experimental characterization of variation in power ... - hal-inria
TRANSCRIPT
HAL Id: hal-02166019https://hal.inria.fr/hal-02166019
Submitted on 26 Jun 2019
HAL is a multi-disciplinary open accessarchive for the deposit and dissemination of sci-entific research documents, whether they are pub-lished or not. The documents may come fromteaching and research institutions in France orabroad, or from public or private research centers.
L’archive ouverte pluridisciplinaire HAL, estdestinée au dépôt et à la diffusion de documentsscientifiques de niveau recherche, publiés ou non,émanant des établissements d’enseignement et derecherche français ou étrangers, des laboratoirespublics ou privés.
Experimental Characterization of Variation in PowerConsumption for Processors of Different generations
Yewan Wang, David Nörtershäuser, Stéphane Le Masson, Jean-Marc Menaud
To cite this version:Yewan Wang, David Nörtershäuser, Stéphane Le Masson, Jean-Marc Menaud. Experimental Char-acterization of Variation in Power Consumption for Processors of Different generations. GreenCom2019 : 15th IEEE International Conference on Green Computing and Communications, Jul 2019,Atlanta, United States. pp.1-9, �10.1109/iThings/GreenCom/CPSCom/SmartData.2019.00133�. �hal-02166019�
Experimental Characterization of Variation in PowerConsumption for Processors of Different generations
Yewan WangOrange Labs, IMT Atlantique
Lannion, [email protected]
David NortershauserOrange Labs
Lannion, [email protected]
Stephane Le MassonOrange Labs
Lannion, [email protected]
Jean-Marc MenaudIMT AtlantiqueNantes, France
Abstract—Data centers are energy-hungry facilities. Buildingenergy consumption predictive models for servers is one ofthe solutions to use efficiently the resources. However, physicalexperiments have shown that even under the same conditions,identical processors consume different amount of energy tocomplete the same task. While this manufacturing variabilityhas been observed and studied before, there is lack of evi-dence supporting the hypotheses due to limited sampling data,especially from the thermal characteristics. In this article, wecompare the power consumption among identical processorsfor two Intel processors series with the same TDP (ThermalDesign Power) but from different generations. The observedpower variation of the processors in newer generation is muchgreater than the older one. Then, we propose our hypothesesfor the underlying causes and validate them under preciselycontrolled environmental conditions. The experimental resultsshow that, with the increase of transistor densities, differenceof thermal characteristics becomes larger among processors,which has non-negligible contribution to the variation of powerconsumption for modern processors. This observation reminds usof re-calibrating the precision of the current energy predictivemodels. The manufacturing variability has to be considered whenbuilding energy predictive models for homogeneous clusters.
Keywords-Manufacturing variability; CPU Temperature;Power Estimation; Thermal Interface Material; Leakage current;
I. INTRODUCTION
Today, data centers are estimated to consume 200 terawatthours (TWh) each year, which is more than the need ofsome countries, such as Iran [1]. Building energy efficientdata centers and reducing environmental impact become agreat concern. Therefore, it is essential to have a preview ofthe energy consumption before planning the construction, forboth economic and environmental benefits. Energy predictivepower model is one of the approaches [2]. We are currentlyworking on an energy predictive model for servers in usingcorresponding indicators, such as system usage, hardwareconfigurations, power management technologies applied, aswell as environmental information, in order to optimize theenergy usage for servers in data centers and to avoid wastingenergy on un-used part of the servers.
Much work has been done on building accurate models. Someof them propose high-accuracy software-level solutions [3][4] [5]. The question is, if we build the power model forone server and validate the model precision based on themodel outputs and the real measurements, can we trust themodel and rely on the same precision to other servers inthe homogeneous cluster or even in the whole data centers?In the experimentation of [6], a same test suite composedof several CPU intensive workloads is executed one by oneto 12 identical servers in a rack, 7.8% power variation isobserved among them. Thermal effect is turned out to be oneof the causes: the rise of the ambient temperature increasesthe power consumption of servers in two ways: the consump-tion of cooling system (integrated fans) and leakage current.Further experimental study showed that, the contribution ofleakage current is impressive. Taking a Gigabyte server as anexample, even get rid of the integrated fan’s power, serverpower can have a 16% rise by only raising CPU temperature.Fabrication process discrepancy can be another cause for thepower variation observed. However, authors admit that theycan hardly guarantee the same ambient temperature for eachserver in a rack, which constrains them from studying thevariation introduced by fabrication process discrepancy. Butrecent studies altered that, the tiny fabrication discrepancybetween the printed transistors can result in visible differencein terms of both performance and power consumption amonghigh-performance microprocessors. The variation is becomingworse in modern processors [7] [8]. John C. McCulloughet al. [9] found that when applying a power model trainedon Intel Core i5-540M-1 to an identical processor 540M-2, mean prediction errors could be increased from 10% to23%. They suggest using only power instrumentation foraccurate power characterization. Among all of the components,processors are responsible for most of the power consumptionand the variations [10] [11]. Recent experimental studieshave identified several sources of variation among whichare: frequency variation introduced by advanced performanceenhancement technologies such as Turbo Boost and Multi-Threading [8] [7], within die parameter [12] and aging [10].

However, the variation brought by different thermal featuresof processors has not been accurately characterized accordingto our knowledge. Addressing this lack of study, we comparethe power variation for two processors with the same TDPbut issued of different generations: Intel Xeon E5345 andIntel Xeon E5-2603v2. We test 30 identical samples for eachtype by switching processors in a same platform in orderto eliminate the influences introduced by platform design.Thermal parameters such as ambient and CPU temperatureare controlled and varied with the help of a climatic cabin andan external powered fan. The paper is organized as follows:Firstly, we introduce briefly the related work in Section II.In Section III, we explained how physical measurements areperformed to compare the power consumption variation amongidentical processors. Then, in IV we propose and evaluate twohypotheses from the perspective of thermal characteristics:switch of TIM (Thermal Interface Material) and leakagecurrent parameters. Conclusions and perspectives are givenin V. Results of our experiments can help identifying andcharacterizing the influence of manufacturing variability on thepower variation of processors. These observations remind us ofreflecting correcting the precision of existing power predictivemodels. The major contributions of this paper are:
• We compare the power consumption variation for twogenerations of Intel processors. 30 identical processorsare evaluated for each generation.
• We explore two potential causes based on thermal char-acteristics hypotheses that may contribute to the powervariation of identical processors: the switch of TIMand the variation of leakage current. Each hypothesis isvalidated in physical experiment.
• Results of our experiments can help identifying andcharacterizing the influence of manufacturing variabilityon the power variation of processors. These observationsremind us of reflecting correcting the precision of existingpower predictive models.
II. RELATED WORK
In our previous work, we studied an energy predictive modelfor servers in using corresponding indicators, such as systemusage, hardware configurations, power management technolo-gies applied, as well as environmental information. Manystudies relating to real word empirical measurement foundthat beside IT load applied to the components (CPU, memory,network and storage), the power of servers can be affected byexternal factors, such as original fabrication process [13] [11],ambient temperature [14] [15] [16]. John C. McCullough etal. [9] found that when applying a power model trained onIntel Core i5-540M-1 to an identical processor 540M-2, meanprediction errors could be increased from 10% to 23%. Theysuggest using power instrumentation only for accurate powercharacterization. Marathe et al [8] performed several tests tocompare both performance and energy efficiency variationamong identical nodes on Sandy Bridge, Ivy Bridge andBroadwell clusters. The variations are compared separatelywith and without hardware-enforced power limit. They found
that processor performance and energy efficiency variation isbecoming worse with the evolution of computation capacity onmodern Intel processors. Balaji et al. [17] compare the powerconsumption variation for modern mobile processors. Theirdata shows power consumption variation among processorsranging from 5% to 17% when processors operate at thelowest and highest frequency respectively. Different powermanagement settings such as Turbo Boost and C-state can alsoaffect the value of variation. El Mehdi Diouri et al. [10] findthat different nodes from a homogeneous cluster have differentpower consumption at idle state. The power consumptions oftwo nodes stay unchanged even after exchanging the positions.They blame the causes to the age of the processors, as theserver equipped with older processors shows more variation.Acun et al. [7] investigate the processors under Turbo Boostin HPC systems. They point out that dynamic overclockingfeature of processor is responsible for substantial frequencydifference among the processors, which explains the up to 16%of core-to-core performance variation. The faster processorsusually consume more than the slower ones. Joakim et al.[11] characterize the variation on CPU power consumption.Experiments are performed on three different platforms anddifferent processors are picked for each platform. Identicalprocessor samples are exchanged after each run to guaranteethe identical conditions. The power consumption can differas much as 29.6% in idle and 19.5% at full load for identi-cal samples. Their observations also show that CPU powerdirectly influence system power, and most of the variationis caused by CPU power variations, other than by the othercomponents [10]. The authors use worklets in SERT (ServerEfficiency Rating Tool) [18] as workloads to stress the SUT(System Under Test). To our knowledge, during the phase ofcalibration, SERT will identify the maximum rate at whichtransaction can be executed for each worklet. This value ishighly reproducible for one server in run-to-run test, but mayvary from server to server calibration [19]. However, as theperformance variation among processors has been observed inprevious studies, and the authors has not mentioned the core-to-core performance variation reported by SERT in this paper,we cannot tell if the workloads (worklets after the phase ofcalibration) used to stress each sample of processor are exactlythe same. Apart from frequency variability, S. R. Sarangi et al[12] emphasize that, within-die parameter variation can resultin process variation including both random and systematiceffects, can also negatively impact a processor’s frequency andleakage power. Most of the studies focus on the differenceat the server level, since processors are placed in differentservers or different sockets, the results cannot eliminate theinfluences caused by system noise, such as the influence of thenearby processors, the platform bugs [8] [20] [21]. Moreover,thermal control strategy is rarely mentioned. As processorsare temperature sensitive components, different operationaltemperature can affect the results.

III. DO IDENTICAL PROCESSORS CONSUME THE SAME?Newer technologies bring diverse features in improving
performance for processors, and in the same time, introducemore variation regarding performance and energy usage toprocessors with the same design. We compare the powervariation for Intel Xeon E5345 and Intel Xeon E5-2603v2. Details about the processors can be found in Table I.The two processors both have 4 cores and the same TDP(Thermal Design Power) of 80W. Otherwise, they disposedifferent designs on architecture and operate on different basefrequencies.
A. Experiments setupThe whole platform (excluding the power supply) is placed
in a climatic cabin, where the ambient temperature is con-figured at 35◦C. The ambient set point is little higher thanASHRAE typical requirement limits (15- 32◦C, for productsrequire a stable and more restrictive environment) [22] in orderto exposure as much as possible the thermal characteristicsdifference between samples. Fan is placed on top of the proces-sor’s heat sink and powered by an external DC (Direct Current)source so as to avoid power variation brought by mother-board’s fan control. Homemade CPU intensive applications“bzip2” and “pi_calculator” are chosen to maximizethe usage and heat dissipation of CPU. The application assigna specific task to the server, and active all the threads availablein the system at full load to complete the task. This allowsanalyzing both the power and performance (execution time)variations among samples. The power consumption variationis analyzed by comparing the average power of the serverin the last minute, where the thermal condition is tendingtowards stable. Performance variation. Samples of processorsare tested and exchanged one by one in the same platforms.When exchanging the samples after each run, we try our bestto uniform the heat paste applied between processor and fan.The platform test diagram shown in Figure 1 includes threeparts: SUT, control and measurement system.
• SUT: Server Under Test, installed with Ubuntu ServerOS.
• The control system:Controller: normal PC (personal computer) with Linuxsystem installed, in the same local network with SUT andcontrols SUT remotely by SSH. Controller also gathersand synchronizes measurement data recorded by powerand temperature analyzers.Climatic chamber: Servathin RC01, controls ambienttemperature.Fan: controls CPU surface temperature, powered byexternal DC source.
• The measurement system: Power: measured by Wattsup-Pro [23]. Measures contain the power consumption ofthe whole server except the fan’s. Ambient temperature:measured by a thermometer with a thermocouple con-nected (type K, with 0.1mm diameter). CPU Temperature:collected by command line tool lm-sensors. Samplingfrequency for all the measures are configured at 1Hz.
Fig. 1. Platform test diagram
B. Power variation for Intel processors of different genera-tions
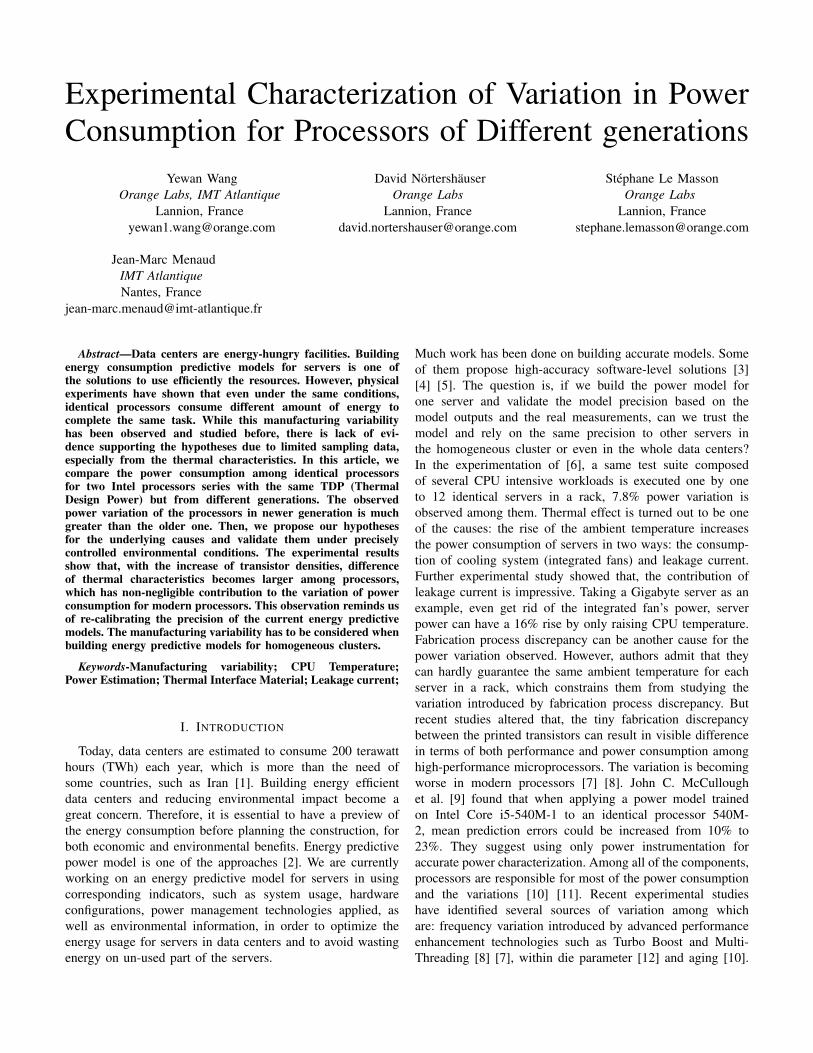
After analyzing all the measurement data, we choose 18representative processors for each platform: 9 samples thatconsume the most and another 9 samples that consume theleast among all the 30 samples. Rank of consumption is shownin the following figures.
Fig. 2. Server power comparison for samples of Xeon E5-2603v2
Fig. 3. CPU distribution for samples of Xeon E5-2603v2
Figure 2 and Figure 4 show the power by running appli-cation “pi_calculator” on the 18 processor samples oftwo types. It can be observed that, power variation amongsamples of Xeon E5-2603v2 (newer generation) between thebest and worst can be more than 30% (16.1W / 51.9W). Thatis much larger than the variation observed from samples ofXeon E5345: 2.8% (2.8W / 98.4W). In addition, we verifythe power variation of Xeon E5-2603v2 by running anotherapplication “bzip2”, and the rank of power consumptionfor samples stays the same. Therefore, the power variation
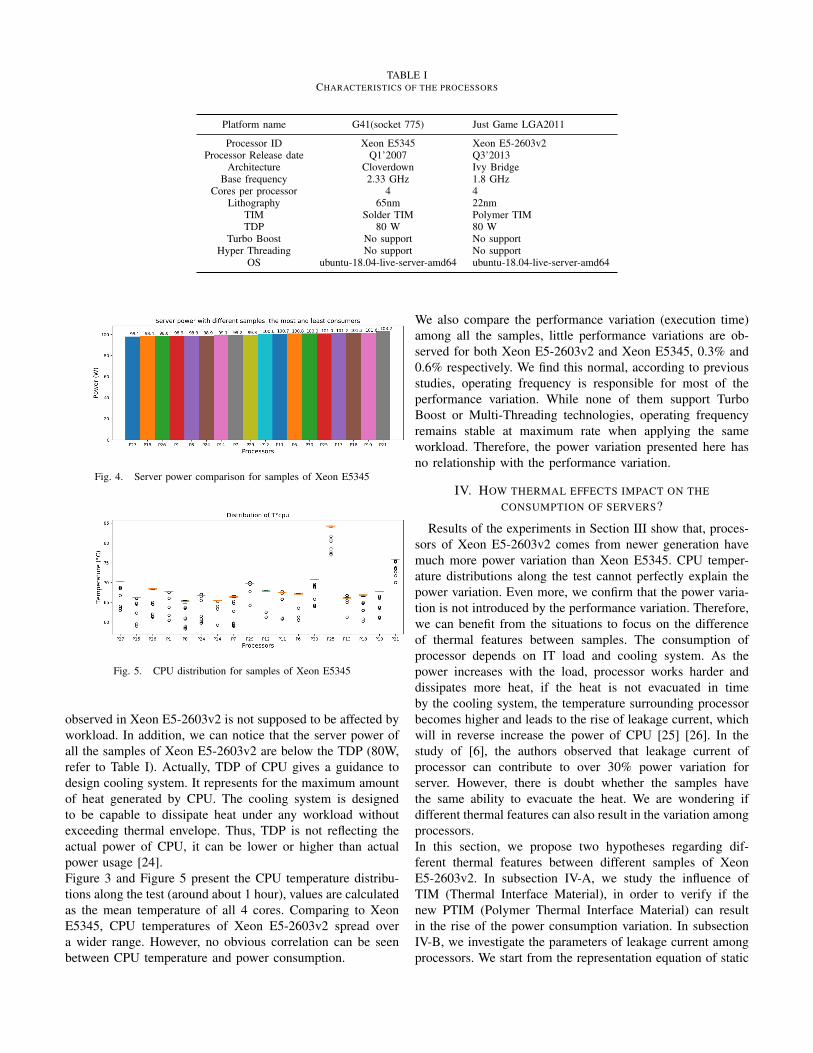
TABLE ICHARACTERISTICS OF THE PROCESSORS
Platform name G41(socket 775) Just Game LGA2011
Processor ID Xeon E5345 Xeon E5-2603v2Processor Release date Q1’2007 Q3’2013
Architecture Cloverdown Ivy BridgeBase frequency 2.33 GHz 1.8 GHz
Cores per processor 4 4Lithography 65nm 22nm
TIM Solder TIM Polymer TIMTDP 80 W 80 W
Turbo Boost No support No supportHyper Threading No support No support
OS ubuntu-18.04-live-server-amd64 ubuntu-18.04-live-server-amd64
Fig. 4. Server power comparison for samples of Xeon E5345
Fig. 5. CPU distribution for samples of Xeon E5345
observed in Xeon E5-2603v2 is not supposed to be affected byworkload. In addition, we can notice that the server power ofall the samples of Xeon E5-2603v2 are below the TDP (80W,refer to Table I). Actually, TDP of CPU gives a guidance todesign cooling system. It represents for the maximum amountof heat generated by CPU. The cooling system is designedto be capable to dissipate heat under any workload withoutexceeding thermal envelope. Thus, TDP is not reflecting theactual power of CPU, it can be lower or higher than actualpower usage [24].Figure 3 and Figure 5 present the CPU temperature distribu-tions along the test (around about 1 hour), values are calculatedas the mean temperature of all 4 cores. Comparing to XeonE5345, CPU temperatures of Xeon E5-2603v2 spread overa wider range. However, no obvious correlation can be seenbetween CPU temperature and power consumption.
We also compare the performance variation (execution time)among all the samples, little performance variations are ob-served for both Xeon E5-2603v2 and Xeon E5345, 0.3% and0.6% respectively. We find this normal, according to previousstudies, operating frequency is responsible for most of theperformance variation. While none of them support TurboBoost or Multi-Threading technologies, operating frequencyremains stable at maximum rate when applying the sameworkload. Therefore, the power variation presented here hasno relationship with the performance variation.
IV. HOW THERMAL EFFECTS IMPACT ON THECONSUMPTION OF SERVERS?
Results of the experiments in Section III show that, proces-sors of Xeon E5-2603v2 comes from newer generation havemuch more power variation than Xeon E5345. CPU temper-ature distributions along the test cannot perfectly explain thepower variation. Even more, we confirm that the power varia-tion is not introduced by the performance variation. Therefore,we can benefit from the situations to focus on the differenceof thermal features between samples. The consumption ofprocessor depends on IT load and cooling system. As thepower increases with the load, processor works harder anddissipates more heat, if the heat is not evacuated in timeby the cooling system, the temperature surrounding processorbecomes higher and leads to the rise of leakage current, whichwill in reverse increase the power of CPU [25] [26]. In thestudy of [6], the authors observed that leakage current ofprocessor can contribute to over 30% power variation forserver. However, there is doubt whether the samples havethe same ability to evacuate the heat. We are wondering ifdifferent thermal features can also result in the variation amongprocessors.In this section, we propose two hypotheses regarding dif-ferent thermal features between different samples of XeonE5-2603v2. In subsection IV-A, we study the influence ofTIM (Thermal Interface Material), in order to verify if thenew PTIM (Polymer Thermal Interface Material) can resultin the rise of the power consumption variation. In subsectionIV-B, we investigate the parameters of leakage current amongprocessors. We start from the representation equation of static
power and analyses the relationship between the leakagecurrent and the temperature. Fans, DC power generator andclimatic cabins are provided to help controlling precisely thetemperature.
A. Hypothesis 1 : The switch of Thermal Interface Material(TIM)
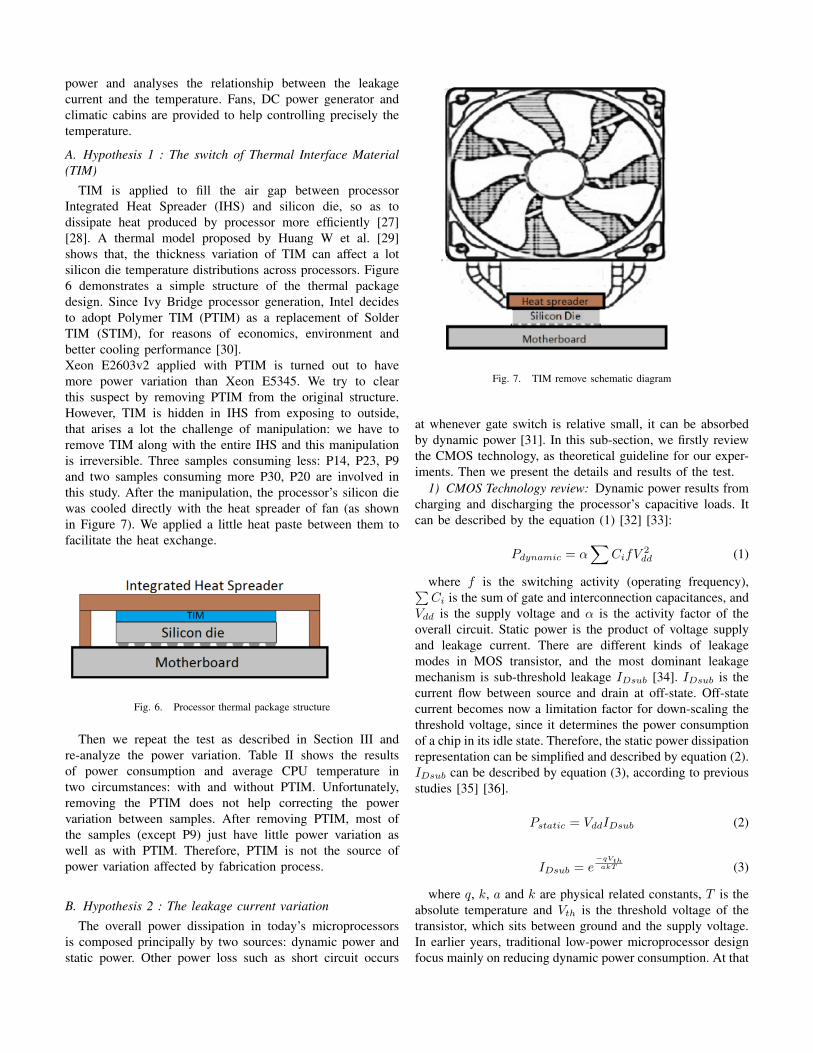
TIM is applied to fill the air gap between processorIntegrated Heat Spreader (IHS) and silicon die, so as todissipate heat produced by processor more efficiently [27][28]. A thermal model proposed by Huang W et al. [29]shows that, the thickness variation of TIM can affect a lotsilicon die temperature distributions across processors. Figure6 demonstrates a simple structure of the thermal packagedesign. Since Ivy Bridge processor generation, Intel decidesto adopt Polymer TIM (PTIM) as a replacement of SolderTIM (STIM), for reasons of economics, environment andbetter cooling performance [30].Xeon E2603v2 applied with PTIM is turned out to havemore power variation than Xeon E5345. We try to clearthis suspect by removing PTIM from the original structure.However, TIM is hidden in IHS from exposing to outside,that arises a lot the challenge of manipulation: we have toremove TIM along with the entire IHS and this manipulationis irreversible. Three samples consuming less: P14, P23, P9and two samples consuming more P30, P20 are involved inthis study. After the manipulation, the processor’s silicon diewas cooled directly with the heat spreader of fan (as shownin Figure 7). We applied a little heat paste between them tofacilitate the heat exchange.
Fig. 6. Processor thermal package structure
Then we repeat the test as described in Section III andre-analyze the power variation. Table II shows the resultsof power consumption and average CPU temperature intwo circumstances: with and without PTIM. Unfortunately,removing the PTIM does not help correcting the powervariation between samples. After removing PTIM, most ofthe samples (except P9) just have little power variation aswell as with PTIM. Therefore, PTIM is not the source ofpower variation affected by fabrication process.
B. Hypothesis 2 : The leakage current variation
The overall power dissipation in today’s microprocessorsis composed principally by two sources: dynamic power andstatic power. Other power loss such as short circuit occurs
Fig. 7. TIM remove schematic diagram
at whenever gate switch is relative small, it can be absorbedby dynamic power [31]. In this sub-section, we firstly reviewthe CMOS technology, as theoretical guideline for our exper-iments. Then we present the details and results of the test.
1) CMOS Technology review: Dynamic power results fromcharging and discharging the processor’s capacitive loads. Itcan be described by the equation (1) [32] [33]:
Pdynamic = α∑
CifV2dd (1)
where f is the switching activity (operating frequency),∑Ci is the sum of gate and interconnection capacitances, and
Vdd is the supply voltage and α is the activity factor of theoverall circuit. Static power is the product of voltage supplyand leakage current. There are different kinds of leakagemodes in MOS transistor, and the most dominant leakagemechanism is sub-threshold leakage IDsub [34]. IDsub is thecurrent flow between source and drain at off-state. Off-statecurrent becomes now a limitation factor for down-scaling thethreshold voltage, since it determines the power consumptionof a chip in its idle state. Therefore, the static power dissipationrepresentation can be simplified and described by equation (2).IDsub can be described by equation (3), according to previousstudies [35] [36].
Pstatic = VddIDsub (2)
IDsub = e−qVthakT (3)
where q, k, a and k are physical related constants, T is theabsolute temperature and Vth is the threshold voltage of thetransistor, which sits between ground and the supply voltage.In earlier years, traditional low-power microprocessor designfocus mainly on reducing dynamic power consumption. At that
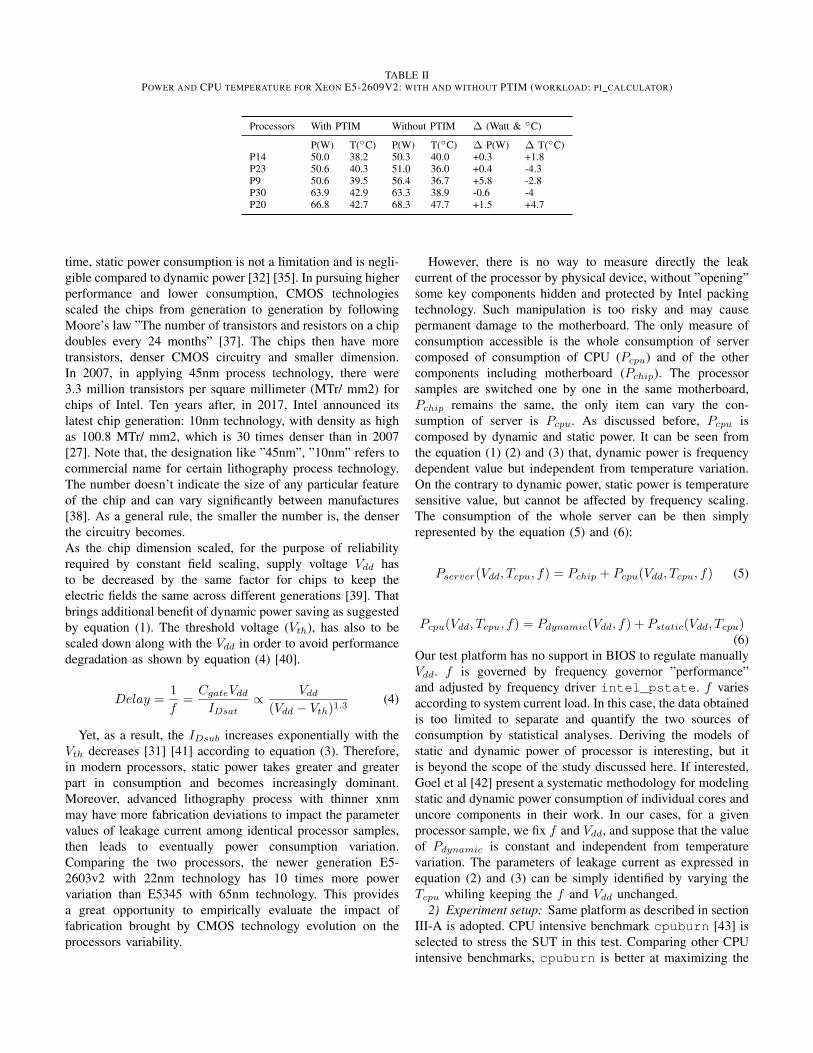
TABLE IIPOWER AND CPU TEMPERATURE FOR XEON E5-2609V2: WITH AND WITHOUT PTIM (WORKLOAD: PI CALCULATOR)
Processors With PTIM Without PTIM ∆ (Watt & ◦C)
P(W) T(◦C) P(W) T(◦C) ∆ P(W) ∆ T(◦C)P14 50.0 38.2 50.3 40.0 +0.3 +1.8P23 50.6 40.3 51.0 36.0 +0.4 -4.3P9 50.6 39.5 56.4 36.7 +5.8 -2.8P30 63.9 42.9 63.3 38.9 -0.6 -4P20 66.8 42.7 68.3 47.7 +1.5 +4.7
time, static power consumption is not a limitation and is negli-gible compared to dynamic power [32] [35]. In pursuing higherperformance and lower consumption, CMOS technologiesscaled the chips from generation to generation by followingMoore’s law ”The number of transistors and resistors on a chipdoubles every 24 months” [37]. The chips then have moretransistors, denser CMOS circuitry and smaller dimension.In 2007, in applying 45nm process technology, there were3.3 million transistors per square millimeter (MTr/ mm2) forchips of Intel. Ten years after, in 2017, Intel announced itslatest chip generation: 10nm technology, with density as highas 100.8 MTr/ mm2, which is 30 times denser than in 2007[27]. Note that, the designation like ”45nm”, ”10nm” refers tocommercial name for certain lithography process technology.The number doesn’t indicate the size of any particular featureof the chip and can vary significantly between manufactures[38]. As a general rule, the smaller the number is, the denserthe circuitry becomes.As the chip dimension scaled, for the purpose of reliabilityrequired by constant field scaling, supply voltage Vdd hasto be decreased by the same factor for chips to keep theelectric fields the same across different generations [39]. Thatbrings additional benefit of dynamic power saving as suggestedby equation (1). The threshold voltage (Vth), has also to bescaled down along with the Vdd in order to avoid performancedegradation as shown by equation (4) [40].
Delay =1
f=CgateVddIDsat
∝ Vdd(Vdd − Vth)1.3
(4)
Yet, as a result, the IDsub increases exponentially with theVth decreases [31] [41] according to equation (3). Therefore,in modern processors, static power takes greater and greaterpart in consumption and becomes increasingly dominant.Moreover, advanced lithography process with thinner xnmmay have more fabrication deviations to impact the parametervalues of leakage current among identical processor samples,then leads to eventually power consumption variation.Comparing the two processors, the newer generation E5-2603v2 with 22nm technology has 10 times more powervariation than E5345 with 65nm technology. This providesa great opportunity to empirically evaluate the impact offabrication brought by CMOS technology evolution on theprocessors variability.
However, there is no way to measure directly the leakcurrent of the processor by physical device, without ”opening”some key components hidden and protected by Intel packingtechnology. Such manipulation is too risky and may causepermanent damage to the motherboard. The only measure ofconsumption accessible is the whole consumption of servercomposed of consumption of CPU (Pcpu) and of the othercomponents including motherboard (Pchip). The processorsamples are switched one by one in the same motherboard,Pchip remains the same, the only item can vary the con-sumption of server is Pcpu. As discussed before, Pcpu iscomposed by dynamic and static power. It can be seen fromthe equation (1) (2) and (3) that, dynamic power is frequencydependent value but independent from temperature variation.On the contrary to dynamic power, static power is temperaturesensitive value, but cannot be affected by frequency scaling.The consumption of the whole server can be then simplyrepresented by the equation (5) and (6):
Pserver(Vdd, Tcpu, f) = Pchip + Pcpu(Vdd, Tcpu, f) (5)
Pcpu(Vdd, Tcpu, f) = Pdynamic(Vdd, f) + Pstatic(Vdd, Tcpu)(6)
Our test platform has no support in BIOS to regulate manuallyVdd. f is governed by frequency governor ”performance”and adjusted by frequency driver intel_pstate. f variesaccording to system current load. In this case, the data obtainedis too limited to separate and quantify the two sources ofconsumption by statistical analyses. Deriving the models ofstatic and dynamic power of processor is interesting, but itis beyond the scope of the study discussed here. If interested,Goel et al [42] present a systematic methodology for modelingstatic and dynamic power consumption of individual cores anduncore components in their work. In our cases, for a givenprocessor sample, we fix f and Vdd, and suppose that the valueof Pdynamic is constant and independent from temperaturevariation. The parameters of leakage current as expressed inequation (2) and (3) can be simply identified by varying theTcpu whiling keeping the f and Vdd unchanged.
2) Experiment setup: Same platform as described in sectionIII-A is adopted. CPU intensive benchmark cpuburn [43] isselected to stress the SUT in this test. Comparing other CPUintensive benchmarks, cpuburn is better at maximizing the

heat dissipation of processor. During the execution of cpuburn,each thread is stressed at full load and operating frequency (f )is then maintained constantly at (1.8GHz). Besides ambientand CPU temperature, we monitor as well the CPU voltage(in using command-line tool lm-sensors [44]) and CPUfrequency (in using python library psutil [45]). Climaticcabin is used to vary the surface temperature of CPU. Someof the processors samples have been used in previous testto validate the hypotheses 1 in section IV-A. Their TIM andHIS are removed. This manipulation is irreversible and mayintroduce unexpected influence to the consumption, therefore,these samples are excluded from this test. Four samplesconsume less: P12, P21, P6, P4 and four samples consumemore P3, P10, P5, P8 are chosen to validate the secondhypotheses.For each sample, we repeat the test procedures as follows:
• Keep the server on idle state for 3 minutes at 22◦Cambient temperature.
• Execute cpuburn for 30 minutes. Along the test, config-ure the climatic cabin to increase the ambient temperaturefrom 22◦C to 50◦C.
• After the execution of cpuburn, keep the server on stateidle for 3 minutes at 50◦C ambient temperature.
• Shutdown the server, switch for the next processor sampleand wait for the whole platform cool down at 22◦Cambient temperature.
3) Experiment results and analyzes:a) On high load state: High load state occurs at the
second step, where server is stressed by cpuburn. Figure 8shows the evolution of CPU temperatures with the ambienttemperature increases from 22◦C to 50◦C. It can be observedthat, cooling abilities of CPU samples differ from eachother. CPU temperature increases gradually with the riseof ambient temperature but ends at different values wherethe ambient temperature is supposed to be at 50◦C. Figure9 shows how server power varies with the rise of CPUtemperature. Processor samples are marked with differentcolors. The points represent for the real measure data. Theserver power can be represented by CPU temperature in usingan exponential function of form exp(−k/T ) as mentionedin equation (3). We can find that the change rates of powerwith the increase of CPU temperature are different amongsamples. Samples consume more (P3, P10, P5 and P8) havealso higher change rates than samples consume less (P12,P21, P6, P4). In another word, processor samples P3, P10 P5and P8 are harder to be cooled down than the others. Changerates of samples can be identified clearly in presenting theexponential function without the intercept, as shown in Figure10
b) On idle state: On idle state, only OS is running inthe server. Power consumptions on idle state for differentsamples are compared at 22◦C and 50◦C ambient temperaturerespectively. Results are shown in Figure 11. We can observethat, there is more power variation on idle state at 50◦Cambient temperature. Moreover, with the same rise of ambient
Fig. 8. CPU temperature as function over time
Fig. 9. Relationship of CPU temperature and Server power for differentsamples during execution of cpuburn
temperature, idle power goes up to a higher value for samplesthat consume more.
V. CONCLUSIONS AND PERSPECTIVES
With the decrease of lithography size for modern processors,technology today can hardly control precisely the variabilitybetween processor samples in fabrication process. Apart fromthe performance variability brought by the operating frequencyvariation, our experimental results show surprisingly highvariability of power consumption within modern processor.30% power consumption variation is observed among 30identical processor samples, which has no correlation withthe performance (frequency variation). In the first time, weconfirm and characterize by means of physical experiments,the power consumption variation introduced by within dieparameter variation. Fabrication variability has random effects

Fig. 10. Illustrations of server powers functions for different processorsamples
Fig. 11. Server power on idle state at 22◦C and 50◦C ambient temperatures
on processor samples. Samples can have different heat dis-sipation rates under the supposed same conditions (ambienttemperature and load level), which results in different leakagecurrent distributions then finally affect the static power con-sumption among samples. Our demonstration highlights thechallenges of modeling techniques posed by rising processorsvariability. Even for servers in homogeneous clusters cannotconsider being exactly the same. As a result, the precisionof existing power models can be questioned when applyingto other identical SUT samples. Taking these concerns intoaccount, power modeling techniques based on pure softwaresolutions such as linear regression or performance counters,are not reliable enough for modern servers in predicting powerfrom one server to several servers in a rack or data centers.In addition, the findings present in this paper can be alsoapplied to optimize the energy management strategies indata center, such as VM migration, shut down technology.Power consumption variation occurs at server level could beworse than at processor level. Processor samples with worse
thermal features will not only have more static power, butalso request more energy in associated cooling system. Wewill further investigate to filter out the servers with bothbetter and worse thermal features in a data center, in orderto better orient energy management strategies. Processors arebecoming smaller, more powerful and less consuming fromgeneration to generation. On the other side, processors becomemore complex than ever. Leakage current variations arisefrom imperfections in the fabrication process among modernprocessors, such as lithographic length aberration. Accordingto our observations, leakage current variations have impact oncooling ability, samples dispose of different increase rate withthe rise of temperature.
REFERENCES
[1] N. Jones, “How to stop data centres from gobbling up the world’selectricity.” Nature, vol. 561, no. 7722, pp. 163–166, 2018.
[2] M. Vor Dem Berge, G. Da Costa, M. Jarus, A. Oleksiak, W. Piatek, andE. Volk, “Modeling data center building blocks for energy-efficiencyand thermal simulations,” in Energy-Efficient Data Centers, H. Springer,Berlin, Ed. Springer, 2014, vol. 8343, pp. 66–82.
[3] G. Da Costa and H. Hlavacs, “Methodology of measurement for energyconsumption of applications.” Tech. Rep., 2010.
[4] M. Jarus, A. Oleksiak, T. Piontek, and J. Weglarz, “Runtime power usageestimation of hpc servers for various classes of real-life applications,”Future Generation Computer Systems, vol. 36, pp. 299–310, 2014.
[5] M. Canuto, R. Bosch, M. Macias, and J. Guitart, “A methodologyfor full-system power modeling in heterogeneous data centers,” inProceedings of the 9th International Conference on Utility and CloudComputing, ser. UCC ’16. New York, NY, USA: ACM, 2016, pp. 20–29. [Online]. Available: http://doi.acm.org/10.1145/2996890.2996899
[6] Y. Wang, D. Nortershauser, S. Le Masson, and J.-M. Menaud, “Potentialeffects on server power metering and modeling,” Wireless Networks, pp.1–8, 2018.
[7] B. Acun, P. Miller, and L. V. Kale, “Variation among processorsunder turbo boost in hpc systems,” in Proceedings of the 2016International Conference on Supercomputing, ser. ICS ’16. NewYork, NY, USA: ACM, 2016, pp. 6:1–6:12. [Online]. Available:http://doi.acm.org/10.1145/2925426.2926289
[8] A. Marathe, Y. Zhang, G. Blanks, N. Kumbhare, G. Abdulla, andB. Rountree, “An empirical survey of performance and energy efficiencyvariation on intel processors,” in Proceedings of the 5th InternationalWorkshop on Energy Efficient Supercomputing, ser. E2SC’17. NewYork, NY, USA: ACM, 2017, pp. 9:1–9:8. [Online]. Available:http://doi.acm.org/10.1145/3149412.3149421
[9] J. C. McCullough, Y. Agarwal, J. Chandrashekar, S. Kuppuswamy, A. C.Snoeren, and R. K. Gupta, “Evaluating the effectiveness of model-basedpower characterization,” in USENIX Annual Technical Conf, vol. 20,2011.
[10] M. E. M. Diouri, O. Gluck, L. Lefevre, and J. Mignot, “Your cluster isnot power homogeneous: Take care when designing green schedulers!”in 2013 International Green Computing Conference Proceedings, June2013, pp. 1–10.
[11] J. von Kistowski, H. Block, J. Beckett, C. Spradling, K.-D. Lange,and S. Kounev, “Variations in cpu power consumption,” in Proceedingsof the 7th ACM/SPEC on International Conference on PerformanceEngineering, ser. ICPE ’16. New York, NY, USA: ACM, 2016, pp. 147–158. [Online]. Available: http://doi.acm.org/10.1145/2851553.2851567
[12] S. R. Sarangi, B. Greskamp, R. Teodorescu, J. Nakano, A. Tiwari,and J. Torrellas, “Varius: A model of process variation and resultingtiming errors for microarchitects,” IEEE Transactions on SemiconductorManufacturing, vol. 21, no. 1, pp. 3–13, Feb 2008.
[13] H. C. Coles, Y. Qin, and P. N. Price, “Comparing server energy useand efficiency using small sample sizes,” Lawrence Berkeley NationalLaboratory, Tech. Rep., 2014.
[14] A. Orgerie, L. Lefevre, and J. Gelas, “Demystifying energy consumptionin grids and clouds,” in International Conference on Green Computing,Aug 2010, pp. 335–342.

[15] T. Wendy, B. Kevin, and A. Victor, “The unexpected impact of raisingdata center temperatures,” Schneider Electric, Tech. Rep., 2011.
[16] S. Sampath, “Thermal analysis of high end servers based on developmentof detail modeland experiments,” The university of texas at Arlington,Tech. Rep., 2012.
[17] B. Balaji, J. McCullough, R. K. Gupta, and Y. Agarwal, “Accuratecharacterization of the variability in power consumption in modernmobile processors,” in Proceedings of the 2012 USENIX Conference onPower-Aware Computing and Systems, ser. HotPower’12. Berkeley,CA, USA: USENIX Association, 2012, pp. 8–8. [Online]. Available:http://dl.acm.org/citation.cfm?id=2387869.2387877
[18] K.-D. Lange and M. G. Tricker, “The design and development ofthe server efficiency rating tool (sert),” in Proceedings of the 2NdACM/SPEC International Conference on Performance Engineering, ser.ICPE ’11. New York, NY, USA: ACM, 2011, pp. 145–150. [Online].Available: http://doi.acm.org/10.1145/1958746.1958769
[19] Y. Wang, D. Nortershauser, S. Le Masson, and J.-M. Menaud, “Etudede l’influence des aspects thermiques sur la consommation et l’efficaciteenergetique des serveurs,” in SFT 2018 - 26eme Congres Francaisde Thermique, Pau, France, May 2018, pp. 1–8. [Online]. Available:https://hal.inria.fr/hal-01763524
[20] O. Tuncer, E. Ates, Y. Zhang, A. Turk, J. Brandt, V. J. Leung,M. Egele, and A. K. Coskun, “Diagnosing performance variations in hpcapplications using machine learning,” in High Performance Computing,J. M. Kunkel, R. Yokota, P. Balaji, and D. Keyes, Eds. Cham: SpringerInternational Publishing, 2017, pp. 355–373.
[21] E. A. Leon, I. Karlin, and A. T. Moody, “System noise revisited:Enabling application scalability and reproducibility with smt,” in 2016IEEE International Parallel and Distributed Processing Symposium(IPDPS), May 2016, pp. 596–607.
[22] A. T. Committee, “Data center power equipment thermal guidelines andbest practices whitepaper,” ASHRAE, Tech. Rep., 2016. [Online]. Avail-able: https://tc0909.ashraetcs.org/documents/ASHRAE TC0909 PowerWhite Paper 22 June 2016 REVISED.pdf
[23] (2010) Wattsup pro power meter. [Online]. Available:http://www.wattsupmeters.com
[24] C. Andrew. (2013) The technical details behind intel’s 7 watt ivy bridgecpus. [Online]. Available: https://arstechnica.com/gadgets/2013/01/the-technical-details-behind-intels-7-watt-ivy-bridge-cpus/
[25] E. Kursun and C. Cher, “Temperature variation characterization andthermal management of multicore architectures,” IEEE Micro, vol. 29,no. 1, pp. 116–126, Jan 2009.
[26] D. Moss and J. H. Bean, “Energy impact of increased server inlettemperature,” APC white paper, vol. 138, 2009.
[27] C. Rachel. (2017) Intel now packs 100 million transistors ineach square millimeter - ieee spectrum. [Online]. Available:https://spectrum.ieee.org/nanoclast/semiconductors/processors/intel-now-packs-100-million-transistors-in-each-square-millimeter.
[28] R. Prasher, “Thermal interface materials: Historical perspective, status,and future directions,” Proceedings of the IEEE, vol. 94, no. 8, pp.1571–1586, Aug 2006.
[29] W. Huang, E. Humenay, K. Skadron, and M. R. Stan, “The needfor a full-chip and package thermal model for thermally optimizedic designs,” in Proceedings of the 2005 International Symposiumon Low Power Electronics and Design, ser. ISLPED ’05. NewYork, NY, USA: ACM, 2005, pp. 245–250. [Online]. Available:http://doi.acm.org/10.1145/1077603.1077662
[30] D. A. R. Mukul P, P. Neha and W. Vijay, “Material technology forenvironmentally micro-electronic packagingl perspective, status, andfuture directions,” Intel Technology Journal, 2006.
[31] N. S. Kim, T. Austin, D. Baauw, T. Mudge, K. Flautner, J. S. Hu, M. J.Irwin, M. Kandemir, and V. Narayanan, “Leakage current: Moore’s lawmeets static power,” Computer, vol. 36, no. 12, pp. 68–75, Dec 2003.
[32] C.-L. Su, C.-Y. Tsui, and A. M. Despain, “Low power architecturedesign and compilation techniques for high-performance processors,”in Proceedings of COMPCON ’94, Feb 1994, pp. 489–498.
[33] D. Etiemble, “45-year CPU evolution: one law and two equations,” inSecond Workshop on Pioneering Processor Paradigms, Vienne, Austria,Feb. 2018. [Online]. Available: https://hal.archives-ouvertes.fr/hal-01719766
[34] A. Keshavarzi, K. Roy, and C. F. Hawkins, “Intrinsic leakage in lowpower deep submicron cmos ics,” in Proceedings International TestConference 1997, Nov 1997, pp. 146–155.
[35] M. Horowitz, T. Indermaur, and R. Gonzalez, “Low-power digitaldesign,” in Proceedings of 1994 IEEE Symposium on Low PowerElectronics, Oct 1994, pp. 8–11.
[36] J. A. Butts and G. S. Sohi, “A static power model for architects,”in Proceedings 33rd Annual IEEE/ACM International Symposium onMicroarchitecture. MICRO-33 2000, Dec 2000, pp. 191–201.
[37] G. E. Moore, “Cramming more components onto integrated circuits,”Proceedings of the IEEE, vol. 86, no. 1, pp. 82–85, Jan 1998.
[38] (2016) Technology node. [Online]. Available:https://en.wikichip.org/wiki/technology node
[39] R. H. Dennard, F. H. Gaensslen, V. L. Rideout, E. Bassous, and A. R.LeBlanc, “Design of ion-implanted mosfet’s with very small physicaldimensions,” IEEE Journal of Solid-State Circuits, vol. 9, no. 5, pp.256–268, Oct 1974.
[40] T. Sakurai and A. R. Newton, “Alpha-power law mosfet model and itsapplications to cmos inverter delay and other formulas,” IEEE Journalof Solid-State Circuits, vol. 25, no. 2, pp. 584–594, April 1990.
[41] B. Zhai, D. Blaauw, D. Sylvester, D. Sylvester, and K. Flautner,“Theoretical and practical limits of dynamic voltage scaling,” inProceedings of the 41st Annual Design Automation Conference, ser.DAC ’04. New York, NY, USA: ACM, 2004, pp. 868–873. [Online].Available: http://doi.acm.org/10.1145/996566.996798
[42] B. Goel and S. A. McKee, “A methodology for modeling dynamicand static power consumption for multicore processors,” in 2016 IEEEInternational Parallel and Distributed Processing Symposium (IPDPS),May 2016, pp. 273–282.
[43] R. Robert, “Ubuntu manpage: cpuburn, burnbx, burnk6, burnk7,burnmmx, burnp5, burnp6 - a collection,” 2011, online; accessed 2018-05-28. [Online]. Available: https://patrickmn.com/projects/cpuburn/
[44] ArchWiKi. (2016) lm sensors - archwiki. [Online]. Available:https://wiki.archlinux.org/index.php/lm sensors
[45] Psutil. (2009) psutil 5.5.0 documentation. [Online]. Available:https://psutil.readthedocs.io/en/latest/