visual abstraction - hal-inria
TRANSCRIPT
HAL Id: hal-02944201https://hal.inria.fr/hal-02944201
Submitted on 21 Sep 2020
HAL is a multi-disciplinary open accessarchive for the deposit and dissemination of sci-entific research documents, whether they are pub-lished or not. The documents may come fromteaching and research institutions in France orabroad, or from public or private research centers.
L’archive ouverte pluridisciplinaire HAL, estdestinée au dépôt et à la diffusion de documentsscientifiques de niveau recherche, publiés ou non,émanant des établissements d’enseignement et derecherche français ou étrangers, des laboratoirespublics ou privés.
Visual AbstractionIvan Viola, Min Chen, Tobias Isenberg
To cite this version:Ivan Viola, Min Chen, Tobias Isenberg. Visual Abstraction. Min Chen; Helwig Hauser; PennyRheingans; Gerik Scheuermann. Foundations of Data Visualization, Springer International Publishing,pp.15–37, 2020, 978-3-030-34444-3. �10.1007/978-3-030-34444-3_2�. �hal-02944201�

Chapter 2Visual AbstractionIVAN VIOLA, King Abdullah University of Science and Technology, Saudi ArabiaMIN CHEN, University of Oxford, UKTOBIAS ISENBERG, Inria Saclay, France
AbstractIn this chapter we revisit the concept of abstraction as it is used in visualizationand put it on a solid formal footing. While the term abstraction is utilized in manyscientific disciplines, arts, as well as everyday life, visualization inherits the notionof data abstraction or class abstraction from computer science, topological abstrac-tion from mathematics, and visual abstraction from arts. All these notions have a lotin common, yet there is a major discrepancy in the terminology and basic under-standing about visual abstraction in the context of visualization. We thus root thenotion of abstraction in the philosophy of science, clarify the basic terminology, andprovide crisp definitions of visual abstraction as a process. Furthermore, we clarifyhow it relates to similar terms often used interchangeably in the field of visualiza-tion. Visual abstraction is characterized by a conceptual space where this processexists, by the purpose it should serve, and by the perceptual and cognitive qualitiesof the beholder. These characteristics can be used to control the process of visualabstraction to produce effective and informative visual representations.
2.1 Definitions
The term abstraction often lacks a precise definition in many fields. While severalfields have defined the term for their own purposes, there is only a vague under-standing of its meaning that is shared by all fields. Some scientific disciplines andscholarly fields have adjusted the vaguely understood meaning to fit the needs ofthe respective discipline or field. In this chapter we first present our key definitionsrelated to visual abstraction, and we then provide the justification for the definitions.In giving these definitions, we revise our previous set of definitions relating to the
e-mail: [email protected]: [email protected]: [email protected]
1
2
concept of abstraction [24], based on new discussions related to, and insights from,our further literature study. Terminology related to abstraction has been adoptedfrom Leppanen [12] and is discussed in Section 2.2.7.
Definition 1 An abstraction is a process that transforms a source thing into a lessconcrete sign thing of the source thing. Abstraction uses a concept of point-of-view,which determines which aspects of source thing should be preserved in its sign thingand which should be suppressed.
Definition 2 A data representation is a sign thing that stands in digital form for areferent thing from reality or another sign thing, using data structures or conceptthings. Similarly, a visual representation is a sign thing that stands for a referentfrom reality or another sign thing so that it can be visually perceived and cognitivelyprocessed by a human observer.
Definition 3 Visual abstraction is a particular type of abstraction where the signthing is visual, while the source thing is either non-visual or visual. A visual repre-sentation results from a process of visual abstraction if such transformation inten-tionally disregards certain aspects of data representations.
Definition 4 The abstraction process also involves a point-of-view component de-fined through the task, which the visualization process aids to accomplish. This taskis represented as a combination of targets on which particular actions are per-formed.
Proposition 1 The amount or significance of abstraction of a thing can be, in com-puter or signal representations, quantified by means of information theory.
Definition 5 A meaningful visual abstraction is a visual abstraction such that, fora given point-of-view and for a given purpose or goal, key aspects of the underlyingreferent thing are preserved in the visual representation so that the cognitive loadwhen perceiving it as a stimulus is significantly reduced.
Definition 6 A visualization is a process that transforms data representations of athing from reality into visual representations. Visualization is a process that is in-tended to be a meaningful visual abstraction process. The designers of visualizationprocesses must understand the point-of-view component and tasks. Otherwise, theywould not reach the full meaningfulness intended.
Definition 7 An abstraction axis is the perceived sequence of visual representationsthat is assembled by the designer of a visualization system to illustrate a given pointor series of points about reality. Each of the building blocks of an abstraction axisis the result of an individual abstraction process to a visual representation. Eachtransition between two successive abstraction axis building blocks can but doesnot have to remove information, some can also both remove and add informationbased on chosen blocks specific abstraction. If two or more abstraction axes areconstructed such that they affect independent aspects of the visual representations,they can be combined into an abstraction space that observers can explore.

3
2.2 Flavors of Abstraction
The notion of what is abstract and what is concrete is a fundamental discussion inphilosophy, without a clear consensus. In its simplest terms, an abstract object has nophysical referent, while concrete objects have physical referents. Reiterating Frege’swritings, “The Thought” [10] is even stronger in restricting what an abstract thoughtis: “An object is abstract if and only if it is both non-physical and non-mental.”An object is acknowledged as mental when “it exists at a time if and only if it isthe object or content of some mental state or process at that time.” This statementimplies that an abstract object is an object if and only if it cannot be found in nature,cannot be constructed, and one cannot even form a mental image of it.
Another definition of abstract objects is that they lack causal powers [21]. Thismeans that abstract objects cannot affect other objects in any way. An empty set issuch a case of an abstract entity as it does not have any causal powers. The defini-tion of abstract entity is often so strict that some philosophers deny the existence ofan abstract entity as such. However, there seems to be better agreement on what anabstraction is: “It is a distinctive mental process in which new ideas or conceptionsare formed by considering several objects or ideas and omitting the features thatdistinguish them” [21]. Lewis [13] proposed that “abstract entities are abstractionsfrom concrete entities. They result from somehow subtracting specificity, so that anincomplete description of the original concrete entity would be a complete descrip-tion of the abstraction.” In the rest of the chapter we use the term abstraction alignedwith these definitions to only describe a process, as we have also done in our owndefinitions at the beginning. The entity after abstraction is, in our case, denoted asa representation. We do not enter the dispute of whether it is an abstract entity ornot. In such a way we build on the part that philosophers agreed upon, while weavoid the terminological controversy. Before we look at the use of abstraction invisualization, let us first consider its occurrence in related arts and sciences.
2.2.1 Abstraction in the arts
In the arts, the term abstract art refers to non-figurative artwork, where the intent isto develop art beyond depiction of natural or man-made objects. The compositionmay exist with a degree of independence from visual references in the world [1].This art movement started during early 20th century and emerged from figurative art.Artists such as Picasso, Mondrian, Kandinski, and many others originally depictednatural objects. The beginning of non-figurative art started with a deep analysis andobservation of the creative process, where the graphical elements that composedthe rendering became themselves the subject of study. The natural objects weregradually represented through collection of simpler geometric primitives. The artistssearched for an expression of minimal set of visual elements that is still able to carrythe figurative meaning. But they did not stop there. Artists further experimented withthe graphical elements beyond recognizability of any corresponding figure from the
4
rendering itself. Interestingly, one can sometimes discover a correspondence to theirearlier works where a particular figure is still recognizable, thus transitively thefigure can be imagined in the fully abstract art with such aids as well. It indicatesthat the artists still had a particular figure in mind, when rendering a particular art,while, without the prior work context, this figure would not be discovered by anotherhuman observer. This gradual process, which transformed figurative art into what isnow called abstract art, is abstraction.
2.2.2 Abstraction and generalization in cartography
In cartography, depending on a chosen scale for a map and its type/target audience,a subset of information is selected, the elements to be depicted are simplified andtheir depiction is adjusted. For example, streets can be shown with a much largerwidth than in reality, yet fine details of their path are removed. When zooming out,important elements and landmarks in the map are depicted, while generally lessrelevant elements are suppressed. At a particular level of scale, for example, the postoffice, a religious place, a building of historical significance, a bridge over the river,or the main streets are clearly depicted in the map, while similar objects in termsof spatial dimensions are abstracted into very simplified representations, if they areshown at all. The field has created a solid vocabulary and guidelines on how certainelements should be depicted and when should they be visible. In cartographic visuallanguage, the umbrella term for guidelines of how different scales should depictcertain information is map generalization [4]. We discuss the specific meaning ofthe term generalization below, but other principles such as grouping or classificationare applied here as well. In prior work, these concepts are considered as distinctabstraction principles and we discuss their specifics below.
2.2.3 Abstraction in shape analysis
In shape analysis, the term abstraction typically refers to a skeletonization or ex-traction of topological features that represent essential characteristics of the under-lying shape [8, 11]. Here, abstraction preserves the key properties of the geomet-ric components such as their connectivity. The levels of detail of these abstractedrepresentations are controlled through measures like persistence: this measure de-termines which structures are too small for particular scale to justify their validityand which are grouped into other larger-scale structures. Such abstracted represen-tations facilitate the extraction of hierarchies in shapes to facilitate geometric link-age, multi-scale representations, and—importantly—the topological representationis much sparser and facilitates an unobstructed clear view on the key geometricproperties. The same holds for the topology of flow data, where a flow field is clas-sified into points and regions of certain uniform properties such as sinks, sources,
5
and separatrices (curves or surfaces) that partition the flow according to its long-term behavior.
2.2.4 Mathematical abstraction
The term mathematical abstraction refers to a process of transforming a specific real-world situation into generalized form using mathematical formalism.1 The specificswhich do not affect the solution to a given problem are removed so that, in theend, only a set of key elements with properties and relations to each other re-mains, which can be expressed formally. Problems to solve in mathematics classare frequently expressed as real-world situations. The tasks are to abstract from thereal-world specifics and apply a mathematical formalism that provides the answerto the given problem. The development of mathematics and physical sciences hasadvanced through mathematical abstraction into Euclidean geometry, algebra, andanalysis. These developments have been possible due to humans being capable ofthinking in an abstract way.
2.2.5 Abstract thinking
School students are trained in abstract thinking by being challenged to solve a spe-cific real-world problem. To be able to do so, they are trained to abstract from thecase specifics by extracting only the essential components so that a formal solu-tion can be calculated and, finally, interpreted back for the specific real-world sce-nario. Abstract thinking is, according to cognitive psychology [17], the most com-plex stage in the development of cognitive thinking, where generalizations and con-cepts are used in the thought process. From a set of observations, hypotheses can beformed and logical reasoning can lead to conclusive statements [17].
2.2.6 Abstraction in object-oriented design
In computer science, the term abstraction achieves yet another flavor of its mean-ing. In object-oriented design, the most frequently used programming methodology,it primarily relates to the definition of classes and methods that cannot be instanti-ated. Typically, classes and methods are hierarchically grouped into increasingly ab-stract constructs such that implementations of particular functionality can be sharedamong many different elements. While for most of these classes it is possible tocreate instances, an abstract class is a construct that itself cannot be instantiated but
1 https://en.wikipedia.org/wiki/Abstraction (mathematics)
6
which organizes the functionality into a comprehensive representation. The classhierarchy as the outcome of such abstraction gives a clear understanding of differ-ences in functionality among various classes as well as what they have in common.It also facilitates further extensibility of existing code to support new cases that werenot considered in the initial software design.
2.2.7 Abstraction ontology
In the area of information and knowledge modeling, a particularly interesting pastwork closely relates to our own investigation. Leppanen [12] distinguishes betweenfirst-order and second-order abstraction. First-order abstraction is associated withprimary things, while second-order abstraction acts upon a predicate that definesthe primary things. An example of a primary thing is sedan with several predicates,among others a color. The result of the abstraction of a sedan would be a car or avehicle, which corresponds to first-order abstraction. Let us assume that an instanceof a sedan is painted with a particular blue, for example Maya Blue. This predicatecan also be abstracted to light blue or blue, a process which is of the second-orderabstraction type and is also termed as predicate abstraction.
Importantly, Leppanen defines four elementary abstraction principles: classifi-cation, generalization, composition, and grouping. First, classification is definedthrough the term isInstanceOf or that instances are typeOf. The opposite to clas-sification is instantiation. Second, generalization is a principle of abstraction wherethe differences of subtypes are suppressed to fit a supertype. This refers to an isArelationship and the antonym to generalization is specialization. Third, compositionis a principle of abstraction in which a whole concept is composed of part con-cepts. These parts are abstracted to form a whole object. This refers to a partOfrelationship and its opposite is the decomposition. Finally, the last principle of ab-straction is grouping which relies on a isMemberOf relationship and whose oppositeis individualization. For example, a particular person can be a member of a politicalparty. This abstraction includes aggregation, set membership, and association. Both,first-order and second-order abstractions can benefit all four elementary abstractionprinciples. In all cases, an important property to highlight is that abstraction is asso-ciated with an intentional and controlled loss of information.
Leppanen’s work stresses the importance of the concept point-of-view that playscrucial role during the abstraction process. When using classification on a thingtermed, for example, Margaret Thatcher, the abstraction along classification wouldlead to entity female or UK Prime Minister. If we would be using grouping, theabstraction would lead to Conservative Party. In case the composition principle isused for abstraction of UK Prime Minister, the outcome would be UK Govern-ment. Therefore, things might generally have many different kinds of abstractionsas things from reality are typically embedded in a complex and intertwined abstrac-tion hierarchies.
7
In his work, Leppanen combines philosophical and semiotic standpoints. In thecontext of semiotic frameworks [19], they refer to three kinds of things: a conceptthing, a referent thing, and a sign thing. Concepts are mental constructs, words ofmind, and form basic components of human knowledge. A referent is an elementof reality that relates to the concept. A reality describes a set of anything that existsor can possibly exist, physically or virtually. A sign is anything that can stand forsomething else, including symbols, text, or images. As such it is a representationof a concept. These concepts are used below in the discussion of abstraction invisualization. We applied the same terminology in our definitions from the start ofthe chapter, but we added the concept of a source thing (Def. 1).
2.2.8 Summary of abstraction in the world outside visualization
The intuitive understanding of abstraction has been reinforced by this brief excur-sion into various fields and that stand and argue for abstraction. We can observe thatthe term is not used uniformly and that it is frequently exchanged with other terms.The recurrent pattern is that abstraction relates to formation of some higher-orderconstructs or representations that are result of a transformation of lower-level enti-ties. The lowest entities are more tangible, while the higher levels of the abstractionhierarchy are further removed from tangibility and become more mental constructsand concepts (defined as the constituents of thoughts [21]) that, in one way or an-other, allow humans to recognize certain characteristics clearer than the lower-levelrepresentations. The ability to abstract seems to be one of the core properties ofhumans, present while shaping the entire body of analytical knowledge humankindhas formed throughout our history.
2.3 Abstraction for Visualization
Let us now investigate how abstraction manifests itself in visualization. We proposethat abstraction is equally central to visualization as it is to other areas in which ana-lytic reasoning is the core part of a processing workflow. Visualization is the processof transforming the digital representation of data into visual representations that areexposed to a human viewer (Def. 6). It takes advantage of the fact that most humansare extremely efficient in comprehending information presented as a visual stimulus.Naturally, this stimulus has to be well designed to convey the intended information(Def. 5). This aspect is the main concern of the visualization mapping stage of thevisualization pipeline. Visualization is omnipresent in studying various real-worldphenomena, conveying structures, methods, or concepts. In visualization, the ab-straction process guides the transformation into visual representations (Def. 2, 3),similar to the process of abstract thinking. In some sense it serves as an extension ofthe working memory, where needed information can be instantaneously accessed.
8
We thus first clarify the meaning of abstraction in visualization and then discuss itscore properties.
To bring visualization into the context of semiotic frameworks, the sign is termedas representation, both digital and visual, and the referent is the studied phenomenonfrom reality (Def. 1, 2). The concept is what relates to the referent and can be con-veyed through the representation. In visualization, abstraction is performed at leastin three stages: first, the abstraction of the reality into data representations and,second, the data representation is, through abstraction, transformed into visual rep-resentations. Third, a visual representation is transformed to a mental model or amemory representation through the perceptual and cognitive processes of the hu-man observer.
Abstraction has occurred if the quantum of information before the abstraction ishigher than in the representation after abstraction, while some aspects of the originalrepresentation are preserved and become more prominent (Def. 1). In case there isno intended information loss, we refer to a more general term transformation ormapping. For example, several simultaneous abstraction processes that individuallywork on different aspects of the things could be combined, some work in a positivedirection (removal of information) and others in a negative direction. This couldlead to composite transformation or mapping that transfer one representation intoanother, with information loss and information gain at the same time.
2.3.1 Task abstraction
Visualization is driven by a particular intent. There is a reason behind a visualiza-tion, even in the casual scenarios. This intent defines the point-of-view (Def. 4),which, as a controlling mechanism, can steer how abstraction changes the represen-tations. In the visualization literature, Munzner [18] describes a hierarchical frame-work into which specific individual visualization usage scenarios can be abstracted.On the highest level, Munzner classifies the tasks as a combination of an action upona target. The action class is instantiated into analyze, search, and query, which canbe further instantiated into lower-level classes of actions. The target is instantiatedinto data in general, attributes, networks, and spatial data which are further instan-tiated into more detailed targets. It is the combination of the action and target thatwould define the point of view to guide the abstraction process.
2.3.2 Data abstraction
Munzner [18] also defines various types of data and data sets for visualization.Data types are items, attributes, links, positions, and grids. Data set types are tables,networks, trees, fields, geometry, clusters, sets, and lists. All these types are con-cept things (Def. 2). The data abstraction here refers to the transformation from the
9
real-world phenomenon, the referent thing, into data structures (concept thing) anddigital representations (sign thing), to facilitate an efficient and automatized compu-tational processing. This task of data abstraction is somewhat similar to the math-ematical abstraction process. In both cases we end up with a formal representationon which standardized mathematical or computational machinery can be applied.
The initial data abstraction is typically performed during the acquisition pro-cess. Either real-world observations are made and digitally stored in a particulardata representation or even a mathematical model is formulated based upon theseobservations. Both forms are data representations abstracted from the thing that ex-ists in reality, and these representations have been achieved through a classificationprocess.
The result of the initial data abstraction is frequently further abstracted into an-other data representation to promote a particular point-of-view, neglecting unimpor-tant aspects of the original data representation. As such, the filtering operation istypically applied, which might be considered to relate to map generalization and assuch corresponds to the generalization abstraction principle. Once the data represen-tation contains the relevant data prominently, a conversion into data representationis performed that can efficiently be visually represented.
2.4 Visual Abstraction
After series of data abstractions and transformations (the latter when no informa-tion loss happens), in visualization, the data is transformed/abstracted into visualrepresentations. A visual representation is then shown on a display, perceived, andfurther cognitively processed by a human observer. The visual abstraction processthat generates this visual representation can be performed in many ways: In the caseof kernel density estimation plots or clustering techniques, for instance, data can bevisually abstracted using a composition principle such that smaller elements becomea part of higher-order representations. In case of volumetric scalar fields, the voxelvalues can be classified into color and opacity ranges. By this, some voxels becomeabstracted into types such as air, soft tissue, or hard tissue. Level of detail tech-niques would typically relate to composition or grouping; in atomistic visualization,individual atoms become member of particular molecules, which in turn becomemembers of certain compartments, up to cells. In many cases of particular visualabstraction it can be simultaneously argued for different abstraction principles, andthere might be more principles than those proposed by Leppanen [12].
Munzner [18] provides a conceptual framework according to which visual repre-sentations or encoding can be categorized. This framework is rather extensive, how-ever on the low level the visual encoding can abstract data representations throughtwo key aspects. The first aspect is the graphical mark that positions each data ele-ment: points, lines, and areas. These marks further encode quantitative informationor their mutual relationship is conveyed through various perceptual channels: po-sition, shape, color, size, and angle. These basic low-level perception-driven visual
10
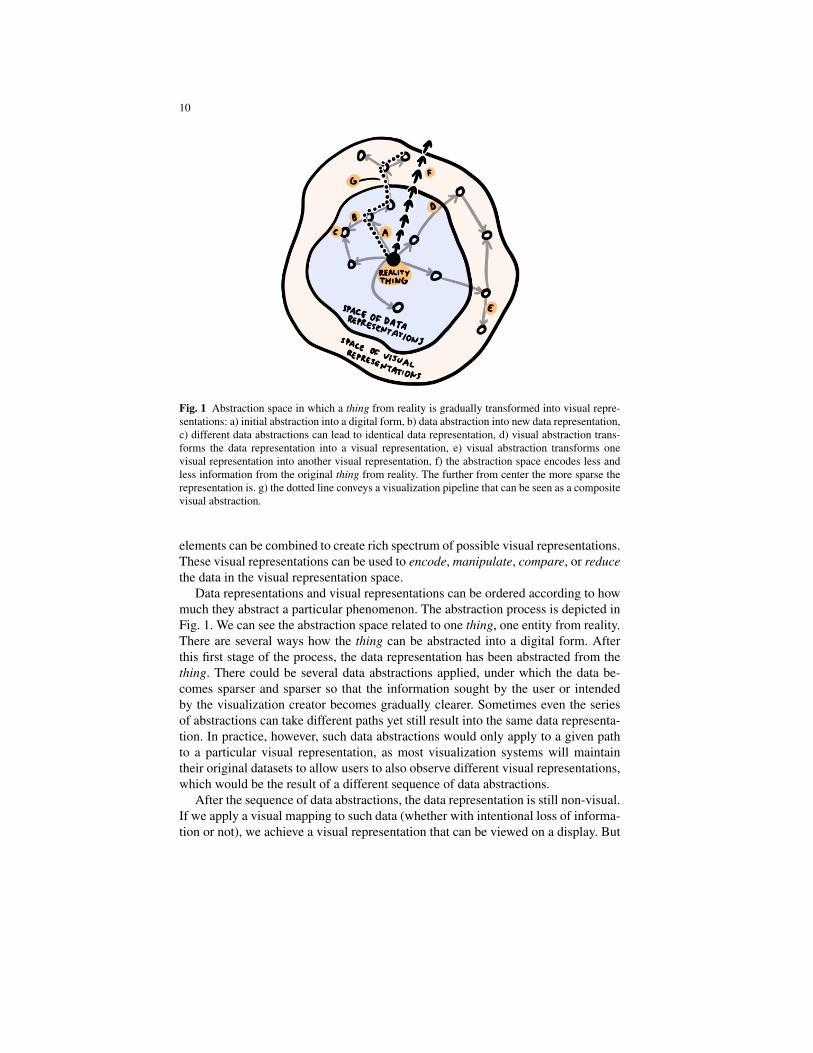
Fig. 1 Abstraction space in which a thing from reality is gradually transformed into visual repre-sentations: a) initial abstraction into a digital form, b) data abstraction into new data representation,c) different data abstractions can lead to identical data representation, d) visual abstraction trans-forms the data representation into a visual representation, e) visual abstraction transforms onevisual representation into another visual representation, f) the abstraction space encodes less andless information from the original thing from reality. The further from center the more sparse therepresentation is. g) the dotted line conveys a visualization pipeline that can be seen as a compositevisual abstraction.
elements can be combined to create rich spectrum of possible visual representations.These visual representations can be used to encode, manipulate, compare, or reducethe data in the visual representation space.
Data representations and visual representations can be ordered according to howmuch they abstract a particular phenomenon. The abstraction process is depicted inFig. 1. We can see the abstraction space related to one thing, one entity from reality.There are several ways how the thing can be abstracted into a digital form. Afterthis first stage of the process, the data representation has been abstracted from thething. There could be several data abstractions applied, under which the data be-comes sparser and sparser so that the information sought by the user or intendedby the visualization creator becomes gradually clearer. Sometimes even the seriesof abstractions can take different paths yet still result into the same data representa-tion. In practice, however, such data abstractions would only apply to a given pathto a particular visual representation, as most visualization systems will maintaintheir original datasets to allow users to also observe different visual representations,which would be the result of a different sequence of data abstractions.
After the sequence of data abstractions, the data representation is still non-visual.If we apply a visual mapping to such data (whether with intentional loss of informa-tion or not), we achieve a visual representation that can be viewed on a display. But
11
even visual representations can be further transformed into sparser visual represen-tations by means of visual abstraction. The more far away in the abstraction space,the less information from the reality is preserved. If we concatenate a path from thereality to the final visual representation, we can see a visualization pipeline. In casewe perform a transformation so that the distance between the original representa-tion and the reality and the target representation and the reality are the same, we donot perform an abstraction. If the target representation is closer to the reality thanthe original representation, we perform an inverse operation to abstraction. Yet thisinverse abstraction only happens in the eyes of the beholder, as we always removeinformation along the path from reality to visual representation.
2.4.1 Meaningful Abstraction
It is not clear whether an abstraction has to be meaningful or whether its only con-dition is a loss of information. What if, for example, a high-dimensional data setis projected onto fewer dimensions? Projection is, in principle, a valid abstraction.But what if we project only every second data element and create a confusing datarepresentation in which only half of the data set is projected onto lower-dimensionalspace. Is such a meaningless projection also an abstraction? From the information-theoretic point of view we have lost a certain amount of information, so it can beconsidered as an abstraction. To differentiate us from this view, we should definethe term meaningful abstraction for those abstractions that are useful in some appli-cation contexts (Def. 5).
Visual mapping may result into a representation with an equal amount of infor-mation, however, more visually confusing than the previous representation. For ex-ample, it is known that humans have difficulties with identifying portraits of knownfaces if they are rotated by 180 degrees from the natural portrait orientation [22].From the information-theoretic point of view, the rotation does not remove informa-tion from the image, but there is a significant difference in cognitive load betweenthese two representations. Such a rotation is consequently not a meaningful visualmapping. The same holds for two visual representations of a graph, a node-link di-agram and an adjacency matrix. When the one visual representation is transformedinto another, no information is lost. Yet the cognitive load for viewers differs be-tween these two representations. Building on the term of meaningfulness, a visualrepresentation can be more meaningful (or effective) for a particular intent thananother visual representation. Visual abstractions that lead to these representationsmight be ordered or perhaps even quantified in how meaningful they are.
The concept of meaningfulness in terms of visual abstraction processes is tightlyrelated to visual perception processes. In principle, a meaningful visual abstractionmakes the job of visual processing simpler so that less of a cognitive processingneeds to be invested, for a given purpose or goal, in comprehending the abstractedvisual representation to understand the intended aspects of the reality. Therefore,visual abstractions relevant for visualization will need to result into lower cognitive

12
load when comprehending the abstracted representation, for the chosen intention.Therefore the meaningful visual abstraction has to pass two conditions: the targetvisual representation has to formally contain less information and the cognitive loadhas to be lower. The perceived information, if not increase, should decrease at mostlinearly with the cognitive load.
At this point we solidify the previous discussion and define some key terms invisualization. Abstraction is a process, it is a transformation along which some in-formation is intentionally lost to give prominence to the higher-level informationwithin. The abstraction process results into a representation. For pure data abstrac-tion, it results in a data representation, while, when visual abstraction is involved,it results in a visual representation. These abstractions can be considered as mean-ingful as long as they are benefiting particular application example or purpose. Themeaningfulness property is scoped by the set of meaningful applications. A visualrepresentation is the result of a visual transformation. When information is inten-tionally lost and the cognitive load is lower, while the perceived information lossis, at most, linear with the cognitive load difference, then we consider the visualabstraction as meaningful. Visual mapping and visual encoding, while both hav-ing their distinct meaning, can be used interchangeably with visual transformation.Visual metaphor operates on the concept of analogy. It presents a sign thing of a dif-ferent referent thing from reality than the one originally regarded. This way visualmapping associates properties of one referent thing to another referent thing. Anexample of a visual metaphor are Chernoff faces, where different facial propertiesencode multivariate data [7].
2.4.2 Abstraction Axes and Abstraction Spaces
So far we mainly discussed the process of abstraction from reality via data repre-sentations to visual representations. Yet we also showed that positive or negativeabstraction can be perceived by a viewer as he or she is manipulating this abstrac-tion chain or visualization pipeline. For better describing the latter aspect, Viola andIsenberg [24], inspired by earlier examples in visualization [14, 15, 16, 27] as wellas in the arts world, proposed the notion of axes of abstraction which could forman abstraction space. With these two concepts we can describe the abstraction thatis perceived and controlled by the beholder, in contrast to the abstraction that isapplied as a particular visual representation is generated (Def. 7).
An abstraction axis in this concept is the previously mentioned virtual, perceivedconnection between different end points of the previously discussed abstraction pro-cess. This connection arises for observers as they adjust the settings of the visu-alization pipeline. This notion, however, assumes that, for each abstraction axis,there is a clearly identifiable succession of changes to the visual representation that(a) decreases the amount of information in each step and (b) provides a meaning-ful generalization of the depicted content to the viewer. In fact, Viola and Isen-berg [24] even state that abstraction axes do not need to be unique: for their chosen
13
example from structural biology [27] they show that a molecular van-der-Waalssurface-based molecular representation can be subjected to two alternative forms ofstructural abstraction (a phenomenon they call “forking” of axes)—one leading to asurface-based abstraction via different probe sizes and one leading to a second-orderrepresentation via balls-and-sticks, licorice (sticks-only), and backbone representa-tions.
In particular for this latter form of abstraction, one could argue that condition(a) is not necessarily met: while the transition from van-der-Waals surfaces to thelicorice representation in van der Zwan’s [27] model certainly removes the detailof the graphical atom representations, it simultaneously also adds representations ofthe bonds between atoms that did not exist in the starting configuration: the represen-tations of atoms with implicitly represented bonds are continuously replaced withrepresentations of bonds with implicitly represented atoms. One could thus arguethat in this transition no abstraction happens, only one representation is smoothlytransitioned into another. This transition, however, only happens in the eyes of thebeholder; at any given point along the transition still abstraction happens from real-ity (source things) via data representations to visual representations.
A more recent example is the work by Miao et al. [15] who similarly constructeda progression of transitions from an atom-based representation of DNA nanostruc-tures and the mechanical building blocks of the nanostructures to be built. Interest-ing in their progression of ten abstraction stages is that, while the first and last arefairly clear, the specific order of the sequence in-between is not and was createdbased on the discussions with and needs of their collaborating domain scientists.
Based on these two examples, we thus suggest that pure and continuous abstrac-tion axes are rather rare. Instead, abstraction axes are typically composed of smallerbuilding blocks where one representation is (typically) seamlessly transformed intoanother and as such forms a constructed sequence. In practice we often find abstrac-tion axes that progress from a representation with more information to a represen-tation with less detail, thus the name abstraction axis. We can also find transitions,however, that remove one type of visual detail and replace it with another type ofvisual information. Abstraction axes are always constructed with a given purposeand application case in mind and are not unique. If two abstraction axes work onindependent attributes of the visual representation and can thus be independentlycontrolled, then they form an abstraction space (Def. 7).
2.5 An Information-Theoretic Analysis of Abstraction as aProcess
As described above, the notion of “abstraction” encompasses a wide range of defini-tions in different contexts. It can be quite difficult for a single mathematical formula-tion to encapsulate the essences of these definitions. In this section, we examine thecharacteristics of the process of abstraction using information-theoretic measures.We show that the definitions given at the beginning of this chapter can be explained
14
using an information-theoretic metric, which therefore offers a potential means formodelling and measuring visual abstraction.
Fig. 2 shows several visualization images generated using some typical visual-ization techniques. Most visualization researchers would unreservedly refer to thefirst four images, (a)–(d), as results of visual abstraction, and many would content-edly accept a suggestion that (e) and (f) are also results of visual abstraction, butsome would be hesitant to consider (g) and (h) as such abstracted representations.Nevertheless, one can also argue that the latter four images, (e)–(h), are also resultsof visual abstraction because, in comparison with the source data, some informa-tion has been abstracted away and, in comparison with statistical abstraction of thesource data, the information presented is visual.
First, the level of willingness for people to consider a visualization image as anabstracted visual representation does not appear to be related to the quality of theimage or the usefulness of the technique that generates the image. Second, we canobserve that both Fig. 2(a) and Fig. 2(h) feature some deformation, and deforma-tion does not seem to be a critical factor that influences the perception of visualabstraction results. Similarly, from a comparison of (b) vs. (h) and (c) vs. (g) we canobserve that the types of data to be visualized do not have decisive influence uponthe perception of the term “visual abstraction”. Third, we can also observe that animpression of photorealism or just a perceived intention seems to bring about thehesitation in characterizing a visualization image as the result of visual abstraction.Meanwhile, having no or less photo-realistic effect in an image (e.g., (e) or (f)) doesnot immediately imply visual abstraction either, at least to some people. Here theadjective “photo-realistic” indicates that the rendering algorithm used was designedto achieve a photo-realistic effect, without implying that the image resulting fromthe rendering process actually resembles a photograph.
One hypothesis is that our willingness or hesitation to consider a visualizationimage as resulting from visual abstraction relates to an unconsciously-integratedreasoning about two conditions of visual abstraction.
A. A visual abstraction is a transformation from data to its visual representa-tion with some information loss—Here data can be of any data types includingvisual data (e.g., image corpora and videos). This can be considered as a broaddefinition of visual abstraction, and encapsulates the aforementioned definitionsin cartography and shape analysis. While introducing a constraint of visual out-put, it exhibits a parallel with the definitions in relation to mathematical abstrac-tion, abstract thinking, and grouping in object-oriented design. All eight imagesin Fig. 2 satisfy this condition in general. We will discuss information loss indetail later.
B. A visual abstraction is a transformation from a more photo-realistic visualrepresentation to a less photo-realistic one—This can be considered as a nar-row definition of visual abstraction, and encapsulates the aforementioned defini-tions in art, cartography, and shape analysis. It applies to transformations withvisual input as well as visual output. Considering the examples in Fig. 2, forimages (a), (b), (c), and (d), it is relatively easy for one to imagine their photo-realistic counterparts. Although some of these images can be generated directly

15
(a) London underground map [23] (b) pen-and-ink volume rendering [3]
(c) 3D streamline flow visualization [20] (d) glyph-based video visualization [9]
(e) network visualization [14] (f) parallel coordinates visualization [25]
(g) 3D flow visualization [26] (h) volume visualization and deformation [2]
Fig. 2 Examples of visualization images that may attract different views as to whether they are theresults of visual abstraction processes. Most would agree that (a)-(d) are visually abstract, manywould content that (e) and (f) are considered so, and some might be hesitant about (g) and (h).
16
from source data that may not be visual, a subjective impression of a transfor-mation that decreases photorealism is sufficient for viewers to associate theseimages with abstraction. Meanwhile, it is harder to imagine a photo-realistic ver-sion of (e) or (f), and therefore this condition does not appear to be applicable tothem. For images (g) and (h), it is intuitive to consider them more photo-realisticthan less. They not only fail to satisfy, but also negate, this condition.
We can easily see that reading data using a spreadsheet or reading their statisticalsummary do not meet either condition. Images (a), (b), (c), and (d) in Fig. 2 satisfyboth conditions. Images (e) and (f) satisfy condition A but not B. Images (g) and(h) satisfy condition A but negate B. Suppose that we had a numerical score 2 forcondition A, score 1 for condition B, score 0 for not applicable, and score −1 fornegation. Spreadsheet or statistical summary would score 0; (g) and (h) would score1; (e) and (f) would score 2; (a), (b), (c), and (d) would score 3. Such a scoringsystem would reflect the level of willingness for one to characterize a visualizationimage as the result of visual abstraction.
We can also infer that condition A is more essential than condition B. WithoutA, images (e) and (f) would not be considered as results of visual abstraction at all.Without B, there would not be any hesitation about whether images (g) and (h) areresults of visual abstractions.
However, condition A does not in itself meet the expectation for the minimalquality that the process of meaningful visual abstraction should possess, since arbi-trarily throwing away information should not be referred to as meaningful abstrac-tion. Below we use several information-theoretic measures to clarify Condition A.
Let Pd→v be a process for transforming a dataset d to a visualization image v. LetD be the data space containing all possible datasets that Pd→v can take as its input,and V be the data space containing all possible visualization images that Pd→v cangenerate. In information theory, D and V are referred to as alphabets. The dataset dis thus a letter in the input alphabet D, and the visualization image v is a letter of theoutput alphabet V. The process Pd→v can thus be written as Pd→v : D−→ V.
The Shannon entropy measures the amount of uncertainty or variation of an al-phabet. Let p(d) be the probability of a dataset d in the context of an application.The Shannon entropy of D is thus defined as:
H (D) =− ∑d∈D
p(d) log2 p(d)
When all letters in D have the same probability, we have H (D) = log2 ‖D‖, where‖D‖ is the number of different letters in D. Similarly, we can measure the Shannonentropy H (V) as the amount of uncertainty or variation of V.
Alphabet Compression [6] is the difference H (D)−H (V), which is a coarseindication of the amount of information loss of the visualization process Pd→v.Consider a simple example. D is defined by a real variable, X , which may takevalid values between 0.00 and 10,000.00 at two decimal point precision. There arethus 1,000,001 possible values. Let all values have the same probability. We haveH (D)≈ 20 bits.
17
Pd→v
Visual Abstraction / Visualization
Pd→v
Performing Decision or Analytical Tasks
𝔻 𝕍 𝕋
Qd←v
Reconstruction
Qv←t
Reconstruction
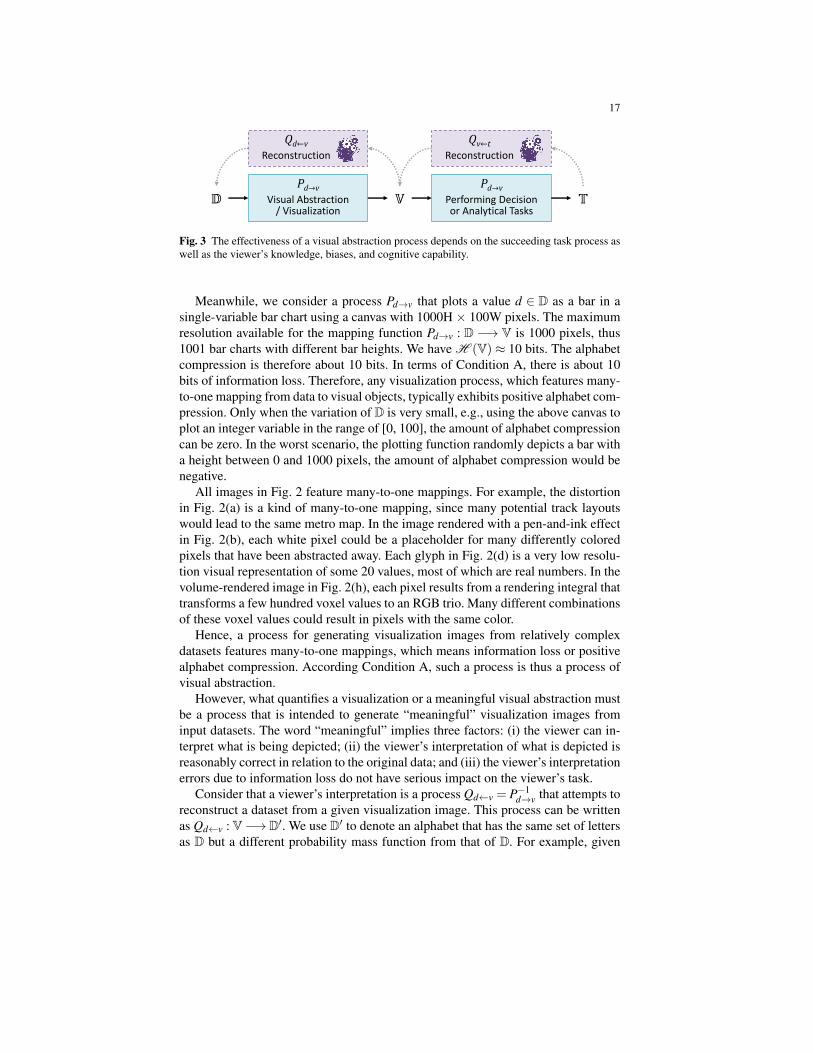
Fig. 3 The effectiveness of a visual abstraction process depends on the succeeding task process aswell as the viewer’s knowledge, biases, and cognitive capability.
Meanwhile, we consider a process Pd→v that plots a value d ∈ D as a bar in asingle-variable bar chart using a canvas with 1000H × 100W pixels. The maximumresolution available for the mapping function Pd→v : D −→ V is 1000 pixels, thus1001 bar charts with different bar heights. We have H (V)≈ 10 bits. The alphabetcompression is therefore about 10 bits. In terms of Condition A, there is about 10bits of information loss. Therefore, any visualization process, which features many-to-one mapping from data to visual objects, typically exhibits positive alphabet com-pression. Only when the variation of D is very small, e.g., using the above canvas toplot an integer variable in the range of [0, 100], the amount of alphabet compressioncan be zero. In the worst scenario, the plotting function randomly depicts a bar witha height between 0 and 1000 pixels, the amount of alphabet compression would benegative.
All images in Fig. 2 feature many-to-one mappings. For example, the distortionin Fig. 2(a) is a kind of many-to-one mapping, since many potential track layoutswould lead to the same metro map. In the image rendered with a pen-and-ink effectin Fig. 2(b), each white pixel could be a placeholder for many differently coloredpixels that have been abstracted away. Each glyph in Fig. 2(d) is a very low resolu-tion visual representation of some 20 values, most of which are real numbers. In thevolume-rendered image in Fig. 2(h), each pixel results from a rendering integral thattransforms a few hundred voxel values to an RGB trio. Many different combinationsof these voxel values could result in pixels with the same color.
Hence, a process for generating visualization images from relatively complexdatasets features many-to-one mappings, which means information loss or positivealphabet compression. According Condition A, such a process is thus a process ofvisual abstraction.
However, what quantifies a visualization or a meaningful visual abstraction mustbe a process that is intended to generate “meaningful” visualization images frominput datasets. The word “meaningful” implies three factors: (i) the viewer can in-terpret what is being depicted; (ii) the viewer’s interpretation of what is depicted isreasonably correct in relation to the original data; and (iii) the viewer’s interpretationerrors due to information loss do not have serious impact on the viewer’s task.
Consider that a viewer’s interpretation is a process Qd←v = P−1d→v that attempts to
reconstruct a dataset from a given visualization image. This process can be writtenas Qd←v : V−→D′. We use D′ to denote an alphabet that has the same set of lettersas D but a different probability mass function from that of D. For example, given
18
a bar that is 499 pixels tall, a viewer may interpret it as one of these values inthe original D, {498.00,498.01, ...,499.99,500.00}. Imagine that the interpretationis biased towards 500.00 due to the corresponding mark on the vertical axis. Theprobability q(500) would be undesirably higher than the original probability p(500).
In information theory, such errors in the interpretation can be collectively mea-sured by the Kullback-Leibler divergence, which is defined as:
DKL(D′‖D) = ∑d∈D
q(d) log2q(d)p(d)
where p() and q() are the probability mass functions of D and D′ respectively, andq(d)/p(d) is a discrete representation of the Radon-Nikodym derivative of q withrespect to the original p.
In the context of visual abstraction, this measurement offers a counterbalance tothe measurement alphabet compression. It is referred to as Potential Distortion [6].While it is desirable to have the results of visual mapping Pd→v as abstract as possi-ble, i.e., for Pd→v to have a high amount of alphabet compression, it is also necessaryto keep the inaccuracy of the interpretation function Qd←v as low as possible, i.e.,for Qd←v to have a low amount of potential distortion.
Since Qd←v is a human-centric process, Qd←v may feature inaccuracy due toperceptual errors and cognitive biases. However, Qd←v can also make use of humanknowledge that is not encoded in the data to help more accurate reconstruction. Forexample, imagine that a viewer is asked to guess what would be the original colorson the patch of white pixels between two black lines in the pen-and-ink visualiza-tion image in Fig. 2(b). A naıve guess would be either white (as what is seen) or anarbitrary selection from various grey colors. Most viewers, especially those familiarwith the depicted object or volume visualization methods, can do much better thanthe naıve guess. Hence the process of “knowledge-assisted guessing”—a heuris-tic process—has a lower amount of potential distortion than the naıve guessing. Ingeneral, it is this human knowledge that enables visual abstraction to be deployedeffectively in many situations, such as those illustrated in Fig. 2. Whether users havethe adequate ability to interpret the results of visual abstraction is thus one of thekey criteria for judging if a visual abstraction process is appropriate or its results aremeaningful, which reflecting the two factors (i) and (ii) described above.
Nevertheless, since Pd→v is usually a many-to-one mapping, and Qd←v is usuallya one-to-many mapping, one may wonder why we should go through such “unnec-essary fuss” to apply the process Pd→v first to D and another process Qd←v to re-construct D′. One important rationale is about the task succeeding Pd→v and Qd←v.The judgment about whether a visual abstraction process is appropriate or its re-sults are meaningful thus depends on another process Pv→t . As illustrated in Fig. 3,Pv→t takes V as the input, and generates another output alphabet T that may consistof a collection of letters, e.g., different options of a decision, different levels of anassessment, different categories of a situation, etc.
The process of visual abstraction Pd→v and the reconstructive interpretation Qd←vcan collectively affect the task process Pv→t , especially its Cost Ct(Pv→t ,Qv←t).
19
Similar to Qd←v, here Qv←t is an interpretation process for reconstructing V fromT. For a univariate value (e.g., 499.38), there is little merit to visualize it using abar chart. The difference of the cost for reading the number and that of viewing abar is negligible for most tasks. The potential distortion caused by visual abstrac-tion can only affect the process Pv→t negatively. However, if the number of variablesincreases, e.g., 10 variables, the cognitive load for viewing and comparing 10 num-bers is likely to be higher than viewing and comparing 10 bars using a bar chart. Itis not difficult to imagine the merits of visualization when the number of variablesincreases. For the volume datasets featured in Fig. 2(b,h), the number of variables ina dataset is typically at the scale of 256×256×256 or more. It is inconceivable toperform a decision task by reading the numerical values of such a volume dataset.Hence, visual abstraction can be used to transform a volume dataset with a hugenumber of variables to visualization images as shown in (b) and (h), which reducesthe cost Ct(Pv→t ,Qv←t) significantly.
The above information-theoretic discourse on visual abstraction is based on thecost-benefit metric for data intelligence proposed by Chen and Golan [6]. For anydata intelligence process Pi with an input alphabet Zi and an output alphabet Zi+1,its cost-benefit ratio is defined as:
BenefitCost
=Alphabet Compression−Potential Distortion
Cost
=AC(Pi)−PD(Qi)
Ct(Pi,Qi)=
H (Zi)−H (Zi+1)−DKL(Z′i‖Zi)
Ct(Pi,Qi)
When this metric is applied to the two processes in Fig. 3, we have the combinedcost-benefit ratio as:
BenefitCost
(d→ v→ t
)=
AC(Pd→v)−PD(Qd←v)+AC(Pv→t)−PD(Qv←t)
Ct(Pd→v,Qd←v)+Ct(Pv→t ,Qv←t)(1)
=H (D)−H (V)−DKL(D′‖D)+H (V)−H (T)−DKL(V′‖V)
Ct(Pd→v,Qd←v)+Ct(Pv→t ,Qv←t)
=H (D)−H (T)−DKL(D′‖D)−DKL(V′‖V)
Ct(Pd→v,Qd←v)+Ct(Pv→t ,Qv←t)
In comparison, if one has to perform the task by reading the data without visualiza-tion, the cost-beneficial ratio would be:
BenefitCost
(d→ t
)=
AC(Pd→t)−PD(Qd←t)
Ct(Pd→t ,Qd←t)(2)
=H (D)−H (T)−DKL(D′′‖D)
Ct(Pd→t ,Qd←t)
Note that the term DKL(D′‖D) in Eq. (1) and the term DKL(D′′‖D) in Eq. (2) are ofdifferent quantities as they relate to Qd←v and Qd←t respectively.
When the dataset d is large and complex, we can see that the cost Ct(Pd→t ,Qd←t)in Eq. (2) would be much higher than the combined costs in Eq. (1) in terms of time

20
and cognitive load in performing the task. In other words, we have:
Ct(Pd→t ,Qd←t)> Ct(Pd→v,Qd←v)+Ct(Pv→t ,Qv←t)
Although reading data might appear to be more accurate, the reconstruction processQd←t from the task alphabet T (e.g., the patient has a tumor or not) to the dataalphabet D (e.g., a volume dataset) is much more error-prone than the reconstructionprocess via visualization. In other words, we have:
PD(Qd←t)> PD(Qd←v)+PD(Qv←t)
With AC(Pd→v)+AC(Pv→t) = AC(Pd→t), it is not difficult to conclude:
BenefitCost
(d→ v→ t
)>
BenefitCost
(d→ t
)Under Condition A, we can thus mathematically reason that, for any slightly
large or complex dataset, the process from data alphabet D to task alphabet T withvisual abstraction is usually more cost-beneficial than the process without.
For some very simple datasets, such as a univariate value, visual abstraction maynot have an information-theoretic merit. However, this is not to say that it couldnot have cognitive merit in disseminative visualization. More likely, the results ofvisual abstraction could attract more attention from the viewers who unconsciouslydevote more cognitive load to the task. Although the viewers’ cost-beneficial ratioincreases, the presenter of the disseminative visualization benefits from the contri-bution of extra cognitive load from the viewers. In many ways, this is similar toscenarios of disseminative visualization, where the amount of visual abstraction ispurposely reduced in order to attract viewers’ attention, and hence their cognitiveload. Such scenarios may include, for instance, showing an animated chart, whilsta static chart could adequately convey the information, or showing visualization intheatre-based virtual environments [5].
Similarly, we can also use the cost-benefit metric to analyze the scenarios undercondition B by comparing the cost-benefit ratio of a more photo-realistic techniquewith a less photo-realistic technique. Similar to Condition A, the potential distortionis affected by viewers’ knowledge as well as their biases. The cost is affected by theviewer’s task as well as cognitive capability.
Furthermore, this metric can be applied to human-centric processes (e.g., visu-alization and interaction) as well as machine-centric processes (e.g., statistics andalgorithms). In general, statistical abstraction and algorithmic abstraction usuallyresult in more alphabet compression as well as more potential distortion but lesscost than visual abstraction. In designing a visual analytics workflow, the metriccan be used to compare the cost-benefit of a human-centric process with that of amachine-centric process by analyzing the trade-off among alphabet compression,potential distortion, and cost. The metric can also be used to guide a visualizationdesigner in choosing different forms of visual abstraction, e.g., in reasoning about
21
the trade-off among the amount of abstraction, the potential perceptual errors, andthe cost of task performance.
In summary, as defined at the beginning of this chapter, meaningful visual ab-straction depends on some points of view and some tasks. From the perspective ofinformation theory, the points of view may be in either or both of the followingforms:
• The factors that influence the alphabet compression and cost of the process Pd→vfor transforming data to visualization. These factors may include the designers’wish to keep or highlight some information while removing or deemphasizingother information, their understanding of the task requirements, their apprecia-tion of the resources available for visualization, and their awareness of the view-ers’ knowledge of visual representations and skills of visual analysis.
• The factors that influence the potential distortion and the cost of the processQd←v for reconstructing data from visualization. These factors may include theviewers’ knowledge related to the data being depicted and the visual represen-tations used, their understanding about the information required for performingtheir tasks, and their cognitive load and time constraint in executing the processQd←v.
Meanwhile, tasks can be defined as processes that succeed the processes Pd→v andQd←v. As long as the tasks fall broadly in the category of data intelligence tasks, thecost-benefit metric proposed by Chen and Golan [6] can also be applied to these suc-ceeding processes. Therefore, from the information-theoretic perspective, the mostmeaningful visual abstraction, or the most effective visualization in general, is theprocess with the optimal cost-benefit measure.
2.6 Summary
In this chapter we thus formally defined the concepts of abstraction and visual ab-straction as they relate to the field of visualization and based on existing notionsof the terms in related fields such as the arts and in philosophy. We argued thatany visual representation is the result of multiple abstraction steps from reality, andwe called the step from data representation to visual representation visual abstrac-tion. We also showed that as users of a visualization system we do not observe thisabstraction process but instead adjust settings to transition from one visual repre-sentation to another—each being an independent result of the abstraction processfrom source thing to sign thing. Yet as designers of visualization systems we canprovide guided interaction such that several results of meaningful abstractions canbe assembled into sequences that we call abstraction axes to better illustrate howdifferent aspects of reality relate to each other, and several of these abstraction axescan be assembled into abstraction spaces to illustrate the interrelation of several in-dependent aspects. So while we argue that any visual representation is the result of

22
an abstraction process, it is still important to discuss abstraction and visual abstrac-tion as it teaches us about visualization as a process in general.
Acknowledgments
The authors would like to thank Jos Roerdink, Helwig Hauser, Stefan Bruckner,Hans-Christian Hege, and Torsten Moller for fruitful discussion that helped shapingthe chapter. Thanks to Peter Mindek for illustrating the abstraction space in Fig. 1.
References
1. Arnheim, R.: Visual Thinking. University of California Press, Berkeley, Los Angeles, London(1969)
2. Birkeland, A., Viola, I.: View-dependent peel-away visualization for volumetric data. In: Proc.SCCG, pp. 121–128. ACM, New York (2009). DOI 10.1145/1980462.1980487
3. Bruckner, S., Groller, M.E.: Style transfer functions for illustrative volume rendering. Com-puter Graphics Forum 26(3), 715–724 (2007). DOI 10.1111/j.1467-8659.2007.01095.x
4. Buttenfield, B.P., McMaster, R.B. (eds.): Map Generalization: Making Rules for KnowledgeRepresentation. Longman Scientific & Technical, Harlow, Essex, UK (1991)
5. Chen, M., Gaither, K., John, N.W., McCann, B.: An information-theoretic approach to thecost-benefit analysis of visualization in virtual environments. IEEE Transactions on Visual-ization and Computer Graphics 25(1), 32–42 (2019). DOI 10.1109/TVCG.2018.2865025
6. Chen, M., Golan, A.: What may visualization processes optimize? IEEE Transac-tions on Visualization and Computer Graphics 22(12), 2619–2632 (2016). DOI10.1109/TVCG.2015.2513410
7. Chernoff, H.: The use of faces to represent points in k-dimensional space graphi-cally. Journal of the American Statistical Association 68(342), 361–368 (1973). DOI10.1080/01621459.1973.10482434
8. Cornea, N.D., Silver, D., Yuan, X., Balasubramanian, R.: Computing hierarchical curve-skeletons of 3D objects. The Visual Computer 21(11), 945–955 (2005). DOI 10.1007/s00371-005-0308-0
9. Duffy, B., Thiyagalingam, J., Walton, S., Smith, D.J., Trefethen, A., Kirkman-Brown, J.C.,Gaffney, E.A., Chen, M.: Glyph-based video visualization for semen analysis. IEEETransactions on Visualization and Computer Graphics 21(8), 980–993 (2015). DOI10.1109/TVCG.2013.265
10. Frege, G.: Der Gedanke [The thought]. Beitrage zur Philosophie des deutschen Idealismus1(2), 58–77 (1918). URL https://www.jstor.org/stable/2251513. Englishtranslation in Mind: A quarterly Review of Psychology and Philosophy 65(259): 289–311,July 1956
11. Isenberg, T.: Capturing the essence of shape of polygonal meshes. Ph.D. thesis, Otto-von-Guericke University of Magdeburg, Germany (2004). DOI 10.25673/5454
12. Leppanen, M.: Towards an abstraction ontology. In: M. Duzı, H. Jaakkola, Y. Kiyoki, H. Kan-gassalo (eds.) Information Modelling and Knowledge Bases XVIII, Frontiers in Artificial In-telligence and Applications, vol. 154, pp. 166–185. IOS Press, Amsterdam (2007). URLhttp://ebooks.iospress.nl/volumearticle/3413
13. Lewis, D.K.: On the Plurality of Worlds. Blackwell, Oxford (1986)

23
14. Miao, H., De Llano, E., Isenberg, T., Groller, M.E., Barisic, I., Viola, I.: DimSUM: Dimensionand scale unifying maps for visual abstraction of DNA origami structures. Computer GraphicsForum 37(3), 403–413 (2018). DOI 10.1111/cgf.13429
15. Miao, H., De Llano, E., Sorger, J., Ahmadi, Y., Kekic, T., Isenberg, T., Groller, M.E., Barisic,I., Viola, I.: Multiscale visualization and scale-adaptive modification of DNA nanostructures.IEEE Transactions on Visualization and Computer Graphics 24(1), 1014–1024 (2018). DOI10.1109/TVCG.2017.2743981
16. Mohammed, H., Al-Awami, A.K., Beyer, J., Cali, C., Magistretti, P., Pfister, H., Had-wiger, M.: Abstractocyte: A visual tool for exploring nanoscale astroglial cells. IEEETransactions on Visualization and Computer Graphics 24(1), 853–861 (2018). DOI10.1109/TVCG.2017.2744278
17. Mosby: Mosby’s Medical Dictionary, 9th edn. Elsevier (2012)18. Munzner, T.: Visualization Analysis and Design. A K Peters Visualization Series. CRC Press,
Boca Raton, FL, USA (2014). DOI 10.1201/b1751119. Ogden, C.K., Richards, I.A.: The Meaning of Meaning: A Study of the Influence of Language
upon Thought and of the Science of Symbolism. Kegan Paul, London (1923)20. Oster, T., Rossl, C., Theisel, H.: Core lines in 3D second-order tensor fields. Computer Graph-
ics Forum 37(3), 327–337 (2018). DOI 10.1111/cgf.1342321. Stanford encyclopedia of philosophy. Web site. URL https://plato.stanford.edu/
contents.html22. Thompson, P.: Margaret Thatcher: A new illusion. Perception 9(4), 483–484 (1980). DOI
10.1068/p09048323. Transport for London: Tube map (2018). URL https://tfl.gov.uk/maps/track/
tube24. Viola, I., Isenberg, T.: Pondering the concept of abstraction in (illustrative) visualization.
IEEE Transactions on Visualization and Computer Graphics 24(9), 2573–2588 (2018). DOI10.1109/TVCG.2017.2747545
25. Wang, Y., H. Haleem, C.S., Wu, T., Zhao, X., Fu, S., Qu, H.: Towards easy comparison oflocal businesses using online reviews. Computer Graphics Forum 37(3), 63–74 (2018). DOI10.1111/cgf.13401
26. Zhai, X., Hou, F., Qin, H., Hao, A.: Inverse modelling of incompressible gas flow in subspace.Computer Graphics Forum 36(6), 100–111 (2017). DOI 10.1111/cgf.12861
27. van der Zwan, M., Lueks, W., Bekker, H., Isenberg, T.: Illustrative molecular visualizationwith continuous abstraction. Computer Graphics Forum 30(3), 683–690 (2011). DOI10.1111/j.1467-8659.2011.01917.x