automated electrodes detection during ... - hal-inria
TRANSCRIPT
HAL Id: hal-01939735https://hal.inria.fr/hal-01939735
Submitted on 14 Dec 2018
HAL is a multi-disciplinary open accessarchive for the deposit and dissemination of sci-entific research documents, whether they are pub-lished or not. The documents may come fromteaching and research institutions in France orabroad, or from public or private research centers.
L’archive ouverte pluridisciplinaire HAL, estdestinée au dépôt et à la diffusion de documentsscientifiques de niveau recherche, publiés ou non,émanant des établissements d’enseignement et derecherche français ou étrangers, des laboratoirespublics ou privés.
Automated Electrodes Detection during simultaneousEEG/fMRI
Mathis Fleury, Christian Barillot, Elise Bannier, Marsel Mano, Pierre Maurel
To cite this version:Mathis Fleury, Christian Barillot, Elise Bannier, Marsel Mano, Pierre Maurel. Automated ElectrodesDetection during simultaneous EEG/fMRI. Frontiers in information and communication technologies,Frontiers Media S.A., In press, pp.1-15. 10.1101/395806. hal-01939735

Automated Electrodes Detection during simultaneous EEG/fMRI
Mathis Fleury∗, Christian Barillot ∗, Marsel Mano ∗, Elise Bannier †,Pierre Maurel ∗
2018March
∗Univ Rennes, Inria, CNRS, Inserm, IRISA UMR 6074, VISAGES ERL U-1228, F-35000, Rennes†Univ Rennes, Inria, CNRS, Inserm, IRISA UMR 6074, VISAGES ERL U-1228, F-35000, Rennes, University Hospital
of Rennnes Department Radiology, Rennes, France
1

1. ABSTRACT
1 Abstract
The coupling of Electroencephalography (EEG) and functional magnetic resonance imaging (fMRI)enables the measure of brain activity at high spatial and temporal resolution. The localisation of EEGsources depends on several parameters including the knowledge of the position of the electrodes on thescalp. An accurate knowledge about this information is important for source reconstruction. Currently,when acquiring EEG and fMRI together, the position of the electrodes is generally estimated accord-ing to fiducial points by using a template. In the context of simultaneous EEG/fMRI acquisition, anatural idea is to use magnetic resonance (MR) images to localise EEG electrodes. However, most MRcompatible electrodes are built to be almost invisible on MR Images. Taking advantage of a recentlyproposed Ultra short Echo Time (UTE) sequence, we introduce a fully automatic method to detect andlabel those electrodes in MR images. Our method was tested on 8 subjects wearing a 64-channel EEGcap. This automated method showed an average detection accuracy of 94% and the average positionerror was 3.1 mm. These results suggest that the proposed method has potential for determining theposition of the electrodes during simultaneous EEG/fMRI acquisition with a very light cost procedure.
2 Introduction
Electroencephalography (EEG) measures the electrical potential generated by the neuronal activityover the scalp with electrodes placed on the surface of the scalp (Buzsáki et al. [2012], Murakami andOkada [2006], Petsche et al. [1984]). Usually electrodes are placed thanks to a flexible cap and posi-tioned according to anatomical points enabling optimal covering of brain regions regardless of the sizeand shape of the subject’s head. Currently, when acquiring EEG and functional magnetic resonanceimaging (fMRI) simultaneously, the position of the electrodes is calculated according to fiducial points(anatomical points of the skull) such as inion, nasion and vertex (Strobel et al. [2008]). The localisationof EEG sources in the brain depends on several parameters including the position of the electrodeson the scalp. A precise knowledge of these positions is important because inaccurate information onEEG electrodes coordinates may affect EEG inverse solution (Khosla et al. [1999]). This knowledge iseven more crucial in the case of simultaneous EEG and fMRI study, when the sessions are conductedrepeatedly over a long period of time. Approximations in the positioning of the electrodes are thenmade in each session and will give rise to important inaccuracies in the measured evoked potential(Wood and Allison [1981]). As a matter of fact, magnetic resonance (MR) images and EEG need to beregistered to be able to compare activations given by fMRI and by EEG. This simultaneous acquisitionallows the concordance of two different kind of information, a high temporal resolution in the order ofa millisecond with EEG, and a high spatial resolution in the order of millimetre with MRI.
In this article an automated and efficient method to determine EEG electrodes positions basedon a specific MR sequence is presented and evaluated. Compared to other existing approaches, theproposed method does not need additional hardware (like 3D electromagnetic digitizer devices (Ad-jamian et al. [2004];Whalen et al. [2008]), artificial electrode markers (Sijbers et al. [2000]) or laserscanner(Koessler et al. [2011]; Bardouille et al. [2012])), which might be uncomfortable for the subjectif he must stay still during acquisition (Le et al. [1998]) and add time to the preparation of the patient.Semi-automated electrodes localisation methods exist (de Munck et al. [2012]; Butler et al. [2017]),which require a manual fiducial landmark identification to guide co-registration without any markers
2 2

3. METHODS
but these approach relies on the efficiency of the accuracy of the operator. Another automated methodwas recently developed and shown great results with an anatomical MR image (Marino et al. [2016]),however, this method is only working with a high density cap also compatible with MRI: the GES 300from Geodesic EEG Systems. Since this kind of cap includes plastic around electrodes and containhydrogen protons, it can be visible on T1-w image. For seek of genericity (i.e. able to operate onall types of caps when artefacts do not appear on T1-w images), we propose to make use of a MRIsequence with radial k-space sampling named UTE for Ultra-short Echo-Time. It allows to visualisethe tissues with a very short T2 and T2∗, such as cortical bone, tendons and ligaments (Holmes andBydder [2005], Keereman et al. [2010]). This sequence is all the more interesting in our context becauseit enables the visualisation of the MR compatible electrodes (Butler et al. [2017], Springer et al. [2008])on the scalp with a capability to be performed rapidly enough to not overwhelm the whole MRI protocol.
We propose a fully automated method, which provides reliable and reproducible results for thedetection and labelling of a MR compatible EEG cap into the MR space.
3 Methods
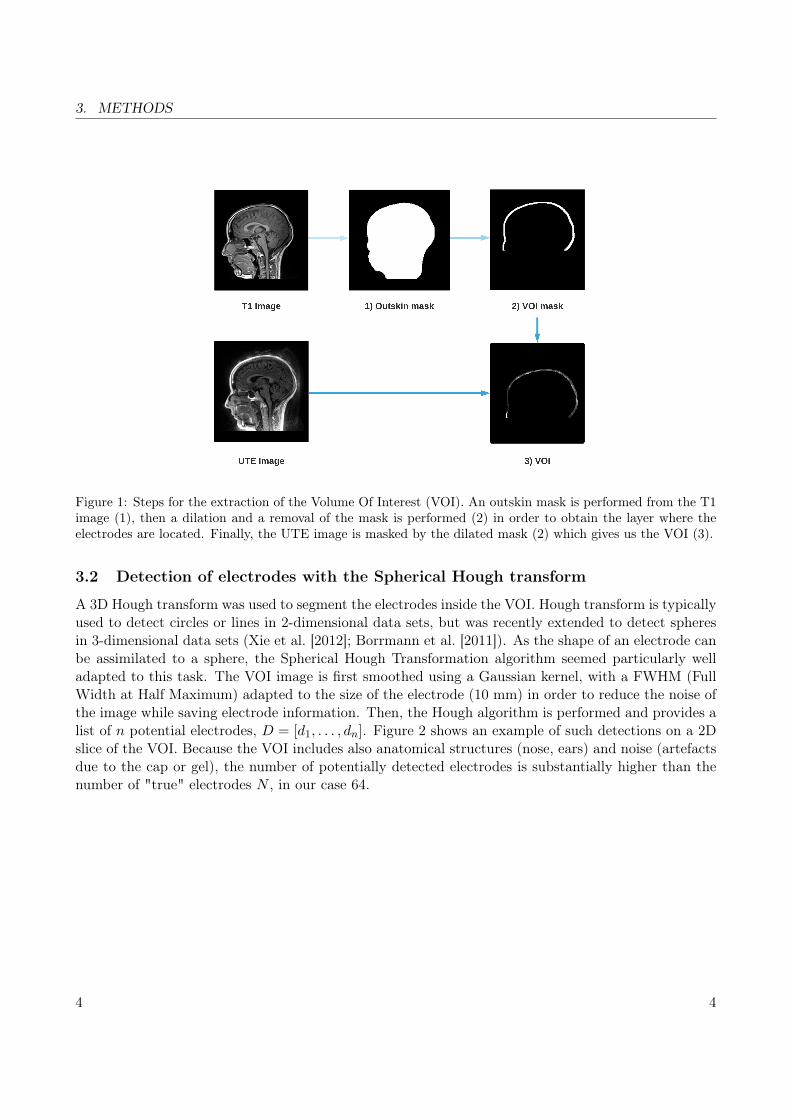
The retrieval of the electrodes consisted in two parts; firstly, we provided a mask that includes thevolume where the electrodes are located; secondly, we performed the electrode detection inside thisvolume of interest (VOI). Figure 1 presents a flowchart of the method’s main steps. We hypothesisedthat electrodes would appear as spheres inside the UTE volume and it allows us to perform a Houghtransform in a consistent manner across subjects.
3.1 Scalp segmentation
Several reliable scalp segmentation methods exist for T1-w imaging. Because UTE images are noisier,we performed the scalp segmentation on the T1-w images and co-registered the UTE images with theT1-w images to apply the mask. The T1-w is first registered on the UTE and the anatomical T1 imageis then segmented using FSL, an open-library of analysis tools for MRI and its function BET (BrainExtraction Tool) (Smith [2002]; Popescu et al. [2012]). A mask of the scalp is computed from thesegmentation. Since electrodes are located around the head of the subject, the scalp mask is dilatedtoward the periphery in order to isolate this layer. What is outside the dilated mask is subtracted inorder to isolate only the layer where the electrodes are located.
3 3
3. METHODS
Figure 1: Steps for the extraction of the Volume Of Interest (VOI). An outskin mask is performed from the T1image (1), then a dilation and a removal of the mask is performed (2) in order to obtain the layer where theelectrodes are located. Finally, the UTE image is masked by the dilated mask (2) which gives us the VOI (3).
3.2 Detection of electrodes with the Spherical Hough transform
A 3D Hough transform was used to segment the electrodes inside the VOI. Hough transform is typicallyused to detect circles or lines in 2-dimensional data sets, but was recently extended to detect spheresin 3-dimensional data sets (Xie et al. [2012]; Borrmann et al. [2011]). As the shape of an electrode canbe assimilated to a sphere, the Spherical Hough Transformation algorithm seemed particularly welladapted to this task. The VOI image is first smoothed using a Gaussian kernel, with a FWHM (FullWidth at Half Maximum) adapted to the size of the electrode (10 mm) in order to reduce the noise ofthe image while saving electrode information. Then, the Hough algorithm is performed and provides alist of n potential electrodes, D = [d1, . . . , dn]. Figure 2 shows an example of such detections on a 2Dslice of the VOI. Because the VOI includes also anatomical structures (nose, ears) and noise (artefactsdue to the cap or gel), the number of potentially detected electrodes is substantially higher than thenumber of "true" electrodes N , in our case 64.
4 4

3. METHODS
Figure 2: Example of Hough transform detection (red dots) on the VOI smoothed image. Hough transformdetects also anatomical parts (arrow), which will be excluded in the filtering steps (cf. section 3.3).
3.3 Selection of detected electrodes
The detected electrodes are then filtered to get rid of the potential false detections given by the Houghtransform. A 64 electrodes spherical EEG template pj (1 ≤ j ≤ 64) ∈ P was given by the capmanufacturer, indicating theoretical positions of every electrodes relatively to each other. Due to thenon-sphericity of the head and the elastic deformations of the cap, these positions are not sufficientenough to give a reliable detection by itself. However, this template will be used to identify outliersin our detections. This spherical template is registered onto the detected electrodes from previoussection, through the Iterative Closest Point (ICP) algorithm, a well-known algorithm for registeringtwo-cloud of points (Besl et al. [1992]; Chen and Medioni [1992]). The algorithm takes a first pointcloud which will be kept fixed, while the other one will be spatially transformed in order to best alignthe reference. The goal is to iteratively minimise a metric error, usually the distance between the twosets of points, by modifying the transformation applied to the source.
In our case, the ICP will find the optimal rotation, translation and scale to fit the data point setD obtained with the Hough transform and the model point P . The algorithm is divided into 2 steps.The first step consists in estimating correspondences between the two set of points. During this step,for each point pj , in the reference set P , the closest point di of the detected points set D is computed.This point will be noted cj and therefore defined as follows:
cj = argmind1,...,dn
dist(di, pj), ∀j ∈ [1, . . . , N ]. (1)
The second step consists in computing the similarity transform that best aligns every cj to thecorresponding pj . The minimisation is expressed by:
(R∗, S∗, t∗) = argminR,S,t
∑j∈[1,...,N ]
‖cj − SRpj − t‖2, (2)
where R is a rotation matrix (3 × 3), t is a translation vector (3 × 1) and S is a scale matrix(S = s ∗ Id, 3× 3). The ICP runs until convergence. The registered template P ′ can then be written
5 5

3. METHODS
as:
p′j = SRpj + t. (3)
Once the ICP is completed, a two-part filtering phase is implemented. The first one consists intaking the closest point of the Hough transform data set; for each of the N electrodes of the registeredmodel P ′, the closest detected point cj is selected. Unselected points are discarded and, after this firstfiltering step, the number of electrodes is therefore equal to N , the total number of electrodes desired(64 in our case). Figure 3 illustrates the impact of this step.
Figure 3: Example of outliers removal in potential electrodes data set D with the ICP algorithm. The datasetD is represented in red on the left along with the registered template P ′ in purple. The data set obtained afterthe first filtering step is in red on the right. Outliers are mostly due to external anatomical parts or noise nottaken in account during the segmentation. These outliers are discarded by the filtering step because they aretoo far from P ′.
For the second and final step, all points cj , which are too far from the closest point of the templateP′ , are removed. A threshold equals to four times the Median Absolute Deviation (MAD) of all dis-
tances is applied. For each removed point, a replacement is determined by a new detection from thelocal maxima on the VOI image around the theoretical position given by the registered template (cf.Figure 4). The new data set D′ is obtained and the N electrodes are then labeled using the template.
6 6

3. METHODS
Figure 4: Cross section of the VOI image. Green points are corresponding to the template data set P ′, bluepoints to the maximum local detection and the red one are the outliers from D. The second and final filteringstep consists in replacing any point from the Hough data set too far from the registered template P ′. Thesubstituted point comes from a detection by local maxima, closest to the template P ′.
3.4 Validation of the method
A manual selection of the electrodes positions was done on the UTE sequence and the quality of ourdetection was assessed using this manual selection as a ground truth. Instead of selecting the center ofeach electrode in a 3D image, we choose to use a more convenient procedure for the manual detection.Following Butler et al. [2017], the manual detection was performed by picking up the Cartesian position(xi, yi, zi) of each 64 electrodes for each subject on a pancake view, which is roughly a 2D projectionof the scalp (de Munck et al. [2012]).
The performance indicators of our automated detection will be the position error (PE) and thepositive predictive value (PPV). The position error is the average Euclidean distance between eachpair of electrodes (the manually selected one, considered as the ground truth, and the detected one)and the PPV is the percentage of electrodes that have been well detected. We considered that a de-tected electrodes is well localised when the PE is below 10mm, which corresponds to the diameter ofthe electrode (Kavanagk et al. [1978]).
We also compared the performance of our method against a more traditional semi-automatic one:five fiducial points were selected manually and the spherical template was adjusted to these points(Towle et al. [1993]). This method, although not recent, is still used by many studies (e.g. Thorntonet al. [2017], Jenson et al. [2018], Ge et al. [2017]).
7 7

4. MATERIALS
4 Materials
4.1 Subjects and EEG equipment
After IRB approval, eight healthy volunteers provided written informed consent to take part in thestudy. They all underwent a simultaneous EEG/fMRI examination (fully described in Mano et al.[2017]). EEG was acquired using two 32-channel MR compatible amplifiers (actiCHamp, Brainproduct,Gilching, Germany) and a cap providing 64 Ag/AgCl electrodes positioned according to the extended10-20 system and one additional ground electrode. Electrodes are attached to small cups with innerdiameter of 10 mm and 4 mm height, inserted in the cap and filled with gel to minimise the contactimpedance. All subject wore a large (circumference between 56-58 cm) MR compatible cap fromBrainproduct (Gilching, Germany) and a particular attention was given to its positioning accordingto standard fiducial points.
4.2 UTE sequences parameters
All MR data were collected on a 3T Siemens Verio MR scanner (VB17, Siemens Healthineers, Erlangen,Germany). Specifically, the UTE sequence using 3D radial k-space sampling was performed with thefollowing parameters: repetition time (TR) = 3.45 ms, echo time (TE) = 0.07 ms, flip angle (FA) =14 and voxel size 1.33×1.33×1.33mm3. A 3D T1 MPRAGE was also performed: TR = 1900 ms, TI= 900 ms, TE = 2.26 ms, FA = 9 and voxel size 1× 1× 1mm3 . Two additional UTE sequences withlower sampling resolution were acquired in order to decrease the acquisition time and to investigate theimpact on electrodes detection. To reduce the acquisition time, the number of spokes has to decrease;from 60000 spokes (60K) for the original, to 30000 (30K) and 15000 (15K) spokes for the additionalones. The UTE acquisition time goes down from 5min 35 s to 2min 47 s and 1min 23 s. A comparisonbetween these acquisitions is shown in Figure 5.
Figure 5: Example of UTE images with different sampling. The image quality as well as the acquisition timedecrease linearly according to the sampling. Acquisition time for 1) 5min 35 s, 2) 2min 47 s, 3) 1min 23 s.
8 8

5. RESULTS
5 Results
The creation of an image (VOI) containing only the information related to the electrode allows toremove external noise while protecting the information related to the electrode. This image enablesrobust detection of the position of the electrodes for all subjects. Furthermore, since our method al-ways detects exactly N (64 in our case) electrodes, the number of false negatives (missed electrodes)will automatically be equal to the number of false positives (wrongly detected electrodes). Table 1presents the mean position error (PE), the standard deviation of the PE and the maximum PE of ourdetections for each of the eight subjects. The max PE reflected a high difficulty to detect the electrodesnear anatomical parts or in posterior regions where the head apply a pressure on the EEG cap insidethe MRI. Our UTE-based electrode detection showed an average PE of 3.1mm for all subjects. Thedetection accuracy, represented by the positive predictive value (PPV), is also shown and correspondsto the percentage of electrodes correctly found. The average PPV for all subjects was 94.22%.
Subjects Mean PE (mm) Std PE (mm) Max PE (mm) PPV (%)UTE S1 2.73 2.83 17.32 95.38
S2 2.41 2.38 12.43 96.92S3 2.66 2.43 13.62 95.38S4 4.10 3.97 21.3 89.23S5 3.32 3.38 14.45 90.7S6 2.85 3.24 17.57 95.38S7 2.76 2.51 15.90 96.92S8 3.69 5.13 26.24 93.84
Table 1: Position error (PE) and positive predictive value (PPV) for each subject (S1-S8) for UTE-MR electrodesdetection. The PPV is the percentage of electrodes that have been detected. We consider that an electrode iswell localised when the PE is below 10mm, which represents the diameter of an electrode. The mean PE on allsubject is equal to 3.1mm and the mean PPV to 94.22%.
We then compared the performance of our method with the semi-automatic one presented in sec-tion 3.4 (FID). The PE and PPV were calculated in the same way. The results are shown in Table 2and Figure 6 shows, for each subject, a comparison of the PEs obtained by the two methods. Themean PE on all subject is equal to 7.7mm and the mean PPV to 79.41%. Moreover, for every subjects,our method produced smaller PE and better PPV. A paired t-test was computed between the two PEssets and a significant difference was obtained (p<0.0001).
9 9
5. RESULTS
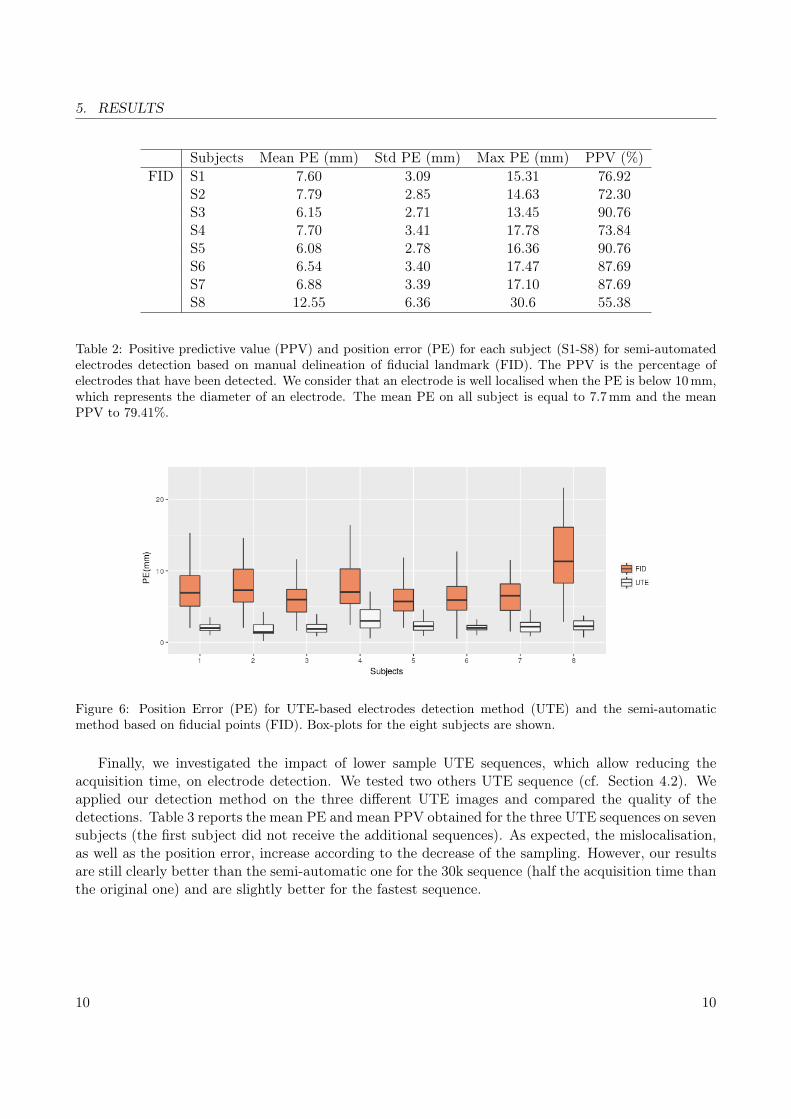
Subjects Mean PE (mm) Std PE (mm) Max PE (mm) PPV (%)FID S1 7.60 3.09 15.31 76.92
S2 7.79 2.85 14.63 72.30S3 6.15 2.71 13.45 90.76S4 7.70 3.41 17.78 73.84S5 6.08 2.78 16.36 90.76S6 6.54 3.40 17.47 87.69S7 6.88 3.39 17.10 87.69S8 12.55 6.36 30.6 55.38
Table 2: Positive predictive value (PPV) and position error (PE) for each subject (S1-S8) for semi-automatedelectrodes detection based on manual delineation of fiducial landmark (FID). The PPV is the percentage ofelectrodes that have been detected. We consider that an electrode is well localised when the PE is below 10mm,which represents the diameter of an electrode. The mean PE on all subject is equal to 7.7mm and the meanPPV to 79.41%.
Figure 6: Position Error (PE) for UTE-based electrodes detection method (UTE) and the semi-automaticmethod based on fiducial points (FID). Box-plots for the eight subjects are shown.
Finally, we investigated the impact of lower sample UTE sequences, which allow reducing theacquisition time, on electrode detection. We tested two others UTE sequence (cf. Section 4.2). Weapplied our detection method on the three different UTE images and compared the quality of thedetections. Table 3 reports the mean PE and mean PPV obtained for the three UTE sequences on sevensubjects (the first subject did not receive the additional sequences). As expected, the mislocalisation,as well as the position error, increase according to the decrease of the sampling. However, our resultsare still clearly better than the semi-automatic one for the 30k sequence (half the acquisition time thanthe original one) and are slightly better for the fastest sequence.
10 10

6. DISCUSSION
UTE 60K UTE 30K UTE 15KAcquisition time 5min 35 s 2min 47 s 1min 23 sPE (mm) 3.12 4.02 6.56PPV (%) 94.22 88.13 80.43
Table 3: Mean of position error (PE) and mean positive predictive value (PPV) for three different samplingresolutions of the UTE sequence. Shorter acquisition time implied lower SNR and lower detection accuracy.Results are still better than the semi-automatic method.
6 Discussion
We have proposed an automated method for detecting and labelling EEG electrodes based on UTE MRimages without using any external sensors. Previous results indicate that a localisation technique usingelectromagnetic digitisation technology is time-consuming (Dalal et al. [2014]) and others techniquessuch as 3D digitisation can be affected by errors of registration and projection of EEG electrodes onthe head model. We have shown that our method offers constant and precise results. Moreover, theproposed method provides the position of the electrodes directly into the MR-space, which is crucialin case of simultaneous EEG/fMRI acquisitions.
Furthermore, for seek of genericity, the proposed method is able to operate on all types of capsand does not need specific electrodes, unlike a recent work from Marino et al. [2016] for example. Tothe best of our knowledge, this is first automated electrodes detection method implying non-visibleelectrodes on anatomical MR sequence.
The method presented here requires only an additional sequence (the UTE acquisition sequence) inthe experimental protocol. This acquisition takes from 1 to 5 min. From our experiments, a good com-promise between acquisition time and detection quality can be achieved with a 2 or 3 min sequences.Further optimisation of the sequence parameters could enable an improvement of the images withoutincreasing the acquisition time.
7 Conclusion
We presented a method to automatically detect and label EEG electrodes during an EEG/fMRI ac-quisition. We used a UTE MR sequence to obtain electrodes positions on a MR-volume. This methodonly has for additional cost the acquisition time of the UTE sequence in the MR protocol. We havedemonstrated that our method achieves a significantly more accurate electrode detection compared toa semi-automatic detection one that is more commonly used during EEG/fMRI protocols. For futureresearch, since the proposed method can be totally automated and does not require complex process-ing, this technique may be used to extract the position and the label of the electrodes in real time.Indeed, this technique is interesting for applications requiring immediate knowledge of the position ofthe electrodes. We believe this method will be useful to improve the fusion of EEG and fMRI signals.
11 11

8. ACKNOWLEDGEMENT
8 Acknowledgement
MRI data acquisition was partly supported by the Neurinfo MRI research facility from the Universityof Rennes I. Neurinfo is granted by the the European Union (FEDER), the French State, the BrittanyCouncil, Rennes Metropole, Inria, Inserm and the University Hospital of Rennes. The authors wouldlike to thank their collaborators at Siemens Healthineers, in particular Vladimir Jellus and P. Speierfor their valuable contributions to the development and testing of the prototype Ultra Short TE forthis project.
12 12

REFERENCES REFERENCES
References
P. Adjamian, G. Barnes, A. Hillebrand, I. Holliday, K. Singh, P. Furlong, E. Harrington, C. Bar-clay, and P. Route. Co-registration of magnetoencephalography with magnetic resonance imagingusing bite-bar-based fiducials and surface-matching. Clinical Neurophysiology, 115(3):691–698, mar2004. ISSN 1388-2457. doi: 10.1016/J.CLINPH.2003.10.023. URL https://www-sciencedirect-com.
passerelle.univ-rennes1.fr/science/article/pii/S1388245703003791.
T. Bardouille, S. V. Krishnamurthy, S. G. Hajra, and R. C. D’Arcy. Improved localization accuracy inmagnetic source imaging using a 3-d laser scanner. IEEE Transactions on Biomedical Engineering,59(12):3491–3497, 2012.
P. J. Besl, N. D. McKay, et al. A method for registration of 3-d shapes. IEEE Transactions on patternanalysis and machine intelligence, 14(2):239–256, 1992.
D. Borrmann, J. Elseberg, K. Lingemann, and A. Nüchter. The 3d hough transform for plane detectionin point clouds: A review and a new accumulator design. 3D Research, 2(2):3, 2011.
R. Butler, G. Gilbert, M. Descoteaux, P.-M. Bernier, and K. Whittingstall. Application of polymersensitive MRI sequence to localization of EEG electrodes. Journal of Neuroscience Methods, 278:36 – 45, 2017. ISSN 0165-0270. doi: https://doi.org/10.1016/j.jneumeth.2016.12.013. URL http:
//www.sciencedirect.com/science/article/pii/S0165027016302953.
G. Buzsáki, C. A. Anastassiou, and C. Koch. The origin of extracellular fields and currents — EEG,ECoG, LFP and spikes. Nature Reviews Neuroscience, 13(6):407–420, jun 2012. ISSN 1471-003X.doi: 10.1038/nrn3241. URL http://www.nature.com/articles/nrn3241.
Y. Chen and G. Medioni. Object modelling by registration of multiple range images. Image and visioncomputing, 10(3):145–155, 1992.
S. S. Dalal, S. Rampp, F. Willomitzer, and S. Ettl. Consequences of EEG electrode position error onultimate beamformer source reconstruction performance. Frontiers in Neuroscience, 8:42, mar 2014.ISSN 1662-453X. doi: 10.3389/fnins.2014.00042. URL http://journal.frontiersin.org/article/
10.3389/fnins.2014.00042/abstract.
J. C. de Munck, P. J. van Houdt, R. M. Verdaasdonk, and P. P. Ossenblok. A semi-automatic methodto determine electrode positions and labels from gel artifacts in EEG/fMRI-studies. NeuroImage, 59(1):399–403, jan 2012. ISSN 1053-8119. doi: 10.1016/J.NEUROIMAGE.2011.07.021. URL https:
//www-sciencedirect-com.passerelle.univ-rennes1.fr/science/article/pii/S1053811911007828.
S. Ge, M.-Y. Ding, Z. Zhang, P. Lin, J.-F. Gao, R.-M. Wang, G.-P. Sun, K. Iramina, H.-H. Deng, Y.-K.Yang, and Y. Leng. Temporal-Spatial Features of Intention Understanding Based on EEG-fNIRSBimodal Measurement. IEEE Access, 5:14245–14258, 2017. ISSN 2169-3536. doi: 10.1109/ACCESS.2017.2723428. URL http://ieeexplore.ieee.org/document/7968269/.
J. E. Holmes and G. M. Bydder. MR imaging with ultrashort TE (UTE) pulse sequences: Basicprinciples. Radiography, 11(3):163–174, aug 2005. ISSN 1078-8174. doi: 10.1016/J.RADI.2004.07.007. URL https://www.sciencedirect.com/science/article/pii/S1078817404001257.
13 13
REFERENCES REFERENCES
D. Jenson, K. J. Reilly, A. W. Harkrider, D. Thornton, and T. Saltuklaroglu. Trait related sensorimotordeficits in people who stutter: An EEG investigation of µ rhythm dynamics during spontaneousfluency. NeuroImage: Clinical, 19:690–702, jan 2018. ISSN 2213-1582. doi: 10.1016/J.NICL.2018.05.026. URL https://www-sciencedirect-com.passerelle.univ-rennes1.fr/science/article/pii/
S2213158218301724.
R. N. Kavanagk, T. M. Darcey, D. Lehmann, and D. H. Fender. Evaluation of methods for three-dimensional localization of electrical sources in the human brain. IEEE Transactions on BiomedicalEngineering, (5):421–429, 1978.
V. Keereman, Y. Fierens, T. Broux, Y. De Deene, M. Lonneux, and S. Vandenberghe. MRI-based atten-uation correction for PET/MRI using ultrashort echo time sequences. Journal of nuclear medicine,51(5):812–818, 2010.
D. Khosla, M. Don, and B. Kwong. Spatial mislocalization of EEG electrodes–effects on accuracy ofdipole estimation. Clinical neurophysiology, 110(2):261–271, 1999.
L. Koessler, T. Cecchin, O. Caspary, A. Benhadid, H. Vespignani, and L. Maillard. EEG–MRI Co-registration and Sensor Labeling Using a 3D Laser Scanner. Annals of Biomedical Engineering,39(3):983–995, mar 2011. ISSN 0090-6964. doi: 10.1007/s10439-010-0230-0. URL http://link.
springer.com/10.1007/s10439-010-0230-0.
J. Le, M. Lu, E. Pellouchoud, and A. Gevins. A rapid method for determining standard 10/10 electrodepositions for high resolution EEG studies. Electroencephalography and clinical neurophysiology, 106(6):554–558, 1998.
M. Mano, A. Lécuyer, E. Bannier, L. Perronnet, S. Noorzadeh, and C. Barillot. How to build a hybridneurofeedback platform combining EEG and fMRI. Frontiers in neuroscience, 11:140, 2017.
M. Marino, Q. Liu, S. Brem, N. Wenderoth, and D. Mantini. Automated detection and labelingof high-density EEG electrodes from structural MR images. Journal of neural engineering, 13(5):056003, 2016.
S. Murakami and Y. Okada. Contributions of principal neocortical neurons to magnetoencephalographyand electroencephalography signals. The Journal of physiology, 575(3):925–936, 2006.
H. Petsche, H. Pockberger, and P. Rappelsberger. On the search for the sources of the electroen-cephalogram. Neuroscience, 11(1):1–27, jan 1984. ISSN 0306-4522. doi: 10.1016/0306-4522(84)90212-4. URL https://www-sciencedirect-com.passerelle.univ-rennes1.fr/science/article/
pii/0306452284902124.
V. Popescu, M. Battaglini, W. Hoogstrate, S. Verfaillie, I. Sluimer, R. van Schijndel, B. van Dijk,K. Cover, D. Knol, M. Jenkinson, F. Barkhof, N. de Stefano, and H. Vrenken. Optimizing parameterchoice for FSL-Brain Extraction Tool (BET) on 3D T1 images in multiple sclerosis. NeuroImage,61(4):1484–1494, jul 2012. ISSN 10538119. doi: 10.1016/j.neuroimage.2012.03.074. URL http:
//linkinghub.elsevier.com/retrieve/pii/S1053811912003552.
J. Sijbers, B. Vanrumste, G. Van Hoey, P. Boon, M. Verhoye, A. Van der Linden, and D. Van Dyck.Automatic localization of EEG electrode markers within 3D MR data. Magnetic resonance imaging,18(4):485–488, 2000.
14 14

REFERENCES REFERENCES
S. M. Smith. Fast robust automated brain extraction. Human Brain Mapping, 17(3):143–155, nov2002. ISSN 1065-9471. doi: 10.1002/hbm.10062. URL http://doi.wiley.com/10.1002/hbm.10062.
F. Springer, P. Martirosian, N. F. Schwenzer, M. Szimtenings, P. Kreisler, C. D. Claussen, andF. Schick. Three-dimensional ultrashort echo time imaging of solid polymers on a 3-tesla whole-body MRI scanner. Investigative radiology, 43(11):802–808, 2008.
A. Strobel, S. Debener, B. Sorger, J. C. Peters, C. Kranczioch, K. Hoechstetter, A. K. Engel, B. Brocke,and R. Goebel. Novelty and target processing during an auditory novelty oddball: A simultaneousevent-related potential and functional magnetic resonance imaging study. NeuroImage, 40(2):869–883, apr 2008. ISSN 1053-8119. doi: 10.1016/J.NEUROIMAGE.2007.10.065. URL https://www.
sciencedirect.com/science/article/pii/S1053811907011111#fig1.
D. Thornton, A. W. Harkrider, D. Jenson, and T. Saltuklaroglu. Sensorimotor activity measured viaoscillations of EEG mu rhythms in speech and non-speech discrimination tasks with and withoutsegmentation demands. Brain and Language, apr 2017. ISSN 0093-934X. doi: 10.1016/J.BANDL.2017.03.011. URL https://www-sciencedirect-com.passerelle.univ-rennes1.fr/science/article/
pii/S0093934X16301274.
V. L. Towle, J. Bolaños, D. Suarez, K. Tan, R. Grzeszczuk, D. N. Levin, R. Cakmur, S. A. Frank,and J.-P. Spire. The spatial location of EEG electrodes: locating the best-fitting sphere relative tocortical anatomy. Electroencephalography and Clinical Neurophysiology, 86(1):1–6, jan 1993. ISSN0013-4694. doi: 10.1016/0013-4694(93)90061-Y. URL https://www-sciencedirect-com.passerelle.
univ-rennes1.fr/science/article/pii/001346949390061Y.
C. Whalen, E. L. Maclin, M. Fabiani, and G. Gratton. Validation of a method for coregistering scalprecording locations with 3D structural MR images. Human Brain Mapping, 29(11):1288–1301, nov2008. ISSN 10659471. doi: 10.1002/hbm.20465. URL http://doi.wiley.com/10.1002/hbm.20465.
C. C. Wood and T. Allison. Interpretation of evoked potentials: A neurophysiological perspective.Canadian Journal of Psychology/Revue canadienne de psychologie, 35(2):113, 1981.
L. Xie, R. E. Cianciolo, B. Hulette, H. W. Lee, Y. Qi, G. Cofer, and G. A. Johnson. Magnetic resonancehistology of age-related nephropathy in the Sprague Dawley rat. Toxicologic pathology, 40(5):764–78,jul 2012. ISSN 1533-1601. doi: 10.1177/0192623312441408. URL http://www.ncbi.nlm.nih.gov/
pubmed/22504322http://www.pubmedcentral.nih.gov/articlerender.fcgi?artid=PMC3515870.
15 15