evaluation of the installed passenger capacity utilization
TRANSCRIPT
1
GSJ: Volume 9, Issue 8, August 2021, Online: ISSN 2320-9186
www.globalscientificjournal.com
Evaluation of the Installed Passenger Capacity Utilization Performance of the Nigerian Railway Services
**Eneonwo, Cosmas Ifedilichi Centre for Logistics & Transport Studies,
University of Port Harcourt, Rivers State, Nigeria. e-mail: [email protected]
Emenike, Gladys Chineze (Ph.D)
Department of Geography & Environmental Management, Faculty of Social Sciences, University of Port Harcourt.
ABSTRACT The annual volume of passengers carried by the Nigerian Railway Corporation (NRC) has been on progressive decline. This paper evaluates the performance of selected train stations in Nigeria in utilization of installed capacity for passenger carriage. The data for the study were sourced using structured questionnaires. Secondary data were obtained from online sources. Spearman’s Rank Order Correlation technique was used to establish the strength of the relationship between active Installed Passenger Capacity (IPC) and the Actual Capacity Utilization (ACU). The analysis revealed significant (P<0.05) relationship with correlation coefficient (rho) of 0.892. Simple regression analysis was used to develop model for the relationships. The R Square was 0.840. A deterministic model for the relationship was developed and the study concludes that high downtime regimes and infrastructural inadequacy impact capacity utilization negatively. The study recommended scheduled preventive maintenance of trains and rolling stock, linking of high economic activity centres. Keywords: Volume, Capacity Utilization, Traffic, Rolling-Stock, Downtime.
1. Introduction The Nigerian Railway Corporation (NRC) as it is known today, started as the Government Department of
Railways in 1898. It was created by an Act of the parliament of 1955 (amended in 1990) and renamed the
Nigerian Railway Corporation (NRC).
The rail transport system was quite useful in the past years, before and after the nation’s independence, so
much so that it enhanced the operations of the colonial government, by linking the rural areas and
hinterlands to the central seat of government. Then, it constituted approximately one-third of the national
freight traffic (Adesanya, 2002).
GSJ: Volume 9, Issue 8, August 2021 ISSN 2320-9186 1068
GSJ© 2021 www.globalscientificjournal.com
2
Dina and Raji (2016) observed that industrialized nations of the world such as the United States of
America, Japan, Australia, Britain, China, etc, have consistently developed their railways, improving
speed, managerial expertise and coverage. For example, Rodrigue and Slack (2009) noted that portions of
the French high speed rail system, can engage in a speed of up to 515km/hr. This also applies to the
Chinese railway system.
Today in Nigeria, studies have shown that the rail system can no longer sustain itself, as the service
operators are currently bedeviled with myriads of operational issues (Adesanya, 2010; Agunloye, 2008).
Researchers lament persistent rot in the railway transport sub-sector in Nigeria, resulting to the loss of
capacity to act as a vehicle for mass transit (Agunloye and Oduwaye, 2011; Odeleye, 2015; Ayoola, 2008;
Faajir and Zidan, 2016).
2. Literature Review
The Theory of Performance
The Theory of Performance (ToP) as propounded by Don Elger in 2007, gives a good theoretical
underpinning to this study as it identifies the components that holistically interact to establish levels of
performance in various organisations.
According to Elger (2007), performance is a concept that is defined by set results or goals. To perform
therefore, is to bring about prized results. McNamara (2005) observed that performance as a concept
supposes that being busy is not the same as being productive. Folan, Browne & Jagdev (2008) outlined
three priorities that govern performances in an organization:
a. RELEVANCE: Performance is construed with the mind of the supposed relevance of an entity to a
given situation. In this instance, an organization may be assessed in line with its impact in a given area.
b. VISION/OBJECTIVE: Performance in this case is construed with specific objectives in mind. In this
case, a company may be appraised in line with its vision as to what it wants to achieve in the future, not
based on the vision or objectives of extraneous forces.
GSJ: Volume 9, Issue 8, August 2021 ISSN 2320-9186 1069
GSJ© 2021 www.globalscientificjournal.com
3
c. RECOGNISABLE CHARACTERISTICS: Performance may be reduced to recognizable characteristics
that are of absolute relevance to the organization. One may assess an organization on the basis of such
parameters as timeliness, cost, quality of products/services, etc.
3. Materials and Methods
Research Design: The study is basically quantitative. Correlation Research design was used, as it
analyses the relationship between two or more variables.
The population for this study: All the active train stations as at the period of the study. Total of ten (10)
active stations out of 27 identified major stations/terminals across the study area.
Sampling Technique: Stratified sampling technique used to classify the two railway districts in
Nigeria (Eastern and Western rail lines) into various strata, based on the current level of functionality of
stations/terminals. Stations were selected in order of functionality.
Purposive sampling technique: The purposive or judgmental sampling technique was employed to
choose the functional stations/terminuses for data collection.
Sample size: Since the size is low, all 10 active stations formed the sample size for this study. 12
members of staff drawn from 7 designations on the basis of relevance of duties to the study were sampled.
That gave a sample size of 120 members of staff.
Nature of Data: Ordinal data as the options available were ordered or ranked (<5, 6-10, 11-15, 16-20,
>20). Where applicable, Likert scaling was introduced and scaled thus: Strongly agreed (1), Agreed (2),
Neutral (3), Strongly Disagreed (4), Disagree (5).
Sources of Data: Primary: Structured questionnaires. Secondary: NRC as annual reports, interviews,
journal articles, internet/online sources, releases from the National Bureau of Statistics; etc.
Method of Data Analysis: Spearman’s Rank Order Correlation technique was used to test the hypothesis
and establish the strength of the relationships. Furthermore, a simple regression analysis was used to
develop a model for the relationship.
GSJ: Volume 9, Issue 8, August 2021 ISSN 2320-9186 1070
GSJ© 2021 www.globalscientificjournal.com
4
4. Results and Discussion
Fleet Size
From the table above, it is observed that 13 respondents, representing 11.5% of total sample size observed
that the estimated number of trains were about 5 or less. Following this, 23 respondents, accounting for
20.4% of respondents sample observed between 6 to 10 trains in the fleet. 11 to 15 trains were observed
by 20 respondents who represented 17.7% of total sample size. 48 respondents, constituting 42.5% of
total sample size estimated between16 to 20 trains, while 9 respondents estimated above 20 trains in the
fleet. Overall, the study shows that the highest estimates points to the presence of 6 to 20 trains in the
fleet.
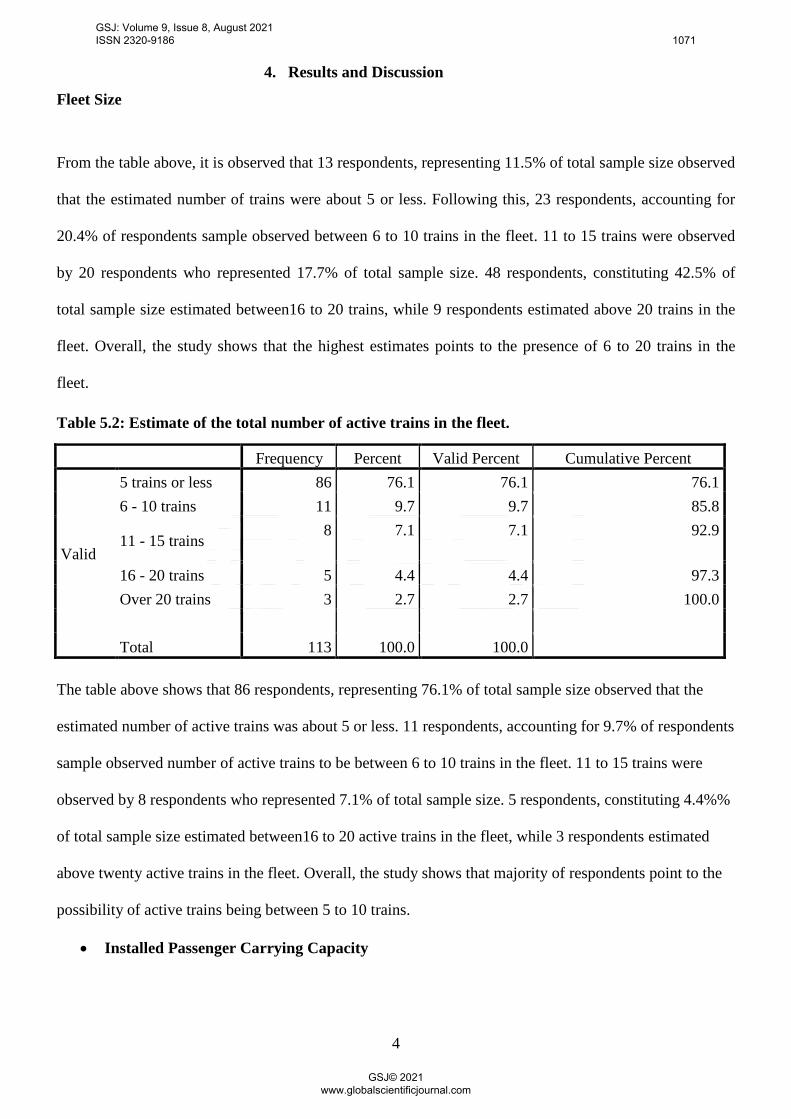
Table 5.2: Estimate of the total number of active trains in the fleet.
The table above shows that 86 respondents, representing 76.1% of total sample size observed that the
estimated number of active trains was about 5 or less. 11 respondents, accounting for 9.7% of respondents
sample observed number of active trains to be between 6 to 10 trains in the fleet. 11 to 15 trains were
observed by 8 respondents who represented 7.1% of total sample size. 5 respondents, constituting 4.4%%
of total sample size estimated between16 to 20 active trains in the fleet, while 3 respondents estimated
above twenty active trains in the fleet. Overall, the study shows that majority of respondents point to the
possibility of active trains being between 5 to 10 trains.
• Installed Passenger Carrying Capacity
Frequency Percent Valid Percent Cumulative Percent
Valid
5 trains or less 86 76.1 76.1 76.1 6 - 10 trains 11 9.7 9.7 85.8
11 - 15 trains 8 7.1 7.1 92.9
16 - 20 trains 5 4.4 4.4 97.3 Over 20 trains 3 2.7 2.7 100.0 Total 113 100.0 100.0
GSJ: Volume 9, Issue 8, August 2021 ISSN 2320-9186 1071
GSJ© 2021 www.globalscientificjournal.com
5
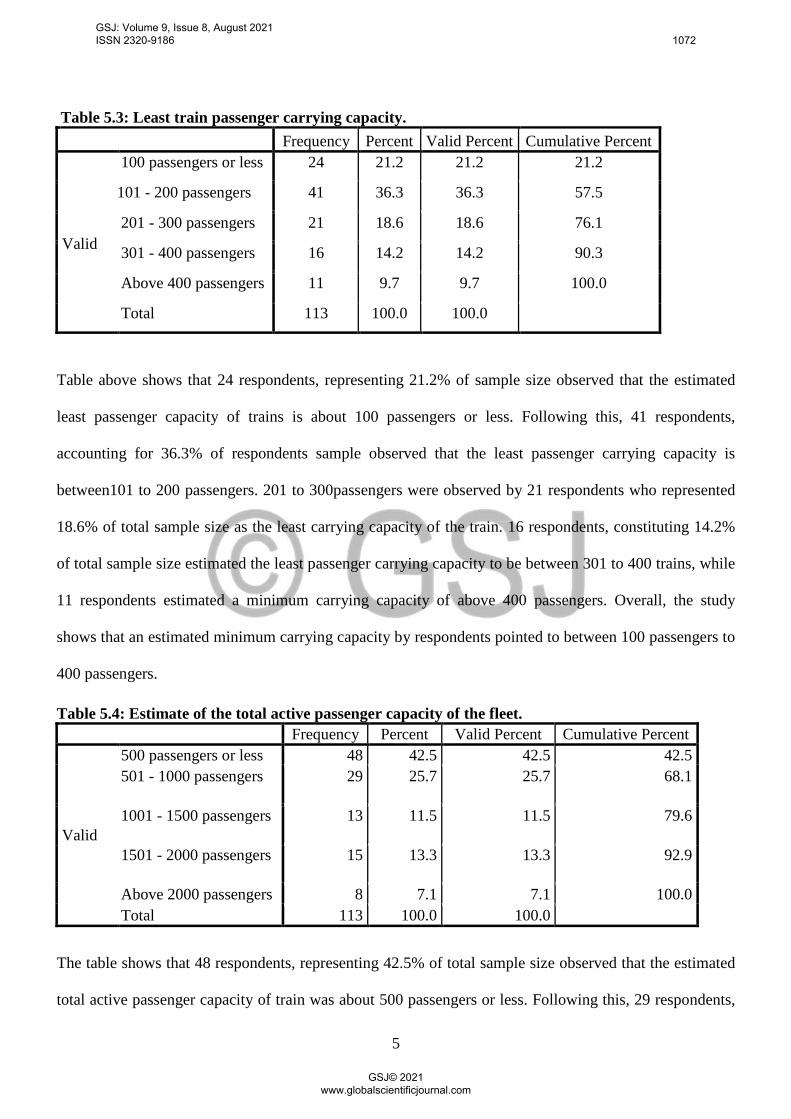
Table 5.3: Least train passenger carrying capacity. Frequency Percent Valid Percent Cumulative Percent
Valid
100 passengers or less 24 21.2 21.2 21.2
101 - 200 passengers 41 36.3 36.3 57.5
201 - 300 passengers 21 18.6 18.6 76.1
301 - 400 passengers 16 14.2 14.2 90.3
Above 400 passengers 11 9.7 9.7 100.0
Total 113 100.0 100.0
Table above shows that 24 respondents, representing 21.2% of sample size observed that the estimated
least passenger capacity of trains is about 100 passengers or less. Following this, 41 respondents,
accounting for 36.3% of respondents sample observed that the least passenger carrying capacity is
between101 to 200 passengers. 201 to 300passengers were observed by 21 respondents who represented
18.6% of total sample size as the least carrying capacity of the train. 16 respondents, constituting 14.2%
of total sample size estimated the least passenger carrying capacity to be between 301 to 400 trains, while
11 respondents estimated a minimum carrying capacity of above 400 passengers. Overall, the study
shows that an estimated minimum carrying capacity by respondents pointed to between 100 passengers to
400 passengers.
Table 5.4: Estimate of the total active passenger capacity of the fleet. Frequency Percent Valid Percent Cumulative Percent
Valid
500 passengers or less 48 42.5 42.5 42.5 501 - 1000 passengers
29 25.7 25.7 68.1
1001 - 1500 passengers
13 11.5 11.5 79.6
1501 - 2000 passengers
15 13.3 13.3 92.9
Above 2000 passengers 8 7.1 7.1 100.0 Total 113 100.0 100.0
The table shows that 48 respondents, representing 42.5% of total sample size observed that the estimated
total active passenger capacity of train was about 500 passengers or less. Following this, 29 respondents,
GSJ: Volume 9, Issue 8, August 2021 ISSN 2320-9186 1072
GSJ© 2021 www.globalscientificjournal.com
6
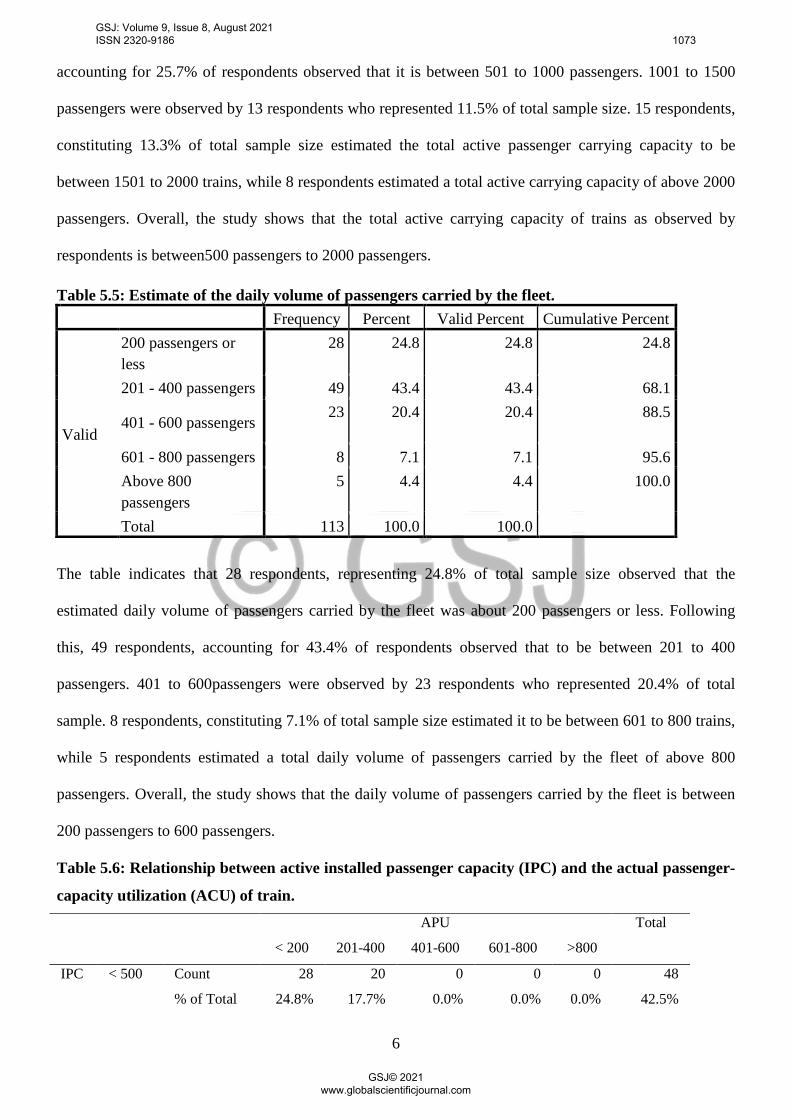
accounting for 25.7% of respondents observed that it is between 501 to 1000 passengers. 1001 to 1500
passengers were observed by 13 respondents who represented 11.5% of total sample size. 15 respondents,
constituting 13.3% of total sample size estimated the total active passenger carrying capacity to be
between 1501 to 2000 trains, while 8 respondents estimated a total active carrying capacity of above 2000
passengers. Overall, the study shows that the total active carrying capacity of trains as observed by
respondents is between500 passengers to 2000 passengers.
Table 5.5: Estimate of the daily volume of passengers carried by the fleet. Frequency Percent Valid Percent Cumulative Percent
Valid
200 passengers or less
28 24.8 24.8 24.8
201 - 400 passengers 49 43.4 43.4 68.1
401 - 600 passengers 23 20.4 20.4 88.5
601 - 800 passengers 8 7.1 7.1 95.6 Above 800 passengers
5 4.4 4.4 100.0
Total 113 100.0 100.0
The table indicates that 28 respondents, representing 24.8% of total sample size observed that the
estimated daily volume of passengers carried by the fleet was about 200 passengers or less. Following
this, 49 respondents, accounting for 43.4% of respondents observed that to be between 201 to 400
passengers. 401 to 600passengers were observed by 23 respondents who represented 20.4% of total
sample. 8 respondents, constituting 7.1% of total sample size estimated it to be between 601 to 800 trains,
while 5 respondents estimated a total daily volume of passengers carried by the fleet of above 800
passengers. Overall, the study shows that the daily volume of passengers carried by the fleet is between
200 passengers to 600 passengers.
Table 5.6: Relationship between active installed passenger capacity (IPC) and the actual passenger-
capacity utilization (ACU) of train.
APU Total
< 200 201-400 401-600 601-800 >800
IPC < 500 Count 28 20 0 0 0 48
% of Total 24.8% 17.7% 0.0% 0.0% 0.0% 42.5%
GSJ: Volume 9, Issue 8, August 2021 ISSN 2320-9186 1073
GSJ© 2021 www.globalscientificjournal.com
7
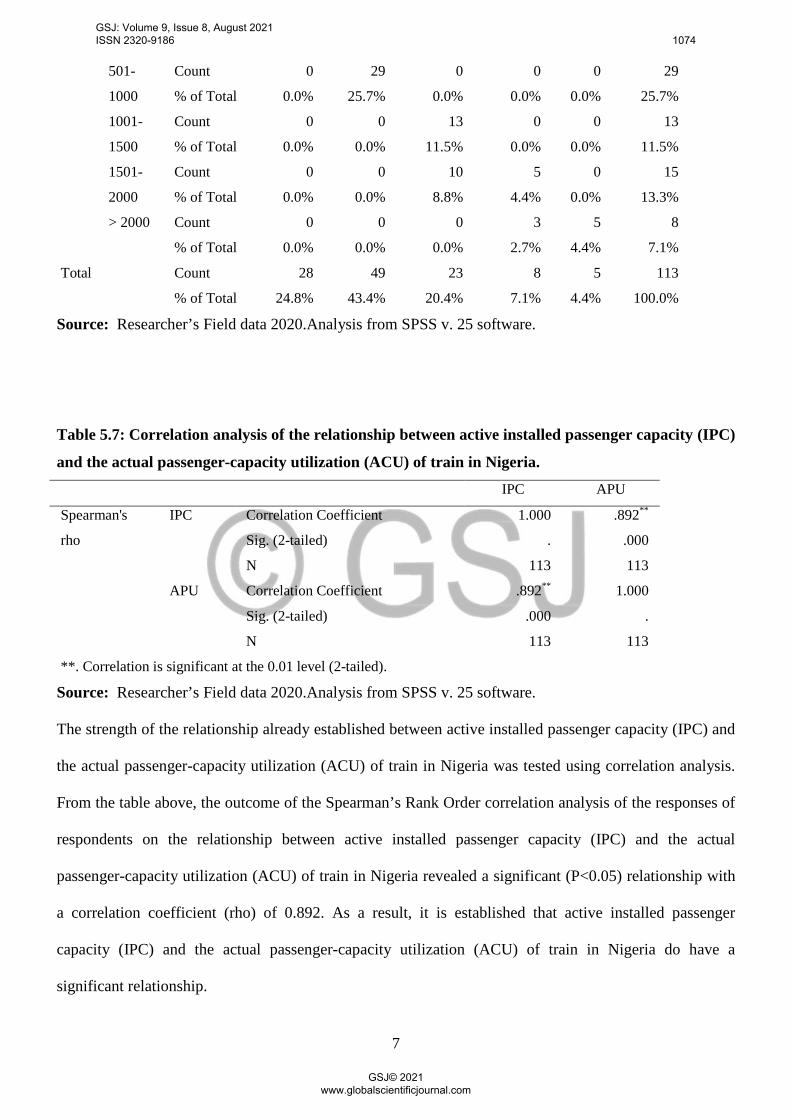
501-
1000
Count 0 29 0 0 0 29
% of Total 0.0% 25.7% 0.0% 0.0% 0.0% 25.7%
1001-
1500
Count 0 0 13 0 0 13
% of Total 0.0% 0.0% 11.5% 0.0% 0.0% 11.5%
1501-
2000
Count 0 0 10 5 0 15
% of Total 0.0% 0.0% 8.8% 4.4% 0.0% 13.3%
> 2000 Count 0 0 0 3 5 8
% of Total 0.0% 0.0% 0.0% 2.7% 4.4% 7.1%
Total Count 28 49 23 8 5 113
% of Total 24.8% 43.4% 20.4% 7.1% 4.4% 100.0%
Source: Researcher’s Field data 2020.Analysis from SPSS v. 25 software.
Table 5.7: Correlation analysis of the relationship between active installed passenger capacity (IPC)
and the actual passenger-capacity utilization (ACU) of train in Nigeria.
IPC APU
Spearman's
rho
IPC Correlation Coefficient 1.000 .892**
Sig. (2-tailed) . .000
N 113 113
APU Correlation Coefficient .892** 1.000
Sig. (2-tailed) .000 .
N 113 113
**. Correlation is significant at the 0.01 level (2-tailed).
Source: Researcher’s Field data 2020.Analysis from SPSS v. 25 software.
The strength of the relationship already established between active installed passenger capacity (IPC) and
the actual passenger-capacity utilization (ACU) of train in Nigeria was tested using correlation analysis.
From the table above, the outcome of the Spearman’s Rank Order correlation analysis of the responses of
respondents on the relationship between active installed passenger capacity (IPC) and the actual
passenger-capacity utilization (ACU) of train in Nigeria revealed a significant (P<0.05) relationship with
a correlation coefficient (rho) of 0.892. As a result, it is established that active installed passenger
capacity (IPC) and the actual passenger-capacity utilization (ACU) of train in Nigeria do have a
significant relationship.
GSJ: Volume 9, Issue 8, August 2021 ISSN 2320-9186 1074
GSJ© 2021 www.globalscientificjournal.com
8
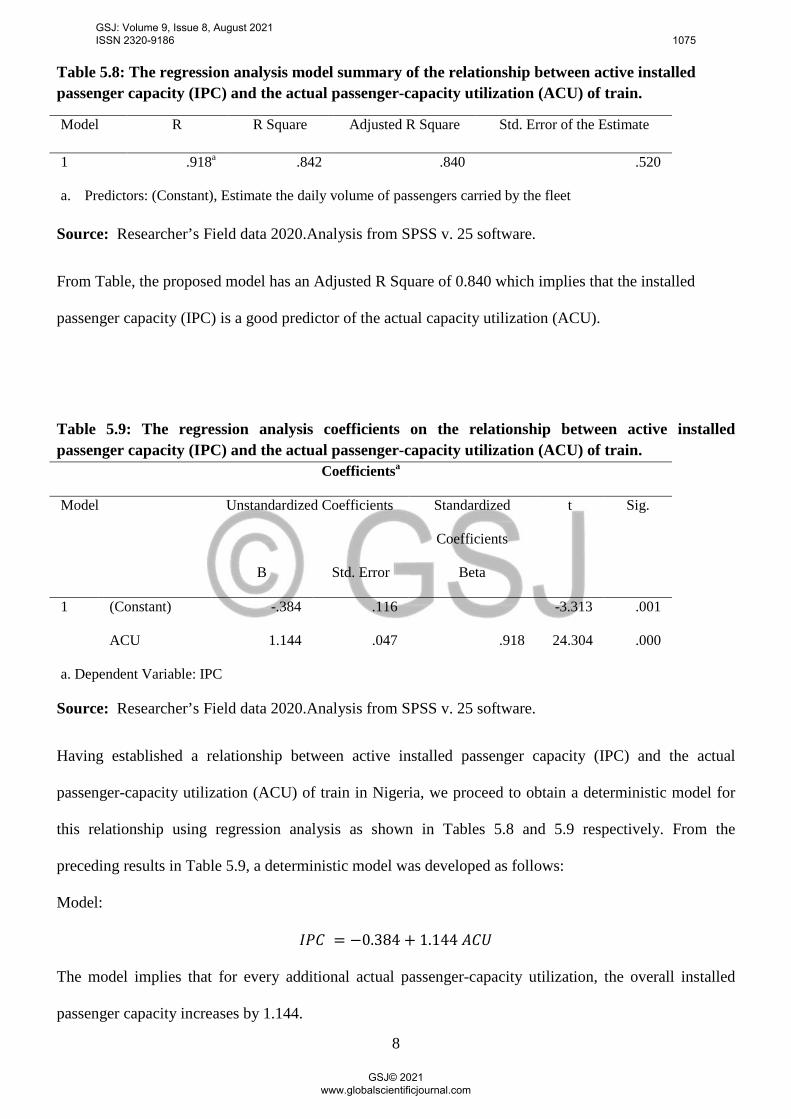
Table 5.8: The regression analysis model summary of the relationship between active installed passenger capacity (IPC) and the actual passenger-capacity utilization (ACU) of train.
Model R R Square Adjusted R Square Std. Error of the Estimate
1 .918a .842 .840 .520
a. Predictors: (Constant), Estimate the daily volume of passengers carried by the fleet
Source: Researcher’s Field data 2020.Analysis from SPSS v. 25 software.
From Table, the proposed model has an Adjusted R Square of 0.840 which implies that the installed
passenger capacity (IPC) is a good predictor of the actual capacity utilization (ACU).
Table 5.9: The regression analysis coefficients on the relationship between active installed passenger capacity (IPC) and the actual passenger-capacity utilization (ACU) of train.
Coefficientsa
Model Unstandardized Coefficients Standardized
Coefficients
t Sig.
B Std. Error Beta
1 (Constant) -.384 .116 -3.313 .001
ACU 1.144 .047 .918 24.304 .000
a. Dependent Variable: IPC
Source: Researcher’s Field data 2020.Analysis from SPSS v. 25 software.
Having established a relationship between active installed passenger capacity (IPC) and the actual
passenger-capacity utilization (ACU) of train in Nigeria, we proceed to obtain a deterministic model for
this relationship using regression analysis as shown in Tables 5.8 and 5.9 respectively. From the
preceding results in Table 5.9, a deterministic model was developed as follows:
Model:
𝐼𝐼𝐼𝐼𝐼𝐼 = −0.384 + 1.144 𝐴𝐴𝐼𝐼𝐴𝐴
The model implies that for every additional actual passenger-capacity utilization, the overall installed
passenger capacity increases by 1.144.
GSJ: Volume 9, Issue 8, August 2021 ISSN 2320-9186 1075
GSJ© 2021 www.globalscientificjournal.com
9
5. Discussion of findings
a. Positive significant relationship between active installed passenger capacity (IPC) and the
actual passenger-capacity utilization (ACU) of train in Nigeria?
It is established that where there is improvement of the passenger carrying capacities of the trains, there
would be corresponding improvement on the actual passenger carriage. This means that for a unit
addition in capacity, there would be a unit additional increase in utilization of capacity.
b. High Train Downtime Regime:
Trains, according to the NRC operators sometimes spend more than one year in the workshop; depending
on the fault to be fixed. This goes to show that the stock of spare parts is a challenge, despite the huge
profit.
c. Installed passenger capacity of the fleet of Nigerian Railway Corporation is grossly
underutilized:
Owing to frequent breakdowns and high downtime regime, the average daily utilization of overall fleet
size capacity of an average station or terminus is very low. Consequently, the frequencies of operations,
maintenance of departure and arrival timelines are not guaranteed.
6. Recommendations
Preventive Maintenance of Trains and Rolling Stock
The management of NRC and ARMT should ensure scheduled train and rolling stock maintenance.
Scheduled preventive maintenance would help reduce incidences of breakdowns in transit and attendant
high downtime regime, and make for increase in capital gains.
Total Rehabilitation of Existing Rail Infrastructure
Government must devote more efforts at the gradual replacement of the sleepers of the narrow gauge
lines that have become obsolete and dangerous, with standard gauge tracks. Currently, most of the
segments of the Nigerian rail network, especially the eastern district have been cut off intermittently from
their origin or destination.
Breaking of Government sole right over Rail Transport Industry
GSJ: Volume 9, Issue 8, August 2021 ISSN 2320-9186 1076
GSJ© 2021 www.globalscientificjournal.com
10
The Nigerian Railway Act of 1955 (amended in 1990) which grants government the exclusive right over
railway transport should be amended to allow private investors to operate. Competition brings about high
service quality.
References
Adesanya, A (2002). Declining fortunes of Rail Transport in Nigeria: Response and Direction of Policy. NISER Monograph Series, No. 8, NISER, Ibadan.
Adesanya, A. (2010). “Bringing the railways back on track: challenges and options”. Text of a lecture
delivered at the monthly NISER seminar series, held at NISER, Ibadan.. Agunloye O.O & Oduwaye L. (2011): Factors influencing the quality of rail transport services in
metropolitan Lagos. Journal of Geography and Regional Planning. 4(2), 98-103. ISSN 2070-1845.
Agunloye, O.O. (2008). Assessment of rail transport services in Lagos Metropolis. An unpublished M.Sc
Dissertation, Submitted to the Department of Geography, University of Lagos, Lagos. Ayoola T. (2008): Colonial inheritance, postcolonial neglect, and the management of Nigerian Railway
by Rail India Technical and Economic Services (RITES). African Journals Online (AJOL). Vol. 14(1). http://dx.doi.org/10.4314/lnr.v14i1.46493.
Elger, D. (2007). Theory of Performance. In S.W. Beyerlein, C. Holmes, & D. K. Apple (Eds.), Faculty
guidebook: A comprehensive tool for improving faculty performance (4th ed.) (19-22). Lisle, IL: Pacific Crest.
Faajir, A. and Zidan, Z.H (2016): An analysis of the issues and challenges of transportation in Nigeria
and Egypt. The Business and Management Review. 7(2), Folan, P; Browne J. & Jagdev H. (2008). Performance: its content & meaning for today’s business
research. In https://ore.exeter.ac.uk/repository/bitstream/handle/10871/17128 International Labour Organization (1994). Tripartite meeting on the consequences for management and
personnel of the restructuring of railways. Geneva: International Labour Office. McNamara, C. (2005) Field Guide to Consulting and Organizational Development. A Collaborative and
Systems Approach to Performance, Change and Learning. Authenticity Consulting, LLC. National Bureau of Statistics (2018). Annual Reports: Rail Transportation. NBS, Abuja. Nigerian Railway Corporation (1955). Act No. 20 of 1955. Laws of the Federation of Nigeria (1990
revised edition), Vol. 18, pp. 11950-12006. Nigerian Railway Corporation (2010). Annual report 2003-2010. NRC Headquarters, Lagos, Nigeria. Rodrigue, J-P & Slack, B. (2009). Rail transportation and pipelines. Retrieved April 15, 2009 from
http://people.hofstra.edu/geotrans/eng/ch3en/conc3en/ch3c2ben.html.
GSJ: Volume 9, Issue 8, August 2021 ISSN 2320-9186 1077
GSJ© 2021 www.globalscientificjournal.com