evaluation of oriented poly(lactide) polymers vs. existing pet and oriented ps for fresh food...
TRANSCRIPT
Evaluation of Oriented Poly(lactide) Polymers with Existing PET and Oriented PS for Fresh Food Service Containers
Rafael A. Auras1a, S. Paul Singh1, Jagjit J. Singh2
1.School of Packaging, MSU, East Lansing, MI, U.S.A. 48824-1223 2. California Polytechnic University, San Luis Obispo, CA, U.S.A.
SUMMARY
Poly(lactide) (PLA) polymers have garnered increasing attention in the last few years as food packaging materials because they can be obtained from renewable resources; their production consumes quantities of carbon dioxide; they can be recyclable and compostable; and also their physical and mechanical properties can be tailored through polymer architecture. As a consequence, PLA is becoming a growing alternative as a green food packaging material. PLA’s optical, physical, and mechanical properties have been compared to those of polystyrene (PS) and polyethylene terephthalate (PET) although studies comparing and showing the actual performance of PLA, PS and PET plastics containers are scarce. The purpose of this study was to investigate and to compare the role of PLA in package sustainability for the food service industry. Two of the commonly used materials to make containers to package fresh food, PET and oriented polystyrene (OPS), were compared with oriented PLA (OPLA) and OPLA with 40% recycled content from the industrial trimming process. The recycled OPLA provides an opportunity for full material utilization and lowers costs. This study involved a number of tests to quantify the physical, mechanical, barrier, and compatibility properties that would affect the selection criteria for containers to be used for food service applications. Based on the data collected, OPLA, OPLA+40% regrind, OPS, and PET performances were evaluated. Exposure of OPS, PET, OPLA, and OPLA+40% regrind to vegetal oil and weak and strong acids show a minimal reduction in the performance of these polymers. At ambient temperature, PET has the highest impact resistance followed by OPLA, OPS, and OPLA+40% regrind. In terms of barrier properties, PET shows the highest oxygen barrier followed by OPLA, OPLA 40% recycled content, and OPS. Thus, OPLA and OPLA with 40% recycled content can be used for fresh food applications as well as OPS and PET, and in many situations it performs better than OPS and PET. Keywords: poly(lactide); poly(ethylene terephthalate); polystyrene;biodegradable;
packaging.
a Correspondence to P: (517) -432-3254; E: [email protected]
Evaluation of OPLA, OPLA+40% regrind, PET, and OPS for Fresh Food Containers
INTRODUCTION As consumers are becoming more aware of municipal waste problems and
demand the use of bio-friendly packaging materials, the selection of food packaging polymers not only depends on the evaluation of polymer standard properties, but also on the recyclability and sustainability of these polymers. As a consequence, Poly(lactide) (PLA) polymers have garnered increasing attention in the last few years as food packaging materials because they can be obtained from renewable resources;1 their production consumes quantities of carbon dioxide;2 they can be recyclable and compostable;3 and their physical and mechanical properties can be tailored through polymer architecture.4
High molecular weight PLA can be obtained by different routes: a) direct condensation-polymerization, b) azeotropic dehydrative condensation, and c) polymerization through lactide formation. Polymerization through lactide formation is by and large the current method used for producing higher quantities of PLA for commercial packaging applications. Dextrose, which is obtained from the starch fermentation from corn, is further fermented to obtain either D-lactic acid (DLA), L-lactic acid (LLA), or a mixture of the two (DLLA). Afterward, a mixture of LA is further polymerized to obtain an intermediate low molecular mass poly(lactic acid), which is then under lower pressure catalytically converted into a mixture of lactide stereoisomers.5 Lactide, the cyclic dimer of lactic acid, is formed by the condensation of two lactic acid molecules as follows: L-lactide (two L-lactic acid molecules), D-lactide (two D-lactic acid molecules), and meso-lactide (an L-lactic acid and a D-lactic acid molecule). After vacuum distillation of the lactide, high molecular mass PLA with controlled optical purity and a constitutional unit of –[OCH(CH3)CO-O-CH(CH3)-CO]- is formed by ring-opening polymerization of the lactides.4, 6
Properties of high molecular weight PLA are determined by the polymer architecture (i.e., the stereochemical makeup of the backbone) and the molecular mass, which is controlled by the addition of hydroxylic compounds. The ability to control the stereochemical architecture in PLA polymers permits precise control over the speed and finally degree of crystallinity, the mechanical properties, and the processing temperatures of the material. In addition, the degradation behavior strongly depends on the stereochemical composition, molecular weight, and crystallinity of the samples.7
PLA’s optical, physical, and mechanical properties have been compared to poly-styrene (PS), and polyethylene terephthalate (PET).8, 9 Nonetheless, PLA polymers have the advantage of easily tailoring their physical properties by changing the chemical composition (amount of L- and D-isomer) and the processing conditions. PLA meets legal standards, and it can be used in fabricating articles for contact with food. PLA polymers show good barrier to aroma, and medium barrier to gases and vapors. Currently, PLA is being used as a food packaging polymer for short shelf life products with common applications such as containers, drinking cups, sundae and salad cups, overwrap and lamination films, and blister packages.10, 11 PLA is becoming a growing alternative as a green food packaging material. New applications have been claimed in the arena of fresh products, where thermoformed PLA containers are used in retail markets for fruit and vegetables. In the next years, PLA production and consumption is expected to increase. Therefore, there is a need to better understand and describe its

Evaluation of OPLA, OPLA+40% regrind, PET, and OPS for Fresh Food Containers
properties as a packaging material, especially for food packaging applications. The purpose of this study was to investigate the role of package sustainability for plastics made from renewable sources for the food service industry. The packaging used by this industry which represents restaurants, delis, and dispensing machines, among others currently relies on the use of plastics made from petroleum based resources. Two of the commonly used materials to make containers to package fresh food are poly-ethylene terephthalate (PET) and oriented polystyrene (OPS). This study was aimed at comparing the performance of thermo-formed food service containers made from the existing petroleum based plastics (PET and OPS) to similar containers made from OPLA and OPLA + 40% recycled content from the industrial trimming process. The recycled PLA provides an opportunity for full material utilization and lowers costs. This study involved a number of tests to quantify the physical, mechanical, barrier, and compatibility properties that would affect the selection criteria for containers to be used for food service applications.
EXPERIMENTAL PART
Materials OPLA, OPLA with 40% recycled content from the industrial trimming process,
PET, and OPS roll stock sheet were provided by Wilkinson Manufacturing Company, (Fort Calhoun, NE). OPLA was made with nominally 94 % L-Lactide with a density of 1243 ± 2 kg/m3.
Physical Properties Thickness
Thickness of films was determined with a TMI 549M micrometer (Testing Machines, Inc., Amityville, New York) according to ASTM D 374 – 99. Glass Transition (Tg) and Melting Temperature (Tm)
Four different samples of OPLA, OPLA+40% regrind, PET and PS were used to determine the Tg and Tm with a Differential Scanning Calorimetry (DSC 2010) made by TA Instruments (New Castle, DE) in accordance with ASTM D 3418-97. The DSC standard calibration procedures were performed according to ASTM E 967-97 and E 968-99. In addition, three other samples were used to determine the enthalpy of fusion and to calculate the percent crystallinity of PET, OPS, and OPLA and OPLA+40% regrind by DSC according to ASTM D 3417-97 (Equation 1).
cm
mcc
HHHx
∆∆+∆= x100(%) (1)
where ∆Hm is the enthalpy of fusion ∆Hc is the enthalpy of cold crystallization, and ∆Hmc
is the heat of melting of purely crystalline poly(L-lactide) or PET. The crystallinity amounts were calculated according to equation 1.
Evaluation of OPLA, OPLA+40% regrind, PET, and OPS for Fresh Food Containers
Barrier Properties Water Vapor Transmission Rate
Water vapor transmission rate was tested using a Permatran W3/31 from Modern Controls Inc. (Minneapolis, MN). Prior to testing the sample, a reference material with known transmission rate was tested to verify that the instrument was working properly. The temperature and relative humidity were 37.8ºC and 100%RH, respectively. The testing was performed until 10 values of constant transmission rate (small fluctuation without upward/downward pattern) were obtained. The final transmission rate was calculated by averaging the last 10 constant values for duplicate samples. Water vapor permeability coefficients (WVPC) were calculated by equation 2:
P
lWVTRWVPC∆
= * (2)
where WVTR is the water vapor transmission rate [kg/m2.s], l is the thickness [m], and ∆P is the difference in water vapor partial pressure across the film [Pascal]. ∆P= p1 – p2; where p1 is the partial pressure of the water at the temperature tested on the test side, and p2 is equal to zero on the detector side.
Oxygen Transmission Rate:
Oxygen transmission rates were tested using an Oxtran 2/21 made by Modern Controls Inc, (Minneapolis, MN). The tests were performed in accordance with ASTM D 3985-02 and F 1927-98e1. Calibration of the instrument was performed with a standard film provided by Modern Controls Inc, (Minneapolis, MN). The temperature and relative humidity of the test conditions were 23 ºC and 0%RH, respectively. The samples were conditioned for 4 hours prior to testing. The testing was performed until 10 values of constant transmission rate (small fluctuation without upward/downward pattern) were obtained. The final transmission rate was calculated by averaging the last 10 constant values for duplicate samples.
Mechanical Properties Impact
Impact tests were conducted according to ASTM D 1709-91 on the four polymer materials. This standard describes the method to determine the energy that causes the plastic film/sheet to fail under specified conditions of impact of a free-falling dart. The energy is expressed in terms of weight (mass) of the missile falling from a specified height, which would result in a 50% failure of all specimens tested. The tests were conducted on the material provided in roll stock. The tests were conducted at ambient 72ºF (22ºC) and frozen food storage temperatures of 0°F (-18ºC), -10°F (-23ºC), and –20°F (-29ºC). Tensile
The tensile properties of these four materials were tested using the roll stock sample materials. The tests were conducted in accordance with ASTM D 882-97 in an

Evaluation of OPLA, OPLA+40% regrind, PET, and OPS for Fresh Food Containers
United tensile test machine, (United Calibration Corporation Huntington Beach, California). Tests were performed on three samples of each material at the following temperatures: 72ºF (23ºC) ambient temperature, 0°F (-18ºC), -10°F(-23ºC), and –20°F (-29ºC).
Chemical Resistance
Acid and Vegetable Oil Resistance Test The samples of the four materials obtained from the roll stock were also subjected
to a chemical resistance test. Samples (6 x 1 inches) obtained from roll stock materials were exposed to a weak acid (pH = 6), strong acid (pH =2) for periods of 0,1,3,5, and 7 days, and OPLA +40% regrind were also exposed to a vegetable oil for periods of 0,1,3,5, and 7 days. The weak acid solution was prepared using acetic acid, and the strong acid solution was prepared using hydrochloric acid. Three replicates were tested after exposure at each condition for changes in tensile properties as compared to tests at ambient conditions (72ºF).
RESULTS Physical properties
PLA polymers pass through an endothermic event which is superimposed on the Tg and is observed during the first heating on the DSC.8 This endothermic relaxation, with an enthalpy around of 1.4 J/g results from secondary molecular reordering undergone in the amorphous phase of semi-crystalline polymers.12 The endothermic peak is eliminated as the sample is heated above Tg. The second heating curve shows the glass transition temperature. Table 1 presents the glass transition and melting temperature and the enthalpy of fusion for PET, OPS, OPLA, and OPLA+40% regrind. The percent of crystallinity, χC, was calculated from equation 1.
For PLA, ∆Hm =135 J/g,13 and for PET, ∆Hm =125.6 J/g.14 OPS used in packaging is atactic, so it cannot crystallize. Its lack of crystallinity makes it highly transparent. Since it is an amorphous polymer, it does not have a defined melting point. So, it gradually softens through a wide range of temperatures.
Table 1. Glass transition, melting temperature, and percent crystallinity of OPLA, OPLA+40% regrind, PET, and OPS.
Sample Tg, ºC Tm, ºC χχχχc, %
OPLA 62 ± 1 150 ± 0.5 29 ± 0.5
OPLA+40%regrind 58 ± 0.5 150 ± 0.5 25 ± 3
PET 80 ± 0.5 246 ± 0.5 27 ± 2
OPS* 106 ± 0.5 N/A N/A
*atactic
Evaluation of OPLA, OPLA+40% regrind, PET, and OPS for Fresh Food Containers
Barrier Properties
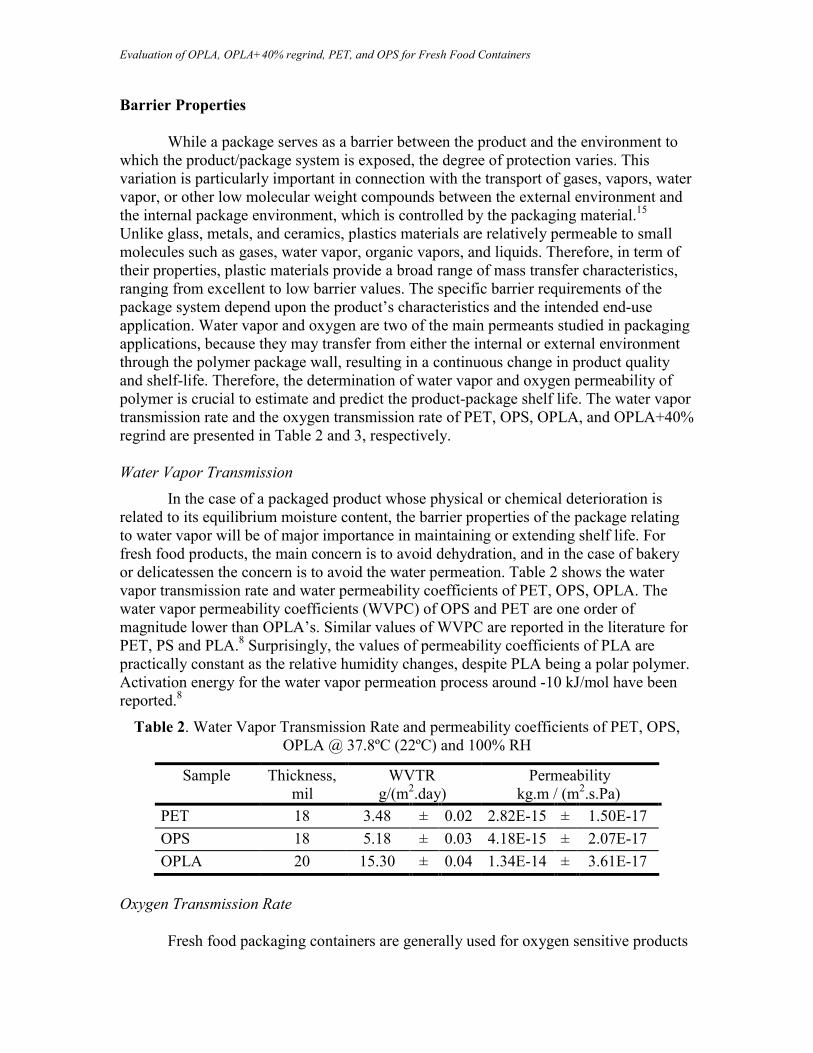
While a package serves as a barrier between the product and the environment to which the product/package system is exposed, the degree of protection varies. This variation is particularly important in connection with the transport of gases, vapors, water vapor, or other low molecular weight compounds between the external environment and the internal package environment, which is controlled by the packaging material.15 Unlike glass, metals, and ceramics, plastics materials are relatively permeable to small molecules such as gases, water vapor, organic vapors, and liquids. Therefore, in term of their properties, plastic materials provide a broad range of mass transfer characteristics, ranging from excellent to low barrier values. The specific barrier requirements of the package system depend upon the product’s characteristics and the intended end-use application. Water vapor and oxygen are two of the main permeants studied in packaging applications, because they may transfer from either the internal or external environment through the polymer package wall, resulting in a continuous change in product quality and shelf-life. Therefore, the determination of water vapor and oxygen permeability of polymer is crucial to estimate and predict the product-package shelf life. The water vapor transmission rate and the oxygen transmission rate of PET, OPS, OPLA, and OPLA+40% regrind are presented in Table 2 and 3, respectively.
Water Vapor Transmission In the case of a packaged product whose physical or chemical deterioration is
related to its equilibrium moisture content, the barrier properties of the package relating to water vapor will be of major importance in maintaining or extending shelf life. For fresh food products, the main concern is to avoid dehydration, and in the case of bakery or delicatessen the concern is to avoid the water permeation. Table 2 shows the water vapor transmission rate and water permeability coefficients of PET, OPS, OPLA. The water vapor permeability coefficients (WVPC) of OPS and PET are one order of magnitude lower than OPLA’s. Similar values of WVPC are reported in the literature for PET, PS and PLA.8 Surprisingly, the values of permeability coefficients of PLA are practically constant as the relative humidity changes, despite PLA being a polar polymer. Activation energy for the water vapor permeation process around -10 kJ/mol have been reported.8
Table 2. Water Vapor Transmission Rate and permeability coefficients of PET, OPS, OPLA @ 37.8ºC (22ºC) and 100% RH
Sample Thickness, mil
WVTR g/(m2.day)
Permeability kg.m / (m2.s.Pa)
PET 18 3.48 ± 0.02 2.82E-15 ± 1.50E-17 OPS 18 5.18 ± 0.03 4.18E-15 ± 2.07E-17 OPLA 20 15.30 ± 0.04 1.34E-14 ± 3.61E-17
Oxygen Transmission Rate
Fresh food packaging containers are generally used for oxygen sensitive products

Evaluation of OPLA, OPLA+40% regrind, PET, and OPS for Fresh Food Containers
sensitive such as fruits, salad and ready to eat meals. Therefore, the oxygen barrier property of a polymer plays an important role to protect a fresh product in a package. Oxygen barrier is quantified by the oxygen permeability coefficients which indicate the amount of oxygen that permeates per unit of area and time in a packaging material. Bigger oxygen permeability coefficients are an indication of lower barrier protection. When a packaging film with low oxygen permeability coefficients is used, the oxygen pressure inside the package drops to the point where oxidation is retarded, and the shelf life of the product may be extended. The values of the oxygen transmission rate and oxygen permeability coefficients of PET, OPS, OPLA, and OPLA+40% regrind are shown in Table 3. If we compare the oxygen permeability coefficients, the OPS oxygen permeability coefficient is one order of magnitude higher than OPLA’s, and two order of magnitude higher than PET’s. A slightly higher oxygen permeability coefficient was observed for OPLA +40% regrind than the OPLA without regrind.
Table 3. Oxygen Transmission Rate (OTR) and permeability coefficients of OPLA, OPLA+40% regrind, PET and OPS. Results @ 72ºF (22ºC) and 0% relative humidity.
Sample Thickness, mil
OTR cc/(m2.day)
Permeability kg.m / (m2.s.Pa)
PET 18 9.44 ± 0.06 6.95E-19 ± 1.90E-20 OPS 18 531.58 ± 0.67 3.91E-17 ± 8.72E-19 OPLA 20 56.33 ± 0.12 4.33E-18 ± 1.00E-19 OPLA+40% 18.0 106.3 ± 9.5 8.17E-18 ± 8.99E-19
Similar PLA, PET and OPS oxygen permeability coefficients are reported in the literature.9, 16, 17 Lehermeier et al, 200116 reports oxygen permeability coefficients around of 3.3x10⁻¹⁷ kg.m / (m2.s.Pa) at 25ºC and activation energy of 11.1 kJ.mol-1. Auras et al, 20049 determined and compared the diffusion, solubility and permeability coefficients of PET and two PLA films by using an isostatic technique at 1 and 0.21 atmosphere pressure at 5, 23, and 40ºC and between 0 and 90% relative humidity. They reported an increase of the oxygen permeability coefficient from 3.5x10⁻¹⁸ kg.m / (m2.s.Pa) at 5ºC to 11x10-18 kg.m / (m2.s.Pa) in the absence of moisture. However, when the temperature increased from 5ºC to 40ºC and the humidity to 90% the oxygen permeability coefficients of PLA decreased to 8.5x10⁻¹⁸ kg.m / (m2.s.Pa).
Mechanical Properties Impact
Impact properties of PET, OPS, OPLA and OPLA+40% regrind were determined by the falling dart method at -20ºF, -10ºF, 0ºF, and 72ºF. The first three temperature indicates normal freeze temperature used in the retail package, and 72ºF is the room temperature. Figure 1 shows the impact failure weight of these four polymers. It is possible to observe that PET failed at a weight that is almost double that of OPS, OPLA, and OPLA+40% regrind. However, if we compare OPS with OPLA, the average failure weight is in the same range. Moreover, OPLA+40% presents a higher average impact
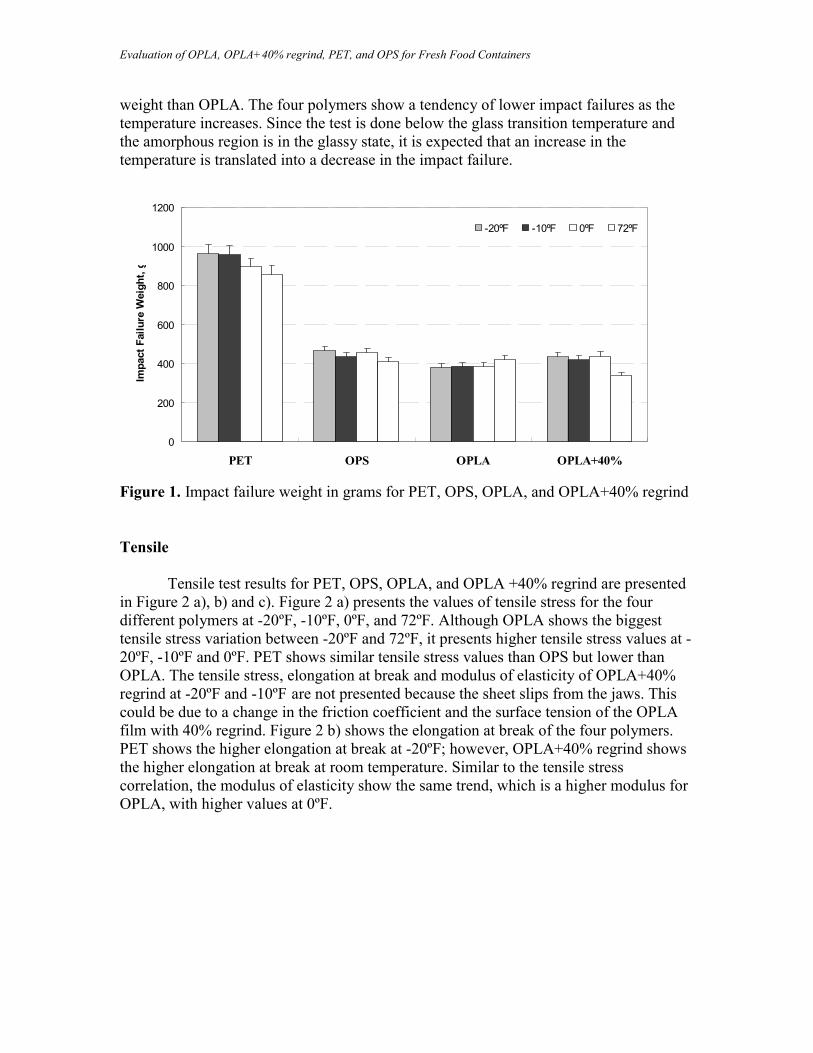
Evaluation of OPLA, OPLA+40% regrind, PET, and OPS for Fresh Food Containers
weight than OPLA. The four polymers show a tendency of lower impact failures as the temperature increases. Since the test is done below the glass transition temperature and the amorphous region is in the glassy state, it is expected that an increase in the temperature is translated into a decrease in the impact failure.
0
200
400
600
800
1000
1200
PET OPS OPLA OPLA+40%
Impa
ct F
ailu
re W
eigh
t, g
-20ºF -10ºF 0ºF 72ºF
Figure 1. Impact failure weight in grams for PET, OPS, OPLA, and OPLA+40% regrind Tensile
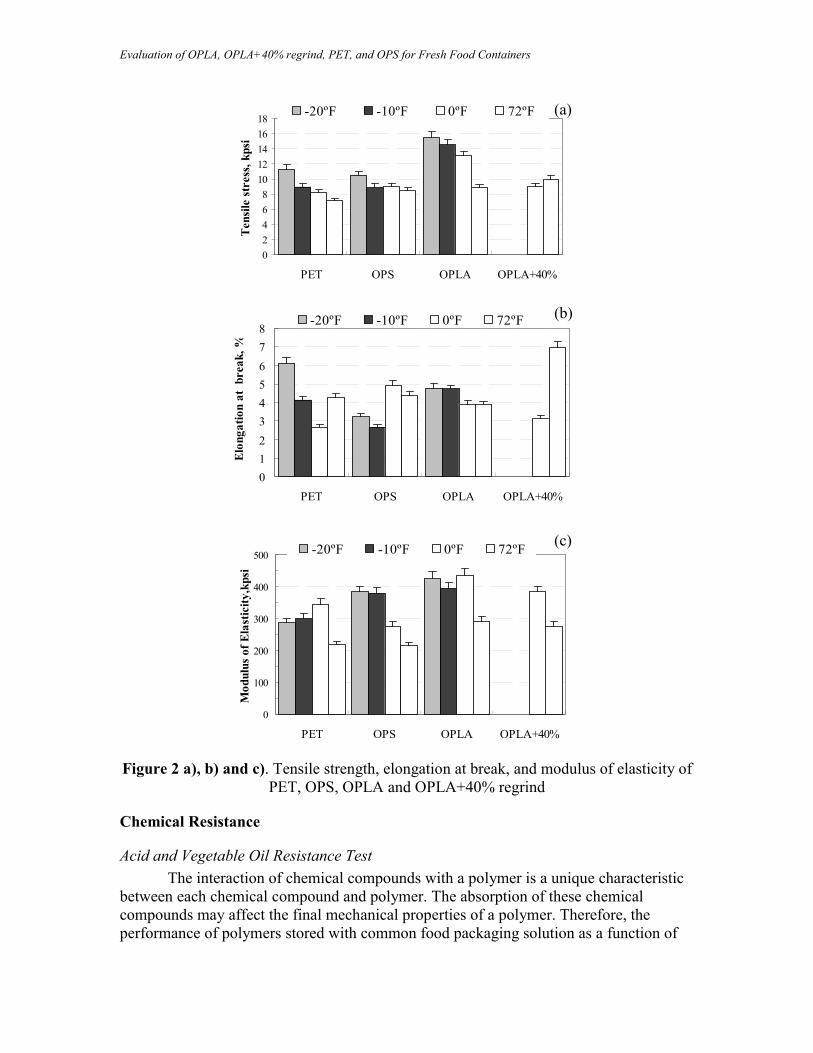
Tensile test results for PET, OPS, OPLA, and OPLA +40% regrind are presented in Figure 2 a), b) and c). Figure 2 a) presents the values of tensile stress for the four different polymers at -20ºF, -10ºF, 0ºF, and 72ºF. Although OPLA shows the biggest tensile stress variation between -20ºF and 72ºF, it presents higher tensile stress values at -20ºF, -10ºF and 0ºF. PET shows similar tensile stress values than OPS but lower than OPLA. The tensile stress, elongation at break and modulus of elasticity of OPLA+40% regrind at -20ºF and -10ºF are not presented because the sheet slips from the jaws. This could be due to a change in the friction coefficient and the surface tension of the OPLA film with 40% regrind. Figure 2 b) shows the elongation at break of the four polymers. PET shows the higher elongation at break at -20ºF; however, OPLA+40% regrind shows the higher elongation at break at room temperature. Similar to the tensile stress correlation, the modulus of elasticity show the same trend, which is a higher modulus for OPLA, with higher values at 0ºF.
Evaluation of OPLA, OPLA+40% regrind, PET, and OPS for Fresh Food Containers
Figure 2 a), b) and c). Tensile strength, elongation at break, and modulus of elasticity of
PET, OPS, OPLA and OPLA+40% regrind
Chemical Resistance
Acid and Vegetable Oil Resistance Test The interaction of chemical compounds with a polymer is a unique characteristic
between each chemical compound and polymer. The absorption of these chemical compounds may affect the final mechanical properties of a polymer. Therefore, the performance of polymers stored with common food packaging solution as a function of
02468
1012141618
PET OPS OPLA OPLA+40%
Ten
sile
str
ess,
kps
i
-20ºF -10ºF 0ºF 72ºF
012345678
PET OPS OPLA OPLA+40%
Elo
ngat
ion
at b
reak
, %
-20ºF -10ºF 0ºF 72ºF
0
100
200
300
400
500
PET OPS OPLA OPLA+40%
Mod
ulus
of E
last
icity
,kps
i
-20ºF -10ºF 0ºF 72ºF
(a)
(b)
(c)

Evaluation of OPLA, OPLA+40% regrind, PET, and OPS for Fresh Food Containers
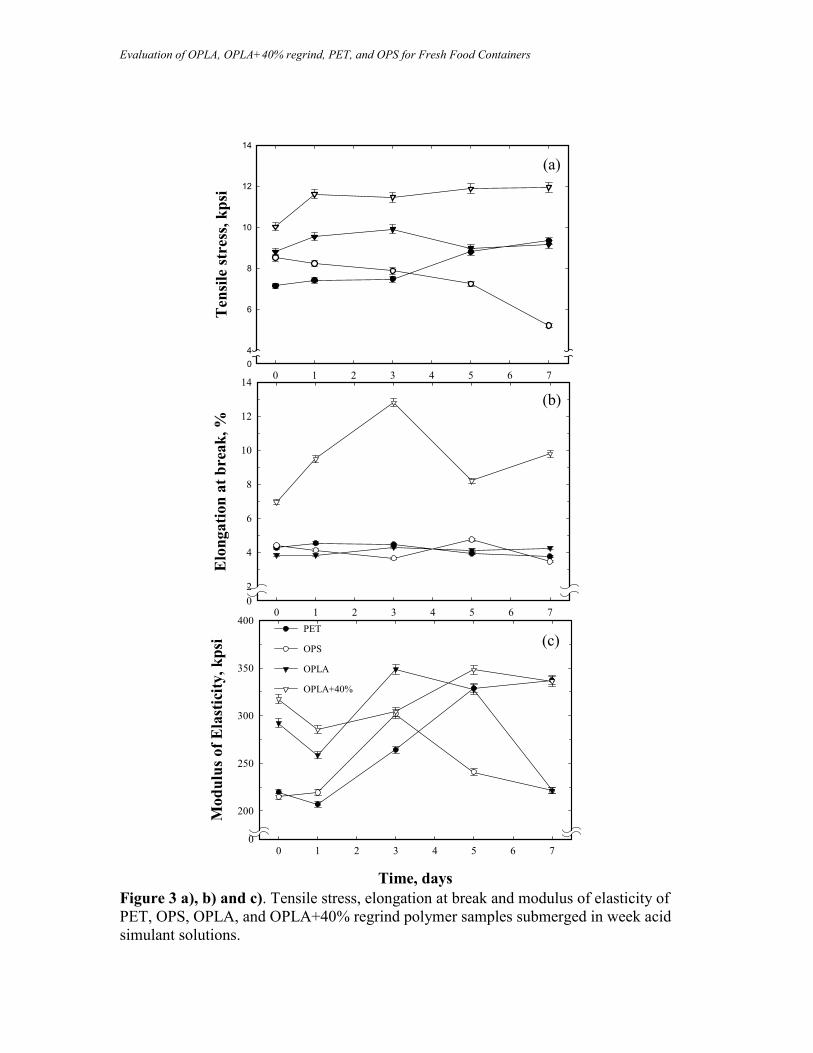
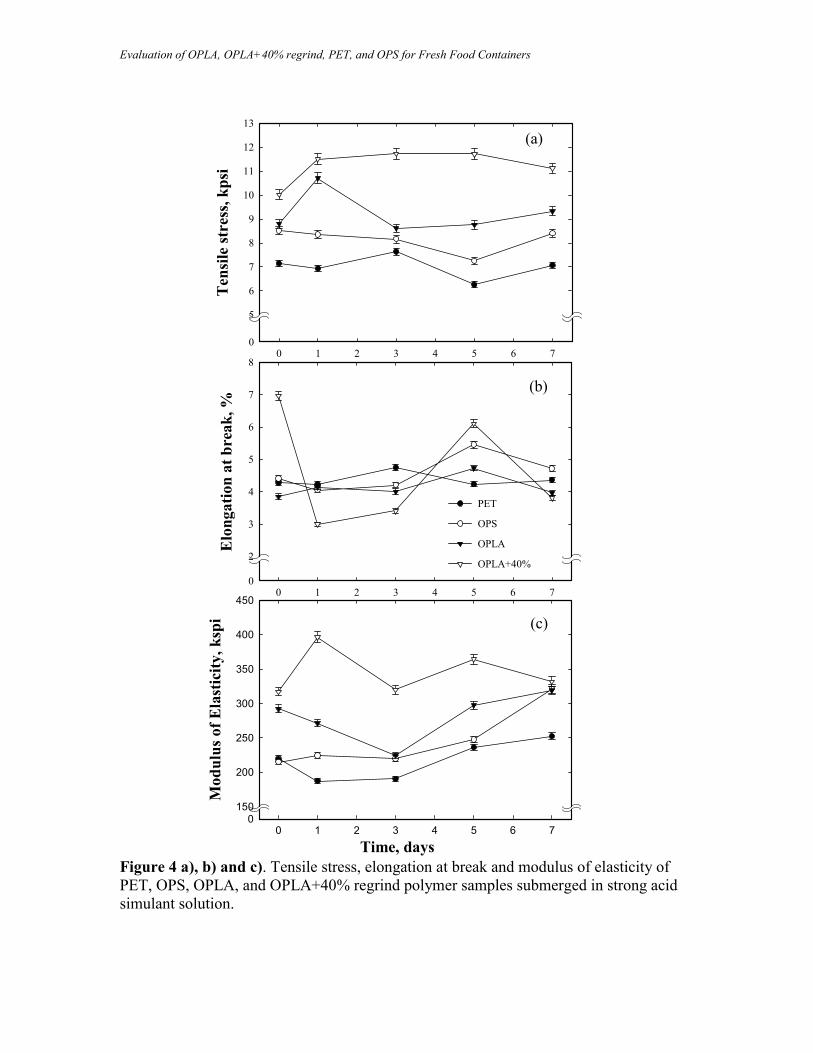
time is necessary to assess the suitability of the package. Figure 3 and 4 show the tensile stress, elongation at break, and modulus of elasticity of samples submerged in weak and strong acid as a function of time. These simulant solutions represent the spectrum of the product that could be packaged in these polymers.
For samples submerged in weak acid (Figure 3), PET shows an increase of tensile
stress of around 30% at day seven. OPLA+40% regrind and OPLA show an increase of tensile stress of 19% and 4%, respectively. On the other hand, OPS samples show a reduction of the tensile stress of almost 40%. Figure 3 b) shows that PET and OPS became more brittle at day seven than they were at day zero. A reduction of the elongation at break of 12% for PET and 21% for OPS are observed at seven days. Otherwise, OPLA become 10% more ductile at day seven than day one, and OPLA+40% regrind is 40% more ductile at day seven that it was at day one. As PET and OPS are becoming more brittle, the modulus of elasticity is increasing (53% for PET and 5% for OPS). In the case of OPLA, the modulus of elasticity is reduced by 25%; however, in the case of OPLA+40% regrind the modulus of elasticity does not change as a function of time.
For samples submerged in strong acid (Figure 4), PET and OPS do not show
significant variation of tensile stress at day seven. OPLA+40% regrind and OPLA show an increase of tensile stress of 11% and 10%, respectively. Figure 4 b) shows no major variation of the elongation at break for PET, OPS, and OPLA although it shows a net variation of 45% of elongation at break of OPLA +40% regrind. In all the cases, the four polymers became more brittle with an increase in the modulus of elasticity from 4.6 % for OPLA+40% regrind to 50% for OPS. The increase in the modulus of elasticity in every sample is an indication of the brittleness of the sample as a function of time.
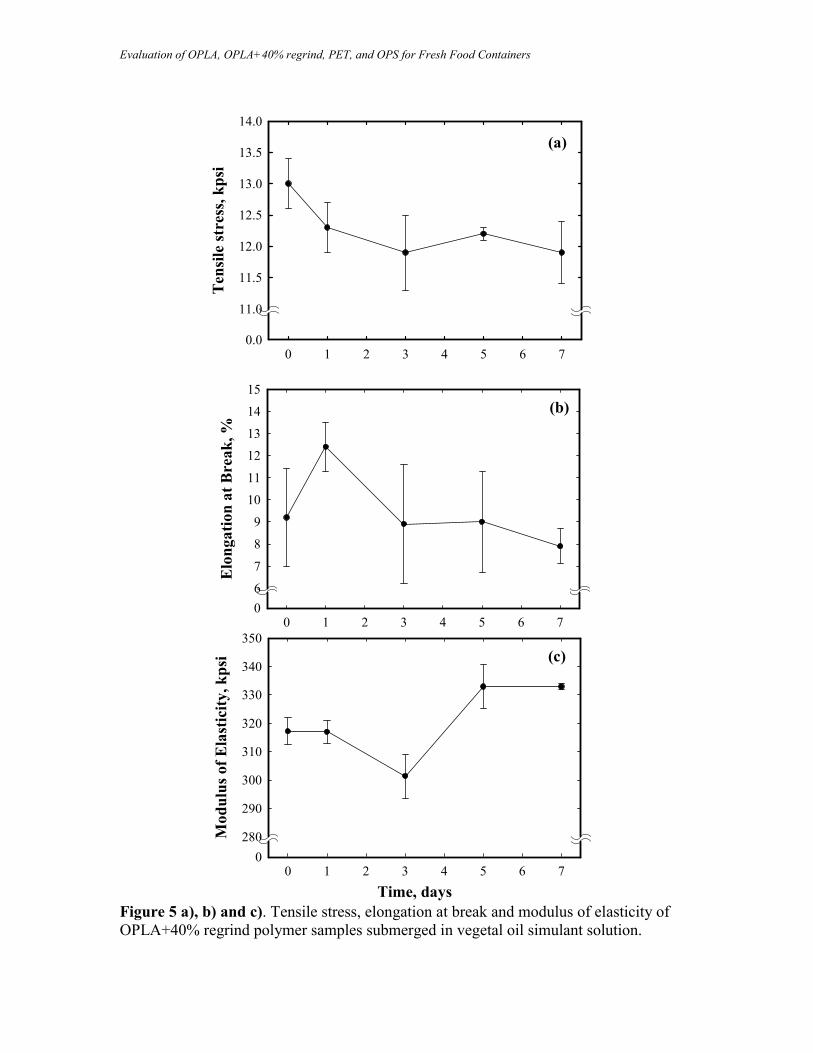
OPLA+40% samples submerged in vegetal oil (Figure 5 a)) show a decrease of the tensile stress by 8.5% in day seven compared to day one. Also, Figure 5 b) shows a reduction of the elongation at break at day seven of 14% compared to day one. Samples testing at day three and five show a bigger variation of the elongation at break compared with the samples tested in other times. Finally, the modulus of elasticity increased by 4.5% at day seven compared with day one.
Evaluation of OPLA, OPLA+40% regrind, PET, and OPS for Fresh Food Containers
0 1 2 3 4 5 6 7
Tens
ile st
ress
, kps
i
04
6
8
10
12
14
0 1 2 3 4 5 6 7
Elo
ngat
ion
at b
reak
, %
02
4
6
8
10
12
14
Time, days
0 1 2 3 4 5 6 7
Mod
ulus
of E
last
icity
, kps
i
0
200
250
300
350
400PET
OPS
OPLA
OPLA+40%
(a)
(b)
(c)
Figure 3 a), b) and c). Tensile stress, elongation at break and modulus of elasticity of PET, OPS, OPLA, and OPLA+40% regrind polymer samples submerged in week acid simulant solutions.
Evaluation of OPLA, OPLA+40% regrind, PET, and OPS for Fresh Food Containers
0 1 2 3 4 5 6 7
Ten
sile
stre
ss, k
psi
0
5
6
7
8
9
10
11
12
13
0 1 2 3 4 5 6 7
Elo
ngat
ion
at b
reak
, %
0
2
3
4
5
6
7
8
0 1 2 3 4 5 6 7
Mod
ulus
of E
last
icity
, ksp
i
0150
200
250
300
350
400
450
PET
OPS
OPLA
OPLA+40%
Time, days
(a)
(b)
(c)
Figure 4 a), b) and c). Tensile stress, elongation at break and modulus of elasticity of PET, OPS, OPLA, and OPLA+40% regrind polymer samples submerged in strong acid simulant solution.
Evaluation of OPLA, OPLA+40% regrind, PET, and OPS for Fresh Food Containers
0 1 2 3 4 5 6 7
Tens
ile st
ress
, kps
i
0.0
11.0
11.5
12.0
12.5
13.0
13.5
14.0
0 1 2 3 4 5 6 7
Elo
ngat
ion
at B
reak
, %
06
7
8
9
10
11
12
13
14
15
0 1 2 3 4 5 6 7
Mod
ulus
of E
last
icity
, kps
i
0280
290
300
310
320
330
340
350
(a)
(b)
(c)
Time, days Figure 5 a), b) and c). Tensile stress, elongation at break and modulus of elasticity of OPLA+40% regrind polymer samples submerged in vegetal oil simulant solution.
Evaluation of OPLA, OPLA+40% regrind, PET, and OPS for Fresh Food Containers
CONCLUSIONS
Based on the data collected on the four materials the following conclusions were reached.
• Table 1 shows the glass transition and melting temperatures of the four materials. PLA showed the lower glass transition temperature. OPLA showed a lower melting temperature than PET. There is not major variation of Tg and Tm between OPLA and OPLA+40% regrind.
• In terms of water vapor barrier, PET showed the best performance followed by OPS and PLA tested. In the case of oxygen barrier properties, PET showed the lowest oxygen permeability coeffients followed by OPLA and OPLA +40% regrind. OPS showed very poor oxygen barrier.
• At ambient conditions (72ºF), PET had the highest impact resistance followed by OPLA, OPS, and OPLA +40% regrind. The impact properties of PET, OPS, and OPLA+40% regrind improved at lower temperatures (below freezing) while PLA showed a lowering of dart impact resistance at these temperatures.
• OPLA+40% regrind and OPLA material showed the best modulus of elasticity, results followed by PET and OPS. These properties were also improved at lower temperature conditions.
• The results of chemical resistance tests showed that exposure of acids (pH of 6 and 2) and vegetable oils resulted in minimal strength degradation for OPLA, PET and OPS, while OPLA +40% regrind actually showed an improvement.
ACKNOWLEDGEMENTS The authors thank Wilkinson Manufacturing Company, (Fort Calhoun, NE) for the PET, OPLA, OPLA +40 %regrind and OPS samples.
REFERENCES
1. Holland SJ, Tighe BJ. Biodegradable Polymers. Advances in Pharmaceutical Sciences. London: Academic Press London; 1992:101 - 165.
2. Dorgan JR, Lehermeier HJ, Palade L-I, Cicero J. Polylactides: properties and prospects of an environmentally benign plastic from renewable resources. Macromolecular Symposia. 2001;175:55-66.
3. Drumright RE, Gruber PR, Henton DE. Polylactic acid technology. Advanced Materials. 2000;12:1841-1846.
4. Auras R, Harte B, Selke S. An Overview of Polylactides as Packaging Materials. Macromol. Biosci. 2004;4:835-864.
5. Albertsson AC, Varma IK. Recent Developments in Ring Opening Polymerization of Lactones for Biomedical Applications. Biomacromolecules. 2003; 4 (6): 1466-1486.
6. Hartmann MH. High Molecular Weight Polylactic Acid Polymers. In: Kaplan DL, ed. Biopolymers from Renewable Resources. 1 vol. Berlin: Springer - Verlag Berlin Heidelberg; 1998:367-411.
7. Tsuji H, Miyauchi S. Poly(L-lactide): 7. Enzymatic hydrolysis of free and restricted amorphous regions in poly(L-lactide) films with different crystallinities and a fixed crystalline thickness. Polymer. 2001;42:4463-4467.
Evaluation of OPLA, OPLA+40% regrind, PET, and OPS for Fresh Food Containers
8. Auras R, Harte B, Selke S, Hernandez R. Mechanical, Physical, and Barrier Properties of Poly(lactide) Films. Journal of Plastic Film and Sheeting. 2003;19:123-135.
9. Auras R, Harte B, Selke S. Effect of Water on the Oxygen Barrier Properties of Polyethylene Terephthalate and Poly(lactide) Films. Journal of Applied Polymer Science. 2004;92:1790-1803.
10. Baillie J. Yoghurt Launch for Biodegradable Pot. Packaging Week. 13 vol; 1997. 11. Whiteman N. Bio-Based Materials: A Reality in the Packaging Industry. Packexpo. Chicago, IL:
PMMI; 2002:37-42. 12. Micard V, Guilbert S. Thermal Behavior of Native and Hydrophobized Wheat Gluten, Gliadin,
and Glutenin-Rich Fractions by Modulated DSC. International Journal of Biological Macromolecules. 2000;27:229-216.
13. Miyata T, Masuko T. Crystallization behaviour of poly(L-lactide). Polymer. 1998;39:5515-5521. 14. Wunderlich B. Macromolecular Physics. 1 vol. New York: Academic Press; 1973. 15. Hernandez RJ, Giacin JR. Factors Affecting Permeation, Sorption, and Migration Processes in
Package-Product Systems. In: Taub IA, Singh RP, eds. Food Storage Stability: CRC; 1997. 16. Lehermeier HJ, Dorgan JR, Way D, J. Gas Permeation Properties of Poly(lactic acid). Journal of
Membrane Science. 2001;190:243-251. 17. Oliveira NS, Oliveira J, Gomes T, Ferreira A, Dorgan JR, Marrucho IM. Gas Sorption in
Poly(lactic acid) and Packaging Materials. Fluid Phase Equilibria. 2004;222-223:317-324.