optical flow-based segmentation of containers for automatic code recognition
TRANSCRIPT

Optical Flow-Based Segmentation of Containers for Automatic Code Recognition
Vicente Atienza, Ángel Rodas, Gabriela Andreu, and Alberto Pérez
Department of Computer Engineering, Polytechnic University of Valencia Camino de Vera s/n, 46071 Valencia, Spain
{vatienza, arodas, gandreu, aperez}@disca.upv.es
Abstract. This paper presents a method for accurately segmenting moving container trucks in image sequences. This task allows to increase the performance of a recognition system that must identify the container code in order to check the entrance of containers through a port gate. To achieve good tolerance to non uniform backgrounds and the presence of multiple moving containers, an optical flow-based strategy is proposed. The algorithm introduces a voting strategy to detect the largest planar surface that shows a uniform motion of advance. Then, the top and rear limits of this surface are detected by a fast and effective method that searches for the limit that maximizes some object / non-object ratios. The method has been tested offline with a set of pre-recorded sequences, achieving satisfactory results.
1 Introduction
Currently in most trading ports, the entering and leaving of container trucks are controlled by human inspection. Using techniques of computer vision and pattern recognition, it is possible to build systems that, placed at the gates of the port, automatically monitorize this container activity [12][13]. To achieve that, this kind of systems must be able to recognize the character code that identifies each container, usually located near the top-rear corner. The process can be quite complex: the system has to deal with outdoor scenes involving unstable lighting conditions (changes in climatology, day/night cycle) as well as with dirty and damaged container codes (See Fig. 1). It is also necessary to consider that the truck is moving when the images are acquired. These unfavourable conditions make the recognition process prone to errors.
To increase recognition ratio and performance of the system it is very useful the introduction of a previous container segmentation process. This kind of visual process makes unnecessary the installation of sensors of presence, like the light-barrier sensor used to detect the rear part of a container used in [12][13]. On the other hand, by having an adequate estimation of the top-rear corner of the container in the image it is possible to limit the code recognition process to a restricted area, instead of processing the whole image. This speeds up the recognition process and reduces the
This work has been partially supported by grant CICYT DPI2003-09173-C02-01

apparition of errors, because of the presence of less character-like forms that could be confused with true characters. Finally, by applying the container localization process to every acquired frame it is possible to track the position of the container along the sequence. This makes feasible the matching of multiple recognition results corresponding to different frames. In practice it has been observed that a given character can be correctly recognized in a frame and not recognized in other, due to the presence of moving shadows or reflections, not uniform surface structure, etc. The analysis and integration of the whole sequence can potentially obtain much better recognition results than if performed to individual, unconnected frames.
Different segmentation strategies have been tested, all of them aimed to find the top and rear limits of the moving container. Line detection by Hough transform [8] obtains relatively good results for the top limit of the container, but finds difficulties in detecting a reliable vertical line that corresponds to its rear end. This is due to the frequent presence of vertical lines in the background (buildings, other containers) and the repetitive pattern of vertical lines that usually present the surface of the containers (Fig. 2.a). To overcome the problems involved by the presence of a non-uniform background, motion detection techniques have been considered. Fast and simple techniques like image subtraction [9] offered promising results, but some problems were found due to the presence of multiple moving objects and the operation of the auto-iris lens, which induced fast brightness changes detected as false motion (Fig. 2.b). A more complex but also much more reliable motion detection-based segmentation strategy is described in the next section. It is based on optical flow computation by a block-matching procedure (see similar approaches in [4] or [5]) and the use of a voting strategy to determine dominant motion. Voting processes to estimate motion parameters or perform multiple motion segmentation are widely used in different approaches [3] [7] [10] [11]. Experimental results for the proposed optical flow-based method are also presented, which confirm the suitability of this technique for the application of interest.
Fig. 1. Examples of container codes

2 Optical flow-based segmentation
In this section we propose a segmentation strategy that achieve reliable results, overcoming the problems found by the aforementioned methods. This strategy is based on the calculation of the optical flow [1][2] derived from the comparison of two consecutive frames ( kk ff ,1− ). By considering the optical flow information and adequate object and image formation models it is possible to obtain velocity vectors for the scene points. The segmentation strategy consists on isolate the largest planar surface of the scene that presents a coherent motion of advance. Consequently, we consider as a natural assumption that the container of interest (that nearest to the camera) corresponds to that which occupies the largest portion of the image.
To estimate the dominant motion we propose the use of a parametrization strategy that allows to exploit the available a priori knowledge over the physical motion (leftward direction, maximum velocity) and structure of the target (vertical planar surface, admissible range of orientations). We use two parameters directly related to the magnitudes whose variability more strongly affects the characteristics of the observed motion field: maximum allowed advance of the truck in a frame time
)( l∆ and angle of orientation of the container surface with respect to the camera axis )(α . These real-world measures are intuitive and adequate constraints for them can
be easily obtained from the observance of truck orientations and speeds at the port gate. They can remain as adjustable parameters for the system operator, who does not need to be aware of the image-formation model and the camera calibration process.
The estimation of these parameters will be done by means of a voting strategy, detailed in Section 2.3. This voting procedure is intended to obtain a robust estimation of the dominant motion, in spite of the existence of image areas corresponding to static background and the presence of other (small) moving surfaces in the image.
(a) (b)
Fig. 2. Difficulties found by other segmentation strategies. (a) Line detection by Hough transform. It is difficult to discriminate which vertical line corresponds to the end of the container. (b) Motion detection by image subtraction. Brilliant zones correspond to high difference values. False motion appears due to the auto iris operation (static parts like the sky should be black). A second moving truck is also detected

2.1 Optical flow calculation
Optical flow vectors are obtained by measuring the displacement experimented by image blocks from image 1−kf to image kf . An optical flow vector is calculated for every 8×8 block in an 8-pixel-wide grid. To obtain the flow vector corresponding to a given block, we search for the displacement that minimizes a similarity measure. Correlation coefficient [6] has been chosen as similarity measure to achieve tolerance to brightness and contrast changes like that occurred due to the auto-iris effect. As we are only interested in containers that moves to the left, the location of the matching area in kf for every block is established in the x-direction from its position in 1−kf to a maximum leftward displacement. The height of this searching area is limited to a few pixels as we are only interested in motion parallel to the ground. Moreover, the y-component of the optical flow can not be reliably determined because the surfaces of containers frequently exhibit lack of texture variation in the y-direction.
Only blocks containing enough grey-level variation in the x-direction are considered to avoid false motion estimations. For that, we select the set )1( −kP of central points of 8×8 blocks that fulfil the following condition:
})1,(),(|),({)1(3
4
3
311 τ>−−=− ∑ ∑
+
−=
+
−=−−
y
yi
x
xjkk jifjifyxpkP (1)
Were τ is a fixed threshold value. The value for this parameter has been selected experimentally to obtain a high number of points corresponding to the container area, while avoiding the selection of low quality points in low-textured areas like the sky zone. Good results have been obtained by setting this parameter to 1.0×block size. An example of the motion field obtained by this method is shown in Fig. 3.
Fig. 3. Optical flow obtained for 8×8 blocks. To enhance clarity of figure, only vectors in a 16×16 grid are shown (25% of total flow vectors)

2.2 Object and image formation models
Fig. 4 represents the object model and the image formation model (only X and Z components are considered). T is the surface of the container, modelled as a planar surface normal to the ground plane, which forms an α angle with respect to the optical axis of the camera Z . 0Z is the distance from the image plane I to the container surface T along the optical axis Z . Vector l represents the position of a point over the container surface with respect to the container point that corresponds to the centre of the image. Vector u is the correspondent measure (x-component) observed over the image plane. f is the focal length of the lens for the pinhole model.
By the Law of Sines, it can be derived the equation
)sin()sin()( 0
γβfZl +
= (2)
where )/(arctan fu=β and βαπγ −−= . For simplicity we denote this relationship by the expression ),,,( 0 fZuLl α= or, by dropping the known model parameters: ),( uLl α= . We shall use this latter expression to indicate the conversion from image plane x-coordinate (u) to feature position over the container surface (l) in the next section.
αβ
γ
ul
f Z0
Z
X
Fig. 4. Image formation model. I: image plane, T: container surface, Z: optical axis
2.3 Estimating the motion parameters of the largest container surface
The structure and motion parameters of the container surface ),( l∆α are estimated by a voting strategy. For that, we define a voting matrix ],[ lV ∆α , with α and l∆ integers in the ranges
]90,90[ maxmax ααα +−∈ , ]1,[ max −∆−∈∆ ll

where maxα defines the maximum allowed angle deviation (in degrees) for the container surface with respect to the orientation normal to the optical axis Z, and
maxl∆ represents the maximum expected displacement (in centimetres) between consecutive frames. Then, the algorithm works as follows:
Algorithm 1 Initialize voting matrix ],[ lV ∆α to zeroes
)1( −∈∀ kPp do /*process all points for which a flow vector is available */ ]90,90[ maxmax ααα +−∈∀ do /* try all feasible values for α */
Compute ))]((,[),( ppuLpl φαα +=∆ - ))(,( puL α where:
)(•u represents the x-coordinate of a point in the image plane, according to the centred coordinate system of the image formation model
)( pφ is the optical flow vector obtained for point p if max),(0 lpl ∆≤∆< α then 1)],(,[)],(,[ +∆←∆ αααα plVplV /* Vote for (α , ),( αpl∆ ) */
Select (α̂ , l̂∆ ) | )max(]ˆ,ˆ[ VlV =∆α /*select the most voted pair */
Let }ˆ)ˆ,(|)1({ lplkPpM ∆=∆−∈= α /*select the points whose corresponding flow
vectors match with (α̂ , l̂∆ ) parameters */
Fig. 5. Optical flow vectors that correspond to the most voted pair of surface parameters.
Their base points form set M

This strategy assumes that the larger a container surface is, the greater number of optical flow vectors will correspond to it, for a given pair of (α̂ , l̂∆ ) parameters. As result of this algorithm we obtain the set M of image points whose flow vectors correspond to the largest moving surface (see example of Fig. 5).
2.4 Determining the limits of the container
As result of the previous step, we get a set of optical flow vectors that correspond to the container surface. Next, we need to determine the top and rear (right) limits of this surface. We propose an algorithm that will try to find the position of a vertical line that mark the right limit of the container and an horizontal image line that marks the top limit of this area. In other words, these lines will mark the separation between object/non-object image areas in horizontal and vertical directions.
The algorithm processes the optical flow images (8-times less resolution than the original grey-level images). This optical flow images are binarized to obtain image B in this way: a pixel ),( yxB is set to object (container surface) if the point ),( yxp belongs to M , and is set to background in other case. Then, the algorithm searches for the rear limit of the container, by maximizing a measure of object quality to the left of the tentative limit and background quality to its right:
Algorithm 2 max_quality = 0 for x_limit = image_width-1, image_width-2,…,1
leftthetopixelsbckgndleftthetopixelsobjqualityobj ____/_____ =
rightthetopixelsobjrightthetopixelsbckgndqualitybckgnd ____/_____ =
litybckgnd_qua*yobj_qualititylimit_qual = if limit_quality > max_quality then
max_quality = limit_quality; best_limit = x_limit
The algorithm that searches for the top limit works in the same way. Fig. 6 shows the limits found by means of this strategy for a frame of example.
3 Experiments and discussion
This segmentation strategy has been applied to a set of pre-recorded video sequences. A digital video camera was installed in a truck gate at the container terminal of the Valencia port (Spain). This camera was equipped with an auto-iris lens and a monochrome, non-interlaced ½” CCD sensor. The camera captured lateral views of the moving trucks in the selected lane from an approximate distance of 2 meters. Images were digitized at 768×572 pixel resolution by a computer equipped with an acquisition card and stored to hard disk. These images were corrected for the slight barrel distortion effect introduced by the 8 mm lens to assure undistorted straight lines

for container limits of the target trucks. The effect of this correction can be noticed by observing the pin cushion effect induced in distant lines like that corresponding to the street lamp to the right end of the image in Fig. 6.
To obtain numerical results, a total of 200 frames corresponding to 18 different sequences were manually inspected and the position of the top-rear corner of the container in every one of them was annotated. This working sequences were acquired under day-light illumination and included situations of multiple moving trucks, cluttered backgrounds and fast global illumination changes. These changes are due to the auto iris operation to compensate for the light increase caused by the motion of a truck that progressively uncovers part of the sky zone. Table 1 shows mean values and standard deviation of errors obtained in the automatic estimation of the corner points for these sequences (errors are computed with respect to the manually estimated position of the points).
Table 1. Statistics for errors committed in the estimation of corner position (pixels)
mean error std. deviation
x-direction -2.2 8.4
y-direction 2.8 7.5
Fig. 7 shows results obtained for two of the processed sequences. The figure
depicts segmentation results corresponding to cases for which other segmentation methods found difficulties due to the presence of vertical lines in the background and
Fig. 6. Top and rear limits found for the container area
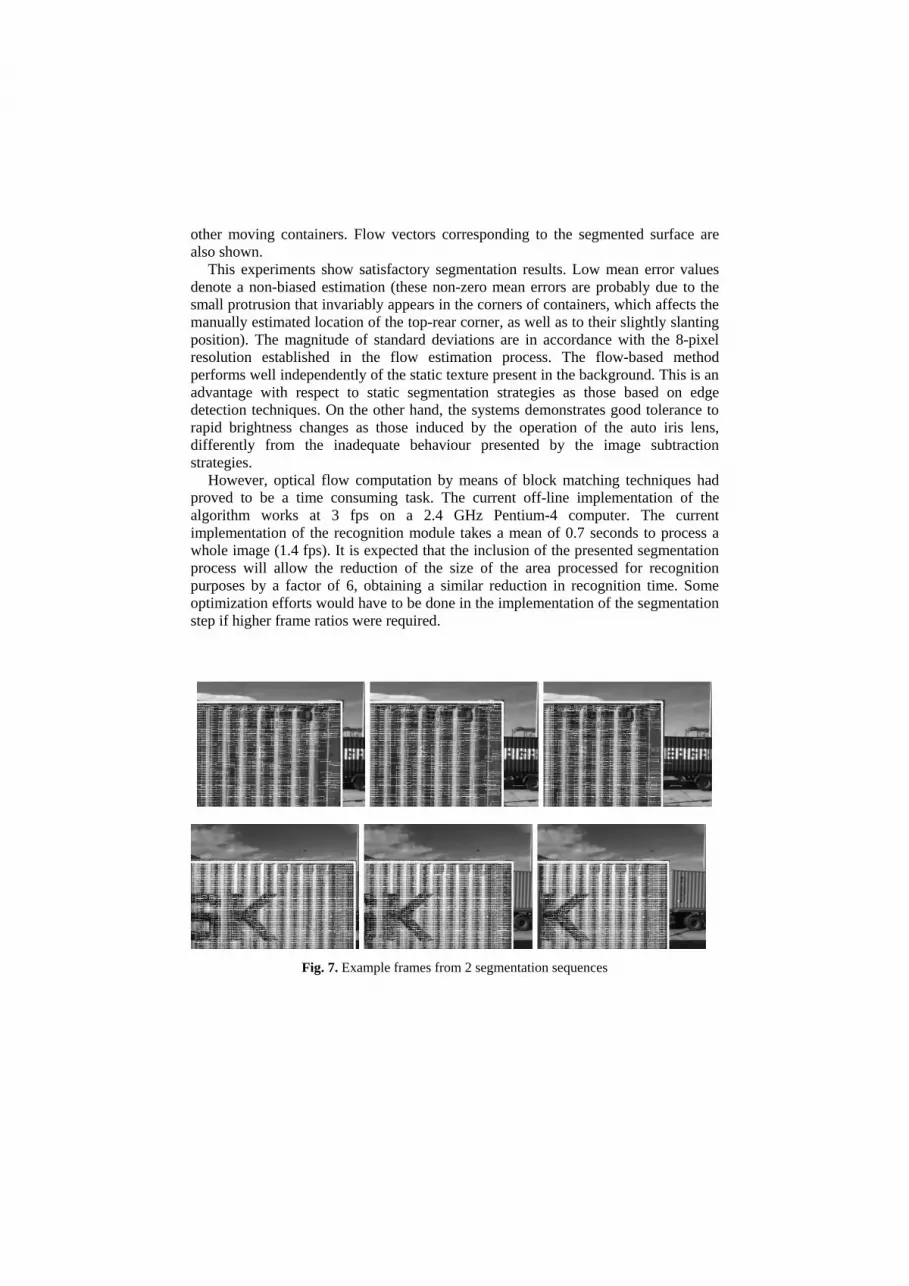
other moving containers. Flow vectors corresponding to the segmented surface are also shown.
This experiments show satisfactory segmentation results. Low mean error values denote a non-biased estimation (these non-zero mean errors are probably due to the small protrusion that invariably appears in the corners of containers, which affects the manually estimated location of the top-rear corner, as well as to their slightly slanting position). The magnitude of standard deviations are in accordance with the 8-pixel resolution established in the flow estimation process. The flow-based method performs well independently of the static texture present in the background. This is an advantage with respect to static segmentation strategies as those based on edge detection techniques. On the other hand, the systems demonstrates good tolerance to rapid brightness changes as those induced by the operation of the auto iris lens, differently from the inadequate behaviour presented by the image subtraction strategies.
However, optical flow computation by means of block matching techniques had proved to be a time consuming task. The current off-line implementation of the algorithm works at 3 fps on a 2.4 GHz Pentium-4 computer. The current implementation of the recognition module takes a mean of 0.7 seconds to process a whole image (1.4 fps). It is expected that the inclusion of the presented segmentation process will allow the reduction of the size of the area processed for recognition purposes by a factor of 6, obtaining a similar reduction in recognition time. Some optimization efforts would have to be done in the implementation of the segmentation step if higher frame ratios were required.
Fig. 7. Example frames from 2 segmentation sequences

References
[1] Anandan, P., A Computational Framework and an Algorithm for the Measurement of Visual Motion, Int. J. on Comp. Vision , Vol.2 (1989) 283–310
[2] Barron, J.L., Fleet, D.J., Beauchemin, S.S., Performance of optical flow techniques, International Journal of Computer Vision, Vol. 12, n. 1, (1994) 43–77
[3] Bober, M., Kittler, J., Estimation of Complex Multimodal Motion: An Approach Based on Robust Statistics and Hough transform, Image and Vision Computing, Vol. 12 (1994) 661–668
[4] Coifman, B., Beymer, D., McLauchlan, P., Malik, J., A Real-Time Computer Vision System for Vehicle Tracking and Traffic Surveillance, Transportation Research: Part C, Vol 6, no 4 (1998), 271–288
[5] Di Stefano, L., Viarani, E., Vehicle Detection and Tracking Using the Block Matching Algorithm, Proc. of "3rd IMACS/IEEE Int'l Multiconference on Circuits, Systems, Communications and Computer, Vol. 1 (1999) 4491–4496
[6] Gonzalez, R. C., Woods, R. E., Digital Image Processing, Addison-Wesley (1993) [7] Hill, L., Vlachos, T., Optimal Search in Hough Parameter Hyperspace For Estimation of
Complex Motion in Image Sequences, IEE Proc.-Vis. Image Signal Process., Vol. 149, n. 2 (2002) 63–71
[8] Illingworth, J., Kittler, J., A Survey of the Hough Transform. Computer Vision, Graphics, Image Processing, Vol. 44 (1988) 87–116
[9] Jain, R. C., Difference and Accumulative Difference Pictures in Dynamic Scene Analysis, Image and Vision Computing, Vol. 12, n. 2 (1984) 99–108
[10] Kang, E.-Y., Cohen, I., Medioni, G., Non-Iterative Approach to Multiple 2D Motion Estimation, Int. Conf. on Pattern Recognition (ICPR’04), Vol. 4 (2004) 791–794
[11] Nicolescu, M., Medioni, G., A Voting-Based Computational Framework for Visual Motion Analysis and Interpretation, IEEE Transactions on Pattern Analysis and Machine Intelligence, Vol. 27, n. 5 (2005) 739–752
[12] Salvador, I., Andreu, G., Pérez, A., Detection of identifier code in containers, IX Spanish Symposium on Pattern Recognition and Image Analysis, Vol. 2 (2001) 119–124
[13] Salvador, I., Andreu, G., Pérez, A., Preprocessing and Recognition of Characters in Containers Codes, Proceeding of the International Conference on Pattern Recognition (ICPR-2002) (2002) 101–105