evaluation of genetic algorithm-generated multivariate color tables for the visualization of...
TRANSCRIPT
2008 IEEE Nuclear Science Symposium Conference Record
Evaluation of Genetic Algorithm-GeneratedMultivariate Color Tables for the Visualization of
Multimodal Medical Fused Data Sets
Karl G. Baum, Member, IEEE, Maria Helguera, Member, IEEE, Evan Schmidt,Kimberly Rafferty, and Andrzej Krol, Senior Member, IEEE
M06-449
Abstract- Application of a multimodality imaging approach isadvantageous for detection, diagnosis, and management of manyailments. Display is limited to two or three dimensions whenusing spatial relationships alone. The use of color, in addition tospatial relationships increases the dimensionality of the data thatcan be effectively visualized. A genetic algorithm has beendeveloped to automatically generate color tables satisfyingdefined requirements for the fused display of high-resolution anddynamic contrast-enhanced magnetic resonance imaging andF18-FDG positron emission tomography data sets. Radiologistswere asked to evaluate images created using several differentfusion-for-visualization techniques. The study determinedradiologists' preference, ease of use, understanding, efficiency,and accuracy when reading images using each technique. Thegenetic algorithm generated color tables were rated as thepreferred ones.
I. INTRODUCTION
Color tables provide a convenient way to take a number ofgrayscale images and display them as a single color image.
The color table provides a function from the grayscale valuesin the images to the colors that should be displayed. In thispaper the use of two-dimensional color tables for thepresentation of combined PET and MRI images is explored.The hope is that displaying them as a single image, and clearlypresenting the spatial relationships between the two, willincrease the clinical utility of the images, improving bothreading accuracy and efficiency.
When selecting a color table the choice should be bothapplication and observer dependent. It is also necessary toconsider environmental factors that affect how observers willperceive the displayed colors.
It is well known that various vision deficiencies, such asdeuteranomaly, influence how individuals perceive color.This means that in general there will not be a color table that isideal for everyone. Even among those without any
Manuscript received November 7, 2008. This work was supported in partby the College of Science at the Rochester Institute of Technology, theChester F. Carlson Center for Imaging Science at the Rochester Institute ofTechnology, and Kodak.
K. G. Baum (email: [email protected]), K. Rafferty, and M. Helguera(email: [email protected]) are with the Chester F. Carlson Center forImaging Science at the Rochester Institute of Technology, Rochester, NY14623 USA.
E. Schmidt was with the Rochester Institute of Technology, Rochester, NY14623 USA, during summer break from Honeoye Falls-Lima High School,Honeoye Falls, NY 14472 USA, and now attends Purdue University, IN47907 USA.
A. Krol is with the Radiology Department at SUNY Upstate MedicalUniversity, Syracuse, NY 13210 USA.
documented vision deficiencies, the choice of the optimalcolor table will vary with factors such as experience andtraining.
The viewing conditions also playa role in selecting themost appropriate color table. This includes conditions such asthe lighting in the room, the color of the background, and thegamma and black offset of the display device.
When generating color tables using the genetic algorithmdescribed in this paper a controlled viewing environment,calibrated display, and observers with normal vision areassumed. Gamma corrections as well as other corrections forviewing conditions will be applied to the color table prior todeploying it into the environment. The color tables generatedare intended for a general audience, and are not tuned towardsanyone individual. This has to be so if the color tables are tobe deployed in a clinical setting.
When designing color tables, it is a necessity to consider thetask that the images produced by the application of the colortable are going to be used for. A full demonstration of how aproperly designed color table can aid a task while animproperly designed one can complicate matters can be foundin [I]. In consequence, it is first necessary to define the task athand and then the requirements of the color tables that will aidin this task.
A. The Problem
Application of a multimodality approach is advantageousfor detection, diagnosis and management of breast cancer. Inthis context, F-I8-FDG positron emission tomography (PET)[2, 3], and high-resolution and dynamic contrast-enhancedmagnetic resonance imaging (MRI) [4, 5] have steadily gainedclinical acceptance. Initial experience with combined PET(metabolic imaging) and x-ray computed tomography (CT,anatomical localization) has demonstrated sizableimprovements in diagnostic accuracy, allowing betterdifferentiation between normal and pathological uptake and byproviding positive finding in CT images for lesions with lowmetabolic activity [3].
Obtaining the spatial relationships between these modalitiesand conveying them to the observer maximizes the benefit thatcan be achieved. The process of obtaining the spatialrelationships and manipulating the images, so thatcorresponding voxels in them represent the same physicallocation is called registration [6, 7].
The next step is the visualization of the data. Traditionallythe registered images are displayed side by side. However, it
978-1-4244-2715-4/08/$25.00 ©2008 IEEE 4355
Authorized licensed use limited to: Rochester Institute of Technology. Downloaded on February 12, 2009 at 14:01 from IEEE Xplore. Restrictions apply.
(1)
is believed that a combined MRI/PET display may be morebeneficial. The advantage of a combined image lies in ourinability to visually judge spatial relationships between imageswhen they are viewed side by side. Depending on backgroundshades and colors, identical shapes and lines may appear to bedifferent sizes [8]. The fact that the spatial relationshipsbetween the modalities can better be ascertained from acombined display drives this research.
The process of combining the MRI and PET 3D images intoa single 3D image is called image fusion. The color tablesgenerated and studied in this work are to be used to createfused MRI/PET images.
B. Fusion Techniques for Visualization
Much research has been devoted to discover new andoptimum ways to take two images and display them as a singleone. These techniques include color overlay, color mixing,techniques based directly on color spaces, and spatial andtemporal interlacing. For a review of these techniques see [9].Usually, these techniques are applied to the data and theresults are compared in order to determine the bestvisualization technique.
An interesting fact is that a two dimensional color table canbe used to implement all of these techniques with theexception of interlacing. This facilitates an alternativeapproach to discovering the best visualization technique.Trying out each visualization technique and determiningoptimum parameters is time consuming, instead this paperproposes to focus on finding the best two-dimensional colortable.
This is not a new approach and a lot of effort has beenexpended on studying the design of color tables, how variousproperties of them affect the perception of the displayedimages, the role the images that the color table is beingapplied to play, and on techniques to compare the color tables[1,10,11].
C. Drawbacks ofthe Color Table Approach
Color tables are often created by hand, and are usuallyevaluated by humans. The biggest drawbacks of this approachare that the color tables tend to be large, and that it is onlyfeasible to evaluate a small number of them.
The size of the color table depends on the number ofdiscrete values in the sources to be displayed, and the numberof colors the display device has access to. For example ifthere are two 8-bit sources, there will be 256*256 entries inthe color table. Assuming an 8-bit display, each entry can beone of256*256*256 colors.
Considering every color for each entry is a nearlyimpossible task for a human. This problem is usually avoidedby selecting and using one of the previously mentioned fusionfor-visualization techniques. The problem with taking one ofthese approaches is that only a small set of the possible colortables are considered. In this paper a new genetic algorithmbased color table creation method is introduced. In theory,this method will search through the space containing all
possible color tables in order to produce one that bestrepresents a set of criteria.
This paper also presents a simple technique for automaticevaluation of color tables. While this technique is not meantto replace human evaluation, it can be used to pre-evaluate alarge set of color tables, guiding the genetic algorithm inselecting color tables for human review.
II. GENETIC ALGORITHM-GENERATED COLOR TABLES
A. Extension ofColor Mixing
Color mixing is a technique discussed in [9] that can beused to take any number of one channel images (N) and createa fused RGB image, where R, G, B, represent the red, green,and blue channels in the displayed image respectively. Let Sirepresent the intensity in the lh source image, and Ri, Gi, Bi theweighting factors for the red, green, and blue channelsrespectively. The contribution of source i to each of theoutput channels is determined by Eq. 1:
{
RI GI BI]
(R, G, B, ( )
SIS2 ···S,v :~ :~ :- = R,G,B
R,\, G.....' BJV
Assuming source intensities to be normalized from zero toone, (1) is equivalent to taking the intensity axis of source iand lying it along the line segment formed by connecting(0,0,0) to (Ri,Gi,Bi) in the RGB color space.
This technique can be extended by using an offset so thatthe vectors (Ri,Gi,Bi) do not need to be located at the origin asstated in Eq. 2:
(R,G,B) = (t(S,R, +ORi)' t(s,G, +0,,,1 t(S,B, +OB,)} (2)
where OXi represents the offset from the origin along the Xaxis for the contribution from source i.
B. Color Differences
Before an algorithm which generates color tables can becreated, there needs to be a way to quantitatively defineguidelines or requirements to be used when generating thecolor tables. The result of evaluating a color table with theseguidelines will be the fitness factor used to determine thereproduction of the color tables within the genetic algorithm.
To aid in defining these guidelines a way to determine thedifference between two colors is first introduced.Traditionally this difference is defined as the Euclideandistance between the two colors in the CIE L*a*b* space andis given by Eq. 3:
L1E = J(!lL*)2 + (Aa*)2 + (,M*)2 (3)
The validity of this Eq. 3 comes from the assumption thatthe CIE L*a*b* color space is uniform. It has been shownthat this assumption is not quite true [12]. For this reason wechoose to use the more recently developed computationallyefficient measurement used by CompuPhase in theirPaletteMaker application [13]:
4356
Authorized licensed use limited to: Rochester Institute of Technology. Downloaded on February 12, 2009 at 14:01 from IEEE Xplore. Restrictions apply.

The ~C in Eq. 4 is the difference between the two colors
defined in RGB space as (C1,R, C1,(J, G1,B) and(C2,R, C2,(J, G2,B), where CX,y is the value for the yth channelfor the Xth color, and has values from 0 to 255. For furtherdiscussion of this metric see [14].
C. Color Table Requirements
This definition of color difference is aids in defining therequirements for the color tables which follow.
1) Color Table should be in the RGB Color SpaceIt was decided that the color tables produced need to be
defined in the 8-bit per channel RGB color space supported bymost applications. This is required in order to facilitate easyuse and guaranteed compatibility of the color tables produced.This was taken into consideration when selecting the formulafor color differences.
2) Color Table should satisfy the Order PrincipleIn [15] Trumbo defines several desirable properties of color
tables. One of these is the order principle. Basically if a colortable satisfies the order principle, then the colors chosen torepresent the data values should be perceived as ordered in thesame order as the data values. This rules out spectral colortables where large variations of hue occur. This is importantbecause the pixel values in the original medical data representphysical quantities, such as the concentration of F-18 decay inthe PET images. This is the information radiologists need tohave, if one pixel is shown as blue and another red, theradiologists will be unable to determine which pixel has ahigher concentration without referring to the color table.While the color table will not be a secret from the radiologistevaluating the fused data, the less they need to refer to thecolor table the more efficiently they can examine the data.
Also, a side effect of a color table not satisfying the orderprinciple is that the color table often creates falsesegmentation when applied to the image. The color contourscreated in the image emphasize particular pixel values.
To guarantee that the order principle is satisfied, arepresentation of the color table based on the color mixingtechnique introduced [9] and previously discussed here is usedby the algorithm.
3) Color Table should satisfy the Rows and ColumnsPrinciple
The rows and columns principle is also defined by Trumboin [15]. It states that the colors in the color table should bechosen so that two source images do not obscure one another.
This is particularly important in this situation. Each of theinput images and their gray levels mean something to theradiologist. This meaning needs to be preserved in the fused
images. The radiologist needs be able to tell the intensity ofeach of the source images by examining the fused image.
This is ensured by making the color's one dimensional colortables corresponding to each source as different as possiblefrom each other. In other words, the first row of the colortable should consist of colors as different as possible from thefirst column. This can quantitatively be measured bymaximizing ~C, in Eq. 4, for the average color in the firstrow of the table and the average color for the first column inthe table. Due to the linear model of the color mixingtechnique this property will then be distributed throughout therest of the color table.
4) Color Table should be Perceivably UniformThe ideal color table should be perceivably uniform. In
other words the ~C between neighboring entries in the colortable should be a constant throughout the table. This can bemeasured by finding ~C for all neighbors and then examiningits variance. The smaller the variance the better.
This is an important factor because it minimizes the relianceon the color table, due to the fact that the radiologist'sintuition about the location of the color in the color table ismore likely to be correct.
5) The Contrast for Each Source should be MaximizedThe contribution from each source should have as much
contrast as possible. As contrast increases for a source it getseasier to see the variations in the fused image due to thatsource. Due to using the color mixing model we need only toexamine the endpoints of the first row and column of the colortable to know the range of colors available for each of thesources to use.
Maximizing ~C between the first entry in the first columnand the last entry in the first column of the color table willmaximize the contrast for the first source. Similarly,maximizing ~C between the first entry in the first row andthe last entry in the first row of the color table will maximizethe contrast for the second source.
As a final measure to ensure good contrast throughout thecolor table it is desirable to have the contrast along thediagonal of the color table maximized. This is done bymaximizing baC for the first entry in the first row and columnof the color table and the last entry in the last row and columnof the color table.
D. Desirable Properties Not Considered
It should be noted that in the current implementation thealgorithm does not consider all of the desired properties of acolor table. For example no preference is given to anyparticular color. Humans may find some colors easier to lookat and examine for long periods of time than others.
Simultaneous contrast and chromatic contrast effects asdescribed in [10] are not considered. These effects describehow the appearance of a particular color may change based onthe surrounding colors in the image.
4357
Authorized licensed use limited to: Rochester Institute of Technology. Downloaded on February 12, 2009 at 14:01 from IEEE Xplore. Restrictions apply.

Generate Initial Population
Determine Fitness of Each Chromosome
Create Offspring bySplicing of
Chromosomes Selectedwith Probabilities
Proportional to their
Create Offspring byMutation of a ChromosomeSelected with a ProbabilityProportional to its Ranking
true
Create Offspring byReplication of HighestRanked Chromosomes
Highest Ranked ChromosomeDefines Best Fusion Technique
E. Genetic Algorithm
A relatively simple and standard genetic algorithm is usedfor the generation of the color tables. Each color table isdefined by 12 real numbers that have a range from -1 to 1.These numbers represent the following variables from Eq. 2:R1, ORl, G 1, OGI, Bf, OBI, R2, 0R2, G2, 0R2, B2, OB2. Thesecoefficients when used with the color mixing equationcompletely define a color table.
The algorithm is represented by Fig. 1. To start, an initialpopulation of color tables is randomly generated. An iterativeloop is then entered. Each member of the population is thenevaluated and ranked based on the requirements of the desiredcolor table. A new population is then generated, where thecontribution from each member of the previous generation tothe new generation is based upon its ranking. This process isrepeated for a large number of iterations.
Color tables are tested based on the requirements outlined inSection II.C. The numeric results of the evaluation of a givencolor table can then be weighted and summed to give thefitness score for that member of the population.
Fig. 1. Flow chart of genetic algorithm used to identify appropriate color tables.
Another effect that the human visual system has on images The members of the current generation with the highestthat is usually ignored is that the color of an object influences fitness scores are automatically included in the nextits perceived size [16, 17]. For example, if we color a lesion generation. The rest of the members in the next generation arered-purple it would appear larger than if it had been colored created by splicing or mutating the members in the currentgreen. population.
When creating a population member by mutation, a memberof the previous generation is chosen randomly with aprobability proportional to its fitness score. The newpopulation member is then created from the old one bymaking one or two random changes to its definingcoefficients.
When creating a population member by splicing, twomembers of the previous generation are chosen at random witha probability proportional to their fitness scores. The newpopulation member is generated by taking the first Xcoefficients of it from the first chosen member and remaining12-X coefficients from the second member. The point ofsplicing, X, which determines the amount of each of thechosen color tables that gets transferred to the new color table,is chosen at random.
For the stopping criteria the algorithm can be halted whenthe member with the highest fitness score does not change fora number of generations. There is no fear of running thealgorithm for too many generations due to the nature of theproblem.
4358
Authorized licensed use limited to: Rochester Institute of Technology. Downloaded on February 12, 2009 at 14:01 from IEEE Xplore. Restrictions apply.
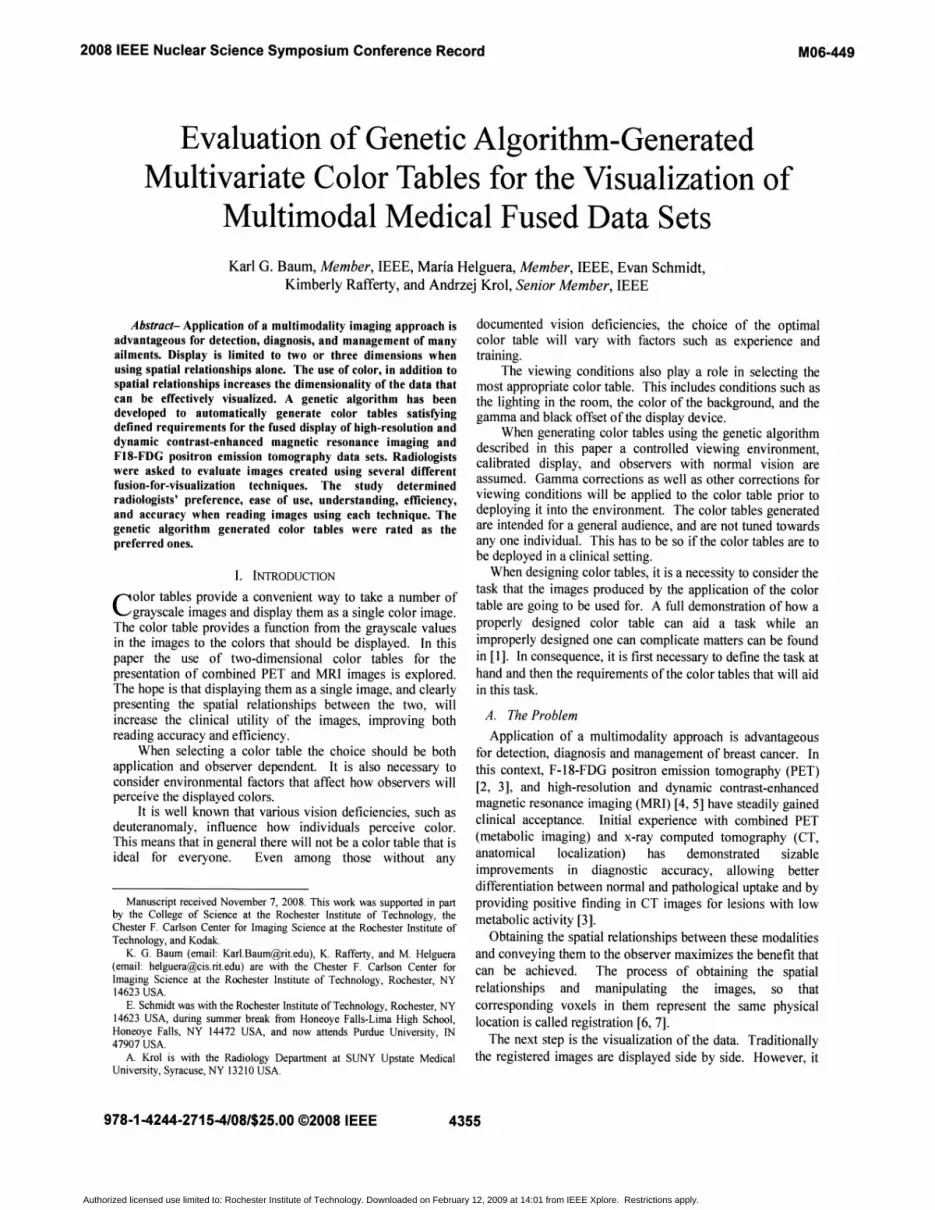
After the algorithm has finished executing, the member ofthe final population with the highest fitness score representsthe 'best' color table that the algorithm could come up with.The algorithm can be run several times to get a set of colortables that can then be evaluated by human observers. Anexample of a color table created with the algorithm and theresulting fused image, along with the source MRI and PETimages are shown in Fig. 2. The fused images were createdusing the KGB Fusion Viewer software package [15].
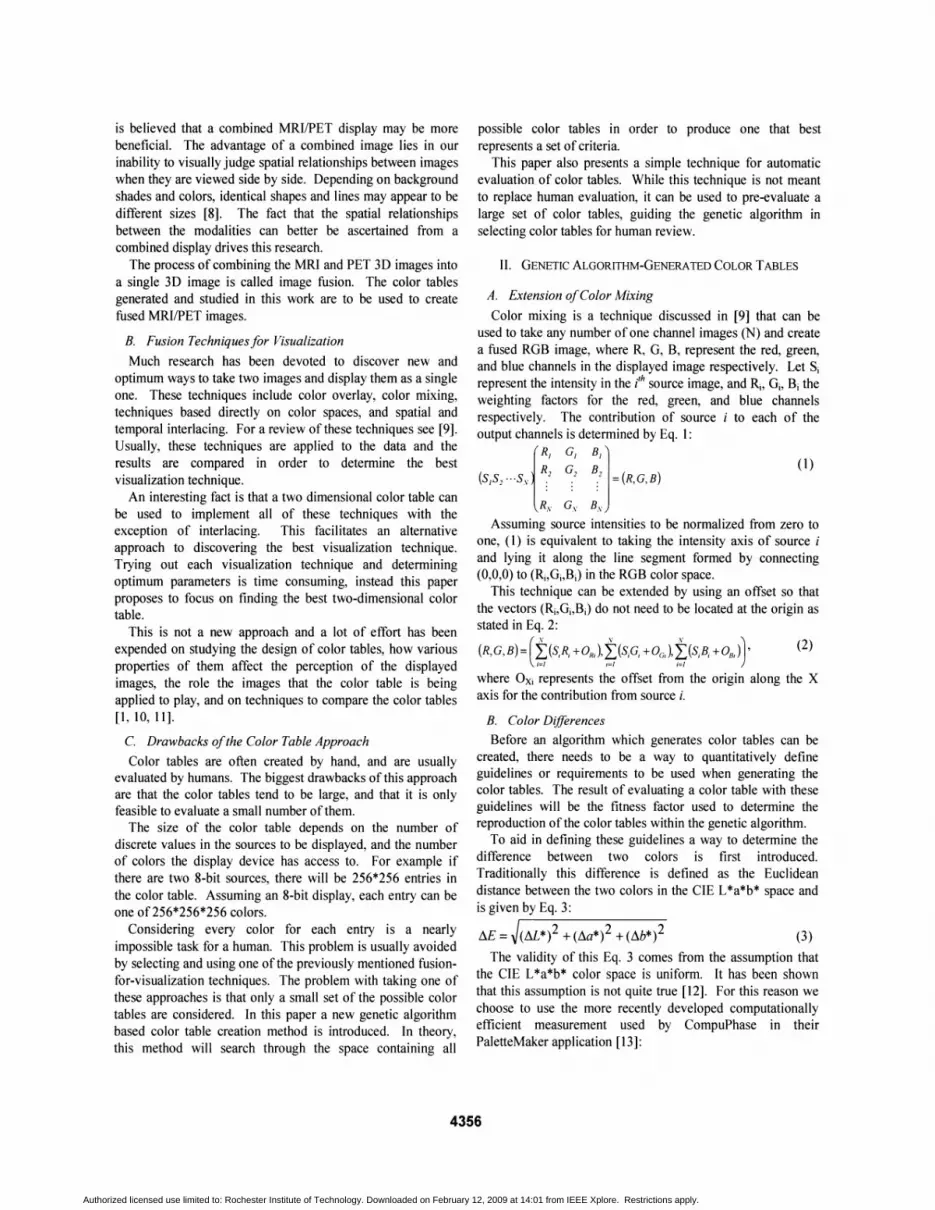
Fig. 4. Interface used by radiologists to evaluate the fusion techniques.
o 1 234 5 6 7 8 9Image Number
Fig. 5. Distance in pixels between corresponding locations in PET andMRI gray scale images.
I f I f I I I
20en~ 15SQ)
g 10coeni:5 5
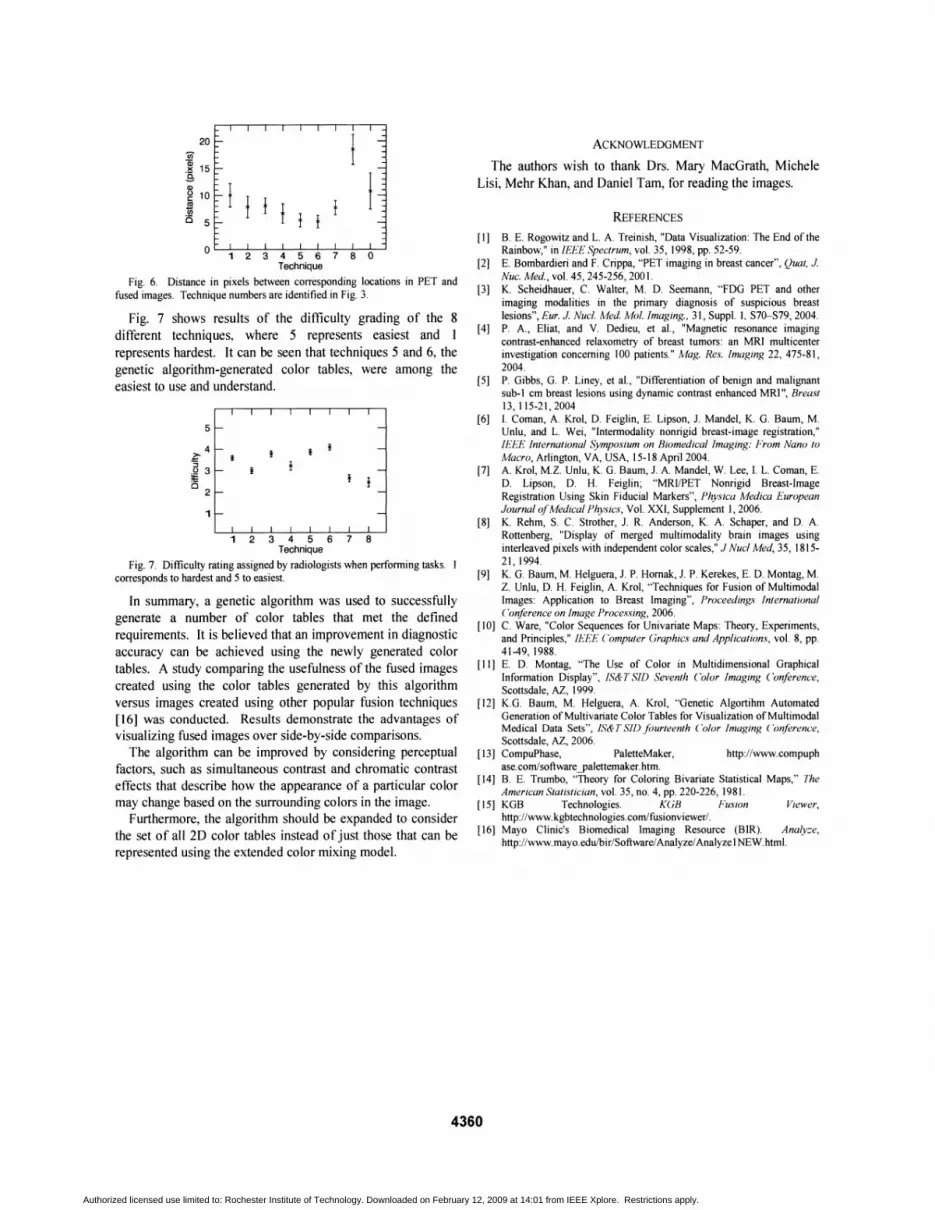
Fig. 6, on the other hand, shows the distance in pixelsbetween the location of the area of maximum metabolicactivity selected on the fused image and the correspondinglocation selected on the gray scale PET image for each of the8 studied visualization techniques. Technique 0 represents thedistance between the locations found in the PET and MRIimages, Le., the average over the nine images represented inFig. 5. It can be seen that the average distance is reducedparticularly with techniques 5 and 6, which correspond to thetwo color tables generated by the genetic algorithm describedin Section III. Almost any fusion technique provides benefitsover only displaying the PET and MRI images side by side(Technique 0 on Fig. 6).
IV. RESULTS AND CONCLUSIONS
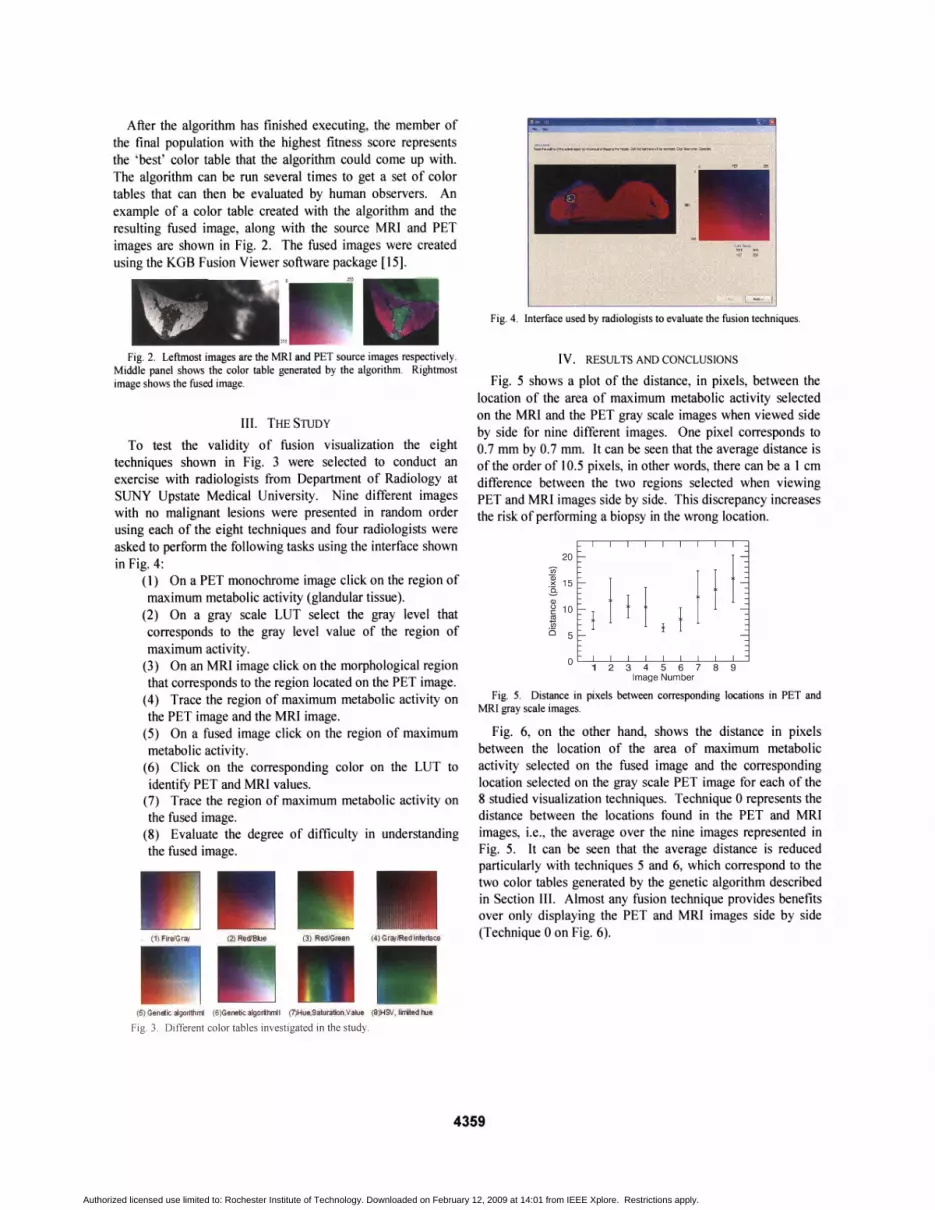
Fig. 5 shows a plot of the distance, in pixels, between thelocation of the area of maximum metabolic activity selectedon the MRI and the PET gray scale images when viewed sideby side for nine different images. One pixel corresponds to0.7 mm by 0.7 mm. It can be seen that the average distance isof the order of 10.5 pixels, in other words, there can be a 1 cmdifference between the two regions selected when viewingPET and MRI images side by side. This discrepancy increasesthe risk of performing a biopsy in the wrong location.
III. THE STUDY
To test the validity of fusion visualization the eighttechniques shown in Fig. 3 were selected to conduct anexercise with radiologists from Department of Radiology atSUNY Upstate Medical University. Nine different imageswith no malignant lesions were presented in random orderusing each of the eight techniques and four radiologists wereasked to perform the following tasks using the interface shownin Fig. 4:
(1) On a PET monochrome image click on the region ofmaximum metabolic activity (glandular tissue).
(2) On a gray scale LUT select the gray level thatcorresponds to the gray level value of the region ofmaximum activity.
(3) On an MRI image click on the morphological regionthat corresponds to the region located on the PET image.
(4) Trace the region of maximum metabolic activity onthe PET image and the MRI image.
(5) On a fused image click on the region of maximummetabolic activity.
(6) Click on the corresponding color on the LUT toidentify PET and MRI values.
(7) Trace the region of maximum metabolic activity onthe fused image.
(8) Evaluate the degree of difficulty in understandingthe fused image.
Fig. 2. Leftmost images are the MRI and PET source images respectively.Middle panel shows the color table generated by the algorithm. Rightmostimage shows the fused image.
(5) Genetic 8gorithm (6)Genetic aI90rltmt (7)Hue,Saturation,ValIe (8)H&1••irited tile
Fig. 3. Different color tables investigated in the study.
4359
Authorized licensed use limited to: Rochester Institute of Technology. Downloaded on February 12, 2009 at 14:01 from IEEE Xplore. Restrictions apply.
20en~ 158:Q) Ig 10 I I~ 5 I I f
o 123 4 5 6 7 8 0Technique
Fig. 6. Distance in pixels between corresponding locations in PET andfused images. Technique numbers are identified in Fig. 3.
Fig. 7 shows results of the difficulty grading of the 8different techniques, where 5 represents easiest and 1represents hardest. It can be seen that techniques 5 and 6, thegenetic algorithm-generated color tables, were among theeasiest to use and understand.
5
~4
~ 3:;:is
2
1
2 3 4 5 6 7 8Technique
Fig. 7. Difficulty rating assigned by radiologists when performing tasks.corresponds to hardest and 5 to easiest.
In summary, a genetic algorithm was used to successfullygenerate a number of color tables that met the definedrequirements. It is believed that an improvement in diagnosticaccuracy can be achieved using the newly generated colortables. A study comparing the usefulness of the fused imagescreated using the color tables generated by this algorithmversus images created using other popular fusion techniques[16] was conducted. Results demonstrate the advantages ofvisualizing fused images over side-by-side comparisons.
The algorithm can be improved by considering perceptualfactors, such as simultaneous contrast and chromatic contrasteffects that describe how the appearance of a particular colormay change based on the surrounding colors in the image.
Furthermore, the algorithm should be expanded to considerthe set of all 2D color tables instead of just those that can berepresented using the extended color mixing model.
ACKNOWLEDGMENT
The authors wish to thank Drs. Mary MacGrath, MicheleLisi, Mehr Khan, and Daniel Tam, for reading the images.
REFERENCES
[1] B. E. Rogowitz and L. A. Treinish, "Data Visualization: The End of theRainbow," in IEEE Spectrum, vol. 35, 1998, pp. 52-59.
[2] E. Bombardieri and F. Crippa, "PET imaging in breast cancer", Quat, J.Nuc. Med., vol. 45,245-256,2001.
[3] K. Scheidhauer, C. Walter, M. D. Seemann, "FDG PET and otherimaging modalities in the primary diagnosis of suspicious breastlesions", Eur. J. Nucl. Med. Mol. Imaging., 31, Suppl. 1, S70-S79, 2004.
[4] P. A., Eliat, and V. Dedieu, et aI., "Magnetic resonance imagingcontrast-enhanced relaxometry of breast tumors: an MRI multicenterinvestigation concerning 100 patients." Mag. Res. Imaging 22, 475-81,2004.
[5] P. Gibbs, G. P. Liney, et aI., "Differentiation of benign and malignantsub-l em breast lesions using dynamic contrast enhanced MRI", Breast13, 115-21,2004
[6] I. Coman, A. Krol, D. Feiglin, E. Lipson, 1. Mandel, K. G. Baum, M.Unlu, and L. Wei, "Intermodality nonrigid breast-image registration,"IEEE International Symposium on Biomedical Imaging: From Nano toMacro, Arlington, VA, USA, 15-18 April 2004.
[7] A. Krol, M.l. Unlu, K. G. Baum, 1. A. Mandel, W. Lee, I. L. Coman, E.D. Lipson, D. H. Feiglin; "MRVPET Nonrigid Breast-ImageRegistration Using Skin Fiducial Markers", Physica Medica EuropeanJournal ofMedical Physics, Vol. XXI, Supplement 1, 2006.
[8] K. Rehm, S. C. Strother, 1. R. Anderson, K. A. Schaper, and D. A.Rottenberg, "Display of merged muItimodality brain images usinginterleaved pixels with independent color scales," J Nucl Med, 35, 181521,1994.
[9] K. G. Baum, M. Helguera, 1. P. Hornak, 1. P. Kerekes, E. D. Montag, M.l. Unlu, D. H. Feiglin, A. Krol, "Techniques for Fusion of MuItimodalImages: Application to Breast Imaging", Proceedings InternationalConference on Image Processing, 2006.
[10] C. Ware, "Color Sequences for Univariate Maps: Theory, Experiments,and Principles," IEEE Computer Graphics and Applications, vol. 8, pp.41-49, 1988.
[11] E. D. Montag, "The Use of Color in Multidimensional GraphicalInformation Display", IS&T SID Seventh Color Imaging Conference,Scottsdale, AZ, 1999.
[12] K.G. Saum, M. Helguera, A. Krol, "Genetic Algortihm AutomatedGeneration of MuItivariate Color Tables for Visualization of MultimodalMedical Data Sets", IS&T SID fourteenth Color Imaging Conference,Scottsdale, AZ, 2006.
[13] CompuPhase, PaletteMaker, http://www.compuphase.com!software-I'alettemaker.htm.
[14] B. E. Trumbo, "Theory for Coloring Bivariate Statistical Maps," TheAmerican Statistician, vol. 35, no. 4, pp. 220-226, 1981.
[15] KGB Technologies. KGB Fusion Viewer,http://www.kgbtechnologies.com!fusionviewer/.
[16] Mayo Clinic's Biomedical Imaging Resource (BIR). Analy=e,http://www.mayo.edu/bir/Software/Analyze/AnalyzelNEW.html.
4360
Authorized licensed use limited to: Rochester Institute of Technology. Downloaded on February 12, 2009 at 14:01 from IEEE Xplore. Restrictions apply.