some information on preparing tables tables - citeseerx
TRANSCRIPT

FRDC 2005/083 FINAL REPORT
REGIONAL IMPACT ASSESSMENT FOR THE MARINE PROTECTED AREAS PROPOSED FOR THE SOUTH-EAST REGION
Colin Buxton, Malcolm Haddon & Matt Bradshaw
February 2006

National Library of Australia Cataloguing-in-Publication Entry
Buxton, Colin David, 2006 –
Regional impact assessment for the marine protected areas proposed for the south-east region Bibliography Includes index ISBN 0 9577587 6 6
This report was prepared by TAFI to assist with the identification of the impacts associated with Commonwealth proposed MPAs for the South-east Region. The views opinions expressed in this report are those of the author/s and not necessarily those of the Tasmanian Aquaculture and Fisheries Institute or the University of Tasmania. The University of Tasmania does not accept any responsibility for the contents of this report, and shall not be liable for any loss or damage that may be occasioned directly or indirectly through the use or, or reliance on, the contents of this publication. Enquires should be directed to: Prof Colin Buxton Director Tasmanian Aquaculture and Fisheries Institute University of Tasmania Private Bag 49, Hobart, Tasmania 7001 © The Tasmanian Aquaculture and Fisheries Institute, University of Tasmania 2006. Copyright protects this publication. Except for purposes permitted by the Copyright Act, reproduction by whatever means is prohibited without the prior written permission of the Tasmanian Aquaculture and Fisheries Institute.
Table of Contents
iii TAFI Final Report – FRDC 2005/083
Table of Contents
NON TECHNICAL SUMMARY........................................................................................................ 1
ACKNOWLEDGEMENTS ................................................................................................................. 6
1 BACKGROUND ............................................................................................................... 7 1.1 OVERVIEW OF THE PROPOSED MPAS IN THE SOUTH-EAST REGION...................................... 9 1.1.1 The South-east region ..................................................................................................... 9 1.1.2 Commercial fisheries (extract from National Oceans Office 2004)................................ 9 1.1.3 The Marine Provinces and Geomorphology of the SE Region ..................................... 11 1.1.4 The proposed candidate MPAs in the SE Region ......................................................... 12 2 NEED ............................................................................................................................... 19
3 OBJECTIVES ................................................................................................................. 19
4 METHODS ...................................................................................................................... 19 4.1 CATCH ESTIMATES............................................................................................................. 19 4.1.1 Spatial Processing of State Data ................................................................................... 21 4.1.2 Spatial Processing of Commonwealth Logbook Data................................................... 21 4.1.3 Database Validation Check ........................................................................................... 23 4.2 SOCIO-ECONOMICS............................................................................................................. 23 4.3 DEVELOPING ALTERNATIVE OPTIONS ................................................................................. 25 5 RESULTS AND DISCUSSION ..................................................................................... 26 5.1 IMPACTS OF EACH CANDIDATE MPA.................................................................................. 26 5.1.1 Murray........................................................................................................................... 27 5.1.1.1 Description................................................................................................................................ 27 5.1.1.2 Catch impacts............................................................................................................................ 28 5.1.1.3 Socio-economic impacts ........................................................................................................... 31 5.1.2 Nelson ........................................................................................................................... 32 5.1.2.1 Description................................................................................................................................ 32 5.1.2.2 Catch impacts............................................................................................................................ 33 5.1.2.3 Socio-economic impacts ........................................................................................................... 33 5.1.3 Apollo ........................................................................................................................... 34 5.1.3.1 Description................................................................................................................................ 34 5.1.3.2 Catch impacts............................................................................................................................ 35 5.1.3.3 Socio-economic impacts ........................................................................................................... 35 5.1.4 Zeehan........................................................................................................................... 36 5.1.4.1 Description................................................................................................................................ 36 5.1.4.2 Catch impacts............................................................................................................................ 37 5.1.4.3 Socio-economic impacts ........................................................................................................... 37 5.1.5 Tasman Fracture............................................................................................................ 38 5.1.5.1 Description................................................................................................................................ 38 5.1.5.2 Catch impacts............................................................................................................................ 40 5.1.5.3 Socio-economic impacts ........................................................................................................... 42 5.1.6 Huon.............................................................................................................................. 43 5.1.6.1 Description................................................................................................................................ 43 5.1.6.2 Catch impacts............................................................................................................................ 44 5.1.6.3 Socio-economic impacts ........................................................................................................... 44 5.1.7 South Tasman Rise........................................................................................................ 45 5.1.7.1 Description................................................................................................................................ 45 5.1.7.2 Catch impacts............................................................................................................................ 46 5.1.7.3 Socio-economic impacts ........................................................................................................... 46 5.1.8 Banks Strait and Offshore Seamounts........................................................................... 47 5.1.8.1 Description................................................................................................................................ 47

Table of Contents
TAFI Final Report – FRDC 2005/083 iv
5.1.8.2 Catch impacts ............................................................................................................................48 5.1.8.3 Socio-economic impacts............................................................................................................52 5.1.9 Offshore Seamounts ......................................................................................................53 5.1.9.1 Description ................................................................................................................................53 5.1.9.2 Catch impacts ............................................................................................................................53 5.1.9.3 Socio-economic impacts............................................................................................................53 5.1.10 Bass Basin .....................................................................................................................55 5.1.10.1 Description ................................................................................................................................55 5.1.10.2 Catch impacts ............................................................................................................................56 5.1.10.3 Socio-economic impacts............................................................................................................56 5.1.11 East Gippsland...............................................................................................................57 5.1.11.1 Description ................................................................................................................................57 5.1.11.2 Catch impacts ............................................................................................................................57 5.1.11.3 Socio-economic impacts............................................................................................................57 5.2 OVERALL IMPACT OF MPAS ON CATCH OF MAJOR SPECIES IN SOUTH-EAST REGION..........59 5.3 SOCIO-ECONOMIC SURVEY ................................................................................................78 5.4 CASE STUDIES....................................................................................................................81 5.4.1 Case Study 1: A Coastal Fishing Community in Tasmania: A case of reduced diversity
through frustrated opportunity.......................................................................................81 5.4.2 Case Study 2: The economic impact of reduced catch from the Northern Zone Rock
Lobster Fishery on the Kangaroo Island and State economies *...................................87 5.4.3 Case Study 3: The Tasmanian scallop fishery...............................................................98 5.4.4 Case Study 4 - Commonwealth Shark Fishery: Loss of an operation’s sheltered winter
fishing grounds............................................................................................................112 5.4.5 Case Study 5 - Commonwealth Auto-Longline Fishery: Undermining of the
competitive advantage of a diversified enterprise .......................................................115 5.4.6 Case Study 6: Commonwealth Orange Roughy Fishery: Displacement of effort to the
High Seas and of an enterprise to New Zealand..........................................................119 5.4.7 Case Study 7: Tasmanian Scallop Fishery - Impacts both up and downstream on a
vertically integrated enterprise ....................................................................................123 5.4.8 Case Study 8: Dedicated fish freighting operation based in Tasmania: rendered
uncompetitive by higher rates due to lower volumes ..................................................128 5.4.9 Case Study 9: Wild fish processing in Tasmania: Undermining of an operation’s core
business .......................................................................................................................131 5.4.10 Case Study 10: The Orange Roughy Fishery ..............................................................135 5.4.11 Case Study 11: Commonwealth Market Trawl Fishery: Dislocation of an enterprise’s
fishing grounds from its processing facility ................................................................142 5.5 ECONOMIC ANALYSIS OF THE IMPACT OF THE PROPOSED MPAS IN THE SOUTH-EAST REGION145 5.5.1 Gross value of displaced catches by Commonwealth licensed operators....................145 5.5.2 Gross value of displaced catches by both State and Commonwealth operators ..........151 5.5.3 Additional costs of fishing elsewhere..........................................................................151 5.5.4 Implications of MPAs for employment .......................................................................154 5.5.5 Estimated value of displaced catches by Tasmanian based operators .........................154 6 ALTERNATIVES .........................................................................................................155 6.1 APPLICATION OF THE FISHERIES RISK ASSESSMENT.........................................................155 6.2 ZONATION........................................................................................................................158 6.3 BOUNDARIES....................................................................................................................160 6.3.1 Murray.........................................................................................................................163 6.3.2 Nelson..........................................................................................................................164 6.3.3 Apollo..........................................................................................................................164 6.3.4 Zeehan ......................................................................................................................... 164 6.3.5 Tasman Fracture ..........................................................................................................165 6.3.6 Huon and South Tasman Rise .....................................................................................166 6.3.7 Banks Strait and Offshore Seamounts.........................................................................167 6.3.8 Bass Basin ...................................................................................................................168 6.3.9 East Gippsland.............................................................................................................168 7 GENERAL DISCUSSION AND CONCLUSIONS....................................................177 7.1 CONTEXT .........................................................................................................................177

Table of Contents
v TAFI Final Report – FRDC 2005/083
7.2 IMPLICATIONS OF POTENTIAL CATCH DISPLACEMENT ..................................................... 177 7.2.1 General Remarks......................................................................................................... 177 7.2.2 Murray......................................................................................................................... 178 7.2.3 Zeehan......................................................................................................................... 179 7.2.4 Tasman Fracture Zone................................................................................................. 179 7.2.5 Huon............................................................................................................................ 179 7.2.6 Offshore Seamounts (South) ....................................................................................... 179 7.2.7 Banks Strait ................................................................................................................. 180 7.2.8 Bass Basin ................................................................................................................... 182 8 BENEFITS AND ADOPTION..................................................................................... 183
9 FURTHER DEVELOPMENT..................................................................................... 183
10 PLANNED OUTCOMES ............................................................................................. 184
11 INTELLECTUAL PROPERTY .................................................................................. 185
12 STAFF............................................................................................................................ 185 12.1 PROJECT SUPPORT TEAM ................................................................................................. 185 13 REFERENCES.............................................................................................................. 186
14 ABBREVIATIONS AND ACRONYMS ..................................................................... 187
15 APPENDICES ............................................................................................................... 188 15.1 APPENDIX 1. THE SURVEY QUESTIONNAIRE USED IN THE STUDY TO DETERMINE SOCIO-
ECONOMIC IMPACTS OF THE SOUTH-EAST REGION CANDIDATE MPAS ON THE COMMERCIAL FISHING INDUSTRY ........................................................................................................... 188
15.2 APPENDIX 2: SUMMARY OF THE DEH FISHERIES RISK ASSESSMENT ............................... 195


Non-technical summary
1 TAFI Final Report – FRDC 2005/083
2005/083 Regional impact assessment for the Marine Protected Areas proposed for the South-east Region
PRINCIPAL INVESTIGATOR Professor Colin Buxton
ADDRESS University of Tasmania Tasmanian Aquaculture and Fisheries Institute
Marine Research Laboratories Private Bag 49 TAS 7001 Telephone: 03 6227 7256 Fax: 03 6227 8035
Non Technical Summary
On the 14 December 2005 the Australian Government announced detailed proposals for the establishment of an extensive network of Marine Protected Areas (MPAs) in the South-east Region of Australia. The 14 candidate MPAs would cover more than 170,000 square kilometres of Commonwealth waters off Tasmania, Victoria, southern New South Wales and eastern South Australia. Simultaneously, the Australian Government’s fisheries management reform, including substantial reductions in Total Allowable Catch (TAC) and the purchase of fishing licenses to remove effort from over fished fisheries, was extended to fishers – both Commonwealth and State licensed – who were affected by the creation of the MPA network. By running a single adjustment package it was reasoned that affected businesses need only go through one adjustment process (rather than two), and businesses in the South-east Region would not face a series of changes over several years. The gross value of fisheries production from the South-east Region, at over $500 million per annum, represents an estimated 23% of the total gross value of Australian fisheries production. At the time of the announcement of the proposed MPA network, the boundaries of only two candidate MPAs within the 11 Broad Areas of Interest (BAOIs) had been discussed in any detail with the fishing industry. The Australian Government had brought forward the release of the proposed MPA network so that fishermen could make decisions about their future in the full knowledge of their operating environment – knowing the full extent of proposed exclusions from MPAs as well as knowing how their fisheries would be managed.

Non-technical summary
TAFI Final Report – FRDC 2005/083 2
This report investigates the considerable impacts that these announcements pose for the fishing industry in the South-east Region and the considerable socio-economic implications for individual fishers who fish within the proposed areas, for entire fisheries, and on the overall supply of seafood to the Australian consumer. On the understanding from the Commonwealth Department of Environment and Heritage (DEH), that the proposed areas were negotiable, Industry and management agencies believed the most appropriate response was to characterise and validate the impacts and make a scientifically defensible case for alternatives such as boundary changes or alterations to the proposed MPA classifications. These alternatives were designed to minimise the impacts on the fishing industry while at the same time not eroding the conservation values of the proposed MPA network in the region. A key component of the study was to provide defensible estimates of catch displacement, sociological impacts and economic impacts, recognising the limitations imposed by a relatively short time frame.
Objectives of the study: - To quantify the commercial fisheries catch for key species within the
proposed MPAs for the South-east region; - To quantify the commercial fisheries economic value associated with the
catch within the proposed MPAs for the South-east region; - To quantify the socio-economic impact of the proposed MPAs on the
commercial fishing industry; and - To outline in terms of the above, alternative approaches that minimize
impacts on the fishing industry without compromising the biodiversity objectives of DEH.
In the State-based fisheries the overall displacement of catch was estimated as 4027t per annum (2000-2005). Only a few species appeared likely to be adversely affected by the proposed network of MPAs and only four of the candidate MPAs were reported to have significant displaced catches. These were the Murray (rock lobster), Zeehan (giant crab), Tasman Fracture (rock lobster & scalefish) and Banks Strait (scallop, rock lobster, giant crab and scalefish). The estimated Gross Value of Product (GVP) displaced was $6.4 million per annum. The most significant impact was on the Tasmanian scallop fishery where an estimated 4,000t would be lost each year. The paddock based spatial management system would be severely disrupted and possibly cease to work. Effectively this sustainable fishery accredited under the Environment Protection and Biodiversity Conservation Act would be lost and scalloping would return to an uncertain “boom and bust” future. Fisheries for rock lobster were also impacted, especially off Kangaroo Island and off St Helens where localised displacements of catch were capable of causing a disruption to stock re-building strategies and/or serial depletion as a result of displaced fishing effort.

Non-technical summary
3 TAFI Final Report – FRDC 2005/083
For Commonwealth fisheries the catch data have been adjusted for proposed 2007 TACs to enable the effects of TAC changes to be separated from the effects of MPA catch displacement. These proposed 2007 TAC reductions are highly significant for orange roughy, dories, blue-eye trevalla, blue grenadier, ling and flathead. The five year time period, 2000-2005, was used to attempt to reflect the dynamic and possibly cyclic nature of catches in the MPAs, as well to indicate which sectors are developing or declining for other reasons. The 2004-05 catch and GVP data was used to provide the most up to date expression of the displaced catch and its value. Commonwealth fisheries were impacted by all of the proposed MPAs and across all of the major fishing sectors. Against catch history averaged over the period 2000-2005 an estimated 5,230t would be displaced across the region. The most impacted were the Commonwealth trawl fishery (3,307t), the small pelagics fishery (1,642t), long-lining (143t) and shark gillnet fishery (64t). The estimated GVP of this displaced catch was $13.73 million or 16% of the value of the fishery in the region. Using 2004/05 catch returns the overall displacement in Commonwealth fisheries was 7,287t, equating to 21.6% of the catch in the region, but when adjusted for projected 2007 TACs, this decreased to 5,000t. The GVP of this displacement was $15.87 million (unadjusted) or $5.76 million (adjusted) for projected 2007 TACs. This difference was principally due to adjustments affecting the trawl sector. Before adjustment for 2007 TAC the most significant effects of the displacement were in the orange roughy fishery ($11.63m), small pelagics ($2.64m), longline ($0.86m) and gillnet ($0.58m). The data showed that the proposed network would severely impact the small pelagic fishery because major grounds were contained in the Banks Strait and Tasman Fracture candidate MPAs and the combined displacements would not be able to be caught elsewhere, especially for the same cost of operation. Similarly the aggregate effect of the network on the market species was significant. This was especially true for the iconic blue-eye trevalla fishery where catch displacements especially in Banks Strait and Tasman Fracture MPAs were sufficient to disrupt the operations of several businesses. Combining State and Commonwealth data the displaced catch (2004/05 adjusted) was estimated as 9,027t with a GVP value of $11.6 million. As this study does not attempt to calculate changes in the net income of fishers or the loss of value of their fishing entitlements and other assets, the results cannot be used to indicate the potential level of compensation payable by the Government under its structural adjustment package.

Non-technical summary
TAFI Final Report – FRDC 2005/083 4
The sociological impacts of the proposed MPAs were characterized by 11 case studies on individual businesses across the value chain, selected fisheries and entire communities. A number of general conclusions were apparent:
− Impacts were not a simple addition of the effects in each MPA, rather they were a complex interaction across the entire network;
− Blue-eye trevalla was a key species that leveraged the profitability of individual operations well above the GVP of the catch;
− The entire Tasmanian scallop fishery was at risk with significant consequences for the profitability of businesses that included scallops in a multi-species or multi-sector operation.
− The orange roughy fishery was significantly impacted, especially by the high proportion of seamounts and pinnacles in the system, and was significantly at risk.
− The proposed MPAs had a very significant impact on several communities notably St Helens and Triabunna in Tasmania, and Kangaroo Island in South Australia.
− Many jobs would be lost in rural communities. The sample alone (80 fishers and processors) suggested a loss of 52 permanent and 152 casual positions.
− Despite the impacts and the proposed restructure, many fishers would be forced to remain in the fishery. The obvious effect would be greater effort on remaining areas and stress on the sustainability and ecological health of adjacent areas.
Clearly the majority (approximately 90%) of the impacts of the proposed network of MPAs was on Tasmanian based operations. Taking account of the findings of the study, and with the help and support of both Industry and DEH an alternative network of MPAs in the South-east region was proposed. The key elements of this new system were:
− Establishing Habitat Protection Zones (IUCN Category VI) that allowed oil and gas industry activities but excluded all other extractive uses.
− Simplification of MPA boundaries, especially in areas adjacent to the coast, to improve compliance and enforcement.
− Including Multiple-use Zones (IUCN Category VI) in several areas that allow fishing activities that have a demonstrably low impact determined through the Fisheries Risk Assessment (that are therefore consistent with the conservation values of the system).
− Boundary changes to several of the proposed MPAs including:
a. Tasman Fracture
b. Huon/South Tasman Rise
Non-technical summary
5 TAFI Final Report – FRDC 2005/083
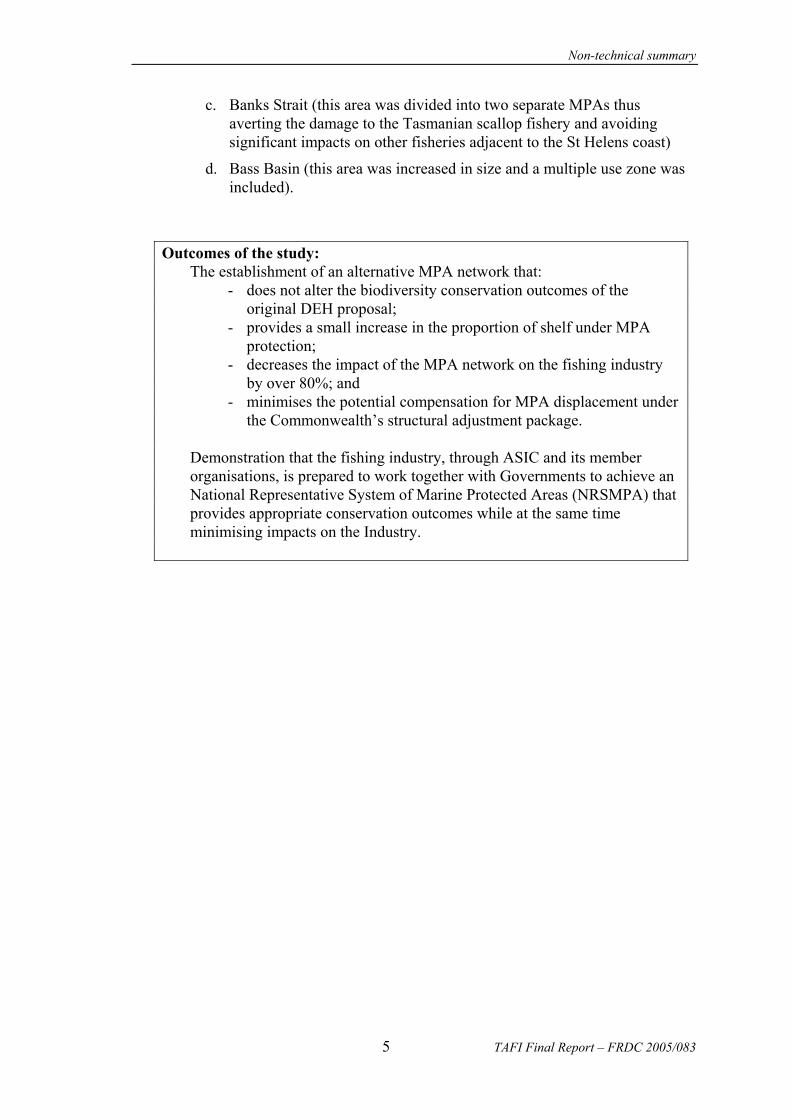
c. Banks Strait (this area was divided into two separate MPAs thus averting the damage to the Tasmanian scallop fishery and avoiding significant impacts on other fisheries adjacent to the St Helens coast)
d. Bass Basin (this area was increased in size and a multiple use zone was included).
Outcomes of the study: The establishment of an alternative MPA network that: - does not alter the biodiversity conservation outcomes of the
original DEH proposal; - provides a small increase in the proportion of shelf under MPA
protection; - decreases the impact of the MPA network on the fishing industry
by over 80%; and - minimises the potential compensation for MPA displacement under
the Commonwealth’s structural adjustment package. Demonstration that the fishing industry, through ASIC and its member
organisations, is prepared to work together with Governments to achieve an National Representative System of Marine Protected Areas (NRSMPA) that provides appropriate conservation outcomes while at the same time minimising impacts on the Industry.
Acknowledgements
TAFI Final Report – FRDC 2005/083 6
Acknowledgements
We would like to offer our appreciation to the many people who assisted us in this study. The project support team: Crispian Ashby, Roger Edwards, Dallas d’Silva, Gerry Geen, Ian Knuckey, James Larcombe, Ross McGowan, Jeff Moore, Gail Richey, Ed Smith, and Sean Sloan assisted with all aspects of the work, provided a valuable interface with Industry in the Region and for comments on earlier draft of the text. Special mention goes to Ian Knuckey for his support with mapping; Jeff Moore for his support in arranging meetings with ASIC, DEH and DAFF and for his contributions to the report; James Larcombe who provided most of the analysis of Commonwealth catch data and provided a valuable sounding board on all aspects of the study and Ed Smith who took care of most of the meeting notes. David Galeano (ABARE) provided useful support with the economic analysis and Peter Harris (Geosciences Australia) provided assessments of the proportions of geomorphic types in the MPA system. Adrian Linnane (SARDI) provided data on the SA rock lobster catches. The project received the wholehearted support of the fishing industry and their peak bodies. In this regard ASIC, through their MPA Working Group, played an important role in commenting on the report and through several workshops aimed at developing the alternative options. Many people in the fishing industry in Tasmania, Victoria and South Australia willingly provided detailed information on their businesses in order to obtain an accurate socio-economic assessment of the impacts of MPAs in the South-east region. They are too many to mention by name. The alternative MPA options were developed with the support of the ASIC MPA Working Group, and members provided useful comments, support and guidance on early drafts. The staff of DEH, especially Leanne Wilkes, Paul Garrett and Stephen Oxley, and DAFF provided support in the form of maps and other information needed to develop the alternative options presented in the report, and on several occasions made themselves available to discuss draft information. We would like to thank Rod Casement for permission to compare his 2004 logbooks against our database from AFMA. In addition, we would like to thank Fay Helidoniotis at TAFI for diligently reading through all the records of both the log-books and the database to make this comparison. The project would not have been possible without the support of AFMA (Richard McLoughlin and Nick Rayns), PIRVic (Peter Appleford), PIRSA (Will Zacharin) and DPIWE (Wes Ford) who supported the concept of a regional approach to the study and provided Commonwealth and State catch data for the analysis. Finally, the project would not have been possible without the financial support of the FRDC and the Tasmanian Department of Primary Industries, Water and Environment and we would like to thank Patrick Hone and Wes Ford, respectively, for their support and encouragement to do the work.
Background
7 TAFI Final Report – FRDC 2005/083
1 Background
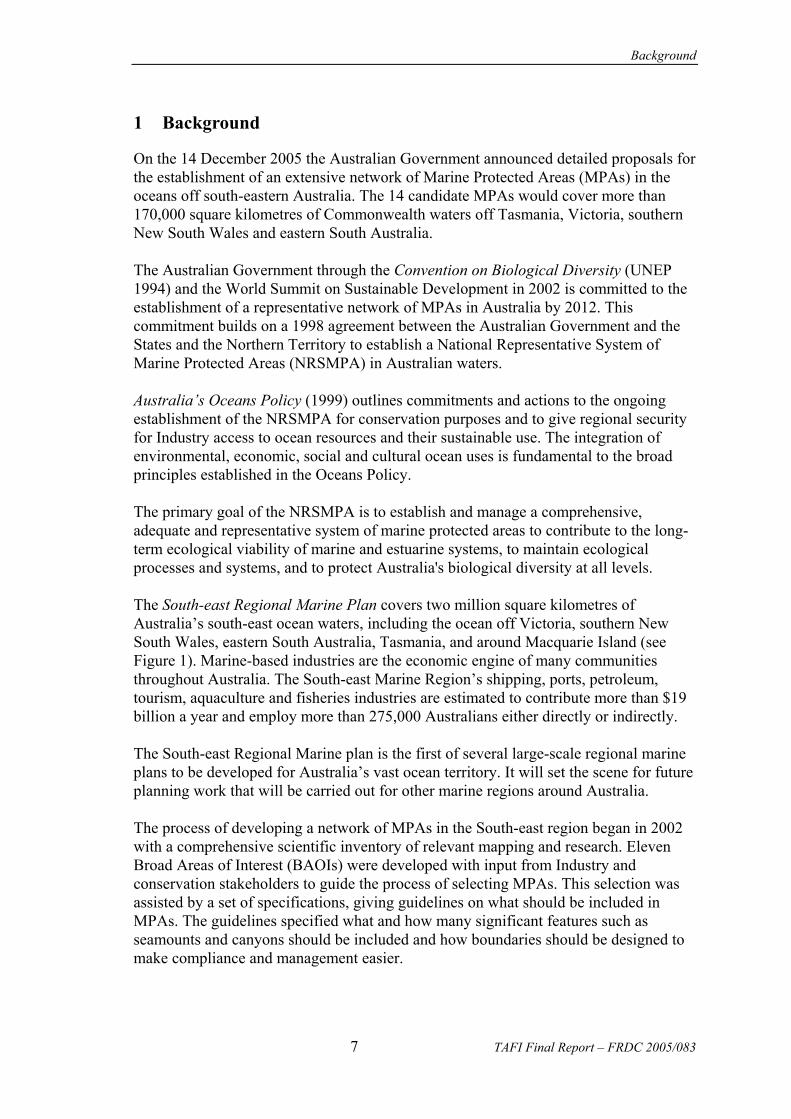
On the 14 December 2005 the Australian Government announced detailed proposals for the establishment of an extensive network of Marine Protected Areas (MPAs) in the oceans off south-eastern Australia. The 14 candidate MPAs would cover more than 170,000 square kilometres of Commonwealth waters off Tasmania, Victoria, southern New South Wales and eastern South Australia. The Australian Government through the Convention on Biological Diversity (UNEP 1994) and the World Summit on Sustainable Development in 2002 is committed to the establishment of a representative network of MPAs in Australia by 2012. This commitment builds on a 1998 agreement between the Australian Government and the States and the Northern Territory to establish a National Representative System of Marine Protected Areas (NRSMPA) in Australian waters. Australia’s Oceans Policy (1999) outlines commitments and actions to the ongoing establishment of the NRSMPA for conservation purposes and to give regional security for Industry access to ocean resources and their sustainable use. The integration of environmental, economic, social and cultural ocean uses is fundamental to the broad principles established in the Oceans Policy. The primary goal of the NRSMPA is to establish and manage a comprehensive, adequate and representative system of marine protected areas to contribute to the long-term ecological viability of marine and estuarine systems, to maintain ecological processes and systems, and to protect Australia's biological diversity at all levels. The South-east Regional Marine Plan covers two million square kilometres of Australia’s south-east ocean waters, including the ocean off Victoria, southern New South Wales, eastern South Australia, Tasmania, and around Macquarie Island (see Figure 1). Marine-based industries are the economic engine of many communities throughout Australia. The South-east Marine Region’s shipping, ports, petroleum, tourism, aquaculture and fisheries industries are estimated to contribute more than $19 billion a year and employ more than 275,000 Australians either directly or indirectly. The South-east Regional Marine plan is the first of several large-scale regional marine plans to be developed for Australia’s vast ocean territory. It will set the scene for future planning work that will be carried out for other marine regions around Australia. The process of developing a network of MPAs in the South-east region began in 2002 with a comprehensive scientific inventory of relevant mapping and research. Eleven Broad Areas of Interest (BAOIs) were developed with input from Industry and conservation stakeholders to guide the process of selecting MPAs. This selection was assisted by a set of specifications, giving guidelines on what should be included in MPAs. The guidelines specified what and how many significant features such as seamounts and canyons should be included and how boundaries should be designed to make compliance and management easier.
Background
TAFI Final Report – FRDC 2005/083 8
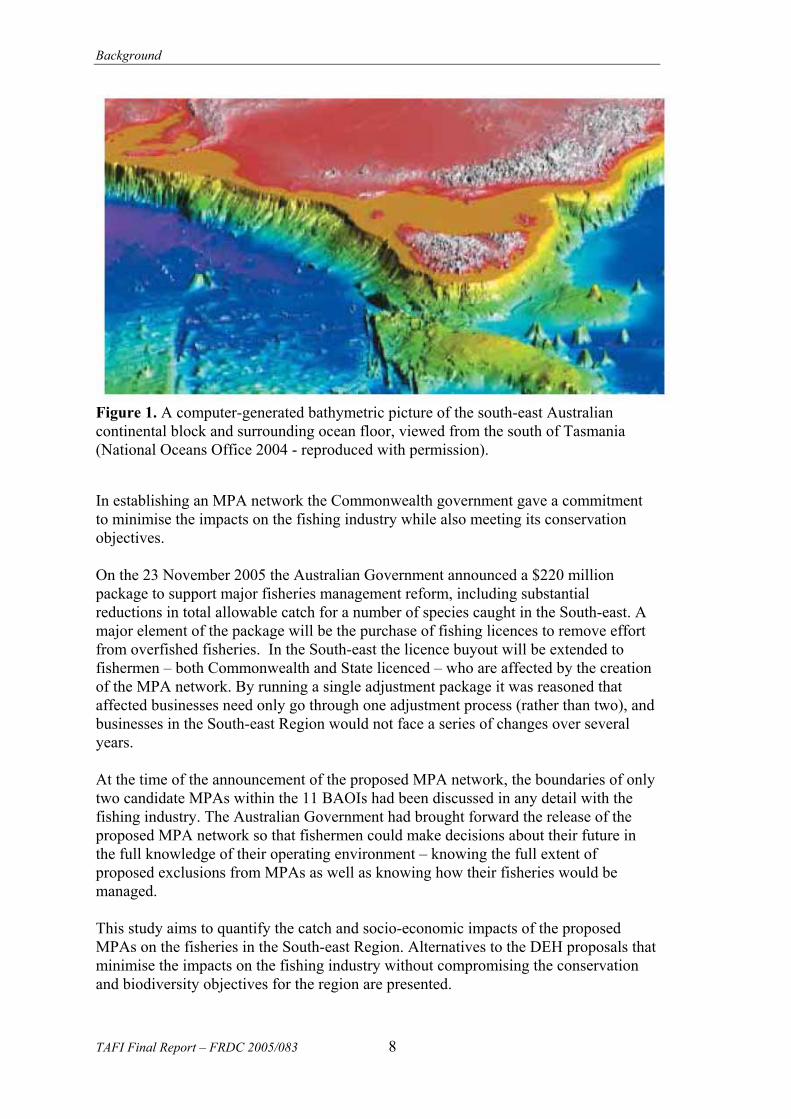
Figure 1. A computer-generated bathymetric picture of the south-east Australian continental block and surrounding ocean floor, viewed from the south of Tasmania (National Oceans Office 2004 - reproduced with permission). In establishing an MPA network the Commonwealth government gave a commitment to minimise the impacts on the fishing industry while also meeting its conservation objectives. On the 23 November 2005 the Australian Government announced a $220 million package to support major fisheries management reform, including substantial reductions in total allowable catch for a number of species caught in the South-east. A major element of the package will be the purchase of fishing licences to remove effort from overfished fisheries. In the South-east the licence buyout will be extended to fishermen – both Commonwealth and State licenced – who are affected by the creation of the MPA network. By running a single adjustment package it was reasoned that affected businesses need only go through one adjustment process (rather than two), and businesses in the South-east Region would not face a series of changes over several years. At the time of the announcement of the proposed MPA network, the boundaries of only two candidate MPAs within the 11 BAOIs had been discussed in any detail with the fishing industry. The Australian Government had brought forward the release of the proposed MPA network so that fishermen could make decisions about their future in the full knowledge of their operating environment – knowing the full extent of proposed exclusions from MPAs as well as knowing how their fisheries would be managed. This study aims to quantify the catch and socio-economic impacts of the proposed MPAs on the fisheries in the South-east Region. Alternatives to the DEH proposals that minimise the impacts on the fishing industry without compromising the conservation and biodiversity objectives for the region are presented.

Background
9 TAFI Final Report – FRDC 2005/083
1.1 Overview of the proposed MPAs in the South-east Region
1.1.1 The South-east region
The South-east Marine Region covers more than two million square kilometres of water off Victoria, Tasmania (including Macquarie Island), southern New South Wales around the town of Bermagui, and eastern South Australia from the South Australian/Victorian border to Victor Harbor. The mapping of the sea floor of the South-east Marine Region has revealed numerous features such as underwater canyons and seamounts (underwater mountains). Ecologically, the Region has high levels of species endemism (species that are found nowhere else) and biodiversity. A range of conservation measures are employed to protect the natural features of the Region. This natural wealth forms the basis for a broad range of economic, social and cultural values and activities. These include, but are not limited to, petroleum exploration and extraction, commercial fishing, marine based tourism and recreation, customary Indigenous practices, aquaculture, and conservation. Marine resource use in the Region has changed significantly over time. It is likely that this will continue as technology advances and community values change. A detailed description of the South-east Region may be found on the National Oceans Office website at http://www.oceans.gov.au/regional_marine_plan_overview.jsp
1.1.2 Commercial fisheries (extract from National Oceans Office 2004)
Commercial fishing is an important component of the Region’s coastal economy. Associated activities such as repair yards, dock handling, transportation, boat construction, fish processing and commercial trade and the supply of marine gear such as nets and rigging, add significantly to the Region’s employment and economic activity. In 2002–03, the total gross value of fisheries production (including molluscs and crustaceans) from the South-east Marine Region, in both Commonwealth and South-east States’ waters, is estimated to have been $531 million, made up of $135 million from aquaculture, $317 million from South-east States’ waters and $79 million from Commonwealth waters. This represented an estimated 23% of the total gross value of Australian fisheries production in 2002–03. There are over 30 Commonwealth, South-east State or jointly managed open ocean fisheries in the Region using an array of fishing methods and gear types. The Region’s waters are accessible to bottom-fishing gears such as bottom longline and trawl and pelagic fishing gear that operates in the water column, such as purse seine and pelagic longline. Commercial fishing in the Region is not spread evenly across all waters but is concentrated in inshore coastal waters (mainly South-east State fisheries) and along the

Background
TAFI Final Report – FRDC 2005/083 10
continental slope (mainly Commonwealth fisheries). The Commonwealth fisheries within the Region are the:
− Bass Strait Central Zone Scallop Fishery
− Southern and Eastern Scalefish and Shark Fishery which incorporates the South East Trawl Fishery, Gillnet Hook and Trap Fishery (formerly the South East Non-trawl Fishery and the Southern Shark Fishery) and the Great Australian Bight Trawl Fishery
− Southern Squid Jig Fishery
− Small Pelagics Fishery (formerly the Jack Mackerel Fishery)
− Eastern Tuna and Billfish Fishery
− South Tasman Rise Fishery
− Antarctic Fishery
− Southern Tuna and Billfish Fishery
− Southern Bluefin Tuna Fishery In addition, significant State fisheries within the Region are:
− Abalone Fishery
− Rock Lobster Fishery Commercial and recreational use of the Region’s fisheries has been expanding since Bass and Flinders explored Bass Strait in 1797. Prior to this date, Indigenous fishing and trade had been taking place for millennia. At first, European commercial interests concentrated on the vast abundance of whales and seals in the Region but as more Europeans settled in the Region and technology advanced, more recreational and commercial fisheries developed, first around the bays and inlets and later away from the coast in deeper waters. Today some 400+ commercial fishing boats operate in Commonwealth waters alone, catching over 50 species. The Australian Government manages the commercial fisheries for which it has responsibility using the Fisheries Management Act 1991. State/Territory governments have legislation for managing both commercial and recreational fisheries. In some cases where fisheries overlap jurisdictional boundaries the Australian and South-east State governments have agreed on the management responsibility, fishing methods and/or areas of water, using Offshore Constitutional Settlement arrangements. In the Region, many commercial and recreational species are being targeted using an array of different methods and as a consequence there is a range of environmental, social and economic issues related to the long term sustainability of fishing activities in the South-east Marine Region. This has led to high levels of regulation, imposed by different jurisdictions, to ensure fishing is conducted at sustainable levels. Recent developments in Australian policy and legislation have influenced management arrangements for fisheries in the Region. Fisheries are required to undertake assessment under the Australian Government’s Environment Protection and Biodiversity

Background
11 TAFI Final Report – FRDC 2005/083
Conservation Act 1999 to demonstrate that their management arrangements meet ecologically sustainable management of fisheries criteria. Already a number of State and Australian Government fisheries, such as the abalone and rock lobster fisheries and the Southern and Eastern Scalefish and Shark Fishery, have completed these assessments.
1.1.3 The Marine Provinces and Geomorphology of the SE Region
The primary goal of the NRSMPA is to establish a system of parks that are Comprehensive, Adequate and Representative (CAR) (ANZECC 1999). This is defined as follows:
− Comprehensive – include MPAs that sample the full range of Australia’s ecosystems.
− Adequate – include MPAs of appropriate size and configuration to ensure the conservation of marine biodiversity and integrity of ecological processes.
− Representative – include MPAs that reflect the marine life and habitats of the areas they are chosen to represent.
Typically the assessment of a candidate MPA requires information on biodiversity, ecological processes, conservation status, biogeographical characteristics, social, cultural and economic interests as well as threatening processes (Commonwealth of Australia 2003). In the South-east Region, much of this knowledge is not available at a fine scale, especially as it relates to biodiversity, ecological processes and threatening processes. Given this data would take years to collect at considerable cost , a precautionary approach is being used to establish the NSRMPA. This uses best scientific understanding of surrogates for broad-scale ecosystems and habitats based on bioregional assessments as well as advice and expertise offered by stakeholders (Commonwealth of Australia 2003). The two core regional datasets that underpin this approach are:
− The Interim Bioregionalisation of the South-east Marine Region (NOO 2002; Butler et al. 2002) for the deepwater areas outside the continental shelf, and
− The Interim Marine and Coastal Regionalisation for Australia (ANZECC 1998).
The hierarchical structure of the deepwater bioregionalisation is defined at three scales (Commonwealth of Australia 2003):
− Large provinces (Level 1),
− Shelf, slope and abyssal plain (Level 2), and
− Geomorphic units (Level 3), which includes features such as seamounts, canyons etc.

Background
TAFI Final Report – FRDC 2005/083 12
These are illustrated in Figures 1.1a and 1.1b.
1.1.4 The proposed candidate MPAs in the SE Region
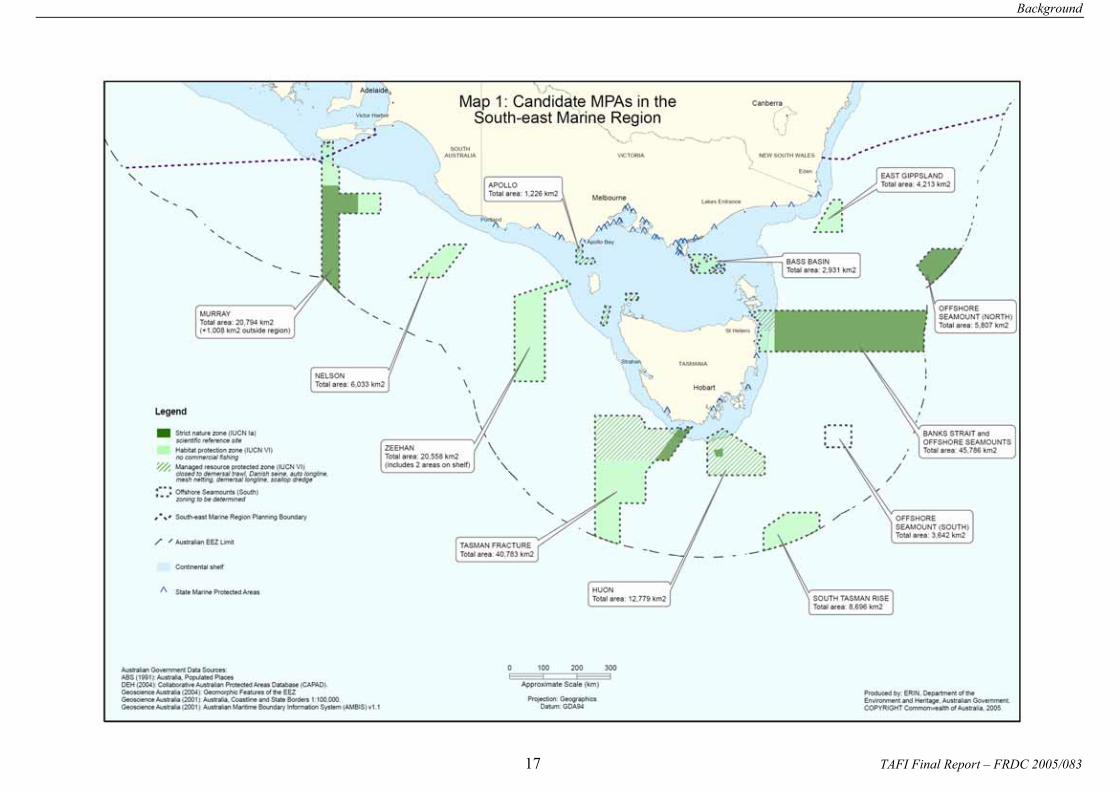
The South-east network of candidate MPAs announced by DEH is summarised in Figure 1.1c. This illustrates the position of the 14 individual MPAs being proposed and the zonation and total area total of each MPA. Figure 1.1d illustrates the position of petroleum leases in the South-east Region relative to the location of the MPA network. Geomorphic features, their occurrences (counts) and surface areas (in square kilometres) for the whole of the southeast planning area and for the new candidate marine protected areas (MPAs) is given in Table 1.1.

Background
13 TAFI Final Report – FRDC 2005/083
Table 1.1. Geomorphic features, their occurrences (counts) and surface areas (in square kilometres) for the whole of the southeast planning area and for the new candidate marine protected areas (MPAs). The percentage of surface area of each feature contained in MPAs is also listed (Peter Harris, GeoSciences Australia, unpublished data).
Geomorphic Count Area km2 Count Area km2 Percent of area Feature (All of SE Region) (In SE MPAs) in new MPAs
Shelf1 219,350 12,130 5.53 Slope1 430,440 84,953 19.74 Abyssal1 545,230 77,047 14.13 Shelf 46 117,650 9 5,291 4.50 Slope 40 249,900 16 48,880 19.56 Abyssal 3 538,430 9 73,219 13.60 Bank 3 1,348 0 0 0.00 Basin 6 24,136 4 1,820 7.54 Canyon 131 40,193 30 7,953 19.79 Valley 7 21,010 3 1,451 6.91 Escarp. 16 5,875 7 804 13.68 Knoll 41 7,228 14 2,574 35.61 Pinnacle 46 732 35 510 69.67 Plateau 6 105,860 8 11,610 10.97 Reef 1 4 0 0 0.00 Ridge 5 5,840 4 4,197 71.87 Saddle 2 30,442 6 4,350 14.29 Seamount 11 9,052 7 5,854 64.67 Sill 2 2,790 1 1,316 47.15 Terrace 8 22,469 3 2,214 9.85 Sandwaves 5 7,512 2 979 13.04 Trench 2 2,082 2 1,135 54.51 TOTAL 1,195,020 174,160 14.60
Note: The first listing of continental shelf, slope and abyssal plain areas are total, mutually exclusive areas. Second listing of continental shelf, slope and abyssal plain areas are less the surface areas of superimposed features (eg. shelf area is total shelf area minus superimposed basin area, sill area, sandwaves, etc.).

Background
TAFI Final Report – FRDC 2005/083 14
Figure legends for maps on pages 14 – 17. Page 14 – Figure 1.1a Map of the major Provinces in the South-east region (Commonwealth 2003). Page 15 – Figure 1.1b Map 2: Geomorphic features and IMCRA bioregions in the South-east Marine Region (reproduced with permission from DEH). Page 16 – Figure 1.1c Map 1: Candidate MPAs in the South-east Marine Region (reproduced with permission from DEH). Page 17 – Figure 1.1d Map 6: Petroleum leases in the South-east Marine Region (reproduced with permission from DEH).

Background
15 TAFI Final Report – FRDC 2005/083

Background
TAFI Final Report – FRDC 2005/083 16
Background
17 TAFI Final Report – FRDC 2005/083

Background
TAFI Final Report – FRDC 2005/083 18

Need, Objectives & Methods
19 TAFI Final Report – FRDC 2005/083
2 Need
The announcement of the proposed MPAs for the South-east Region has considerable implications for individual fishers who fish within the proposed areas, entire fisheries, and on the overall supply of seafood to the Australian consumer. On the understanding from the Commonwealth Department of Environment and Heritage (DEH), that the proposed areas are negotiable, Industry and management agencies believe the most appropriate response is to characterise and validate the impacts and make a scientifically defensible case for alternatives such as boundary changes or alterations to the proposed MPA classifications. Developing a single coordinated scientific report that included the whole SE Region and all fishing activities impacted was considered essential. The development of a defensible report would ensure that all parties had a common reference point in negotiations. To develop such a report it was important that the data was verifiable, all data assumptions were transparent, the project team was the best available, was independent and included support from a wide range of organisations.
3 Objectives
The objectives of the study were fourfold:
1. To quantify the commercial fisheries catch for key species within the proposed MPAs for the South-east region
2. To quantify the commercial fisheries economic value associated with the catch within the proposed MPAs for the South-east region
3. To quantify the socio-economic impact of the proposed MPAs on the commercial fishing industry
4. To outline in terms of 1, 2 & 3, alternative approaches that minimize impacts on the fishing industry without compromising the biodiversity objectives of DEH.
4 Methods
Given the time frame under which DEH expected an Industry response, this study operated under strict time limitations and therefore opportunities to gather complete information on the socio-economic impacts were restricted. 4.1 Catch Estimates
In all cases, estimates of the catch potentially displaced from the area of the candidate MPA were derived from the catch and effort databases held by the various State authorities and by the Australian Fisheries Management Authority (AFMA). In the case of the Commonwealth fisheries, catch and effort are reported using latitude and longitude readings for the location of fishing effort. This meant that obtaining estimates of the spatial distribution of catch was relatively simple and was conducted using Geographical Information System (GIS) software. For the Commonwealth fisheries there have been recent marked changes to the TACs for some species.

Need, Objectives & Methods
TAFI Final Report – FRDC 2005/083 20
For each of the candidate MPAs displaced catch was estimated against catch history averaged over the period 2000 – 2005, both with and without adjustment for TAC proposed for 2007. These expected TAC adjustments are summarised in Table 4.1.
Table 4.1. SESSF Total Allowable Catches Comparison
Species 2006 TAC Projected 2007 TAC Alfonsino 500 500 Bight redfish 1,400 1,400 Blue eye trevalla 560 500 Blue grenadier 3,730
(+200 research quota) 2,500
Blue warehou 650 (+100 research quota)
650
Deepwater flathead 3,000 (+40 research quota)
3,000
Flathead 3,000 2,300 Gemfish east
100 (bycatch) 100 (bycatch)
Gemfish west (SET) 165 165 Jackass morwong 1,200 1,200 John dory 190 190 Mirror dory 634 634 Ocean perch 500 500 Orange roughy eastern zone 700 (+100 research quota) 0* Orange roughy southern zone 10 (bycatch) 0* Orange roughy western zone 250 (bycatch) 0* Orange roughy Cascade zone 700 (+100 research quota) 214 Orange roughy GAB Esperance zone
212 212
Oreo smooth, Cascade 100 0* Oreo smooth, other 50 0* Oreo basket, other 200 0* Pink ling 1,200 1,200 Redfish 900 900 Ribaldo 165 165 Royal red prawn 500 500 School whiting 1,500 1,500 Silver trevally 270 0* Spotted (silver) warehou 4,400 3,300 Deepwater shark basket east 92 (bycatch) 0* Deepwater shark basket west 108 (bycatch) 0* Elephant fish 130 130 Gummy Shark 1,800 1650 Saw shark 434.4 434.4 School shark 257.4
(bycatch) 240 (bycatch)
*Bycatch limits to apply

Need, Objectives & Methods
21 TAFI Final Report – FRDC 2005/083
The number of years of data that were used for each candidate MPA and fishery differed depending upon what data was available. In summary tables, where only average catches are presented, the number of years that were averaged in each case is provided. Typically the catches from about 2000 to about 2005 are presented. In a few cases a longer timeline is presented to provide an indication of the variation in catches from particular areas from year to year.
4.1.1 Spatial Processing of State Data
In the case of State fisheries, except for giant crab, catches are reported in the different States with respect to defined statistical reporting blocks. In Tasmania these form a 30 x 30 minute grid (quarter degree blocks) across the State. In South Australia, the reporting blocks are one-degree blocks while in Victoria the general Ocean Licence Fishery reporting blocks are six-minute squares. With the State fisheries, the statistical reporting blocks never completely coincided with boundaries of the candidate MPAs. Without independent evidence as to the exact distribution of fishing effort the only option available was to apportion catches from statistical blocks into the candidate MPAs in proportion to their area of overlap. This may introduce an unknown bias in the catch estimates because the distribution of catch is not homogeneous across any statistical fishing block, particularly on hard substrates (reef). Even though the geographical scale of reporting was relatively coarse each record also provided an estimate of average depth. Therefore, in addition to the relative area of overlap only those catches were considered that were taken in depths deeper than the closest depth contour to the candidate MPA boundary. The contour maps were only approximate and it was known that some fishing areas in the candidate MPAs were relatively shallow so the estimates were once again conservative.
4.1.2 Spatial Processing of Commonwealth Logbook Data
For the Commonwealth fisheries, relatively exact catches by area could be determined because a requirement of fishing is to report start and finish latitudes and longitudes for each shot. The catch from each shot was apportioned to the area fished depending on the proportion of the trawl track (depicted as a straight line) lying within each candidate MPA. In cases where only the start latitude and longitude were available the whole catch was deemed to be derived from the location of the start of the tow (Method 1). For some shark records data is provided at a half-degree block resolution and then catch is apportioned with respect to the degree of overlap with candidate MPAs (Method 2).
Method 1: Intersect linear ‘tracks’ against the MPA candidates. Most of the Commonwealth data is processed in this way.
The positioning of gear such as bottom trawl and pelagic longline is approximated by a straight line between start and finish positions.

Need, Objectives & Methods
TAFI Final Report – FRDC 2005/083 22
Lines are split at the intersection of the MPA to create numerous smaller line segments that lie fully within or outside the MPA.
Catch, effort and GVP are apportioned to segments proportional to line length (segment length/total length x quantity), and segment statistics are summed for each MPA.
Where no end position is available the fishing operation is assigned a nominal length of 100 metres northwards.
Method 2: Intersect polygons against MPA candidates. A small amount of the Commonwealth data (shark) is processed in this way.
Fishing operations are sometimes reported on a simple half-degree grid. The half-degree reporting system is overlaid onto the MPA candidates and
Catch and GVP are apportioned based on the percentage of the half-degree reporting cell that is taken up by the MPA.
This method assumes that catch is taken uniformly across the area of the reporting cell, however this may not be the case.
As a test of the accuracy of the transfer of data from the fishers to the AFMA the records from a single vessel were compared with the records as entered into the AFMA database. This involved a literal comparison of each record in the database for 2004 for that vessel with that recorded in the vessel’s catch and effort logbooks. The only fields considered related to location (to test the accuracy of geographical data) and the catches of flathead and jackass morwong (representing typical market fishing).
Need, Objectives & Methods
23 TAFI Final Report – FRDC 2005/083
4.1.3 Database Validation Check
900 records from the 2004 log books of the FV Tullaberga, relating to flathead and jackass morwong catches, were checked against the values provided to the authors by AFMA from their database of catch and effort. A low frequency of three types of error was identified. The first were errors with respect to the date of the fishing event, the second related to differences between reported catch and that recorded in the database, and the third were errors in relation to the recorded latitude of the start of the fishing effort. The most common errors were small mistakes with dates, which tended to place dates either one day before or one day after when they are recorded as occurring in the log-books. There were 21 out of 900 of these (2.33%), but these included five recorded catches that had mistakenly been recorded as being in 2003. There were 13 errors relating to quantity of fish caught, some of which were entered into the database as greater than that reported and some as less, leading to a total loss of 300 kg across both species (much of that was the missing day that was shifted to 2003). The error rate was therefore 1.44% but the quantity in error was only a very small proportion of the total. Finally, seven small errors of latitude were found among the 900 errors (0.77%), although one of these would have had the effect of moving one shot outside of one of the proposed MPAs the effect was considered to have been trivial. The error rate observed here is not exceptional considering the amount of hand written records that are being entered. Overall, the catch quantities are almost precisely correct, though there are some details that might be upset if the exact date of operation were important. The spatial errors could be significant but the majority of trawl shots are correctly entered into the database. 4.2 Socio-economics
Given the short timeframe, socioeconomic data were generated via a criterion sampling method. The rationale behind this method was to target those, for example, 20 per cent of operators, who stood to be highly affected, while leaving the, for example, 80 per cent of less- or un-affected operators, largely out of the sample, as follows.

Need, Objectives & Methods
TAFI Final Report – FRDC 2005/083 24
impact
number
e.g., auto-longline operators (approx. 6)e.g., scallop fishers (approx. 15)
e.g., rock lobster fishers: geographicsample
e.g., line fishers: opportunistic sample
individual cases, e.g., in the small pelagic fishery or the giant crab fishery
High impact/lownumber: interview asmany as willing
To ascertain an indication of the nature and magnitude of impacts, rather than of their context, the criterion used was operations that stood to be significantly affected by the proposed Commonwealth MPAs. This criterion then defined a population of significantly affected operators, as identified by key informants on the project team. The sample was generated from this frame, the population of which sits within larger-populations, as follows:
Sam ple
Population:h ighly affected
A ll those disp laced
A ll operators
Identified by key inform antsN B : not to scale
Use of data
Socio-economic data were generated with fishers and processors as well as with businesses in secondary industries. Analysis of the data focused on development of case studies to illustrate the range and extent of impacts of the proposed MPAs on businesses in various sectors of the fishing industry. Economic data collected in the survey was used to:

Need, Objectives & Methods
25 TAFI Final Report – FRDC 2005/083
− Estimate, in combination with logbook data, the gross revenue forgone by fishers by gear type for each MPA;
− Identify additional costs to fishers of adjusting their areas of operation and/or fishing practices; and
− Estimate the number of jobs lost as a result of cost reducing strategies employed by fishers and processors in adjusting to the MPAs and due to operators going out of business.
Case studies have been selected by sector and de-identified to protect confidentiality. All names are fictitious. 4.3 Developing alternative options
A set of alternative MPA options was developed in consultation with both ASIC and DEH.
The approach adopted was to develop the alternative options through several workshops with the ASIC MPA Working Group and several informal meetings with DEH. The aim of this process was to minimize impacts of the proposed MPA network on the commercial fishing sector while maintaining the biodiversity conservation value of the system. Special account was taken of the constraints imposed by the needs of the Oil and Gas sector.
Results & Discussion
TAFI Final Report – FRDC 2005/083 26
5 Results and Discussion
5.1 Impacts of each candidate MPA
For the network proposed by DEH in the South-east region, MPAs will initially be assigned to either category Ia or VI as follows:
(i) Strict nature reserve (IUCN category Ia) scientific reference site - Subject to conditions set under existing regulations, management plans and permits, this zone allows for scientific research and monitoring and shipping and general transit. All mining exploration and development activities, commercial fishing, recreational and charter fishing are disallowed.
(ii) Habitat protection zone (IUCN category VI) no commercial fishing - Subject to conditions set under existing regulations, management plans and permits, this zone allows for mining exploration and development activities, recreational and charter fishing, shipping and general transit, scientific research and commercial tourism. All commercial fishing activities are disallowed.
(iii) Managed resource protected zone (IUCN category VI) closed to demersal trawl, Danish seine, auto longline, mesh netting, demersal longline, scallop dredge - Subject to conditions set under existing regulations, management plans and permits, this zone allows for mining exploration and development activities, specified commercial fishing methods, recreational and charter fishing, shipping and general transit, scientific research and commercial tourism.
The descriptions and maps of the candidate MPAs are reproduced below with the permission of DEH. Further information can be obtained on the DEH website at: http://www.deh.gov.au/coasts/mpa/index.html.

Results & Discussion
27 TAFI Final Report – FRDC 2005/083
5.1.1 Murray
5.1.1.1 Description
The Murray candidate MPA (Fig. 5.1.1a&b) stretches south of Kangaroo Island off the South Australian coast for a distance of more than 400 kilometres from the inshore State waters to the edge of Australia’s Exclusive Economic Zone. The Murray also extends eastwards to take in representative geomorphic areas. Its total area is more than 20,000 square kilometres.
Figure 5.1.1a. The Murray candidate MPA, an area of 20,794 sq kms (including 1,008 sq kms outside region).

Results & Discussion
TAFI Final Report – FRDC 2005/083 28
Figure 5.1.1b. The Murray candidate MPA, showing the shelf region in more detail.
5.1.1.2 Catch impacts
The fisheries that operate in the area of the Murray candidate MPA include:
− State: Northern Zone Rock Lobster (NZRL)
− Commonwealth: Southern and Eastern Scalefish and Shark Fishery (SESSF) including the Scalefish Hook, Gillnet and Great Australian Bight Trawl sectors.
The primary concern for commercial fisheries involves the Habitat Protection Zone proposed over parts of the continental shelf (Figures 5.1.1a & b) immediately south of Kangaroo Island. The inner part of the near-shore is classed as Habitat Protection Zone, which precludes all commercial fishing. The impact of the MPA will be the
Results & Discussion
29 TAFI Final Report – FRDC 2005/083
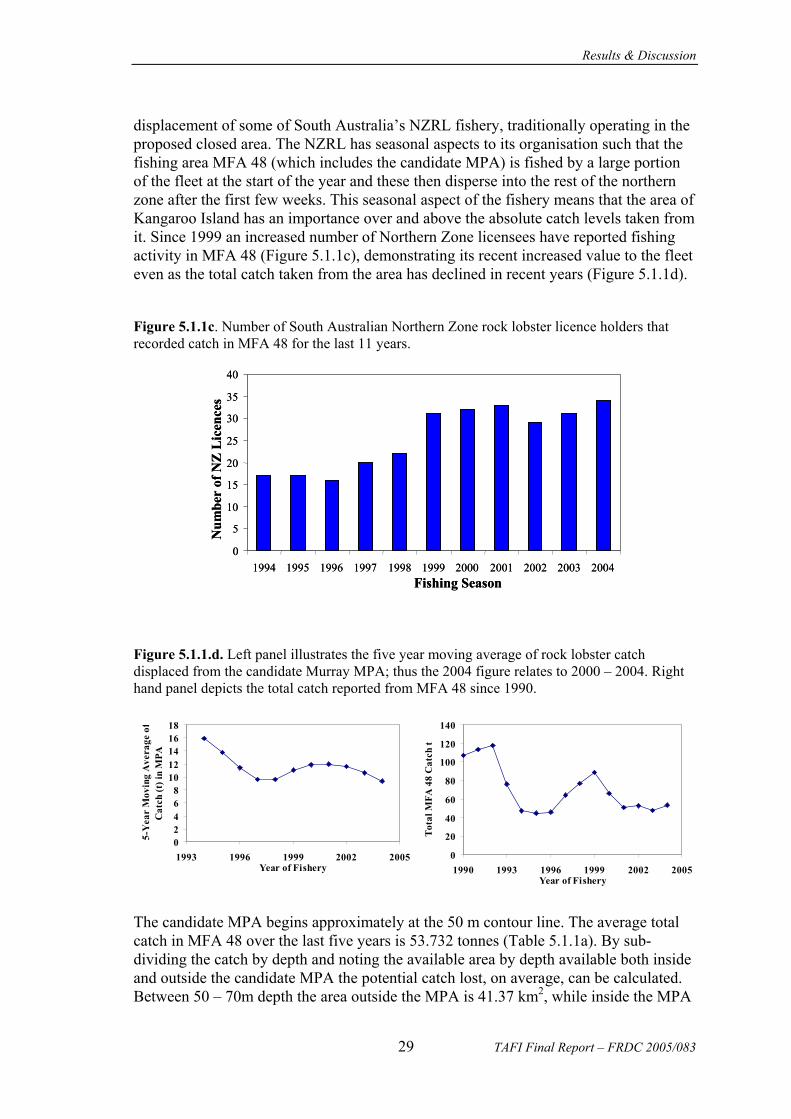
displacement of some of South Australia’s NZRL fishery, traditionally operating in the proposed closed area. The NZRL has seasonal aspects to its organisation such that the fishing area MFA 48 (which includes the candidate MPA) is fished by a large portion of the fleet at the start of the year and these then disperse into the rest of the northern zone after the first few weeks. This seasonal aspect of the fishery means that the area of Kangaroo Island has an importance over and above the absolute catch levels taken from it. Since 1999 an increased number of Northern Zone licensees have reported fishing activity in MFA 48 (Figure 5.1.1c), demonstrating its recent increased value to the fleet even as the total catch taken from the area has declined in recent years (Figure 5.1.1d).
Figure 5.1.1c. Number of South Australian Northern Zone rock lobster licence holders that recorded catch in MFA 48 for the last 11 years.
0
5
10
15
20
25
30
35
40
1994 1995 1996 1997 1998 1999 2000 2001 2002 2003 2004Fishing Season
Num
ber
of N
Z L
icen
ces
0
5
10
15
20
25
30
35
40
1994 1995 1996 1997 1998 1999 2000 2001 2002 2003 2004Fishing Season
Num
ber
of N
Z L
icen
ces
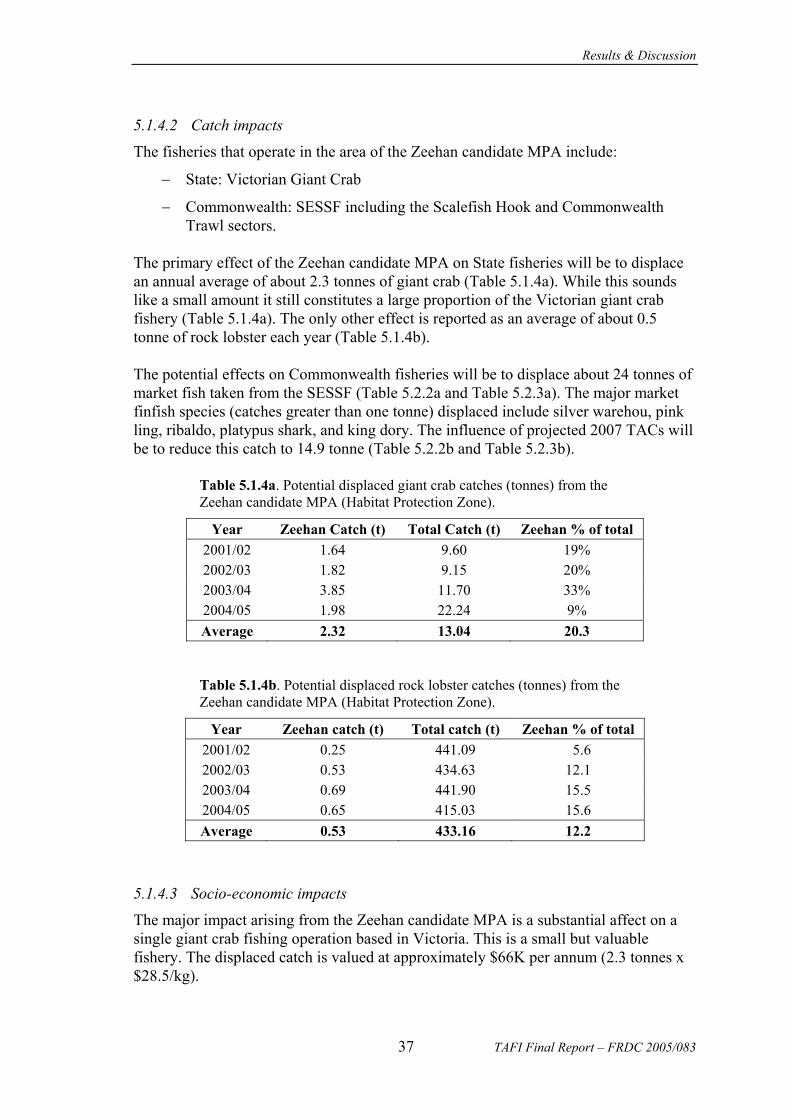
Figure 5.1.1.d. Left panel illustrates the five year moving average of rock lobster catch displaced from the candidate Murray MPA; thus the 2004 figure relates to 2000 – 2004. Right hand panel depicts the total catch reported from MFA 48 since 1990.
0
20
40
60
80
100
120
140
1990 1993 1996 1999 2002 2005Year of Fishery
Tota
l MFA
48
Cat
ch t
02468
1012141618
1993 1996 1999 2002 2005Year of Fishery
5-Y
ear
Mov
ing
Ave
rage
of
Cat
ch (t
) in
MPA
The candidate MPA begins approximately at the 50 m contour line. The average total catch in MFA 48 over the last five years is 53.732 tonnes (Table 5.1.1a). By sub-dividing the catch by depth and noting the available area by depth available both inside and outside the candidate MPA the potential catch lost, on average, can be calculated. Between 50 – 70m depth the area outside the MPA is 41.37 km2, while inside the MPA

Results & Discussion
TAFI Final Report – FRDC 2005/083 30
there are 148.13 km2. Over the last five years the logbook data indicates there was an average catch of 6.492 tonnes between 50 – 70 m, implying that 5.081 tonnes would have been taken in the MPA and 1.411 tonnes outside. The area between 70 – 150m was 2826.72 km2 outside and 1308.98 km2 inside the candidate MPA. Given the average catch from 70 – 150m depth over the last four seasons was 13.235 tonnes this implies 4.182 tonnes were taken inside the MPA and 9.054 tonnes outside (Table 5.1.1a). Therefore, the candidate MPA will lead to a loss of 5.081 + 4.182 tonnes = 9.263 tonnes. This is an average value and with the rebuilding strategy in place would be expected to increase slowly over the next few years to more closely reflect the moving average displaced catches seen in recent years (Figure 5.1.1d). Given these values the average displacement is approximately 17.239% of the total MFA 48 catch. When this value is used to indicate the potential displacement from earlier catches it can be seen that the average displaced catch can vary from 9.37 tonnes up to 15.95 tonnes (Table 5.1.1b). The current fishery management is designed to achieve stock rebuilding with the TAC of 625 tonnes in 2003/2004 (about 70% of the average catch over the past 20 years), with a further reduction in 2004/2005 from 625t to 520t. In its EPBC strategic assessment the fishery was judged as “….. being managed in an ecologically sustainable way, in accordance with the [EPBC] guidelines.” The loss of catch would require a further reduction in the TAC to avoid either a slowing or cessation of the stock rebuilding strategy or the risk of depletion in adjacent areas (Buxton et al. 2006). Naturally a reduction in the number of operators would be needed to maintain the status quo in the fishery (catch rate and profitability).
Table 5.1.1a. The catch impacts of the candidate MPA in Murray. Total average catch from MFA 48 over the last five years was 53.732 tonnes. By estimating the relative area within and outside the candidate MPA by depth it was possible to apportion the catch lost to the MPA.
Depth Range 50-70m 70-150m Total Area km2 Out of MPA 41.37 2826.72
Area km2 in MPA 148.13 1308.98 % Area Inside MPA 78.17 31.65
Total Catch by Depth 6.492t 13.235t 19.727t Catch in MPA 5.081 4.182 9.263t
In addition to the rock lobster losses there would also be average annual losses from the Commonwealth SESSF (mostly market fish and sharks), with a loss of 23.7 tonnes (Table 5.2.2a and Table 5.2.3a). With the projected 2007 TACs this figure does not change appreciably (Table 5.2.2b and Table 5.2.3b). It should be noted, however, that the auto-longline fishery in this area had been excluded from August 2004 until November 2005, which could have biased these figures low. Additionally, the developing slope fishery in the Commonwealth GAB trawl sector will be adversely affected. Catches by this sector in the proposed Murray MPA have increased in recent years. The impacts on the GABTF are largely the loss of potential future grounds as the

Results & Discussion
31 TAFI Final Report – FRDC 2005/083
slope fishery develops further under current arrangements agreed between Industry and AFMA.
Table 5.1.1b. The annual catch (tonnes) taken from MFA 48 along with that potentially displaced from the candidate Murray MPA, with the five year moving average displaced catch through time.
Season Catch (t) Displaced Catch (t) 5-Year Moving Average1990 107.166 18.4741991 113.447 19.5571992 118.122 20.363 15.9471993 76.562 13.198 13.7881994 47.238 8.143 11.4741995 44.547 7.679 9.6291996 46.321 7.985 9.6451997 64.620 11.140 11.0891998 77.034 13.280 11.8401999 89.112 15.362 12.0022000 66.328 11.434 11.5962001 51.032 8.797 10.5952002 52.817 9.105 9.3752003 48.003 8.2752004 53.732 9.263
5.1.1.3 Socio-economic impacts
The socio-economic impacts of the Murray candidate MPA will principally affect the NZRL fishery and is summarised in Case Study 2 – The economic impact of reduced catch from the Northern Zone Rock Lobster fishery on the Kangaroo Island and State economies. The key findings of this analysis were: For a given reduction in catch the following number of boats would need to be removed from the fishery:
- 20 tonne – 2 boats removed from KI and 1 from elsewhere in SA; - 35 tonne – 4 boats removed from KI and 1 from elsewhere in SA; and - 50 tonne – 5 boats removed from KI and 2 from elsewhere in SA.
The estimated quota and boat buyout cost, assuming a 20-50 tonnes displacement of catch, was $5.8-14.2million.

Results & Discussion
TAFI Final Report – FRDC 2005/083 32
5.1.2 Nelson
5.1.2.1 Description
The Nelson candidate MPA (Fig. 5.1.2) takes in more than 6,000 square kilometres of Commonwealth ocean territory in deep water (below 3000 m depth) off the far southeast of South Australia. It spans the deep-water ecosystems of the major biological zone that extends from South Australia to the west of Tasmania.
Figure 5.1.2. The Nelson candidate MPA, encompassing an area of 6,033 sq kms.

Results & Discussion
33 TAFI Final Report – FRDC 2005/083
5.1.2.2 Catch impacts
The fisheries that operate in the area of the Nelson candidate MPA include:
− Commonwealth: Southern and Eastern Scalefish and Shark Fishery (SESSF) including the Scalefish Hook and Commonwealth Trawl sectors.
None of the States have reported any significant catches from the Nelson candidate MPA. A total catch of the order of 673 kg (Table 5.2.3a) is all that has been reported from Commonwealth fisheries, and that was spread among 37 different species. This figure reduces to 573 kg with projected 2007 TACs (Table 5.2.3b). The Candidate MPA in Nelson should have no significant impact on commercial fishing.
5.1.2.3 Socio-economic impacts
None.

Results & Discussion
TAFI Final Report – FRDC 2005/083 34
5.1.3 Apollo
5.1.3.1 Description
The Apollo candidate MPA (Fig. 5.1.3) is located off Apollo Bay on Victoria’s West Coast in shallow waters, mostly 80 to 120 m depths, on the continental shelf. It includes 1,226 square kilometres of Commonwealth ocean territory and encompasses the continental shelf ecosystem of the major biological zone that extends from South Australia to the west of Tasmania. The shelf is a high-energy environment, exposed to large swell waves propagating from the southwest and strong tidal flows.
Figure 5.1.3. The Apollo candidate MPA, encompassing an area of 1,226 sq kms.

Results & Discussion
35 TAFI Final Report – FRDC 2005/083
5.1.3.2 Catch impacts
The fisheries that operate in the area of the Apollo candidate MPA include:
− State: Rock lobster
− Commonwealth: SESSF including the Scalefish Hook, Gillnet and Danish Seine sectors, Southern Squid Jig Fishery and the Bass Strait Central Zone Scallop Fishery.
Given the zoning of the candidate MPA in Apollo no State fisheries will be displaced, but several of the Commonwealth operations will be excluded. The Commonwealth fisheries report a total of about 1,600 kg a year from this area (mostly market fish; Tables 5.2.2a and 5.2.3a), which is spread among several species. This is expected to reduce to approximately 1,400 kg with 2007 TACs (Tables 5.2.2b and 5.2.3b). As a Category VI – multiple use MPA the Apollo candidate MPA will have no significant effect on rock lobster potting and shark gillnetting because they are acceptable methods under the FRA.
5.1.3.3 Socio-economic impacts
The impacts will be minimal; arising from small Commonwealth catches in this area.

Results & Discussion
TAFI Final Report – FRDC 2005/083 36
5.1.4 Zeehan
5.1.4.1 Description
The Zeehan candidate MPA (Fig. 5.1.4) covers an area of more than 20,000 square kilometers to the north and west of Tasmania and two smaller areas close to the north-west corner of Tasmania. It covers a broad depth range from the shallow continental shelf in about 50 m to the abyss in over 3000 m spanning the continental shelf, continental slope and deeper water ecosystems of the major biological zone that extends from South Australia to the west of Tasmania. A significant feature is a series of four submarine canyons that incise the continental slope, extending from the shelf edge to abyssal depths.
Figure 5.1.4. The Zeehan candidate MPA, encompassing an area of 40,783 sq kms.
Results & Discussion
37 TAFI Final Report – FRDC 2005/083
5.1.4.2 Catch impacts
The fisheries that operate in the area of the Zeehan candidate MPA include:
− State: Victorian Giant Crab
− Commonwealth: SESSF including the Scalefish Hook and Commonwealth Trawl sectors.
The primary effect of the Zeehan candidate MPA on State fisheries will be to displace an annual average of about 2.3 tonnes of giant crab (Table 5.1.4a). While this sounds like a small amount it still constitutes a large proportion of the Victorian giant crab fishery (Table 5.1.4a). The only other effect is reported as an average of about 0.5 tonne of rock lobster each year (Table 5.1.4b). The potential effects on Commonwealth fisheries will be to displace about 24 tonnes of market fish taken from the SESSF (Table 5.2.2a and Table 5.2.3a). The major market finfish species (catches greater than one tonne) displaced include silver warehou, pink ling, ribaldo, platypus shark, and king dory. The influence of projected 2007 TACs will be to reduce this catch to 14.9 tonne (Table 5.2.2b and Table 5.2.3b).
Table 5.1.4a. Potential displaced giant crab catches (tonnes) from the Zeehan candidate MPA (Habitat Protection Zone).
Year Zeehan Catch (t) Total Catch (t) Zeehan % of total 2001/02 1.64 9.60 19% 2002/03 1.82 9.15 20% 2003/04 3.85 11.70 33% 2004/05 1.98 22.24 9% Average 2.32 13.04 20.3
Table 5.1.4b. Potential displaced rock lobster catches (tonnes) from the Zeehan candidate MPA (Habitat Protection Zone).
Year Zeehan catch (t) Total catch (t) Zeehan % of total 2001/02 0.25 441.09 5.6 2002/03 0.53 434.63 12.1 2003/04 0.69 441.90 15.5 2004/05 0.65 415.03 15.6 Average 0.53 433.16 12.2
5.1.4.3 Socio-economic impacts
The major impact arising from the Zeehan candidate MPA is a substantial affect on a single giant crab fishing operation based in Victoria. This is a small but valuable fishery. The displaced catch is valued at approximately $66K per annum (2.3 tonnes x $28.5/kg).
Results & Discussion
TAFI Final Report – FRDC 2005/083 38
5.1.5 Tasman Fracture
5.1.5.1 Description
At more than 40,000 square kilometres, the Tasman Fracture (Fig. 5.1.5a&b) is the second largest of the candidate MPAs in the South-east Marine Region. It extends south-west of Tasmania from the continental shelf to the EEZ boundary, 200 nautical miles from land. The Tasman Fracture Zone candidate MPA spans the continental shelf, continental slope and deeper water ecosystems of a primary biological zone to the south of Tasmania. It is scored by steep canyons and encloses other geological features including steep escarpments and troughs, saddles, canyons, basins and part of a plateau that is over 400 kilometres long and rises up to three kilometres above the seafloor.

Results & Discussion
39 TAFI Final Report – FRDC 2005/083
Figure 5.1.5a. The Tasman Fracture candidate MPA, an area of 40,783 sq kms

Results & Discussion
TAFI Final Report – FRDC 2005/083 40
Figure 5.1.5b. The Tasman Fracture candidate MPA, showing the shelf region in more detail.
5.1.5.2 Catch impacts
The fisheries that operate in the area of the Tasman Fracture candidate MPA include:
− State: Rock Lobster and Scalefish
− Commonwealth: SESSF including the Scalefish Hook and Commonwealth Trawl sectors.
In the State fisheries both scalefish (1.37t) and rocklobster (1.5t) are caught in the candidate MPA. In terms of scalefish the only species caught in any quantities include both bastard and striped trumpeter (Table 5.1.5a). The most common catch was striped trumpeter, averaging about 1.37 tonnes a year.

Results & Discussion
41 TAFI Final Report – FRDC 2005/083
Because the Category VI habitat protection zone in the Tasman Fracture candidate MPA is relatively deep (>100m depth) the amount of displaced rock lobster catch is only approximately 1.5 tonnes per annum (Table 5.1.5b). In the Commonwealth fisheries, on the other hand, about 239 tonnes of scalefish will be displaced, which is mostly small pelagics, orange roughy, smooth oreo dory (18t), blue-eye trevalla (17 t; mostly by longlining) and silver warehou (20t). Other displaced species of importance include gummy shark (1t), pink ling (7t), jackass morwong (1.6t), ribaldo (3.6t), blue grenadier (8.4t), mirror dory (3t) and barracouta (8t) (see Tables 5.2.2a and 5.2.3a). Including the projected 2007 TAC adjustments most of the displaced catches are lower and the total would be 114 tonnes (Tables 5.2.2b and 5.2.3b). These differences are primarily due to adjustments in the Commonwealth trawl fishery for orange roughy and smooth oreo dory, which together account for about 61 tonnes. While TAC adjustments will drop the orange roughy TAC to zero for the coming years, there is an Industry expectation that the stock will recover to form a small sustainable fishery in the future.
Table 5.1.5a. With reference to the candidate MPA in the Tasman Fracture, State catches (tonnes) only from waters deeper than 100 m, other species are taken but only in very small quantities. The fishing year extends from July to June each year.
Fishing Year Bastard Trumpeter Striped Trumpeter 94/95 1.127 95/96 0.273 1.807 96/97 0.637 97/98 0.029 0.336 98/99 2.515 99/00 4.944 00/01 0.113 1.595 01/02 1.177 02/03 0.435 03/04 0.012 0.339 04/05 0.016 0.184
Average 94/95 – 04/05 0.089 1.372
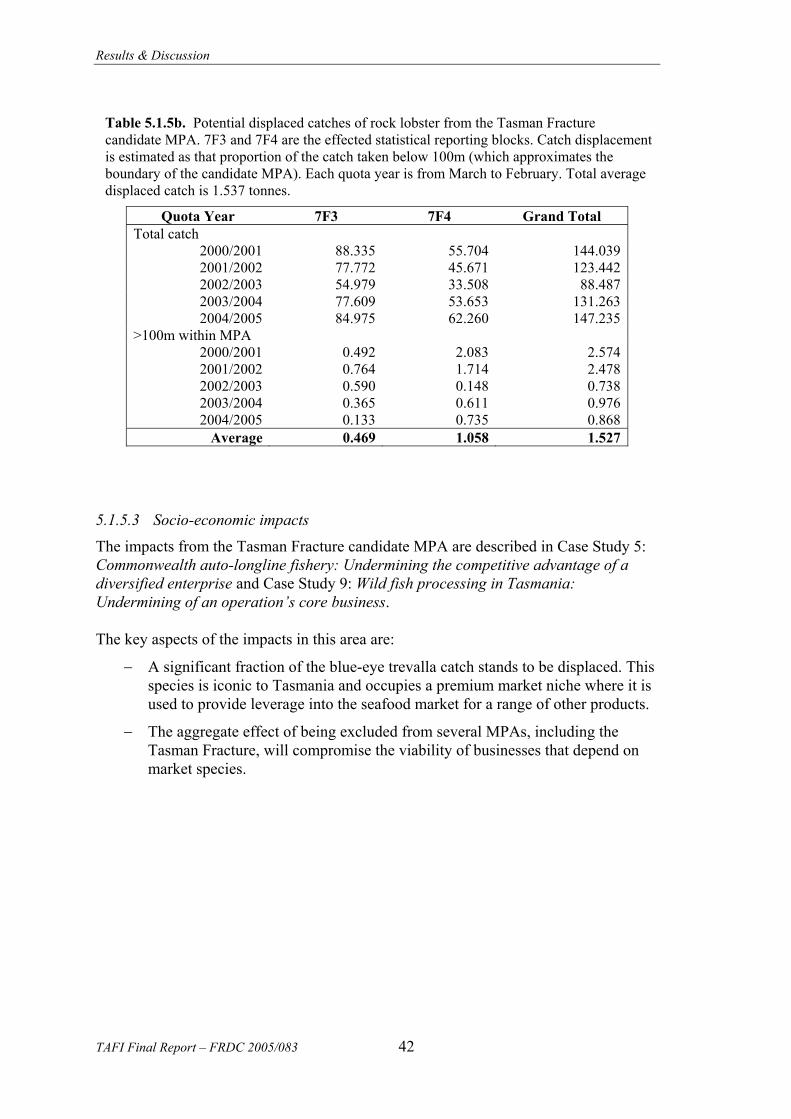
Results & Discussion
TAFI Final Report – FRDC 2005/083 42
Table 5.1.5b. Potential displaced catches of rock lobster from the Tasman Fracture candidate MPA. 7F3 and 7F4 are the effected statistical reporting blocks. Catch displacement is estimated as that proportion of the catch taken below 100m (which approximates the boundary of the candidate MPA). Each quota year is from March to February. Total average displaced catch is 1.537 tonnes.
Quota Year 7F3 7F4 Grand Total Total catch
2000/2001 88.335 55.704 144.039 2001/2002 77.772 45.671 123.442 2002/2003 54.979 33.508 88.487 2003/2004 77.609 53.653 131.263 2004/2005 84.975 62.260 147.235
>100m within MPA 2000/2001 0.492 2.083 2.574 2001/2002 0.764 1.714 2.478 2002/2003 0.590 0.148 0.738 2003/2004 0.365 0.611 0.976 2004/2005 0.133 0.735 0.868
Average 0.469 1.058 1.527
5.1.5.3 Socio-economic impacts
The impacts from the Tasman Fracture candidate MPA are described in Case Study 5: Commonwealth auto-longline fishery: Undermining the competitive advantage of a diversified enterprise and Case Study 9: Wild fish processing in Tasmania: Undermining of an operation’s core business. The key aspects of the impacts in this area are:
− A significant fraction of the blue-eye trevalla catch stands to be displaced. This species is iconic to Tasmania and occupies a premium market niche where it is used to provide leverage into the seafood market for a range of other products.
− The aggregate effect of being excluded from several MPAs, including the Tasman Fracture, will compromise the viability of businesses that depend on market species.

Results & Discussion
43 TAFI Final Report – FRDC 2005/083
5.1.6 Huon
5.1.6.1 Description
The Huon candidate MPA (Fig. 5.1.6) covers just less than 13,000 square kilometres of Commonwealth ocean territory to the south of Tasmania. It covers a broad depth range from the outer continental shelf in about 150 m to the abyss in over 3,000 m. The majority of the area is in deep water. The area spans continental shelf, continental slope and deeper water ecosystems of a primary biological zone to the south of Tasmania. Its most remarkable feature is the cluster of 70 cone-shaped submerged volcanoes, some of which are already contained within the existing Tasmanian Seamounts Marine Reserve.
Figure 5.1.6. The Huon candidate MPA, encompassing an area of 12,779 sq kms.
Results & Discussion
TAFI Final Report – FRDC 2005/083 44
5.1.6.2 Catch impacts
The fisheries that operate in the area of the Huon candidate MPA include:
− State: Rock Lobster and Scalefish
− Commonwealth: SESSF including the Scalefish Hook and Commonwealth Trawl sectors.
There were no significant catches reported from State fisheries operating in the Huon candidate MPA (Table 5.2.1). However, there were approximately 170 tonnes reported from Commonwealth fisheries in this area, much of the detail of which is hidden by the 5-boat rule. Orange roughy (77t) and smooth oreo dory (32t) account for more than half of this displaced catch. A significant proportion of the remaining catch from this area is made up of blue-eye trevalla (11 tonnes taken by longlining), and other market fish, such as silver warehou, pink ling, jackass morwong and tiger flathead (Tables 5.2.2a and 5.2.3a). Including the projected 2007 TAC adjustments the total would be only 51.5 tonnes (Tables 5.2.2b and 5.2.3b), because of a significant reduction in orange roughy and smooth oreo dory catches. The expectation is that the orange roughy stock would recover to permit a small but sustainable yield into the future.
5.1.6.3 Socio-economic impacts
The impacts in this area are similar to those described under the Tasman Fracture candidate MPA. The impact in an individual MPA may not appear to be significant, but collectively they will have a major impact on certain fishing sectors and individual operators.

Results & Discussion
45 TAFI Final Report – FRDC 2005/083
5.1.7 South Tasman Rise
5.1.7.1 Description
The South Tasman Rise candidate MPA (Fig. 5.1.7) covers almost 9,000 square kilometres of deep ocean to the south-east of Tasmania including a section of the mid-continental slope of the South Tasman Rise in 1,200 to 3,000m depth. Its southern edge follows the boundary of the EEZ, 200 nautical miles from land. It spans mid-continental slope and deeper water ecosystems of a primary biological zone to the south of Tasmania. The candidate MPA contains several volcanic seamounts.
Figure 5.1.7. The South Tasman Rise candidate MPA, encompassing an area of 8,696 sq kms.
Results & Discussion
TAFI Final Report – FRDC 2005/083 46
5.1.7.2 Catch impacts
The fisheries that have operated in the area of the Huon candidate MPA include:
− Commonwealth: SESSF including the Scalefish Hook and Commonwealth Trawl sectors.
The South Tasman Rise candidate MPA will impact on catches from Commonwealth fisheries but these are minor (see Tables 5.2.2a & b, and 5.2.3a & b).
5.1.7.3 Socio-economic impacts
None. Historically this area produced significant catches of orange roughy. There may be potential for stock rebuilding but the Industry has not argued to retain access to this area. Most reported catches near this area derive from International waters adjacent to the region.

Results & Discussion
47 TAFI Final Report – FRDC 2005/083
5.1.8 Banks Strait and Offshore Seamounts
5.1.8.1 Description
The Banks Strait candidate MPA (Fig. 5.1.8a & 5.1.9) is the largest in the proposed network covering over 45,000 kilometres of Commonwealth ocean territory from the outer limit of State waters to the outer edge of Australia’s Exclusive Economic Zone, 200 nautical miles off land. It covers a depth range from about 40m on the shallow continental shelf to abyssal depths of 3,000m or more and spans continental shelf, continental slope and deep water ecosystems of the major biological zone that extends around southeastern Australia to the east of Tasmania.
Figure 5.1.8a. The Banks Strait and Offshore Seamounts candidate MPAs showing the shelf region.

Results & Discussion
TAFI Final Report – FRDC 2005/083 48
5.1.8.2 Catch impacts
The fisheries that operate in the area of the Banks Strait candidate MPA include:
− State: Tasmanian Scallops, Rock lobster, Scalefish and Giant Crab
− Commonwealth: SESSF including the Scalefish Hook, Gillnet and Commonwealth Trawl sectors and the Small Pelagic Fishery.
The candidate MPA for Banks Strait and Offshore Seamounts has significant displaced catch implications for both State and Commonwealth fisheries (Tables 5.2.1 & 5.2.2a & b). In the State fisheries for rock lobster (Table 5.1.8a) and giant crab (Table 5.1.8.b) the displaced catches appear relatively minor but make up an average of about 9% of the rock lobster catches in the affected statistical reporting areas and an average of 11.6% of the total east coast catches of giant crab. Both of these quantities constitute a significant displacement of catch if the rebuilding stock strategy in place in the area is to be maintained. In the State scalefish fishery striped trumpeter is almost all caught in the deeper water encompassed by the candidate MPA (Table 5.1.8c). Small amounts of jackass morwong and ocean perch will also be displaced from the State fishery. However, the biggest impact on State fisheries implied by this candidate MPA would be to severely damage the Tasmanian scallop industry. The impact on this Industry will be so large that a separate detailed case study of those impacts has been included in this document (Case Study 3). In brief, however, the candidate MPA Managed Resource Protection Zone will prevent the exploitation of a very large area of scallop beds in Banks Strait in 2007 and 2008 (and possibly in 2009; see Figure 5.1.8b). This area is a very significant part of the detailed spatial management regime recently implemented by the Tasmanian Government. The closure would prevent the TAC from being taken for at least two years (between 8,000 and 12,000 tonnes) and would disrupt the operation of the spatial management with a risk of returning the fishery back to its dysfunctional ‘boom and bust’ days. What is becoming an example of world-class management of scallop stocks (as described at the 15th International Pectinid Workshop held in Mooloolaba in April 2005) will be reduced to a marginal and potentially uneconomical fishery as a result of the candidate Managed Resource Protection Zone in Banks Strait (see Case Study 3). Across several Commonwealth fisheries the estimated total catch displacement was 3,078 tonnes, which included significant amounts of orange roughy (1179t), small pelagics (1,557t; redbait and jack mackerel), blue-eye trevalla (69 t), shark (14 t), and market fish (>100 t) (Tables 5.2.2a and 5.2.3a). Once again, including the projected 2007 TAC adjustments, most of the displaced catches were lower but the total would still be 1,821 tonnes (Tables 5.2.2b and 5.2.3b). The small pelagic fishery (Zone A) will be severely affected with a displacement of at least 49% of its annual catch. This would have the potential to convert this fishery into only a seasonal catch that would negatively impact on marketing.

Results & Discussion
49 TAFI Final Report – FRDC 2005/083
Figure 5.1.8b. The distribution of scallop beds (paddocks) in the candidate Managed Resource Protection Zone in Banks Strait. The left panel illustrates the 87 km2 of scallop beds discovered in 2005 and the right panel illustrates the localization of fishing effort and catch (from VMS data) in another paddock off Eddystone Point when two thirds of the total catch taken in 2003 was outside the State 3nm limit. These areas were to have provided the location of fishing in 2007 and 2008 (and possibly 2009), losing in the first instance 8,000 to 12,000 tonnes of scallops.
A large impact would be felt in the market fishery (part of the SESSF; Table 5.2.2). Over 69 tonnes of blue-eye trevalla would be displaced along with silver warehou (11t), pink ling (30t), jackass morwong (18t), tiger flathead (33t), ribaldo (11t), platypus shark (birdbeak shark) (14t), blue grenadier (27t) and squid (8t). Many other species are taken in smaller amounts each year. The average displaced catch for the period 2000 – 2005, adjusted for the 2007 TAC (Table 5.2.2), fails to provide an indication of the variation in catches obtained from a particular region (Figure 5.1.8c). Clearly, the spatial distribution of the catch taken from different areas varies among years. By removing this important market fishing ground the flexibility of fishing will be reduced and effort will be more concentrated elsewhere. The shark fishery overlaps to a large extent with the scallop fishery (the north-west part of the Banks Strait Managed Resource Protection Zone) and would displace more than 15 tonnes of catch.

Results & Discussion
TAFI Final Report – FRDC 2005/083 50
Figure 5.1.8c. A comparison of the estimate of average historical catch (potential displaced catch) from within the Banks Strait candidate MPA for six market fish species taken in the SESSF. The averages are taken from each year up to and including 2004. The selection of which years to use has a large influence on the apparent average of a number of the species.
Ave
rage
Cat
ch (t
) up
to 2
004
0
10
20
30
40
50
1995 1997 1999 2001 2003 2005
Blue Grenadier
0
10
20
30
40
50
1995 1997 1999 2001 2003 2005A
vera
ge c
atch
up
to 2
004
Spotted Warehou
05
1015202530
1995 1997 1999 2001 2003 2005
Ave
rage
cat
ch u
p to
200
4
Pink Ling
0
10
20
30
40
50
1995 1997 1999 2001 2003 2005
Blue Grenadier
0
10
20
30
40
50
1995 1997 1999 2001 2003 2005A
vera
ge c
atch
up
to 2
004
Spotted Warehou
0
10
20
30
40
50
1995 1997 1999 2001 2003 2005
Spotted Warehou
01995 1997 1999 2001 2003 2005
010203040506070
1995 1997 1999 2001 2003 2005
Ave
rage
Cat
ch u
p to
200
4
Flathead
01020304050607080
1995 1997 1999 2001 2003 2005
Ave
rage
Cat
ch u
p to
200
4
Blue Warehou
10203040506070
Jackass Morwong
10203040506070
Jackass Morwong
01995 1997 1999 2001 2003 2005
010203040506070
1995 1997 1999 2001 2003 2005
Flathead
01995 1997 1999 2001 2003 2005
010203040506070
1995 1997 1999 2001 2003 2005
Flathead
01020304050607080
1995 1997 1999 2001 2003 2005
Ave
rage
Cat
ch u
p to
200
4
Blue Warehou
01020304050607080
1995 1997 1999 2001 2003 2005
Blue Warehou
05
1015202530
1995 1997 1999 2001 2003 2005
Ave
rage
cat
ch u
p to
200
4
Pink Ling
05
1015202530
1995 1997 1999 2001 2003 2005
Pink Ling
Years
Ave
rage
Cat
ch (t
) up
to 2
004
0
10
20
30
40
50
1995 1997 1999 2001 2003 2005
Blue Grenadier
0
10
20
30
40
50
1995 1997 1999 2001 2003 2005A
vera
ge c
atch
up
to 2
004
Spotted Warehou
0
10
20
30
40
50
1995 1997 1999 2001 2003 2005A
vera
ge c
atch
up
to 2
004
Spotted Warehou
05
1015202530
1995 1997 1999 2001 2003 2005
Ave
rage
cat
ch u
p to
200
4
Pink Ling
05
1015202530
1995 1997 1999 2001 2003 2005
Ave
rage
cat
ch u
p to
200
4
Pink Ling
0
10
20
30
40
50
1995 1997 1999 2001 2003 2005
Blue Grenadier
0
10
20
30
40
50
1995 1997 1999 2001 2003 2005A
vera
ge c
atch
up
to 2
004
Spotted Warehou
0
10
20
30
40
50
1995 1997 1999 2001 2003 2005
Spotted Warehou
01995 1997 1999 2001 2003 2005
010203040506070
1995 1997 1999 2001 2003 2005
Ave
rage
Cat
ch u
p to
200
4
Flathead
01995 1997 1999 2001 2003 2005
010203040506070
1995 1997 1999 2001 2003 2005
Ave
rage
Cat
ch u
p to
200
4
Flathead
01020304050607080
1995 1997 1999 2001 2003 2005
Ave
rage
Cat
ch u
p to
200
4
Blue Warehou
01020304050607080
1995 1997 1999 2001 2003 2005
Ave
rage
Cat
ch u
p to
200
4
Blue Warehou
10203040506070
Jackass Morwong
10203040506070
Jackass Morwong
01995 1997 1999 2001 2003 2005
010203040506070
1995 1997 1999 2001 2003 2005
Flathead
01995 1997 1999 2001 2003 2005
010203040506070
1995 1997 1999 2001 2003 2005
Flathead
01020304050607080
1995 1997 1999 2001 2003 2005
Ave
rage
Cat
ch u
p to
200
4
Blue Warehou
01020304050607080
1995 1997 1999 2001 2003 2005
Blue Warehou
05
1015202530
1995 1997 1999 2001 2003 2005
Ave
rage
cat
ch u
p to
200
4
Pink Ling
05
1015202530
1995 1997 1999 2001 2003 2005
Pink Ling
Years
Table 5.1.8a. Rock lobster catches (t) displaced by the habitat protected zone in Banks Strait. Displacement was estimated from catches below 50 m depth i.e. outside of State waters. Quota years extend from March through to the following February. The average annual displaced catch of rock lobster from the Banks Strait candidate MPA is 3.831 tonnes.
Quota Year
5H1 5H2 5H3 5H4 Year Total % Catch
2000/2001 1.398 0.017 1.509 0.044 2.968 8.912 2001/2002 2.039 0 1.158 0.021 3.217 7.667 2002/2003 1.601 0 2.911 0.002 4.513 8.959 2003/2004 1.734 0.021 2.122 0 3.877 8.656 2004/2005 2.832 0.07 1.614 0.061 4.577 11.641 Average 1.921 0.022 1.863 0.026 3.831 9.167

Results & Discussion
51 TAFI Final Report – FRDC 2005/083
Table 5.1.8b. Weight, effort and percentage of east coast and total catch of Giant Crabs taken from the proposed no commercial fishing zone in the Candidate MPA for Banks Strait.
Quota Year 99/00 00/01 01/02 02/03 03/04 04/05 AverageTotal weight
(tonnes) 3.92 7.58 1.88 4.93 0.08 0.58 3.16
Pot days (effort) 3569 10814 2870 6952 79 438 % east coast catch 0.13 0.30 0.07 0.17 0.01 0.03 0.12
% total catch 0.06 0.09 0.02 0.06 <0.01 0.01 0.041
Table 5.1.8c. Total and displaced catches (t) of scalefish from the candidate Banks Strait MPA, data derived from the State fishery commercial catch and effort database from when daily reporting has been required. Each season is from July to June. As the thirty degree reporting grid did not align with the candidate MPAs the catches have been apportioned with respect to depth greater than 50 m, and the relative area of overlap.
94/95 95/96 96/97 97/98 98/99 99/00 00/01 01/02 02/03 03/04 04/05 Average
Total Catches t Striped Trumpeter 3.64 6.25 7.08 8.98 7.79 13.6
4 8.65 6.18 4.34 8.98 2.93 7.13
Bastard Trumpeter 0.83 4.97 3.59 3.06 2.66 2.40 1.87 1.56 1.44 1.01 0.99 2.22
Jackass Morwong 1.42 5.61 3.69 2.88 1.72 5.98 2.03 3.19 1.72 0.87 0.38 2.68
Ocean Perch 0.45 1.38 1.84 1.89 1.56 4.84 1.25 0.42 0.93 1.14 0.71 1.49
Flathead 0.49 2.06 1.43 0.56 1.43 2.56 1.62 1.98 1.35 1.91 0.96 1.49
Wrasse 1.47 5.19 6.31 6.53 6.65 9.80 6.13 5.82 6.82 5.43 5.51 5.97
Displaced Catches t Striped Trumpeter 3.58 5.9 6.44 8.36 7.51 11.3
5 7.92 5.16 4.1 8.39 2.51 6.47
Bastard Trumpeter 0.27 0.84 0.28 0.83 0.07 0.8 0.35 0.32 0.54 0.23 0.34 0.44
Jackass Morwong 1.26 4.03 2.48 2.09 1.29 5.26 1.72 1.71 1.2 0.23 0.22 1.95
Ocean Perch 0.33 1.13 1.67 0.37 1.17 4.15 0.76 0.15 0.4 1.03 0.44 1.05
Flathead 0.05 0.27 0.33 0.07 0.17 1.45 1.08 0.61 0.31 0.41 0.01 0.43
Wrasse 0.29 0.58 0.18 0.39 0.07 1.34 1.05 0.23 0.15 0.07 0.44

Results & Discussion
TAFI Final Report – FRDC 2005/083 52
5.1.8.3 Socio-economic impacts
The impacts of the Banks Strait candidate MPA will be significant. They are described in Case Study 1: A coastal fishing community on Tasmania: A case of reduced diversity through frustrated opportunity and Case Study 7: Tasmanian Scallop fishery-impacts both up and down stream on a vertically integrated enterprise. To a lesser extent all of the other case studies (except for Case Study 2 – Kangaroo Island) impinge on Banks Strait. In summary the Banks Strait candidate MPA will effectively close the Tasmanian Scallop fishery losing markets and export orders, and will have a very significant impact on the blue-eye trevalla fishery (longline and trawl), market fishing in the SESS fishery and the small pelagic fishery. In addition, it will remove any possibility of the orange roughy fishery re-opening following rebuilding. All of these potential losses will have significant impacts on the adjacent St Helens community.

Results & Discussion
53 TAFI Final Report – FRDC 2005/083
5.1.9 Offshore Seamounts
5.1.9.1 Description
The Offshore Seamounts candidate MPA (see Fig. 5.1.9) comprises two distinct zones – a northern area of nearly 6,000 square kilometres that abuts the edge of the EEZ in the Tasman Sea to the north-east of Flinders Island, and a 3,600 square kilometres southern zone encompassing the Cascade Seamount, south-east of Tasmania. The northern zone is proposed as a strict nature zone (IUCN Category Ia). The zoning category for the southern zone is still to be determined. The Offshore Seamounts candidate MPA spans continental slope and deeper water ecosystems of the major biological zone that extends around south-eastern Australia to the east of Tasmania. Its most prominent feature is the Cascade Seamount, which is an important fishery area for orange roughy and deep water oreo dories. Other seamounts in the region are too deep to have been fished.
5.1.9.2 Catch impacts
Only Commonwealth fisheries will be affected by the Offshore Seamounts (north) part of the Candidate MPA for Banks Strait and Offshore Seamounts. The total displaced catch of several species is small but cannot be reported because of the 5-boat rule (Table 5.2.2a). On the Offshore Seamounts (south), the Cascades, a total displaced catch of 1613 tonnes included orange roughy (1391t), smooth oreo dory (187t), blue-eye trevalla (18.7t) and spikey oreo dory (14t). Yet again, including the projected 2007 TAC adjustments produced a significant reduction in the displaced catch down to 231 tonnes (Tables 5.2.2b and 5.2.3b).
5.1.9.3 Socio-economic impacts
The impacts from the Seamount closures in this MPA are described in Case Study 6: Commonwealth Orange Roughy Fishery: Displacement of effort to the high seas and relocation of an enterprise to New Zealand. The risks associated with the displacement of this fishery include increased unregulated high seas fishing, relocation of fishing operations to New Zealand and consequent socio-economic losses to Tasmania (Hobart).

Results & Discussion
TAFI Final Report – FRDC 2005/083 54
Figure 5.1.9. The Banks Strait and Offshore Seamounts candidate MPAs, encompassing an area of 55,234 sq kms.
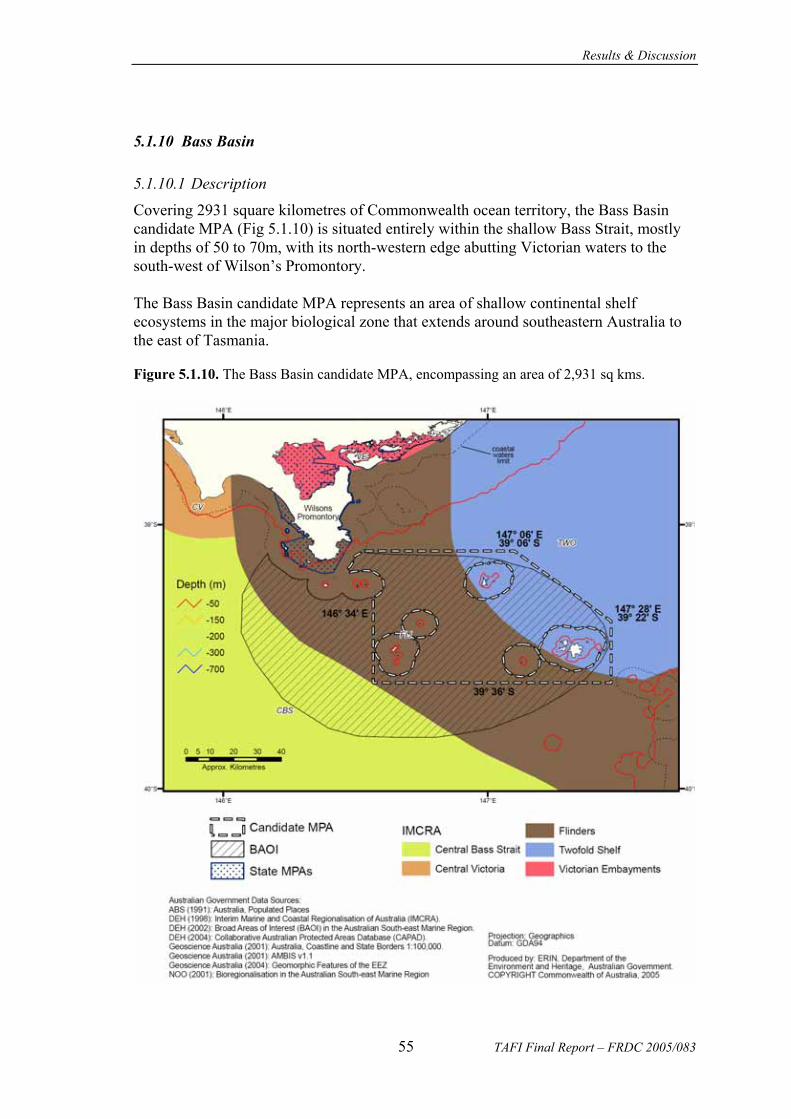
Results & Discussion
55 TAFI Final Report – FRDC 2005/083
5.1.10 Bass Basin
5.1.10.1 Description
Covering 2931 square kilometres of Commonwealth ocean territory, the Bass Basin candidate MPA (Fig 5.1.10) is situated entirely within the shallow Bass Strait, mostly in depths of 50 to 70m, with its north-western edge abutting Victorian waters to the south-west of Wilson’s Promontory. The Bass Basin candidate MPA represents an area of shallow continental shelf ecosystems in the major biological zone that extends around southeastern Australia to the east of Tasmania.
Figure 5.1.10. The Bass Basin candidate MPA, encompassing an area of 2,931 sq kms.

Results & Discussion
TAFI Final Report – FRDC 2005/083 56
5.1.10.2 Catch impacts
The fisheries that operate in the area of the Bass Basin candidate MPA include:
− Commonwealth: SESSF Gillnet sector and the Bass Strait Central Zone Scallop Fishery.
The catch impacts in the Bass Basin are restricted to Commonwealth fisheries as the States have not declared any significant catches from the area. The only fishery affected to any extent is the shark gillnet fishery in which 45.6 tonnes will be displaced (Table 5.2.2a). The Bass Strait Central Zone Scallop fishery is currently closed.
5.1.10.3 Socio-economic impacts
The impacts of the Bass Basin candidate MPA are described in Case Study 4: A Commonwealth Shark Fishery: Loss of an operation’s sheltered winter fishing grounds. The value of the displaced catch sums to be greater than $0.3 million per annum (42 t x $6-8/kg). Smaller operators may be forced to shift their effort into the State waters around the Islands in the Bass Basin because of their inability to operate in more exposed areas or further a field. Larger operators will probably shift their operations into western Bass Strait and/or become seasonal fishers to avoid winter conditions.

Results & Discussion
57 TAFI Final Report – FRDC 2005/083
5.1.11 East Gippsland
5.1.11.1 Description
Covering 4,213 square kilometres of Commonwealth ocean territory, the East Gippsland candidate MPA (Fig 5.1.10) contains representative samples of an extensive network of canyons, continental slope and escarpment in depths from 600m to deeper than 4,000m. The area includes both tropical and temperate waters and phytoplankton communities. Complex seasonality in oceanographic patterns influences biodiversity and local productivity. There are summertime incursions of the warm East Australian Current, and a wintertime cascade of cold water from Bass Strait that sinks along the upper slope and forms a temperature front. Upwelling of nutrient-rich water occurs along the edge of this front and supports enhanced productivity levels over the upper continental slope. Geomorphic features include significant rocky-substrate habitat types, including submarine canyons, escarpments and a knoll protruding from the base of the slope. The area may also include foraging area for wandering albatross.
5.1.11.2 Catch impacts
The fisheries that operate in the area of the East Gippsland candidate MPA include:
− Commonwealth: SESSF including the Scalefish Hook and Commonwealth Trawl sectors and the Tuna and Billfish Fisheries.
The impact of the candidate MPA in the East Gippsland will be primarily on Commonwealth fisheries. A total of 29 tonnes will be displaced from this area and this includes blue-eye trevalla, jack mackerel and skipjack tuna (17t). Nearly two tonnes of yellowfin tuna are also taken from this area. These figures do not change significantly with the 2007 TAC adjustments.
5.1.11.3 Socio-economic impacts
The impacts from this MPA appear to be minor. None of the respondents to the survey specifically addressed this area.
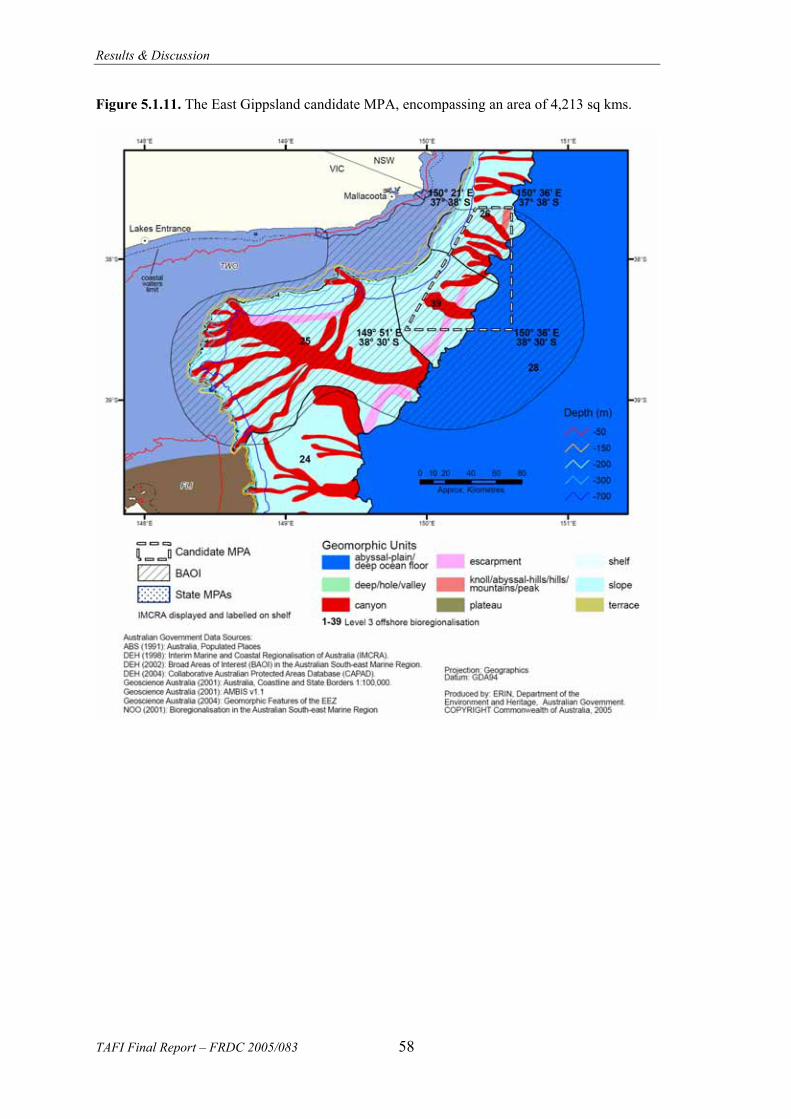
Results & Discussion
TAFI Final Report – FRDC 2005/083 58
Figure 5.1.11. The East Gippsland candidate MPA, encompassing an area of 4,213 sq kms.
Results & Discussion
59 TAFI Final Report – FRDC 2005/083
5.2 Overall impact of MPAs on catch of major species in South-east Region
In the State-based fisheries only a few species appear likely to be adversely affected by the proposed network of MPAs and only four of the candidate MPAs were reported to have significant displaced catches (Table 5.2.1). The most significant impact would be on the Tasmanian scallop fishery where an estimated 12,000t will be lost over the period 2007-09. The significance of this loss is compounded by the fact that this fishery has undergone significant changes to its operation and management is now considered to be sustainable with an annual TAC of 4,000t. This on-going sustainability will be lost as a consequence of the closure. The paddock based detailed spatial management system will be severely disrupted and possibly will cease to work its benefits. The key issue is that the paddock fisheries management strategy cannot operate without the scallop beds that are found in the proposed MPA. Thus the entire fishery is compromised. The next most important is State managed fisheries for rock lobster where a total displacement of around 14 tonnes from South Australia and Tasmania is reported. In aggregate the Scalefishery will also be affected, especially in Tasmania, and particularly for striped trumpeter (6.5t). In Commonwealth based fisheries (Table 5.2.2 – 5.2.4) the largest impacts will obviously be on the orange roughy fishery with a displacement in terms of catch history of almost 2,700 tonnes (Table 5.2.2a). The effects of the candidate MPAs on the orange roughy fishery are obscured by the recent changes to the TAC. For example, the TAC on the Cascade orange roughy grounds has been reduced to 700 tonnes for 2006 and, contingent on the results of an Industry based survey the TAC for 2007 may be as low as 214 tonnes. The TACs for elsewhere may contract to effectively zero, though it is possible that a research TAC will be maintained in some areas. The overall effect of the candidate MPAs, however, will be to preclude the re-establishment of the orange roughy fishery should the stocks rebuild and even shut down the last remaining fishery should the candidate MPA over the Cascade fishing ground be implemented. There will also be a major impact on the small pelagic fishery with significant catches of redbait and jack mackerel being displaced. So much catch will be displaced that it is doubtful whether it could all be caught elsewhere, especially for the same cost of operation. The combined effect of the candidate Banks Strait MPA and the Tasman Fracture MPA would severely damage the small pelagic fishery. In addition significant amounts of the iconic blue-eyed trevalla fishery will be lost (123t), with important amounts of gummy shark (84t), other sharks and rays (49t), silver warehou (41t), pink ling (48t), jackass morwong (25t), flathead (43t), ribaldo (21t), blue grenadier (44t) and squid (9.6t) and other market fish being lost or displaced. The value of these catches (as GVP) as they are distributed among the different fishing methods is described in Table 5.2.3b and Table 5.2.4b. The impact of the orange

Results & Discussion
TAFI Final Report – FRDC 2005/083 60
roughy reductions is the biggest effect in the Commonwealth but the market fish and shark fisheries are also valuable.
Table 5.2.1 Estimated annual displaced catch (tonnes), as determined by the average annual catch during 2000 – 2004 for State fisheries only. Those candidate MPAs not shown were not deemed to have significant State based catches.
Common name Murray Zeehan Tasman Fracture
Banks Strait
Totals
Rock lobster 9.37 0.53 1.52 2.53 13.95 Giant crab 2.32 4.58 6.90 Commercial scallop 4,000.00 4,000.00 Striped trumpeter 0.75 5.62 6.37 Bastard trumpeter 0.05 0.36 0.41 Jackass morwong 1.02 1.02 Ocean perch 0.56 0.56 Flathead 0.48 0.48 Wrasse 0.38 0.38 Total 9.37 2.85 2.32 4,015.53 4,030.07

Results & Discussion
61 TAFI Final Report – FRDC 2005/083
Table 5.2.2a. Mean annual displaced catch (kg) for Commonwealth managed species taken within candidate MPAs. * Denotes data confidential, less than 5 boats. Commonwealth catch data (2000-05) are from operation position. Offshore Seamounts (North) is omitted as only confidential records were present. Species described are restricted to those with catches greater than 100 kg. Species Common Name Candidate MPA Zones Totals
M
urra
y - I
a
Mur
ray
- VI (
no
com
mer
cial
fish
ing)
Nel
son
- VI (
no
com
mer
cial
fish
ing)
Apo
llo -
VI
Zee
han
- VI (
no
com
mer
cial
fish
ing)
Zee
han
(mid
) - V
I
Zee
han
(Nor
th-e
ast)
- V
I
Tas
man
Fra
ctur
e - I
a
Tas
man
Fra
ctur
e - V
I
Tas
man
Fra
ctur
e - V
I (n
o co
mm
erci
al
fishi
ng)
Huo
n - I
a
Huo
n - V
I
Sout
h T
asm
an R
ise
- V
I (no
com
mer
cial
fis
hing
) B
anks
Str
ait -
VI
Ban
ks S
trai
t - V
I (no
co
mm
erci
al fi
shin
g)
Ban
ks S
trai
t and
O
ffsh
ore
Seam
ount
s -
Ia
Off
shor
e Se
amou
nts
(Sou
th) -
zon
ing
yet t
o be
det
erm
ined
Bas
s Bas
in -
VI (
no
com
mer
cial
fish
ing)
Eas
t Gip
psla
nd -
VI
Overall Total 737 23969 673 1581 22215 962 421 177513 59574 1936 484 169992 181 98880 2897357 81471 1613121 49327 28757 5352117 Visible Total 705 23056 535 1078 21847 962 402 164520 59376 1847 0 169488 97858 2894584 81019 1611443 48361 28333 5327906 orange roughy 149 * * 1671 17 * 37247 6105 * * 77008 * 394 1143982 34720 1390764 * 178 2692437 redbait 130 0 69427 833 1038372 3472 1112234 common jack mackerel 43 7303 6 518616 3790 16 631290 smooth oreo dory * * 1361 * 16121 1581 * 32084 * 693 4499 1678 187081 * * 245125 blue-eye trevalla 113 5383 * * 583 14 11379 5604 * * 11149 * 19567 31405 18615 18975 5 5 123149 gummy shark 17 5131 171 112 177 7 357 939 160 335 * 5602 6460 2006 34992 58 56524 pink ling 23 977 37 8 2288 273 2504 4789 84 5299 * 13850 11134 5670 * 13 502 47666 spikey oreo dory * 483 * * 2328 * * 7336 509 13 2706 * 208 15230 2014 14623 * 29 45585 blue grenadier 30 2374 107 3 2985 102 * 1294 7096 1370 1324 * 14129 12261 1508 * * 76 44673 tiger flathead 4 3 * 438 36 70 * 21 153 8069 * 9379 23966 117 * 102 600 42963 silver warehou 266 1069 48 * 2047 127 4745 15056 371 5602 * 5112 6541 101 18 304 41431 jackass morwong 26 87 48 264 11 284 * 828 764 * * 3977 * 3529 14390 84 * 22 209 24540 barracouta * * * * * * * 7878 * 73 205 4055 12 * 88 22557 ribaldo * 86 * * 1023 14 * 1580 2049 9 5093 2600 7547 1467 * * 64 21630 skipjack tuna * 17335 19336 platypus shark * * 1441 * * 77 * 165 11971 2016 * * 15770 squid * 5 * 2 8 * * 176 * 205 3086 5581 35 * 72 9679 reef ocean perch * 100 6 * 893 8 * 368 594 * 590 * 2744 2598 811 * 4 249 9088 king dory 24 200 * 7 2906 14 275 862 * 356 2625 1065 136 * 5 8496 mirror dory 29 158 15 * 247 * 692 2346 * * 646 * 2275 323 79 * 1 227 7050 school shark 32 2933 10 6 433 5 18 869 407 482 347 171 42 * 1093 3 6851 blue warehou * 138 0 * * 15 2227 * 635 3176 1 80 61 6346 stargazers 12 12 14 * 47 * 547 1029 * 3748 * 91 454 * 10 3 6031 hapuku 75 759 11 67 12 * * 159 3754 581 * * 5445 Gould's squid 12 124 25 28 31 * 36 477 * * 325 * 1592 2439 3 * 36 194 5323 southern sawshark * 41 4 0 4 0 1 11 * 1 267 4584 4928 alfonsino * * * 16 9 22 * 1373 2699 275 * * 4628

Results & Discussion
TAFI Final Report – FRDC 2005/083 62
Table 5.2.2a [cont:]
Mur
ray
- Ia
Mur
ray
- VI (
no
com
mer
cial
fish
ing)
Nel
son
- VI (
no
com
mer
cial
fish
ing)
Apo
llo -
VI
Zee
han
- VI (
no
com
mer
cial
fish
ing)
Zee
han
(mid
) - V
I
Zee
han
(Nor
th-e
ast)
- V
I
Tas
man
Fra
ctur
e - I
a
Tas
man
Fra
ctur
e - V
I
Tas
man
Fra
ctur
e - V
I (n
o co
mm
erci
al fi
shin
g)
Huo
n - I
a
Huo
n - V
I
Sout
h T
asm
an R
ise
- VI
(no
com
mer
cial
fish
ing)
Ban
ks S
trai
t - V
I
Ban
ks S
trai
t - V
I (no
co
mm
erci
al fi
shin
g)
Ban
ks S
trai
t and
O
ffsh
ore
Seam
ount
s - Ia
Off
shor
e Se
amou
nts
(Sou
th) -
zon
ing
yet t
o be
de
term
ined
Bas
s Bas
in -
VI (
no
com
mer
cial
fish
ing)
Eas
t Gip
psla
nd -
VI (
no
com
mer
cial
fish
ing)
TO
TA
L
blue mackerel * 4105 * 4614 common sawshark 129 * 3 48 1 1 * 3 162 145 4072 4610 red gurnard * 4 * * * 84 331 * 2852 * 389 603 5 32 4 4449 cardinalfishes and long- finned pike 1660 2701 * * 4368
[dogfishes] * * * * 464 * * * 111 * 189 82 2250 311 * * * 4221 octopods * * 2 2 * * 3 9 64 * 1170 2094 18 * 106 24 3494 gemfish 13 771 5 6 * 21 8 * 149 * 1128 652 455 * * 45 3253 latchet * 49 * 3 5 87 326 * 1124 * 222 1155 * 1 15 2995 fishes 29 43 * * 588 7 * * 55 * * 826 1168 17 * * 77 2941 yellowfin tuna * 2489 2492 cuttlefish * * * * * * * * * 66 * 697 1052 10 * 573 23 2437 Elephantfish 18 * 44 23 4 0 43 62 * 23 106 320 96 1007 4 1750 silky shark * * boarfishes 100 4 17 * 16 * 128 134 649 15 439 1 1504 shortfin mako * * * 3 122 509 339 68 370 1446 swordfish 382 * 1025 1417 frostfish * * * * * * 757 376 * 100 1346 bigeye tuna * 982 1338 white warehou * 398 284 53 88 415 10 1248 broadnose shark * 77 10 103 27 0 25 54 9 7 179 71 34 500 * 1099 longsnout dogfish * 79 * 32 * 98 * 176 235 * * 1028 albacore 75 * 784 973 silver dory * * * 63 176 * 220 * 34 134 * * 4 19 875 skates * * * * * * 50 * 264 359 34 * 17 814 sawsharks * 7 * * 4 * * * 109 * 130 266 * * * 3 776 dories * * * * * 686 dogfishes * * * 24 * * * 213 71 215 * * 4 649 rudderfish * * * * * * * 5 224 * * * 381 638 triggerfishes and leatherjackets * 1 * * * 48 372 38 * 19 151 633
Fishes * 26 10 27 37 * * * * * * 146 210 12 * * 20 618 rubyfish * * * 504 redfish * 31 * * * * * 39 32 * 376 499

Results & Discussion
63 TAFI Final Report – FRDC 2005/083
Table 5.2.2a [cont:]
Mur
ray
- Ia
Mur
ray
- VI (
no
com
mer
cial
fish
ing)
Nel
son
- VI (
no
com
mer
cial
fish
ing)
Apo
llo -
VI
Zee
han
- VI (
no
com
mer
cial
fish
ing)
Zee
han
(mid
) - V
I
Zee
han
(Nor
th-e
ast)
- V
I
Tas
man
Fra
ctur
e - I
a
Tas
man
Fra
ctur
e - V
I
Tas
man
Fra
ctur
e - V
I (n
o co
mm
erci
al fi
shin
g)
Huo
n - I
a
Huo
n - V
I
Sout
h T
asm
an R
ise
- VI
(no
com
mer
cial
fish
ing)
Ban
ks S
trai
t - V
I
Ban
ks S
trai
t - V
I (no
co
mm
erci
al fi
shin
g)
Ban
ks S
trai
t and
O
ffsh
ore
Seam
ount
s - Ia
Off
shor
e Se
amou
nts
(Sou
th) -
zon
ing
yet t
o be
de
term
ined
Bas
s Bas
in -
VI (
no
com
mer
cial
fish
ing)
Eas
t Gip
psla
nd -
VI (
no
com
mer
cial
fish
ing)
TO
TA
L
striped marlin 468 468 spikey dogfish * 56 * * 85 2 26 110 22 77 34 * 424 snapper * 15 2 11 * * 392 * 422 shortnose chimaeras * * * * 50 73 32 73 156 25 * * 419 blue shark 5 * 42 8 * 26 1 81 51 169 395 southern bluefin tuna * * * * * 370 conger eels * * 352 * * * * 361 oxeye oreodory * * * * unknown/other * * 164 155 * * 345 striped trumpeter 39 38 28 * 35 95 108 * * 345 deepwater flathead * 62 * * * * * * * * * 335 gastropods * * * * * * 184 * 21 1 324 john dory 0 1 * * * * * 26 122 3 * 10 105 269 whiskery shark 250 * 250 sharks (other) * * * * * 36 * * * 18 220 deepsea scorpionfish * * * * * * 208 bronze whaler 149 * * 12 42 207 shovelnose rays * * * * * * * 67 66 * * 25 19 193 escolar 183 183 bailer shell * * * * 80 * * * * 170 holothurian * * crabs * * * * 73 36 * 19 157 octopuses * 143 * 156 blue morwong 141 8 * 2 * 152 warty oreodory * * ocean perch * 123 * 144 eastern school whiting * * 1 128 Australian angelshark * * * * * 2 * * 17 121 imperador * * * 119 thresher shark * * 37 26 35 * 110 bight redfish 108 * * 109 hapuku 92 * 1 6 106 cuttlefish * 13 84 * 104 roughskin dogfish * * 99 102
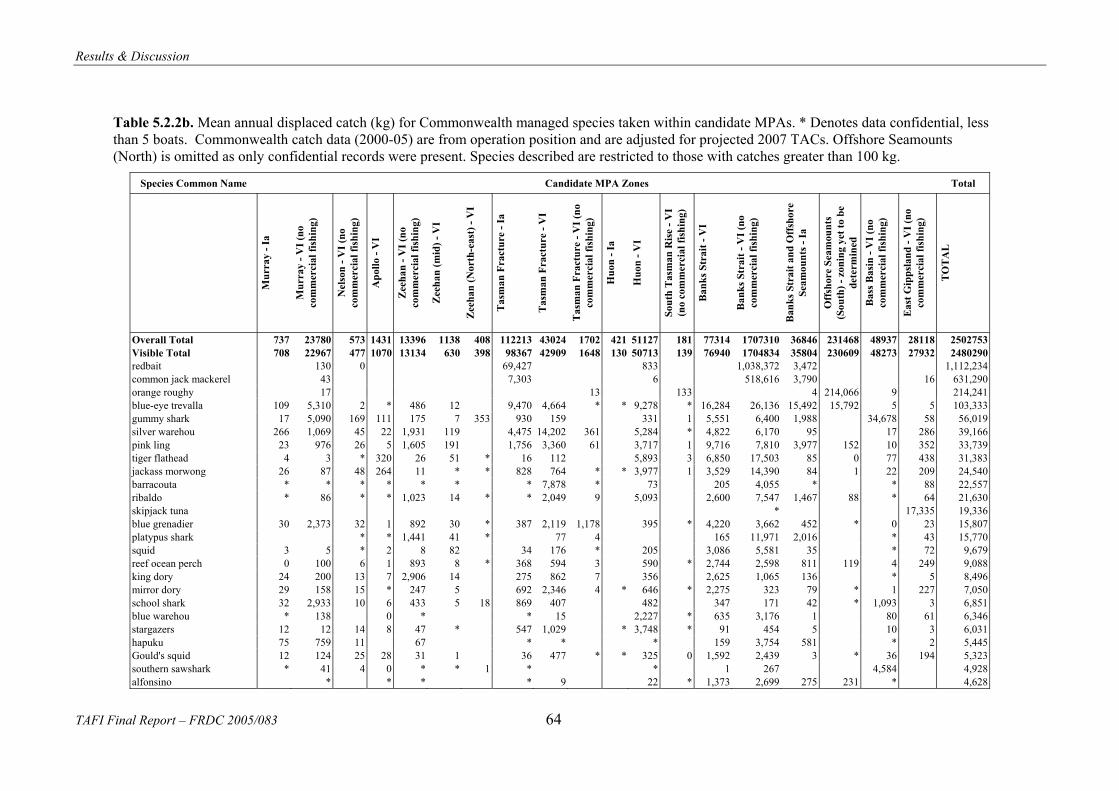
Results & Discussion
TAFI Final Report – FRDC 2005/083 64
Table 5.2.2b. Mean annual displaced catch (kg) for Commonwealth managed species taken within candidate MPAs. * Denotes data confidential, less than 5 boats. Commonwealth catch data (2000-05) are from operation position and are adjusted for projected 2007 TACs. Offshore Seamounts (North) is omitted as only confidential records were present. Species described are restricted to those with catches greater than 100 kg.
Species Common Name Candidate MPA Zones Total
Mur
ray
- Ia
Mur
ray
- VI (
no
com
mer
cial
fish
ing)
Nel
son
- VI (
no
com
mer
cial
fish
ing)
Apo
llo -
VI
Zee
han
- VI (
no
com
mer
cial
fish
ing)
Zee
han
(mid
) - V
I
Zee
han
(Nor
th-e
ast)
- V
I
Tas
man
Fra
ctur
e - I
a
Tas
man
Fra
ctur
e - V
I
Tas
man
Fra
ctur
e - V
I (no
co
mm
erci
al fi
shin
g)
Huo
n - I
a
Huo
n - V
I
Sout
h T
asm
an R
ise
- VI
(no
com
mer
cial
fish
ing)
Ban
ks S
trai
t - V
I
Ban
ks S
trai
t - V
I (no
co
mm
erci
al fi
shin
g)
Ban
ks S
trai
t and
Off
shor
e Se
amou
nts -
Ia
Off
shor
e Se
amou
nts
(Sou
th) -
zon
ing
yet t
o be
de
term
ined
B
ass B
asin
- V
I (no
co
mm
erci
al fi
shin
g)
Eas
t Gip
psla
nd -
VI (
no
com
mer
cial
fish
ing)
TO
TA
L
Overall Total 737 23780 573 1431 13396 1138 408 112213 43024 1702 421 51127 181 77314 1707310 36846 231468 48937 28118 2502753 Visible Total 708 22967 477 1070 13134 630 398 98367 42909 1648 130 50713 139 76940 1704834 35804 230609 48273 27932 2480290 redbait 130 0 69,427 833 1,038,372 3,472 1,112,234 common jack mackerel 43 7,303 6 518,616 3,790 16 631,290 orange roughy 17 13 133 4 214,066 9 214,241 blue-eye trevalla 109 5,310 2 * 486 12 9,470 4,664 * * 9,278 * 16,284 26,136 15,492 15,792 5 5 103,333 gummy shark 17 5,090 169 111 175 7 353 930 159 331 1 5,551 6,400 1,988 34,678 58 56,019 silver warehou 266 1,069 45 22 1,931 119 4,475 14,202 361 5,284 * 4,822 6,170 95 17 286 39,166 pink ling 23 976 26 5 1,605 191 1,756 3,360 61 3,717 1 9,716 7,810 3,977 152 10 352 33,739 tiger flathead 4 3 * 320 26 51 * 16 112 5,893 3 6,850 17,503 85 0 77 438 31,383 jackass morwong 26 87 48 264 11 * * 828 764 * * 3,977 1 3,529 14,390 84 1 22 209 24,540 barracouta * * * * * * * 7,878 * 73 205 4,055 * * 88 22,557 ribaldo * 86 * * 1,023 14 * * 2,049 9 5,093 2,600 7,547 1,467 88 * 64 21,630 skipjack tuna * 17,335 19,336 blue grenadier 30 2,373 32 1 892 30 * 387 2,119 1,178 395 * 4,220 3,662 452 * 0 23 15,807 platypus shark * * 1,441 41 * 77 4 165 11,971 2,016 * 43 15,770 squid 3 5 * 2 8 82 34 176 * 205 3,086 5,581 35 * 72 9,679 reef ocean perch 0 100 6 1 893 8 * 368 594 3 590 * 2,744 2,598 811 119 4 249 9,088 king dory 24 200 13 7 2,906 14 275 862 7 356 2,625 1,065 136 * 5 8,496 mirror dory 29 158 15 * 247 5 692 2,346 4 * 646 * 2,275 323 79 * 1 227 7,050 school shark 32 2,933 10 6 433 5 18 869 407 482 347 171 42 * 1,093 3 6,851 blue warehou * 138 0 * * 15 2,227 * 635 3,176 1 80 61 6,346 stargazers 12 12 14 8 47 * 547 1,029 * 3,748 * 91 454 5 10 3 6,031 hapuku 75 759 11 67 * * * 159 3,754 581 * 2 5,445 Gould's squid 12 124 25 28 31 1 36 477 * * 325 0 1,592 2,439 3 * 36 194 5,323 southern sawshark * 41 4 0 * * 1 * * 1 267 4,584 4,928 alfonsino * * * * 9 22 * 1,373 2,699 275 231 * 4,628
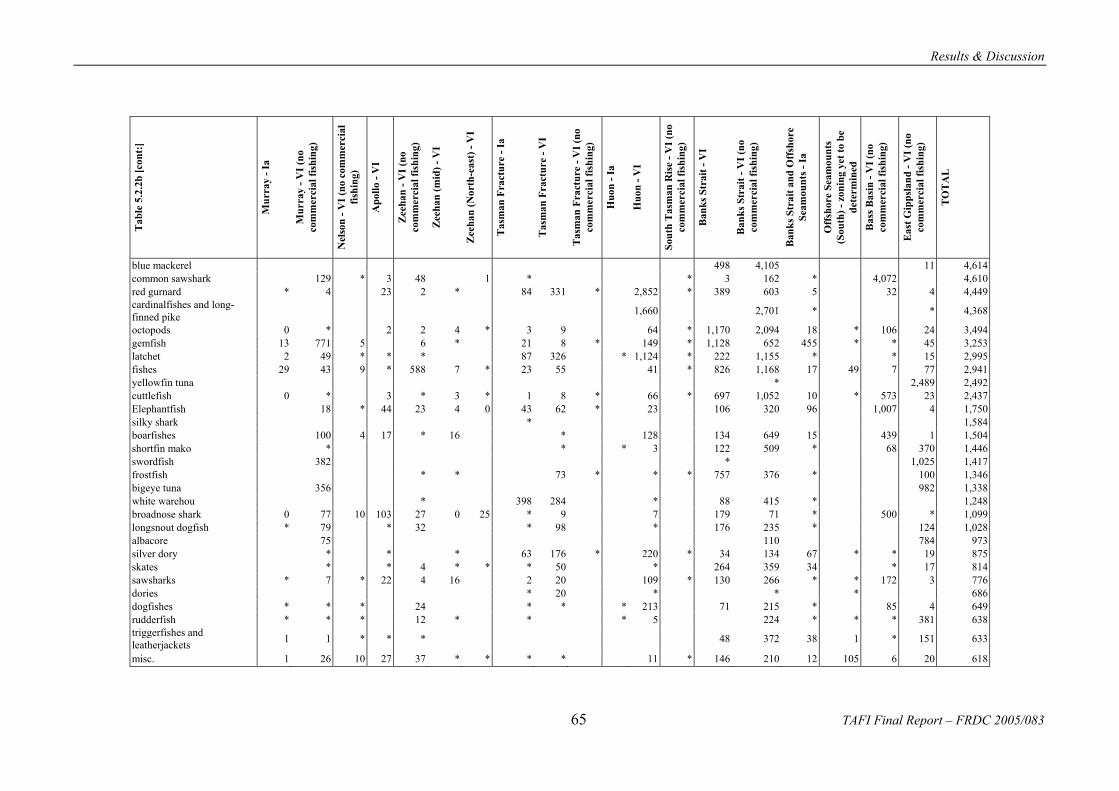
Results & Discussion
65 TAFI Final Report – FRDC 2005/083
Tab
le 5
.2.2
b [c
ont:
]
Mur
ray
- Ia
Mur
ray
- VI (
no
com
mer
cial
fish
ing)
Nel
son
- VI (
no c
omm
erci
al
fishi
ng)
Apo
llo -
VI
Zee
han
- VI (
no
com
mer
cial
fish
ing)
Zee
han
(mid
) - V
I
Zee
han
(Nor
th-e
ast)
- V
I
Tas
man
Fra
ctur
e - I
a
Tas
man
Fra
ctur
e - V
I
Tas
man
Fra
ctur
e - V
I (no
co
mm
erci
al fi
shin
g)
Huo
n - I
a
Huo
n - V
I
Sout
h T
asm
an R
ise
- VI (
no
com
mer
cial
fish
ing)
Ban
ks S
trai
t - V
I
Ban
ks S
trai
t - V
I (no
co
mm
erci
al fi
shin
g)
Ban
ks S
trai
t and
Off
shor
e Se
amou
nts -
Ia
Off
shor
e Se
amou
nts
(Sou
th) -
zon
ing
yet t
o be
de
term
ined
B
ass B
asin
- V
I (no
co
mm
erci
al fi
shin
g)
Eas
t Gip
psla
nd -
VI (
no
com
mer
cial
fish
ing)
TO
TA
L
blue mackerel 498 4,105 11 4,614 common sawshark 129 * 3 48 1 * * 3 162 * 4,072 4,610 red gurnard * 4 23 2 * 84 331 * 2,852 * 389 603 5 32 4 4,449 cardinalfishes and long-finned pike 1,660 2,701 * * 4,368
octopods 0 * 2 2 4 * 3 9 64 * 1,170 2,094 18 * 106 24 3,494 gemfish 13 771 5 6 * 21 8 * 149 * 1,128 652 455 * * 45 3,253 latchet 2 49 * * * 87 326 * 1,124 * 222 1,155 * * 15 2,995 fishes 29 43 9 * 588 7 * 23 55 41 * 826 1,168 17 49 7 77 2,941 yellowfin tuna * 2,489 2,492 cuttlefish 0 * 3 * 3 * 1 8 * 66 * 697 1,052 10 * 573 23 2,437 Elephantfish 18 * 44 23 4 0 43 62 * 23 106 320 96 1,007 4 1,750 silky shark * 1,584 boarfishes 100 4 17 * 16 * 128 134 649 15 439 1 1,504 shortfin mako * * * 3 122 509 * 68 370 1,446 swordfish 382 * 1,025 1,417 frostfish * * 73 * * * 757 376 * 100 1,346 bigeye tuna 356 982 1,338 white warehou * 398 284 * 88 415 * 1,248 broadnose shark 0 77 10 103 27 0 25 * 9 7 179 71 * 500 * 1,099 longsnout dogfish * 79 * 32 * 98 * 176 235 * 124 1,028 albacore 75 110 784 973 silver dory * * * 63 176 * 220 * 34 134 67 * * 19 875 skates * * 4 * * * 50 * 264 359 34 * 17 814 sawsharks * 7 * 22 4 16 2 20 109 * 130 266 * * 172 3 776 dories * 20 * * * 686 dogfishes * * * 24 * * * 213 71 215 * 85 4 649 rudderfish * * * 12 * * * 5 224 * * * 381 638 triggerfishes and leatherjackets 1 1 * * * 48 372 38 1 * 151 633
misc. 1 26 10 27 37 * * * * 11 * 146 210 12 105 6 20 618

Results & Discussion
TAFI Final Report – FRDC 2005/083 66
Tab
le 5
.2.2
b [c
ont:
]
Mur
ray
- Ia
Mur
ray
- VI (
no c
omm
erci
al
fishi
ng)
Nel
son
- VI (
no c
omm
erci
al
fishi
ng)
Apo
llo -
VI
Zee
han
- VI (
no c
omm
erci
al
fishi
ng)
Zee
han
(mid
) - V
I
Zee
han
(Nor
th-e
ast)
- V
I
Tas
man
Fra
ctur
e - I
a
Tas
man
Fra
ctur
e - V
I
Tas
man
Fra
ctur
e - V
I (no
co
mm
erci
al fi
shin
g)
Huo
n - I
a
Huo
n - V
I
Sout
h T
asm
an R
ise
- VI (
no
com
mer
cial
fish
ing)
Ban
ks S
trai
t - V
I
Ban
ks S
trai
t - V
I (no
co
mm
erci
al fi
shin
g)
Ban
ks S
trai
t and
Off
shor
e Se
amou
nts -
Ia
Off
shor
e Se
amou
nts (
Sout
h) -
zoni
ng y
et to
be
dete
rmin
ed
Bas
s Bas
in -
VI (
no
com
mer
cial
fish
ing)
Eas
t Gip
psla
nd -
VI (
no
com
mer
cial
fish
ing)
TO
TA
L
spikey oreodory * 483 8 * 2 * 537 rubyfish * * * 504 redfish * 31 * * * * * 39 32 5 376 499 striped marlin 468 468 spikey dogfish * 56 * * * * 26 110 22 77 34 1 424 snapper * 15 2 11 * * 392 1 422 shortnose chimaeras * * * 4 50 73 32 73 156 25 * 3 419 blue shark 5 * 42 8 1 26 1 81 51 169 395 southern bluefin tuna 53 137 * 129 * 370 conger eels * * 352 * * * 1 361 oxeye oreodory * * * 349 unknown/other * 13 164 155 * * 345 striped trumpeter * * * * 35 95 * * * 345 deepwater flathead * 62 9 * * * * * * * * 335 gastropods * * * * 62 51 184 * 21 1 324 john dory 0 1 * * * * * 26 122 3 0 10 105 269 whiskery shark * * 250 sharks (other) * 69 * * 88 36 3 * * 18 220 deepsea scorpionfish * * * 163 * * 208 bronze whaler 149 * * 12 42 207 shovelnose rays 0 * * * * * * 67 66 0 * 25 19 193 escolar 183 183 bailer shell * * 59 7 80 * * * 3 170 holothurian * * crabs * * * * 73 36 * 19 157 octopuses 13 143 * 156 blue morwong 141 8 * * * 152 warty oreodory * * ocean perch 17 123 * 144 eastern school whiting * 3 1 128 Australian angelshark * 0 40 * * 2 * * 17 121 imperador * * 56 119
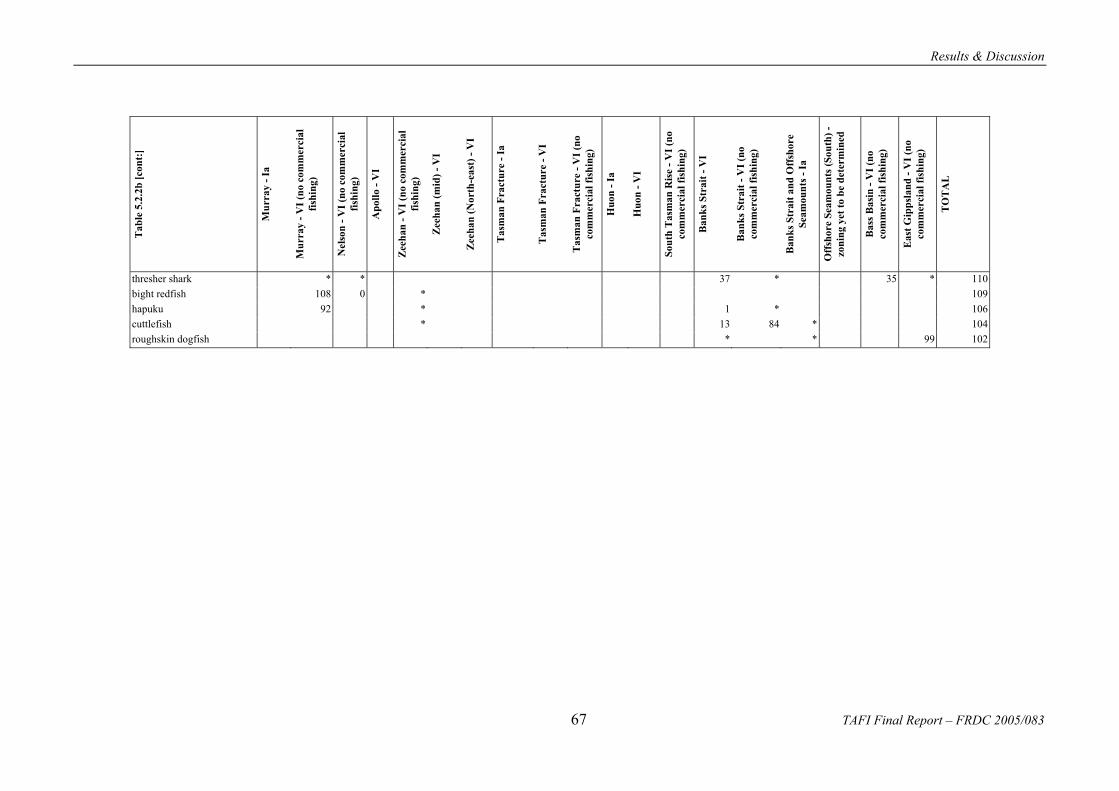
Results & Discussion
67 TAFI Final Report – FRDC 2005/083
Tab
le 5
.2.2
b [c
ont:
]
Mur
ray
- Ia
Mur
ray
- VI (
no c
omm
erci
al
fishi
ng)
Nel
son
- VI (
no c
omm
erci
al
fishi
ng)
Apo
llo -
VI
Zee
han
- VI (
no c
omm
erci
al
fishi
ng)
Zee
han
(mid
) - V
I
Zee
han
(Nor
th-e
ast)
- V
I
Tas
man
Fra
ctur
e - I
a
Tas
man
Fra
ctur
e - V
I
Tas
man
Fra
ctur
e - V
I (no
co
mm
erci
al fi
shin
g)
Huo
n - I
a
Huo
n - V
I
Sout
h T
asm
an R
ise
- VI (
no
com
mer
cial
fish
ing)
Ban
ks S
trai
t - V
I
Ban
ks S
trai
t - V
I (no
co
mm
erci
al fi
shin
g)
Ban
ks S
trai
t and
Off
shor
e Se
amou
nts -
Ia
Off
shor
e Se
amou
nts (
Sout
h) -
zoni
ng y
et to
be
dete
rmin
ed
Bas
s Bas
in -
VI (
no
com
mer
cial
fish
ing)
Eas
t Gip
psla
nd -
VI (
no
com
mer
cial
fish
ing)
TO
TA
L
thresher shark * * 37 * 35 * 110 bight redfish 108 0 * 109 hapuku 92 * 1 * 106 cuttlefish * 13 84 * 104 roughskin dogfish * * 99 102

Results & Discussion
TAFI Final Report – FRDC 2005/083 68
Table 5.2.3a. Mean annual displaced catch (kg) by method from candidate MPAs. * Denotes data confidential, less than 5 boats. Commonwealth catch data (2000-05) are from operation position and in the case of some shark from gridded data. The Offshore Seamounts North candidate MPA is omitted because only confidential data is available from that region.
Fishing Method Candidate MPA Zones
M
urra
y - I
a
Mur
ray
- VI (
no c
omm
erci
al
fishi
ng)
Nel
son
- VI (
no c
omm
erci
al
fishi
ng)
Apo
llo -
VI
Zee
han
- VI (
no c
omm
erci
al
fishi
ng)
Zee
han
(mid
) - V
I
Zee
han
(Nor
th-e
ast)
- V
I
Tas
man
Fra
ctur
e - I
a
Tas
man
Fra
ctur
e - V
I
Tas
man
Fra
ctur
e - V
I (no
co
mm
erci
al fi
shin
g)
Huo
n - I
a
Huo
n - V
I
Sout
h T
asm
an R
ise
- VI (
no
com
mer
cial
fish
ing)
Ban
ks S
trai
t - V
I
Ban
ks S
trai
t - V
I (no
co
mm
erci
al fi
shin
g)
Ban
ks S
trai
t and
Off
shor
e Se
amou
nts -
Ia
Off
shor
e Se
amou
nts (
Sout
h)
- zon
ing
yet t
o be
det
erm
ined
Bas
s Bas
in -
VI (
no
com
mer
cial
fish
ing)
Eas
t Gip
psla
nd -
VI (
no
com
mer
cial
fish
ing)
TO
TA
L o
f Dis
plac
ed K
G
(bol
d ite
ms)
RE
GIO
NA
L o
r ST
AT
E to
tal
KG
for
sect
or
% R
egio
nal o
r St
ate
kg
Dis
plac
ed
bottom longline * 4,713 * * 2,728 259 401 11,756 12,428 * 22,425 34,526 26,180 15,044 * 976 143,118 765,181 18.70%
danish seine * * * * * 132 1,770,690 0.01%
dropline 1,181 * 5,200 * 24,166 12,192 43,024 216,478 19.87%
gillnet 53 9,162 257 300 1,062 * 7,116 2,930 45,662 66,541 2,354,572 2.83%
handline * 1,605 *
otter trawl 584 7,864 405 1,227 19,187 1,153 * 82,586 47,146 1,814 * 146,726 179 64,354 1,280,736 44,038 1,601,859 2,680 4,359 3,306,952 28,149,768 11.75%
pelagic longline 876 180 * 169 * * 7,049 * 532,053 *
purse seine * * * 1,501,930 *
squid jig * * * 1,212,995 *
trolling * * 4,828 *
trotline * * 2,977 *
unknown * * 159,300 *
midwater trawl/ SPF 173 76,730 840 1,556,988 7,262 16 1,642,009 5,000,000 *
Total 737 23,969 673 1,581 22,215 421 177,513 59,574 1,936 484 169,992 181 98,880 2,897,357 81,471 1,613,121 49,327 28,757 5,229,625 41,672,376 12.55%

Results & Discussion
69 TAFI Final Report – FRDC 2005/083
Table 5.2.3b. Mean annual displaced catch (kg) by method from candidate MPAs. * Denotes data confidential, less than 5 boats. Commonwealth catch data (2000-05) are from operation position and in the case of some shark from gridded data. Catches are adjusted for projected 2007 TACs. The Offshore Seamounts North candidate MPA is omitted because only confidential data is available from that region.
Fishing Method Candidate MPA Zones
Mur
ray
- Ia
Mur
ray
- VI (
no c
omm
erci
al
fishi
ng)
Nel
son
- VI (
no c
omm
erci
al
fishi
ng)
Apo
llo -
VI
Zee
han
- VI (
no c
omm
erci
al
fishi
ng)
Zee
han
(mid
) - V
I
Zee
han
(Nor
th-e
ast)
- V
I
Tas
man
Fra
ctur
e - I
a
Tas
man
Fra
ctur
e - V
I
Tas
man
Fra
ctur
e - V
I (no
co
mm
erci
al fi
shin
g)
Huo
n - I
a
Huo
n - V
I
Sout
h T
asm
an R
ise
- VI (
no
com
mer
cial
fish
ing)
Ban
ks S
trai
t - V
I
Ban
ks S
trai
t - V
I (no
co
mm
erci
al fi
shin
g)
Ban
ks S
trai
t and
Off
shor
e Se
amou
nts -
Ia
Off
shor
e Se
amou
nts (
Sout
h) -
zoni
ng y
et to
be
dete
rmin
ed
Bas
s Bas
in -
VI (
no
com
mer
cial
fish
ing)
Eas
t Gip
psla
nd -
VI (
no
com
mer
cial
fish
ing)
TO
TA
L o
f Dis
plac
ed K
G
(bol
d ite
ms)
bottom longline * 4,713 * * 2,361 186 398 9,921 10,259 * 18,885 29,535 21,870 12,255 * 965 121,124
danish seine * * * * * * 131
dropline 1,169 * 4,325 * 20,773 10,320 36,823
gillnet 53 9,118 254 299 1,032 * 6,991 2,790 45,348 65,886
handline *
otter trawl 584 7,731 310 1,081 10,736 952 * 20,026 32,765 1,603 * 31,401 179 47,773 98,519 4,213 222,088 2,617 3,720 486,324
pelagic longline 876 180 * 169 * * 7,049 *
purse seine * * *
squid jig * * *
trolling * *
trotline * *
unknown * *
midwater trawl/ SPF 173 76,730 840 1,556,988 7,262 16 1,642,009
Totals Displaced 737 23,780 573 1,431 13,396 1,138 408 112,213 43,024 1,702 421 51,127 181 77,314 1,707,310 36,846 231,468 48,937 28,118 2,380,145
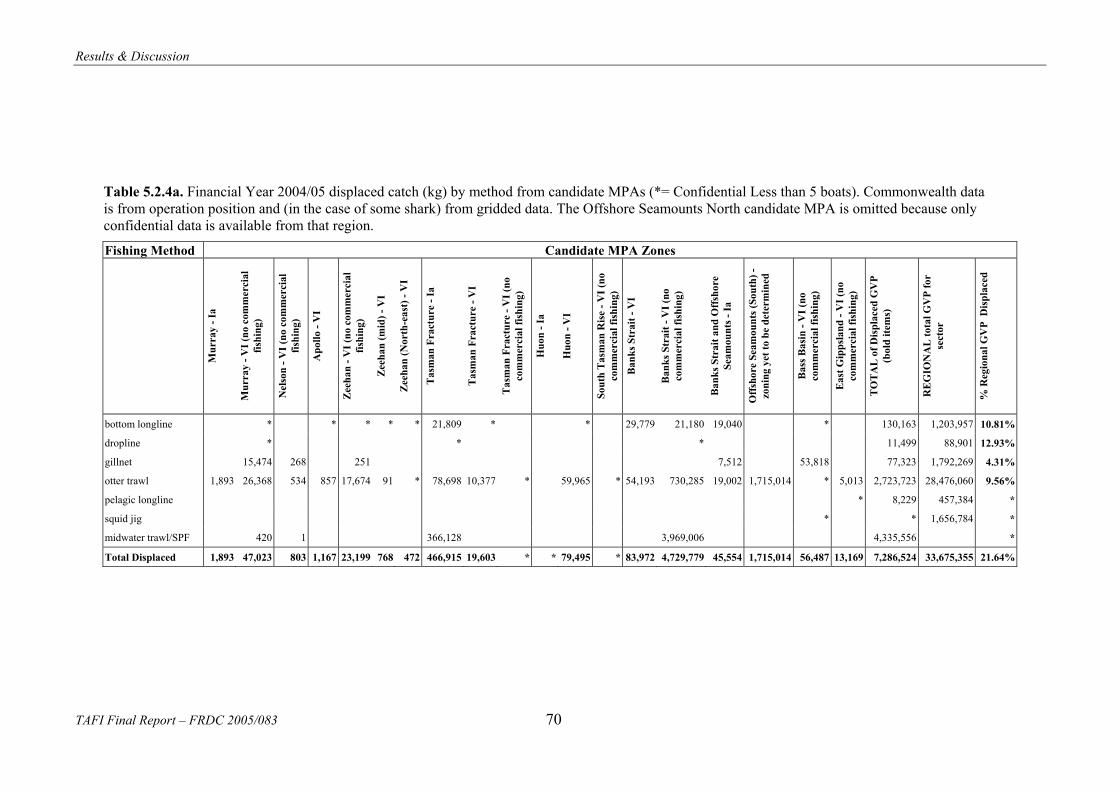
Results & Discussion
TAFI Final Report – FRDC 2005/083 70
Table 5.2.4a. Financial Year 2004/05 displaced catch (kg) by method from candidate MPAs (*= Confidential Less than 5 boats). Commonwealth data is from operation position and (in the case of some shark) from gridded data. The Offshore Seamounts North candidate MPA is omitted because only confidential data is available from that region.
Fishing Method Candidate MPA Zones
Mur
ray
- Ia
Mur
ray
- VI (
no c
omm
erci
al
fishi
ng)
Nel
son
- VI (
no c
omm
erci
al
fishi
ng)
Apo
llo -
VI
Zee
han
- VI (
no c
omm
erci
al
fishi
ng)
Zee
han
(mid
) - V
I
Zee
han
(Nor
th-e
ast)
- V
I
Tas
man
Fra
ctur
e - I
a
Tas
man
Fra
ctur
e - V
I
Tas
man
Fra
ctur
e - V
I (no
co
mm
erci
al fi
shin
g)
Huo
n - I
a
Huo
n - V
I
Sout
h T
asm
an R
ise
- VI (
no
com
mer
cial
fish
ing)
Ban
ks S
trai
t - V
I
Ban
ks S
trai
t - V
I (no
co
mm
erci
al fi
shin
g)
Ban
ks S
trai
t and
Off
shor
e Se
amou
nts -
Ia
Off
shor
e Se
amou
nts (
Sout
h) -
zoni
ng y
et to
be
dete
rmin
ed
Bas
s Bas
in -
VI (
no
com
mer
cial
fish
ing)
Eas
t Gip
psla
nd -
VI (
no
com
mer
cial
fish
ing)
TO
TA
L o
f Dis
plac
ed G
VP
(bol
d ite
ms)
RE
GIO
NA
L to
tal G
VP
for
sect
or
% R
egio
nal G
VP
Dis
plac
ed
bottom longline * * * * * 21,809 * * 29,779 21,180 19,040 * 130,163 1,203,957 10.81%
dropline * * * 11,499 88,901 12.93%
gillnet 15,474 268 251 7,512 53,818 77,323 1,792,269 4.31%
otter trawl 1,893 26,368 534 857 17,674 91 * 78,698 10,377 * 59,965 * 54,193 730,285 19,002 1,715,014 * 5,013 2,723,723 28,476,060 9.56%
pelagic longline * 8,229 457,384 *
squid jig * * 1,656,784 *
midwater trawl/SPF 420 1 366,128 3,969,006 4,335,556 *
Total Displaced 1,893 47,023 803 1,167 23,199 768 472 466,915 19,603 * * 79,495 * 83,972 4,729,779 45,554 1,715,014 56,487 13,169 7,286,524 33,675,355 21.64%

Results & Discussion
71 TAFI Final Report – FRDC 2005/083
Table 5.2.4b. Financial Year 2004/05 displaced catch (kg) by method from candidate MPAs. Catches are adjusted for projected 2007 TACs. (*= Confidential Less than 5 boats). Commonwealth data is from operation position and (in the case of some shark) from gridded data. The Offshore Seamounts North candidate MPA is omitted because only confidential data is available from that region.
Fishing Method Candidate MPA Zones
Mur
ray
- Ia
Mur
ray
- VI (
no c
omm
erci
al
fishi
ng)
Nel
son
- VI (
no c
omm
erci
al
fishi
ng)
Apo
llo -
VI
Zee
han
- VI (
no c
omm
erci
al
fishi
ng)
Zee
han
(mid
) - V
I
Zee
han
(Nor
th-e
ast)
- V
I
Tas
man
Fra
ctur
e - I
a
Tas
man
Fra
ctur
e - V
I
Tas
man
Fra
ctur
e - V
I (no
co
mm
erci
al fi
shin
g)
Huo
n - I
a
Huo
n - V
I
Sout
h T
asm
an R
ise
- VI (
no
com
mer
cial
fish
ing)
Ban
ks S
trai
t - V
I
Ban
ks S
trai
t - V
I (no
com
mer
cial
fis
hing
)
Ban
ks S
trai
t and
Off
shor
e Se
amou
nts -
Ia
Off
shor
e Se
amou
nts (
Sout
h) -
zoni
ng y
et to
be
dete
rmin
ed
Bas
s Bas
in -
VI (
no c
omm
erci
al
fishi
ng)
Eas
t Gip
psla
nd -
VI (
no
com
mer
cial
fish
ing)
TO
TA
L o
f Dis
plac
ed G
VP
(bol
d ite
ms)
bottom longline * * * * * 18,365 * * 24,907 17,700 15,450 * 108,583
dropline * * * 10,526
gillnet 15,386 267 251 6,783 53,399 76,086
otter trawl 1,893 26,367 492 713 10,113 47 * 10,468 7,385 * 19,528 * 41,672 76,976 3,429 253,982 * 4,441 461,006
pelagic longline * 8,229
squid jig * *
midwater trawl/SPF 420 1 366,128 3,969,006 4,335,556
Total Displaced 1,893 46,935 760 1,014 14,823 534 468 395,192 14,834 * * 35,661 * 66,579 4,072,066 25,662 253,982 56,014 12,597 5,000,016
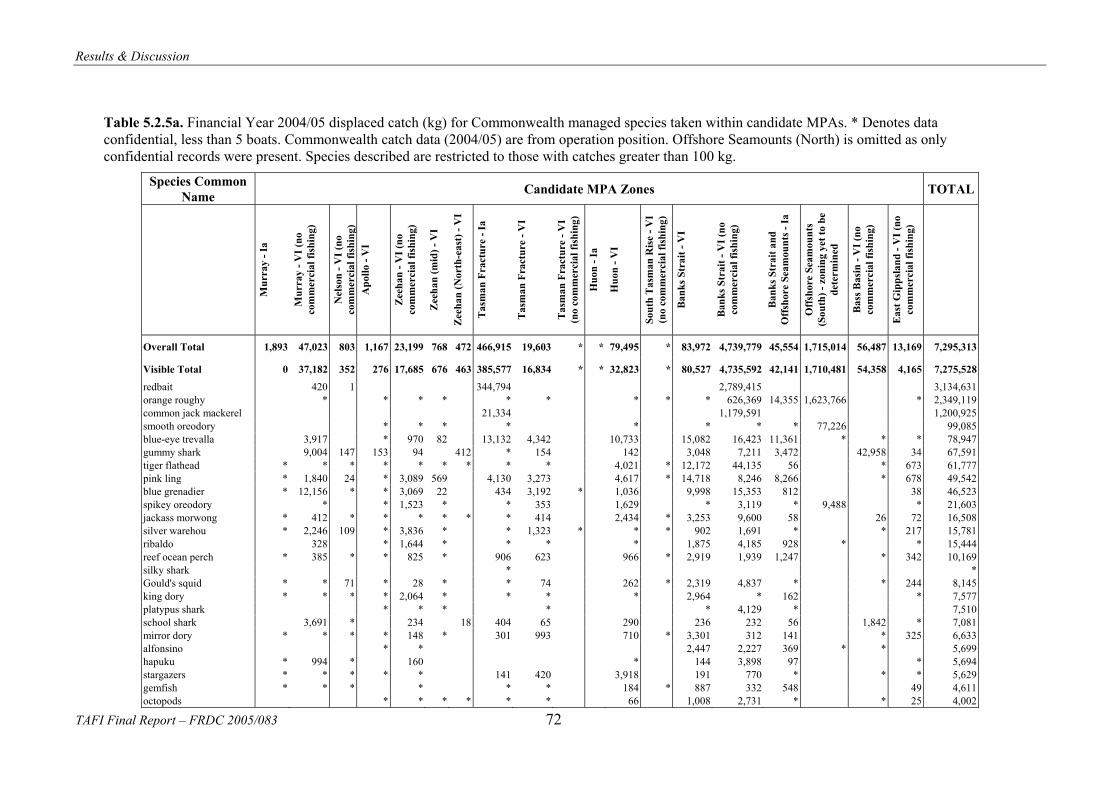
Results & Discussion
TAFI Final Report – FRDC 2005/083 72
Table 5.2.5a. Financial Year 2004/05 displaced catch (kg) for Commonwealth managed species taken within candidate MPAs. * Denotes data confidential, less than 5 boats. Commonwealth catch data (2004/05) are from operation position. Offshore Seamounts (North) is omitted as only confidential records were present. Species described are restricted to those with catches greater than 100 kg.
Species Common Name Candidate MPA Zones TOTAL
Mur
ray
- Ia
Mur
ray
- VI (
no
com
mer
cial
fish
ing)
Nel
son
- VI (
no
com
mer
cial
fish
ing)
A
pollo
- V
I
Zee
han
- VI (
no
com
mer
cial
fish
ing)
Zee
han
(mid
) - V
I
Zee
han
(Nor
th-e
ast)
- V
I
Tas
man
Fra
ctur
e - I
a
Tas
man
Fra
ctur
e - V
I
Tas
man
Fra
ctur
e - V
I (n
o co
mm
erci
al fi
shin
g)
Huo
n - I
a
Huo
n - V
I
Sout
h T
asm
an R
ise
- VI
(no
com
mer
cial
fish
ing)
Ban
ks S
trai
t - V
I
Ban
ks S
trai
t - V
I (no
co
mm
erci
al fi
shin
g)
Ban
ks S
trai
t and
O
ffsh
ore
Seam
ount
s - Ia
Off
shor
e Se
amou
nts
(Sou
th) -
zon
ing
yet t
o be
de
term
ined
Bas
s Bas
in -
VI (
no
com
mer
cial
fish
ing)
Eas
t Gip
psla
nd -
VI (
no
com
mer
cial
fish
ing)
Overall Total 1,893 47,023 803 1,167 23,199 768 472 466,915 19,603 * * 79,495 * 83,972 4,739,779 45,554 1,715,014 56,487 13,169 7,295,313
Visible Total 0 37,182 352 276 17,685 676 463 385,577 16,834 * * 32,823 * 80,527 4,735,592 42,141 1,710,481 54,358 4,165 7,275,528
redbait 420 1 344,794 2,789,415 3,134,631orange roughy * * * * * * * * * 626,369 14,355 1,623,766 * 2,349,119common jack mackerel 21,334 1,179,591 1,200,925smooth oreodory * * * * * * * * 77,226 99,085blue-eye trevalla 3,917 * 970 82 13,132 4,342 10,733 15,082 16,423 11,361 * * * 78,947gummy shark 9,004 147 153 94 412 * 154 142 3,048 7,211 3,472 42,958 34 67,591tiger flathead * * * * * * * * * 4,021 * 12,172 44,135 56 * 673 61,777pink ling * 1,840 24 * 3,089 569 4,130 3,273 4,617 * 14,718 8,246 8,266 * 678 49,542blue grenadier * 12,156 * * 3,069 22 434 3,192 * 1,036 9,998 15,353 812 38 46,523spikey oreodory * * 1,523 * * 353 1,629 * 3,119 * 9,488 * 21,603jackass morwong * 412 * * * * * * 414 2,434 * 3,253 9,600 58 26 72 16,508silver warehou * 2,246 109 * 3,836 * * 1,323 * * * 902 1,691 * * 217 15,781ribaldo 328 * 1,644 * * * * 1,875 4,185 928 * * 15,444reef ocean perch * 385 * * 825 * 906 623 966 * 2,919 1,939 1,247 * 342 10,169silky shark * *Gould's squid * * 71 * 28 * * 74 262 * 2,319 4,837 * * 244 8,145king dory * * * * 2,064 * * * * 2,964 * 162 * 7,577platypus shark * * * * * 4,129 * 7,510school shark 3,691 * 234 18 404 65 290 236 232 56 1,842 * 7,081mirror dory * * * * 148 * 301 993 710 * 3,301 312 141 * 325 6,633alfonsino * * 2,447 2,227 369 * * 5,699hapuku * 994 * 160 * 144 3,898 97 * 5,694stargazers * * * * * 141 420 3,918 191 770 * * * 5,629gemfish * * * * * * 184 * 887 332 548 49 4,611octopods * * * * * * 66 1,008 2,731 * * 25 4,002

Results & Discussion
73 TAFI Final Report – FRDC 2005/083
Table 5.2.5a {cont.]
Mur
ray
- Ia
Mur
ray
- VI (
no
com
mer
cial
fish
ing)
Nel
son
- VI (
no
com
mer
cial
fish
ing)
A
pollo
- V
I
Zee
han
- VI (
no
com
mer
cial
fish
ing)
Zee
han
(mid
) - V
I
Zee
han
(Nor
th-e
ast)
- V
IT
asm
an F
ract
ure
- Ia
Tas
man
Fra
ctur
e - V
I
Tas
man
Fra
ctur
e - V
I (n
o co
mm
erci
al
fihi
)H
uon
- Ia
Huo
n - V
I
Sout
h T
asm
an R
ise
- V
I (no
com
mer
cial
fi
hi)
Ban
ks S
trai
t - V
I
Ban
ks S
trai
t - V
I (no
co
mm
erci
al fi
shin
g)
Ban
ks S
trai
t and
O
ffsh
ore
Seam
ount
s -
IaO
ffsh
ore
Seam
ount
s (S
outh
) - z
onin
g ye
t to
be d
eter
min
ed
Bas
s Bas
in -
VI (
no
com
mer
cial
fish
ing)
Eas
t Gip
psla
nd -
VI
(no
com
mer
cial
fis
hing
)T
OT
AL
southern sawshark * * 0 3,744 *yellowfin tuna * 3,736red gurnard * * * * * * * 839 884 * * * 3,306latchet * 72 * * * 1,589 * * 1,395 * 17 3,291common sawshark * 7 * 1 2,861 3,002barracouta * * * * * * 1,220 * * * 834 * 2,827Elephantfish * * * * 4 * * * 153 275 133 1,289 * 2,314blue mackerel * * * 2,083longsnout dogfish * * * * * * 373 * * 2,021cuttlefish * * * * * * * 484 992 * * 24 1,824blue warehou * * * * * * * 828 * 44 158 1,574boarfishes 250 * 0 * * * 210 553 24 471 * 1,525[dogfishes] * * * * * 622 * 1,434albacore * 1,336broadnose shark 157 * 114 * 32 * 305 * 509 1,274swordfish * *frostfish * * * * * * * 1,216 * 32 * * * * * * * 474 468 55 * 43 1,188silver dory * * 178 229 * * * 49 1,149dories * *rubyfish * * *sawsharks * * * * * 111 464 * * * 919white warehou * * 210 * 368 * * 893triggerfishes and leatherjackets * * * * * * * * 526 768
squid * * 122 * * * 714shortfin mako 117 56 * 599bigeye tuna * *skates * * * * * 252 * * 512snapper 32 * 3 475 * 512gastropods * * * 313 * * 488blue morwong 462 * 466john dory * * * * * * * 227 * * 129 405bight redfish 374 * 374redfish * * 316 318thresher shark * * * 82 303

Results & Discussion
TAFI Final Report – FRDC 2005/083 74
Table 5.2.5a {cont.]
Mur
ray
- Ia
Mur
ray
- VI (
no
com
mer
cial
fish
ing)
Nel
son
- VI (
no
com
mer
cial
fish
ing)
A
pollo
- V
I
Zee
han
- VI (
no
com
mer
cial
fish
ing)
Zee
han
(mid
) - V
I
Zee
han
(Nor
th-e
ast)
- V
I
Tas
man
Fra
ctur
e - I
a
Tas
man
Fra
ctur
e - V
I
Tas
man
Fra
ctur
e - V
I (n
o co
mm
erci
al fi
shin
g)
Huo
n - I
a
Huo
n - V
I
Sout
h T
asm
an R
ise
- VI
(no
com
mer
cial
fish
ing)
Ban
ks S
trai
t - V
I
Ban
ks S
trai
t - V
I (no
co
mm
erci
al fi
shin
g)
Ban
ks S
trai
t and
O
ffsh
ore
Seam
ount
s - Ia
Off
shor
e Se
amou
nts
(Sou
th) -
zon
ing
yet t
o be
de
term
ined
Bas
s Bas
in -
VI (
no
com
mer
cial
fish
ing)
Eas
t Gip
psla
nd -
VI (
no
com
mer
cial
fish
ing)
TO
TA
L
bronze whaler 283 * * 299giant crab * * * * 128 294deepwater flathead * * * * 254blue shark * * * * * * 254rudderfish * * * 245scalloped hammerhead * * *tusk * *shortnose chimaeras * * * * * * 218hapuku * * * 216imperador * * * *southern eagle ray * * * *rattails, whiptails and grenadiers * * * *
escolar * *knifejaw * 126 * 146striped marlin * *dogfishes * * * * * 141bailer shell * * * * * 138silver trevally * * 95 132Australian angelshark * * * 38 131shovelnose rays * * * * 71 124striped trumpeter 118 118spikey dogfish * * * * * * 112atlantic mackerel * * * * * 112

Results & Discussion
75 TAFI Final Report – FRDC 2005/083
Table 5.2.5b. Financial Year 2004/05 displaced catch (kg) for Commonwealth managed species taken within candidate MPAs. * Denotes data confidential, less than 5 boats. Commonwealth catch data (2000-05) are from operation position and are adjusted for projected 2007 TACs. Offshore Seamounts (North) is omitted as only confidential records were present. Species described are restricted to those with catches greater than 100 kg.
Species Common Name Candidate MPA Zones Total
Mur
ray
- Ia
Mur
ray
- VI (
no
com
mer
cial
fish
ing)
Nel
son
- VI (
no
com
mer
cial
fish
ing)
Apo
llo -
VI
Zee
han
- VI (
no
com
mer
cial
fish
ing)
Zee
han
(mid
) – V
I
Zee
han
(Nor
th-e
ast)
- V
I
Tas
man
Fra
ctur
e - I
a
Tas
man
Fra
ctur
e - V
I
Tas
man
Fra
ctur
e - V
I (no
co
mm
erci
al fi
shin
g)
Huo
n - I
a
Huo
n - V
I
Sout
h T
asm
an R
ise
- VI
(no
com
mer
cial
fish
ing)
Ban
ks S
trai
t - V
I
Ban
ks S
trai
t - V
I (no
co
mm
erci
al fi
shin
g)
Ban
ks S
trai
t and
O
ffsh
ore
Seam
ount
s – Ia
Off
shor
e Se
amou
nts
(Sou
th) -
zon
ing
yet t
o be
de
term
ined
B
ass B
asin
- V
I (no
co
mm
erci
al fi
shin
g)
Eas
t Gip
psla
nd -
VI (
no
com
mer
cial
fish
ing)
TO
TA
L
Overall Total 1,893 46,935 760 1,014 14,823 534 468 395,192 14,834 * * 35,661 * 66,579 4,072,066 25,662 253,982 56,014 12,597 5,000,016
Visible Total 0 37,109 337 275 12,706 477 459 381,836 12,460 0 0 26,204 0 63,230 4,077,436 22,827 249,930 53,970 3,647 4,990,305
redbait 420 1 344,794 2,789,415 3,134,631common jack mackerel 21,334 1,179,591 1,200,925orange roughy * * 24 249,930 2,50,763gummy shark 8,932 145 151 93 408 * 152 140 3,020 7,145 3,441 42,570 34 66,988blue-eye trevalla 3,917 * 807 68 10,929 3,614 8,932 12,552 13,668 9,455 * * * 66,358tiger flathead * * * * * * * * * 2,937 * 8,890 32,233 41 * 492 45,123pink ling * 1,840 17 * 2,167 399 2,897 2,296 3,239 * 10,325 5,785 5,799 * 476 35,311blue grenadier * 12,156 * * 917 6 130 953 * 309 2,986 4,585 249 11 22,471jackass morwong * 412 * * * * * * 414 2,434 * 3,253 9,600 58 26 72 16,508ribaldo 328 * 1,644 * * * * 1,875 4,185 928 * * 15,444silver warehou * 2,246 103 * 3,618 * * 1,248 * * * 851 1,595 * * 205 15,078reef ocean perch * 385 * * 825 * 906 623 966 * 2,919 1,,939 1247 * 342 10,169silky shark * *Gould's squid * * 71 * 28 * * 74 262 * 2,319 4,837 * * 244 8,145king dory * * * * 2,064 * * * * 2,964 * 162 * 7,577platypus shark * * * * * 4,129 * 7,510school shark 3,691 * 234 18 404 65 290 236 232 56 1,842 * 7,081mirror dory * * * * 148 * 301 993 710 * 3,301 312 141 * 325 6,633alfonsino * * 2,447 2,227 369 * * 5,699hapuku * 994 * 160 * 144 3,898 97 * 5,694stargazers * * * * * 141 420 3,918 191 770 * * * 5,629gemfish * * * * * * 184 * 887 332 548 49 4,611octopods * * * * * * 66 1,008 2,731 * * 25 4,002southern sawshark * * 0 3,744 3,767

Results & Discussion
TAFI Final Report – FRDC 2005/083 76
Table 5.2.5b {cont.]
Mur
ray
- Ia
Mur
ray
- VI (
no
com
mer
cial
fish
ing)
Nel
son
- VI (
no
com
mer
cial
fish
ing)
Apo
llo -
VI
Zee
han
- VI (
no
com
mer
cial
fish
ing)
Zee
han
(mid
) – V
I
Zee
han
(Nor
th-e
ast)
- V
IT
asm
an F
ract
ure
- Ia
Tas
man
Fra
ctur
e - V
I
Tas
man
Fra
ctur
e - V
I (n
o co
mm
erci
al
fihi
)H
uon
- Ia
Huo
n - V
I
Sout
h T
asm
an R
ise
- V
I (no
com
mer
cial
fi
hi)
Ban
ks S
trai
t - V
I
Ban
ks S
trai
t - V
I (no
co
mm
erci
al fi
shin
g)
Ban
ks S
trai
t and
O
ffsh
ore
Seam
ount
s –
IaO
ffsh
ore
Seam
ount
s (S
outh
) - z
onin
g ye
t to
be d
eter
min
ed
Bas
s Bas
in -
VI (
no
com
mer
cial
fish
ing)
Eas
t Gip
psla
nd -
VI
(no
com
mer
cial
fis
hing
) T
OT
AL
yellowfin tuna * 3,736red gurnard * * * * * * * 839 884 * * * 3,306latchet * 72 * * * 1,589 * * 1,395 * 17 3,291common sawshark * 7 * 1 2,861 3,002barracouta * * * * * * 1,220 * * * 834 * 2,827Elephantfish * * * * 4 * * * 153 275 133 1,289 * 2,314spikey oreodory * * 2,128blue mackerel * * * 2,083longsnout dogfish * * * * * * 373 * * 2,021cuttlefish * * * * * * * 484 992 * * 24 *blue warehou * * * * * * * 828 * 44 158 1,574boarfishes 250 * 0 * * * 210 553 24 471 * 1,525albacore * 1,336broadnose shark 157 * 114 * 32 * 305 * 509 1,274swordfish * *frostfish * * * * * * * 1,216 * 32 * * * * * * * 474 468 55 * 43 1,188silver dory * * 178 229 * * * 49 1,149dories * *rubyfish * * *sawsharks * * * * * 111 464 * * * 919white warehou * * 210 * 368 * * 893triggerfishes and leatherjackets * * * * * * * * 526 768
squid * * 122 * * * 714shortfin mako 117 56 * 599bigeye tuna * *skates * * * * * 252 * * 512snapper 32 * 3 475 * 512gastropods * * * 313 * * 488blue morwong 462 * 466john dory * * * * * * * 227 * * 129 405bight redfish 374 * 374redfish * * 316 318thresher shark * * * 82 303bronze whaler 283 * * 299

Results & Discussion
77 TAFI Final Report – FRDC 2005/083
Table 5.2.5b {cont.]
Mur
ray
- Ia
Mur
ray
- VI (
no
com
mer
cial
fish
ing)
Nel
son
- VI (
no
com
mer
cial
fish
ing)
Apo
llo -
VI
Zee
han
- VI (
no
com
mer
cial
fish
ing)
Zee
han
(mid
) – V
I
Zee
han
(Nor
th-e
ast)
- V
I
Tas
man
Fra
ctur
e - I
a
Tas
man
Fra
ctur
e - V
I
Tas
man
Fra
ctur
e - V
I (n
o co
mm
erci
al fi
shin
g)
Huo
n - I
a
Huo
n - V
I
Sout
h T
asm
an R
ise
- VI
(no
com
mer
cial
fish
ing)
Ban
ks S
trai
t - V
I
Ban
ks S
trai
t - V
I (no
co
mm
erci
al fi
shin
g)
Ban
ks S
trai
t and
O
ffsh
ore
Seam
ount
s – Ia
Off
shor
e Se
amou
nts
(Sou
th) -
zon
ing
yet t
o be
de
term
ined
B
ass B
asin
- V
I (no
co
mm
erci
al fi
shin
g)
Eas
t Gip
psla
nd -
VI (
no
com
mer
cial
fish
ing)
TO
TA
L
giant crab * * * * 128 294deepwater flathead * * * * 254blue shark * * * * * * 254rudderfish * * * 245scalloped hammerhead * * *tusk * *shortnose chimaeras * * * * * * 218hapuku * * * 216imperador * * * *southern eagle ray * * * *rattails, whiptails and grenadiers * * * *
escolar * *knifejaw * 126 * 146smooth oreodory * 143striped marlin * *dogfishes * * * * * 141bailer shell * * * * * 138Australian angelshark * * * 38 131shovelnose rays * * * * 71 124striped trumpeter 118 118spikey dogfish * * * * * * 112atlantic mackerel * * * * * 112

Results & Discussion
TAFI Final Report – FRDC 2005/083 78
5.3 Socio-Economic Survey
Description of the sample
Prior to sampling, two port meetings were convened by Industry, one in St Helens and one in Hobart, and were attended by members of the project team. Over 100 people were present at the St Helens meeting, and more than 50 attended the meeting in Hobart. Opportunity presented by the meetings to take submissions and conduct interviews was taken by the project team. Interviews undertaken were used to pilot questions developed for sampling. Questions were also developed with input from the project team, resulting in the survey instrument at Attachment 1. In the preamble to the survey instrument it was emphasized that participants be able and willing to verify information by way of such means as BAS statements or annual financial statements if required. The survey instrument included both closed and open-ended questions inquiring after participants’ assets, fishing and/or processing in 2005, their expenditures, any impact of the proposed MPAs, any likely responses to this impact, and questions regarding embeddedness in the local community. The survey instrument was administered in some cases as an interview, in others as a questionnaire and in some cases as both. In combination, submissions, interviews and completed questionnaires comprised a sample of 80 responses (Table 5.3.1).
Table 5.3.1 Distribution of responses to the questionnaire.
Response type Number
Interview 33
Interview & questionnaire 8
Questionnaire 28
Questionnaire & submission 1
Submission 10
Total 80
The vast majority of responses was from operators based in Tasmania (Table 5.3.2).
Table 5.3.2 Distribution of responses by jurisdiction.
State Number
NSW 3
SA 18
Tas 49
Vic 10
Total 80
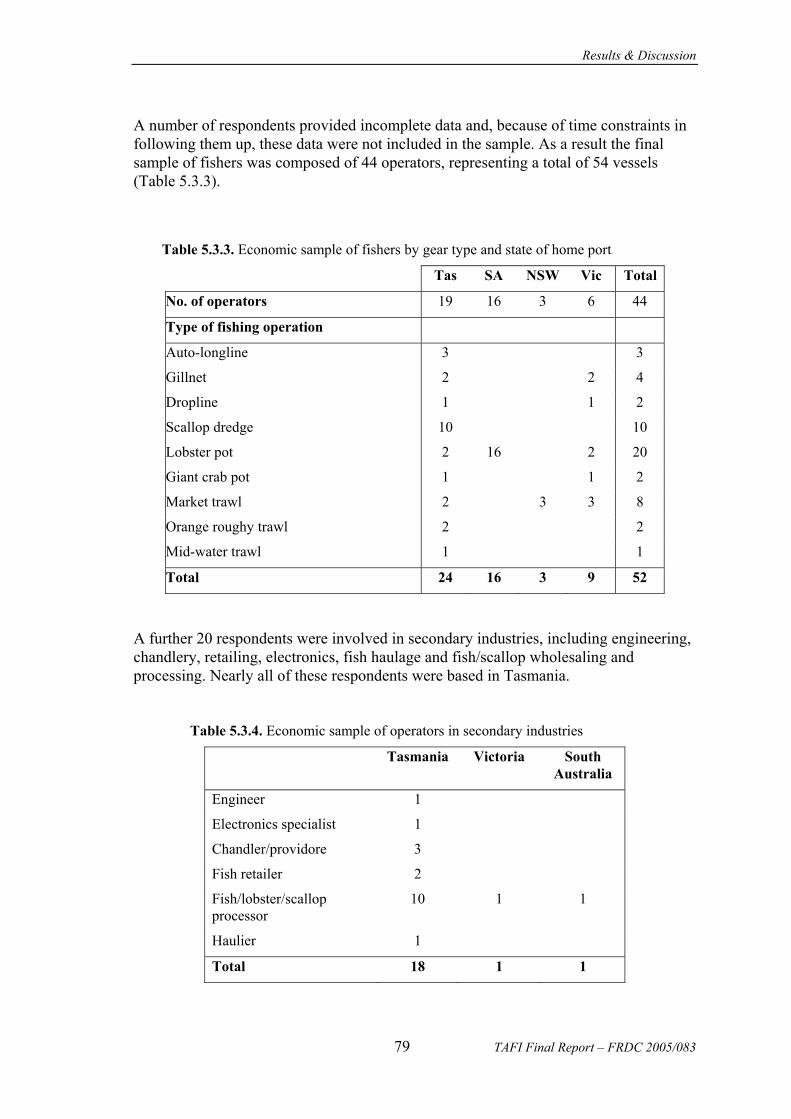
Results & Discussion
79 TAFI Final Report – FRDC 2005/083
A number of respondents provided incomplete data and, because of time constraints in following them up, these data were not included in the sample. As a result the final sample of fishers was composed of 44 operators, representing a total of 54 vessels (Table 5.3.3).
Table 5.3.3. Economic sample of fishers by gear type and state of home port
Tas SA NSW Vic Total
No. of operators 19 16 3 6 44
Type of fishing operation
Auto-longline 3 3
Gillnet 2 2 4
Dropline 1 1 2
Scallop dredge 10 10
Lobster pot 2 16 2 20
Giant crab pot 1 1 2
Market trawl 2 3 3 8
Orange roughy trawl 2 2
Mid-water trawl 1 1
Total 24 16 3 9 52
A further 20 respondents were involved in secondary industries, including engineering, chandlery, retailing, electronics, fish haulage and fish/scallop wholesaling and processing. Nearly all of these respondents were based in Tasmania.
Table 5.3.4. Economic sample of operators in secondary industries
Tasmania Victoria South Australia
Engineer 1
Electronics specialist 1
Chandler/providore 3
Fish retailer 2
Fish/lobster/scallop processor
10 1 1
Haulier 1
Total 18 1 1
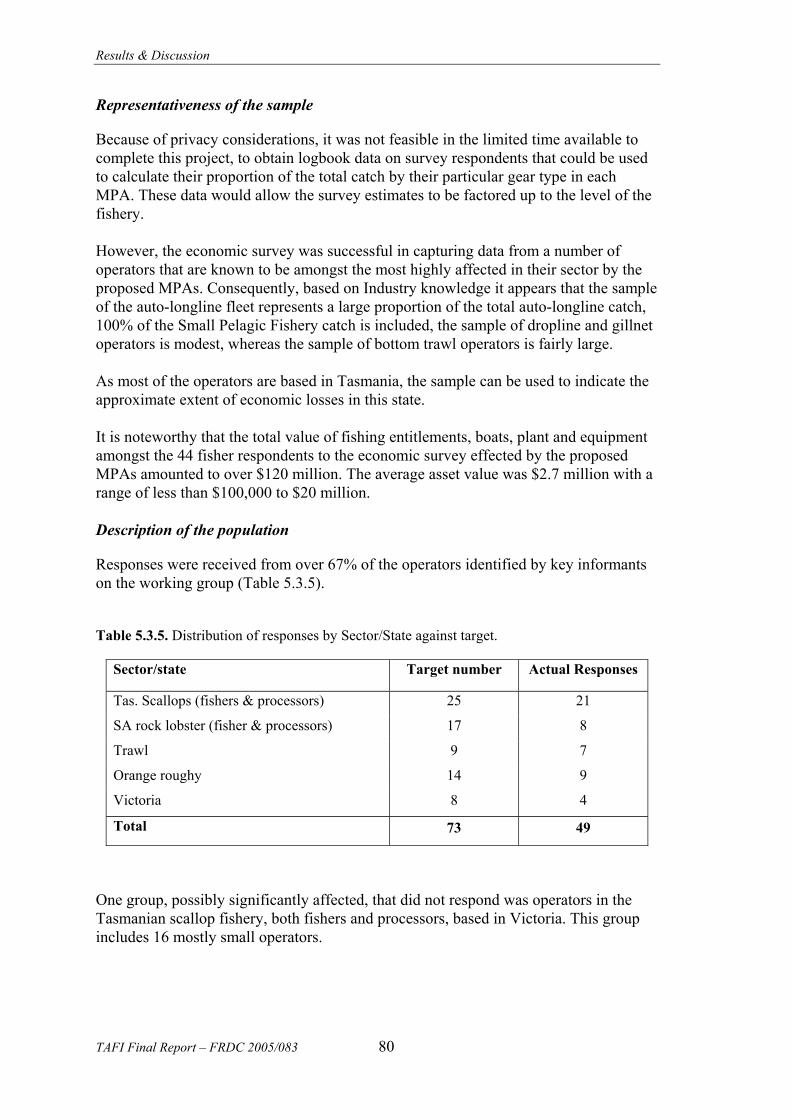
Results & Discussion
TAFI Final Report – FRDC 2005/083 80
Representativeness of the sample
Because of privacy considerations, it was not feasible in the limited time available to complete this project, to obtain logbook data on survey respondents that could be used to calculate their proportion of the total catch by their particular gear type in each MPA. These data would allow the survey estimates to be factored up to the level of the fishery. However, the economic survey was successful in capturing data from a number of operators that are known to be amongst the most highly affected in their sector by the proposed MPAs. Consequently, based on Industry knowledge it appears that the sample of the auto-longline fleet represents a large proportion of the total auto-longline catch, 100% of the Small Pelagic Fishery catch is included, the sample of dropline and gillnet operators is modest, whereas the sample of bottom trawl operators is fairly large. As most of the operators are based in Tasmania, the sample can be used to indicate the approximate extent of economic losses in this state. It is noteworthy that the total value of fishing entitlements, boats, plant and equipment amongst the 44 fisher respondents to the economic survey effected by the proposed MPAs amounted to over $120 million. The average asset value was $2.7 million with a range of less than $100,000 to $20 million. Description of the population
Responses were received from over 67% of the operators identified by key informants on the working group (Table 5.3.5).
Table 5.3.5. Distribution of responses by Sector/State against target.
Sector/state Target number Actual Responses
Tas. Scallops (fishers & processors) 25 21
SA rock lobster (fisher & processors) 17 8
Trawl 9 7
Orange roughy 14 9
Victoria 8 4
Total 73 49
One group, possibly significantly affected, that did not respond was operators in the Tasmanian scallop fishery, both fishers and processors, based in Victoria. This group includes 16 mostly small operators.
Results & Discussion
81 TAFI Final Report – FRDC 2005/083
5.4 Case Studies
5.4.1 Case Study 1: A Coastal Fishing Community in Tasmania: A case of reduced diversity through frustrated opportunity
Particularly affected by the proposed Commonwealth Banks Strait MPA
Introduction
frustrate, v., -trated, -trating. –v.t. 1. to make (plans, efforts, etc.) of no avail; defeat; baffle; nullify. 2. to disappoint or thwart (a person). [L frustratus, pp., having disappointed or deceived]
‘Frustrated’ is not too strong a word to describe the reaction of many of the residents of St Helens, especially those connected with the fishing industry, to the proposed Commonwealth MPAs. St Helens is a fishing community on the east coast of Tasmania with a population of nearly 2000 people. Its fishing fleet has been contracting in size for some ten years due to the introduction of quota management in the Tasmanian rock lobster fishery, closures in the Tasmanian scallop fishery, reductions in Commonwealth TACs for school and gummy shark and so on. In 2003, 2004 and, particularly, in 2005, the re-opening of the Tasmanian scallop fishery provided a much needed shot in the arm for St Helens. For the first time in many years money was available to invest in boats and equipment, and the town’s marine engineers, slipways and boat chandleries all benefited. Over winter, from May to November when St Helens’ summer tourist trade was only a warm memory, there was more work splitting scallops than there were splitters to be found. The town’s retailers both sold many scallops as well as the provisions needed by the fishers, both local and visiting, catching them. In short, scallops resulted in a mini-boom in St Helens in the winter of 2005, and fishers, processors and suppliers of goods and services were hoping for more of the same into the years to come. Indeed, there was sufficient confidence that State fishery managers, scientists and Industry had together beaten the boom-and-bust cycle of the scallop fishery - using the paddock fishing method - that investments were being made to be well positioned to profit from future seasons. Then, seen through the collective eyes of St Helens, from Canberra and for no good reason, came the surprise blow of the proposed Commonwealth Banks Strait MPA. This MPA threatens to close the Tasmanian scallop fishery in 2007. The language in the foregoing paragraph is deliberately emotive in an attempt to capture the mood of the St Helens community expressed, for example, by attendance of more than 100 individuals at a port meeting convened to begin to come to terms with the proposed Commonwealth Banks Strait MPA. Representatives from throughout the community were present including local government officials, local members of State and Federal parliaments, fishers, retailers, and so on. Injury was on show at the meeting but so too was insult taken at the proposal:

Results & Discussion
TAFI Final Report – FRDC 2005/083 82
“I find it insulting that much time and effort continually goes into ensuring our State fishers operate in a sustainable manner, ever changing and adjusting to new requirements and environments, implementing quotas, gear restrictions, licence reductions [etc.] and [yet we] can be dictated to with this format”
Basic community profile
As noted, in 2001 St Helens had a population of nearly 2000 people (ABS 2001). St Helens is the local government centre of a municipality with a population of just over 5500 people. Retirees, especially, are attracted to the equable climate and sandy beaches in the region of the town. For example, approximately one-quarter of St Helens’ population was aged 65 years or over in 2001, compared with 16.7 per cent in its municipality and 13.4 per cent in Tasmania. The percentage of lone person households in St Helens, 34.1 per cent compared with 26.9 for Tasmania, reflects this situation, and the median age of residents of St Helens is close to 50 years compared with 36 years for Tasmania. St Helens’s unemployment rate in 2001 was 15 per cent, compared with 10.1 per cent for Tasmania. The proportion of St Helens’s employed population in the agriculture, forestry and fishing industries was 15.4 per cent compared with 6.7 per cent for Tasmania. And median weekly household income in St Helens in 2001 was between $400-499 compared with $600-699 for Tasmania. Over summer, tourists substantially boost St Helens’s population. In 2003/04 approximately 173 000 people visited St Helens. Game and charter fishing are used to sell St Helens as a tourist destination, and a proportion of marine-related activity, including aluminium boat building, is related to recreational fishing (Coakes et al. 2001). In summary, St Helens has a basic community profile not dissimilar to a number of remote rural regions in Tasmania. Compared with figures for Tasmania, St Helens’s unemployment rate is higher, it has a greater reliance on primary production, its proportion of elderly – the vast majority of whom are no longer in the workforce – is higher, and its median household income is lower than for the State as a whole. As such, it is arguably less well placed than a port such as Hobart, Tasmania’s capital city, to absorb a socioeconomic impact such as threatened by the proposed Commonwealth MPAs.
Impacts of the proposed MPAs
In 1996/97 the St Helens fishing fleet consisted of a minimum of 31 non-trailerable vessels, predominantly operating in the rock lobster fishery (Williamson et al. 1998). At present, the St Helens fishing fleet is approximately half this number. The intervening period has seen the introduction of quota management in the rock lobster and giant crab fisheries, declining TACs in various Commonwealth fisheries, particularly shark, and until recently very little scallop fishing. (In the rock lobster fishery alone, activity in terms of boats-through-port and number of landings declined

Results & Discussion
83 TAFI Final Report – FRDC 2005/083
by approximately 10 per cent between 1997 and 2000 [Frusher et al. 2003].) In the winters of 2004 and 2005, however, commercial scalloping in the Tasmanian fishery emerged to occupy part of St Helens during the slowdown of rock lobster fishing. In 2005, shell weight landings of scallops in St Helens totalled nearly 3300 tonnes, over three-quarters of the entire tonnage landed in the fishery. The next highest port in terms of landings made up less than seven per cent of total tonnage. Clearly, by tonnes of scallops landed, St Helens was the major beneficiary of the renascent scallop fishery. Over 1000 tonnes shell weight scallops were landed by the four boats associated with St Helens alone. In total, 23 boats from both Tasmania (14 vessels) and Victoria (nine vessels) unloaded scallops in St Helens in 2005. Scallops were offloaded for processing and sale in the town, as well as elsewhere. Crews enjoyed furlough in St Helens with more money than they could earn in 12 months casual employment rock lobster fishing.
“The loss of trade this Hotel alone would lose if the commercial [scallop] fishing ceased would equate to an amount in excess of $250 000 and may I point out at a very critical time of the year when the tourist dollars are not there. No business can afford to lose this amount of money yet still retain all its employees, so … this would result in job loss from every area of our hotel”
In addition, the scallop boats refuelled and reprovisioned in St Helens, and a number required repairs and maintenance. For example, for St Helens’s new $8 million supermarket, purchases related to provisioning scallop boats constituted between 10-15 per cent of winter turnover.
“And for every one dollar they spend, that’s three dollars back into the community. We’ve got 54 employees here, and we donate up to $40 000 a year to local causes like rotary, sports teams and charities”
Without the scallop-related business, this retailer was certain that turnover would decline at the slowest time of year, that less staff would be needed, and that a further consequence would be a review of all sponsorships. And one of St Helens’s marine and general engineers took on an apprentice and put on another subcontractor as a result of the extra scallop fishing-related work, which he estimated to be worth $75 000 in gross income in 2005. He had $100 000 scallop fishing-related work on his books for 2006, and he had planned to put an underwater camera on a scallop dredge with a view to fine-tuning harvester design so that a harvester was both more efficient and lower impact. This work and plan are both on hold at present as fishers await the outcome of the Commonwealth MPAs proposal. Should the Commonwealth Banks Strait MPA be introduced as proposed, scalloping in the Tasmanian fishery stands to be cancelled in 2007, 2008 and possibly even in 2009. The implications for this marine engineer are putting two people off and “going back on the tools myself”. He was concerned too about $20 000 work he did on shark boats per annum, which stand also to be excluded from areas of the Banks Strait MPA, as

Results & Discussion
TAFI Final Report – FRDC 2005/083 84
well as a $10 000 work order from an affected blue-eye trevalla fisher, and $20 000 per annum maintenance done for a fish freighting company on its refrigerated trucks used to transport mainly orange roughy and scallops.
“It just keeps adding up, the more you think about it. My business could be more than halved”
For the other marine engineer in St Helens, the proposed Commonwealth MPA looks set to be a case of déjà vu. He worked in Queensland for 25 years on vessels in the northern trawl fisheries, but relocated to St Helens in 2001 due to the introduction of MPAs reducing his work by more than half. He chose St Helens as one of Tasmania’s main fishing ports and he was confident in the sustainable management time-horizons of rock lobster and scallops. He invested in plant and equipment with a market value of $750 000 and he now employs nine people full time, working on Tasmanian projects 70 per cent of the time. Forty-five per cent of his business in St Helens is from commercial fishing, and scallop boats are six of his main clients. At present, he has $20 000 work on hold relating to scalloping as fishers wait out the uncertainty caused by the proposed Commonwealth Banks Strait MPA. If there is to be no scallop-related work in 2007, he anticipates that his activities and labour requirement would be halved, requiring him to lay off four employees. And he didn’t expect the specialised employees laid off would, with families to feed, be able to remain in St Helens, but would be forced to take their trades elsewhere, making it difficult for him again to gear-up should scalloping-related work arise in future. For nine staff, he needed approximately 50 jobs to be going per week to provide them with sufficient continuity of work. With scallops effectively ‘busting’ in 2007, he saw little opportunity to make up the shortfall in work given that 90 per cent of his business was marine-related. And with scallop fishing-related business standing largely to evaporate for these marine engineers, the slipway and chandlery that hosted much of the work stands to lose up to 20 per cent of its turnover, leaving insufficient work to occupy both slipways and chandleries in St Helens. The proposed Commonwealth Banks Strait MPA also stands to affect fishers of blue-eye trevalla and market fish, some of which is landed and sold in St Helens.
“Everything I have on display here today is because Michael unloaded yesterday. Without his catch I’d have no fresh fish. And our whole business is based on fresh fish and chips. Freighting fish in from Melbourne isn’t an option, not just because it costs more, but because it’s not fresh”
So spoke the co-proprietor of the award-winning PrimeFish, an outlet for both fresh and cooked fish in St Helens. PrimeFish sells some 35 tonnes of fish each year in St Helens, to both locals and tourists. Thirty tonnes of its sales are mixed scalefish and shark, the majority of which is blue-eye trevalla. Rock lobster and scallops make up the bulk of the remainder of its sales. PrimeFish sourced nearly all its 15 tonnes per annum of blue-eye trevalla as well as its tonnages of pink ling, hapuka, alfonsino and so on from the
Results & Discussion
85 TAFI Final Report – FRDC 2005/083
sole auto-longline fisher operating out of St Helens, Michael. (Few trawlers unload in St Helens any longer.) Without Michael, PrimeFish considers that it could not source the fresh product that has seen it feature in Australian Gourmet Traveller and Mietta’s Australian Restaurants. Put simply: “If Michael goes, we’d go out of business”. And there is a real risk that Michael will leave St Helens due to the proposed Commonwealth MPAs, particularly the MPA proposed for Banks Strait. Michael catches all his blue-eye trevalla within the proposed Banks Strait MPA. His is a local boat that catches its fish locally and supplies a local market, among others. Michael holds that his tight margin means that he cannot afford to use less efficient dropline gear and that under the proposed spatial scheme of the MPAs he will have to steam further to reach fishing grounds. In other words, he will have to fish non-locally, which will cost him in terms of travel time and so on. To minimise this cost, Michael maintains that he will move his operation to the port closest to wherever his fishing effort is displaced, i.e., that he will leave St Helens. And PrimeFish considers that Michael’s catch will leave with him. The proposed Commonwealth Banks Strait MPA also takes in the bulk of the striped trumpeter grounds off St Helens which would mean little of this premium species being locally available. PrimeFish sees the implication of the Commonwealth Banks Strait MPA, should it be introduced as proposed, as forcing it to consider operation as just a fish and chips shop rather than being a purveyor of fine award-winning fresh fish and chips. PrimeFish considers that fresh local seafood partly draws tourists to St Helens, something from which he benefits. PrimeFish, however, considers there to be little scope to import fish from Melbourne to run its business for reasons of both cost and quality. By the time fish arrive from the Melbourne Fish Market, via the hands of auctioneers, wholesalers and freighters, an additional $1.50 per kilogram is added to its cost. And this additional cost is for fish that is considerably less fresh and has a shorter shelf-life than local product. With wastage and so on, an extra $3.00 per kilogram would need to be added to the retail price of this inferior product. This price increase is something PrimeFish does not consider its market would stomach but, more importantly, is not a product that PrimeFish is interested in offering. PrimeFish maintains, then, that it may be forced to close, an operation employing four local people, two full time and two casual. For a town that sells itself around fishing and seafood, the question that PrimeFish then has is: where will tourists be able to buy fresh local seafood? This question was echoed by one of St Helens’s hotels which outlays considerable sums of money each year to purchase fresh local seafood for its menu:
“On the business side of things so far as the [Hotel] is concerned we purchased approximately $56 000 worth of fresh seafood last year all of which was Local Produce”
Much of this local produce came from one of St Helens’s seafood processors. Two of these processors valued the opportunity to diversify their operations presented by scallops. In 2005, they were still ‘gearing up’ in terms of facilities and splitters to deal with the tonnage of scallops available. They therefore processed less than 75 tonnes shell weight scallops between them in 2005, but have substantial plans involving tanks,
Results & Discussion
TAFI Final Report – FRDC 2005/083 86
trucks and markets for 2006. These plans are on hold at present due to the uncertainty caused by the proposed Commonwealth MPAs.
Conclusion
The impact of the proposed Commonwealth Banks Strait MPA on St Helens, particularly regarding the possibility of no commercial scallop fishing in 2007, stands to be the withdrawal of its much-needed winter shot in the socioeconomic arm. And this one less opportunity to generate employment and business runs the risk of cessation of activities such as dredging the bar-way to the port due to the continuing contraction of the fishing fleet, the closure of fish-related retail outlets, and a reduction in marine services related to slipping and engineering. St Helens is conscious that to rely on retirees and summer tourism to complement minor aquaculture, agricultural and forestry activity – little wood harvested is processed in St Helens’s municipality - is a recipe for winter discontent. A fishing fleet that is active over winter adds to the robustness of St Helens’s economy and many in the town view the possible loss of commercial scallop fishing with chagrin. Diversity and opportunity are important teeth in the cogs of small regional communities. The ability to increase the range of contributions to an enterprise’s or a community’s socioeconomy is crucial to their health and development. The reverse of this process, diversity and opportunity diminished, is intuitively understood to be detrimental to the ability of an economy to withstand an impact. Such an understanding is exemplified by the following participant regarding tourism.
“Tourism which is an extremely important component of Tasmania’s existence will be greatly affected due to higher prices for our produce if available at all, lack of services due to failing infrastructure within the smaller communities, lack of accommodation due to failed businesses which then creates more unemployment continuing the Domino effect of economic downturn”
Reduced economic activity is undoubtedly a negative outcome. St Helens is clearly threatened with such an outcome by the proposed Commonwealth MPAs. And this reduction is of one order in particular, related to scallops. Boats stand not to be fishing for scallops in 2007, not to be landing their catch in St Helens, not purchasing provisions and requiring repairs and maintenance and so on. Such an outcome can only reduce the amount and variety of economic activity in St Helens. But without a history of reliance on scalloping, it is difficult to argue that St Helens could not exist without this activity. However, with the supply of fresh local trevalla and market fish endangered by the proposed Commonwealth MPAs and the risk that large wholesalers in Tasmania and Melbourne will only deal with large orders, the outlook for small retail seafood outlets may not be optimistic. It is not surprising then that the frustration at opportunities thwarted, ex cathedra, was palpable among the hundred who solemnly assembled in St Helens early January 2006.

Results & Discussion
87 TAFI Final Report – FRDC 2005/083
5.4.2 Case Study 2: The economic impact of reduced catch from the Northern Zone Rock Lobster Fishery on the Kangaroo Island and State economies *
Affected by the proposed Murray MPA
Introduction
This case study was prepared by EconSearch Pty Ltd in January 2006 to provide some estimates of the economic impact of reduced catch from the Northern Zone Rock Lobster (NZRL) fishery on the Kangaroo Island (KI) and South Australian (SA) economies. The estimates presented in this report have been derived from input-output models for the KI and SA economies, recently prepared for the Department of Trade and Economic Development (EconSearch 2005a). In order to compile a representative cost structure for the NZRL fishing sector, costs per boat were derived from data provided by operators in the fishery from a financial survey for 2000/01 (EconSearch 2005b) and updated to the current year using a range of indicators. Three alternative scenarios have been analysed. For each, it was assumed that approximately 75 per cent of the reduction in catch would be attributable to boats from KI and the balance to boats from elsewhere in SA. The three scenarios were:
- a 20 tonne reduction in catch; - a 35 tonne reduction in catch; and - a 50 tonne reduction in catch.
It was assumed that this reduction in catch would result in the following boats being removed from the fishery:
- 20 tonne – 2 boats removed from KI and 1 from elsewhere in SA; - 35 tonne – 4 boats removed from KI and 1 from elsewhere in SA; and - 50 tonne – 5 boats removed from KI and 2 from elsewhere in SA.
Finally the estimated cost to buy out the quota and boats associated with each catch reduction is presented. Estimates of the Economic Impact of Reduced Catch from the NZRL Fishery
Measures of Economic Impact Estimates of economic impact presented in this report have been prepared using ‘with’ and ‘without’ catch reduction scenarios. That is, the estimates presented below represent the net impact of reduced catch in the NZRL fishery. Economic impacts have been specified in terms of the following indicators:
- value of output; - employment; - household income; and - contribution to gross state or regional product.

Results & Discussion
TAFI Final Report – FRDC 2005/083 88
Value of output is a measure of the gross revenue of goods and services produced by commercial organisations plus gross expenditure by government agencies. This indicator needs to be used with care as it includes elements of double counting. Employment is a measure of the number of working proprietors, managers, directors and other employees, in terms of the number of full-time equivalent jobs. Household income is a measure of the wages and salaries and other payments to labour including overtime payments and income tax, but excluding payroll tax. It is a component of Gross State Product (GSP) and Gross Regional Product (GRP). Contribution to GSP or GRP is a measure of the net contribution of an activity to the state/regional economy. Contribution to GSP or GRP is measured as value of output less the cost of goods and services (including imports) used in producing the output. It can also be measured as household income plus other value added (gross operating surplus and all taxes, less subsidies). It represents payments to the primary inputs of production (labour, capital and land). Using contribution to GSP or GRP as a measure of economic impact avoids the problem of double counting that may arise from using value of output for this purpose. Economic Impacts on the Kangaroo Island Regional Economy
Estimates of the net economic impact on the Kangaroo Island regional economy of removing 20, 35 and 50t of catch from the NZRL fishery are outlined in Tables 5.4.2.1 to 5.4.2.3, respectively. The direct impact measures fishing and downstream activities (i.e. processing, transport, retail/food services and capital expenditure). The flow-on impact measures the economic effects in other sectors of the economy (trade, manufacturing, etc.) generated by the fishing industry activities, that is, the multiplier effects.

Results & Discussion
89 TAFI Final Report – FRDC 2005/083
Table 5.4.2.1. The net economic impact of removing 20t of catch from the NZRL fishery on the KI regional economy a
Sector Output Employment b Household Income
Contribution to GRP
$m fte $m $m
Direct effects
Fishing -0.4 -7 -0.2 -0.1
Downstream c -0.1 -1 0.0 0.0
Total Direct d -0.5 -7 -0.2 -0.2
Flow-on effects
Trade 0.0 -1 0.0 0.0
Manufacturing 0.0 0 0.0 0.0
Business Services 0.0 0 0.0 0.0
Transport 0.0 0 0.0 0.0
Other Sectors -0.2 -1 0.0 -0.1
Total Flow-on d -0.3 -2 -0.1 -0.2
Total d -0.8 -10 -0.3 -0.3
a In 2006 dollars. b Full-time equivalent jobs. c Downstream impacts include processing, transport, retail/food services and capital expenditure. d Totals may not sum due to rounding.
Source: EconSearch analysis.
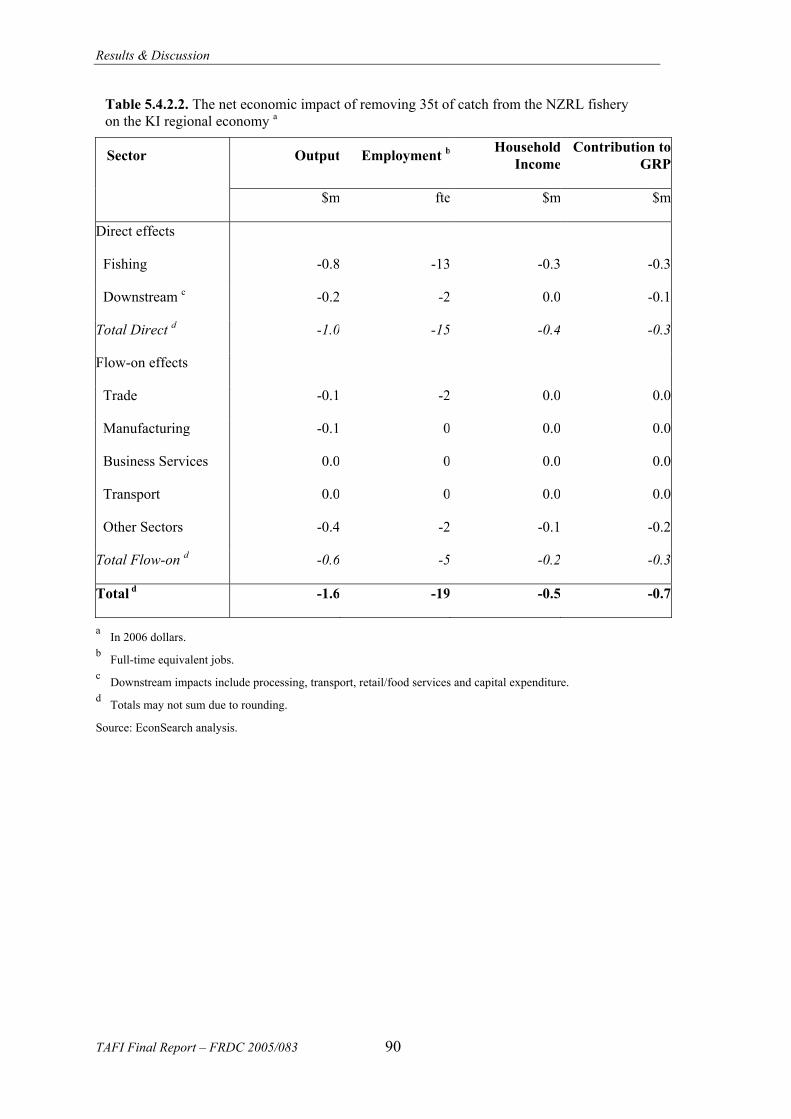
Results & Discussion
TAFI Final Report – FRDC 2005/083 90
Table 5.4.2.2. The net economic impact of removing 35t of catch from the NZRL fishery on the KI regional economy a
Sector Output Employment b Household Income
Contribution to GRP
$m fte $m $m
Direct effects
Fishing -0.8 -13 -0.3 -0.3
Downstream c -0.2 -2 0.0 -0.1
Total Direct d -1.0 -15 -0.4 -0.3
Flow-on effects
Trade -0.1 -2 0.0 0.0
Manufacturing -0.1 0 0.0 0.0
Business Services 0.0 0 0.0 0.0
Transport 0.0 0 0.0 0.0
Other Sectors -0.4 -2 -0.1 -0.2
Total Flow-on d -0.6 -5 -0.2 -0.3
Total d -1.6 -19 -0.5 -0.7
a In 2006 dollars. b Full-time equivalent jobs. c Downstream impacts include processing, transport, retail/food services and capital expenditure. d Totals may not sum due to rounding.
Source: EconSearch analysis.

Results & Discussion
91 TAFI Final Report – FRDC 2005/083
Table 5.4.2.3. The net economic impact of removing 50t of catch from the NZRL fishery on the KI regional economy a
Sector Output Employment b Household Income
Contribution to GRP
$m fte $m $m
Direct effects
Fishing -1.0 -16 -0.4 -0.3
Downstream c -0.2 -2 -0.1 -0.1
Total Direct d -1.2 -18 -0.5 -0.4
Flow-on effects
Trade -0.1 -2 0.0 -0.1
Manufacturing -0.1 -1 0.0 0.0
Business Services -0.1 0 0.0 0.0
Transport -0.1 0 0.0 0.0
Other Sectors -0.5 -3 -0.1 -0.3
Total Flow-on d -0.8 -6 -0.2 -0.4
Total d -2.0 -24 -0.6 -0.8
a In 2006 dollars. b Full-time equivalent jobs. c Downstream impacts include processing, transport, retail/food services and capital expenditure. d Totals may not sum due to rounding.
Source: EconSearch analysis.
Some interpretation is provided below for the 35t scenario (Table 5.4.2.2), interpretation for the other scenarios is identical.
- As a result of the removal of 4 KI based boats from the NZRL fishery, the value of output generated directly by rock lobster fishing in the KI regional economy would fall by $0.8 million while output generated on KI by associated downstream activities (processing, transport, retail/food services and capital expenditure) would fall by $0.2 million. Flow-on output in other sectors of the regional economy would fall by $0.6 million with the sectors most affected being the trade and manufacturing sectors. Total value of output lost from the KI regional economy would be approximately $1.6 million.

Results & Discussion
TAFI Final Report – FRDC 2005/083 92
- As a result of the removal of 4 KI based boats from the NZRL fishery, the number of jobs generated directly by rock lobster fishing in the KI regional economy would fall by 13 fte (full-time equivalents) while the number of jobs generated on KI by associated downstream activities (processing, transport, retail/food services and capital expenditure) would fall by 2 fte. Flow-on employment in other sectors of the regional economy would fall by 5 fte with the sector most affected being the trade sector. The total number of jobs lost from the KI regional economy would be approximately 19 fte.
- As a result of the removal of 4 KI based boats from the NZRL fishery, household income generated directly by rock lobster fishing in the KI regional economy would fall by $0.3 million while household income generated on KI by associated downstream activities (processing, transport, retail/food services and capital expenditure) would fall by less than $0.1 million. Flow-on household income in other sectors of the regional economy would fall by $0.2 million. Total household income lost from the KI regional economy would be approximately $0.5 million.
- As a result of the removal of 4 KI based boats from the NZRL fishery, the direct contribution to gross regional product (GRP) attributable to rock lobster fishing in the KI regional economy would fall by $0.3 million1 while contribution to GRP generated on KI by associated downstream activities (processing, transport, retail/food services and capital expenditure) would fall by $0.1 million. Flow-on contribution to GRP in other sectors of the regional economy would fall by $0.3 million. Total contribution to GRP lost from the KI regional economy would be approximately $0.7 million.
Economic Impacts on the State Economy
Estimates of the net economic impact on the state economy of removing 20, 35 and 50t of catch from the NZRL fishery are outlined in Tables 5.4.2.4 to 5.4.2.6, respectively. Note that the impacts at the state level reflect both the larger number of boats removed from the fishery (as outlined in Section 1) as well as the greater interdependencies that exist between sectors at the state level relative to those that exist in a small regional economy (i.e. KI). The direct impact measures fishing and downstream activities (i.e. processing, transport, retail/food services and capital expenditure). The flow-on impact measures the economic effects in other sectors of the economy (trade, manufacturing, etc.) generated by the fishing industry activities, that is, the multiplier effects.
1 Note that the reduction in direct contribution to GSP is no greater than the reduction in direct household income (after accounting for rounding) given that the boats removed from the fishery were assumed to be generating a negative gross operating surplus.

Results & Discussion
93 TAFI Final Report – FRDC 2005/083
Table 5.4.2.4. The net economic impact of removing 20t of catch from the NZRL fishery on the SA economy a
Sector Output Employment b Household Income
Contribution to GSP
$m fte $m $m
Direct effects
Fishing -0.6 -10 -0.2 -0.2
Downstream c -0.3 -2 -0.1 -0.1
Total Direct d -0.9 -12 -0.3 -0.3
Flow-on effects
Trade -0.2 -2 -0.1 -0.1
Manufacturing -0.3 -1 0.0 -0.1
Business Services -0.1 -1 -0.1 -0.1
Transport -0.1 0 0.0 0.0
Other Sectors -0.6 -3 -0.2 -0.4
Total Flow-on d -1.3 -8 -0.4 -0.6
Total d -2.3 -20 -0.7 -1.0
a In 2006 dollars. b Full-time equivalent jobs. c Downstream impacts include processing, transport, retail/food services and capital expenditure. d Totals may not sum due to rounding.
Source: EconSearch analysis.

Results & Discussion
TAFI Final Report – FRDC 2005/083 94
Table 5.4.2.5. The net economic impact of removing 35t of catch from the NZRL fishery on the SA economy a
Sector Output Employment b Household Income
Contribution to GSP
$m fte $m $m
Direct effects
Fishing -1.0 -16 -0.4 -0.3
Downstream c -0.5 -3 -0.1 -0.2
Total Direct d -1.5 -19 -0.5 -0.5
Flow-on effects
Trade -0.3 -4 -0.1 -0.2
Manufacturing -0.5 -2 -0.1 -0.1
Business Services -0.2 -1 -0.1 -0.1
Transport -0.1 -1 0.0 -0.1
Other Sectors -1.1 -5 -0.3 -0.6
Total Flow-on d -2.2 -13 -0.6 -1.1
Total d -3.8 -33 -1.1 -1.6
a In 2006 dollars. b Full-time equivalent jobs. c Downstream impacts include processing, transport, retail/food services and capital expenditure. d Totals may not sum due to rounding.
Source: EconSearch analysis.

Results & Discussion
95 TAFI Final Report – FRDC 2005/083
Table 5.4.2.6. The net economic impact of removing 50t of catch from the NZRL fishery on the SA economy a
Sector Output Employment b Household Income
Contribution to GSP
$m fte $m $m
Direct effects
Fishing -1.4 -23 -0.6 -0.5
Downstream c -0.7 -4 -0.2 -0.3
Total Direct d -2.1 -27 -0.7 -0.8
Flow-on effects
Trade -0.5 -6 -0.2 -0.2
Manufacturing -0.7 -2 -0.1 -0.2
Business Services -0.3 -2 -0.1 -0.2
Transport -0.2 -1 -0.1 -0.1
Other Sectors -1.5 -8 -0.4 -0.9
Total Flow-on d -3.1 -18 -0.8 -1.5
Total d -5.3 -46 -1.6 -2.3
a In 2006 dollars. b Full-time equivalent jobs. c Downstream impacts include processing, transport, retail/food services and capital expenditure. d Totals may not sum due to rounding.
Source: EconSearch analysis.
Some interpretation is provided below for the 35t scenario (Table 5.4.2.5), interpretation for the other scenarios is identical.
- As a result of the removal of 5 boats from the NZRL fishery, the value of output generated directly by rock lobster fishing in the state would fall by $1.0 million while output generated in the state by associated downstream activities (processing, transport, retail/food services and capital expenditure) would fall by $0.5 million. Flow-on output in other sectors of the state economy would fall by $2.2 million with the sectors most affected being the trade, manufacturing, business services and transport sectors. Total value of output lost from the state economy would be approximately $3.8 million.

Results & Discussion
TAFI Final Report – FRDC 2005/083 96
- As a result of the removal of 5 boats from the NZRL fishery, the number of jobs generated directly by rock lobster fishing in the state economy would fall by 16 fte (full-time equivalents) while the number of jobs generated in the state by associated downstream activities (processing, transport, retail/food services and capital expenditure) would fall by 3 fte. Flow-on employment in other sectors of the regional economy would fall by 13 fte with the sectors most affected being the trade, manufacturing, business services and transport sectors. The total number of jobs lost from the state economy would be approximately 33 fte.
- As a result of the removal of 5 boats from the NZRL fishery, household income
generated directly by rock lobster fishing in the state economy would fall by $0.4 million while household income generated in the state by associated downstream activities (processing, transport, retail/food services and capital expenditure) would fall by $0.1 million. Flow-on household income in other sectors of the state economy would fall by $0.6 million with the sectors most affected being the trade, manufacturing and business services sectors. Total household income lost from the state economy would be approximately $1.1 million.
- As a result of the removal of 5 boats from the NZRL fishery, the direct
contribution to gross state product (GSP) attributable to rock lobster fishing would fall by $0.3 million2 while contribution to GSP generated by associated downstream activities (processing, transport, retail/food services and capital expenditure) would fall by $0.2 million. Flow-on contribution to GSP in other sectors of the state economy would fall by $1.1 million with the sectors most affected being the trade, manufacturing, business services and transport sectors. Total contribution to GSP lost from the state economy would be approximately $1.6 million.
Estimated Buyout Costs
The estimated buyout costs include the cost of quota to offset the catch reduction and an allowance for the boat and gear involved with each licence (Table 5.4.2.7). The key assumptions used are:
- each pot has 131.653 quota units attached; - a pot could be purchased at $25,0004; and - the average value of boat and gear per licence holder is, on average, around
$670,0005.
The estimated cost of buy out would range from $5.8 million for 3 boats up to $14.2 million for 7 boats.
2 Note that the reduction in direct contribution to GSP is less than the reduction in direct household income given that the boats removed from the fishery were assumed to be generating a negative gross operating surplus. 3 Based on a TAC of 520 tonnes and 3,950 pots 4 Industry estimate 5 Estimate for 2004/05 imputed from EconSearch (2005b).

Results & Discussion
97 TAFI Final Report – FRDC 2005/083
Table 5.4.2.7. Estimated quota and boat buyout costs
Catch Reduction (t) 20 35 50
Pots (no.) 152 266 380
Pot Cost ($) $3,798,077 $6,646,635 $9,495,192
Boats (no.) 3 5 7
Boat Cost ($) $2,013,063 $3,355,104 $4,697,146
Total Buyout Cost ($) $5,811,140 $10,001,739 $14,192,339
*Disclaimer
EconSearch prepared the above Case Study exclusively for the use and benefit of The University of Tasmania. Neither the firm nor any employee of the firm undertakes responsibility in any way whatsoever to any person (other than to the above mentioned client) in respect of the report including any errors or omissions therein however caused.

Results & Discussion
TAFI Final Report – FRDC 2005/083 98
5.4.3 Case Study 3: The Tasmanian scallop fishery
Affected by the proposed Banks Strait MPA History of the Tasmanian Scallop Fishery
The Tasmanian Scallop Fishery is managed by the Tasmanian Government under an Offshore Constitutional Settlement Agreement between the Commonwealth and Tasmania. The history of commercial scallop fisheries within southeast Australia, including Tasmania, are characterised by a cycle of ‘boom and bust’. Prior to and during the 1970’s, inshore scallop beds were sequentially discovered, fished, and subsequently exploited (depleted) to the point of collapse (Figure 5.4.3.1). From the 1970’s to late 1980’s, new scallop stocks were discovered in offshore regions, in particular around the Furneaux group of islands and Banks Strait. The exploitation of these beds followed the familiar pattern of discovery and heavy fishing, which again resulted in the complete exploitation (depletion) of scallop stocks from these regions. The sequence of collapses within the scallop fishery was generally the consequence of excessive fishing capacity, which allowed the increasingly rapid fish-down of any newly discovered scallop stocks. Despite the implementation of several management restrictions during the 1980’s, which aimed at decreasing fishing effort on the scallop grounds, both the Tasmanian and Commonwealth fisheries had totally collapsed by the late 1980’s (Figure 5.4.3.2), with all known stocks having been discovered and exploited. New management strategies were implemented during the 1990’s aimed at assisting the recovery of scallop stocks within the Tasmanian and Commonwealth fisheries. In particular, fishermen and managers recognized that future harvesting strategies needed to be based on up-to-date biological knowledge of the species (with particular regard to reproductive maturity and growth rates), fleet dynamics and the need for economic efficiency. The resultant management strategy combined input and output controls aiming to restrict the number of fishers, to prohibit the taking of small scallops, to control scallop landings, and to provide a level of profitability to the fleet. The two main strategies implemented were the ‘less than 20% discarding rate’ requirement and the ‘two major spawnings’ criterion. The 20% discarding rate was designed as a yield optimization strategy, through limiting the capture and incidental mortality of small scallops. The ‘two major spawning’ criterion was a parallel management requirement, designed to allow scallops reproduce twice prior to being fished. Two major spawnings from adults was considered essential if sufficient reproduction output from the fishery was to occur and this was implemented by instituting a legal minimum shell length (recently increased in both Commonwealth and Tasmanian waters from 80mm to 90 mm). Seasonal closures were also adopted, which shut the scallop season during the summer months. This minimized the impact of scalloping during the highest spatfall (settlement) period, and helped prevent landings of scallops in poor condition. Despite these management changes, the capacity of the fleet remained far too high and both the Tasmanian and Commonwealth scallop fisheries had collapsed again by 1998/1999 (Figure 5.4.3.2).

Results & Discussion
99 TAFI Final Report – FRDC 2005/083
Figure 5.4.3.1. Commercial catches of P. fumatus from southeastern Australia from 1928 to 1989. The years when new beds were first exploited are indicated (data and diagram after Young et al., 1990).
Gre
at O
yste
r B
ayN
orfo
lk B
ay
Port
Phi
llip
Bay
N.E
. Tas
man
ia
Lak
es E
ntra
nce
Jerv
is B
ay
Furn
eaux
Gro
up
Ban
ks S
trai
t
0
500
1000
1500
2000
2500
3000
3500
4000
4500
5000
1928
1931
1934
1937
1940
1943
1946
1949
1952
1955
1958
1961
1964
1967
1970
1973
1976
1979
1982
1985
1988
Year of Scallop Fishery
Yie
ld (T
onne
s Mea
t Wei
ght)
Figure 5.4.3.2. Commercial scallop catch (shell wt) within the Tasmanian (solid line) and Commonwealth (dotted line) scallop fisheries using available data.
0
5000
10000
15000
1970 1975 1980 1985 1990 1995 2000 2005
Shel
l Wt T
onne
s
Tasmanian Commonwealth
0
5000
10000
15000
1970 1975 1980 1985 1990 1995 2000 2005
Shel
l Wt T
onne
s
Tasmanian Commonwealth

Results & Discussion
TAFI Final Report – FRDC 2005/083 100
From 1999 in the Commonwealth fishery and 2000 in the Tasmanian fishery, up until 2003, both the Central Bass Strait scallop zone and the Tasmanian scallop zone remained closed to commercial scallop fishing due to low scallop stocks. Although parts of the Commonwealth fishery were opened during 2001 and 2002, no fishing occurred. This extended closure led to some restructuring of the fleet with the aggregation of Tasmanian scallop licences into fewer hands, ultimately making the fishery more manageable and profitable for the remaining fishers. More importantly, the Tasmanian Government adopted a harvesting strategy based on detailed Spatial Management. It was hoped that such a strategy would add greater protection to the scallop resource during a fishing season, and allow sustainability of the scallop resource.
Spatial Management of the Tasmanian Scallop Fishery
The spatial management regime adopted by the Tasmanian scallop fishery differs from the majority of other spatially managed fisheries in Australia as all areas are closed to fishing unless specifically opened by public notice. This strategy limits fishing to discrete areas, which contain scallops. This ‘boxing off’ of scallop beds is possible because ‘good’ scallop beds tend to be found as small (1000’s meters x 1000’s meters) discrete patches (Haddon et al. 2005 – FRDC 2003/017). Industry has referred to the cycle of opening and closing discrete patches within and between seasons as ‘paddock fishing’. The main aims of detailed spatial management are to:
- Maximise stock rebuilding of scallops in unfished areas;
- Protect scallop stocks in other areas for future access (harvesting) and to provide the larvae to replenish areas previously opened to fishing;
- Limit fishing impacts on under-size scallops; and
- Focus commercial fishing on smaller areas containing good scallop beds, which has benefits to both fishers and the broader marine environment.
All vessels licenced to operate in the Tasmanian scallop fishery are required to have a vessel monitoring system (VMS) which tracks the location of vessels to ensure compliance with spatial management arrangements.
If effective, detailed spatial management will increase the chances of sustainability within the Tasmanian scallop fishery, and provide continuity of product into the market place on an annual basis, while allowing other habitats and species either never to be fished or to benefit from regular periods of recovery. Industry has realised the benefits of detailed spatial management strategies, and have come to accept the regime since its implementation into the Tasmanian scallop fishery in 2003. This acceptance is evident in industry’s willingness to partake in industry based surveys (during which catch tends not to be retained). These surveys have been meeting the data requirements to appropriately operate and manage detailed spatial management of scallop stocks. The development and optimization of industry surveys to aid in the management of the Tasmanian scallop fishery (and others like it) forms the

Results & Discussion
101 TAFI Final Report – FRDC 2005/083
basis of a current FRDC project at the Tasmanian Aquaculture Fisheries Institute (FRDC 2005/027 – Facilitating Industry Self-Management for Spatially Managed Stocks: A Scallop Case Study). The Tasmanian Scallop Resource and Harvesting Plan
From June 2005 until December 2005, a series of industry surveys were conducted within the Tasmanian scallop fishery. The main aim of these surveys was to explore waters where the status of scallop stocks was unknown, and to survey in greater detail known scallop stocks. Such information is essential for detailed spatial management regimes to be successful. The following provides a brief overview of the status of the Tasmanian scallop fishery, based on industry survey data, and an overview of the projected rotational harvest strategy (spatial management) for 2006 to 2008. Northwest Tasmania No known commercial scallop stocks are currently available within the northwest of Tasmania (Figure 5.4.3.3).
Figure 5.4.3.3. Location of industry sample tows, and amount of scallops caught per 5 minute sample tow (kg’s scallops) from surveys conducted in the Northwest of Tasmania during June 2005. Only two stations to the northwest of Stanley were found to contain low numbers of scallops. No scallops were taken in all other stations.

Results & Discussion
TAFI Final Report – FRDC 2005/083 102
Northeast Tasmania / West Flinders Island Abundances of scallops to the Northeast of Anderson Bay were found to be only very patchily significant within isolated areas (Figure 5.4.3.4). The size of these scallops was generally small (50 – 70 mm range). Further monitoring of this area may find a larger commercial resource, as the catchability of small (50 mm) scallops in standard scallop dredges is known to be low.
Figure 5.4.3.4. Location of industry sample tows, and amount of scallops caught per 5 minute sample tow (kg’s scallops) from surveys conducted northeast of Tasmania and to the west of Flinders Island during June 2005.

Results & Discussion
103 TAFI Final Report – FRDC 2005/083
East Flinders / Banks Strait Some of the known scallop stocks east of Flinders Island (northern beds) were commercially fished during 2005 (Figure 5.4.3.5). Very high abundances of mostly undersize scallops were found to occur over a large area within Banks Strait (south of Cape Barren Island). The scallop industry recommended that a Class 1 closure (no vessels to transit) around this region be implemented. Commercial quantities of legal sized scallops were found east of Eddystone Point during December 2005.
Figure 5.4.3.5. Location of industry sample tows, and amount of scallops caught per 5 minute sample tow (kg’s scallops) from surveys conducted east of Flinders Island, in Banks Strait, and east of Eddystone Point June, July and December 2005.
Eddystone Point

Results & Discussion
TAFI Final Report – FRDC 2005/083 104
St. Helens Point to Friendly Beaches
Scallop beds were fished commercially in this region during 2004. Residual scallop stocks remain (Figure 5.4.3.6), however, they are generally not considered to be in commercial quantities.
Figure 5.4.3.6. Location of industry sample tows, and amount of scallops caught per 5 minute sample tow (kg’s scallops) from surveys conducted from St. Helens Point to Friendly Beaches, south of Bicheno, during July 2005.
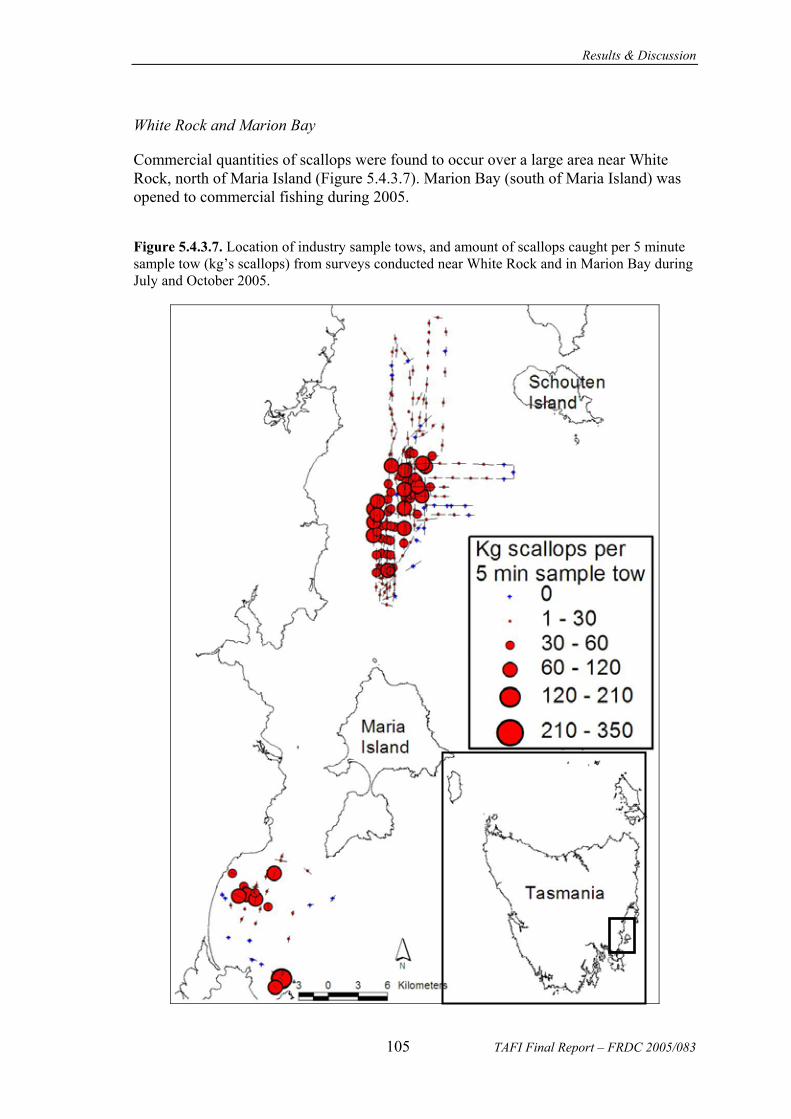
Results & Discussion
105 TAFI Final Report – FRDC 2005/083
White Rock and Marion Bay
Commercial quantities of scallops were found to occur over a large area near White Rock, north of Maria Island (Figure 5.4.3.7). Marion Bay (south of Maria Island) was opened to commercial fishing during 2005.
Figure 5.4.3.7. Location of industry sample tows, and amount of scallops caught per 5 minute sample tow (kg’s scallops) from surveys conducted near White Rock and in Marion Bay during July and October 2005.
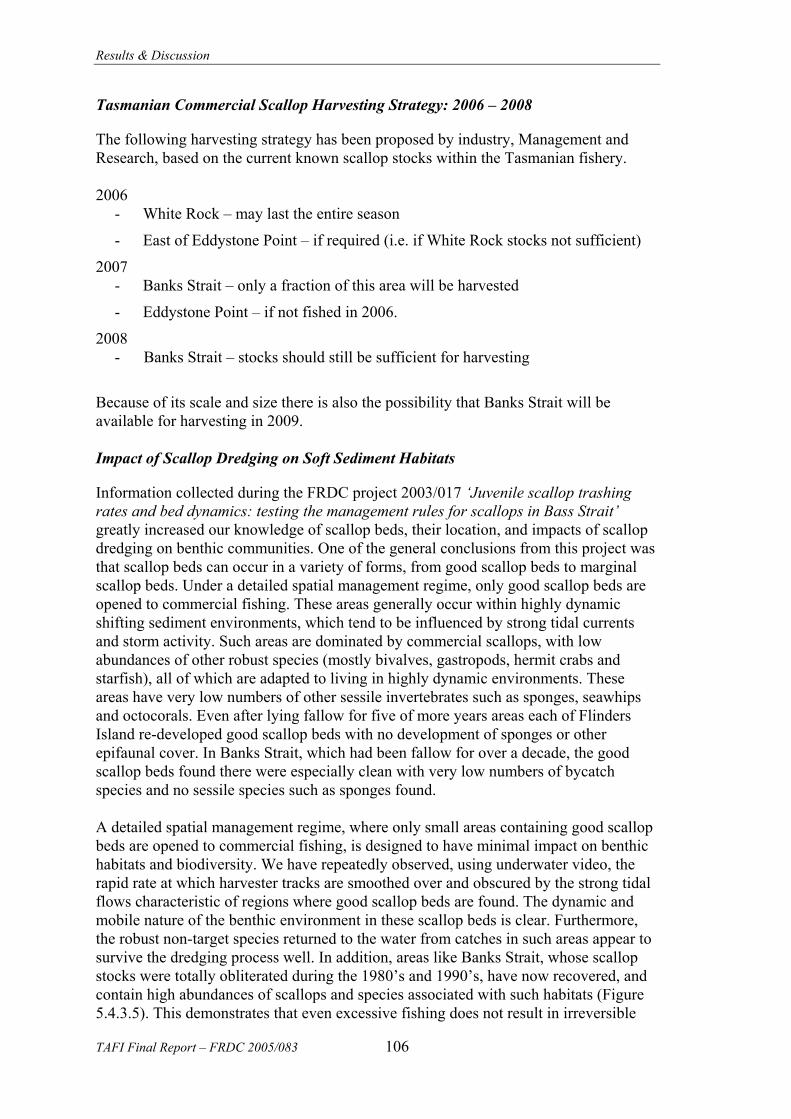
Results & Discussion
TAFI Final Report – FRDC 2005/083 106
Tasmanian Commercial Scallop Harvesting Strategy: 2006 – 2008
The following harvesting strategy has been proposed by industry, Management and Research, based on the current known scallop stocks within the Tasmanian fishery. 2006
- White Rock – may last the entire season
- East of Eddystone Point – if required (i.e. if White Rock stocks not sufficient)
2007 - Banks Strait – only a fraction of this area will be harvested
- Eddystone Point – if not fished in 2006.
2008 - Banks Strait – stocks should still be sufficient for harvesting
Because of its scale and size there is also the possibility that Banks Strait will be available for harvesting in 2009. Impact of Scallop Dredging on Soft Sediment Habitats
Information collected during the FRDC project 2003/017 ‘Juvenile scallop trashing rates and bed dynamics: testing the management rules for scallops in Bass Strait’ greatly increased our knowledge of scallop beds, their location, and impacts of scallop dredging on benthic communities. One of the general conclusions from this project was that scallop beds can occur in a variety of forms, from good scallop beds to marginal scallop beds. Under a detailed spatial management regime, only good scallop beds are opened to commercial fishing. These areas generally occur within highly dynamic shifting sediment environments, which tend to be influenced by strong tidal currents and storm activity. Such areas are dominated by commercial scallops, with low abundances of other robust species (mostly bivalves, gastropods, hermit crabs and starfish), all of which are adapted to living in highly dynamic environments. These areas have very low numbers of other sessile invertebrates such as sponges, seawhips and octocorals. Even after lying fallow for five of more years areas each of Flinders Island re-developed good scallop beds with no development of sponges or other epifaunal cover. In Banks Strait, which had been fallow for over a decade, the good scallop beds found there were especially clean with very low numbers of bycatch species and no sessile species such as sponges found. A detailed spatial management regime, where only small areas containing good scallop beds are opened to commercial fishing, is designed to have minimal impact on benthic habitats and biodiversity. We have repeatedly observed, using underwater video, the rapid rate at which harvester tracks are smoothed over and obscured by the strong tidal flows characteristic of regions where good scallop beds are found. The dynamic and mobile nature of the benthic environment in these scallop beds is clear. Furthermore, the robust non-target species returned to the water from catches in such areas appear to survive the dredging process well. In addition, areas like Banks Strait, whose scallop stocks were totally obliterated during the 1980’s and 1990’s, have now recovered, and contain high abundances of scallops and species associated with such habitats (Figure 5.4.3.5). This demonstrates that even excessive fishing does not result in irreversible

Results & Discussion
107 TAFI Final Report – FRDC 2005/083
damage to benthic habitats dominated by scallops. Under a rotational spatial management system, such habitats are expected to ‘bounce back’ once the area is closed again following fishing and allowed to recover. Impact of the Banks Strait MPA on the Tasmanian Scallop Fishery
Overlap of known scallop stocks and the MPA boundaries
Only a small area of the proposed Banks Strait MPA will have an impact on the Tasmanian scallop fishery. These regions are in the inner IUCN VI zoned sections (Figure 5.1.8). Of greatest impact is the northern Managed Resource Protection Zone, which disallows a range of demersal fishing activities, including scallop dredging. A ban on scallop dredging within this region will have a very large impact on the planned future harvest strategy of scallops found within the Tasmanian fishery. In particular, harvesting of the scallop beds east of Eddystone Point, and within the Banks Strait region (Figure 5.4.3.8) will be directly affected. These areas are scheduled to be harvested from 2006 through to 2008 and beyond. Given the current knowledge of scallop stocks within this region, it is believed that at least 8,500 tonnes (two years of harvesting given the current TAC) of scallops will be available. However, further exploration (survey work) within this region is expected to identify substantially larger stocks of scallops, which should provide a resource / harvesting strategy beyond 2008. As an example, a bed of scallops has been found to the east of Eddystone Point but has not yet been fully surveyed (Figure 5.4.3.8). Only limited scientific research tows have been conducted within this region, but industry members have suggested that this bed of scallops covers an extensive area (4 nM x unknown strip – Stuart Richey pers. comm). As such, this area may provide a substantial ‘paddock’ of scallops for future harvesting under a detailed spatial management regime. At the very least it will provide a substantial spawning biomass to replenish other areas (a standard benefit of the sequential paddock fishing management arrangement). At present, no alternative harvesting locations options are available for 2007 and beyond, as scallop stocks from remaining areas of the Tasmanian scallop fishery (areas outside the proposed Banks Strait MPA) have either been fished in recent years and require time to recover, or do not appear to contain commercial quantities of scallops. Consequently, the area within the proposed Banks Strait MPA is vital for the continued harvesting of scallops within the Tasmanian scallop fishery until 2008 and later. The rotational harvest strategy currently in use in Tasmanian scallop fishery appears to be successful in providing a fishery in each year and allowing scallop beds a number of years to recover and disseminate larval products for at least two years or more before being considered for harvesting. The smaller beds in the North East of Bass strait are made up of scallops that are currently too small to be fished but they are growing and will be suitable for harvest in two or more years. The requirement for such a harvest strategy is, however, that there are as many discrete good quality scallop beds as possible to maximize the options and keep the proportion of the total that is opened in any one year as small as possible. This means that the spawning biomass available to replenish nearby previously fished areas is maximized and each area experiences longer rests between fishing.

Results & Discussion
TAFI Final Report – FRDC 2005/083
Figure 5.4.3.8. Location of known concentrations of commercial scallops east of Eddystone Point and within Banks Strait that fall within the proposed northern IUCN VI Managed Resource Protected Zone. The light grey box off Eddystone indicate scientific sample tows from a bed of scallops that has not been fully surveyed. Industry advice is that this is a substantial bed of scallops (Stuart Richey pers. comm.)
Not fully surveyed
108

Results & Discussion
109 TAFI Final Report – FRDC 2005/083
Historical Catches of Scallops within the Proposed Banks Strait MPA
The proposed Banks Strait MPA will not only alter the immediate future harvesting plan of scallops within the Tasmanian fishery, but will also completely compromise the eventual target of a sustainable scallop fishery. The region from Eddystone Point north to Banks Strait has historically been an exceptionally productive scallop ground. This is evident through historical catch data (see the peaks in catches in Figure 5.4.3.1; 1981 – 1984, a large proportion of which came from Banks Strait). Despite this region being devastated by a large number of commercial vessels during the 1980’s, the resource has managed to recover and we now have a sustainable and conservative management strategy in place that will prevent any repeat of previous mistakes. More recent VMS data from the 2003 commercial scallop season further highlights the importance of this region to the Tasmanian scallop fishery. A region (paddock) to the east of Eddystone Point was opened to commercial fishing during 2003, with VMS data clearly showing that a vast proportion of the scallop resource caught during this year was within the proposed Banks Strait – Managed Resource Protection Zone (Figure 5.4.3.9). In fact, approximately 68% of the total catch, or 2,334 tonnes, from this region fell within the boundaries of the proposed Banks Strait MPA. A detailed spatial management system, with a lower TAC than historical levels and extended periods of recovery, should provide sustainability of the resource.
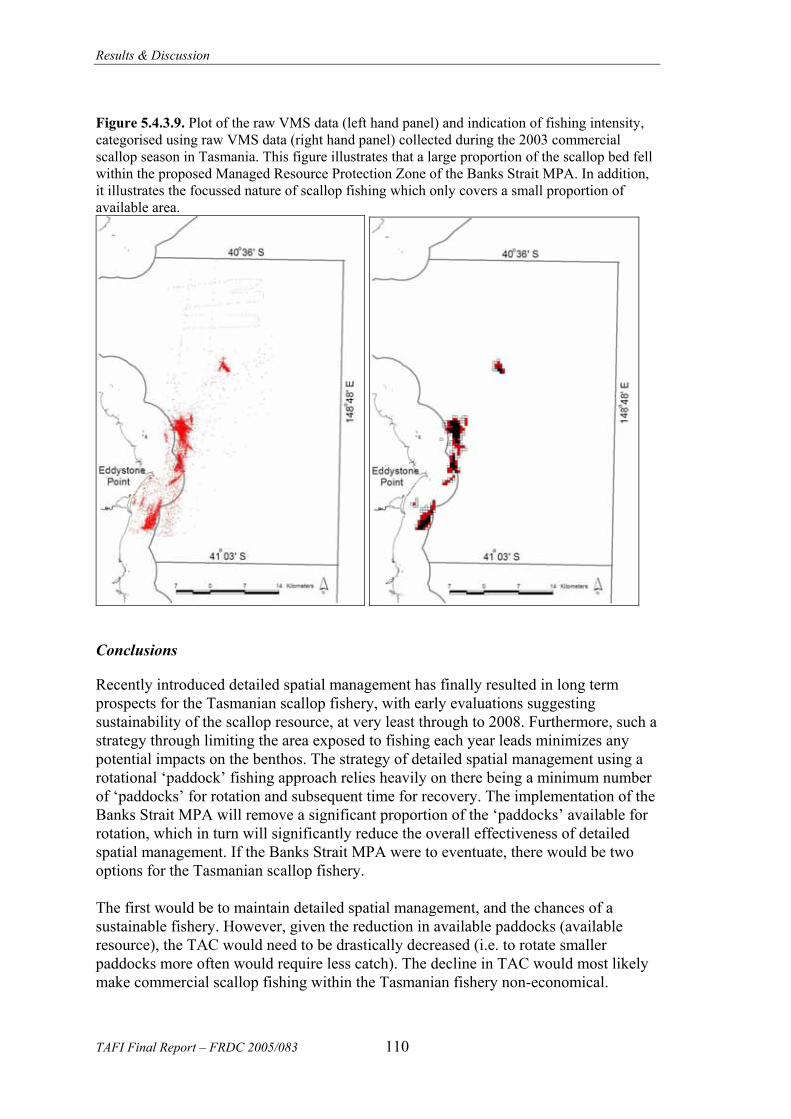
Results & Discussion
TAFI Final Report – FRDC 2005/083 110
Figure 5.4.3.9. Plot of the raw VMS data (left hand panel) and indication of fishing intensity, categorised using raw VMS data (right hand panel) collected during the 2003 commercial scallop season in Tasmania. This figure illustrates that a large proportion of the scallop bed fell within the proposed Managed Resource Protection Zone of the Banks Strait MPA. In addition, it illustrates the focussed nature of scallop fishing which only covers a small proportion of available area.
Conclusions
Recently introduced detailed spatial management has finally resulted in long term prospects for the Tasmanian scallop fishery, with early evaluations suggesting sustainability of the scallop resource, at very least through to 2008. Furthermore, such a strategy through limiting the area exposed to fishing each year leads minimizes any potential impacts on the benthos. The strategy of detailed spatial management using a rotational ‘paddock’ fishing approach relies heavily on there being a minimum number of ‘paddocks’ for rotation and subsequent time for recovery. The implementation of the Banks Strait MPA will remove a significant proportion of the ‘paddocks’ available for rotation, which in turn will significantly reduce the overall effectiveness of detailed spatial management. If the Banks Strait MPA were to eventuate, there would be two options for the Tasmanian scallop fishery. The first would be to maintain detailed spatial management, and the chances of a sustainable fishery. However, given the reduction in available paddocks (available resource), the TAC would need to be drastically decreased (i.e. to rotate smaller paddocks more often would require less catch). The decline in TAC would most likely make commercial scallop fishing within the Tasmanian fishery non-economical.

Results & Discussion
111 TAFI Final Report – FRDC 2005/083
The second and more likely option for the Tasmanian scallop fishery would be a shift from detailed spatial management, back to the ‘boom and bust’, ‘bonus fishery’ days of scalloping. This shift would most likely see the entire fishery open in any given year. For example, there may be one or at most two good scallop seasons followed by 3 – 5 years of closures while stocks within the entire fishery recover. This would have obvious negative impacts on a broad range of benthic habitats, as control over where scalloping occurs would be reduced or lost. There is also a great risk of losing export markets and processing expertise, which require continuity of product supply. This would in turn lead to lower prices on the domestic market due to less competition for the product. The last five years have been spent in the development of the detailed spatial management scheme currently being implemented in Tasmania’s scallop fishery. The Industry has finally welcomed this as securing a fishery every year (as far as possible). They now contribute their own time and boats to provide the greatly increased amounts of data required for such detailed spatial management. Without this data the whole fleet is left to search the coast for suitable scallop beds with a concomitant potential for dredging in inappropriate areas. The proposed Banks Strait MPA, which would close off at least 50% of the fishery, sends the wrong message to an Industry that has cooperated with researchers and managers to bring about a responsible and appropriate management strategy for this fishery.
Figure 5.4.3.10. The future of the Tasmanian scallop fishery that should derive from the newly implemented paddock fishing management strategy.
0
5000
10000
15000
1970 1975 1980 1985 1990 1995 2000 2005
Shel
l Wt T
onne
s
0
5000
10000
15000
1970 1975 1980 1985 1990 1995 2000 2005
Shel
l Wt T
onne
s
2006 2007 2008 2009 2010 2011 2012
Sustainablefishery each year
with TAC
Boom & Bust
0
5000
10000
15000
1970 1975 1980 1985 1990 1995 2000 2005
Shel
l Wt T
onne
s
0
5000
10000
15000
1970 1975 1980 1985 1990 1995 2000 2005
Shel
l Wt T
onne
s
2006 2007 2008 2009 2010 2011 2012
Sustainablefishery each year
with TAC
Boom & Bust

Results & Discussion
TAFI Final Report – FRDC 2005/083 112
5.4.4 Case Study 4 - Commonwealth Shark Fishery: Loss of an operation’s sheltered winter fishing grounds
Affected by the proposed Commonwealth Bass Basin and Banks Strait MPAs
Introduction
Open water in Bass Strait can be a dangerous place to fish, especially in winter. This fact has long been known by shark fishers operating out of ports on both Bass Strait’s Victorian and Tasmanian coasts. As such, during winter these fishers have traditionally worked around the shelter afforded by Bass Strait island groups such as Kent, Hogan and Curtis as well as that provided by the Furneaux Group and Tasmania’s upper east coast. The proposed Commonwealth Bass Basin and Banks Strait MPAs stand largely to remove these protected winter fishing grounds, relative to open water, from the grounds available to Commonwealth shark fishers. Apart from effort displacement into open water and into summer, with attendant concerns of increased costs and reduced catch rates, safety is one of BassShark Pty Ltd’s main apprehensions regarding these two MPAs: “Bass Basin is our winter fishery, it’s sheltered from a north-west wind which is the prevailing wind in winter”. The average length of vessels in the fishery is less than 50 feet, and without areas such as the Bass Basin MPA, BassShark considers that it would be forced to downsize into solely a summer fishing operation. (BassShark includes the proposed Commonwealth Banks Strait MPA in its considerations due to it being uncertain whether commercial gillnetting will ultimately be a permitted activity in a managed resource protected zone.) Snapshot of the operation
The market value of BassShark’s vessel and gear, fishing licences and quota units, and plant and equipment is over $2 million. With its vessel, BassShark fishes throughout the year and in 2005 landed 86 tonnes of predominantly gummy shark. Approximately 50 per cent of this gummy shark was caught in proposed Commonwealth MPAs, mainly Banks Strait and Bass Basin. BassShark’s operating expenditure in 2005 was over $500 000, and it provided for three full time positions and gave casual employment to 11 people. BassShark’s vessel fished 200 days in 2005, 130 of which were in proposed Commonwealth MPAs, as follows:
Summer Winter No. days fished in MPAs
Banks Strait 60 10 70
Bass Basin 40 40
Zeehan 15 15
Apollo 5 5
Total days fished in MPAs 80 50 130
Total days fished 200
Results & Discussion
113 TAFI Final Report – FRDC 2005/083
Approximately 60 per cent of BassShark’s 70 days fishing outside proposed Commonwealth MPAs was in summer in western Bass Strait, and 40 per cent was in winter in eastern Bass Strait. In other words, like many shark fishers, BassShark predominantly fished the open water of western Bass Strait in summer and the shelter offered by the island groups of eastern Bass Strait in winter. Availability of protected fishing grounds in the proposed Commonwealth Bass Basin MPA, close to its home port in Victoria, were particularly important to BassShark. In years prior to 2005, more days were spent fishing the area of the Zeehan MPA in summer and Bass Basin in winter.
Impacts of the proposed MPAs
BassShark has been an active member of the committee established by the Australian Fisheries Management Authority (AFMA) to advise on management of the shark fishery. In view of scientific stock assessment of the take of gummy shark as sustainable, in 2005 BassShark built a new boat and created two additional positions in the forms of a skipper and a deck hand. If the Commonwealth MPAs are introduced as proposed, these two positions will be lost as BassShark is forced to concentrate its fishing into summer in the open waters of western Bass Strait. According to BassShark, this concentration will result in its vessel having to steam further and spend more time in exposed open waters, which will increase both its operating cost and its maintenance bill. One fewer deck hand would also mean slower movement of the catch through gutting to the ice room, resulting in softer, lower quality product. BassShark is also concerned that other shark boats will be concentrated into western Bass Strait in summer, with the risk of declining catch rates and regional depletion. BassShark points out that it contemplates this situation on top of the recent 30 per cent increase in fuel price, and 100 per cent increase in AFMA fees since 2000. Given the disregard shown to fishery management by the Commonwealth MPAs, BassShark is also reconsidering its involvement in AFMA’s management process. Perhaps most depressing for BassShark is the prospect that it would probably have to move its home port west to be closer to where it would be forced to fish. This relocation would mean leaving a house and town that have been home for 25 years: “We’d have to start off a whole new support base”. This support base includes engineers, welders, electricians and so on, as well as friends and local interests. But, most importantly, BassShark would be uprooted from its extended and inter-generational family of fisher fathers, uncles, brothers and so on within which it learnt its trade and still relies for assistance and advice. BassShark is a supporter of its local town’s annual fishing festival, and is a member of volunteer sea rescue and the Lions Club. These social ties are additional to those with the town’s fishing co-operative – which BassShark considers will shut should the Commonwealth MPAs be introduced as proposed due to lack of boats – which employs some 25 people in its processing operation. The co-operative supplies local restaurants and hotels as well as the Melbourne Fish Market and is an integral part of the town’s fishing festival which draws thousands of tourists each year.

Results & Discussion
TAFI Final Report – FRDC 2005/083 114
Conclusion
If excluded from the proposed Commonwealth Bass Basin and Banks Strait MPAs, BassShark does not consider that it will be able to catch its full quota of gummy shark elsewhere, despite being prepared to fish open waters in western Bass Strait more than at present. The loss of its sheltered winter fishing grounds spell downsizing, a disruptive change in home port and the prospect of having to substitute catch of a premium species with quota leased for a weaker market species, saw shark. And BassShark is not looking forward to there being a greater concentration of vessels in smaller areas of fishable water resulting in lower catch rates and possible areal depletion, let alone the safety issues of increased open water fishing. In short, BassShark considers that it stands to be dislocated both on water and on land and that these dislocations will result in it becoming a downsized business operating on a substantially smaller margin. And BassShark owes approximately $400 000 on quota purchased. Little wonder then, in its written reply to the following question regarding the proposed Commonwealth MPAs: ‘Any other response/implication (please specify)?’ in its only reply in capital letters BassShark stated:
STRESS RELATED ILLNESS DEPRESSION STRESS ON RELATIONSHIP

Results & Discussion
115 TAFI Final Report – FRDC 2005/083
5.4.5 Case Study 5 - Commonwealth Auto-Longline Fishery: Undermining of the competitive advantage of a diversified enterprise
Affected by the proposed Commonwealth Murray, Banks Strait, Huon, Tasman Fracture, and Zeehan MPAs
Introduction
“How can you put a value on a competitive advantage?” This question was asked by the Managing Director of a group of entities, Catch&Grow Pty Ltd, which relies for its market share on it being possible to supply both wild and cultured fish. “You have to look at the group holistically, it’s greater than the sum of its parts, and each cog affects all the others.” One of those parts, in particular, is vital to the group of operations as a whole. That part is the wild fisheries component of Catch&Grow in the context of its aquaculture operation. Put simply, in the Tasmanian context, Catch&Grow has a turnover of $6.5 million per annum, approximately $2.6 million of which is generated through the sale of blue-eye trevalla, ling and ribaldo caught from its vessel operating in the Australian south-east marine region. Catch&Grow considers this catch, significantly threatened by the proposed Commonwealth MPAs, to be one of its key competitive advantages in its markets for its fish products in Tasmania.
Structure of the enterprise
Catch&Grow is a Tasmanian owned and primarily Tasmanian-based operation. It has four principal components to its Tasmanian operation: aquaculture; fishing; buying in wild caught fish, and processing both wild and cultured fish. Its auto-longline fishing vessel operates in the Australian south-east marine region in the gillnet, hook and trap (GHAT) sector of the southern and eastern scalefish and the shark fishery managed by the Australian Fisheries Management Authority (AFMA). Catch&Grow’s vessel concentrates on taking blue-eye trevalla and ling, with ribaldo as its main bycatch.
“This fishing side of our business is the key driver that gives us leverage into our aquaculture markets, and these MPAs would mean our vessel would go from turning a profit to contributing a loss to our business”
Catch&Grow’s vessel lands approximately 120 000kg of blue-eye trevalla, 150 000kg of ling and 50 000kg of ribaldo each year. It does so predominantly through trips to fishing grounds impinged on by the following proposed Commonwealth MPAs, to the following extents:
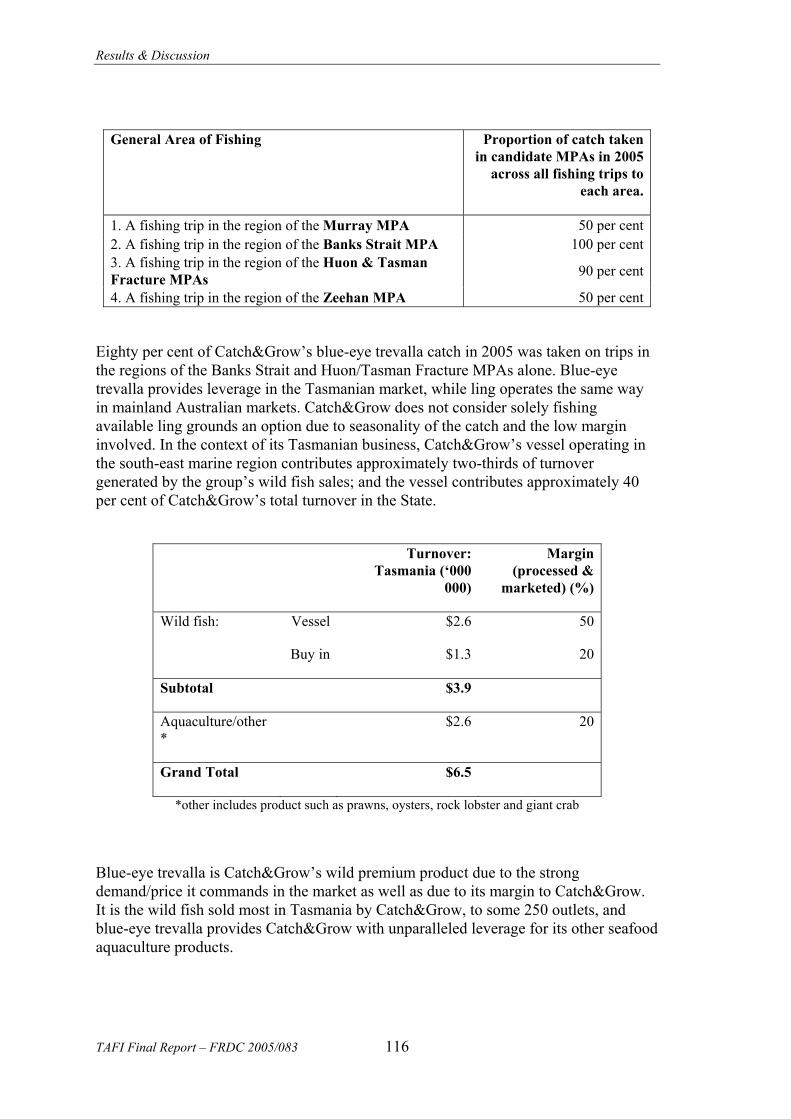
Results & Discussion
TAFI Final Report – FRDC 2005/083 116
General Area of Fishing Proportion of catch taken in candidate MPAs in 2005
across all fishing trips to each area.
1. A fishing trip in the region of the Murray MPA 50 per cent 2. A fishing trip in the region of the Banks Strait MPA 100 per cent 3. A fishing trip in the region of the Huon & Tasman Fracture MPAs 90 per cent
4. A fishing trip in the region of the Zeehan MPA 50 per cent
Eighty per cent of Catch&Grow’s blue-eye trevalla catch in 2005 was taken on trips in the regions of the Banks Strait and Huon/Tasman Fracture MPAs alone. Blue-eye trevalla provides leverage in the Tasmanian market, while ling operates the same way in mainland Australian markets. Catch&Grow does not consider solely fishing available ling grounds an option due to seasonality of the catch and the low margin involved. In the context of its Tasmanian business, Catch&Grow’s vessel operating in the south-east marine region contributes approximately two-thirds of turnover generated by the group’s wild fish sales; and the vessel contributes approximately 40 per cent of Catch&Grow’s total turnover in the State.
Turnover: Tasmania (‘000
000)
Margin (processed &
marketed) (%)
Wild fish: Vessel $2.6 50
Buy in $1.3 20
Subtotal $3.9
Aquaculture/other*
$2.6 20
Grand Total $6.5
*other includes product such as prawns, oysters, rock lobster and giant crab
Blue-eye trevalla is Catch&Grow’s wild premium product due to the strong demand/price it commands in the market as well as due to its margin to Catch&Grow. It is the wild fish sold most in Tasmania by Catch&Grow, to some 250 outlets, and blue-eye trevalla provides Catch&Grow with unparalleled leverage for its other seafood aquaculture products.
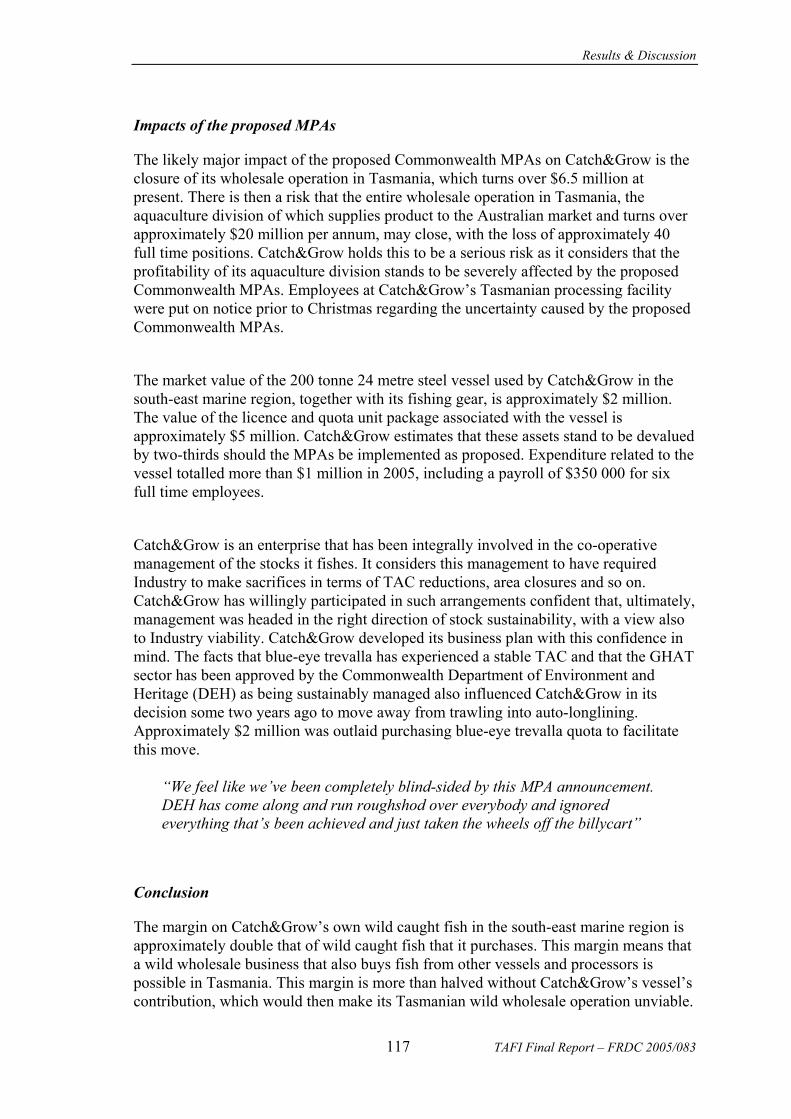
Results & Discussion
117 TAFI Final Report – FRDC 2005/083
Impacts of the proposed MPAs
The likely major impact of the proposed Commonwealth MPAs on Catch&Grow is the closure of its wholesale operation in Tasmania, which turns over $6.5 million at present. There is then a risk that the entire wholesale operation in Tasmania, the aquaculture division of which supplies product to the Australian market and turns over approximately $20 million per annum, may close, with the loss of approximately 40 full time positions. Catch&Grow holds this to be a serious risk as it considers that the profitability of its aquaculture division stands to be severely affected by the proposed Commonwealth MPAs. Employees at Catch&Grow’s Tasmanian processing facility were put on notice prior to Christmas regarding the uncertainty caused by the proposed Commonwealth MPAs.
The market value of the 200 tonne 24 metre steel vessel used by Catch&Grow in the south-east marine region, together with its fishing gear, is approximately $2 million. The value of the licence and quota unit package associated with the vessel is approximately $5 million. Catch&Grow estimates that these assets stand to be devalued by two-thirds should the MPAs be implemented as proposed. Expenditure related to the vessel totalled more than $1 million in 2005, including a payroll of $350 000 for six full time employees.
Catch&Grow is an enterprise that has been integrally involved in the co-operative management of the stocks it fishes. It considers this management to have required Industry to make sacrifices in terms of TAC reductions, area closures and so on. Catch&Grow has willingly participated in such arrangements confident that, ultimately, management was headed in the right direction of stock sustainability, with a view also to Industry viability. Catch&Grow developed its business plan with this confidence in mind. The facts that blue-eye trevalla has experienced a stable TAC and that the GHAT sector has been approved by the Commonwealth Department of Environment and Heritage (DEH) as being sustainably managed also influenced Catch&Grow in its decision some two years ago to move away from trawling into auto-longlining. Approximately $2 million was outlaid purchasing blue-eye trevalla quota to facilitate this move.
“We feel like we’ve been completely blind-sided by this MPA announcement. DEH has come along and run roughshod over everybody and ignored everything that’s been achieved and just taken the wheels off the billycart”
Conclusion
The margin on Catch&Grow’s own wild caught fish in the south-east marine region is approximately double that of wild caught fish that it purchases. This margin means that a wild wholesale business that also buys fish from other vessels and processors is possible in Tasmania. This margin is more than halved without Catch&Grow’s vessel’s contribution, which would then make its Tasmanian wild wholesale operation unviable.

Results & Discussion
TAFI Final Report – FRDC 2005/083 118
Catch&Grow would then have no wild fish from the south-east marine region to sell alongside its aquaculture products. Catch&Grow is the only enterprise competing in its markets at present that offers the advantage of supplying both wild and cultured product; Catch&Grow considers that it secures a number of its largest customers because it operates as a supplier of both. Without this competitive advantage, Catch&Grow would be forced to compete with other solely aquaculture enterprises, the tonnages of which are at least five times that of Catch&Grow. Catch&Grow fears that it would lose any volume driven price war regarding aquaculture product, and that with a lead-time of three years between it being possible to expand its aquaculture operation and there being fish to process in its factory, Catch&Grow considers itself vulnerable to such an eventuality. If it were to survive, it would be on significantly reduced margins and scale. Such are some of the strategic implications considered by Catch&Grow due to the impact of the proposed Commonwealth MPAs on the wild fisheries component of its group of operations. The possible dollar value impact on Catch&Grow should its Tasmanian wholesale operation close is the loss of approximately $6.5 million in turnover per annum. Assets associated with this closure are valued at approximately $7 million, and expenditure related to the operation of these assets is over $1 million per annum. But the loss to Catch&Grow in terms of its position in its markets across its group of operations could be far greater. The cost in Tasmania could be as great as 40 full time positions, and an even more radical restructure might eventuate if Catch&Grow’s aquaculture market share was to slide substantially. How, indeed, can you put a value on a competitive advantage?

Results & Discussion
119 TAFI Final Report – FRDC 2005/083
5.4.6 Case Study 6: Commonwealth Orange Roughy Fishery: Displacement of effort to the High Seas and of an enterprise to New Zealand
Affected by the proposed Commonwealth Offshore Seamount (South) and Banks Strait MPAs
Introduction
Approximately 80 per cent of OffshoreFishing Pty Ltd’s retained catch stands to be displaced by the proposed Commonwealth Offshore Seamount (South) and Banks Strait MPAs. OffshoreFishing sees little option but to try to make up its approximately 500 tonnes of displaced catch by fishing outside 200 nautical miles of the Australian coastline. It would compete on the high seas with New Zealand vessels as well as with other Australian vessels displaced by the proposed MPAs. It is the opinion of OffshoreFishing that these fishing grounds could stand the likely increase in fishing effort for only a short number of years: “Then it’ll be lunch cruises on the Derwent for us.” OffshoreFishing considers this result to be entirely unnecessary if co-operative research, management and sustainable fishing of productive fishing grounds in Australian waters were to continue to run their collective course. The key to this continuation is the access threatened by the proposed Commonwealth MPAs.
Snapshot of the operation
OffshoreFishing operates a single trawl vessel that targets orange roughy, smooth dory and spikey dory, primarily in the Commonwealth southern and eastern scalefish and shark fishery. Its vessel, gear, licences and quota unit holdings, and vehicles together have a market value of over $3 million. OffshoreFishing calculates that it operated its vessel for 215 of its 256 fishing days in 2005 in the Offshore Seamount (South) and Banks Strait MPAs. In these 215 days it took 434 tonnes of orange roughy, 52 tonnes of smooth dory and 13 tonnes of spikey dory, all of which it landed in Hobart. In addition, it took 123 tonnes of fish outside Australia’s exclusive economic zone, a proportion of which it landed in New Zealand. OffshoreFishing’s total sales in 2005 grossed approximately $2.5 million, nearly $2 million of which was generated from the sale of fish caught in the proposed Commonwealth Offshore Seamount (South) and Banks Strait MPAs. OffshoreFishing has six equivalent full time positions, five on the vessel and one onshore, payments to which exceed $600 000 per annum. It also supports two other households that are partners in the enterprise. Additional expenditure on fuel, repairs and maintenance, administration and so on is over $1 million. In short, OffshoreFishing calculates its annual operating cost to be $1.8 million.

Results & Discussion
TAFI Final Report – FRDC 2005/083 120
Impacts of the proposed MPAs
As noted, OffshoreFishing stands to have approximately 80 per cent of its 2005 catch displaced by the proposed Commonwealth Offshore Seamount (South) and Banks Strait MPAs. OffshoreFishing will then be forced to search for alternative fishing grounds. Notwithstanding the cost of exploring for new grounds, OffshoreFishing does not consider it likely that suitable grounds will be found within the southern and eastern scalefish and shark fishery, and it holds that searching in other Australian waters would be folly at present given that MPAs stand to be ‘rolled out’ in Australia’s other marine regions. OffshoreFishing states that its only realistic option is to fish high seas grounds with which it is already familiar and it would likely relocate to one of the closer New Zealand ports while fishing the high seas remained economically viable. OffshoreFishing considers it unlikely that high seas fishing could entirely replace catch lost due to MPAs. It also knows from experience that operating expenses are greater fishing the high seas. OffshoreFishing is aware that this strategy is marginal but it considers it to be its only option. Relocation of OffshoreFishing to New Zealand would affect Hobart in terms of lost employment associated with the operation as well as in its unloadings, processing, repairs and maintenance, and freight related expenditures foregone. For example, a single operation processes OffshoreFishing’s orange roughy catch, which to it is worth over $12 million in revenue. It would attempt to substitute this tonnage using aquaculture product or import wild species but does not expect that such an adjustment would be seamless or even entirely possible. Unfortunately, planned diversification into processing small pelagic species looks set also to be affected by the proposed Commonwealth MPAs. And specialist providers of services such as marine electronics and net making and rigging stand to cease operating without the trade provided by trawl fishing vessels, particularly orange roughy. OffshoreFishing is also concerned about the impact of the proposed Commonwealth MPAs on its fishing licences and quota holdings assets in the southern and eastern scalefish and shark fishery.
“[The] Australian fisheries management Authority (AFMA) has issued Statutory Fishing Rights (SFRs) to fishers of the south-east fishery. These SFRs have been issued, operated and traded without the restrictions of either Strict Nature Zones or Habitat Protection Zones of the magnitude proposed. The proposed MPAs remove substantial areas of south-east fishery that are currently utilized and areas that could be utilized in the future with these SFRs. Consequently any introduction of MPAs into this area will disenfranchise and devalue the capital value and income earned from these SFRs”
OffshoreFishing maintains that the combination of lack of detail and final decision regarding various recent Commonwealth fishing-related announcements and the short timeframe operators were being forced to work to made it difficult to assess implications for asset value and hence to frame options.
Results & Discussion
121 TAFI Final Report – FRDC 2005/083
“I wish to protest the short consultation period and time table that DEH [the Australian Government Department of the Environment and Heritage] is working to. I reject the proposition that these time lines will allow for fishermen to make an informed decision about whether to stay in the Industry or exit with the assistance of the buy-out, particularly given the lack of information and reasoning behind the need for the proposed MPAs and hence what final form they will be or whether they will in fact come into existence. In addition other than the initial announcement regarding the Government’s buy-out package, commercial fishermen are unaware of what and how the value of their fishing concessions will be calculated. Thus it seems that the fishermen are at risk of being disenfranchised of their property rights and not appropriately compensated due to the tight and short timetable preventing the adequate consultation to make an informed decision”
In addition, OffshoreFishing considers the market value of its vessel and associated gear to be $1.2 million, and that this value is entirely threatened by the proposed Commonwealth MPAs.
“There’s a glut of boats and gear on the market at the moment, let alone once these MPAs are brought in”
Conclusion
“It appears to us that someone in DEH wants to shut down the orange roughy fishery. If they want to, they should come out and say so, then we can work towards a properly costed buy-out”
OffshoreFishing viewed the imposition threatened by the proposed Commonwealth Offshore Seamount (South) and Banks Strait MPAs as a backdoor method of closing the orange roughy fishery in the south-east marine region. OffshoreFishing had not participated in the Industry initiative to develop a structural adjustment package for the southern and eastern scalefish and shark fishery, but it had been prepared cautiously to welcome the package. OffshoreFishing considered that the proposed Commonwealth MPAs announcement then both compromised the structural adjustment package by increasing the potential number of applicants and overrode the principle and process of managed sustainable fishing being co-operatively worked towards by Industry with the Australian Fisheries Management Authority (AFMA). OffshoreFishing does not hold AFMA’s approach to the orange roughy resource to warrant the imposition of MPAs:
“AFMA has managed the south-east fishery within its charter to develop the fisheries in a sustainable and economic manner. The SFR conditions have been maintained and adjusted with full consultation to ensure that this resource of
Results & Discussion
TAFI Final Report – FRDC 2005/083 122
Australia is protected for the future. Consideration of biodiversity has been integrated in the decisions of permit conditions and resource management. Details of the proposed MPAs which restrict commercial fishing have not suggested or addressed any failings of AFMA's management that is detrimental to biodiversity conservation goals that are the concern. I believe that prior to implementing MPAs which restrict commercial fishing in areas that operators have a legal entitlement to, DEH should specify the direct failings as they see it of AFMA's management of biodiversity conservation”
OffshoreFishing is a member of the research advisory group regarding orange roughy, and participates in the annual stock surveys to track the biomass. It has been a co-operative member of an open management process and was prepared to accept whatever reductions in TACs might be scientifically required to ensure a sustainable catch. It considers that the proposed Commonwealth MPAs threaten to close this process regardless of scientific stock assessment, AFMA management processes or Industry consultation.
“No logic is presented for the boundaries or sizes of the MPAs … It would be beneficial to fishers to know why these boundaries are so crucial and why they can not stand any commercial fishing within them”
“[DEH] talks about MPAs being managed primarily for biodiversity conservation and very broadly speaks of the value of the prospective MPA, but it does not give any scientific impact studies to demonstrate or quantify that the operation of the commercial fishers of the areas has detrimentally effected the biodiversity of the area to any degree or to a degree that requires fishers to be outlawed from that area. With no substantiated argument being presented it is very hard to understand why fishers should be disenfranchised of their property rights”
The paradox for OffshoreFishing is that the proposed Commonwealth MPAs threatened to displace its fishing effort to the high seas. The tragedy is that OffshoreFishing would prefer to remain within what it perceives to be a responsible management regime in the southern and eastern scalefish and shark fishery, not to be forced to redeploy its vessel on the high seas, and relocate its operation from Hobart to New Zealand.

Results & Discussion
123 TAFI Final Report – FRDC 2005/083
5.4.7 Case Study 7: Tasmanian Scallop Fishery - Impacts both up and downstream on a vertically integrated enterprise
Affected by the proposed Commonwealth Banks Strait MPA
Introduction
Build-Fish-Process Pty Ltd adds value to its enterprise by operating both up and downstream of the fishing side of its business. Upstream, Build-Fish-Process supplies the scallop and auto-longline fleets by building boats. It fishes itself from two vessels for scallops, rock lobster, blue-eye trevalla and ling. And downstream it processes its 630 tonnes (shell weight) of scallops per annum, predominantly for export to France. The lynchpin of this vertically integrated operation is scallops caught in the Tasmanian fishery. With approximately 50 per cent of the fishery’s grounds proposed to be excluded by the Commonwealth Banks Strait MPA – and grounds in this area anticipated to contribute 100 per cent of the fleet’s catch in 2007 and 2008 – the implications for Build-Fish-Process are the closure of both its boat building and processing operations, and the forced restructuring of its devalued fishing operation by attempting to increase its share of the southern rock lobster catch in Tasmania. These impacts are set within the context of what Build-Fish-Process considers now to be a sustainably managed scallop fishery – one in which it has strategically positioned itself – that has a developing export market:
“It is discouraging for a fisherman who started in 1980 and had to survive through a 12 year scallop closure, then buy out several other operators at a large cost to stay competitive in a fishery that we are told is totally sustainable and meets all environmental policies, to then have approximately 50% of the scallop grounds closed for no apparent reason …”
Structure of the enterprise
Build-Fish-Process has three arms: boat building; fishing; and processing.
Boat building: Build-Fish-Process builds vessels for the scallop and auto-longline fleets. At present, it is one month from completing such a dual capability greater then 20 metre steel vessel for a fisher who, subsequent to the December 2005 announcement regarding the proposed Commonwealth Banks Strait MPA, has postponed his order.
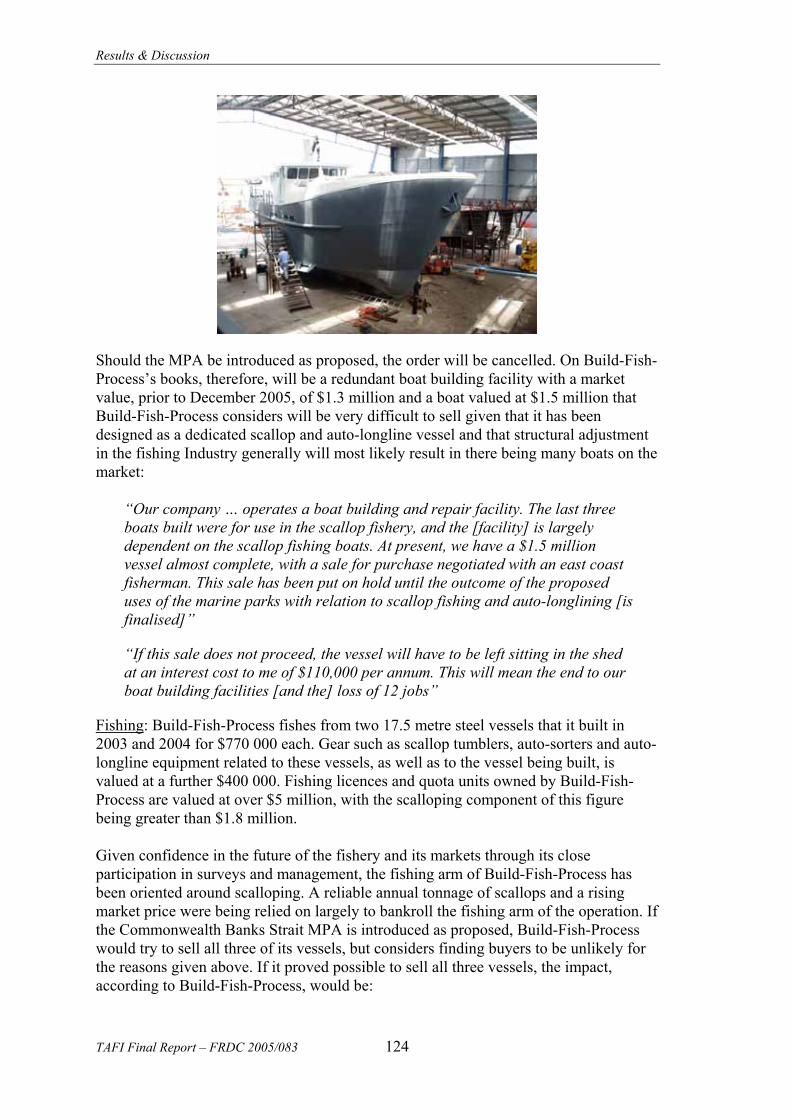
Results & Discussion
TAFI Final Report – FRDC 2005/083 124
Should the MPA be introduced as proposed, the order will be cancelled. On Build-Fish-Process’s books, therefore, will be a redundant boat building facility with a market value, prior to December 2005, of $1.3 million and a boat valued at $1.5 million that Build-Fish-Process considers will be very difficult to sell given that it has been designed as a dedicated scallop and auto-longline vessel and that structural adjustment in the fishing Industry generally will most likely result in there being many boats on the market:
“Our company … operates a boat building and repair facility. The last three boats built were for use in the scallop fishery, and the [facility] is largely dependent on the scallop fishing boats. At present, we have a $1.5 million vessel almost complete, with a sale for purchase negotiated with an east coast fisherman. This sale has been put on hold until the outcome of the proposed uses of the marine parks with relation to scallop fishing and auto-longlining [is finalised]”
“If this sale does not proceed, the vessel will have to be left sitting in the shed at an interest cost to me of $110,000 per annum. This will mean the end to our boat building facilities [and the] loss of 12 jobs”
Fishing: Build-Fish-Process fishes from two 17.5 metre steel vessels that it built in 2003 and 2004 for $770 000 each. Gear such as scallop tumblers, auto-sorters and auto-longline equipment related to these vessels, as well as to the vessel being built, is valued at a further $400 000. Fishing licences and quota units owned by Build-Fish-Process are valued at over $5 million, with the scalloping component of this figure being greater than $1.8 million. Given confidence in the future of the fishery and its markets through its close participation in surveys and management, the fishing arm of Build-Fish-Process has been oriented around scalloping. A reliable annual tonnage of scallops and a rising market price were being relied on largely to bankroll the fishing arm of the operation. If the Commonwealth Banks Strait MPA is introduced as proposed, Build-Fish-Process would try to sell all three of its vessels, but considers finding buyers to be unlikely for the reasons given above. If it proved possible to sell all three vessels, the impact, according to Build-Fish-Process, would be:

Results & Discussion
125 TAFI Final Report – FRDC 2005/083
“[the] loss of 12 full time jobs on boats – estimated to be approx $550,000 in wages [and]…[the] loss of 2 full time maintenance workers – approx $96,000”
More likely, however, Build-Fish-Process would be “left with vessels almost impossible to sell at a reasonable price – approx. value $3 million”. Without at least one of its three vessels being sold, Build-Fish-Process would be forced to attempt to access an additional 200 Tasmanian rock lobster quota units – valued at $6 million to purchase at present - to run all three boats: “Three boats with enough quota to make all three viable in the fishery – a huge investment in vessels and quota holdings”. Whether this number of units would be available for either sale or lease, and at what price, are unknown, but Build-Fish-Process fears that access would be difficult and that prices associated with such access would be higher than at present.
Processing: Build-Fish-Process owns one of only a small handful of European Union registered processing facilities in Tasmania. The facility is valued at $750 000, employs two people permanently and approximately 30 scallop splitters from May to December, who can earn up to approximately $1000 a week. Particularly encouraging in 2005 was the all-season beach price for scallops of $13 kilogram, up from $8 kilogram in 2004. This increase was due to the development of markets in France:
“Our Company along with [another] Company has spent large amounts of money in conjunction with the State Economic Development Authority toward researching and securing export markets in Europe. This led to a 50% increase in the beach price for scallops in the 2005 season, and [there] appears to be another 20% for the 2006 season. This market will be lost unless we can maintain a reliable supply”
Quite simply, without scallop fishing being possible in the proposed Commonwealth Banks Strait MPA, the reduced tonnage available would make Build-Fish-Process’s processing facility redundant.
“[The] factory has been mainly set up for scallop processing. [It] has just recently had $200,000 spent [on it] to meet EU export requirements. If we lose half [the] scallop beds, [the] factory [is] not viable and will close [with the] loss of:
- 30 part time splitters jobs - 2 full time jobs - wages for Bridport - factory of no viable use”
In summary, the market value of Build-Fish-Process’s assets pre-November 2005 was approximately $10 million. With these assets, Build-Fish-Process was building boats as well as catching and processing 630 tonnes shell weight of scallops, 16 tonnes of rock lobster, 25 tonnes of trevalla, 60 tonnes of ling and seven tonnes of ribaldo. Every one of these catches stands to be impacted by the proposed Commonwealth MPAs, as follows:

Results & Discussion
TAFI Final Report – FRDC 2005/083 126
Species Proportion tonnage affected in which MPA (2005)
Scallops 100 per cent (2007 & 2008) (by proposed Banks Strait MPA)
Southern rock lobster (Tasmania)
<1 per cent (by proposed Tasman Fracture MPA)
Blue-eye trevalla 60 per cent (by proposed Banks Strait MPA)
Ling 15 per cent (by proposed Banks Strait MPA)
Ribaldo 25 per cent (by proposed Banks Strait MPA)
Additional to a payroll that includes 28 full time employees and 30 casual scallop splitters and pays out over $2 million per annum, approximately $1 million is expended on bait, leasing quota units into the business, fuel, fees, food, administration, repairs and maintenance, insurance and so on.
Conclusion
For Build-Fish-Process to have two of its three arms closed by the proposed Commonwealth MPAs would result in 14 full time and 30 casual positions ceasing to exist in Bridport, a holiday town of less than 1400 permanent residents.
“With Bridport being a summer holiday location, it is very hard for the businesses to survive through the winter. With the scallops being a winter fishery, that employs a large number from the local and surrounding communities, it would be a huge loss that would affect all retailers in the area”
Moreover, as many of Bridport’s residents are retirees attracted to the sunny beaches and golf courses, i.e., no longer active as possible employers, employment opportunities in the town are limited. Subtracting over $1.5 million in wages from the Bridport area can only add to the torpor of a town already feeling the effect of a ten year contraction in fishing-related activity. For this ray of hope to be extinguished stands to be difficult enough for Bridport, but for Build-Fish-Process the proposed Commonwealth MPAs threaten to close two of its three arms and leave the other in considerable uncertainty. Having worked with government – including the Commonwealth Department of Environment and Heritage (regarding export exemption), and the Tasmanian Departments of Economic Development (market development) and Primary Industries, Water and Environment (management) - to muster the confidence to invest in the fishery, the proposed MPAs are treacherous disappointments to Build-Fish-Process. The principles of co-operative management, a responsible approach to closures, and sustainable development appear to Build-Fish-Process entirely to have been sacrificed, undoing many years of hard work and achievement.

Results & Discussion
127 TAFI Final Report – FRDC 2005/083
“A paddock fishing method has been adopted for the management of this fishery. This has proved to be a very successful method of management and [the fishery] is regarded by some scientists as one of the best managed scallop fisher[ies] in the world”
“The key to making this type of management plan work is to have as many small areas as possible to fish at separate times. This allows recovery time for previously fished areas. All scallop beds are surveyed prior to allowing fishing, and the scallop size must meet … strict criteria before being opened to fishing”
“In 2003 a large bed of juvenile scallops was located in Banks Strait, historically one of our main scallop grounds. These beds have been kept closed and have been ear-marked for fishing in 2007”
“The Banks Strait marine park totally bans scallop fishing within our traditional grounds. This will not only mean the loss of maybe 50% of our scallop grounds, but will put extra effort back on to the other areas, and will not allow our management plan to work as intended”
The potential cost to Build-Fish-Process runs into the millions (loss of turnover due to there being no scallop fishing in 2007 alone stands to be greater than $2 million), as does the loss in employment and annual expenditure to the Bridport area. This smarts all the harder given that the impact is considered to be entirely unnecessary. From being vertically integrated both up and downstream, Build-Fish-Process stands to be left steaming into an uncertain future with only its devalued vessels.

Results & Discussion
TAFI Final Report – FRDC 2005/083 128
5.4.8 Case Study 8: Dedicated fish freighting operation based in Tasmania: rendered uncompetitive by higher rates due to lower volumes
Affected by the proposed Commonwealth Banks Strait and Tasman Fracture MPAs
Introduction
Compared with companies transporting general cargo, FishFreight Pty Ltd is a small road-carrier. It is competitive because it transports sufficient volume (lineal metres) in combination with being a specialist service, to qualify for a discount freight rate across Bass Strait. (Discount rates are offered to regular customers invoiced over certain amounts per annum.) The specialist service it offers is wharf pick-up of fish to be transported in dedicated refrigerated trailers and trucks to Melbourne and Sydney, as well as to destinations within Tasmania. Should the Commonwealth MPAs be introduced as proposed, the volume of fish transported by FishFreight across Bass Strait stands to be reduced substantially, to well below the level at which its annual payments would qualify it for its present discount freight rate. To protect its already slender margin, FishFreight would be forced to charge more for its service, to the extent that it could not compete in comparison with the already lower charges of the general freight companies. According to FishFreight, the proposed Commonwealth MPAs seriously threaten it with the prospect of closure. Apart from the cost to FishFreight, Tasmania would also lose the service of a specialised transporter of fish to the Australian mainland.
Snapshot of the enterprise
FishFreight operates with assets with a market value of over $2 million, including specialised refrigerated trailers, prime-movers, rigid trucks, bulk bins and fork lifts. It also holds over $250 000 trevalla quota units. In 2005, FishFreight transported some 1600 tonnes shell weight of scallops, 480 tonnes of orange roughy, and 50 tonnes of market fish from Hobart and St Helens in Tasmania to Melbourne and Sydney. FishFreight’s turnover from this activity was approximately $2.2 million. FishFreight’s expenditure per annum in 2005 was approximately $2 million, predominantly on shipping ($1 million), fuel, interest payments on nearly $1 million of debt, on repairs and maintenance, and approximately half on its payroll. FishFreight employs nine people full time and three people part time. Since the announcement of the proposed Commonwealth MPAs, FishFreight has cancelled an order for an additional trailer worth $130 000. Unfortunately, FishFreight had already outlaid $40 000 purchasing the refrigeration unit for the trailer.

Results & Discussion
129 TAFI Final Report – FRDC 2005/083
Impacts of the proposed MPAs
“We’ll probably cease operating. You can’t get any more drastic than that”
FishFreight had anticipated TAC reductions in the Commonwealth fishery, particularly regarding orange roughy, but had not expected the reductions to be so dramatic. What was not anticipated was the possible loss of scallop tonnage in 2007 due to the proposed Commonwealth Banks Strait MPA. Like many other operators in the fishing industry, FishFreight is in abeyance at present:
“Our drivers are asking us what the long-term future is. They’re applying for other jobs. I don’t really blame them. They’ve all got mortgages. But we’ve trained them over three years to cart fish, and we’re trying to talk them into staying while we wait and see the outcome of all this …”
At the very least, FishFreight expects that it will be “definitely downgrading” due to TAC reduction and structural adjustment. This would mean no longer freighting any tonnage to Sydney, which provides FishFreight its healthiest margin. It may be possible for FishFreight to survive the loss of over 20 per cent of its tonnage in the form of orange roughy, but the loss of scallops - three-quarters of its tonnage - risks putting FishFreight out of business altogether.
“And what would our trailers and trucks be worth? They’re built just to carry fish. They’d be the hardest things to sell. We scrub them out after every load – we spend $3000 a year on detergent – but they still smell. You can’t treat us like a normal carrier. We have to charge a round trip price because we don’t get general back freight because of the smell. Nowhere in Sydney or Melbourne will let us wash out. The general carriers don’t like to handle fish unless it’s packaged and doesn’t smell. And they don’t pick up from the wharf”
The smell associated with freighting fresh fish means that FishFreight cannot make up reduced tonnage of fish transported with general freight. And even if FishFreight could find some general freight suitable to be transported with fish, it considers it highly likely that its annual invoices from its Bass Strait carrier will fall well below the amount required to qualify for its present discounted freight rate. Such little room for adjustment in the face of major possible impact could likely result in FishFreight ceasing to operate, at considerable personal cost to the entrepreneur owner-operator who established it.
“We’d have to sell our blue-eye quota to help clear our debt, but what would we get for it? And we’ve got nowhere to move the business to. Our competitors in Eden and Portland and the rest aren’t as affected by MPAs. We came from fishing, but there’ll be nothing there for us to go back to”

Results & Discussion
TAFI Final Report – FRDC 2005/083 130
Conclusion
As for a number of other operators in the fishing industry, FishFreight considers it difficult having quickly to contemplate business decisions in an atmosphere where little is known or decided. Also difficult is having confidence in the process FishFreight finds itself caught in due to the surprise nature of the MPA announcement and the announcement’s seeming ignorance of social impacts or of the sustainable and co-operative management of fisheries such as the Tasmanian scallop fishery. FishFreight considers it galling to be facing the possibility of losing nearly all its business without consultation, consideration or compensation. And Tasmania stands to lose a unique service that turns over approximately $2.2 million per annum and employs 12 people.

Results & Discussion
131 TAFI Final Report – FRDC 2005/083
5.4.9 Case Study 9: Wild fish processing in Tasmania: Undermining of an operation’s core business
Affected by the proposed Commonwealth Banks Strait, Huon, South Tasman Rise, Zeehan and Tasman Fracture MPAs
Introduction
Put simply, approximately 80 per cent of FishTas Pty Ltd’s tonnage into the processing arm of its operation in Tasmania stands to be affected by the proposed Commonwealth MPAs. Nearly 50 per cent of its total tonnage, shell weight scallops, stands to be unavailable in 2007 and 2008 due to the proposed Commonwealth Banks Strait MPA. Over 20 per cent of its tonnage is orange roughy, and a further 7.6 per cent is market fish such as tiger flathead, gummy shark, spotted trevally, blue grenadier and blue-eye trevalla caught in the south-east marine region. Of this market fish, all but shark is caught by FishTas’ own trawler, which it began operating in 2005, predominantly off the east coast of Tasmania. FishTas has supported its processing and fishing operation by purchasing quota units in orange roughy, blue grenadier and redfish. To process its large tonnage of scallops, FishTas took out a three year lease on a second processing facility in a scallop port in 2005. It also invested in a waste management plant to turn 40 tonnes of fish waste per month into fertiliser. In short:
“…we’ve geared up to process scallops, roughy and market fish, and these MPAs leave us quadriplegic on life support. Closing is a very possible scenario.”
Structure of the enterprise
FishTas is principally a processing operation, but in 2005 it added a vessel to its business to guarantee a percentage supply of market fish as well as to improve its margin on its market fish. Fishing vessel: In September 2004, FishTas purchased a 19.4 metre steel trawler worth $800 000. In 2005, this vessel caught in the south-east marine region approximately 75 per cent of the market fish processed by FishTas. (FishTas imported and processed some 200 tonnes of blue-eye trevalla from Western Australia in 2005.) Four people are employed full time on the vessel, and wages alone totalled nearly $250 000 in 2005. Of the main species caught by the vessel in 2005, the following table indicates the affects of the proposed Commonwealth MPAs:
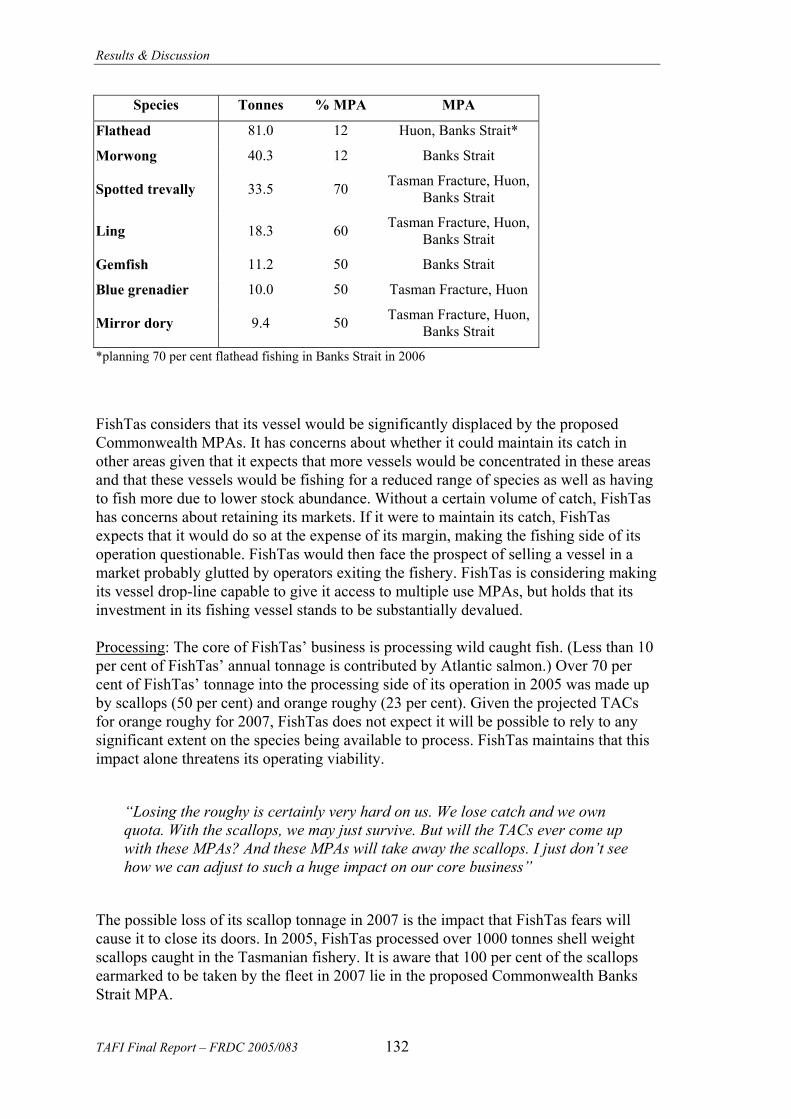
Results & Discussion
TAFI Final Report – FRDC 2005/083 132
Species Tonnes % MPA MPA
Flathead 81.0 12 Huon, Banks Strait*
Morwong 40.3 12 Banks Strait
Spotted trevally 33.5 70 Tasman Fracture, Huon, Banks Strait
Ling 18.3 60 Tasman Fracture, Huon, Banks Strait
Gemfish 11.2 50 Banks Strait
Blue grenadier 10.0 50 Tasman Fracture, Huon
Mirror dory 9.4 50 Tasman Fracture, Huon, Banks Strait
*planning 70 per cent flathead fishing in Banks Strait in 2006
FishTas considers that its vessel would be significantly displaced by the proposed Commonwealth MPAs. It has concerns about whether it could maintain its catch in other areas given that it expects that more vessels would be concentrated in these areas and that these vessels would be fishing for a reduced range of species as well as having to fish more due to lower stock abundance. Without a certain volume of catch, FishTas has concerns about retaining its markets. If it were to maintain its catch, FishTas expects that it would do so at the expense of its margin, making the fishing side of its operation questionable. FishTas would then face the prospect of selling a vessel in a market probably glutted by operators exiting the fishery. FishTas is considering making its vessel drop-line capable to give it access to multiple use MPAs, but holds that its investment in its fishing vessel stands to be substantially devalued. Processing: The core of FishTas’ business is processing wild caught fish. (Less than 10 per cent of FishTas’ annual tonnage is contributed by Atlantic salmon.) Over 70 per cent of FishTas’ tonnage into the processing side of its operation in 2005 was made up by scallops (50 per cent) and orange roughy (23 per cent). Given the projected TACs for orange roughy for 2007, FishTas does not expect it will be possible to rely to any significant extent on the species being available to process. FishTas maintains that this impact alone threatens its operating viability.
“Losing the roughy is certainly very hard on us. We lose catch and we own quota. With the scallops, we may just survive. But will the TACs ever come up with these MPAs? And these MPAs will take away the scallops. I just don’t see how we can adjust to such a huge impact on our core business”
The possible loss of its scallop tonnage in 2007 is the impact that FishTas fears will cause it to close its doors. In 2005, FishTas processed over 1000 tonnes shell weight scallops caught in the Tasmanian fishery. It is aware that 100 per cent of the scallops earmarked to be taken by the fleet in 2007 lie in the proposed Commonwealth Banks Strait MPA.
Results & Discussion
133 TAFI Final Report – FRDC 2005/083
According to FishTas, it loses both in terms of volume and margin. For example, with the development of the French market for scallops in 2005, a margin of over $3.30 was achieved; and the margin on orange roughy achieved in the US market was $1.37 in 2005. These margins compare with an average of less than one dollar for market fish.
“Scallops and roughy are where our margin is. We hardly make anything on market fish”
The processing side of FishTas’ business has a market value of over $1.6 million in land, plant and equipment, and vehicles. FishTas has a full time staff of five people. Wages paid to these employees came to over $300 000 in 2005. In addition, FishTas employs approximately 30 casual workers throughout the year, and approximately 30 splitters from May to December. Wages paid to these employees came to nearly $700 000 in 2005. FishTas planned, prior to the proposed Commonwealth MPA announcement, to continue to develop its export markets in 2006 with new value-added product lines.
Impacts of the proposed Commonwealth MPAs
According to FishTas, the primary impact of the proposed Commonwealth MPAs on its operation is almost comprehensively to undermine its business plan, to the point of possible closure. Its investments in orange roughy, its trawl vessel and in scalloping capacity all appear, in hindsight, to have been misconceived. “Scallops could have been a lifeline, but even that could be gone.” Should the Commonwealth Banks Strait MPA be introduced as proposed, FishTas considers that the Tasmanian scallop fishery would, at the very least return to boom and bust. And without continuity of supply, FishTas holds that splitters and markets would be difficult to hold. FishTas demonstrates frustration at what look like being erroneous signals sent by management of the fisheries concerned, particularly scallops. Its investments in positioning itself were made regarding the best possible information about management available at the time. Tough but responsible decisions that took into consideration both stocks and Industry were expected relating to orange roughy and market fish. It was understood that boats needed to come out of various fisheries and that TACs needed to be adjusted downwards. There was confidence in the Tasmanian scallop fishery as stocks rebuilt, the boom and bust cycle of fishing was overcome and new, more profitable markets were developed. FishTas does not consider that it acted irrationally given signals about these fisheries at the time. The Commonwealth MPAs announcement has turned FishTas’ logic on its head, and FishTas considers that the announcement has come without warning and sits within an environment of considerable uncertainty in terms of the Commonwealth fishery structural adjustment initiative. FishTas is particularly concerned at the short timeframes of the Commonwealth initiatives. Little time is being given to operators to assess where they stand in relation to various initiatives, which lack both detail and final decision, and no transition period is being proposed.
Results & Discussion
TAFI Final Report – FRDC 2005/083 134
Regarding its options, FishTas sees few. Increasing its processing of aquaculture product would be expensive and deliver a low margin in what is already a highly competitive sector. FishTas is not confident that substitute tonnages of fish are available to import, and is also concerned that the resulting market price and quality would not be acceptable to consumers. FishTas therefore has concerns, not just about itself but about where local fishers might sell fish to be processed, and where local consumers might obtain fresh fish.
Conclusion
Like many affected in the Industry at present, FishTas considers itself to be in limbo. FishTas held it impossible to make any plans at present, especially given that the MPAs were proposals only and that important details about the structural adjustment package were not yet finalised. But if various Commonwealth initiatives are introduced as it fears, FishTas will be on the market: “We’d take $4.5 million, but it’s worth twice that to set up.” FishTas was in no doubt that its future was in jeopardy: “I could end up driving a taxi.” Just what the other approximately 65 people employed by FishTas for some period in 2005 might end up doing if the Commonwealth MPAs are introduced as proposed is similarly uncertain.
Results & Discussion
135 TAFI Final Report – FRDC 2005/083
5.4.10 Case Study 10: The Orange Roughy Fishery
Affected by Banks Strait and Offshore Seamounts, Huon, South Tasman Rise, Tasman Fracture MPAs Whether intentionally or otherwise, the proposed MPAs put forward by DEH would close every major current orange roughy fishing ground in Australia: St Helens Hill, St Patrick’s Head, Matsuyker, Pedra Branca, and the Cascade Plateau. This suggests the system of MPAs being proposed for the South East Marine Region is being used as a blunt (and poorly suited) tool for fisheries management, as opposed to the intended concept of MPA’s being developed for biodiversity conservation.
Introduction
Within the Southern and Eastern Scalefish and Shark Fishery (SESSF) orange roughy are taken entirely by the trawl sector. Catches are managed within four zones – Eastern, Southern, Western and the Cascade Plateau. Orange roughy is a long-lived, low productivity species that has winter spawning aggregations that make it highly vulnerable to fishing. Catches on the main commercial grounds are usually very “clean” with extremely low levels of bycatch of other species, as they are often target shots, of very short duration (Knuckey and Liggins (1999). The first substantial commercial catches of orange roughy were taken in the late 1980s, and the species has been one of the most valuable components of the catch taken by the trawl sector since that time. The fishery has reduced significantly since the late 1980s in response to management intervention and close monitoring of TAC levels, with the fleet reduced to a small number of dedicated vessels that concentrate their activities in the deepwater. It is well recognized that the catches taken during the late 1980s and early 1990s were not sustainable in the Eastern, Southern and Western zones. In all cases, there is evidence that stocks fell to below 20% virgin biomass Smith and Wayte (2005). As a consequence, management measures including quota limits and strict compliance have been put into place over the last decade to facilitate the rebuilding of these stocks, and there is mounting evidence that this is occurring. In the Cascade fishery, strict quotas were introduced before overfishing occurred, and preliminary analyses from the latest scientific acoustic surveys suggest a snapshot stock biomass of 33,000 tonnes - which is estimated to be 67% of pre-fishery biomass. Based on these figures, annual catches of 500t are considered to be sustainable in the long term Deepwater Assessment Group advice to SETMAC 91 (2005). Recognising the management failures with orange roughy in the past, AFMA is now implementing a world-leading harvest strategy framework for orange roughy that includes research, monitoring, assessment and strict rules for TAC levels that ensures stocks are rebuilding to, or maintained at, sustainable levels. The Australian orange
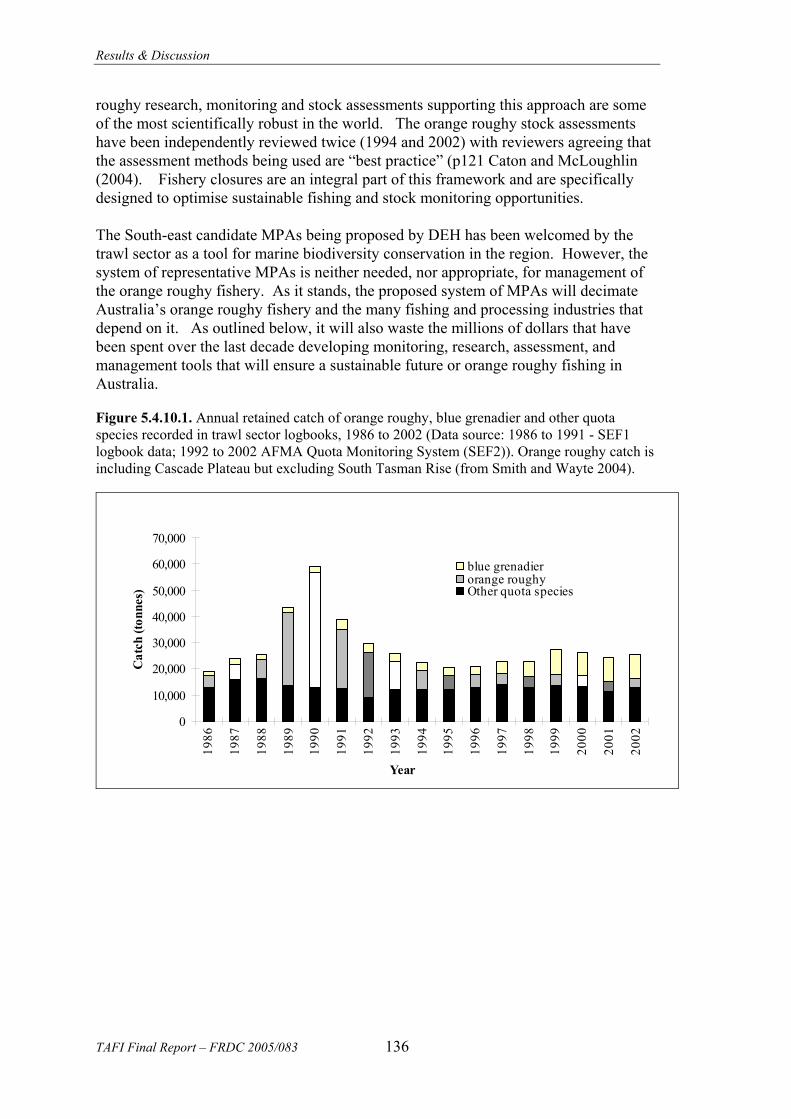
Results & Discussion
TAFI Final Report – FRDC 2005/083 136
roughy research, monitoring and stock assessments supporting this approach are some of the most scientifically robust in the world. The orange roughy stock assessments have been independently reviewed twice (1994 and 2002) with reviewers agreeing that the assessment methods being used are “best practice” (p121 Caton and McLoughlin (2004). Fishery closures are an integral part of this framework and are specifically designed to optimise sustainable fishing and stock monitoring opportunities. The South-east candidate MPAs being proposed by DEH has been welcomed by the trawl sector as a tool for marine biodiversity conservation in the region. However, the system of representative MPAs is neither needed, nor appropriate, for management of the orange roughy fishery. As it stands, the proposed system of MPAs will decimate Australia’s orange roughy fishery and the many fishing and processing industries that depend on it. As outlined below, it will also waste the millions of dollars that have been spent over the last decade developing monitoring, research, assessment, and management tools that will ensure a sustainable future or orange roughy fishing in Australia.
Figure 5.4.10.1. Annual retained catch of orange roughy, blue grenadier and other quota species recorded in trawl sector logbooks, 1986 to 2002 (Data source: 1986 to 1991 - SEF1 logbook data; 1992 to 2002 AFMA Quota Monitoring System (SEF2)). Orange roughy catch is including Cascade Plateau but excluding South Tasman Rise (from Smith and Wayte 2004).
0
10,000
20,000
30,000
40,000
50,000
60,000
70,000
1986
1987
1988
1989
1990
1991
1992
1993
1994
1995
1996
1997
1998
1999
2000
2001
2002
Year
Cat
ch (t
onne
s)
blue grenadierorange roughyOther quota species
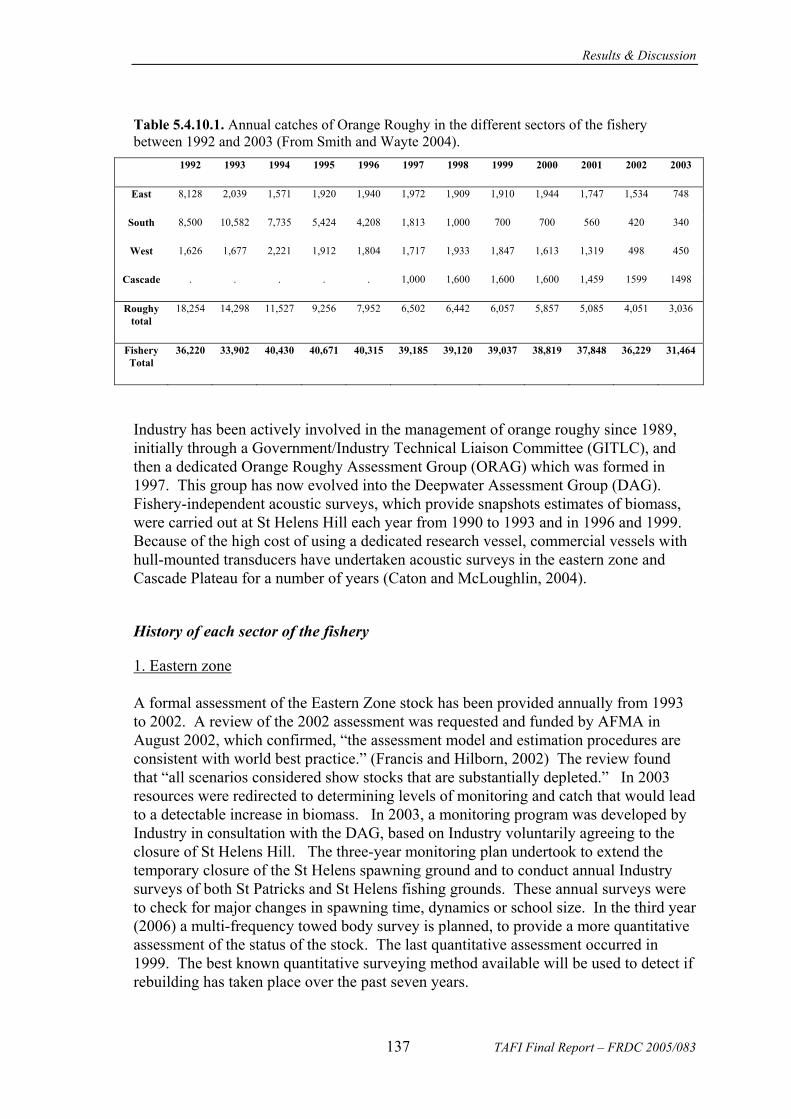
Results & Discussion
137 TAFI Final Report – FRDC 2005/083
Table 5.4.10.1. Annual catches of Orange Roughy in the different sectors of the fishery between 1992 and 2003 (From Smith and Wayte 2004).
1992 1993 1994 1995 1996 1997 1998 1999 2000 2001 2002 2003
East 8,128 2,039 1,571 1,920 1,940 1,972 1,909 1,910 1,944 1,747 1,534 748
South 8,500 10,582 7,735 5,424 4,208 1,813 1,000 700 700 560 420 340
West 1,626 1,677 2,221 1,912 1,804 1,717 1,933 1,847 1,613 1,319 498 450
Cascade . . . . . 1,000 1,600 1,600 1,600 1,459 1599 1498
Roughy total
18,254 14,298 11,527 9,256 7,952 6,502 6,442 6,057 5,857 5,085 4,051 3,036
Fishery Total
36,220 33,902 40,430 40,671 40,315 39,185 39,120 39,037 38,819 37,848 36,229 31,464
Industry has been actively involved in the management of orange roughy since 1989, initially through a Government/Industry Technical Liaison Committee (GITLC), and then a dedicated Orange Roughy Assessment Group (ORAG) which was formed in 1997. This group has now evolved into the Deepwater Assessment Group (DAG). Fishery-independent acoustic surveys, which provide snapshots estimates of biomass, were carried out at St Helens Hill each year from 1990 to 1993 and in 1996 and 1999. Because of the high cost of using a dedicated research vessel, commercial vessels with hull-mounted transducers have undertaken acoustic surveys in the eastern zone and Cascade Plateau for a number of years (Caton and McLoughlin, 2004).
History of each sector of the fishery
1. Eastern zone A formal assessment of the Eastern Zone stock has been provided annually from 1993 to 2002. A review of the 2002 assessment was requested and funded by AFMA in August 2002, which confirmed, “the assessment model and estimation procedures are consistent with world best practice.” (Francis and Hilborn, 2002) The review found that “all scenarios considered show stocks that are substantially depleted.” In 2003 resources were redirected to determining levels of monitoring and catch that would lead to a detectable increase in biomass. In 2003, a monitoring program was developed by Industry in consultation with the DAG, based on Industry voluntarily agreeing to the closure of St Helens Hill. The three-year monitoring plan undertook to extend the temporary closure of the St Helens spawning ground and to conduct annual Industry surveys of both St Patricks and St Helens fishing grounds. These annual surveys were to check for major changes in spawning time, dynamics or school size. In the third year (2006) a multi-frequency towed body survey is planned, to provide a more quantitative assessment of the status of the stock. The last quantitative assessment occurred in 1999. The best known quantitative surveying method available will be used to detect if rebuilding has taken place over the past seven years.

Results & Discussion
TAFI Final Report – FRDC 2005/083 138
The three-year monitoring strategy agreed to was based on a TAC of 720 tonnes plus 100 tonnes research quota for each of the three years (2004, 2005 and 2006). In the Deepwater Assessment Group advice to SETMAC 91 (2005), the qualitative summary of 2005 Industry acoustic survey showed:
− Good fish aggregation ‘marks’ on echosounders again observed at St Patricks Head.
− St Helens catches of roughy were high in several locations on the hill and good marks observed – classification of marks off bottom as being entirely orange roughy regarded as uncertain.
− Plans for 2006 multi-frequency towed body survey are under way and this should help resolve target identification issues.
− If marks (>100 m high) are shown to be entirely orange roughy then significant rebuilding has occurred at St Helens Hill.
Although orange roughy are acknowledged to be very long lived, experience in New Zealand has shown that stocks rebuild when an area is closed for a number of years. In the case of orange roughy, this is probably less attributable to the regeneration of stocks than the re-aggregation of fish that have been dispersed through continual fishing over a number of years at well-known spawning sites. Anecdotal evidence from Industry suggests that fish are more abundant on the flats in the eastern zone than in previous years, suggesting that the stock is indeed rebuilding since the St Helens Hill was closed. Industry is participating in the 2006 survey and has already agreed to accept the result of the survey. That is, if the results are positive, a TAC will be developed based on the appropriate harvest strategy for the stock; if the results are negative, the fishery will be closed for further years, and a bycatch tonnage agreed to, whilst the stock rebuilds. 2. Cascade Plateau The Cascade Plateau has been fished spasmodically for over thirty years. The first known vessels to fish the area are thought to have been Polish and Japanese vessels in the 1970’s. These were followed by Norwegian and Russian factory vessels, which fished under joint venture arrangements. Since 1996, the Cascade Plateau has been a valuable component of SEF landings. Total reported catches to the end of 2004 are 15,367 tonnes. A proposal from the Orange Roughy Assessment Group in 2004 was accepted by SETMAC – this was based on a competitive TAC of 1,600 tonnes built around a strategic fishing and research program. ITQs replaced the competitive TAC from 1 April 2001. The first formal quantitative assessment of the Cascade Plateau population was undertaken in 2004 (Wayte 2004a). Estimates available in 2005 indicated that a sustainable long-term annual catch level for the Cascade Plateau could be between 200 and 400 tonnes. However, an analysis of data collected in 2005 indicates that an overall biomass of ~37,000 tonnes of fish was present over the 2005 spawning period, and on these figures a sustainable catch of ~790 tones may be possible.

Results & Discussion
139 TAFI Final Report – FRDC 2005/083
An acoustic survey will again be undertaken in winter 2006, during which it is hoped to clarify the factors contributing to the snapshot biomass estimates, such as acoustic target strength, species composition, proportion spawning and turnover. The TAC for 2006 for the Cascade Plateau is 700 tonnes plus 100 tonnes research quota. 3. Southern zone The Southern Zone assessment is limited to fish caught at Maatsuyker. Pedra Branca fish are considered to form a common stock with the Eastern Zone fish spawning at St Helens. The assessment for the Southern Zone has not been updated since 2000. Analysis of historical catch and effort data showed that catch rates in 2001 were (marginally) higher than at any time since 1996. However, they still represented only 7% of peak catch rates in 1989. In 2005, based on fishing catches, CPUE, and acoustic marks observed on the grounds, the fishery appears to be rebuilding. Using research quota, Industry collected otoliths from Maatsuyker orange roughy in early 2005. These are currently being aged by the CAF and an update of the stock assessment for this fishery is planned for 2006. To facilitate rebuilding of stocks, in 2006 the TAC for the Southern Zone has been set at zero, with 10 tonnes available to cover bycatch.
Impacts of the MPAs proposed by DEH:
Although the current research indicates that stocks of orange roughy are healthy on the Cascade Plateau, and may be rebuilding in the East and South, the candidate South-east MPAs as proposed by DEH would result in permanent closure of all major orange roughy fishing grounds. Orange roughy are caught when they aggregate during spawning time, and as such cannot be taken viably during the remainder of the year in other areas. The vessels that operate in the orange roughy fishery are generally dedicated deepwater vessels, and do not operate to any great extent in the market fish area of the fishery. The explicit impacts of the proposed MPA closures would fall most heavily upon catchers of orange roughy, the businesses that both market fresh orange roughy and those that process and freeze the fish for export markets, as well as the holders of orange roughy statutory fishing rights (SFRs). If the orange roughy operators continue to fish in the SESSF, the resulting shift in effort of the deepwater fleet onto market fishing grounds would adversely impact on all scalefish operators in the SESSF. It is recognised that there is opposition in some quarters to the fishing of long-lived species such as orange roughy and of trawling on seamounts per se because of the fragility and high levels of endemism of the benthos on seamounts. Clearly, if fishing was unsustainable, Industry would share this concern. However, these concerns need to be considered in the following context:

Results & Discussion
TAFI Final Report – FRDC 2005/083 140
− In Australia, it is considered that the stocks are now effectively managed to the extent that rebuilding is occurring, and that sustainable levels of fishing will continue to be available to operators, particularly in the Eastern Zone and the Cascade Plateau – under agreed formal harvest strategies.
− Greater than 60% of the seamounts in the SE have been claimed in the candidate MPAs, far more than the notional 20% that is considered representative for any MPA system.
− Some of the seamounts enclosed in the candidate system of MPAs (eg Cascades) have had a very long trawling history and are not considered pristine from a biodiversity perspective. There are numerous others in Australian jurisdiction (including the proposed MPA area) on which trawling is currently disallowed, and which do not have a catch history. These would make better candidates for biodiversity protection within MPAs (eg Taupo).
Conclusions
− Loss of grounds and all existing orange roughy fishing businesses –equates to approximately 1500 tonnes on 2006 TACs at an average price of $4. 50 (based on an annual price for landed product), which has an annual value of $6.75m in lost catch alone.
− Flow on effects would need to be assessed on a case-by-case basis, noting that the closure of the orange roughy fishery would have significant impacts on the existing infrastructure, particularly in Tasmania.
− Marketers and processors will suffer significantly with the loss of orange roughy, export markets will be lost as will the ability to generate a surplus through land-based processing of whole, fresh orange roughy into skinless fillets for the US market, and associated export synergies.
− Jobs will be lost onshore as well as on deepwater vessels:
e. There are specific businesses based in Hobart, which would become uneconomic without the activity of the orange roughy fleet out of Hobart. These include electronics, chandlery and gear businesses;
f. Transporters would be severely impacted, as orange roughy requires substantial transport services from Tasmania to the mainland.
− Importantly, the value and security of statutory fishing rights will be severely undermined if sustainable fisheries are closed by external initiatives without fair and reasonable recompense, which will have far-reaching impacts on all SFR holders.
− The Australian Government has been moving all Commonwealth managed fisheries to formal management plans where SFRs are intended to provide more secure rights (and therefore more attractive to financial institutions). Unless there is adequate recompense for removal of those rights for reasons other than non-sustainability of a resource, this significantly undermines the security of SFRs.

Results & Discussion
141 TAFI Final Report – FRDC 2005/083
− The closure of the orange roughy fishery will impact on the market fishery sector of the south east trawl fishery, as the deepwater vessels will turn their focus to those grounds. This would impact across the fishery with an increase in the demand for quota and increased competition on the fishing grounds.
− The deepwater fleet is generally of a greater capacity than the average market fishing vessel and have higher running costs. This will increase their need to catch a higher volume of fish in a shorter period of time than the current market vessels, leading to higher volumes of fish on the wholesale markets which are already very sensitive to volumes of produced. It is also likely to lead to regional depletion in areas currently supporting the market fleet.

Results & Discussion
TAFI Final Report – FRDC 2005/083 142
5.4.11 Case Study 11: Commonwealth Market Trawl Fishery: Dislocation of an enterprise’s fishing grounds from its processing facility
Particularly affected by the proposed Commonwealth Banks Strait MPA
Introduction
Fishing grounds in the proposed Commonwealth Banks Strait MPA contribute the bulk of the catch taken by MarketTrawl Pty Ltd’s two fishing vessels in what MarketTrawl terms its vessels’ “summer fishery”, from January to April. In total, in 2005, approximately 25 per cent of these vessels’ catch was in the Banks Strait MPA. If this MPA is introduced as proposed, MarketTrawl’s vessels stand to be displaced to summer fishing grounds south of Banks Strait. This displacement would leave them a significant distance from their home port of Eden, NSW. At present, MarketTrawl unloads its vessels to its purpose-built processing facility in Eden. This facility was completed in December 2005 at a cost of $1.3 million. If its vessels are forced to operate in waters off south-east Tasmania, MarketTrawl will either incur the costs associated with further steaming and reduced product quality or unload in Hobart. Unloading in Hobart would largely render its processing facility in Eden redundant.
“The choice will be either to cripple the boats or cripple the factory. Either way, we’re probably out of business”
Snapshot of the operation
MarketTrawl operates two vessels in the southern and eastern scalefish and shark fishery (SESSF). It manages a third vessel in this fishery, which does not fish heavily in areas covered by proposed Commonwealth MPAs. This third vessel fishes predominantly off the middle of Tasmania’s east coast and consequently unloads in Hobart. MarketTrawl also operates a fish processing facility in Eden, at which 10 boats in total unload, several operating in fisheries other than the SESSF. The majority of fish processed, however, is market fish landed by MarketTrawl’s two vessels, which each work close to 300 days a year in the SESSF. MarketTrawl estimates the market value of its two vessels, gear, fishing licences and quota units, vehicles, and plant and equipment associated with both the fishing and processing sides of its operation to be approximately $6 million. Between them, both of MarketTrawl’s boats caught more than 800 tonnes of market fish in 2005, predominantly tiger flathead, silver warehou, ling and arrow squid, with a landed value of greater than $2.5 million. Nine people are employed full time on the boats, with a payroll of over $600 000. A further four people are employed full time on

Results & Discussion
143 TAFI Final Report – FRDC 2005/083
the management, administration and maintenance sides of the operation. The processing facility has 19 permanent part time employees.
Impacts of the proposed MPAs
MarketTrawl emphasised the uncertainty caused by the proposed Commonwealth MPAs, particularly due to its interference with the fishery structural adjustment process. This uncertainty made it difficult for MarketTrawl to ascertain the full nature of possible impacts, let alone to formulate its likely response.
“[MPAs] should wait until we know the fleet size. The MPA process began three years ago, with two [MPAs] negotiated with full consultation. The system broke down and stalled for 15 months, and now we get three months to finalise 12 MPAs. Why are they doing this in three months, after three years of mucking around!!”
In short, without knowing the structure of the Commonwealth trawl fleet, which was dependent on the operation of the structural adjustment process, MarketTrawl considered it hard to forecast how it might position itself. And MarketTrawl held there to be a risk that with the structural adjustment and MPAs processes being run together, neither would be fully and effectively implemented.
“We could end up with the worst of both worlds: only half a buy out and MPAs concentrating us into fishing down what’s left of our grounds”
In summary, MarketTrawl considered there to be a “bombardment” of Commonwealth initiatives at present, all with unrealistically short timeframes and all of which ignored existing Australian Fisheries Management Authority (AFMA) management processes. Albeit in the midst of uncertainty, MarketTrawl was contemplating ceasing operating if the Commonwealth Banks Strait MPA was introduced as proposed, due to MarketTrawl’s seasonal fishing pattern being profoundly affected. In 2005, MarketTrawl’s vessels moved with the fish following water currents between Banks Strait in summer and areas further north such as the Horseshoe and off Eden as far as Ulladulla in winter. Without fishing grounds in the Banks Strait MPA, MarketTrawl would be effectively without its summer fishery, which was where its two vessels did all their fishing from January to April in 2005. And displacement further south, with its attendant uncertainty regarding competition from other boats, catch rates and so on, would probably mean unloading in Hobart, thus cutting out the bulk of MarketTrawl’s processing facility’s throughput in Eden. MarketTrawl was clear that it could not operate its processing facility on less than half its present tonnage as crucial market and employee continuities would be broken. The question that then arose for MarketTrawl was where would it process its winter fish caught off the Victorian and NSW coasts? With depressed prospects for the fishing Industry in these States, MarketTrawl could simply not see a niche for a full time wild fish processing facility.

Results & Discussion
TAFI Final Report – FRDC 2005/083 144
Conclusion
Fish are not a ubiquitous resource. Operations tend to base themselves close to where they fish for reason of economic efficiency. Margins can then accommodate around this efficiency and assume its existence as other factors such as fuel price or the price to lease in a kilogram of quota ratchet higher. Then to have an existing optimum location threatened can seriously undermine the operating viability of an enterprise. Such is the case for MarketTrawl. The proposed Commonwealth Banks Strait MPA threatens to displace particularly its summer market trawl fishing from north-east to south-east Tasmania, closer to Hobart than to its present home port of Eden. Like the vessel it currently manages, the two boats it owns would then most likely unload in Hobart in summer rather than make the longer and more costly steam to Eden. The location of its new processing facility would then be compromised, thus facing MarketTrawl with the equally invidious decision of running either its vessels at a loss or its processing facility under capacity. Apart from putting off one deckhand on each of its two vessels, MarketTrawl sees little scope for cost reduction. Moreover, MarketTrawl is conscious that having to shift its fishing south is a risky displacement:
“We do not know how many vessels will take the structural adjustment so we can not predict how much effort will go into these hugely reduced fishing grounds”
With unknown piling upon unknown, MarketTrawl considered it most likely that it would cease operating both its processing facility in Eden and its two trawlers valued at approximately $6 million, at a direct cost to the community of 16 full time and 19 permanent part time positions.

Results & Discussion
145 TAFI Final Report – FRDC 2005/083
5.5 Economic analysis of the impact of the proposed MPAs in the South-east Region
As identified in the case studies, the proposed MPAs would create substantial pressures for operational adjustments in the businesses investigated. Such adjustments are costly and may result in the business becoming unviable and ceasing to operate. The purpose of the economic analysis was to use economic survey data, combined with state and Commonwealth logbook data, to indicate the likely magnitude of the economic impacts on the Industry and to identify which sectors would bear the brunt of the costs. The economic indicators used were:
− the gross value of the displaced catch from the proposed MPAs by gear type;
− additional costs of fishing resulting from operational adjustments to the proposed MPAs; and
− the number of jobs lost as a result of operational adjustments by fishers and processors.
These economic indicators can also be used as a benchmark against which alternative MPA proposals can be measured with regard to their likely impact on industry.
5.5.1 Gross value of displaced catches by Commonwealth licensed operators
The catch data in Tables 5.2.2a&b pertain to Commonwealth licensed operators and are sourced from the AFMA logbook database. Gross value data are based on these catches combined with average fish prices provided mainly by ABARE. Four sets of tables were used. These represent:
− Average actual catches (see Table 5.2.2a) and GVP (Table 5.5.1a) for the five year period 2000-05;
− Average actual catches (see Table 5.2.2b) and GVP (Table 5.5.1b) for the five year period 2000-05, adjusted for proposed 2007 TACs;
− Catch (see Table 5.2.4a) and GVP (Table 5.5.1c) for 2004-05;
− Catch (see Table 5.2.4b) and GVP (Table 5.5.1d) for 2004-05 adjusted for 2007 TACs.
The catch data have been adjusted for proposed 2007 TACs to enable the effects of TAC changes to be separated from the effects of MPA catch displacement. These proposed 2007 TAC reductions are highly significant for orange roughy, dories, blue-eye trevalla, blue grenadier, ling and flathead. The five year time period, 2000-2005, is used to attempt to reflect the dynamic and possibly cyclic nature of catches in the MPAs, as well to indicate which sectors are developing or declining for other reasons.
Results & Discussion
TAFI Final Report – FRDC 2005/083 146
The 2004-05 catch and GVP data is separate to provide the most up to date expression of the displaced catch and its value.
From an economic perspective, the main results from these tables are as follows: The gross value of catches (Table 5.5.1c) taken within the areas of the proposed MPAs, based on 2004-05 data, is estimated at $15.9 million, with the major components being $11.6 million for the trawl Industry, mostly orange roughy from the Cascade Plateau and Banks Strait, $2.6 million for the Small Pelagic Fishery, and $0.9 million for the auto-longline sector. This is equivalent to almost 22% of the total value of catches in the South East region. However, it is necessary to take into account the proposed reductions by AFMA in 2007 TACs of a number of species (reductions that are fishery management actions taken independently of the MPA process), to gauge the likely catch displacement impact of the MPAs alone. In Tables 5.2.4b and 5.5.1d, the proposed TAC reductions are applied to 2004-05 catch and GVP data to isolate the impacts of the MPAs. These tables illustrate that the TAC reductions alone act to reduce the GVP of catches within proposed MPAs by over $10 million, or 64% compared to the unadjusted 2004-05 data. The estimated impacts of the TAC reductions on GVP by sector in the areas of the proposed MPAs are: auto-longline 16%; dropline 9%; gillnet 2%; and bottom trawl 85%. When these TAC induced effects are accounted for, the estimated GVP of displaced catches from proposed MPAs is $5.8 million for Commonwealth operators, based on 2004-05 data (Table 5.5.1d). If catch data averaged over a longer time period from 2000 to 2005 is considered the impact of the proposed MPAs is somewhat less at $3.7 million. That is, catches and catch value in the proposed MPAs have grown over the period so that the latest data reflect the greatest impact. The large majority, 77%, of the difference between the 2000-05 and 2004-05 data is accounted for by the recent development of the Small Pelagic Fishery. The remaining 23% increase in 2004-05 compared to the average of 2000-05 is largely attributable to a growth in catches by auto-longline, gillnet and market trawl sectors.

Results & Discussion
147 TAFI Final Report – FRDC 2005/083
Table 5.5.1a. Mean annual GVP ($) for Commonwealth managed species taken within candidate MPA (* denotes data confidential, fewer than 5 boats), Commonwealth catch data (2000-05) is from operation position and (in the case of some shark) from gridded data. Offshore Seamounts (North) is omitted as only confidential records were present.
Fishing Method Candidate MPA Zones
Mur
ray
- Ia
Mur
ray
- VI (
no c
omm
erci
al
fishi
ng)
Nel
son
- VI (
no c
omm
erci
al
fishi
ng)
Apo
llo -
VI
Zee
han
- VI (
no c
omm
erci
al
fishi
ng)
Zee
han
(mid
) - V
I
Zee
han
(Nor
th-e
ast)
- V
I
Tas
man
Fra
ctur
e - I
a
Tas
man
Fra
ctur
e - V
I
Tas
man
Fra
ctur
e - V
I (no
co
mm
erci
al fi
shin
g)
Huo
n - I
a
Huo
n - V
I
Sout
h T
asm
an R
ise
- VI (
no
com
mer
cial
fish
ing)
B
anks
Str
ait -
VI
Ban
ks S
trai
t - V
I (no
co
mm
erci
al fi
shin
g)
Ban
ks S
trai
t and
Off
shor
e Se
amou
nts -
Ia
Off
shor
e Se
amou
nts (
Sout
h) -
zoni
ng y
et to
be
dete
rmin
ed
Bas
s Bas
in -
VI (
no
com
mer
cial
fish
ing)
Eas
t Gip
psla
nd -
VI (
no
com
mer
cial
fish
ing)
TO
TA
L o
f Dis
plac
ed G
VP
(bol
d ite
ms)
RE
GIO
NA
L to
tal G
VP
for
sect
or
% R
egio
nal o
r St
ate
GV
P D
ispl
aced
bottom longline * 26,918 * * 10,488 949 2,452 52,331 46,175 * 88,149 152,314 95,070 60,614 * 5,640 616,554 2,995,047 20.59%
danish seine * * * * * * * 338 4,465,336 0.01%
dropline 5,987 * 26,800 * * 129,648 66,548 230,799 1,114,094 20.72%
gillnet 401 55,634 1,497 1,671 7,460 * 42,552 16,577 264,533 390,330 10,018,647 3.90%
handline * 5,796 *
otter trawl 1,481 24,599 955 2,754 50,109 2,571 * 216,222 89,817 3,107 * 423,824 691 171,688 4,505,694 146,689 5,793,902 7,491 11,245 11,452,975 56,112,163 20.41%
pelagic longline 9,737 2,934 * 606 * * 60,898 * 4,705,918 *
purse seine * * * 3,068,980 *
squid jig * * * 1,933,229 *
trolling * * 17,473 *
trotline * * 14,940 *
unknown * * 191,439 * midwater trawl/SPF 126 29,502 891,832 7,136 15 928,610 ** *
Total Displaced Catch
2,468 123,000 2,505 4,174 62,268 3,520 2,500 335,249 135,992 4,267 2,499 511,977 699 324,023 5,668,433 297,575 5,867,312 277,684 104,684 13,730,978 84,643,062 16.22%

Results & Discussion
TAFI Final Report – FRDC 2005/083 148
Table 5.5.1b. Mean annual GVP ($) for Commonwealth managed species taken within candidate MPA (* denotes data confidential, fewer than 5 boats), Commonwealth catch data (2000-05) is from operation position and (in the case of some shark) from gridded data and are adjusted for projected 2007 TAC changes. Offshore Seamounts (North) is omitted as only confidential records were present. Fishing Method Candidate MPA Zones
Mur
ray
- Ia
Mur
ray
- VI (
no
com
mer
cial
fish
ing)
Nel
son
- VI (
no
com
mer
cial
fish
ing)
Apo
llo -
VI
Zee
han
- VI (
no
com
mer
cial
fish
ing)
Zee
han
(mid
) - V
I
Zee
han
(Nor
th-e
ast)
- V
I
Tas
man
Fra
ctur
e - I
a
Tas
man
Fra
ctur
e - V
I
Tas
man
Fra
ctur
e - V
I (n
o co
mm
erci
al fi
shin
g)
Huo
n - I
a
Huo
n - V
I
Sout
h T
asm
an R
ise
- VI
(no
com
mer
cial
fish
ing)
Ban
ks S
trai
t - V
I
Ban
ks S
trai
t - V
I (no
co
mm
erci
al fi
shin
g)
Ban
ks S
trai
t and
O
ffsh
ore
Seam
ount
s - Ia
Off
shor
e Se
amou
nts
(Sou
th) -
zon
ing
yet t
o be
de
term
ined
B
ass B
asin
- V
I (no
co
mm
erci
al fi
shin
g)
Eas
t Gip
psla
nd -
VI (
no
com
mer
cial
fish
ing)
TO
TA
L o
f Dis
plac
ed
GV
P (b
old
item
s)
bottom longline * 26,918 * * 9,099 691 2,431 44,169 38,002 * 73,327 131,444 77,929 48,930 * 5,579 521,505
danish seine * * * * * * 333
dropline 5,916 * 22,311 * * 111,054 56,137 196,929
gillnet 400 55,363 1,483 1,665 7,310 * 41,847 15,901 262,555 386,528
handline *
otter trawl 1,481 24,114 752 2,372 28,630 2,073 * 26,060 52,234 2,726 * 64,160 691 132,371 216,060 10,149 858,912 7,293 9,282 1,439,410
pelagic longline 9,737 2,934 * 606 * * 60,898 *
purse seine * * *
squid jig * * *
trolling * *
trotline * *
unknown * *
midwater trawl/SPF 153 49,365 136 1,024,391 7,136 * 1,081,180
Total Displaced Catch 2,467 122,200 2,282 3,777 39,395 2,764 2,451 152,149 90,237 3,800 2,139 137,626 699 263,834 1,474,916 138,262 919,956 275,458 102,706 3,737,256

Results & Discussion
149 TAFI Final Report – FRDC 2005/083
Table 5.5.1c. Financial Year 2004/05 GVP ($) for Commonwealth managed species taken within candidate MPA (* denotes data confidential, fewer than 5 boats), Commonwealth catch data (2000-05) is from operation position and (in the case of some shark) from gridded data. Offshore Seamounts (North) is omitted as only confidential records were present.
Fishing Method Candidate MPA Zones
Mur
ray
- Ia
Mur
ray
- VI (
no c
omm
erci
al fi
shin
g)
Nel
son
- VI (
no c
omm
erci
al fi
shin
g)
Apo
llo -
VI
Zee
han
- VI (
no c
omm
erci
al fi
shin
g)
Zee
han
(mid
) - V
I
Zee
han
(Nor
th-e
ast)
- V
I
Tas
man
Fra
ctur
e - I
a
Tas
man
Fra
ctur
e - V
I
Tas
man
Fra
ctur
e - V
I (no
com
mer
cial
fis
hing
)
Huo
n - I
a
Huo
n - V
I
Sout
h T
asm
an R
ise
- VI (
no
com
mer
cial
fish
ing)
B
anks
Str
ait -
VI
Ban
ks S
trai
t - V
I (no
com
mer
cial
fis
hing
)
Ban
ks S
trai
t and
Off
shor
e Se
amou
nts
- Ia
Off
shor
e Se
amou
nts (
Sout
h) -
zoni
ng
yet t
o be
det
erm
ined
Bas
s Bas
in -
VI (
no c
omm
erci
al
fishi
ng)
Eas
t Gip
psla
nd -
VI (
no c
omm
erci
al
fishi
ng)
TO
TA
L o
f Dis
plac
ed G
VP
(bol
d ite
ms)
RE
GIO
NA
L to
tal G
VP
for
sect
or
% R
egio
nal G
VP
Dis
plac
ed
bottom longline * * * * * 144,376 * * 197,139 140,210 126,045 * 861,682 5,019,101 17.17%
dropline * * * 77,779 546,250 14.24%
gillnet 116,671 2,024 1,895 56,638 405,791 583,019 9,042,218 6.45%
otter trawl 5,117 84,357 1,517 2,065 49,953 289 * 281,209 21,599 * 195,379 * 144,969 3,032,723 78,341 7,714,711 * 12,698 11,636,624 52,348,961 22.23%
pelagic longline * 62,031 3,445,454 *
squid jig * * 1,955,390 * midwater trawl/SPF 298 1 252,271 2,393,342 2,645,911 0 *
Total Displaced 5,117 232,642 3,542 4,121 86,761 4,770 3,104 679,743 82,675 * * 324,664 * 342,108 5,629,723 261,024 7,714,711 413,512 74,012 15,867,080 72,357,373 21.93%

Results & Discussion
TAFI Final Report – FRDC 2005/083 150
Table 5.5.1d. Financial Year 2004/05 GVP ($) for Commonwealth managed species taken within candidate MPA (* denotes data confidential, fewer than 5 boats), Commonwealth catch data (2000-05) is from operation position and (in the case of some shark) from gridded data and are adjusted for projected 2007 TAC changes. Offshore Seamounts (North) is omitted as only confidential records were present.
Fishing Method Candidate MPA Zones
Mur
ray
- Ia
Mur
ray
- VI (
no
com
mer
cial
fish
ing)
Nel
son
- VI (
no c
omm
erci
al
fishi
ng)
Apo
llo -
VI
Zee
han
- VI (
no
com
mer
cial
fish
ing)
Zee
han
(mid
) - V
I
Zee
han
(Nor
th-e
ast)
- V
I
Tas
man
Fra
ctur
e - I
a
Tas
man
Fra
ctur
e - V
I
Tas
man
Fra
ctur
e - V
I (no
co
mm
erci
al fi
shin
g)
Huo
n - I
a
Huo
n - V
I
Sout
h T
asm
an R
ise
- VI
(no
com
mer
cial
fish
ing)
Ban
ks S
trai
t - V
I
Ban
ks S
trai
t - V
I (no
co
mm
erci
al fi
shin
g)
Ban
ks S
trai
t and
Off
shor
e Se
amou
nts -
Ia
Off
shor
e Se
amou
nts
(Sou
th) -
zon
ing
yet t
o be
de
term
ined
Bas
s Bas
in -
VI (
no
com
mer
cial
fish
ing)
Eas
t Gip
psla
nd -
VI (
no
com
mer
cial
fish
ing)
TO
TA
L o
f Dis
plac
ed G
VP
(bol
d ite
ms)
bottom longline * * * * * 121,580 * * 164,883 117,176 102,278 * 718,818
dropline * * * 71,206
gillnet 116,010 2,016 1,890 51,145 402,631 573,692
otter trawl 5,117 84,354 1,404 1,639 25,652 139 * 16,669 13,964 * 39,130 * 111,954 184,029 10,933 1,174,968 * 10,962 1,692,108
pelagic longline * 62,031
squid jig * *
midwater trawl/SPF 298 1 252,271 2,393,342 2,645,911
Total Displaced 5,117 231,979 3,421 3,633 57,061 3,368 3,078 392,086 63,275 * * 145,934 * 276,837 2,751,743 164,356 1,174,968 410,185 72,276 5,763,799

Results & Discussion
151 TAFI Final Report – FRDC 2005/083
5.5.2 Gross value of displaced catches by both State and Commonwealth operators
GVP values for significant State catches (see Table 5.2.1) are summarized in Table 5.5.2a. Combining these with the adjusted Commonwealth GVP data in Table 5.5.1d gives a total value of catch displacement by proposed MPAs of $11.65 million, with Commonwealth and State fisheries adding almost equally to the total (Table 5.5.2b).
Table 5.5.2a. Gross value ($) of displaced catches from State managed fisheries in 2004/05. Those candidate MPAs not shown were not deemed to have significant State based catches.
Common name Murray Zeehan Tasman Fracture
Banks Strait
Totals
Rock lobster 271,730 15,370 44,080 73,370 404,550Giant crab 81,200 160,300 241,500Commercial scallop 5,200,000 5,200,000Striped trumpeter 7,500 56,200 63,700Bastard trumpeter 3375 25,290 28,665Jackass morwong 2,550 2,550Ocean perch 840 840Flathead 2160 2160Wrasse 950 950Total 271,870 96,570 54,955 5,521,660 5,944,915
5.5.3 Additional costs of fishing elsewhere
There is an argument that a proportion of the displaced catches could be taken in other parts of the fishery with the result that the overall catch reducing impacts of the MPAs may be significantly less than estimated above. This is likely to be correct for a number of species, but is not the case for scallops in Banks Strait where the main scallop bed is contained within the MPA, or for rock lobster in Murray where the reduction in available habitat would result in the Northern Zone rock lobster TAC being reduced by approximately 9 – 16 tonnes. For other species and gear types, some replacement of catch could be expected. Questions were asked of fishers in the economic survey regarding their likely operational responses to the introduction of MPAs in an attempt to address this issue and to provide some perspective on likely behavioural responses as well as indicative estimates of the additional costs of alternative fishing strategies. Table 5.5.3 identifies

Results & Discussion
TAFI Final Report – FRDC 2005/083 152
the likely operational responses of a sample of fishers to the introduction of the proposed MPAs. Of the 29 fishers that responded clearly to these questions, 19 indicated that they would either attempt to take their quota from other areas of the fishery or switch to alternative fisheries. Many of these respondents suggested that these strategies would be both costly and unlikely to succeed in terms of making up the displaced catch or catch value from the MPAs. Several operators indicated that the likely outcome following an attempt to increase catches elsewhere would be to cease to operate. A number of operators provided quantitative estimates of the likely extent of cost increases in response to their proposed changes in operation. These increases ranged from 10% to 25% of total costs. Nearly $0.75 million of additional costs were identified in the detailed responses of just two operators to changes in their fishing strategies resulting from the proposed MPAs. One of these operators estimated that only around 60% of its displaced catch could be replaced because of practical considerations relating to the extra distance to alternative grounds and because of fewer opportunities to fish in these more exposed areas. Data limitations and privacy considerations prevent further analysis of this issue.

Results & Discussion
153 TAFI Final Report – FRDC 2005/083
Table 5.5.2b: Financial Year 2004/05. Commonwealth and State GVP ($) displacement from candidate MPAs in the South-east (*= Confidential Less than 5 boats). Adjusted for 2007 TACs.
Jurisdiction Candidate MPA Zones
Mur
ray
- Ia
Mur
ray
- VI (
no
com
mer
cial
fish
ing)
Nel
son
- VI (
no
com
mer
cial
fish
ing)
Apo
llo -
VI
Zee
han
- VI (
no
com
mer
cial
fish
ing)
Zee
han
(mid
) - V
I
Zee
han
(Nor
th-e
ast)
- V
I
Tas
man
Fra
ctur
e - I
a
Tas
man
Fra
ctur
e - V
I
Tas
man
Fra
ctur
e - V
I (n
o co
mm
erci
al fi
shin
g)
Huo
n - I
a
Huo
n - V
I
Sout
h T
asm
an R
ise
- V
I (no
com
mer
cial
fi
hi)
Ban
ks S
trai
t - V
I
Ban
ks S
trai
t - V
I (no
co
mm
erci
al fi
shin
g)
Ban
ks S
trai
t and
O
ffsh
ore
Seam
ount
s -
Ia
Off
shor
e Se
amou
nts
(Sou
th) -
zon
ing
yet t
o be
det
erm
ined
Bas
s Bas
in -
VI (
no
com
mer
cial
fish
ing)
Eas
t Gip
psla
nd -
VI
(no
com
mer
cial
fish
ing)
TO
TA
L o
f Dis
plac
ed
GV
P (b
old
item
s)
Commonwealth 5,117 231,979 3,421 3,633 57,061 3,368 3,078 392,086 63,275 * * 145,934 * 276,837 2,751,743 164,356 1,174,968 410,185 72,276 5,759,317
State 271,730 96,570 54,955 5,521,660 5,944,915
MPA Zone Total 276,847 231,979 3,421 3,633 153,631 3,368 3,078 447,041 63,275 0 0 145,934 0 276,837 8,273,403 164,356 1,174,968 410,185 72,276 11,704,232
Candidate MPA Total 508,826 3,421 3,633 160,077 510,316 145,934 0 8,714,596 1,174,968 410,185 72,276 11,704,232
Table 5.5.3: Indicative operational responses by a sample of fishers to the introduction of MPAs.
Operational strategy Scallop Drop-line
Rock lobster
Market trawl
Mid-water
Auto-L’line
Gillnet TOTAL
Response 1: Offsetting cost reductions 1 2 1 4
Response 2: Take Quota from other areas 2 7 1 1 1 1 13
Response 3: Attempt to increase catch of other species 4 1 1 6
Response 4: Downsize operation 1 1 2
Response 5: Cease operating 1 1 1 1 4
TOTAL 8 1 11 4 1 2 2 29

Results & Discussion
TAFI Final Report – FRDC 2005/083 154
5.5.4 Implications of MPAs for employment
Many survey respondents indicated that they would seek to reduce labour costs as part of their operational strategy to cope with the introduction of the proposed MPAs. For fishers, this usually involved shedding part time or casual crewmembers or in cases where a vessel would cease to operate, a full crew. In the secondary sector, scallop processors, haulage contractors and boat builders indicated that they would be shedding jobs to reduce their payroll. The majority of casual jobs would be lost from the scallop processing sector while full time jobs were lost from the processing, haulage and boat building sectors.
Table 5.5.4. Estimated job losses from a sample of operators as a result of MPAs
Sector Jobs lost
Full time Casual
Fishing 29 35
Secondary 23 117
Total 52 152
The large majority of these job losses would be in Tasmania, reflecting both the composition of the survey sample and the preponderance of MPAs around Tasmania.
5.5.5 Estimated value of displaced catches by Tasmanian based operators
Based on both the aggregated logbook data for Commonwealth operators and the economic survey data, it appears that Tasmanian based vessels would contribute around $4.8 million of the total $5.8 million of estimated displaced catch by Commonwealth licensed vessels. This estimate is adjusted for 2007 TAC reductions. A further $5.6 million of displaced catches is attributable to Tasmanian vessels in state managed fisheries, the large majority of which are in the Banks Strait scallop fishery The total value of displaced catches by Tasmanian based vessels is, therefore, approximately $10.4 million, or nearly 90% of the total across all states.

Alternatives
155 TAFI Final Report – FRDC 2005/083
6 Alternatives
The key opportunities for a more acceptable outcome for the fishing Industry, one that minimises the impact on fisheries and that does not compromise the conservation values of the proposed South-east Region MPA network are wrapped up in three linked issues: boundaries, zonation and application of the fisheries risk assessment that was conducted as part of the process. Each of these aspects is discussed below. The alternatives presented below are without prejudice and serve as a platform for further negotiation between Industry and the DEH as well as other stakeholders. 6.1 Application of the Fisheries Risk Assessment
Background to the FRA
To assist in identifying those fishing activities that will be permitted in multiple use zones of MPAs in the South-east Marine Region, DEH established a fishing risk assessment Technical Working Group. The role of the Technical Working Group was to provide advice on the impacts that fishing activities pose to MPA conservation values in the South-east Marine Region. The Technical Working Group comprised of marine scientists and fishing gear experts, as well as Industry and conservation sector advisors and observers. The Technical Working Group met in early May 2005 to develop preliminary results, which were then released for a period of stakeholder comment. The Technical Working Group reconvened in mid July 2005 to consider stakeholder comments and revise the results as appropriate. The Technical Working Group report was finalised out-of-session. The fishing risk assessment focused primarily on benthic habitats and did not consider benthic and pelagic species and communities. The rationale for the benthic habitat focus was:
− MPAs are a spatial management tool and in general perform best in protecting spatially fixed conservation values. This aligns closely with the conservation values being used to identify MPAs in the South-east (i.e., features such as submarine canyons and seamounts).
− Fisheries management agencies have a clear mandate to ensure fishing activities are ecologically sustainable. This is not the role of MPAs.
− The risk assessment is looking only at fishing methods permitted in multiple use areas. Higher protection levels can and will be established where full ecosystem protection is required.

Alternatives
TAFI Final Report – FRDC 2005/083 156
Government policy underlying the FRA
The Government has provided a clear policy framework for the development and application of the FRA through several documents including:
− Fishing Risk Assessment for Multiple Use MPAs, September 2005.
− Fishing Risk Assessment for the Development of a Representative System of Marine Protected Areas in the South-east Marine Region - Report of the Technical Working Group, October 2005.
− Zoning Representative MPAs, a draft policy paper released in December 2005. Key aspects of the policy include:
− Decisions on whether an activity can be carried out are made after a thorough assessment of the conservation values of the area and after consultation with stakeholders.
− The FRA results will be applied to candidate MPAs in the South-east Marine Region as they are identified, using knowledge about presence/absence of conservation values within each candidate MPA.
− DEH applies results to candidate MPAs…using available information about presence/absence of conservation values.
− Outcomes of the FRA and information about presence/absence of conservation values within candidate MPAs will form the basis for decisions about permitted fishing activities in multiple use MPAs.
Fishing Risk Assessment categories
In the DEH document Fishing Risk Assessment for Multiple Use MPAs, September 2005, the risk rating is stated as referring to the risk that a fishing activity poses to conservation value/s within a multiple use MPA. The three risk categories are low, medium and high risk:
− A low risk rating indicates that the interaction has an acceptable risk to the MPA conservation value/s and is likely to be permitted within a multiple use MPA based upon conservation values alone.
− A medium risk indicates that the interaction has a tolerable risk to the MPA conservation value/s provided the activity is managed to reduce the risk to an acceptable level in line with the low risk rating identified above. Potential risk management measures should be realistic for introduction in the short term. Any risk management measures suggested by the TWG will be considered by Government alongside management practicability.
− A high risk indicates that the interaction poses an unacceptable risk to the MPA conservation values and is unlikely to be permitted within a multiple use MPA based upon conservation values alone.

Alternatives
157 TAFI Final Report – FRDC 2005/083
Apparent inconsistencies in the application of FRA results
A summary of the Fisheries Risk Assessment results is provided in Appendix 2. It is clear that the intent of the FRA has not been followed in terms of the risk that a specific fishing activity poses to a specific MPA. In the determination of risk, the TWG ranked each fishing method according to depth, recognising a general trend of increased fragility with increased depth, and the influence of substrate type. Instead of applying the FRA in a differential way, DEH appear to have applied a ‘one-size-fits-all’ approach to fisheries risk. This is not only within MPAs but also between all of the reserves in the network. The application of the risk assessment appears to be inconsistent in several areas:
− Only those fishing methods that have a low risk have been permitted in Category VI multiple-use MPAs. Some methods such as midwater trawl and lobster potting are appropriately permitted (with scores of L-M and even L-H) while others with similar score, such as longlining, are excluded. This directly contradicts the policy intention, and, in the case of longlining needs to be addressed.
− Methods that are essentially similar in terms of their footprint and interaction with the benthos have been treated differently despite similar FRAs eg longlining and droplining. Both should be allowed in multiple use areas.
− Sectors using exactly the same methods have been treated differently in the Category VI Habitat Protection Areas, eg recreational lobster fishing is permitted but commercial lobster fishing is not. There appears to be no justification for including recreational fishing in these areas. Conversely, if recreational fishing using these methods is deemed to be consistent with the benthic conservation values then commercial fishing using the same methods should be allowed.
There appears to be a fundamental inequity in the treatment of the recreational and commercial sectors, for example, off Kangaroo Island. One consequence of the zonation proposed will see a reallocation of the marine resources of the area from the commercial to the recreational and charter boat sectors. No account of EPBC accreditation or mitigation measures, for example, Threat Abatement Plans (TAP) for seabirds appears to have influenced the decision to include/exclude a particular method from multiple-use areas (or at least the justification for exclusions have not been made).
Industry has expressed their concerns over the application of the FRA as follows:
− The generic application of the fishing risk assessment results to the proposed SE MPA network despite current Government policy stating otherwise.
− Apparent inconsistencies in the application of FRA results to the various fishing methods.

Alternatives
TAFI Final Report – FRDC 2005/083 158
− The lack of explanation or consultation as to the rationale for allowed and disallowed methods, especially in circumstances where the TWG could not agree on a single risk-rating.
Given the above there appears to be some justification for a re-evaluation of some of the fishing methods excluded from multiple-use areas.
6.2 Zonation
Marine protected areas (MPAs) are defined as an area of sea (which may include land, the seabed and subsoil under the sea) established by law for the protection and maintenance of biological diversity and of natural and cultural resources (ANZECC 1999). The National Representative System of Marine Protected Areas (NRSMPA) aims to include the full range of MPAs identified by the World Conservation Union (IUCN) –from highly protected areas (IUCN category Ia) managed primarily for scientific research through to sustainable multiple use areas (IUCN category VI) that accommodate a wide spectrum of human activities. MPAs may include zones assigned to different IUCN categories.
IUCN categories
The IUCN categories are defined as follows:
− IUCN Ia - Strict nature reserve: Managed primarily for scientific research or environmental monitoring.
− IUCN Ib - Wilderness area: Protected and managed to preserve its unmodified condition.
− IUCN II - National Park: Protected and managed to preserve its natural condition.
− IUCN III - Natural Monument: Protected and managed to preserve its natural or cultural features.
− IUCN IV - Habitat/species management area: Managed primarily, including (if necessary) through active intervention, to ensure the maintenance of habitats or to meet the requirements of specific species.
− IUCN V - Protected landscape/seascape: Managed to safeguard the integrity of the traditional interactions between people and nature.
− IUCN VI - Managed resource protected area: Managed to ensure long-term protection and maintenance of biological diversity with a sustainable flow of natural products and services to meet community needs.
It was proposed by DEH that MPAs in the South-east region will be initially assigned to either Category Ia or VI as follows:
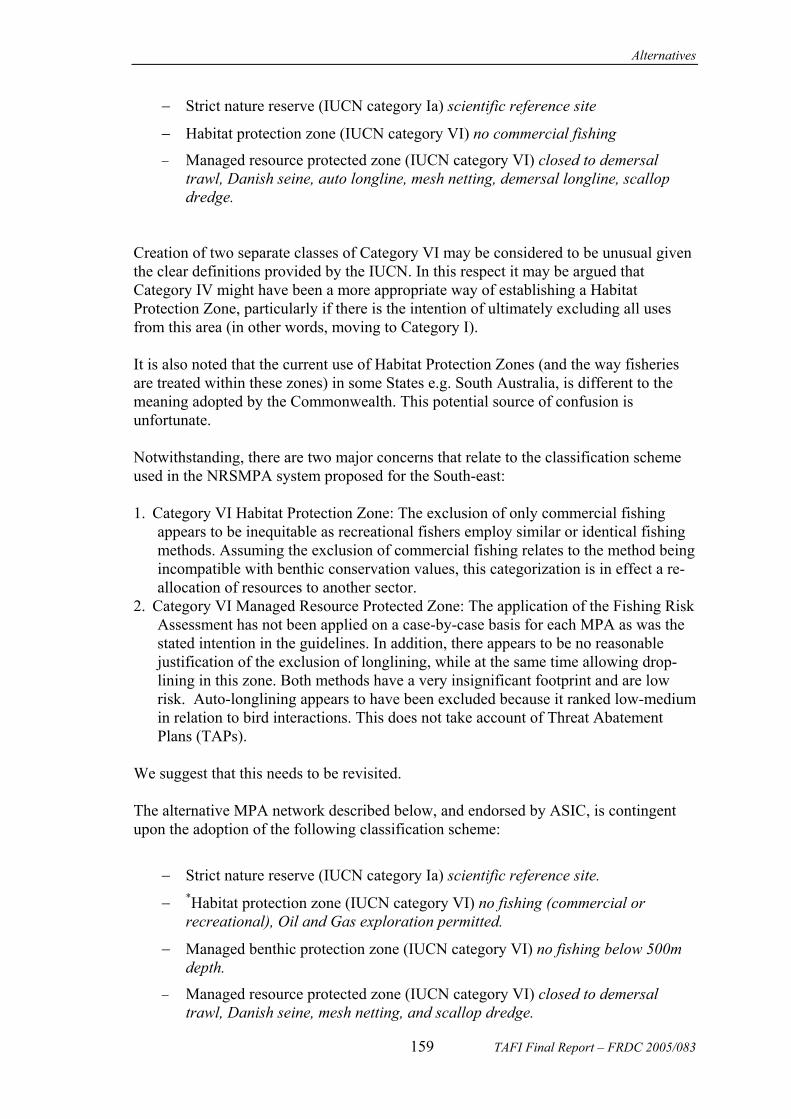
Alternatives
159 TAFI Final Report – FRDC 2005/083
− Strict nature reserve (IUCN category Ia) scientific reference site
− Habitat protection zone (IUCN category VI) no commercial fishing
− Managed resource protected zone (IUCN category VI) closed to demersal trawl, Danish seine, auto longline, mesh netting, demersal longline, scallop dredge.
Creation of two separate classes of Category VI may be considered to be unusual given the clear definitions provided by the IUCN. In this respect it may be argued that Category IV might have been a more appropriate way of establishing a Habitat Protection Zone, particularly if there is the intention of ultimately excluding all uses from this area (in other words, moving to Category I). It is also noted that the current use of Habitat Protection Zones (and the way fisheries are treated within these zones) in some States e.g. South Australia, is different to the meaning adopted by the Commonwealth. This potential source of confusion is unfortunate. Notwithstanding, there are two major concerns that relate to the classification scheme used in the NRSMPA system proposed for the South-east: 1. Category VI Habitat Protection Zone: The exclusion of only commercial fishing
appears to be inequitable as recreational fishers employ similar or identical fishing methods. Assuming the exclusion of commercial fishing relates to the method being incompatible with benthic conservation values, this categorization is in effect a re-allocation of resources to another sector.
2. Category VI Managed Resource Protected Zone: The application of the Fishing Risk Assessment has not been applied on a case-by-case basis for each MPA as was the stated intention in the guidelines. In addition, there appears to be no reasonable justification of the exclusion of longlining, while at the same time allowing drop-lining in this zone. Both methods have a very insignificant footprint and are low risk. Auto-longlining appears to have been excluded because it ranked low-medium in relation to bird interactions. This does not take account of Threat Abatement Plans (TAPs).
We suggest that this needs to be revisited. The alternative MPA network described below, and endorsed by ASIC, is contingent upon the adoption of the following classification scheme:
− Strict nature reserve (IUCN category Ia) scientific reference site.
− *Habitat protection zone (IUCN category VI) no fishing (commercial or recreational), Oil and Gas exploration permitted.
− Managed benthic protection zone (IUCN category VI) no fishing below 500m depth.
− Managed resource protected zone (IUCN category VI) closed to demersal trawl, Danish seine, mesh netting, and scallop dredge.

Alternatives
TAFI Final Report – FRDC 2005/083 160
* Note: As described above the Habitat Protection Zone would according to IUCN guidelines be more appropriately described as category IV. 6.3 Boundaries
Figure 6.3 provides a set of alternative MPA boundaries for the South-east region. This set of alternatives is provided with the following considerations:
− An understanding of the potential impact of the proposed MPAs based on the findings of this study.
− Not compromising DEH specifications for biodiversity objectives (also noting the relative paucity of protected area of shelf);
− Taking account of DEH objectives to:
o mimimise the impacts on Industry; and
o simplify enforcement.
− An understanding of additional criteria revealed through negotiations with DEH following the announcement of the proposed MPAs including:
o the desire to have at least one MPA in each of the three provinces that extends from State waters to the limit of the EEZ (currently proposed as Murray, Tasman Fracture and Bass Strait and Offshore Seamounts MPAs);
o constraints imposed on the positions and zoning of candidate MPAs by Oil and Gas leases and areas of prospectivity;
− Assessing compatibility of fishing methods within a IUCN VI MPA using the DEH Fisheries Risk Assessments on a case-by-case basis for each MPA rather than the current ‘one-size-fits-all’ approach proposed.
− Providing an assessment of the alternative MPAs against the design criteria summarised in Table 6.3

Alternatives
161 TAFI Final Report – FRDC 2005/083
Table 6.3 - Design criteria used in the selection of candidate MPAs for the South-east Region (Commonwealth 2003)
S1: Sample all the features listed under the Bioregions and Geomorphic Characteristics and Conservation Features. Seek to include whole features
S2: Where possible include linked systems/habitats across shelf, slope, abyssal plain, continental blocks
S3: Chose undisturbed areas
S4: Consider any ‘edge effects’ that you are aware of
S5: Include at least 2 adjacent canyons and intervening seafloor
S6: Include transitions from canyon-rich to canyon-poor areas
S7: Include entire seamounts, not only part. Where an area includes seamounts on continental block and on abyssal plain, treat these as different; represent each, with some adjacent continental block/abyssal plain
S8: As a minimum, include entire cinder cones. Preferably, include at least 2 cinder cones
S9: Consider areas of high biodiversity that you are aware of
S10: Use simple boundaries/ reduced fragmentation
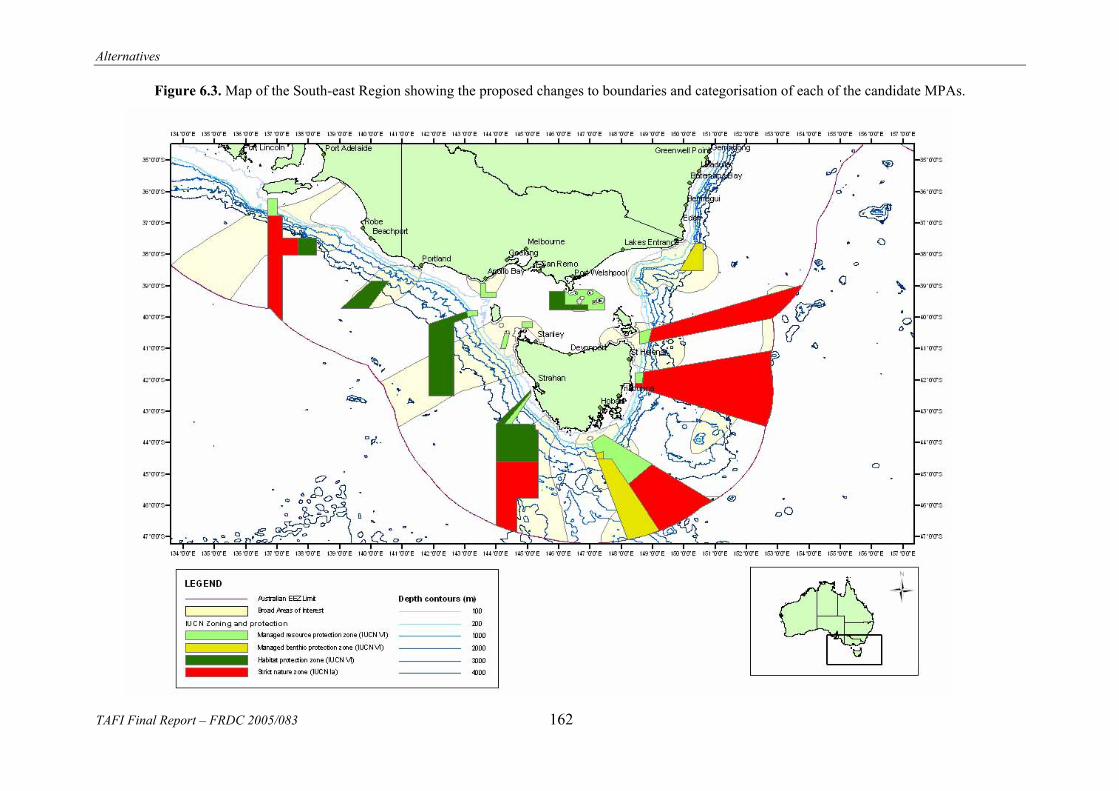
Alternatives
TAFI Final Report – FRDC 2005/083 162
Figure 6.3. Map of the South-east Region showing the proposed changes to boundaries and categorisation of each of the candidate MPAs.

Alternatives
163 TAFI Final Report – FRDC 2005/083
A description of the alternative proposals, the rationale and a discussion of the selection criteria for each MPA is presented below. Maps for each MPA proposal include the latitude and longitude (as degree, minutes and seconds) wherever changes are being proposed over the DEH candidate MPA network.
6.3.1 Murray
Description:
− Simplify the boundary adjacent to Kangaroo Island with a straight line bordering the southern limit of State waters (Fig. 6.3.1a).
− Establish Category VI multiple-use zones on shelf waters to the 1000m isobath, and on the eastern arm in which rock lobster and shark gill net are permissible fishing activities (Fig. 6.3.1a).
Rationale:
− The most significantly impacted fishery in this area will be NFMZ rock lobster, which occurs on the shelf down to approximately 150m. Creating a Category VI multiple-use zone adjacent to Kangaroo Island would significantly address the potential impact on this fishery by allowing potting to continue.
− Similarly the multiple-use zone to the east will minimise impacts on Commonwealth fisheries permitted under the FRA.
− Both would minimise compensation claims in this area.
− Straightening the boundary adjacent to State waters will simplify compliance (S10).
Selection criteria:
− The proposed changes to classification do not erode the values captured in the original DEH proposal. Specifically fisheries allowed to operate in the multiple-use area do not threaten benthic conservation values.
− This proposal provides continuous MPA from the limit of the EEZ to State waters in the Province (S2).
Note: In developing this option the fishing Industry suggested that alternative configurations that extend across the Lacepede shelf towards the Murray mouth could be considered. Such an option would more closely fit with the BAOI and provide a greater inclusion of the ‘connectivity’ across the shelf in the MPA. This would require further negotiation with stakeholders. In this context it is noted that if the Murray boundary was changed the impacts could be substantially less than currently proposed, but there would be impacts on fisheries. These could only be quantified when the proposed new boundary were known.

Alternatives
TAFI Final Report – FRDC 2005/083 164
6.3.2 Nelson
Description:
− No changes proposed.
Rationale:
− As originally proposed the MPA does not impact on any fisheries in a significant way.
6.3.3 Apollo
Description:
− Simplification of the boundary adjacent to state waters with a straight line bordering the southern limit of State waters (see Fig. 6.3.7).
− No changes proposed to classification.
Rationale:
− As proposed, the MPA is a multiple-use area and allows shark and rock lobster fishing methods that are important to the area. There is also some Danish seining in the inshore area of the proposed MPA that may not be permissible in a Category VI multiple-use MPA. Straightening the boundary would simplify compliance and minimises the impact on Danish seine fishing close to the State border (S10).
6.3.4 Zeehan
Description:
− Extend the eastern boundary of the MPA to the Tasmanian border.
− Establish a Category VI multiple use zone in the area that crosses the shelf break as illustrated (Fig. 6.3.4).
Rationale:
− The creation of a multiple-use zone will minimise potential compensation claims and is consistent with initial negotiations involving the fishing industry.
Selection criteria:
− The proposed changes to classification do not erode the values captured in the original DEH proposal. Specifically fisheries allowed to operate in the multiple-use area do not threaten benthic conservation values (in this case giant-crab potting, midwater trawl and drop-line).

Alternatives
165 TAFI Final Report – FRDC 2005/083
Zeehan (mid) and Zeehan (north-east)
Description:
− No changes proposed Rationale:
− As proposed, the MPA impacts on several fisheries, some which have been classified as having low impact (rock lobster, scalefish, drop-line, gillnet). Multiple-use minimises potential compensation claims.
6.3.5 Tasman Fracture
Description:
− Significantly change the shape of the MPA by removing the existing Category I no take area as well as a portion of the eastern part of the Category VI multiple-use zone as illustrated in Figure 6.3.5.
− Extend the northern part of the MPA towards Strahan across the existing oil leases (Fig. 6.3.5) to the edge of State waters.
− Establish a Category VI Habitat Protection Zone from State waters to the existing Category I zone on the western boundary of the MPA.
− Include auto-longlining as an approved fishing method in the multiple-use area. Rationale:
− As originally proposed, the MPA has a significant impact on several fisheries, most notably through the exclusion of auto-longlining from the Category VI multiple-use area, and the exclusion of all commercial fishing from the Category I strict nature zone.
− Changing the configuration and zonation of the Tasman Fracture MPA removes most of the impact on fisheries in this area (Commonwealth trawl, longlining, and small pelagics).
− The original objective, to establish a no-take MPA from state waters to the limit of the EEZ is addressed in the proposed adjustments.
− The proposed alternative provides a closer alignment with the BOAI.
− Including auto-longlining in the multiple use area would significantly decrease potential compensation claims from this sector of the Industry without compromising the benthic values of the MPA network.
Selection criteria:
− The new proposal does not erode any of the values captured in the original DEH proposal, but adds to the attractiveness in the following ways:
o Capturing more of the BAOI and maintaining connectivity between significant features of the area (S1 & S2).
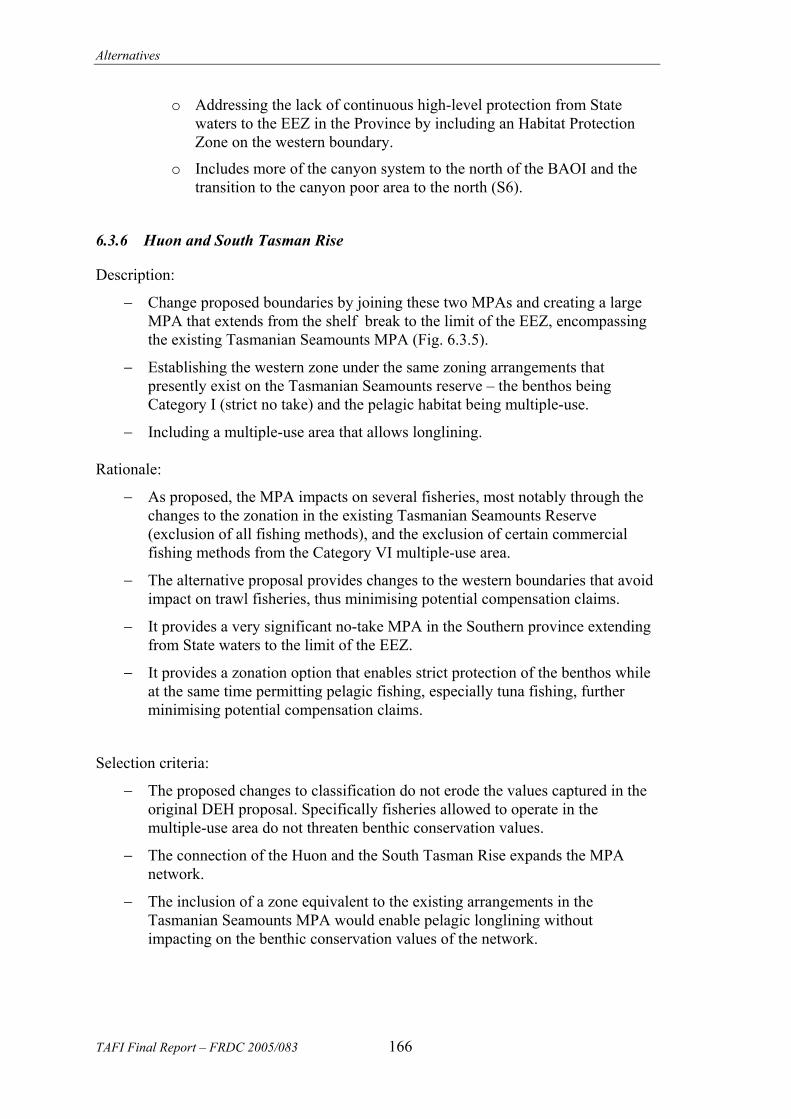
Alternatives
TAFI Final Report – FRDC 2005/083 166
o Addressing the lack of continuous high-level protection from State waters to the EEZ in the Province by including an Habitat Protection Zone on the western boundary.
o Includes more of the canyon system to the north of the BAOI and the transition to the canyon poor area to the north (S6).
6.3.6 Huon and South Tasman Rise
Description:
− Change proposed boundaries by joining these two MPAs and creating a large MPA that extends from the shelf break to the limit of the EEZ, encompassing the existing Tasmanian Seamounts MPA (Fig. 6.3.5).
− Establishing the western zone under the same zoning arrangements that presently exist on the Tasmanian Seamounts reserve – the benthos being Category I (strict no take) and the pelagic habitat being multiple-use.
− Including a multiple-use area that allows longlining. Rationale:
− As proposed, the MPA impacts on several fisheries, most notably through the changes to the zonation in the existing Tasmanian Seamounts Reserve (exclusion of all fishing methods), and the exclusion of certain commercial fishing methods from the Category VI multiple-use area.
− The alternative proposal provides changes to the western boundaries that avoid impact on trawl fisheries, thus minimising potential compensation claims.
− It provides a very significant no-take MPA in the Southern province extending from State waters to the limit of the EEZ.
− It provides a zonation option that enables strict protection of the benthos while at the same time permitting pelagic fishing, especially tuna fishing, further minimising potential compensation claims.
Selection criteria:
− The proposed changes to classification do not erode the values captured in the original DEH proposal. Specifically fisheries allowed to operate in the multiple-use area do not threaten benthic conservation values.
− The connection of the Huon and the South Tasman Rise expands the MPA network.
− The inclusion of a zone equivalent to the existing arrangements in the Tasmanian Seamounts MPA would enable pelagic longlining without impacting on the benthic conservation values of the network.

Alternatives
167 TAFI Final Report – FRDC 2005/083
6.3.7 Banks Strait and Offshore Seamounts
Description:
− Split the proposed MPA into two separate MPAs – Banks Strait (in the north) and a new area called Freycinet (in the south).
− Establish the Freycinet MPA with a multiple use area extending from State waters to 150m, and a contiguous Category 1 strict nature zone of Wineglass Bay that extends from State waters to the limit of the EEZ and which takes in the seamount to the north of the Cascades (Fig. 6.3.7a).
− Establish the Banks Strait MPA with a multiple use area extending from the western edge to the upper slope (800m). This area to be joined to the proposed Offshore Seamounts (north) as a Category 1 strict nature reserve (Fig. 6.3.7b)
− Remove Offshore Seamounts (south) from the network. Rationale:
− As originally proposed, the Banks Strait and Seamounts MPA impacted on several fisheries, some in a very significant way. The suggested alterations to the boundaries will significantly mimimise the impact on the fishing sector completely avoiding conflict with the Tasmanian Scallop Fishery, which has been identified as a major problem for the coastal community at St Helens. They significantly reduce impacts on Commonwealth fisheries especially longlining, droplining and trawl, including the key orange roughy grounds of St Helens Hill and Paddy’s Head.
− The new MPAs do not compromise the benthic values or area contained in the proposed South-east MPA network. In particular the proposed Freycinet MPA will provide a reserve in the Province that extends from State waters to the limit of the EEZ. This MPA captures iconic geomorphic features such as seamounts, ridges and saddles and is adjacent to a significant conservation area on land – the Freycinet National Park.
− Combined with suggested changes to the zonation in the Tasman Fracture MPA, the proposed changes to the Banks Strait MPA will avoid much of the conflict associated with the blue-eye trevalla fishery.
− Given the high percentage of seamounts already captured by the proposed South-east MPA network (>60%), there appears to be no justification for the inclusion of the Cascades in the MPA (Banks Strait Seamounts south). The Cascades have a long exploitation history (30 years) this area was deemed to be too important to the SESS to be included in the system. Inclusion would significantly impact on the orange roughy fishery and would greatly increase the potential compensation claim.
Selection criteria:
− The changes proposed capture similar geomorphical features to those in the DEH proposal. In addition:
g. The new Freycinet MPA includes seamounts and other geomorphological features not previously captured (S7).

Alternatives
TAFI Final Report – FRDC 2005/083 168
h. The new configuration significantly avoids impacts on the fisheries in the area.
− The Freycinet MPA provides an area of continuous high-level protection from State waters to the limit of the EEZ by the establishment of a Habitat Protection Zone off Wineglass Bay (S2).
− Boundaries are simplified (S10).
6.3.8 Bass Basin
Description:
− Simplification of the boundary adjacent to state waters.
− Change the boundaries of the MPA as outlined in Figure 6.3.8, extending the MPA to the west as a Habitat Protection Zone.
− Change the zonation of the MPA - establish a Category VI Habitat Protection Zone in the west of the MPA and establish the exiting area as Category VI multiple-use.
Rationale:
− As currently proposed by the DEH the MPA will significantly impact the gillnet shark fishery. A shift of the boundaries to the area west of the proposed area will still be in the BAOI but will lessen the impact on the shark fishery and minimise potential compensation claims in this area
− In addition, it is conceivable that the effort from the existing proposed Bass Basin MPA will be concentrated in State waters around the Bass Strait islands posing a significant detrimental impact on remaining waters. This is avoided by the suggested changes.
− The alternative increases the MPA area on the shelf. Selection criteria:
− The alternative proposal for Bass Basin does not erode any of the values captured in the original DEH proposal, but adds to the attractiveness in the following ways:
i. Minimising impact on fisheries
j. Capturing a larger area of the shelf
k. Expanding the area of the MPA provides a linkage with State MPAs in both Victoria and Tasmania (S4).
6.3.9 East Gippsland
Description:

Alternatives
169 TAFI Final Report – FRDC 2005/083
− Minor adjustment to the western boundary (Fig 6.3.10) to avoid existing trawled area.
Rationale:
− As proposed, the MPA does not impact on any fisheries in a significant way. The longitude of 150o 21’ E on the NW corner of the MPA is suggested to change to 150o 22’ E so that the MPA does not directly abutt well established and valuable commercial trawl fishing grounds and in this way avoid accidental boundary violations.
Selection criteria:
− The changes proposed do not erode any of the values captured in the original DEH proposal.

Alternatives
TAFI Final Report – FRDC 2005/083 170
Figure 6.3.1a. Map of the proposed new Murray MPA showing the changes to boundaries and categorisation.
136 4236 12.6
136 4236 46.2
137 0036 12.6
137 1036 46.2
137 1036 42.6
● ●
● ●●
136 4236 12.6
136 4236 46.2
137 0036 12.6
137 1036 46.2
137 1036 42.6
● ●
● ●●
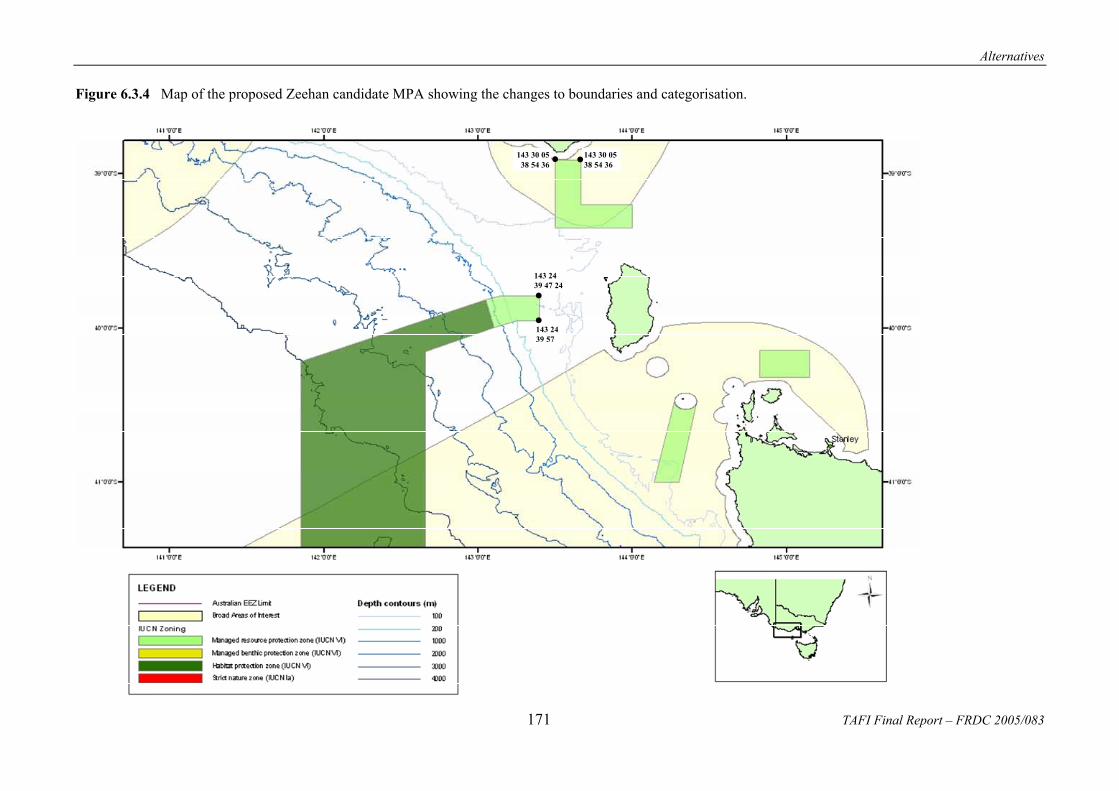
Alternatives
171 TAFI Final Report – FRDC 2005/083
Figure 6.3.4 Map of the proposed Zeehan candidate MPA showing the changes to boundaries and categorisation.
143 30 0538 54 36
143 30 0538 54 36
143 2439 47 24
143 2439 57
● ●
●
●
143 30 0538 54 36
143 30 0538 54 36
143 2439 47 24
143 2439 57
143 30 0538 54 36
143 30 0538 54 36
143 2439 47 24
143 2439 57
● ●
●
●

Alternatives
TAFI Final Report – FRDC 2005/083 172
Figure 6.3.5 Map of the proposed new Tasman Fracture and Huon and Offshore Seamounts candidate MPAs showing the changes to boundaries and categorisation.
144 1543 24
144 3043 24
145 0642 20 145 06
42 24
145 0642 28 48
147 02 2443 58 48
147 25 4843 44 24
148 58 1244 40 12
148 13 1245 19 12
147 40 4844 30 36
147 14 2444 30 36
●
●
● ●●
●●●
●●
●
144 1543 24
144 3043 24
145 0642 20 145 06
42 24
145 0642 28 48
147 02 2443 58 48
147 25 4843 44 24
148 58 1244 40 12
148 13 1245 19 12
147 40 4844 30 36
147 14 2444 30 36
●
●
● ●●
●●●
●●
●

Alternatives
173 TAFI Final Report – FRDC 2005/083
Figure 6.3.7a Map of the proposed new Freycinet and Seamounts MPA showing the changes to boundaries and categorisation.
152 48 3641 03 36●
152 3643 28 12
●
●● ●
●●
148 25 4842 12 36
148 40 1242 06 36
148 25 4842 06 36
148 25 4841 46 48
148 48 00 41 45 00
148 40 1242 16 48
●
152 48 3641 03 36●
152 3643 28 12
●
●● ●
●●
148 25 4842 12 36
148 40 1242 06 36
148 25 4842 06 36
148 25 4841 46 48
148 48 00 41 45 00
148 40 1242 16 48
●

Alternatives
TAFI Final Report – FRDC 2005/083 174
Figure 6.3.7b Map of the proposed new Banks Strait and Seamounts MPA showing the changes to boundaries and categorisation.
152 49 4840 01 12
●
153 47 2438 57 ●
148 58 4840 21
●148 34 1240 28 12
●
148 34 1240 51 36
●148 51 3640 47 24
●
152 49 4840 01 12
●
153 47 2438 57 ●
148 58 4840 21
●148 34 1240 28 12
●
148 34 1240 51 36
●148 51 3640 47 24
●

Alternatives
175 TAFI Final Report – FRDC 2005/083
Figure 6.3.8 Map of the proposed new Bass Basin MPAs showing the changes to boundaries and categorisation.
147 27 3639 22 12●
147 0639 06
●146 1239 09 36
●
145 4239 09 36●
145 4239 46 12
●146 55 1239 46 12
●
146 55 1239 36
●
146 12 3639 36
●
147 27 3639 46 12
●
147 27 3639 22 12●
147 0639 06
●146 1239 09 36
●
145 4239 09 36●
145 4239 46 12
●146 55 1239 46 12
●
146 55 1239 36
●
146 12 3639 36
●
147 27 3639 46 12
●
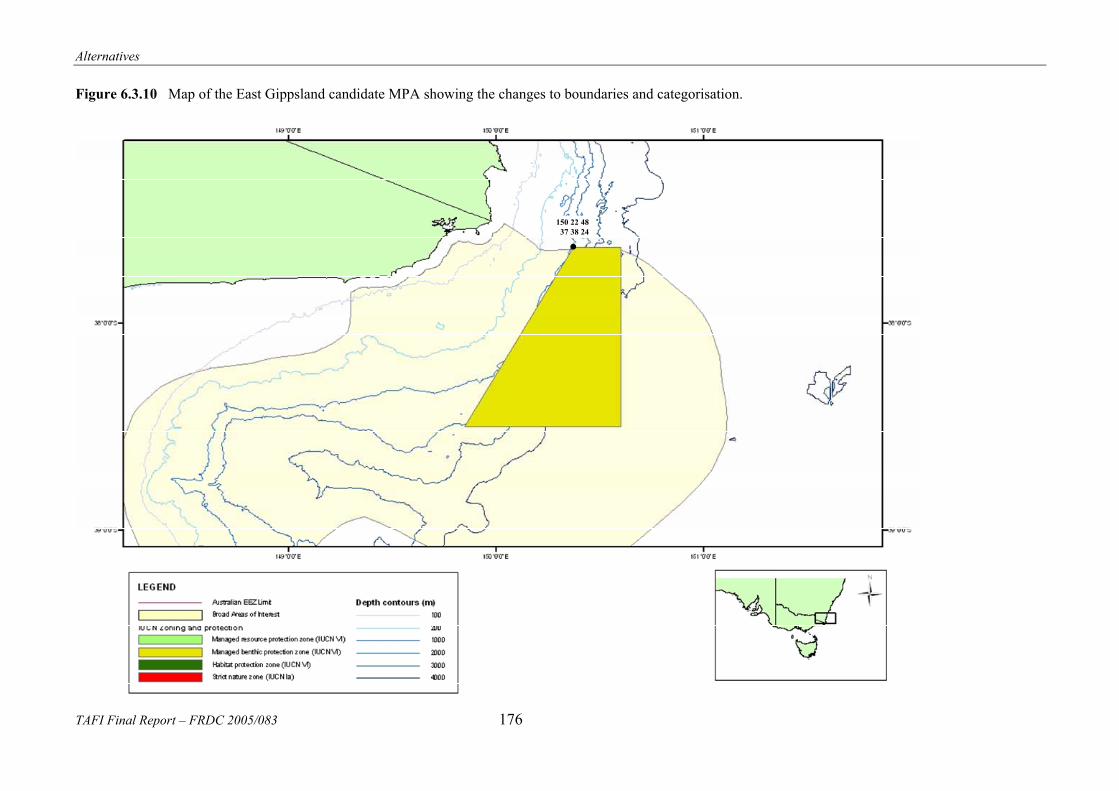
Alternatives
TAFI Final Report – FRDC 2005/083 176
Figure 6.3.10 Map of the East Gippsland candidate MPA showing the changes to boundaries and categorisation.
150 22 4837 38 24
●
150 22 4837 38 24
●

General Discussion & Conclusions
177 TAFI Final Report – FRDC 2005/083
7 General Discussion and Conclusions
7.1 Context
The impacts of the network of candidate MPAs on commercial fisheries constitutes a complex array of effects and interactions as described in the Results and Discussion. In an attempt to summarize the main points the following series of dot points are presented but are not intended to represent the full details of each situation. To fully grasp the implications the full document is required.
7.2 Implications of Potential Catch Displacement
7.2.1 General Remarks
− The overall impact of the network of candidate MPAs on commercial fishing should not be seen as a simple addition of their individual effects. When catch is displaced from an area the fishing industry requires options for where else to attempt to fish. For example, the Banks Strait, the Huon and the Tasman Fracture candidate MPAs all have significant impacts on the fishery for the iconic Australian species the blue-eye trevalla. Not withstanding the adjustment package on offer, in combination the candidate MPAs reduce the available quality fishing areas and would have the potential to displace undesirably high levels of fishing effort into other prime fishing areas.
− Selecting a fishing area is usually a trade-off between choosing to go where the catches are best while minimizing the costs of fishing (least fuel and shortest fishing trips). If too many prime fishing sites are closed to fishing this will greatly increase the chances of any remaining prime sites being depleted by a focussing of displaced effort. If sufficient catch is displaced a network of MPAs could result in a subsequent serial depletion of remaining prime fishing areas.
− The impact of a particular candidate MPA may extend to beyond its precise borders so the impacts on trawl fisheries listed in this document are biased low. For example, a typical trawl in the SETF market fishery (not orange roughy) tends to be about 3 – 3.5 hour duration, which might cover 10 nautical miles. If an MPA were to cut off >1/3 of a typical trawl shot on a particular trawl ground, the value in shooting the remainder of such shots becomes less attractive. The crew has to work too hard to carry out small (<2 hour shots) and it is becomes less economically viable. Importantly, it is the bottom topography that determines where trawling is possible, and the start and end of shots are often determined by untrawlable ground. Put simply, if the edge of an MPA cuts through a trawl shot to any great extent, then the whole shot is effectively lost, not just that which is in the MPA.

General Discussion and Conclusion
TAFI Final Report – FRDC 2005/083 178
7.2.2 Murray
Rock lobster
− The current fishery management is designed to achieve stock rebuilding with the TAC of 625 tonnes in 2003/2004 (about 70% of the average catch over the past 20 years), with a further reduction in 2004/2005 from 625 t to 520 t. In its EPBC strategic assessment the fishery was judged as “The fishery is being managed in an ecologically sustainable way, in accordance with the [EPBC] guidelines.”
− The estimated loss of rock lobster catch of about 8.86 tonnes implied by the candidate MPA would require the number of active operators to be reduced by two (there are currently about 55) in order to retain the status quo in the stock status.
− The absolute amount of catch that will be displaced does not fully reflect the importance to the Northern Zone rock lobster fishery because it ignores the seasonal distribution of effort, which would be disrupted. Nor does it take into account the rebuilding and expected increases in catch from the Kangaroo Island area.
− Compliance of the current near-shore candidate MPA boundary would be extremely complex and expensive to implement. The current boundary involves the curving 3nm boundary between State and Commonwealth waters. In addition, the presence of a small island just off Kangaroo Island prevents the northern boundary of the reserve from retaining a simple shape.
− During the more than two years of negotiations the candidate MPA nearest Kangaroo Island had always been classified as multiple-use, specifically rock lobster fishing was to have been permitted. Concern has been expressed over the change in zonation in the current candidate MPA.
GHAT fishery
− Until recently the Murray region was closed to the GHAT fishery. In the future the exclusion of certain methods from the MPA will present an opportunity lost that is not quantified in the figures presented in this study because of a lack of information on recent catch history.
GAB trawl fishery
− The developing slope fishery in the Commonwealth GAB trawl fishery will be adversely effected. Catches by this sector in the proposed Murray MPA have increased in recent years. The impacts on the GABTF are similar to the GHAT, in the form of loss of productive grounds and potential revenue as the slope fishery develops further.

General Discussion & Conclusions
179 TAFI Final Report – FRDC 2005/083
7.2.3 Zeehan
− The offshore candidate MPA extends over the shelf into a valuable giant crab fishery area. The absolute amount of catch appears to be relatively small but this still constitutes about 20% of the total Victorian giant crab fishery. This small but valuable fishery would be severely compromised by the proposed closure.
7.2.4 Tasman Fracture Zone
− Because the no commercial fishing zone in the Tasman Fracture candidate MPA is relatively deep (>100m depth) only relatively small amounts of both scalefish and rock lobster are caught by State fisheries in the candidate MPA.
− In Commonwealth fisheries, on the other hand, at least 85 tonnes of scalefish are displaced from both the Category Ia and Category VI zones, this is mostly blue-eye trevalla (a Tasmanian iconic commercial species) and silver warehou. Other market fish species taken in significant quantities include gummy shark, pink ling, jackass morwong, ribaldo, blue grenadier, school shark, mirror dory and star gazers.
− The combined effects of the Banks Strait, the Huon and the Tasman Fracture candidate MPAs will be to severely constrain the blue-eye trevalla fishery around Tasmania. In addition, the market fish fishery (jackass morwong, flathead, and other species) will also be greatly compromised.
7.2.5 Huon
− Only Commonwealth fisheries are affected by this candidate MPA but it is an important area for blue-eye trevalla and an array of market fish. In combination with the Tasman Fracture Zone, and the Banks Strait, these candidate MPAs will act to severely constrain or damage the blue-eye trevalla and market fish fishery around Tasmania.
7.2.6 Offshore Seamounts (South)
− The orange roughy fishery has been the most valuable fishery in the SETF and has led to extensive investment in large vessels capable of fishing the deep water stocks. The TACs for the various separate fishing grounds have recently been reduced. The 2004 SESSF assessment document suggested a TAC of 720 tonnes for the Eastern Zone, and a long term catch level of between 200 and 400 tonnes for the Cascade Plateau and recommended reducing that TAC down to 400 tonnes by 2008. In other areas it recommended precautionary action.
− Recent surveys have been indicating that the stocks are recovering faster than the stock assessment model predicts is possible. This is similar to the New
General Discussion and Conclusion
TAFI Final Report – FRDC 2005/083 180
Zealand Challenger Plateau stock which was deemed to have recovered through re-aggregation rather than growth and recruitment. In other words, the initial apparent depletion was related to a dis-aggregation of the spawning aggregations rather than actual destruction of stock. What this would imply is that the optimism within Industry that the orange roughy fishery can be viable and sustainable in the long term appears to have a real foundation.
− There are two areas of importance to the orange roughy fishery. These are the Cascade Plateau and the St Helens Hill / St Patrick’s Head areas off the east coast of Tasmania. The average expected catch displaced from the Cascade (adjusted for the likely 2007 TAC) is 214 tonnes of orange roughy. However, in recent years the TAC has been 1400 tonnes on the Cascade (700 tonnes in 2006) and 720 tonnes for the eastern zone (plus 100 tonnes of research quota for each of the two areas). Closing the Cascade Plateau and the eastern zone would effectively close the orange roughy fishery. This would constitute a loss of about 1600 tonnes, which at $4.00 a kg equates to greater than $6.0 million.
− If the vessels currently fishing for orange roughy were to be diverted full time into the market fish fishery this could potentially lead to large scale regional depletion through increased discarding.
− The proposed MPAs will have a significant effect on the viability of enterprises associated with this fishery as follows:
o It should be noted that the removal of a large part of any operator’s fishing business in the SE trawl could well make that fishing enterprise economically unviable – therefore the closure of ORH grounds is likely to have far more wide reaching effects than solely the ORH aspect of a fishing business.
o The viability of marketing/processing businesses would be affected in a similar way to that of a fishing operator if the ORH component is removed. This is especially the case against the backdrop of potentially losing the supply of other fresh fish through the implementation of MPAs.
o Fresh fish marketers (Melbourne and Sydney markets) will lose their ability to make a commission on the sale of ORH (generally equates to ~10% of value across the market floor, as well as the ability to market “packages” of fish to buyers reducing ability to “move” fish.
o Processors will lose export markets and the ability to generate a surplus through land-based processing of whole, fresh ORH into skinless fillets for the US market, and associated export synergies.
7.2.7 Banks Strait
− The inshore sections of the proposed Banks Strait and Offshore Seamounts MPA overlap with a very significant part of the Tasmanian scallop fishery, currently managed by Tasmania under an Offshore Constitutional Settlement between Tasmania and the Commonwealth.

General Discussion & Conclusions
181 TAFI Final Report – FRDC 2005/083
− If the proposed Managed Resource Protection Area and Habitat Protection Zone go ahead the Tasmanian scallop fishery will be reduced by more than 50% as this is a highly productive area for commercial scallops. The planned fisheries in 2007 to 2008 (and possibly 2009) will be mostly or completely compromised, leading to a loss of 8,000 to 12,000 tonnes of scallops over at least two years, and there are currently no full alternative areas available.
− Before the late 1990s the Commonwealth and Tasmanian fisheries were managed in such a way as to lead to a cycle of “boom” years of large catches followed by “bust” years of closed fishery. In Tasmania this cycle has been broken by the introduction of a new detailed spatial management arrangement whereby most of the coastline is closed to fishing and only smaller areas are open to scalloping in any one year. This rotational “paddock” fishing rests large areas for a number of years with the idea of the scallop stocks within them having time to recover between periods of fishing.
− A fortunate outcome of this paddock fishing is that fishing is focused on small areas of high scallop density so that it affords significant protection to large areas of seabed because less searching for the scallop beds is required by the whole fleet.
− The detailed spatial management arrangements, which are still being optimized, have led to a successful fishery for the past three years with catches of 3,433 t in 2003, 4,055 t in 2004, and 4,668 t in 2005, with known prospects of good fishing (a TAC of at least 4,000 t for the next three years), and with further scallop beds due to come on line after that. It has led to a sustainable fishery that should occur each year, and which has recently been accredited by DEH as sustaionable under the EPBC act.
− The scallop beds that are fished tend be relatively small (1000s x 1000s metres) and tend to occur in physically dynamic environments with strong tidal currents and exposure to powerful wave actions. The species living there tend to be well adapted to physical disturbance and, perhaps counter-intuitively, scallop dredging has been found to have only minor effects because they are so focused into small areas. Scallop beds are regularly found to return to the same locations proving that even past excessive fishing pressure does not irrevocably damage the benthic habitat. Even after a fallow period of five or more years these areas of ‘good’ scallop beds have not developed alternative biological communities (i.e. epifaunal species do not develop or aggregate in the absence of scallop dredging).
− If the proposed Banks Strait MPAs go ahead as proposed there will be too few paddocks to permit a fishery every year and the TAC would have to be significantly reduced. At worst the detailed spatial management would no longer be economically viable and there would need to be a return to opening the whole fishery every few years. Apart from destroying an extremely well managed fishery this outcome would be damaging to the east Tasmanian coastal benthic habitat as much more searching would be required by the individual fishers. The loss of continuity of supply would immediate lose export markets which would, in turn, lower domestic prices back to the vessels.
General Discussion and Conclusion
TAFI Final Report – FRDC 2005/083 182
− The other State fisheries impacted by the Banks Strait candidate MPA include rock lobster, giant crab and some of the major scalefish species. Individually these appear to be relatively small impacts but the rock lobster catches make up 9% of the locally caught lobster and the giant crab catches make up 11.6% of the whole east coast catch. The losses to rock lobster, giant crab and scalefish taken collectively (especially in combination with the losses to scallops and Commonwealth fisheries; see below) will have serious implications for local fishing operations.
− The Commonwealth fisheries that would be affected by the Banks Strait candidate MPA include significant amounts of blue-eye trevalla (> 69 tonnes), shark, market fish, and small pelagics (redbait and jack mackerel).
− The small pelagic fishery could be very severely affected with a displacement of at least 49% of an average annual catch.
− Over 69 tonnes of the iconic blue-eye trevalla will be displaced by the Banks Strait candidate MPA. In combination with the Huon and Tasman Fracture Zone candidate MPAs this will severely impact the whole blue-eye trevalla fishery.
− The Banks Strait area is also an important fishing ground for the foundation market fish that dominate the Australian food market. More than 10 tonnes each will be displaced of silver warehou, pink ling, jackass morwong, tiger flathead and others. In combination with the proposed closures in the Huon and the Tasman Fracture Zone the available options for fishing locations will be severely reduced. Displacement of catch into less productive areas, if it occurs, could lead to a serial depletion of those areas and negatievly affect fleets from other areas (e.g. eastern Victoria).
7.2.8 Bass Basin
− The biggest impact in this area will be a displacement of over 80 tonnes of sharks and rays. This area is a relatively safe fishing region in the winter months (Bass Strait is notoriously dangerous) and numerous smaller operators, mostly based in Victoria, will be the most affected by this closure. Their vessels are not large enough for them safely to go elsewhere in the winter raising the real risk of them transferring their effort into the 3-mile rings surrounding the Bass Basin islands. It would be a risky conservation option to concentrate fishing effort into these small areas.

183 TAFI Final Report – FRDC 2005/083
8 Benefits and Adoption
The major beneficiaries of this work will include: - The commercial fishing sectors (State and Commonwealth) that are affected by
the proposed MPAs including Gillnet Hook and Trap, Southeast Scalefish and Shark, Small Pelagic, Tasmanian Scallops, Southern Rock Lobster (SA and Tas), Giant Crab (Vic and Tas), Tasmanian Scalefish.
- State Fisheries Departments in Tasmania, Victoria and South Australia. - Commonwealth Departments (DEH, DAFF, AFMA) responsible for the
implementation of the South-east Region MPAs and the implementation of the fishery adjustment package.
The alternatives presented in this report, if adopted by the key stakeholders (ASIC, DEH and DAFF), will underpin changes to MPAs (boundaries and zonation), thus minimising the impact on the commercial fishing sector. DEH have indicated a desire to use the data from the report to inform the statutory requirement for a Regulation Impact Statement (RIS) for the proposed MPAs. Finally, the study forms a benchmark for similar MPA planning processes in other regions around Australia.
9 Further Development
The project timeframe was severely limited by the timeline provided by DEH to Industry to respond to the proposed network of MPAs in the South-east Region. For this reason a more comprehensive socio-economic survey was not possible and the ability to project the full economic impacts of the system (beyond an estimate of GVP) was not possible. Such an analysis will be required for any enterprise that is considering tendering under the structural adjustment package. A quantification of the displaced catch in the alternative system of MPAs proposed here was beyond the resources of this study. This is probably needed to fully assess the impacts of the alternative system on the fishing industry. The application of the Fisheries Risk Assessment on a case-by-case basis is needed to fully integrate the alternative system within the negotiated policy framework. This will improve the understanding of the risks associated with individual fisheries in individual MPAs and is likely to improve the conservation outcome. Clearly, little is known about the biodiversity of the system and this represents a huge research opportunity for the future if the system is to achieve its intended outcomes. Similarly, the relationship between geomorphology and biodiversity is poorly understood. This use of surrogacy needs to be tested.

Benefits & Adoption, Further Development and Planned Outcomes
TAFI Final Report – FRDC 2005/083 184
10 Planned Outcomes
1. The implementation of an alternative system of MPAs for the South-east region that:
− Minimises the impact on the fishing industry;
− Treats all fishing sectors in an equitable way;
− Does not compromise the intended biodiversity conservation objectives of the originally proposed network; and
− Is supported by ASIC, DEH, DAFF and leading conservation agencies. 2. A significant reduction of the impact of the MPA network on the fishing industry. 3. A significant reduction in the potential compensation payout to the fishing
industry. 4. A broad acceptance by the fishing industry of the MPA network in the South-east
Region that results in:
− Improved relationships between the fishing industry and DEH; and
− A greater opportunity for compliance. 5. Presentation of a template of how to assess the impacts of an MPAs on a regional
basis, for use in future as systems are developed in other Regions around Australia.

IP, Staff & Appendices
185 TAFI Final Report – FRDC 2005/083
11 Intellectual Property
There is no intellectual property arising from this study, other than ownership of data derived during Tasmanian and Interstate MPA surveys. This data may be made available on request, however TAFI and collaborating agencies retain the right to control access to this data for the purpose of publication in the primary literature.
12 Staff
Prof. Colin Buxton, Director, Tasmanian Aquaculture and Fisheries Institute, University of Tasmania (PI)
Assoc. Prof. Malcolm Haddon, Resource Modeller, TAFI Marine Research Laboratories, University of Tasmania (Co-investigator)
Dr Matt Bradshaw, Honourary Research Associate, School of Geography and Environmental Studies, University of Tasmania (Co-investigator)
12.1 Project Support Team
Crispian Ashby, FRDC Program Manager
Roger Edwards, General Manager, Corvel Marketing and Management (SA Industry)
Dallas d’Silva, A/Manager Marine Fisheries, Primary Industries and Resources Victoria (Vic Govt)
Dr David Galeano, Fisheries Economist (ABARE)
Gerry Geen, Economist, Fisheries Economic Research Consultancy
Dr Ian Knuckey, Fishwell Consulting (Commonwealth Industry)
Dr James Larcombe, Fisheries Scientist (BRS)
Ross McGowan, Executive Director, Seafood Industry Victoria (Vic Industry)
Jeff Moore, ASIC Liaison Officer (ASIC)
Gail Richey, Executive Officer, Commonwealth Fisheries Association (Commonwealth Industry)
Ed Smith, Project Officer, Tasmanian fishing industry (Tasmanian Industry)
Sean Sloan, Senior Fisheries Manager, Primary Industries and Resources South Australia (SA Government)

IP, Staff & Appendices
TAFI Final Report – FRDC 2005/083 186
13 References
Australian Bureau of Statistics (2001) Basic Community Profiles, Nos 2001.0, 6021001,6021007,6021008, 6021009, 60210011, 60210012, 615150210, UCL614800. Canberra.
ANZECC 1998. Guidelines for establishing the National Representative System of Marine Protected Areas. Environment Australia. 15pp.
ANZECC 1999. Strategic Plan of Action for the National Representative System of Marine Protected Areas: A guide for action by Australian Governments. Environment Australia. 79pp.
Butler, A. Harris, P. Lyne, V. Heap, A. Passlow, V. and Smith, R. 2001. An interim draft bioregionalisation for the continental slope and deeper waters of the South-east Marine Region of Australia. Report to the National Oceans Office. CSIRO Marine Research and GeoScience Australia.
Caton, A. and McLoughlin , K. (eds) (2004) Fishery Status Reports 2004: Status of fish stock managed by the Australian Government. Bureau of Rural Sciences, Canberra.
Coakes, S. and Gabriel, M. (2001) The right bait – social contributions of tourism fishing charter operations to St Helens, Tasmania, BRS, Canberra
Commonwealth of Australia 2003. Australia’s South-east Marine Region: A user’s guide to identifying candidate areas for a regional representative system of Marine Protected Areas. 85pp.
EconSearch 2005a, Regional Development Board Economic Models, a series of RISE models prepared for the Office of Regional Affairs, Department of Trade and Economic Development.
EconSearch 2005b, Economic Indicators for the SA Northern Zone Rock Lobster Fishery 2003/04, report prepared for Primary Industries and Resources South Australia, August.
Francis and Hilborn (2002). Review of the 2002 Australian orange roughy stock. AFMA Unpublished report.
Frusher, S., Eaton, L. & Bradshaw, M. (2003) Impact of management change to an ITQ system in the Tasmanian rock lobster fishery. FRDC Final Report 1999/140.
Knuckey, I.A. and Liggins, G.W. (1999). Focussing on bycatch issues in Australia’s South East Fishery. In: Buxton, C.D. and S.E. Eayrs (eds), Establishing meaningful targets for bycatch reduction in Australian fisheries. Australian Society for Fish Biology Workshop Proceedings, Hobart, September 1998. pp 46-55.
National Oceans Office 2004. South East Regional Marine Plan, Implementing Australia’s Oceans Policy in the South-east Marine Region. Atremis 123pp.
National Ocean’s Office 2002. Ecosystems: nature’s diversity. The South-east regional Marine Plan.
Smith, A.D.M. and S.E. Wayte (eds) (2005) The Southern and Eastern Scalefish and Shark Fishery 2004, Fishery Assessment Report compiled by the Southern and Eastern Scalefish and Shark Fishery Assessment Group. Australian Fisheries Management Authority, Canberra.
Smith, A.D.M. and S.E. Wayte (eds) (2004) The South East Fishery 2003, Fishery Assessment Report compiled by the South East Fishery Assessment Group. Australian Fisheries Management Authority, Canberra.

IP, Staff & Appendices
187 TAFI Final Report – FRDC 2005/083
Williamson, S. Wood, L. & Bradshaw, M. (1998) A socoi-economic profile of the rock lobster industry in Tasmania and the effects of a shift to quota management system on four port communities. Internal Report UniTas Consulting Ltd. Hobart
14 Abbreviations and Acronyms
ABARE Australian Bureau of Agricultural and Resource Economics AFMA Australian Fisheries Management Authority ASIC Australian Seafood Industry Council BRS Australian Bureau of Rural Sciences DAFF Commonwealth Department of Agriculture, Forestry and Fisheries DEH Commonwealth Department of Environment and Heritage EEZ Exclusive Economic Zone FRA Fishing Risk Assessment conduced by DEH in May 2005 GIS Geographical Information System IMCRA Interim Marine and Coastal Regionalisation for Australia MPA Marine Protected Area NOO National Oceans Office NRSMPA National System of Marine Protected Areas PIRSA Primary Industries and Resources South Australia PIRVic Primary Industries and Resources Victoria TAC Total Allowable Catch TAFI Tasmanian Aquaculture and Fisheries Institute SARDI South Australian Research and Development Institute
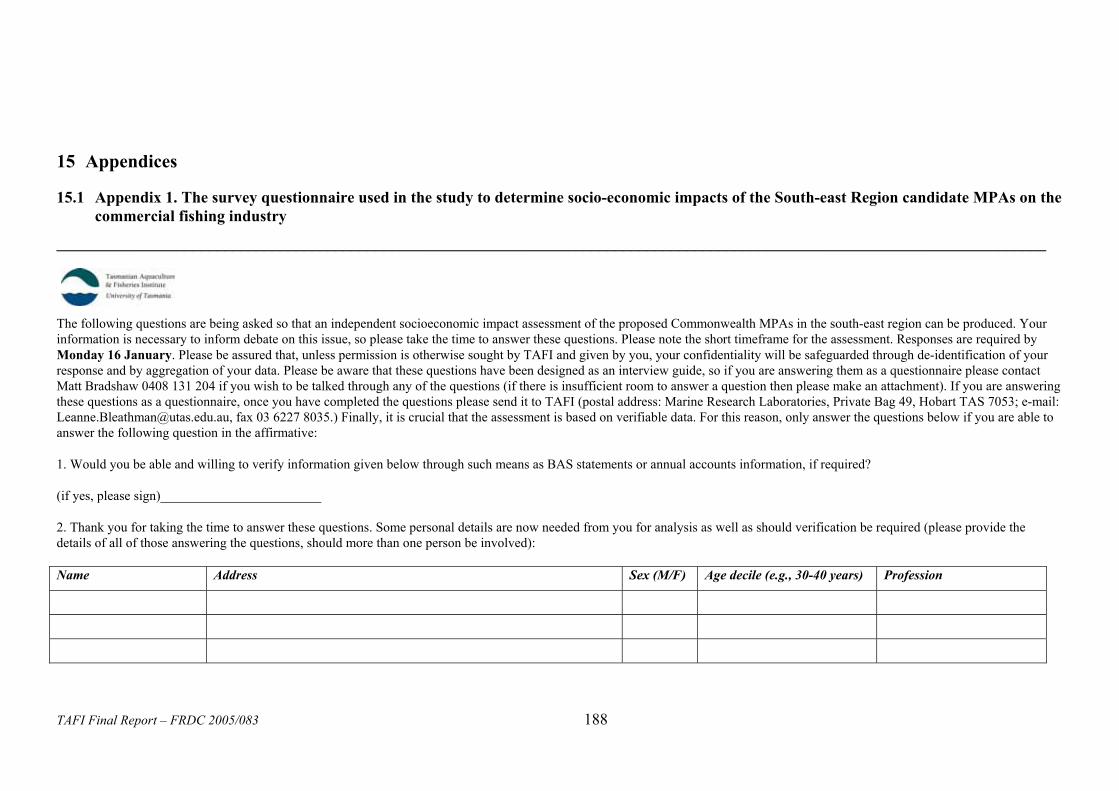
TAFI Final Report – FRDC 2005/083 188
15 Appendices
15.1 Appendix 1. The survey questionnaire used in the study to determine socio-economic impacts of the South-east Region candidate MPAs on the commercial fishing industry
____________________________________________________________________________________________________________________________
The following questions are being asked so that an independent socioeconomic impact assessment of the proposed Commonwealth MPAs in the south-east region can be produced. Your information is necessary to inform debate on this issue, so please take the time to answer these questions. Please note the short timeframe for the assessment. Responses are required by Monday 16 January. Please be assured that, unless permission is otherwise sought by TAFI and given by you, your confidentiality will be safeguarded through de-identification of your response and by aggregation of your data. Please be aware that these questions have been designed as an interview guide, so if you are answering them as a questionnaire please contact Matt Bradshaw 0408 131 204 if you wish to be talked through any of the questions (if there is insufficient room to answer a question then please make an attachment). If you are answering these questions as a questionnaire, once you have completed the questions please send it to TAFI (postal address: Marine Research Laboratories, Private Bag 49, Hobart TAS 7053; e-mail: [email protected], fax 03 6227 8035.) Finally, it is crucial that the assessment is based on verifiable data. For this reason, only answer the questions below if you are able to answer the following question in the affirmative:
1. Would you be able and willing to verify information given below through such means as BAS statements or annual accounts information, if required?
(if yes, please sign)________________________
2. Thank you for taking the time to answer these questions. Some personal details are now needed from you for analysis as well as should verification be required (please provide the details of all of those answering the questions, should more than one person be involved):
Name Address Sex (M/F) Age decile (e.g., 30-40 years) Profession
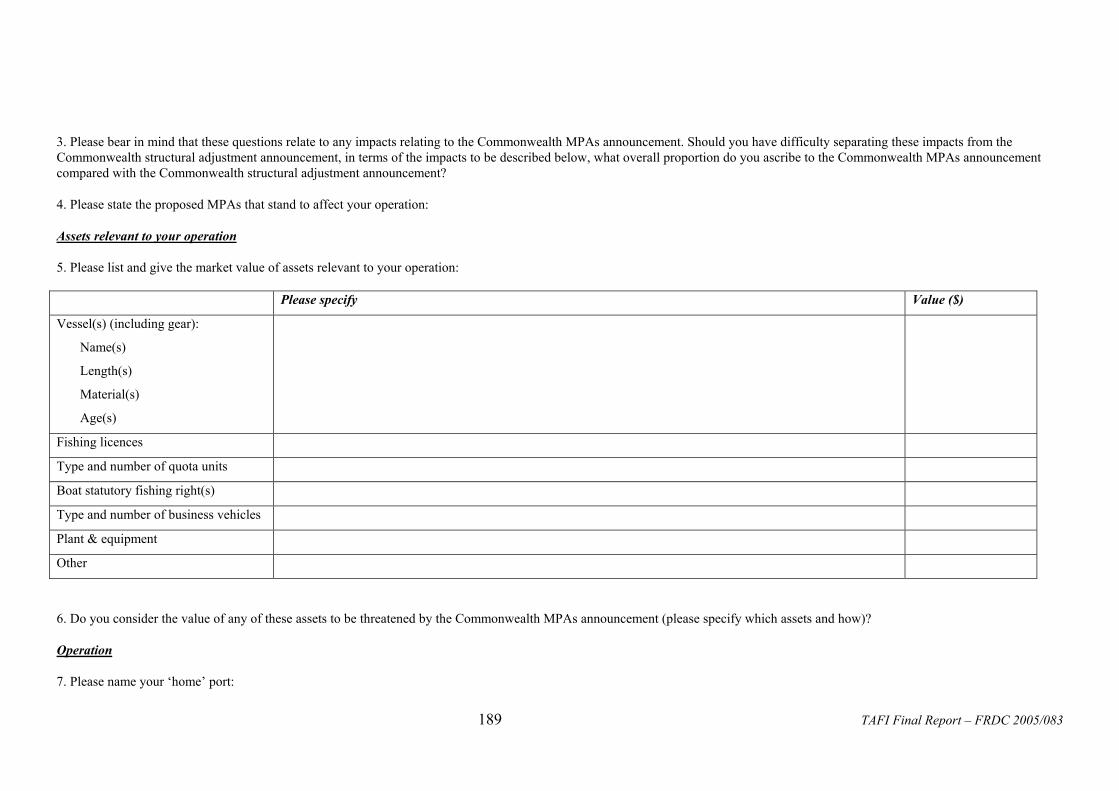
189 TAFI Final Report – FRDC 2005/083
3. Please bear in mind that these questions relate to any impacts relating to the Commonwealth MPAs announcement. Should you have difficulty separating these impacts from the Commonwealth structural adjustment announcement, in terms of the impacts to be described below, what overall proportion do you ascribe to the Commonwealth MPAs announcement compared with the Commonwealth structural adjustment announcement?
4. Please state the proposed MPAs that stand to affect your operation:
Assets relevant to your operation
5. Please list and give the market value of assets relevant to your operation:
Please specify Value ($)
Vessel(s) (including gear):
Name(s)
Length(s)
Material(s)
Age(s)
Fishing licences
Type and number of quota units
Boat statutory fishing right(s)
Type and number of business vehicles
Plant & equipment
Other
6. Do you consider the value of any of these assets to be threatened by the Commonwealth MPAs announcement (please specify which assets and how)?
Operation
7. Please name your ‘home’ port:

TAFI Final Report – FRDC 2005/083 190
8. For the last 12 months of your operation, please complete the following table (only exclude activity outside the Australian south-east fishing region):
Main species retained/processed
Total kg Months of the year fished/received
Type and average amount of gear used (if fishing)
(If a fisher) at which port(s) unloaded (please give proportions)
Sold to (who & where) (please give proportions)
Average $/kg
(If a processor) number vessels bought from, where received & where vessels based
Kg retained in any MPA (from which your type of fishing stands to be excluded)
9. (For fishers): Would you be able and willing to provide personal catch data, with TAFI giving due regard to confidentiality, to be used as part of this assessment (Y/N)?
10. (For fishers): How many days did you fish in the last 12 months?
11. (For fishers): In the last 12 months, how many days did you fish in each proposed MPA from which you stand to be operationally excluded?
12. How does this last 12 months, described in the above table, compare with the previous three-to-five years (please note any change in the above pattern and the reason for any change)?
13. Do you pursue any other occupation unrelated to fishing and, if so, what proportion is it regarding annual time and income?
14. For the last 12 months of your operation, please complete the following table regarding business expenditure:

191 TAFI Final Report – FRDC 2005/083
Item Unit Total expenditure ($)
From whom and where is this business(es) located
Bait Kg
Gear Please specify:
Lease number
Fuel Litres
Fees
Food
Wages/payroll/labour Number employees (please specify full time and other)
Maintenance Please specify:
Accounts
Administration
Plant & equipment Please specify:
Debt servicing Please specify
Other (please specify)
15. What is the daily operating cost of your operation?
16. How does this last 12 months, described in the above table, compare with the previous three-to-five years (please note any change in the above pattern and the reason for any change)?
Intentions

TAFI Final Report – FRDC 2005/083 192
17. What were your intentions regarding your operation prior to the Commonwealth MPAs announcement (please specify any recent operational investments)?
18. What is the break-even income of your operation (daily, trip [how many days] or annual, whichever time period is convenient)?
19. What annual tonnage of which target species do you require for your business to remain viable?
20. Assuming that, without changing your operation, your tonnage stands to be reduced by some amount, what type of response are you considering likely (please complete the relevant section below)?
Response 1: Operate on reduced tonnage (Y/N)
Implication: Do you plan to pursue any cost reductions to offset the reduction (please specify):
Response 2: Make up the reduction from other areas regarding the same species (Y/N)
Implications: please:
specify which areas:
Estimate the cost of the adjustment (e.g., from lower catch rates, additional operating costs):
(please specify)
Estimate the risk of the adjustment regarding a) the operation
b) the quality of the product and
c) the stock(s) concerned

193 TAFI Final Report – FRDC 2005/083
Would this possible response involve a change in either your ‘home’ port or your place of residence (please specify)?
Response 3: Make up the reduction from other species (Y/N)
Implications: please:
Specify which species & where sourced:
Estimate the cost of the adjustment (e.g., accessing quota, new area or type of fishing):
(please specify)
Estimate the risk of the adjustment regarding a) the operation
b) the quality of the product and
c) the stock(s) concerned
Would this possible response involve a change in either your ‘home’ port or your place of residence (Y/N) and, if so, at what cost (please specify)?
Response 4: Downsize your operation, below potential reduction in tonnage, involving significant change in operational structure (Y/N)
Implication: How do you plan to rationalise your operation (please specify):
Response 5: Cease operating (Y/N)
Implication: Do you intend to pursue an alternative activity (please specify):
21. Any other response/implication (please specify)?
Fishery
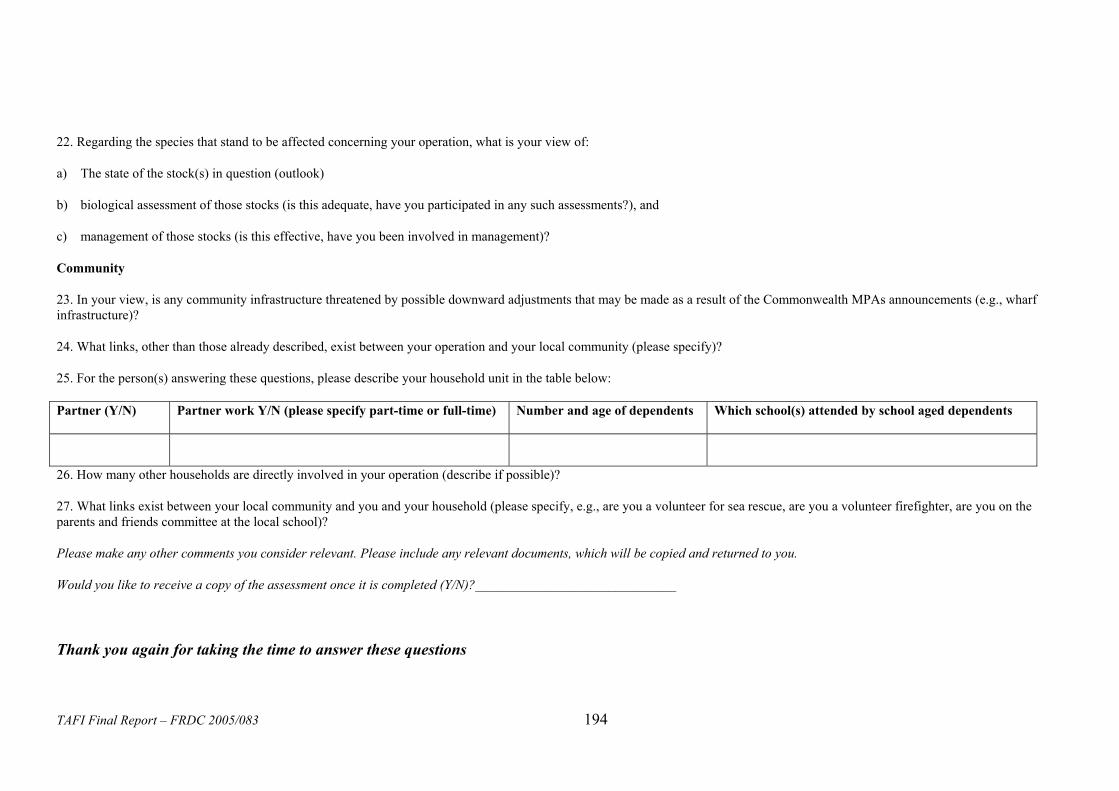
TAFI Final Report – FRDC 2005/083 194
22. Regarding the species that stand to be affected concerning your operation, what is your view of:
a) The state of the stock(s) in question (outlook)
b) biological assessment of those stocks (is this adequate, have you participated in any such assessments?), and
c) management of those stocks (is this effective, have you been involved in management)?
Community
23. In your view, is any community infrastructure threatened by possible downward adjustments that may be made as a result of the Commonwealth MPAs announcements (e.g., wharf infrastructure)?
24. What links, other than those already described, exist between your operation and your local community (please specify)?
25. For the person(s) answering these questions, please describe your household unit in the table below:
Partner (Y/N) Partner work Y/N (please specify part-time or full-time) Number and age of dependents Which school(s) attended by school aged dependents
26. How many other households are directly involved in your operation (describe if possible)?
27. What links exist between your local community and you and your household (please specify, e.g., are you a volunteer for sea rescue, are you a volunteer firefighter, are you on the parents and friends committee at the local school)?
Please make any other comments you consider relevant. Please include any relevant documents, which will be copied and returned to you.
Would you like to receive a copy of the assessment once it is completed (Y/N)?______________________________
Thank you again for taking the time to answer these questions

195 TAFI Final Report – FRDC 2005/083
15.2 Appendix 2: Summary of the DEH Fisheries Risk Assessment No mark – activity does not occur or not considered a foreseeable threat L – low risk for a multiple use MPA (activity likely to be permitted) M – medium risk for a multiple use MPA (activity unlikely to be permitted unless risk can be managed) H – high risk for a multiple use MPA (activity unlikely to be permitted) * Results to be used as guidance for further assessment of risks.
Conservation value Fishing method
01 M
idw
’ter
tr
awl
02 D
anis
h se
ine
03 D
emer
sal
traw
l
04 A
balo
ne
05 C
rab
06 R
’lobs
ter
07 G
illne
t &
mes
hnet
08 P
elag
ic
long
line
09 P
urse
se
ine
10 S
callo
p dr
edge
11 S
quid
jig
12 F
ish
trap
13 R
ec
fishi
ng
14 D
emer
sal
long
line
15 H
ook
(dro
plin
e)
16 A
uto
long
line
Hard bottom habitats – shelf (coastal <25m)
L L L L
Soft bottom habitats – shelf (coastal < 25 m)
L L
Hard bottom habitats – shelf (inner 25-100m)
H6 L L L L L L7
L9
M10
Soft bottom habitats – shelf (inner 25-100m)
L - H8 M – H L L
H11
L
6 Both single trawlers and pair trawlers are considered a high risk. 7 Low risk from droplines. No foreseeable threat from handlines. 8 Low risk in featureless high energy areas. High risk in areas where richer assemblages are know to occur especially at quiescent environments. 9 Low risk where dredge accidentally encounters bottom, ie outside areas encountered in past. 10 Medium risk in existing scallop beds 11 High risk where interaction occurs on soft bottom habitats that support a diverse range of invertebrates and outside of existing scallop beds.

TAFI Final Report – FRDC 2005/083 196
Conservation value Fishing method 01
Mid
w’t
er
traw
l
02 D
anis
h se
ine
03 D
emer
sal
traw
l
04 A
balo
ne
05 C
rab
06 R
’lobs
ter
07 G
illne
t &
mes
hnet
08 P
elag
ic
long
line
09 P
urse
se
ine
10 S
callo
p dr
edge
11 S
quid
jig
12 F
ish
trap
13 R
ec
fishi
ng
14 D
emer
sal
long
line
15 H
ook
(dro
plin
e)
16 A
uto
long
line
L12 Hard bottom habitats – shelf (outer 100-200m)
H L L
M13
L-M L
M – H14
Soft bottom habitats – shelf (outer 100-200m)
M – H
M15
L L L
L16 Hard bottom habitats – slope (upper 200-700m)
M – H L
M17
L L L – M
M – H18
L19 Soft bottom habitats – slope (upper 200-700m)
M20
L
H21
L L
12 Gillnets pose a low risk. Lost gillnets and meshnets also pose a low risk. 13 Meshnets pose a medium risk. 14 Medium to high risk to invertebrates, which occur in patches on sediments. Considerable uncertainty identified 15 Medium risk to unstructured sandy sediments 16 Lost meshnets pose a low risk. 17 Meshnets pose a medium risk. Gillnets do not operate at this depth. 18 Medium to high risk to invertebrates and sensitive habitats. Uncertainty identified 19 Lost meshnets pose a low risk. 20 Medium risk to unstructured sediments 21 Meshnets pose a high risk. Gillnets do not operate at this depth.

197 TAFI Final Report – FRDC 2005/083
Conservation value Fishing method
01 M
idw
’ter
tr
awl
02 D
anis
h se
ine
03 D
emer
sal
traw
l
04 A
balo
ne
05 C
rab
06 R
’lobs
ter
07 G
illne
t &
mes
hnet
08 P
elag
ic
long
line
09 P
urse
se
ine
10 S
callo
p dr
edge
11 S
quid
jig
12 F
ish
trap
13 R
ec
fishi
ng
14 D
emer
sal
long
line
15 H
ook
(dro
plin
e)
16 A
uto
long
line
Hard bottom habitats – slope (mid 700-1500m)
H
Soft bottom habitats – slope (mid 700-1500m)
H L
Hard bottom habitats – slope (seamount 700-1500m)
H L
Soft bottom habitats – slope (seamount 700-1500m)
H
Hard bottom habitats – slope (canyon 100-1500m)
H L L L L L-M L L – M
Soft bottom habitats – slope (canyon 100-1500m)
H L L L L-M L
L22 L23 Seals and sealions* L L L
M24 M25
L L
Whales*
L L
22 Low risk to seals 23 Gillnets and meshnets pose a low risk to seals 24 Medium risk to sealions 25 Gillnets pose a medium risk to sealions
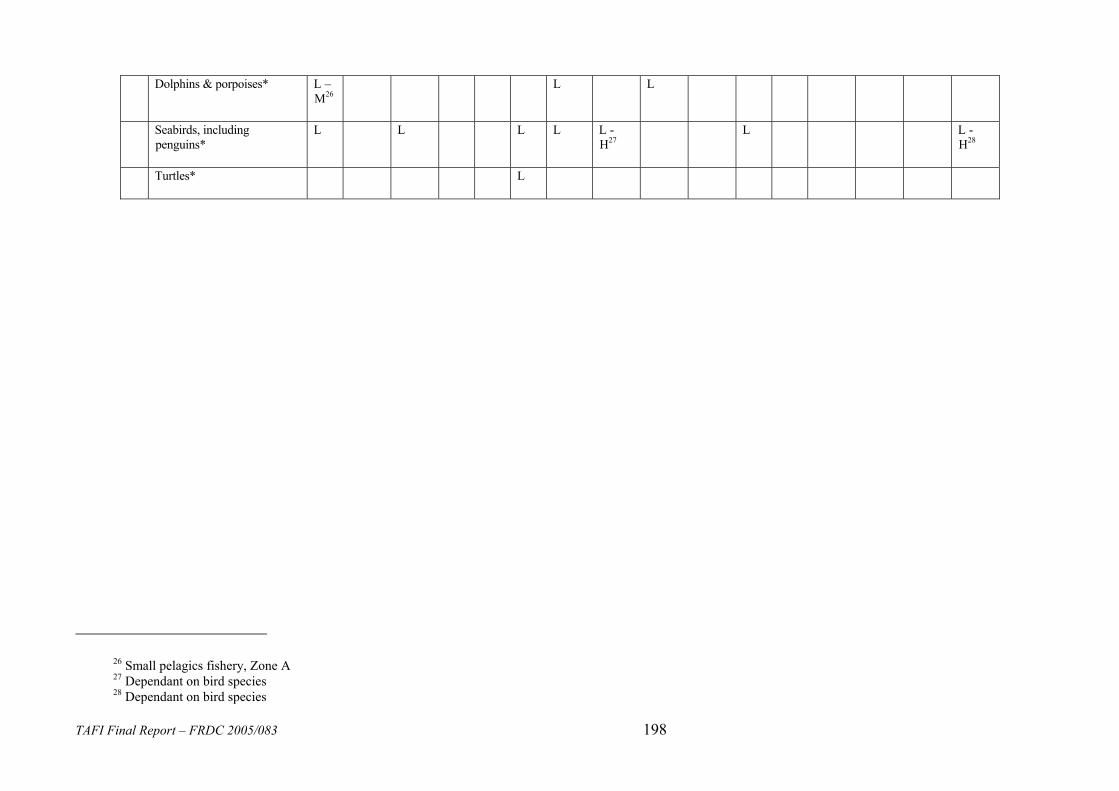
TAFI Final Report – FRDC 2005/083 198
Dolphins & porpoises* L – M26
L L
Seabirds, including penguins*
L L L L L - H27
L L - H28
Turtles* L
26 Small pelagics fishery, Zone A 27 Dependant on bird species 28 Dependant on bird species