supplementary tables s2 s4 s5
TRANSCRIPT

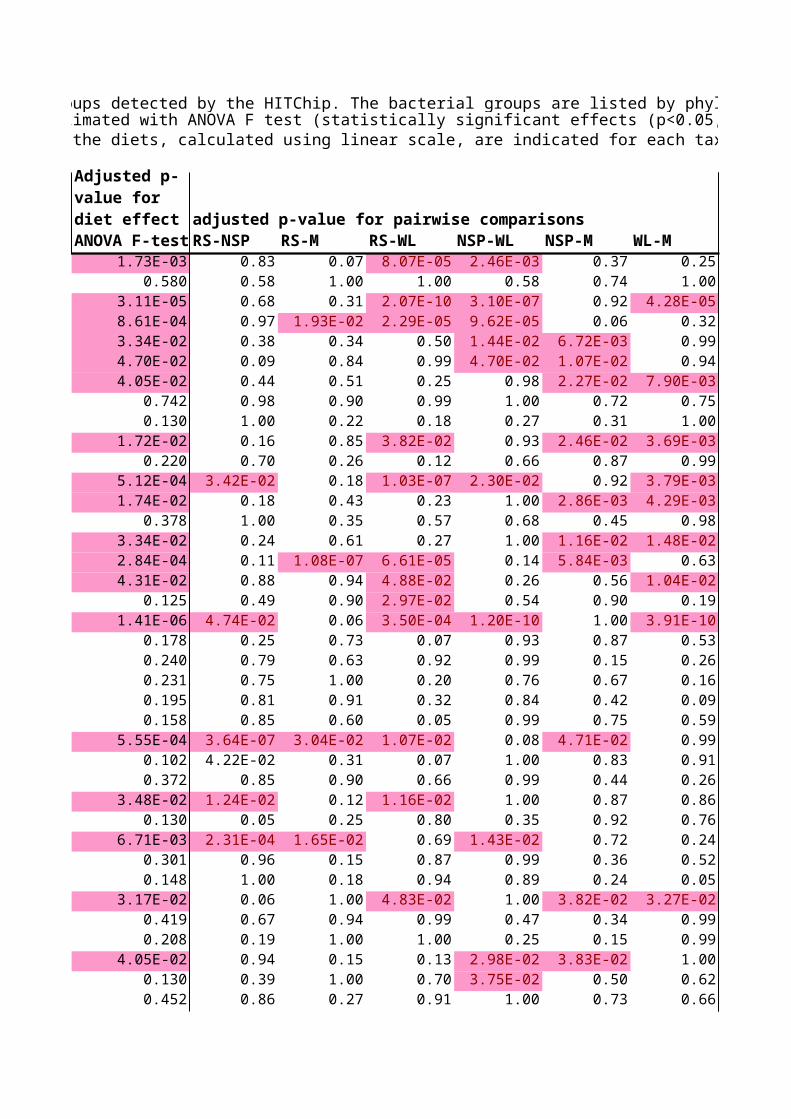
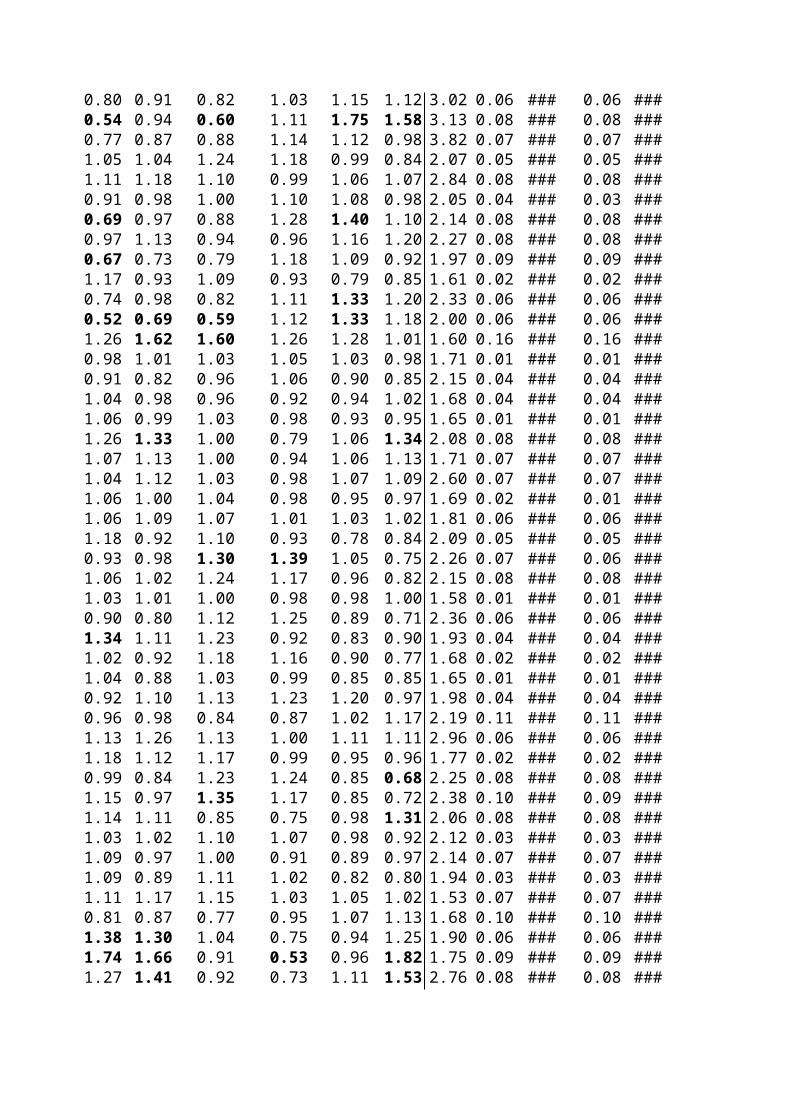
across all samples. Dietary impact on each group was estimated with ANOVA F test (statistically significant effects (p<0.05; 5E-02) are highlighted with red) followed by mixed linear model as detailed in materials and methods. Also the fold changes of the signal intensities between the diets, calculated using linear scale, are indicated for each taxa (1 indicating no change). Changes larger than 30% are bolded.
Phulym/Firmicute groupGenus-like group Share % Actinobacteria Actinomycetaceae 0.05%Actinobacteria Atopobium 0.06%Actinobacteria Bifidobacterium 0.65%Actinobacteria Collinsella 0.23%Actinobacteria Corynebacterium 0.03%Actinobacteria Eggerthella lenta et rel. 0.08%Actinobacteria Micrococcaceae 0.04%Actinobacteria Propionibacterium 0.05%Asteroleplasma Asteroleplasma et rel. 0.03%Bacilli Aerococcus 0.08%Bacilli Aneurinibacillus 0.08%Bacilli Bacillus 0.07%Bacilli Enterococcus 0.06%Bacilli Gemella 0.04%Bacilli Granulicatella 0.21%Bacilli Lactobacillus gasseri et rel. 0.06%Bacilli Lactobacillus plantarum et rel. 0.06%Bacilli Lactobacillus salivarius et rel. 0.06%Bacilli Lactococcus 0.05%Bacilli Staphylococcus 0.05%Bacilli Streptococcus bovis et rel. 0.62%Bacilli Streptococcus intermedius et rel. 0.22%Bacilli Streptococcus mitis et rel. 0.93%Bacilli Weissella et rel. 0.07%Bacteroidetes Allistipes et rel. 1.19%Bacteroidetes Bacteroides fragilis et rel. 1.46%Bacteroidetes Bacteroides intestinalis et rel. 3.05%Bacteroidetes Bacteroides ovatus et rel. 1.19%Bacteroidetes Bacteroides plebeius et rel. 0.59%Bacteroidetes Bacteroides splachnicus et rel. 0.46%Bacteroidetes Bacteroides stercoris et rel. 0.49%Bacteroidetes Bacteroides uniformis et rel. 3.06%Bacteroidetes Bacteroides vulgatus et rel. 14.43%Bacteroidetes Parabacteroides distasonis et rel. 0.63%Bacteroidetes Prevotella melaninogenica et rel. 4.08%Bacteroidetes Prevotella oralis et rel. 0.40%Bacteroidetes Prevotella ruminicola et rel. 0.29%Bacteroidetes Prevotella tannerae et rel. 0.55%
Table S4. Impact of diets on genus-like phylogenetic groups detected by the HITChip. The bacterial groups are listed by phylum or Firmicute subgroup. Share refers to mean percent-wise share of the total hybridization signal for given taxa

Bacteroidetes Tannerella et rel. 0.33%Bacteroidetes Uncultured Bacteroidetes 0.25%Clostridium cluster I Clostridia 0.09%Clostridium cluster IIClostridium stercorarium et rel. 0.12%Clostridium cluster IIClostridium thermocellum et rel. 0.03%Clostridium cluster IVAnaerotruncus colihominis et rel. 0.31%Clostridium cluster IVClostridium cellulosi et rel. 0.80%Clostridium cluster IVClostridium leptum et rel. 1.24%Clostridium cluster IVClostridium orbiscindens et rel. 0.84%Clostridium cluster IVEubacterium siraeum et rel. 0.25%Clostridium cluster IVFaecalibacterium prausnitzii et rel. 10.56%Clostridium cluster IVOscillospira guillermondii et rel. 3.59%Clostridium cluster IVPapillibacter cinnamivorans et rel. 1.42%Clostridium cluster IVRuminococcus bromii et rel. 4.46%Clostridium cluster IVRuminococcus callidus et rel. 0.48%Clostridium cluster IVSporobacter termitidis et rel. 0.69%Clostridium cluster IVSubdoligranulum variable at rel. 1.82%Clostridium cluster IXDialister 0.34%Clostridium cluster IXMegamonas hypermegale et rel. 0.03%Clostridium cluster IXMegasphaera elsdenii et rel. 0.04%Clostridium cluster IXMitsuokella multiacida et rel. 1.23%Clostridium cluster IXPeptococcus niger et rel. 0.08%Clostridium cluster IXPhascolarctobacterium faecium et rel. 0.05%Clostridium cluster IXUncultured Selenomonadaceae 0.62%Clostridium cluster IXVeillonella 0.30%Clostridium cluster XIAnaerovorax odorimutans et rel. 0.17%Clostridium cluster XIClostridium difficile et rel. 0.42%Clostridium cluster XIClostridium felsineum et rel. 0.09%Clostridium cluster XIPeptostreptococcus anaerobius et rel. 0.04%Clostridium cluster XIPeptostreptococcus micros et rel. 0.03%Clostridium cluster XIAnaerostipes caccae et rel. 0.97%Clostridium cluster XIBryantella formatexigens et rel. 0.74%Clostridium cluster XIButyrivibrio crossotus et rel. 0.57%Clostridium cluster XIClostridium colinum et rel. 0.21%Clostridium cluster XIClostridium nexile et rel. 1.05%Clostridium cluster XIClostridium sphenoides et rel. 0.91%Clostridium cluster XIClostridium symbiosum et rel. 1.68%Clostridium cluster XICoprococcus eutactus et rel. 1.37%Clostridium cluster XIDorea formicigenerans et rel. 1.12%Clostridium cluster XIEubacterium hallii et rel. 4.40%Clostridium cluster XIEubacterium rectale et rel. 1.49%Clostridium cluster XIEubacterium ventriosum et rel. 1.26%Clostridium cluster XILachnobacillus bovis et rel. 1.12%Clostridium cluster XILachnospira pectinoschiza et rel. 1.24%Clostridium cluster XIOutgrouping clostridium cluster XIVa 0.60%Clostridium cluster XIRoseburia intestinalis et rel. 4.94%

Clostridium cluster XIRuminococcus gnavus et rel. 0.58%Clostridium cluster XIRuminococcus lactaris et rel. 0.96%Clostridium cluster XIRuminococcus obeum et rel. 2.76%Clostridium cluster XVAnaerofustis 0.11%Clostridium cluster XVEubacterium limosum et rel. 0.12%Clostridium cluster XVBulleidia moorei et rel. 0.07%Clostridium cluster XVEubacterium biforme et rel. 0.25%Clostridium cluster XVEubacterium cylindroides et rel. 0.06%Clostridium cluster XVCatenibacterium mitsuokai et rel. 0.11%Clostridium cluster XVLactobacillus catenaformis et rel. 0.03%Clostridium cluster XVClostridium ramosum et rel. 0.11%Clostridium cluster XVCoprobacillus catenaformis et rel. 0.11%Cyanobacteria Uncultured Chroococcales 0.41%Fusobacteria Fusobacteria 0.03%Proteobacteria Aeromonas 0.05%Proteobacteria Alcaligenes faecalis et rel. 0.05%Proteobacteria Anaerobiospirillum 0.03%Proteobacteria Aquabacterium 0.18%Proteobacteria Bilophila et rel. 0.08%Proteobacteria Burkholderia 0.26%Proteobacteria Campylobacter 0.03%Proteobacteria Desulfovibrio et rel. 0.07%Proteobacteria Enterobacter aerogenes et rel. 0.09%Proteobacteria Escherichia coli et rel. 0.07%Proteobacteria Haemophilus 0.09%Proteobacteria Helicobacter 0.03%Proteobacteria Klebisiella pneumoniae et rel. 0.09%Proteobacteria Leminorella 0.07%Proteobacteria Methylobacterium 0.03%Proteobacteria Moraxellaceae 0.03%Proteobacteria Novosphingobium 0.07%Proteobacteria Oceanospirillum 0.12%Proteobacteria Oxalobacter formigenes et rel. 0.57%Proteobacteria Proteus et rel. 0.04%Proteobacteria Pseudomonas 0.09%Proteobacteria Serratia 0.13%Proteobacteria Sutterella wadsworthia et rel. 0.40%Proteobacteria Vibrio 0.05%Proteobacteria Xanthomonadaceae 0.10%Proteobacteria Yersinia et rel. 0.04%Spirochaetes Brachyspira 0.05%Uncultured ClostridialUncultured Clostridiales I 0.12%Uncultured ClostridialUncultured Clostridiales II 0.12%Uncultured Mollicutes Uncultured Mollicutes 0.13%Verrucomicrobia Akkermansia 0.80%
across all samples. Dietary impact on each group was estimated with ANOVA F test (statistically significant effects (p<0.05; 5E-02) are highlighted with red) followed by mixed linear model as detailed in materials and methods. Also the fold changes of the signal intensities between the diets, calculated using linear scale, are indicated for each taxa (1 indicating no change). Changes larger than 30% are bolded.
adjusted p-value for pairwise comparisonsANOVA F-test RS-NSP RS-M RS-WL NSP-WL NSP-M WL-M
1.73E-03 0.83 0.07 8.07E-05 2.46E-03 0.37 0.250.580 0.58 1.00 1.00 0.58 0.74 1.00
3.11E-05 0.68 0.31 2.07E-10 3.10E-07 0.92 4.28E-058.61E-04 0.97 1.93E-02 2.29E-05 9.62E-05 0.06 0.323.34E-02 0.38 0.34 0.50 1.44E-02 6.72E-03 0.994.70E-02 0.09 0.84 0.99 4.70E-02 1.07E-02 0.944.05E-02 0.44 0.51 0.25 0.98 2.27E-02 7.90E-03
0.742 0.98 0.90 0.99 1.00 0.72 0.750.130 1.00 0.22 0.18 0.27 0.31 1.00
1.72E-02 0.16 0.85 3.82E-02 0.93 2.46E-02 3.69E-030.220 0.70 0.26 0.12 0.66 0.87 0.99
5.12E-04 3.42E-02 0.18 1.03E-07 2.30E-02 0.92 3.79E-031.74E-02 0.18 0.43 0.23 1.00 2.86E-03 4.29E-03
0.378 1.00 0.35 0.57 0.68 0.45 0.983.34E-02 0.24 0.61 0.27 1.00 1.16E-02 1.48E-022.84E-04 0.11 1.08E-07 6.61E-05 0.14 5.84E-03 0.634.31E-02 0.88 0.94 4.88E-02 0.26 0.56 1.04E-02
0.125 0.49 0.90 2.97E-02 0.54 0.90 0.191.41E-06 4.74E-02 0.06 3.50E-04 1.20E-10 1.00 3.91E-10
0.178 0.25 0.73 0.07 0.93 0.87 0.530.240 0.79 0.63 0.92 0.99 0.15 0.260.231 0.75 1.00 0.20 0.76 0.67 0.160.195 0.81 0.91 0.32 0.84 0.42 0.090.158 0.85 0.60 0.05 0.99 0.75 0.59
5.55E-04 3.64E-07 3.04E-02 1.07E-02 0.08 4.71E-02 0.990.102 4.22E-02 0.31 0.07 1.00 0.83 0.910.372 0.85 0.90 0.66 0.99 0.44 0.26
3.48E-02 1.24E-02 0.12 1.16E-02 1.00 0.87 0.860.130 0.05 0.25 0.80 0.35 0.92 0.76
6.71E-03 2.31E-04 1.65E-02 0.69 1.43E-02 0.72 0.240.301 0.96 0.15 0.87 0.99 0.36 0.520.148 1.00 0.18 0.94 0.89 0.24 0.05
3.17E-02 0.06 1.00 4.83E-02 1.00 3.82E-02 3.27E-020.419 0.67 0.94 0.99 0.47 0.34 0.990.208 0.19 1.00 1.00 0.25 0.15 0.99
4.05E-02 0.94 0.15 0.13 2.98E-02 3.83E-02 1.000.130 0.39 1.00 0.70 3.75E-02 0.50 0.620.452 0.86 0.27 0.91 1.00 0.73 0.66
. Impact of diets on genus-like phylogenetic groups detected by the HITChip. The bacterial groups are listed by phylum or Firmicute subgroup. Share refers to mean percent-wise share of the total hybridization signal for given taxa
Adjusted p-value for diet effect

4.12E-02 8.49E-03 0.14 0.06 0.91 0.78 0.990.130 0.07 1.00 0.56 0.67 0.13 0.700.511 0.41 0.57 0.68 0.97 1.00 1.00
2.96E-02 0.45 0.75 0.08 0.81 0.07 4.95E-030.555 0.50 1.00 1.00 0.62 0.60 1.000.079 0.37 0.16 0.94 0.13 0.96 4.17E-02
1.09E-04 9.81E-10 2.91E-02 3.26E-04 0.15 4.83E-03 0.585.59E-05 4.30E-11 2.27E-02 7.13E-04 1.64E-02 8.24E-04 0.792.56E-03 7.65E-05 2.14E-02 0.88 1.85E-03 0.52 0.14
0.765 0.98 0.92 0.98 0.87 0.74 0.990.597 0.58 0.92 1.00 0.67 0.93 0.96
1.53E-04 1.11E-07 6.77E-04 0.17 2.75E-03 0.40 0.267.45E-06 5.73E-11 7.20E-12 1.05E-03 1.86E-02 0.97 5.63E-034.05E-02 1.21E-02 4.83E-02 0.44 0.41 0.98 0.68
0.125 0.27 0.64 3.35E-02 0.81 0.94 0.461.53E-05 3.42E-13 4.94E-04 7.56E-04 1.78E-03 5.19E-03 1.00
0.239 0.28 0.91 0.22 1.00 0.70 0.635.23E-02 0.90 0.19 0.61 0.22 0.55 7.63E-031.28E-02 2.89E-02 0.84 0.16 0.90 2.51E-03 2.26E-02
0.151 0.71 0.94 0.52 0.07 0.97 0.220.171 0.48 0.11 1.00 0.57 0.82 0.150.067 2.52E-02 0.69 1.00 3.92E-02 0.35 0.780.231 0.40 0.15 0.98 0.64 0.94 0.310.079 1.00 0.20 0.75 0.87 0.13 1.72E-020.273 0.98 0.18 0.97 1.00 0.36 0.38
3.83E-03 1.50E-02 2.35E-03 0.99 6.43E-03 0.93 1.01E-030.208 0.09 0.95 0.88 0.37 0.29 1.000.632 0.54 0.87 0.73 0.99 0.95 0.990.419 0.30 0.94 0.54 0.98 0.66 0.88
2.26E-02 1.92E-03 0.83 0.40 0.18 4.02E-02 0.912.36E-04 8.13E-08 3.90E-05 7.41E-03 0.07 0.83 0.421.88E-04 5.51E-08 3.36E-04 4.90E-04 0.32 0.47 1.005.29E-04 8.89E-07 0.26 1.11E-03 0.46 6.68E-03 0.27
0.745 0.71 0.93 1.00 0.84 0.97 0.983.48E-02 5.65E-03 0.37 0.09 0.78 0.38 0.914.25E-03 2.70E-04 1.97E-03 7.51E-03 0.81 0.97 0.971.15E-03 1.32E-04 0.70 1.03E-02 0.68 1.27E-02 0.214.05E-02 7.76E-03 0.07 0.46 0.31 0.90 0.75
0.068 0.05 0.98 0.21 0.93 0.15 0.431.09E-02 9.30E-04 1.88E-02 0.17 0.32 0.87 0.811.84E-02 1.21E-03 0.34 0.87 1.70E-02 0.21 0.795.14E-02 0.70 7.04E-03 0.55 0.99 0.13 0.212.60E-03 2.25E-04 0.08 2.55E-04 1.00 0.33 0.391.84E-04 1.38E-09 7.34E-03 1.42E-03 0.05 2.01E-02 0.98
0.085 2.55E-02 0.70 0.33 0.67 0.34 0.940.085 0.28 0.13 0.98 0.13 0.98 0.06

0.074 2.73E-02 0.71 0.07 0.99 0.35 0.551.44E-02 1.01E-02 0.99 4.65E-02 0.96 2.99E-02 0.11
0.213 0.09 0.59 0.66 0.63 0.73 1.000.302 0.97 0.98 0.19 0.42 1.00 0.400.580 0.75 0.44 0.83 1.00 0.95 0.910.499 0.47 0.99 1.00 0.50 0.72 0.99
4.25E-03 1.87E-04 0.99 0.51 2.76E-02 9.61E-04 0.720.485 0.99 0.71 0.93 0.98 0.56 0.34
1.28E-02 4.96E-04 1.23E-02 0.10 0.34 0.85 0.851.43E-02 4.00E-02 0.59 0.45 0.64 6.39E-04 3.55E-024.05E-02 3.44E-02 1.00 0.27 0.81 0.07 0.398.38E-04 2.87E-05 0.06 9.18E-04 0.85 0.21 0.66
0.125 0.63 0.08 0.08 0.63 0.61 1.000.446 0.89 0.97 0.70 0.27 0.67 0.92
3.43E-02 0.30 3.23E-03 0.88 0.75 0.30 3.25E-020.428 0.79 0.99 0.83 0.29 0.61 0.960.093 0.12 0.95 0.55 0.80 3.46E-02 0.260.250 0.51 0.32 1.00 0.49 0.99 0.310.449 0.88 0.51 1.00 0.88 0.92 0.510.745 0.97 0.70 0.99 1.00 0.91 0.840.278 0.26 1.00 0.66 0.91 0.28 0.670.486 0.68 0.36 0.58 1.00 0.95 0.980.372 0.62 0.95 0.91 0.95 0.30 0.620.204 0.96 1.00 0.27 0.10 0.99 0.220.640 0.99 1.00 0.62 0.82 1.00 0.710.425 0.31 0.99 0.99 0.46 0.52 1.000.136 0.83 0.31 0.80 0.30 0.81 4.56E-02
3.18E-02 3.18E-03 0.63 0.07 0.74 0.13 0.626.71E-03 0.99 0.45 1.74E-02 4.40E-02 0.28 1.05E-044.25E-03 0.75 1.12E-02 0.86 1.00 2.81E-04 5.58E-044.25E-03 0.33 0.27 0.07 1.76E-04 3.03E-03 0.94
0.597 0.99 1.00 0.56 0.75 1.00 0.690.410 0.71 0.23 0.73 1.00 0.83 0.81
2.04E-02 3.18E-03 0.10 9.07E-03 0.99 0.71 0.870.410 1.00 0.83 0.73 0.70 0.86 0.250.555 0.94 1.00 0.59 0.90 0.91 0.54
4.70E-02 0.56 0.73 0.32 1.41E-02 0.99 3.56E-020.119 0.10 0.98 0.07 0.36 0.98 0.190.597 0.74 0.98 1.00 0.72 0.53 0.99
1.52E-02 0.46 0.22 0.27 0.99 4.79E-03 1.23E-030.486 0.70 0.43 0.53 0.99 0.97 1.000.446 0.53 0.81 0.33 0.99 0.97 0.87
2.56E-03 4.72E-04 8.75E-03 0.96 2.73E-03 0.90 3.54E-022.76E-02 0.07 0.12 0.98 2.19E-02 1.00 4.55E-02
0.158 0.54 0.24 0.97 0.28 0.94 0.09

across all samples. Dietary impact on each group was estimated with ANOVA F test (statistically significant effects (p<0.05; 5E-02) are highlighted with red) followed by mixed linear model as detailed in materials and methods. Also the fold changes of the signal intensities between the diets, calculated using linear scale, are indicated for each taxa (1 indicating no change). Changes larger than 30% are bolded.
Fold change in abundance RS-NS RS-M RS-WL NSP-WL NSP-M WL-M M M sd NSP NSP sd RS1.07 1.24 1.45 1.35 1.15 0.85 1.81 0.03 ### 0.03 ###0.89 0.98 1.00 1.13 1.10 0.98 1.79 0.04 ### 0.04 ###1.19 1.32 2.76 2.32 1.11 0.48 2.14 0.13 ### 0.13 ###1.04 1.30 1.51 1.46 1.25 0.86 2.13 0.06 ### 0.06 ###0.95 1.05 1.04 1.09 1.10 1.01 1.62 0.01 ### 0.01 ###0.85 1.06 1.02 1.20 1.25 1.04 1.89 0.04 ### 0.04 ###1.08 0.93 1.10 1.02 0.86 0.85 1.80 0.02 ### 0.02 ###0.97 1.07 0.97 1.01 1.10 1.10 1.78 0.03 ### 0.03 ###1.01 1.07 1.07 1.06 1.06 1.00 1.63 0.01 ### 0.01 ###1.35 0.89 1.47 1.09 0.66 0.60 2.26 0.06 ### 0.06 ###1.05 1.08 1.10 1.05 1.03 0.99 2.15 0.03 ### 0.03 ###1.14 1.10 1.30 1.15 0.97 0.85 2.22 0.04 ### 0.04 ###1.18 0.88 1.17 0.99 0.74 0.75 2.04 0.04 ### 0.04 ###0.98 0.83 0.87 0.89 0.85 0.96 1.66 0.04 ### 0.04 ###1.68 0.71 1.65 0.98 0.42 0.43 2.57 0.10 ### 0.10 ###1.13 1.34 1.26 1.12 1.19 1.07 1.81 0.02 ### 0.02 ###1.06 0.95 1.23 1.16 0.90 0.77 1.83 0.04 ### 0.04 ###1.14 1.07 1.29 1.13 0.94 0.83 1.90 0.05 ### 0.05 ###1.30 1.30 0.66 0.51 1.00 1.96 1.76 0.05 ### 0.05 ###1.10 1.05 1.13 1.03 0.96 0.93 1.97 0.03 ### 0.03 ###0.93 1.10 0.95 1.02 1.19 1.16 2.80 0.06 ### 0.06 ###0.91 1.02 0.83 0.91 1.12 1.22 2.34 0.07 ### 0.07 ###0.91 1.08 0.83 0.91 1.19 1.31 2.92 0.09 ### 0.09 ###1.19 1.10 1.21 1.02 0.93 0.91 1.75 0.02 ### 0.02 ###2.53 1.61 1.69 0.67 0.64 0.96 3.03 0.09 ### 0.08 ###1.64 1.39 1.58 0.96 0.85 0.88 2.76 0.11 ### 0.11 ###0.86 1.14 0.81 0.94 1.32 1.40 3.12 0.13 ### 0.13 ###1.86 1.58 1.87 1.00 0.85 0.85 2.70 0.10 ### 0.10 ###1.29 1.21 1.09 0.85 0.94 1.10 2.80 0.08 ### 0.08 ###1.42 1.29 1.10 0.77 0.91 1.18 2.46 0.06 ### 0.05 ###1.07 1.34 1.11 1.04 1.25 1.21 2.80 0.08 ### 0.08 ###1.03 1.46 0.90 0.88 1.42 1.61 3.56 0.12 ### 0.12 ###0.68 1.03 0.68 0.99 1.51 1.53 3.16 0.11 ### 0.11 ###1.16 0.93 0.96 0.83 0.80 0.97 2.70 0.05 ### 0.05 ###0.73 1.03 0.98 1.34 1.40 1.05 2.77 0.26 ### 0.26 ###0.94 1.25 1.25 1.33 1.33 1.00 2.62 0.10 ### 0.10 ###0.85 0.98 1.12 1.31 1.16 0.88 2.43 0.09 ### 0.09 ###1.08 1.19 1.06 0.99 1.10 1.12 2.90 0.06 ### 0.06 ###
. Impact of diets on genus-like phylogenetic groups detected by the HITChip. The bacterial groups are listed by phylum or Firmicute subgroup. Share refers to mean percent-wise share of the total hybridization signal for given taxa
Mean log10 signal intensity per diet with sd

1.38 1.25 1.29 0.93 0.91 0.97 2.65 0.06 ### 0.06 ###1.54 1.04 1.26 0.82 0.67 0.82 2.62 0.07 ### 0.07 ###1.30 1.25 1.21 0.93 0.96 1.04 1.99 0.07 ### 0.07 ###0.90 1.07 0.85 0.94 1.19 1.26 2.30 0.04 ### 0.04 ###1.04 1.00 1.01 0.97 0.96 1.00 1.61 0.01 ### 0.01 ###1.21 1.29 0.94 0.77 1.06 1.38 2.56 0.06 ### 0.06 ###2.36 1.48 1.77 0.75 0.63 0.84 3.03 0.07 ### 0.07 ###2.95 1.59 1.85 0.62 0.54 0.86 3.45 0.07 ### 0.06 ###1.29 1.19 1.04 0.81 0.92 1.14 3.17 0.04 ### 0.04 ###0.94 1.12 1.07 1.14 1.20 1.05 2.15 0.09 ### 0.09 ###0.84 0.91 0.98 1.17 1.09 0.93 2.54 0.17 ### 0.17 ###2.43 1.88 1.39 0.57 0.77 1.35 3.33 0.07 ### 0.07 ###0.38 0.35 0.58 1.53 0.94 0.61 3.00 0.06 ### 0.06 ###1.71 1.59 1.30 0.76 0.93 1.22 3.99 0.13 ### 0.13 ###0.79 0.86 0.71 0.89 1.08 1.21 2.50 0.08 ### 0.08 ###2.21 1.54 1.50 0.68 0.70 1.02 2.80 0.06 ### 0.06 ###1.24 1.09 1.26 1.01 0.87 0.86 3.02 0.09 ### 0.09 ###0.90 0.73 1.21 1.34 0.81 0.61 3.07 0.16 ### 0.15 ###1.05 0.99 1.04 0.99 0.94 0.95 1.59 0.01 ### 0.01 ###0.93 0.96 1.09 1.17 1.03 0.88 1.72 0.03 ### 0.03 ###0.69 0.55 0.96 1.40 0.79 0.57 1.74 0.17 ### 0.17 ###1.18 1.07 1.01 0.85 0.91 1.06 2.05 0.03 ### 0.02 ###0.87 0.83 0.97 1.11 0.95 0.86 1.65 0.06 ### 0.06 ###1.07 0.56 1.34 1.25 0.52 0.42 3.05 0.18 ### 0.18 ###0.91 0.62 0.90 0.99 0.68 0.69 2.77 0.13 ### 0.13 ###1.39 1.49 0.97 0.70 1.07 1.54 2.31 0.04 ### 0.04 ###1.61 1.11 1.16 0.72 0.69 0.96 2.82 0.11 ### 0.11 ###1.26 1.15 1.20 0.95 0.91 0.96 2.06 0.07 ### 0.07 ###1.07 1.02 1.05 0.98 0.95 0.97 1.97 0.03 ### 0.03 ###1.07 1.02 1.03 0.96 0.95 0.99 1.60 0.01 ### 0.01 ###0.42 0.48 0.61 1.45 1.14 0.79 3.51 0.07 ### 0.07 ###0.61 0.69 0.71 1.16 1.14 0.98 2.92 0.04 ### 0.04 ###0.51 0.78 0.61 1.21 1.54 1.27 2.95 0.06 ### 0.06 ###0.92 0.95 0.98 1.07 1.04 0.97 2.51 0.04 ### 0.04 ###0.67 0.82 0.76 1.12 1.22 1.09 3.07 0.05 ### 0.05 ###0.60 0.64 0.67 1.12 1.06 0.94 2.98 0.05 ### 0.05 ###0.67 0.90 0.75 1.11 1.34 1.21 3.67 0.06 ### 0.06 ###0.71 0.76 0.85 1.21 1.08 0.90 3.32 0.05 ### 0.05 ###0.77 0.96 0.82 1.07 1.25 1.17 3.31 0.06 ### 0.06 ###0.61 0.68 0.77 1.25 1.11 0.89 3.55 0.06 ### 0.06 ###0.64 0.82 0.91 1.42 1.27 0.89 3.55 0.05 ### 0.05 ###0.83 0.57 0.80 0.96 0.68 0.71 3.40 0.09 ### 0.09 ###0.47 0.64 0.48 1.02 1.37 1.34 3.07 0.07 ### 0.07 ###0.56 0.74 0.71 1.27 1.32 1.04 3.35 0.05 ### 0.05 ###0.74 0.89 0.83 1.13 1.20 1.06 2.65 0.06 ### 0.06 ###0.73 0.68 1.07 1.46 0.93 0.64 4.13 0.09 ### 0.09 ###
0.80 0.91 0.82 1.03 1.15 1.12 3.02 0.06 ### 0.06 ###0.54 0.94 0.60 1.11 1.75 1.58 3.13 0.08 ### 0.08 ###0.77 0.87 0.88 1.14 1.12 0.98 3.82 0.07 ### 0.07 ###1.05 1.04 1.24 1.18 0.99 0.84 2.07 0.05 ### 0.05 ###1.11 1.18 1.10 0.99 1.06 1.07 2.84 0.08 ### 0.08 ###0.91 0.98 1.00 1.10 1.08 0.98 2.05 0.04 ### 0.03 ###0.69 0.97 0.88 1.28 1.40 1.10 2.14 0.08 ### 0.08 ###0.97 1.13 0.94 0.96 1.16 1.20 2.27 0.08 ### 0.08 ###0.67 0.73 0.79 1.18 1.09 0.92 1.97 0.09 ### 0.09 ###1.17 0.93 1.09 0.93 0.79 0.85 1.61 0.02 ### 0.02 ###0.74 0.98 0.82 1.11 1.33 1.20 2.33 0.06 ### 0.06 ###0.52 0.69 0.59 1.12 1.33 1.18 2.00 0.06 ### 0.06 ###1.26 1.62 1.60 1.26 1.28 1.01 1.60 0.16 ### 0.16 ###0.98 1.01 1.03 1.05 1.03 0.98 1.71 0.01 ### 0.01 ###0.91 0.82 0.96 1.06 0.90 0.85 2.15 0.04 ### 0.04 ###1.04 0.98 0.96 0.92 0.94 1.02 1.68 0.04 ### 0.04 ###1.06 0.99 1.03 0.98 0.93 0.95 1.65 0.01 ### 0.01 ###1.26 1.33 1.00 0.79 1.06 1.34 2.08 0.08 ### 0.08 ###1.07 1.13 1.00 0.94 1.06 1.13 1.71 0.07 ### 0.07 ###1.04 1.12 1.03 0.98 1.07 1.09 2.60 0.07 ### 0.07 ###1.06 1.00 1.04 0.98 0.95 0.97 1.69 0.02 ### 0.01 ###1.06 1.09 1.07 1.01 1.03 1.02 1.81 0.06 ### 0.06 ###1.18 0.92 1.10 0.93 0.78 0.84 2.09 0.05 ### 0.05 ###0.93 0.98 1.30 1.39 1.05 0.75 2.26 0.07 ### 0.06 ###1.06 1.02 1.24 1.17 0.96 0.82 2.15 0.08 ### 0.08 ###1.03 1.01 1.00 0.98 0.98 1.00 1.58 0.01 ### 0.01 ###0.90 0.80 1.12 1.25 0.89 0.71 2.36 0.06 ### 0.06 ###1.34 1.11 1.23 0.92 0.83 0.90 1.93 0.04 ### 0.04 ###1.02 0.92 1.18 1.16 0.90 0.77 1.68 0.02 ### 0.02 ###1.04 0.88 1.03 0.99 0.85 0.85 1.65 0.01 ### 0.01 ###0.92 1.10 1.13 1.23 1.20 0.97 1.98 0.04 ### 0.04 ###0.96 0.98 0.84 0.87 1.02 1.17 2.19 0.11 ### 0.11 ###1.13 1.26 1.13 1.00 1.11 1.11 2.96 0.06 ### 0.06 ###1.18 1.12 1.17 0.99 0.95 0.96 1.77 0.02 ### 0.02 ###0.99 0.84 1.23 1.24 0.85 0.68 2.25 0.08 ### 0.08 ###1.15 0.97 1.35 1.17 0.85 0.72 2.38 0.10 ### 0.09 ###1.14 1.11 0.85 0.75 0.98 1.31 2.06 0.08 ### 0.08 ###1.03 1.02 1.10 1.07 0.98 0.92 2.12 0.03 ### 0.03 ###1.09 0.97 1.00 0.91 0.89 0.97 2.14 0.07 ### 0.07 ###1.09 0.89 1.11 1.02 0.82 0.80 1.94 0.03 ### 0.03 ###1.11 1.17 1.15 1.03 1.05 1.02 1.53 0.07 ### 0.07 ###0.81 0.87 0.77 0.95 1.07 1.13 1.68 0.10 ### 0.10 ###1.38 1.30 1.04 0.75 0.94 1.25 1.90 0.06 ### 0.06 ###1.74 1.66 0.91 0.53 0.96 1.82 1.75 0.09 ### 0.09 ###1.27 1.41 0.92 0.73 1.11 1.53 2.76 0.08 ### 0.08 ###

across all samples. Dietary impact on each group was estimated with ANOVA F test (statistically significant effects (p<0.05; 5E-02) are highlighted with red) followed by mixed linear model as detailed in materials and methods. Also the fold changes of the signal intensities between the diets, calculated using linear scale, are indicated for each taxa (1 indicating no change). Changes larger than 30% are bolded.
RS sd WL WL sd0.03 ### 0.030.04 ### 0.040.13 ### 0.130.06 ### 0.060.01 ### 0.010.04 ### 0.040.02 ### 0.020.03 ### 0.030.01 ### 0.010.06 ### 0.060.03 ### 0.030.04 ### 0.040.04 ### 0.040.04 ### 0.040.10 ### 0.100.02 ### 0.020.04 ### 0.040.05 ### 0.050.05 ### 0.050.03 ### 0.030.06 ### 0.060.07 ### 0.070.09 ### 0.090.02 ### 0.020.08 ### 0.080.11 ### 0.110.13 ### 0.130.10 ### 0.100.08 ### 0.080.05 ### 0.050.08 ### 0.080.12 ### 0.120.11 ### 0.110.05 ### 0.050.26 ### 0.260.10 ### 0.100.09 ### 0.090.06 ### 0.06
. Impact of diets on genus-like phylogenetic groups detected by the HITChip. The bacterial groups are listed by phylum or Firmicute subgroup. Share refers to mean percent-wise share of the total hybridization signal for given taxa
signal intensity per diet with sd

0.06 ### 0.060.07 ### 0.070.07 ### 0.070.04 ### 0.040.01 ### 0.010.06 ### 0.060.07 ### 0.070.06 ### 0.060.04 ### 0.040.09 ### 0.090.17 ### 0.170.07 ### 0.070.06 ### 0.060.13 ### 0.130.08 ### 0.080.06 ### 0.060.09 ### 0.090.15 ### 0.150.01 ### 0.010.03 ### 0.030.17 ### 0.170.02 ### 0.020.06 ### 0.060.18 ### 0.180.13 ### 0.130.04 ### 0.040.11 ### 0.110.07 ### 0.070.03 ### 0.030.01 ### 0.010.07 ### 0.070.04 ### 0.040.06 ### 0.060.04 ### 0.040.05 ### 0.050.05 ### 0.050.06 ### 0.060.05 ### 0.050.06 ### 0.060.06 ### 0.060.05 ### 0.050.09 ### 0.090.07 ### 0.070.05 ### 0.050.06 ### 0.060.09 ### 0.09

0.06 ### 0.060.08 ### 0.080.07 ### 0.070.05 ### 0.050.08 ### 0.080.03 ### 0.030.08 ### 0.080.08 ### 0.080.09 ### 0.090.02 ### 0.020.06 ### 0.060.06 ### 0.060.16 ### 0.160.01 ### 0.010.04 ### 0.040.04 ### 0.040.01 ### 0.010.08 ### 0.080.07 ### 0.070.07 ### 0.070.01 ### 0.010.06 ### 0.060.05 ### 0.050.06 ### 0.060.08 ### 0.080.01 ### 0.010.06 ### 0.060.04 ### 0.040.02 ### 0.020.01 ### 0.010.04 ### 0.040.11 ### 0.110.06 ### 0.060.02 ### 0.020.08 ### 0.080.09 ### 0.090.08 ### 0.080.03 ### 0.030.07 ### 0.070.03 ### 0.030.07 ### 0.070.10 ### 0.100.06 ### 0.060.09 ### 0.090.08 ### 0.08

TABLE S2A. Primers used in this study.Target group Primer name Primer sequenceall bacteria
UniF GTGSTGCAYGGYYGTCGTCA universalUniR ACGTCRTCCMCNCCTTCCTC universalRflbr730F GGCGGCYTRCTGGGCTTTClep1240mR ACCTTCCTCCGTTTTGTCAAC cluster IV
R. bromiiRflbr730F GGCGGCYTRCTGGGCTTTRbromR CAACTTTCCCCGAAGGGCACCTA R. bromii Clept1240mF GACTGCCGTTGACAAAACRalbR CCTACAATCCGAACTAAGACTGC R. albus/bicirculans
R. flavefaciens, R. champanellensis, R. callidusClept1240mF GACTGCCGTTGACAAAACRfla+R CCTRCAATCTGAACTGGGACAA R. flavefaciens/champanellensis/callidus
R. champanellensisRumcelmF GWTCAGTCCTTCGGGACACAA R. champanellensisRumcelR TAGCAATTCCGACTTCAT several Firmicutes
References
Bacterial strain
- - - -
Primer specificity1
cluster IV Ruminococcus spp.cluster IV Ruminococcus
cluster IV Ruminococcus
R. albus & R. bicirculans 80/32cluster IV Ruminococcus
cluster IV Ruminococcus
1Where other bacterial groups are also amplified by one of the primers, overall specificity is ensured by the corresponding primer not targeting those groups (e.g. R. bromii primer also targets Paenibacillus, but the corresponding forward primer does not target this group) 2Wegmann U, Louis P, Goesmann A, Henrissat B, Duncan SH, Flint HJ (2013) Complete genome of a new Firmicutes species belonging to the dominant human colonic microbiota (“Ruminococcus bicirculans”) reveals two chromosomes and a selective capacity to utilize plant glucans. Environ Microbiol (online publication)
Chassard C, Delmas E, Robert C, Bernalier-Donadille A (2010) The cellulose-degrading microbial community of the human gut varies according to the presence or absence of methanogens. FEMS Microbiol Ecol 74: 205-213Fuller Z, Louis P, Mihajlovski A, Rungapamestry V, Ratcliffe B, Duncan AJ (2007) Influence of cabbage processing methods and prebiotic manipulation of colonic microflora on glucosinolate breakdown in man. Br J Nutr 98:364-372Ramirez-Farias C, Slezak K, Fuller Z, Duncan A, Holtrop G, Louis P (2009) Effect of inulin on the human gut microbiota: stimulation of Bifidobacterium adolescentis and Faecalibacterium prausnitzii. Br J Nutr 101:541-550Sghir A, Gramet G, Suau A, Rochet V, Pochart P, Dore J (2000) Quantification of bacterial groups within human fecal flora by oligonucleotide probe hybridization. Appl Environ Microbiol 66: 2263-2266
TABLE S2B. Validation of Ruminococcus spp. specific primersLevel of amplification for different target groups and respective primers1
cluster IV Ruminococcus spp.
Rflbr730FClep1240mR
R. bromii
Rflbr730FRbromR
R. albusR. bicirculans
Clept1240mFRalbR
R. flavefaciensR. champanellensis
R. callidus
Clept1240mFRfla+R
Bacteroides thetaiotaomicron VPI-5482

- - - -- - - -- - - -- - - -- - - -- - - -- - - -- - - -- - - -- - - -+ - - -+ + - -+ + - -+ - + -+ - + -+ - - ++ - - +
Bifidobacterium adolescentis DSM 20083Collinsella aerofaciens DSM 3979Eubacterium cylindroides T2-87Ruminococcus obeum A2-162Eubacterium hallii L2-7Eubacterium rectale A1-86Megasphaera elsdenii ATCC 25940Clostridium acetobutylicum DSM 792Faecalibacterium prausnitzii A2-165Oscillibacter valericigenes DSM 18026Eubacterium siraeum 70/3Ruminococcus bromii L2-63Ruminococcus bromii ATCC 27255Ruminococcus albus SY3Ruminococcus bicirculans 80/3Ruminococcus flavefaciens N17Ruminococcus champanellensis 18P131-: >105-fold lower than for target strains; (-): approximately 103-fold lower than for target strain; +: within 10-fold of 107 copies based on respective standard curve

Referenceuniversal Fuller et al., 2007universal Fuller et al., 2007
Ramirez-Farias et al., 2009cluster IV Ramirez-Farias et al., 2009
Ramirez-Farias et al., 2009R. bromii this study
Sghir et al., 2000; modifiedR. albus/bicirculans this study
Sghir et al., 2000; modifiedR. flavefaciens/champanellensis/callidus this studyR. champanellensis Chassard et al., 2010; modifiedseveral Firmicutes Chassard et al., 2010
-
Primer specificity1
cluster IV Ruminococcus spp.
cluster IV Ruminococcus spp.
cluster IV Ruminococcus spp.
cluster IV Ruminococcus spp.
other bacterial groups are also amplified by one of the primers, overall specificity is ensured by the corresponding primer not targeting those but the corresponding forward primer does not target this group)
Wegmann U, Louis P, Goesmann A, Henrissat B, Duncan SH, Flint HJ (2013) Complete genome of a new Firmicutes species belonging to the dominant human colonic microbiota (“Ruminococcus bicirculans”) reveals two chromosomes and a selective capacity to utilize plant glucans. Environ Microbiol (online publication)
Chassard C, Delmas E, Robert C, Bernalier-Donadille A (2010) The cellulose-degrading microbial community of the human gut varies according to the presence
Fuller Z, Louis P, Mihajlovski A, Rungapamestry V, Ratcliffe B, Duncan AJ (2007) Influence of cabbage processing methods and prebiotic manipulation of
Ramirez-Farias C, Slezak K, Fuller Z, Duncan A, Holtrop G, Louis P (2009) Effect of inulin on the human gut microbiota: stimulation of Bifidobacterium adolescentis
Sghir A, Gramet G, Suau A, Rochet V, Pochart P, Dore J (2000) Quantification of bacterial groups within human fecal flora by oligonucleotide probe
Level of amplification for different target groups and respective primers1
R. champanellensis
RumcelmFRumcelR

----------
(-)-----+
-fold lower than for target strain; +: within 10-fold of 107

Table S5A. Effect of diet on faecal short chain fatty acid (SCFA) concentrations (mM) and proportions (%)
abbreviations: SCFAtot Ac Prop Bu Lact Isobu Isoval Val Acp Propp Bup Lactp Isobup Isovalp Valptotal SCFA acetate propionatbutyrate lactate isobutyraisovalerat valerate acetate% propionatbutyrate% lactate% isobutyraisovalerat valerate%
SCFA SCFA%Form Ac Prop Isobu Bu Isoval Val Cap Lact Succ Fum SCFAtot Formp Acp Propp Isobup
M 0.22 77.06 25.56 1.73 24.00 1.36 2.46 0.42 3.58 3.30 0.08 139.77 0.18 55.41 18.11 1.36NSP 0.60 79.29 22.08 1.24 23.40 0.97 1.97 0.30 2.25 8.62 0.10 140.82 0.32 57.11 16.11 1.02RS 1.14 61.91 17.94 1.82 17.09 1.49 2.18 0.94 4.11 1.32 0.16 110.10 1.23 56.48 16.46 1.81WL 0.15 62.22 17.40 1.85 12.72 1.51 2.03 0.43 4.17 1.10 0.09 103.68 0.11 59.60 16.71 1.89
SED 0.665 6.034 2.014 0.179 2.986 0.146 0.185 0.246 0.566 2.86 0.058 10.76 0.655 1.402 0.892 0.151Pvalue 0.435 0.006 0.001 0.004 0.001 0.002 0.053 0.062 0.005 0.042 0.533 0.001 0.303 0.033 0.138 0.000
M vs NSP 0.574 0.714 0.092 0.009 0.842 0.010 0.011 0.643 0.025 0.071 0.657 0.923 0.827 0.233 0.030 0.029M vs RS 0.174 0.016 0.001 0.603 0.026 0.407 0.143 0.041 0.354 0.491 0.171 0.009 0.117 0.449 0.071 0.005M vs WL 0.919 0.019 0.000 0.495 0.001 0.323 0.027 0.981 0.301 0.446 0.823 0.002 0.921 0.005 0.124 0.001NSP vs RS 0.419 0.006 0.046 0.002 0.041 0.001 0.245 0.014 0.002 0.015 0.349 0.007 0.174 0.659 0.696 0.000NSP vs WL 0.507 0.007 0.025 0.001 0.001 0.001 0.713 0.626 0.002 0.012 0.825 0.001 0.751 0.083 0.500 0.000RS vs WL 0.145 0.959 0.790 0.870 0.152 0.871 0.424 0.043 0.912 0.940 0.249 0.555 0.096 0.032 0.775 0.599
Statistical analysis: ANOVA with Diet as treatment effect and with Volunteer as random effect. Mean values not sharing the same letter per column are significantly different (P<0.05).M a a a a a a a bc c
NSP a a b a b b a c dRS b b a b a a b bc abWL b b a b a a b a a
Table S5B.Relationships between faecal SCFA and bacterial populations estimated by qPCR for 14 volunteersData are from all available samples from the final two weeks of the RS and NSP diets and the one week of the M diet. qPCR results are those of Walker et al (2011).
abbreviations:Bact BacteroidetesRoseb Roseburia + E. rectale groupFprau F prausnitziiRum Ruminococci (cl IV)Total16S Total 16S rRNA gene signalBifid_log* Bifidobacterium sppOscil_log* Oscillobacter relatives.
X = bacteria, Y = SCFA
Y=SCFA mM Y=SCFA%slope SCFAtot Ac Prop Bu Lact Isobu Isoval Val Acp Propp Bup Lactp Isobup Isovalp Valp
X=Bacteria% Bact -0.097 -0.190 0.285 -0.168 -0.036 -0.010 -0.010 -0.019 -0.043 0.192 -0.077 -0.033 -0.010 -0.010 -0.015Roseb 0.709 0.673 -0.101 0.297 -0.005 0.007 0.006 0.003 0.064 -0.055 0.127 0.022 0.016 0.011 0.000Fprau 0.470 0.290 0.023 0.077 -0.036 -0.006 -0.005 -0.001 0.123 -0.009 0.056 -0.037 -0.007 -0.007 -0.005Rum -1.560 -0.806 -0.330 -0.365 0.036 0.010 0.009 0.009 0.086 -0.063 -0.088 0.058 0.021 0.018 0.026Total16S 33.012 18.803 6.152 7.659 -1.202 -0.330 -0.321 -0.214 -1.024 0.759 1.778 -1.596 -0.566 -0.489 -0.558Bifid_log* -1.735 -0.068 -0.637 2.362 0.257 0.104 0.114 0.200 0.960 -0.206 1.973 0.138 0.102 0.095 0.187Oscil_log* -3.440 -0.443 -2.712 0.371 1.358 0.404 0.403 0.370 1.261 -1.268 0.479 1.342 0.415 0.382 0.359
Significant slopes are highlighted as follows: slopes for which P<0.01 are highlighted in orange, slopes for which 0.01 < P < 0.05 are highlighted in light orange.

Pvalue SCFAtot Ac Prop Bu Lact Isobu Isoval Val Acp Propp Bup Lactp Isobup Isovalp ValpBact 0.834 0.450 0.005 0.263 0.144 0.211 0.151 0.014 0.487 0.000 0.202 0.194 0.229 0.209 0.022Roseb 0.514 0.242 0.679 0.354 0.934 0.703 0.717 0.878 0.616 0.574 0.318 0.703 0.418 0.498 1.000Fprau 0.448 0.388 0.881 0.708 0.274 0.564 0.597 0.898 0.155 0.888 0.504 0.275 0.522 0.505 0.580Rum 0.003 0.004 0.002 0.010 0.189 0.278 0.249 0.337 0.142 0.156 0.122 0.028 0.016 0.021 0.000Total16S 0.002 0.001 0.005 0.007 0.029 0.072 0.038 0.251 0.380 0.396 0.119 0.002 0.001 0.001 0.000Bifid_log* 0.827 1.000 0.735 0.345 0.536 0.431 0.343 0.143 0.353 0.796 0.048 0.746 0.479 0.456 0.116Oscil_log* 0.773 0.944 0.339 0.921 0.033 0.039 0.022 0.065 0.412 0.283 0.751 0.040 0.057 0.044 0.039
* Bifids, Oscil: %data were logtransformed
Table S5C.Relationships between indicators of host metabolism, microbial metabolites and fecal bacterial populations (qPCR)Data are from all available samples from the final two weeks of the RS and NSP diets and the one week of the M diet. qPCR results are those of Walker et al (2011).
slope InspM HOMAweekGlucose Pvalue InspM HOMA weekGlucoseX=SCFA mM Ac -0.173 -0.006 0.002 Ac 0.505 0.596 0.648
Prop -1.093 -0.042 0.003 Prop 0.110 0.141 0.722Bu -0.032 0.002 0.010 Bu 0.950 0.917 0.175Lact -1.833 -0.047 0.056 Lact 0.516 0.691 0.148Isobu -8.390 -0.277 0.132 Isobu 0.313 0.422 0.252Isoval -4.264 -0.104 0.252 Isoval 0.676 0.805 0.070Val -6.559 -0.153 0.251 Val 0.443 0.669 0.034SCFAtot -0.147 -0.005 0.001 SCFAtot 0.288 0.391 0.544
X=SCFA% Acp 1.733 0.063 -0.014 Acp 0.209 0.275 0.453Propp -1.010 -0.054 -0.005 Propp 0.578 0.478 0.828Bup 1.015 0.053 0.034 Bup 0.465 0.356 0.063Lactp -0.126 -0.010 0.021 Lactp 0.965 0.939 0.592Isobup -1.264 -0.102 0.015 Isobup 0.883 0.775 0.897Isovalp 3.234 0.072 0.092 Isovalp 0.745 0.861 0.496Valp 3.725 0.123 0.111 Valp 0.724 0.781 0.438
X=Bacteria% Bact -0.415 -0.014 -0.001 Bact 0.483 0.560 0.944Roseb -1.948 -0.090 -0.012 Roseb 0.070 0.043 0.394Fprau 0.600 0.025 -0.007 Fprau 0.456 0.463 0.518Rum -0.054 -0.006 -0.006 Rum 0.910 0.773 0.361Bifid_log 22.754 0.724 -0.148 Bifid_log 0.015 0.069 0.234Oscil_log 10.304 0.556 0.194 Oscil_log 0.466 0.347 0.288Total16S 8.487 0.263 -0.044 Total16S 0.364 0.500 0.739
Significant slopes (P < 0.05) are highlighted in light orange.

Bup Isovalp Valp Capp Lactp Succp Fump16.22 1.09 1.83 0.32 2.86 2.56 0.0715.90 0.79 1.50 0.24 1.92 5.03 0.0814.14 1.48 2.06 0.80 4.23 1.10 0.2212.21 1.56 2.03 0.43 4.31 1.05 0.10
1.235 0.131 0.139 0.215 0.474 1.59 0.0790.009 0.000 0.001 0.064 0.000 0.055 0.215
0.796 0.024 0.022 0.724 0.054 0.128 0.8590.101 0.006 0.107 0.032 0.006 0.364 0.0610.002 0.001 0.159 0.607 0.004 0.347 0.6910.163 0.000 0.000 0.014 0.000 0.018 0.0880.005 0.000 0.000 0.387 0.000 0.017 0.8270.127 0.550 0.832 0.096 0.874 0.974 0.134
Statistical analysis: ANOVA with Diet as treatment effect and with Volunteer as random effect. Mean values not sharing the same letter per column are significantly different (P<0.05).ab c a aab d b ab ab a bc a a b
Data are from all available samples from the final two weeks of the RS and NSP diets and the one week of the M diet. qPCR results are those of Walker et al (2011).

Data are from all available samples from the final two weeks of the RS and NSP diets and the one week of the M diet. qPCR results are those of Walker et al (2011).

Table S5D. Fecal SCFA and qPCR data on bacterial populations from the study of Walker et al (2011)[Means of all available samples from the final two weeks of RS, NSP and WL diets, and the single week of the M diet]
%bacteria avg of last two weeks on diet log10(16S) SCFA avg of last two weeks on dietVolunteerDiet Bact Roseb Fprau Rum Bifid Methan Oscil SumBac Total16S Bifid.logOscil.log Form Ac Prop Isobu Bu Isoval Val
11 M 31.94815 14.70875 0.656953 4.281248 0.12089 0.000498 0.105281 51.82177 11.01218 -0.91761 -0.97765 1.067112 64.9796 16.54908 1.358174 20.67183 0.919677 2.01140811 NSP 22.62711 11.05758 0.049984 3.740788 0.306393 0 0.044269 37.82613 11.06063 -0.51372 -1.3539 0.411564 67.48021 16.09581 1.509409 12.84789 1.117046 1.57945511 RS 21.66518 23.50218 0.245995 11.80551 0.063464 0 0.018157 57.30049 10.5659 -1.19747 -1.74097 0 46.51649 13.55386 2.344898 8.673916 1.913101 1.95521411 WL 19.04334 10.82307 0.314722 10.16681 0.02001 0 0.066474 40.43442 10.03027 -1.69876 -1.17735 0 55.74217 15.96721 2.344812 14.42555 2.000521 2.77010412 M 68.61164 3.951475 2.98751 2.150054 0.711348 0.000307 0.238743 78.65107 10.96019 -0.14792 -0.62207 0.839026 86.48917 41.08578 1.09617 17.20286 0.700043 1.08292812 NSP 48.97761 9.411628 8.50768 3.863437 1.45432 0.002774 0.705936 72.92338 11.3515 0.16266 -0.15123 0.151135 72.60487 19.32543 1.021526 17.45453 0.653663 1.28227212 RS 35.32394 7.235091 10.97701 23.97792 1.265503 0.378219 2.314835 81.15614 10.11734 0.102263 0.36452 0.472604 50.97471 16.17802 1.999241 9.889276 1.611647 1.88621412 WL 25.80979 2.840357 6.870106 5.668349 0.334229 0.127401 1.936253 43.58649 10.2892 -0.47596 0.286962 0 53.59268 16.48311 1.597012 10.42626 1.221632 1.90109814 M 31.80023 6.954253 0.199713 0.647739 2.363254 0 0.152256 42.06669 10.90293 0.37351 -0.81743 0.864667 91.9408 31.76085 3.064564 25.93643 1.939797 3.4762514 NSP 31.45845 2.530926 0.709067 0.21582 1.985541 0 0.207501 37.10731 10.57489 0.297879 -0.68298 0 72.9358 21.13601 1.228131 16.8473 0.844936 1.85241514 RS 25.77164 6.155549 0.186324 0.172562 4.88497 0 0.202575 37.37362 10.69087 0.688862 -0.69341 0.498221 36.95711 12.65734 1.443734 7.860139 1.072274 1.45643614 WL 36.45599 2.98736 0.788586 5.514978 0.312851 0 0.599968 46.65973 10.17561 -0.50466 -0.22187 0.211032 56.84738 19.25447 1.655886 14.70585 1.232509 1.98474115 M 22.31313 8.195747 19.34503 5.619772 0.124584 0.248209 0.335739 56.18221 10.65013 -0.90454 -0.474 0.320667 81.26732 20.04915 1.821724 41.83157 1.468455 2.78771915 NSP 10.75645 8.17325 29.9613 6.958755 0.133701 0.041322 0.689066 56.71385 11.43975 -0.87386 -0.16174 0 128.2235 25.37254 1.351453 51.48734 0.863037 2.3772915 RS 18.27408 13.53124 40.03658 22.34008 0.194735 0.149576 0.724792 95.25108 9.987396 -0.71056 -0.13979 0.566374 60.76609 14.4307 1.41924 14.21285 1.034774 1.60699415 WL 24.81219 3.091263 29.17133 8.848917 0.059558 0.307573 2.16637 68.45721 10.53647 -1.22506 0.335733 0 66.80703 17.17153 1.81606 11.73819 1.488194 1.83412916 M 37.11562 3.774772 12.5653 14.90841 0.001573 0.053299 0.690338 69.10932 10.61312 -2.80313 -0.16094 0 72.82953 25.89018 2.020322 15.09588 1.388052 2.38765916 NSP 18.52546 6.420439 16.16723 3.790985 0.002927 0.001012 0.718661 45.62671 11.1611 -2.53361 -0.14348 7.516386 108.3012 31.25887 0.860544 20.90894 0.784309 1.577916 RS 25.17135 6.530081 9.925582 42.13803 0.139573 0.003393 0.980729 84.88874 9.759815 -0.8552 -0.00845 0.408229 62.30391 17.87687 1.347134 13.32473 0.883113 2.14234716 WL 21.26889 3.140117 18.19117 10.2216 0.002815 0.008032 1.061786 53.8944 10.31144 -2.55053 0.026037 1.18773 108.0927 22.83242 2.14162 13.04087 1.582675 1.77618417 M 20.22743 4.709419 32.25293 8.007801 1.174516 0 0.983671 67.35577 11.21149 0.069859 -0.00715 0 61.11144 17.86396 2.297767 20.71698 1.816076 2.49061417 NSP 31.36055 6.694207 21.04916 5.260493 0.109128 0 1.032385 65.50592 10.92159 -0.96206 0.013842 0.296009 41.20519 12.25996 1.039343 8.719666 0.816924 1.03773217 RS 40.28608 2.452136 14.07824 14.30509 0.124949 0 3.254179 74.50067 10.89479 -0.90327 0.512441 10.67824 45.53263 11.78416 1.316315 5.646568 1.03705 1.21673317 WL 40.34981 1.310655 19.50936 5.720037 0.114711 0 1.308931 68.31351 10.37145 -0.94039 0.116917 0.357001 49.65562 11.21402 1.694916 6.566671 1.472168 1.55261618 M 28.76664 15.83044 9.733924 2.169659 2.603314 0.020792 0.798092 59.92287 10.77512 0.415527 -0.09795 0 116.2677 38.91104 1.705064 51.57587 1.151284 3.31898618 NSP 38.01313 7.755789 15.01004 1.061312 1.440318 0.001224 0.208892 63.49071 11.01271 0.158458 -0.68008 0 71.26092 25.29679 0.694108 35.0103 0.418348 1.87416618 RS 34.70322 29.69995 11.48322 1.952992 1.065196 0.00092 0.705487 79.61098 11.38574 0.027429 -0.15151 3.35862 103.2382 33.39807 0.963306 39.08207 0.806247 1.82461418 WL 37.05117 4.667073 10.16561 1.679803 0.058617 0.001029 0.340465 53.96377 10.42636 -1.23198 -0.46793 0.381534 68.84841 22.11984 1.166882 16.9089 0.999434 1.64758619 M 10.49229 3.17126 11.22741 7.115451 4.178355 0.197872 1.498793 37.88143 10.94509 0.621005 0.175742 0 52.02024 17.29916 2.331218 10.95887 2.020305 2.5485419 NSP 16.69351 3.136898 10.77563 4.179496 1.811586 0.045149 0.854217 37.49649 10.35012 0.258059 -0.06843 0 64.20887 18.42803 1.685046 14.98366 1.364572 2.51111319 RS 10.59481 4.440019 12.30372 24.34002 0.504132 0.100084 2.925479 55.20825 9.936503 -0.29746 0.466197 0 54.81897 14.13956 2.220446 8.007679 1.967982 2.49100719 WL 6.666114 1.969377 11.29873 11.28791 2.606151 0.413443 2.585119 36.82685 10.64023 0.416 0.412481 0 44.48196 12.31939 1.507381 9.329847 1.34144 1.77524120 M 7.508249 7.190327 23.39212 16.45172 11.87083 0.42172 0.697053 67.53201 11.10768 1.074481 -0.15673 0 95.24152 20.06173 1.092149 33.80516 0.735851 2.63234820 NSP 10.81801 6.924349 27.35311 8.494621 9.337046 0.276563 0.804316 64.00801 10.00349 0.97021 -0.09457 0 97.60392 19.26544 1.082393 36.4551 0.927733 2.48524120 RS 9.598861 8.250521 18.71768 49.76006 12.23925 0.831583 1.486163 100.8841 9.527605 1.087755 0.172067 0 62.26224 11.15848 1.012627 15.59388 0.83402 2.67689620 WL 7.100387 4.309229 23.54198 20.94915 4.508595 0.741277 1.347173 62.49779 10.68367 0.654041 0.129423 0 51.17563 12.95107 1.808398 12.04949 1.606014 2.07335322 M 35.9122 4.018766 12.47014 10.76788 0.420143 0.016531 2.679603 66.28527 10.80856 -0.3766 0.42807 0 74.41042 28.86828 2.235047 21.78458 1.996634 2.92998722 NSP 27.72538 5.259648 20.33165 14.0612 0.288574 0.123104 3.202918 70.99247 9.972666 -0.53974 0.505546 0 67.34148 18.79116 2.236767 22.03013 1.955487 2.8869522 RS 26.81123 2.803511 9.052953 27.87491 2.388621 0.219673 9.125219 78.27612 9.65947 0.378147 0.960243 0 56.10228 19.02845 3.322466 24.29399 3.159635 3.53228522 WL 17.46905 2.156033 15.89901 17.16617 0.154536 0.343551 5.560236 58.74859 10.7835 -0.81097 0.745093 0 58.01486 13.79685 2.183545 15.53362 2.021993 2.59409923 M 57.45353 0.420429 22.0514 3.704685 1.390416 0.002317 0.412945 85.43572 11.13833 0.143145 -0.38411 0 62.61639 31.63001 0.796622 18.78242 0.943359 2.03589923 NSP 48.39792 1.202683 25.04056 1.105218 2.153842 0.000487 0.277076 78.17779 10.54721 0.333214 -0.5574 0 80.85494 46.48368 0.850995 20.13273 0.895288 1.79405623 RS 53.39743 4.50204 31.07237 2.491998 10.6031 0.000343 2.524513 104.5918 11.04671 1.025433 0.402178 0 66.1337 35.10606 2.086536 14.43768 1.667097 1.85922923 WL 20.41279 0.659978 29.42039 6.204022 0.581971 0.000398 1.038233 58.31778 10.54136 -0.2351 0.016295 0 57.60031 24.15525 1.719995 13.24291 1.206215 1.61905124 M 11.87701 10.52527 1.191071 10.46268 2.370718 0 1.228253 37.655 9.951589 0.37488 0.089288 0 61.56388 17.33248 1.995957 15.94574 1.723548 2.40613924 NSP 12.28314 8.503731 1.221352 3.48923 2.68762 0 1.061386 29.24645 11.05244 0.429368 0.025873 0 105.9834 23.68095 1.349218 41.47556 1.222453 2.24330924 RS 12.87009 17.60597 1.436482 24.70694 1.433269 0 1.098607 59.15136 9.961766 0.156328 0.040842 0 62.18016 14.46556 1.342095 22.08423 0.904843 1.59544124 WL 18.61303 2.712922 1.093524 5.019383 0.339653 0 1.386531 29.16504 10.43413 -0.46896 0.14193 0 55.92328 17.42482 1.843143 12.0202 1.381656 1.88357225 M 24.22722 6.014353 0.002237 0.087394 0.088542 0 0.035919 30.45567 11.08864 -1.05285 -1.44468 0 68.20452 16.85943 0.763481 15.75962 1.018528 1.60696425 NSP 23.62821 5.170604 0.002526 0.046005 0.035772 0 0.079482 28.96259 11.19127 -1.44645 -1.09973 0 57.39539 16.53263 0.928373 9.161022 0.711749 1.94995925 RS 17.8388 11.98934 0.030396 0.648695 0.229953 0 0.304363 31.04155 10.27792 -0.63836 -0.51661 0 64.42505 20.68242 2.307837 18.98215 2.154028 2.84762225 WL 27.69751 1.782392 0.040495 0.897156 0.026451 0 0.52208 30.96608 10.62333 -1.57756 -0.28226 0 72.12959 19.02736 1.831306 10.59029 1.446228 2.02024126 M 5.266608 10.90553 15.24594 5.926546 0.271029 0.010297 1.042938 38.66888 11.52439 -0.56698 0.018259 0 89.85437 33.68092 1.648412 25.86397 1.280698 2.74184626 NSP 17.3809 5.839673 28.3227 2.96622 1.241853 0.086364 1.506929 57.34464 10.58174 0.09407 0.178093 0 74.62609 15.16299 1.480404 20.03411 1.007774 2.07572826 RS 7.065784 15.58369 13.37186 10.04797 1.674699 0.098186 1.905421 49.74762 10.97242 0.223937 0.279991 0 94.53853 16.64456 2.416001 37.14766 1.768434 3.49173426 WL 9.803256 1.681213 7.431986 4.666396 0.457465 0.114557 2.405617 26.56049 10.33478 -0.33964 0.381227 0 72.23316 18.83056 2.642246 17.52596 2.147854 3.05598

avg of last two weeks on diet SCFA% avg of last two weeks on diet metabolites last week on dietCap Lact Succ Fum SCFAtot Formp Acp Propp Isobup Bup Isovalp Valp Capp Lactp Succp Fump InspM HOMA weekGlucose
0 2.018992 2.398791 0.136451 112.1111 0.955978 57.91636 14.88576 1.304776 18.07493 0.901981 1.829976 0 2.087273 1.926239 0.116727 95.22984 3.956521 6.3720 3.355561 0.351428 0.211736 104.9601 0.379745 64.39292 15.49761 1.412456 12.08752 1.04361 1.475721 0 3.13324 0.352492 0.224685 172.8159 6.944432 6.30550 5.55725 0 0.278468 80.79319 0 57.46267 16.83859 2.890807 10.79755 2.366973 2.417295 0 6.910902 0 0.315213 108.7587 3.75231 5.784
0.155927 3.200309 0 0.264298 96.8709 0 57.57802 16.54932 2.46309 14.452 2.110219 2.805426 0.135118 3.586152 0 0.320661 42.4027 1.542656 5.620 1.353388 0 0 149.8494 0.564654 57.62488 27.28678 0.772455 11.50619 0.495885 0.751337 0 0.997823 0 0 116.4468 4.295147 5.6650 0.152265 0 0.079571 112.7253 0.159045 64.34897 17.07502 0.918324 15.53521 0.586909 1.148778 0 0.160234 0 0.067504 102.0846 3.657275 5.5865
0.430269 4.851288 0.264954 0.229302 88.78753 0.57775 57.4674 17.99213 2.313589 11.0668 1.878882 2.081193 0.393765 5.657735 0.313966 0.256795 122.1 4.682602 6.1290.896549 3.314202 0 0.063389 89.49593 0 59.59468 17.5467 2.044664 11.37163 1.609999 2.202062 1.084709 4.479302 0 0.066249 112.957 4.014801 4.981
0 7.121405 0.199111 0.152978 166.4568 0.542701 55.37122 19.2205 1.802082 15.43062 1.141701 2.052532 0 4.154307 0.160798 0.123542 70.36674 2.932876 5.9670 2.632156 0 0.216617 117.6934 0 62.04052 17.88023 1.083274 14.16351 0.746163 1.571647 0 2.328119 0 0.18654 149.7793 5.786532 6.0640 3.427524 0.133151 0.418886 65.92481 0.785308 55.04571 19.49492 2.27484 11.94772 1.714682 2.24312 0 5.517345 0.227288 0.749066 151.8316 5.237892 5.34250 2.854915 0 0.34154 99.08833 0.233181 57.38731 19.40728 1.672901 14.83202 1.246605 2.003742 0 2.862757 0 0.354201 97.75435 3.575803 5.64450 3.97316 0 0.173514 153.6933 0.38862 54.12313 14.28548 1.540498 22.9807 1.215878 1.926301 0 3.368984 0 0.17041 125.5517 5.35852 7.10950 2.20964 0 0 211.8848 0 59.71188 12.7888 0.692105 24.18665 0.423152 1.157615 0 1.039799 0 0 141.9176 5.237287 6.05250 2.5395 0 0 96.57652 0.480468 63.1225 15.48603 1.536717 13.78436 1.127179 1.641534 0 2.82122 0 0 120.5999 4.634011 6.053
0.34266 5.72616 0 0.115754 107.0397 0 62.84398 16.18053 1.710946 10.42181 1.399261 1.6977 0.36042 5.262062 0 0.123296 117.3844 5.328637 7.230.447847 3.956756 0.621171 0.082248 124.7196 0 58.36277 20.22333 1.673897 12.28762 1.165797 1.954431 0.499859 3.311528 0.428969 0.0918 40.23003 1.626774 6.532
0 0.317604 38.05645 0.047136 209.6294 3.634616 52.10697 15.69009 0.435469 9.90681 0.362826 0.798395 0 0.172751 16.87434 0.017732 61.09169 2.595163 6.2541.753471 2.060178 0.467074 0 102.5671 0.379529 60.18351 17.72479 1.407396 12.46341 0.93694 2.146242 1.753656 2.311791 0.692732 0 35.58271 1.337177 5.6640.387581 6.832717 0.415914 0 158.2905 0.771177 68.47656 14.33178 1.318197 8.266797 0.971243 1.107421 0.253932 4.169019 0.333871 0 19.65782 0.873891 6.75
0 4.880187 0 0.306107 111.4831 0 55.90356 15.75402 1.951415 18.30267 1.536666 2.151548 0 4.12183 0 0.278288 120.9402 4.079778 5.50350 2.430642 0 0 67.80547 0.296312 59.72893 18.67855 1.702344 12.49022 1.351472 1.632155 0 4.12001 0 0 120.8569 4.37164 5.667
0.242554 4.535982 0.264913 0 82.25515 12.58229 55.67371 14.40402 1.600251 6.878351 1.262375 1.48066 0.272867 5.501783 0.343688 0 125.1836 4.514395 5.95050.488686 4.692803 1.459244 0.05124 79.20498 0.303675 61.5065 12.70452 2.410197 7.934366 2.133859 2.06441 0.58084 7.354225 2.938929 0.06848 65.89069 2.285855 5.9255
0 3.217866 0.970418 0.063833 217.182 0 54.27625 17.73527 0.855931 22.67721 0.597081 1.507304 0 1.677418 0.631962 0.04157 90.62531 3.423913 6.58850 0 1.195326 0.59305 136.343 0 53.37083 18.93942 0.49826 24.36565 0.30831 1.367014 0 0 0.754695 0.395822 120.8569 4.998048 6.9460 0.283953 0.582502 0 183.5376 2.352908 53.56723 19.61569 0.552376 21.73393 0.506832 1.012281 0 0.215887 0.442871 0 85.11792 3.18656 6.5940 2.068387 0.527163 0 114.6681 0.230938 59.28827 19.79553 1.219732 14.21916 1.044416 1.541348 0 2.280015 0.380586 0 60.75833 2.521026 6.842
1.107887 5.520421 0 0 93.80664 0 55.4168 18.48248 2.488179 11.68121 2.153922 2.717944 1.178662 5.880809 0 0 210.1453 8.119532 6.34951.364577 3.274218 0 0.052987 107.8731 0 59.22906 17.33297 1.752819 12.969 1.452355 2.423782 1.220408 3.588767 0 0.030836 151.8246 5.253247 5.7631.247386 6.015584 0.907689 0.696067 92.51237 0 58.74267 15.18711 2.415226 8.237396 2.154641 2.549314 1.054784 6.659801 1.697395 1.301658 155.6722 5.992526 6.00750.924651 4.115734 0 0 75.79565 0 58.38026 16.18175 1.985377 12.71457 1.767405 2.299645 1.200138 5.47085 0 0 85.70477 3.13243 5.74751.983471 1.625454 0 0 157.1777 0 60.83046 12.87001 0.73965 20.86783 0.499871 1.736174 1.297297 1.158708 0 0 257.781 10.20181 6.14351.430424 1.947224 0 0 161.1975 0 60.79788 12.39563 0.754596 21.4874 0.627838 1.597178 0.908902 1.430569 0 0 205.7074 8.318472 6.5134.588413 1.899806 0.189214 0 100.2156 0 62.43496 11.22649 1.044545 15.12157 0.866132 2.675052 4.498243 1.947842 0.185158 0 219.5419 8.452564 6.21350.821123 4.667371 1.990514 0.221034 89.364 0 57.32284 14.69409 2.07051 13.37394 1.849101 2.359465 0.889791 5.37971 1.806554 0.253997 158.3634 6.187838 6.3275
0 5.20613 0 0 137.4311 0 53.81369 19.65561 1.825275 16.46518 1.649228 2.262907 0 4.328108 0 0 150.1301 7.511427 7.6720 5.523841 0 0 120.7658 0 56.23619 15.67474 1.806966 17.96593 1.569465 2.317974 0 4.428734 0 0 182.6361 9.851044 8.422
0.174894 7.689918 0 0 117.3039 0 49.86686 16.03432 2.814915 18.9378 2.65837 3.043868 0.242989 6.400883 0 0 174.2674 8.452269 7.6360.644304 5.863462 2.626932 0.088427 103.3681 0 56.35143 13.36211 2.243285 14.39343 2.104527 2.556807 0.475514 6.146701 2.280325 0.085875 114.662 5.184507 7.29550.590036 0.87532 11.53881 0 129.8089 0 48.47658 23.30866 0.561306 14.10625 0.797471 1.538776 0.352006 0.522201 10.33674 0 217.1458 8.465579 6.352
0 0.658885 43.49491 0.029181 195.1947 0 41.31872 23.99586 0.440272 10.26383 0.453698 0.915836 0 0.314062 22.28087 0.016847 112.5785 4.356888 5.6410 4.942492 1.571699 0.447113 128.2516 0 52.35364 26.17883 1.764458 11.0325 1.428325 1.509281 0 4.275405 1.096312 0.361245 149.2689 5.734651 5.81650 2.245486 1.03603 0.128185 102.9534 0 56.13706 23.12699 1.716058 12.96064 1.201909 1.60002 0 2.126559 1.003041 0.127717 56.76149 2.184825 6.0330 5.433262 0.378759 0.175652 106.9554 0 57.09609 16.41881 1.894385 14.91836 1.625584 2.252218 0 5.211364 0.447268 0.135924 114.4779 4.98168 6.95650 3.747393 3.609429 0.047203 183.3589 0 57.44574 12.64756 0.704797 23.04539 0.675969 1.17388 0 1.92182 2.361569 0.023282 123.3119 4.98364 6.6630 3.081899 0.898863 0.032704 106.5858 0 59.01468 14.11109 1.343683 18.98297 0.913383 1.527993 0 3.089705 0.980875 0.03562 105.7203 4.443109 6.3980 3.689273 0.347671 0 94.51362 0 59.25199 18.49264 1.968092 12.53663 1.468351 1.990959 0 3.945683 0.345658 0 77.00269 3.068034 6.0535
0.358508 1.668168 27.17716 0 133.4164 0 51.29385 12.73602 0.582707 11.83702 0.761415 1.214216 0.270292 1.258872 20.04561 0 36.62446 1.475408 6.62650 3.049561 33.63991 0.031824 123.4004 0 46.37676 13.27834 0.763624 7.237274 0.586475 1.576602 0 2.617103 27.5325 0.031321 24.58877 0.956132 5.8620 6.301788 13.01423 0.120634 130.8358 0 48.62343 15.81133 1.910781 14.95012 1.799644 2.301376 0 5.25064 9.27959 0.073094 36.22165 1.568204 6.8880 3.808338 6.662355 0 117.5157 0 61.49845 16.54414 1.562593 9.061036 1.22164 1.714947 0 3.134726 5.262467 0 15.92141 0.579544 5.693
1.388696 3.219528 2.976293 0 162.6547 0 55.22025 20.73596 1.013006 15.89239 0.787011 1.685513 0.852574 1.97765 1.835652 0 95.55626 3.969319 6.7871.474052 2.253148 0.319423 0.144935 118.5787 0 62.37953 13.60942 1.26148 16.83077 0.837649 1.789676 1.250712 1.64242 0.23627 0.162073 99.28919 4.206189 6.32854.730779 4.3085 0.154197 0 165.2004 0 57.19234 10.29139 1.493435 22.03299 1.0951 2.158081 2.936036 2.681456 0.119171 0 115.4606 4.842555 6.33851.299621 5.294569 0.360855 0 123.3908 0 58.82542 15.07091 2.097069 14.47074 1.685657 2.428152 1.031595 4.104023 0.286432 0 82.05865 3.195961 5.922

last week on diet