appendix: statistical tables
TRANSCRIPT
Appendix: Statistical Tables
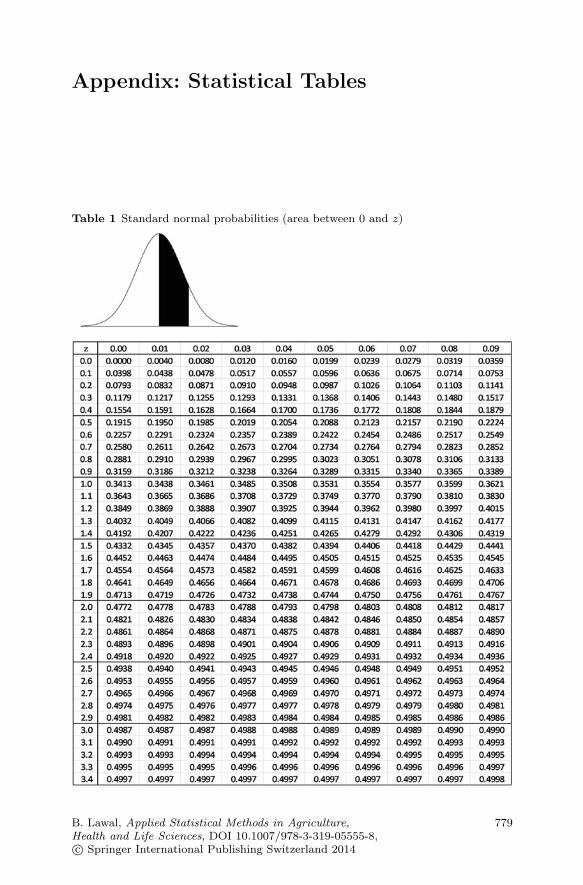
Table 1 Standard normal probabilities (area between 0 and z)
779B. Lawal, Applied Statistical Methods in Agriculture,Health and Life Sciences, DOI 10.1007/978-3-319-05555-8,c© Springer International Publishing Switzerland 2014
780 Appendix: Statistical Tables
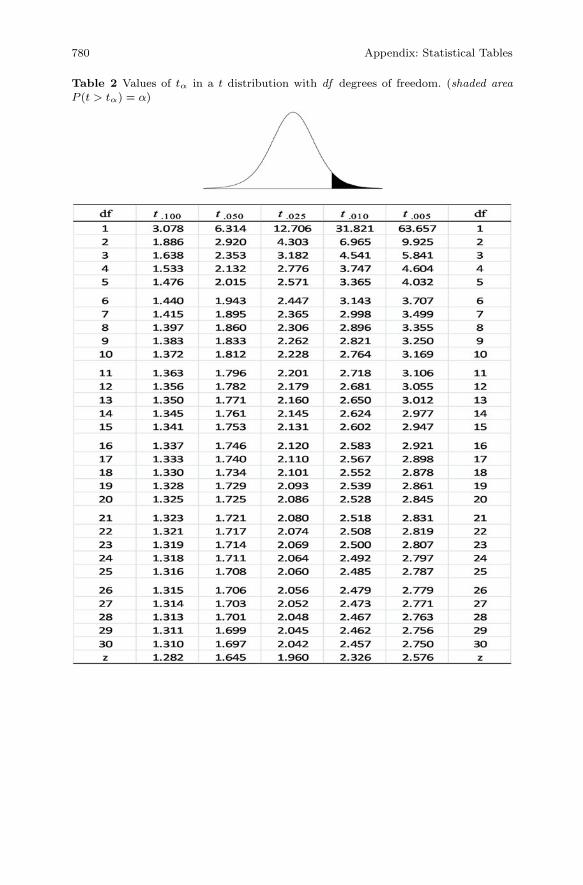
Table 2 Values of tα in a t distribution with df degrees of freedom. (shaded areaP (t > tα) = α)
Appendix: Statistical Tables 781
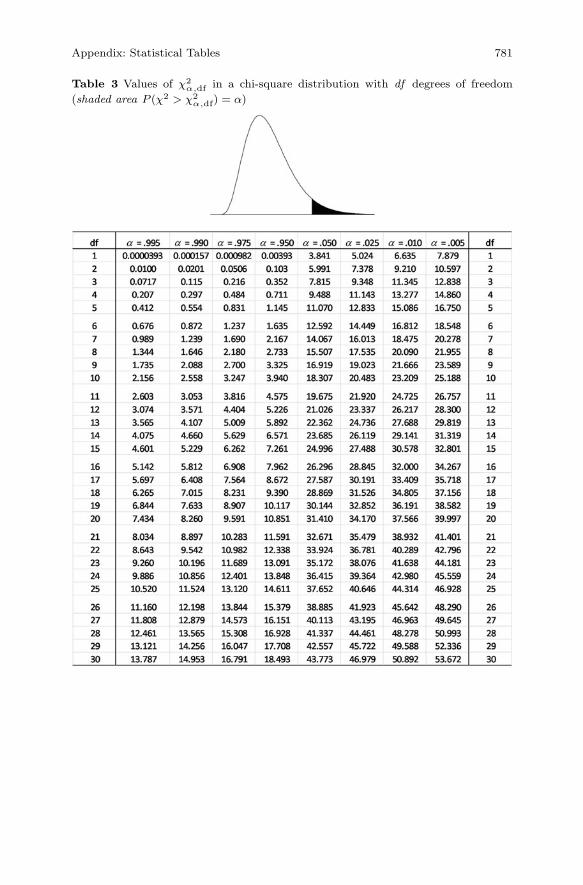
Table 3 Values of χ2α,df in a chi-square distribution with df degrees of freedom
(shaded area P (χ2 > χ2α,df) = α)
782 Appendix: Statistical Tables
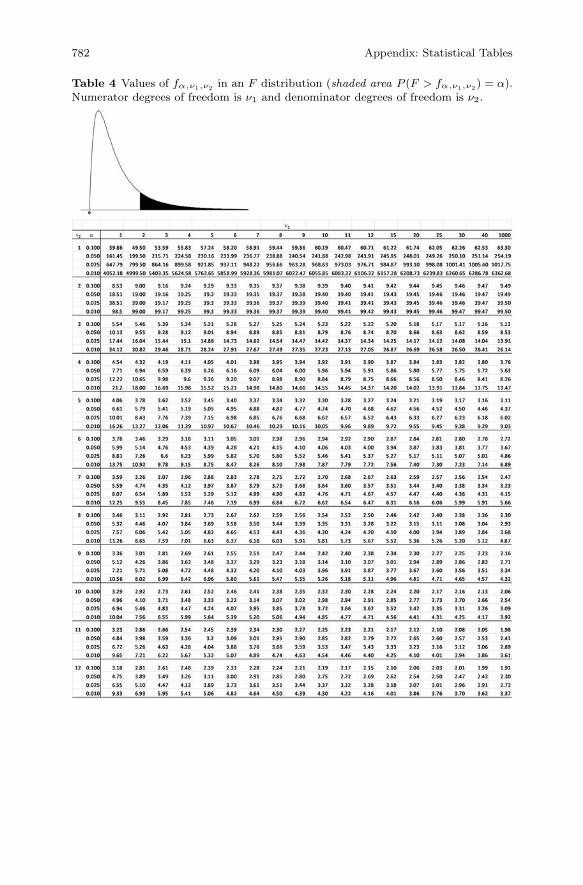
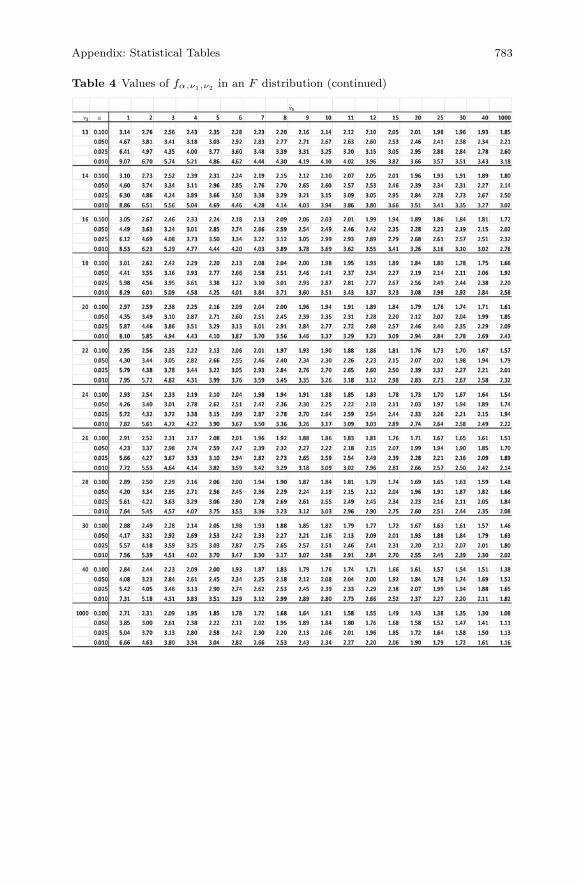
Table 4 Values of fα,ν1,ν2 in an F distribution (shaded area P (F > fα,ν1,ν2) = α).Numerator degrees of freedom is ν1 and denominator degrees of freedom is ν2.
Appendix: Statistical Tables 783
Table 4 Values of fα,ν1,ν2 in an F distribution (continued)
784 Appendix: Statistical Tables
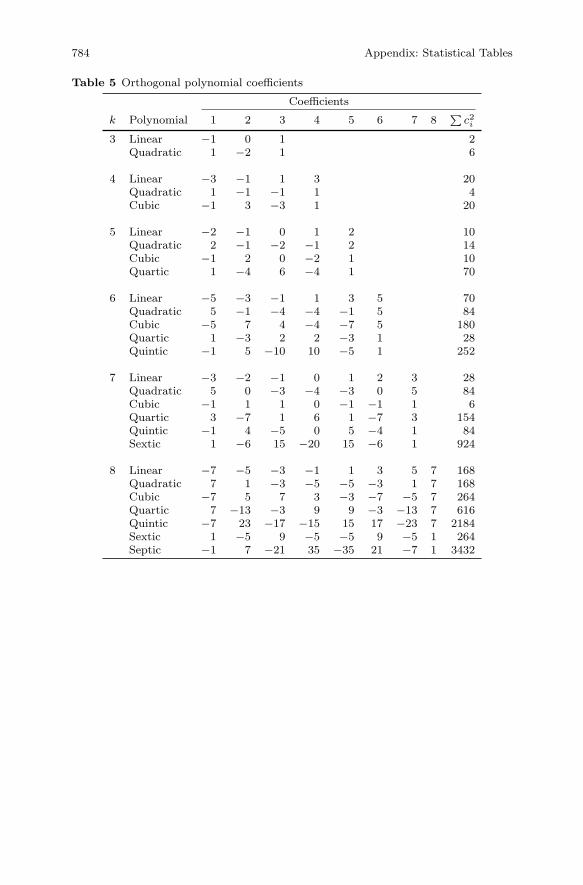
Table 5 Orthogonal polynomial coefficients
Coefficients
k Polynomial 1 2 3 4 5 6 7 8∑
c2i
3 Linear −1 0 1 2Quadratic 1 −2 1 6
4 Linear −3 −1 1 3 20Quadratic 1 −1 −1 1 4Cubic −1 3 −3 1 20
5 Linear −2 −1 0 1 2 10Quadratic 2 −1 −2 −1 2 14Cubic −1 2 0 −2 1 10Quartic 1 −4 6 −4 1 70
6 Linear −5 −3 −1 1 3 5 70Quadratic 5 −1 −4 −4 −1 5 84Cubic −5 7 4 −4 −7 5 180Quartic 1 −3 2 2 −3 1 28Quintic −1 5 −10 10 −5 1 252
7 Linear −3 −2 −1 0 1 2 3 28Quadratic 5 0 −3 −4 −3 0 5 84Cubic −1 1 1 0 −1 −1 1 6Quartic 3 −7 1 6 1 −7 3 154Quintic −1 4 −5 0 5 −4 1 84Sextic 1 −6 15 −20 15 −6 1 924
8 Linear −7 −5 −3 −1 1 3 5 7 168Quadratic 7 1 −3 −5 −5 −3 1 7 168Cubic −7 5 7 3 −3 −7 −5 7 264Quartic 7 −13 −3 9 9 −3 −13 7 616Quintic −7 23 −17 −15 15 17 −23 7 2184Sextic 1 −5 9 −5 −5 9 −5 1 264Septic −1 7 −21 35 −35 21 −7 1 3432
Appendix: Statistical Tables 785
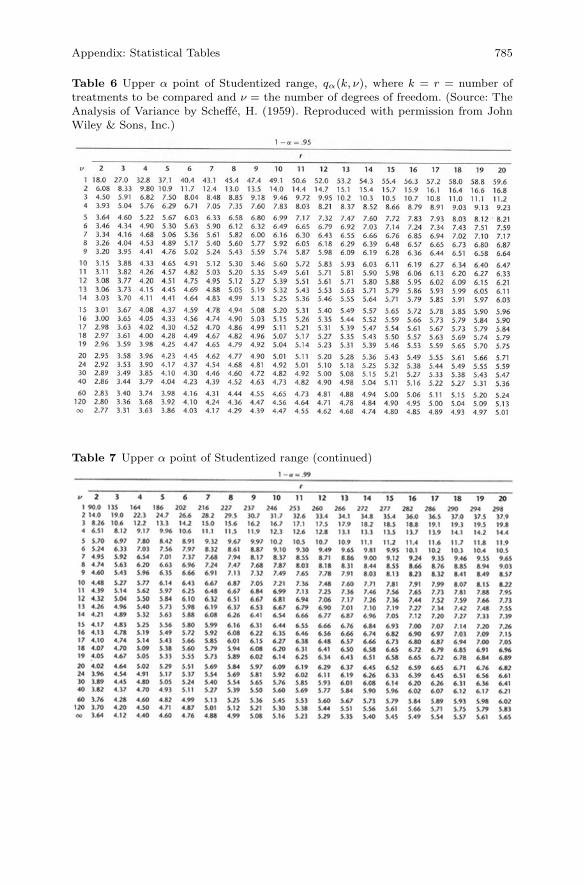
Table 6 Upper α point of Studentized range, qα(k, ν), where k = r = number oftreatments to be compared and ν = the number of degrees of freedom. (Source: TheAnalysis of Variance by Scheffe, H. (1959). Reproduced with permission from JohnWiley & Sons, Inc.)
Table 7 Upper α point of Studentized range (continued)
786 Appendix: Statistical Tables
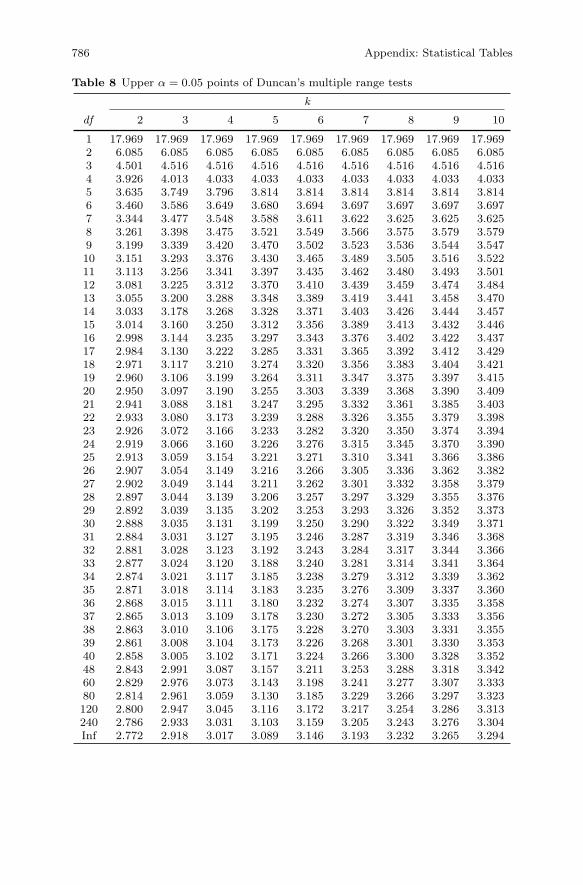
Table 8 Upper α = 0.05 points of Duncan’s multiple range tests
k
df 2 3 4 5 6 7 8 9 10
1 17.969 17.969 17.969 17.969 17.969 17.969 17.969 17.969 17.9692 6.085 6.085 6.085 6.085 6.085 6.085 6.085 6.085 6.0853 4.501 4.516 4.516 4.516 4.516 4.516 4.516 4.516 4.5164 3.926 4.013 4.033 4.033 4.033 4.033 4.033 4.033 4.0335 3.635 3.749 3.796 3.814 3.814 3.814 3.814 3.814 3.8146 3.460 3.586 3.649 3.680 3.694 3.697 3.697 3.697 3.6977 3.344 3.477 3.548 3.588 3.611 3.622 3.625 3.625 3.6258 3.261 3.398 3.475 3.521 3.549 3.566 3.575 3.579 3.5799 3.199 3.339 3.420 3.470 3.502 3.523 3.536 3.544 3.54710 3.151 3.293 3.376 3.430 3.465 3.489 3.505 3.516 3.52211 3.113 3.256 3.341 3.397 3.435 3.462 3.480 3.493 3.50112 3.081 3.225 3.312 3.370 3.410 3.439 3.459 3.474 3.48413 3.055 3.200 3.288 3.348 3.389 3.419 3.441 3.458 3.47014 3.033 3.178 3.268 3.328 3.371 3.403 3.426 3.444 3.45715 3.014 3.160 3.250 3.312 3.356 3.389 3.413 3.432 3.44616 2.998 3.144 3.235 3.297 3.343 3.376 3.402 3.422 3.43717 2.984 3.130 3.222 3.285 3.331 3.365 3.392 3.412 3.42918 2.971 3.117 3.210 3.274 3.320 3.356 3.383 3.404 3.42119 2.960 3.106 3.199 3.264 3.311 3.347 3.375 3.397 3.41520 2.950 3.097 3.190 3.255 3.303 3.339 3.368 3.390 3.40921 2.941 3.088 3.181 3.247 3.295 3.332 3.361 3.385 3.40322 2.933 3.080 3.173 3.239 3.288 3.326 3.355 3.379 3.39823 2.926 3.072 3.166 3.233 3.282 3.320 3.350 3.374 3.39424 2.919 3.066 3.160 3.226 3.276 3.315 3.345 3.370 3.39025 2.913 3.059 3.154 3.221 3.271 3.310 3.341 3.366 3.38626 2.907 3.054 3.149 3.216 3.266 3.305 3.336 3.362 3.38227 2.902 3.049 3.144 3.211 3.262 3.301 3.332 3.358 3.37928 2.897 3.044 3.139 3.206 3.257 3.297 3.329 3.355 3.37629 2.892 3.039 3.135 3.202 3.253 3.293 3.326 3.352 3.37330 2.888 3.035 3.131 3.199 3.250 3.290 3.322 3.349 3.37131 2.884 3.031 3.127 3.195 3.246 3.287 3.319 3.346 3.36832 2.881 3.028 3.123 3.192 3.243 3.284 3.317 3.344 3.36633 2.877 3.024 3.120 3.188 3.240 3.281 3.314 3.341 3.36434 2.874 3.021 3.117 3.185 3.238 3.279 3.312 3.339 3.36235 2.871 3.018 3.114 3.183 3.235 3.276 3.309 3.337 3.36036 2.868 3.015 3.111 3.180 3.232 3.274 3.307 3.335 3.35837 2.865 3.013 3.109 3.178 3.230 3.272 3.305 3.333 3.35638 2.863 3.010 3.106 3.175 3.228 3.270 3.303 3.331 3.35539 2.861 3.008 3.104 3.173 3.226 3.268 3.301 3.330 3.35340 2.858 3.005 3.102 3.171 3.224 3.266 3.300 3.328 3.35248 2.843 2.991 3.087 3.157 3.211 3.253 3.288 3.318 3.34260 2.829 2.976 3.073 3.143 3.198 3.241 3.277 3.307 3.33380 2.814 2.961 3.059 3.130 3.185 3.229 3.266 3.297 3.323120 2.800 2.947 3.045 3.116 3.172 3.217 3.254 3.286 3.313240 2.786 2.933 3.031 3.103 3.159 3.205 3.243 3.276 3.304Inf 2.772 2.918 3.017 3.089 3.146 3.193 3.232 3.265 3.294
Appendix: Statistical Tables 787
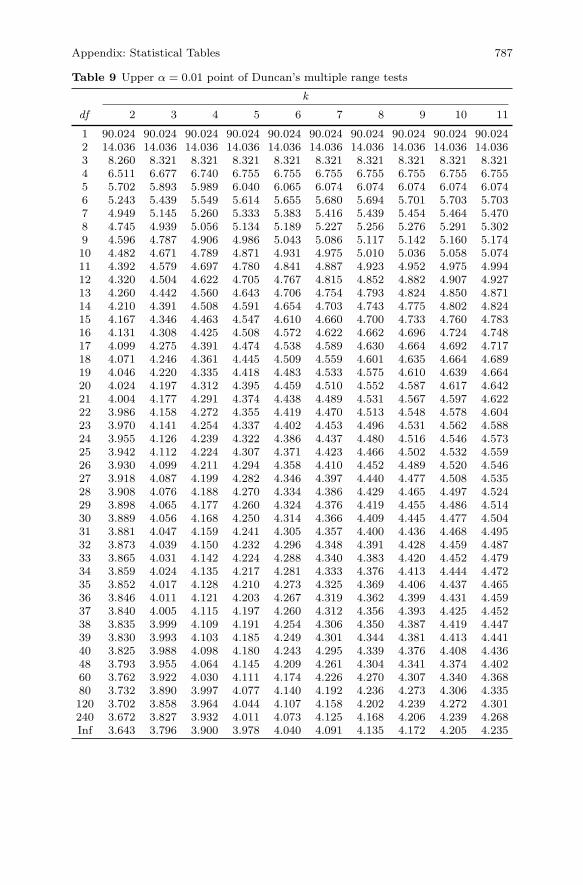
Table 9 Upper α = 0.01 point of Duncan’s multiple range tests
k
df 2 3 4 5 6 7 8 9 10 11
1 90.024 90.024 90.024 90.024 90.024 90.024 90.024 90.024 90.024 90.0242 14.036 14.036 14.036 14.036 14.036 14.036 14.036 14.036 14.036 14.0363 8.260 8.321 8.321 8.321 8.321 8.321 8.321 8.321 8.321 8.3214 6.511 6.677 6.740 6.755 6.755 6.755 6.755 6.755 6.755 6.7555 5.702 5.893 5.989 6.040 6.065 6.074 6.074 6.074 6.074 6.0746 5.243 5.439 5.549 5.614 5.655 5.680 5.694 5.701 5.703 5.7037 4.949 5.145 5.260 5.333 5.383 5.416 5.439 5.454 5.464 5.4708 4.745 4.939 5.056 5.134 5.189 5.227 5.256 5.276 5.291 5.3029 4.596 4.787 4.906 4.986 5.043 5.086 5.117 5.142 5.160 5.17410 4.482 4.671 4.789 4.871 4.931 4.975 5.010 5.036 5.058 5.07411 4.392 4.579 4.697 4.780 4.841 4.887 4.923 4.952 4.975 4.99412 4.320 4.504 4.622 4.705 4.767 4.815 4.852 4.882 4.907 4.92713 4.260 4.442 4.560 4.643 4.706 4.754 4.793 4.824 4.850 4.87114 4.210 4.391 4.508 4.591 4.654 4.703 4.743 4.775 4.802 4.82415 4.167 4.346 4.463 4.547 4.610 4.660 4.700 4.733 4.760 4.78316 4.131 4.308 4.425 4.508 4.572 4.622 4.662 4.696 4.724 4.74817 4.099 4.275 4.391 4.474 4.538 4.589 4.630 4.664 4.692 4.71718 4.071 4.246 4.361 4.445 4.509 4.559 4.601 4.635 4.664 4.68919 4.046 4.220 4.335 4.418 4.483 4.533 4.575 4.610 4.639 4.66420 4.024 4.197 4.312 4.395 4.459 4.510 4.552 4.587 4.617 4.64221 4.004 4.177 4.291 4.374 4.438 4.489 4.531 4.567 4.597 4.62222 3.986 4.158 4.272 4.355 4.419 4.470 4.513 4.548 4.578 4.60423 3.970 4.141 4.254 4.337 4.402 4.453 4.496 4.531 4.562 4.58824 3.955 4.126 4.239 4.322 4.386 4.437 4.480 4.516 4.546 4.57325 3.942 4.112 4.224 4.307 4.371 4.423 4.466 4.502 4.532 4.55926 3.930 4.099 4.211 4.294 4.358 4.410 4.452 4.489 4.520 4.54627 3.918 4.087 4.199 4.282 4.346 4.397 4.440 4.477 4.508 4.53528 3.908 4.076 4.188 4.270 4.334 4.386 4.429 4.465 4.497 4.52429 3.898 4.065 4.177 4.260 4.324 4.376 4.419 4.455 4.486 4.51430 3.889 4.056 4.168 4.250 4.314 4.366 4.409 4.445 4.477 4.50431 3.881 4.047 4.159 4.241 4.305 4.357 4.400 4.436 4.468 4.49532 3.873 4.039 4.150 4.232 4.296 4.348 4.391 4.428 4.459 4.48733 3.865 4.031 4.142 4.224 4.288 4.340 4.383 4.420 4.452 4.47934 3.859 4.024 4.135 4.217 4.281 4.333 4.376 4.413 4.444 4.47235 3.852 4.017 4.128 4.210 4.273 4.325 4.369 4.406 4.437 4.46536 3.846 4.011 4.121 4.203 4.267 4.319 4.362 4.399 4.431 4.45937 3.840 4.005 4.115 4.197 4.260 4.312 4.356 4.393 4.425 4.45238 3.835 3.999 4.109 4.191 4.254 4.306 4.350 4.387 4.419 4.44739 3.830 3.993 4.103 4.185 4.249 4.301 4.344 4.381 4.413 4.44140 3.825 3.988 4.098 4.180 4.243 4.295 4.339 4.376 4.408 4.43648 3.793 3.955 4.064 4.145 4.209 4.261 4.304 4.341 4.374 4.40260 3.762 3.922 4.030 4.111 4.174 4.226 4.270 4.307 4.340 4.36880 3.732 3.890 3.997 4.077 4.140 4.192 4.236 4.273 4.306 4.335120 3.702 3.858 3.964 4.044 4.107 4.158 4.202 4.239 4.272 4.301240 3.672 3.827 3.932 4.011 4.073 4.125 4.168 4.206 4.239 4.268Inf 3.643 3.796 3.900 3.978 4.040 4.091 4.135 4.172 4.205 4.235
Bibliography
Angela M. Dean and Daniel Voss (1999) Design and Analysis of Experiments.Springer, New York.
Armitage, P. and Berry, G. (1985). Statistical Methods in Medical Research. 2ndEdition. Blackwell Scientific Publications. London.
Bates, D. and Watts, D. (1988) Nonlinear Regression Analysis and Its Applications.John Wiley & Sons. Inc. New York, NY.
Bishop, Y. M. M., Fienberg, S. E. and Holland, P. W. (1975). Discrete MultivariateAnalysis. MIT Press.
Blaisdell, E. A. (1993). Statistics in Practice. Saunders College Publishing. FortWorth.
Box, G. E. P. and Cox, D. R. (1964). An analysis of transformations (with discussion).Journal of Royal Statistical Society, Series B, 26: 211–246.
Breslow, N.E., & Day, N.E. (1980). Statistical Methods in Cancer Research. Lyon:International Agency for Research on Cancer.
Brown S., Selvin, S. and Winkelstein, W. J. (1975). The association of economicstatus with the occurrence of lung cancer. Cancer, 36(5):1903–11.
Christensen, R. (1990). Log-Linear Models. Springer-Verlag, New York.Cochran, W.G & Cox, G.M. (1957). Experimental Designs. John Wiley and Sons.
New York.Cox, D. R. (1972). Regression models and life tables (with discussion). J. Roy. Statist.
Soc., B74:187–220.Daniel, W. W. (1999). Biostatistics: A foundation for Analysis in the Health Sciences.
Seventh ed. Wiley. New York.Donald Weber and John H. Skillings (2000). A first course in the Design of
Experiments. A linear Models Approach. CRC Press. Boca Raton.Festing, MWT and Altman, D.G. (2002). Guidelines for the design and Statistical
analysis of experiments using laboratory animals. ILAR J 43 (supp) 000–000Finney, D. (1947). The estimation from individual records of the relationship between
dose and quantal response. Biometrika, 34: 320–334.Goldstein, A. (1965). Biostatistics: An Introductory Text. New York: Macmillan.Gomez, K.A. & Gomez, A.A. (1984) Statistical Procedures for Agricultural Research.
2nd Edition. Wiley & Sons. CanadaGraybill, F. and Iyer, H. (1994). Regression Analysis: concepts and Applications.
Duxbury Press. Belmont, CA.Hastie, T.J. & Tibshirani, R. J. (1990). Generalized Additive Models. Chapman &
hall/CRC monographs. LondonHoshmand A. R. (1994). Experimental Research Design and Analysis: a practical
approach for agricultural and Natural Sciences. CRC Press, Inc., Boca Raton,Florida.
Keppel, G. (1991). Design and Analysis: A Researcher’s Handbook. 3rd ed.Englewood Cliffs: Prentice Hill
789B. Lawal, Applied Statistical Methods in Agriculture,Health and Life Sciences, DOI 10.1007/978-3-319-05555-8,c© Springer International Publishing Switzerland 2014
790 Bibliography
Kuehl, R.O. (1994). Statistical Principles of Research Design and Analysis. DuxburyPress. Belmont, CA.
Kutner, M., Nachtsheim, C., Neter, J., and Li, W. (2005). Applied Linear StatisticalModels. McGraw-Hill & Irwin, New York, NY. Fifth edition.
Lawal, H.B. (1980). Tables of percentage points of Pearson’s goodness-of-fit statisticfor use with small expectations. Appl. Statist., 29, 292–298.
Lawal, H.B. (1989). On the X2 statistic for testing independence in two-waycontingency tables AMSE Review, 12: 37–51.
Lawal, B. (2003). Categorical Data Analysis with SAS and SPSS Applications.Lawrence Erbaum Assoc., New Jersey.
Lawal, H.B., & Upton, G.J.G. (1984). On the use of X2 as a test of independence incontingency tables with small cell expectations. Australian J. Statist., 26, 75–85.
Litchfield, J.T. & Wilcoxon, F. A. (1949). A simplified method of evaluating dose-response Experiments. J. Pharmacol. Exp. Ther., 96(2): 99–113.
Lombard H. L. and Doering C.R. (1947). Treatment of the four-fold table by partialcorrelation as it relates to public health problems. Biometrics, 3: 123–128
Lunneborg, C. E. (1994). Modeling Experimental and Observational Data. Duxbury.Belmont, CA.
Mead, R. & Curnow, R.N. (1983). Statistical Methods in Agriculture and Experimen-tal Biology. Chapman and Hall. London.
Michaelis, L. and Menten, M. (1913). Die kinetik der invertinwirkung. BiochemischeZeitschrift, 49:333–369.
Montgomery, Douglas (2005) Design and Analysis of Experiments. 5th ed. JohnWiley & Sons, New York.
Pagano, M. & Gauvreau, K. (2000). Principles of Biostatistics. 2nd Edition.Duxbury, CA.
Pearce, S. E. (1983). The Agricultural Field Experiment: A Statistical Examinationof Theory and Practice. Chichester, England: John Wiley & Sons.
Rosner, B. (2000). Fundamentals of Biostatistics. 5th Edition. Duxbury. Belmont,CA.
Samuels, M. L. and Witmer, J. A. (1999). Statistics for the Life Sciences. 2nd edition.Prentice Hall. New Jersey.
Schork, M. A. and and Remington, R. D. (2000). Statistics with Applications to theBiological and Health Sciences. Prentice Hall, Englewood Cliffs, NJ.
Sedmak, D., Meineke, T., Knechtges, D., and Anderson, J. (1989). Prognosticsignificance of cytokeratin-positive breast cancer metases. Modern Pathology,2:516–520.
Source: Experimentation in Biology by Ridgman, V.J., pg. 55Steel, R. G.D. & Torrie, J.H. (1960). Principles and Procedures of Statistics.
McGraw-Hill Book Company, New York.Winer, B.J., Brown, D.R., & Michaels, K.M. (1991). Statistical Analysis in
Experimental Design. McGraw-Hill, New York.Woodward, G., Lange, S.W., Nelson, K.W., & Calvert, H.O. (1941). The acute oral
toxicity of acetic, chloracetic, dichloracetic and trichloracetic acids. J. of IndustrialHygience and Toxicology, 23, 78–81.
Wu, C. F. J. and Hamada, Michael, S. (2000). Experiments: Planning, Analysis, andParameter Design Optimization. Wiley, New York.
Yarnold, J.K. (1970). The minimum expectation in χ2 goodness-of-fit tests and theaccuracy of approximations for the null distribution. J. Amer. Statist. Assoc., 65,865–886.
Yates, F. (1934). Contingency tables involving small numbers and the χ2 test. J. R.Statist. Soc., Suppl., 1, 217–235.
Zar, J. H. (1999). Biostatistical Analysis. Prentice Hall, New Jersey. Fourth Edition.The two books at home

Credits
(This page contains an extension of the copyright page.)
We have made every effort to trace the ownership of all copyrighted material and tosecure permission from copyright holders. In the event of any question arising as tothe use of any material, we will be happy to make the necessary correction in futureprintings including e-printing.
791B. Lawal, Applied Statistical Methods in Agriculture,Health and Life Sciences, DOI 10.1007/978-3-319-05555-8,c© Springer International Publishing Switzerland 2014
Index
AAdditivity, 397, 425, 427, 429Aliases, 595, 597, 599, 605Alpha level-α, 147, 171, 179, 358Alternative hypothesis, 134, 135, 142,
154, 205, 340Analysis of Variance Table-Oneway
Regression, 226, 245RCBD, 403
ANOVA, see Analysis of VarianceArray, 11, 38, 39, 45Association, 309
BBalanced incomplete block design, 641
ANOVA table, 644examples, 643parameter equations, 641parameters relationship, 641reduced design, 641statistical model, 642
Bartlett’s homogeneity test, 186, 764Bayes’s Theorem, 74Bias in measurement, 8BIBD construction, 642, 652Binomial distribution, 80, 82
fitting, 327–330Box-Cox transformation, 438
CCalculating factorial interaction
contrasts, 557Case-control studies, 423Categorical variable
nominal, 4, 307ordinal, 307
Censoring, 719
interval censoring, 720left censoring, 720right censoring, 720
Charts, 24bar chart, 25component chart, 28multiple bar chart, 26, 27pie chart, 28, 29
Chi squared distribution, 312degree of freedom, 312table, 781
Classinterval, 13limits, 14
Coefficient of Determination, 241,242, 304
Coefficient of Variation (CV), 50, 51, 635Cohort studies, 348Combination, 62Combined analysis of experiments, 749
over several seasons, 750over several sites, 763over several years, 771
Combining several 2 × 2 contin-gency tables, 315–317, see alsoMantel-Haenzel test
Comparisons of Regressions, 257Completely Randomized Design
(CRD), 355correction factor, 357hypotheses of interest, 369pilot studies, 355
Concordance correlation, 253Conditional probability, 67, 727, 735Confidence difference for two
populations, 123for means (μ1 − μ2), 123
793B. Lawal, Applied Statistical Methods in Agriculture,Health and Life Sciences, DOI 10.1007/978-3-319-05555-8,c© Springer International Publishing Switzerland 2014
794 Index
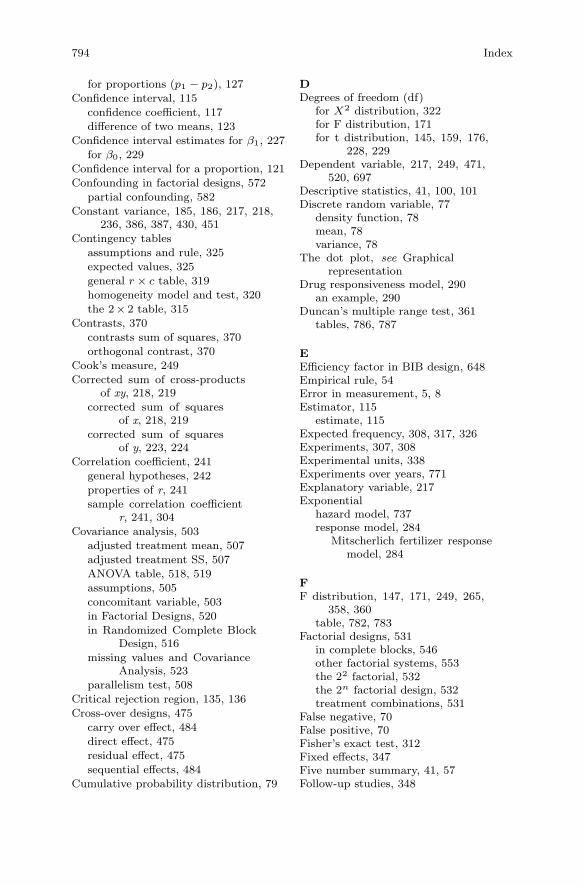
for proportions (p1 − p2), 127Confidence interval, 115
confidence coefficient, 117difference of two means, 123
Confidence interval estimates for β1, 227for β0, 229
Confidence interval for a proportion, 121Confounding in factorial designs, 572
partial confounding, 582Constant variance, 185, 186, 217, 218,
236, 386, 387, 430, 451Contingency tables
assumptions and rule, 325expected values, 325general r × c table, 319homogeneity model and test, 320the 2 × 2 table, 315
Contrasts, 370contrasts sum of squares, 370orthogonal contrast, 370
Cook’s measure, 249Corrected sum of cross-products
of xy, 218, 219corrected sum of squares
of x, 218, 219corrected sum of squares
of y, 223, 224Correlation coefficient, 241
general hypotheses, 242properties of r, 241sample correlation coefficient
r, 241, 304Covariance analysis, 503
adjusted treatment mean, 507adjusted treatment SS, 507ANOVA table, 518, 519assumptions, 505concomitant variable, 503in Factorial Designs, 520in Randomized Complete Block
Design, 516missing values and Covariance
Analysis, 523parallelism test, 508
Critical rejection region, 135, 136Cross-over designs, 475
carry over effect, 484direct effect, 475residual effect, 475sequential effects, 484
Cumulative probability distribution, 79
DDegrees of freedom (df)
for X2 distribution, 322for F distribution, 171for t distribution, 145, 159, 176,
228, 229Dependent variable, 217, 249, 471,
520, 697Descriptive statistics, 41, 100, 101Discrete random variable, 77
density function, 78mean, 78variance, 78
The dot plot, see Graphicalrepresentation
Drug responsiveness model, 290an example, 290
Duncan’s multiple range test, 361tables, 786, 787
EEfficiency factor in BIB design, 648Empirical rule, 54Error in measurement, 5, 8Estimator, 115
estimate, 115Expected frequency, 308, 317, 326Experiments, 307, 308Experimental units, 338Experiments over years, 771Explanatory variable, 217Exponential
hazard model, 737response model, 284
Mitscherlich fertilizer responsemodel, 284
FF distribution, 147, 171, 249, 265,
358, 360table, 782, 783
Factorial designs, 531in complete blocks, 546other factorial systems, 553the 22 factorial, 532the 2n factorial design, 532treatment combinations, 531
False negative, 70False positive, 70Fisher’s exact test, 312Fixed effects, 347Five number summary, 41, 57Follow-up studies, 348
Index 795
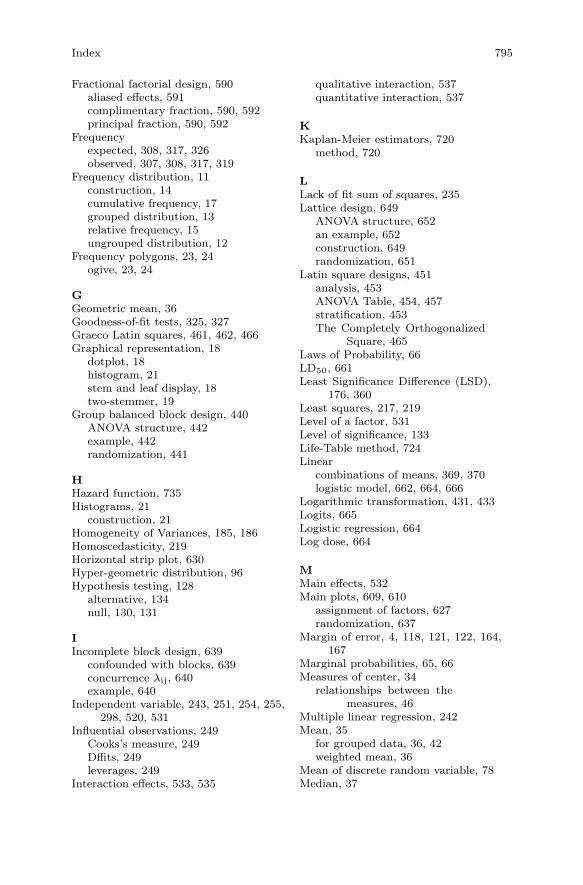
Fractional factorial design, 590aliased effects, 591complimentary fraction, 590, 592principal fraction, 590, 592
Frequencyexpected, 308, 317, 326observed, 307, 308, 317, 319
Frequency distribution, 11construction, 14cumulative frequency, 17grouped distribution, 13relative frequency, 15ungrouped distribution, 12
Frequency polygons, 23, 24ogive, 23, 24
GGeometric mean, 36Goodness-of-fit tests, 325, 327Graeco Latin squares, 461, 462, 466Graphical representation, 18
dotplot, 18histogram, 21stem and leaf display, 18two-stemmer, 19
Group balanced block design, 440ANOVA structure, 442example, 442randomization, 441
HHazard function, 735Histograms, 21
construction, 21Homogeneity of Variances, 185, 186Homoscedasticity, 219Horizontal strip plot, 630Hyper-geometric distribution, 96Hypothesis testing, 128
alternative, 134null, 130, 131
IIncomplete block design, 639
confounded with blocks, 639concurrence λij, 640example, 640
Independent variable, 243, 251, 254, 255,298, 520, 531
Influential observations, 249Cooks’s measure, 249Dffits, 249leverages, 249
Interaction effects, 533, 535
qualitative interaction, 537quantitative interaction, 537
KKaplan-Meier estimators, 720
method, 720
LLack of fit sum of squares, 235Lattice design, 649
ANOVA structure, 652an example, 652construction, 649randomization, 651
Latin square designs, 451analysis, 453ANOVA Table, 454, 457stratification, 453The Completely Orthogonalized
Square, 465Laws of Probability, 66LD50, 661Least Significance Difference (LSD),
176, 360Least squares, 217, 219Level of a factor, 531Level of significance, 133Life-Table method, 724Linear
combinations of means, 369, 370logistic model, 662, 664, 666
Logarithmic transformation, 431, 433Logits, 665Logistic regression, 664Log dose, 664
MMain effects, 532Main plots, 609, 610
assignment of factors, 627randomization, 637
Margin of error, 4, 118, 121, 122, 164,167
Marginal probabilities, 65, 66Measures of center, 34
relationships between themeasures, 46
Multiple linear regression, 242Mean, 35
for grouped data, 36, 42weighted mean, 36
Mean of discrete random variable, 78Median, 37
796 Index
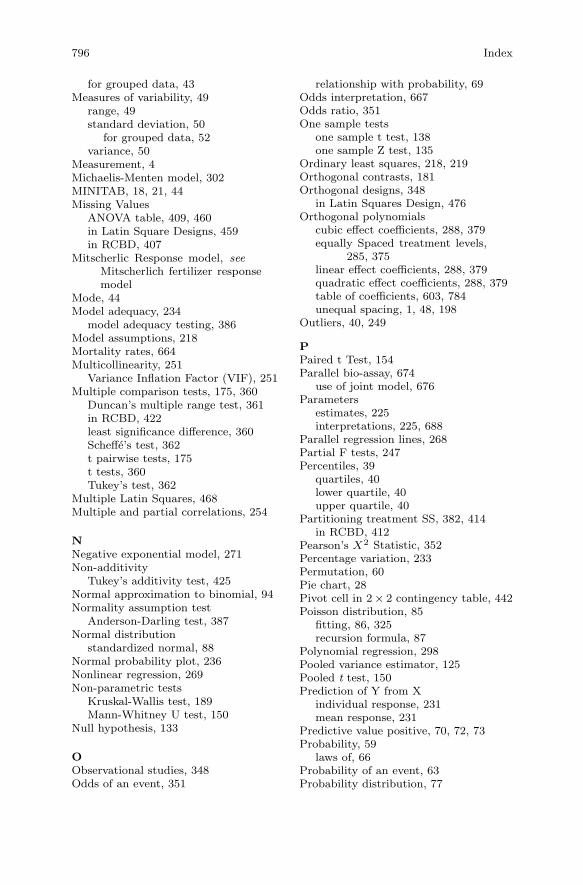
for grouped data, 43Measures of variability, 49
range, 49standard deviation, 50
for grouped data, 52variance, 50
Measurement, 4Michaelis-Menten model, 302MINITAB, 18, 21, 44Missing Values
ANOVA table, 409, 460in Latin Square Designs, 459in RCBD, 407
Mitscherlic Response model, seeMitscherlich fertilizer responsemodel
Mode, 44Model adequacy, 234
model adequacy testing, 386Model assumptions, 218Mortality rates, 664Multicollinearity, 251
Variance Inflation Factor (VIF), 251Multiple comparison tests, 175, 360
Duncan’s multiple range test, 361in RCBD, 422least significance difference, 360Scheffe’s test, 362t pairwise tests, 175t tests, 360Tukey’s test, 362
Multiple Latin Squares, 468Multiple and partial correlations, 254
NNegative exponential model, 271Non-additivity
Tukey’s additivity test, 425Normal approximation to binomial, 94Normality assumption test
Anderson-Darling test, 387Normal distribution
standardized normal, 88Normal probability plot, 236Nonlinear regression, 269Non-parametric tests
Kruskal-Wallis test, 189Mann-Whitney U test, 150
Null hypothesis, 133
OObservational studies, 348Odds of an event, 351
relationship with probability, 69Odds interpretation, 667Odds ratio, 351One sample tests
one sample t test, 138one sample Z test, 135
Ordinary least squares, 218, 219Orthogonal contrasts, 181Orthogonal designs, 348
in Latin Squares Design, 476Orthogonal polynomials
cubic effect coefficients, 288, 379equally Spaced treatment levels,
285, 375linear effect coefficients, 288, 379quadratic effect coefficients, 288, 379table of coefficients, 603, 784unequal spacing, 1, 48, 198
Outliers, 40, 249
PPaired t Test, 154Parallel bio-assay, 674
use of joint model, 676Parameters
estimates, 225interpretations, 225, 688
Parallel regression lines, 268Partial F tests, 247Percentiles, 39
quartiles, 40lower quartile, 40upper quartile, 40
Partitioning treatment SS, 382, 414in RCBD, 412
Pearson’s X2 Statistic, 352Percentage variation, 233Permutation, 60Pie chart, 28Pivot cell in 2 × 2 contingency table, 442Poisson distribution, 85
fitting, 86, 325recursion formula, 87
Polynomial regression, 298Pooled variance estimator, 125Pooled t test, 150Prediction of Y from X
individual response, 231mean response, 231
Predictive value positive, 70, 72, 73Probability, 59
laws of, 66Probability of an event, 63Probability distribution, 77
Index 797
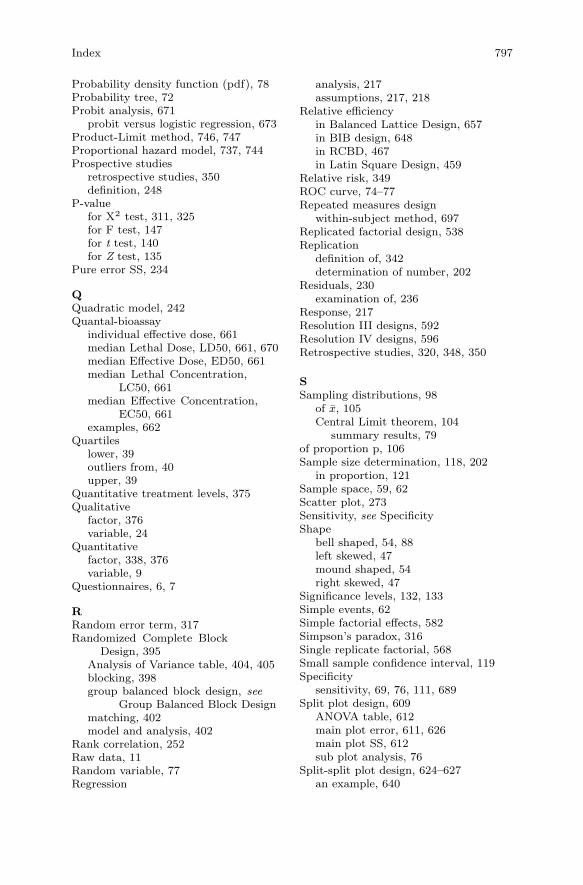
Probability density function (pdf), 78Probability tree, 72Probit analysis, 671
probit versus logistic regression, 673Product-Limit method, 746, 747Proportional hazard model, 737, 744Prospective studies
retrospective studies, 350definition, 248
P-valuefor X2 test, 311, 325for F test, 147for t test, 140for Z test, 135
Pure error SS, 234
QQuadratic model, 242Quantal-bioassay
individual effective dose, 661median Lethal Dose, LD50, 661, 670median Effective Dose, ED50, 661median Lethal Concentration,
LC50, 661median Effective Concentration,
EC50, 661examples, 662
Quartileslower, 39outliers from, 40upper, 39
Quantitative treatment levels, 375Qualitative
factor, 376variable, 24
Quantitativefactor, 338, 376variable, 9
Questionnaires, 6, 7
RRandom error term, 317Randomized Complete Block
Design, 395Analysis of Variance table, 404, 405blocking, 398group balanced block design, see
Group Balanced Block Designmatching, 402model and analysis, 402
Rank correlation, 252Raw data, 11Random variable, 77Regression
analysis, 217assumptions, 217, 218
Relative efficiencyin Balanced Lattice Design, 657in BIB design, 648in RCBD, 467in Latin Square Design, 459
Relative risk, 349ROC curve, 74–77Repeated measures design
within-subject method, 697Replicated factorial design, 538Replication
definition of, 342determination of number, 202
Residuals, 230examination of, 236
Response, 217Resolution III designs, 592Resolution IV designs, 596Retrospective studies, 320, 348, 350
SSampling distributions, 98
of x, 105Central Limit theorem, 104
summary results, 79of proportion p, 106Sample size determination, 118, 202
in proportion, 121Sample space, 59, 62Scatter plot, 273Sensitivity, see SpecificityShape
bell shaped, 54, 88left skewed, 47mound shaped, 54right skewed, 47
Significance levels, 132, 133Simple events, 62Simple factorial effects, 582Simpson’s paradox, 316Single replicate factorial, 568Small sample confidence interval, 119Specificity
sensitivity, 69, 76, 111, 689Split plot design, 609
ANOVA table, 612main plot error, 611, 626main plot SS, 612sub plot analysis, 76
Split-split plot design, 624–627an example, 640
798 Index
design layout, 624structure of ANOVA Table, 629
Square-root transformation, 430Analysis of Variance of, 469
Statistical tables, 777X2, 781Duncan’s multiple range test,
786, 787F distribution, 782, 783orthogonal polynomial
coefficients, 784standard normal, Z, 779t distribution, 780
Strip-plot designan example, 631design layout, 637structure of ANOVA table, 629
Standard Errorsfor the mean x, 166for the proportion p, 168for the difference of two means, 127for the difference of two
proportions, 127Student’s t distribution, 125, 138, 228Summation notation, 55Sums of squares
of contrasts, 415of orthogonal contrasts, 181from orthogonal polynomial
coefficients, 198in Yates’s algorithm, 542
Survival analysis, 719survival time, 720, 723, 732, 734,
740, 742Survival function, 720
computations, 732definition, 722probabilities, 725, 732
TTable of orthogonal polynomial
coefficients, 286t Table, 141, 452Tally, 44, 103Test of significance, 130, 131,
133, 519Test
of common intercept, 263of no interaction, 425of parallelism, 519for homogeneity of variances, 772for normality, 432lack of fit, 235
multiple comparisons, 175, 176Tests concerning two populations, 107
two sample Z test, 205two sample t test, 169, 174two proportions, 128
Test of independencein 2 × 2 contingency tables, 75
Test of Significance, 130, 131, 133,235, 634
Test statisticsCook’s, 251Pearson’s X2, 311, 312, 321, 353Likelihood Ratio test G2, 308Yates test, 542Mantel-Haenzel test, 317
Testing for a proportion, 141, 142The 23 factorial
ANOVA table, 539, 541calculating the SS, 438standard errors, 543
TransformationsArc Sine, 431–438Box-Cox, 438–440logarithmic, 431square root, 430, 431, 433, 439
Tree diagram, 69, 72Type I error, 133, 178Type II error, 133, 343Types of alternative hypotheses, 134
left-tailed, 134, 135right-tailed, 134two-sided, 136, 142, 243
t-test, 150, 155, 186Tukey’s test, 178–180
studentized range tables, 178
UUnbalanced one-way ANOVA, 171, 699Upper tail, 178
VVariate, 1, 3, 4, 42, 338, 503Variable
binary, 430categorical, 4, 28, 755concomitant, 503–505, 530continuous, 341, 680discrete, 103explanatory, 217, 237, 243, 251, 297,
697, 744independent, 243, 251, 255, 298, 531qualitative, 24, 194

Index 799
response, 194, 217, 218, 280, 295,355, 516, 662, 697, 757
Varianceanalysis, see Analysis of varianceof discrete random variable, 79heterogeneity, 343pooled, 148, 171, 186, 258, 759
Variationexplained or fitted, 226total, 8, 233, 346, 571
Venn diagram, 66Vertical factor, 632
WWeibull model, 736, 737Weighted Mean, 36–39
YYates’s algorithm, 409, 542–546Y-intercept, 217
Zz confidence intervals, 113z critical values, 155z score, 90z table, 779z test
for difference between means, 131,135, 207, 208, 210, 561
for difference betweenproportions, 127
for population mean, 423for population proportion, 128