"evaluation of dsr-48 emergency diesel generator
TRANSCRIPT
. _ _ _ _ _ _ _ _ _ _ _ _ _ , _ - _
Failure'
. twrs0os1'
ENG#NEERNO AND METALLURGICAL CONSULTANTS*
3 C 2225 EAST BAYSHORE ROAD. P.O. DOX $1470.44 J PALO ALTO. CAUFORNIA 943(El #415) 06H400 TELEX 704216
FaAA-PA-R-87-02-11 i
PA11745
..
EVALUATION OF DSR-48 EERGENCY DIESEL
GENERATOR CRANKSHAFTS AT RANCHO SECO
NUCLEAR GENERATING STATION
.
Prepared by.
Failure Analysis Associates2225 East Bayshore Road
Palo Alto, California 94305.
Prepared for_
TDI Diesel Generator Owners' Group
|
February, 1987
!
Y$R |0byy050B71229S gy
.
BOSTON e DETROIT HOUSTON LOS ANGELES e PALO ALTO ee PHOENIXe WASHINGTON. DCe
.- - ___ _ _ _ _ _ _ _ _ _ _ _ _ -
,__-_ _ _ _ _ _ _ _ _ _ _ _
i
''- BMM0021
TABLE OF CONTEKIS
1.0 INTRODUCTION AND StM4ARY..........................................1-12.0 COW LIANCE OF CRANKSHAFT WITH DEMA RECOMMENDATIONS................ 2-1
2.1 Review of TDI Torsional Critical Speed Analysis......... 2-12.2 Review of Stone & Webster EngineerinTorsiograph Test....................g Corporation
2-3...
2.3 Conclusions............................................
2-6................
3.0 FATIGUE ANALYSIS OF CRANKSHAFT.................................... 3-13.1 Crank shaf t Dynamic Torsi onal Analysi s. . . . . . . . . . . . . . . . . . . 3-13.2 Calculation of Fillet Stresses.......................... 3-43.3 Factor of Safety Against Fatigue Failure.. .... .. . .... . .. 3-53.4 Calculation of RSNGS Load to Produce Specified
Factor of Safety..................... 3-63.5 Conclusions.......................... .................. 3-6..................
4.0 COMPLIANCE WITH NRC SAFFETY EVALUATION REC 0MNDATIONS............ 4-14.1 Conclusions............................................. 4-2
.
m
I
islum
i ArvMaAssooates
___ - -_ - _ - -_ - - - -------- - - --

_ _ _ .
~'
SN M 0 0 211.0 INTRODUCTION AW SlM ERY,
| An evaluation of the 13-inch by 12-inch crankshaf ts installed in theEmergency diesel generators at Rancho Seco Nuclear Generating Station, RSNGS,|
was performed to determine the adequacy of the crankshafts for their intendedservice and to recommend a safe operating load. This report summarizes theresults of testing and analyses, performed on the crankshafts in the
,
Transamerica Delaval Inc., TDI, DSR-48 engines installed at RSNGS. No
crankshaft inspections were available for review.
The TDI part number for the crankshafts at RSNGS is 03-310-05-AC. Theengine serial numbers for the diesel generators at RSNGS are 81015-3057 and31016-3058. The forging and machining of the crankshafts were performed byKobe Steel, Ltd.
Significant testing and evaluation of 13-inch by 12-inch crankshaftsinstalled in the TDI DSR-48 engines at Shoreham Nuclear Power Station, SNPS,and at River Bend Station, RBS, has been performed. The part number for the-crankshafts at SNPS and RBS is 03-310-05-AC. Fatigue damage was discovered in
the original 13-inch by 11-inch crankshafts at SNPS and the replacement crank-shafts installed are of the same design as those in use at RBS and RSNGS. The
,
crankshafts have identical crankshaft stiffness, inertia and fillet geometry.The main differences in the torsional systems are that the engines have
,
different flywheel and generator inertias and a different shaft stiffnessbetween the flywheel and generator. Due to the similarities of the torsionalsystems at these plants, the response of the crankshafts are similar, and thissimilarity has been demonstrated by analysis and testing.
The testing on the crankshaft at SNPS consisted of dynamic strain gagemeasurements to determine maximum stresses, torsiograph testing and an endur-
7ante test run for 10 cycles at loads equal to or greater than 3300 kW.Dynamic torsional analysis and stress analysis have been performed on the SNPScrankshaft. In addition, the detailed investigation of the failure of theoriginal 13-inch by 11-inch crankshaft at SNPS provides data for evaluation ofthe fatigue life of the crankshafts. To utilize the data available from theevaluation of the SNPS crankshafts similarities and comparisons to the RSNGScrankshafts will be made throughout the report where appropriate.
1-1
Assma es
-- - - - - - - - - -----
__ ..
'
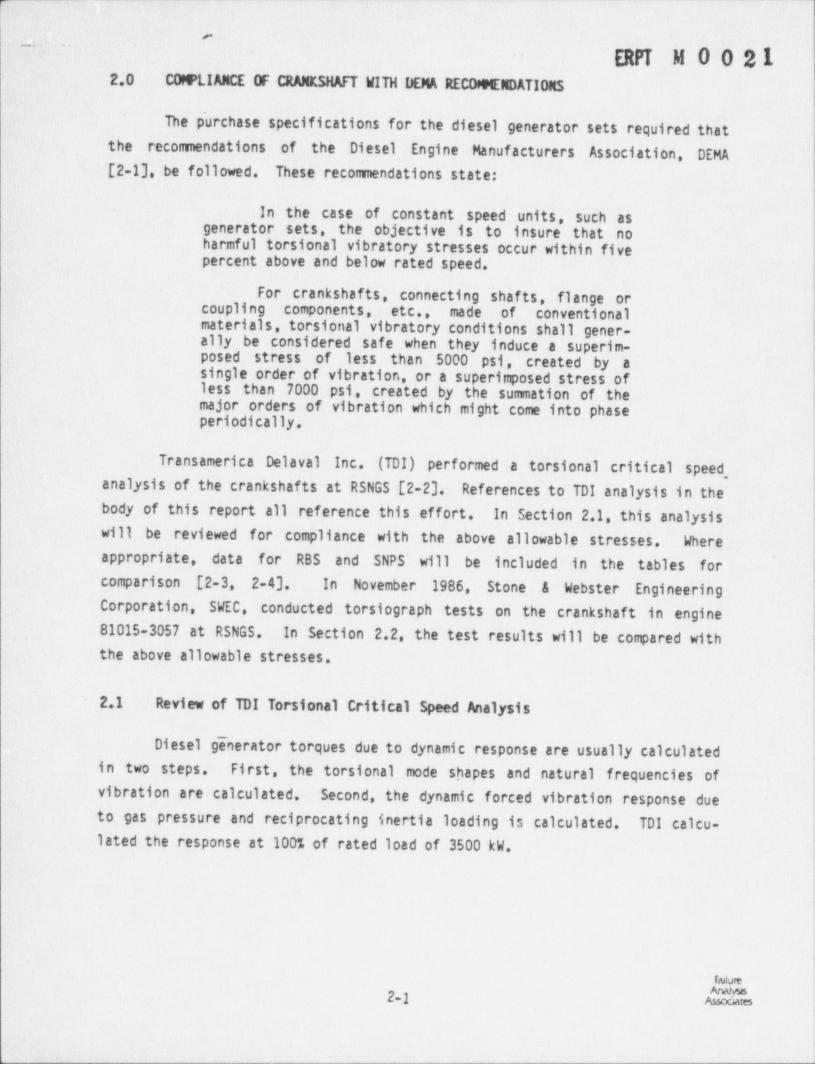
ERYT M 0 0 21The testing on the crankshafts at RBS consisted of torsiograph testing.
Dynamic torsional analysis and stress analysis have been performed on the RBS
crankshaft. To utilize the data available from the evaluation of the RBScrankshafts, similarities and comparisons to the RSNGS crankshaft will 'be made
throughout the report where appropriate.
The crankshaft is required to meet the recommendations of the DieselEngine Manufacturers Association, DEMA. In Section 2.0, the RSNGS torsionaldesign c01culations prepared by TDI and the results of the torsiograph test
'
performed at RSNGS by Stone & Webster Engineering Corporation, SWEC, arereviewed for compliance with DEMA stress allowables. The relationship betweentorsional response and engina load is determined based on the results of thetorsiograph tests performed at RSNGS, RBS and SNPS. The crankshafts at RSNGS
meet the DEMA allowables for single order and combined order stresses at 450rpm and 3500 kW based on the torsiograph test results.
The fatigue analysis to determine the RSNGS operation load to providean adequate factor of safety against fatigue failure is determined in Section ~3.0. A dynamic torsional analysis of the crankshaft is performed to determinethe stress levels in ea h cylinder of the crankshaft. This model is compared
with the SWEC test data for the amplitude of free-end vibration. Stress
values at full load are determined at rated speed.
Utilizing the SNPS dynamic strain gage test data, a factor of safety of1.34 is calculated for RSNGS at full load (3500 kW). This value for the
factor of safety is established with more confidence than usual on account ofthe dyaemic strain gage testing of a similar crankshaft at SNPS, and on
account of the endurance limit established from the failed crankshafts atSNPS. The RSN65 factor of safety at 3500 kW is less than that of SNPS at itslicensed load of 3300 kW and that of RBS at its licensed load of 3130 kW.
Based upon the relationship between torsional response and engine loaddescribed in Section 2.0, a RSNGS load of 3311 kW will produce a factor ofsafety against fatigue failure equivalent to that of RBS at its licensed loadof 3130 kW. Operation of the diesel engine at RSNGS at a load of 3311 kW willprovide a sufficient margin of safety against fatigue failure.
1-2
Assma es
!
n, ,
'-
-
OtPT M 0 0 '2 12.0 COWLIANCE OF CRAKSHAFT WITH DEM RECOMNDATIONS
The purchase specifications for the diesel generator sets required thatthe recommendations of the Diesel Engine Manufacturers Association, DEMA[2-13, be followed. These recommendations state:
In the case of constant speed units, such asgenerator sets, the objective is to insure that noharmful torsional vibratory stresses occur within fivepercent above and below rated speed.
For crankshafts, connecting shafts, flange or,
coupling components,. etc., made of conventionalmaterials, torsional vibratory conditions shall gener-:
ally be considered safe when they induce a superim-posed . stress of less than 5000 psi, created by asingle order of vibration, or a superimposed stress ofless than 7000 psi, created by the summation of themajor orders of vibration which might come into phaseperiodically.
Transamerica Delaval Inc. (TDI) performed a torsional critical speed,analysis of the crankshafts at RSNGS [2-2]. References to TDI analysis in the'body of this report all reference this effort. In Section 2.1, this analysiswill be reviewed for compliance with the above allowable stresses. Where
appropriate, data for RBS and SNPS will be included in the tables for '
comparison [2-3, 2-4]. In November 1986, Stone & Webster EngineeringCorporation, SWEC, conducted torsiograph tests on the crankshaft in engine81015-3057 at RSNGS. In Section 2.2, the test results will be compared withthe above allowable stresses.
2.1 Review of TDI Torsional Critical Speed Analysis 1
Diesel generator torques due to dynamic response are usually calculated I
in two steps. First, the torsional mode shapes and natural frequencies ofvibration are calculated. Second, the dynamic forced vibration response dueto gas pressure and reciprocating inertia loading is calculated. TDI calcu-lated the response at 100% of rated load of 3500 kW.
I
i
!1
2-1
__
"
ERPT M 0 0-212.1.1 Natural Frequencies
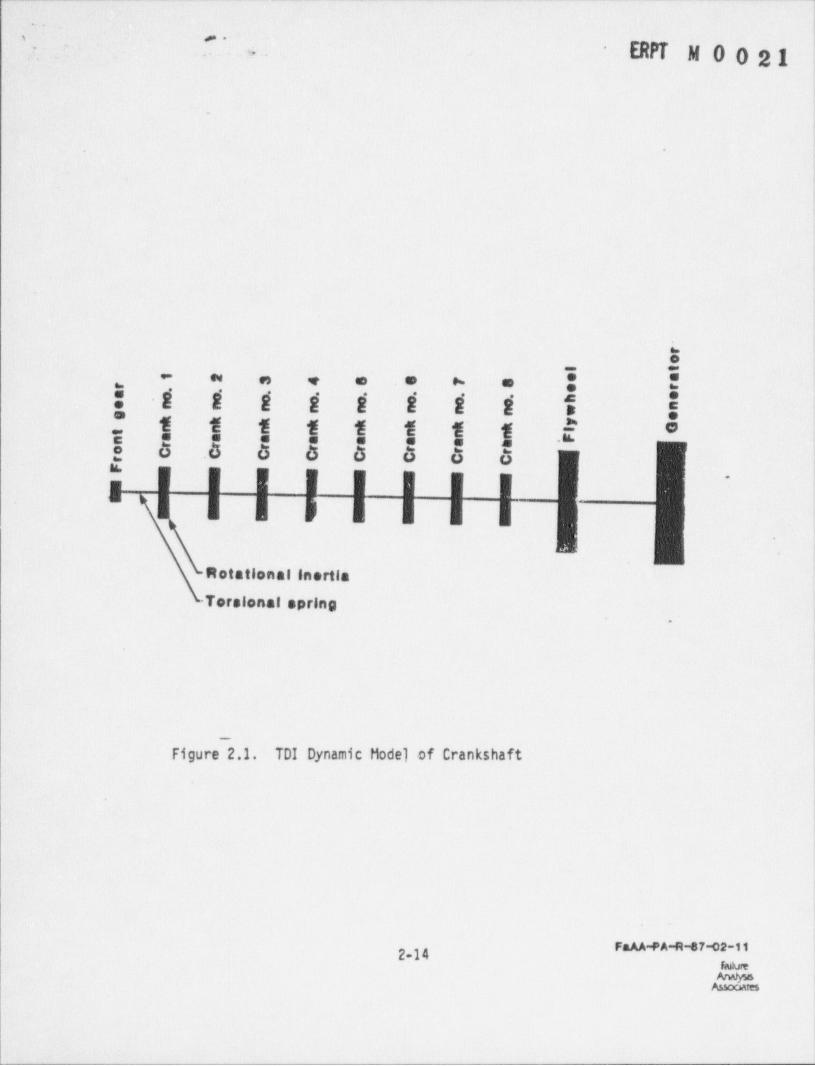
The first step in a torsional critical speed analysis is to determinethe natural frequencies of the crankshaft. The engine speed at which a givenorder resonates may then be calculated. The diesel generator is modeled as a i
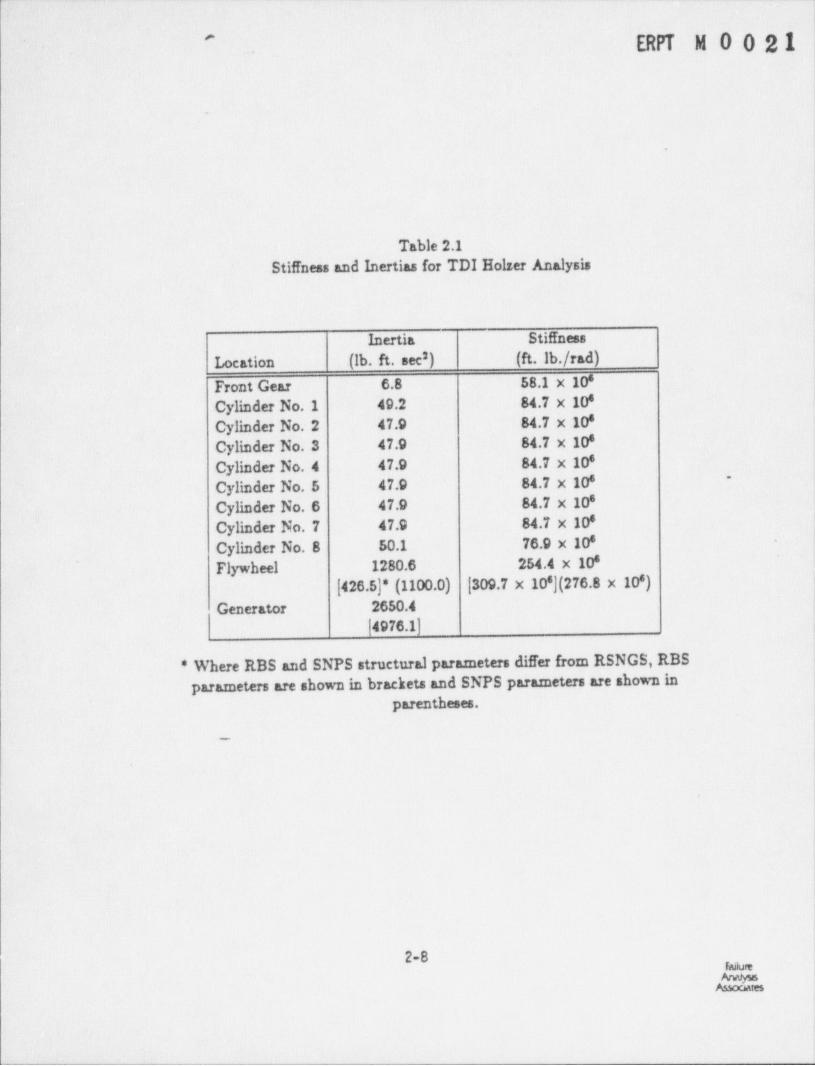
system of lumped mass moments of inertia interconnected by torsional springs,as shown in Figure 2.1. The inertia and stiffness values are shown in
'
Table 2.1.
It has long been standard practice in the diesel engine industry to i
solve this eigenvalue problem by the Holzer method [2-6). This method hasbeen used for at least 40 years [2-7], and thus is well established.
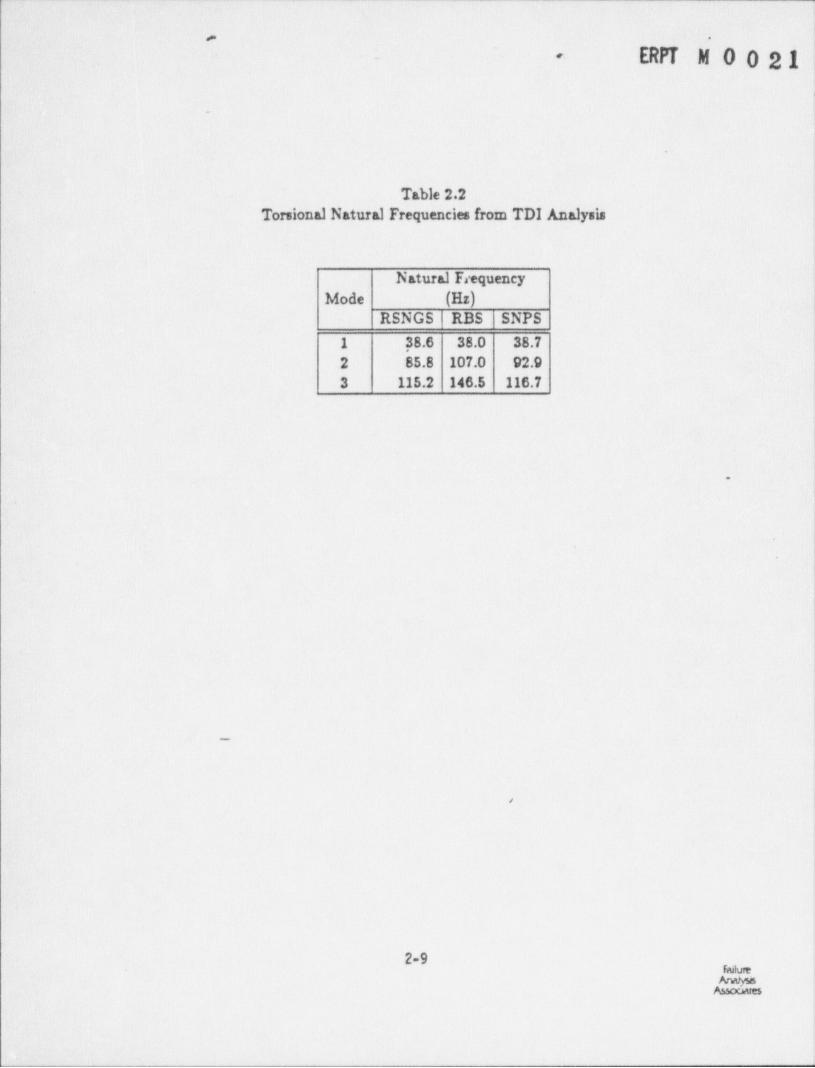
TDI used the Holzer method to calculate the system's first three natu-ral frequencies, which are shown in Table 2.2 [2-2, 2-3, 2-4]. The firstnatural frequency was found to be 38.6 Hz, which produces 4th order resonanceat 579 rpm.
.
2.1.2 Nominal Stresses
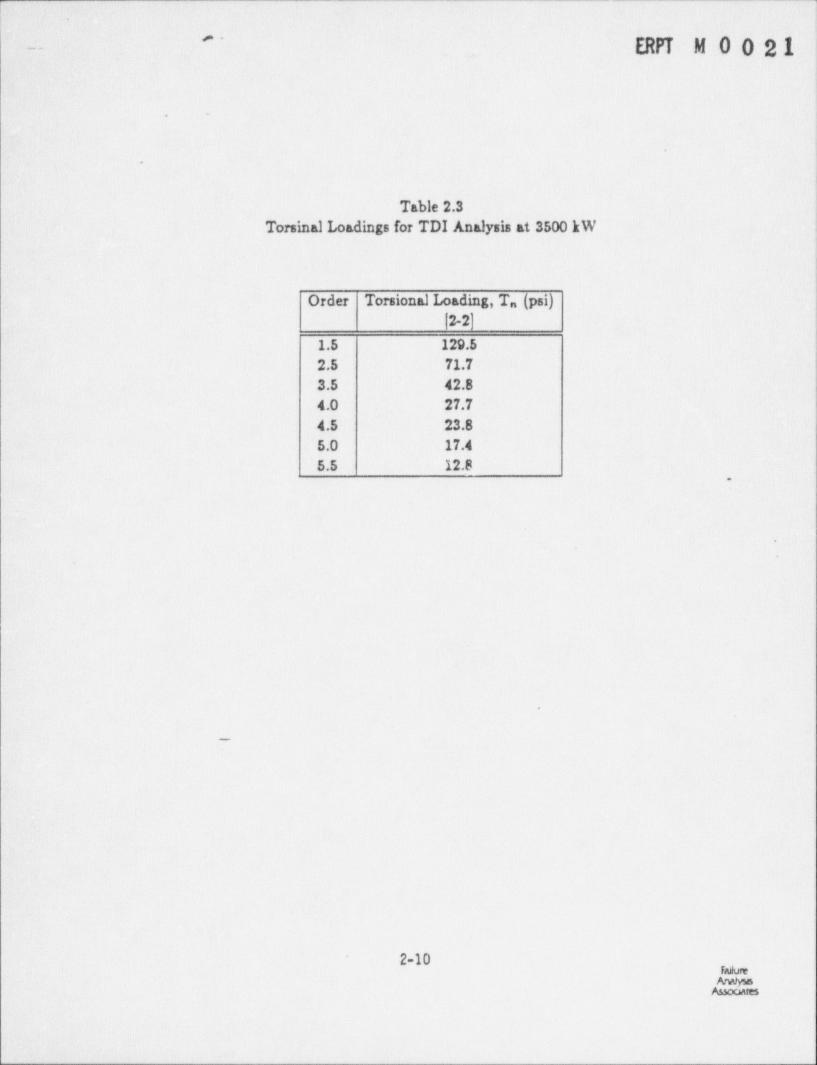
The second step in a torsional critical speed analysis is to determinethe dynamic torsional response of the crankshaft due to gas pressure and re-ciprocating inertia loading. The 1st order is a harmonic which repeats onceper revolution of the crankshaft. For a four-stroke engine, harmonics of or-der 0.5, 1.0, 1.5, 2.0, 2.5. . . exi t. TDI performs this calculation for eachorder of vibration up to 12.0 separately. For each order, the applied torqueat a cylinder due to gas pressure and reciprocating inertia is calculated.The values of this torque for each order are usually normalized by dividing bythe piston area and throw radius. The normalized value for the nth order isreferred to as T . The values of T for significant orders used by TDI aren n
shown in Table 2.3. These values may be compared to those recommended byLloyd's Register of Shipping, LRS [2-8]. It is found that TDI's values arehigher than LRS's values for low orders and lower for high orders. However,
the largest single order was measured to be within 5% of those computed usingTDI's values of T . The response is then calculated by one procedure if then
harmonic is at resonance and by another if the harmonic is away fromresonance.
ram2-2 Ds
- _ _ _ -- -
. . _
ERPT M. 0 0 21e-
m d.*
At resonance, the torsional vibration amplitudes would increase indefi-nitely in the_ absence of damping. The solution is obtained by balancing theenergy input with the energy loss due to damping. TDI used an empirical formof hysteresis damping due to friction.
Away from resonance, the torsional vibrations reach a steady-statelevel even without the aid of any damping. The magnitude of this response foreach structural mode and loading order is calculated as the product of adynamic ampl1fication factor and an equivalent static equilibrium amplitude.The equivalent static equilibrium amplitude is computed using a modal load andmodal stiffness [2 9] for the nth order harmonic and given mode shape. The
nominal shear stress, T, in the 12-inch pin of Crankpin No. 8 for each orderis then calculated from the dynamic torque, T, using i = Tr/J, where r is thepin radius and J is the polar moment of inertia.
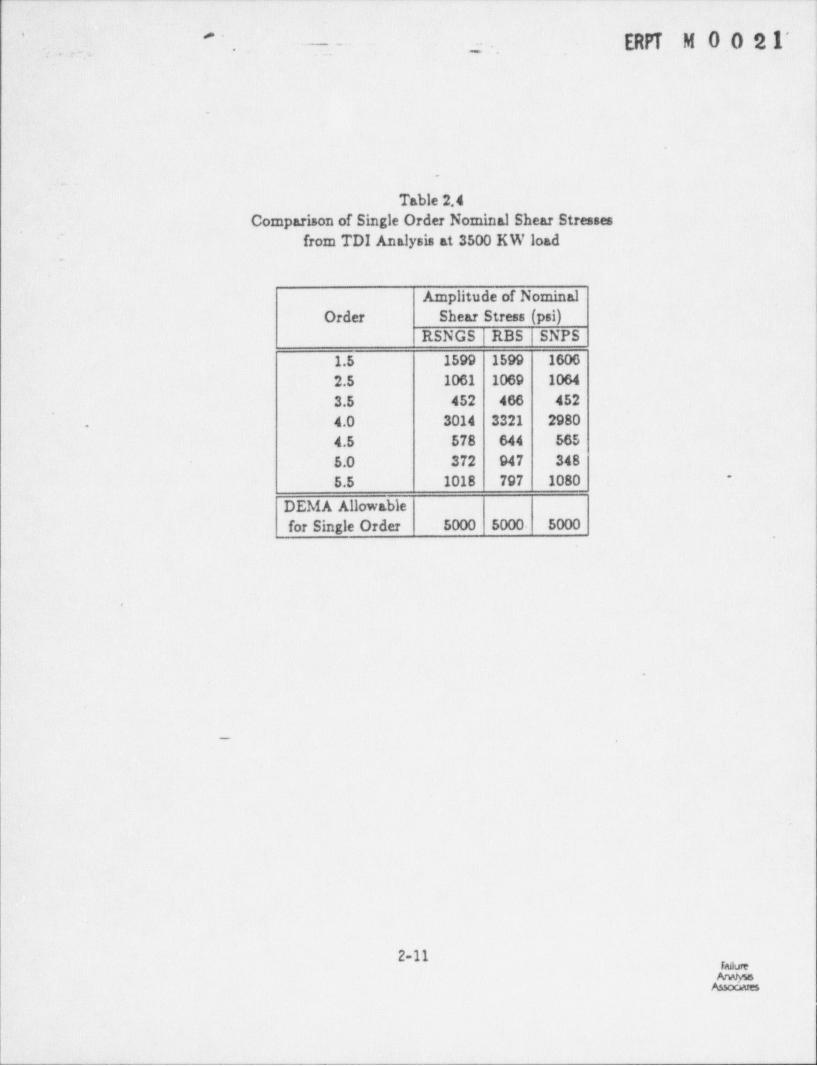
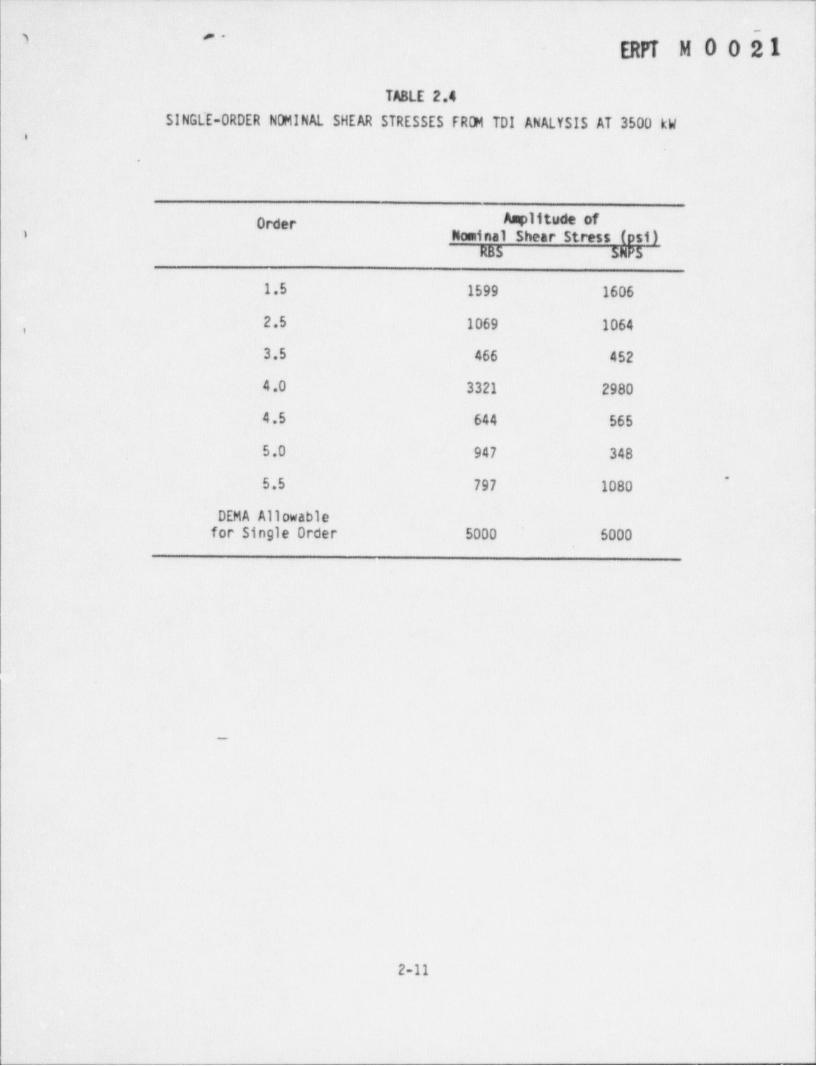
TDI calculated the response for the first three modes and plotted theresults for only the first mode since higher modes produce much smallerstresses. The nominal shear stresses for the significant orders are shown in *Table 2.4. For RSNGS, it is seen that the largest single order stress of3014 psi at rated load and speed for the 4th order is well below the 5000 psiDEMA allowable.
TDI does not calculate the associated phase angle with the response ofeach order, so that it is not possible to calculate the combined response.The measured combined response will be compared with the allowable in the nextsection.
2.2 Review of Stone & Webster Engineering Corporation Torstograph Te:t
The purpose of the torsiograph test of th'e Emergency diesel generatoris to measure the angular displacements of the forward end of the crankshaft.These displacements are then used in conjunction with a dynamic torsionalanalysis of the crankshaft to confirm the results of the vibrational analysisand to assess the maximum stresses in the crankshaft. The torsiographresponse may be decomposed into components corresponding to each order and thepeak-to-peak response may also be obtained. The torsiograph test is usually
Failure
Anoaates
_ _ . _ _ _ _ _ _ _ -
_ - __ _ __ __
L an noo21-
<
|l performed in two stages. The first stage is performed without load at vari-
)
able speed and is used to determine the location of critical. speeds. Criticalspeeds may also be determined while operating at a fixed speed and observingthe frequency content of the response. The second stage is performed at ratedspeed of 450 rpm with variable load, and is used to confirm the forced. vibra- 'qtion calculations. These tests collect data during steady-state operation.
'
|| Data may also be obtained during transient (start-up, coastdown, misfiring) L
operations to assess the response of the crankshaft during these events.-
; A torsiograph test was performed on Emergency Diesel Generator A, EDGA,
at RSNGS by SWEC. This test concentrated on collecting data during steady-| . state operation [2-5]. The results of these tests are discussed and compared
with the results of the torsiograph tests performed at SNPS and RBS [2-10, 2-11] in the following sections.
2.2.1 Natural Frequencies
The frequency content of the torsional vibration signal indicated the-torsional resonant frequency of the RSNGS torsional system was 38.3 Hz [2-
5]. This value is in excellent agreement with- TDI's computed value of 38.6
Hz.
2.2.2 Nominal Stresses at Full Load
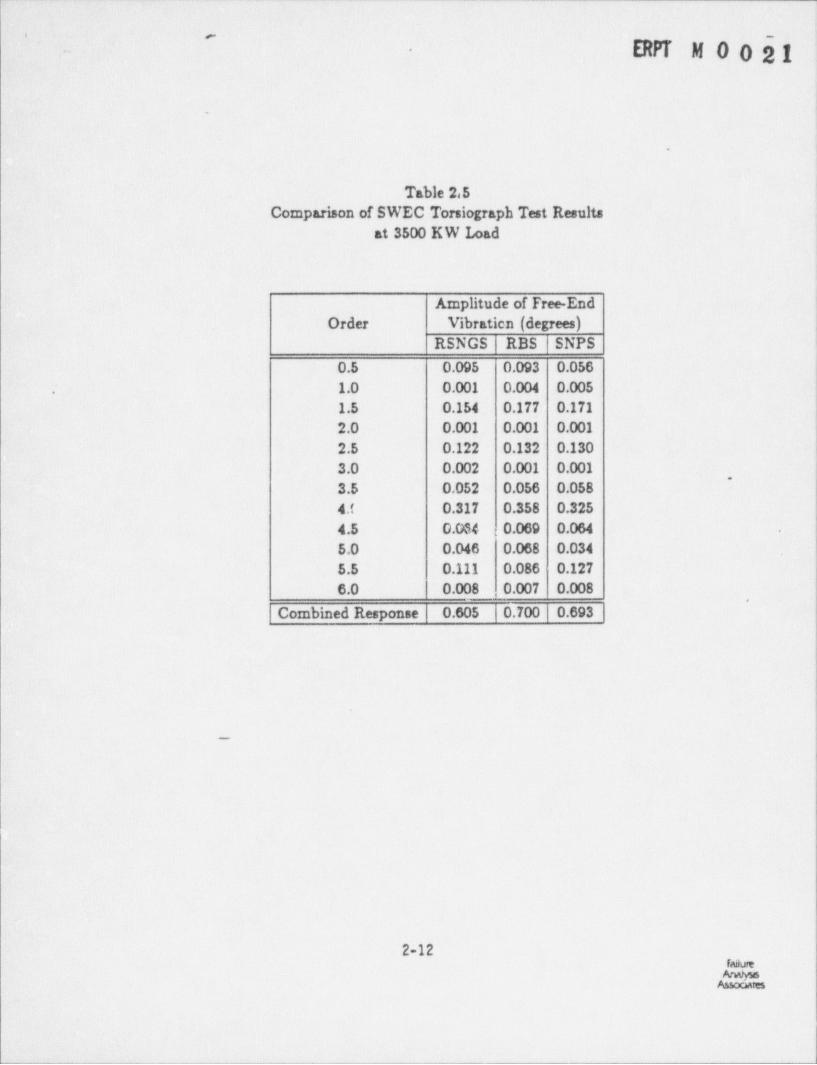
The torsiograph response of the crankshaft at full load for significantorders along with the peak-to-peak amplitude is shown in Table 2.5. The
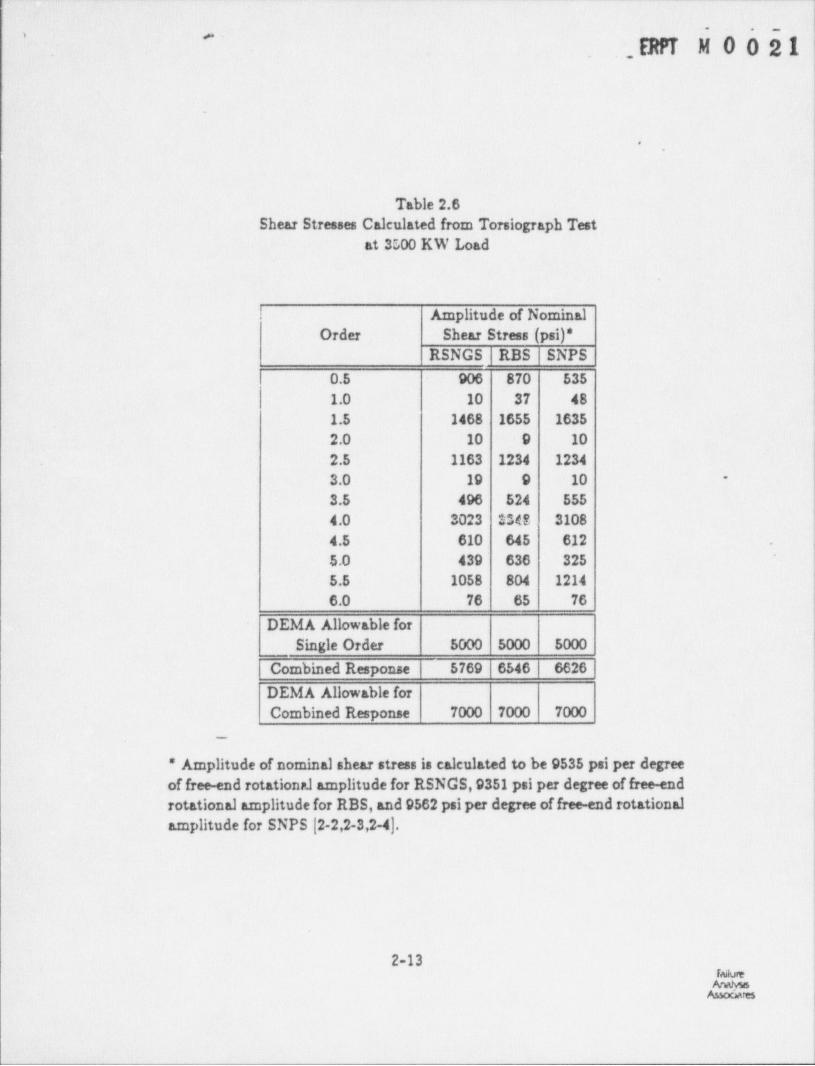
amplitude of nominal shear stress may be estimated from the free-end vibrationby assuming that the shaft is vibrating in its first mode. This assumption istypically used to estimate maximum stresses from torsiograph vibration data.However, a more accurate calculation is made in Section 3 in which thecrankshaft stresses between each cylinder are determined and used incalculating the fatigue margin of the crankshaft. Assuming first moderesponse, the nominal shear stress in Crankpin No. 8 is at RSNGS is 9535 psiper degree of free-end rotation. The amplitudes of nominal shear stress arepresented in Table 2.6. The results indicate that f 6r RSNG$, the largestsingle order has a stress of 3023 psi which is well below the DEMA allowable
.
2-4Failure
Assocates
_ _ _ - _ -
_ __
ERPT M 0 0 21"
of 5000 psi. The total stress of 5769 psi is also shown to be below the DEMAallowable of 7000 psi.
The measured response at 3500 kW is in agreement with that calculatedby Tb! and shown in Table 2.4, although the measured values are somewhathigher than the calculated values. A comparison of RSNGS, RBS and SNPS
results indicates that the response is similar for the crankshafts as
expected. The fourth order response is the largest order for all crankshaftsand is higher for RBS because its fourth order resonant speed is closer to theoperating speed. The fourth order response at RSNGS is lower than that atSNPS and RBS. The combined response at RSNGS is also shown to be lower thanat SNPS and RBS. RSNGS has a fifth order resonant speed of 463 rpm and a fiveand a half resonant speed of 421. Even though these resonant speeds are nearthe operating speed of 450 rpm, their magnitude is small compared to thefourth order response and should not be of concern.
2.2.3 Nominal Stress at Reduced Loads.
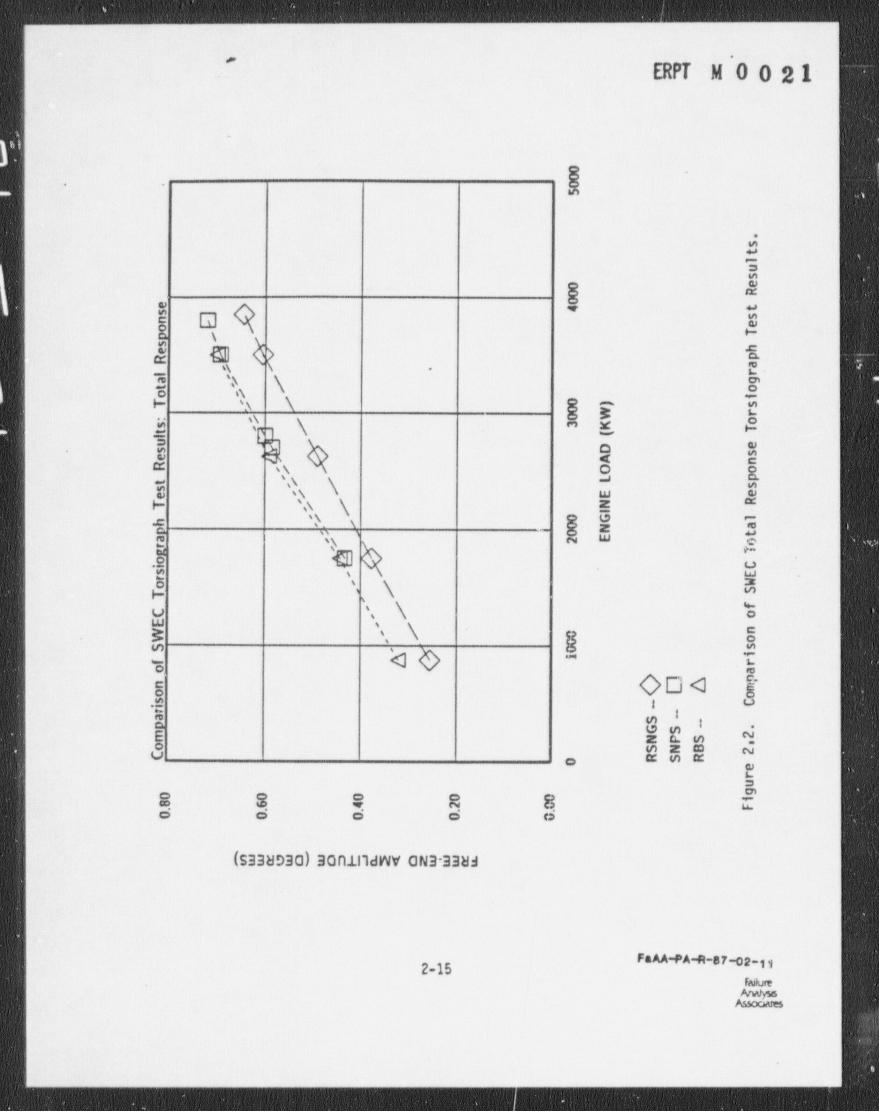
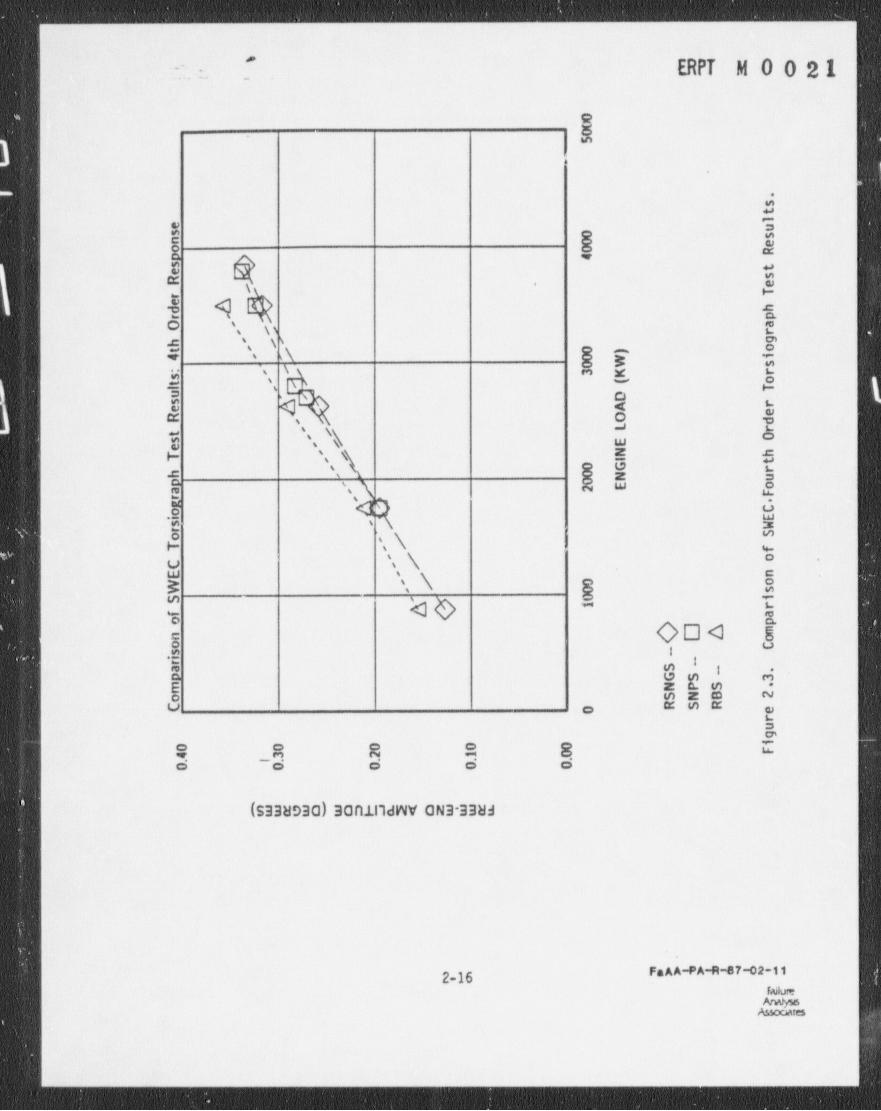
Torsiograph test data is typically obtained at about four or five
different load levels. The relationship between torsional response and loadmay be obtained by plotting the torsiograph test data versusi engine load.
The torsiograph test data for the variable load tests at RSNGS, RBS andSNPS are plotted in Figures 2.2 and 2.3. From these plots it was determinedthat a linear relationship between torsional response and load existed. This
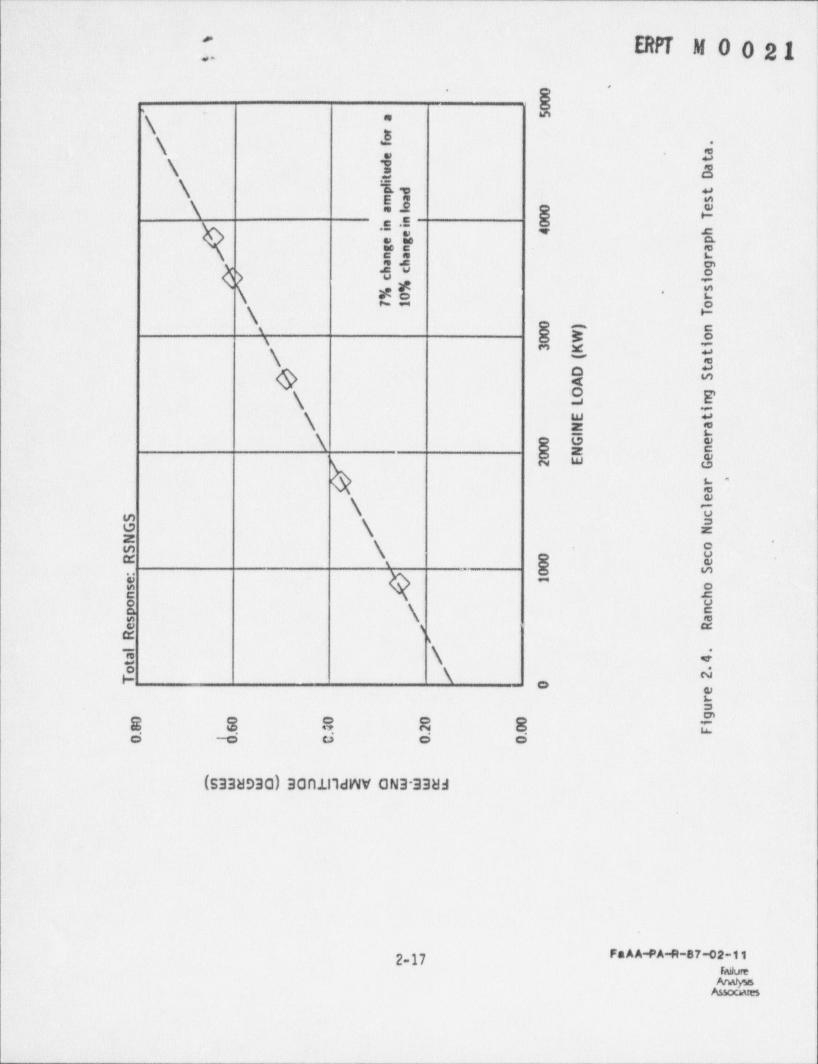
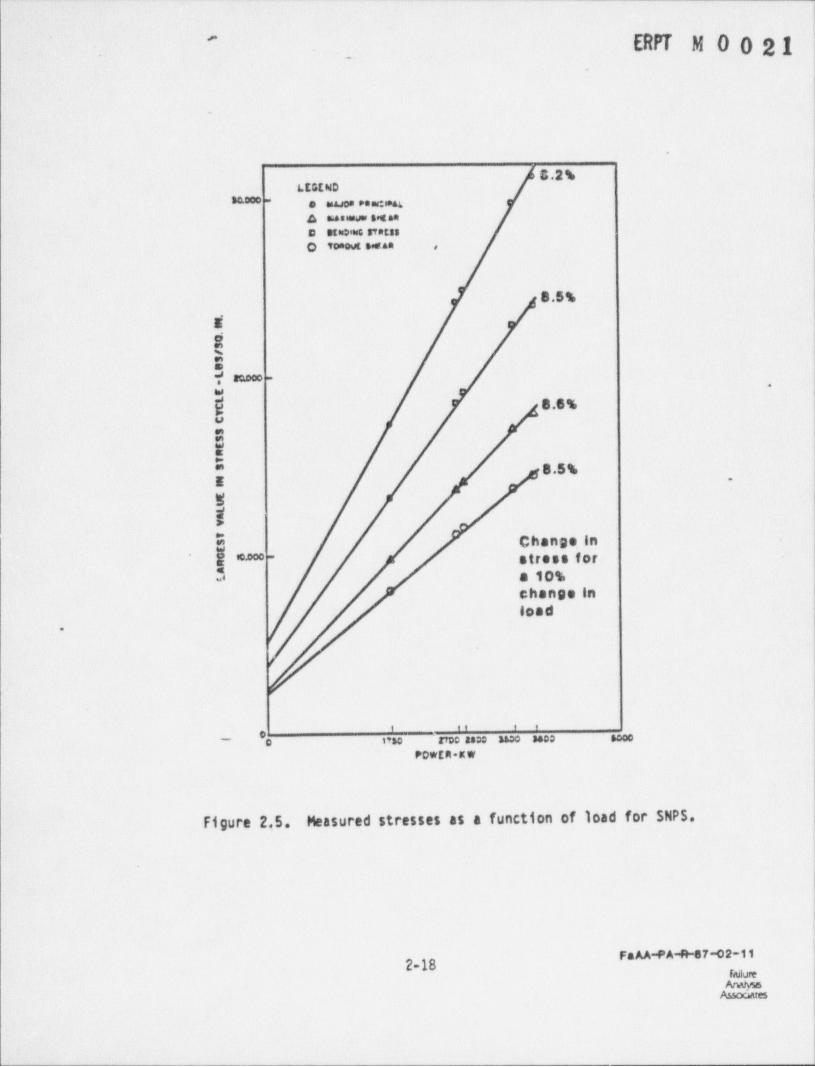
allows the determination of stresses at reduced loads based upon stresses at a3500 kW load and the slope of the torsional response versus load curve. Fromthe data it was determined that there is approximately a 7% change in tor-sional response-for a 10% change in load (see Figure 2.4). In addition, the
dynamic strain gage test at SNPS [2-10] showed that the relationship betweencrankpin fillet stresses and load is also linear. Figure 2.5 indicates thatthe crankpin measured stress data shows approximately an 8.5% change in stressfor a 10% change in engine load. To determine the torsional stress at a load !
3500, the following equa-L (kW), TL, from the torsional stress at 3500 kW, r
tion can be used
2-5Lulure
Assooares
t
- _ - - .
ERPT M 0- 0 21~ -
TL*T3 500 (0.3 + 0.7 3500 )
Using 7% leads to a comparison which gives relatively higher stressesthan if 8.5% were used, when considering loads below 3500 kW.
~
2.3 Conclusions
The following conclusions can be stated:
The TDI Holzer calculations of the natural frequency of the*
crankshaft are in good agreement with test data,
e The TDI forced vibration calculations at 3500 kW are reason-ably accurate and show that the single order stresses complywith DEMA.
e The torsiograph test data at 3500 kW shows that the combinedorder stresses comply with DEMA at the rated speed of 450 rpm.
e The torsiograph test data shows that there is a linear varia-tion of crankshaft response with load. .
-,
failure
As ces
_ - - - - - - - - - - - - - - _ - _ _ - - a
- _ - _ - _ _ _ __- - - -
~
ERPT M 0 0 21-
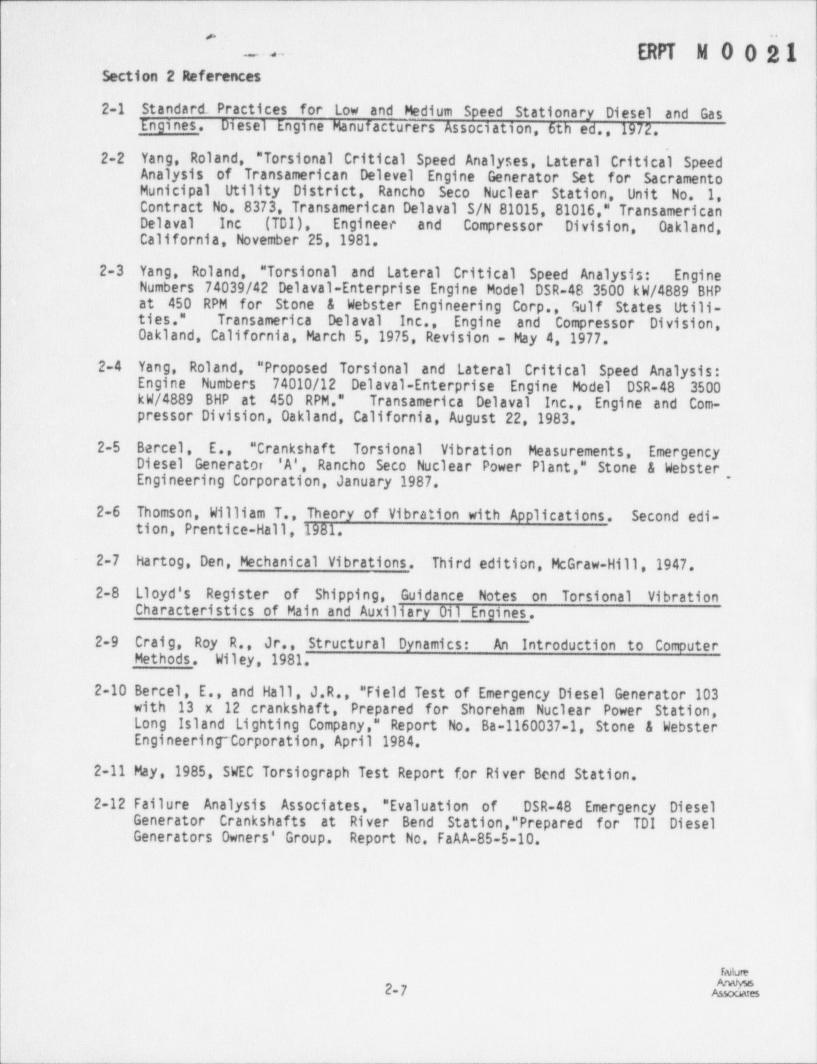
Section 2 References 1
|
2-1 Standard _ Practices for Low and Medium Speed Stationary Diesel and GasEngines. Diesel Engine Manufacturers Association, 6th ed.,1972.
2-2 Yang, Roland, " Torsional Critical Speed Analyses. -Lateral Critical SpeedAnalysis of Transamerican Delevel Engine Generator Set for - Sacramento
L Municipal; Utility District, Rancho Seco Nuclear Station. Unit No. 1,Contract No. 8373 Transamerican Delaval S/N 81015, 81016 " Transamerican i;
Delaval Inc_ (TDI), Engineer and Compressor Division, 0akland,California, November 25,-1981.
2-3 Yang,_ Roland, " Torsional , and . Lateral _ Critical Speed Analysis: EngineNumbers 74039/42 Delaval-Enterprise Engine Model DSR-48 3500 kW/4889 BHP . !at 450 RPM for Stone & Webster Engineering Corp., Sulf States Utili- I
|- ties." Transamerica Delaval Inc., Engine and Compressor' Division, 1Oakland, California, March 5,1975, Revision - May 4,1977.
L 2-4 Yang, Roland, " Proposed Torsional and Lateral' Critical Speed Analysis:Engine' Numbers 74010/12 Delaval-Enterprise Engine Model DSR-48 3500kW/4889 BHP at 450 RPM." Transamerica Delaval Inc., Engine and Com--
pressor Division, Oakland, California - August 22, 1983.
2-5 Bercel. E., " Crankshaft Torsional Vibration Measurements, EmergencyDiesel Generator 'A', Rancho Seco Nuclear Power Plant," Stone & WebsterEngineering Corporation, January 1987. *
2-6 Thomson, William T., Theory of Vibration with Applications. Second edi- '
tion, Prentice-Hall,1981.
2-7 hartog, Den, Mechanical Vibrations. Third edition, McGraw-Hill,1947 '
'2-8 Lloyd's Register of Shipping, Guidance Notes on Torsional VibrationCharacteristics of Main and Auxiliary 011 Engines.
2-9 Craig, Roy R., Jr., Structural Dynamics: An Introduction to ComputerMethods. Wiley,1981.
2-10 Bercel, E., and Hall, J.R., " Field Test of Emergency Diesel Generator 103with 13 x 12 crankshaft, Prepared for Shoreham Nuclear Power Station,Long Island Lighting Company," Report No. Ba-1160037-1, Stone & WebsterEngineerinrCorporation, April 1984
2-11 May,1985, SWEC Torsiograph Test Report for River Bend Station.'
2-12 Failure Analysis Associates, " Evaluation of DSR-48 Emergency Diesel !
Generator Crankshafts at River Bend Station," Prepared for TDI Diesel '
Generators Owners' Group. Report No. FaAA-85-5-10.
Failure
2-7 A
ERPT M 0 0 21"-
.
.
.
!
Table 2.1StiKness and Inertins for TDI Holzer Analysis -
Inertia Stiffness
Location (Ib. ft. sec ) (ft. Ib./ rad)2
'8
Front Gear 6.8 58.1 x 10 -
Cylinder No.1 49.2 84.7 x 10'Cylinder No. 2 47.9 84.7 x 10'Cylinder No. 3 47.9 84.7 x 10'Cylinder No. 4 47.9 84.7 x 10' '
8 -
Cylinder No. 5 47.9 84.7 x 10⁸
Cylinder No. 6 47.9 84.7 x 10
Cylinder No. 7 47.9 84.7 x 10'8
Cylinder No. 8 50.1 76.9 x 10 -
Flywheel 1280.6 254.4 x 10'8 8
[426.5)* (1100.0) [309.7 x 10 )(276.8 x 10 )Generator 2650.4
{4976.1)
* Where RBS and SNPS structural parameters difer from RSNGS, RBSparameters are shown in brackets and SNPS parameters are shown in
parentheses.
2-8Failure
tes
- - - - - - - - - - - - - - _ -
._ _ _ _ _ _ _ _ _ _ _ - _ - _ _ _ _ _ _ _ - - _ -
r -
ERPT M 0 0.21- o--
.
Table 2.2Torsional Natural Frequencies from TDI Analysis
Natural FrequencyMode (Hz)
RSNGS RBS SNPS
1 38.6 38.0 38.7
2 85.8 107.0 92.93 115.2 146.5 116.7
i
O
emme
#
2-9 g,
M
_-__ _ _ -
_ _ _ .__ __
''- ERPT M 0 0 21.
. -
.
Table 2.3Torsinal Loadings for TDI Analysis at 3500 kW
Order Torsional Loading, T. (psi)
|2-2]1.5 129.5
2.5 71.73.5 42.84.0 27.7
4.5 23.8
5.0 17.4
5.5 12.8.
.
.
-
2-10Fadure
Assocates
_ _ _ - - - _ - - - - - - - - _ - - - - - - - _ - - - - - - - - - - - - - - - - -- - - - - - -
- _ _ _ _ --_-
ERPT M 0 0 21'' '
_. - 2.. , _ ,
~
\1
.
'
Table 2.4Comparison of Single Order Nominal Shear Stresses
from TDI Analysis at 3500 KW load-
Amplitude of NominalOrder Shear Stress (psi)
RSNGS RBS SNPS
1.5 1599 1599 1606
2.5 1061 1069 1064
3.5 452 466 452
4.0 3014 3321 2980.
4.5 578 644 565
5.0 372 947 348
5.5 1018 797 1080-
DEMA Allowablefor Single Order 5000 5000- 5000
)
.
:|
h
-:
2-11
- - - - - - - - - - - - - - - - - - - - - - - - - - - _ -
_ __ - _ _ _ _ _ _
,Ii
s e - 1
- - ERPT M 0 0 21
.
.
1
Table 2.5Comparison of SWEC Torsiograph Test Results I
at 3500 KW Loadi
Amplitude of Free-EndOrder Vibratien (degrees)
RSNGS | RBS | SNPS0.5 0.095 0.093 0.056
1.0 0.001 0.004 0.005.
1.5' O.154 0.177 0.171
2.0 0.001 0.001 0.001
2.5 0.122 0.132 0.1303.0 0.002 0.001 0.001
,
3.5 0.052 0.056 0.0584.0 0.317 0.358 0.325
4.5 0.064 ; 0.069 0.064
5.0 0.046 0.068 0.034
5.5 0.111 0.086 0.127
6.0 0.008 0.007 0.008.
Combined Response 0.605 | 0.700 | 0.693 ||
w
2-12Failure
'Auooares
1
-..-- ---_ . .. .__ - -_ _ . . ..
- . - - - - - - - - - - _ - - - - - - - - - - - - - - ---
. . .ERPT 0551' '
.
'
.
Table 2.6Shear Stresses Calculated from Torsiograph Test
at 3500 KW Load
Amplitude of NominalOrder Shear Stress (psi)*
RSNGS RBS SNPS
0.5 906 870 535
1.0 10 37 481.5 1468 1655 1635
2.0 10 9 10
2.5 1163 1234 1234 !
3.0 19 9 10 -
3.5 496 524 555
4.0 3023 3:48 3108
4.5 610 645 6125.0 439 636 325
5.5 1058 804 1214
6.0 76 65 76
DEMA Allowable forSingle Order 5000 5000 5000
Combined Response 5769 | 6546 | 6626 |DEMA Allowable forCombined Response 7000 7000 7000
._
* Amplitude of nominal shear stress is calculated to be 9535 psi per degreeof free-end rotational amplitude for RSNGS,9351 psi per degree of free-endrotational amplitude for RBS, and 9562 psi per degree of free-end rotationalamplitude for SNPS |2-2,2-3,2-4).
2-13
Auomns
- - - - - - _ - -
- -
. , . .
ERPT M 0 0 21..
,..
.
1.
|l
1 I
.
*_ ,: l
-- . . . . . ~ ..
: t i i i i i i i s i*
s. s. s. s. s. s. s. s. .!..E a .6 a a a a a a 3: I I I I I I I I E
l~
"I I I I I I I gRotational inertiaTorsional spring
.
Figure 2.1. TDI Dynamic Model of Crankshaft
FaAA-PA-R-67-02-11,
Falure
Assocates 1
. . . .:
_ _ - . _ _ _ - _ _
''
ERPT M O O 2 1-
.
E. .
m
a
a
$ "
! Q E~
b \H
5 NE'\ -
_
2 ',s \ g$ SN \ [ F 2j ' , ' \ y_. .ea
Ca o av - < eE s\ O oy ',s
\ $'e s\ w w
= =s 's \,
g 'h \_ | E %
#e "s ' u w
..E. E, b- m
$ \ \ 5v ', \ tE \, \ 8m -,
O
0 < R.s I u
!e e Ia g g .
E z c. m N. -o m zm uV K m Ko
b
4 % 3 8 ? fC O O O O
| (sassosa) soniilany ana-assa
'' "'" -"'''- 2- 52-uFailureW
Auoewes
i. . . . . . . . . . . . _ . . . _ _ _ . _ . .
_ - _ _ _ _ _ - - _
'
, :._
ERPT M 0 0 21
e-
5- m
i .
. .
&
5.E $ 0a -,
0 -m 0 ,
.- ,,
O 's \s Eg s en_e s
4 's <\ $.
'5 s ~s :
' *3 oN,s.
0 4 5oc: y"
', \\ $-
$ s \\ W\ E 6N\ @E h
F ',.=
! ', ~W e,
a , - gd \\ I
' "
u N\ o
E 's \ g 5-
$ DD i'
ooo sea i
o''
*g !g
h $ $ m,,
"
o m z co NE M EU c g
hw
Na d a 6 o
'
(s33893a) BonindWV aN3-3383
FaAA-PA-R-87-02-112-16FailureW
Auocates
. . . . _ . .
_ _ _ . _ _ _ _ _ _ _ _ _ _ - _ _ _
i
ER M M 0 0 2 1 |-
.
\.
. .
.\ a\ 4\ 1 2
. ~
\ * #\ ! #,$ ).E -
i&F 2k kk ef -
,t_--
\1, | _m
ea
\ s :o MG 8
\ ez
\ s e\ kbh -
as
\ liG \!5i \
-
Be= s =
u Q i~
| \ ie <
m \ i5s \ "
=g"nc
a S 8 8 8 Cs .-s a a =
(saavoia) sonindWV ONa-338:1
!
2-17 FaAA-PA 4-87-02-11w,
M !
!
. . .. . . _ . . ..-
- -
_ _ _ _ - _ _ _ _ _ - _ _ _ _ _ _ _ _ _ _ ,
ERPT M 0 0 21 j,
. .
5.2%LtstND
M0oo = 8 es& Joe Past*.neet& u insgesSHE64
9 ote:DiesG Stat 35
o voaowc waa , 1
8.5%
i ,
ei !
OE1 moco -
.wy 8.6 %v
WE s.5%E -
W
t: Changein| **oo stress for-
3 a10%change in
load.
, ,, , ,
- oc ma voc asco uso woo sooo
POWE R * K W
Figure 2.5. Measured stresses as a function of load for SNPS.
Fa AA-PA-A-87-02-112-18
Failure
- - _ - - - - - - - - - - - - - -
- _ _ - - . _-
ERPT M 0 0.21-
3.0 FATIGUE ANALYSIS OF CRANKSHAFT
In Seciion 2.0 it was found that the RSNGS crankshafts satisfy the DEMA
nominal stress' recommendations at rated speed for 3500 kW. The stresses for a
single order were considerably below the 5000 psi that is recomended as anallowable. However, the stresses for combined orders were quite close to the7000 psi- that is recommended as an allowable. While _ the DEMA- limits arebelieved to contain an intrinsic (though unspecified) safety margin, a fatigueanalysis of the crankshaft was undertaken to determine the true margin.
.
First, a dynamic torsional analysis of the crankshaft is performed tol determine the true range of torque at each crank throw. This model is com-
pared with SWEC torsiograph test data for the amplitudes of free end vibra-tion.
Second, the maximum actual stresses in the crankpin fillet are deter-| mined from the dynamic strain gage test data fr'om SNPS and the differences
between the stresses at SNPS and RSNGS. .
Third, the fatigue endurance limit is established for the RBS 13-inchby 12-inch crankshafts by first obtaining the endurance limit for the failed -13-inch by 11-inch crankshafts at SNPS, and then assessing the differencesbetween the two crankshafts. The endurance limit is compared with valuesprovided in the literature.
Finally, a factor of safety against fatigue failure is computed.
3.1 Crankshaft Dynamic Torsional Analysis5
3.1.1 TorsionaT Model
FaAA developed a dynamic torsional model of the crankshaft to overcome
limitations in TDI's conventional forced vibration calculations. For
instance, the TDI method does not compute the phase relationship between thevarious orders or modes, so it is not possible to compute the true summa-tion. The actual maximum stress is a direct result of this summation. Fur-
thermore, the TDI method always predicts maximum stress in Crankpin No. 8,
3-1
Assom es
- - - - - - - -__ _-
_ . ERPT M 0 0 21-
which is generally true for a single order in the first mode but not true forthe combined response of all orders and modes.
The dynamic model developed used the same idealized lumped inertia andtorsional spring model as the TDI analysis (Figure 2.1 and Table 2.1) with oneadditional spring placed between the generator and ground to represent theeffect of the grid on dynamic response during synchronous operation.
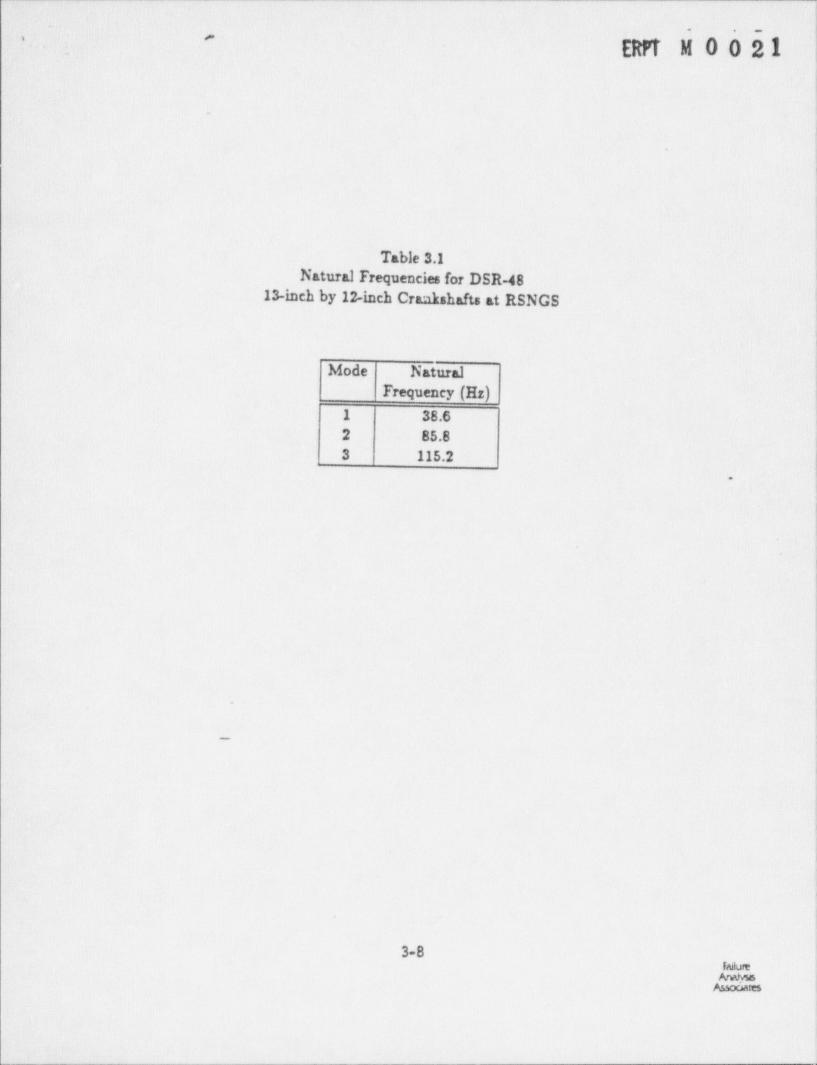
The first three torsional natural frequencies for the RSNGS crankshaftare shown in Table 3.1 [3-1]. The natural frequencies are in agreement withthose computed by TDI and that measured by SWEC. There is also a rigid bodymode which has a natural frequency of 2.9 Hz when the engine is connected tothe grid.
1
When the diesel generator is running at a given speed and power level, '
the forced vibration problem is steady-state where both load and response'
repeat themselves every two revolutions of the crankshaft. To model thedynamic response, a modal superposition analysis [3-2] was used with harmonicload input. The calculation of the harmonic loads will be discussed in thenext section.
3.1.2 Harmonic Loading
To calculate the harmonic loading on a crankshaft it is necessary toconsider gas pressure, reciprocating inertia, and frictional loads. The gas
pressure loading was obtained from pressure versus crank angle data. This
pressure was measured at SNPS by SWEC [3-3]. The pressure was measured inCylinder. No. 7 by inserting a probe through the air start valve. A top dead
center, TDC, mark for Cylinder No. 7 was simultaneously recorded by a probe onthe flywheel. -
The torque produced by this pressure may then be calculated as a func-tion of crank angle. The mean value of this torque should be the torque
required to produce 3500 kW divided by the mechanical efficiency. A mechani-
cal efficiency of 1.0 was obtained, rather than the expected 0.88 to 0.90.
The difference is probably explained by either the pressure measurements being
l
3-2,
- - - - - - - - -
- _ _ _ _ _ _ _ _-_ __ _ ._ . _ _ _
ERPT M 'O O 21''
too low or by the TDC being shifted. Peak pressures were measured in all the
cylinders to ensure that all cylinders were balanced. Normally, the excess
torque above that required to run the engine at 3500 kW is dissipated byfriction.
The reciprocating mass of the connecting rod and piston was found to be
approximately 820 lbs. This mass causes reciprocating inertia torque on the
crankshaft. The effect of this torque was combined with the gas pressure
torque.
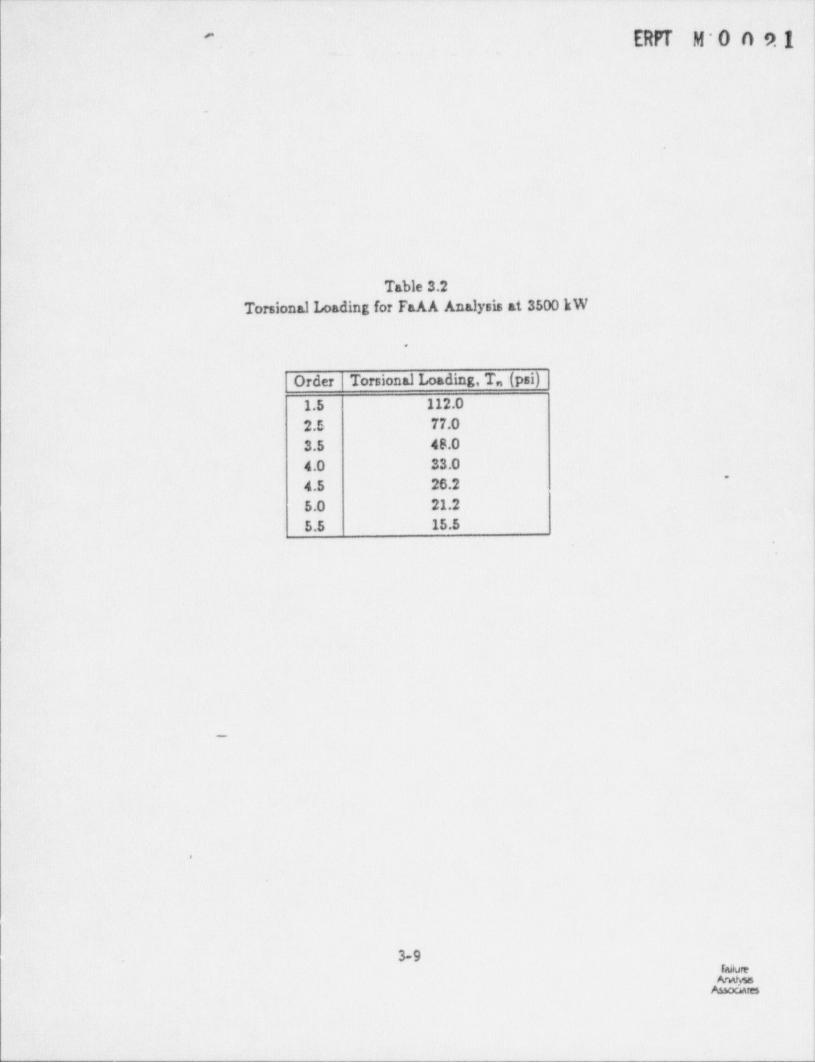
The total torque was then decomposed into its sine and cosine harmonics
corresponding to each order. These torque harmonics were used in the steady-
state analysis. The magnitude of tile torque harmonics are normalized bydividing by the piston area and throw radius. The resulting normalizedtorques for the most significant orders are shown in Table 3.2.
3.1.3 Comoarison of Calculated Response With Test Data.
The response due to the first 24 orders and all 11 modes is calculatedusing modal superposition with 2.5% of critical damping for each mode. The
actual value of damping used has little effect on the response since the'
orders are not at resonance at 450 rpm.
The calculated amplitude of free-end displacement is approximately 10percent greater than the SWEC test measurements at RSNGS [3-1,3-4]. Agreement
is close for all significant orders. This confirms that the pressure versus
crank angle data used provides a good representation of the cylinder pressureloading at RSNGS.
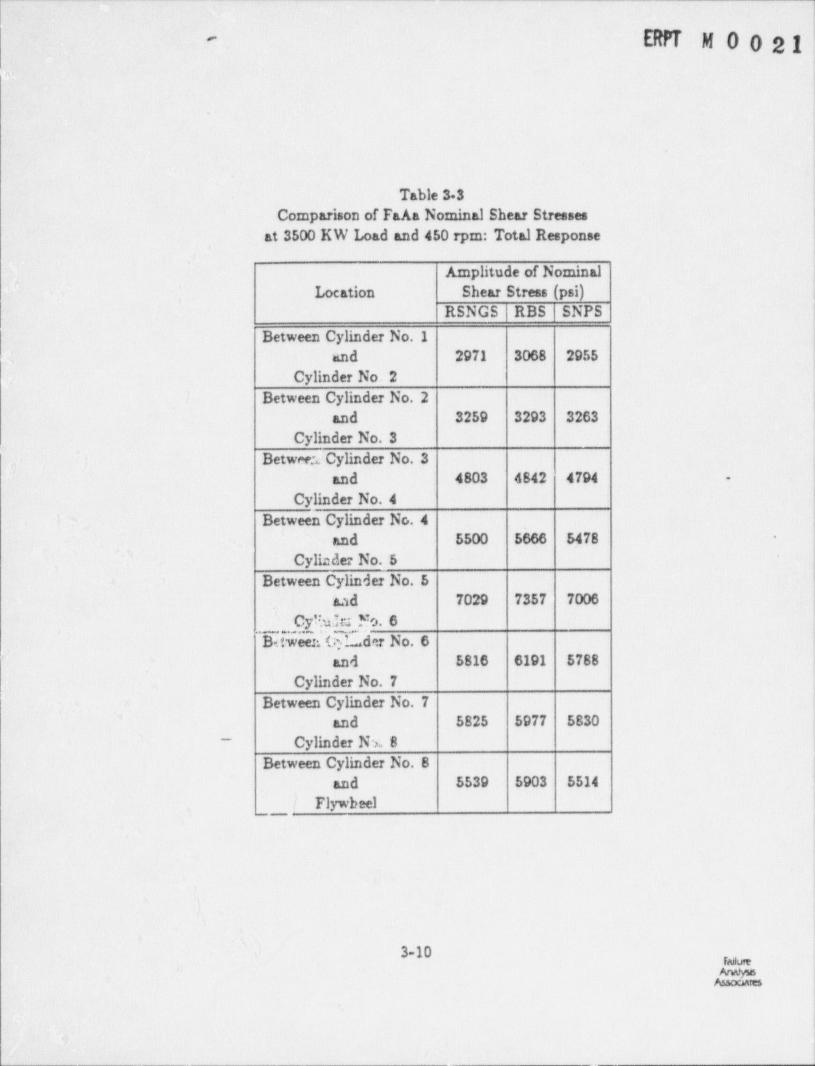
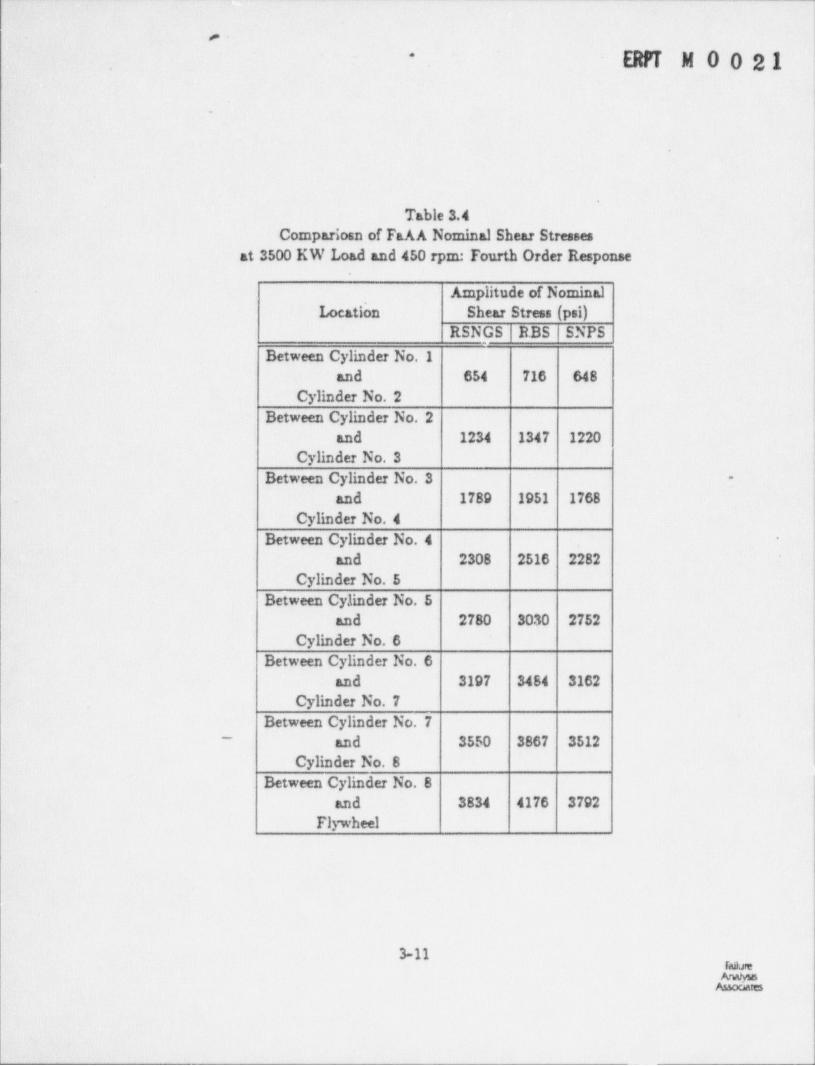
The model also calculates the range of torque at each crank throw, fromwhich nominal shear stresses (t = Tr/J) are calculated and shown in Table 3.3,and 3.4 for the combined and fourth order response. The maximum combined
stress occurs between cylinder number 5 and cylinder number 6. The maximum
fourth order stress occurs between cylinder number 8 and the flywheel.
3-3FMure
Assoca es
-- - _ - - -
'ERPT M 0 0 21
3.2 Calculation of Fillet Stresses'
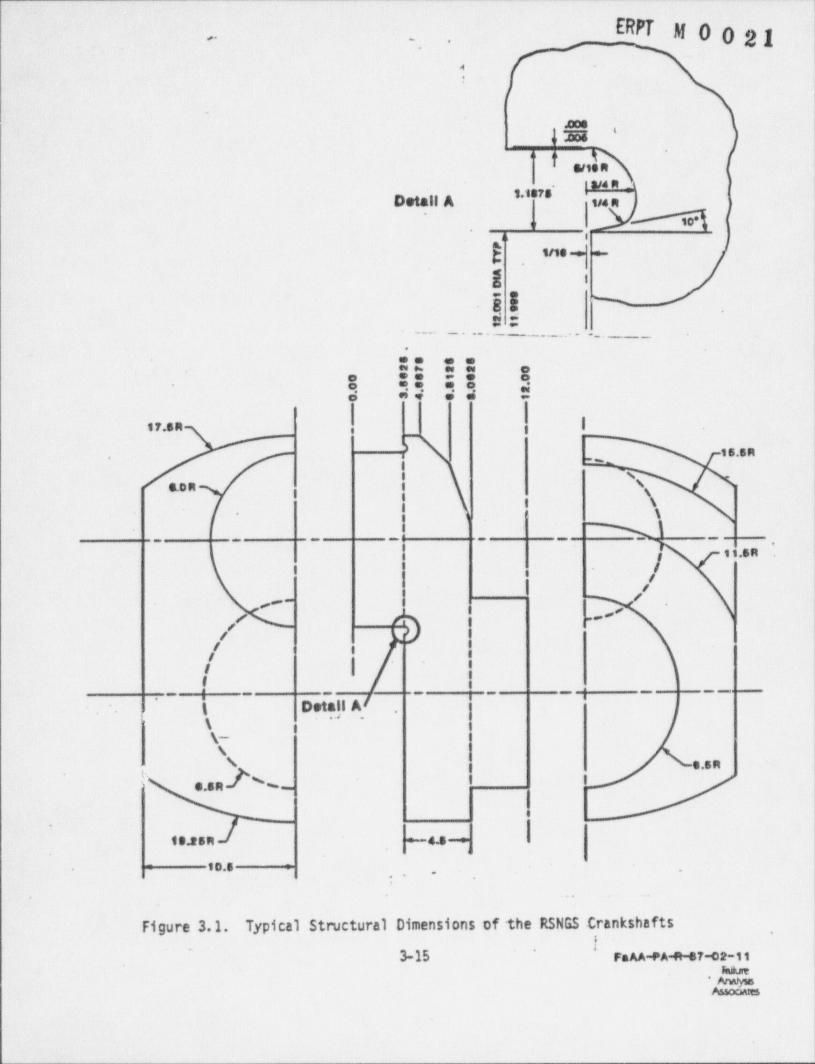
The fillet of crankpin number 5 of a 13-inch by 12-inch crankshaft atSNPS was instrumented with strain gages and tested under operational. condi-tions at 450 rpm and 3500 kW [3-3]. The fillet - geometry of the SNPS crank-shafts is the same as that of the RBS crankshafts as specified in TDI drawing
03-310-05-AC. Figure 3-1 shows typical structural dimensions for the crank-'
shafts.
A dynamic model of the crankshaft confirms that crankpin number 5undergoes the greatest stress. Three-dimensional finite element models of aquarter crank throw were used to determine the location of highest stress,both within the fillet and around the crankpin [3-5]. The strain gage rosettewas placed in this highest stressed location. )
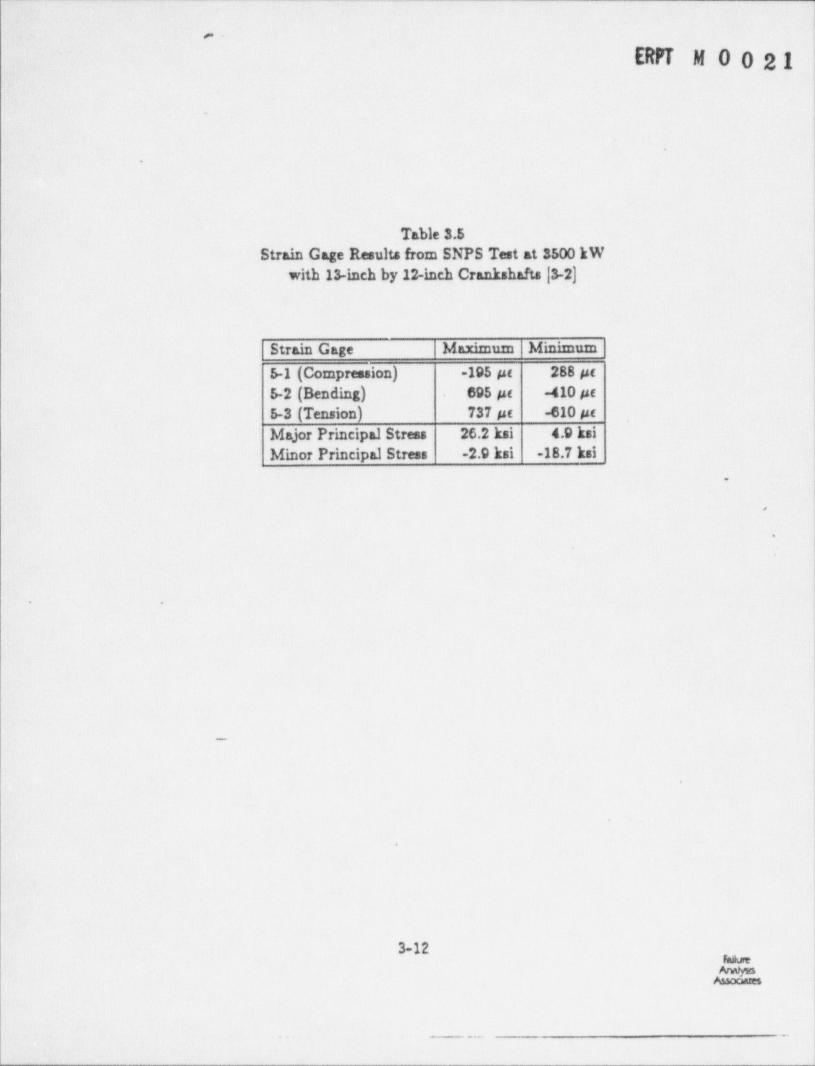
The strain gage results from the SNPS test at 3500 kW are shown inTable 3.5. The calculation of principal stresses from the strain gage resultsare also shown.
|
To account for the simultaneous effects of shear and bending, the
stress state is represented by an equivalent stress using Sine's method [3-
6]. For a biaxial stress state, the equivalent alternating stress, Sqa, andequivalent mean stress, S ,, are given by:q
(3d - S a 2) A/23 +3S *qa a3 4
and S ,= S,t m2+S
q
where _ S and _S are the alternating components of principal stress, andai a2
S,1 and S,3 are the mean components of principal stress. From the SNPS testat 3500 kW [3-3], the equivalent alternating . stress, Sqa, and equivalent mean !
stress, S ,, on crankpin number 5 were calculated to be:q
S , = 24.5 ksiq
S ,= 4.8 ksiq
3-4
res
- - - - - - - - _ _ -
_ _ _ _ _ _ _ _ _ _ _ _ _ _ _ _ _ _ _ _ _ _ _ - _ _ _ _ _ _ . _ ____ __ _ _ _ _ _ - _ - _ _ _ _ _ _ _ _ _ _ _ _ _ _ _ _ _ _ _ _ _ _ - _ _ ___-_-
ERPT N 0 0 21, ,.
Equivalent stresses, S , and S ,, are those alternating and mean uniaxialq q
stresses that_ can be expected to give the same life as the given multiaxialstresses.
To determine the actual fillet stresses at 3500 kW in the RSNGS crank-shafts the value of S , needs to be factored by the differences in nominalq
torsional stress. Thus, the equivalent alternative stress at RSNGS at 3500 kWis given by
S , = 24.6 ( ) = 24.68 ksiq
since the nominal stress at this load is 7029 psi and the nominal torsionalstress at SNPS at 3500 kW is 7006 psi.
3.3 Factor of Safety Against Fatigue Failure
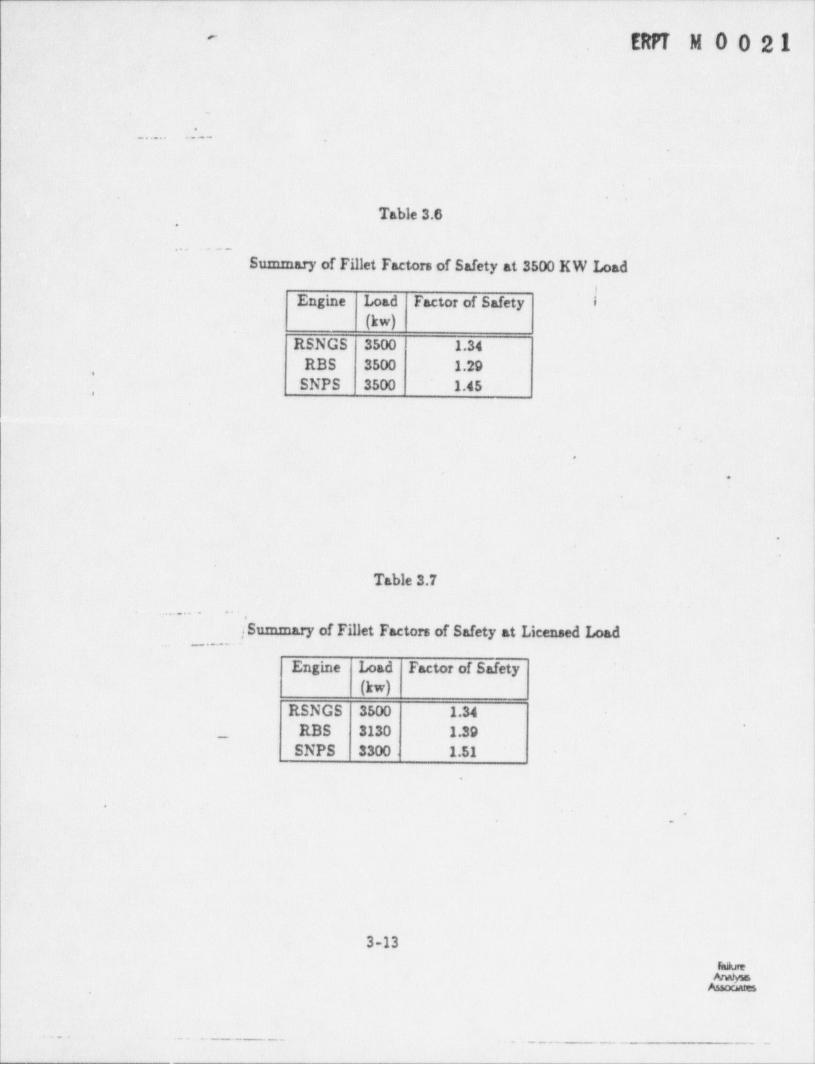
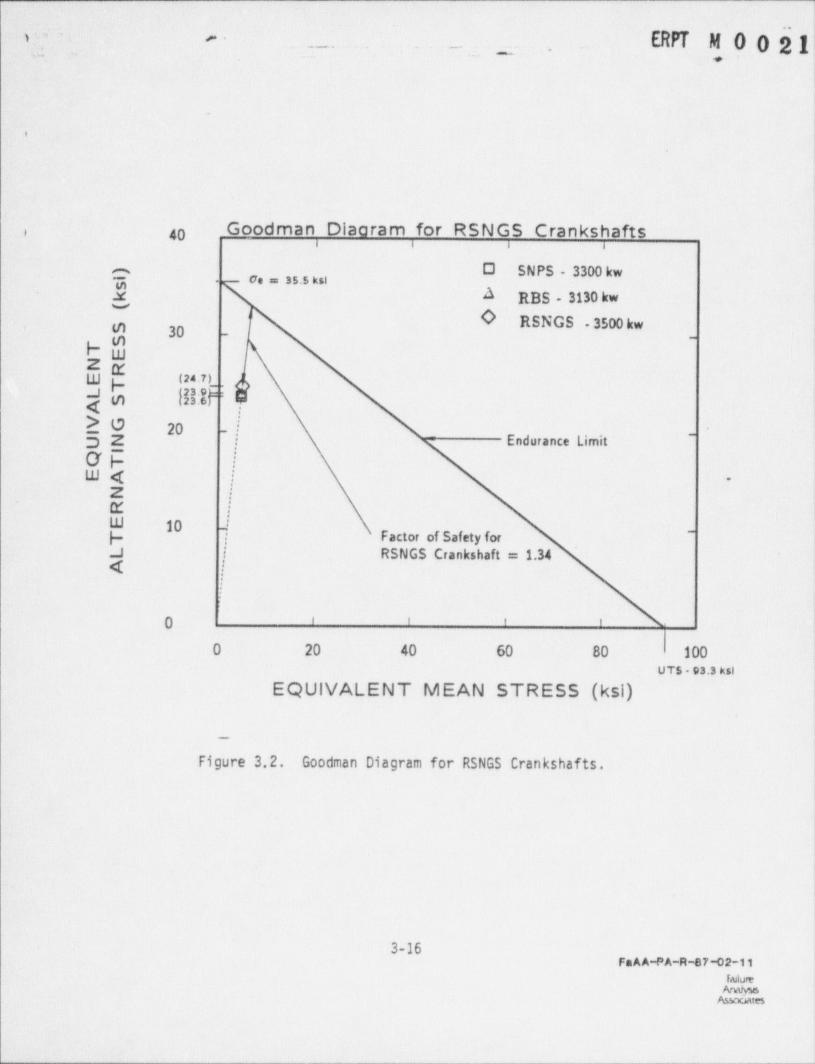
The factor of safety against fatigue failure for the RSNGS crankshafts -at 3500 kW is computed to be 1.34 from the Goodman Diagram in Figure 3.2.This factor of safety is compared with those at SNPS and RBS at 3500 kW inTable 3.6. This factor of safety is computed taking into account both thestress levels and material properties of the crankshaft. At 3500 kW, RSNGS
has a factor of safety which is less than that at SNPS at 3500 kW.
3.4 Calculation of RSNGS Load to Produce Specified Factor of Safety
Table 3.7 also sunnarizes the factor of safety against fatigue failurefor SNPS at its licensed load of 3300 kW which corresponds to the stresslevels in the crankshaft during the endurance test [3-73 and for RBS at 3130kW, its licensed load [3-8]. The load of 3130 kW produces stress at RBS thatare comparable to stresses at 3300 kW at SNPS. This reduced load wasdetermined based upon the 7% stress reducticn for a 10% load reduction asdefined in Section 2.0. The RSNGS factor of safety at 3500 kW is lower thanat both RBS at 3130 kW and SNPS at 3300 kW.
3-5failure
Assocates
_ _ _ _ _ _
_ an M 0 0 21,
,
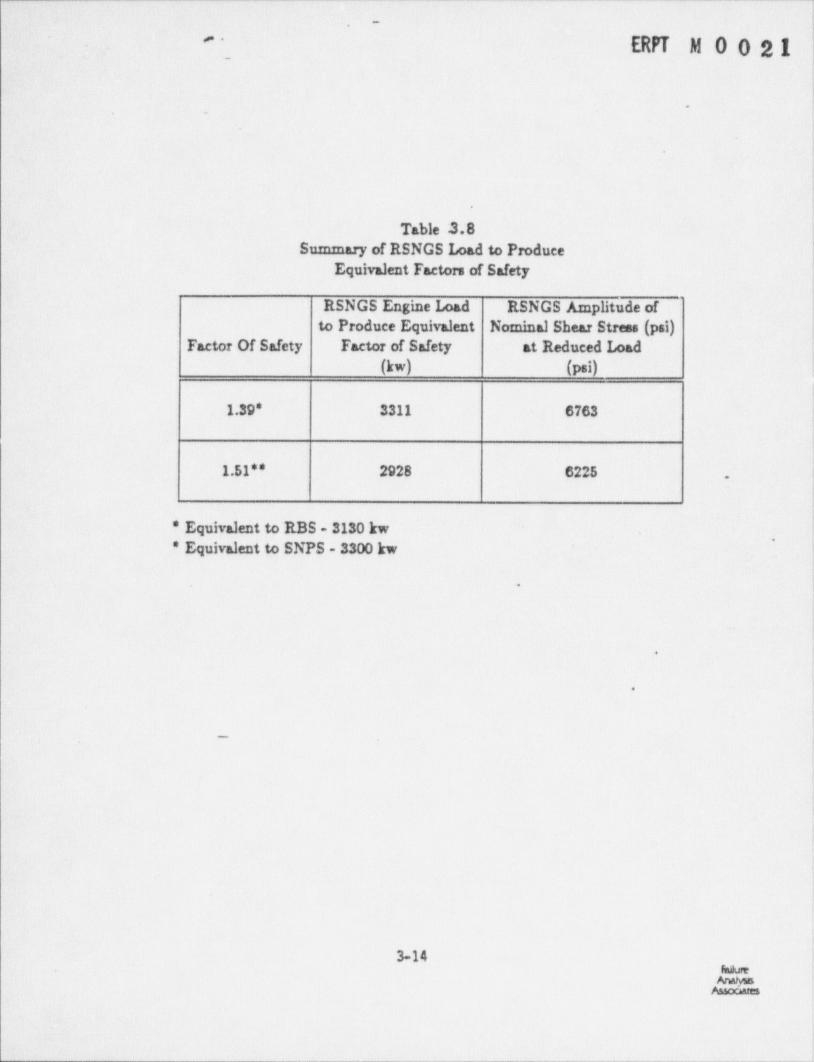
Based upon the linear load versus stress relationship determined inSection 2.0,.the load to produce a specified factor'of safety may be deter-mined. Using this relationship the values in Table 3.8 are obtained; a load
)
of 3311 kW at RSNGS will provide a factor of safety at RSNGS equal to 'that at I
RBS at 3130 kW.
3.5 Conclusions
The following conclusions may be stated:
The results of the analytical model of RSNGS are ir, good agreemente
with test results.
|The actual maximum crankpin fillet stresses at RSNGS at 3311 kW may ie
be determined by scaling the strain gage test data from NSPS at 3500 )kW. |
lThe factor of safety against fatigue failure at RSNGS at 3500 kWe
load is below that of SNPS at its licensed load of 3300 kW and that.of RBS at its licensed load of 3130 kW.
e The RSNGS load required to produce a factor of safety againstfatigue cracking equivalent to that at River Bend Station at 3130 kWis 3311 kW. This factor of safety provides sufficient margin forsafe operation at loads up to 3311 kW.
_
3-6
I'
1
_ __-______________ ___ _
_ - _ - _ _ _ _ _ _ _
'- . ERPT M 0 0 21.
Section 3 References!
I 3-1 Failure Analysis Associates FaAA-SP84-6-10(h)..
3-2 Timoshenko, S., D.H. Young, and W. Weaver, Jr., Vibration Problems inEngineering. Fourth edition, Wiley,1974
3-3 Bercel. E., and Hall, J.R., " Field Test of Emergency Diesel Generator103," Stone & Webster Engineering Corporation, April 1984
3-4 Bercel, E., " Crankshaft Torsional Vibration Measuremetns, EmergencyDiesel Generator 'A', Rancho Seco Nuclear Generating Station," Stone &Webster Engineering Corporation, January 1987.
3-5 " Evaluation of Emergency Diesel Generator Crankshafts at Shoreham andGrand Gulf Nuclear Power Stations," Failure Analysis Associates ReportNo. FaAA-84-3-16, May 22, 1984.
3-6 Fuchs, H.O., and Stephens, R.I., Metal Fatigue in Engineering. Wiley,1980.
3-7 Failure Analysis Associates, " Evaluation of DSR-48 Emergency DieselGenerator Crankshafts at River Bend Station", Prepared for TDI DieselGenerator Owners' Group, Report No. FaAA-85-5-10.
3-8 " Safety Evaluation Report Related to the Operability and Reliability ofIEmergency Diesel Generators Manufactured by Transamerica Delaval, Inc "NUREG-1216, August 1986.
__
e
3-7 m
_ _ _ _ _ _ _ _ _ _ ____________-______ _ __ _ -_ _ _ - __ _ -
__ - . . _ _ - _ _ _ _ _ _ _ _ _ - _ _ _ _ _ _ - _ _ _ _ _ _ _ _ _ _ _ _ _ _ _ _ _ _ _ _ _ - _ _ _
|
- ERIT N 0 5 5 1' '
L|
_
ITable 3.1
Natural Frequencies for DSR-4813-inch by 12-inch Crankshafts at RSNGS '
,
Mode NaturalFrequency (Hz)
.|1 38.6'
2 85.83 115.2
.
.
-
1
!
:
,
l
f3-8failure
AnaMaAuooates
_ _ _ _ _ _ _ _ _ ..
ERfT M 0 o 9.1'
.
Table 3.2Torsional Loading for FaAA Analysis at 3500 kW
.
Order Torsional Loading, T. (psi) |
1.5 112.0
2.5 77.0
3.5 48.04.0 33.0
-
4.5 26.2
5.0 21.25.5 15.5
_
8
- 3-9Fdure
Auocates
. _ _ _ ____ . _ _ _ _ _ _ _ _ _ _ _ _ _ _ _ _ _ _ _ _ _ _ _ _ _ _ _ _ _ _
ERPT M 0 0 21-
~
.
Table 3 3Comparison of FaAa Nominal Shear Stresses
at 3500 KW Load and 450 rpm: Total Response
Amplitude of Nominal'
Location Shear Stress (psi) i
RSNGS RBS | SNPSBetween Cylinder No. I
1 and 2971 3068 2955- Cylinder No. 2
Between Cylinder No. 2and 3259 3293 3263
Cylinder No. 3BetweruCylinder No. 3
"
and 4803 4842 4794 -
Cylinder No. 4Between Cylinder No. 4'
and 5500 5666 5478 -
i'Cylinder No. 5
Between Cylinder No. 5and 7029 7357 7006
Cyb5ra No.6B< tween tyLde.r No. 6
and 5816 6191 5788*
Cylinder No. 7Between Cylinder No. 7
and 5825 5977 5830- Cylinder Ns. 8
Between Cylinder No. 8and 5539 5903 5514
r Flywheel__
3-10
O
t
_ _ . _ . _ . _ _ _ _ _ _ _ _ _ _ _ _ _ _ . _ _ ___s
I {!
e
ERfT M 0 0 21 |fi !
|.*
Table 3.4Compariosn of FaAA Nominal Shear Stresses
at 3500 KW Load and 450 rpm: Fourth Order Response
Amplitude of NominalLocation Shear Stress (psi)
RSNGS RBS SNPS
Between Cylinder No Iand 654 716 648
Cylinder No. 2Between Cylinder No. 2
and 1234 1347 1220Cylinder No. 3
Between Cylinder No. 3 -
and 1789 1951 1768
Cylinder No. 4Between Cylinder No. 4
and 2308 2516 2282Cylinder No. 5
Between Cylinder No. 5and 2780 3030 2752
Cylinder No. 6Between Cylinder No. 6
and 3197 3484 3162Cylinder No. 7
Between Cylinder No. 7- and 3550 3867 3512
Cylinder No. 8Between Cylinder No. 8
and 3834 4176 3792Flywheel |
l
3-11Fdute
_ _ _
_ _ _ _ _ _ _ _ _ _ _ - _ _ _ _
e-
ERPT M 0 0 21
.
.
Table 3.5Strain Gage Results from SNPS Test at 3500 kW
with 13-inch by 12-inch Crankshafts [3-2]
Strain Gage Maxunum Minimum |5-1 (Compression) -195 pc 288 pc
5-2 (Bending) 695 pc -410 pc
5-3 (Tension) 737 ue -610 ye
Major Principal Stress 26.2 kai 4.9 ksiMinor Principal Stress -2.9kai -18.7 ksi
-
#
e
' e
eene
3-12 me
. . -
m_-m_. .___-_ _. __._ _ _ _ __
_ - - _ -
ERN M 0 0 21-
_
....... . --.
Table 3.6.
.. . ..
Summary of Fillet Factors of Safety at 3500 KW Load
!Engine Load Factor of Safety i
(kw)RSNGS 3500 1.34
RBS 3500 1.29'
SNPS 3500 1.45.
.
.
.
Table 3.7
.... . . . ,
| Summary of Fillet Factors of Safety at Licensed Load__. _.
Engine Load Factor of Safety(kw)
RSNGS 3500 1.34
_ RBS 3130 1.39SNPS 3300 1.51
.
e
e
3-13ram-
... . . -. _ .. . . . _ .--. -.
_ __ ___________________--s---_- - - -- -- - - - - -
. - _ _ _
~
ERN M 0 0 21'-
_
-.
Table 3.8Summary of RSNGS Load to Produce
Equivalent Factors of Safety
RSNGS Engine Load RSNGS Amplitude ofto Produce Equivalent Nominal Shear Stress (psi)
Factor Of Safety Factor of Safety at Reduced Load
(kw) (psi)
1.39* 3311 6763
1.51 * * 2928 6225 .
* Equivalent to RBS - 3130 kw,
* Equivalent to SNPS - 3300 kw '
.
4
0
m
I
3-14raan
_ ____---_
__ _ _ _ _ _ _ _ _ _ _ .
ERPT g o 0 2 1. .,
o
:
-
.aos '2i5o
g-
o owie n i
<
i nu n '.
Detail A '1M I b''''#"
.
po,
n i t
g . , , , . . _
g i <
i Iis t
. . . . - . . . . . . . .. _
**".4 : .
. .. . .o *M ** A. me .e -
I I1
i17.sn i t_,
'
is.sn_,
, sS.O n I s
\' '| t \
. > \
N,I I, _ _ _- - - - -
.
| i s.sn)s , ,
! /<- -
/ * ' ,
/ /.T'J |!
,
/a/ a g
/ I e!. 8
; - --_ _ _ _ _ --
l' *
l Deta,ll A. .
..
\ t\-As , e.sn
' s.sn %
.
t o.asm - 4.s --
- so.s '
,,-.
..
Figure 3.1. Typical Structural Dimensions of the RSNGS Crankshafts,
-
3 15- I-
FaAA-M + 47-02-11raan
*ANWmAssooms
- _ _ _ - - _ - - _ - _ _ _ _ _ _ _ _ -
- - - - - - - -
v;. - - . . .
.ERPT M 0 0 2 1--
.,- -. _ . . . . .
_
.
, 40 Goodman Dlaaram for RSNGS Crankshaftss s s s
O wn - m wc. ,, . 3 s.s u,,
.$ A RBS - 3130 kwvO RSNGS - 3500 kwM 30 -
h-
WZgWp (24.7)_
<m {$!:$h_d:
20 20 -| -
>Z ; Endurance Limit=
GF |W< | -
Z !K !W 10 i -
F j Factor of Safety for.J i RSNGS Crankshaft = 1.344 |
:
0 ' ' ' '
0 20 40 60 80 100UTS - 93.3 ksi
EQUIVALENT MEAN STRESS (ksi)
-
Figure 3.2. Goodman Diagram for RSNGS Crankshafts.
3-16FaAA-PA-R-87-02-11
m.
- _ _ - - _ _ _ - - _ - - _
''
ERN N 0 5 514.0 CopFLIANCE WITH NRC SAFETY EVALUATION RECOP9ENDATION
The NRC Safety Evaluation Report Related to the Operability and Relia-
bility of Emergency Diesel Generators Manufactured by Transamerica Delaval,Inc.-[4-1] states that the torsiograph test results and torsional stressescalculated for RSNGS should be compared with similar data for SNPS and RBS.The staff further notes that the crankshaft material properties as obtainedfrom material certification ' reports should be compared with SNPS and RBSdata. These recommendations are consistent with those made by PacificNorthwest Laboratory, PNL, in their review of resolution of known problems inengine components for TDI diesel generators [4-2). In addition PNL suggestspreservice crankshaft inspections be performed. Depending upon the outcome ofthese comparisons and inspections, a " qualified" load capacity is to be esta-blished for RSNGS. Once a " qualified" load capacity for the RSNGS engines has
~
been satisfactorily established, recommendations for the SNPS and RBS crank-shafts are applicable [4-2].
Sections 2.0 and 3.0 compare the torsiograph test results and torsional.stresses for RSNGS with SNPS and RBS. The comparison indicates that theresponse of the crankshafts at RSNGS are similar to those at SNPS and RBS. .The crankshafts at all plants comply with DEMA recommendations for singleorder and combined response. In addition, it was shown that the RSNGStorsiograph test data is consistent with that from SNPS and RBS indicating alinear variation of crankshaft response with load.
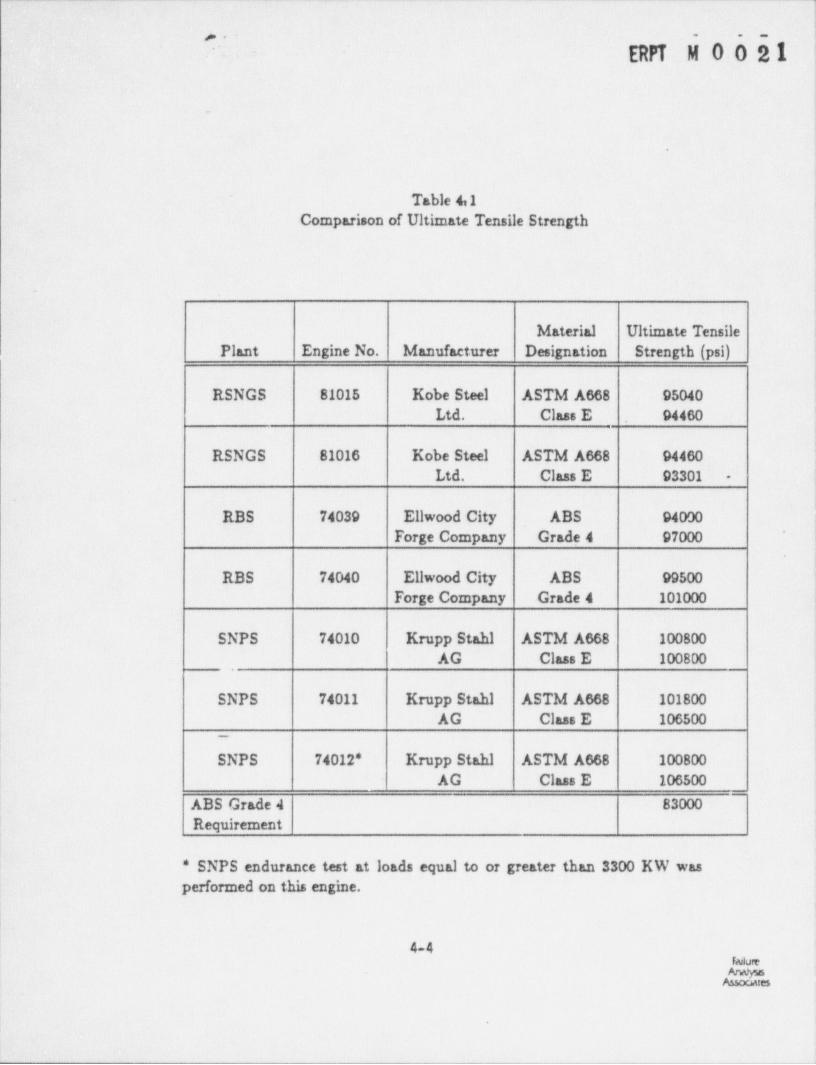
The material specification for the crankshafts at RSNGS, RBS and SNPSwere the same. Crankshafts at all plants were required to meet ABS Grade 4which has a minimum ultimate tensile strength, UTS, of 83000 psi. The UTSmeasurements fof RSNGS, RBS and SNPS are shown in Table 4.1. The lowestmeasurement is 93301 psi at RSNGS, 94000 psi at RBS and 100800 psi at SNPS.The crankshafts at both stations meet the min'imum requirements of ABS Grade 4 I
and have UTS values within the expected range for this material.
Based upon the above comparisons, a factor of safety against fatiguefailure for the RSNGS crankshafts at 3500 kW was determined and compared with
,
those at SNPS and RBS at their licensed load. The comparison indicated that
4-1Falwe
tes
i
_ _ _ _ _ - _ _ _ - _
ERR N!0'd 51--
!
ithe RSNGS factor of safety at 3500 kW is lower than at both RBS and SNPS attheir licens_ed loads. Based upon the linear load versus stress relationshipdetermined in Section 2.0, a load of 3311 kW at RSNGS would provide a factorof Safety at RSNGS equal to that at RBS at its licensed load. Operation of '
RSNGS crankshaft at 3311 kW provides sufficient margin for safe operation ofthe crankshafts.
The NRC Safety Evaluation Report on the TDI Diesel Generator OwnersGroup Program Plan, [4-3) provides that where TDI diesels are to be operatedat brake mean effective pressures exceeding 185 psig, the applicant shouldsubmit information demonstrating that components, which are of the samedesign, have operated successfully for.at least ten million load cycles whichmeet or exceed the maximum emergency service load requirements for the subjectengines. The following comparison can be made with an endurance test per-formed on one of the SNPS crankshafts. Alternatively, a design may be quali-
7fied by testing a prototype to 10 cycles at the rated load where additionaldata is available to demonstrate an adequate fatigue margin. In this case the,endurance test is being used to provide additional assurance of the adequacyof the design even though the test by itself would not represent sufficient
iassurance.
7A 10 cycle endurance test was run on a DSR-48 engine crankshaft with13-inch main journals and 12-inch crankpin journals at a load of 3300 kW* atSNPS. The crankpin fillet and oil hole geometry are identical for the crank-shafts at RSNGS and those at SNPS. The crankshafts were made according to TDIdrawing number 03-310-05-AC.
While the crankshafts are of the same design for the two stations, theflywheel and generator are somewhat different. This difference leads to a
;
small change in the torsional stresses for the crankshafts as discussed inprevious sections of this report. To account for these design differences the l
* Ine endurance test has been stated to be nominally at 3300 kW. However,Dr. Pischinger (FEV) performed a cumulative damage analysis of the crankshaft |based on the actual loads experienced during the 745 hour endurance test andfound the load to be equivalent to 3505 kW [4-3).
4-2i
FMure
Assooa es
- - - - - - - - - - - -
-
'. ;; - - ERPT M 0 0 21-
-
load at RSNGS that produces the same torsional stress as a load of 3300 kW at
SNPS may be _ calculated. This calculation is based on the linearity of stresswith load which has been established in Sections 2.0 and 3.0. Based on a 7%change in stress for a 10% change in load, a load of 3285 kW at RSNGS ' produces
the same stress as a load of 3300 kW at SNPS.
The fatigue limit for these crankshafts is approximately proportionalto the UTS of the material. Thus, the factor of safety in the SNPS crank-shafts at 3300 kW is approximately 9% higher than in the RSNGS crankshafts at3285 kW. However, this effect is small in comparison to the factor of safetyin the RSNGS crankshafts.
The crankpin fillets at SNPS are shot peened whereas those at RSNGS'arenot. While no credit was taken for the effect of shot peening in computingfatigue margins, it is possible to estimate the maximum effect that it couldhave had on the crankshaft endurance test. The stresses in the most highlystressed main journal oil hole is computed to be about 7% less than that ofthe most highly stressed crankpin fillet. Thus, if shot peening has more tharra 7% effect on the crankpin fillets, the oil holes will govern crankshaftlife. This 7% effect is quite small when compared to the safety margin.
4.1 Conclusions
The following conclusions may be stated:|
e The crankshafts at RSNGS are geometrically identical to those atSNPS
,
e Based upon comparisons of the torsiograph test data, analyticalstresses _, and material properties a load of 3311 kW at RSNGS is ;in compliance with the NRC safety evaluation report. )
|
I
4-3 Assmates
- _
_ _ _ _ _ _ _ _ _ _
-
ERPT M0021Section 4 References
4-1 " Safety' Evaluation Report Related to the Operability and Reliability ofEmergency Diesel Generators Manufactured by Transamerica Delaval, Inc.".NUREG-1216, U.S. Nuclear Regulatory Comittee, August 1986.
4-2 Technical Evaluation Report, " Review of Resolution of Known Problems in '
Engine Components for Transamerica Delaval, Inc. Emergency DieselGenerators'," prepared for NRC by Pacific Northwest Laboratory, PNL-5600,December 1985.
4-3 U.S. NRC Atomic Safety and Licensing Board hearing on Shoreham NuclearPower Station Docket No. 50-322-OL, Tr. 28419-20.
4-4 U.S. NRC Atomic Safety and Licensing Board hearing on Shoreham NuclearPower Station, Docket No. 50-322-OL, Tr. 28503.
4-5 FaAA Report and Support Package for FaAA-85-5-10.
.
4
0
_
4-4- raiiwe
Assocates
.
___.m__ _ _ . _ _ _ _ __ _ - - _ - _ -
_ - _ _ _ _ _ _ _
- -
ERPT U 0 0 5 1'>
_
.
Table 4,1Comparison of Ultimate Tensile Strength
,
Material Ultimate TensilePlant Engine No. Manufacturer Designation Strength (psi)
RSNGS 81015 Kobe Steel ASTM A668 95040Ltd. Class E 94460
RSNGS 81016 Kobe Steel ASTM A668 94460Ltd. Class E 93301 -
RBS 74039 Ellwood City ABS 94000Forge Company Grade 4 97000
RBS 74040 Ellwood City ABS 99500Forge Company Grade 4 101000
SNPS 74010 Krupp Stahl ASTM A668 100800AG Class E 100800
SNPS 74011 Krupp Stahl ASTM A668 101800AG Class E 106500
_
SNPS 74012* Krupp Stahl ASTM A668 100800AG Class E 106500
ABS Grade 4 83000-
Requirement
* SNPS endurance test at loads equal to or greater than 3300 KW was| performed on this engine.
l
|4-4fFalure
421, '
;
,
- _ _ - - _ _ _ - - _ - _ - _ _
-_ _-
~ ~
ATT A c.H M E A>T- To~ EltPT- M oo n I~
(FA A A '- PA - R- 97-0 3 -i t h ..
FaAA-85-5-10- QRGS
EVALUATION OF DSR-48 EMERGENCY DIESEL
GENERATOR CRANKSHAFTS AT RIVER BE M STATION
Prepared by,
Failure Analysis AssociatesPalo Alto, California
1
Prepared for,
- TDI Diesel Generator Owners' Group
May 18,1985
.|1
|
_ _ _ ___-- _ A
_ _ - _ _ _ _ _ _ _
ERfT M 0 a 9.1!. .- _ . . .
{f TABLEOFIJNTENTS;'
.,
1
1.0 I INTRODUCTION AND StMMARY. . . . . . . . ............................... 1-1
2.0 C(MPLI ANCE OF CRANKSHAFT WITH DEMA JCOMEWAT!0NS . . . . . . . . . . . . . . . . 2-1
2.1 Revi ew of TDI Torsi onal C riti cal Speed . . . . . . . . . . . . . . . . . . . . . . . 2-12.2 Review of Stone & Webster Engineering Corporation
Torsiograph Test............................................. 2-32.3 Conclusions.................................................. 2-6
3.0 FATIGUE ANALYSIS OF CRANKSHAFT.................................... 3-1
3.1 C rankshaf t Dynami c Torsi onal Analysi s . . . . . . . . . . . . . . . . . . . . . . . . 3-13.2 Calculation of Fillet and Oil Hole Stresses.................. 3-53.3 Endurance Limit for Crankshafts.............................. 3-73.4 F actor of Safety Agai nst Fati gue F ail u re. . . . . . . . . . . . . . . . . . . . . 3-83.5 Conclusions.................................................. 3-8
4.0 CRANKSHAFT ENDURANCE TEST......................................... 4-1
4.1 Conclusions.................................................. 4-3
.
5.0 CRANKSHAFT FILLET AND OIL HOLE I NSPECTIONS . . . . . . . . . . . . . . . . . . . . . . . . 5-1
5.1 C rankpi n Fi ll et Eddy Current E xami nati on . . . . . . . . . . . . . . . . . . . . . 5-15.2 Crankshaft Oil Hole Liquid Penetrant Examination............. 5-15.3 Crankshaft Oil Hole Eddy Current Exami nation.... . . .... ... .... 5-15.4 Conclusions.................................................. 5-2
i
ll
''- !
ERPT M 0 0 21 I
1.0 INTRODUCTION AND SlDMARY_
An evaluation of the 13-inch by 12-inch crankshafts installed in theemergency diesel generators at River Bend Station, RBS, was performed to |
determine the adequacy of the crankshafts for their intended service. This )report summarizes the results of testing, analyses, and inspections performedon the crankshafts in the two Transamerica Delaval Inc., TDI, DSR-48 enginesinstalled at RBS.
i
)The TDI part number for the crankshafts at RBS is 03-310-05-AC. The
plant ID for engine serial no. 74039 is 1EGS*EG1A (EG1A) and for engine serialno. 74040 is 1EGS*EG1B (EG1B). The forging and machining of the crankshaftswas performed by Ellwood City Forge Corporation.
Significant testing and evaluation of 13-inch by 12-inch crankshaftsinstalled in the TDI DSR-48 engines at Shoreham Nuclear Power Station, SNPS,has been performed. The part number for the crankshafts at SNPS is
03-310-05-AC. Fatigue damage was discovered in the original 13-inch by 11 ~inch crankshafts at SNPS and the replacement crankshafts installed are of thesame design as those in use at RBS. The two crankshafts have identical crank-shaft stiffness, inertia and fillet geometry. The main differences in the twotorsional systems are that the engines have different flywheel and generatorinertias and a different shaft stiffness between the flywheel and generator.Due to the similarities of the two torsional systems the response of the
,
crankshafts are similar, and this similarity has been demonstrated by analysisand testing.
The testing on the crankshaft at SNPS consisted of dynamic strain gagemeasurements to determine maximum stresses, torsiograph testing and an endur-ance test run for 107 cycles at loads equal to or greater than 3300 kW.Dynamic torsional analysis and stress analysis have been performed on the SNPScrankshaft. In addition, the detailed investigation of the failure of the
,
original 13-inch by 11-inch crankshaft at SNPS provides data for evaluation ofthe fatigue life of the crankshafts. To utilize the data available from theevaluation of the SNPS crankshafts, similarities and comparisons to the RBScrankshafts will be made throughout the report where appropriate.
1-1
.__ _ _____ _ _______ -_____ _ ___ ____ ______ _________
_ _ _ _ _ _ _ _ _ _ _ _
'
ERM M 0 0 21- -s
The crankshaft is required to meet the recommendations of the DieselEngine Manufacturers Association, DEMA. In Section 2.0, the RBS torsional
design calculations prepared by TDI and the results of the torsiograph testsperformed at RBS by Stone & Webster Engineering Corporation, SWEC, arereviewed for compliance with DEMA stress allowables. The relationship betweentorsional response and engine load is determined based on the results of thetorsiograph test. The crankshafts at RBS meet the DEMA allowables for singleorder and combined order stresses at 450 rpm and 3500 kW.
The fatigue analysis to determine the safety margin of the crankshaftsat RBS at 3130 kW is discussed in Section 3.0. Amendment 16 to the FSAR
states 3130 kW as bounding the maximum emergency service loads. A dynamic
torsional analysis of the crankshaft is performed to determine the stress
A levels in each cylinder of the crankshaf t. This model is compared with theSWEC test data for the amplitudes of f ree-end vibration. Stress values atfull load are determined over a range of iS% of rated speed.
.
The fatigue endurance limit is established for the crankshafts at bothRBS and SNPS by first obtaining the endurance limit for the failed crankshaftat SNPS from strain gage test data c.nd a review of literature. The dif-ferences between the failed crankshaft and those in use at RBS and SNPS arethen assessed and the endurance limit is then scaled to account for thesedifferences.
Utilizing the SNPS dynamic strain gage test data, the factor of safetyagainst f atigue failure is calculated to be 1.39. This value for the factorof safety is established with more confidence than usual on account of thedynamic strain Sage testing of a similar crankshaft at SNPS, and on account ofthe endurance limit established from the failed crankshafts at SNPS. The
vari ation of the factor of safety over the tS% rated speed range is then
reviewed. The reduction in the factor of safety at overspeed compared withrated speed is found to be small in comparison to the safety margin .
In Section 4.0, the RBS load that produces stress levels equal to those7in the SNPS crankshaft during the 10 cycle endurance test is determined. The
applicability of the SNPS endurance test results to the crankshafts at RBS isdiscussed.
1-2
__ ._. _____-_ __ __- _ _ _ _ _ _ - _ _

- - - _
2: ERPT M 0 0 E l"
The safety margin of 1.39 for the RBS crankshafts at 3130 kW demon-strates that'the crankshafts are adequate for their intended service at loadsnot exceeding 3130 kW.
,
t
.
-
1-3
- _ _ - - _ _ _ _ _ - _ _ _ _ _ _ _ _ _ _ _ _ _ _ _ _ _ _ _ _ _ _ _ _ _ _ _ _ _ _ _ _ . _ _ _ _ _ _ _ _ _ _ _ _ _ _ _ _ _ _ .____________________-_ _ _ _ ___ _ _
_ _ - _ _ _ _ _ _ _ _ _ _
*.
ERf'T M 0 0 212.0 C(MPLIANCE OF CRANKSHAFT WITH DEMA RECOP9tENDATIONS
_
The purchase specifications for the diesel generator sets required thatthe - recommendations of the Diesel Engine Manufacturers Association, DEMA[2-1], be followed. These recommendations state:
In the case of constant speed units such asgenerator sets, the objective is to insure, that noharmful torsional vibratory stresses occur within fivepercent above and below rated speed.
For crankshafts, connecting shafts, flange orcoupling components, etc., made of conventionalmaterials, torsional vibratory conditions shall gener-ally be considered safe when they induce a superim-posed stress of less than 5000 psi, created by asingle order of vibration, or a superimposed stress ofless than 7000 psi, created by the summation of themajor orders of vibration which might come into phaseperiodically.
In March,1975, Transamerica Delaval Inc. (TDI) performed a torsional-,
critical speed analysis of the crankshaf ts at RBS [2-2]. References to TDIanalysis in the body of this report all reference this effort. In Section2.1, this analysis will be reviewed for compliance with the above allowablestresses. Where appropriate, data for SNPS will be included in the tables forcomparison [2-3]. In September 1984 and again in May 1985, Stone & WebsterEngineering Corporation, SWEC, conducted torsiograph tests on the crankshaf tin EG1A at RBS [2-4, 2-5]. In Section 2.2, the test results will be comparedwith the above allowable stresses.
2.1 Review of TDI Torsional Critical Speed Analysis.-
Diesel generator torques due to dynamic response are usually calculatedin two steps. First, the torsional mode shapes and natural frequencies ofvibration are calculated. Second, the dynamic forced vibration response dueto gas pressure and reciprocating inertia loading is calculated. TDI calcu-lated the response at 100% of rated load of 3500 kW.
!
2-1
_ ___-___________ - ____
_. - _ _ _ _ _ _ _ _ _ _ _ _ _ .
. ERM M 0 0 51 -~
2.1.1 Natural Frequencies_
The first step in a torsional critical speed analysis is to determinethe natural frequencies of the crankshaft. The engine speed at which a givenorder resonates may then be calculated. The diesel generator is modeled as asystem of lumped mass moments of inertia interconnected by torsional springs,as shown in Figure 2-1. The inertia and stiffness values are shown inTable 2.1.
It has long been standard practice in the diesel engine industry tosolve this eigenvalue problem by the Holzer method [2-6]. This method hasbeen used for at least 40 years [2-7], and thus is well established.
TDI used the Holzer method to calculate the system's first three natu-ral frequencies, which are shown in Table 2.2. The first natural frequencywas found to be 38.0 Hz, which produces 4th order resonance at 570 rpm.
2.1.2 Nominal Stresses *
The second step in a torsional critical speed analysis is to determinethe dynamic torsional response of the crankshaft due to gas pressure and re-ciprocating inertia loading. The 1st order is a harmonic which repeats onceper revolution of the crankshaft. For a four-stroke engine, harmonics of or-der 0.5, 1.0, 1.5, 2.0, 2.5. . . exist. TDI performs this calculation for eachorder of vibration up to 12.0 separately. For each order, the applied torqueat a cylinder due to gas pressure and reciprocating inertia is calculated.The values of this torque for each order are usually normalized by dividing bythe piston area and throw radius. The normalized value for the nth order isreferred to as-T . The values of T for significant orders used by TDI aren n
shown in Table 2.3. These values may be compared to those recommended byLloyd's Register of Shipping, LRS [2-8]. It is found that TDI's values arehigher than LRS's values for low orders and lower for high orders. However,
the stress from the measured largest single order was found to be within 5% ofthat computed by TDI. The response is then calculated by one procedure if theharmonic is at resonance and by another if the harmonic is away from reso-nance.
2-2
_ _ _ _ _ _ _ _ _ _ _ _ _ _ _ _ _ _ _ _ _ _ - _ _ _ _
-_ - -
, 2 ERPT M 0 0 21-'
I
At resonance, the torsional vibration amplitudes would increase indefi-nitely in the absence of damping. The solution is obtained by balancing theenergy input with the energy loss due to damping. TDI used an empirical formof hysteresis damping due to friction. The purpose of this calculation is toensure that the diesel generator could be brought up to operating speed with-out undergoing excessive stresses as critical speeds are passed. Observationshave shown that excessive vibration during startup does not occur [2-4, 2-5).
Away from resonance, the torsional vibrations reach a steady-statelevel even without the aid of any damping. The magnitude of this response foreach structural mode and loading order is calculated as the product of a i
dynamic amplification factor and an equivalent static equilibrium amplitude.| The equivalent static equilibrium amplitude is computed using a modal load and
modal stiffness [2-9] for the nth order harmonic and given mode shape. Thenominal shear stress, t, in the 12-inch pin of Crankpin No. 8 for each orderis then calculated from the dynamic torque, T, using i = Tr/J, where r is thepin radius and J is the polar moment of inertia. *
TDI calculated the response for the first three modes and plotted theresults for only the fi rst mode since higher modes produce much smallerstresses. The nominal shear stresses for the significant orders are shown inTable 2.4. It is seen that the largest single order stress of 3321 psi atrated load and speed for the 4th order is well below the 5000 psi DEMA allow-able.
TDI does not calculate the associated phase angle with the response of ;
each order, so that it is not possible to calculate the combined response.The measured combined response will be compared with the allowable in the nextsection.
2.2 Review of Stone & Webster Engineering Corporation Torsiograph Test
The purpose of the torsiograph test of the emergency diesel generatoris to measure the angular displacements of the forward end of the crank-shaft. These displacements are then used in conjunction with a dynamic tor-sional analysis of the crankshaft to confirm the results of the vibrational
2-3
_
_ - - - - - - - -- ,
M '
BW M 0 0 21 i"
|
.
analysis and to assess the maximum stresses in the crankshaft. The torsio- !|
graph response may be decomposed into components corresponding to each order
and the peak-to-peak response may also be obtained. The torsiograph. test is j
usually performed in two stages. The first stage is performed without load atvariable speed and is used to determine the location of critical speeds.Critical speeds may also be determined while operating at a fixed speed andobserving the frequency content of the response. The second stage is per- iformed at rated speed of 450 rpm with variable load, and is used to confirmthe forced vibration calculations. These tests collect data during steady j
state operation. Data may also be obtained during transient (start-up, coast-down, misfiring) operations to assess the response of the crankshaft during I
these events.I
Two torsiograph tests were performed on EG1A at RBS by SWEC. The first I
test, which was performed in September 1984, concentrated on collecting data'|during steady-state operation [2-4]. The second test, performed in May 1985,
collected data during transient operation and repeated the variable load. !
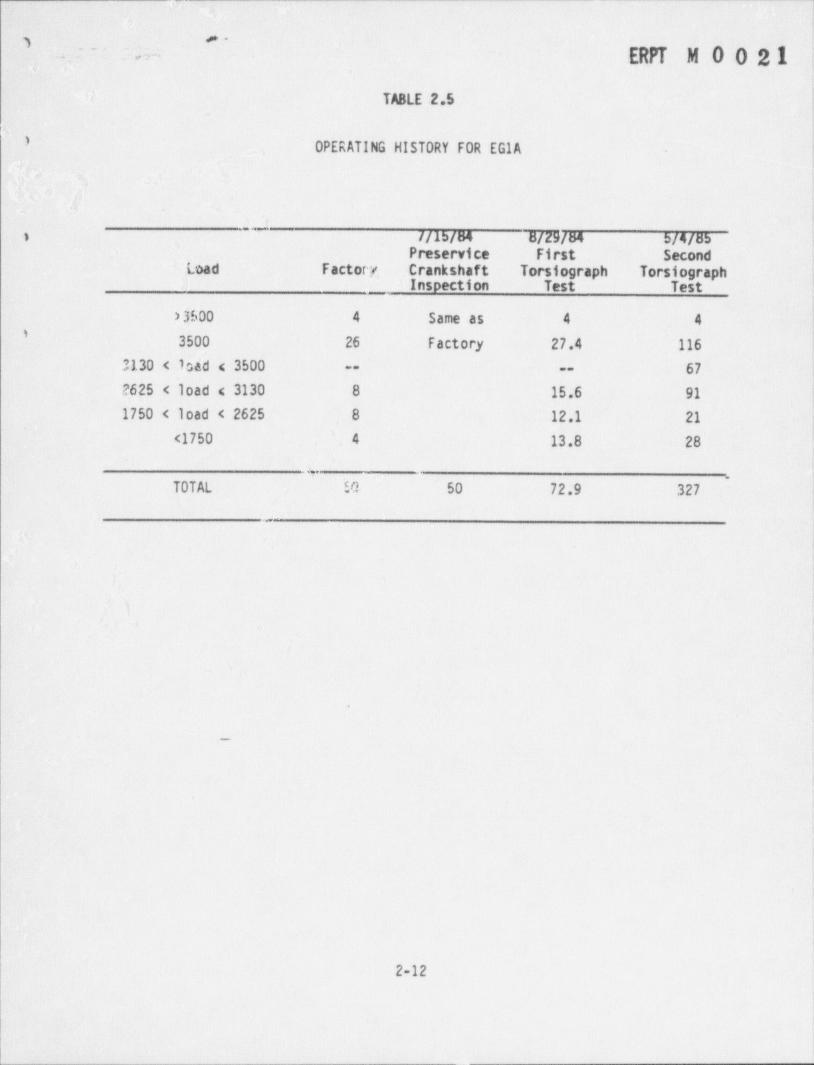
portion of the prior test to determine the response after the engine had beenrun in [2-5]. The operating history estimated from test engineers logs forEG1A and EG1B at the time of these tests are summarized in Tables 2.5 and
(|2.6. The results of these tests are discussed and compared with the results j
of the torsiograph test performed at SNPS [2-10] in the following sections. j
IThe torsiograph response of the crankshaft at full load for each test |
1s shown in Table 2.7. This comparison indicates that EG1A is better balanced !
now than at the time of the first torsiograph test. This is indicated by the
lower half order response recorded during the second torsiograp test. The
total response _of the engine also shows a decrease. This decrease in responseis typical of an engine after run-in. At the time of the second test EG1A had120 hours of operation at 3500 kW or greater, 87 more than at the time of the l
J
first torsiograph test. The response of the engine during the second test isindicative of the future response of the engine. Torsiograph data presented |in this section will be taken from the second torsf ograph test. l
|
J
2-4
|
l
_ _ - _ _ _ _ _ _ _ - _ _ _ ___ ._
''-
ERPT M 0 0 21
2.2.1 Natural Frequencies
The frequency content of the torsional vibration signal indicated thetorsional resonant frequency of the system was 38.1 Hz [2-4]. This value is |
in excellent agreement with TDI's computed value of 38.0 Hz.
2.2.2 Nominal Stresses at Full Load
The torsiograph response of the crankshaft at full load for significantorders along with the peak to peak amplitude is . shown in Table 2.8. The
amplitude of nominal shear stress may be estimated from the free-end vibrationby assuming that the shaft is vibrating in its first mode. This assumption istypically used to estimate maximum stresses from torsiograph vibration data.However, a more accurate calculation is made in Section 3 in which the crank-shaft stresses between each cylinder are determined and used in calculatingthe fatigue margin of the crankshaft. Assuming first mode response, thenominal shear stress in Crankpin No. 8 is 9351 psi per degree of free-end,rotation. The amplitudes of nominal shear stress are presented in Table ~2.8. .The results indicate that the largest single order has a stress of 3348
psi which is well below the DEMA allowable of 5000 psi. The total stress of6546 psi is also shown to be below the DEMA allowable of 7000 psi.
The measured response at 3500 kW is in general agreement with that,
calculated by TDI and shown in Table 2.4, although the measured values aresomewhat higher than the calculated values.
A comparison of RBS and SNPS results indicates that the response issimilar for the crankshafts as expected. The fourth order is the largest
order for both crankshafts, and is slightly higher for RBS because its fourthorder resonant speed is closer to the operating speed. The five and a half |
order is smaller at RBS because its resonant speed is further away from theoperating speed than it is at SNPS. Even though the fifth order at RBS has a !
resonant speed of 455 rpm, its magnitude is still quite small and there aresix other orders with greater magnitude. Thus, the fifth order response is j
not large enough to be of concern. |
|
|
2-5
1j
0
_ _ _ _ _ _ _ _ _ _ _ _ _ _ _ _ _ _ _ _ _ _ _ _ _ _ _ _ _ _ _ _ - _ _ - _ _ _ _ - _ _ _ _ _ _ -
''
_ ERPT M 0 0 21
2.2.3 Nominal Stress at Reduced Loads.
Torsiograph test data is typically obtained at about four or five
different load levels. The relationship between torsional response and loadmay be obtained by plotting the torsiograph test data versus engine load.
The torsiograph test data for the variable load tests at RBS and SNPSare plotted in Figures 2-2 and 2-3. From these plots it was determined that alinear relationship between torsional response and load existed. This allowsthe determination of stresses at reduced loads based upon stresses at a 3500kW load and the slope of the torsional response versus load curve. From the
RBS data it was determined that there is a 7% change in torsional response fora 10% change in load. This relationship also holds for the SNPS torsiographtest data. To determine the torsional stress at a load L (kW), TL, from thetorsional stress at 3500 kW. T , the following equation can be used
TL '3soo 3500* *
.
Using this approach the stress levels at the 3130 kW load that producesstresses similar to those in the SNPS crankshaft during ,its endurance testwere calculated. The values are tabulated in Table 2.9.
2.3 Conclusions
The following conclusions can be stated:
The TDI Holzer calculations of the natural frequency of theecrankshaft are in good agreement with test data,
The TDI forced vibration calculations at 3500 kW are reason-e
ably accurate and show that the single order stresses complywith DEMA. -
The torsiograph test data at 3500 kW shows that the combinedeorder stresses comply with DEMA at the rated speed of 450 rpm.
The torsiograph test data shows that there is a linear varia-etion of. crankshaft response with load.
2-6
_ _ _ _ _ _ _ _ _ - _ _ _ _ - _
-,
~~
ERPT M 0 0 21-
.~~
Section 2 References
2-1 | Standard Practices for low and Medium Speed Stationary Diesel and GasEngines. Diesel Engine Manufacturers Association, 6th ed., 197Z.
2-2 Yang, Roland, " Torsional and Lateral Critical . Speed Analysis: EngineNumbers 74039/42 Delaval-Enterprise Engine Model DSR-48 3500 KW/4889 BHP 'at 450 RPM for Stone & Webster Engineering Corp., . Gulf StatesUtilities." Transamerica Delaval Inc., Engine and Compressor. Division,Oakland, California, March 5, 1975, Revision - May 4, 1977.
2-3 Yang, Roland, " Proposed Torsional and Lateral Critical Speed Analysis:Engine . Numbers 74010/12 Delaval-Enterprise Engine Model DSR-48 3500kW/4889 BHP at 450 RPM." Transamerica Delaval Inc., Engine and Com-pressor Division, Oakland, California, August' 22,1983.
2-4 Bercel, E., " Crankshaft Torsional Vibration Measurements DGIA River BendNuclear Power Station " Stone & Webster Engineering Corporation,September 1984.
2-5 May,1985, SWEC Torsiograph' Test Report for River Bend Station.
2-6. Thomson, William T., Theory of Vibration with Applications. Second edi-tion, Prentice-Hall, 1981.
,
2-7 Hartog, Den, Mechanical Vibrations. Third edition, McGraw-Hill, 1947,
2-8 Lloyd's Register of Shipping, Guidance Notes' on Torsional VibrationCharacteristics of Main and Auxiliary 011 Engines.
2-9 Craig, Roy R., Jr., Structural Dynamics: An Introduction to Computer -Methods. Wil ey , 1981.
2-10 Bercel, E. , and Hall , J.R. , " Field Test of Emergency Diesel Generator103," Stone & Webster Engineering Corporation, April 1984
_
li1
I2-7
_ _ _ _ _ _ _ _ - _ _ - _ _ _ _ _ _ _ _ _ _ _ -
__ ._ _ - _ _ _ _ _ _ _ _ _ _ _ _
ERPT 5 0 h 5 1 ,'
..
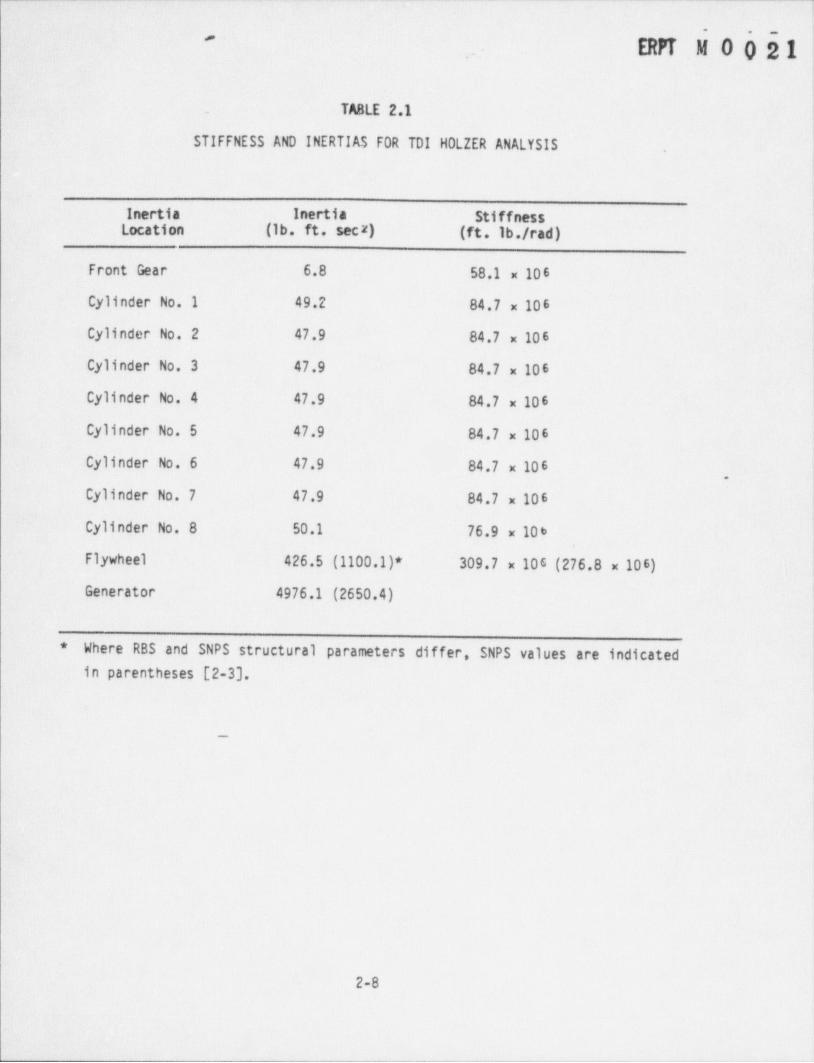
. TABLE 2.1
STIFFNESS AND INERTIAS FOR TDI HOLZER ANALYSIS .
Inertia Inertia StiffnessLocation (ib. ft. sec ) (ft.Ib./ rad)z
Front Gear 6.8 58.1 x 10 6
Cylinder No. 1 49.2 84.7 x 10 6
Cylinder No. 2 47.9 84.7 x 10 6
Cylinder No. 3 47.9 84.7 x 10⁶
Cylinder No. 4 47.9 84.7 x 10 6
Cylinder No. 5 47.9 84.7 x 10 6
Cylinder No. 6 47.9 84.7 x 10 6,
Cylinder No. 7 47.9 84.7 x 10 6
Cylinder No. 8 50.1 76.9 x 10⁶
Flywheel 426.5 (1100.1)* 309.7 x 106 (276.8 x 10⁶).Generator 4976.1 (2650.4)
* Where RBS and SNPS structural parameters differ, SNPS values are indicated)in parentheses [2-3).
._
2-8
- _ _ - - - - - -
f-_ - - -_ -_-__ ______
~ ERPT M 0 5 5 1'
. _ . . --
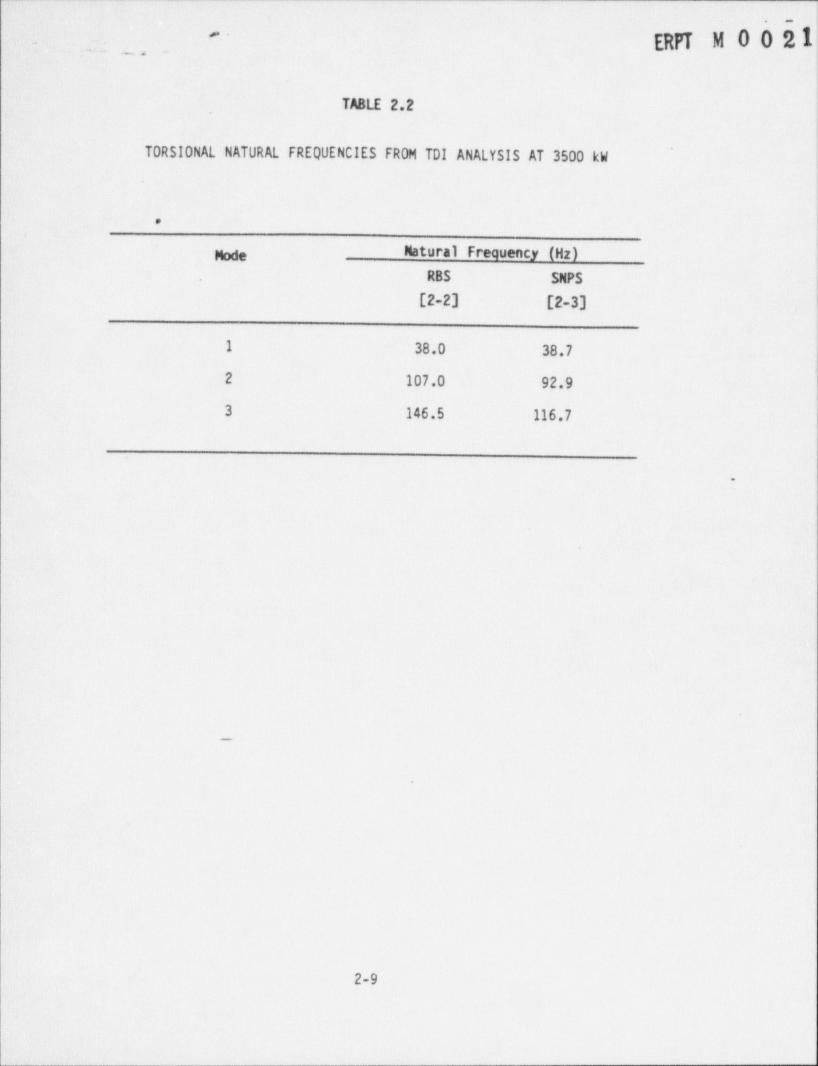
_TABLE 2.2
TORSIONAL NATURAL FREQUENCIES FROM TDI ANALYSIS AT 3500 kW
|
.
% Natural Frequency (Hz)
RBS SNPS
[2-2] [2-3]
1 38.0 38.7,
2 107.0 92.9
3 146.5 116.7
.
m
i.
i
.
l
2-9
.___-____-____-_____-____A
- _ - - - . - - - . - - - - - - - - - - - - - - --- - - _ - _ _ - - - - - - - _ - - - -
,
S_.Et
:' ''
. _ . ERPT M 0 0 21.
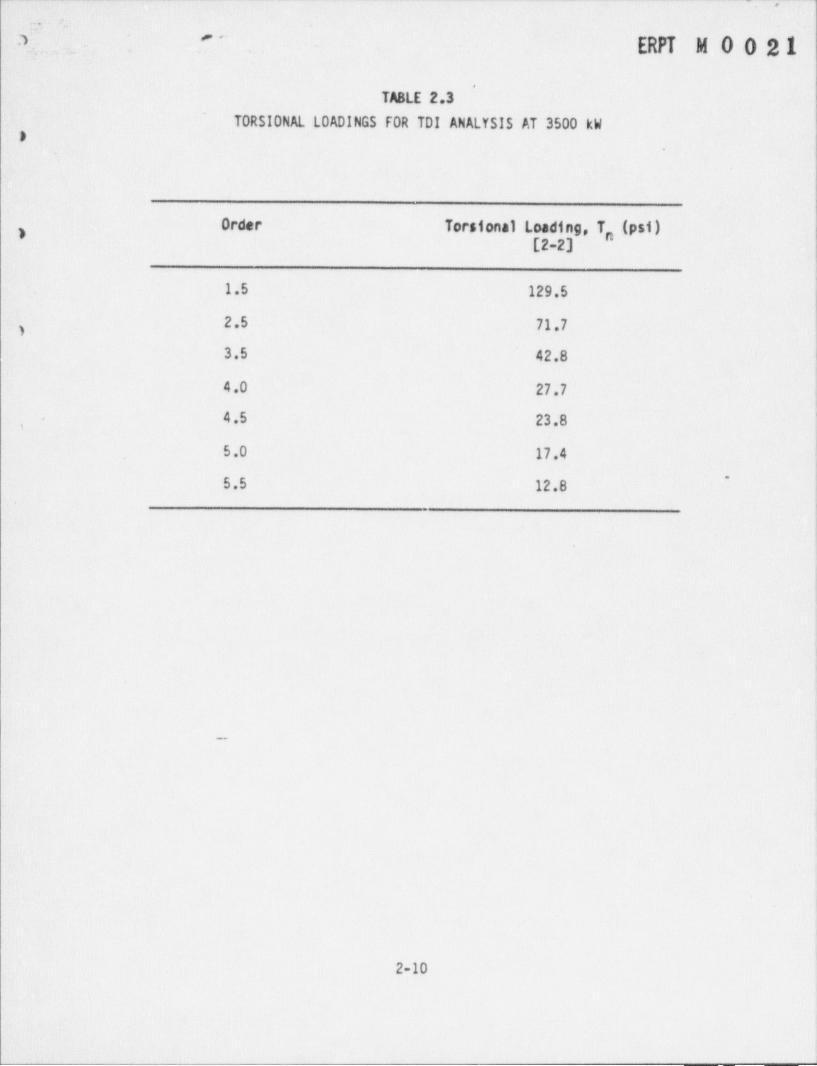
TABLE 2.3'
TORSIONAL LOADINGS FOR TDI ANALYSIS AT 3500 kWD
Order Torsional Loading, Tp'(psi)I[2-2]
1.5 129.5
2.5 71.73
3.5 42.8
4.0 27.7
4.5 23.8.
,
5.0 17.4 1
~
5.5 12.8
1
-
1
!
11
J2-10
l
___ _ - - ___ N
_ - - - _ - . - - - - - - - - - - - - -
' '~
ERM M 0 0 21
TABLE 2.4
SINGL'E-ORDER NOMINAL SHEAR STRESSES FROM TDI ANALYSIS AT 3500 kWi
.
Order Amplitude ofi Nominal Shear Stress (>si)
RBS 5N 'S
1.5 1599 1606
2.5 1069 1064,
3.5 466 452
4.0 3321 2980
4.5 644 565
5.0 947 348
~
5.5 797 1080
DEMA Allowablefor Single Order 5000 5000
-.
2-11
_ _-__ -___ - _ -
,,
,
#-3.= .; : - - ._ +a ERPT M 0 ^0 21a, ,
4 TABLE 2.5_
kV
, OPERATING HISTORY'FOR EG1A -
...e ,
_. 4 (* "'
''l.
_,
_
~~
3 //lb/54 5/z9/54 b/4/sbPreservice First Second
Load Factory. Crankshaft Torstograph TorsiographInspection Test Test
>3500 4 Same as 4 4'
3500 26 Factory 27.4 116
3130 < 1 cad < 3500 67-- --
2625 < load < 3130 8 15.6 91
1750 < load < 2625 8 12.1 21
<1750 4 13.8 28
~
TOTAL 10 50 72.9 327
,.
,
'1
&
h
2-12
.___________ - _-
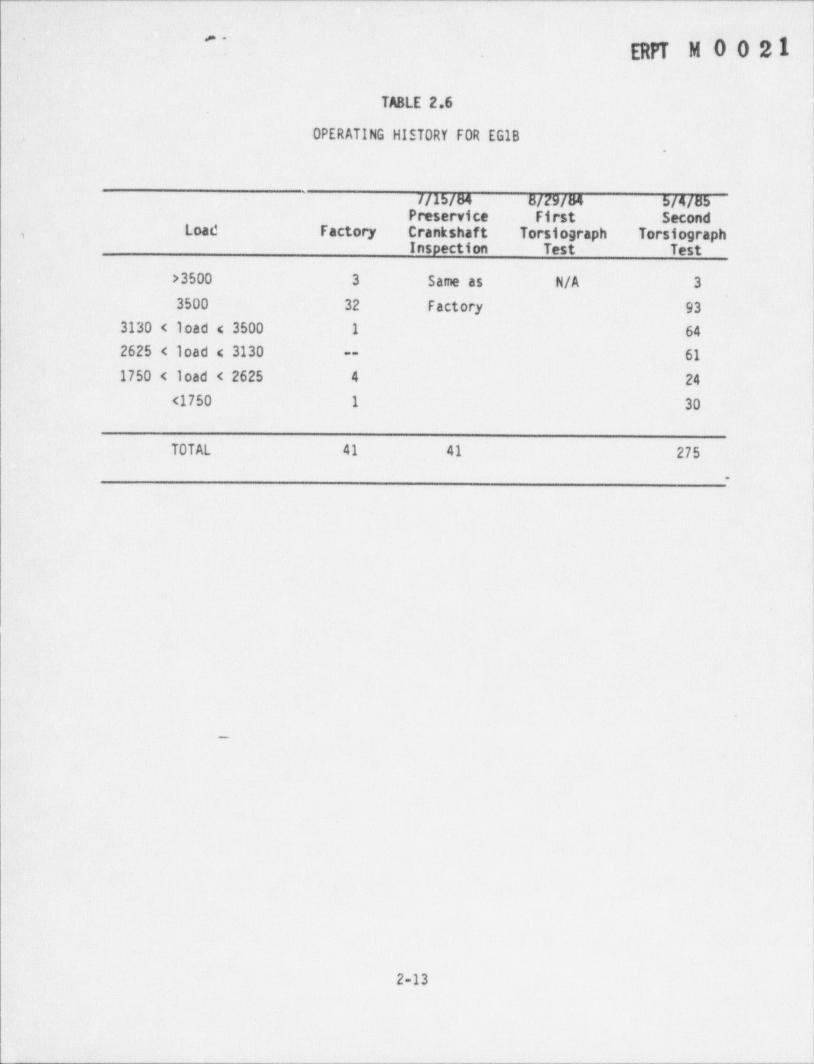
~
EWT M ' O O 21
lTABLE 2.6
.
OPERATING HISTORY FOR EG1B,
~
l
'
7/15/54 5/Z9/54 b/4/85Preservice First Second |
Load Factory Crankshaft Torsiograph Torsiograph !,
Inspection Test Test
>3500 3 Same as N/A 3
3500 32 Factory 93
3130 < load < 3500 1 64
2625 < load < 3130 61--
1750 < load < 2625 4 24
<1750 1 30
TOTAL 41 41 275
.
2-13
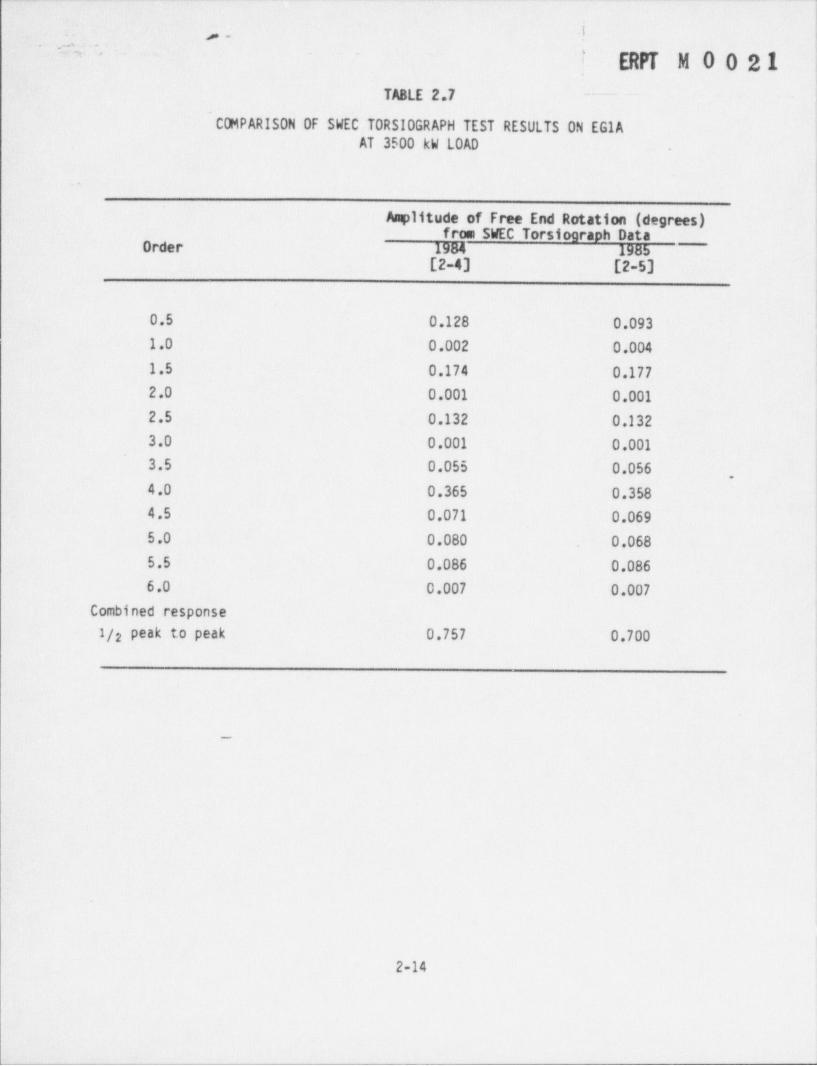
:
i. .
- cs:, _ - .
: ERPT M 0 0 21,
'
TA8LE 2.7 ----
C04 PARIS 0N OF SWEC TORSIOGRAPH TEST RESULTS ON EG1AAT 3500 kW LOAD .
I
Amplitude of Free End Rotation (degrees)from SWEC Torsiograph Data
Order 1984 1985[2-4] [2-5]
|
0.5 0.128 0.0931.0 0.002 0.0041.5 0.174 0.1772.0 0.001 0.0012.5 0.132 0.1323.0 0.001 0.0013.5 0.055 0.056
,
4.0 0.365 0.3584.5 0.071 0.0695.0 0.080 0.0685.5 0.086 0.0866.0 0.007 0.007
j
Combined response
1/2 peak to peak 0.757 0.700
_
2-14
i
_ _ - _ _ _ _ _ _ _ _ _ _ _ _ _ - _ _ _ - _ -
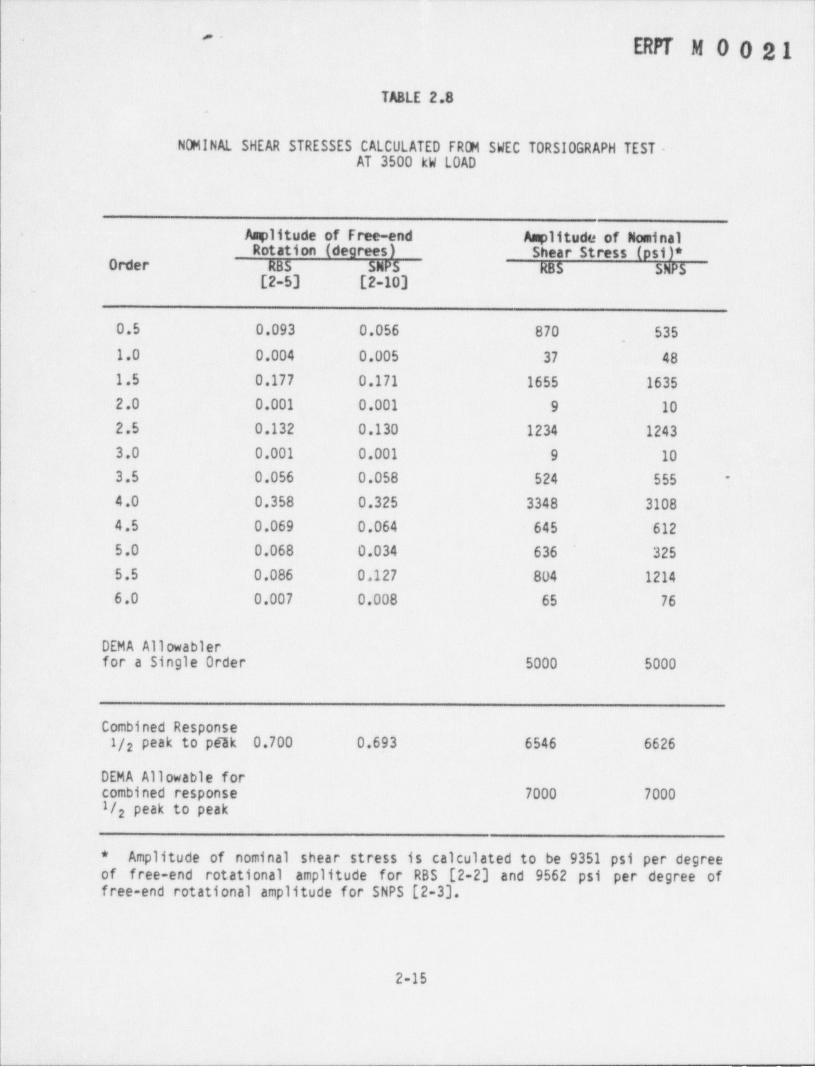
. _ _ _ _ _ _ _ _ _ _ _ _ _ _ _ _ _ _
.
ERPT M 0 0 21.
TABLE 2.8.
NOMINAL SHEAR STRESSES CALCULATED FROM SWEC TORSIOGRAPH TEST -AT 3500 kW LOAD
Amplitude of Free-end Amplitude of Nominal,
Rotation (degrees) Shear Stress (psi)*Order RBS SNPS RBS SNPS
[2-5] [2-103
0.5 0.093 0.056 870 535,
1.0 0.004 0.005 37 48
1.5 0.177 0.171 1655 1635
2.0 0.001 0.001 9 10
2.5 0.132 0.130 1234 1243
3.0 0.001 0.001 9 10
3.5 0.056 0.058 524 555 -
4.0 0.358 0.325 3348 3108
4.5 0.069 0.064 645 612
5.0 0.068. 0.034 636 325
5.5 0.086 0.127 804 1214
6.0 0.007 0.008 65 76
DEMA Allowablerfor a Single Order 5000 5000
Combined Response1/2 peak to pf8k 0.700 0.693 6546 6626
DEMA Allowable forcombined response 7000 70001/2 peak to peak
!
* Amplitude of nominal shear stress is calculated to be 9351 psi per degreeof free-end rotational amplitude for RBS [2-2] and 9562 psi per degree of i
free-end rotational amplitude for SNPS [2-3]. |
2-15
_ ___ __ a
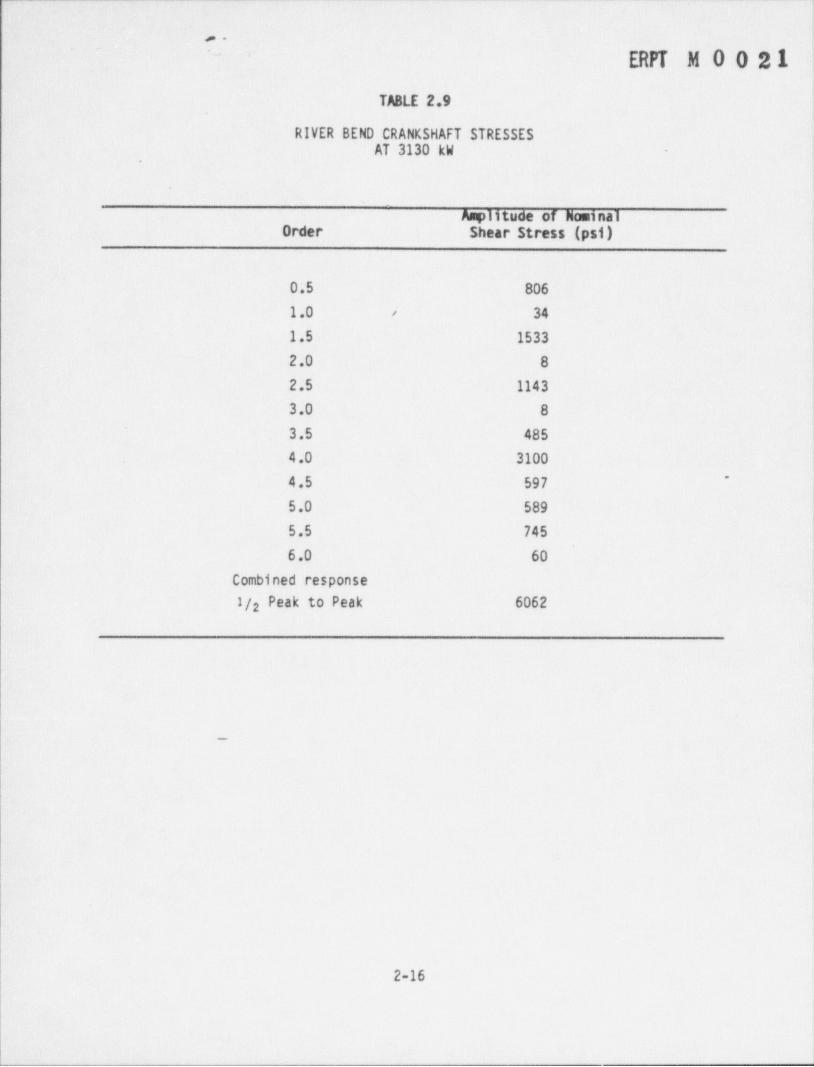
- _ - - _ - - - - - _ - . -
-.~ ~~
ERIT M 0 0 21!
TABLE 2.9.
RIVER BEND CRANKSHAFT STRESSESAT 3130 kW
.
|
Amplitude of NominalOrder. Shear Stress (psi)
0.5 806'
1.0 34-
1.5 1533
2.0 8
2.5 1143
3.0 8
3.5 485
4.0 3100|
4.5 597~
5.0 589
5.5 745
6.0 60
Combined response
1/2 Peak to Peak 6062
-!
2-16
_ _ _ _ _ _ _ _ _ _ _ _ _ - _ _ _ _ _ _ _ _
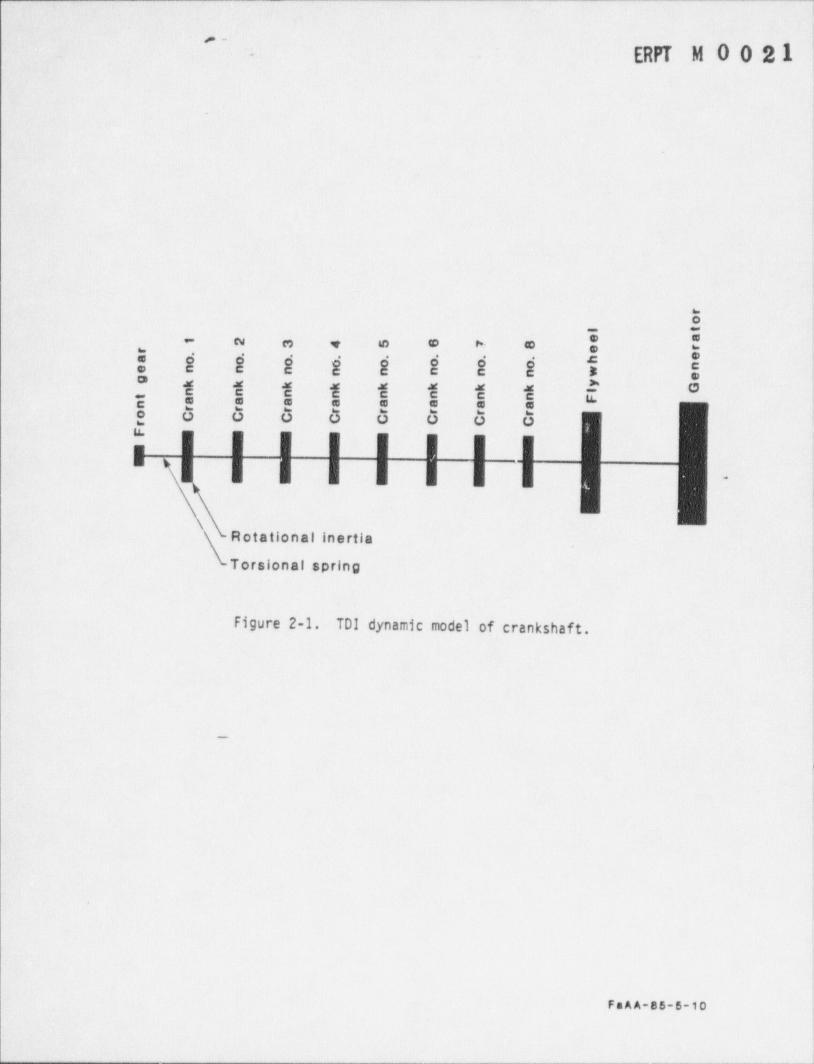
|
'~- ERPT M 0 0 21
.
|
|
I-
2-
*;- cu n , e e n a
! s s s s s s s s 5 !* s i s s i s i i *_c ! e e e e e g eo o o o o o o o o
| I I I I I I I"'I I I I I I I -
\ R otational inertiaTorsional spring
Figure 2-1. TDI dynamic model of crankshaft.
__
I
FaAA-85-5-to
- _ _ _ _ _ - _ _ _ - - _ - . - - -
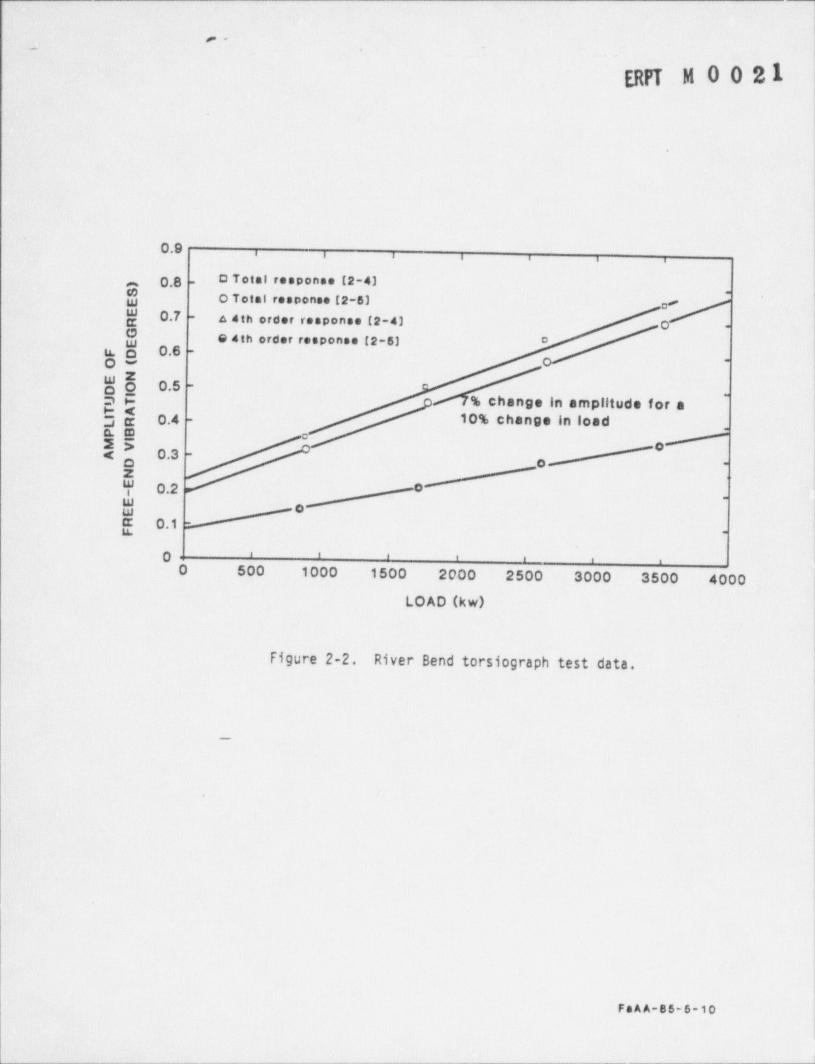
. - _ _ _ - _ _ _ _ - _ _ _ . _ _ _ _ - - _ _ _ _ _ . _ _ _ _ _ - _ _ _ _ _ _ _ _ _ _ _ _ _ _ _ _ _ _ _ _ _ _ - _ _ _ _ _ - - _ _
r-. .
ERPT M 0 0 21
.
0.9 , , , , , , ,
O Totsi response 12-4)0.8 .m
@ O Total response (2-5),
c'y 0.7 A 4th order response (2-4) o
-
-
@ G 4th order response [2-5) D
u. o 0.6 -
Ow .
$ b 0.5 -
ap % change in amplitude for a-
$ $ 0.4 10% change in load -.
-
nE #e
!# 0.3 -
$ .2 Xo .
0 0-
N 0.1 -u. .
0 ' ' ' ' ' ' '
O 500 1000 1500 2000 2500 3000 3500 4000LOAD (kw)
Figure 2-2. River Bend torsiograph test data.
__
FaAA-85-6-10
4
- _ _ ____.
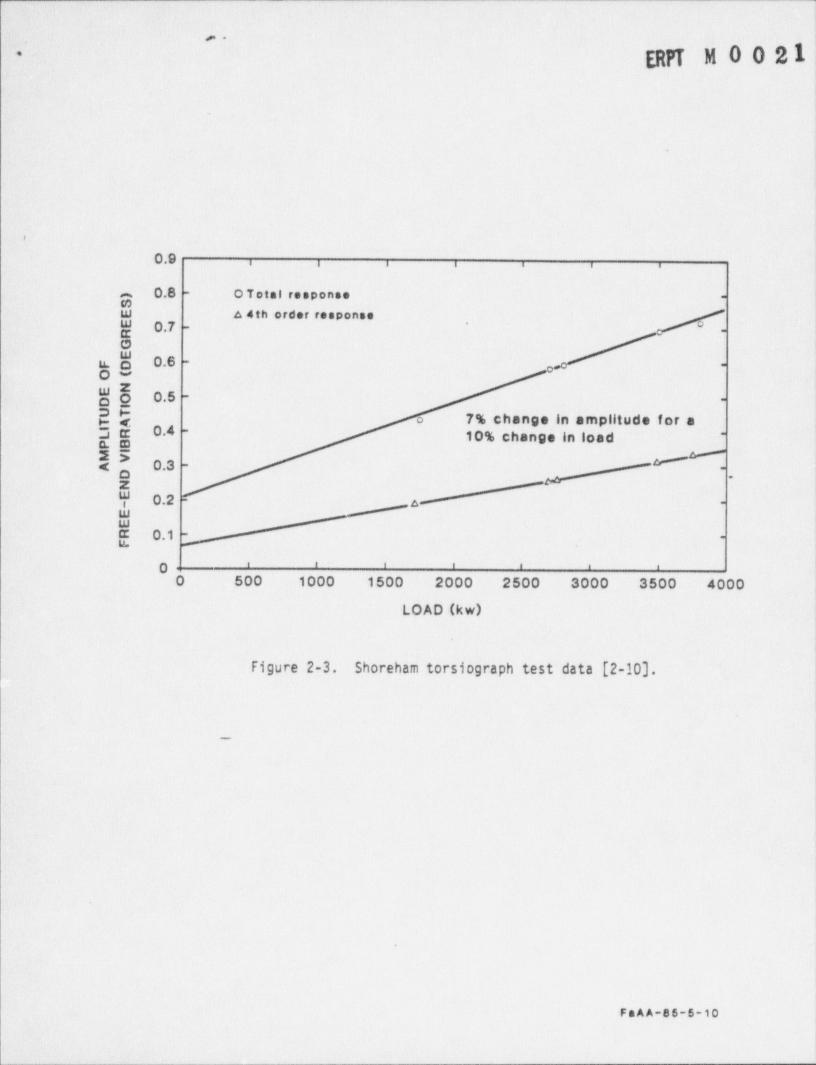
- - - - _ _ - _ _ _ _ - _ _ _ _ . . _ _ _ _ _ _ _ . - - _ _ - - _
p .,
9 '
ERM M 0 0 21 !
.
>-
0.9 ' ' i i , , ,
0.8 - oTotal responsea -
sotu A 4th order responso
y 0.7 -* *
-
O
u. $ 0.6 --
oOw
$ h 0.5 --
3 Q,0.4
7% change in amplitude for ao3e 10% change in load-
-
n. m25-< 0.3 -
-g ,
'
O.2 4 -
0.1 --
' ' ' ' ' ' '0O 500 1000 1500 2000 2500 3000 3500 4000
LOAD (kw)
Figure 2-3. Shoreham torsiograph test data [2-10).
1
~
Il
FaAA-86-5-10
_ _ _ _ _ _ _ _ - _ _ _ _ _ _ _ _ - - - _ _ _ _ - _ _ _ _ - _ _ _ - _ _ _ _.
- -- _
1|,
- ERPT M 0 0 21 !|l
3.0 FATIGUE ANALYSIS OF CRANKSHAFT|
. In Section 2.0 it was found that the RBS crankshafts satisfy the DEMAnominal stress recommendations at rated speed for 3500 kW. The stresses for a
single order were considerably below the 5000 psi that is recomended as anallowable. However, the stresses for combined orders were close to the
7000 psi that is recommended as an allowable. While the DEMA limits are ]believed to contain an intrinsic (though unspecified) safety margin, a fatigue i
analysis of the crankshaft was undertaken to determine the true margin.
First, a dynamic torsional analysis of the crankshaft is performed todetermine the true range of torque at each crank throw. This model is com-pared with SWEC torsiograph test data for the amplitades of free end vibra-tion. The model may then be used to predict the nominal torsional stress overthe speed range of 450 rpm tS%.
Second, the maximum actual stresses in the crankpin fillet are deter .mined from the dynamic strain gage test data from SNPS and the differencesbetween the stresses at SNPS and RBS. The actual stresses in the oil holesare computed from the nominal torsional stress and the stress concentrationfactor.
Third, the fatigae endurance limit is established for the RBS 13-inchby 12-inch crankshafts by first obtaining the endurance limit for the failed
13-inch by 11-inch crankshafts at SNPS, and then assessing the differencesbetween the two crankshafts. The endurance limit is compared with valuesprovided in the literature.
-
Finally, a factor of safety against fatigue failure is computed.
3.1 Crankshaft Dynamic Torsional Analysis
3.1.1 Torsional Model
FaAA developed a dynamic torsional model of the crankshaft to overcomelimitations in TDI's conventional forced vibration calculations. For
instance, the TDI method does not compute the phase relationship between the
3-1
_ _ _ _ _ _ _ _ _ _ _ _ _ _ _ - _ _ _ _ _ _ _ _ _ - _ _ -
-_- _ _ _ _ _ _ - _ _ _ _ _ _ _ _ _ _ _ _ . _ __ .___ - _ - _ - - _ - _ _ _ _ _ _ _ _ _ - _ _ _ _ .
'- an M 0 0 21
various orders or modes, so it is not possible to compute the true summa-tion. The a'ctual maximum stress is a direct result of this summation. Fur-thennore, the TDI method always predicts maximum stress in Crankpin No. 8,whic'h is generally true for a single order in the first mode but not true forthe combined response of all orders and modes.
The dynamic model developed used the same idealized lumped inertia and
torsional spring model as the TDI analysis (Figure 2-1 and Table 2.1) with one '
additional spring placed between the generator and ground to represent theeffect of the grid on dynamic response during synchronous operation. Thisspring constant was found to be 2.053 x 106 ft.-lb./ radian based on generatorspecifications. This constant is set close to zero to represent RBS emergencybus operation.
The first three torsional natural frequencies for the RBS crankshaftare shown in Table 3.1. The natural frequencies are in agreement with thosecomputed by TDI and that measured by SWEC. There is also a rigid body mode,which has a natural frequency of 3.0 Hz when the engine is connected to thegrid, and is 0 Hz for RBS emergency bus operation.
When the diesel generator is running at a given speed and power level,the forced vibration problem is steady-state where both load and responserepeat themselves every two revolutions of the crankshaft. To model thedynamic response, a modal superposition analysis [3-1] was used with harmonicload input. The calculation of the harmonic loads will be discussed in thenext section.
3.1.2 Harmonic Loading
To calculate the harmonic loading on a crankshaft it is necessary to
consider gas pressure, reciprocating inertia, and frictional loads. The gas
pressure loading was obtained from pressure versus crank angle data. This
pressure was measured at SNPS by SWEC [3-2]. The pressure was measured in
Cylinder No. 7 by inserting a probe through the air start valve. A top dead
center, TDC, mark for Cylinder No. 7 was simultaneously recorded by a probe onthe flywheel. The pressure data at 3500 kW was reduced by FaAA to obtain thepressure curve shown in Figure 3-1.
3-2 :
_ _ _ _ _ _ _ _ -
- _ _ - _ _ .
-
ERPT M0021The torque produced by this pressure may then be calculated as a func-
tion of crarik angle. The mean value of this torque should be the torquerequired to produce 3500 kW divided by the mechanical efficiency. A mechani-
cal efficiency of 1.0 was obtained, rather than the expected 0.88 to 0.90.The difference is probably explained by either the pressure measurements beingtoo low or by the TDC being shifted. Peak pressures were measured in all thecylinders to ensure that all cylinders were balanced. Normally, the excesstorque above that required to run the engine at 3500 kW is dissipated byfriction.
The reciprocating mass of the connecting rod and piston was found to beapproximately 820 lbs. This mass causes reciprocating inertia torque on thecrankshaft. The effect of this torque was combined with the gas pressuretorque.
The total torque was then decomposed into its sine and cosine harmonicscorresponding to each order. These torque harmonics were used in the steady ,state analysis. The magnitude of the torque harmonics are normalized bydividing by the piston area and throw radius. The resulting normalizedtorques for the most significant orders are shown in Table 3.2.
3.1.3 Comparison of Calculated Response With Test Data
The response cue to the first 24 orders and all 11 modes is calculatedusing modal supery. .dion wan 2.5% of critical damping for each mode. The
actual value of damping used has little effect on the response since the
orders are not at resonance at 450 rpm. '
The calculated amplitude of free-end displacement is compared to the !
SWEC test measurements at RBS [3-3] in Table 3.3. It is seen that the agree-ment is close for all significant orders. The vector summation listed repre-sents half the maximum peak-to-peak displacement range. This confirms thatthe pressure versus crank angle data used p.rovides a good representation ofthe pressure loading at RBS. <
i
3-3
_ _ _ _ _ _ _ _ _ _ _
_ _ _ _ _ . ___ _ . - _ _ - - - - - - - - -
-.
ERPT M 0 0 21"
The model also calculates the range of torque at each crank throw, fromwhich nomin'l shear stresses (t = Tr/J) are calculated and shown ina
Table 3.4. The maximum stress occurs between cylinder number 5 and cylindernumber 6.
3.1.4 Calculation of Nominal Stresses at Offspeed Conditions
The dynamic torsional model of the crankshaft may be used to predictthe stresses over the speed range 450 rpm 15%. Over this speed range themaximum stress always occurs between cylinder number 5 'and cylindernumber 6. The maximum amplitudes of torsional stress are shown in Figure 3-2and Table 3.5 for both RBS and SNPS at 3500 kW. It is seen that there is goodagreement between the values computed by FaAA and- those computed using Dr.Sarsten's computer program COMHOL2 [3-43. . At 450 rpm the stress' at RBS is
somewhat higher, 7357 psi, than that at SNPS, 7006 psi. At overspeed, 472.5rpm, the stress at RBS is higher than SNPS since tne fourth order criticalspeed is closer to the operating speed at RBS than it is at SNPS. On theother hand, at underspeed, 427.5 rpm, the stress at RBS is lower than SNPSbecause the five and 'a half order critical speed is' further away at RBS thanit is at SNPS.
3.1.5 Calculation of Nominal Stresses at Reduced Loads
In Section 2.0 it was shown that the torsional vibration of the crank-shaft is linearly related .to the engine load. Torsiograph data for both RBS-and SNPS showed that this relationship leads to a 7% change in vibrationamplitude for a 10% change in engine load. In addition, the dynamic straingage test at SMPS [3-2] showed that the relationship between crankpin filletstresses and load is also linear. Figure 3-3 indicates that the crankpinmeasured stress data shows an 81/2% change in stress for a 10% change inengine load.
])This linear relationship may now be used to compute stresses at loads]
below 3500 kW. The stresses in Figure 3-4 and Table 3.6 are computed for aload of 3130 kW at RBS and 3300 kW at SNPS. The load of 3300 kW at SNPScorresponds to the load used for the 107 cycle entrance test on DG103 at
|
3-4
_ _ _ _ _ _ _ _
I
i ERM M 0 0 2 i
SNPS. The load of 3130 kW produces stresses at RBS that are comparable tostresses at 3300 kW at SNPS. These reduced stresses are calculated assuming a7% stress reduction for a 10% load reduction. Using 7% leads to a comparison
which gives relatively higher stresses for RBS than if 81/2% were used.
The stresses at 3130 kW computed in the above manner will be used tocompute the fatigue margin of the crankshaft.
3.2 Calculation of Fillet and Oil Hole Stresses
The fillet of crankpin number 5 of a 13-inch by 12-inch crankshaft atSNPS was instrumented with strain gages and tested under operational condi-tions at 450 rpm and 3500 kW [3-2]. The fillet geometry of the SNPS crank-shafts is the same as that of the RBS crankshafts as specified in TDI drawing03-310-05-AC. Figure 3-5 shows typical structural dimensions for the crank-shafts.
A dynamic model of the crankshaft confirms that crankpin number 5undergoes the greatest stress. Three-dimensional finite element models of aquarter crank throw were used to determine the location .of highest stress,both within the fillet and around the crankpin [3-5]. The strain gage rosettewas placed in this highest stressed location.
The strain gage results from the SNPS test at 3500 kW are shown inTable 3.7. The calculation of principal stresses from the strain gage resultsare also shown.
To account for the simultaneous effects of shear and bending, thestress state Ts represented by an equivalent stress using Sine's method[3-6]. For a biaxial stress state, the equivalent alternating stress, S qa*
and equivalent mean stress, Sqm, are given by:
qa " (S ~3 b +ba a iy a 2)I/
S2
1
and S , = S,l m2+S
q
3-5
. - - _ _ _ _ _ _ _ _ _ _ - _ _ _ _ _
' ~
ERPT M 0 0 2 I
where 5, and S are the alternating components of principal stress, and
S,, and S,3 _are the mean components of principal stress. From the SNPS test I
at 3500 kW [3-2], the equivalent alternating stress, S a, and equivalent meanq
stress, S ,, on crankpin number 5 were calculated to be:q
|
S , = 24.6 ksiq
'S ,= 4.8 ksi {q
Equivalent stresses, S , and S ,, are those alternating and mean uniaxialq q
stresses that can be expected to give the same life as the given multiaxialstresses. ,
To determine the actual fillet stresses at 3130 kW in the RBS crank- |
shafts the value of S , needs to be factored by the differences in nominalq
torsional stress. Thus, the equivalent alternating stress at RBS at 3130 kWis .given by .
,
.
S = 24.6 = 23.9 ksiqa (7006)
since the nominal stress at this load is 6813 psi and the nominal torsionalstress at SNPS at 3500 kW is 7006 psi.
Tiie stress in the oil holes may be calculated from the nominal tor-sional stress using a stress concentration factor of 4.16. This factor isbased on theoretical solutions for a plate with a hole in shear [3-7], and afinite element model to account for the blend radius.
The nomijial torsional stress in the main journals is computed from itsadjacent crankpin by accounting for the difference in the radius of the jour-nal. The maximum oil hole stress is determined to be in main journal number 6and'is 22.3 ksi.
3.3 Endurance Limit for Crankshafts
The endurance limit for the RBS crankshafts was based on an analysis ofthe failed 13-inch by 11-inch crankshafts at SNPS and confirmed by a review of'the literature.
3-6
___- ___ __ -
_ _ _ _ _ _ _ _ . _
p
ERPT M 0 0 21
The number 5 crankpin fillet of a 13-inch by 11-inch crankshaf t atSNPS, which had a fatigue crack, was instrumented [3-8]. The strain gage data ]and resulting principal stresses for this crankshaft at 3500 kW are shown in
|iTabl'e 3.8.
and equivalent mean stress,The equivalent alternating stress, Sqa,Sqm, were calculated to be:
S a = 33.7 ksiq
S = 10.9 ksiqm
At the time of the fatigue failure in DG102 the crankshaft had
experienced at least 273 hours at equal to or greater than 3500 kW. Countingone stress cycle for every two revolutions of the crankshaft, this leads toabout 4 x 10⁶ cycles. The operating history for the three SNPS crankshaf tsare shown in Table 3.9.
.
A review of S-N data for material similar to the crankshaft indicatesthat a typical S-N curve is represented by the notched wrought 1040 data shownin Figure 3-6 [3-10). This data was used to determine the shape of the S-Ncurve. The curve was then shifted on the vertical scale to match the datafrom the full scale crankshaft failures at SNPS. Using the shape of the curvein Figure 3-6, the 107 cycle endurance limit for this mean stress was deter-mined to be 32.4 ksi. The ultimate tensile strength for these crankshaftsaveraged 96 ksi.
The crankshafts at RBS have a minimum ultimate tensile strength of 94ksi. The endurance limit scales approximately linearly with ultimate tensilestrength. On this basis, the endurance limit for the RBS 13-inch by 12-inchcrankshafts is calculated from the SNPS 13-inch by 11-inch crankshafts and isshown on the Goodman diagram [3-11] in Figure 3-7.
Additionally, a review of the literature was conducted to find other
fatigue data for large diameter crankshafts. Nishihara and Fukui [3-12]reported full scale f atigue test results for a large diameter crankshaft of asimilar material, with an ultimate tensile strength of 94 ksi and found an
3-7
_ _ _ _ _ _ _ _ _ _ _ _ _ _ _ _ -
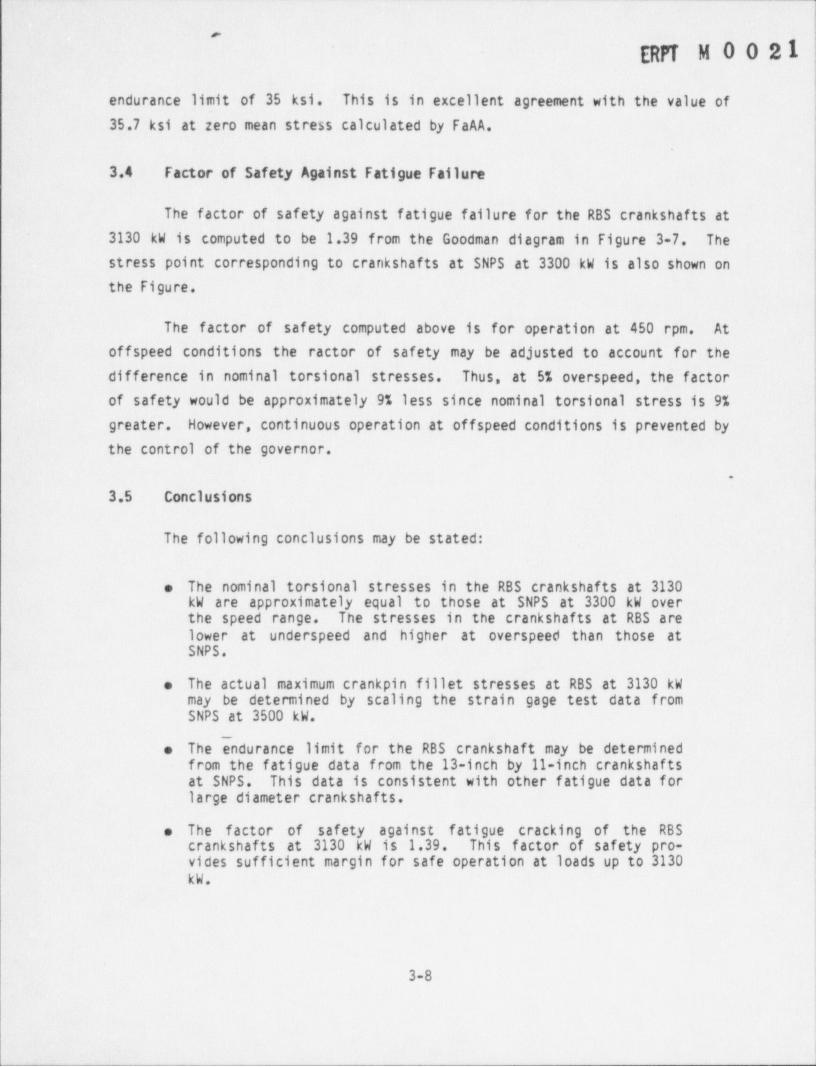
_ _ _ _ -
'
- ERn M 0 0.2 1
endurance limit of 35 ksi. This is in excellent agreement with the value of35.7 ksi at zero mean stress calculated by FaAA.
3.4 Factor of Safety Against Fatigue Failure|
The factor of safety against fatigue failure for the RBS crankshafts at3130 kW is computed to be 1.39 from the Goodman diagram in Figure 3-7. The
stress point corresponding to crankshafts at SNPS at 3300 kW is also shown onthe Figure.
The factor of safety computed above is for operation at 450 rpm. Atoffspeed conditions the ractor of safety may be adjusted to account for thedifference in nominal torsional stresses. Thus, at 5% overspeed, the factorof safety would be approximately 9% less since nominal torsional stress is 9%greater. However, continuous operation at offspeed conditions is prevented bythe control of the governor.
.
3.5 Conclusions
The following conclusions may be stated:
e The nominal torsional stresses in the RBS crankshafts at 3130kW are approximately equal to those at SNPS at 3300 kW overthe speed range. The stresses in the crankshafts at RBS arelower at underspeed and higher at ' overspeed than those atSNPS.
The actual maximum crankpin fillet stresses at RBS at 3130 kWemay be determined by scaling the strain gage test data fromSNPS at 3500 kW.
e The endurance limit for the RBS crankshaft may be determinedfrom the fatigue data from the 13-inch by 11-inch crankshaftsat SNPS. This data is consistent with other fatigue data forlarge diameter crankshafts.
e The factor of safety against fatigue cracking of the RBScrankshafts at 3130 kW is 1.39. This f actor of safety pro-vides sufficient margin for safe operation at loads up to 3130kW.
3-8
.__ _-_____ - ____________ - _ _ -
_ - _ - _ _ _ _
o.
DIPT M 0. 021Section 3 References
3-1 Timoshenko, S. , D.H. Young, and W. Weaver, Jr., Vibration Problems in-Engineering. Fourth edition, Wiley,1974.
3-2 Bercel, E., and . Hall , J.R. , " Field Test of Emergency Diesel Generator103," Stone & Webster Engineering Corporation, April 1984.
3-3 May,1985, SWEC Torsiograph Test Report for River Bend Station. !,
3-4 Nervik, N.R., and A. Sarsten, "COMHOL2 User's. Manual," Division of '
Internal Combustion Engines and Marine Engineering. The NorwegianInstitute of Technology.
3-5 " Evaluation of Emergency Diesel Generator Crankshafts at Shoreham andGrand Gulf Nuclear Power Stations," Failure Analysis Associates ReportNo. FaAA-84-3-16, May 22, 1984.
3-6 Fuchs, H.O., and Stephens, R.I., Metal Fatigue in Engineering. Wiley,1980.
3-7 Peterson, R.E., Stress Concentration Factor. Wiley & Sons, New York,1974.
.
3-8 Bercel, E. , and Hall, J.R. , " Field Test of Emergency Diesel Generator101," Stone & Webster Engineering Corporation, October 1983.
3-9 " Emergency Diesel Generator Crankshaft Failure Investigation ShorehamNuclear Power Station," Failure Analysis Associates Report No. FaAA-83-10-2.1, October 31, 1983.
3-10 Structural Alloys Handbook, Volume 1 Battelle's Columbus Laboratories,page 45, 1981 Edition.
3-11 Collins, J.A., Failure of Materials in Mechanical Design. Wiley, 1981.
3-12 Nishihara, M., and Fukui, Y., " Fatigue Properties of Full Scale Forgedand Cast Steel Crankshafts," Transactions of the Institute of MarineEngineering. Series B on Component Design for Highly Pressure-ChargedDiesel Engines, London, January 1976.
3-9
I_..
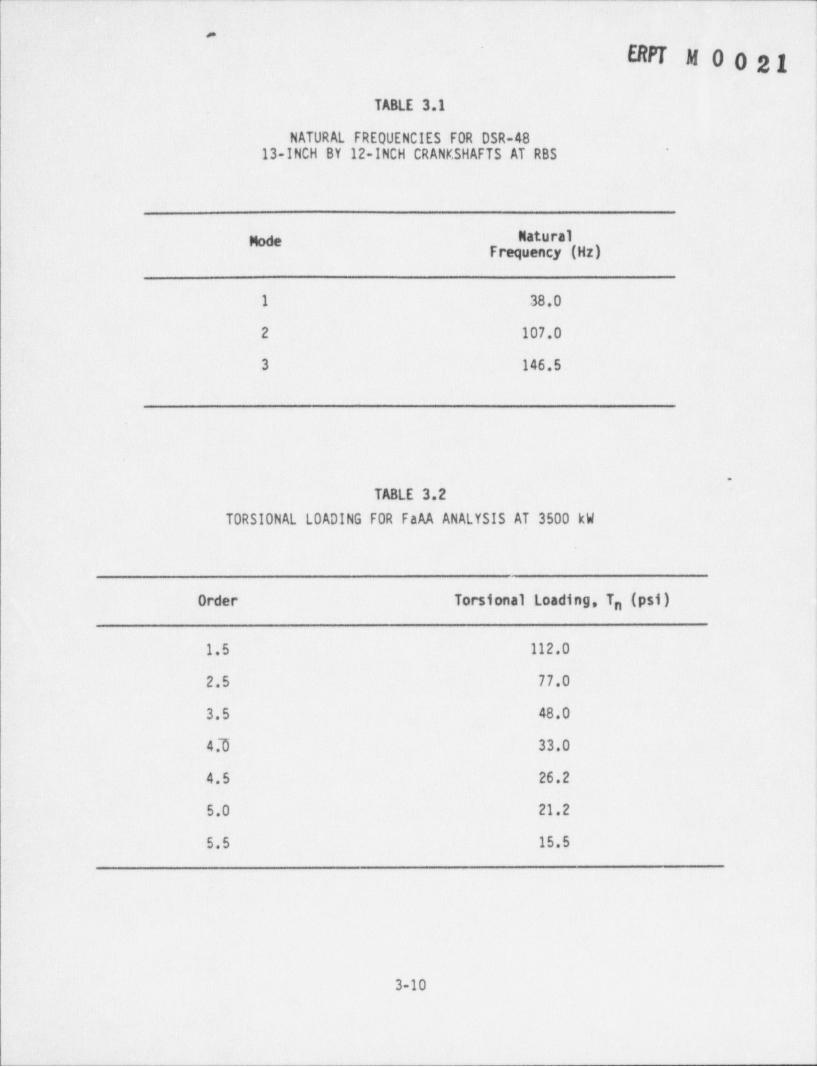
, . - - - , - - _ . _ . _ _ , . - - - _ _ . - - , . - - - - - - - - _ _ - - - - - - - - - - _ _ _ -
-
GU M 0 0 21
.TABLE 3.1
NATURAL FREQUENCIES FOR DSR-4813-INCH BY 12-INCH CRANKSHAFTS AT RBS
'
i
,
% NaturalFrequency (Hz)
1 38.0!
2 107.0 ;
3 146.5
.
TABLE 3.2
TORSIONAL LOADING FOR FaAA ANALYSIS AT 3500 kW
Order Torsional Loading, Tn(Psi)
1.5 112.0
2.5 77.0
3.5 48.0
4.3 33.0
4.5 26.2
5.0 21.2i
5.5 15.5 |
i
:
3-10
. _ _ _ _ _ _ _ _ _ _ _ _ _ _ _ - _ _ _ _
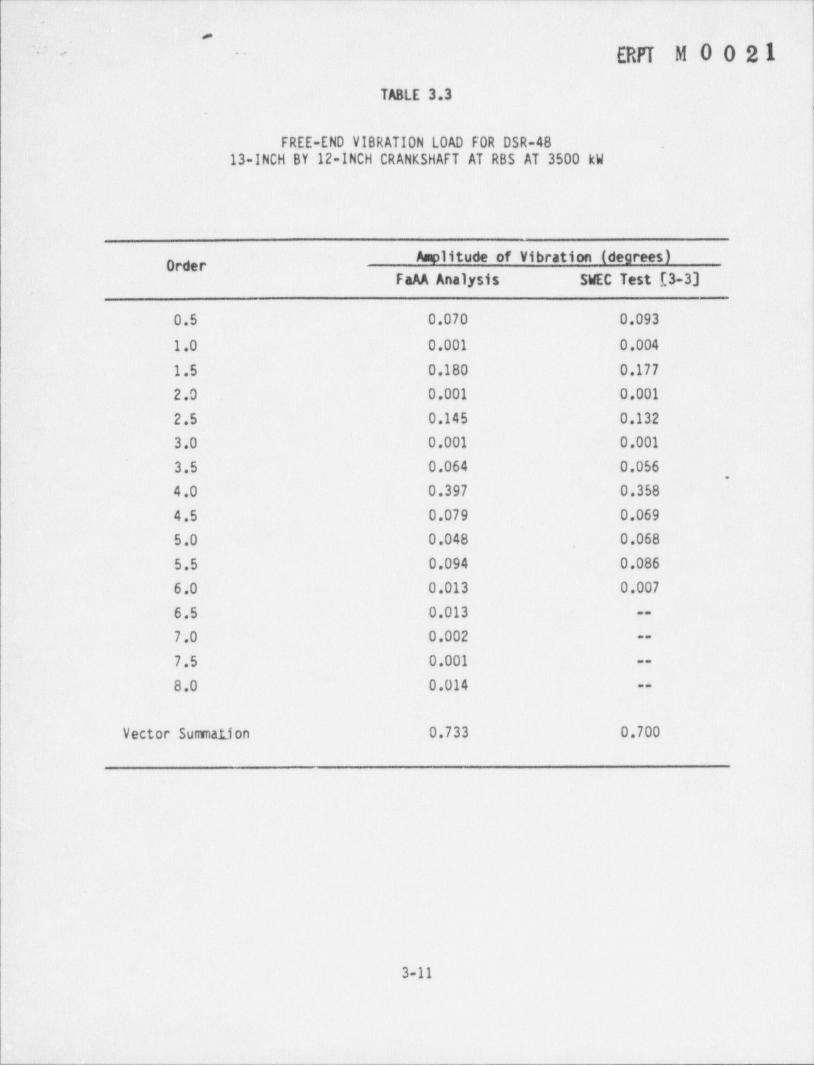
- - _ - - _ __ - _ - _ _ _ - _ - _ _ _ -__ _ _ _ - - _ _ _ - _ _ _ - - _
4
'r, .. ERPI M0021
TABLE 3.3.
FREE-ENO VIBRATION LOAD FOR DSR-4813-INCH BY 12-INCH CRANKSHAFT AT RBS AT 3500 kW
apl ue bration (degrees)Order
FaAA Analysis SWEC Test [3-3]
0.5 0.070 0.093
1.0 0.001 0.004
1.5 0.180 0.177
2.0 0.001 0.001
2.5 0.145 0.132
3.0 0.001 0.001
3.5 0.064 0.056,
4.0 0.397 0.358
4.5 0.079 0.069
5.0 0.048 0.068
5.5 0.094 0.086
6.0 0.013 0.007
6.5 0.013 --
7.0 0.002 --
7.5 0.001 --
8.0 0.014 --
Vector Summation 0.733 0.700|
i
i
i
!
i
3-11
1
)
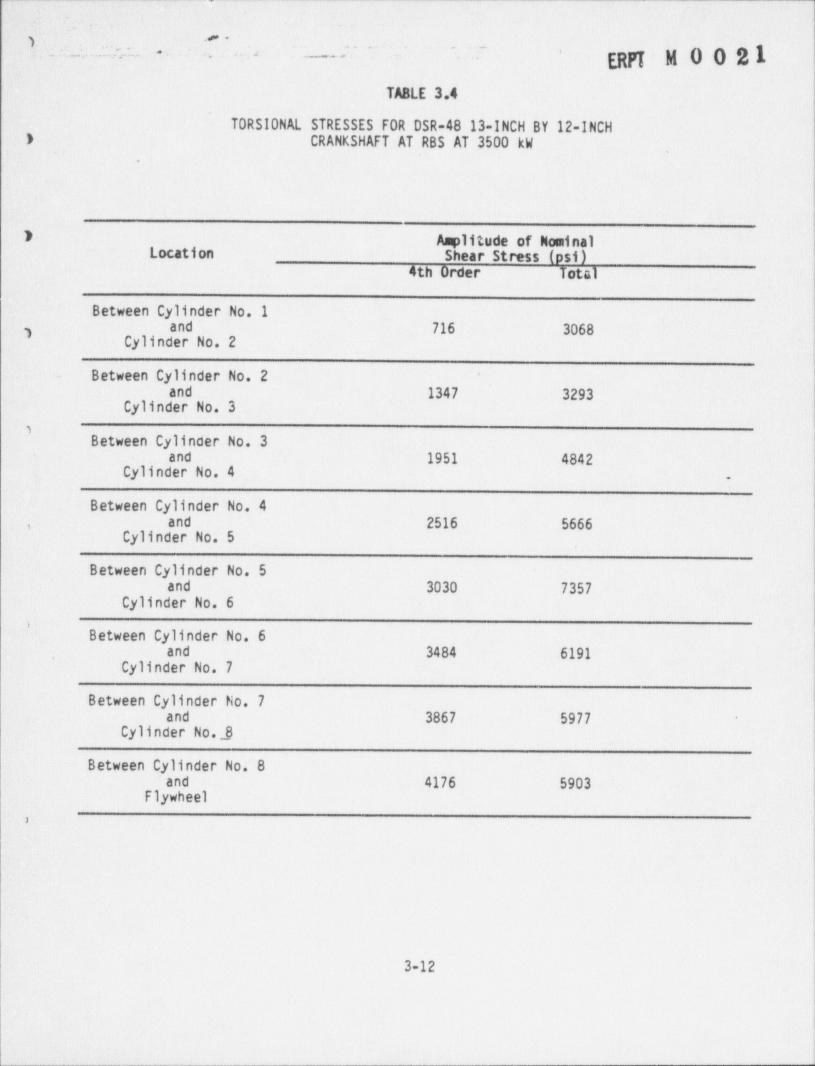
-. _ _ _ _. - _ _ _ _ _ _ _ - _ _ _ _ _ _ _ _ _ _ _ _ _ _ _ _ _ _ - _
I ' ~~ ~~ ~ ~~'-. . - -- -
E.RPT M 0 0 21._ :a. _ ._Jaf _ -
TABLE 3.4,
TORSIONAL STRESSES FOR DSR-48 13-INCH BY 12-INCH) CRANKSHAFT AT RBS AT 3500 kWl'
t
3 Amplitude of NominalLocation Shear Stress (psi)
4th Order Total
iBetween Cylinder No. 1I 716 3068
Cylinder No. 2
Between Cylinder No. 2 '
3293Cylinder No. 3
Between Cylinder No. 3
Cylinder No. 4 '
Between Cylinder No. 4'
Cylinder No. 5
Between Cylinder No. 53030 7357
Cylinder No. 6
Between Cylinder No. 6gg
*
Cylinder No. 7
Between Cylinder No. 73867 5977 *
Cylinder No. 3
Between Cylinder No. 84176 5903
Flywheel1
3-12
4
_ _ _ _ _ _ _ _ _ . _ _ . __ - _ _ . . - - - - - . - - - - - - - - -
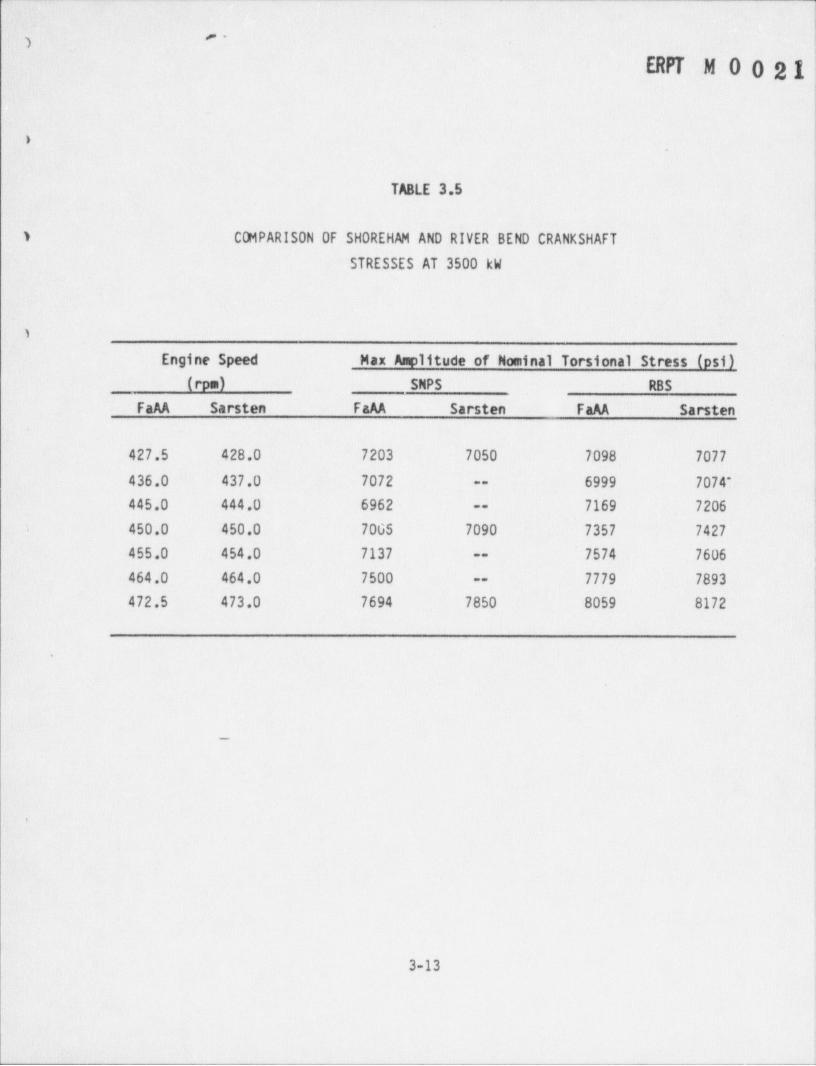
_ _ - . . . _ _ _ _ _ _ . . _ _ _ ___-______ ___-_-
'') i
BR M 0 0 21.
>
TABLE 3.5
) COMPARIS0N OF SHOREHAM AND RIVER BEND CRANKSHAFT
STRESSES AT 3500 kW,
'1
i
| Engine Speed Max Amplitude of Nominal Torsional Stress (psi)(rpm) SNPS RBS
FaAA Sarsten FaAA Sarsten FaAA Sarsten
'
427.5 428.0 7203 7050 7098 7077
436.0 437.0 7072 6999 7074*--
445.0 444.0 6962 7169 7206--
450.0 450.0 7005 7090 7357 7427.;'
455.0 454.0 7137 7574 7606--
464.0 464.0 7500 7779 7893--
472.5 473.0 7694 7850 8059 8172
9
m
j
3-13 i
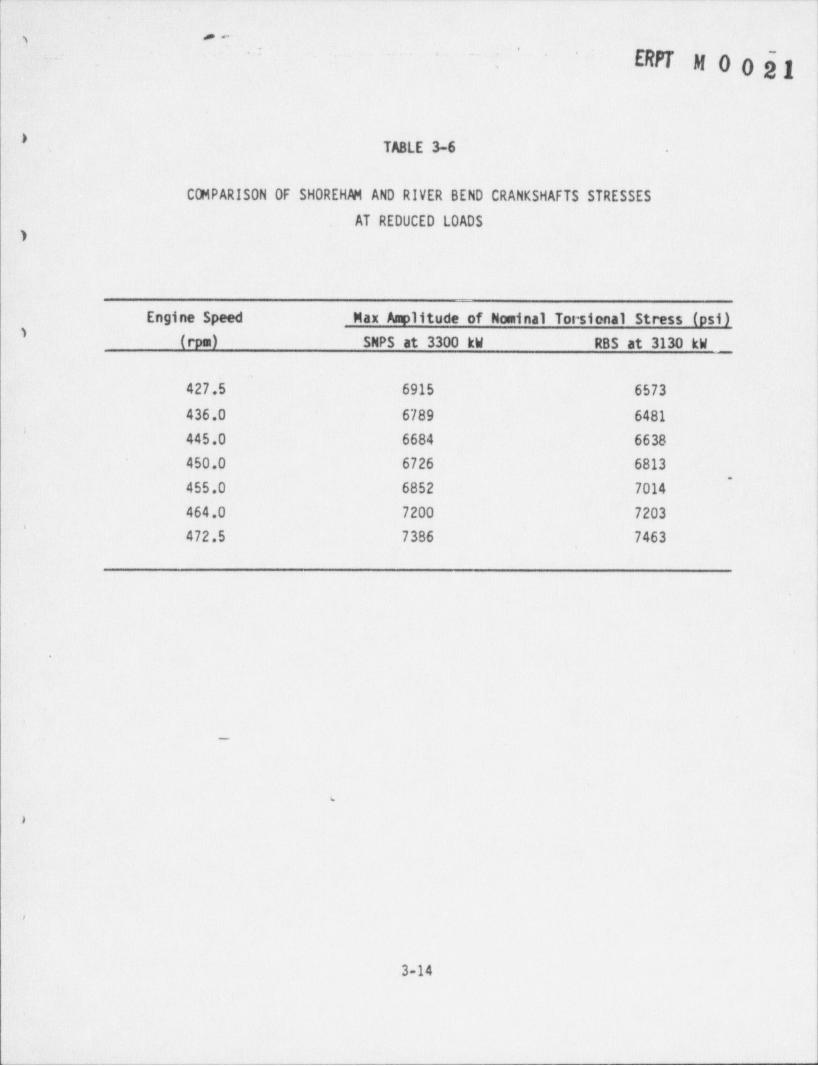
r
~a" -
'
. ERPT M 0 0 f g'
#TABLE 3-6 .
COMPARISON OF SHOREHAM AND RIVER BEND CRANKSHAFTS STRESSES
AT REDUCED LOADS
Engine Speed Max Amplitude of Nominal Torsional Stress (psi)(rpm) SNPS at 3300 kW RBS at 3130 kW _
'
427.5 6915 6573
436.0 6789 6481'
445.0 6684 6638
450.0 6726 6813~
455.0 6852 7014
464.0 7200 7203'
472.5 7386 7463
1
m
b
h
I
3-14
_ _ _ _ _ _ _ _ _ _ _ _ _ _ _ _ _ _ _ _ _ _ _ _ _ _ _ _ _ _ _
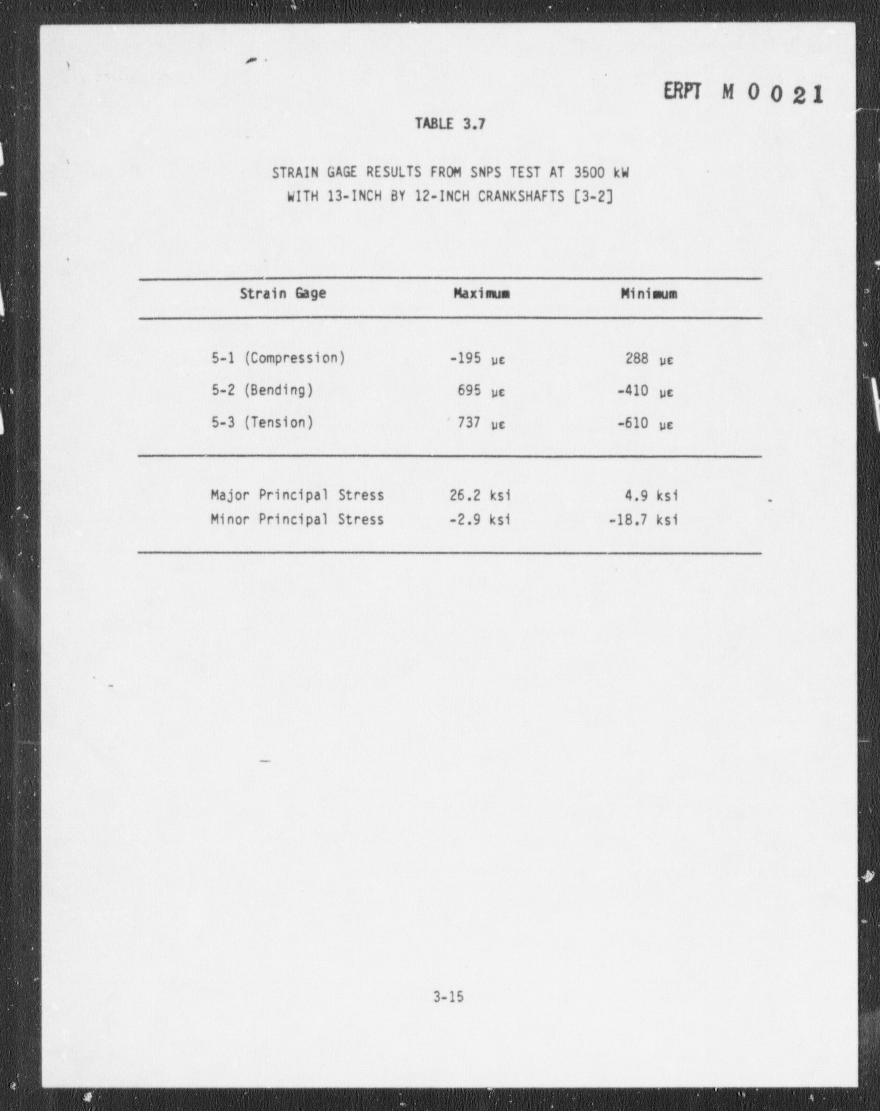
_ _ - _ - _ _ _ _ _ _ _ _ _ - . _ _
'')
,
EM M 0 0 21TABLE 3.7
.
'STRAIN GAGE RESULTS FROM SNPS TEST AT 3500 kW
WITH 13-INCH BY 12-INCH CRANKSHAFTS [3-2]
.
Strain Gage Maximum Minimum
5-1 (Compression) -195 ue 288 uc
5-2 (Bending) 695 uc -410 pc
5-3 (Tension) ' 737 uc -610 ue
Major Principal Stress 26.2 ksi 4.9 ksi .
Minor Principal Stress -2.9 ksi -18.7 ksi
-
N
3-15
. . .
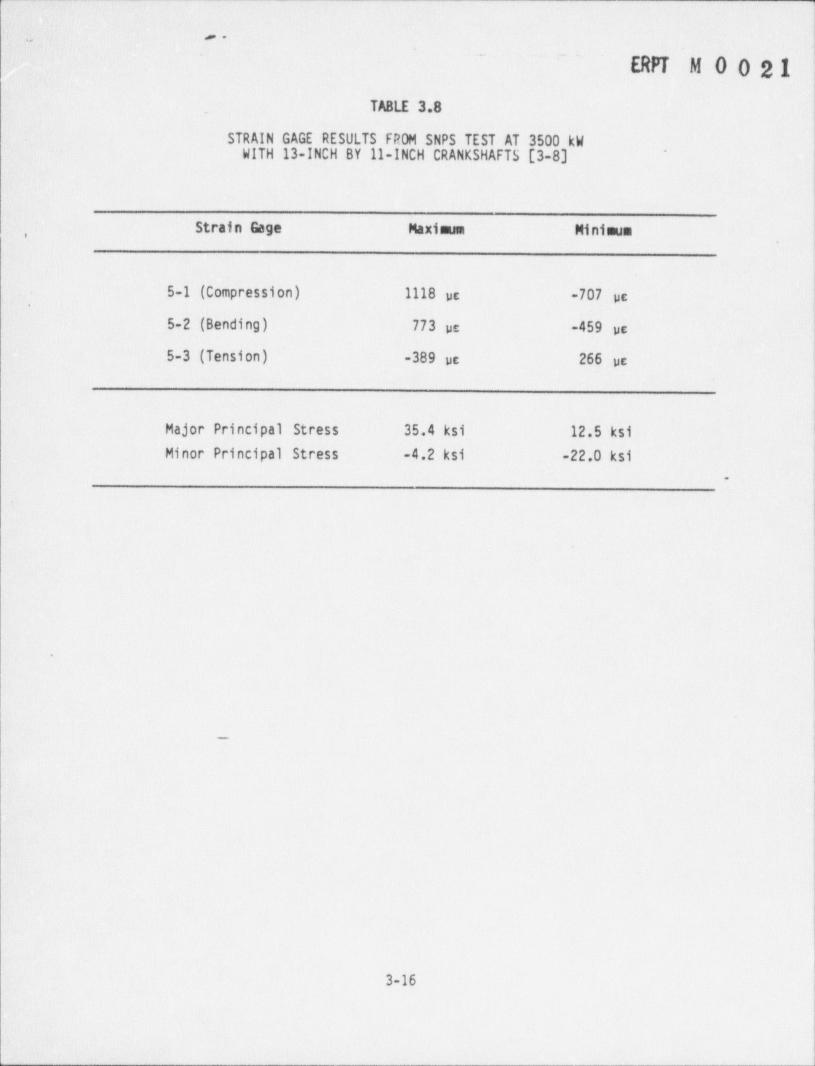
_ _ _ _ _
.~
- ~ "ERPT M 0 0 21
, TABLE 3.8
STRAIN GAGE RESULTS FROM SNPS TEST AT 3500 kWWITH 13-INCH BY 11-INCH CRANKSHAFTS [3-8]
'
Strain Gage Maximum Minimum,
5-1 (Compression) 1118 pc -707 pc,
5-2 (Bending) 773 pc -459 pc
5-3(Tension) -389 pc 266 pc
1
Major Principal Stress 35.4 ksi 12.5 ksiMinor Principal Stress -4.2 ksi -22.0 ksi
.
4
-
3-16
- _ _ _ - _ _ - _ - _ _ - _ _
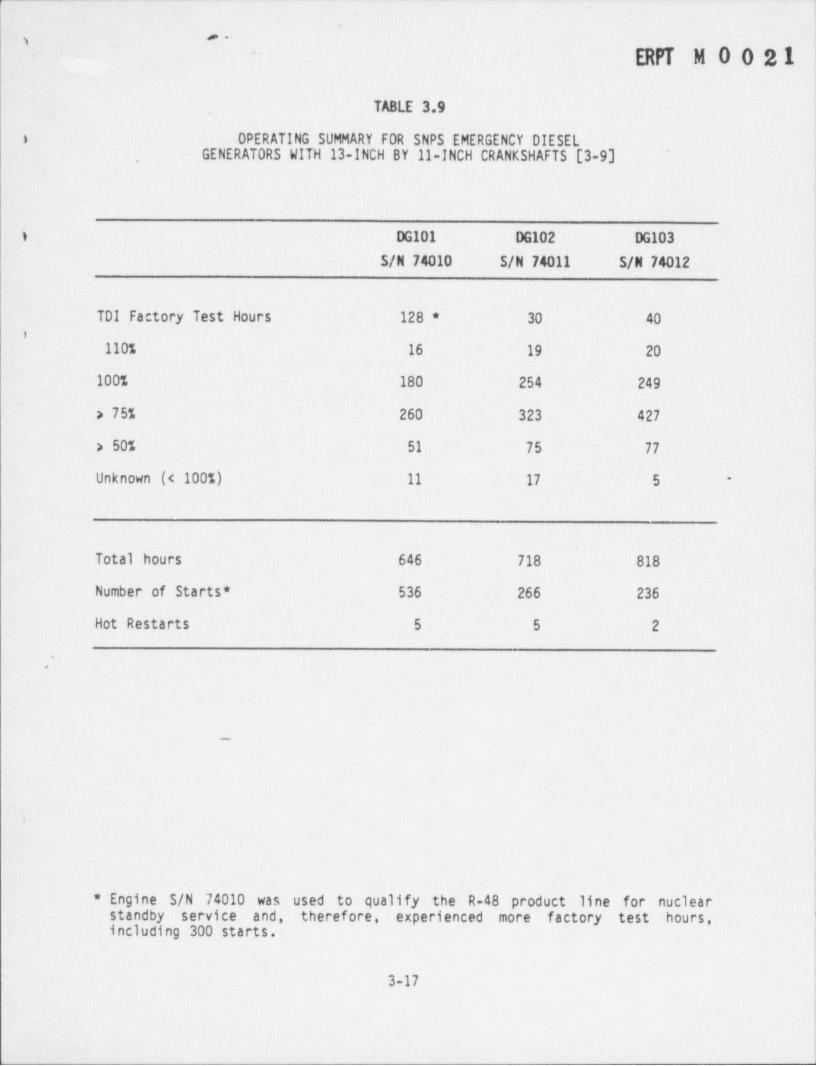
_ _ _ _ .- _ - .
a..,- - an M 0 0 21
_ TABLE 3.9
i OPERATING SUMMARY FOR SNPS EMERGENCY DIESEL >
GENERATORS WITH 13-INCH BY 11-INCH CRANKSHAFTS [3-9],
,
i DG101 DG102 DG103
S/N 74010 S/N 74011 S/N 74012
TDI Factory Test Hours 128 * 30 40i
110% 16 19 ' 20
100% 180 254 249
> 75% 260 323 427
> 50% 51 75 77
Unknown (< 100%) 11 17 5 -
Total hours 646 718 818
Number of Starts * 536 266 236
Hot Restarts 5 5 2
|
-.
,
* Engine S/N 74010 was used to qualify the R-48 product line for nuclearstandby service and, therefore, experienced more factory test hours,including 300 starts.
|3-17
L_ - - - - - - - -- - - . - - - - - - - - - - - _ - - - - - - - - - _ - _ - - - _ - - - _ - - - - -
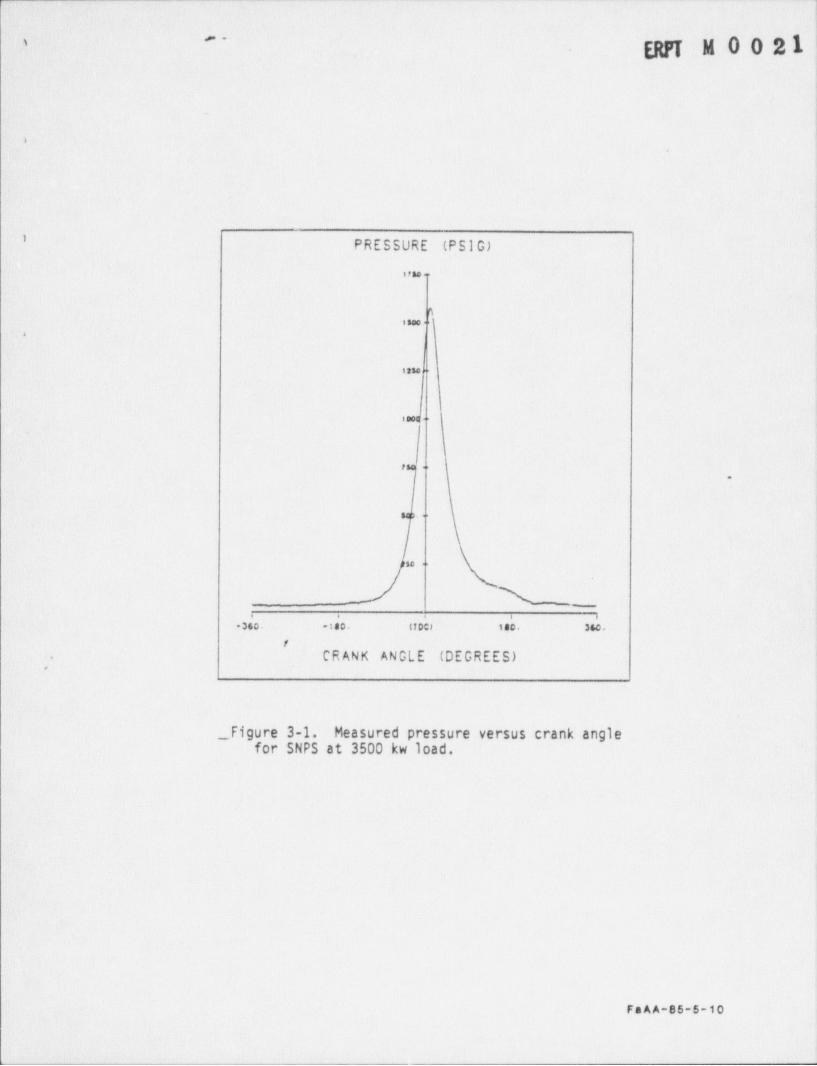
- _ _ _ -_- . - _
3 . ERPT M 0 0 21"-
, -
_
i-.
4
'PRESSURE (P S I G)
. r so .
0.,jseo
isse '
1 <
!
t. Ip 4
to
___
. . . e
360 -140. (TDC) 100. Sec.
f
CR ANK ANGLE' (DEGREES).
.,
__ Figure 3-1. Measured pressure versus crank anglefor SNPS at 3500 kw load.
FaAA-85-5-io
______- _____ _ _ -
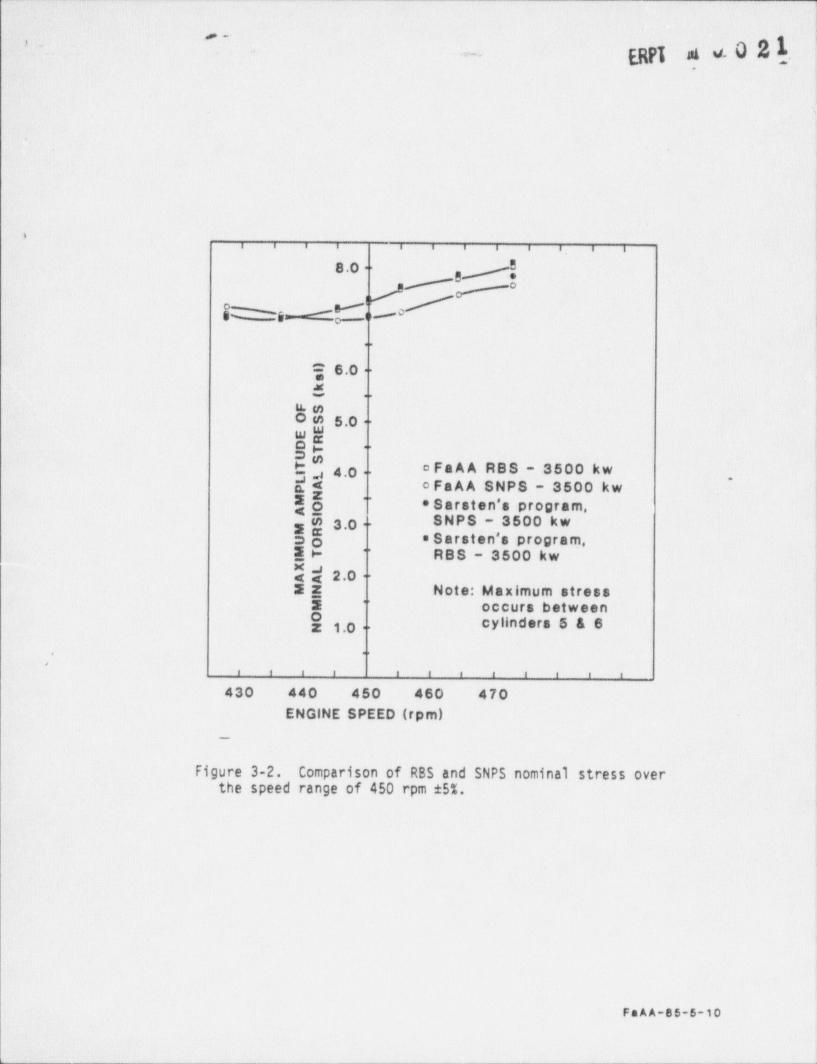
_ . _ . - _ _ _ - _ _ _ _-
s
gp{ d V. 0 2 [.' ' -
- .~
i
1
\
| >i i . . . . . . . ., i f
B8.0 - gy
/ '/ rAo8m(r: ,e cV_c
.
y 6.0-6
u. m,
' Om5o $
.0 -W3- .
tm o Fa A A RBS - 3500 kwA 4,o .g4 o FaAA SNPS - 3500 kw
,
{h * Sarsten's program,*
,is 3.0 SNPS - 3500 kw|- mg . Sarsten's program,
EH RBS - 3500 kw'
xJ<< 2.022 Note: Maximum stress
E occurs between'
!1.0- cylinders 5 & 6
1. *
,
i t t t i f f f f 1 t t
430 440 450 460 470ENGINE SPEED (rpm)
~
i.
Figure 3-2. Comparison of RBS and SNPS nominal stress overthe speed range of 450 rpm 5%.
FaAA-85-5-io
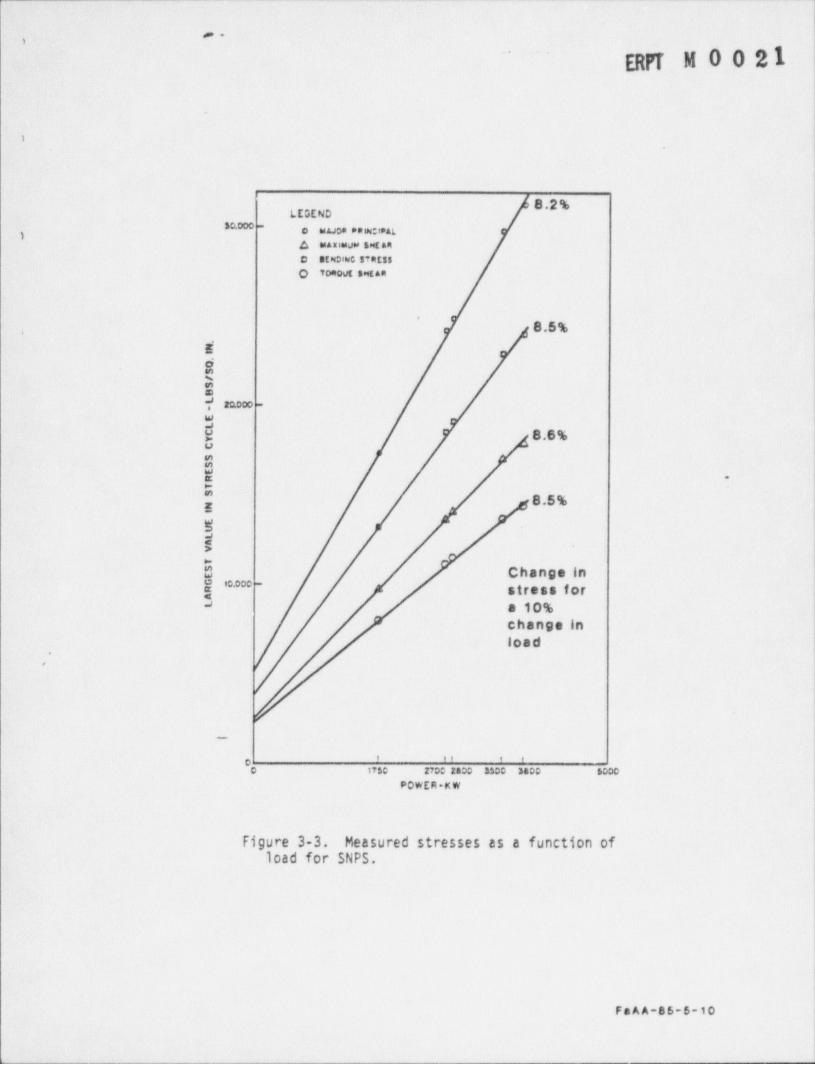
__- - - -
,.,
an M 0 0 21'
.
>.
8.2 %LestNo
80 000 -
o muon enm:i n3
a mariusw sacanc stwome stats:
O Toaout s** tan
'
8.5%,
i
N3m
1 mooo -
2g 8.6%u
# -
|;;8.5 %g
Wi>>-
0 Change inj '# -
stress for" a 10%
change inload
.
,
__
' '' ' 'eO 1750 2700 2000 3500 3400 h000
POWER-KW
Figure 3-3. Measured stresses as a function ofload for SNPS.
I
l
FaAA-85-6-1o
1t . _ _ _ _ _ _ _ _ _ _ _ _ _ _ _ _ _ _ _ _ _ _ _ _ _ _ _ _ _ _ _ _ _ _
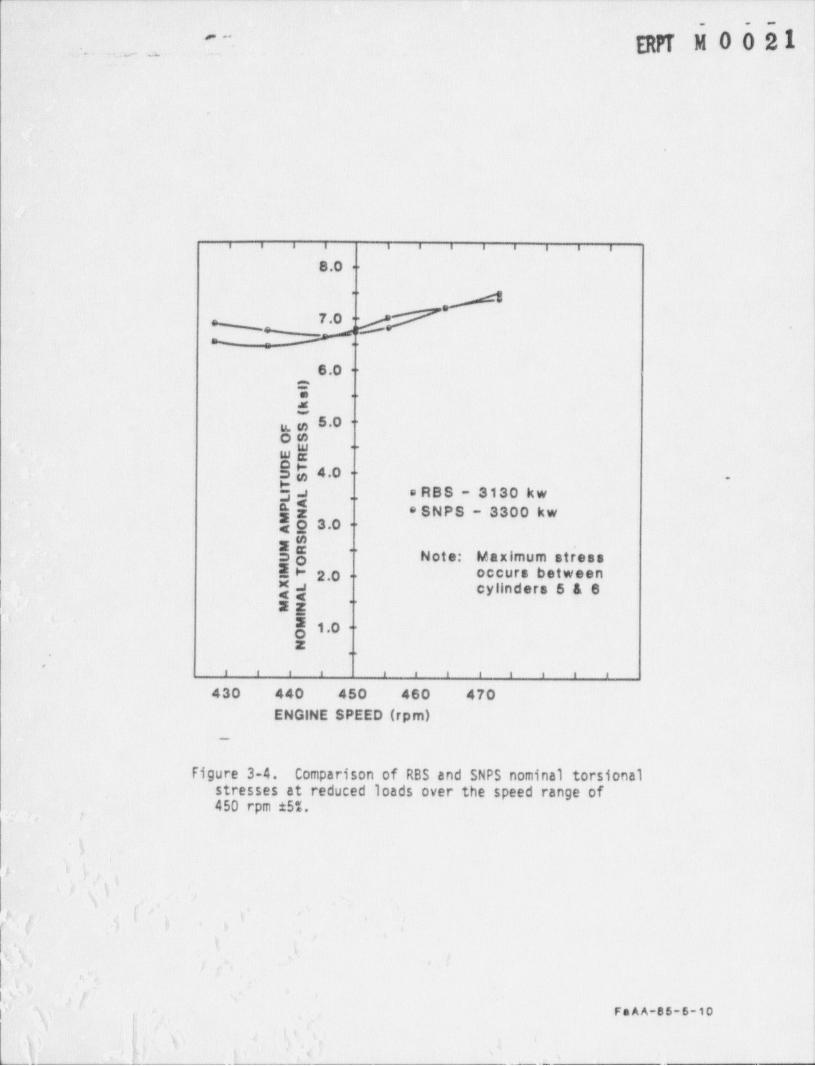
__ _
.. - . .. . .-
Eyt50051'
' ~4
.
. . . i i . . . . , . .
8.0 -
8 '
7_
6.0=e .
6g e 5.0 -Om
. wg "
$ $ 4.0 - .
$ .J a RBS - 3130 kw.,
' g$ * SNPS - 3300 kw4 g 3.0 -e
!$ "
Note: Maximum stressE > 2.0 occurs betweenyg cylinders 5 & 6
,
',- EE' ' g1,o.
2. -
t I I f f f i i f f f e
430 440 450 460 470ENGINE SPEED (rpm)
__
Figure 3-4. Comparison of RBS and SNPS nominal torsionalstresses at reduced loads over the speed range of450 rpm 15%.
,
' ),
+ ,.,i / 4
''
> < ,. \.,
3' - ,
}[ (') I ', }.
,
'
V ',
,q
t (.
A \. - a.w v / g. ,
4'i'
;
\> ' "4-
,
r.AA-es-s-sop N,-
,-
,
op , ' .3 t' iu ,
.
X ' {; .?: '- , ,
_ _ _ _ _ - - - _ _ _ _ _ - _ _ _ _ _ _
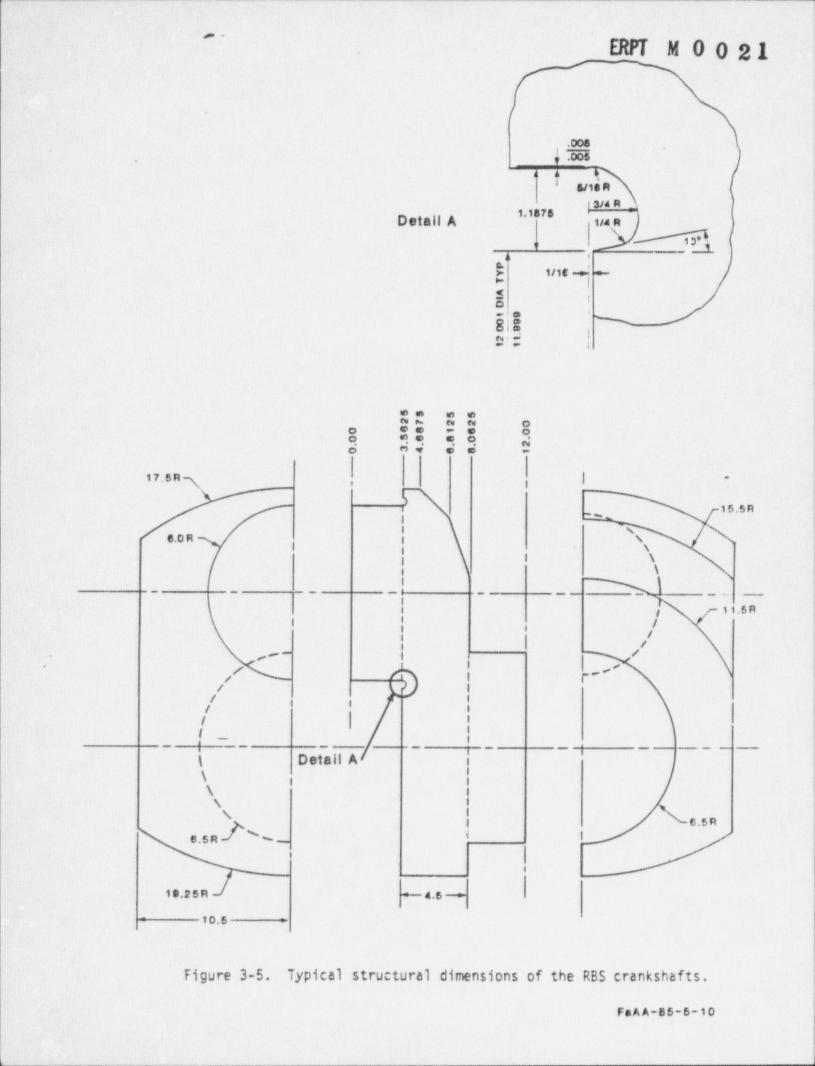
_ __ -___ ___ _ __ _ _ _ _ _ _ _ _ _ _ _ _ _ - _ _ _ _ _ _ _ _ _ _ _ _ _ _ _ _
~
_ERPTM 0 0 21
.
.oos. .006
o e g8 siss R
13/4 R _ l
''''#'Detail A ti4 ni
Io
a e l
h titt .-
Cb
-
81.g_
wi I
h tw OO *9 * O OO, 9 W, 9 O fo n w e e -
,1 I|17.5 R -
,
15.5 R,. -
|6.o R \l g \
g i \
\_ _ _ _| __ N )_
|| i i.5 R,
| | /,/s 11
g q /- i '.
|,
c-- ',,
/ ig/ I/ | 1
_ : _ |I, _;_ _ _ _ __ ___ _
| Detail A i\ !i\ n
\
,1 6.5RI I6.5 R %~
Qi
!i e.2 S n - 4. 5 --
- 10.5
Figure 3-5. Typical structural dimensions of the RBS crankshafts.
FaA A-8 5-5-10
,_ - _ _ _ _ _ _ _ _ _ _ _ _ _ _ -
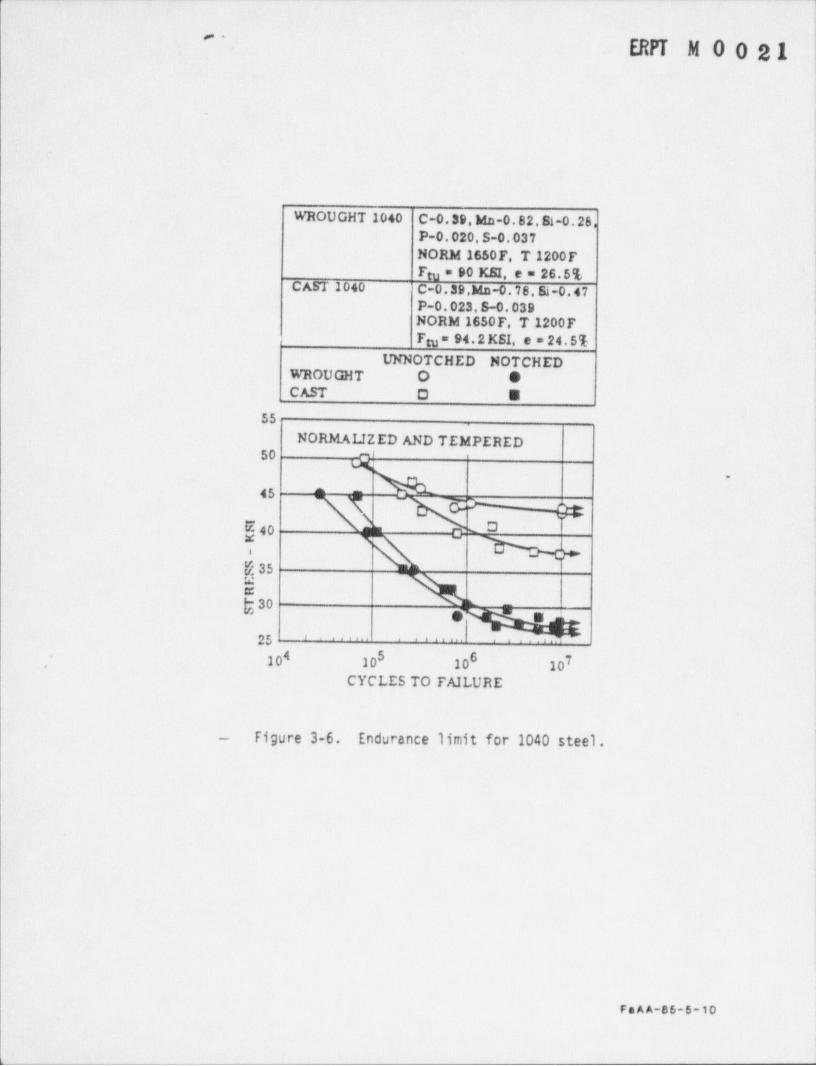
, _ _ _ _ - _ _ _ _ _ _ _ _ _ _ _ _ _ _ _ . _ _ _ _ _ _ _ _ _ _ _ - . _ _ _ _ _ _ _ _ _ _ _ _ _ _ _ _ . - _ _ _ _ _ _ _ _ _ _ _ _ _ _ _ _ . - . _ _ _ _ _ _ _ - . _
- -
BM M 0 0 21
_
WROUGHT 1040 C-0. 39, Mn-0. 82,81-0. 28,P-0,020,S-0.037NORM 1650F. T 1200FFru = 90 KSI, e = 26.5%
CAST 2040 C-0. 39,Mn-0. 7 8, Si-0. 4 7P-0.023,S-0.039NORM 1650F, T 1200FFtu = 94.2 KSI, e = 24.5%
UNNOTCHED NOTCHEDWROUGHT O 9CAST D E
55
NORMAIJZED AND TEMPERED50 q!
. _ h ,
Eo U
: s- m@, 35
-
g 30 _t
,
25 ' ' ' ' ' ''''" '' ' ' ' '
4 5 6 7-
10 10 10 10'
CYCLES TO FAILURE
- Figure 3-6. Endurance limit for 1040 steel.
FaAA-85-5-10
t - __ ____ __.._______
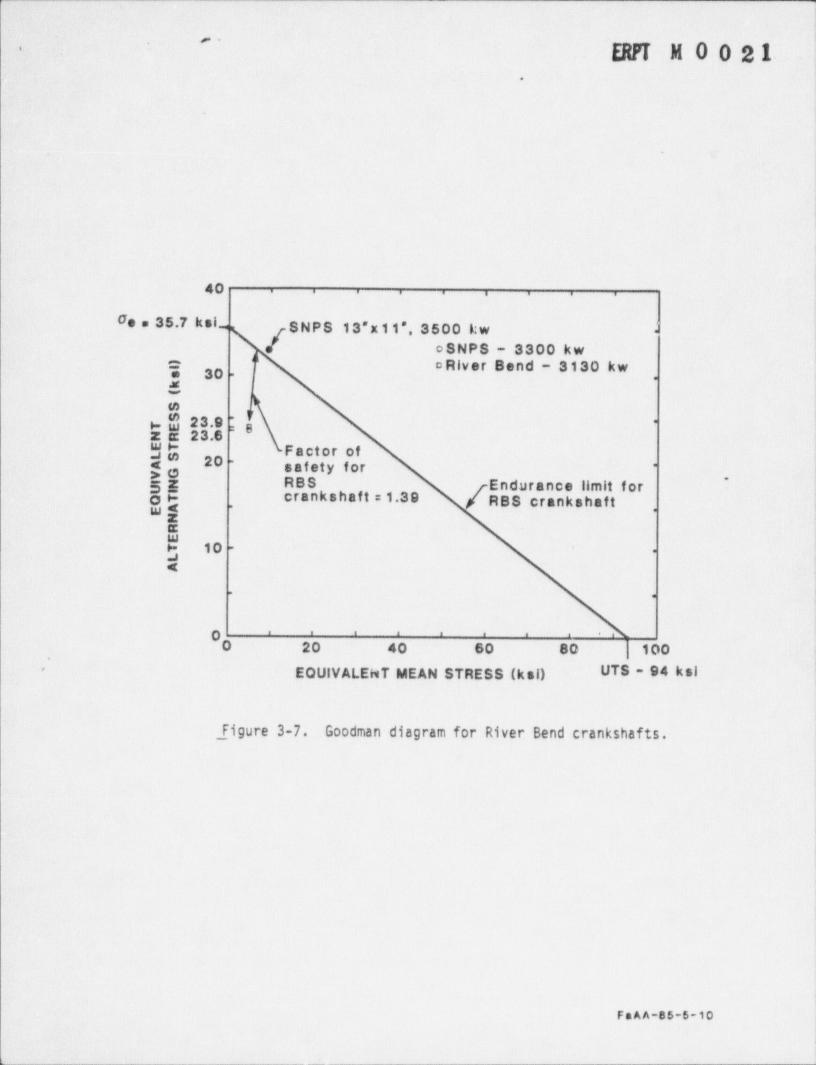
, ._ - _ _ _ _ _ _ _ _ _ _ _ _ - _ _ -
'~
ERN M 0 0 2 1--
.
.
40 . . . . . . . . .
Ce e 35.7 ksi- SNPS 13*x11*, 3500 kw!
-
oSNPS - 3300 kw= oRiver Bend - 3130 kw30y -
-
_
h*
w $ 23.9 ;g "
z e 23.6$$ Factor of
20 -
safety forgg *
5E RBS fEndurance limit f or,
oe crankshaf t = 1.39 / RBS crankshaftwg *'
53 10 -
-
<.
.
O ' ' ' ' ' ' ' ' '
O 20 40 60 80 100
EQUIVALEHT MEAN STRESS (ksi) UTS - 94 ksl
Figure 3-7. Goodman diagram for River Bend crankshafts.
i
I
1
i
FaAA-85-5-10
t. .
. . . . . . . . . . . . _ _ _-
_ _ _ _ _ _ _ _ _ _ _ _ _ _ _ _ .
,. . -
'
ERFr M 0 0 21 '
-
4.0 CRANKSHAFT ENDURANCE TESTING
The NRC Safety Evaluation Report on the TDI Diesel Generator Owners
Group Program Plan, [4-1] provides that where TDI diesels are to be operatedat brake mean effective pressures exceeding 185 psig, the applicant should i
submit information demonstrating that components, which are of the samedesign, have operated successfully for at least ten million load cycles which !
meet or exceed the maximum emergency service load requirements for the subjectengines. The following comparison can be made with an endurance test per-formed on one of the SNPS crankshafts. Alternatively, a design may be quali-fied by testing a prototype to 107 cycles at the rated load where additionaldata is available to demonstrate an adequate fatigue margin. In this case theendurance test is being used to provide additional assurance of the adequacyof the design even though the test by itself would not represent sufficient |
assurance.
A 107 cycle endurance test was run on a DSR-48 engine crankshaft with *
13-inch main journals and 12-inch crankpin journals at a load of 3300 kW* atSNPS. The crankpin fillet and oil hole geometry is identical for the crank-shafts at RBS and those at SNPS. The crankshafts were made according to TDIdrawing number 03-310-05-AC.
While the crankshafts are of the same design for the two stations, theflywheel and generator are somewhat different. This difference leads to a
I small change in the torsional stresses for the crankshafts as discussed inprevious sections of this report. To account for these design differences theload at RBS that produces the same torsional stress as a load of 3300 kW atSNPS may be calctriated. This calculation is based on the linearity of staesswith load which has been established in Sections 2.0 and 3.0. Based on a 7%
change in stress for a 10% change in load, a load of 3071 kW at RBS producesthe same stress as a load of 3300 kW at SNPS, as shown in Figure 4-1.
* The encurance test has been stated to be nominally at 3300 kW. However,Dr. Pischinger (FEV) performed a cumulative damage analysis of the crankshaftbased on the actual loads experienced during the 745 hour endurance test andfound the load to be equivalent to 3505 kW [4-2].
4-1
(
- _____-__- - __ _ - _ _ _ _ . _ -_ _ -- _-
--._ ' _
~~ ERPT M 0 0 21-.
The . material specifications for the crankshafts at RBS and SNPS were'the same. Crankshafts at both plants were required to meet ABS Grade 4 whichhas a minimum ultimate tensile strength, UTS, of 83000 psi. The UTS measure-ments for RBS [4-3, 4-43 and SNPS [4-5, 4-6.-4-7) are shown in Table 4.1. The
lowest measurement at RBS is 94000 psi and at SNPS is 100800 psi. The crank-shafts at both. stations meet the minimum requirements of ABS Grade 4 and haveUTS values within the expected range for this material. The lowest measure-
ment at RBS is about 7% lower than the lowest measurement at SNPS.
The fatigue limit for these crankshafts is approximately proportionalto the UTS of the caterial. Thus, the factor of safety in the SNPS crank-shafts at 3300 kW is approximately 7% higher than in the RBS crankshafts at3071 kW. However, this effect is small in comparison to the factor of safetyin the RBS crankshafts.
The crankpin fillets at SNPS are shot peened whereas those at RBS arenot. While no credit was taken for the effect of shot peening in computing-fatigue margins, it is possible to estimate the maximum effect that it couldhave had on the crankshaft endurance test. The stresses in the most highlystressed main journal oil hole is computed to be about 7%' less than that of
- the most highly stressed crankpin fillet. Thus, if shot peening has more thana 7% effect on the crankpin fillets, the oil holes will govern crankshaftlife. This 7% effect is quite small when compared to the safety margin.
/ The endurance testing at SNPS along with RBS actual experience areplotted against the crankshaft S-N curve in Figure 4-2. It is seen that forthe RDS crankshafts at 3071 kW, the stresses 'are significantly below theactual SNPS endurance test of 3500 kW. The margin between the RBS stresses at
3071 kW and the S-N curve for the RBS crankshaft corresponding to the lowestUTS measurement is adequate to ensure reliable operation of the RBS crank-shafts for their intended service.
4-2
L _ - - _ _ _ _ _ - - - - - - - - - - - _ - - - - - _ - - _ __
. _ _ _ - _ _ _ _ _ _ _ _ _ _ _ _ _
'''ERPT M 0 0 21
4.1 Conclusions
. The following conclusions may be stated:
* The crankshafts at RBS are geometrically identical to those atSNPS-
At 450 rpm the torsional stresses at RBS at 3071 kW are equale,
to those at SNPS at 3300 kW
Although the lowest UTS at RBS is lower than that at SNPS, theematerial specifications are the same and the material meetsthe requirements of ABS Grade 4
The advantage of shot peening is limited to about 7% since theeoil holes are not sh'ot peened.
4
Section 4 References
4-1 U.S. NRC Safety Evaluation Report, Transamerica Delaval, Inc. DieselGenerator Owners Group Program Plan, August 13, 1984.
4-2 U.S. NRC Atomic Safety and Licensing Board hearir.g on Shoreham NuclearPower Station, Docket No. 50-322-OL, Tr. 28419-20.
4-3 American Bureau of Shipping, Report on Castings and Forgings for thecrankshaft in engine 74039, 4-6-80. '
4-4 American Bureau of Shipping, Report on Castings and Forgings for thecrankshaft in engine 74040, 31-7-80.
4-5 Krupp Stahl, Schmiede Und Bearbeitung for the crankshaft in engine74010, 17-10-83..
,
4-6 American Bureau of Shipping, Report on Castings or Forgings for thecrankshaft in engine 74011, February 4,1983.
4-7 American_ Pureau of Shipping, Report on Castings or Forgings for thecrankshaft in engine 74012, February 4,1983.
1
1'
s
4-3
\ - _ - - _ - - - - _ - - _ - - _ - - - _ - - - _ - - - - _ _ _ - -
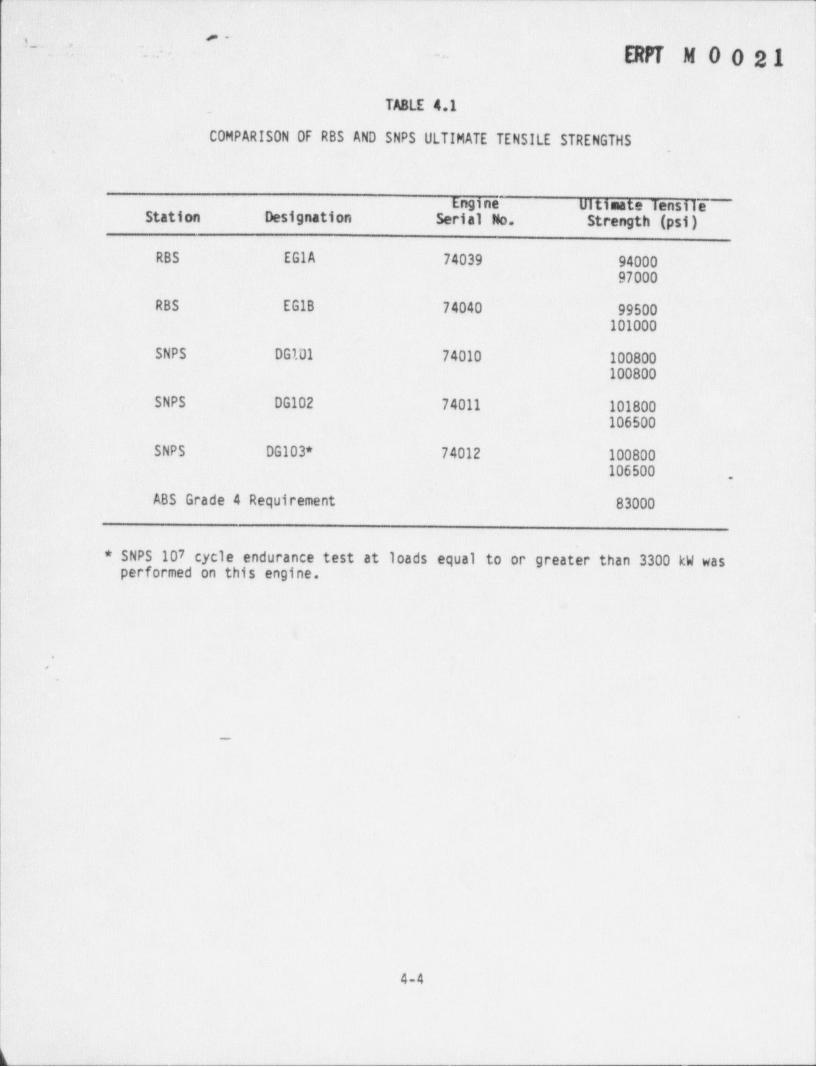
_ ___--- ___-__ - _-
*~u. ,
ERPT M 0 0 21,
.
. TABLE 4.1
COMPARIS0N OF RBS AND SNPS ULTIMATE TENSILE STRENGTHS.
|
Engine Ultimate Tensile ~Station Designation Serial No. Strength (psi)
RBS EG1A 74039 9400097000
RBS EG1B 74040 99500101000
SNPS DG101 74010 100800100800
SNPS DG102 74011 101800106500 !
l
SNPS DG103* 74012 100800106500 .
ABS Grade 4 Requirement 83000
i
SNPS 107 cycle endurance test at loads equal to or greater than 3300 kW was*
performed on this engine.
<
k\
'
,
o
|
I
4-4
\_ _ _ _ . _ _ -- _ _ . _ _ _ - - - . - -- - - - - - - - - - - - _ - _ - - - -- - - -
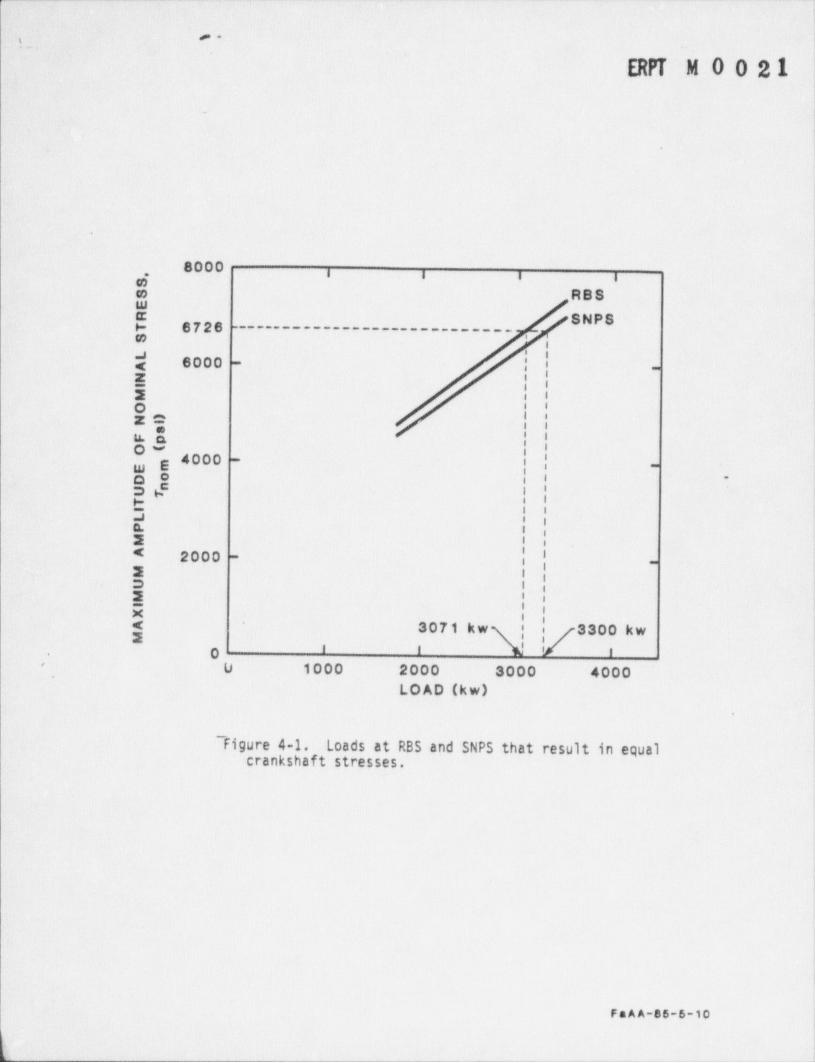
- --
--'ERPT M 0 0 21
.
8000 i i i i.
@ RBSE SNPSH 6726 - ~ ~ ~ ~ ~ ~ ~ ~ - - - ~ ~ ~ - - - ~ ~ ~ ~ ~ ~ ~ ~ ~ ~ ~* ,
{||s
d 6000 --
Zii
|Oz2 I i
i iE I |SL
Ow a ,4000 - 'im E -
O * , .
3 6* | e
>- i I,
I I3 8 1gL l ax | |< 2000 -i i i
-
2 I ie I i!!! | |x I i< -
3071 kwg '| ef3300 kwIe i \ / sO.
< U 1000 2000 3000 4000LOAD (kw)
~ Figure 4-1. Loads at RBS and SNPS that result in equalcrankshaft stresses.
FaAA-85-5-10
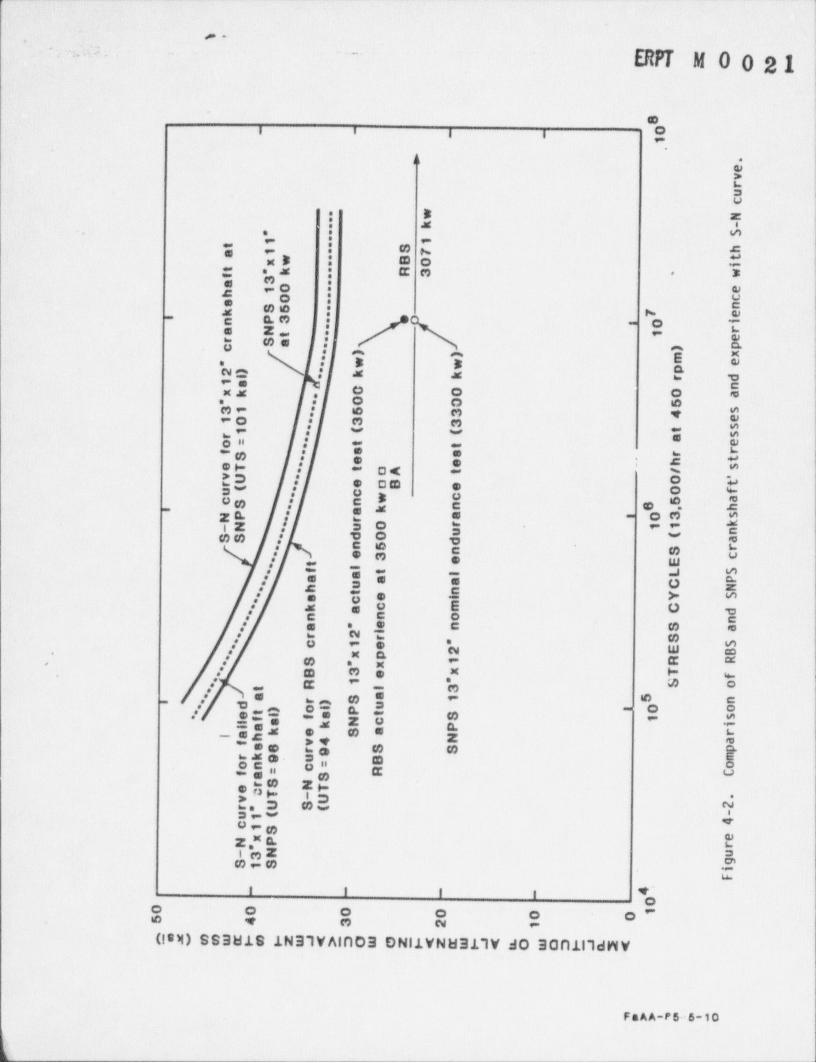
lIIiI!itI!| , '
OON -_ yi
-. . ' ..!
='
_,
80~ - - -
_
1.
: .
evruc
" w N- k -
. * - S*1 1
~ S 7 ht
a 1- txw B 0" i
t *k R 3 w'f -
a 310 " eh -0 cs " nS5k 7 en P3 "i
0 it
a N " rt 1 er Sa " p'c )' w w
) ) xm e" p2 )l k k r d _
_
1 a nxk 0 0 0 a _.* - 0 0 5 .
31 - s5 3 410 " 3 3 es' ( ( t1 sr ao= ' et t rs s rf S ' e e h t.
, _ seT t oA t /vU 0 'tr e o8 e 0 fu( c- w c a
. a k n 6 5,cS * n* hs
NP a 03 sir k- N u 0 r 1 1u nSS d 0 (
d an 5 r.
- n S- e 3 e E c** t
l. f t L S- a a l
a a C P* u N. h nt Y Ss c e* i*' k a c m C d' n n o n
a * e n S a' i" r 2 Sr" Sc 1 e E B2x p.
. 1 R RS * x'
B 3 e x T5 Rf
1 * S o3l= t
a 1 5 n* a r Sd o )l Pi u 0 oIeft )l e t S sf* 1
a k N cel P ii
k e S a rah_ f v4 N a| ._
s6 r9 S S p__
rk9 u B m__ on= c= o_
R C_f_ a S_
rS NTe nT -r U S (U
.v2
u "1 ( -4c1S e
N *x P r3 N u
S1S gi
F
- - - - 4,0
.
0 0 0 0 0 O_
1
5 4 3 2 1
_ eex* o# g gz* <>5OW OzI<zawF .# u.O ,03t2 (L I *t J ~
;$ 2+.o .
I| l || (| ) |l|1 ||
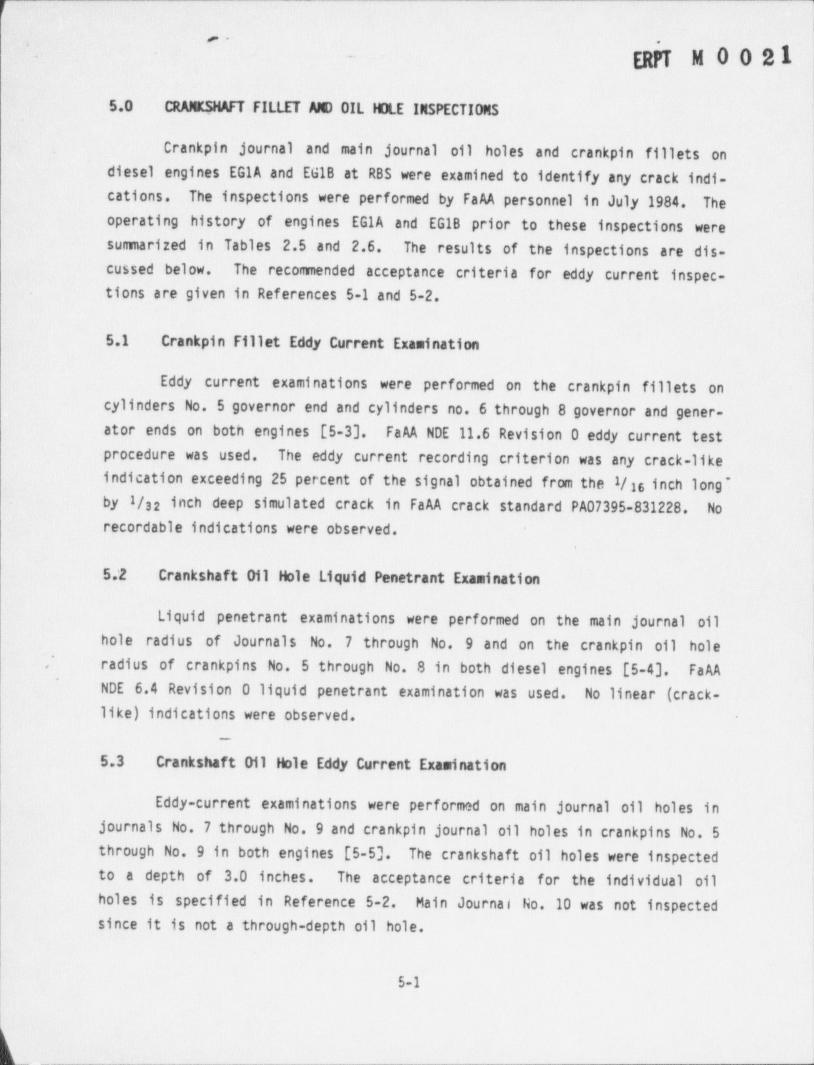
/.
.,
, ~
ERPT M 0 0 21
5.0 CRANKSHAFT FILLET Af0 OIL HDLE INSPECTIONS
Crankpin journal and main journal oil holes and crankpin fillets ondiesel engines EG1A and EG1B at RBS were examined to identify any crack indi-cations. The inspections were performed by FaAA personnel in July 1984. Theoperating history of engines EGIA and EG1B prior to these inspections were Isummarized in Tables 2.5 and 2.6. The results of the inspections are dis-
|cussed below. The recommended acceptance criteria for eddy current inspec- ftions are given in References 5-1 and 5-2. '
5.1 Crankpin Fillet Eddy Current Examination
!
Eddy current examinations were performed on the crankpin fillets oncylinders No. 5 governor end and cylinders no. 6 through 8 governor and gener-ator ends on both engines [5-3]. FaAA NDE 11.6 Revision 0 eddy current testprocedure was used. The eddy current recording criterion was any crack-like i
indication exceeding 25 percent of the signal obtained from the 1/16 inch long'by 1/32 inch deep simulated crack in FaAA crack standard PA07395-831228. No
recordable indications were observed..
5.'2 Crankshaft Oil Hole Liquid Penetrant Examination
Liquid penetrant examinations were performed on the main journal oilhole radius of Journals No. 7 through No. 9 and on the crankpin oil hole
/ radius of crankpins No. 5 through No. 8 in both diesel engines [5-4]. FaAA
NDE 6.4 Revision 0 liquid penetrant examination was used. No linear (crack-like) indications were observed.
_
5.3 Crankshaft Oil Hole Eddy Current Examination I
Eddy-current examinations were performed on main journal oil holes injournals No. 7 through No. 9 and crankpin journal oil holes in crankpins No. 5through No. 9 in both engines [5-5]. The crankshaft oil holes were inspectedto a depth of 3.0 inches. The acceptance criteria for the individual oilholes is specified in Reference 5-2. Main Journal No.10 was not inspectedsince it is not a through-depth oil hole. I
5-1
____
_ _ _ _ _ ._ _
- m - . -
EFT M 0 0 21
FaAA NDE- 11.3 Revision 0 eddy current procedure was used. The crack
reference (FaAA PA07395-74073) is a simulated oil hole machined in a segmentof crankshaft and containing a simulated crack of 0.040 inch long by j
0.020 inch deep.
Eddy current indications were observed exceeding the recording jthreshold at various depths in all of the oil holes inspected. An interpreta-
{tion of the results of this test was made utilizing the most recent FaAA eddy Icurrent recording criteria for oil holes (NDE 11.3, Revision 2). Using thisprocedure only 5 of the 28 oil holes inspected had recordable indication[5-2]. The recommended oil hole acceptance criteria is detailed by cylinderlocation and broad ranges of depth from the journal surface (0" to 1",1" to f2", and 2" to 3"). Further evaluation of the allowable notch sizes for thefive oil holes at the depth at which the threshold readings were exceeded was I
made [5-5]. The results indicated that for these oil holes the readings are,
within the allowable criteria..
5.4 Conclusions
The following conclusions can be stated:
The eddy current inspection of the fillets on EG1A and EG1Beshowed no recordable indications were present.
The results of the liquid penetrant inspections of the maine.
journal and crankpin journal oil hole radii indicated that no<
crack-like indications were observed.
{ A review of the results of the eddy current inspection of theemain joucnal oil holes on EGIA and EG1B indicates that allreadings are within the acceptable criteria.
References
j 5-1 Memorandum to John C. Kantneyer, DR/QR Program Manager from Paul R.) Johnston, Crankshaft Design Review Task Leader, dated 7/26/84, re: 011'
Hole Inspections for DSR-48 Crankshafts at River Bend. !
5-2 Memorandum to Duane Johnson, FaAA NDE Manager, from Paul R. Johnston,Crankshaft Design Review Task Leader, dated 7/9/84, re: Inspection of
| DSR-48 Crankshafts of River Bend.|
|
5-2
\

. _ _ _ - _ _ _ - _ _ - _ _ - _ _ - _ _ _ _ _ _ _ _ _ _ _ _ _ _ - _ _ _ _ _ - . _ _ _ . _ . _ _ _ - . _ _ ,
#-
p .-
ERf'T M 0 0 212. _.
5-3 FaAA Eddy Current Examination 1 Report Nos. 840710-101, 840710-201,840711-202, 840711-203, dated July, 1984.
5-4 FaAA Liquid Penetrant Examination Report Nos. 840715-603, 840715-604dated July, 1984
| 5-5 Hand Calculation " Review of NDE Crankshaft Inspection Reports,"! FaAA-SP-85-5-10.
1
i
.
'
.
|
|
=
I
;
5-3
'
. ..