evaluating web user perceived latency using server side measurements
TRANSCRIPT

Evaluating web user perceived latency using server
side measurements
Marik Marshak1, Hanoch Levy*
School of Computer Science, Tel Aviv University, Tel Aviv, Israel
Received 7 August 2002; accepted 7 August 2002
Abstract
The central performance problem in the World Wide Web, in recent years, is user perceived latency. This is the time spent by a user while
waiting for a Web page he/she requested. Impatience with poor performance is the most common reason visitors terminate their visit at Web
sites. For e-commerce sites, such abandonment translates into lost revenue. For this reason, measuring the delay experienced by its customers
is of high importance to a Web site. These measurements are critical for analyzing the site behavior and to size its components. As of today
the main tool for conducting such measurements are external, client-side tools, whereby agents located on the net request pages from the site
and measure its latency. In this paper we propose a novel solution that conducts the measurements of the user perceived delay at the Web site.
The major advantage of this measurement approach, as opposed to client side approach, is that it can evaluate the latency experienced by each
and every client (regardless of its network location). Further, this estimate can be conducted at real time, thus allowing the server to control its
operation and prioritize the requests based on the actual performance observed by the clients. The solution does not require any agents to be
placed at the net. Further, it does not sniff low-level protocols (that is, IP protocols) and is all based on implementation at the HTTP level. As
such, it is very efficient and economical. The solution is based on a novel technique in which a special tiny HTTP object, which is called the
sentry and which is inserted at the end of the HTTP document, assists in measuring the user perceived latency. The algorithm is implemented
on the Apache server. The implementation was tested throughout an extensive array of tests and found to provide very accurate measures
(whose relative errors were in the order of several percents only).
q 2002 Elsevier Science B.V. All rights reserved.
Keywords: Web server; Perceived user latency; HTTP; Local measuring
1. Introduction
The rapid growth of the World Wide Web in recent years
has caused a significant shift in the composition of Internet
traffic. Today, Web traffic forms the dominant component of
the Internet backbone traffic. Therefore, there is significant
value in understanding the Web performance, and especially
that experienced by the users. The central performance
problem in the World Wide Web, in recent years is user
perceived latency. This is the time elapses from the moment
the user requests a Web page till the time he/she receives the
requested page. Impatience with poor performance is the
most common reason users terminate their visit at web sites.
For commercial sites, such abandonment translates into lost
revenue. A key for reduction of these delays is proper
measurement of the user perceived latency. Once the
perceived latency of a Web site as experienced by the
users is estimated, a Web site can use several methods to
reduce it: (1) a mirror site, (2) wider connectivity to the
Internet, (3) better Web server or, (4) load balancing.
Furthermore, if the estimation can be done at real time, it
can be used for online control of the server scheduling and
prioritization mechanism to improve the performance
perceived by the clients.
Today, the common approach for measuring this
perceived latency is to conduct the measurement from
outside of the server using remote agents. This method
deploys a limited number of remote agents placed around
the Internet. These agents fetch a specific Web page from
the Web server, and thus measure the latency from those
locations only. The disadvantages of this method are (1) the
Web site is dependent on an external body for conducting
these measurements, (2) the number of agents is limited;
Computer Communications 26 (2003) 872–887
www.elsevier.com/locate/comcom
0140-3664/03/$ - see front matter q 2002 Elsevier Science B.V. All rights reserved.
PII: S0 1 40 -3 66 4 (0 2) 00 2 20 -7
1 M. Marshak is currently with EMC, USA. This research was partially
supported by a grant from the Ministry of Science, Israel.
* Corresponding author.
E-mail addresses: [email protected] (H. Levy), mmarshak@emc.
com (M. Marshak).

therefore, their measurements do not reflect what real Web
users experienced in other places, (3) the approach cannot
provide a real-time measure of the latency as perceived by
the individual clients, (4) the perceived latency measured by
the agents does not have a breakdown to the various latency
components, and (5) the agents’ DNS lookup time is
affected by prior DNS lookup queries.
In this work, we propose a new approach to estimate user
perceived latency, based on server side measurement. The
new solution does not require any agents to be placed at the
net and no additional hardware. Further, it does not monitor
packets at low-level protocols (TCP/IP) and is all based on
implementation at the HTTP level. The other properties of
the solution are (1) low CPU and network overhead, (2)
minimal network architecture dependency, (3) minimal
modification to the Web server and, (4) no additional user
perceived latency. Our solution is based on two fundamental
observations. The first is that a common Web page consists
of text, inlined2 images and scripts. We exploit this
structure, aiming at extracting information from the inter-
request times experienced by the server while the user
fetches the Web page. The second is that while packet traces
are normally not collected, HTTP access logs are kept by
most sites. These logs contain hidden information that can
be extracted, and when combined with the first observation,
can be used to calculate the user perceived latency.
Our solution is based on a new technique in which a
special tiny and practically unnoticeable HTTP object,
called the sentry, is embedded at the HTML file and used in
measuring the user perceived latency. Our solution consists
of two elements, one element is the measuring element and
the other one is the latency estimation element, which can
be run either in online or off-line fashion. The measuring
element consists altogether of four components: (1) the
sentry—a zero size inline HTTP object that is placed at the
end of the HTML document (and thus does not add
overhead) which tracks the arrival time to the user, (2)
Extended Server Access Log, (3) Queue Latency Probe, and
(4) External Pinger—an external program to measure RTT
between the users and the server (It should be noted that this
is not the only source for computing RTT, and that we
compute an alternative measure of RTT from the Web
server logs). The estimation element takes as input these
data sets and compute an estimate for the time took for the
user to fetch the textual portion of the Web page and the full
Web page (text and inlines).
Our method cannot measure the DNS lookup time.
However, for most Web sites the DNS lookup time [6] in
comparison with the whole transaction time is negligible.
Note also, that other solutions that use remote measure-
ments face the same problem, since their DNS queries are
affected by the previous queries, which bias the measure-
ments. To address the DNS access issue, we will show
a scheme to check whether users have problem accessing
the server due to DNS problems.
A major advantage of our approach, in comparison to
client (agent) based approaches, is that it can provide in real-
time a good estimate of the delay experienced by each of the
individual clients visiting the site. This information can be
used dynamically by the server, in an online mode, to
dynamically control its prioritization and scheduling
algorithms in order to optimize the perceived performance
of the system; for example, high priority can be given to
clients which are subject to large delays. All this is
implemented without the need to use low-level protocols
or without needing an extra expensive piece of hardware.
We demonstrate our approach by implementing it on the
Apache [2] Web server. The server was running on a PC
acting as a dedicated Web server and we ran Web clients,
that simulate Web browsers with extensive monitoring
capabilities, under different Web server loads and from
different locations with different network characteristics. To
examine our approach we conducted an array of exper-
iments. Our experiments show that the proposed method
estimates the latency to fetch the textual portion of the Web
page and the full Web page with an average error of 4%
under normal server loads, and an average error of 10%
under overloaded server loads.
The remainder of this work is organized as follows:
Section 2 provides background and notations; Section 3
analyzes a Web page transfer; Section 4 describes the
observations led us to the solution; Section 5 describes the
measuring architecture of our solution; Section 6 describes
estimation algorithm of our solution; Section 7 evaluates our
solution; Section 8 presents related problems and their
solutions; Section 9 presents concluding remarks and future
work.
1.1. Related work
The collection of information about user activity on the
Web has been the subject of extensive research in both
academia and industry. Over the last years, several
approaches for collecting information about user Web
activity were proposed. These are: (1) modified Web
browsers, (2) Web servers logs, (3) Web proxies logs, and
(4) packet monitoring. Each of these methods has its own
advantages, but most suffer from severe limitations regard-
ing the detail of information that can be logged. Until now,
the only method used for collecting information for
estimating various latency components was the packet
monitoring method [9,14], which used complex algorithm
and additional hardware to produce the HTTP trace. Very
recently this approach has been applied in a proprietary
commercial solution [15].
Rajamony and Elnozahy [17] recently presented a
framework for measuring the user-perceived response
time of clients accessing a Web server. Their solution is
based on instrumented hyperlinks and java script that is run
2 This paper uses the terms of embedded images and inlined images
interchangeably.
M. Marshak, H. Levy / Computer Communications 26 (2003) 872–887 873

on the client side. After the user clicks on the hyperlinks, the
script collects the client perceived response time and reports
it back to the server. Their solution suffers from several
drawbacks: (1) it assumes that the script already resides on
the client side, which often is not the case. (2) It cannot
compute response times for pages loaded by the user
directly entering a URL into a browser’s location bar. (3) It
is based on the client running JavaScript 1.1, which is
frequently not the case (due to the browser not supporting
these scripts or the user disabling them). (4) It cannot
provide additional insight into the components of the
latency, for example, whether the latency is high due to
server load or due to another reason.
A proprietary commercial product that uses similar
principles to those of Ref. [17] is the Quality of Service
Monitor (QoS) of Tivoli [21].
A number of commercial products use a geographically
distributed set of clients (agents) to periodically retrieve
Web pages from Web servers. The distributed agent
approach is likely to obtain a very precise measure of the
specific page being retrieved. However, it suffers from
several drawbacks. (1) The response time obtained through
this method does not necessarily reflect the response time
seen by the real visitors of the Web site. This stems from the
fact that the geographical and temporal distribution of the
agent retrievals may be completely different from those of
the web site’s actual customers. Note that the actual
customer perceived latency can be very variable due to
variability in equipment (e.g. ADSL vs. modem), network
conditions and geographic location. In fact, in our
experimentation (See end of Section 7.2) such variability
is indeed observed. (2) The DNS lookup time that these
clients measure is affected by previous queries done to the
DNS server, hence resulting in small DNS lookup time. (3)
These solutions cannot provide additional insight into the
components of the latency, for example, whether the latency
is high due to server load or due to another reason. Examples
of such client retrieval systems are Sitescope [18], Keynote
[13], NetMechanics [16], and Software Research [19].
2. Background and notations
2.1. Latencies of Web transfer
The fact that each Web page consists of many embedded
images implies that Web browsing sessions typically consist
of many HTTP [7] requests, each for a small size document.
The practice with HTTP/1.0 was to use a separate TCP
connection for each HTTP request and response [3]. This
led to incurring connection-establishment and slow-start
latencies on each request [11]. Persistent connection
addresses this problem by reusing a single long-lived TCP
connection for multiple HTTP requests. Persistent connec-
tions became default with HTTP/1.1, which becomes
increasingly deployed. Deployment of HTTP/1.1 reduces
the latency incurred in subsequent requests to a server
utilizing an existing connection, but longer perceived
latency is still incurred when a request necessitates
establishment of a new connection. The process that is
required for exchanging an HTTP message request/response
between the client and the server is as follows: first, the IP
address of the server is needed in order to establish a
connection. Therefore, the browser has to map a domain
name of the server to the server’s IP address. Browsers may
send a DNS query to a local name-server or get it from their
internal cache. A name-server caches an address for TTL
seconds [5]. Second, HTTP messages between a client and a
Web server are sent using TCP connections. A new HTTP
request may either use an existing persistent TCP connec-
tion, or establish a new connection. The events in the case of
a new connection establishment phase of an HTTP
transaction are as follows: 3 (1) the client sends a SYN
segment to the serve, (2) the server’s TCP places the request
to a new connection in the uncompleted connection queue
and sends to the client the server’s SYN segment with the
ACK flag on, (3) the client acknowledging the server’s SYN
and the server’s TCP moves the new connection from the
uncompleted connection queue to the completed connection
queue, (4) the new connection is waiting to be accepted by
the server. After the server establishes the connection, the
Web server is ready to read the HTTP request from the
client and sends back an appropriate response.
The completed connection queue’s average length depends
on how fast the HTTP server process calls accept() and on
the request rate. If a server is operating at its maximum
capacity, it cannot call accept() fast enough to keep up with
the connection request rate and the queue grows. When
these queues reach their limit new connection requests will
be refused. Lastly, once a connection is established at the
transport layer, the client sends an HTTP request to the
server over that connection and waits to read the server
response. The client request is processed by the server’s
HTTP daemon. Before responding to the request, the server
may add latency due to the following: (1) disk I/O, (2)
generation of dynamic contents, and (3) reverse-DNS query
which happen rarely. To display a typical Web page, a
browser may need to initiate several HTTP transactions to
fetch the various components (HTML text, images) of the
page. With persistent connections, supported by HTTP/1.1,4
subsequent requests (which can be requests for the
embedded images or for a new URL) and responses may
utilize the same TCP connection (this feature is shown in
Fig. 1). Pipelining is supported by HTTP/1.1, and allows for
several HTTP request–responses to overlap in time on the
same TCP connection: a subsequent request can be issued
3 For simplicity, we focus our discussion on a BSD [20] based network
subsystem. The process in many other implementations of TCP/IP, such as
those found in Unix System V and Windows NT is similar.4 Prior to HTTP/1.1 some browsers and servers used the option Keep-
Alive to keep TCP connections open and reuse them.
M. Marshak, H. Levy / Computer Communications 26 (2003) 872–887874

without waiting for the response to the previous one (this
feature is not shown in Fig. 1). According to Ref. [24],
popular browsers implement persistent connections, but do
not implement pipelining. An additional factor contributing
slightly to the latency factor is the ‘client program think’
time. This latency can be caused by the following elements:
(1) waiting for discovering new references of embedded
images in the HTML page. (2) The client’s CPU is
switching between the different browser threads.
2.2. Interaction between HTTP and TCP at Web servers
The interaction between the operating system and the
Web server application imposes some separation between
the HTTP session and the transport layer. There is typically
no channel for ‘upward’ communication from the transport
layer to the HTTP server as to whether and when
transmission is completed and acknowledged.
2.3. Concurrent TCP connections
Modern multi-threaded browsers often facilitate HTTP
transfers by opening multiple concurrent TCP connections.
The browser initiates multiple parallel image requests as the
basic HTML page is received. The maximum number of
connections to one server is browser dependent. The
suggested number is two concurrent persistent TCP
connections with HTTP/1.1. According to Wang and Cao
[24] and self-measurements, it seems that HTTP/1.1 version
of Microsoft Explorer uses about two concurrent persistent
TCP connections to a server and HTTP/1.1 Netscape
Navigator uses about four concurrent persistent TCP
connections to a server. Both browsers open these
concurrent persistent TCP connections regardless of the
number of embedded images in the Web page.
2.4. Server logs
As part of processing an HTTP request, the Web server
generates a log entry with several fields. The common fields
found in most logs include: (1) IP address or name of the
client, (2) first line of the request including the HTTP
method and URL, (3) Date/Time (in whole seconds) stamp,
(4) HTTP response status code, and (5) number of bytes in
the response, not including headers. The meaning of the
date/time stamp is one of the following: (1) the epoch when
the server starts processing the request, (2) the epoch when
the server starts writing the response contents into the socket
buffer, or (3) the epoch when the server completes writing
the response contents into the socket. Server Logs may also
contain some of the following fields: (1) Cookie information
and (2) Server processing time (in whole seconds).
Krishnamurthy and Rexford [14] indicate that currently
standard log files generated by Web servers do not include
sufficient detail about the timing of all possible aspects of
data retrieval. The new standard HTTP 1.1 [10] introduces
new features that are currently not logged in the server logs.
2.5. Notations
In the rest of this paper we will use the following
terminology: Main page latency—the time that elapsed
from the moment the user request the specific URL till the
time he receives the textual part of the Web page, that is the
HTML portion of the Web page. Web page latency—the
time that elapses from the moment the user requests the
specific Web page till the time he receives all the Web page,
that is the text and all the embedded images. Connection
latency—the time that takes to establish a TCP connections
(3-way handshake). Queuing latency—this is time the client
is waiting in the complete connection queue. Web page
transaction—this includes all the requests the client issues
Fig. 1. Web page transaction for fetching a Web page using persistent connections.
M. Marshak, H. Levy / Computer Communications 26 (2003) 872–887 875
in the process of requesting the Web page (text and
embedded images) and the corresponding server responses.
Inter-request time—this is the time between successive
HTTP requests on the same persistent TCP connection.
3. Analysis of a Web page transfer
Our method was developed for use with persistent
connections with no pipelining. This follows a study
done by Wang and Cao [24], indicating that popular
browsers implement persistent connections, but do not
implement pipelining. Extension to our method under the
assumption of pipelining will be discussed in Section 7.
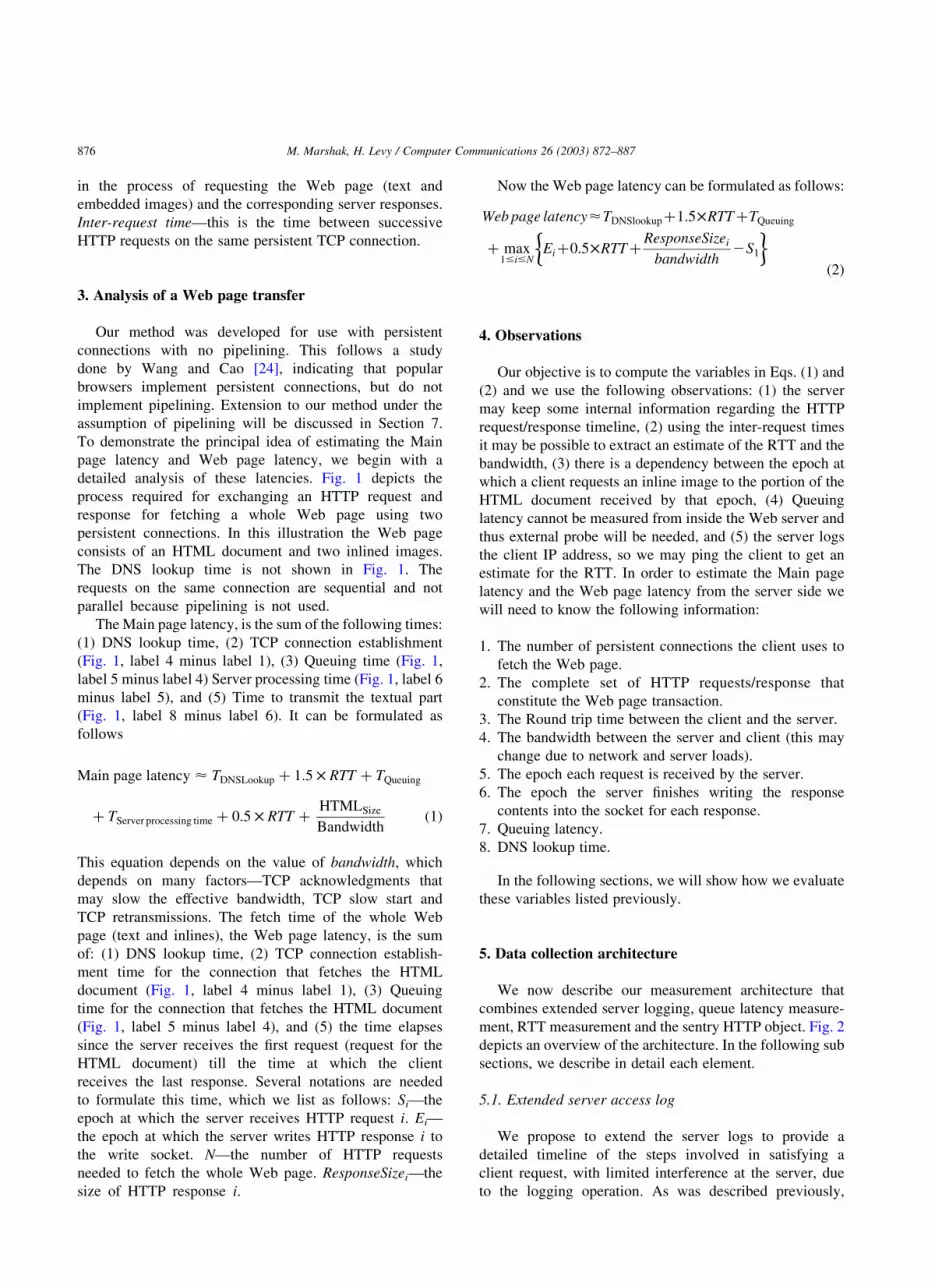
To demonstrate the principal idea of estimating the Main
page latency and Web page latency, we begin with a
detailed analysis of these latencies. Fig. 1 depicts the
process required for exchanging an HTTP request and
response for fetching a whole Web page using two
persistent connections. In this illustration the Web page
consists of an HTML document and two inlined images.
The DNS lookup time is not shown in Fig. 1. The
requests on the same connection are sequential and not
parallel because pipelining is not used.
The Main page latency, is the sum of the following times:
(1) DNS lookup time, (2) TCP connection establishment
(Fig. 1, label 4 minus label 1), (3) Queuing time (Fig. 1,
label 5 minus label 4) Server processing time (Fig. 1, label 6
minus label 5), and (5) Time to transmit the textual part
(Fig. 1, label 8 minus label 6). It can be formulated as
follows
Main page latency < TDNSLookup þ 1:5 £ RTT þ TQueuing
þ TServer processing time þ 0:5 £ RTT þHTMLSize
Bandwidthð1Þ
This equation depends on the value of bandwidth, which
depends on many factors—TCP acknowledgments that
may slow the effective bandwidth, TCP slow start and
TCP retransmissions. The fetch time of the whole Web
page (text and inlines), the Web page latency, is the sum
of: (1) DNS lookup time, (2) TCP connection establish-
ment time for the connection that fetches the HTML
document (Fig. 1, label 4 minus label 1), (3) Queuing
time for the connection that fetches the HTML document
(Fig. 1, label 5 minus label 4), and (5) the time elapses
since the server receives the first request (request for the
HTML document) till the time at which the client
receives the last response. Several notations are needed
to formulate this time, which we list as follows: Si—the
epoch at which the server receives HTTP request i. Ei—
the epoch at which the server writes HTTP response i to
the write socket. N—the number of HTTP requests
needed to fetch the whole Web page. ResponseSizei—the
size of HTTP response i.
Now the Web page latency can be formulated as follows:
Web page latency<TDNSlookupþ1:5£RTTþTQueuing
þ max1#i#N
Eiþ0:5£RTTþResponseSizei
bandwidth2S1
� �ð2Þ
4. Observations
Our objective is to compute the variables in Eqs. (1) and
(2) and we use the following observations: (1) the server
may keep some internal information regarding the HTTP
request/response timeline, (2) using the inter-request times
it may be possible to extract an estimate of the RTT and the
bandwidth, (3) there is a dependency between the epoch at
which a client requests an inline image to the portion of the
HTML document received by that epoch, (4) Queuing
latency cannot be measured from inside the Web server and
thus external probe will be needed, and (5) the server logs
the client IP address, so we may ping the client to get an
estimate for the RTT. In order to estimate the Main page
latency and the Web page latency from the server side we
will need to know the following information:
1. The number of persistent connections the client uses to
fetch the Web page.
2. The complete set of HTTP requests/response that
constitute the Web page transaction.
3. The Round trip time between the client and the server.
4. The bandwidth between the server and client (this may
change due to network and server loads).
5. The epoch each request is received by the server.
6. The epoch the server finishes writing the response
contents into the socket for each response.
7. Queuing latency.
8. DNS lookup time.
In the following sections, we will show how we evaluate
these variables listed previously.
5. Data collection architecture
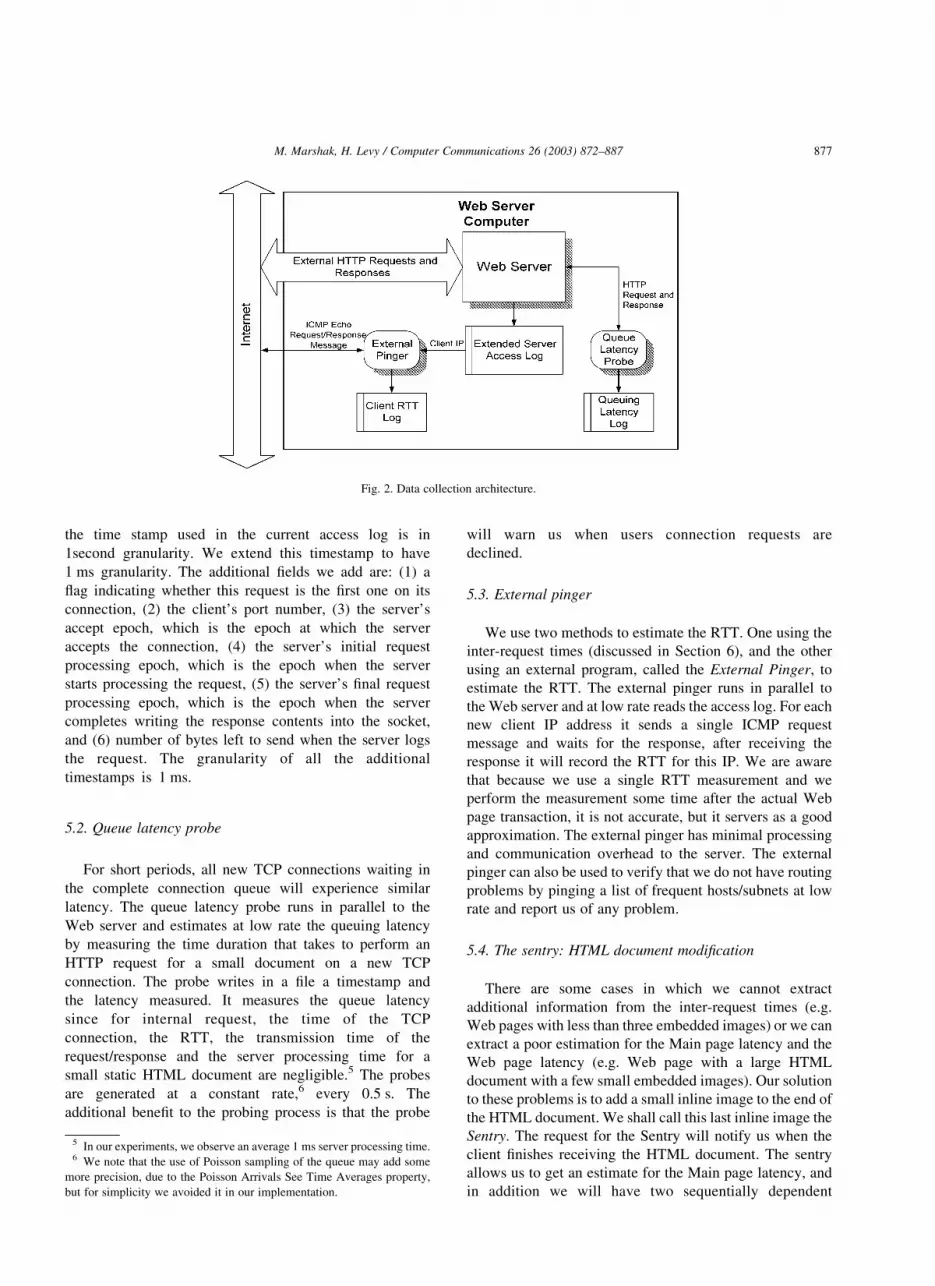
We now describe our measurement architecture that
combines extended server logging, queue latency measure-
ment, RTT measurement and the sentry HTTP object. Fig. 2
depicts an overview of the architecture. In the following sub
sections, we describe in detail each element.
5.1. Extended server access log
We propose to extend the server logs to provide a
detailed timeline of the steps involved in satisfying a
client request, with limited interference at the server, due
to the logging operation. As was described previously,
M. Marshak, H. Levy / Computer Communications 26 (2003) 872–887876
the time stamp used in the current access log is in
1second granularity. We extend this timestamp to have
1 ms granularity. The additional fields we add are: (1) a
flag indicating whether this request is the first one on its
connection, (2) the client’s port number, (3) the server’s
accept epoch, which is the epoch at which the server
accepts the connection, (4) the server’s initial request
processing epoch, which is the epoch when the server
starts processing the request, (5) the server’s final request
processing epoch, which is the epoch when the server
completes writing the response contents into the socket,
and (6) number of bytes left to send when the server logs
the request. The granularity of all the additional
timestamps is 1 ms.
5.2. Queue latency probe
For short periods, all new TCP connections waiting in
the complete connection queue will experience similar
latency. The queue latency probe runs in parallel to the
Web server and estimates at low rate the queuing latency
by measuring the time duration that takes to perform an
HTTP request for a small document on a new TCP
connection. The probe writes in a file a timestamp and
the latency measured. It measures the queue latency
since for internal request, the time of the TCP
connection, the RTT, the transmission time of the
request/response and the server processing time for a
small static HTML document are negligible.5 The probes
are generated at a constant rate,6 every 0.5 s. The
additional benefit to the probing process is that the probe
will warn us when users connection requests are
declined.
5.3. External pinger
We use two methods to estimate the RTT. One using the
inter-request times (discussed in Section 6), and the other
using an external program, called the External Pinger, to
estimate the RTT. The external pinger runs in parallel to
the Web server and at low rate reads the access log. For each
new client IP address it sends a single ICMP request
message and waits for the response, after receiving the
response it will record the RTT for this IP. We are aware
that because we use a single RTT measurement and we
perform the measurement some time after the actual Web
page transaction, it is not accurate, but it servers as a good
approximation. The external pinger has minimal processing
and communication overhead to the server. The external
pinger can also be used to verify that we do not have routing
problems by pinging a list of frequent hosts/subnets at low
rate and report us of any problem.
5.4. The sentry: HTML document modification
There are some cases in which we cannot extract
additional information from the inter-request times (e.g.
Web pages with less than three embedded images) or we can
extract a poor estimation for the Main page latency and the
Web page latency (e.g. Web page with a large HTML
document with a few small embedded images). Our solution
to these problems is to add a small inline image to the end of
the HTML document. We shall call this last inline image the
Sentry. The request for the Sentry will notify us when the
client finishes receiving the HTML document. The sentry
allows us to get an estimate for the Main page latency, and
in addition we will have two sequentially dependent
Fig. 2. Data collection architecture.
5 In our experiments, we observe an average 1 ms server processing time.6 We note that the use of Poisson sampling of the queue may add some
more precision, due to the Poisson Arrivals See Time Averages property,
but for simplicity we avoided it in our implementation.
M. Marshak, H. Levy / Computer Communications 26 (2003) 872–887 877
requests which will enable us to do some estimation of the
bandwidth and the RTT. The latter will yield a better
estimation for the latencies. It is important to note that the
Sentry imposes negligible overhead on the server, the client
and the communications network. The sentry must be
refreshed for each document in order to prevent it from
being cached by the client. This can be performed by
specifying Time-To-Live (TTL) of value 0.
6. Latency estimation algorithm
In this section we present our algorithm of estimating the
Main page latency and the Web page latency based on the
data collected by our measurement architecture. Our latency
estimation algorithm estimates those latencies for each Web
page transaction separately. Hence, we need to split the
access log to Web page transaction. Therefore prior to the
estimation there is a splitting phase of the access log per Web
page transaction. The splitting phase consists of two steps:
(1) sorting the access log according to the HTTP request
timestamp, (2) splitting the chronicle ordered access log
according to the client IP address and request for the HTML
document. After the splitting phase, we have a complete
timeline of the Web page transaction for each persistent
connection (each persistent connection has a different client
port number). The only missing information in order to
compute the latencies is the RTT and the bandwidth. Next,
we describe our heuristics to estimate these variables.
6.1. Inter-request RTT
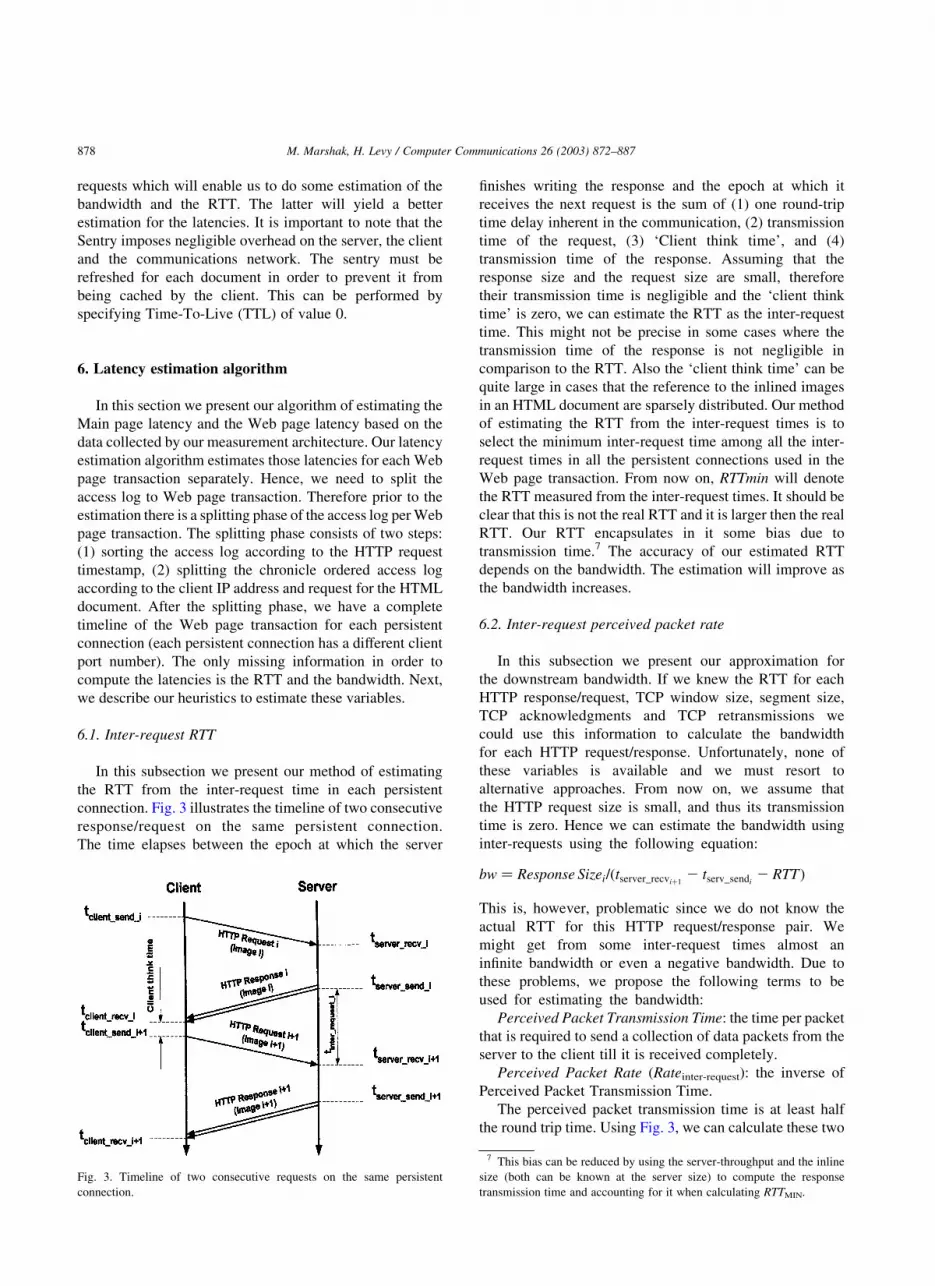
In this subsection we present our method of estimating
the RTT from the inter-request time in each persistent
connection. Fig. 3 illustrates the timeline of two consecutive
response/request on the same persistent connection.
The time elapses between the epoch at which the server
finishes writing the response and the epoch at which it
receives the next request is the sum of (1) one round-trip
time delay inherent in the communication, (2) transmission
time of the request, (3) ‘Client think time’, and (4)
transmission time of the response. Assuming that the
response size and the request size are small, therefore
their transmission time is negligible and the ‘client think
time’ is zero, we can estimate the RTT as the inter-request
time. This might not be precise in some cases where the
transmission time of the response is not negligible in
comparison to the RTT. Also the ‘client think time’ can be
quite large in cases that the reference to the inlined images
in an HTML document are sparsely distributed. Our method
of estimating the RTT from the inter-request times is to
select the minimum inter-request time among all the inter-
request times in all the persistent connections used in the
Web page transaction. From now on, RTTmin will denote
the RTT measured from the inter-request times. It should be
clear that this is not the real RTT and it is larger then the real
RTT. Our RTT encapsulates in it some bias due to
transmission time.7 The accuracy of our estimated RTT
depends on the bandwidth. The estimation will improve as
the bandwidth increases.
6.2. Inter-request perceived packet rate
In this subsection we present our approximation for
the downstream bandwidth. If we knew the RTT for each
HTTP response/request, TCP window size, segment size,
TCP acknowledgments and TCP retransmissions we
could use this information to calculate the bandwidth
for each HTTP request/response. Unfortunately, none of
these variables is available and we must resort to
alternative approaches. From now on, we assume that
the HTTP request size is small, and thus its transmission
time is zero. Hence we can estimate the bandwidth using
inter-requests using the following equation:
bw ¼ Response Sizei=ðtserver_recviþ12 tserv_sendi
2 RTTÞ
This is, however, problematic since we do not know the
actual RTT for this HTTP request/response pair. We
might get from some inter-request times almost an
infinite bandwidth or even a negative bandwidth. Due to
these problems, we propose the following terms to be
used for estimating the bandwidth:
Perceived Packet Transmission Time: the time per packet
that is required to send a collection of data packets from the
server to the client till it is received completely.
Perceived Packet Rate (Rateinter-request): the inverse of
Perceived Packet Transmission Time.
The perceived packet transmission time is at least half
the round trip time. Using Fig. 3, we can calculate these two
Fig. 3. Timeline of two consecutive requests on the same persistent
connection.
7 This bias can be reduced by using the server-throughput and the inline
size (both can be known at the server size) to compute the response
transmission time and accounting for it when calculating RTTMIN.
M. Marshak, H. Levy / Computer Communications 26 (2003) 872–887878
values for any inter-request as follows:
Perceived Packet Rate ¼
dResponseSizei=PacketSizee
max tserver_recviþ12 tserv_sendi
2 0:5 £ RTT ; 0:5 £ RTTn o
ð3Þ
The Perceived Packet Rate estimates the actual band-
width only if the dominant part of the transmission is the
transmission time and not half of the RTT. Using Eq. (3),
we will have a different value for the Perceived Packet
Rate for any two successive requests on the same
persistent connection. The reasons for the different
Perceived Packet Rate for each pair of inter-request
times is that each inter-request time is affected differently
by: high client think time, many TCP acknowledgments
or TCP retransmissions. As the HTTP response size
increases the effective bandwidth decreases due to TCP
overheads. Hence, the Perceived Packet Rate is a better
estimate of the transmission rate for large HTTP
response size. Note that the actual packet size used
does not affect the algorithm.
6.3. Average inter-request perceived packet rate
The Web page transaction timeline has several inter-
request times. The average of all the perceived packet
rate measures taken over all the inter-requests in all the
active connections is a good rate estimator for determin-
ing when a large HTTP response (e.g. HTML document)
will be received by the clients. However, for average
HTTP response, which is relatively small, this estimate is
an under estimate. The reason for this is that TCP
acknowledgments overhead is low for a small response.
Therefore, we define the following rate estimators:
Connection perceived packet rate (RateConn): the average
perceived packet rate for a particular connection.
Web transaction perceived packet rate (RateWeb_Trans):
the average of the all RateConn over all the connections.
Perceived packet line rate (Rateline): the average
perceived packet rate (Rateinter-request) over all the connec-
tions that the client uses in the process of fetching the Web
page, excluding perceived packet rate calculated from long
inter-request times. We define short inter-request time if it is
less than 6 £ RTTMIN. It is valid only if there are at least four
samples of short inter-requests times.
RateConn is a good rate estimator for large responses
which suffer from TCP overheads, while Rateline is a
good rate estimator for small responses. For connections
with high RTT, Rateline and RateConn will be similar. It
may happen that Rateline is invalid; this usually happens
for Web pages that have small number of embedded
images or for Web pages that have many large embedded
images and few small embedded images. Rarely it may
happen that RateConnwill be invalid for all the connec-
tion; this happens when a Web page has only a few
embedded images. Obviously in this case RateWeb_Trans
will be invalid also. In this case by using our estimation
to the epoch at which the client received the HTML
document (Eq. (6)), we can estimate the perceived packet
rate for the HTML document. Using this perceived
packet rate, we recalculate RateConn for the connection on
which the HTML document request came on and
recalculate RateWeb_Trans:
6.4. Main page latency
The estimated Main page latency, excluding the DNS
lookup time, can be summarized in the following formula:
Main Page Latency
< TQueuing þ 1:5 £ RTT þ tclient_recvHTML2 tserv_recvHTML
ð4Þ
The queue time latency is obtained from the queue latency
log. The RTT used by our algorithm is the minimum
between RTTMIN and the external measured RTT. We
estimate the epoch at which the HTML document was
received by the client, from three sources: (1) Using inter-
request time, (2) Using Connection perceived packet rate,
and (3) Using the Sentry. The actual time is the minimum
derived from these three measures. Using Fig. 3 we derive
the estimation:
tclient_recvHTML¼
min
tserver_sendHTMLþdResponseSizeHTML=PacketSizee
RateConn
if ðaÞ
tserver_recvnext_inter_request20:5£RTT if ðbÞ
tserver_recvSentry_image20:5£RTT
8>>>>><>>>>>:
ð4Þ
(a) if RateConn Valid
(b) if at least two request on HTML’s conn.
6.5. Web page latency
The estimated Web page latency, excluding the DNS
lookup time, can be finally calculated according to the
following formula:
Web Page Latency
< TQueuing þ 1:5 £ RTT þ tclient_recvLast_Response
2 tserv_recvHTMLð6Þ
The only unknown time, is tclient_recvLast_Responsewhich we
next calculate. We define the following notations:NConn—
the number of persistent connection used. j—connection
number. CHTML—the connection number on which the
request to the HTML document came. tserv_sendlast;j—the
time the server finished writing the last HTTP request
M. Marshak, H. Levy / Computer Communications 26 (2003) 872–887 879

into the write socket of connection j. Nj—the number of
requests on connection j. NHTML—the number of requests
on the connection on which the request to the
HTML document came. ResponseSizelast;j—the remaining
part of the last response when the server finished
writing to connection j. tclient_recvlast;j—the time the
client finished receiving the last HTTP response from
connection j.
We estimate this latest time as follows:
tclient_recvLast_Response¼ max
1#j,NConn
ðtclient_recvlast;jÞ
Where
tclient_recvlast;j¼
tclient_recvhtmlif ðaÞ
tserv_sendlast;jþ
dResponseSizelast;j=PacketSizee
Rateline
if ðbÞ
tserv_sendlast;jþ
dResponseSizelast;j=PacketSizee
RateWeb_Trans
if ðcÞ
8>>>>>>><>>>>>>>:
ð6Þ
(a) Nhtml ¼ 1 and j ¼ Chtml
(b) not (Nhtml ¼ 1 and j ¼ Chtml) and Rateline Valid
(c) not (Nhtml ¼ 1 and j ¼ Chtml) and Rateline Valid.
7. Evaluation of the algorithm
This section describes the experimental methodology,
benchmarking and analysis tools, the results of our
experiments, our analysis of the results and the
measuring overhead on the server. We implemented our
algorithm on the Apache version 1.3.9, a public domain
HTTP/1.1 server. We conducted the measurements using
three locations. The Web server was located at Tel-Aviv
University (TAU), Israel. The Web clients were located
at Tel-Aviv college (MTA), Israel and at the University
of California, Irvine (UCI), CA.
7.1. Measurements test bed
We want to evaluate the performance of our estimation
method. In order to make our evaluation valid we need to
simulate real clients with real-world Web traffic character-
istics (bandwidth, RTT and loss rate), fetching different
Web pages under various server loads. Also, in order to
estimate our performance we need to know the actual
latencies the clients experienced. Fig. 4 demonstrates the
topology of the test bed. In the following subsection we will
describe each element of the test bed.
7.1.1. Web server
The Web server computer includes three elements: the
modified Apache Web server, the queue latency probe and
the External pinger. The server ran on a dedicated PC
running the Linux operating system version 2.2.14.
7.1.2. Web clients
Inorder toevaluateourmethodweneededaWebclient that
could simulate a Web browser and perform measurements of
the Main page latency, the Web page latency and other
parameters like RTT. Therefore, we wrote a multi-thread
‘Web browser’ program utilizing BSD–socket interface.
This program supports HTTP/1.1 persistent connections and
simulates the dependency between the request for the HTML
document and the requests for the embedded images. The
program fetches whole Web pages using a predefined number
of persistent TCP connections. After fetching the whole Web
page all the threads close the connections and the master
program writes in a log file, called the client log file, the RTT,
the Main page latency and the Web page latency.
7.1.3. Web workload generator
To generate the workload we wrote a program called
Web Loader, based on the ‘Web browser’ program with a
few modifications. The Web Loader uses a fixed number of
threads. Each thread runs in infinite loop with the same task:
opening a TCP connection to the server, fetching one Web
page from server and closing the connection. The Web page
Fig. 4. Testbed topology.
M. Marshak, H. Levy / Computer Communications 26 (2003) 872–887880

to be fetched is selected randomly from various Web pages,
which vary in size. Hence, each Web Loader simulates
several clients running on the same client machine. We
limited the number of threads per computer to 10. In order to
reach the required workload we ran the Web loader on
several machines located on our LAN.
7.1.4. Representative Web pages used in the experiment
We wanted to test our estimation on representative Web
pages. We wanted to determine typical HTML document
size, the number of embedded images and their typical size
for popular Web pages. Several rating sites offer statistics on
popular Web sites like Hot100 [1]. Hot100 claims to survey
100,000 users (40% of whom are outside the USA). Hot100
claims to gather data at ‘strategic’ points on the Internet (not
at the browser or server). For those top 100 sites we
measured their page sizes and found that the average HTML
document size is 30 K, the average number of embedded
images is 21 with an average size of 2.5 K per embedded
image. As a result we selected to use the following Web
pages as representatives: combinations of HTML document
sizes 10, 30 and 60 K with 5, 15, 30 and 50 embedded
images with an average size of 2–3 K, this gives us 12
various pages. Two additional Web pages were used: a Web
page consisting of a 30 K HTML document and 21
embedded images of average size 6 K (a Web page with
very large inlines) and one Web page which includes only 2
inlines. Thus, altogether we have14 different Web pages.
Lastly, in order to use genuine Web pages, we selected Web
pages of these characteristics them from the top 100 Web
pages.
7.1.5. Testing under real-world traffic characteristics
We want to estimate our method using clients with real-
world Web traffic characteristics connecting through a
WAN. We want to estimate the performance under WAN
effects: large RTT disparity, packet loss and various
bandwidth characteristics. The PingER project at Stanford
Accelerator Center (SLAC) [8] conducts continuous net-
work monitoring to measure network latency and packet
loss over the Internet. Their measurements show average
loss rate of 0.5% and RTT of 30–60 ms in the US, Asia and
Europe, while between the continents the average loss rate is
of 1.4% and RTT varies between 200 and 600 ms. We
conducted our experiments with two clients, one located at
MTA and UCI. Our experiments were performed at various
hours of the day and over a one-week span. During this time
frame we measured these clients’ network characteristics in
terms of RTT, bandwidth and loss rate. UCI’s RTT was
600–620 ms, bandwidth 30–40 KB/s and loss rate of 0%.
MTA’s RTT was 30–100 ms, bandwidth 5–17 KB/s and
loss rate of 2%. UCI’s RTT reflect longer network RTT to
the US from the server (located in Tel-Aviv). UCI’s RTT,
bandwidth and Loss Rate showed a minor disparity. MTA
showed large disparity in the RTT and in the bandwidth.
Therefore, these two sites are good representatives for
real-world Web traffic characteristics, because they cover
large ranges of RTT, bandwidth and loss rate. Heidemann
et al. [12] summarized network characteristics for several
existing networks, which include typical bandwidth and
RTT. According to the terms of Ref. [12] we can categorize
them as follows: MTA can be categorized as something
between WAN-Modem to WAN-ISDN due its large
disparity, while UCI can be categorized as Medium-Internet
connectivity with large number of hops.
7.2. Experiments runs
We conducted the test runs as follow: Each web-client
located in MTA or UCI fetched all the 14 Web pages in
serial fashion. For each Web page our browser first fetched
it with four persistent connections for five times and later
the browser fetched it with two persistent connections for
five times. Between each Web page download, it waited for
4 s before continuing. The tests were repeated under various
server loads. We controlled the server load by number of
Web Loader computers running in our LAN. The number of
Web Loader computers varies between 0 and 9, which
means between 0 and 90 clients, in total. We used four
server loads: light, medium, high and overloaded. Table 1
shows summarized the web server load characteristics.
The delay experienced in the measurements varied
widely as function of the client location, the number of
embedded images and the load. For example, under medium
load and two images we observed delays of 0.68–0.83 s for
MTA and 3–3.2 s for UCI. For 5 images we observed
delays of about 1–3 s for MTA and about 3–7 s for UCI,
and for 30 images we observed delays of about 3.5–12 s for
MTA and about 7–15 s for UCI.
7.3. Performance evaluation
Fig. 5 depicts the accuracy of our Main page latency
and Web page latency estimation method for all the test
runs for both of the clients under the various server
loads. The figure depicts also the effect of the estimating
method for the RTT (RTTMIN or RTT from the External
pinger). It should be clear that the External pinger is an
integral part of our method. Therefore, the performance
of our method should be evaluated for the case of using
the pinger for estimating the RTT. The RTT measure-
ments are subject to some errors due to variability,
Table 1
Web server load characteristics
Load CPU
usage [%]
Requests
per sec
Average queue
latency [msec]
No. of web loaders
Light 3 7 1 0
Medium 20 68 20 1
High 50 75 500 4
Overloaded 90 56 6000 9
M. Marshak, H. Levy / Computer Communications 26 (2003) 872–887 881
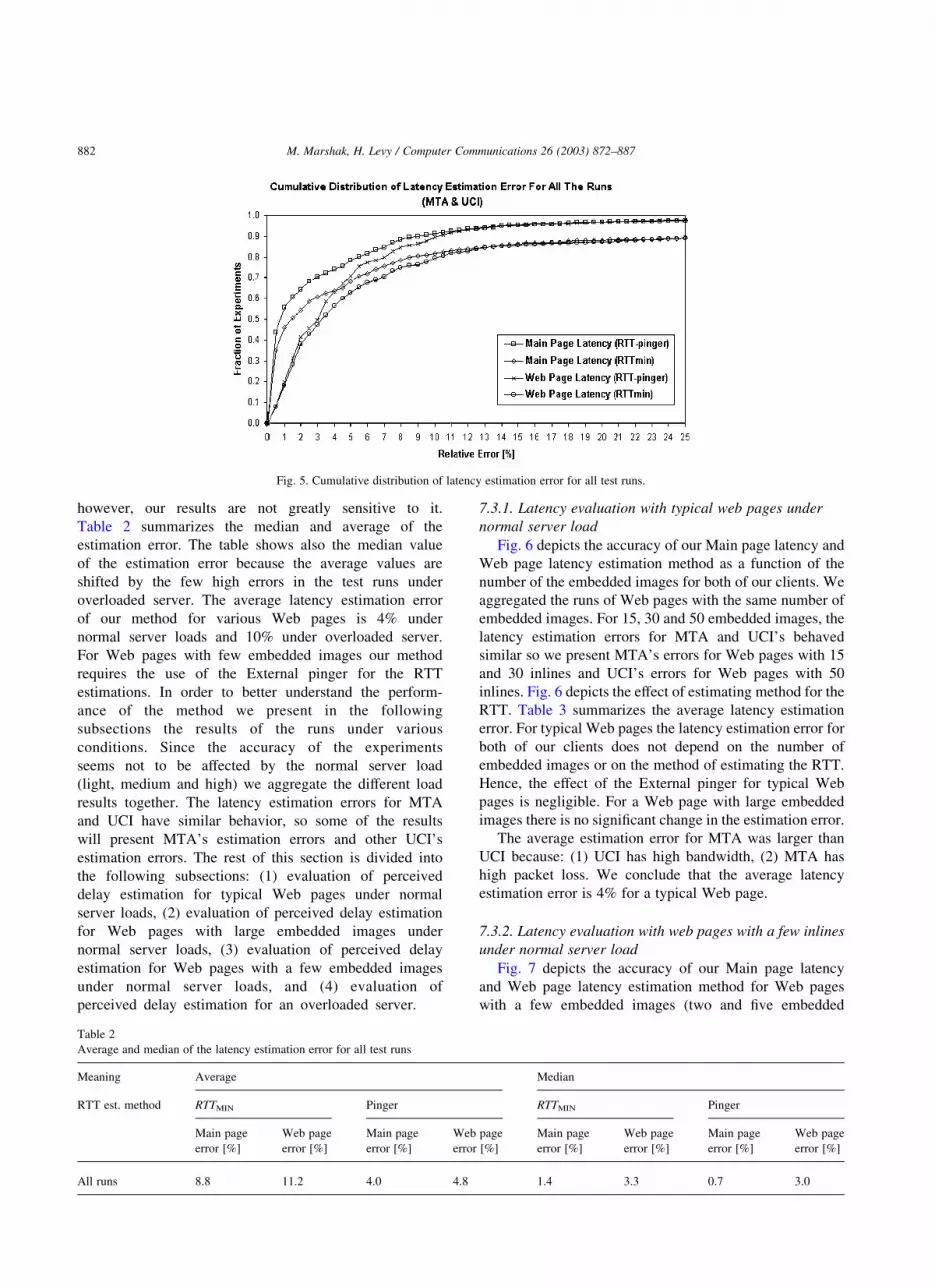
however, our results are not greatly sensitive to it.
Table 2 summarizes the median and average of the
estimation error. The table shows also the median value
of the estimation error because the average values are
shifted by the few high errors in the test runs under
overloaded server. The average latency estimation error
of our method for various Web pages is 4% under
normal server loads and 10% under overloaded server.
For Web pages with few embedded images our method
requires the use of the External pinger for the RTT
estimations. In order to better understand the perform-
ance of the method we present in the following
subsections the results of the runs under various
conditions. Since the accuracy of the experiments
seems not to be affected by the normal server load
(light, medium and high) we aggregate the different load
results together. The latency estimation errors for MTA
and UCI have similar behavior, so some of the results
will present MTA’s estimation errors and other UCI’s
estimation errors. The rest of this section is divided into
the following subsections: (1) evaluation of perceived
delay estimation for typical Web pages under normal
server loads, (2) evaluation of perceived delay estimation
for Web pages with large embedded images under
normal server loads, (3) evaluation of perceived delay
estimation for Web pages with a few embedded images
under normal server loads, and (4) evaluation of
perceived delay estimation for an overloaded server.
7.3.1. Latency evaluation with typical web pages under
normal server load
Fig. 6 depicts the accuracy of our Main page latency and
Web page latency estimation method as a function of the
number of the embedded images for both of our clients. We
aggregated the runs of Web pages with the same number of
embedded images. For 15, 30 and 50 embedded images, the
latency estimation errors for MTA and UCI’s behaved
similar so we present MTA’s errors for Web pages with 15
and 30 inlines and UCI’s errors for Web pages with 50
inlines. Fig. 6 depicts the effect of estimating method for the
RTT. Table 3 summarizes the average latency estimation
error. For typical Web pages the latency estimation error for
both of our clients does not depend on the number of
embedded images or on the method of estimating the RTT.
Hence, the effect of the External pinger for typical Web
pages is negligible. For a Web page with large embedded
images there is no significant change in the estimation error.
The average estimation error for MTA was larger than
UCI because: (1) UCI has high bandwidth, (2) MTA has
high packet loss. We conclude that the average latency
estimation error is 4% for a typical Web page.
7.3.2. Latency evaluation with web pages with a few inlines
under normal server load
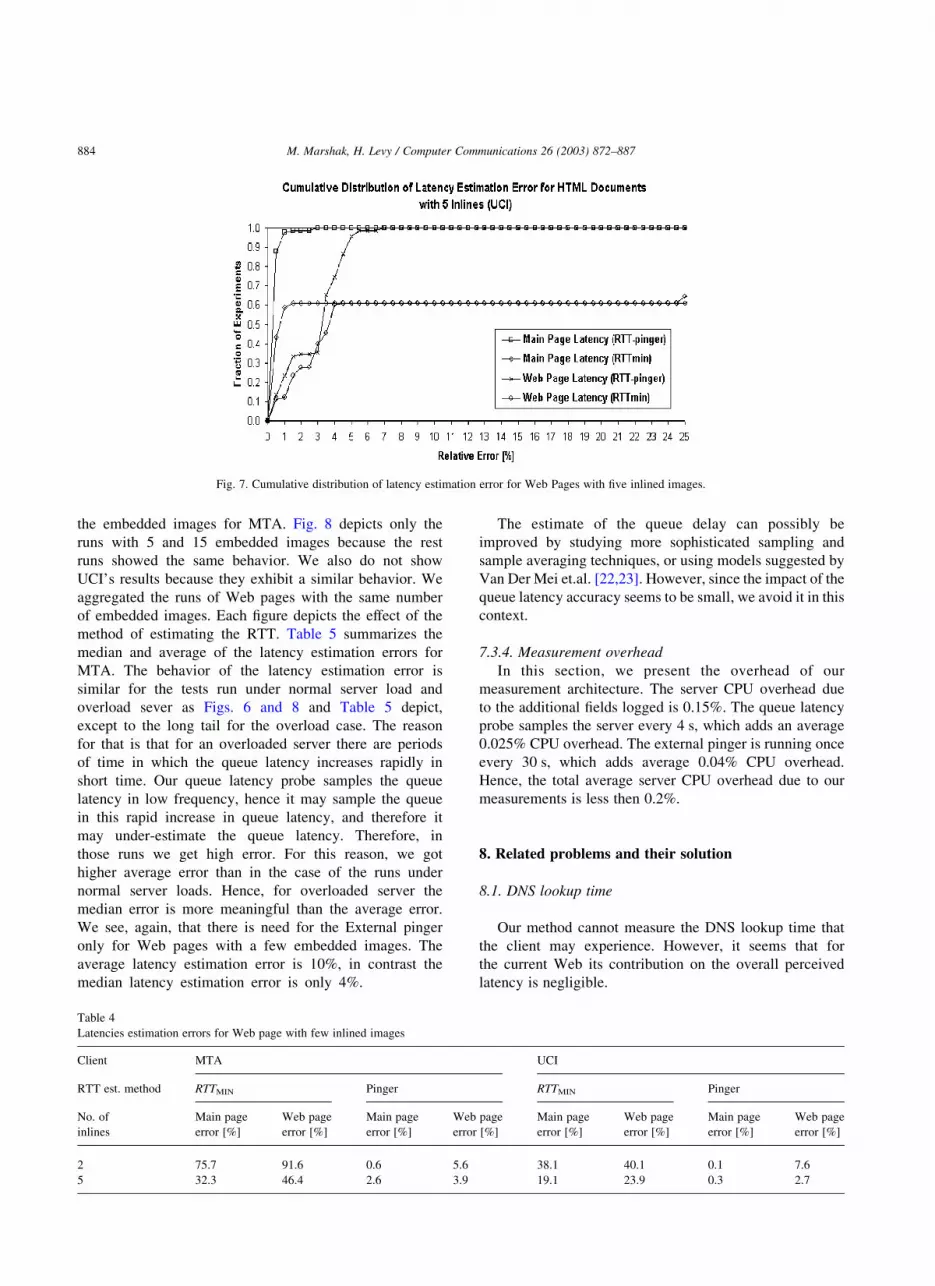
Fig. 7 depicts the accuracy of our Main page latency
and Web page latency estimation method for Web pages
with a few embedded images (two and five embedded
Fig. 5. Cumulative distribution of latency estimation error for all test runs.
Table 2
Average and median of the latency estimation error for all test runs
Meaning Average Median
RTT est. method RTTMIN Pinger RTTMIN Pinger
Main page
error [%]
Web page
error [%]
Main page
error [%]
Web page
error [%]
Main page
error [%]
Web page
error [%]
Main page
error [%]
Web page
error [%]
All runs 8.8 11.2 4.0 4.8 1.4 3.3 0.7 3.0
M. Marshak, H. Levy / Computer Communications 26 (2003) 872–887882

images). The latency estimation error for Web pages with
two and five embedded images behave similar so we
present the error for Web pages with five embedded
images. Each figure also depicts the effect of the method
for estimating the RTT. Table 4 summarizes the average
errors for UCI and MTA. As can be seen from Table 4,
for a Web page with a few embedded images it is
preferred to use the External pinger to estimate the RTT
rather than relying on the RTTMIN. The error decreases in
some cases from an average error of 90% to an average
error of 6%.
We conclude that for Web pages with a few embedded
images our method estimates the Main page latency and the
Web page latency as good as for Web pages with many
embedded images. This holds when we have RTT
estimation via the External pinger.
7.3.3. Latency evaluation under overloaded server
In this subsection, we evaluate our method under
overloaded server condition. Fig. 8 depicts the accuracy
of our Main page latency and Web page latency
estimation method as a function of the number of
Fig. 6. Cumulative distribution of latency estimation error for typical HTML documents.
Table 3
Latencies estimation errors for typical Web page
Client MTA UCI
RTT est. method RTTMIN Pinger RTTMIN Pinger
No.
of inlines
Main page
error [%]
Web page
error [%]
Main page
error [%]
Web page
error [%]
Main page
error [%]
Web page
error [%]
Main page
error [%]
Web page
error [%]
15 4.5 5.6 3.5 4.8 0.5 1.9 0.5 1.9
21 2.3 2.4 2.2 2.3 0.3 2.4 0.2 2.4
30 3.5 5.5 3.4 5.4 0.2 3.2 0.2 3.2
50 4.3 6.1 4.3 6.1 0.7 3.3 0.7 3.3
M. Marshak, H. Levy / Computer Communications 26 (2003) 872–887 883
the embedded images for MTA. Fig. 8 depicts only the
runs with 5 and 15 embedded images because the rest
runs showed the same behavior. We also do not show
UCI’s results because they exhibit a similar behavior. We
aggregated the runs of Web pages with the same number
of embedded images. Each figure depicts the effect of the
method of estimating the RTT. Table 5 summarizes the
median and average of the latency estimation errors for
MTA. The behavior of the latency estimation error is
similar for the tests run under normal server load and
overload sever as Figs. 6 and 8 and Table 5 depict,
except to the long tail for the overload case. The reason
for that is that for an overloaded server there are periods
of time in which the queue latency increases rapidly in
short time. Our queue latency probe samples the queue
latency in low frequency, hence it may sample the queue
in this rapid increase in queue latency, and therefore it
may under-estimate the queue latency. Therefore, in
those runs we get high error. For this reason, we got
higher average error than in the case of the runs under
normal server loads. Hence, for overloaded server the
median error is more meaningful than the average error.
We see, again, that there is need for the External pinger
only for Web pages with a few embedded images. The
average latency estimation error is 10%, in contrast the
median latency estimation error is only 4%.
The estimate of the queue delay can possibly be
improved by studying more sophisticated sampling and
sample averaging techniques, or using models suggested by
Van Der Mei et.al. [22,23]. However, since the impact of the
queue latency accuracy seems to be small, we avoid it in this
context.
7.3.4. Measurement overhead
In this section, we present the overhead of our
measurement architecture. The server CPU overhead due
to the additional fields logged is 0.15%. The queue latency
probe samples the server every 4 s, which adds an average
0.025% CPU overhead. The external pinger is running once
every 30 s, which adds average 0.04% CPU overhead.
Hence, the total average server CPU overhead due to our
measurements is less then 0.2%.
8. Related problems and their solution
8.1. DNS lookup time
Our method cannot measure the DNS lookup time that
the client may experience. However, it seems that for
the current Web its contribution on the overall perceived
latency is negligible.
Fig. 7. Cumulative distribution of latency estimation error for Web Pages with five inlined images.
Table 4
Latencies estimation errors for Web page with few inlined images
Client MTA UCI
RTT est. method RTTMIN Pinger RTTMIN Pinger
No. of
inlines
Main page
error [%]
Web page
error [%]
Main page
error [%]
Web page
error [%]
Main page
error [%]
Web page
error [%]
Main page
error [%]
Web page
error [%]
2 75.7 91.6 0.6 5.6 38.1 40.1 0.1 7.6
5 32.3 46.4 2.6 3.9 19.1 23.9 0.3 2.7
M. Marshak, H. Levy / Computer Communications 26 (2003) 872–887884

Keynote [13] is a commercial company that measures
Web sites’ latencies using remote agents. According to
their measurements, the average DNS lookup time is
60 ms. Cohen and Kaplan [6] studied DNS lookup times
under various conditions. Their study shows that DNS
lookup times for 80% of the servers took under 300 ms,
and repeated DNS query conducted hours later took less
then 150 ms for 80% of the servers. Because DNS
queries are cached also in Web browsers and ISP’s name
servers, this time can be even lower. Their study
measured the DNS lookup time compared to the time
to download only the textual portion of home page of
some URLs, without the embedded contents. They
assume that transmission time is negligible, because
they conducted their measurements in high bandwidth
environment. In our experiments with a client with
average bandwidth and low RTT (MTA), the typical
average time of downloading HTML document and
whole Web page excluding DNS lookup time, is 2 and
5 s, respectively. This means that the DNS lookup time
relatively to the download time of HTML document and
the download of the whole Web page is 10 and 4%,
respectively. Measurements conducted by Bhargava [4]
show similar ratios. This ratio can go down to less than
1% if the DNS query is already in the cache of the Web
browser or in the ISP’s DNS server. Hence for most
Web sites the DNS lookup time in comparison to the
whole transaction, or even just the HTML document
download time, is negligible.
Nonetheless, we propose a server-side approach for
verifying that the Web access does not have DNS problems:
The world is divided into several zones, where each zone is
under the responsibility of a well-known Root DNS server.
Therefore, the Web server, by using a program like
nslookup, could query each one of the root DNS servers
with its domain name periodically and report the adminis-
trators about DNS problems in any zone.
8.2. Pipelining
If popular web browsers will use pipelining in the future,
our method is still valid. Some minor modifications need to
be performed. These are: (1) the RTT could not be measured
from the inter-request times, therefore we will rely only on
the external RTT measuring program, our pinger, and (2) we
need to change the way we calculate the perceived rate in
our method. In case of pipelining subsequent server
responses can be written without the previous ones being
received. Hence, the server will write not to an empty write
buffer as in the case of not using the pipelining. Therefore,
Fig. 8. Cumulative distribution of latency estimation error under overloaded server.
Table 5
Average and median of the latency estimation error under overloaded server
Meaning Average Median
RTT est. method RTTMIN Pinger RTTMIN Pinger
No.
of inlines
Main page
error [%]
Web page
error [%]
Main page
error [%]
Web page
error [%]
Main page
error [%]
Web page
error [%]
Main page
error [%]
Web page
error [%]
5 14.3 20.7 3.6 3.9 7.0 7.1 1.9 2.5
15 10.5 9.6 10.1 9.5 2.8 2.5 2.0 2.9
30 10.3 6.1 10.3 6.1 4.9 2.3 4.9 2.3
50 8.6 11.5 8.5 11.5 1.2 7.7 1.2 7.7
M. Marshak, H. Levy / Computer Communications 26 (2003) 872–887 885

we can measure the decrease rate of the write buffer each
time the server writes a new response. By monitoring the
changes along the timeline of the whole transaction, we will
be able to estimate the perceived rate.
8.3. Load balancing
Some Web sites use several Web servers and distribute the
clients’ requests using a load-balancing device. In case that
all the client’s connections are sent to the same server our
algorithm does not require modification. In a case that each
connection is sent to a different server there is a need to merge
all the site server’s access logs together before running our
latency estimation method.
8.4. Web proxy
Our method used the client IP address in order to
distinguish between the different users. Some Web clients
are forced to go through proxies to connect to the Internet.
Therefore, the server will not be able to distinguish between
the different clients that are connecting to the server via the
proxy. One can use cookies to distinguish between them.
8.5. Distributed embedded images
Some Web sites distribute their embedded images in other
servers around the Internet. Microsoft Explorer opens two
persistent connections to the server while Netscape Navi-
gator opens four persistent connections to the server. We
noticed that when Microsoft Explorer and Netscape
Navigator detect reference to images at a different server,
they open additional two or four additional connections to the
new server, respectively. Hence the download of these
images is done simultaneously to the download of the page
downloaded from the original site. These new TCP
connections may slow down the rate of the connections to
the original server if the client has a limited bandwidth. Thus
the new requests on the already established connections to
the original server will suffer from rate decrease which will
be noticeable from the access log, and thus will be taken into
account in our estimation algorithm.
We examined the 100 Web sites that we used previously
and found that 30% of these Web pages have no external
images and 70% have less than 8 external images. For 60% of
the Web pages the relative fraction of the external images is
less then 20%. In addition, we can see that about 20% of the
Web pages have about 80% of their images stored in other
servers. The average number of external images is 6, while
the average number of embedded images per Web page is 21.
Hence, on the average most of the images come from the
original Web server.
Thus, our algorithm will accurately estimate the latency of
the HTML document and accurately estimate the download
time of the images located in the original server, which, for
most cases is the major portion of the images.
9. Concluding remarks
We presented a new approach to estimate user perceived
latency, based on server side measurement. The new solution
does not require any agents to be placed at the net and no
additional hardware. Further, it does not monitor packets at
low-level protocols and is all based on implementation at the
HTTP level. The solution we proposed is based on a new
technique in which a special tiny and unnoticeable HTTP
object, the sentry, is used in measuring the user perceived
latency. We demonstrated our approach by implementing it
on the Apache Web server. Our experiments showed that the
proposed method estimates the latency to fetch the textual
portion of the Web page and the full Web page with an
average error of 4% under normal server loads, and an
average error of 10% under overloaded server loads.
The major advantage of our measurement approach, as
opposed to client (agent) side approach, is that is can
evaluate the latency experienced by each individual client
(regardless of its network location). Further, this estimate
can be conducted in real time, thus allowing the server to
control in online mode its operation and prioritize the
requests based on the actual performance observed by the
clients.
Several issues remain open for further research. These
relate to the application of our method (1) users using
proxies. (2) HTTP transactions that use pipelining and (3)
Web sites that have external embedded images.
References
[1] 100.hot.com. http://www.100hot.com/.
[2] Apache HTTP server project,http://www.apache.org.
[3] T. Berners-Lee, R. Fielding, H. Frystyk Nielsen, Hypertext Transfer
Protocol—HTTP/1.0. RFC 1945, MIT/LCS, 1996.
[4] B. Bhargava, A study of communications delays for Web transactions,
Cluster Computing 4 (2002) 319–333.
[5] E. Cohen, H. Kaplan, Proactive caching of DNS records: Proceedings
Symposium on Applications and the internet (SAINT), San Deigo, CA,
January 2001, pp85–94.
[6] E. Cohen, H. Kaplan, Prefetching the means for document transfer: a
new approach for reducing Web latency, Proceedings of the IEEE
INFOCOM’00 Conference (2000).
[7] E. Cohen, H. Kaplan, J.D. Oldham, Managing TCP connections under
persistent HTTP, Computer Networks 31 (1999) 1709–1723.
[8] L. Cottrell, W. Matthews, C. Logg, Tutorial on Internet monitoring
pinger at SLAC, Available from http://www.slac.stanford.edu/comp/
net/wanmon/tutorial.html/, 1999.
[9] A. Feldmann, BLT: Bi-Layer Tracing of HTTP and TCP/IP. WWW-
9, Computer Networks, 33(1 - 6) (May 2000) 321–335.
[10] R. Fielding, J. Gettys, J.C. Mogul, H. Frystyk, L. Masinter, P. Leach,
T. Berners-Lee, Hypertext transfer protocol—HTTP/1.1, Request for
Comments 2616 (1999) ftp://ftp.isi.edu/in-notes/rfc2616.txt.
[11] H. Frystyk Nielsen, J. Gettys, A. Baird-Smith, E. Prud’hommeaux,
H.W. Lie, C. Lilley, Network performance effects of HTTP/1.1,
CSS1, and PNG, Proceedings of the ACM SIGCOMM’97 Con-
ference, France (1997).
[12] J. Heidemann, K. Obraczka, J. Touch, Modeling the performance of
HTTP over several transport protocols, ACM/IEEE Transactions on
Networking 5 (5) (1997) 616–630.
M. Marshak, H. Levy / Computer Communications 26 (2003) 872–887886

[13] Keynote company, http://www.keynote.com/.
[14] B. Krishnamurthy, J. Rexford, En passant: predicting HTTP/1.1
traffic, Proceedings of the Global Internet Symposium (1999).
[15] Mercury Interactive’s Topaz, http://www.mercuryinteractive.com.
[16] NetMechanics Inc., http://www.netmechanics.com.
[17] R. Rajamony, M. Elnozahy, Measuring client-perceived response
times on the WWW, Proceedings of the Third USENIX
Symposium on Internet Technologies and Systems (USITS) March
(2001).
[18] Sitescope company, http://www.sitescope.com/.
[19] Software Research, http://www.netmechanics.com.
[20] W.R. Stevens, TCP/IP Illustrated, vol. 1, Addison-Wesley, Reading,
MA, 1994.
[21] Tivoli Web Management Solutions, http://www.tivoli.com/products/
demos/twsm.html, IBM Corporation.
[22] R.D. Van der Mei, R. Hariharan, W. Ehrlich, P.K. Reeser,
Performance of Web servers in a distributed computing environment,
Teletraffic Engineering in the Internet Era (2001) 125–134.
[23] R.D. Van der Mei, R. Hariharan, P.K. Reeser, Web server performance
modeling, Telecommunications Systems 16 (2001) 361–378.
[24] Z. Wang, P. Cao, Persistent connection behavior of popular browsers,
http://www.cs.wisc.edu/cao/papers/persistent-connection.html.
M. Marshak, H. Levy / Computer Communications 26 (2003) 872–887 887