evaluating the effect of word prediction and location of word
TRANSCRIPT
Evaluating the Effect of Word Prediction and Location of Word Prediction List on
Text Entry with Children with Spina Bifida and Hydrocephalus
C ynthia Tarn
A thesis submitted in confomity with the requirements for the degree of Master of Science
Graduate Department of Rehabilitation Science University of Toronto
O Copyright by Cynthia Tarn (2001)
National Library of Canada
Bibliothèque nationale du Canada
Acquisitions and Acquisitions et Bibliographie Services services bibliographiques
395 Weflington Street 395, rue Wellington OttawaON KtAON4 OttawaON K1AON4 Canada Canada
The author has granted a non- L'auteur a accordé une Licence non exclusive licence allowing the exclusive permettant à la National Library of Canada to Bibliothèque nationale du Canada de reproduce, loan, distribute or sell reproduire, prêter, distribuer ou copies of this thesis in microform, vendre des copies de cette thèse sous paper or electronic formats. la fome de microfiche/film, de
reproduction sur papier ou sur format électronique.
The author retains ownership of the L'auteur conserve la propriété du copyright in this thesis. Neither the droit d'auteur qui protège cette thèse. thesis nor substantial extracts fiom it Ni la thèse ni des extraits substantiels may be printed or otherwise de celle-ci ne doivent être imprimés reproduced without the author's ou autrement reproduits sans son permission. autorisation.
Canada
Evaluating the Effect of Word Prediction and Location of Word Prediction List
on Text Entry with Children with Spina Bifida and Hydrocephalus
Cynthia Tarn
Master of Science, 200 I
Graduate Department of Rehabilitation Science
University of Toronto
Abstract
This study which used a single-subject alternating treatments design evaluated the
effect of word prediction on rate and accuracy of text entry and compared the effect of
location of word prediction list on rate and accuracy of text entry. Three locations (upper
right corner, following the cursor and lower middle border) were used. In addition. user's
perspectives related to the potential benefits of word prediction were explored. Three girls
and one boy aged 10- 12 with spina bifida and hydrocephalus participated in the study over a
period of20 days. Rates and accuracy of text entry were measured on a copy-writing trisk.
The Canadian Occupational Performance Measure (COPM) was used to evaluate
participants' perceived performance and satisfaction with written productivity tasks. This
study found that word prediction did not improve rates of text entry but did improve accuracy
of text entry when the prediction list was placed in the lower middle border.

Acknowledgements
I acknowledge the support of an outstanding thesis committee: Dr. Denise Reid. wtio
supervised the thesis, dong with Dr. Stephen Naurnann and Dr. Bernard O0Keefe who together
represented a complimentary mix of clinical and technicai expertise. I am thankful to Dr. Kent
Campbell for his guidance and support in statistical analysis. 1 am obliged to the participants of
the study For their devotion of tirne and effort in this study. 1 am gnteful to the generous support
of the Bloorvicw MacMillan Centre for its Whippcr Watson Graduate Studentship Award and
the Canadian Occupational Therapy Foundation /Hospital for Sick C hildren for i ts graduate
peadiatric scholarship. L a t but not least, 1 am indebted to rny husband, William and friends
especially Ava-Lee Kotler and Gai1 Teachrnan who each in their own unique way have provided
me witli gifts of unrelcnting support and love.
TABLE OF CONTENTS Page
. . .......................................................................................................................................... Abstract 11
Table of Contents .......................................................................................................................... iv
. . .............................................................................................................................. List of Tables v 11
... List of Figures ............................................................................................................................ W I I
......................................................................................................................... List of Appendices x
............................................................................................................. Chapier One . Introduction 1 ........................................................................................................................... . 1 1 Objectives 5
..................................................................... 1.2 Conceptual Basis and Relevance of the Study 5
Chapter Two . Literaturc Review .................................................................................................... 7 2.1 Spina Bifida and Hydrocephalus ......................................................................................... 7
2.1 1 Description of Spina Bifida ......................................................................................... 7 2.12 Associated Abnonnalities ........................................ 9 2.13 Deficiis in Spina Bifida and Hydrocephalus ............................................................ 12
................................................................................................ IntelIectual Function 12 .................................................................................................................... Memory 1:
........................................................................... Attention and Executive Functions 14 ................................................................................................................... Language 14
Visual Perception ..................................................................................................... 15 ........................................................................................................................ Vision 15
Upper Extremity Function .................................................................................. 16 2.2 Word Prediction ................................................................................................................. 18
................................................................................ 2.2 1 Application of Word Prediction 18 2.22 Factors ilffecting Effectiveness of Word Prediction in Rate Enhancernent .............. 19
............................................. 2.23 Previous Studies on Effectiveness of Word Prediction 24 .................................................................................................... 2.3 Perceived Self-E fficacy 2 8
........................................................................................................................ 2.5 Hypotheses -32
Chapter Three . Meihod .............................................................................................................. 3 ................................................................................................................. 3.1 Research Design 34
......................................................................... 3.1 1 Single Subject Experimental Design 34 3.1 2 Alternat ing Treatments Design ................................................................................. -35
......................................................................................................... 3.1 3 Intemal Validity 36 ........................................................................................................ 3.14 Extemal Validity 37
3.15 Description of the Research Design Used in the Study ............................................. 39
............................................................................................ 3.2 Ethics and Informed Consent 39 3.3 Sampling ........................................................................................................................... 40
3.3 1 Sarnple S i x ............................................................................................................... 4U 3.32 Inclusion Cri tcria ...................................................................................................... 40 3.33 Exclusion Criteria ................................................................................................... A I 3.3 4 Recruitmen t S trategy ................................................................................................. 41
3.4 Computer Hardware and Software .................................................................................... 42 3.4 1 Computer Hardware .................................................................................................. 42
......................................................................................... 3.42 Word Prediction Software 43 3.43 Word Processing Software ........................................................................................ 44
................................................................................................................... 3.5 Copy Material 45 3.6 Measurement .................................. ................................................................................... 45
3.6 1 Kump's Directions for Scoring Typing Tests ........................................................... 45 3.62 Candian Occupational Performance Mesure (COPM) .......................................... 46 3.63 Developmental Eye Movement Test (DEM) ............................................................ 47 3.64 The Children's Handwriting Evaluation Scale (CHES) .......................................... 48 3.65 Behavior Cliecklist .................................................................................................... 48 3.66 Dernographic Information Form .............................................................................. A9
3.7 Data Collection Procedurcs ............................................................................................... 49 3.8 Data Analysis .................................................................................................................... 53 3.9 Pilot Study ......................................................................................................................... 55
Chapter Four . Results .................................................................................................................. 58 . 4 I Participant One .................................................................................................................. 58
4.1 1 Background hformation ............................. .., ........................................................... 58 4.12 Pre-Baseline Results ................................................................................................. 58 4.13 Preference for Placement Locations of Prcdiction List ........................................... 59 4.14 Rates of Text Entry ................................................................................................... 59
........................................................................................ Gross Rates oFText Entry 59 Error-Adjusted Rates of Text Entry ......................................................................... 59
4.1 5 Accuracy of Text Entry ............................................................................................. 60 4.16 Perceived Performance .............................................................................................. 60 4.17 Behaviour Observation ............................................................................................. 60
4.2 Participant Two ................................................................................................................. 61 4.2 1 Background Information ......................................................................................... A I 4.22 Pre-Baseline Results .............................................................................................. 1 4.23 Preference for Placement Locations of Prediction List ............................................ 62 4.24 Rates of Text Entry ................................................................................................... 62
Gross Rates of Text Entry ........................................................................................ 62 Error-Adjusted Rates of Text Entry ......................................................................... 62
4.25 Accuracy of Text En- ............................................................................................. 63 4.26 Perceived Performance .............................................................................................. 63 4.27 Behaviour Observation ............................................................................................. 63
4.3 Participant Three ............................................................................................................... 63 ........................................................................................... 4.3 1 Background Information 63
4.32 Pre-Baselinc Results ................................................................................................. 64 4.33 Preference for Placcmcnt Locations of Prediction List ............................................ 64 4.34 Rates of Tcxt Entry ................................................................................................... 65
Gross Rates oTText Entry ........................................................................................ 65 Error-Adjusted Rates of Text Entry ......................................................................... 65
4.35 Accuracy of Text Entry ............................................................................................. 65 4.36 Perceived Performance ............................................................................................. 66 4.37 Behaviour Observation ............................................................................................. 66
4.4 Participant Four ................................................................................................................. 67 4.4 1 Background Iiiformation ........................................................................................... 67 4.42 Pre-Baseline Resul ts ................................................................................................ A7 4.43 Preference for PIacement Locations of Prediction List ............................................ 68 4.44 Rates o f Text Entry ................................................................................................... 68
Gross Rates of Text Entry ........................................................................................ 68 Error-Adjusted Rates of Text Entry ...................................................................... 68
4.45 Accuracy of Text Entry ............................................................................................. 69 4.46 Perceived Performance ............................................................................................. 69 4.47 Bchaviour Observation ............................. ,.. .......................................................... 70
............................................................................................ 4.5 Summary and Group Results 70 .............................................. 4.5 1 Rate of Text Entry with and without Word Prediction 70
..................................... 4.52 Accuracy of Text Entry with and without Word Prediction 71 ....................................... 4.53 Preference for Piacemcnt Location for the Prcdiction List 71
........................ 4.54 Rates of Text Entry with the Prediction List in Different Locations 71 ................. 4.55 Accuracy of Text Entry with the Prediction List in Different Locations 72
............................................................................................. 4.56 Perccived Performance 72
Chapter Five . Discussion ............................................................................................................ 73 5.1 The Effect of Word Prediction on Rate of Text Entry ...................................................... 73 5.2 The Effect of Word Prediction on Accuracy of Text Entry .............................................. 78 5.3 The Effect of the Location of Prediction List ................................................................... 80 5.4 Perceivrd Influence of Word Prediction on Written Productivity ..................................... 82 5.5 Strengths and Limitations of the Study ............................................................................. 84 5.6 Direction for Future Research ........................................................................................... 85 5.7 Conclusion and Clinical Implications ................................................................................ 86
..................................................................................................................... Contributions 87 Clinical Implications .......................................................................................................... 87
References ............................................................................................................... .,. 88 ....................
Table 1
Table 2
Tabte 3
Table 4
Table 5
Tabie G
Table 7
Table 8
Table 9
LIS-r OF TABLES
Page
............................................... Cornparison of Word Prediction Sollwarc (May. 1999) 104
Participant Cliaracieristics ...................................................................................... 1 O5
ResuIts of Pre-Baseline Tests ....................................................................................... 106
................................... Means and Standard Deviations of Gross Rates of 'fcxt Entry 107
bleans and Standard Deviations of Error-ildjusted Rates of Text Entry ..................... 108
kteans and Standard Deviations of Accuracy of Tcxt Entry ....................................... 109
Comparison of Mean Gross Rates of Text Entry .......................................................... 110
Cornparison OF Mean Error-Adjusted Ratcs oTTcxt Entry ........................................... III
Cornparison of Mean Acçuracy of Text Entry .............................................................. 112
Table 1 0 Occupational Pcrfomance Tasks and COPM Scores ................................................ 113
.............................................................. Table 1 1 bleans and Standard Deviations of Pilot Data 150
...................................... Table 12 PP: Comparison of Mean Rates and Accuracy of Text Entry 151
Table 13 PP: Occupational Performance Tasks and COPM Scores .......................................... 152
vii
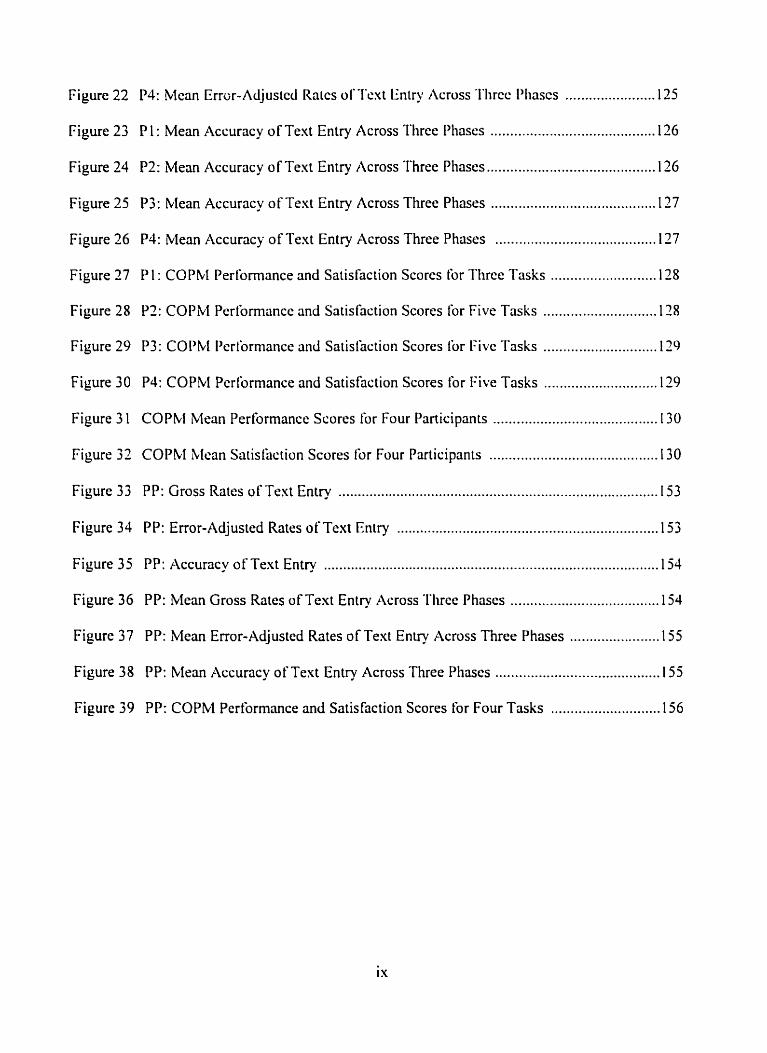
....................... Figure 22 P4: Mean Errür- Adj ustcd Raies o S Tcxt Entry Across 'flircc l'liascs 1 25
.......................................... Figure 23 P 1 : Mean Accuracy of Text Entry Across Three Phases 126
........................................... Figure 24 P2: Mean Accuracy of Text Entry hcross Three Phases 126
.......................................... Figure 25 P3: Mean Accuracy of Text Entry Across Three Phases 127
......................................... Figure 26 P4: Mean Accuracy of Text Entry Across Three Phases 127
........................... Figure 27 P 1 : COPM Performance and Satisfaction Scores Cor Ttiree Tasks 128
Figure 28 P l : COPM Performance and Satisfaction Scores for Five Tasks ............................. 178
Figure 29 P3: C O l W Perlormance and Satislàction Scores Sor Fivc Tasks ............................. 129
Figure 30 PJ: COPM Performance and Satisfaction Scores for Five Tasks ............................. 129
Figure 3 1 COPM Mean Performance Scores for Four Participants .......................................... 130
Figure 3 2 COPM blean Satisfaction Scores for Four Participants .......................................... 130
Figure 33 PP: Gross Rates of Text Entry ............................................................................... 153
Figure 34 PP: Error-Adjusted Rates of Text Entry ................................................................... 153
Figure 35 PP: Accuracy of Text Entry ................................................................................ 1 54
Figure 36 PP: Mean Gross Rates of Text Entry Across 'îliree Phases ...................................... 154
. . Figure 3 7 PP: Mean Error-Adjustcd Rates of Text Entry Across Thce Phases ....................... 133
Figure 38 PP: Mem Accuncy of Text Entry Across Three Phases .......................................... 155
Figure 39 PP: COPM Performance and Satisfaction Scores for Four Tasks ............................ 156

Page
Appendix B Eiliics Approval .................................................................................................. 132
Appendix C Consent Form ................................................................................................... 1 3 3
Appendix D Assent Forni ........................................................................................................ 136
Appendix E Letter of invitation .............................................................................................. 139
Appendix F Sample oS Kunip's Scoring instructioiis lbr Accuracy ol"1'est Entry ................. 140
Appendix G Sample ot' Subtest A and 6 of Developmental Eyc Movement Test .................. 141
................................ Appendix tl Samplr or Subtcst C. Developmental Eye Movement Test 142
Appendix 1 Sarnplc of Scoring Instructions on Cliildrcn 1 Iandwriting Evaluation Scalc ....... l43
Appendix J Beliaviour Clieçklist ............................................................................................ 144
......................................................................... Appendix K Demographic Information Forrn 145
Appendix L Pilot Rcsults ......................................................................................................... 146 L . 1 Background Information ............................................................................... 146
..................................................................................... L.2 Pre-Basclinc Results 146 L.3 Prefercnce for Placement Locations of Prediction List ................................ 147 L.4 Rates of Text Entry ....................................................................................... 147
Goss Rates of Text Entry ........................................................................ 147 Error-Adjusted Rates of Text Entry .................................................... 1 4 7
............................................................................. L.5 Accuracy of Text En try 1 4 8 .................... L.6 Perceived Performance .............................................................. 148
L.7 Behaviour Observation ............................................................................... 1 4 9
Introduc tiori
Health Canada estimates that spina bifida occurs in 5.6 per 10.000 total births in Canada
(Health Canada, 1999). I t is the second most coinnion " birtli dercct," aster cerebral palsy (Wills,
1993). The Canadian rates of spina bifida rank among the highest in the world. Ttiese rates have
important social and economic implications with regard to the long-term treatrnent requiremcnts
for children bom with spina bitida and hydrocephalus. The potential economic çonsequences for
this disability group arc likcly to be considerablc if tlicsc cliildreii are unable io futiction
productively in society .
Clany çhildren wi th spina bi lida and Iiydroccpiialus expcricncc di fficul ty in dcveluping
functional handwiting skills (Anderson. 1976; Cambridge & Anderson. 1979; Pearson. Cam. &
Halli~vell, 1988). Generally. Iiandwriiing speed in children witli spina bilida and Iiydroccphalus
is 20% slower than tliat of children without a disability (Anderson. 1976: Ziviani, Hayes. &
Chant. 1990). Difficulties in maintaining alignrnent. letter formation and word spacing are the
most common conçrrns in Icgibiliiy (Anderson, 1976). When writing is a difficult task, children
may try to compleie a written assignment in as few words as possible, thus affecting
development of language skills (Amundson & Weil, 1996). The implications of handwriting
difficulties are highlighted in Brigg's studies which show that the quality of handwiting may
mean the difference between passing and failing a major examination even when the quality of
the content remains similar (Briggs, 1 970: Briggs. 1 980). A reduced handwiting speed could
mean that an incornpletc response would be produced in an examination. thereby lowering
academic achievement (Tseng & Cemak. 1993). Furthemore. children whose writing speeds are
slow often cannot finish assignments on time. and have to complete iheir schooirvork at home or
at recess periods. This results in a reduction in playtirne, which is important for children's
social-eniotional developiiiciii (Morrison. Metzgcr. Sr Pratt. 1996). Incrcüsed conçcrn about
Iiandwriting difficultics Iiüs bccn spurrcd by rcccnt iiiandatcs iii Ontario io i~itroducc a iiiorc
vigorous curriculum in ivriting and other subject ares. Province-wide tests have been conducted
witli studcnts i i i Gradcs 3. 6 aiid 9 siriçe 1997 to detcrniinc the Icvcl of achievenicnt in the arcas
of reading, writing and maihrmatics (Ontario hlinistry of Education. 1000). A literacy
examination has been designed recently and will be conducted before the end of Grade 1 O.
Students in Ontario will be required to pass the literacy examination to graduate from high
scliool (Ontario blinistry oS Educntion. 7000). Wliilc proiicicncy in a subjcct area is judgcd by
the mastery of knowledge md skills. the legibility and speed of a cliild's handwriiing is critical
to providing a incdium in wliic II io demonstrate what the child has learned about a given subject.
A problcm wi th Iiandwri ting is one of the most common reasons for relirrring school-
aged children to occupational therapy (Cermak, 199 1 : Oliver. 1 990). While some children can
improve their bandwritiny skills tlirougli retnediation. otiicr cliildren cannot and iliey comnionly
require the use of a computer to help with text generation (Amundson 8c Weil. 1996: hluen &
Bannister. 1997: Wills. 1993). 1-Iowever. with reduccd l i n p r dcxtcrity. linper agnosia and
impaired kinesthetic sensation. c hildren witli spina bi fida and hy drocephalus also have
difficulties developing typing skilis. especially in ternis of the rate of text entry (Muen L
Bannister, 1997; Sandler. 1997; Ziviani et al., 1990). Therefore, use o f a computer may help to
improve the quality, but not necessarily the speed of written output.
Word prediction computer software prograrns are designed to increase the rate of text
entry for individuals with physical disabilities (Heinisch & Hecht, 1992; Stmck. 1996: Swiffin,
Amott, Pickering, & Newell. 1987: Woltosz, 1990). The software monitors the keys that the user
types and generates a list of the most likely words and displays them in a prediction list. The user
tlien sclccis tlic dcsircd word lioiii iIic prcdictioii list by prcssiiig a dcsigiiatcd kcy oii iiic
keyboard, usually a numbcr key. By dccreasing the number of keystrokes required to type a
word, word prediction soliware lias the potcniial to iniprove tlic rate of icxi cntry. Anotlicr
benefit of word predictioii is tIiat it reduccs fatigue (Klund & Novak. 1995). This is especially
important for people who have pliysical disabilities and for wlioin keyboarding can bc pliysically
taxing (Klund & Novak. 1995: Waller. Beattic. & Newcll. 1990).
Word prediction is curnrnonly recomrnended by occupatioiial thcrapists ibr children witli
spina bifida and hydroçcphalus as a tool to improve their written productivity in tasks such as
journal entrv, s t o ~ writing and report writing. i-Iowever. the effectiveness of word prediction as
a strategy to meet these targeted outcornes has not been rvcll establisticd. The results of' rcsearch
into this a m are equivoccil. A number ofclinicûl case siudics and experiniental studies suggest
that use of word prcdictioii improves the rate of iext generatiun (Lewis. Graves. Ashton. gi
Kieley. 1998: Newcll. Booth. & Beattie, 1991). Othrr studies tind no dilference iti thc rate of
text entry with or without word prediction, while some researchers report lower rates wi.iili word
prediction (Anson. 1993: Koester & Levine, 1994; Koester & Levine, 1996; Scull & Hill. 1988).
Researchers generally agree that there is an increased demand on the visual-cognitive system
associated with the use of word prediction.
The demand on visual-cognitive skills related to the use of word prediction is particularly
important to consider when working with children with spina biîïda because they comnionly
experience difficulties with oculo-motor control, perceptual and cognitive functioning ( Biglan.
1990; Demis, et al., 198 1; Fletcher. Levin & Butler, 1995; Stickel. 1998: Wills. 1993). Children
with spina bifida and hydrocephalus typically have difficulties with tasks requiring shifting of
eye gaze. active scaniiiiig. scquciiciiiy. plrinniiig. niciital tracking. and sliiliing aiteniion. or
inhibiting overleamed responses (Biglan. 1990; Tew. Laurence. c ! ! Ricliards. 1980: Wills. 1993).
They also genrrally take iwice as long as childrcii without disabilities to acliieve the sanie level
of accuracy in visual scanning tasks (Tew et al.. 1980).
Adjusting paranic ters o î' the word prediction progranis caii 1esst.11 t lie visual-cogni ti ve
loads associaicd witli its use. For cxniiiplc. Swiffin and associates ( 1 987) suggest tliat a balancc
bctween saving keystrokcs and niinimiziny visual-cogni~ivc loads çaii be reachcd by usiiig a
five-word list. They also suggcst tliai a vcrtical layout of tlic list reducrs visual scarcli time as it
keeps the head and cye movemenis to a minimum. The length of words also oCScrs visual cues to
guide the search, thus furtlier rcducing ilie searchiny time. Koestcr and Levine ( 1 996) suggest
that searching the word prcdiction list after typing two letters was the most ciflicient searching
strategy for individuais with slower visual searcliing abilitics. clnother possible parameter
affecting visual search time is the placement location o l the predicrion list on the computer
monitor (Klund & Novak. 1995: Newell. et al.. 199 1). The design of the Windows operating
systern restricts wherr the prediction list can be placed. The ieft upper corner coniains the
frequently used application coninland menu. The scroll bars will be blocked if the word list is
placed at the ttvo lower corners. Therefore. there are only three logical locations for the
prediction list: upper riglit corner (UR). lower middle border (LM) and foliowing the cursor
(FC). To date. no empirical study has addressed the relationship between the placement location
of the prediction list and the rate and accuracy of text entry.
1.1 Objectives
The purpose of this study was three- fold. Fint. this study investigated if use of word
prediction could enhance witten productivity for children with spina bifida and hydrocephalus.
Rate and accuracy of text entry were examined. as both are important elernents of overall
productivity with the use of a computer. Second. this study compared the effect of placement
locations of the prediction list on rate and accuracy of text entn;. The three locations that were
compared included right upper corner. lower middle border and following the cursor. Third. this
study explored user's perspectives related to the potential benefits of word prediction.
Specifically. this study was designed to answer the following questions:
I . Does the use of word prediction significantly improve rate of text entry'?
2 . Does the use of word prediction significantly improve accuracy of text entry?
5. 1s there a difference in rate of text entry when the word prediction list is placed
locations on the computer screen'?
4. Is there a difference in accuracy of text entry when the word prediction list is p
di fferent locations on the computer screen?
in ditTerent
aced in
5. Does client's perception of performance and satisfaction with witten productivity tasks
change afier using word prediction?
1 .I Conceptual Basis and Relevance of the Study
In response to the economic climate of streamlined services and cost cutting in recent
years. DeRuyter ( 1995) issued a wake-up cal1 to the assistive technology community for the need
to conduct outcome research. Many authon have echoed that it is imperative to demonstrate
accountability and to produce evidence that application of assistive technology interventions are
producing the desired outcomes (Minkel. 1996; Petty, Treviranus, & Weiss. 1999; Scherer. 1996.
Smith, 1996). tlowever. the ability to nieasure the true inipact of any assistive device is a very
complex and challenging exercise. Recently, tliere is a growing interest in adopting a client-
centered approacb to evaluate outcomes of assistive devices (Demers. Weiss-Lambrcu. &: Ska.
1996; Scherer & Galvin. 1997: Smith, 1996).
This study was conceived in the context of the Canadian Occupational Pcrforn~ancc
Mode1 (CCIOP). a mode1 of client-centered practice (Canadian Association of Occupational
Therapists [CAO'S]. 1997). Tlic CklOP is bnsed on ilie bcliel'that the pcrson is a lùndamental
part of the tlicrapeutic process. It suggests that occupationnl perhrmancc is the rcsult o l a
dynarnic relaiionstiip bctwccn pcrsoiis. environment. and occupation over a person's lire span.
Acknowledging that an individual's pcrfomance is affcctcd by the complexity O S environmental
and personal Iàctors. Feoring. Law and Clark ( 1997) suggest tliat evidcnce Tor outcornes sliould
be established using objcçtive measurcments and subjective evidence obtained from the client.
Using subjective evidence to establish outcomes is important because underlying client-centred
pnctice is a recognition of the autonomy of the individual person and the recognition of client
choice (Law. Polataj ko, Baptiste, & Townsend. 1997). Objective evaluation of occupational
performance is of value to clients because it helps them gain insight into the degree of change
that has occurred (Fearing. et al., 1997).
The CMOP provides the concept and fmework for this study to examine the common
clinical pnctice of using word prediction as a rate enhancement tool for children with spina
bifida and hydrocephalus. The results of this study will provide preliminary information that can
be used to guide prescription and implementation of word prediction technology with children
with spina bifida and hydrocephalus.
Cliaptcr Two - Litenturc Rcview
This literature review is oqanized into tliree distinct sections. The first section
summarizes current understandings of spina bifida in the litrrature. It includes a description of
the disorder and the concomitant difficulties expcrienced by cliildren. Deticits in the a r e s of
upper limb functions. vision. cognition and language arc discusscd in yreater depth as thesc
deficits may aFîèct the abil ity of children with spi na bifida and hydrocephalus to use a cornputer
and word prediction software effectively. fl ic second section reviews the literature on clinical
applications of word prediction and Factors tliat tiiay a f i c t the el'feciiveness of tliis teclinology.
Factors that influence keystroke savings and visual-cognitive loads associated with the use of
word prediction are elaborated to provide the foundation for the study. Prcvious studies on
effectivcness of word prediction are critiqued to idcntiî'y gaps in existiiig knowlcdgc. The tliird
section summarizes theories relatcd to perccived self-efficacy and discusscs bow p e r c e i d self-
efficacy can influence performance. At the end of the chapter. information gained from the
literature review is summarized and applied to guide the irnplernentation of word prediction
technology in this study and the development of the hypotheses.
2.1 Spina Bifida and Hydrocephalus
2.1 1 Description of Spina Bifida
The term spina bifida describes the condition in which sections cf the spinal column fail
to close at the midline. This c m occur at any level of the spine from the cervical to the sacrai
region. The most common location (80%) for spina bifida is in the lumbar region (Biglan, 1990;
Shaer, 1997). Myelorneningocelt. is the most severe form of spina bifida, in which the spinal
cord protrudes through ihe dorsal aspect of the spinal column causing damage to the spinal cord
(S haer, 1997). The abnorina1 development of the spinal cord results in a lack of normal nerve
function at and below the level of tlic defect. As a result of spinal cord dysfunction, iiiost
children with myelomeningoccle require assistance cvith arnbulation. Skin sensation may be
absent or significantly reduced in areas at or below the level of the lesion (Sandler. 1997: Shaer.
1997). Fewer than 10% olchildren with myelorneningocele achieve independent bladder and
bowel control (Lie. Lagergren. & Rasniussen. 1 99 1 ). In addition. ortliopnedic abiiomial i ties
such as club fect. and other deformitics of the feet. knees. and hips or kyphoscoiiosis are
çotnmonly Lund in cliildrcn witli niyclonicningocelc (Karol. 1995). In addition to beiny the
most severe form. myeionicningocelr is also the most comrnon lorm of spina bifida (90%).
therefore the term "myeloriieningocele" is very onen simply callcd spina bifida by lay persons
and professionals aiike (Shacr. 1997). Throughout this thesis. the ierms "spina bilida" and
"myelomeningoccle" are used intercliangcably .
Wlien a çliild is born wiih an open defect in the spinal column. surgcry is donc to place
the underdeveloped. protruding nervous tissue back into the spinal canal and to cuver it with as
many of the normal tissue laycrs as possible. Delayed closure of the defect can lead to
contamination and datnages to the central nervous system. Witli advances in medicine. the 10-
year survival rate of c hildren wi th spina bi fida improved from 40% in the 1950's to over 83% in
1992 (Eckstein & illacnab. 1966; Steinbook, Levine. Cochrane, & Invin. 1992). Shunt
procedures, infection control and clean catheteriwtion techniques are amony the most significant
medical advancements that have allowed more babies to survive and to survive with less
neurological deficits than previously reported (Harcourt, 1974; Hunt & Poulton. 1995: Wills,
1993).
2.12 Associated Abnormalities
Spina bifida is not just a condition of the spine. There are also associated abnomalities of
the nervous system as a result of Arnold-Chiari 11 malformation and hydrocephalus (Sandler.
1 997: Shaer. 1 997). With the availability of rnagnetic resonance imaging ( M N ) techniques.
researchers have gained a better understanding of the changes in the central nervous systems
related to spina bifida (Barkowich. 1990). The MM techniques have also been applied to relate
the pathology in the central nervous system to the clinical manifestations (Fletcher. Bohan. et
al.. 1996: Lennerstrand. Gailo. & Samuelson. 1990).
Samuelsson and associates ( 1 987) reported that nearly al1 children with spina bitida aere
born with Arnold-Chiari 11 malformation. The Arnold-Chiari II malformation is a condition
which involves abnormalitics of the hindbrain and posterior fossa including an elongated. small
cerebcllum and brain stem and hemiation of the cerebellurn and portions of the mrdulla and pons
through an cnlarged foramen magnum into the cervical spinal canal (Barkowich. I W O ) . This
malformation c m lead to dysfunction of the brainstcrn. the cerebellurn and of sorne of the cranial
nerves and the upper cervical nerves. Motor difficulties including vocal cord paralysis. disorders
of rye movemrnts and upper extrernity weakness can result. In the severe cases. life-threatcning
symptorns such as apnea and disorganized swallowing cm occur (Shaer. 1997).
Hydrocephalus is seen in approximately 80% of children with spina bifida ofien as a
result of the obstruction of the ventricular sysrern caused by the Arnold-Chiari II malformation
(Dias Br McLone. 1993: Yeates. Enrile. & Loss. 1998). Hydrocephalus can cause a variety of
associated brain abnormalities. includinp dyspiasia of the corpus callosum. stretching of the
periventncular white rnatter. dismption of myelination. damage to the optic tracts. and reduction
in the thichess of the cortical mantle. especially in the posterior regions (Del Bigio. 1993:
Fletcher, et al.. 1995). In addition. children with hydrocephalus show reductions in overall gray
matter that are more pronounced in postenor than antenor regions of both hemispheres (Fletcher.
McCauley. et al.. 1996).
The clinical management of hydrocephalus usually involves shunting to continuously
drain the cerebral-spinal fluid (CSF) out of the ventricles. The CSF can be drained into scveral
locations including the abdominal cavity. atrium. the gailbladdrr. or directly to the outside of the
head (Shaer. 1997). The ventricular-peritoneal (VP) shunt. which drains the CSF to the
peritoneal cavity is the most comrnon procedure (Christoferson. 199 1 : Sandler. 1 997). The shunt
helps to keep the intracranial pressure within normal iimits. and prevents further damagc to the
brain from high pressure (Shaer. 1 997). Approximately 85% of children with spina bi Bda and
hydrocephalus have shunts insened. most in the first year of life (Minns. 1981: Wills. 1993).
Reccnt studies suggest that shunt treatrnent does not restore the brain damages causrd by
hydrocephalus (Del Bigio. 1993).
More than half of al1 new-born VP shunt recipients have no significant episodes of shunt
malformation and keep the sarne shunt until late childhood. at which time the shunt tubing may
need lengthening to accornmodate increasing growth (Sandler. 1997). However. shunt failure is
more cornmon in adolescents and adults with spina bifida and hydrocephalus. The growth that
occurs with puberty c m pull the shunt tubing up and out of the abdominal cavity. so that the
shunt does not drain normally or becomes obstmcted (Sandlrr. 1997). The actual presence of the
shunt within the body c m predispose children with spina bifida and hydrocephalus to many other
complications such as a reaction to the tubing. infections. tissue scming and mechanical
breakdotc-n (Christoferson. 199 1 ).
In addition to Arnold-Chiari 11 malformation and hydrocephalus. magnetic resonancc
imaging ( M N ) studies show that complete or partial agenesis of the corpus callosum are
commonly found in children with spina bifida and hydrocephalus (Barkowich. 1990). Chiidren
with spina bifida and hydrocephalus are also at increased risk for seizures. with an incidence of
approximately 5% to 15%. The risk of seizures is çreatest for children with a history of
ventriculitis and Frequent shunt revisions (Yeates et al.. 1998).
The consequences of the involvement of the central nrnous system in children with
spina bi tida and hydrocephalus include de ficiencies in intelligence. language. visual perception.
memory. attention and upper limb functioning (Dahi. er al.. 1995: Demis. et al.. 198 1 : Demis.
Hendrick. Hoffman. & Humphrey. 1987: Fletcher. Brookshire. 1996: Fletcher. et al.. 1992;
Jansen. et al.. 199 1 : T w & Lawrence. 1973: Wills. 1993). In the early years of lifc. parents of
children with spina bifida and hydrocephalus are most concemed about sun.ival. followed by
orthopaedic problems. and bowel and bladder incontinence (Lollar. 1993). Deficits in
neuropsychological functioning. language. and hand function are often not identitïed or
addressed in these early years (Anderson & Spain. 1977). Donders and colleagues ( 199 1 )
suggested that man: of these deficits are subtle in nature and would not be apparent to caregivers
of children under the age of eight. Anderson and Spain ( 1977) also obsened thnt children with
spina bifida and hydrocephalus often manage well in their first two or three years at school.
However. they commonly begin to fa11 behind their peers when they reach grade three. when the
demands and complexity of academic and witing tasks increase (Anderson & Spain. 1977:
Donders. Rourke. & Canady. 199 1 1.
Manu researchers suggest that the spina bifida and hydrocephalus population is very
heterogeneous because many factors afkct their outcornes. especially in the area of
neuropscychological functioning (Fletcher. Dennis. & Northmp. 7000: Wills. 1993: Yrates et al..
19%). Greener and associates ( 199 1 ) studied the association of race and gender with
neurological levels of myelomeningocele. Overall. they f o n d that the white to black ratio was
3.6: 1 and the male to female ratio was 0.86: 1. However. the proportions of thoracic level lesion
increased siçnificantly in whites and Fernales. The level of lesion has been found to be strongly
correlated with sensory. rnotor and neuropsychological îùnctions. Rather than a gradua1 decrease
in funciions with higher level lesions. there appears to be a sharp dropotT in functions at the
thoracic level (Donders et al.. 199 1 : Greener. Terry. Demasi. & Hemngton. 199 1 : Laurence S:
Coatss. 1962: Wills. Holrnbeck. Dillon. & McLone. 1990). Most reports find no correlation
between the number of shunt revisions and cognitive functioning ( Dennis et al.. 1 98 1 : Hunt &
Holmes. 1976: Tew & La~vrence. 1975). Researchers agree that children with history of infection
in the central nervous system such as venticulitis or meningitis commonly have lower intellectual
function (Hunt & Holmes. 1976: McLonr. Czyzewski. Raimondi. & Sornmers. l982: Shaffer.
Freidrich. Shurtleff. & Wolt: 1985). Fletcher and associatés ( 1992) showed that mesures of the
size of the corpus callosum were significantly and robustly correlated with nonverbal
intelligence. but not with verbal intelligence. In addition. the severi ty of hydrocep halus. timing
of shunt insertion. visual function. the child's personality. farnily. social and educational
arrangements are al1 possible factors affecting the c hild's development cind neuropsychological
functioning ( Wills. 1993).
2-13 Deficits in Spina Bifida and Hpdrocephalus
lntellectual function. Intellectual functioning is commonly described using the
Intelligence Quotient (Yeates et al.. 1998). Early studies of children with spina bifida and
hydrocephalus. before advances in medical practice reduced the mortality rate and complications
related to shunt procedures. comrnonly reported below average intelligence on standardized
intelligence tests. Incidence of mental retardation was found to be high (Laurence & Coates.
1962; Tew. 1977). Recent studies provide a more optimistic picture. showing that children with
spina bifida and hydrocephalus ofien have IQs in the low-average to average range (Brookshire.
et al.. 1995: Fletcher et al.. 1992: Wills et al.. 1990). Verbal abilities are usually stronger than
performance skills. Verbal intelligence is usually in the average range. whereas nonverbal or
performance intelligence falls below the average. (Brookshire et al.. 1995: Dennis et al.. 198 1 :
Fletcher et al.. 1992: Friedrich. Lovejoy. Shaffer. Shurtleff. & Beilke. 199 1 ; Hunt & Poulton.
1995: Steinbook et al.. 1992: Tew. 199 1 ).
Memon.. Relatively few studies focus on rnemory functioning in children with spina
bi tida. C hildren wit h spina bi fida and hydrocephalus are O ftrn included in studies that examine
mernory functions of children with hydrocephalus of V ~ ~ O U S etiologies (Cul1 & Wyke. 1984:
Scott. Fletcher. et al.. 1998: Yeates. Enrile. & Loss. 1995). The results From these studies suggest
that children with shunted hydrocephalus enhibit a pattern of performance suggestive of
encoding and retrieval deficits on both verbal and nonverbal tasks. showing a pervasive
disturbance of memory processes. These children show deficits on tasks involving serial learning
of unrelated items. but not on measures involving the recall of meaningful stot-ies or pictorial
stimuli. One area of disagreement remains unsenled. Scott. Fletcher et al. ( 1998) reported that
children with shunted hydrocephalus displayed difficulties with recognition memory. On the
contrary. Yeates et al. (1995) reported that children with hydrocephalus have no difficulties in
tasks involving recognition. Scott and his colleagues ( 1998) attributed this disparity in findings
to differences in sampling characteristics. Scott et al. included a broader range of etiologies and a
larger sample of children with shunted hydrocephalus in their study.
Attention and executive hnctions. Attention and executive functions are the least studied
area of ne~~ropsychological tiinctions in children with spina bi fida and hydrocephalus. Fletcher.
Brookshire et al. (1996) found that children with hydmcephalus display isolated deficits on
measures of focused attention and selective attention as well as problem-solving detkiencies on
rneasures of rxecutive functions. However. they commented that the poorer performance \vas in
pan related to motor and speed-of-processing deficits common to children with hydrocephalus.
Children with hydrocephalus simply perfom more siowly on tasks that measure selective
attention and problem-soiving skills (Fletcher. Brookshire. 1996). In 1996. Loss. Yeates and
colleagues exarnined attention md executive functions with childrcn with spina bifida and
hydrocephalus. They adopted the attention theory proposed by Mirsky ( 199 1 ) and used test
batteries that measure the four elcments of attention: encode. t0cus/exccute. sustain and shift.
Loss et al. ( 19%) found that children with spina bitïda and hydrocephalus showed deficits across
al1 Four elements of attention (Loss. Yeates. & Enrile. 1996: Mirsky. Bruno. Duncan. Ahearn. 8:
Kellam. i 99 1 ).
Lan~uaee. Children with spina bifida and hydrocephalus ofien demonstrate adequate
language skills. rspecially in fom and structure (Fletcher et al.. 1000). However. they oRen
display deficits in discourse and semantic-pragmatic skills so that their language output is ofien
lacking in substance and poorly matched to the communicative context (Demis. Jacennik. 8;
Bames. 1994). Demis and associates ( 1987) suggested that with increasing agr. children with
hydrocephalus appeared less able than children without disabilities to maintain age-appropriate
performance incrernents in language skills. Word-finding. grammatical comprehension and
spelling are common areas of difftculty found in children with spina bifida and hydrocephalus
(Demis et al.. 1987: Shaffer et al., 1985: Tew & Lawrence. 1975). Studies of school attainment
have consistently s h o w that children with spina bifida and hydrocephalus have reading skills
below their actual age (Tew. 199 1 ). Reading recognition is usually intact but rrading
cornprehension is relatively impaired (Anderson & Spain. 1977: Bames & Dennis. 1 997: Cm.
Halliweli. & Pearson. 198 1 ; Halliwell. C m . & Pearson. 1980).
Visuol perception. Difficulties in visual perception are commonly reponed in studirs that
address the neuropsychological functioning of c hildren with hydrocephalus (Brookshire et al..
1995: Dennis et al., 198 1 : Fletcher et al.. 1992: Tçw & Lawrence. 1975: Yeates et al.. 1998).
Children with spina bifida and hydrocephalus have been found to be slower and less accurate
than children without disabilities wvith respect to visual-spatial abilities (Anderson tk Plewis.
1977: Brookshire et al.. 1995: Yeates et al.. 1998). Poor performance in tasks that involve
identifying rrnbedded figures from the background and identifying shape in its entircty have
been reported (Fletcher et al.. 1992: Miller & Sethi. 197 1 : Willoughby & Hoffman. 1979).
Stickel ( 1998) reponed that children with spina bifida and hydrocephalus are able to solve simple
two-dimensional cornputer-based visual discrimination pro blems. However. they O tien require a
longer time with visual discrimination tasks that demand more cognitive processing ( Stickel.
1998).
Vision. Children with spina bifida and hydrocephalus frequently experience visual
difficulties including ocular mobility defects. strabismus. nystagmus. and refractive errors
(Biglan. 1990: Biglan. 1995: Gaston. 1985: Harcourt. 1974). Approximately 60% - 75% o f
children wvith spina bifida and hydrocephalus are diagnosed with strabismus (Caines & DAI.
1997). A-pattern stnbisrnus. which is also called convergent squint. is the most common type of
strabismus found in this population. Strabismus is commonly treated surgically to restore bifocal
fixation (Harcourt. 1974). However. only a small number of treated individuals are able to
develop normal binocular hnctioning (Harcourt. 1971). Nystagmus is another eye movement
disorder comrnonly found in children with spina bifida and hydrocephdus. occumng at a rate of
25% (Biglan. 1990). Children with nystagmus experience oscillating eye movements in a
particular direction. most often upon lateral gaze. Nystagmus also imprdes the development of
binocular vision. Children assessed for strabismus and nystagmus are sornetimes found to have
defictive vision due to optic atrophy (Biglan. 1990). A number of researchers attnbute
strabismus and nystagmus to hydrocephalus. midbrain or cerebellar dysfunction. or to a
combination of these mechanisms. which causes thinning of the cortex. disruption to the
bninstem and the cerebellurn. and traction and angulation of optic and oculomotor nerves
(Clements & Kaushal. 1970: Gaston. 1985: Harcourt. 1974). These findings have been confimird
using M N techniques in recent studies (Biglan. 1995: Lennerstrand et al.. IWO). The ocular
motility and acuity problerns rnay contribute to the difficulties in visual acuity. visual
accommodation. visuomotor and visuospatial tasks (Dennis et al.. 198 1 : Hunt & Holmes. 1 976:
Tcw. 199 1 ). Children with spina bifida and hydrocephalus commonly expctrience loss of place.
skippinn L words and slow reading speed because of oculo-rnotor difficulties (Biglan. 1990:
Biplan. 1993: Sandlrr. 1997). They typically take twice as long as children without disabilitirs in
visual scanning tasks to achieve the same levei of accuracy(Tew. Laurence. & Richards. 1980).
Upper extremitv function. Children with spina bi fida and hydrocephalus comrnonly
esperience dysfunction in their upper extremitirs and their hands. The? rnay score poorly in
tests of muscle power. bilateral coordination. stereognosis. and tactile and kinesthetic sensation.
H ydrocephalus and cerebellar anolmalies due to Arnold-Chiari II malformation have been the
most commonly irnplicated cause of poor upper limb îùnction (Jansen et al.. 199 1 : M a r .
Aylward, Coiliner. Stacy. & Menelaus. 1988: Minns. 1984: Sand. Taylor. Hill. Kosky. &
Rawlings. 1974: Wallace. 1973). Muen and associates (1 997) report that children with spina
bifida, but without hydrocephalus. also have reduced hand function scores as compared to
children of their own age and sex. They suggest that the spinal cord abnomalities rnight be the
contributing factor to reduced hand function in children with spina bifida. A high incidence of
vertebrai maIfonnations such as syrinçohydrornyelia. hydromy elia or diastematomyelia have
bern ideniified and confirmed using M N techniques (Azimullah. Smit. Rietveld-Knol. & Valk.
199 1 : Emery Rr Lrndon. 1972: La Marca. Herman. Grant. & McLone. 1997: Samuelsson.
Bercstrom. + Thomas. Hemmingsson. & Wallensten. 1987). Al1 of these pathologies are capable of
considerable disruption of the spinal cord locally by their cffect on the neurons in the dorsal and
ventral horns. and more distally by affecting the long tracts as they pass through the affectcd
We8.
Reduced upprr limb functioning. rspeciall y in terms of coordination. and tactile and
kinesthrtic sensation affects the abilities of children with spina bifida and hydrocephalus to witc
and type (kluen & Bûnnister. 1997: Wills. 1993). The development of writing and typing skills
is compounded by the deficits in ocuio-motor control. visual perception. and visual-motor
inregration (Anderson. 1 976: Cambridge & Anderson. 1 979: Pearson. Carr. & Hall iwell. 1 988:
Wills. 1993: Ziviani. et al.. 1990). Gencrally. handwriting speed in children with spina bifida is
about 20% slower than that of children with no disability (Anderson. 1976: Ziviani et al.. 1990).
The level of difficulty in typing has not been documented in the literature. Clinically. children
with spina bi tida and hydrocephalus are observed to have difficulties developinp touch-typing
skills. Many type with only one finger. This may be due to the difficulties in bilateral
coordination of hand movement cornrnonly found in children with spina bifida and
hydrocephalus (Muen & Bannister. 1997).
2.2 Word Prediction
2.21 Application of Word Prediction
Many individuals with physical disabilities find their methods of access to the computer
(e.g.. direct keyboarding. single-switch scanning m d on-screen keyboard) too slow and tiring to
serve as adequate writing tools (Scull & Hill. 1988: Soede & Foulds. 1986: Swi Min. Xmott.
Pickering. & Newell. 1987). Word prediction software was developed to help them improve the
rate of written communication (Klund & Novak. 1 995). The software presents a list of possible
words to users as the- type the initial lrtters of a word. By selecting a word from the prediction
list instead of typing the whole word. the number of key strokes required to type a word is
reduced. Additional kepstroke swings are achieved with auto-spacing and auto-punctuation.
Auto-spacing means that the word prediction software ûutomatically inserts a space after the user
selects a word from the prediction list. Auto-capitalization refers to the automatic capitalization
of the next word after an end-of-sentence punctuation is typed. The reduction of keystrokes
required for typing was hypothesized to be the main reason that word prediction c m irnprove the
rate of text entry (Swiffin et al.. 1987). Typically. word prediction prognms are used by
individuals who type using standard or alternative key boards (e.g .. expanded or srnaIl keyboard).
but the technology has also been incorporated into on-screen keyboard progrms. and single-
switch scanning software ( Fong-Lee. 1993). In addition. word prediction prograrns have been
reçarded as a useful tool to help students with learning disabilities in the writing process.
particularly to help them with difficulties in spelling (Hunt-Beq. Ranking. & Beukelrnan. 1994:
MacArthur. 1996).
2.22 Factors Affectinp E ffectiveness of Word Prediction in Rate Enhancement
Researchers have long recognized that reduction of keystrokes or motor acts does not
translate into an equal arnount of improvement in rate (Dabbagh & Dmper. 1985; Damper.
1984: Gibler & Childress. 1982: Goodenough-Trepagnier & Rosen. 1988: Vanderheiden 8i
Kelso. 1987). There are many factors that affect the overall rate of text cntry or communication
rate offered by a word prediction prognm. These include user chanctcristics. computer
r fticienc y. key stroke savings and visual-cognitive loads (Horstmann & Levine. 1 99 1 : Newrll. et
al.. 1997: Socde & Foulds. 1986). Ii is genenlly assumed that. with the advancement in
computer technology. the factors related to computer eftkiency are negligiblr (Soede & Foulds.
1986). User characteristics that should be considered include physical functions. motivation and
visual-cognitive functions (Newell. Booth. & Beattie. 199 1 ). Assuming that user characteristics
are a relatively constant factor. the overall efficiency of a word prediction prognm depends on
the balance between keystrokr: savings and the visual-cognitive loads (Koester & Lrvine. 1998:
Soedr & Foulds. 1986: Vanderheiden & Kelso. 1987).
I-iipginbotharn ( 1991) conducted a systematic evaluation of keystroke savings offered by
five word prediction progrms. He determined that the range of keystroke savings offered by
word prediction was between 3 1% to 48% (Higinbotham. 1992). The median range of
keystroke savings reported in several case studies was in the range of 23-58% (Korster &
Levine. 1996).
The cognitive processes required to use word prediction include decisions about when or
whether to search the prediction list. visual searching of the prediction list. decisions about
whether or not the list contains the desired word. and planning the appropriate action dependinç
on the presence or absence of the word on the list (Koester & Levine. 199 1 : Treviranus & Noms.
1987; Vanderheiden & Kelso. 1987). Visually. users who are not touch-typists have to switch
their eye gaze between the keyboard. the text location on the cornputer monitor. and the
prediction list. In the case of ri copy task. additional eye-gaze switching is required to and from
the copy material. The switching of eye-gaze requires additional effort for the users to tind their
places after scanning the prediction list (Anson. 1993: Koester & Levine. 1991 : Treviranus &
Noms. 1987: Vanderheiden & Kelso. 1987).
Throuph the use of case studies. clinical observations and mathematical modcling
techniques. researchrrs have identified a number of panmeters related to word prediction
programs that can affect krystroke swings and the visual-cognitive loads. These include:
prediction Irxicon. prediction algorithm. prediction list length. layout and order of the prediction
list (Gibler B; Childress. 1982: Higinbotham. Bak. Drazek. Kelly. & White. 1991: Klund &
Novak, 1995: Koester 8r Levine. 1998: NeweIl et al.. 199 1 : Sviiffin et al.. 1987: Vanderheiden.
1990: Vanderheiden & Kelso. 1987). In addition to changing the parameters of the word
prediction progrm. application of search strategies and training are also recommended as
important factors affecting visual-cognitive loads when using a word prediction program
(Koester & Levine, 1998; Newell et al.. 1992: Vanderheiden & Kelso. 1987).
The prediction algonthm determines how many keystrokes are required before a word is
displayed on the prediction list: therefore. it is an important factor contributing to keystroke
swings (Klund & Novak. 1995). A list of predicted words can be genented based on the
frequency of word usage in the English language. recency of use by the user. word association.
g r m a r or topic (Higginbotham et ai.. 1 992: Klund & Novak. 1 995: S wi Kin et al.. 1 987). The C
most cornmonly used algorithm is fiequency-of-use (Vanderheiden & Kelso. 1987). However.
simple word frequencies and recencies are not an accurate measure of the probability of the next
word during text composition. Both syntav and context play an important part in determining
how likely a particular word will occur as the next word in a sentence. Therefore. by
incorporatinç syntav and context information into the prediction algorithm. it may be possible to
increase the keystroke savings by an additional factor (Swiffin et al.. 1987).
The prediction lexicon affects when and whether the desired t o r d will appear in the
prediction lisi. A prediction lexicon can br fixed or dynamic. A fixed lexicon does not allow any
words to be addcd to the diction-. A dynamic lesicon allows a user's words to be added to the
dictionary as they are typed. Higginbotham ( I W ) suggested that keystroke savings may be
affected by individual communication style. word selection and discourse genre. A prediction
lexicon that c m adequately retlrct the individual's witing or communication needs in different
situations will likely be most stkctive. To be able to reflect the user's witing or communication
style. a dynamic lexicon is recommended (Swiffin et al.. 1987: Treviranus & Noms. 1987). On
the other hand. a tixrd lexicon helps the user to predict whether or not a word will apprar on the
prediction list. where it will be on the list. and thus less cognitively demanding (Vanderheiden &
Kelso. 1987). A large dictionary increases the likelihood that the desired word will be included
in the pre-stored lexicon. but it also tends to increase the required kepstrokes before the word is
displayed on the prediction list (Vanderheiden & Kelso. 1987). Smaller dictionaries of about
2.000 words are recommended as one way to increase communication rate. while keeping the
visual-cognitive load to a minimum (Anson. 1993: Gibier & Childress. 1982: Klund & Novak.

1995). Swifin (1987) suggested that using a nurnber of context-based small dictionaries is bener
than using a large dictionary. However. with the improvement in prediction algorithms. the
current trend in development of word prediction software is in favour of a large pre-stored
lexicon (Co: Writer 4000.2000: Tarn. et al.. 1999).
Predicted words can be displayed in the prediction list according to alphabstical order.
length of the word or frequency-of-use (Woltosz. IWO). The potential benefit of a frequency-of-
use order is the reduction of search time by having the most frequently used words appenr at the
top of the list. Displaying words according to word length may assist users with visual searching.
because the lenpth of the word provides a visual cue for the search. Arranging words
alphabrtically is used more comrnonly by usen with learning difficulties (Aurora. 1999).
Landaucr and Nachbar (as cited in Horstmann and Levine, 199 1 ). who sxamined the
effect of prrdiction list length with mathematical modeling found that srarch time for a 5-word
list was between 1 . O 4 .j seconds. and may be expecred to increase logarithmically if more items
are added to the list. Gsing a laboratop simulation program to test the effectiwness of tvord
prediction in rate reduction. Swiffin and associates ( 1987) observed tliat a 5-word prediction list
provided "a useful keysaving whiie keeping cognitive load and list scmninp time to a minimum"
(p. 188). Venkatagin ( 1994) conducted a study to explore the effect of the length of prediction list
on communication rate. He compared prediction list lengths of 5. 1 O and 15 words and
concluded that a. I 5-word list provided the highest keystroke savings. but required the most tirne
to search. Venkatagiri recommended a 5-word list because it offers the best compromise between
keystroke savings and visual-cognitive loads.
SwiiRin and colleagues ( 1 987) described their expenences in the design of PAL. a word
prediction program. They found that displaying the prediction list horizontally across the screen
required a larger amount of head and eye movements from the users than a vertical display.
Wlien the words are displayed vertically in a prediction list. the length and the shape of the
words provide some clues to guide the visual search (SwiMin et al.. 1987).
The placement location has been suggested as one possible factor that may affect the
visual-cognitive load when using word prediction. Anecdotally. Swiffin. Arnott and others
(1 987) suggest that the prediction list should bc kept in close proximity to the text cursor as i t
allows users to take in the prediction list and the cursor with one çiance. Ciinical experiencrs
suggested that individuals have their own preferences for the location of the word prediction list.
To date. no empirical study has been done to compare the effect of different placement locations
on rate or accuracy of text entry.
The strategy used to search the word list aiso has an rffect on the rate of tsxt entry. To
gain the maximum benefit from keystroke savings. the best strategy is to always search the list.
However. this strategy usually rneans an increased search time (Koester & Levinr. 1998 ).
Appiying the Keystroke-Level model (Card. Moran. & Newell. 1983). a mathematical model
developed for the study of human-computer interfaces. Koester and Levine ( 1997. 1998) buiit
performance protiles to determine the relative performances of visuai search strategies. They
suggest that a good "dl-purpose strategy" is to type one letter and then servch the word list. but
for individuals with slower visual search abiiities. the recomrnended searching strateyy is a "2-
thcn-scarch" strategy meaning searching afier typing two letters (Koester & Levine. 1998).
In addition to adjusting the parameten on word prediction programs to optimize the rate
or text rntry. appropriate training and sufficient practice cm also reduce the visual-cognitive
loads associated with the use of word prediction. Users should be trained to use search strategies
effectively. so that the process becomes automatic (Vanderheiden. 1990). Newell and associates
(1 992) recommended that an average of 1-2 hours of training is n e c e s s q to properly introduce
users to word prediction. After users begin to use word prediction. anticipation of the contents in
the prediction list will become more successful with pnctice. thus shortening visual search time
(Koester & Levine. 1996). However. Koester and Levine (1996) suggestrd that the visual search
task in using word prediction is unlikly to become truly automatic. even with extended pnctice.
because the words in the list serve as both targets and distractors. This makes it unlikel y that
cognitive and perceptual loads from word prediction would become negligible in skilled users.
2.23 Previous Studies on Ettectiveness of Word Prediction
Researchers studying the rfictiveness of word prediction reponed rnixed results. The
mixcd resulis generatrci From previous studies could be üttributed to the combination of
differences in research methodologies. study popuiations. word prediction packages. and
computer access deviccs used in the studies. The major shortfall in the existing body of literature
is that many experirnental studies on word prediction are efficacy studies conducted with able-
bodied subjects in laboratory settings. Clinical information tvas gained mainly from case studies
that were anecdotal in nature.
Two groups of researchers reported improved rates of text mu); with word prediction md
single-switch row-column scanning (Gibler & Childress. 1982: Koester & Levine. 1994). Both
groups used software specifically w-ritten For the experiments. Three able-bodied individuals and
one penon with a disability participated in the study conducted by Gibler and Childress ( 1982).
Four able-bodied individuals were involved with Koester & Levine's studp ( 1994). Gibler et al.
( 1982) reported a 50% gain in the rate of text entry with word prediction. They also noted that
the participant with disabilities found word prediction to be helpful in spelling and reduction of
typoerapiiical + errors. Koester and Lrvine ( 1 994) reported that participants. who practiced using
scanning before being introduced to word prediction. experienced a gain of 8.7% in the rate of
trxt entry with the use of word prediction.
The drvelopers of PAL conducted a number of case studies to evaluate the benefits that
P.AL offered (Xeweli et ai.. 199 1 : Waller. Beattie. & Newell. 1990). Waller. who t u s a member
of the PAL drvelopment team. reponed her experience as a word-prediction user with physical .
disabilities (Waller. et a1.1990). Shs found that her rates of typing were signiticantly better with
the use of word prediction as compared to her previous method of access (abbreviation-
expansion ). Newell and associates ( 199 1 ) conducted nine case studies in a classroom
environment over the entire school Yeuir. The participants had a variety ofdiagnoses covering
Iearning. developmental ancüor physical disabilities. Newell et al. ( 199 1 ) tested rates of text entry
with two of the nine participants. They rcported an ovenll gain in text entry from the
participants' rcsponses to a questionnaire and through interview with the teachers. Dcspite a
positive response. Newell and associates suggested that only children who have problems
riccessing the keyboard would experience the speed advantage of PAL. Consid.ering the time
required for scanning the prediction list. they suggested that for individuals typinp at or above n
typing rate of approximately 10 words per minute (wpm). PAL would not increase typing rates
substantially. However. Nrwell et 31. felt that the improvements in the accuracy of the winen
work from using PAL outweighed this disadvantage.
Lewis and his colleagues ( 1998) compared the usefulness of differeni technoiogy devices
for students with learning disabilities. In their studies. 132 students with Iearning disabilities
participated. Twenty-two students were assigned to the control group who continued to use
handwiting as their means of witten communication. One hundred and ten students were
randomly assigned to tive e.uperimenta1 groups (i.r.. t o r d processin-. keyboarding. alternative
keyboard. word prediction. word prediction with speech output). Al1 students used their rissigned
technology throughout the school year. Lewis et al. ( 1998) reportrd that participants in the
control group hnd the fastest output rates. Arnong the technology user roups. the u-ord
prediction group was the fastest. and the group who used word prediction with speech output was
the slowest. Houever. Lewis et al. did not provide information to dcrnonstnte that the groups
were similar in their typing rates before the study. Therefore. it is difficult to determine if the
faster rates of test entry in the word prediction group were a result of the intenlention. Lewis
et al. ( 1998) also found that students in al1 of the technology groups made fewer spelling
mistakes in post-tests. with the brst accuracy achirvrd by the group who used word prediction
with speech output. Lewis et al. ( 1998) inteniewed the teachers of the participating studrnts for
their views on the usefulness of assistive technology. The teachers indicated that for more
advanced students. word prediction vas distracting and could slow down the writing process
(Lewis. et al.. 1998).
Contra? to the support provided by the above-mentioned studies. a number of
researchcrs reponed slowrr or similar rates with the use of word prediction. Scull and Hill ( 1988)
conducted a study using a single-subject altemating treûtments design to explore the cffect of
word prediction. .An adult with cerebnl palsy participated in the study. Scull and Hill reported no
difference in rates with and without word prediction. They noted that the time saved by reduction
of keystrokes \vas lost by time spent sexching the prediction list (Scull & Hill. 1988). Caves and
colleagues ( 199 1) reported a case study of a IO-year-old male with a C 1 - C I spinal cord injury
who used a single sivitch to access his cornputer. This Young man discontinued the use of word
- prediction after using it for a short time because he felt that he could type a word in less time
than it took to locate and select it from the prediction list. Anson (1993) tested the speed benefit
of word prediction with 18 able-bodied participants. Ten people were assigned to the direct-
typing group. while 8 people were asked to type using an on-screen keyboard. Anson ( 1993)
reponed a drop of 42% in the typing rate for the direct-keyboarding group. but a gain of 8% for
the on-screen keyboard çroup. Eight able-bodied individuals and six people with spinal cord
injuries at levels ranging from C4 to C6 participated in a study conducted by Koester ruid Lsvine
in 1994. The participants used word-prediction sof»vare specially witten for the study. ai th ri
mouthstick or a typing splint. Koester and Levine (1994) reported that rates of trxt entry were
similar with or without word prediction in the able-bodied group. but the participants with spinal
cord injuries rxpenenced a decrrase in their typing rates with word prediction.
In addition to being used as a rate-enhancement tool. word prediction has brrn applird to
help students with learning dit'ficulties with witing. Moms. Nrwell. Booth. Ricketts. and Amott
( 1992) conducted ten case studies but only providrd detailed information on two children in their
report. Both children had physical disabilities (cerebnl palsy. spina bifida and hydrocephalus) as
well as leming difficulties. The authors suggested that use of word prediction improved synta..
in the witing samples of one participant. The participant. who has spina bifida. lost interest in
the use of the software afier a number of trials. therefore. no definitive msult \vas reported on her
(Morris. et al.. 1992). Using single-subject designs. MacArthur studied the effects of word
prediction on witing with students nith leaming disabilities in two studies (MacArthur. 1998:
MacArthur. 1999). The students in both studies were 9 to 10 years old and had similar leaming
profiles. In the fint study. using word prediction software with a small dictionary of 450 words.
Mac.4rthur ( 1998) found that word prediction had a strong effect on the legibility and spelling of
wirten dialogue journal entries for four of the five students. However. word prediction did not

have an impact on the length of writing and rate of text entry. In his second study. a word
prediction package with a dictionary of 2.000 words \vas used (MacArthur. 1999). No
di fferences were found for legibility and spel ling when MacArthur made cornparisons between
direct typing and use of word prediction. He also reported that students wote two to three times
slower with word prediction than with hwdwiting. Analyses of students' use of word prediction
and their spellinç mors suggests that the software is dificult to use because it places substantial
drmands on attention and requires the initial letters of words to be spelled correctly (MacArthur.
1999).
2.3 Percrived Sel f-Efficacy
Self-efficacy theory stated that behaviour is cognitively mediated by the strength of a
person's perceived self-eficacy. Perceived self-efficacy is defined as an individual's assessrnent
of his or her ability to perform behaviours in specific situations (Bandura. 1997). Research has
indicated that perceived sel f-e fficacy is a signi ficant behavioral determinant of actual
performance (Bandura & Adams. 1977: Bandura & Wood. 1989: Toshima. Kaplan. & Ries.
1990: Wang & Richarde. 1987: Wassem. 1992). Most curent conceptual models of hcalth
behaviour includr perceived sel f-cfficacy as a determinant of health-promoting behaviour
( Ajzen. 1985; Bandura 1997: Pender. 1987: Rogers. 1983). I t is postulated that perceived self-
efficacy affect whether people consider chmging their health habits. whether they can rnlist the
motivation and perseverance needed to succeed and how well they maintain the changes they
have achieved (Pender. 1987: Bandura. 1997).
A substantial body of research conducted with adults supports that strong self-efficacy
beliefs are related to a variety of health outcornes (Gechi. Conneil. Sinacore & Prohaska. 1996:

Oman & King. 1998: Rajewski. Ettinger. Martin & Morgan. 1998: Ward. 1993: Wright. Rudicel.
& Feinstein. 1994). Suppon for the link between prrceived self-efficacy and successful
performance in children c m be found in studies of educational outcomes (Schunk & GUM. 1986:
Schunk & Ricc. 1986).
Perceived self-sfficacy is a concept originally developed as part of social cognitive
theory. Social cognitive theorists view hurnan functi~fiiiig as rhe result of triadic reciprocality:
behaviour. internai persona1 factors in the t om of cognitive. affective and biological cvents. and
the rxtemal rnvironment ( Bandura. 1 997). These three major classes of determinmts interact
with each other and intluence one another bidirectionally. The relative influence of raçh of thesr
threr factors varies from situation to situation. tiom person to person. and from rnvironment to
environment. Therefore. perceptions of sel f-e fficacy are not re tlective of a global personah):
trait: rather. rhey va- across different behaviour domains such as physical self-efficacy and
productivity self-rfficacy (Bandura. 1997).
Bandura ( 1977) identificd three parameters of perceived self-efficacy: magnitude.
strength. and generality. Magnitude refers to the relative level of difficulty of the task that is
being rated. Strength of perceived self-efficacy refers to the degree to which people believe the'
cm succeed at a given level of an acti~ity. Generality of perceived self-efficacp refers to the
degree to which the person's perceived self-efficacy for one activity transfers to other similar or
different activities ( Bandura. 1977).
Response efficacy is the belief that performance of a specific behaviour will result in a
specific outcome (Rogers. 1983). Both perceived self-efficacy and response efficacy affect
whether or not the person will elect to perform a cenain activity. Bandura ( 1997) asserted that
people rnay believe that they c m perform an activity (i.e. high perceived self -effcacy). but they
may not believe that performing the activity c m achieve the desired outcornes (Le.. Iow
response-e fficicay ). Improvement in performance c m only be expected if people believe that
they c m perform the activity and that doing so has sorne effect.
.A strong sense of perceived self-efficacy for an acti\.ity is important to successful
performance ( Bandura. 1997). Feeling of mastery heightens perceived self-efficacy and provides
ri source of motivation. Self-discontent with comparative substandard performance lowers
perceived self-efficacy and can lead to termination of the activity (Bandura. 1997). Successful
performance on one activity can result in a strengthening olefticacy rxpectations for other
activities of similar nature ( Bandura. 1 977).
2.4 Summary
Children with spina bifida and hydrocephalus commonlp rrxperiencr difficuities with
rwitten productivity. Wraknesses in oculo-motor control. visuai perception. visual-motor
integrntion and upper cxtrcmity dysfunctions are considered to be the contributing factors to their
handwi ting di fficulties ( Anderson. t 976; Pearson et al.. 1 988: Wills. 1 993). Use of a cornputer
for text generation is a common strategy recomrnended bp occupational therapists to overcomr
the mechanical difficuities with witing (Hunt-Berg et al.. 1994 Stmck. 1996). However. with
reduced finger dexterity. finger agnosia and impaired kinesthetic sensation. children with spina
bifida often have dificulties developing functional typing skills. rspecially in ternis of rate of
text entry (Sandler. 1997).
Word prediction is often recommended by occupational therapists as a tool ro enhance
rates of text entry (Fong-Lee. 1993). However. the effectiveness of word prediction when used as
a rate enhancement tool has not -et been established. Many published studies address this issue.
but the results are equivocal. Researchers recognize that there is a visual-cognitive load
associated with the use of word prediction. therefore the keystroke swing gained from using
word prediction will not translate into an rqual amount of gain in speed. The overd1 efficiency
of word prediction is determined by the balance of keysrroke savings and visual-cognitive loads
(Horstmarin &r Levine. 199 1 : ' IweI l et al. 1992: Soede & Foulds. 1986).
The demand on visual-cognitive skills in using word prediction is a particular important
consideration when working with children with spina bifido as these children commonly
experience difficulties with oculo-rnotor control. perceptual and cognitive functioning (Biglari.
1990. 1995: Dennis et al.. 198 1 : Wills. 1993). Rcsearchers suggest that adjusting the parameters
available on word prediction software might help to lessen the visual-cognitive load. .A
prediction list that is presented venically and contains five words helps to minimize visual search
time (Ncwell et al.. 1992). r\ tixed diction. helps users with the visual searches as they can
anticipate the location of commonly used words on the prediction list (Vanderheiden 8: Kelso.
1987). .A small diction- of about 2.000 words that matches the user's vocabu lû~ may be a
good compromise between keystroke savings and visual-cognitive demands (Gibler 8r Childress.
1982). Children with spina bifida and hydrocephalus who are typicaily slow with visual
scanning. will benefit from the "7-then-search" strategy (Le.. the- type two letters before
scanning the prediction list). The location of the prediction list may also affect the visual search
time. 3s it changes the distance for eye gaze to shifi between the key board. the monitor and the
text rnatenal being copied. Clinical experiences suggested that individuals have their own
preferences for the location of the word prediction list.
Genenlly speaking. researchen agree that word prediction helps to improve accuncy of
wtiting as it removes the mechanical dificuities of spelling (Lewis et ai.. 1998: Newell et al..
199 1 : Newell et al.. 1992). It is a comrnon bclief among rducators and occupational therapists
that individuals whose typing rate is slower than I O or 15 words per minute would brnefit from
using word prediction as a rate enhancement tool (Fong-Lee. 1993: Higginbotham et al.. 1992:
Newell et ai.. 1991 1. To date. no studies have explored the effecriveness of word prediction in
improvinp rate and accuracy of text rntry with chiidren with spina bifida md hydrocephalus.
In addition to using objective data to demonstrate clinical outcomes. Krmper. Cassileth
and Fems ( 1999) recommrndrd that a holistic approach for paediatric outcome research should
include indicators such as impact on cultural identity and perceived self-efficacy. Perceived self-
efficacy is dcfined as an individual's assrssment of his or her ability to pcrform brhaviours in
specific situations (Bandura. 1997). Efficacy beliefs affect whether people can enlist the
motivation and perseverance needed to succeed and how well thcy maintain the changes the!
have achieved. Applyiny the self-sfficcicy theory to children with spina bifida and hydrocephalus
suggests that success with the use of word prediction for copy-iyping leads to an increase in
motivation with the engagement of the activity and a sense of mastery. which c m lend to an
incteasr in perceived performance and satisfaction with performance in other typing tûsks.
2.5 Hypotheses
It is hypothesized that:
1. Use of word prediction will significantly improve rate of text entry.
2. Use of word prediction will significantly improve accurncy of text entry.
3. Rate of text enuy will be significmtly faster when the word prediction list is placed in
the participant's preferred location.
4. Accuracy of test entry will be significantly higher when the word prediction list is
placed in the participant's preferred location.
5. There rvill be a positive change in participants* self-perception of performance and
satisfaction with performance in rvritten productivity tasks after using word prediction.
Chapter Three - Method
A single-subject altemating treatments design (Barlow & Hayes. 1979: Ottenbacher.
1986) was used in the study. The first section of this chapter provides the rationale for using this
design and the considerations in intemal and extemal validity relating to the altemating
treatments design. Ir also describes how the altemating treatments design was applied in this
study. The latter sections describe the sampling strategy. measures. data collection procedures
and data analysis methods used in the study. The last section reports results of the pilot study
conducted to verify the data collection and analysis procedures.
3.1 Research Design
3.1 1 Single Subject Experirnenial Design
Traditionally. researc hers have relied on group and statistical designs to explore treatment
variables and treatment outcomrs (Barlow & Hersen. 1984). The use of group designs make it
possible to use the most well-known powerful designs such as the randomized control trials and
associated statistical tests to evaluate the effectiveness of treatments (Hacker. 1 980). However.
group designs require a large enough samplr from homogeneous groups of subjects to
demonstnte the power of inference (Hulley. Gove. Browner. & Cummings. 1988). The limited
availability of clients with sirnilar types of disabiiities makes it very difficult and often
impossible to use the powefil group designs in paediatric rehabilitation research (Law. King. &
Pollock. 1994). The heterogensity in children with neurological deficits and the small sarnple
size available were the main reasons why a group cornparison approach was impnctical for this
study .

Single-subject experimental designs provide a valid alternative to the traditional group
designs (Kazdin, 1982: Ottenbacher. 1986). These designs enable the researcher to conduct
experimental investigations with one or a small number of participants. In single-subject
research. the participant serves as his/her own control. therefore. it is also called a within-subject
design (McReynolds & Keams. 1983 ). Single-subject research is not the sarne as a case study .
Similar to group designs. single-subject research designs demand caretùl control of variables.
clearly drlineated and reliable data collection. and the introduction and manipulation of onlp one
intervention at a tirne (Bacban . Harris. Chisholm. & Monette. 1997). Single-subjrct research is
particularly suitable for clinical research. It offers some tlexibility to individualize the
therapeutic approach. and it offers an opportunity for in-depth exploration and documentation of
a specitk client. under specific conditions. to the therapeutic intervention (tIackrr. 1980: Law et
al.. 1994: McReynolds & Krms. 1983: Ottenbachrr. 1986). In this study. the use of a single-
subject research design made it possible to individualize the word prediction program to suit the
needs of specific participants. while allowing in-depth explontion and documentation of the
rffect of word prcdiction and the effect of locations of the prediction list on rate and accuracy of
text entry,
3.12 Alternating Treatments Design
Alternating treatments design is one form of single-subject research design. It is well
suited to compare the relative merits of different venions of the sarne intervention. while
allowing cornparison of treatment and no-treatment rffects at the same time (Barlow & Hayes.
1979). Backrnan et al. ( 1997) suggested that the alternating treatmenis design is well suited to
study the effects of assistive tec hnology because use of assistive devices can produce reasonabl y
rapid and clear behaviour changes. In the basic f o m of an altemating treatments design. a
baseline phase is not an absolute requirernent (Ottenbacher. 1986). In a more sophisticated and
powerful altemating treatrnents design. the baseline phase is included (Bachan et al.. 1997:
Ottenbacher. 1986). Such a design is illustrated in Figure 1. This initial baseline phase consists of
a number of measurements taken with the no-treatment conditions (Ottenbacher. 1986). The
baseline information defines the extent to which the participant rrquires treatment. It also senes
as a basis of cornparison for evaluating the rffectiveness of trcatment (McReynolds & Kearns.
1983). In the altemating treatments phase. the participant is exposed to baseline and treatment
conditions one after anothcr in a npidly altemating fashion. The different treatment conditions
and the no-treatment condition are presented to the participant in a random order (Barlow &
Hayes. 1979: Stromgren & Kolby. 1996). After the alternating treatments phase. the no-treatment
data are collected. This strong design permits empirical cornparisons between treatments and
between treritment and no-treatment conditions (Backmm et al.. 1997).
3-13 Intemal Validity
Variables such as history. maturation. testing. instrumentation. and statistical rcgression
are potential threats to the interna1 validity of a single-subject research study (Ottenbacher.
1986). History refers to anp event outside of the intervention that occurs between a set of
observations or measurement such as family crises or the use of a new drug (Kazdin. 1982).
Maturation may be defined as biological. physiological. or psychological changes that occur over
a period of time and are due primarily to growth or adaptation (Ottenbacher. 1986). Testing
refers to "any changes that c m be attributed to the effects of repeated assessments" (Kazdin.
1982. p.78). Statistical regression refers to the tendency of extreme scores to move toward the
means (Kazdin. 1982). In general, intemal validity threats can by controlled by the multiple
application and variation or withdrawal of interventions and by the use of repeated measures
(Ottenbacker. 1986). In an altemating treatments design. the subjects experience each of the
rapidly altemating treatments for an equal amount of time in the s a m r tirne period. thetefore.
variables such as history. maturation and testing would have similar impact on each of the
treatment conditions (Barlow 8: Hayes. 1979: Stromgren & Kolby. 1996). The use of valid and
reliable measures to determine outcome effects can providr adequate controi over
instrumentation (Ottenbacher. 1986).
3.14 External Validity
The primary disadvantage usociated with alternating treatments design is the risk of
multiple treatment interference (Barlow & Hayes. 1979). blultiple treatment interference rekrs
to the fact that the two or more treatments being evaluated may interact in some hshion to
produce an effect that would not be present if any of the treatments iverr appliçd in isolation.
Barlow and Hayes ( 1979) suggest that there are two concerns related to multiple ireatment
interference: sequentiai confounding and cam-over rffects.
Sequential confounding or an order effrct refers to the influence of one treatment on an
adjacent treatment. Counterbalancing or randomized order are common strategies used to control
the order effect (Ottenbacher. 1986: Stromgren & Kolby. 1996). A carry-over effect refers to the
influence on an adjacent treatment. regardless of the overall sequencing. The c q - o v e r effect
c m be divided into two categories: contrast and induction. In contrast cay-over effects. the
performances in the two associated conditions change in the opposite directions. In induction
cany-over effects. the performances in the two associated conditions change in the same
direction (Barlow & Hayes. 1979). There are several possible ways to reduce c q - o v e r effects.
including counterbalancing or randomized order. the use of shon rreatment phases and providing
a separation between the treotment conditions (Ottenbacher. 1986). McGonigle and colleagues
( 1987) studied the impact on different intercomponent interval lengths (ICI) between trearments
on cap-over effects. They conclude that there is no fixed-and-fasr rule as to the appropriate
duration of the ICI. The treatment should be altemated rapidly rnough to establish discrimination
within o reasonable amount of time. and. at the same tirne. alternate slowly enough to avoid
caq-over effects ( McGonigle. Rojahn. Dixon. & Strain. 1987). Even if a11 these points are tden
into consideration. c q - o v e r effects can occur (Barlow & Hayes. 1979). I f data show that one
treatment is more effective than the other. it is desirable to implement this treatment nlone in the
follow-up phase. By doiny so. the rcsearcher cnn assess the effects of that treatment when
administered in isolation. Empirically. the impact of cany-over effects has been s h o w to be
minimal and there is no reason to beiiew that cany-over effects would reverse the relative
position of the two trentments (Barlow & Hrrsen. 1984: Ottenbacher. 1986).
The major weakness of a single-subject research design is that one cannot geneniize the
results beyond the single individual involved in the study. Generalizability of single-subject
research is established through replicating the study directly using other individuals with similar
characteristics. followed by systematic replications of the study across populations. settings and
time. (Barlow & Hersen. 1984: Kazdin. 1982: Ottenbacher. 1986). Barlow and Hersen ( 1984)
offer specific guidelines for conducting a direct replication series in single-subjeci research.
They suggest that (a) the therapist and setting remain constant across replications: (b) the
behavior disorder is topognphically similar across clients: ( c ) client background variables are as
- closely matched as possible: and (d) the procedure is employed unifomly ûcross clients.
Detailed and accurate description of the participants. settings, behaviours and treatments are
important to ensure successful systematic replications of the study (Wolery & Harris. 1982).
3-15 Description of Research Design Lked in this Study
The research design is illustrated in Appendix A. A baselini: was established with
participants typing without the use of word prediction for four days. .At the end of the baseline
phase. word prediction was introduced to the participants in a training session. In the altemaring
treatments phase. the three treatment conditions (word prediction with the prediction list in threr
diffcrent locations: upper right corner. following the cursor and in lower middle edge of the
monitor) and the no-treatment condition were prescnted to the pmicipants in random order each
day. for 1 O days. A shon break of fivc minutes was providrd between treatment conditions.
These short breaks served 3s the intercomponent intends (ICI). .4fter the alternat ing treatment
phase. baseline data were collected for four more days.
3.3 Ethics and Informed Consent
Permission to conduct the study was obtained through Bloonriew klacMillan Centre. The
proposal for the study was submitted to the Research Departmrnt at Bloowiew MacMillan
Centre for scientific review. and was presrnted to the Ethics Committee for ethical clearance
(Appendix B). The Ethics cornmittee approved the Consent Form (Appendix Cl and the .Assent
Form (Appendix D). which described the study to the parentdguardian and to the participant
respectively. All parents/guardian of the participants signed a Consent Form. and the participants
signed an Assent Form prior to taking part in the study.
3.3 Sampling
3.3 1 Sarnple Size
This study includes three direct replications. bringing the total number of participants to
four. Barlow and Hersen ( 1984) suggest that one successful experiment and three successful
replications are required to establish the generality in a series of direct duplication. They fslt that
in the case of mixed results. continuing a direct replication senes indefinitely is not a sound
experimental strategy. A more efficient approach would be to stop after four or tive rcplications
followed by a functional analysis of the failures encountered. I F neither the reliability nor the
generality can be estabiished. the reasons should be analyzed and recommendations should be
made for future studies (Barlow & Hersen. 1984).
3.32 Inclusion Criteria
1. Chronological açe from 10 to I l years. The age range was selectrd brcause witten
productivity becornes increasinglp important around the intermediate and senior
grades in primary school. whrn the frequcncy of note-taking. composition and rssay
tests increase (Reisman. 1993).
2. A primary diagnosis of spina bifida and hydrocephalus confirrned by medical records.
with the lesion at a low thoracic b e l (Ti:) or below.
3. Living in the Greater Toronto area.
4. Rate of handwriting and rate of typing slocver than the average rate of handwiting for
the participant's academic gade.'
' Writing speeds o f children (letters per minute) : gnde 3 (25). gnde 4 (37). gnde 5 (47). gnde 6 (57). gnde 7 (62). grade 8 (73) (Phelps et a[.. 1985) -
5. Verbal intelligence scores of 80 or above as reported in the psychologicai record.
Verbal intelligence scores are considered to be better predictors for academic
achievements than full scale IQ scores (Lollars. 1993: Tew. 199 1 ; Wills et al.. 1990).
As this study focus on written productivity. a score of 80 is required to make sure that
participants are competitive in education (McLone. 1992; Murley and Bell. 1994).
6. Ability to read at the minimum of grade three level as confirmed by educational
assessment tindings or school report.
7. English as tirst language.
3.33 Exclusion Criteria
1 . Identified to have low vision or blindness by an ophthalmologist.
7. Currently using adaptive devices such as an on-scrren keyboard or switches to control
the cornputer.
3. Currentlp using word prediction.
4. Malfunctioning shunt two weeks pnor to commencement of the study. Thc symptoms
indicating shunt mal function include persistent headac he. an obnormally rnlarged
head. deteriorathg mental function. blurred vision or brief episodes of vision loss.
and an increased frequency of seinires (Sekhar. Moossy. & Guthkelch. 1982).
5 . Shunt infection two weeks prior to commencement of the study.
3 -34 Recruitment S trategy
Al1 clients of the Communication and Writing Aids Service and the Spina BifiddSpinal
Cord Program at the Bloorview MacMillan Centre who met the selection critena were invited to
participate in the study. A review of the client database genented a potential sampling pool of 15
candidates. Potential participants were randomly drawn from the pool one at a time. The
investigator mailed a letter of invitation (Appendix E) to the parent/guardian of each potential
participant to seek their consent and the participant's assent to participate in the study. The
Consent Form and the Assent Form were sent with the letter of invitation. The investigator called
the family one week afier the invitation letter was mailed to follow up and to ensure informed
consent. The process was reprated until the required number of participants had bern recruited.
Due to a variety ofreasons. many candidates could not participate in the study. Al1 15 candidates
in the sampling pool eventually recrived a letter of invitation. A total of seven candidates agrxc
to participate in the study. Two candidates withdrew from the srudy a îèw d q s brforc the
commencement of the study because of a hospital admission or illness in the family.
3.4 Computer Hardware and Software
3.4 1 Computer Hardware
A Toshiba Trcra notebook computer wirh a Pentium 166 MHz processor and 6JMB
RAM was used for the study. The display setting on the computer was set at IO24 X 768 pixels.
16 bit high colour and large fonts. A Sony SVGA I5"monitor and an AST standard 1 O1 -key
keyboard were set up on the workstation at the participant's home. but the notebook computer
w a s not left with the participant. The monitor and the keyboard were comected to the notebook
computer at the beginning of each day in the cxper-iment.

3.42 Word Prediction Software
A feature comparison was done in the planning stage of this study (May. 1999) to
identi- suitable word prediction sofware to be used in the study. Parameters important for
reducing visual-cognitive loads in the use of word prediction software were used as critena for
comparison '. These criteria included support for a five-tord vertical display and tlexibility in
placement locations of the prediction list . The four most common word prediction software
packages (i.e.. i\uronG. ~ o : ~ r i t e ? " . K ~ R E P ~ . T'cxt~el~'"') available on the Windows
platform were compared (Aurora. 1997: Co: Writer. 1998: Key REP. 1998: TextHelp. 1999).
Details of the comparison are provided in Table 1. KeyREP \vas selrcted because it was the only
product that allowed the prediction list to br placed in al1 of the trsting locations.
I i i an effort to control the confounding factors that may affect the eftkctivenrss of word
prediction. suggestions in the literature with regard to minimizing the visual-cognitive loads
were adopted to set the parameters on KeyREP. Thrsr: include display options. customization of
the prediction lrxicon and searching strategy j. The prediction list on KryREP was prograrnmed
to display five w r d s venically. I t was also modified so that no word would be displayed until
after the second letter tvas typed. This was implemcnted to ensure that participants usrd the "2-
then-search" strritegy. KeyREP provides four pre-stored dictionaries: dementa-. intermediate.
senior and general. The dictionaries are intended to be used by individuals ofdifferent ages. The
elemrntary dictionary is for children aged 6-8. the intermediate dictionary is for children aped 9-
II. the senior dictionary is for Young people aged 15- 18. and the genenl dictionary is intended to
be used by adults. A new prediction dictionary was created for the study. The dictionary
' Parcuneten important for reducing visual-cognition loads are discussed in Chapter 2. Literature Review. Refer to p. 30-32 for a s u m m q of the discussion. ' The possible etTect of searching strategies are discussed in Chapter 2, Literature Review. Refer to p. 30-32 for a sumrnap of the discussion.
contained al1 of the words in the copy material that \vas used in the study. It also matched the
minimum reading level (i.e.. grade 3) for the study. The dictionary was created by importing the
copy material into the elementary diction-. Originally. the elementary dictionary consisted of
1.928 words. As two-letter words were not needed in a "3-then-search" strategy. al1 ?-letter
words were deleted leaving a total of 1.888 words. Afier the copy material \vas imported. the
dictionary contained 2.245 words. Forty-five words with the lowest frequency (Le. frequency = l )
that were not in the copy material were deleted to create a 2.000-word diction ary.
Two raters independently typed with KeyREP to determine the keystroke saving ratio of
KeyREP with the new dictionary. The ratio was detemined by dividing the number of
keystrokes required to type a paragraph with Key REP by the number of keystrokes required with
direct typing. The computed value was then subtracted from one to derive the keystrokc swing
ratio (Higginbothm. 1993: Venkatagiri. 1994). The copy material consisted of 50 paragnphs of
text. each containing about 100 words. To determine the keystroke savings. cach rater typed a
random sample of 1 5 pangraphs (i.e.. 30% of the copy material) using the "2-then-search"
strategy The average keystroke savings \vas found to be 37.2%. with the range between 35.2%
to 4 1 3% (SD = 2.4). Inter-rater agreement was 98.7%. The resul ts showed that although the "7-
then-search" strategy reduced the keystroke savings. the overall keystroke savings with the new
dictionary was within the average range reported in the literature (Higginbotharn. 1997).
3 -43 Word processing sotiware
Measures. a simple word processing software package with built-in timing features and
links to Microsoft Word 97 'and Microsoft Escel 97? \vas provided by the kiicrocomputer
' Copy material is dcscribed in Section 5.5. p. 45.
Application Prograrn of Bloorview MacMillan Centre (Birch. 1999). The software began timing
when the participant typed the first letter. and the sofhvare stopped accepting keystrokes at the
end of five minutes. At the end of the five minutes. the software saved the keystroke count into a
Microsofi Excel file. which contained formulae for calculation of the text entry rate '. The typed
text was automatically saved as a rich text file. The use of electronic timing and calculation is to
control for potential mors in manual timing and calculation. and thus improves the reliability of
the data.
3.5 Copy Material
For the copy tasks. the story entitlcd "Cam Jansen and the Triceratops Pops Mystery"
was used (Adler. 1995). The story was classified as grade 3 reading material using Fry's
Readability Test (Fry. 1977) and Flesch-Kincaid readability information available in Microsoft
Word 97? The story was pnnted double-spaced in 18 point Anal font for easy reading.
3.6 Measurernent
3.6 1 Kump's Directions for Scoring Typing Tests
In 1997. Kurnp detailed directions for scoring typing tests on a typewriter or a computer.
Kump's s c o h g method applirs to educational settings and is most appropriate to use with a
sample population who are school-aged children.
Gross Rate of Trxt Entrv. The gross rate score was obtained by determining the total
number of keystrokes typed in 5 minutes. Al1 letters. numbers. punctuation. tab keys. enter
Keystroke counts and ntes of text entp are counted according to Kump's directions for scoring typing tests. Details are explained in section 3.6 1 . p.45.
keys. and spaces were counted as keystrokes. The total number of keystrokes was divided by 25
to derive the rate of text entry. The reporting unit was words per minute (wpm).
Accuracv of Text Entrv. Kump (1992) provides very detailed scoring keys for rnarkinp
errors in the typing sarnples (Appendix F). The number of correct keystrokes was derived by
subtractinç the number of mors from the total number of keystrokes. The percent accuracy was
calculated from the number of correct keystrokes over the total number of keystrokes and
multiplied by 100.
Error-Adiusted Rate of Text Entrv. The total number of correct Lystrokcs kvas dividrd
by 25 to derive the error-adjusted n ie of text entry. The reporting unit. again. was wpm. The
error-adjusted rate represents the true productivity with typing after correction of errors. I t is
therefore the rate that is commonly reported in a standard typing test (Kump. 1991).
3.62 Canadian Occupational Performance Measurcs (COPM)
In this study. the COPM was used as a measure of functional self-sfficacy. The COPM is
a standardized outcome mesure with a semi-structured interview format and structured scoring
method CO: ( 1 ) identify and prioritize occupational performance issues in one or al1 three
purposes of occupation: self-care. Icisure and productivity. (2) evaluate sel f-perception of
performance and satisfaction relative to idrntitied issues. and (3) measure changes in client's
perception of hisher occupational performance over time (Law. et al.. 1998). A number of
studies report that the COPM demonstrates good test-retest reliability (Baptiste. et al.. 1993:
Law. et al.. 1990) and content validity (Bosch. 1995: Law. et al.. 1997: Law. et al.. 1998: Pollock
& Stewart. 1998). Evidence of criterion and construct validity (Chan & Lee. 19997: Law. et al..
1994; Mahurin. Bettignies & Pironolo. 199 1 : Wilcox. 1994) and responsiveness of the COPM is

also provided (Mew & Fossey, 19%; Toorney. Nicholson & Carswell. 1995; Wilcox. 1994). The
COPM has been used with clients across developmental Ievels. with a variety of disabilities and
different treatment interventions including assistive technology (McColl. Paterson. Davies.
Doubt. & Law. 1000. Reid. Rigby & Ryan. 1999). The COPM uses three 10 point rating scales
to rate importance. performance. and satisfaction. A score value o f ' 1 ' refcrs to a low rating. i.e.
'not important at all'. Onot able to do at dl'. 'not satistied at dl ' . A score of value of ' 1 O' refers
to a high rating. i.e.. 'extremely important'. 'able to do i t extremely well'. 'extremely satistied'.
Mean performance and satisfaction scores are denved by summinp the ratings across problems
and dividing by the total number of problems.
3.62 Dcvelopmental Eys blovement Test (DEM)
The DEM was used in this study as a descriptive measure. The DEM is a clinical tool
designed to masure saccadic eye movements related to reading (Richman &: Garzia. 1987).
Information on eye movement skills is important to collect as thrse skills may affect participants'
abilities to use word prediction effectively (Koester 8: Lrvine. 1996). It was necessary to
adrninister the DEM to describe the eye movcment skills of the participants because this
information is not readily accessible in the medical record. A number of studies provided
rvidence supporting the rel iability and validity of the DEM (Garzia. Richman. & Nicholson.
1990: Kulp & Schmidt. 1998). Complete guidelines for administration and scoring of the DEM
are contained in the DEM manual. The DEM consists of two sets of vertical column arrays of
numben (Subtest A and Subtest B: Appendix G) and a scattered arny of numbers in horizontal
rows (Subtest C: Appendix H). The participants were timed for speed on reading the numbers
and evaluated for any errors (omissions. additions. transpositions. and substitutions). The time
score of each subtest is adjusted by the number of errors. The vertical score is the sum of the
error-adjusted time score of subtest A and B. The horizontal score is the error-adjusted time
score of subtest C. A ratio score was calculated by dividing the vertical score with the horizontal
score. The vertical score, the horizontal score and the ratio score are used in combination to
determine the presence md the type of oculo-motor deficits. Normative data for percentile score
are available for children aged 6 to 13 years (Richman & Garzia. 1987). Gnffin. Christenson.
Wesson. & Erickson ( 1997) found that after age 13. only limited additional improvement c m br
expected in performance on the DEM test. Therefore. rven though noms are not available for
children older than 13. this test can be used with adolescents and adults (Scheiman. 1997).
3.64 The Children's Handwriting Evaluation Scale (CHES)
CHES was used as a qualifyinç test to assess the handwiting abilities of the participants.
CHES is a commonly used clinical tool. which was developed to rvaluate speed and quality of
handwiting (Phelps. Stempel. & Speck. 19853. Preliminq reliability and validity of CHES has
been established (Phelps. Stempel. & Speck. 1984). The CHES manual providcs detailed
euidelines for the administration and scoring on speed and quality of handwiting (Appendix 1). C
Normative data on witing rate are provided for children in grades 3 through 8. Quality score is
provided according to five standards: letter forms. slant. rhythm. space and genenl appearance.
The percentile scores of witing rate and the quality scores of the participants are reponed.
3.65 Behaviour Checklist
The Behaviour Checklist (Appendix J) was used to monitor behaviour during the
esperiment as a means of ensunng validity when interpreting results. it [vas developed as a result
of the pilot study indicating the need to monitor behavioural factors such as pain. attention. and
motivation that may affect the rate and accuracy of text entry. The Behaviour C hecklist was
adapted from UAB Pain Behavior Questionnaire and Child Behavior Checklist (Richards.
Nepomucleno. Riles. & Suer. 1982; Taylor. 1999). Four occupational therapists with minimum 2
pears of experience in assistive technology were consulted on the initial drafi of the checklist
regarding the relevance and clarity of the items. As a result of these consultations. minor changes
were made in content. The Behaviour Checklist was then pilot-tested with 10 children with
disabilities aged between 6 to 17 (M = 12.7). They were 4 girls and 6 boys with different
diagnoses including head injury. upper limb amputations. rheumûtoid arthritis. cerebral pals).
pervasive developmental disorder. congenital viral infection. motor dysprasia and attention
deficit disorder. The results of the pilot test indicate that items on the Behaviour Chrcklist were
adequate in capturing behaviour relatcd to pain 1 discornfort or difficulties in attention while the
children used cornputer technoiogy.
3 -66. Dernographic Information Form
The demographic information of the participants \vas collected using the Demographic
lnfonnation Form (Appendix K). Detailed and accurate descriptions of the participants are
nrcessary to ensure successful replication of the study (.Wolery & Hams. 1982).
3 -7 Data Collection Procedures
i\fter verbal consent for participation was received. demognphic information on the
participants was collected from medical records and psychological records using the
Demognphic Information Fom.
%e pilot study is descnbed in Section 3.9. p. 55.
Participants were visited at home. The investigator requested al1 families to provide a
room or a quiet area for the experiment to be conducted in the home. so that distraction would
be kept to a minimum.
Pre-baseline. On the first day of the study. a cornputer workstation was set up for the
participant according to ergonomie principles (Claiborne. Powell. & Rey nolds-Ly nch. 1 999).
Participants who were wheelchair dependent remained in their wheelchairs. Ambulatory
participants were seated upright in a chair with their hips and knees flexed at approiiimately 90
degrer or as allowed due to orthopaedic constnints. Participants' feet were supportcd on the
floor or with a footstool. The monitor was positioned at a distance 12 to 20 inches from the
participant's eyes. The top of the monitor was adjusted so that it was at or slightly below the eye
Irvel of the participant. The keyboard was adjusted to slightly below elbow level so that the
participants could type with their elbows at about 90 degrees and their wrists in the neutral
position. The copy material was placed betwern the monitor and the kryboard (Figure 7).
For participants whose handwriting and typing rates had not been tested in onc year prior
to the commencement of the study. a witing test using CHES and a typing test using blessures
were administered to confirm that inclusion criteria were met. In administering CHES. the
sarnple passage was read to the participants. then the participants were instructed to copy the
sample passage. They were asked to wi te as they usually do. and to wite as well as they could
for two minutes. 1 f the participant completed the passage before two minutes has elapsed. he/she
would be asked to start from the beginning and keep copying until he/she was asked to stop. For
the typing test. the participants were asked to copy type for five minutes using the Mesures
program.
Once inclusion criteria were confirmed. the COPM and DEM were administered. In this
study. the COPM was used in a modified fashion. focusing on the domain of productivity.
During the COPM interview. participants were asked to identi. witten productivity tasks that
they were expected to do. nreded to do. or wanted to do in a typical day. The participants were
euided to discuss details of the tasks in order to focus on the aspects of the task that were C
difficult for them. Once tasks w r e identified. participants rated how important each task was to
them using the 1 O-point importance rating scale. Consequently. the participants were asked to
rate their current performance with each task and their satisfaction with performance on the 10-
point rating scales. In administering the DEM. participants were asked to read the numbers from
top to bottom. column by column in subtest 4 and B. and to read the numbers from le fi to right.
row by row in subtest C. Participants were not allowed io use their fingers to guide their reriding.
The time required to read each subtest was recorded.
Badine phase. On each of the four days in the baseline phase. participants were asked to
type as they usually do and as accurately as they could for tive minutes.
Training dav. On the day following the baseline phase. training on the use of word
prediction was provided. Participants were introduced to the concept of word prediction with the
prediction list in the lefi upper corner. They were instructed to type two letters before looking 3t
the prediction list. and io use the prediction list for cornpletion of words as much as possible.
Training was considered completed when the participants couid consisteiitly use word prediction
for the completion of 10 consecutive words without the investigator providing any verbal
prompts. On average. training took about an hour to complete.
.Mtematina treatment ohase. On each day in the altemating treatments phase. participants
were asked to type for a total of four five-minute sessions: direct typing \kithout word prediction
and with word prcdiction at the tlircc testing locations. At tlic bcginning of cadi day. participants
were asked to draw frorn an envelope a piece of paper listing one of the 24 possible
arnngements of typing conditions (Le.. the total possible combinations Cor four treatrnent
conditions). The tliree ivord prediction conditions and the direct typing conditions were tested in
the arrangement selected. A Srninute break was provided between each testing session. At the
end ofeach day. participants were asked to rank the three locations for the prediction list in order
of preîèrence.
A rcinfbrccmcnt systcni wris uscd in tIiis phase io promotc and mainiain participants'
pcrformance. The reinlorcement system intdved giving a sticker to the participants wiien they
demonstrated good effort in a typing session. Tlie number of checkmarks on the Behaviour
Checklist was uscd to de fine "yood effort". This number was individualized using baselinc
observation as a guideline to ensure that i t ivas attainable. A variable interval schedule of
reinforcement (Schunk. 199 1 ) wos used io provide rewards for good efforts. The time betwcen
the reinforcements was varied around an average of 2 days. On the reinforcement day, the
participant received a MacDonald meal coupon as a reward. Participants were reinforced for
their efforts in al\ four treatment conditions (Le.. no word prediction and the three word
prediction condition) in the alternating treatment phase.
After the last session on the last day of tIic alternating treatrnents phase, the COPM was
re-dministered. Participants were asked to rate their performance and their satisfaction with
performance on the written productivity tasks they identified in the pre-baseline day using the
1 O-point performance and satisfaction rating scales.
Follow-up phase. In each of these four days. the participants were asked to type for five
minutes without using word prediction.
3 -8 Data Analy sis
Analysis of single-subject data traditionally involves visual inspection of graphed data
(Wolery & Harris. 1982). Raters use visual inspection io compare the magnitude and pattern of
data in the different phases and during the altemating treatments phase (Ottenbacher. 1986:
Wolery & Harris. 1987). Visual inspection focuses on graphic characteristics such as trend.
slope. level. percentage of overlap. and variability (Barlow & Hersen. 1984). These graphic traits
are assessed singiy and in combination to determine whether the intervention resuited in a
significant change in outconles (Ottenbacher. 1986). Typically. analysis of single-subject data
involves first establishing the stability of the baseline. Hotvever. the stability of baseline is not a
requirement for an altemating treatments design because inferences on intervention effects are
made by cornparhg data in the altemating treatments phase. The validity of in ferences is usually
not threatened by an initial baseline trend or variability in baseline data in an altemating
treatments design (Barlow 8: Hersen. 1983). The baseline data serve as referencrs for
compûrison in the altemating treatments phase. Follow-up data are used for obsen-ation of no-
treatment effects rifter d l interventions are removed (Bachan et al.. 1997).
Researchers have identified inconsistency associated with visual analysis and
recomrnended statistical analysis to be used as an adjunct to visual analysis (Marbst. Ottenbacher.
& Harris. 199 1 ; Kazdin. 1982; Kratochwill & Levin. 1992: Nourbrikhsh 6- Ottenbacher. 1994).
Statistical analysis is particularly useful when changes appear to be small on visual inspection
(Kazdin. 1987: Ottenbacher. 1992: Wolery Br Harris. 1982). Conventional parametnc statistical
measures such as the t and F tests assume normal distribution of the population and independrnt
data (Pagano & Gauvreau. 1992). Single-subject data violate these two assumptions. therefore t
and F tests cannot be used in single-subject research. On the contrary. randomization tests make

no assumption about the distribution or the data and are therefore recommended to be the
appropriate tests to use for N= 1 experiments (Kazdin. 1976: Kratochwill & Levin. 1992:
Ludbrook & Dudley. 1998). Performing randomization tests involves rearranging the data and
calculating the necessary statistics such as the t or the F statistic for each permutation. The
proportion of the test statistics that are as large as the obtained value is the significance or
probability value (P-value: Edgington. 1995). Whrn the nurnber of data assignments is so large
that it would be impractical to calculate the test statistics for all possible permutations. a random
procedure can be conducted to approximate the P-value. The minimum number of permutations
required for approximation is 100. with 5.000 to 10.000 permutations being recommended for
scienti fic reportinp (Edgington. 1995).
In this study. a randomization test wvas performed by using a repeated-mesure analysis of
variance F as n test statistic to examine if there was any difference in the means of the four
conditions being compared in the altemating treatments phase. The significance of F was
determinrd by a random procedure with 5.000 permutations as the nurnber of total permutations
waas over 100.000. The a level was set at 0.05. The F statistic cm only be used to test ifthrre is
n significant differencr arnong the means of the different conditions. To be able to test the
specific hypothrses in the study. multiple cornparison procedures had to be performed. To test
Hypothesis one and two. pair-wise randomization tests were performed by using a paired
t-statistic to compare the rates and accuracy of text entry without word prediction ul th each of
the word prediction conditions. As three comparisons were made. the significmcr level was
adjusted using the Bonferroni correction (Pagano & Gauveau. 1992). The adjusted a was 0.05G
= 0.0 167. The adjustment \vas necessary in order to reduce the risk of committing a Type 1 error.
To test Hypotheses three and four. pair-wise randomization tests were performed by using a
paired t-statistic to compare the rates and accuracy of text rntry between the participant's
preferred Location and the other two locations. The adjusted a with Bonferroni correction was
0.05/7 = 0.03. The significance of t in individual participant's data was determined by running
the paired t-tests on al1 of the 1.024 permutations. In analysis of the group data. a random
procedure with 5.000 permutations \ a s used as the number of total permutations was over
100.000.
To test Hypothesis five. COPM scores at the beginning of the study and at the end of the
altemating treatments phase wrre compared to assess whether a trial of word prediction
influenced the participants' perception of their performance and satisfaction with written
productivity tasks. A change score of two was considered clinically significant (Law et al..
1994). The mean COPM scores before and after introduction of word prrdiction werr compared
using randomization tests. The use of t-tests was not appropriate becaux of the smali simple sizc
(Ludbrook & Dudley. 1998).
The drmognphic information and the pre-baseline test results were cornpiled and
rcported descriptively. Statistical significance. clinical significance and the participant's
perception of the rffect of word prediction wrre considered in the tinal analysis of the
rspçrimental data becouse an intervention is only effective if it is perceived by the participant as
being important and useful (Wolery & Harris. 1982).
3.9 Pilot Studp
A pilot study was conducted with one participant to test the data collection procedures
and data analysis methods of the study. In order to preseme the number of candidates available
for the main study. the pilot study was initially intended to be conducted with a Young person
slightly older or younger than the specified age (10-14) for the main study. Due to recruitment
difficulties. the pilot participant was randomly drawn from the list of candidates for the main
study.
The pilot piirticipant took part in the study following the above-mentioned procedures.
except that no reinforcement system was used. The results of the pilot study are presented in
Appendix L. The findings from the pilot study supported that the data collection procedures and
the data analysis rnethods were appropriate. The need for rwo additional measures were indicated
- when interpreting the pilot results. The14 were the Brhliviour Checklist ' and a Pain Scale. The
Behaviour Checklist was necessary to help explain the variability in the data. The participant in
the pilot study complained of pain in his neck when he used word prediction. rspecially when the
prediction list was in the upper right corner. To be able io measure the lrvel of pain. the Pain
Scale developed by Abu-Saad in 1981 was adopted and pilot tested with I O children ( Abu-Saad.
1984). However. the Pain Scale was not used in the main study. as none of the other children
experienced pain during the study.
In the pilot study. the participant appeared to lose interest in using word prediction
starting around Day 6 in the altemating treatrnents phase. In order to promote and maintain the
motivation of the participants in the main study. a token reinforcement system ' w s introduced.
The token reinforcement system was designed based on learning theories. which suggest that
rewards c m help drvelop skills and interest when they are informative of one's capabilities
(Schunk. 199 1 : Walter & Marks. 198 1). Extensive research exist to support the idea that offering
children rewards based on pre-defined conditions on performances during an instructional
program increases self-efficiency. motivation. and ski11 acquisition (Devers. Bradley-Johnson. &
' Section 3.65 . p.48. s Section 3.7, p.49.
Johnson. 1994; Pavchinski. Evans. & Bostow. 1989: Workman. Workman. & Maclin. 1979). The
reinforcement system was only used in the altemating treatments phase. Not using the
reinforcement system in the baseline and in the foilow-up phase ensured that baseline
performances were established. and withdrawal effects could be observed.
Chapter Four - Results
This chapter is organized into five sections. The first four sections describe each
participant and hisiher experiences in the study. The last section summarizes the results and
presents them in relation to the hypotheses. Selected characteristics of the participants. the pre-
baseline results. and the summary statistics are tabulated. The results of the study are plotted on
line graphs for visual analysis. Results of statistical analyses are also reported.
4. Participant One
4.1 1 Background Information
Participant characteristics. Participant One (P 1 ) was a 1 O-year-old girl with the diagnosis
of S rnyelomeningocrle, hydrocephalus with VP shunt and Strabismus. Relevant charxteristics
of P 1 are presented in Table 2 . Other deficits reported in the medical record include di fticulties
in maintaining attention to tasks and visual perceptual difficulties especially in the area of visual
memory. form constancy and figure-ground perception. P 1 hûd very limited access to her
mother's computer at home. At school. she only used the computeo in the library for games.
Senine. P 1 lived in a small apartment. The experiment took place in the dininp xeo . The
computer was set up on the dining table. P 1 's mother was always present in the apanment and
often talked on the telephone. Due to the srna11 size of the apartment. the telephone conversation
could be heard clearly in the dining area.
4.12 Pre-baseline ResuIts
Pre-baseline test results are presented in Table 3. P 1's handwiting and typing skills were
not assessed. bscause hrr skills had been assessed by her occupational therapist three months
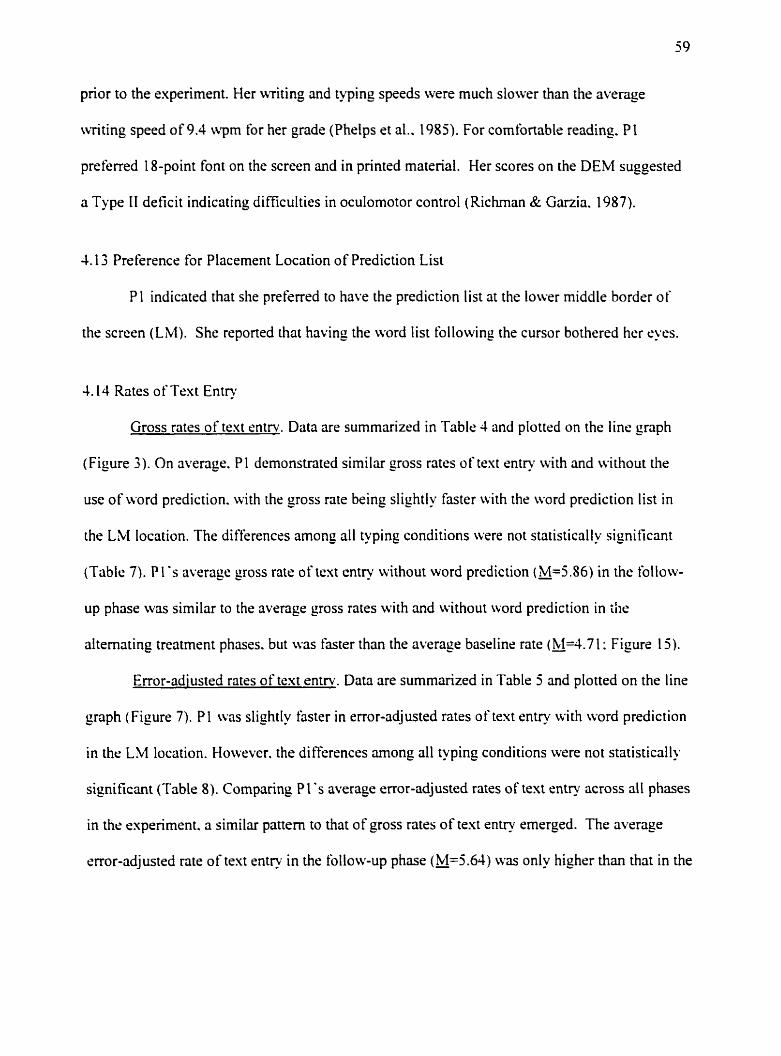
prior to the expenment. Her writing and typing spseds were much slower than the average
witing speed of 9.4 wpm for her grade (Phelps et al.. 1985). For cornfortable reading. P l
preferred 18-point font on the screen and in printed material. Her scores on the DEM suggested
a Type II deficit indicating difficulties in oculomotor control (Richman & Garzia. 1987).
4.13 Preference for Placement Location of Prediction List
P l indicated that she preferred to have the prediction list at the lower middle border of
the screen (LM). She reponed that having the word list following the cursor bothered her sues.
4.14 Rates of Text Entry
Gross rates of text ente. Data are summarized in Table 4 and plotted on the line graph
(Figure 3). On average. Pl demonstrated similar gross rates of text entry with and witliout the
use of word prediction. with the gross rate being slightly faster cvith the word prediction list in
the L M location. The differences among al1 typing conditions were not statistically significant
(Table 7). P 1's average gross rate of text entry without word prediction (1=5 .86 ) in the follow-
up phase was similar to the average gross rates with and without word prediction in die
altemating treatment phases. but was faster than the average baselinr rate (o=4.71: Figure 15).
Error-adjusted rates of text entrv. Data are sumrnarized in Table 5 and plotted on the line
graph (Figure 7). Pl was slightly faster in error-adjusted rates of text entry with word prediction
in the LM location. Howrver. the differences among al1 typing conditions were not statistically
significant (Table 8). Cornparing P 1 's average error-adjusted rates of text e n t e across all phases
in the expenment. a similar pattern to that of gross rates of text entry emerged. The average
error-adjusted rate of text entry in the follow-up phase (-5.64) was only higher than that in the
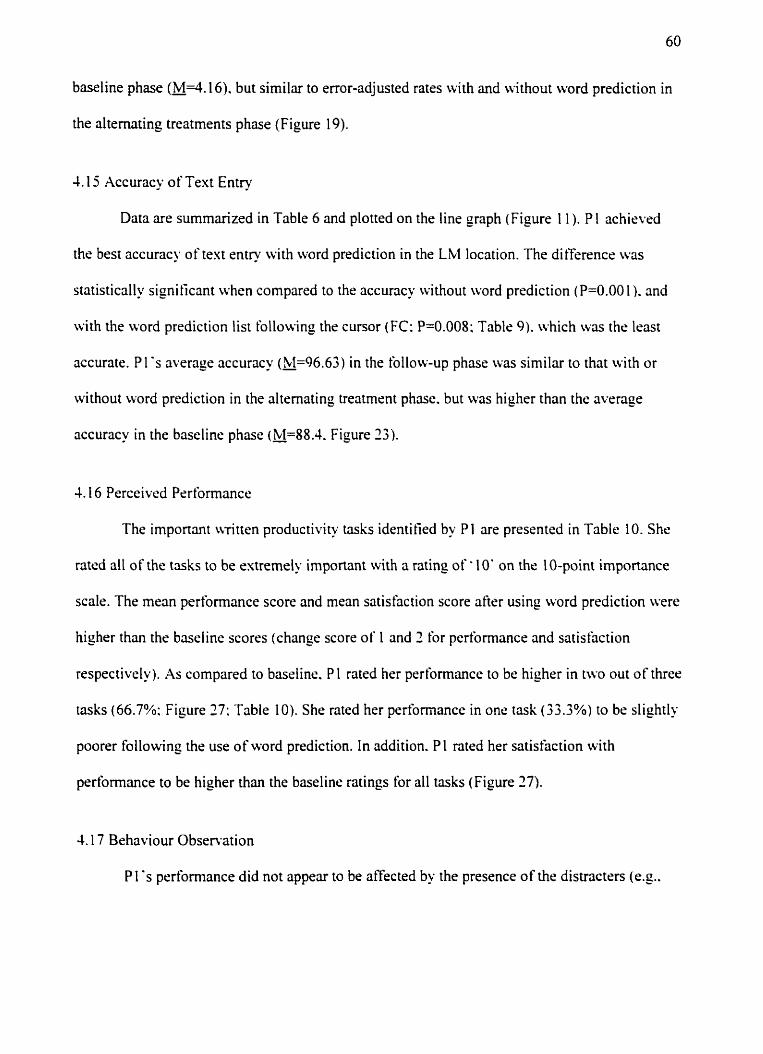
baseline phase (M=4.16). but similar to error-adjusted rates with and without word prediction in
the altemating treatments phase (Figure 19).
4.15 Accuracy of Text Entry
Data are surnmarized in Table 6 and plotted on the line graph (Figure 1 1 ). P I achirved
the best accuncy of text entry with word prediction in the LM location. The difference was
statistically significant when compared to the accuracy without word prediction (P=O.OO 1). and
with the word prediction list following the cursor (FC: P=0.008: Table 9). which was the lrast
accurate. Pl's average accuracy (-96.63) in the follow-up phase was similar to that with or
without word prediction in the altrrnating treatmrni phase. but was higher than the average
accuracy in the baseline phase (O=88.4. Figure 23) .
4.1 6 Perceivcd Performance
The important witten productivity tasks identi tied by P 1 are presented in Table 10. She
rated al1 of the t s k s to be rxtremely important with a rating of * 10' on the IO-point importance
scale. The mean performance score and mean satisfaction score after using word prediction were
higher than the baseiine scores (change score of 1 and 2 for performance and satisfaction
respectively). As compared to baseline. PI rated her performance to be higher in two out of three
tasks (66.7%: Figure 27: Table 10). She rated her performance in one task (33.3%) to be slightly
poorer following the use of word prediction. In addition. PI nted her satisfaction with
performance to be higher than the baseline ratings for al1 tasks (Figure 27).
4.17 Behaviour Observation
PI 's performance did not appear to be affected by the presence of the distracters (e.g..
presence of younger children. telephone conversation). At times. P 1 had difficulties in
maintaining attention to tasks. but she responded well to the reinforcement strategy.
4.2 Participant Two
4.2 1 Background Information
Participant characteristics. Participant Two (Pz) was a 12-year-old girl with the diaenosis
of Tl? myelorneningocele. hydrocephalus with VP shunt. thoracolumbar scoliosis. Strabismus
and Nystagmus. She had a history of meningitis at the age of one and a number of shunt
revisions in the early years. Relevant characteristics of P7 are presented in Table 2. Visual
perceptual deficits in the area of visual memon. form constancy and tigure-ground perception
were reportrd in the medical record. P3 requirrd corrective lrns for reading. She recrived some
keyboarding training at school and had her OWI computer at home.
Settinq. P2 lived in a detached house. The espcriment took place in the dining room. The
computer was set up at a cornputer workstation. The environment was mostly quiet with
occasional noise from the Young children fussing in the family room.
4.22 Pre-baseline Results
Pre-baseline test rrsults are presented in Table 3. P7 typed using both index tingers. Her
witing and typing speeds were much lower than the average witing speed of 12.4 wpm for her
grade (Phrlps et al.. 1983). For cornfortable reading. P2 preferred 18-point font on the screen and
in pnnted material. Hrr scores on the DEM suggested a Type IV deticit indicating difficulties in
automaticity and oculomotor control (Richman & Garzia 1987).
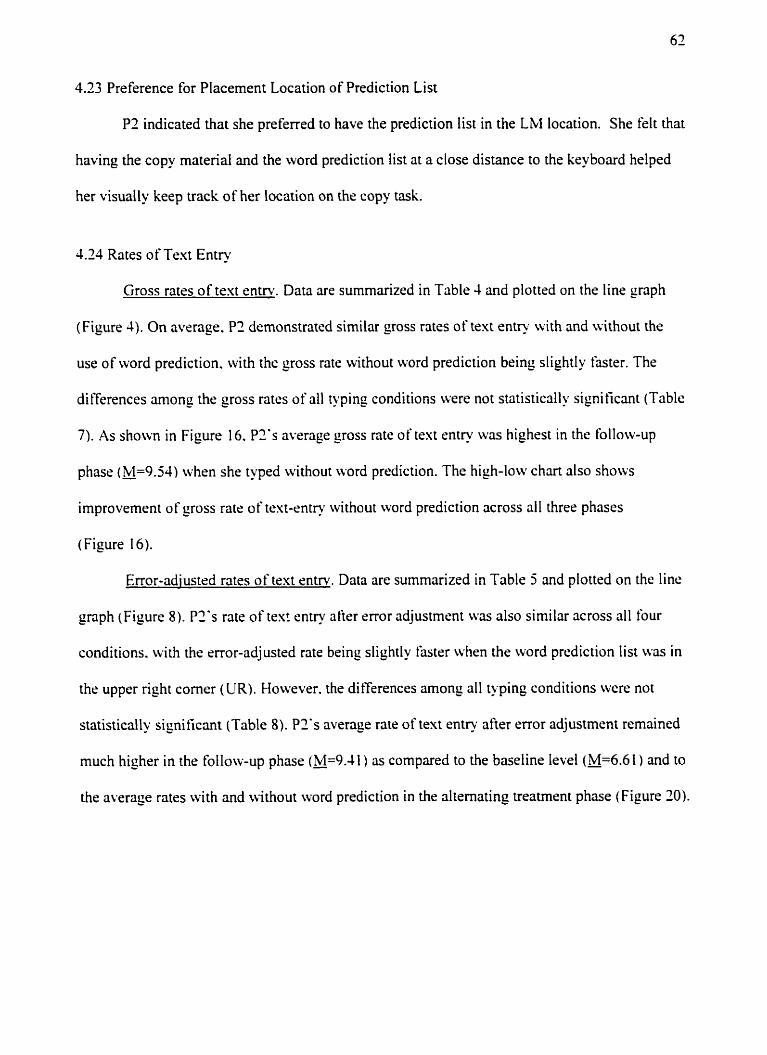
4.23 Preference for Phcernent Location of Prediction List
P3 indicated that she preferred to have the prediction list in the LM location. She felt that
having the copy material and the word prediction list at a close distance to the keyboard helped
her visually keep track of her location on the copy task.
4.24 Rates of Text Entry
Gross rates of text en tp . Data are summarized in Table 4 and plotted on the line gnph
(Figure 4). On average. P2 demonstrated similar gross rates of text entry with and without the
use of word prediction. with the gross rate without word prediction being slightly faster. The
differences amon- the gross rates of al1 typing conditions were not statistically significant (Table
7). As shown in Figure 16. P7's average gross rate of text entry was highest in the follow-up
phase (hJ=9.54) when she typed without word prediction. The high-low chart also shows
improvement of gross rate of text-entry without word prediction across ail three phases
(Figure 16).
Error-adiusted rates of trxt entrv. Daia are summxized in Table 5 and plotted on the lin<:
graph (Figure 8). PI'S rate of tex! entry afrer enor adjustment was also similar across al1 four
conditions. with the error-adjusted rate being slightly faster when the word prediction list was in
the upper right corner (UR). However. the differences among al1 typing conditions were not
statistically significmt (Table 8). Pl's average rate of text entry after error adjustment remained
much higher in the follo~v-up phase (M=9.-ll) as compared to the baseline level (-6.6 1 ) and to
the average rates with and without word prediction in the altemating treatment phase (Figure 10).
4.23 Accuracy of Text entry
Data are summarized in Table 6 and plotted on the line graph (Figure 12). Pz's accuncy
of text entry was higher in al1 three word prediction conditions than without word prediction. The
differences were statistically significant when the prediction list vas in the UR (P=O.O 15) and
Lkl locations (P=O.Ol 1: Table 9). The differences in accuracy were not statistically significant
when the preîèrred location (LM) was compared to the other two locations. On average. P2's
accuracy was similar across al1 three phases with or without word prediction (Figure 24).
4.36 Perceived Performance
The important witten productivity tasks identified by Pz are presented in Tabir 10. A
high level of importance wûs associated with al! of the tasks with cach task rated a -7' or above
on the 10-point importance rating scale. The mean performance score and rnran satisfaction
score after using word prediction were higher than the bascline scores (change score of 0.8 and
0.4 for performance and satisfaction resprctively). .As compared to baseline. P3 rated her
performance and satisfaction to be higher in 3 out of 5 tasks (60%). unchangrd for 1 task (20°/0)
and poorer for 1 task (20°/o) aRer using word prediction (Figure 28: Table 10).
1.27 Behaviour Observation
P? maintained focus and was motivated throughout the rsperiment period. Mild signs of
boredom such as yawning. tvere observrd in the last two days of the altemating treatments phase.
4.3 Participant Three
4.3 1 Background Information
Partici~ant characteristics. Participant Three (P3) was a 1 1 -year-old boy with the
diagnosis of L4 myelomeningocele. hydrocephalus with VP shunt and Nystagmus. Relevant
characteristics of P3 are presented in Table 2. Other deficits reponed in the medical record
include difficulties maintaining attention to tasks and visual perceptual deficits in the area of
visual spatial relationship. visual memory. f o m constancy and figure ground perception. P3
shared the family computer with his siblings. He had access to the use of a computer for witing
in the classroom.
Settinq. P3 lived in a detached house. The experiment took place in the living room. The
computer was set up on a desk. The environment for the experiment was mostly quiet.
Occasionally. the conversation of the siblings was audible in the living room. ET was frequently
distracted by the activities outside the house such as the movement of a construction vehicle. The
blind in the living room was kept draun to reduce distraction.
4.33 Pre-baseline ResuI ts
Pre-baseline test results are presented in Table 3. P3 typed with his lef index tinger. His
witing and typing speeds were much lower than the average writing speed of 1 1 .J wpm for his
grade (Phelps et ai.. 1985). For cornfortable reading. P3 preferred 20-point font on the screen and C
in printed material. His scores on the DEM suggested a Type 11 deficit indicating dit'ficulties in
oculomotor control (Richrnan & Garzia. 1987).
4.33 Preference for Placement Location of Prediction List
P3 indicated that he preferred to have the prediction list at the LM location. He stated
that not having to move his eye gazes too far away from the copy test was helptiil in keeping
track of where he was on the copy material.
4.34 Rates of Text Entry
Gross rates of text entry. Data are summarized in Table 4 and plotted on the line yraph
(Figure 5 ) . On average. P3 demonstrated a faster gross rate of text entry without the use of word
prediction than with word prediction. The differences between the gross rate of text entry
without word prediction and the gross rates with al1 three conditions of word prediction were
statistically significant (P<O.O03: Table 7). Statistically. the differences in gross rates betwen
the prefemd location (LM) and the other two locations were not significant (Table 7). Compared
to the baseline level (~=6.53) and to the average gross rates with or without word prediction in
the altemating treatments phase. P3's average gross rate of text entry \vas at a highrr lrvrl in the
follow-up phase (O=8.43: Figure 17).
Error-adiusted rates of texr entrv. Data are surnmarized in Table 5 and ploned on the line
graph (Figure 9). P3 was raster in error-adjusted rates of text rntry without using l o r d
prediction. The differences bctween the enor-adjusted rate of test entry without word prediction
and the error-adjusted rates with al1 three conditions of word prediction were statisticnlly
significant (P~0.004: Table 8). However. the differences between the prekrred location and the
orher two locations were not staristicaily signiticant (Table 8). P3's average rate of iext entry
after error adjustment was also slightly higher in the follow-up phase (M=7.44) as compared to
the baseline level (M=6.3) and to the average error-adjusted rate with or without word
prediction (Figure 2 1 ).
4.35 Accuracy of Test Entry
Data are summarized in Table 6 and plotted on a line p p h (Figure 13). P3 appeared to
have highest accuracy when the word prediction list was in the LM location. However. the
differences in accuracy arnong al1 typing conditions were not statistically significanr (Table 9).
F3 vas observrd to have dificulties in maintaining his place on the copy material. In a nurnber
of typing sessions. P3 skipped from one word to the next occurrence of the same word. causing a
siyniîïcant drop in accuracy. This problem occurred without word prediction (2 out of 18
samples). and with word prediction when the list wûs in the UR location (2 out of I O samples)
and the FC location (1 out of I O samples). Incorrect spacing and capitalization were particularly
noticeable in the follow-up phase. His average accuracy was slightlp higher in the baseline
phase. but with the variabilitp in the accuracy data. the differences across al1 thrre phases and
with and without word prediction appeared to be insignificant (Figurelj).
4.36 Perccived Performance
The important writtrn productivity tasks identified by P3 are presented in Table 10. .*\
high ievel of importance was associated with a11 of the tasks with each task rated a '6' or above
on the I O-point importance rating scale. The mean performance score and mean satisfaction
score aftcr using word prediction were lower than the baseline scores (change score of -2.4 and
-3.0 for performance and satisfaction respectively). As cornpared to baseline. P3 ratrd his
performance to be hiyher in 1 out of 5 tasks (20%) and poorer for 4 tasks (80%) after usinp word
prediction (Figure 29: Table 10). Comparing satisfaction after using word prediction to baseline.
P3 rated 1 tasks to be the samr (40%) and 3 tasks to be poorer (60%: Figure 19: Table 10).
4.37 Behaviour Observation
P3 ,as easily distncied. but he responded well to the reinforcement stratrgy. He was
initially motivated to try word prediction. On the 6'h day of the alternating treatment phase. he
expressed dislike of word prediction verbally. His effort had to be maintained using the
rein forcement strategy .
4.4 Participant Four
4.4 I Background Information
Participant characteristics. Participant Four (P4) was a IO-year-old Young woman with
the diagnosis of L myelomeningocrle. non-shunted hydrocephalus. congenital hean defect and
S-shape thoracolurnbar scoliosis. Other deficits reported in the medical record included
dificulties maintaining attention to tasks. visual perceptual deficits in the m a of visual spatial
perception. visual sequential memory and form constancy. P4 had her o~vn computer at home.
She received keyboarding training and had regular access to a computer at school.
Settinq. P4 lived in a detached house. The rxpenment took place in her study room. The
computer was set up at a computer workstation. The environment was quiet and distraction frer.
4.43 Pre-baseline Results
Pre-baseline test results are presented in Table 3. P4 typed with al1 I O fingers on the
keyboard. but she needrd to look at the keyboard to locate the keys. Her witing and typing
spceds were lower than the average witing speed of 9.4 wpm for her grade (Phelps et al.. 1985).
P3 preferred IO-point font on the screen and in printed material. Her scores on the DEM
suggested a Type III deficit indicating difficulties in automaticity (Richmm & Garzia. 1987).
4.43 Preference for Placement Location of Prediction List
P4 indicated that she preferred to have the prediction list in the UR location. Contrary to
al1 the other participants. she found that having the copy material and the word list at the LM
location too clustered. making it harder for her to see.
4.44 Rates of Text Entry
Gross rates of text entrv. Data are summarized in Table 4 and plottcd on a line graph
(Figure 6). P I drmonstnted a much &ter gross rate of text entry without the use of uord
prediction than with al1 of the word prediction conditions. The differences between the gross rate
of tcxt entry with and without word prediction were statistically significmt (p=0.001).
Statistically. the differencrs in gross rates between the preferred location (UR) and the othrr two
locations were not significant (Table 7). P3's average gross rate of text entry in the follow-up
phase (-1 2.22) was similar to that in the altemating treatment phase. but was faster than the
average baseline rate (h& 1 0.04) and the average gross rates with word prediction (Figure 1 8).
Error-ûdiusted rates of text entrv. Data are summarized in Table 5 and plotted on a line
graph (Figure 10). P4 was faster in error-adjusted rates of text entry without using word
prediction than with word prediction. The di fferences between the enor-adj usted rate of text
entry without word prediction and the error-adjusted rates with al1 three conditions of word
prediction were statistically significant (P=O.OO 1 ). There was no significant difference in rates of
text entry between the prefened location (UR) and the other two locations (Table 8). P4's
average rate of text entry after error adjustment without word prediction was also similar in the
follow-up p h a x (h+ 1 1.76) and in the altemating treatment phase. but was higher than the
average error-adjusted rates with word prediction and the average baseline rate (-9.2 1 :
Figure 22).
4.45 Accuracy of Text Entry
Data are summarized in Table 7 and plotted on a line graph (Figure 14). Accuracy was
similar in al1 four conditions of typing. P4 appeared to be slightly more accurate when typing
without the use of t o r d prediction. She \vas sirnilady accuratr when the word prediction list was
placed in the UR and the FC locations. and was slightly less accurate in the LM location.
However. the differences between the preferred location (UR) and the other two locations were
not statistically significant (Table 9). Genrrally speaking. P4 was very accurate with her typinç.
She was observed to have problems similar to P3. in skipping words. This problem onlp occurrrd
when P4 typed without lo rd prediction.
4.46 Perceived Performance
The important n~it ten productivity iasks identi fied by P4 are presented in Table 1 0. P1
rated three tasks to be extremely important with a rating of ' 10' on the 1 O-point importance
rating scale. She rated the importance of the remûining two tasks to be medially important (rating
of 4 and 5 ) . The mean performance score and mean satisfaction score afier using word prediction
were lower than the baseline scores (change score of -1.6 and -1 .O for performance and
satisfaction respectively). As compared to baseline. P4 rated her performance to be higher in 2
out of 5 tasks (40%). the sarne for 1 task (20%) and poorer for 2 tasks (40%) after using word
prediction (Figure 30). Comparing satisfaction afier using word prediction to baseline. P4 rated 3
tasks to be higher (40%). 1 tasks to be the same (40%) and 1 task to be poorer (20%: Figure 30).
4.47 Behaviour Observation
Occasionally. PJ was observed to have dificulties in rnaintaining attention to tasks. but
she could be easily re-directed back to the task with verbal reminders. P4 was motivated to
participate in the study and responded well to the reinforcement strategy. Towards the end of the
altemating treatment phases (starting from Day 7). she appeared to prefer typing without word
prediction by siiowing disappointment when having to type with word prediction. Ciowever, she
never expressed a dislikc of word prediction verbally.
4.5 Summary and Group Results
4.5 1 Rates of Text Entry with and without Word Prediction
As a group, the participants in this study demonstrated a significantly faster rate of text
entry (gross rates and error-adjusted rates) without the use of word prediction than with ail of the
word prediction conditions (P=0.000; Table 7 & 8). In examination of individual data. the rates
of text entry without word prediction were significantly higher than the rates of text entry with
word prediction in two participants (P3 and P4). Pl was slightly faster typing with word
prediction in the LM condition. P2 was slightly faster typing without word prediction. In both
cases, the dirferences in rates between typing with or without word prediction were not
statistically significant (Table 7 & 8). When comparing the average rates of text entry across the
three phases, three participants (P2, P3 and P4) dernonstnted fastest rates of text entry in the
follow-up phase, when ihey typed wiihout word prediction. These rates were much higher thui
the average rates with al1 of the word prediction conditions. P 1's average rate in the follow-up
phase was also the highest among the three phases. but the difference was too small to be
considered significant.
4.52 Accuracy of text en- with and without word prediction
Generally speaking. al1 participants were quite accurate in text entry. As a group.
accuracy of text entry was signiticantly higher with word prediction in the LM location
(P = 0.006). but the differences in accuracy between typing ivithout word prediction and the
other word prediction locations (UR and FC) were not significant (Table 9). P l achieved
signiticantly higher accuracy when using word prediction in the LM location. P2 attained
significantly higher accuncy with word prediction in the LM and the UR location. For the other
two participants. the differences in accuracy were not significant among al1 typing conditions.
Al1 participants demonstrated simiiar accuracy across the three phases of the experiment.
4.53 Preference on location for the word prediction list
Three participants preferred to have the word prediction list at the LM location. while I
participant preferred the UR location.
4-54 Rates of Text Entry with the Prediction List in Participant-Preferred Location
For al1 the participants. there vas no significant difference in gross and error-adjusted
rates of text entry when the prediction list was placed in the participant's preferred location
(Table 7 & 8). No trend c m be seen in the gross rates of text entry across participants. but three
participants were slowest in error-adjusted rates of text entry when the word prediction list was
in the FC location and one participant was slowest with the word prediction list in the UR
location.
4.54 Accuracy of Text Entry with the Prediction List in Participant-Preferred Location
Statistically. there were no significant differences in accuracy when the word prediction
list was placed in the participant's preferred location (Table 9). For d l participants. the poorest
accuracy occurred when the word prediction list was placed in the FC location. For P3. who
experienced the most difficulties in keeping track of his place in the copy matenal. the only
occasion when skippinp of words did not happen was when the word list was in the LM location.
4.55 Perceived Performance
The mean performance change score before and afier using word prediction ranged from
-2.4 to 1 .O (Table 10: Figure 3 1 ). and from -3.0 to -1.0 (Table 10: Figure 32) for satisfaction
scores. As a group. the difference in the mean performance score and the mean satisfaction score
before m d afier using word prediction \vas not statistically signiticant (P=O.j and P=0.75 for
performance and satisfaction rrspectivelp). As compared to baselinr. two participants (P 1 and
PI) rated their performance and satisfaction to be higher after using word prediction. The other
two participants (P3 and P4) rated their performance and satisfaction to be poorer after using
word prediction (Figure 3 1 &X). At the task level. participants rated higher performance with 1-
3 tasks (20%-66.7%). same performance with 0-1 task (0-20%) and poorer performance with 14
tasks (30%-80%). With respect to satisfaction with performance. participants nted higher
satisfaction with 0-3 tasks (0%-100%). the sarne mith O-> tasks (0%-40%). and poorer with 0-3
tasks (0%-60%).
Chapter Five - Discussion
This chapter discusses the results of the current study in terms of the effect of
word prediction and the location of word prediction list on rate and accuracy of text entry. and
the perceived influence of word prediction on participants' w-ritten productivity. In addition. the
strengths and weaknesses of the study are reviewed. and priority areas for further studies are
identi fied.
5.1 'ïhe Effect of Word Prediction on the Rate of Trxt En te
As opposed to the hypothesized increase in rate of text entry. this study found that
children with spina biftda and hydrocephalus were slowcr in rates of text entry wiih the use of
word prediction. This tinding is consistent with several previous studitis in tvhich the participants
typed using a standard keyboard (Anson. 1993: Koester & Levine. 1994: Scull R: Hill. 1988).
However. other researchers report gain in rates of test entry with the use of word prediction
(Lewis. et al.. 1998: Newell. et al.. 199 1). In the study conducted by Newell and associates
( 1991) rates of text entry were measured in two participants. Methods of data collection were a
questionnaire and interviews with teachers. In Lewis et al.'s study ( 1 998). no information
regarding participants' typing rates on entry \vas provided. Both Newell et al.'s ( 199 1 ) and Lewis
et d o s (1998) studies were conducted in school environrnents over a school year. therefore the
reported gain in rates of text en tq in the two studies might have been the result of long-term
exposure to word prediction.
Researchers have recognized that there are visual-cognitive demmds related to the use of
word prediction (Dabbagh & Damper. 198% Damper. 1984: Gibler & Childress. 1982:
Goodenough-Trepqnier & Rosen. 1988: Vanderheiden & Kelso. 1987). The spontaneous
comments made by the participants and the observations of their performance during the studp
provided some information about these visual-cognitive demands. The participants of this studp
relied on looking at the keyboard to locate the keys. P3 and P4 reported that having to look away
from the keyboard and switch their eye-gaze back and forth from the copy material to the
keyboard and the monitor slowed their typing rates. PI and P3 commented that the use ofword
prediction required more concentration than direct typing. In the word prediction sessions. al1
participants were observed to spend a considerable amount of time searching the prediction list.
Often. they paused when they had to make a decision. Examples of the decisions they made
include: choosing a number to pick a word tiom the prediction list. determining what action to
take when the desired word was not on the list. and deciding which letter to type next. It was
quite common for participants to Forget which word they were looking for as the! scanncd the
prediction list. especially if the desired word was not displayed the first time they looked at the
list. This resulted in additional time required for the participants to switcli their eye gaze back to
the copy material and scan the copy material For the desired word. before retuming to the task of
searching the prediction list for the appropriate word. The visual-cognitive processes the
participants were observed ro use for t o r d prediction were similm to those processes drscribed
in the titerature (Horstrnann & Levine. 199 1 : Treviranus & Norris. 1987: Vanderheiden &: Kelso.
1987). The time that the visual-cognitive activities required might have significantly otTsetted
any timesaving gained from reduced keystrokes offered by word prediction.
At the simplest level. using word prediction is a visual detection task. Research has
demonstnted that individuals with difficulties in perceptual ability. visual scanning ability.
visual spatial skills. and eye movement control have poor performance in visuai detection tasks.
both in terms of accuracy and efficiency (Gale. 1993: Sergeant. 1996). Use of word prediction
involves higher level cognitive skills than what may be required for a simple visual detection
task. A certain level of language ability is also necessary in order to be able to recognize the
words in the prediction list. The participants of the current study had below average to low
average intelligence. They also dcmonstrated di fficulties in oculo-motor control. visual
perception. attention and memory (Table 3 and 4). It is possible that the constellation of
dificulties in the area of visual-cognitive functioning may have contributed to the reduced rate
of test entry with the use of word prediction. This hypothesis is strengthened by the observation
that P3 and P4. who had the lower scores in intelligence. rnemory and reading and the rnost
dificulties keeping trûck of their place on the copy material. recordrd significantly slower rates
of text entry with word prediction than without word prediction. In cornparison. P l and Pl who
function at a slightly higher level in the area of visual-cognitive skills. rccordrd insigniticant
differences in rates of text entry with and without the use of word prediction.
P2's rates of text entry without word prediction drciined toward the end of the altemating
treatmcnt phase. She was observed to be spending time looking for the prediction list when she
was supposed to be typing without it. Her accuncy with direct typing also suffered because she
often omitted spaces between tvords. These observations suggest that therr might be a multiple
treatment effect. The application of different typing conditions on the samr day during the
altemating treatmeni phases rnight have affected Pz's performances when typing without word
prediction. Barlow and Hayes ( 1979) recommend that if there is evidence suggesting multiple
treatment et'fect. the follow-up information should be used as a reference in the interpretation of
the results. PZ'S average rate of text en. without word prediction was slightly higher than the
average rates of al1 of the word prediction conditions. Stûtistically. the differences were not
siçnificant. However. Pl's average rate of text entry without word prediction in the follow-up
phase (i.e., 9.41 wpm: Table 5 ) was much higher than the rates of text entry uith word prediction
(average rates with word prediction ranged from 7.17 - 7.48 wpm: Table 5). It is possible that
PZ'S rates of text entry without word prediction would have been much higher than the ntes with
word prediction in the altemating treatments phase if there was no interference effect from
application of multiple treatments.
Visual inspection reveals an upward trend and variability in the data of rates of text sntry
with and without the use of word prediction. With al1 of the participants. the variability is higher
with l o r d prediction than it was without word prediction. especially in the second half of the
alternating treatrnents phase. Decreased motivation and reduced attention may be the reasons
contributing to the variability. With the exception of P l . al1 the other participants continued to
improve their ntes of text entry without word prediction in the follow-up phase. This
observation suggests a pnctice effect. With the presencc of an upward trend. there remains a
possibility that the participants may have gained faster rates of text entry with the use of word
prcdiction if the alternating treatments pliase was extended. However. two of the participants (P3
and P4) expressed dislike of word prediction around Day 6 and Day 7 in the aiternating
treatments phase. P 1 and P3 ~ I S O showed signs of boredom such as playing with objects around
the computer and frequent yawning toward the end of the altemating treatments phase. From a
practical standpoint. it would be unrealistic to add more sessions to the present study. The
existence of a practice effect and the issues of reduced motivation and decreased attention are not
considered a threat to the intemal validity of the study. The issue of decreased
rnotivation/attrntion occurred in al1 of the word prediction sessions and without word prediction.
It was also controlled using the reinforcement strategy. The practice effect tvould have a similar
impact on each of the treatrnents and on the no-treatment condition in the alternating treatments
phase (Barlow & Hayes. 1979: Stromgren & Kolby. 1996).
The constant switching of eye gaze required in the copy task might have made additional
visual demand on the participants. Consistent with Anson's report in 1993. participants were
observed having to locate their place on the copy material every time they looked away from it.
In the word prediction sessions. participants needed to check back and fonh between the copy
material and the word prediction list when they forget the words that they were looking for. It is
possible that this increased frequency in eye gaze switching required in the copy task may have
contributed to the reduced rate of text entry with word prediction.
The overall efficiency of word prediction is drtrrmined by the content of the prediction
dict ionq. the prediction algorithm and the text to be generatrd (Higginbotham. 1993: Korstrr
& Levine. 1998: Newell et al.. 199 1 : SwifîÏn. et al.. 1987: Vanderheiden & Kelso. 1987). In the
present study. the keystroke savings offered using KeyREP with the custom dictionary created
for the study was determined to be 37.7% '. A story considered to be grade 3 reading material
was used for copying and creation of the prediction dictionary l u . This was selected to make sure
that participants were able to read all of the words displayed on the prediction list. but this
reading level mûy have had an impact on keystroke saving. The average lrngth of the words in
the copy material was 4.30 not including the spaces. and 5.33 with spaces. This word length is
shorter than the average of 4-74 without space (5.74 with spaces) in standard English text
(Darnper. 1984). Shorter words mean that less keystrokes are saved. The adoption of the %then-
search" strategy in this study may be another factor that affected the eficiency of word
' Section 3.52. p. 43. IO Section 3.5, p. 45.
prediction. The "2-then-search" strategy was adopted to minimize the visual-cognitive load ' ' . but the application of this strategy meant that at least three keystrokes were required to type a
word. The "2-then-search" strategy Iimited the keystroke savings because many of the words
used in the study were 4-5 letters in length. The prediction list in KeyREP was generated by
frequency alone. In many cases. especially in the case of content words. participants had to type
3 to 4 letten before the desired word was displayed on the prediction list. The application of a
more advanced prediction algorithm. such as an application of natural languape processing
techniques could potentially improve the keystroke savinps and reduce the visual-cognitive load
(Langer & Hickry. 1999). It is possible that the effect of word prediction on rates of text çntry
would be different with the word prediction software applying advanced prediction algorithms.
5.2 The Effect of Word Prediction on the Accuracy of Trxt Entry
Generally speaking. al1 participants typed with high accuracy with or without the use o r
word prediction. Statistically. their accuncy was significantly higher with word prediction in the
LM location. The improvement in accuracy was mainly in spacing and capitalization. Cliniccilly.
these improvements are not very significant because it is likely that the participants c m leam to
do proper spacing and capitalization from keyboarding training.
The most severe drop in accuracy occurred when participants skipped many words as
they copied from the source material. The problern of skipping words seemed to appear
randomly and it was noted in sessions with or without word prediction. It is likely that the
problem of skipping words is related to the use of copy task in this study. The findings in
accuracy of text entry may differ if participants were asked to type from dictated tapes or to do
free composition.
I I Section 2.3. p. 19.
Aiioilicr coiiinioii problciii i i i accuracy Ibr dl ofilic participants was iliat additional
spaces were inserted after a word wlien tliey used word prediction. This was niore noticeable
with P4. who was the best-trained typist in the group. The problern occurrcd as a result of the
auto-spacing katurc in KcyREP (i.c.. a spacc was auiomatically inscrted alicr a word that was
selected from the prcdiction list). The benelit of auto-spacing is the savine d o n e additional
keystroke for every word selected from the prcdiction list. However, a well-tnined typist such as
P4 automatically pressed the spacebar at the end oreacli word. This resulted in a double space
being inserted thereby crcating an error and decreased accuracy. P4. wlio had leamt to monitor
her own typing. often iried to t k thc double spacing problem. This meant that additional time
was spent and resultcd in slower rates of tcxt entry. 1-lowever. it is possible tliat with Iùrthcr
practice the participants may be able to adapt to the üutomatic spacing when using word
prcdiction.
lnterestingly. wlien P4 was introduced to the use of word prediction on the training day.
she started to read aloud the words that she was copying. P4 continued to do this throughout the
altemating treatnients phase. more so when she had to use word prediction, but also at times in
the typing sessions without word prediction. This self-echoing stopped towards the end of the
follow-up phase. When the accuncy data were examined, it could be seen that the accuracy was
worse in the baseline (9 1.5%) and in the follow-up phase (96.2%). compared to the range of
97.7% to 98.96% in the altemating treatments phase (Table 6). The problem with accuracy for
P4 was related to skipping words. It is possible thai the echoiny of words helped P4 remember
where she was on the copy material. The combination of word prediction with auditory feedback
is not new. In fact. it is a standard feature that is available on al1 shipping versions of word
prediction software. The choice of not including auditory Seedback in the current study was to
isolate the ellèct of word prediction. Anccdotally. tlic coinbinalion of auditory fccdback and
word prediction was felt to help users locate the targeted word on the prediction list (Hunt-Berg,
Ranking, & Beukelman, 1994; MacArthur. 1996). Lewis and colleagues ( 1998) found that word
prediction in combination with auditory feedback was more effective in the reduction of spelling
m o r s than using word prediction alone. but the rate of text entry was slower than when word
prediction was used without auditory feedback (Lewis. et al.. 1998).
5.3 The Effect of the Location of Prediction List
Quantitative data analysis comparing the rates and accuracy of text entry between the
preferred location and the other two locations revealed no significant difference. However. the
accuracy of text entry with word prediction in the L M location was significantly higher tlian that
of typing wi thout word prediction. Subjectively. three participants (P I . P2 and P3) preferred to
have the prediction list in the LM location, and PJ preferred to have the prediction list in the UR
location. The location of the word prediction list does not appear to have an effect on rate of text
entry. However, the preferred location of the participants was consistent with the location where
participants achieved the best accuracy score. The small sarnple in this siudy may be one reason
why a significant difference among the locations was not detected in analysis of the group
results.
The FC location was not a favorite location for any of the participants. 1 t is also where al1
of the participants recorded the lowest accuracy score. and where three of the participants
registered lowest error-adjusted rates. P2 specifically commented that having the prediction list
following the text cursor bothered her eyes. The observation that the FC location was not a
favorite location for the participants is a particularly important finding to note because it is a
common belief among the software developers that having the prediction list following the
cursor reduces eye nioveriients related to using word prediction (Newell. et al., 1992; Swil'fin et
al., 1987). In May of 1999, KeyREP and Co: Writcr were the only two software packages ihat
allowed the prediction list to follow the cursor. The FC location remains the default location in
the current version of Co: Writer (Co:Writer 4000.2000). Recently, other software developers
have begun to support the placement of the prediction list in the FC location. For esample, the
FC location is the default location used in WriteAway ZOO0 ( WriteAway. 1999). The new
version of Textl-Ielp (TcxtClclp! Read and Write 4. 2000) also provides tlic option for the word
prediciion list to follow the cursor.
The use of a copy task with the copy material being placed between the keyboard and the
monitor in tliis study may have influcnced the preference Cor having the prediction list at the LM
location. I t would be intcresting to compare the preferences for the location of the prediction list
wlien the copy material is placed in different locations (cg.. eitlier sidc of the monitor). The type
of writing t s k used is another possible factor that rnay affect the choice of location. When an
user performs a novel wriiinç task. his/her visual focus is constantly on the text cursor. It is
possible that during this type of task the FC location rnay be preferable.
Another factor to consider in relation to the location ofthe word prediction list is eye
dominance. Gur (1975) suggested that an individual's tendency to gaze either to the left or to the
right is determined by his/her chancteristic preference for use of a certain hemisphere (Gur,
1975). His theory was supported by the evidence of a strong association between eye preference
and handedness (Dellatoias, Curt, Dargent-Pare, & De Agostini, 1998). An individual's eye
dominance is important to consider in the placement of the prediction list as it can affect the
reference point for visual localization (Ponc & Coren. 1986). In the current study, the leA-sided
placement of the prediciion list was not tested bccausc oc the limitation set by the Windows
openting system. If future technology allows the prediction list to be placed on the left hand side
of the screen without comprornising the efficiency or the size of text viewing zen, then it will be
important to compare the efrect of location of tlic prediction list according to cye prelèrenccs.
5.4 Perceived Inthencc of Word Predictiori on Written Productivity
The participants in the study appearcd to Iiave di trerent perception o r change in writtcn
productiviiy atirr using word prediction. The direction of change appears to prallel the changes
in rates and accuracy of tcxt entry recorded in the experiment. P 1 and P2 recorded faster rate of
text entry andfor higher accuracy with text entry with word prediction than without word
prediction. Their niean performance and satisbction scores arter using word prediction were
higher than baseiinc. P3 and P4 registered lower rate of tcxt entry and insignificant cliange in
accuracy of tcxt entry witli word prediction tlian without word prediction. Tl~cir mcan
performance and satisfaction scores alter word prediction were lower than baseline. This finding
agrees with the self-eficacy theory. which suggcsted that feeling of mastery heigbtens perceived
sel f-efficacy (Bandura. 1 997).
Prior research indicates that change scores of two or more points on the COPM are
clinically significant (Law. et al.. 1998). Anûlysis of individual participant's data revealed that
participant's perception of change in performance and satisfaction after using word prediction
varied with the writing tasks. The variability in ntings with different tasks means that the
average performance and satisfaction change scores may not be the best indicators for change.
After exarnining individual participant's COPM scores. significant changes were noted at the
task Ievel. P I rated her performance to be higher in 2 tasks (66.7%) and satisfaction to be higher

in al1 tlircc tasks ( lOO%) alicr using word prcdiction. For tlic 2 tasks nicd wiili Iiiglicr
perforniance and satisfaction. the change scores are between 2 to 3. P2 rated lier perrormance
and satisfaction witli 3 tasks (60%) to be higlicr aner using word prediction, the change scores in
2 of these 3 tasks were in the range of 2-3. P3 ratcd his perforniance and satishction to be lower
in four tasks (80%). The change scores in performance in three out of these four tasks were
between -2 and -5. P4 rated lier performance and satisfaction to be lower in two tasks (40%).
The change scores in peribrmance and satisfaciioii in these two tasks wcre between 4 and -8.
Participants' perception of written produciivity ai baseline c m af1Cct the niagnitude of
changes in tlieir perforniüncc and satisfac tion alicr using word prcdiction. At baselinc. PZ ratcd
her performance and satisfaction to be at a relatively high level with the rating of '7' or above for
four tasks (80%) on a IO-point scale. Aftcr using word prediction. shc rated hcr perbrrnance and
satisfaction at '6' or highcr for al1 tasks. With a rclativcly high initial rûting for most of the tasks.
it is probably not surprising thût the perceived overall changes (0.8 for pcrfonnancc and 0.4 for
satisfaction) after using word prediction were not clinically significant.
During the experimcnt, P l and P4 offcred comments suggesting tliat use of word
prediction might be helpful for spelling because instead of having to type the whole word they
couid select the desired word from the prediction list. However. P3 commented that use of word
prediction miglit not help him with spelling because the use of word prediction required him to
spell at l e s t the first one or two letters of a word. His feeling was consistent with the results
reported by MacArthur (1 999) in a study conducted with students with leaming disabilities. In
this study. MacArthur raised concems about basic spelling skills, word recognition skills.
attention and memory required in the use of word prediction. However, other studies have
supported the effectiveness of using word prediction to help with spelling (Lewis et al., 1998;
Newell, et al., 199 1 ). As suggcsicd by klacArtliur ( 1999). ilic disagrcenicnt in Iiiidings i i i
previous studies regarding the effcct of word prediction on spelling accuracy may be related to
differences in word prediction software in terms of prediction al yori thms. size and content of the
prediction dictionanes. and writing tasks used for the studies.
5.5 Strengths and Limitations of the Study
Four methodological strengtlis were identifkd in this study. Fint. the protocol was o h
reasonable lengtli to mnintain cornpliance. Sccond. inclusion of a reinforcement strategy
controllcd for the possibility OC rcduccd motivation and decrcascd attention afiçting tlic rcsults.
Third. increased objcctivity was achieved through the use of electronic monitoring and
calcuiation of rates and inclusion of inter-rater comparison in the scoring of accuracy. Fourth.
inclusion of basdine and follow-up phases. randomizcd ordcr of treatmcnt applications. and
application of intercomponent intends controllrd for order and cany-over effects.
Conducting the study in the Iiome environment appears to be botli a strength and a
limitation. tIigginbotliam (1993) suggests that the functional aspects of tcclinolopy sliould be
assessed under realistic conditions. This study provided information on the elfect of word
prediction in the home setting. However. conducting the experirnents in the home environment
made it impossible to s tandardize environmental factors such as noise, workstation, and presence
of distracters.
The primary limitation of this study is the limited generalizability of the results. The
present study consists of four direct replications. Interpretation of the results from the present
study should be Iimited to children with spina bifida and hydrocephalus who have similar

characteristics as tlic pariicipants in tliis siudy aiid io ilic speçiliç word prcdiciion softwarc uscd
in the study .
The use olcopy task in tliis study was to control t'or the h i e required for idea generation
and organization of thoughts in a novel writing task. However, the use ofcopy task imposes a
limitation in generalizability of the findings of this study to Free composition. which accounts for
majority of the tvriting tasks required of school-agcd children.
Otlier limitatiotis of the study includc limitcd rcl iability and validiiy of [lie Bchaviour
Checklist used to rnonitor behavior during the expcriment. the small samplc size in the study and
limited reliability in sampling information gathered Srom medical rccords.
5.6 Direction t'or Futiirc Rescarch
Further research in four main areas is rneriied. First. with the avnilübility of new word
prediction soî'tware tliat adopts advanced prediction algorithms developed from natural languagc
processing research. studies are needed to evaluate the effect of this new software on rate and
accuracy of text entry. This information is necessary to guide the prescription of word prediction.
A single-subject repeated measures ABA design niay bc an effective metliod to gather clinically
relevant information (Ottenbûcher. 1986).
Second, research is needed to evaluate the long-term use effect of word prediction with
different writing tasks such as story writing, note taking and report wnting that are typical for
school-aged children. This study focused on the effect of word prediction on nies and accuracy
of text entry, but prier research and anecdotal information suggests that word prediction may
also be helpful in reducing htigue, improving spelling and promoting the development of written
language (Hunt-Berg et al., 1994; Klund & Novak. 1995; Lewis et al., 1998: Newell, et al.,
199 1 ). The use of longitudinal studics nlay be able to capture tlic overall bcncfits of using word
prediction with the different wnting tasks in home andor school settings.
Third, research is needed to furtlicr explore [lie location of word prediction list as a factor
contributing to the effectiveness of word prcdiction. Ihis study demonstratcd that the location o l
the prediction list rnight affect the accuracy of text entry and the ease of use of word prediction.
The finding of this study cliallcnged the common bclief tliat having the word prediction list
followiny tlic cursor is a favorable location. lnCormation on the cffccct of location of word
prediction list is important for clinical implcmentation of word prediction teciinology. tt is also
important information for software developers in funher development of the iechnology. The use
of randomized block design with a large enough sample size to demonstrate power of inkrence
may be a suitable design for this purpose. The rccomrnendation of using randomized block
design instcad of a more powerful randomized controlled trial is based on liniited availability of
homogenous samples in pediatric rehabilitation research (Law. et al.. 1994).
Fourth. research is needed to explore the effeciiueness uf word prediction when it is used
with different computer access systems such as on-screen keyboard and switch access. Different
computer access systems present different challenges and benefits in terms of the user interface.
For example, when using an on-screen keyboard. the user's visual focus is constmtly on the
computer screen. It is possible that elimination of the need to switch eye gaze in this situation
rvould make word prcdiction a more effective too1 for rate enhancement. Single-subject repeûted
mesures ABA design sliould be considered. In a single-subject research, the participant serves
as hisher own control, therefore the design allows customization of the access system to suit
individual participant's needs. The flexibility in experimental setup is important because
individuals requiring the use of on-screen keyboard or switch access are genenlly more
physicall y challenged and would require tlie computer system to be set up in a specific manner.
5.7 Conclusion and Clinical Implications
In the present study conducted with children with spina bifida and hydrocephalus. i t was
found that word prediction did not improve rate of text entry. but it did improve accuracy of text
entry when the word prediction list was placed in the lower middle border of the computer
screen. Considering the limitations statcd above. this Iinding is considered to be preliminary.
Further study is necessary beforc a definitive conclusion c m be made.
Contributions. To date. only a few clinical studies have addressed the effectiveness of
word prediction. This study provides much needed clinical information on the efkct of word
prcdiction on rates and accuracy of text entry for children with spina bifida and hydrocephalus. [ t
is the first study to explore the effect of location of the prediction list on rate and acccuncy of text
entry in this population. This study is also the first to explore the user's perspectives on the
potential influence of word prediction.
Clinical imolications. This study supports the client-centered approach to assessrnent and
recommendation of word prediction. Clinicians should explore the demands of different witing
tasks from the client's perspective and keep in mind that tlie benefits of word prediction are
probably not restricted to improvement of rate and accuracy of iext entry. The possible effect of
location of the word prediction list on rate and accuracy of text entq is worth exploring with
individual client in clinical evaluation to ensure that the word prediction list is placed in an
appropriate location for the client.
Abu-Saad. H. ( 1 984). Assessing children's responses to pain. Pain. 19, 1 63- 1 7 1 .
Adler, D.A. (1995). Cam Jansen and the Triceraio~s Pops Mvstew. New York: Viking Press.
Ajzen, 1. (1985). From intentions to actions: A theory of planned behavior. In J. Kuhl & J. Backman (Eds) Action-Control: From Cornition to Behavior. Heidelberg: Springer.
Amundson. S.J.. & Weil. M. (1996). Prewiting and handwriting skills. In J. Case-Smith & A. S. Allen (Eds.). Occupational Theraov for Cliildren. (pp. 524-543). St. Louis. MO: blosby.
Anderson. E. ( 1976). tlandwriting and spina bifida. Special Education Fonvard Trends. 3(2). 17-20.
Anderson. E.. & Plewis, L. ( 1977). Impairnient of a motor ski11 in children with spina bifida cystica and hydrocephalus: An exploratory study. British Journal of Educational Psvcholoev. 68.6 1-70.
Anderson. E.. & Spain, B. ( 1 977). The Child witli Spina Bifida. London: Oxford University Press.
Anson. D. ( 1 993). The eSfect of word prediction on typing speed. The Arnerican Journal of Occupational Thcrapv. 47( 1 1 ). 103% 1042.
Auron [Coniputer Software]. (1999). Burnaby. BC: Aurora Systems. Inc.
Azimullah. P.C.. Sniit. L M . Rietveld-Knol, E.. & Valk. J. ( 199 1 ). Malformations of the spinal cord in 53 patiens with spina bifida studicd by rnaçnetic resonance imaging. C hild's Nerous S ~ s t e n ~ . 7 ,63-66.
Backman. C.L., Harris. S.R., Chisholm, J.M.. & Monette. A.D. (1997). Single-subject research in rehabilitation: A review of studies using AB, withdrawal. multiple baseline and alternating treatments design. Archives of Phvsical Medicine and Rehabilitation. 78. 1145-1 153.
Bandun. A. (1977). Self-efficacy: Toward a unifying theory of behavioral change. Psvcholurical Review. 84(2). 19 1-2 15.
Bandura, A. (1 986). Social Foundations of Thought and Action: A Social coqnitive Theon. Englewood cliffs, NI: Prentice Hall.
Bandura, A. (1997). Self-Efficacv: The Exercise of Control. New York: W.H. Freeman & Co.
Bandura, A. & Adams. N E . (1977). Analysis of self-efficacy theory of behavioral change. Cognitive theraov and Research. 1,287-3 10.
Bandun. A. & Wood. R. ( 1 989). Eft'cct of pcrccivcd controlability and pcrSorniaiice staiidards on self-rcgulation o fk~mplcx dccisiun making. Journal ol' Ikrsonalitv arid Social Psvchologv, 56, 805-8 14.
Baptiste, S., Law, M., Pollock. N., Polatajko. tI.. McColl. M. A.. & Carswell. A. ( 1993). The Canadian OccupationaI Performance Measure. World Federation of Occu~ational Therapy Bulletin. 28? 475 1.
Barkowich. A.J. ( 1 990). Pcdiatric Neuroimaeing. New York: Raven.
Barlow, D.H.. & E-Iayes, S.C. (1979). Alternating treatrnents design: One strategy Tor comparinç the elTccts of two trcatments in a single subject. Journal of Beliavior Analvsis. 12. 199- 210.
Barlow. D.1-1.. & I-Ierscn. M. ( 1984). Sinele Case Experimental Desians: StratetGcs Tor Studving Behavior Change. (2nd cd.). New York: Pergamon Press.
Barnes, M., & Dennis. M. ( 1992). Reading in cliildren and adolescents alirr early onsct hydrocephnlus and in normally developing age peers: Phonological analysis. word recognition. word comprehension. and passage cornprehension skills. Journal of Pediatric Psvcholoev. 17,445-466.
Biglan. A. W. (1 990). Ophthalmologic complications of meningomyeloccle: A longitudinal study. Tnns Amcrica Oohtharnologist Societv. 88.389-462.
Biglan, A. W. ( 1995). Strabisrnus associated with myelomeningocele. Journal of Pediatric Oohthalmoloav and Strabismus, 32(5), 309-3 14.
Birch. S. (1 999). Measure [Cornputer software]. 'Toronto. ON: Bloorview MacMillan Centre.
Blackstone. S. (1990). Enhancing rate in AAC: Guidelines and strategies. Augmentative Communication News. 3(5), 3-4.
Bosch, J. (1995). The reliabilitv and validitv of the COPM. Unpublished Master's thesis. McMaster University. Hamilton, ON.
Briggs. D. (1 970). The influence of handwriting on assesment. Educational Review. 13( 1). 50-55.
Briggs. D. (1980). A study of the influence of handwiting upon grades using examination scripts. Educational Review. 32, 185- 193.
Brookshire, B.L., Fletcher, LM.. Bohan, T.P., Landry, S.H.. Davidson. K.C., & Francis, D.J. (1995). Verbal and nonverbal ski11 discrepancies in children with hydrocephalus: A five- year longitudinal follow-up. Journal of Pediatric Psvcho lo~~ . 20(6), 785-800.
Bruininks, R.H. (1 978). Bruininks-Oseretskv Test of Motor Proficiencv Examiner's Manual. American Guidance Service Inc.
Caines. E., & Dahl, M. ( 1997). Oplitlialniological findings in a prospective study of 22 cliildren witli spitia bilida cystica. Europcün Journal of Pcdiairic Sur~crv. 7(Suppl l) , 52-53.
Cambridge, J., & Anderson, E. (1979). The 1-landwritina of Soina Bifida Cliildren. London. UK: Association for Spina Bifida and I lydrocephalus.
Canadian Association of'Occupational Tlierripists (1997). Enabling Occupation: An Occupational Therapv Perspective. Ottawa. ON: CAOT Publications ACE.
Card, S., Moran, T., & Ncwell. A. (1 983 ). The Psvchologv of Human-Conir ,ilter Interaction. Hillsdale, NJ: Lawrence Eribnum Associates.
Cam. J., Halliwell. M.D.. S( Pearson. A.h.1. (1981). Educational attainments u f spina bifida children attending ordinary or spccial schools. Zeitschrift fur Kindc. cliirurcic. 34. 364-370.
Caves. KM., Gross. K.. I-lenderson. K.. L klinson. A.A. ( 1 99 1 ). The use of iiitegrated controls for mobility, conimunication and cornputer access. Proceedinc! of RESNA 199 1 Annual Con Ference. (pp. 166- 167). Washington. DC: RESNA Press.
Cermak, S. (1991). Sornatosensory dyspruia. In A. Fisher. E. A. Murray. & A. C. Bundy (Eds.). Sensory Intcaration: Thcorv and Practice. (pp. 138- 170). Pliiladelpliia: FADavis:
Chan, C.C.1-1. & Lee. T.iV1.C. (l997). Validity of the Canadian Occupational Performance Merisure. Occupational Therapv Intcmational, 4(3), 229-247.
Christotèrson. L A . (1991). Surgical treatrnent. In R. W. Lrech & R. A. Bruniback (Eds.). Clvdroceohalus: Current Clinical Concepts. New York: Mosby Year Book.
Claibornc. D.K.. Powell. N.J.. 9r Reynolds-Lynch. K. (1999). Eruonomics and Curnulativc Trauma Disorders: A Handbook for Occu~ational Thera~isis. San Dicpo: Singular Publishing Group.
Clements, D.B., & Kaushal. K. (1970). A study of the ocular complications of hydrocephalus and rneningomyelocele. Trans Opthalmoloev Societv of United Kingdom. 60: 383-390.
Co: Writer 4000 [Compuier Software]. (2000). Wanconda. IL: Don Johnston Inc.
Cull, C.. & Wyke. k1.A. (1984). Memory function of children with spina bifida and shunted hydrocephalus. Develoomental Medicine and Child Neuroiogv. 26, 1 77- 183.
Dabbagh, H.H.. & Damper, R.I. ( 1985). Average selection iength and time as predictors of communication rate. Proceedinrr of E S N A 1985 Annual Conference. (pp. 404406). Washington. DC: RESNA Press.
Dahl, M., Ahlsten. G.. Carlson. H., Rome-Engstrom, E., Lagerkvist, B., Magnusson, G.. Norrlin. S.. Olsen. L.. Stromberg, S., & Thomas. K.A. (1995). Neurological dysfunction above cele level in children with spina bifida cystica: A prospective study to three ycars. Dcvelopmental Medicine and Child Neurolo~.~. 37, 30-40.
Damper, R.I. (1984). Test composition by the physically disabled: A rate prediction model for scanning input. Appi ied Ergonomies, 1 5,289-296.
Del Bigio, M.R. (1993). Neuropathological changes causcd by hydroceplialus. Acta Neuro~atholonica. 85(6), 573-585.
Dellatolas. G.. Curt. F., Dagent-Pare, C.. & De Agostini. M. ( 1998). Eyc doiiiinance in cliildren: A longitudinal study. Behavior Gcnetics. 28(3), 187- 195.
Demen. L.. Weiss-Lambrou. R.. and Ska. B. (1996). Development of the Quebec User Evaluation of Satisfaction with Assistive Technology (QUEST). Assisiive Technolorv. S. 3-13.
Dennis. M.. Fitz. C R . Netley. C.T.. Sugar. I.. Hanvood-Nash. D.C.F.. tlendrick, E.. Hotrman. H.. Sr I-lumphrcy. R. ( 198 1 ). The intelligence of hydroceplialic childrcn. Journal of Clinical and Expcrimcntal Psvcholoev. 9, 593-621.
Dennis. M., tlendrick. E.. Hoffman, H.. & Humplwey, R. (1987). Language of hydroccphalic children and adolescents. Journal of Clinical and Experimcntal Neuropsscliologv. 23. 593-63 1.
Dennis. M.. Jacennik. B., 9r Barnes. hl. (1994). The content of narrative discoursc in cliildrcn and adolescents after early-onset hydrocepbalus and in normal1 y developing age peers. Brain and Lanrrurigc. 46, 129- 165.
Department of National Health and Welfare, & Canadian Association of Occupational Tlierapy. (1983). Guidelines for the Client-Centred Practice of Occupational Therapv. Ottawa. ON: Departmeni of National tlealth and Wel fare.
DeRuyter. F. ( 1 995). Evaluating outcornes in assistivr tec hnology : Do we understand the cornmitment? Assistive Technolo~y. 7, 3- 16.
Deubel, H.. Schneider. W.X.. & Paprotta, 1. ( 1 998). Selective donal and ventral processing: Evidence for a common attentional mechanism in reaching and perception. Visual Coenition. 5( 1 / 2 ) , 8 1 - 10%
Devers. R.. Bradley-Johnson. S.. & Johnson, C.M. (1994). Thc elfect of token reinforcernent on WISC-R performance for fifth-through ninth-grade Amencan Indians. Psvcholoeical Record. J4(3). 44 1449.
Dias, M.S.. & McLone. D.G. (1 993). Hydrocpehalus in the child with dysraphism. Neurosurgerv Clinics of North America. 4(4), 7 1 5-726.
Donders, J., Rourke. B.P., & Canady, A.I. (1991). Neuropsychological functioning of hydrocephalic children. Journal of Clinical and Exoerimental Neuroosvcholoev. 13(4). 607-6 13.
Eckstein, H.B., 9r Macnab, G.H. (1966). Myelomeningocele and hydrocephalus: The impact of modem treatment. Lancet, 842-845.
Edgington. E. ( 1995). Randomiwtion tests. New York: M. Dekker.
Erne-, J.L.. Sr Lendon. R.G. (1972). Clinical iniplications of cord lesions in neurospinal dysnphism. Develo~mencli Medicine and Child Neurologv. 1 J(Suppl 27). 45-5 1.
Fearing, V.G.. Law, M.. & Clark. J. ( 1 997). t h occupational performance process model: Fostering client and therapist alliances. Canadian Journal of Occuaptioiial Therapv, 64(1), 7-15. -
Fletcher. J.M., Bohan. T.P.. Brandt, M.E.. Kraiiier. L.A., Brookshirc. B.L.. Thorstad. K.. Davidson. K.C.. IZrancis. D.J.. McCaulcy. S.R.. Sr Baumgartner. J.E. ( 1996). Morphometric evaluation of the hydrocephalic brain: Ilelationships witli cognitive development. Child's Nervous Svsteni. 1 7(4). 1%- 199.
Fletcher. J.h.1.. Brooksliirc. B.. Landry. S.[ 1.. Bohan, ' I l? . Davidson. K.C.. Fra~icis. D.J.. Lcvin. H.S.. Brandt. M.E.. Kramer. L.A.. & Morris. R.D. ( 1996). Attentional skills and executive funciions in children with early hydrocephalus. Develo~mentnl NéuropsvchoIoev. 12( 1 ). 53-76.
Fletcher, J.h.1.. Dennis. hl.. & Nonhrup. tl. (2000). Neuropsychology of early Iiydrocephalus: Sources of variability in outcomc domüins. In K. O. Ycaics. M. D. Ris. & I I . G. Taylor (Eds.). Pediatric Neuropsvcholow: Rcsearch. Theon, and Practice. (pp. 25-46). New York: Guildford Press.
Fletcher. J.h.1.. Francis. D.J.. Thornpson. N.M.. Brooksliire. B.. Bolian. T.P.. Landry. S.E.. Davidson. K.C.. S; Miner. M.E. (1992). Verbal and nonverbal skill discreponcies in bydrocephûlic cliildren. Journal of Clinical and Exlierimental Ncuropsvcholoev. 14(4). 5 93 -609.
Fletcher, LM., Lrvin. H.S.. & Butler. I.J. (1995). Neurobehavioral effects of brain injury in children. In M. Roberts (Ed.). Handbook of Pediatric Psvcholoav. (pp. 362-383). New York: GuiIdford Press.
Fletcher. J.M.. MçCauley. S.R.. Brandt. M.E.. Bolian, T.P., Krarner, LA. . Francis. D.J.. Thorstad, K. & Brookshire. B. ( 1996). Rrgional brain tissue composition in children with hydrocephalus: Relationships with cognitive development. Archives of Neurolocrv. 53(6). 549-557.
Fong-Lee. D. (1 993 j. Tcchnology update: Rate enhancement software. Canadian Journal of Occu~ational Tlicrapv. 60( 1 ). 37-38.
Friedrich. W.N.. Lovejoy. M.C.. Shaffer. J., ShurtlefF. D.B., & Beilke. R.L. (1991). Cognitive abilities and achievement status of children with myelomeningocele: A contemporary sample. Journal of Paediatnc Psvcholoev. 16,423428.
Fry, E. (1 977). Fry's readability graph: Clarifications. validity. and extension to level. Journal of Reading, 17,242-252.
Gale, A.G. (1993). Human response to visual stiiiiuli. In W. R. Hendee & J. Willenise (Eds.). The Perception of Visual Information. (pp. 127- 147). New York: Springer.
Gardner, M.F. (1 995). Tcst of Visual-Perce~tual Skills (Non-Motor). Burlingame. CA: Psycliological and Educational Publicatioiis.
Garzia. R.P.. Richman. LE., & Nicholson, S.B. ( 1990). A new visual-verbal saccade test: The devclopmental eyc movement test (DEM). Journal of American Ootometrist Association, 61, 124-135. -
Gaston, M. ( 1 985). Does the spina bifida c h i c need an ophthalmologist'? Zeitschrili Sur Kinderchirurgie. .IO(Supplernent 1). 46-50,
Gecht, M.R.. Connell. K.J.. Sinacore, J.M.. & Prohaska. T.R. (1996). A survey o f exercise beliefs and exercise habits among people with arthritis. Artliritis Care and Research.9(2). 82-88.
Gibler. D.C., & Childress. S.D. (1982). Languaye anticipation with a coniputer based scanning communication aid. Proceedines of the lEEE Compuier Societv Workshop on Comouting to Aid the Handicapped. (pp. 1 1- 15). Charlottesville, VA: IEEE.
Goodenougli-Trepagnier. C.. S: Roscn. M.I. ( 1 988). Predictive assessrnent for communication nid prescription: Motor-determincd miwirnum communication rate. The Vocallv Irnpaircd: Clinical Pnctice and Researcli. (pp. 1 67- 1 85). Philadclphia: Grunc and S tratton.
Greener, W.B.. Teny. R.C., Demasi. RA. , c!! Herrington. R.T. ( 199 1 ). Effect of race and grnder on neurologicai b e l in myclorneningocele. Dcvclopmental Medicine and Child Neuroloev. 33, 1 10- 1 1 7.
Griffin. J.R.. Christenson. G.N., Wesson, MD., & Erickson, G.B. (1997). Optometric btanagcment of Readinc Dvsfunction. Ncwton, MA: Buttenvorth-Hcinenirinn.
Gur, R.E. (1975). Conjugate lateral eye movements as an index of hemispheric activation. Neuropsvchofoei;i. 13.3544.
Hacker, B. ( 1980). Single subject research stntegies in occupational thenpy, Part 1. Arnencan Journal of Occuoational Theraw. 34(2), 103- 1 08.
Halliwell. M.D.. C m . J.. & Pearson, A.M. ( 1980). The intellectual and educational functioning of children with neural tube defects. Zeitschrift fur Kinderchirurgie. 3 1, 375-38 1.
Harbst, K.B.. Ottenbacher. K., B Harris, S. (1991). Intemter reliability of thenpists' judgements of graphed data. Phvsical Thera~v. 7 1 (2), 107- 1 15.
Harcourt, B. ( 1 974). S trabismus affecting children with multiple handicaps. British Journal of OphthalmoIogv. 58,272-280.
t-[ciilth Canada. (6- 16- 1999). A 1 lealtli Survcillancc Updatc on Catiüdiaii Lliildrcn riricf Youtli: Ncurai Tube Dckcis [Iiilormation postcd on tlic World Wide Wcb 1. Ruscn. 1. il. and McCourt, C.. Ministcr of Public Works and Govcrnnienl Scrviccs Canada. Retricvcd 5- t - 2000 from tlic World Widc Wcb http:llwww.hc-sc.gc.ca/hpb/lcdc/brcIdmeauin~mu~e~e.html
Heinisch. B.. & Hecht. J. ( 1992). A cornparison of six progrms: Word prediction sotlware. TAM Newsletter. 8(3), 4-8.
Higginbotharn, D.1. ( 1 992). Evaluation of keystroke savings across five assistive communication technologies. Augmentative and Alternative Communication. 8.258-272.
Higginbotliam. D.J.. ( 1993). Assessing augmentative and alternative coinmunication teclmology. Tcchnolo~v and Disribilitv. 2(3). 42-56.
1-Iigginbotham, D.J.. Bak. C.. Drazck. A.. Kelly. C.. & White. K. ( 1992). Word prediction in blS-DOS land. Coinrnunicatinr! 'Together, 1 O( 1 ). 10- 1 3.
Horstmmn. H.. & Levine. S.P. ( 199 1 ). The rffectiveness of word prediction. Proceeding of RENA 1 4th Annual Conïerence. Washington. DC: RESNA Press.
1-tullcy. S.B.. Gove. S.. Browncr. W.S.. & Cumniings, S.R. (1988). Clioosing the study subjccis: Specification and sampiing. in S. B. h i i e y & S. R. Cumrnings (Eds.). D e s i ~ n i n ~ Chica l Research. (pp. 18-30). Baltimore. MD: Williams & Wilkins.
Hunt, G.M., & Holmes. AB. ( 1 976). Factors relating to intelligence in treated cases of spina bifida. American Journa1 of Disabled Children. 130. 823-827.
Hunt. G.M., 81 Poulton. A. (1995). Open spina bifida: a complete cohort rcviewed 25 years after çlosure. Developmental Medicine and Child Neurologv. 37, 19-29,
Hunt-Berg, M.. Ranking. J.L.. & Beukelman. D.R. (1994). Ponder the possibilities: Cornputer supportcd witing for struggling witers. Leamine Disabilities Research and Practice, I2(3), 188- 1 94. -
Hurley. A.D.. & Bell. S. ( 1994). Educational and vocational outcome of adults with spina bifida in relationship to neuropsychological tesiing. Euro~ean Jounral of Pediatric Surgerv, 3(Suppl I), 17-18.
Jansen, J., Taudorf. K.. Pedersen. H.. Jesen, K., Seitzberg, A., & Smith, T. (1991). Upper extremity function in spina bifida. Childs Nervous Svstem. 7(2), 67-7 1.
Karlser, B., & Gardner. E.F. (1995). Stanford Diaenostic Reading Test Fourth Edition. San Antonio. TX: Harcourt Brace & Company.
Karol, L.A. (1995). Orthopedic management of myeIomeningocele. Neurosurgew Clinics of North America. 6,259-268.

Kazdin, A.E. (1 976). Statistical analysis for single-case experimental designs. In M. Hersen & D. H. Barlow (Eds.), Singie Case Research Designs: Methods for Ciinical and Applicd Settings. New York: Pergamon Press.
Kazdin, A.E. (1982). Single-Case Research Designs: Methods for Clinical and Applied Settings. New York: Oxford University Press.
Kemper. K.J., Cassileth, B. & Ferris, T. ( 1 999). Holistic pediatrics: A researcti agenda. Pediatrics, 103(4), 902-909.
Klauschie, J., & Rose, S.R. (1 996). Incidence of short stature in children with hydrocephalus. Journal of Pediatric Endocrinologv and Metabolism, 9(2). 18 1 - 1 87.
Klund, J., & Novak, M. ( 1995). If word prediction c m help, which program do vou choose? Paper presented at RESNA 18"' Annual conference at Vancouver, British Columbia.
Koester, t1.H.. & Levine, S.P. (1994a). Modeling the speed oftext entry with a word prediction interface. IEEE Transactions on Rehabilitation Engineering. 2(3), 177-1 87.
Koester. H.H.. & Levine. S.P. ( 1994b). Learning and performance of able-bodied individuals using scaming systems with and without word prediction. A ~ ~ l i e d Research. 42-53.
Koester, H.H., & Levine, S.P. ( 1996). Effect of a word prediction feature on user performance. Augmentative and Alternative Communication. 12, 155- 168.
Koester, H.H., & Levine, S.P. (1998). Mode1 simulations of user performance with word prediction. Augmentative and Alternative Communication, 14' 25-35.
Kntochwill, T.R., & Levin, J.R. (1992). Single-Case Research Desian and Analvsis. Hillsdale, NJ: Lawrence Erlbaum Associates.
Kulp, MT., & Schmidt. P.P. (1998). Relationship betwen visual skills and performance on saccadic eye movement testing. Optometru and Vision Science. 75(4), 284-287.
Kump, A. (1 992). Directions for scorine t v ~ i n e tests taken either on a tvpe writer or a cornDuter [Data file]. U.S. Department of Education. Office of Educational Research and improvement. ERIC Document Reproduction Service No. ED 356 269.
La Marca, F.. Herman. M.. Grant, J.A., & McLone. D.G. (1997). Presentation and management of hydrornyelia in children with Chain type-II malformation. Pediatric Neurosurgerv, 26(2), 57-67. -
Langer, S., & Hickey. M. (1999). Augmentative and alternative communication and natunl language processing: current research activities and prospects. Augmentative and Alternative Communication, 15, 260-268.
Laurence, KM., & Coates, S. (1 962). The natural history of hydrocephalus. Archives of Disabled Child, 37,345-362,
Law, M.. Baptiste, S.. Carswcll, A., EvlcColl, M.. Polatajko, II., Br Pollock. N. (1998). Caiiüdian Occupationai Perlorniance Measure. (3rd ed.). Ottawa, ON: CAOT Publications ACE.
Law, M., Baptiste, S., McColl, MA., Opzoomer. A.. Polatajko, H., & Pollock. N. (1 990). The Canadian Occupational Performance Measure: An outcome measure for occupational therapy. Canadian Journal of Occua~tional Therapv, 57(2). 82-87.
Law, M.. King, G.. & Pollock, N. Sinale Sub-iect Research Design. (1994). Report no. 94-2. Hamilton, ON: Neurodevelopmental Clinical Research Unit, Chedoke-Mcklaster Hospitals.
Law, M., Polatajko. H.. Baptiste. S.. & Townsend, E. (1997). Core concepts of occupational therapy. In Canadian Association of Occupational Therapy (Ed.), Enabline Occupation: An Occu~ational Therapv Perspective. (pp. 29-57). Ottawa, ON: CAOT Publications ACE.
Law, M., Polritajko. H., Pollock. N.. McColl. M.4.. Carswell. A., & Baptiste. S. (1994). The Canadian Occupational Performance blessure: Results of pilot testing. Canadian Journal of Occu~ational Therapv. 6, 19 1 - 197.
Lemerstrand. G., Gallo. J.E., & Samuelson, L. (1 990). Neuro-opthalmologicd findings in relation IO CNS lesions in patients with myelomeningocele. Develo~rnental Medicine and Child Neurologv, 32,42343 1.
Lewis, R.B., Graves, A.W.. Ashton. TM.. & Kieley, C L . (1998). Word processing tools for students with leaming disabilities: A cornparison of stntegies to increase text entry speed. Learning Disabilities Research and Pnctice. l3(2), 95-1 08.
Lie, KR. , Lagergren. J.. & Rasmussen, F. (1 99 1). Bowel and bladder control of children with myelomeningocele: A Nordic study. Developmental Medicine and Child Neuroloav. 33. 1053-1061.
Lollar, D. J. (1993). Leamine amone Children with Spina Bifida. Washington, DC: Spina Bifida Association of Arnerica.
Loss, N., Yeates, K.O., & Enrile. B. (1996). Attention in children with rnyelomeningocele. The Clinical Neuropsvchologist, 10,7-20.
Ludbrook, J., & Dudley, H. (1998). Why permutation tests are superîor io t and F tests in biomedical research. The American Statistician. 52(2), 127- 132.
MacArthur. C.A. (1 996). Using technology to enhance the writing processes of students with learning disabilities. Journal of Learninc! Disabilities. 29(4), 344-354.
MacArtliur, C.A. (1998). Word processing with speech synthesis and word prediction: Effects on the dalogue journal writing of students with learning disabilities. Learning Disabilitv Quarterlv. 21, 151-165.
MacArthur, C.A. (1999). Word prediction for students with severe spelling problems. Learnins Disabilitv Ouartcrly, 22, 1%- 172.
Maliuriii, R. K., Bctiignics. B. 11.. t Pirozzolo. F. J. (199 1) . Struciured assessiiicnt of inde pendent living skills: Preliminary report of a performance measure of functional abilities in dementia. Journal of Gerontology. 46, 5866.
M m r , L.M., Aylward, G.P., Colliner. F.. Stacy, L.. & Menelaus, M. ( 1988). Impaired mental capabilities and hand function in myelomeningocele. Zeitschrift fur Kinderchirureie. 43, 24-27.
McColl. M.A.. Paterson. M., Davies. D., Doubt, L.. & Law, M. (2000). Validity and community utility of the Canadian Occupational Performance kleasure. Canadian Journal of Occuautional Thcrapv. 67(1). 23-30.
McGonigIe, J.J., Rojahn. J., Dixon. J., & Strain. P.S. (1987). Multiple treatment interference in the alternating trcaimenis design as a function of the intercomponent inierval Icngtli. Journal of Behavior Analvsis. 20, 17 1-1 78.
McLone, D. G. (1992). Continuing concepts in the management of spina bifida. Pediatric Neurosurperv. 18,254-256.
McLone, DG., Czyzewski. D.. Raimondi. A.. & Sommers. R. (1982). Central nervous system infections as a limiting factor in intelligence of children with niyelomeningocele. Pcdiatrics, 70,338-342.
McReynolds. L.V.. & Keams, K.P. (1983). Single-Subiect Experirnental Desiens in Communicative Disorders. Baltimore, MD: University Park Press.
Mew, M.M.. & Fossey, E. (1996). Client-centred aspects ofclinical reasoniny during an initial assessment using the COPM. Australian Journal of Occupational Tlierapv. 43, 1 55- 1 66.
Miller, E., & Sethi. L. (197 1). The effect of hydrocephalus on perception. Develoamental Medicine and Child Neuroloev. 13 (Suppl. 25),77-8 1.
Minkel, J.L. (1 996). Assisiive technology and outcome measurement: Where do we begin? Technologv and Disabilitv. 5,285-288.
Minns. R. ( 1 984). The management of children with spina bifida and associated hydrocephalus. In N. Gordon & 1. McKinlay (Eds.), Neurolo~icallv Handicaooed Children: Treatment and Management. (pp. 82- 108). Oxford: Blackwell Scientific Publications.
Mirsky, A., Bruno, A., Duncan, C., Ahearn, M., & Kellam, S. (1991). Analysis of the elements of attention: A neuropsychological approach. Neuroos~cholo~v. 2(2), 109- 145.
Morris, C., Newell. A.F.. Booth, L., Ricketts, I., & Amott, J. (1992). Syntax PAL: A system to improve the written syntax of language-impaired usen. Assistive Technoloev. 4, 5 1 -59.
Morrison, C.D., Mctzgcr, l'.. & Pratt. 1W. (1996). Play. In J. Casc-Siiiith. A. S. Allcii. & P. N. Pratt (Eds.), Occu~ational Therapv for Children. (pp. 504-523). St. Louis, MO: Mosby.
Muen, W.J., & Bannister. C.M. (1997). Hand Sunction in subjects with spiiia bitIda. European Journal of Pediatric Sureerv. ï(Supp1. 1 ). 18-22.
Newell, A.F.. Arnott, J.L., Booth, L., Beattie. W., Brophy, B., & Ricketts, I.W. (1992). Effect of the "PAL" word prediction systrm on the quality and quantity of text generation. Augmentative and Alternative Communication. 8,304-3 1 1 .
Newell, A.F.. Booth. L.. & Beattie, W. (1 99 1 ) . Prcdictive lext entry with PAL and children with learning difficulties. British Journal of Educational Technolorv, 22( l), 23-40.
Nourbakhsh. MR., & Ottenbacher. K.J. ( 1 994). The statistical analysis of single-subject data: A comparative examination. Phvsical Tliera~v. 74(8), 23-40.
Oliver, C.E. (1990). A sensormotor program for improving writing readincss skills in elenientary-age cliildren. American Journal of Occu~ational Theraov. 44, 1 1 1 - 124.
Oman R.& King A.C. ( 1998). Predicting the adoption and maintenance of exercise participation using self-eftïcacy and previous exercise participation rates. American Journal of Health Promotion, 133). 154- 16 1
Ontario Ministry of Education. (4-26-2000). Ontario's Plan for Reform: Bctter-Educated Students for a Brighter Future [Information posted on the World Wide Web]. Qucen's Printer for Ontario. Retrieved 5-1 -2000 from the World Wide Wcb http://~n~v.edu.gov.on.cden~docurnentibrochure/excele. html
Ottenbacher, K.J. (1986). Evaluatinn clinical change: Strate~ies for occutiational and phvsical therapists. Baltimore. MD: Williams & Wilkins.
Ottenbacher, K.J. (1 992). Analysis of data in idiographic research: Issues and methods. Journal of Physical Medicine and Rehabi liiation. 7 1 (4), 202-208.
Oxley, J.D., & Noais, J.A. (2000). Children's use of rnemory strategies: Relevance to voice output comrnunicrition aid use. Augmentative and Alternative Communication, 16, 79-94.
Pagano, M., & Gauvreau, K. ( 1 992). Princioles of Biostatistics. Belmont. CA: Wadsworth Publishing Company.
Pavchinski, P., Evans, J.H.. & Bostow. D.E. (1989). Increasing word recognition and math ability in a severely leaming-disabled student with token reinforcers. Psvcholoev in the School. 26(4), 3974 1 1 .
Pearson, A.M., Carr, J.. & Halliwell, M.D. (1988). The handwriting of children with spina bifida. Zeitschnfi hir Kinderchirureie. 43(Supplement 2), 40-42.
Pender, N. J. (1987). Health Promotion in Nursing Practice. Norwalk, CT: Appleton.
Petty, L., Treviranus, J.. & Weiss. P. (1999). Outcome measures in vision iechnology: An application of the Canadian Occupaiional Therapy Measure. Proceedincs of the 22nd Annual Conference of RESNA. (pp. 192- 194). Arlington. VA: RESNA Press.
Phelps, J., Stempel, L., & Speck, G. (1984). The Children's I-landwriting Evaluation Scale: A New Diagnostic Tool. Texas Scottish Rite Hospital for Crippled Children.
Phelps, J., Sternpel, L.. & Speck, G. (1985). The children's handwriting scale: A new diagnostic tool. Journal of Educat ion Research, 79(46), 50
Pollock, N. & Stewart. D. (1998). Occupational performance needs of school-aged children with physical disabilitics in the comniunity. Phvsical and Occupational Therapy in Pediatrics,
55-68.
Porac, C., 8: Coran. S. ( 1986). Sigliting doniinance and egoccntric localizatioii. Vision Rcscarcli, 26(10), 1709-1713. -
Purdue Peeboard Test: Instruction and Normative Data for Mode! 32020. (2000). Lafayette. IN: Lafayette Instrument Co.
Rajewski, W. J., Ettinger jr, W.H., klmin. K.. & Morgan, T. (1998). Treating disability in knec osteoarthritis with exercise therapy: A central role for self-efficacy and pain. Arthritis Carc and Rcscarc h, 1 1 (2), 94- 1 0 1 .
Reid, D.T., Rigby, P., & Ryan, S. (1999). Functional impact of a regid pelvic stabilizer on children with cerebral palsy who use wheelchairs: Users' and caregivers' perceptions. Pediatric Rehabilitation. 3(3), 10 1 - 1 1 8.
Reisman, J.E. (1 993). Development and reliability of the research version of the Minnesota Handwriting Test. Phvsical and Occupational Thera~v in Pediatrics. 1 j(2). 4 1-55.
Richards, J.S., Nepomucleno, C.. Riles, M.. & Suer. 2. (1982). Assessinp pain behaviour: the UAB pain behaviour scale. Pain. 14, 393-398.
Richman, LE., 8i Garzia. R.P. (1987). Developrnental Eve Movernent Test (DEM). South Bend. IN: Burnell Corp.
Rogers, R. W. (1983). Cognitive and physiological processes in fear appeals and attitude change: A revised theory of protection motivation. In J.T. Cacioppo & R.E. Petty (Eds), Social Psvchoph~sioloev: A Source Book. New York: Guildford.
Samuelsson. L., Bergstrom. B.. Thomas. K.A.. Hemmingsson, A.. & Wallensten, R. (1987). MR imaging of syringohydromyelia and Chiari malformation in myeiomeningocele patients with scoliosis. American Journal of Neurondiolopv, 8, 539-546.
Sand, P., Taylor, N., Hill. M.. Kosky, N., & Rawlings, M. (1974). Hand function in children with myelomeningocele. American Journal of Occu~ational Theraov. 28,87090.
Sandler. A. (1997). Living - with spina bifida: A guide for families and professionals. Chape1 Hill. NC: The üniversity of North Carolina Press.
Scheiman. M. ( 1997). Understanding and Manaeine Vision Deficits: A Guide for Occupational Therapists. Thorofare. NJ: Slack Inc.
Scherer. M.J. ( 1996). Introduction to outcomes measurement. Technolow and DisabiIitv. 5. 283- 3 8 4
Scherer. M.J. & Galvin. J.C. ( 1997). Outcomes and assistive technology. Rehabilitation Management, 1 O, 103- 105.
Schunk. D.H. & Gunn. T.P. ( 1985). Modeled importance of iask strategies and achievernent beliefs: Effect on self-efficacy and ski11 development. Journal of Educational Research. 79. 238-244. -
Schunk. D.H. & Rice. J.M. (1986). Extended attributional feedback: Sequencr effects during remedial reading instruction. Journal of Earlv Adolescence.6. 55-66.
Schunk. D.H. ( 199 1 ). Lcarning Theories: An Educatinal Perspective. New York: MacMillan Publishing Company.
Scott. MA.. Fletcher. J.M.. Brookshire. B.L.. Davidson. K.C.. Landry. S.H.. Bohan. T.C.. Kramer. LA. . Brandt. ME.. & Francis. D.J. (1998). Memory functions in children with rarly hydrocephalus. Neuroosvcholo~v. 12(4). 578-589.
Sculi. J.. & Hill. L. ( 1988). A computerized communication message preparation progrm that "lrms" the user's vocabulary. Auementative and Alternative Communication. 4.40-43.
Sekhar. L.. Moossy. J.. & Guthkrlch. N.G. (1982). Malfunctioning ventriculoperitoncal shunts. Journal of Neurosureerv. 56.4 1 1 -4 1 6.
Srrgeant. J. ( 1996). A theory in attention: An information proccssing perspective. In G. R. Lyon & N. A. Krasnepor (Eds.). Attention. Memorv and Executive Function. (pp. 57-69). Baltimore: P. H. Brooks Publishing Company.
Shaer. C.M. (1997). The infant and young child with spina bifida: Major medical concerns. Infants and Young Children. 9(3). 13-15.
Shaffer. J.. Freidrich. W .N.. S hurtleff. D.B.. & Wolf. L. ( 1985). Cognitive and cichievernent status of children with myelomeningocele. Journal of Paediatnc Psvcholo~~. 1 O: 325- 335.
Sheslow. D. & Adams. W. ( 1990). Wide Rame Assessrnent of Memorv and Learninq. Wilmington. DE: Jastak.
Smith. R.O. ( 1996). Measuring the outcomes of assistive technology: Challenge and innovation. Assistive Technolop. 8. 7 1-8 1.
Soede, M., & Foulds. R A . (1 986). Dilemma of prediction in conimunication aids and mental load. Proceedines of RESNA 9th .Annual Conference. (pp. 357-359). Washington. DC: RESNA Press.
Steinbook, P.. Levine, B., Cochrane, D.D.. & Invin, B.J. (1992). Long-term outcome and complications of cliildren boni with myelon~rningocele. Cliild's Nervous Svstem. 8. 92- 96.
Stickel, S. (1998). An Analvsis of Visual Perception and Visual Attention Skills in School-Aged Children with Spina Bi fida and Shunted Hvdrocephalus: An Initial Investigation. -
Unpubiished master's thrsis. University of Toronto, Toronto, Ontario. Canada.
Stromgren, B.. 9r Kolby. L.J. ( 1 996). The altemating treatments design: Little used and olien confused? Scandinavian Journal of Bchaviour Tliera~v. 25, 127- 138.
Struck, M. (1996). Augmentative communication and cornputer ricccss. In J. Case-Smith S( il. S. Allen (Eds.), Occu~ational Therapv for Children. (pp. 545-561). St. Louis. MO: Mosby.
Swiffin, AL. . Arnott. J.L.. Pickering. J.A.. & Newell. A.F. ( 1987). Adaptive and predictive techniques in a communication prosthesis. Auamentative and Alternative Communicationi 3, 18 1 - 19 1.
Tarn, C., Marsliall. P.. Nantais. T.. Nishiyama. R.. Shein. F., Stoddart. P.. & Temprile. J. (1999). us in^ Word Prediction and Text-to-Speech to [mprove the Writing of Persons with le am in^ Disabilities: Desien and Implementation Considerations. Paper presented at Closing the Gap Conference at Minnieapolis, MN.
Tashima. M., Kaplan. R.. & Ries, A. (1990). Experimental evaluation of rehabilitation in chronic obstructive pulmonary diseases: short-term efkcts on exercise endurance and health status. Health Psvcholocv, 9,237-352.
Taylor, S. (1999). Behavioral assessment: Review and prospect. Bchaviour Research and Thera~v. 3 7(5).475-482.
Tew, B. ( 1 977). Spina bifida children's scores on the Wechsler Intelligence Scale for Children. Perceritual & blotor Skills, 44, 38 1-382.
Tew. B. (199 1). The effects of spina bifida and hydrocephalus upon learning and behaviour. In C. Bannister & B. Tew (Eds.), Current Concept in S ~ i n a Bifida and Hvdroce~halus. (pp. 158- 179). New York: Cambridge University Press.
Tew, B., & Lawrence, K.M. (1 975). The effects of hydrocephalus on intelligence, visual perception and school attainrnent. Develo~mentd Medicine and Child Neuroloev, 1 7(Supplement 3 9 , 128- 134. -
Tew, B., Laurence, KM.. & Richards, A. (1980). Inattention among children with hydrocephalus and spina bifida. Zeitschri fi fur Kinderchirureie. 3 l(38 1 ), 385
'TcxtHelp! Read & Write 4 [Computcr Soliwarcl. (1000). Antrium. North Ircland: Loricii Systems.
Toomcy, M.. Nicliolson. D. & Carswell. A. (1995). Tlic clinical utility of the COPM: :\ study of comrnunity bascd occupational tiicrüpists. Canadian Jouriial OC Occupahnl T\icrapv. 62. 242-349.
Torgescn, J.K. ( 1996). A modcl ot'nicmory Sroni an information proccssing perspcctivcs: l'lic special çasc oS plionoloyical mcniory. In G. R. Lyon 9r N. A. Krasnegor (Eds.). Attention. Memon. and Executive Funciion. (pp. 1 57- 1 84). Baltimore: P.11. Brookes Publisliinp Company.
l'reviranus. J.. & Norris. L. (1987). Predictive programs: Writing tools h r sevcrcly pliysically disabled studcnts. Proceedinas of RESNA I O t l i Annual Confcrciicc. (pp. 130- 132). Washington. DC: RESNA Press.
Tscng. b1.E 1.. Sr Cermak. S.A. ( 1993). Tlie influence of ergonornic factors and perccptual-motor abilities on handwriting pcrlormance. Amcrican Journal of Occunational Tlicrapu. 47. 9 17-926.
Vanderlieiden. G.C. ( 1990). Tcmporal relationship of the coniponents of the sclection act [Abstract]. Auumcntativc and Alternative Communication. 6, 94
Vanderheidcn. G.C.. Sr Kelso. D.P. (1987). Cornparativc analysis O C fixcd-vocabulary communication accelcration techniques. Auemcntative and Alternative Conimunication, 3. 196-306. -
Venkatagiri. 1-{.S. ( 1 994). Effect of window size on rate of communication in a lexical prcdiction AAC sysiem. Augmentative and Alternative Communication. 10. 105- 1 12.
Wallace. S.J. (1973). The etrect of upper limb function of cliildren on mobility of cliildren wiili myelomeningocele. Devclopmental Medicine & Child Neurolow. I j(Supp1 29). 8 4 9 1 .
Waller. A., Brattie. W.. & Newell. A.F. (1990). Using a predictive word processor: A case study [Abstraçtj. Augmentative and Alternative Communication. 6 . 1 38
Walter, C.A.. & Marks. S.E. (198 1). Experiential Learning and Change: Theorv Design and Practice. New York: John Wiley 8: Sons.
Wang. A. & Richarde. R.S. (1987). Development of memory monitoring and self-efficacy in c hiidren. Psvchological Reports.60,647-65 8.
Ward. M.M. (1994). Clinical measures in rheumatoid arthritis: which are rnost useful in assessing patients? Journal of Rheumntoloev. 2 1 (1 ). 1 7-27.
Wassem. R. (1992). Self-efficacy as a predictor of adjustment to multiple sclerosis. Journal of Neuroscience Nursing. 24,224-239.
Wechsler, D. (1991). Weciisler Intellieence Scale for Childrcn- ïhird Edition bIanual. New York: Psychological Corp.
Wilcox, A. (1994). A Studv of Verbal Guidance for Children with Devclopmental Coordination Disorder. Unpublished master's ihesis, University of Western Ontario, London. Ontario.
Willoughby, R.. & Hol'fiiian. R. (1979). Cognitive and perceptual impairments in childrcn with spina bifida: A look at the evidence. S ~ i n a Bifida Therapv. 2, 127-1 34.
Wills, K.. Holmbeck. G.. Dillon. K.. 81 McLone. D. (1990). Intelligence and acliievment in cliildren witli niyclomeningocele. Journal of Pediatric Psvclioloev. 15. IO 1 - 176.
Wills, K.E. ( 1993). Neuropsychological functioning in children with spina bifida andor hydrocephalus. Journal of Clinical Cliild Psvchology. 2?(2), 347-265.
Wolery, M., & t h r i s . S. (1982). lntcrpreting results of single-subject resrarch design. Phvsical Therapv. 63(4). 445-453.
Woltosz. W. (1 990). A Word about Word Prediction. Paper presented at CAEvIA Workshop.. Toronto, ON.
Workman. E.A.. Workman. B.L.. Sr klaclin. J. ( 1 979). Visual and auditory stimulus prescntation factors in the behavioral treatnient of illegiblc handwriting. Corrective and Social Pschiatrv and Journal of Beliavior Tec1inolorrv Method and Therapv. 25(J). 12% 133.
Wright, J.G.. Rudicel, S. d Feinstein. A R . (1994). Ask patients what thcy want. Evaluation of individual complaints bcfore total hip replacement. Journal of Bone & Joint Sureen; - British Volume, 7612). 2 9 - 3 4
WriteAway 2000 [Cornputer Software]. (1999). St. John's, Newfoundland. Canada: Information Services Inc.
Yeates, K.O., Enrile. B.. & Loss, N. (1995). Verbal learning and memory in children with myelomeningoccle and shunted hydrocephalus. Journal of Pediatric Psycholonv. 10. 80 1- 8 15.
Yeates. K.O.. Enrile. B.. & Loss. N. (1998). Spina bifida and hydrocephalus. In C. E. Coffey & R. A. Brumback (Eds.). Textbook of Pediatric Neuro~svchiatrv. Washington. D. C.: American Psychiatrie Press.
Ziviani. J.. Hayes. A.. & Chant, D. (1990). Handwriting: A perceptual-motor disturbance in children with myelomeningocele. The Occu~ational Theraav Journal of Research. 1 O(1). 10-26.
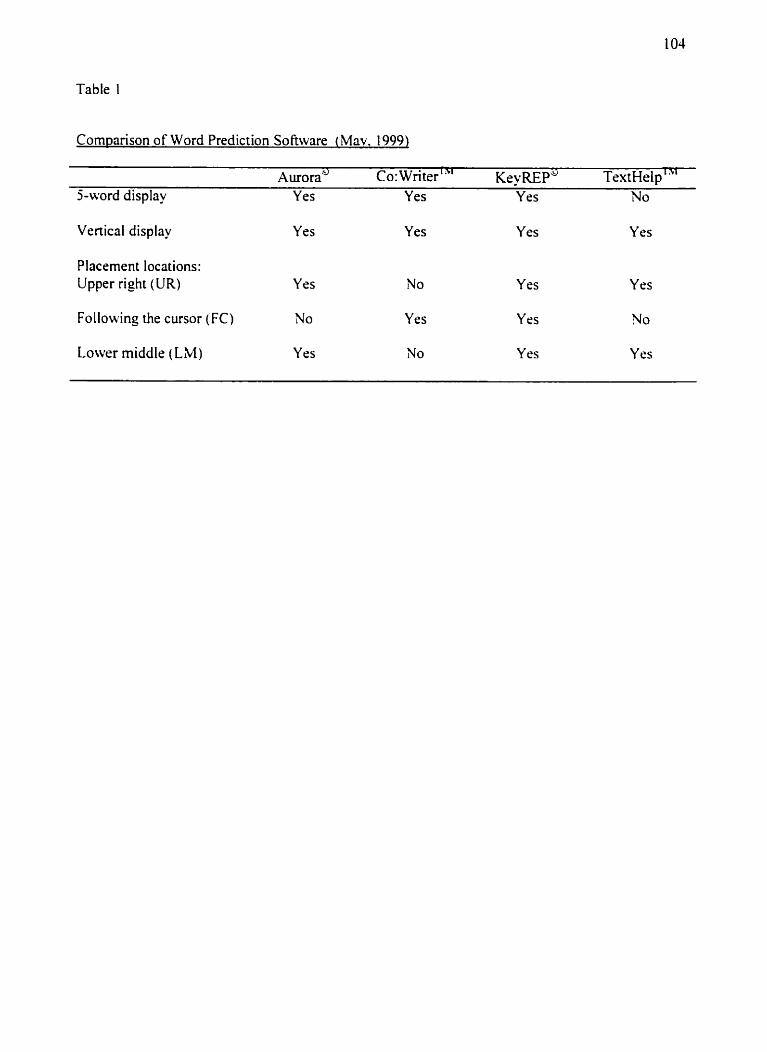
Table 1
Cornparison of Word Prediction Software ( Mav. t 999)
~urora' CO: Writer "" K ~ ~ R E P " TextHelp '" 5-word display Yes Y es Y es No
Vertical display Y es Y es Y es Y es
Placement locations: Upper right (UR) Y es No Y es Y es
Following the cursor (FC) No Yes Y es No
Lower middle (LM) Y es No Y es Y es
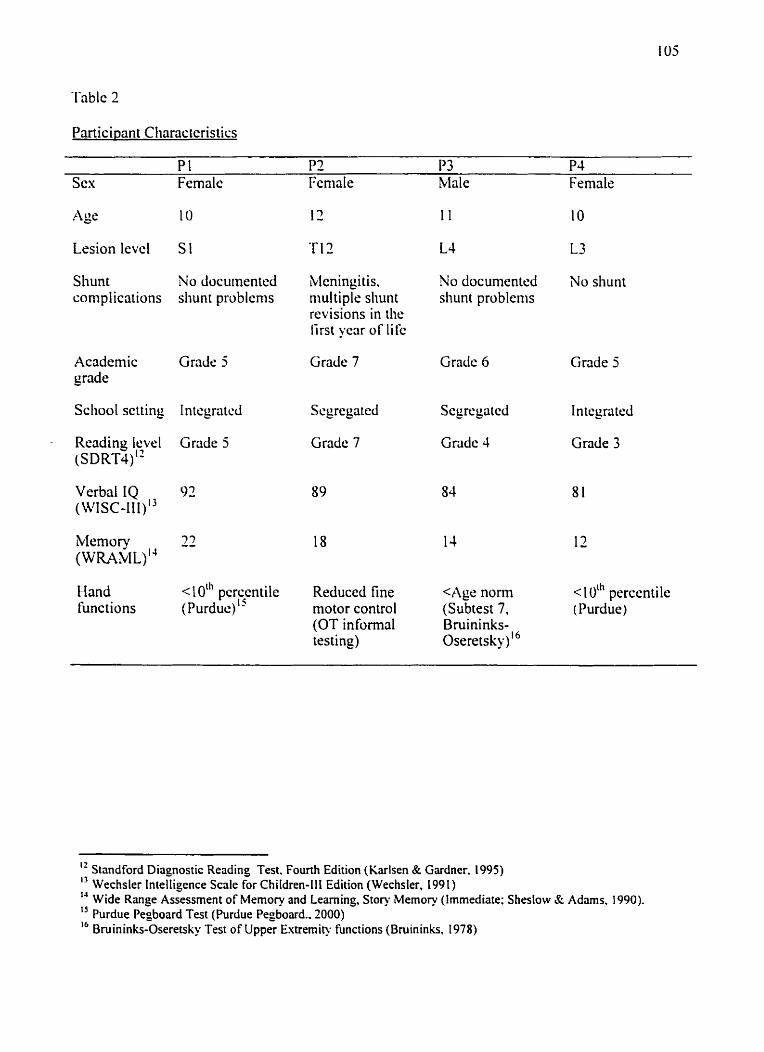
Participant CIiaractcristics
P I P2 P? P4 Sex Female Female Male Female
Lesion level S 1 'ri3 L4 L3
Shunt No docuinented bleningitis. No documcntt.d No shunt complications sliuntproblenis multiplesliunt shunt problcms
revisions in the lirst ycar of lifc
Academic Gracie 5 Grade 7 Grade 6 Grade 5 grade
Scliool setting Integratcd Scgregated Scgregatcd In tcgrrited
Reading level Grade 5 Grade 7 Grade 4 Grade 3 (SDRT~)"
ttand < I oLh pcrqentile Reduced fine <Age nom < I uLh pcrcentile functions (purduc)" motor control (Subtest 7, (Purdue)
(OT informal Bruininks- trsting) Oseretsky ) l 6
" Standford Diagnostic Reading Test. Fourth Edition (Karlsen & Gardner. 1995) 13 Wechsler Intelligence Scale for Children-III Edition (Wechsler, 199 1 ) 14 Wide Range Assessrnent of Memory and Learning, Story Memory (Irnmediate; Sheslow & Adams. 1990). 1s Purdue Pegboard Test (Purdue Pegboard.. 2000) 16 Bniininks-Oseretsky Test of Upper Extremity functions (Bruininks, 1978)
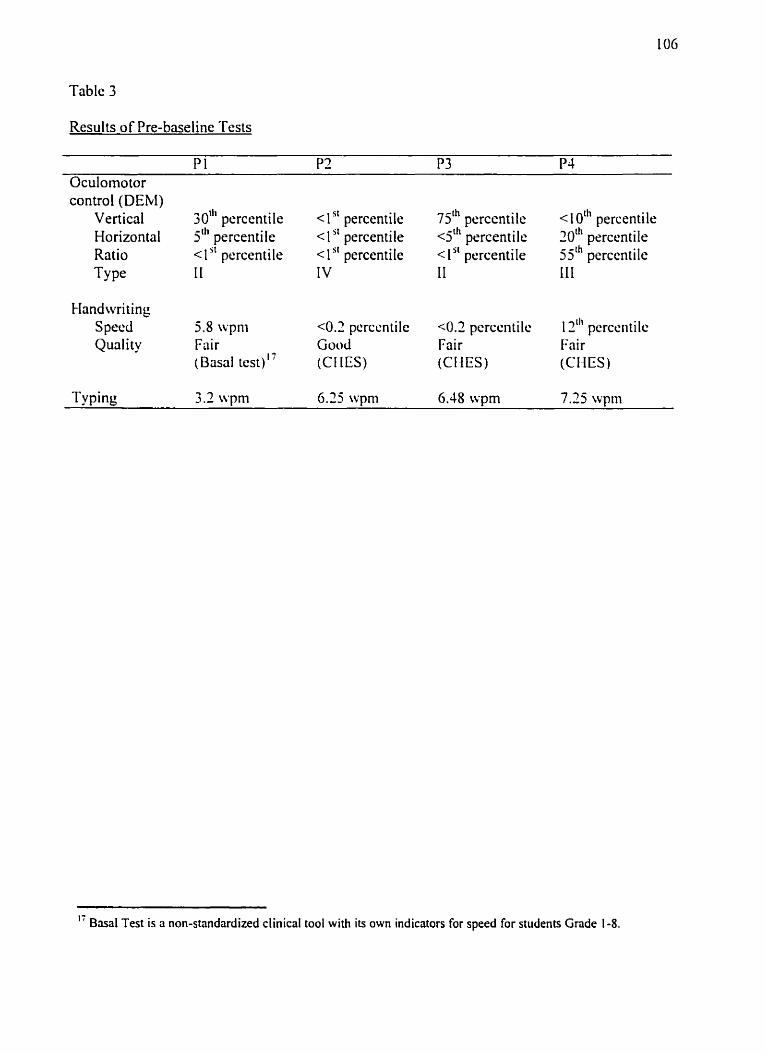
Table 3
Results of Pre-baseline Tests
Oculomo tor control (DEM)
vertical ' 30"' pcrcentile < 1 " percentile 7j th percentile < 1 o ' ~ percentilr Horizontal 5'h percentile < 1 " percentile <jth prrcentile 20"' percentile Ratio < I percentile < 1 " percentile < 1 " percentile j j l h perccntile TY pe I I IV I I 1 II
Clandwriting S pecd 5.8 wpni cO.2 perccntile < O 2 pcrccntilc 12'" pcrcciitilc Quality Fair Good Fair ETai r
(Basal test) " (Ct E S ) (cl IES) (CI [ES)
Typing 3.2 wpm 6.35 wpm 6.38 wpm 7.75 wpm
1: Basal Test is a non-standardized clinical tool with its own indicators for speed for students Grade 1-8.
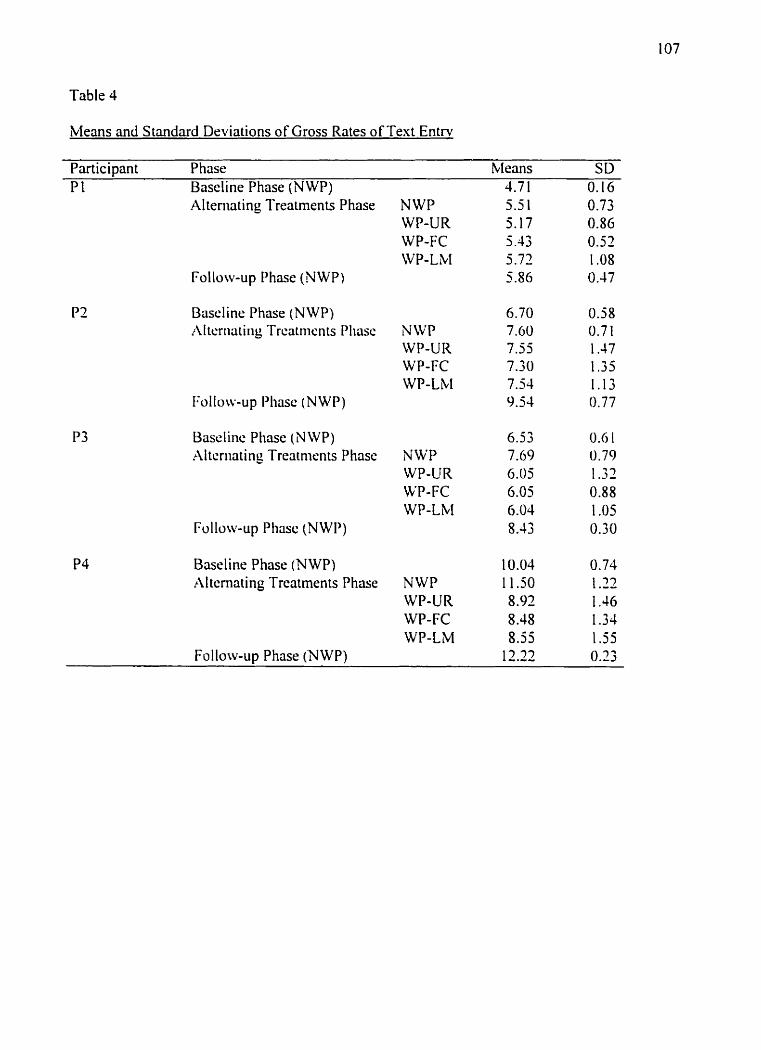
Table 4
Means and Standard Deviations of Gross Rates of Text Entw
Participant Phase Means SD P 1 Baseline Phase (NWP) 4.7 1 O. 16
Alteniating Treatrnents Phase N WP 5.5 1 0.73 WP-UR 5.17 0.86 WP-FC 5.43 0.52 WP-LM 5.72 I .OS
Follow-up Phase (NWP) 5.86 0.47
Briscl ine Phase (N W P) 6.70 0.58 Al tcrrirttiiig Trcatments Plinsc N W P 7.60 0.7 1
WP-UR 7.55 1.47 WP-FC 7.30 1.35 WP-Lbl 7.54 1.13
Follow-up I'liase (NWP) 9.54 0.77
Baselinc Phase ( N WP) 6.53 0.6 I Altcriiating Treatments Phase NWP 7.69 0.79
WP-UR 6.05 1.33 WP-FC 6.05 0.88 WP-LM 6 .O4 1 .O5
Follow-up Plirisc (NWP) 8.43 0.30
Baseline Phase (NWP) 10.04 0.74 Al temating Treatments Phase N W P 1 1.50 1.22
WP-UR 8.92 1.46 WP-FC 8.48 1.34 WP-LM 8.55 1.55
Follow-up Phase (NWP) 12.22 0.23
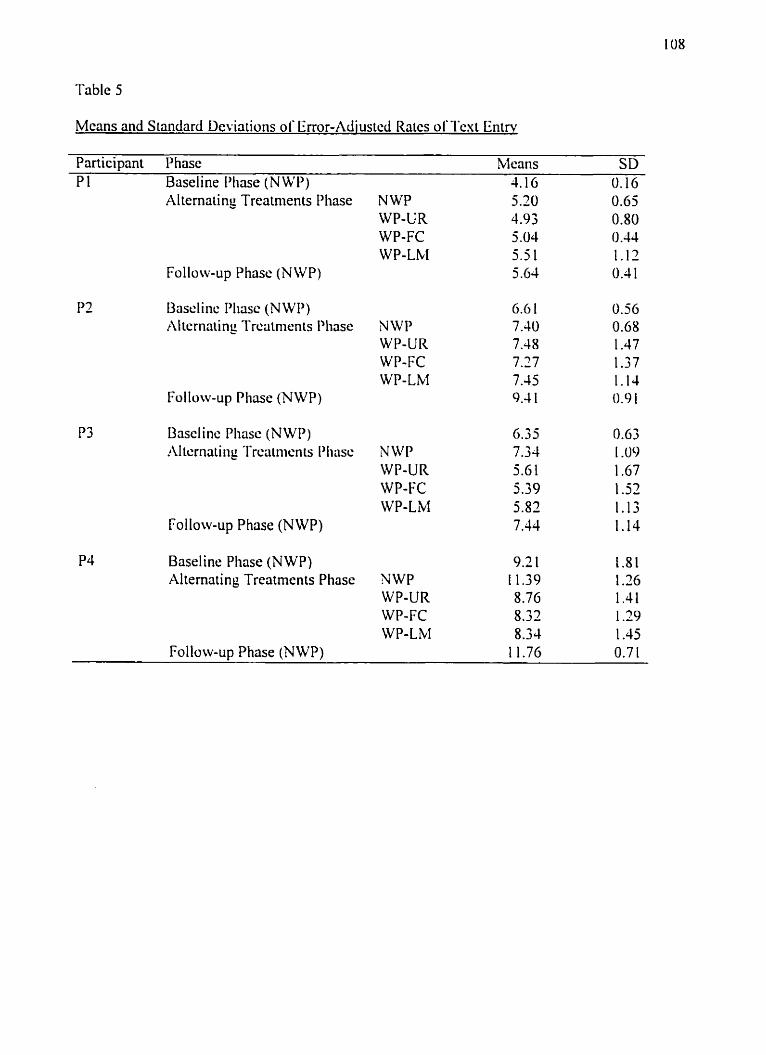
Table 5
Mcans and Standard Dcviatioris O C Error-Adiustcd Ratcs o1"l'cxt Entrv
Participant Phase blcans SD P 1 Baseline Pliase ( N W 1') 4.16 O. 16
Altemaiing Treatments Pliase N WP 5 2 0 0.65 WP-UR 4.93 O. 80 WP-FC 5 -04 0.44 WP-LM 5 .5 1 1.13
Follow-up Phase (N WP) 5.64 0.4 1
Base1 i 11c. I'lirisc (N LVP) 6.6 1 0.56 Alternahg Trmtrnents Phase N WP 7.40 0.68
WP-UR 7.48 1.47 WP-FC 7.27 1.37 WP-LM 7.45 1. 14
Follow-up Phase (NWP) 9.4 1 0.9 1
P3 Bascl ins Pliasc (NWP) 6.35 0.63 Al tcrnatiiig Trcaimcnts Pliasc N WP 7.34 1 .O0
WP-UR 5.6 1 1.67 WP-FC 5.39 1.52 WP-LM 5.82 1.13
Follow-up Phase (NWP) 7.44 1.14
P3 Baseline Phase (NWP) 9.2 1 1.81 Alternating Treatments Phase NWP 1 1.39 1.26
WP-UR 8.76 1.41 WP-FC 5.32 1.29 WP-LM 8.34 1.45
Follow-up Phase (N WP) 1 1.76 0.7 1
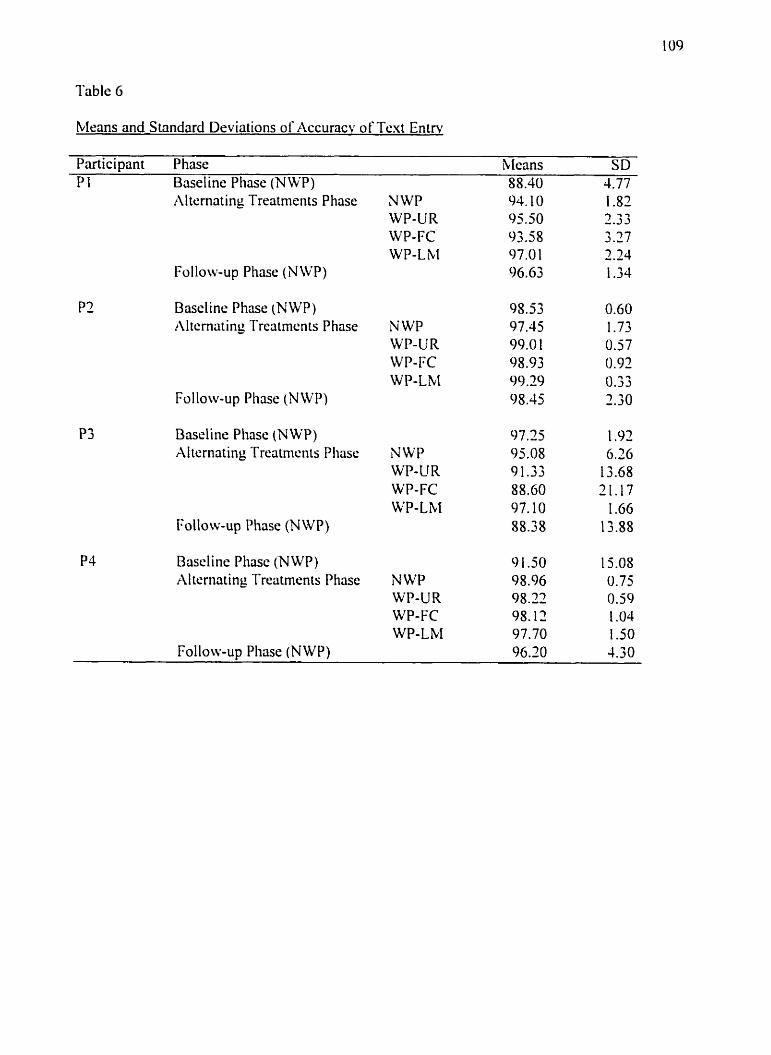
Table G
Means and Standard Deviations of Accuracv of Tcxt Entry
Participant Phase Means SD PI Baseline Phase (N WP) 8 8.40 4.77
Altcrnating Treritments Phase N WP 94.10 1.82 WP-UR 95.50 2-23 WP-FC 93.58 3 .27 WP-Lhl 07.0 1 2.24
Follow-up Phase (NWP) 96.63 1.34
P3 Bascline Phase (NWP) 95.53 0.60 Altcrnating Treatmcnts Phase N WP 97.45 1.73
WP-UR 99.0 1 0.57 WP-FC 95.93 0.92 WP-LM 99.29 0.33
Follow-up Phase (NWP) 98.45 2.30
P3 Bascline Phase (N WP) 97.25 1.92 Altcrnating 'Treatmenis Pliase N WP 95.08 6.26
WP-UR 9 1.33 13.68 WP-FC 88.60 31.17 WP-LM 97.10 1.66
Follow-up Phase (N WP) 5 8.3 8 13.88
P4 Basclinc Phase (NWP) 9 1.50 1 5.08 Alteniiiting Treatrnents Phase NWP 98.96 0.75
WP-UR 98.22 0.59 WP-FC 95.12 1 .O4 WP-LM 97.70 1.50
Follow-up Pliase (NWP) 96.30 4.30
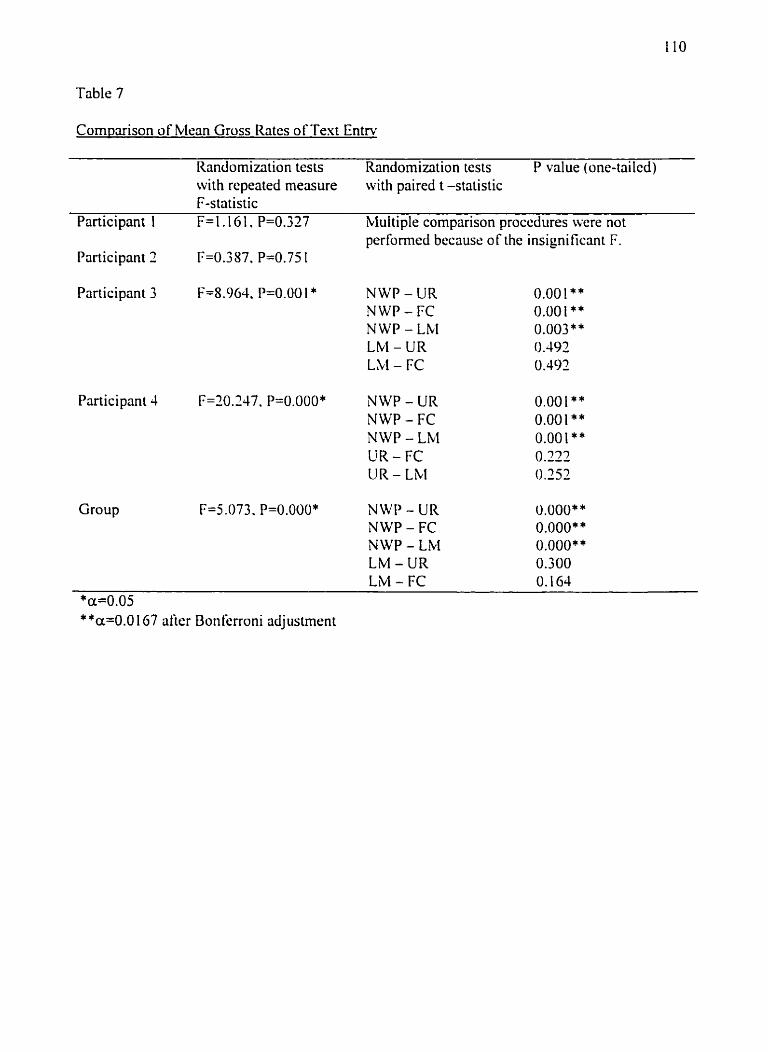
Table 7
Cornparison of h k a n Gross Rates of Text Entrv
tiandomimtion tests Randomimtion tests P value (one-tailcd) with rcpeated measure with paired t -statistic F-statistic
Participant 1 F= 1.16 1. P=0.327 bluitiple cornparison proccdures were not perfomed because of the insignificant F.
Participant 2 F=0.357, P=0.75 1
Participant 3 F4.964, P=O.OO 1 * NWP - UR 0.001 ** NWP - FC 0.001 * * N W P - LkI 0.003** L M - UR O .492 LIbf - FC 0.492
Participant 4 F=20.247. P=0.000* NWP - U R NWP - FC NWP - LM U R - F C UR - Lbl
Group F=5.073. P=O.OOO* NWP - UR 0.000* * NWP - FC O.OOO* * NWP - LM 0.000" * LM - UR 0.300 LM - FC 0.164
*a=O.05 **a=0.0 167 after Bonferroni adjustment
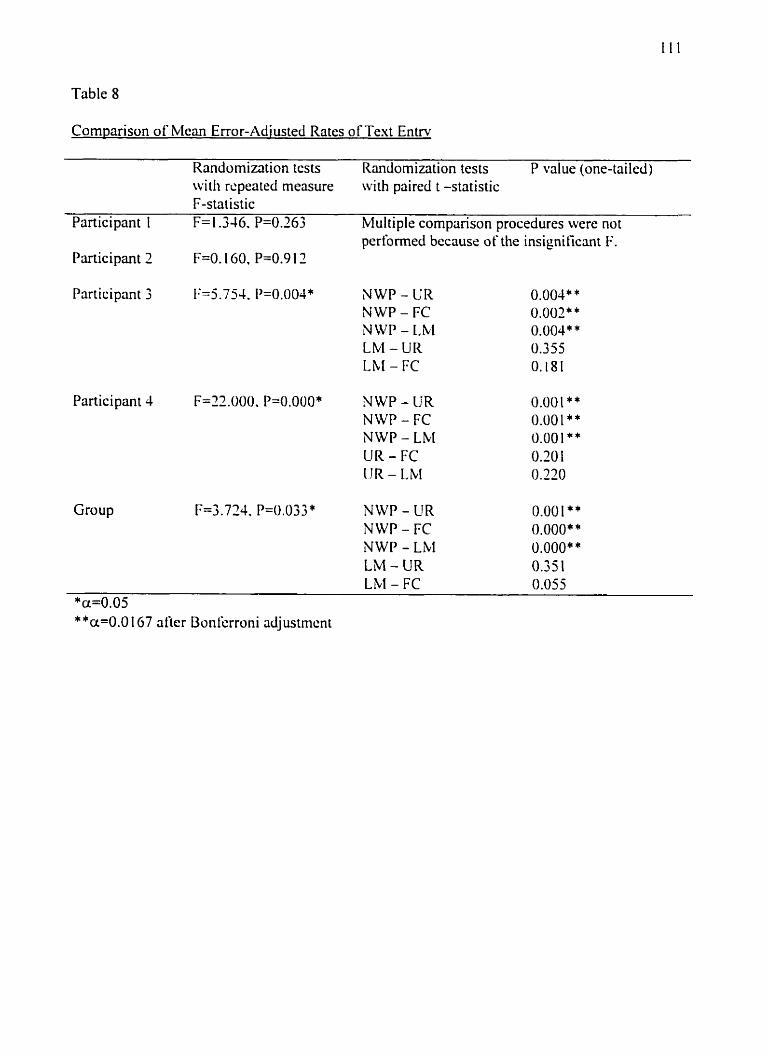
Table 8
Cornparison of Mean Error-Adiusted Rates of Text Entrv
Randomization tests Randomization tests P value (one-tailed) witli repeated rneasure with paired t -statistic F-statistic
Participant 1 F= 1.3 46, P=0.263 Multiple cornpanson procedures were not perfortned bccause of the insignificant F.
Participant 2 F=O. 160, P=0.9 1 3
Participant 3 F=5.754. 1)=0.004* NWP - UR NWP - FC N W P - LbI L M - UR LhI - FC
Participant 4 F=22.000. P=0.000* NWP - UR NWP - FC NWP - L M UR-FC I IR - L M
Group F4.724, P=O.OX * NWP - UR 0.001 ** NWP - FC O.OOO* * NWP - LiLI 0.000" * LM - UR 0.35 1 LbI - FC 0.055
*a=O.OS **a=0.0 167 after Bonkrroni adjustrnent
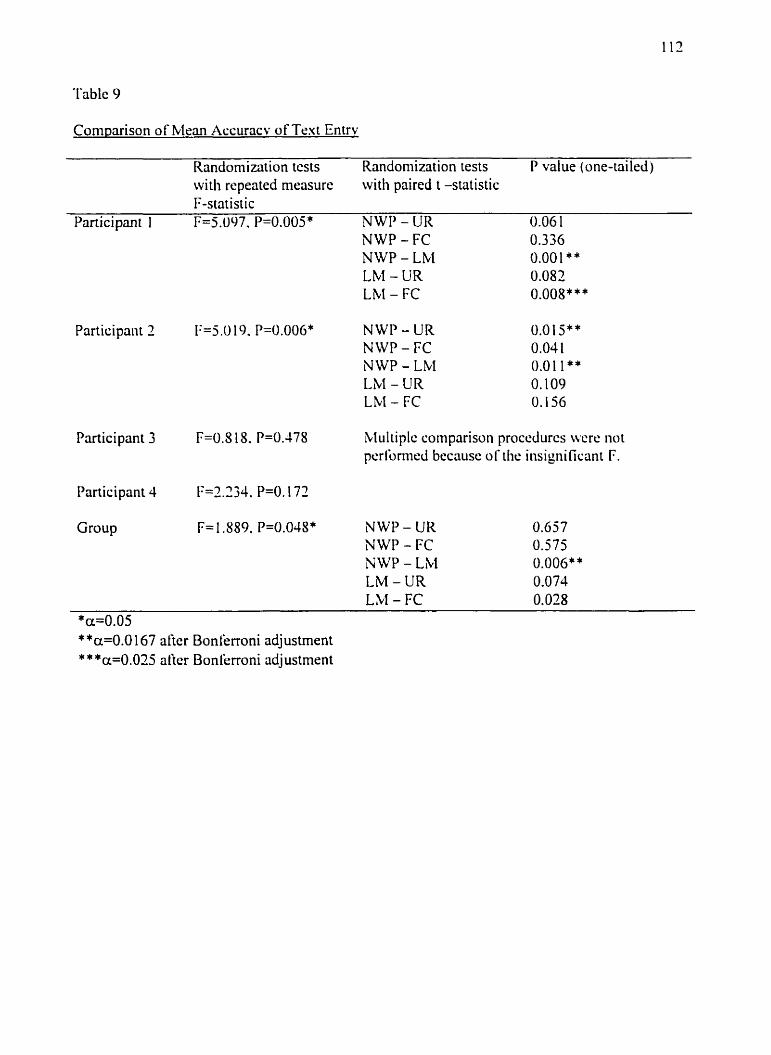
Table 9
Cornonrison of Mean Accuracv of Text Entrv
Randomization tests Randomization tests P value (one-tailed) witli repeated rnensure with paired t -statistic F-statistic
Participant 1 F=5.09 7. P=0.005 * NWP - UR 0.06 1 NWP - FC 0.336 NWP - LbI 0.001 ** LbI - UR 0.082 Lb1 - FC 0.008* * *
Participant 2 F=5 .O 19. P=0.006* N W P - U R N W P - FC NWP - L M LM - UR Lbt - FC
Participant 3 F=O.S i S. P=0.478 hlul tiplc cornparison procedurcs wcre no t pcrlbrined because of the insi ynificant F.
Participant 4 F=2.334. P=O. 172
Group F= 1.889. P=O.O.CS* NWP - UR 0.657 NWP - FC 0.575 NWP - LM 0.006* * LM - UR 0.074 LM - FC 0,028
*a=O.OS * *a=0.0 167 after Bonferroni adjustment * * *a=0.025 atier Bonkrroni adj ustment
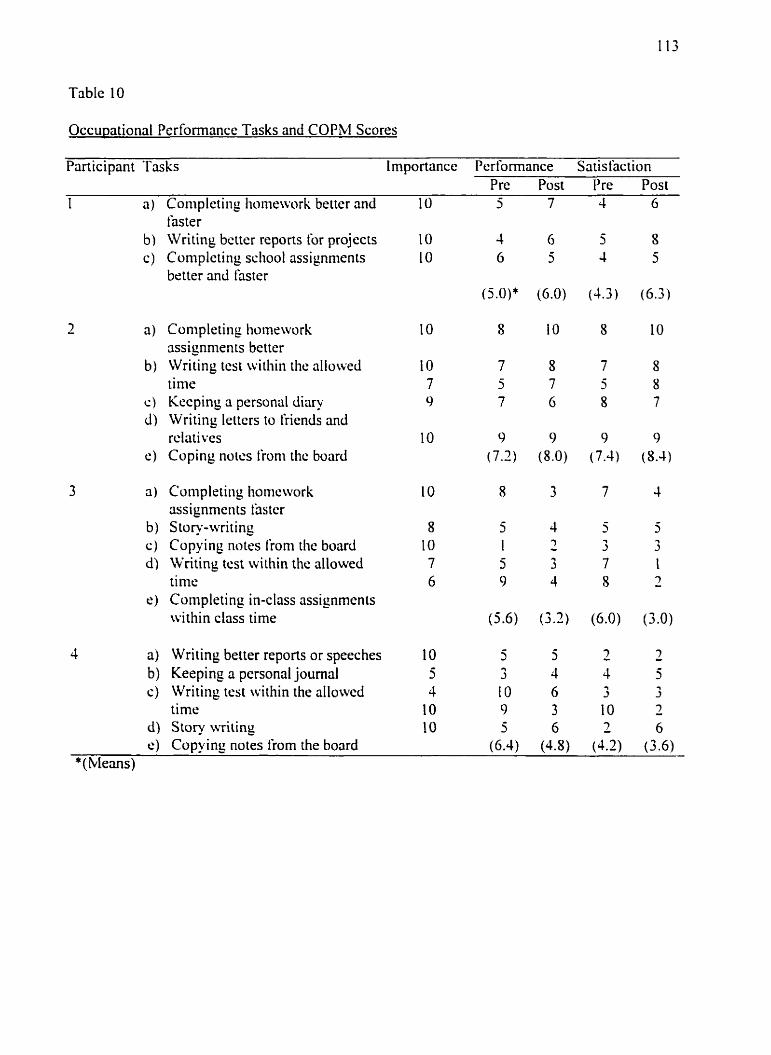
Oçcu~ational Performance Tasks and COPM Scores
Participant T s k s Importance Performance Satisfaction Pre Post Pre Post
1 a) Coitipletiiig Iioniework better and 1 O 5 7 4 6 t s t e r Writing bcttcr reports for projects Coniplcting sdiool assignments better and Saster
Conipleting homework nssignrnents better Writing test witliin the allowed tirne Kçeping o personal diary Writing lettcrs to fricnds and dat ives Coping notes honi thc board
Coniplcting hoincworli assignments fastcr S tory-writing Copying notes liom the board Writing test within the allowed time Completing in-class assignments within class tirne
Writing beiter reports or speeches Keeping a personal journal Writing test within the ailowcd time Story writing Copying notes frorn the board (6.4) (4.8) (4.2) (3.6)

Figure 1. Illustration of tiltemating Trcatments Design Using Hypothctical Data
Bascline Phase
-+ No intervention 4 Intervention A -a- Intervention B
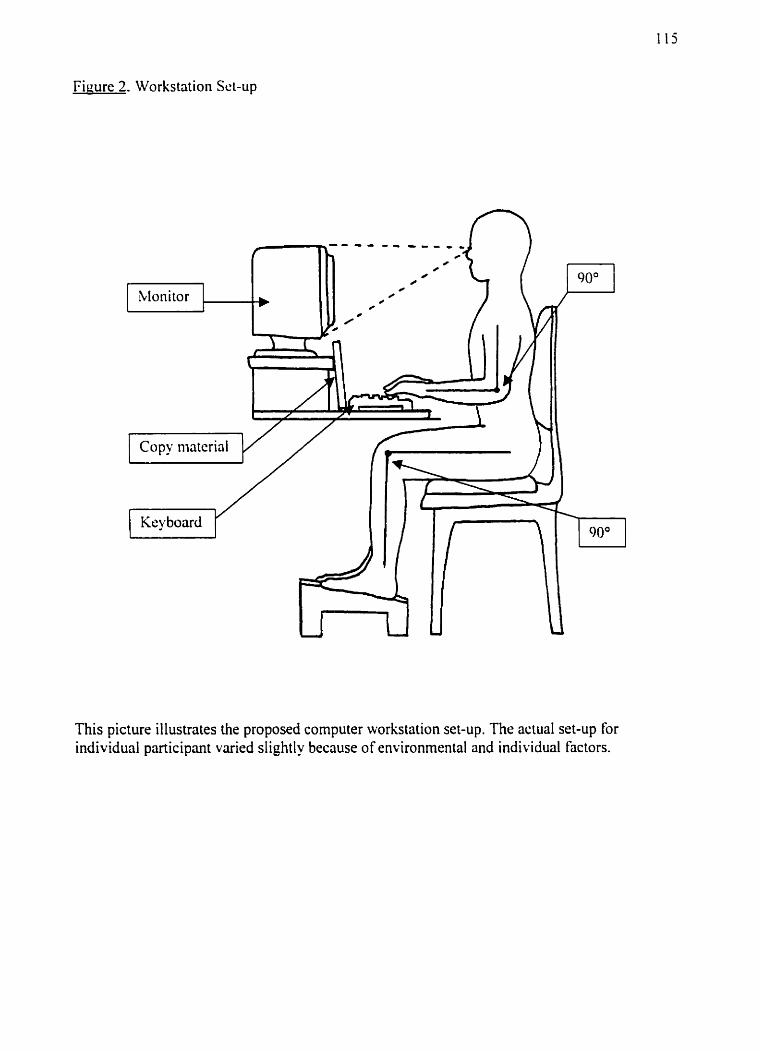
Figure 2. Workstation Set-up
This picture illustrates the proposed cornputer workstation set-up. The actual set-up For individual participant varied slightl y because of environmental and individual Factors.
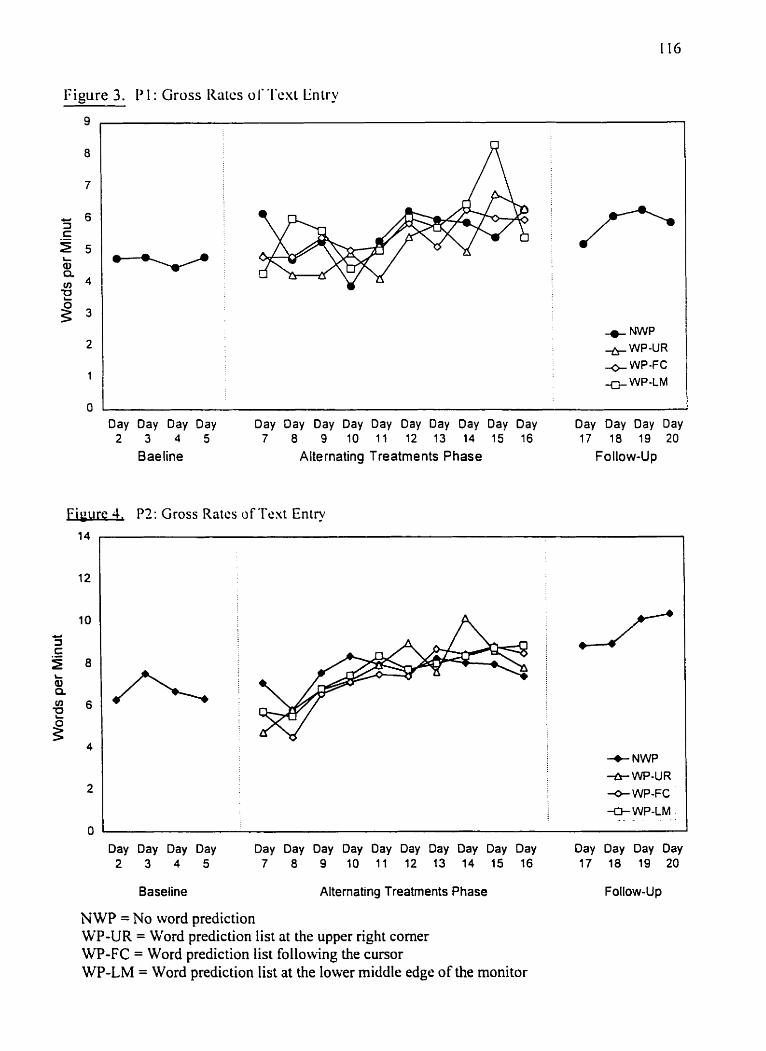
Figure 3. P 1 : Gross llaics ol' l 'cxt Lhiry
+ w p * WP-UR + WP-FC +-j WP-LM
Day Day Day Day Day Oay Day Day Day Oay Day Day Day Day Day Day Day Day 2 3 4 5 7 8 9 10 11 12 13 14 15 16 17 18 19 20
B ae line Alternating Treatments Phase Follow-Up
Firwre 4. PZ: Gross Rates of Text Entry
+ NWP * WP-UR 4 WP-FC U WP-LM ,
- A - .. . .
Day Day Day Day Day Day Day Day Day Day Day Day Day Day Day Day Day Day 2 3 4 5 7 8 9 10 11 12 13 14 15 16 17 18 19 20
Baseline Alternating Treatments Phase Follow-Up
NWP = No word prediction WP-UR = Word prediction list at the upper right corner WP-FC = Word prediction list following the cunor WP-LM = Word prediction list at the lower middle edge of the monitor
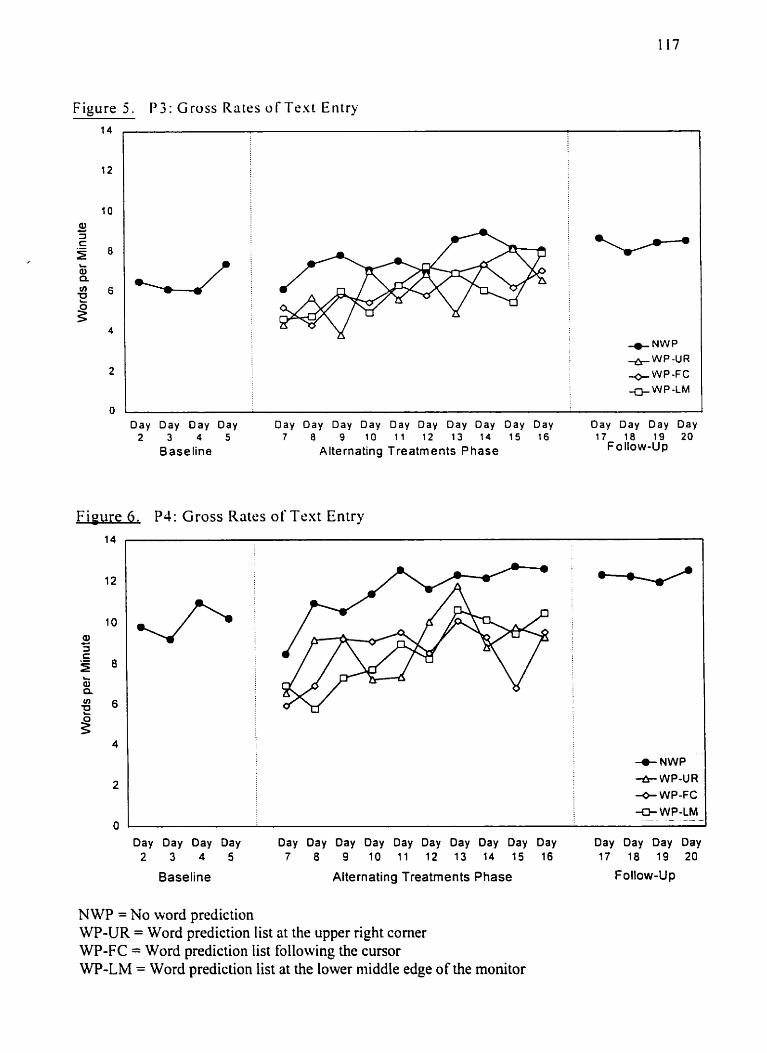
Figure 5 . P 3 : Gross Rates of Text Entry
+NWP +WP-UR + WP-FC +-j WP-LM
- - - -
D a y D a y D a y Day Day Day Day Day Day Day Day Day Day Day Day Day Day Day 2 3 4 5 7 8 9 10 1 1 12 13 14 15 16 17 18 19 20
Baseline Alternating Treatm ents Phase Follow-Up
Figure 6 . PJ: Gross Rates of Text Entry
Day Day Day Day Day Day Day Day Day Day Day Day Day Day 2 3 4 5 7 8 9 10 11 12 13 14 15 16
Baseline Alternating Treatments Phase
+- NWP
+ WP-UR + WP-FC
-(I WP-LM - - --
Day Day Day Day 17 18 19 20
NWP = No word prediction WP-UR = Word prediction list at the upper right corner WP-FC = Word prediction list following the cursor WP-LM = Word prediction list at the lower middle edge of the monitor
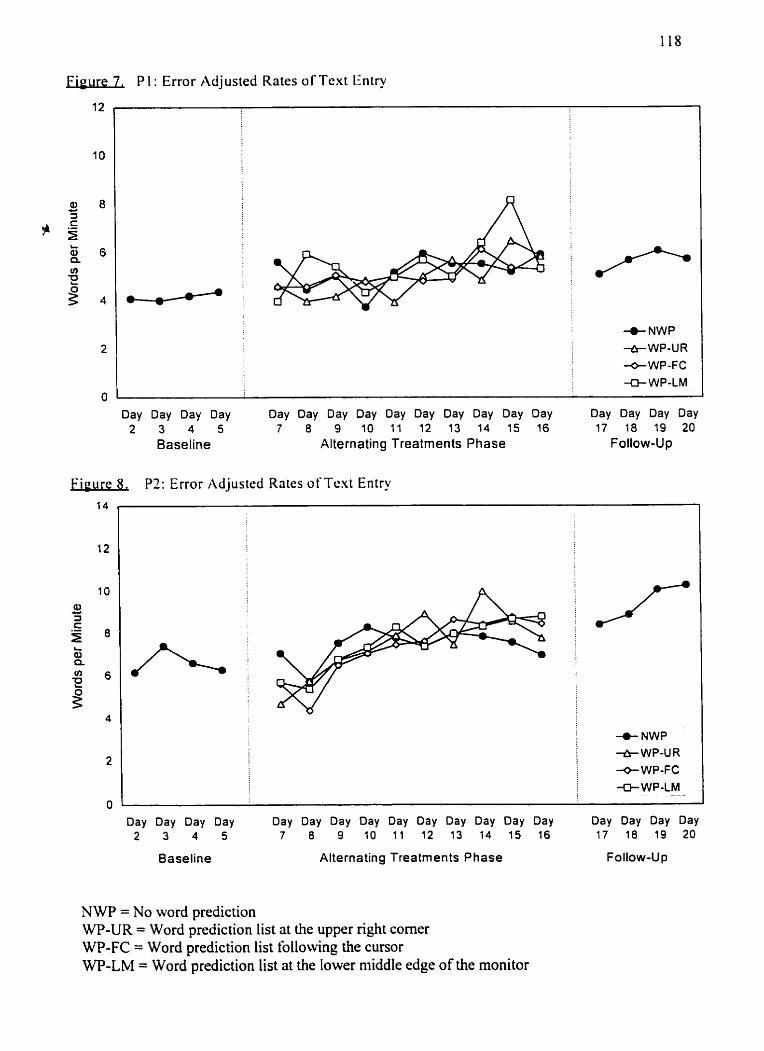
Figure 7. PI : Error Adjusted Rates of Text Entry
12
+NWP -û- WP-UR +WP-FC -a- WP-LM
Day Day Day Day Day Day Day Day Day Day Oay Day Day Oay Day Day Day Day 2 3 4 5 7 8 9 j0 11 12 13 14 15 16 17 18 19 20
Baseline Alternating Treatments Phase Follow-Up
Fieure 8. P7: Error Adjusted Rates of Text Entry
Day Day Day Day 2 3 4 5
Baseline
+ NWP * WP-UR + WP-FC + WP-LM
- - .
Day Day Day Day Day Day Day Day Day Day Day Day Day Day 7 8 9 10 11 12 13 14 15 16 17 18 19 20
Alternating Treatments Phase Follow-U p
NWP = No word prediction WP-UR = Word prediction list ai the upper right corner WP-FC = Word prediction list following the cursor WP-LM = Word prediction list at the lower middle edge of the monitor
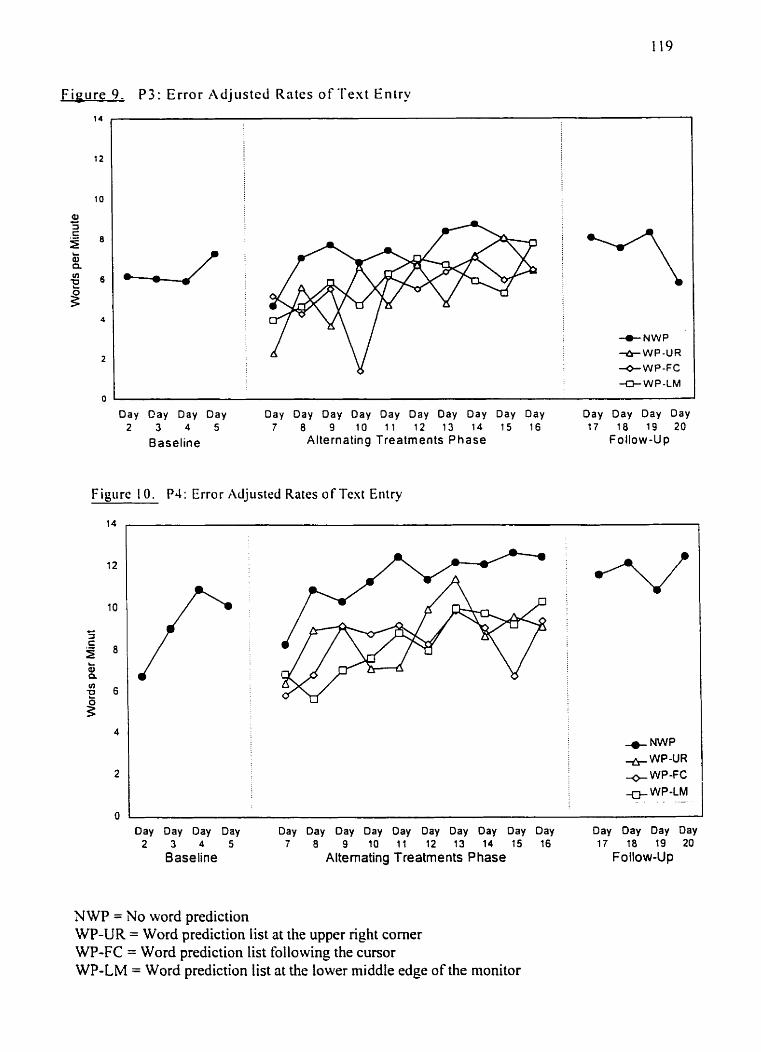
Fipure 9. P 3 : Error Adjustcd Rates of T e x t Entry
+WP-UR + WP-FC
U W P - L M
Day Cay Day Day Day Day Day Day Day Day Day Day Day Day Day Day Day Day 2 3 4 5 7 8 9 10 11 12 13 14 15 16 17 18 19 20
Baseline Alternating Treatments Phase F ollow-Up
Figure I O . P4: Error Adjusted Rates o f Text Entry
-+N""P ++ WP-UR 4 WP-FC +-j WP-LM
. . . . . . . - -
Day Day Oay Day Day Day Day Day Day Day Day Day Day Day Day Day Day Day 2 3 4 5 7 8 9 10 11 12 13 14 15 16 17 t 8 19 20
Baseline Altemating Treatrnents Phase Follow-Up
N WP = No word prediction WP-UR = Word prediction list at the upper right corner WP-FC = Word prediction list following the cursor WP-LM = Word prediction list at the lower middle edge of the monitor
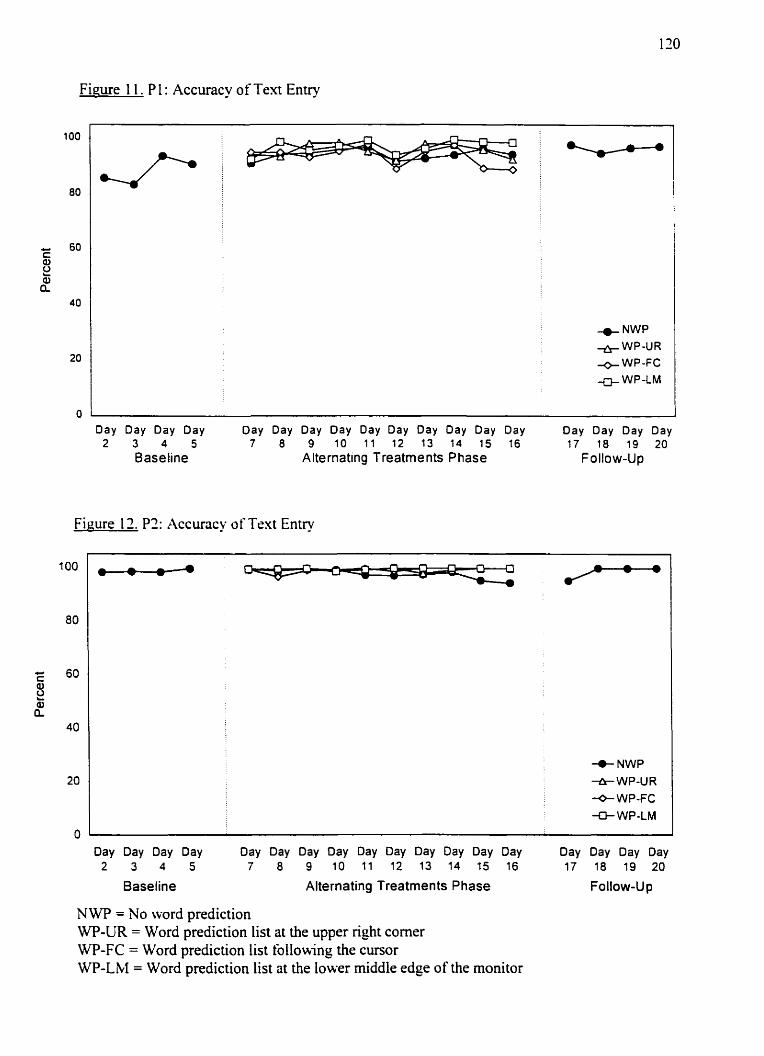
Figure 1 1. P 1 : Accuracy of Text Entry
+ NWP
* WP-UR + WP-FC + WP-LM
Day Day Day Day Day Day Day Day Day Day Day Day Day Day Day Day Day Day 2 3 4 5 7 8 9 10 11 12 13 14 15 16 17 18 19 20
Baseline Alternating Treatments Phase Follow-Up
Figure 12. of Text
+ NWP + WP-UR + WP-FC -(I WP-LM
Day Day Day Day Day Day Day Day Day Day Day Day Day Day Day Day Day Day 2 3 4 5 7 8 9 10 I l 12 13 14 15 16 17 18 19 20
Baseline Alternating Treatments Phase Follow-Up
NWP = No word prediction WP-UR = Word prediction list at the upper right corner WP-FC = Word prediction list followiing the cursor WP-LM = Word prediction list at the lower middle edge of the rnonitor
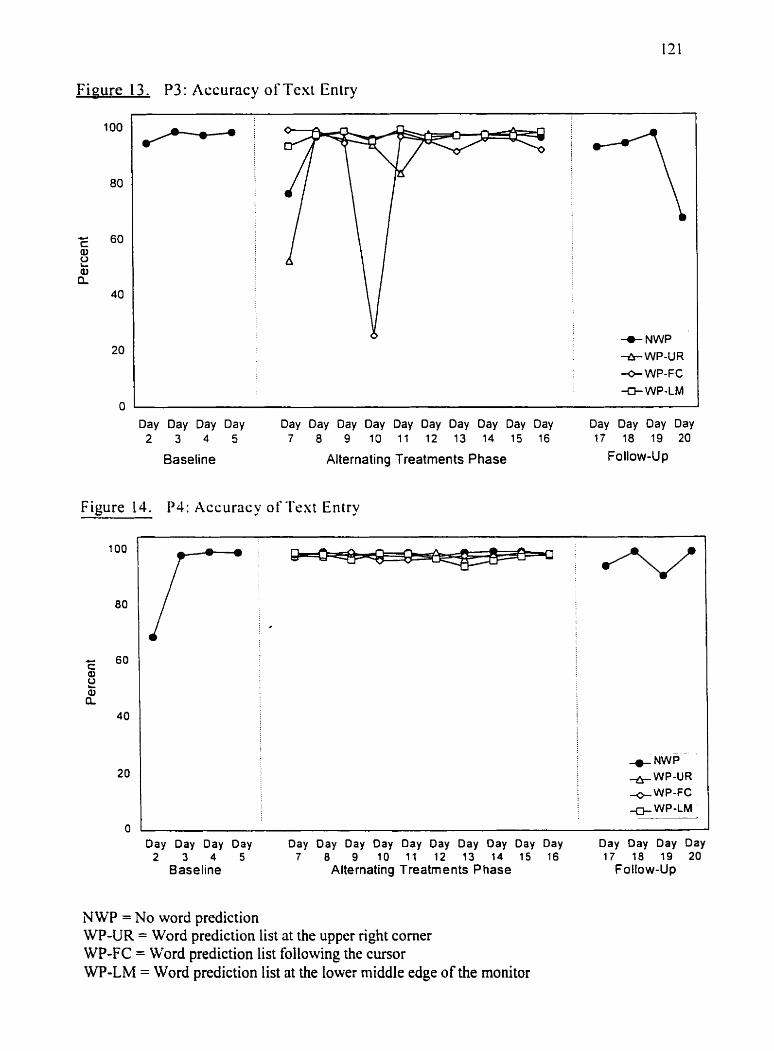
Fieure 13. P3: Accuracy or Text Entry
-0- NWP * WP-UR + WP-FC
U WP-LM
Day Day Day Day Day Day Day Day Day Oay Day Day Day Day Day Day Day Day 2 3 4 5 7 8 9 10 11 12 13 14 15 16 17 18 19 20
Saseline Alternating Treatrnents Phase Follow-Up
Figure 14. P4: Accuracy of Tcxt Entry
+ NWP WP-UR
+ WP-FC .-(I- WP-LM
Day Day Day Day Day Day Day Day Day Day Day Day Day Day Day Day Day Day 2 3 4 5 7 8 9 10 11 12 13 14 15 16 17 18 19 20
Baseline Alternating Treatments Phase Follow-Up
NWP = No word prediction WP-UR = Word prediction list at the upper right corner WP-FC = Word prediction list following the cursor WP-LM = Word prediction list at the lower middle edge of the monitor
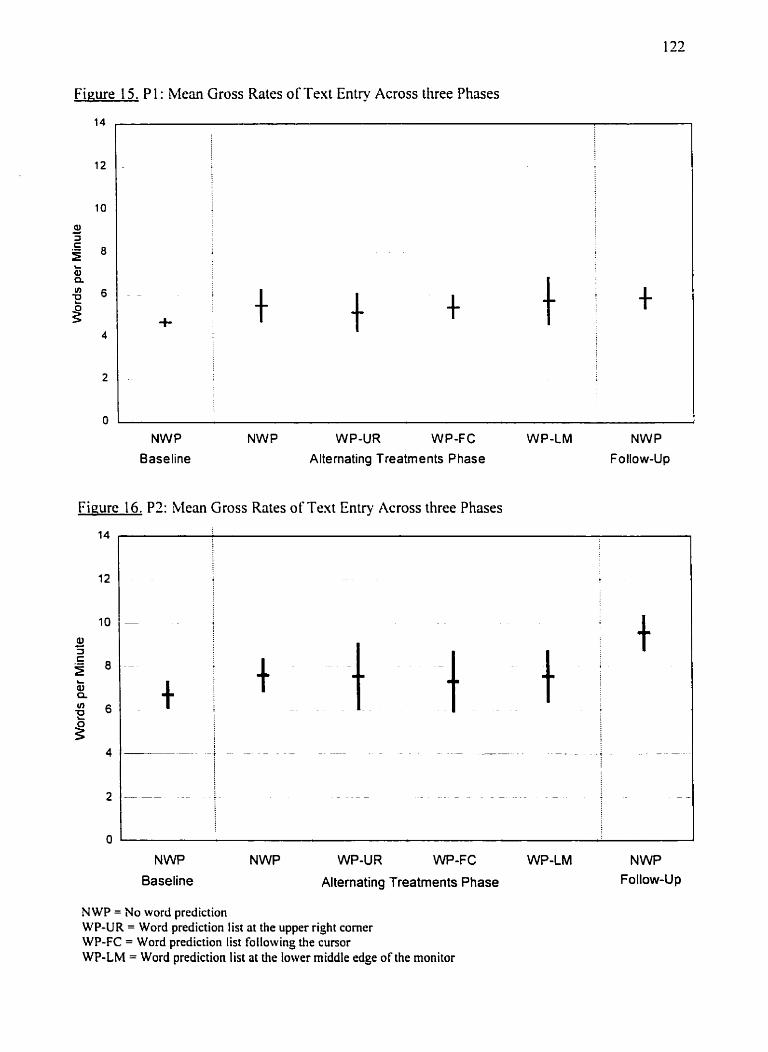

Figure 17. P3: Mean Gross Rates of Text Entry Across three Phases
NWP NWP WP-UR WP-FC WP-LM NWP Baseline Alternating Treatments Phase FoIlow-Up
Figure 18. PJ: Mcan Gross rates of Text Entry Across three Phases
NWP MNP WP-UR WP-FC WP-LM NWP
Baseline Altemating Treatments Phase Follow-Up
N WP = No word prediction WP-UR = Word prodiction Iist at the upper right corner WP-FC = Word prediction list following the cursor WP-LM = Word prediction Iist at the lower rniddle edge of the monitor
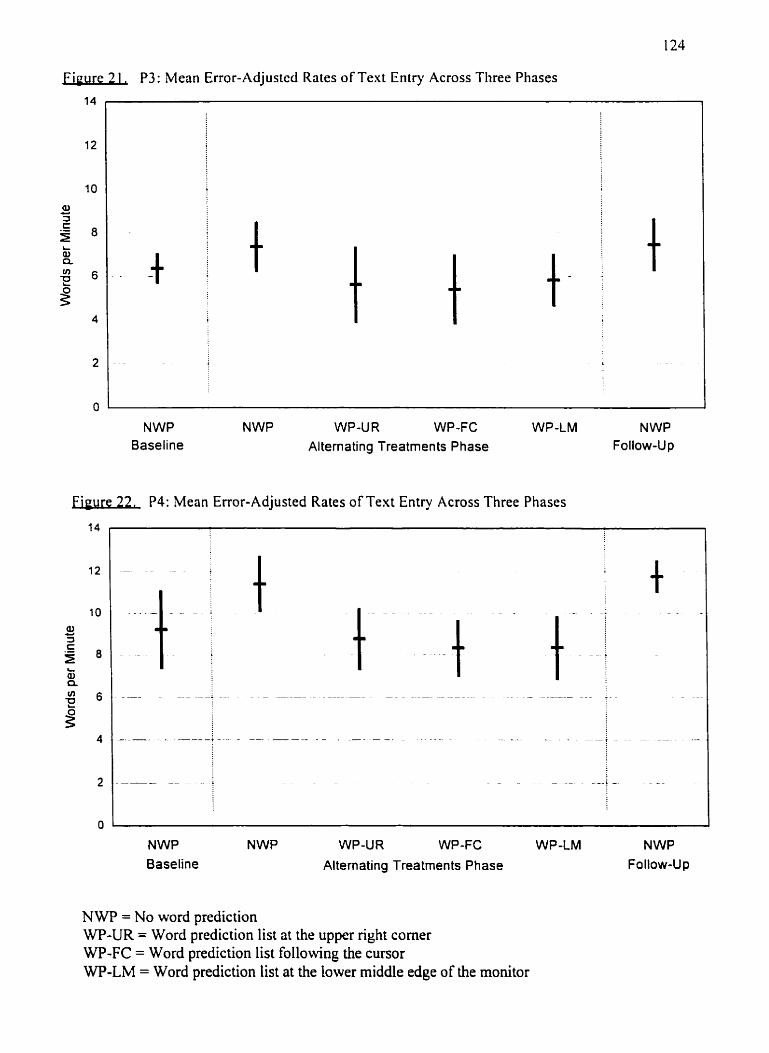
Fieure 2 1. P3: Mean Error-Adjusted Rates of Text Entry Across Three Phases
- -
NWP NWP WP-UR WP-FC WP-LM NWP Baseline Alternating Treatmen ts Phase Follow-U p
h u r e 72. P4: Mean Error-Adjusted Rates of Text Entry Across Three Phases
NWP NWP WP-UR WP-FC WP-LM NWP Baseline Alternating Treatrnents Phase Follow-Up
NWP = No word prediction WP-UR = Word prediction list at the upper right corner WP-FC = Word prediction list following the cursor WP-LM = Word prediction list at the lower middle edge of the monitor
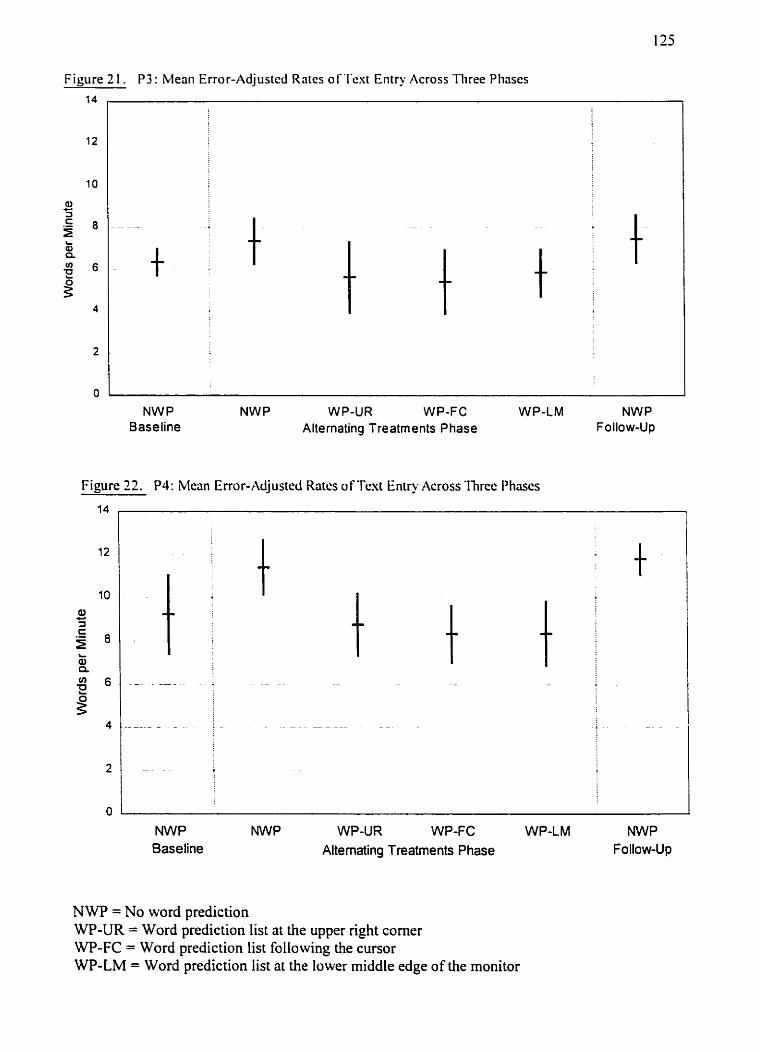
Figure 2 1 . P3 : blean Error-Adjusted Rates of 'I'ext Entry Across Tliree Phases
NWP NWP W P-UR WP-FC WP-LM NWP Baseline Alternating Treatments Phase Follow-Up
Figure 22. P4: Merin Error- Adjusted Rates o f Text Entry Across Three Phases
NWP NWP WP-UR WP-FC WP-LM NWP Baseline Alternating Treatments Phase Follow-Up
NWP = No word prediction WP-UR = Word prediction list at the upper nght corner WP-FC = Word prediction list following the cursor WP-LM = Word prediction list at the lower middle edge of the monitor
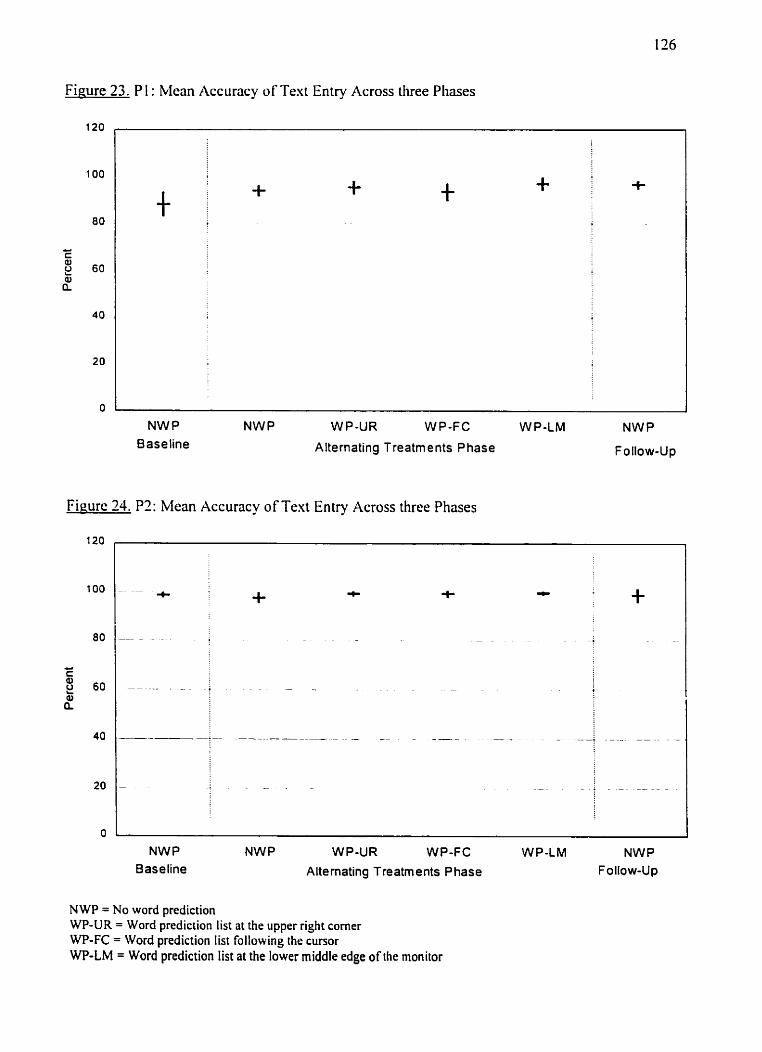
Figure 23. P 1 : Mean Accuracy of Text Entry Across three Pliases
NWP NWP WP-UR WP-FC W P-LM NWP Baseline Alternating Treatm ents Phase FoIIow-Up
Figure 24. P2: Mean Accuracy of Text Entry Across three Phases
NWP NWP WP-UR WP-FC WP-LM NWP Baseline Altemating Treatments Phase Follow-Up
NWP = No word prediction WP-UR = Word prediction list at the upper right corner WP-FC = Word prediction list following the cunor WP-LM = Word prediction list at the lower middle edge of the rnonitor
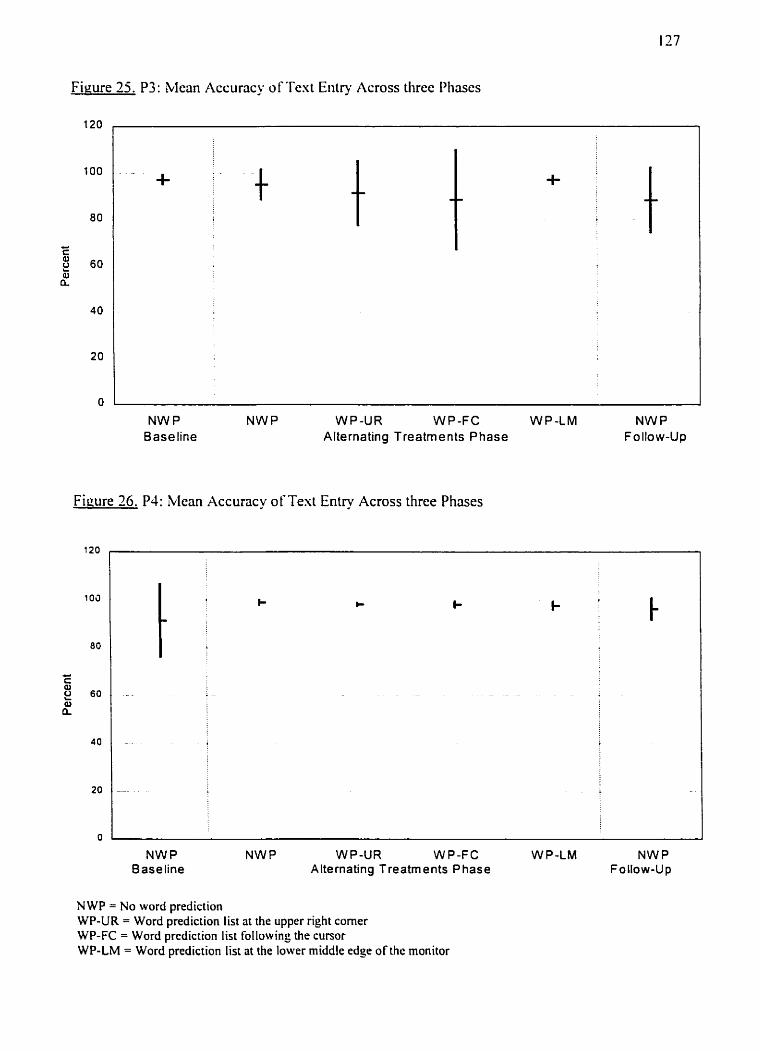
Figure 25. P3: blean Accuracy of Text Eiitry Across three Phases
NWP NWP WP-UR WP-FC WP-LM NWP Baseline Alternating Treatments Phase Fo llow-Up
Figure 26. P4: Mean Accuracy of Text Entry Across three Phases
NWP NWP WP-UR W P-FC W P-LM NWP Baseline Alternating Treatments Phase Follow-Up
NWP = No word prediction WP-UR = Word prediction Iist at the upper right corner WP-FC = Word prediction list fol lowing the cursor WP-LM = Word prediction Iist at the lower rniddle edge of the monitor

Figure 27. P l : COPM Performance and Satisfaction Scores for Three Tasks
Homework Prolects Scnooiwork Hcrnework P ralects Scnooiwork
Performance [a ~ a s e l i n e ~ f t e r ~ o r d ~red ic t ion] Satisfaction
Firrure 28. Pz: COPM Performance and Satisfaction Scores for Five Tasks
Hom ework i e s n Journal Lenen t o p y t n g Notes
Performance Satisfaction l a ~ a s e l i n e m ~ f t e r Word Prediction 1
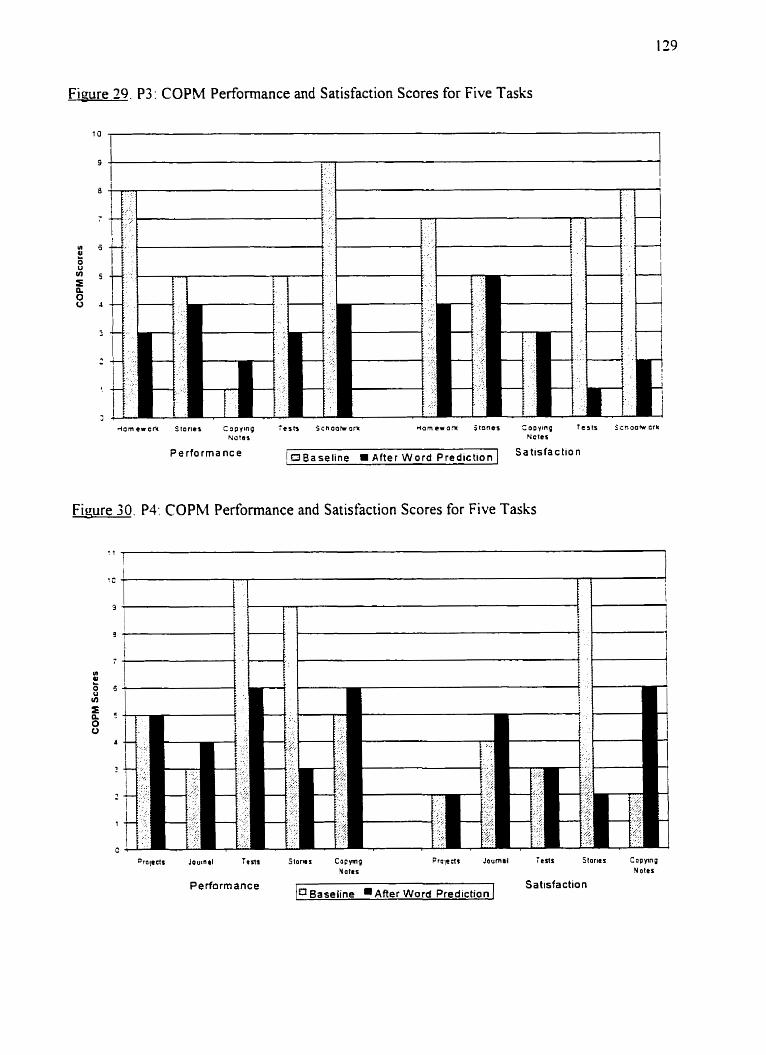
Figue 29. P3: COPM Performance and Satisfaction Scores for Five Tasks
10
9
I
Performance I ~ ~ a s e l i n e m A f t e r W o r d P r c d i c t i o n I sat is fact ion
Figure 30. P4: COPM Performance and Satisfaction Scores for Five Tasks
o r o p d s Journal Tests Slorias Capynig Notas
Performance Satisfaction 10 ~ a s e l i n e .ARer Word ~rediction 1
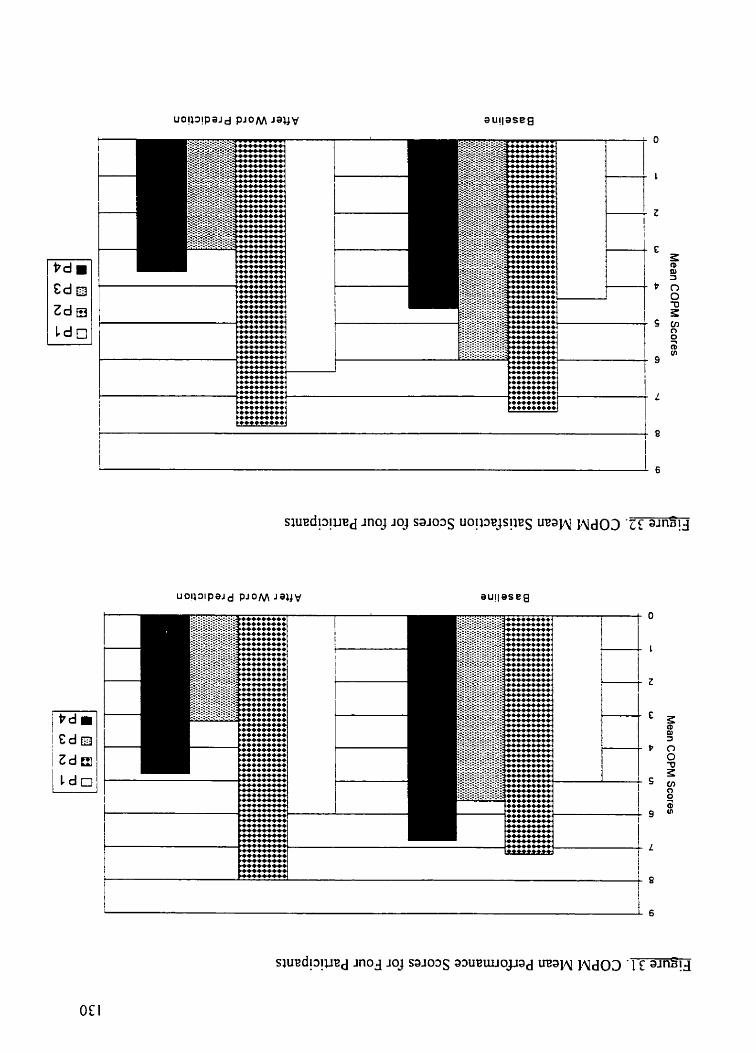
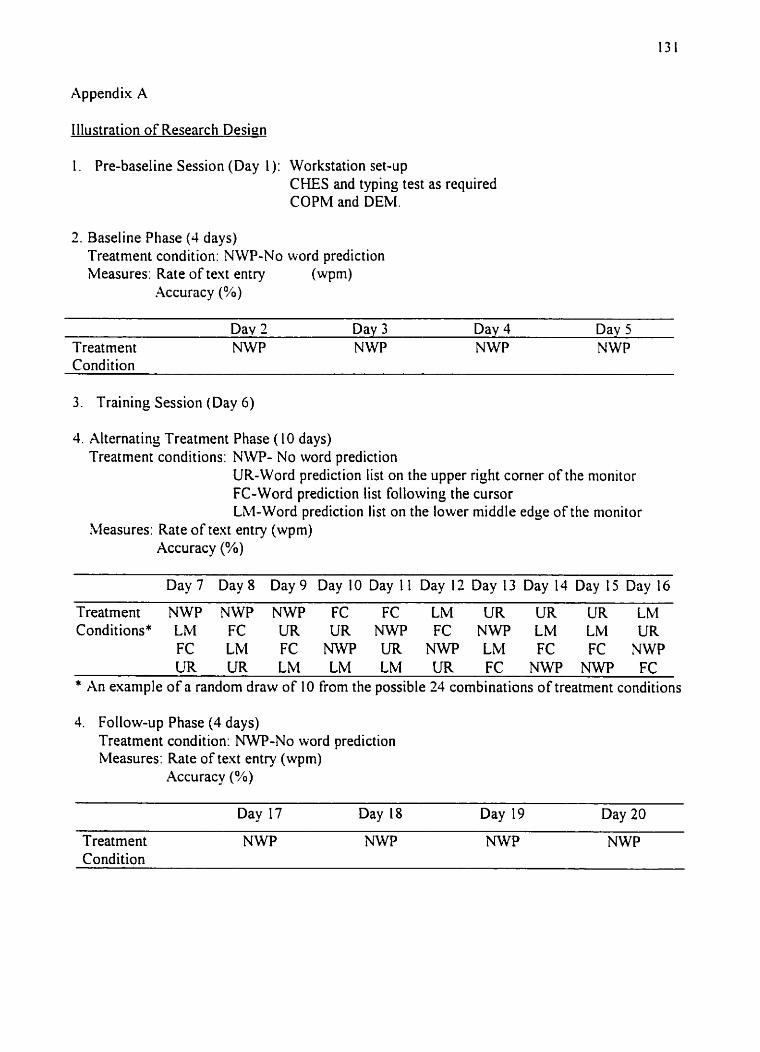
Appendix A
Illustration of Research Design
1. Pre-baseline Session (Day 1): Workstation set-up CHES and typing test as required COPM and DEM.
2. Baseline Phase (4 days) Treatrnent condition: NWP-No word prediction Measures: Rate of text entry ( w P ~ )
Accuracy (%)
Day 2 Day 3 Day 4 Day 5 Treat ment NWP NWP NWP NWP Condition
3. Training Session (Day 6 )
4. Alternating Treatment Phase ( 10 days) Treatment conditions: NLW- No word prediction
UR-Word prediction list on the upper right corner of the monitor FC-Word prediction list following the cursor LM-Word prediction list on the lower rniddle edge of the monitor
Measures: Rate of text entry (wprn) Accuracy (5%)
Day7 Day8 Day9 Day 10 Day I I Day 12 Day 13 Day 14 Day 15 Day 16
Treatment NWP NWP NWP FC FC LM UR UR UR LM Conditions* LM FC iJR UR NWP FC NWP LM LM UR
FC LM FC NWP üR NWP Lbl FC FC NWP UR UR LM LM LM LJR FC NWP NWP FC
* An example of a randorn draw of I O from the possible 24 combinations of treatment conditions
4. Follow-up Phase (4 days) Treatrnent condition: W - N o word prediction Measures: Rate of text entry (wpm)
Accuracy (%)
- - - -
Day 17 Day 18 Day 19 Day 20
Treatment N W P NWP NWP NWP Condition
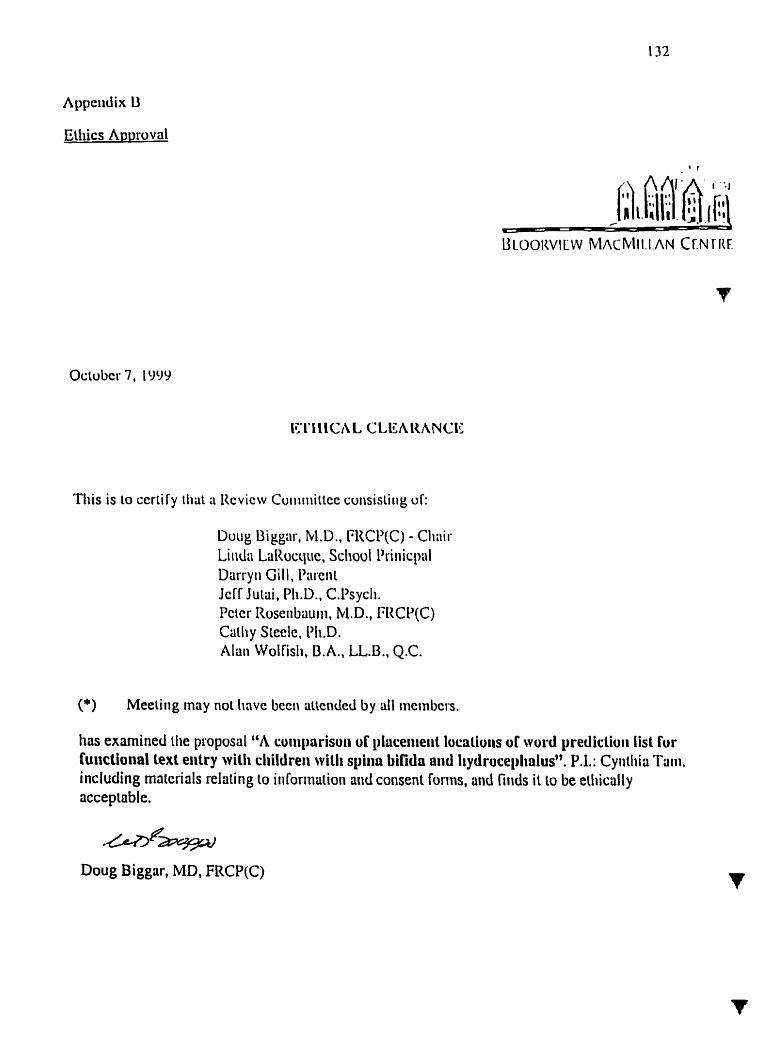
Octobcr 7, 1999
This is io cerii f y t 1 ~ a Rcvicw Cuiiiiiii~icc cuiisisiiiig of:
Doug Biggai. M.D.. I;l<CP(C) - Cliiiii-
Li tda LaRocquc, Scliool 13riiiicpal Darryi~ Gill , l~arciit JciT Jutai. P1i.D.. C.13sycli. Peier Roseiibauiii. MD., FIKP(C) Cailiy SLeele, IJIi.D. Alüii Wolfisti, B.A., LL.B., Q.C.
(*) Meeiiiig may not have becii üiiended by ÜII membcis.
lias examined the proposal "A cuiiiporisuii uC plüceiiieiit lucrliuiis u i wurd predictiuii lis1 fur fulictional text etitry witli cliildreii cviUi spiiia bifidn aiid Iiydruceplinlus". P.I.: Cyiithia Ti~iii.
including materials relaiing (O iiiforinütioii and consent furins, and fiiids it to be eiliiciilly acceptable.
Doug Biggar, MD, FRCP(C)
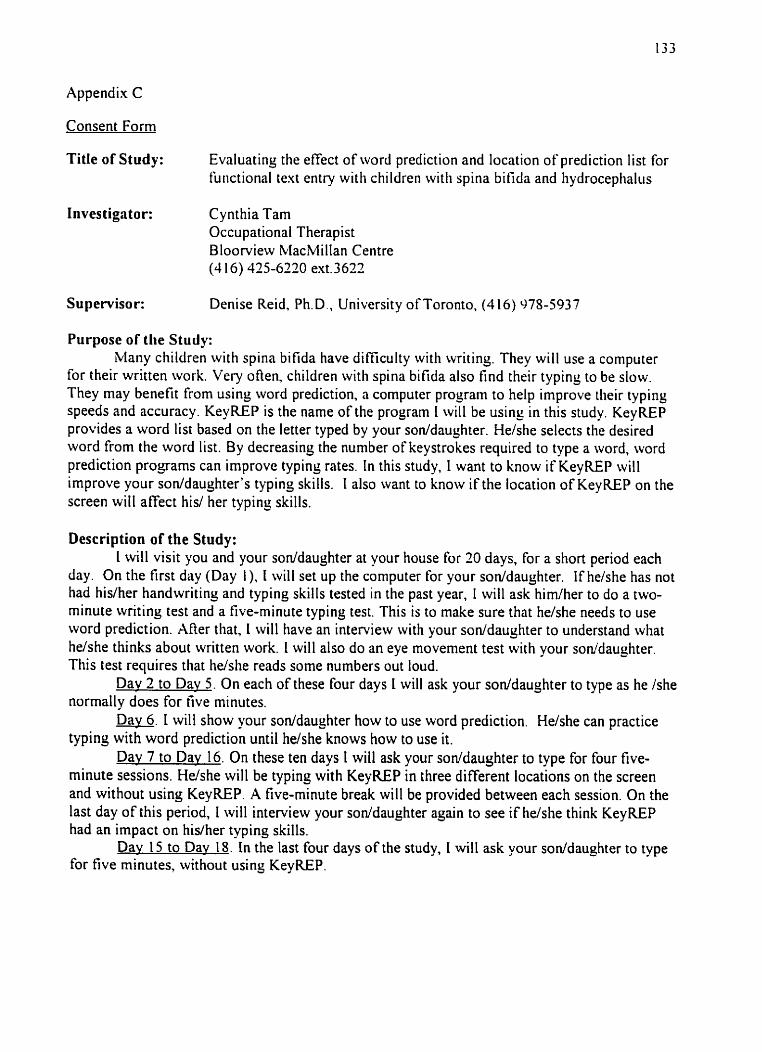
Appendix C
Consent Form
Title of Study: Evaluating the effect of word prediction and location of prediction list for furictional text entry with children witli spina bifida and liydrocephalus
Investigator: Cynthia Tarn Occupational Therapist Bloorview i'vIacMilIan Centre (4 16) 425-6220 ext.3622
Supewisor: Denise Reid, Ph.D., University of Toronto. (416) 978-5937
Purpose of the Study: Many children with spina bifida have difticulty rvith writing. They will use a computer
for their written work. Very often, children with spina bifida also find their typing to be slow. They rnay benefit from using word prediction, n computer program to help improve tlieir typing speeds and accuracy. KeyREP is the name of the program 1 will be using in this study. KeyREP provides a word list based on the letter typed by your soddaughter. He/she selects the desired word from the word list. By decreasing the number of keystrokes required to type a word, word prediction progarns can improve typing rates. In this study, 1 want to know if KeyREP wiil improve your soddaughter's typing skills. I also want to know if the location of KeyREP on the screen will affect his/ her typing skills.
Description of the Study: I will visit you and your soddaughter at your house for 20 days, for a short period each
day. On the first day (Day 1). I will set up the cornputer for your soddaughter. If he/she has not had his/her handwritins and typing skills tested in the past year, 1 will ask himlher to do a two- minute writing test and a five-minute typing test. This is to make sure that he/she needs to use word prediction. ARer that, t will have an interview with your soddaughter to understand what he/she thinks about written work. I will also do an eye movement test with your soddaughter. This test requires that he/she reads some numbers out loud.
Dav 2 to Dav 5. On each of these four days 1 will ask your sonfdaughter to type as he /she normally does for tive minutes.
Dav 6. I will show your soddaughter how to use word prediction. He/she can practice typing with word prediction until hdshe knows how to use it.
Dav 7 to Day 16. On these ten days I will ask your soddaughter to type for four five- minute sessions. Hdshe will be typing with KeyREP in three different locations on the screen and without using KeyREP. A five-minute break will be provided between each session. On the last day of this period, 1 will interview your soddaughter again to see if he/she think KeyREP had an impact on his/her typing skills.
Day 15 to Day 18. In the last four days of the study, I will ask your soddaughter to type for five minutes, without using KeyREP.

Potential Iiarms (iiicoiivciiierice): There are no known risks to this study. There will be a total of 20 study sessions. Each
lasts between IO and 40 minutes. These sessions will hopefully be scheduled consecutively over four weeks. As much as possible, the sessions will be scheduled at a time that is most convenient to you and your son/daughter. 1 will bring a portable computer with me. A monitor and a keyboard will be lefi at your house during the study period.
Po tential Benefits: This study does have the potential to benefit your soddaughter directly . There is a yood
chance KeyREP can improve your son/daugliterTs typins skills. If KeyREP is shown to be beneficial, I can help you procure the program. With your consent, 1 can send the tindings from tlie research project to an occupational therapist at Communication and Writing Aids Service, Bloorview Macklillan Centre. Your son/daughter will not be placed on the waiting list for assessnient. The occupational therapist will contact you directly to set up a nieeting witli you and your son/daughter. Slie will discuss tlie possibility of funding assistance Iiom the Assistive Devices Prosram of blinistry of Health with you. This study will also increase our knowledge in the use of word prediction for cliildren who have spina bifida, and provide a büsis for us to examine its use with other population.
Confiden tiali ty : A11 the information that 1 collect about your soddaughter will be kept confidential. This
information will be protected in the same way as a person's medical chart. No information about your soddaughter will be given out to anyone without your written permissiori, unless this information is required bv law. For example there is the legal duty to report particular infections that could spread to others. It is the law that professionals must report a suspicion of child abuse.
If 1 need to publish information tliat could identify your soddaughter, we will ask for your written consent again. You have the choice of giving or not giving this consent.
Researcli information is normally destroyed afier the research is done. If it is important to keep research information longer, we will ask for your written consent. You have the choice of giving or not giving this consent.
The original of this consent form will be filed in your sonldaughter's medical chart. One photocopy of the consent form will be filed in your soddaughter's research file. You will be given a photocopy of this consent form for your own records.
Participation Participation in this study is voluntary. You have the right to decide not to allow your
soddaughter to be a part of this study. You also have the right to withdraw your soddaughter from this study anytime. If you do not want to participate or if you choose to withdraw later, you and your family will continue to have access to services at Bloorview MacMillan Centre.
For questions and further information Please do not hesitate to contact Cynthia Tarn at (416) 425-6220 ext. 3622 or Denise Reid
at 978-5937 with any questions or concems you may have about this study, Monday to Friday, 8:30 am430 pm. If you reach voice mail, please leave your name and phone number. We will cal1 you as soon as we can.
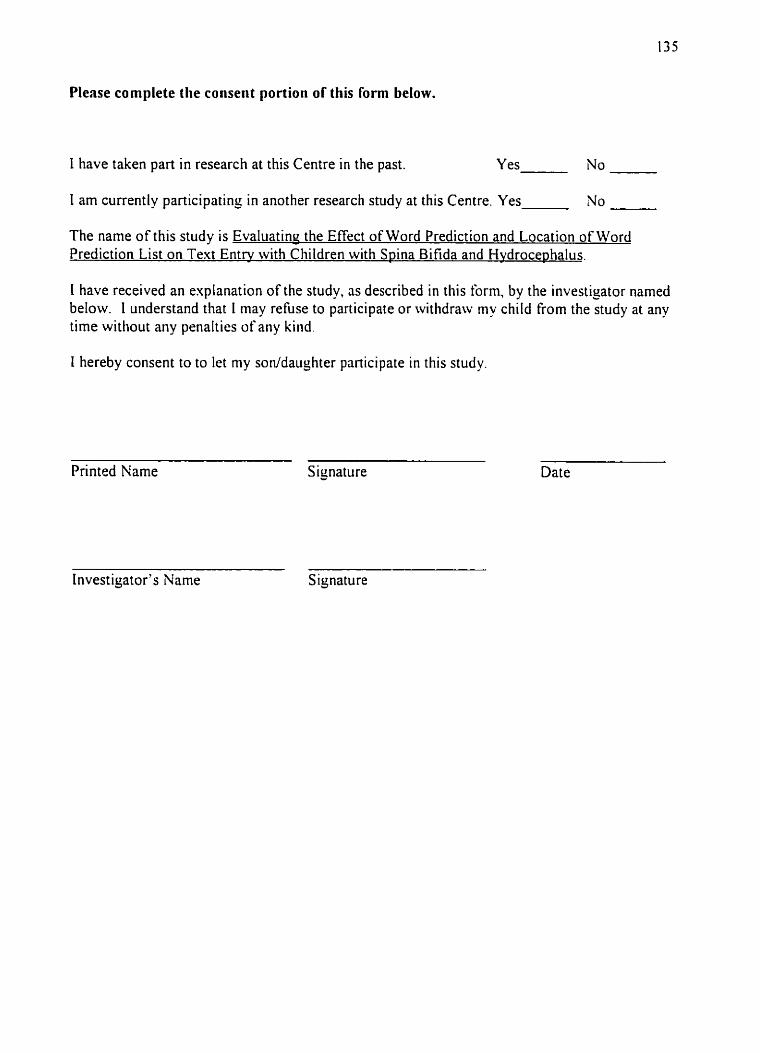
Please complete (lie consent portion of'this form below.
1 have taken part in research at this Centre in the past. Y es No
I am currently participating in another research study at this Centre. Yes No
The name of this study is Evaluatinu the Effect of Word Prediction and Location of Word Prediction List on Text Entrv with Children with Spina Bifida and Hvdrocephalus.
L have received an explanation of the study, as described in this form, by the investigator named below. 1 understand that 1 may refuse to participate or withdraw rny child from the study at any time witliout any penalties of any kind.
1 hereby consent to to let my sonldaughter panicipate in this study
Printed Name Signature Date
Investigator's Name Signature
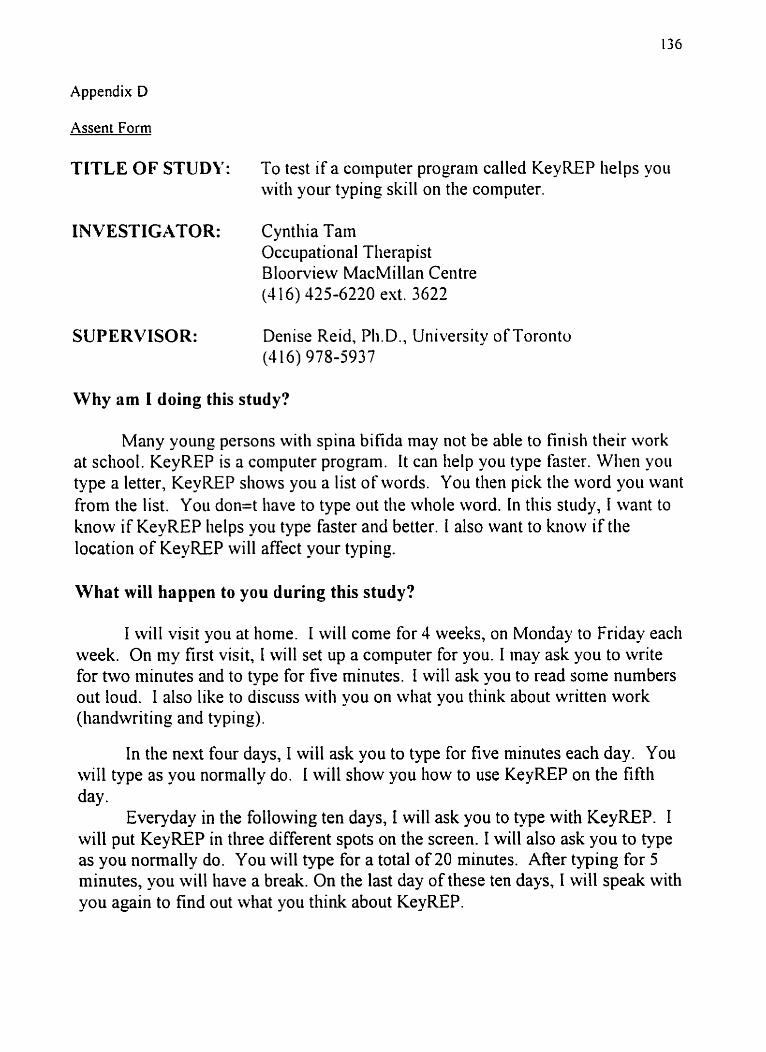
Appendix D
Assent Form
TITLE OF STUDY:
INVESTIGATOR:
SUPERVISOR:
To test if a coinputer program called KeyEZEP lielps y011
witli your typing ski11 on the computer.
Cyntliia Tarn Occupational Tlierapist Bloorview MacMillan Centre (4 16) 425-6220 est. 3622
Denise Reid, Pli. D., University of Toronto (4 16) 978-5937
Why am 1 doing this study?
Many young persons witli spina bifida may not be able to finish their work at scliool. KeyREP is a cornputer program. It can Iielp you type faster. Wlien yoii type a letter, KeyREP shows you a list of words. You tlien pick the word yoii waiit from the list. Y011 don=t Iiave to type out tlie wliole word. In tliis stiidy, I want to know if KeyREP lielps you type faster and better. I also want to know if the location of KeyREP will affect your typing.
What will happen to you during this study?
1 will visit you at home. I will come for 4 weeks, on Monday to Friday eacli week. On rny first visit, I will set up a computer for you. 1 inay ask you to write for two minutes and to type for five minutes. I will ask you to read sotne numbers out loud. I also like to discuss witli you on wliat you tliink about written work (liandwriting and typing).
In the next four days, I will ask you to type for five minutes each day. You will type as you normally do. I will show you how to use KeyREP on the fiftii day .
Evex-yday in the following ten days, I will ask you to type with KeyREP. 1 will put KeyREP in tliree different spots on the screen. I will also ask you to type as you normally do. You will type for a total of 20 minutes. Afier typing for 5 minutes, you will have a break. On the last day of these ten days, I will speak with you again to find out what you think about KeyREP.

In the last four days of the study, 1 will ask you to type for five minutes eacli day, witliout using KeyREP.
Are there good things and bad things about the study?
As far as 1 know, tliere are no bad tliings about tliis stiidy. There will be a total of 20 visits. Eacli last between 15 and 40 minutes. I will visit you at a tiine wlieti it is best for yoii and your parents. I will bring a portable coinputer witli me. I will leave the inonitor and the keyboard in your Iiouse.
Tliere is one good tliing abolit tliis study. KeyREP itiay Iielp yoii type Faster and better. If yoii and your parents want to keep using KeyREP, I will piit yoii iii
contact with an occupational tlierapist at Communication and Writing Aids Service, Bloorview MacMillan Centre. Slie will Iielp you get the progain.
Who will k n o w about whrt you did in this study?
Only people wlio do tliis study will know what y011 did in the study. 1 will not tell anyone wliat you and your parents told me about yourself and the results of your tests. Wlien I talk about the study to anyone, 1 will not say or print yoiir name.
Can 1 decide if I want to be in the study?
I f you do not want to be a part of tliis study tliat is O.K. No one will be mad or disappointed. If you say yes now but change your mind later, you can still say no and tliat will be O.K. Your parents are also reading some information about tliis study. They will talk to you about it. Ask them questions if you do not understand what you have read or what people have told you. Tliey will Iielp you to understand better. Please ask me any questions tliat you have. I c m help you understand the study.

INou give me your permission, please sign here.
1 wnnt to be in this study.
Naine of young person and age
Signature
Name of person wlio obtained assent
Signature
Date
I was present when read this form and gave hisfher verbal assent.
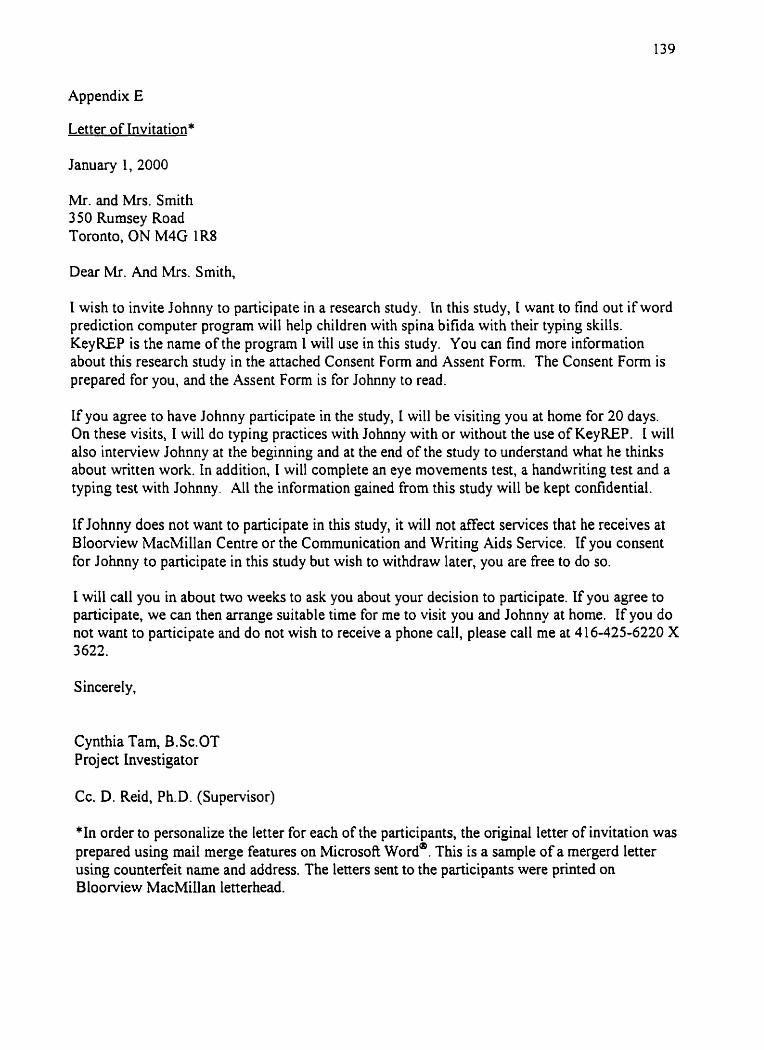
Appendix E
Letter of Invitation*
Mr. and Mrs. Smith 3 50 Rumsey Road Toronto, ON M4G IR8
Dear Mr. And Mrs. Smith,
1 wish to invite Johnny to participate in a research study. In this study, I want to find out if word prediction computer program will help children with spina bifida with their typing skills. KeyREP is the name of the program 1 will use in this study. You can find more information about this research study in the attached Consent Form and Assent Form. The Consent Forrn is prepared for you, and the Assent Form is for Johnny to read.
If you agree to have Johnny participate in the study, 1 will be visiting you at home for 20 days. On these visits, I will do typing practices with Johnny with or without the use of KeyREP. L will also interview Johnny at the beginning and at the end of the study to understand what he thinks about written work. In addition, 1 will complete an eye movements test, a handwriting test and a typing test with Johnny. Al1 the information gained fiom this study will be kept confidential.
If Johnny does not want to participate in this study, it will not affect services that he receives at Bloorview MacMillan Centre or the Communication and Writing Aids Service. If you consent for Johnny to participate in this study but wish to withdraw later, you are fiee to do so.
I will cal1 you in about two weeks to ask you about your decision to participate. Kyou agree to participate, we can then arrange suitable time for me to visit you and Johnny at home. If you do not want to participate and do not wish to receive a phone call, please call me at 4 16-425-6220 X 3622.
S incerely,
Cynthia Tarn, B.Sc.OT Project Investigator
Cc. D. Reid, Ph.D. (Supervisor)
*In order to personalize the letter for each of the participants, the original letter of invitation was prepared using mail merge features on Microsoft ~ o r d " . This is a sample of a mergerd letter using counterfeit name and address. The letters sent to the participants were printed on Bloorview MacMillan letterhead.

Appendix F
S a m ~ l e of Kuino's Scoring Instructions for Accuracv of Text Etitrv
Words3 . . coplrd Incortaclly * 1 rmt erch tirne ütlr oecun.
accuriad property in Adam county. Lf you have palns to ( + O ) 1 ' 1
f acllities c,t tliek the local' arsa 1 * (c01)ddeM ans d * uiwd)
lncomct apaclng brtvvrsn Iettdm wiUiln s word, reauIng In rxcem epace brtrrean W b a a 1 rnot erch uhi th18 occura. (Thin i n r l u d e ~ words whlch are ~attlally t@ed, then typed agatn.)
devel~pmenf o f your pro petty, you v i l 1 br i n t orssted !
(+V 1
to hrat that you (ar ara)' plcasad with the rsferral 1 fi * (coiirldemd a ie mis~;paIled mrd]
( + 3 )
* There is a problem with the typed material but no enor is counted. ! 1 crror is counted
Appendix G
Sam~le of Subtest A and B of Developrnentai Eve Movement Test
Appendix H
Sample of Subtest C of Developmental Eve Movement Test
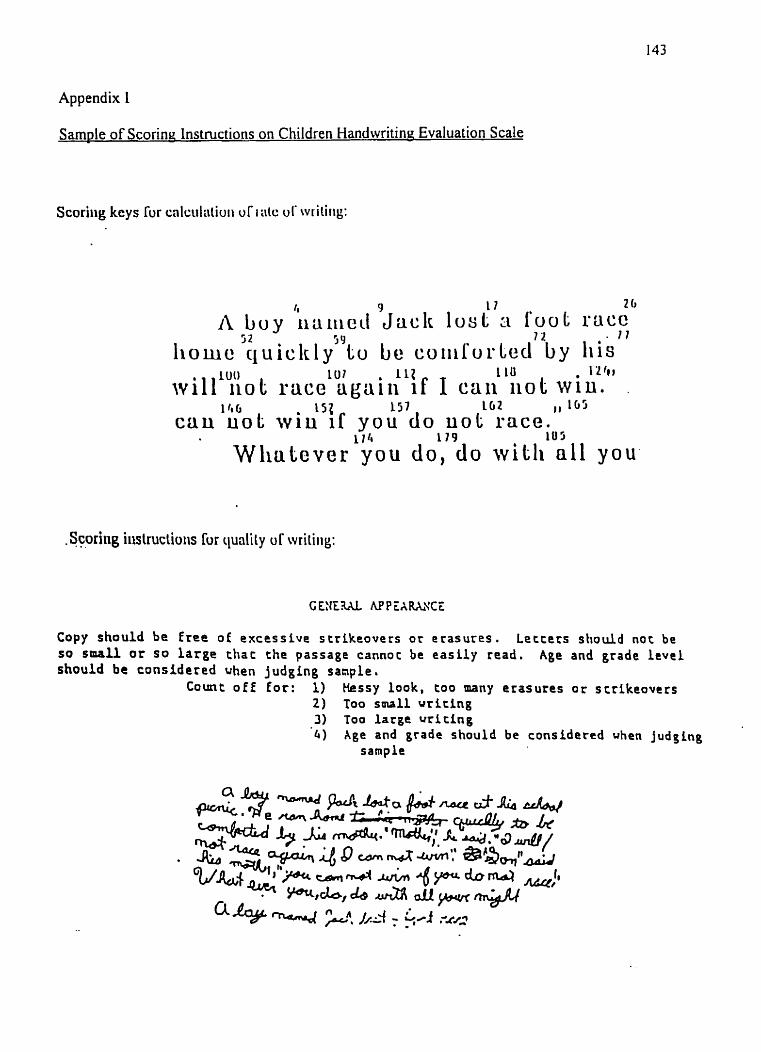
Appendix 1
S a m ~ l e of Scorinr Instructions on Children Handwritinu. Evaluation Scale
Scoriiig keys îor cnlçuliitioii or I ii(c ul' writiiig:
-
101 112 110 12+, willlYhb ruce ugaiii i f I caii i iot W I U . .
-
1 4 U 1 5 7 LG2 ,, 165 crin uo1; w iu i f y o u do uol; race.
114 L 79 l u 5
WliuLcver y o u do , do w i l h d l you
Copy should be Eree o f excessive strikeovers or e tasu tes . L e t t e t s should not be so SMU or so large chat the passage cannoc be e a s i l y read. Age and grade l e v e l should be considered uhen judging sanple.
Count o f f for: 1) Hessy l o o k , too many erasures or s t r l k e o v c t s 2 ) Too small writ ing 3) Too large u r i t i n g
' 4 ) Age and grade should be coosidered uhen jud l ing sample
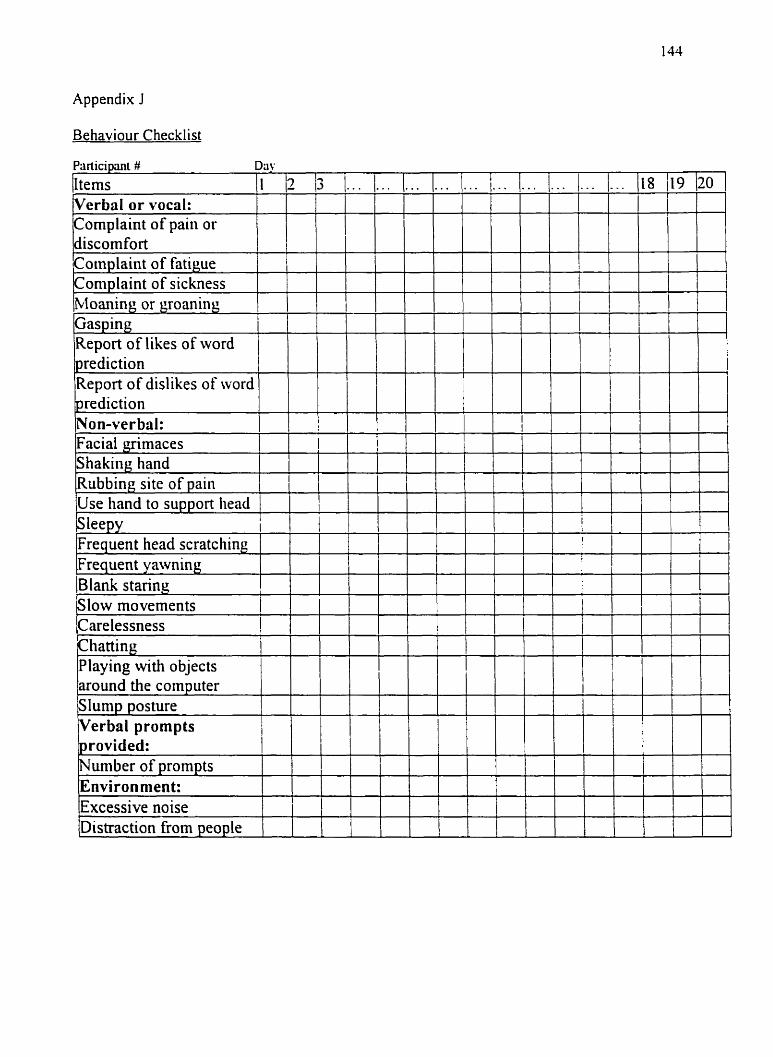
Appendix J
Behaviour Checklist
Participl # Da! 20 . .
r
Items Verbal or vocal: Cornplaint of pain or discom fort Cotnplaint of fatigue Cornplaint of sickness
1
! I
1 PYIoaning or groaning Gasping Report of likes of word prediction Report of dislikes of word prediction Non-verbal:
2 18 119
[ I I
I
-
3 - .
-
s leepy [ I i I Frequent head scratching Frequent yawning Blank staring Slow movements Carelessness
.
Facial grimaces 1 Shaking hand Rubbing site of pain Use hand to support head
~p
.
Playing with objects around the computer Slump posture Verbal prompts provided:
l
. . 1 . .
1
.
I
I
1
1
I
.
I I
I
A
1
1
Number of prompts Environ ment: Excessive noise ~~istractionfrompeople
I I
,
1
l
1 i
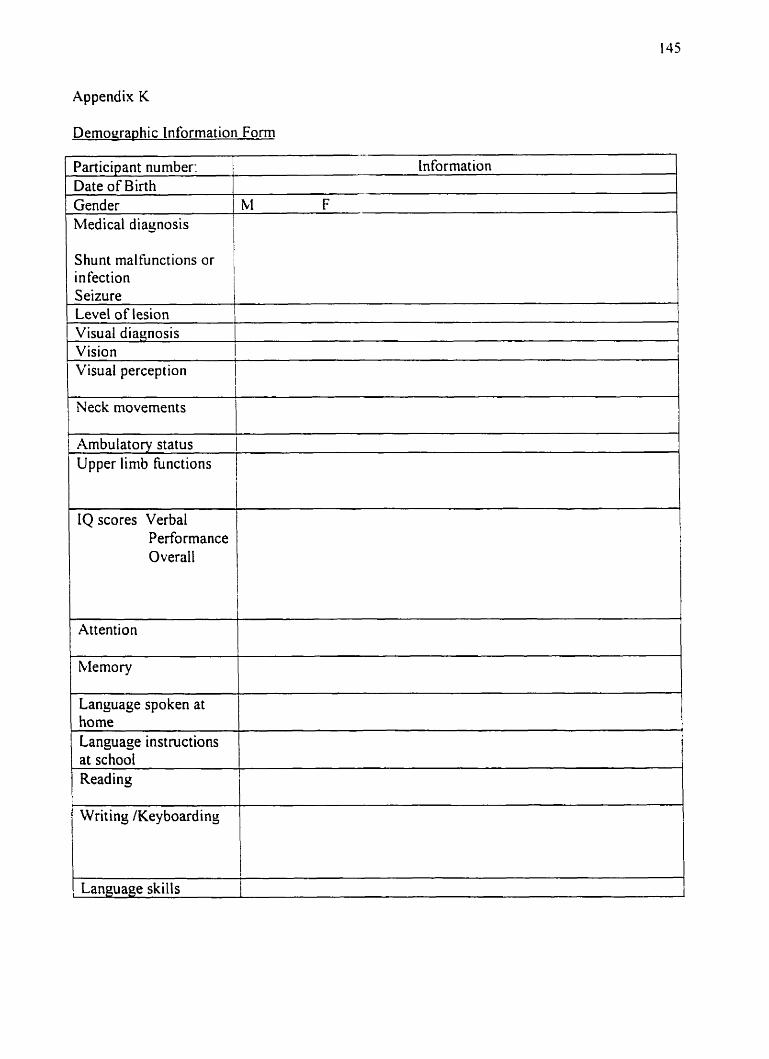
Appendix K
Demographic Information Form
Shunt malhnctions or infection i
I
Participant number: Date of Birth Gender Medical diagosis
Level of lesion Visual diagnosis Vision I
information
hi F
( ~ i s u a l perception
/ Neck movements
Ambulatory status 1 Upper limb hnctions
i
IQ scores Verbal Performance Overail
- -
r ~ a n ~ u a ~ e spoken at 1 -
1
Writing Keyboarding
home Language instructions at school Reading
1 Language skiils
I

Appendix L
Result of Pilot Studv
L. 1 Background Information
Participant characteristics. The participant in the pilot study (PP) was a 12-year-old boy
with the diagnosis of Lr myelomeningocele. Arnold-Chiari 11 malformation. hydrocephalus with
right occipital VP shunt. tethered cord and Nystagmus. PP had a short stature. He was of average
height of an 8-year-old boy. PP was a grade 6 student in a local p r i r n q school. Rrview of
medical record showed that PP's verbal intelligence score was 96 on WISC-III. On WRAML. his
score was 3 indicating average memory skill. On the Stmdford Diagnosit Reading Test. PP's
scores placed his reading level at grade 6. Other deficits reported in the medical record included
reduced grip strength and difficulties in fine motor skills and eye-hand coordination. PP had
access to a computer at home. and had a computer designated for his use at school.
Settinq. PP lived in a semi-detached house. The rxperiment took place in the dining
room. The computer was set up on the dining table. With his short stature. PP needed to put one
phonebook on the chair. and had his feet supported by boxes. The environment for the
experiment was mostly quiet except for when there were visitors in the house.
L .2 Pre-baseline Resul ts
PP's handw-riting speed as assessed with CHES was in the 3.2 percentile for students at
his grade. The quality of his witing was considered to be good (Phelps. et al.. 1984). PP typed
with two index ringers. On the DEM. PP recorded below the 1" percentile for the vertical score.
the horizontal score and the ratio scores. These scores suggested a Type IV deficit indicating
difficulties in autornaticity and oculomotor control (Richman & Garzia 1987).

L.3 Preference for Placement Location of Prediction List
PP indicated that having the prediction list at the LM location (LM) was easier for him to
see. However, he has no strong preference for placement location of the prediction list.
L.4 Rates of îext Entry
Gross rates of text entry. Data are summarized in Table 1 I and plotted on the line graph
(Figure 33). At the end of the tirst session in the baseline phase. PP requested the text display on
screen and on print be enlarged to 20 points. He also requested tliat the copy material be printed
in double spaced format for later sessions. Therefore, the first data point was not included in data
analysis. On average, P3 demonstrated a faster gross rate of text entry without the use of word
prediction than with word prediction. The differences between the gross rate of text entry
without word prediction and the gross rates with the word prediction list at the UR and FC
locations were statisticall y si y ni ficant (PcO.OO3 ; Table 1 2). Statisticall y. the di tTerences in gross
rates between the preferred location (LM) and the other two locations are not significant (Table
1 2 ) As shown in Figure 36, PP's average g r o s rate of text entry was highest in the follow-up
phase (hJ=9.6 1) when he typed without word prediction. The high-low chart also shows
improvement of çross rates of text-entry without word prediction across al1 three phases
(Figure 36).
Error-adiusted rates of text entry. Data are summarized in Table 1 1 and plotted on the
line graph (Figure 34). PP was slightly faster in enor-adjusted rates of text entry without word
prediction than with word prediction. However, the differences amonç the error-adjusted rates of
ail typing conditions were not statistically significant (Table 12). PP's average error-adjusted
rates of text entry remained higher in the follow-up phase (M=8.70) as compared to the baseline
level (-6.59) and to the average rates with and without word prediction in the alternating
treatment phases. (Figure 37).
L.5 Accuracy of Text Entry
Data are summarized in Table 1 1 and plotted on a line graph (Figure 35). PP appeared to
have slightly higher accuracy when the word prediction list was in the LM location. However.
the differences in accuracy arnong ail typing conditions were not statistically significant (Table
12). PP was observed to have the problem of skipping words. This problem occurred without
word prediction. and with word prediction in the UR and FC locations. The word-skipping
problem started to appear at the altemating treatment phase. and continued into the follow-up
phase: thrrefore. the badine accuracy was highest among the three phases (-=97.17: Figure
38).
L.6 Perceived Performance
The important written productivity tasks identified by PP are presentrd in Table 13. A
high level of importance was associated with al1 of the tasks with each task rated a '8' or above
on the IO-point importance rating scale. The mean performance score and mean satisfaction
score after using word prediction were lower than the baseline scores (change score of -2.25 and
-1.75 for performance and satisfaction respectiwly). As compared to baseline. PP rated his
performance to be higher in 1 out of 4 tasks (25%) and poorer for 3 tasks (75%) afier using word
prediction (Figure 39: Table 13). Comparing satisfaction after using word prediction to baseline.
PP nted 1 task to be the sarne (25%) and 3 tasks to be poorer (75%: Figure 39: Table 13).
L.7 Behaviour Observation
PP maintained focus and was motivated throughout the experiment period. He became
discouraged with the use of word prediction on the 7" day in the alternating treatments phase.
Carelessness. slow movements and yawning were noticed while he typed with word prediction in
the last four d-S. He also needed verbal prompt to continue using word prediction.
Signs of eye strain were observed during the altemating treatments phase. At the end of
the firsr da); in this phase. PP reported severe eye strain and headache. Consequently. he was
asked to close his eyes bnefly during the five-minute break between treatment conditions. This
strategy appeared to alleviate the fatigue on the eyes. Yet PP was observed to be rubbing his eyes
at the end of each day in the altemating treatments phase.
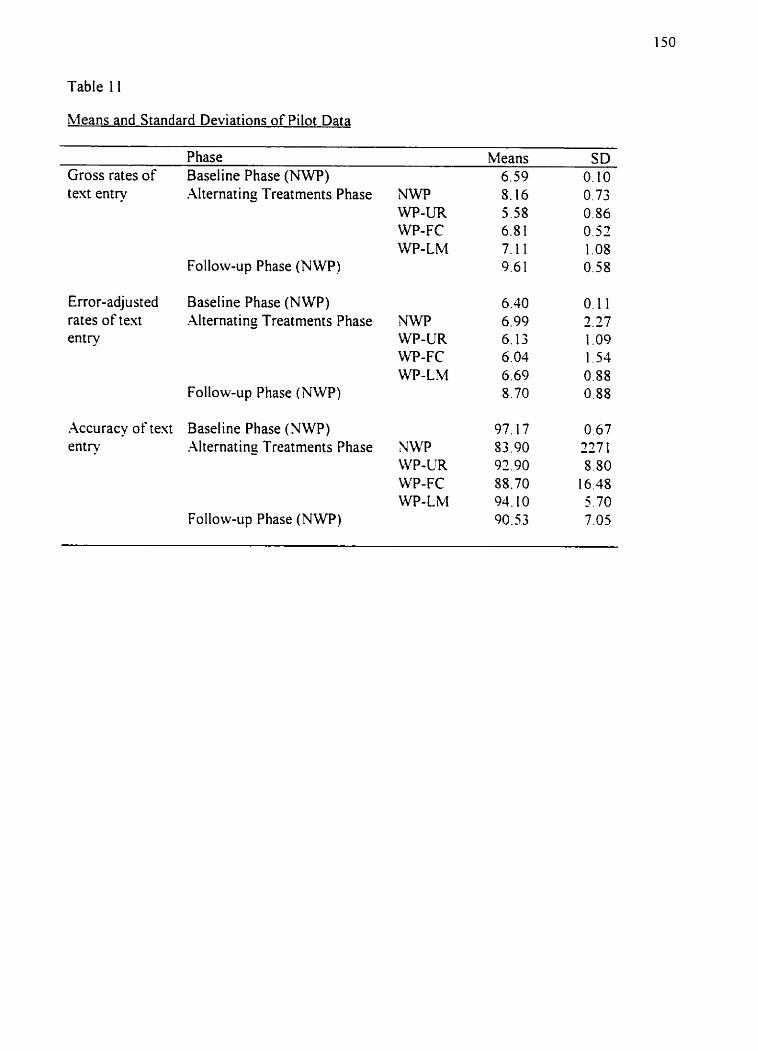
Table 1 I
Means and Standard Deviations of Pilot Data
Phase Means SD Gross rates of text entry
Error-adjusted rates of text entry
Accuracy of text entry
Baseline Phase (NWP) Alternat ing Treat ments Phase
Follow-up Phase (NWP)
Baseline Phase (NWP) Alternat ing Treatments Phase
Follow-up Phase (NWP)
Baseline Phase (NWP) Alternat ing Treatments Phase
Follow-up Phase (NWP)
Nw-P WP-UR WP-FC WP-LM
N W P WP-UR WP-FC WP-LM
NVP WP-UR WP-FC WP-LM
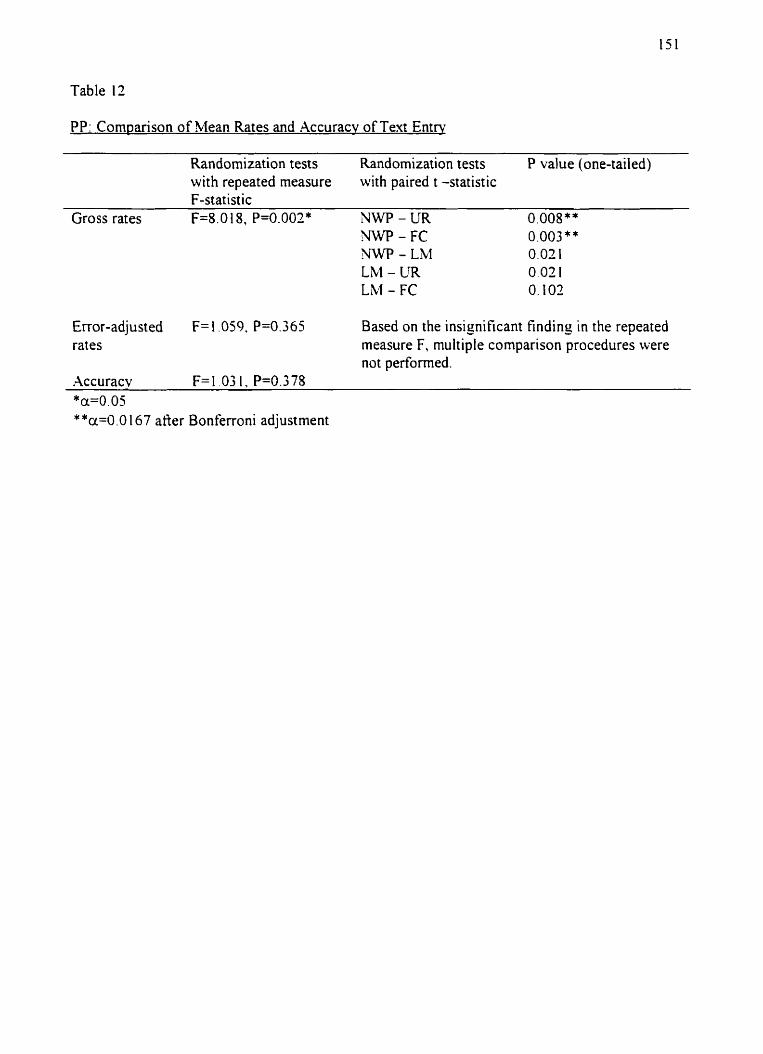
Table 12
PP: Cornparison of Mean Rates and Accuracv of Text Entq
Randomization tests Randomization tests P value (one-tailed) with repeated measure with paired t -statistic F-statistic
Gross rates F=8.018, P=0.002* NWP - UR NWP - FC ?nm - LM LM - UR LM - FC
Error-adjusted F= I .O59, P=0.365 Based on the insignificant findins in the repeated rates measure F, multiple cornparison procedures were
not performed. .\ccuracv F= 1 .O3 I . P=0.3 78 *a=0.05 **u=O.O 167 aller Bonferroni adjustment
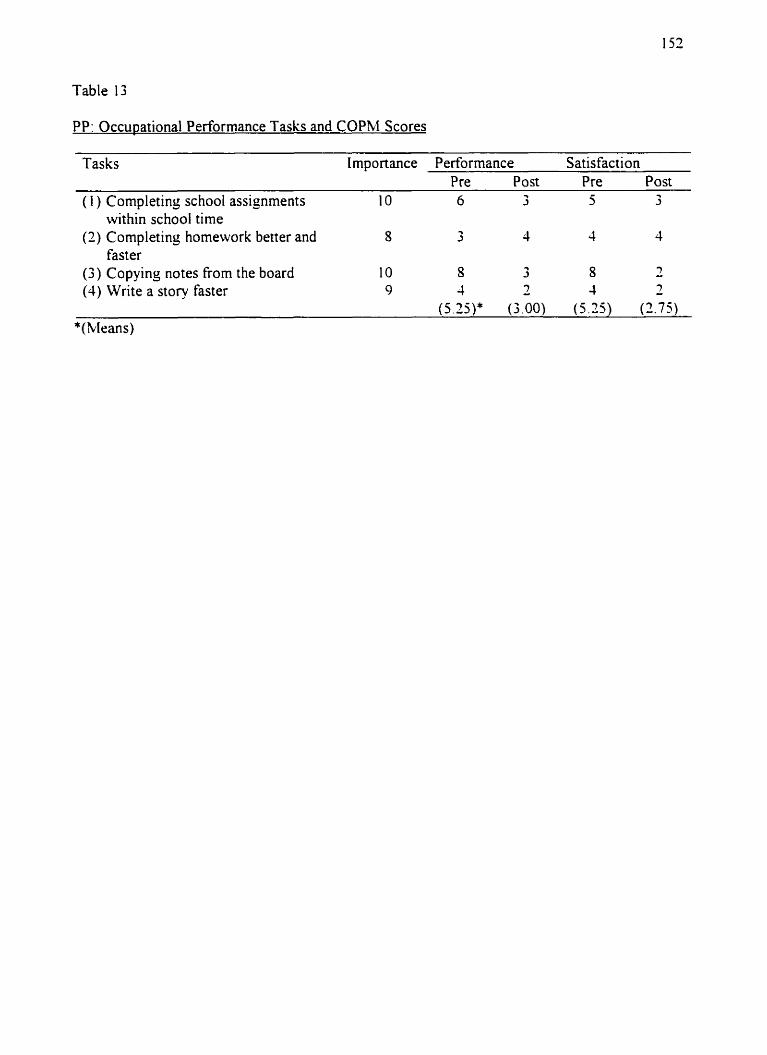
Table 13
PP: Occupational Performance Tasks and COPM Scores
Tasks Importance Performance Satisfaction Pre Post P re Post
( i ) Completing school assignrnents 1 O 6 3 5 3 within school time
(2) Completing homework better and S 3 4 4 4 faster
(3) Copying notes fiom the board 1 O 8 3 S - 3
(4) Write a story faster 9 4 - 7 4 - 7 (,5.25)* (3.00) (5.25) (2.73)
*(Means)
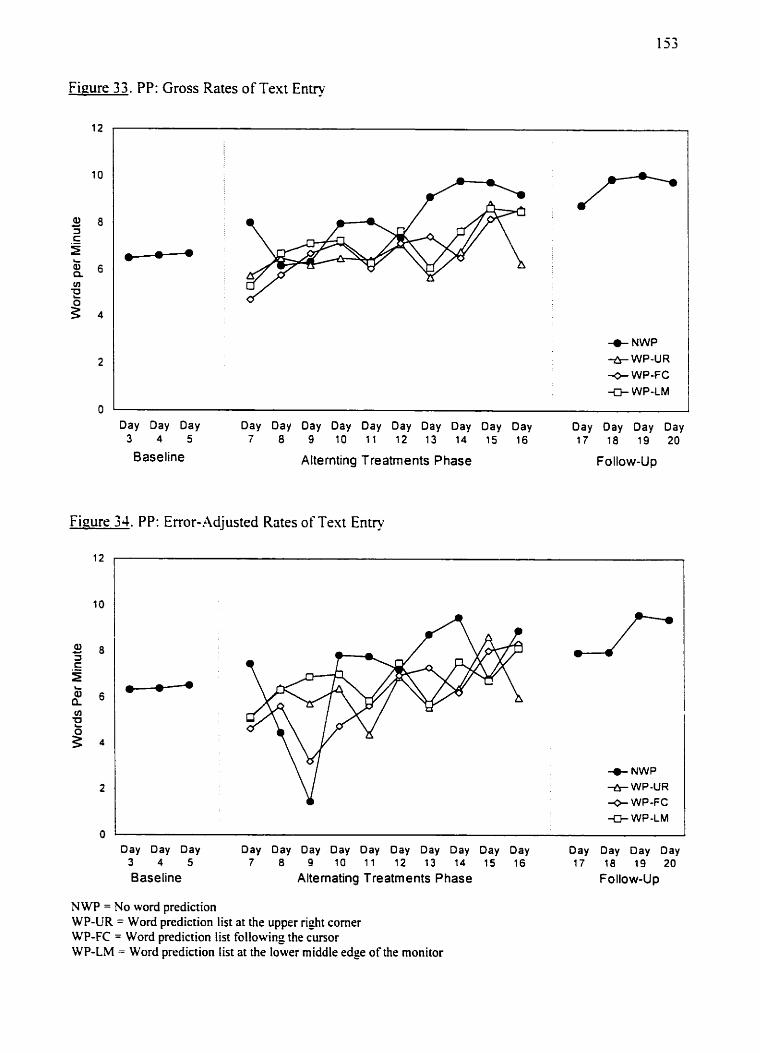
Figure 33. PP: Gross Rates of Text Entry
+ NWP + WP-UR 4 WP-FC + WP-LM
Day Day Day Day Oay Oay Day Day Day Day Day Oay Day Day Oay Day Day 3 4 5 7 8 9 10 1 1 12 13 14 15 16 17 18 19 20
Baseline Alternting Treatrnents Phase Follow-Up
Figure 3 4. PP: Error-Adjusted Rates of Text Entry
12
" --
Day Oay Day Day Day Day Day Day Day Day Day Day Day Day Day Day Day 3 4 5 7 8 9 10 11 12 13 14 15 16 17 18 19 20
BaseIine Altemating Treatments Phase Follow-Up
- +NWP * WP-UR 4 WP-FC + WP-LM
N WP = No word prediction WP-UR = Word prediction list at the upper right corner WP-FC = Word prediction list following the cursor WP-LM = Word prediction list at the lower middle edge of the monitor
I
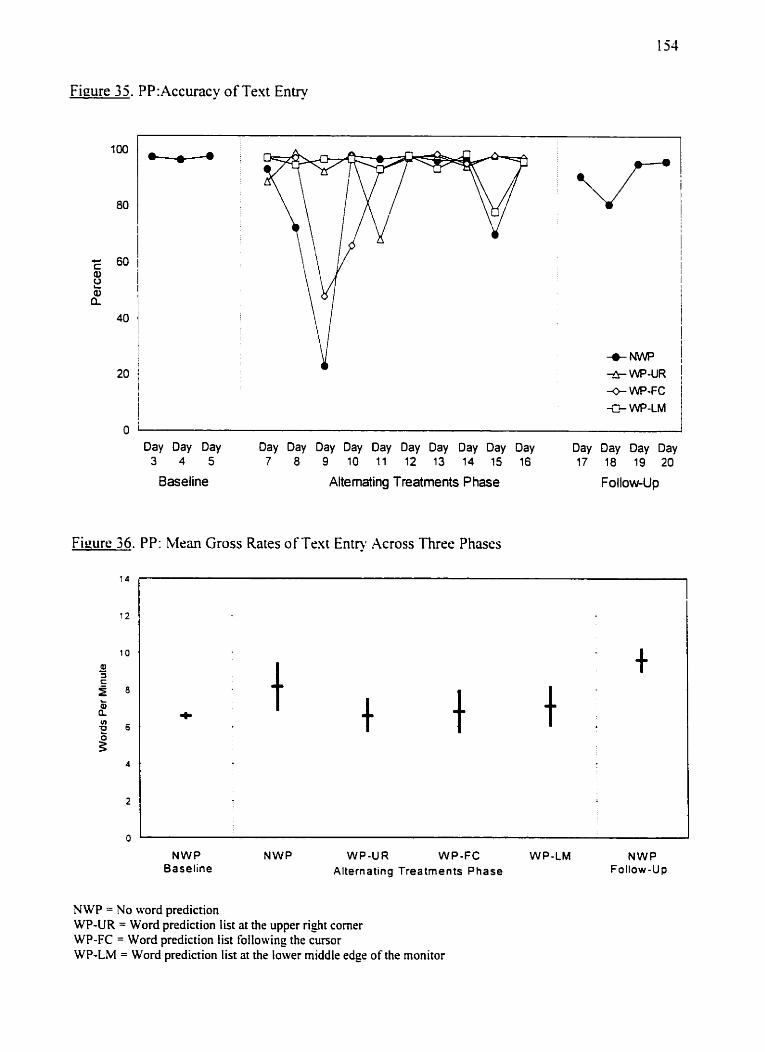
Fieure 35. PP:Accuracy of Ten Entry
- 0 - M N P +Y- WP-UR + WP-FC +- WP-LM
Day Day Day Day Day Day Day Day Day Day Day Day Day Day Day Day Day 3 4 5 7 8 9 10 11 12 13 14 15 16 17 18 19 20
Baseline Altemating Treatments Phase FollowUp
Figure 36. PP: blran Gross Rates of Text Entry Across Three Phases
NWP NWP WP-UR W P-FC W P-LM NWP Baseline Alternating Treatments Phase Foltow-Up
NWP = No w r d prediction WP-UR = Word prediction list at the upper right corner WP-FC = Word prediction list following the cunor WP-LM = Word prediction list at the lower middle edge o f the rnonitor
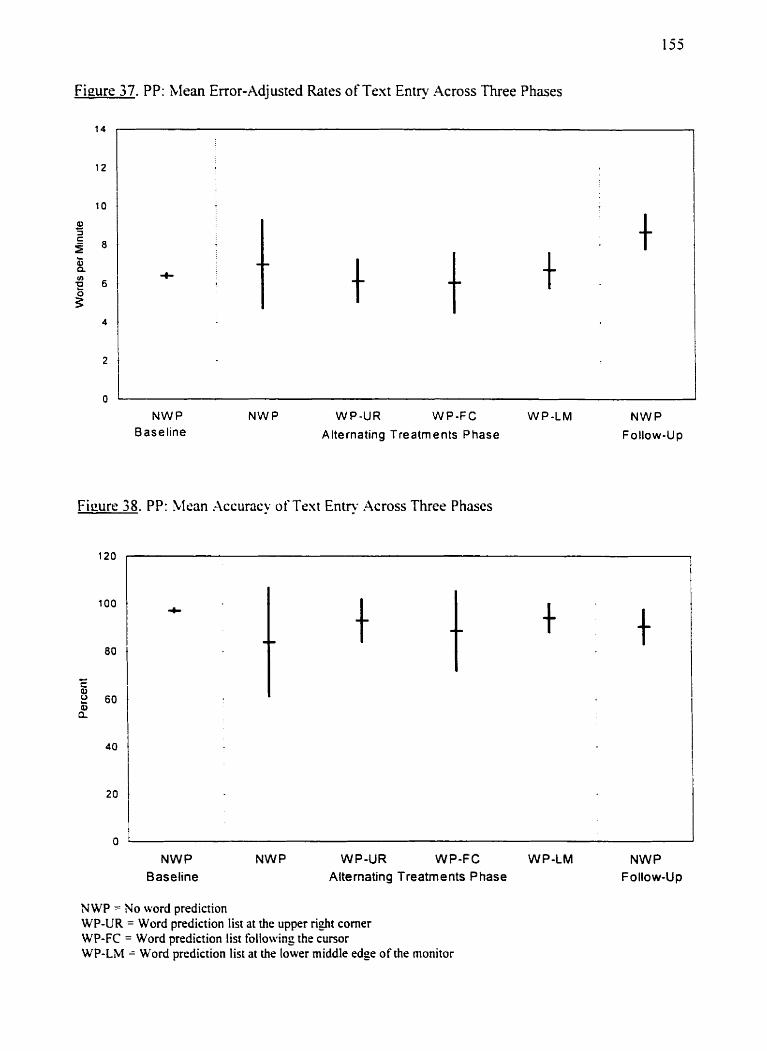
Figure 37. PP: Afean Error-Adjusted Rates oFText Entry .4cross Three Phases
NWP NWP WP-UR WP-FC W P-LM NWP 0 ase line Alternating T reatments Phase Follow-Up
Fieure 38. PP: hl ean .-lccuracy of Text Entry Across Three Phases
- - -- -
NWP NWP WP-UR WP-FC WP-LM NWP Baseline Altemating Treatments Phase Follow-Up
NWP = No word prediction WP-UR = Word prediction list at the upper right corner WP-FC = Word prediction list following the cursor WP-LM = Word prediction list at the lower middle edge of the monitor
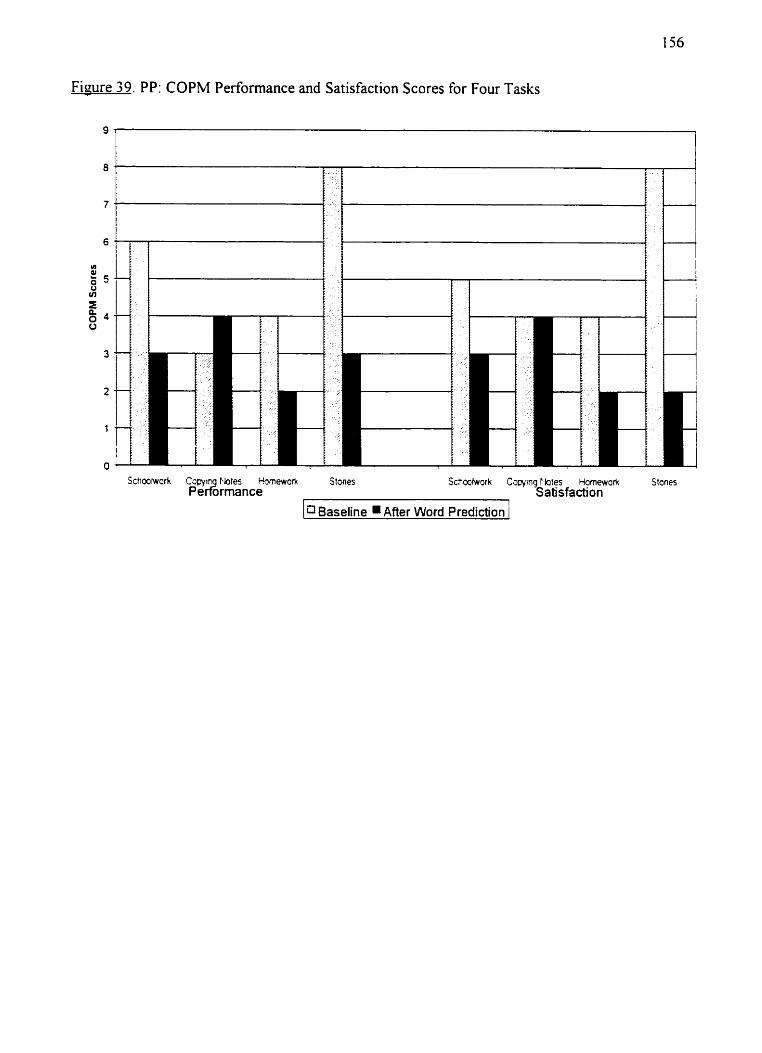
Fisure 39. PP: COPM Performance and Satisfaction Scores for Four Tasks
9
Schoatwcrk Copyin Fbtes Homework Stones Çchooîwork Cwying r bles Homewark Stones ~ e d r r n a n c e Satisfaction
[a Baseline AAer Word Prediction 1