enhanced power generation using controlled inoculum from palm oil mill effluent fed microbial fuel...
TRANSCRIPT
Fuel 143 (2015) 72–79
Contents lists available at ScienceDirect
Fuel
journal homepage: www.elsevier .com/locate / fuel
Enhanced power generation using controlled inoculum from palm oilmill effluent fed microbial fuel cell
http://dx.doi.org/10.1016/j.fuel.2014.11.0300016-2361/� 2014 Elsevier Ltd. All rights reserved.
⇑ Corresponding author. Tel.: +60 9 5492872; fax: +60 9 5492889.E-mail addresses: [email protected], [email protected] (M.R. Khan).
E. Baranitharan a, Maksudur R. Khan a,⇑, Abu Yousuf b, Wee Fei Aaron Teo c, Geok Yuan Annie Tan c,Chin Kui Cheng a
a Faculty of Chemical and Natural Resources Engineering, University Malaysia Pahang, 26300 Pahang, Malaysiab Faculty of Engineering Technology, University Malaysia Pahang, 26300 Pahang, Malaysiac Institute of Biological Sciences, Faculty of Science, University of Malaya, 50603 Kuala Lumpur, Malaysia
h i g h l i g h t s
� A new form of inoculum called controlled inoculum was made from palm oil AS.� Controlled inoculum consists of both fermentative and electrogenic microorganisms.� The inoculum showed higher power density and coulombic efficiency than AS.� EIS analysis showed significant reduction of anode Rct using controlled inoculum.
a r t i c l e i n f o
Article history:Received 22 July 2014Received in revised form 1 November 2014Accepted 8 November 2014Available online 20 November 2014
Keywords:Microbial fuel cellPolyacrylonitrile carbon feltControlled inoculumPalm oil mill effluentElectrogen
a b s t r a c t
Enhancing the anode performance is a critical step for improving the power output of MFCs. This studydeals with the dual chamber MFCs to increase the power generation using the controlled inoculum inPalm oil mill effluent (POME). Controlled inoculum (CI) was made using the predominant microorgan-isms such as Pseudomonas aeruginosa, Azospira oryzae, Acetobacter peroxydans and Solimonas variicolorisisolated from palm oil anaerobic sludge (AS) as well as from biofilm of MFC anode operated with ASand identified using BIOLOG gene III analysis, PCR, DGGE and sequencing. Biofilm formation on electrodewas investigated by Fourier Transform Infrared spectroscopy (FTIR) and Thermogravimetric analayis(TGA). The MFC operated with Polyacrylonitrile carbon felt (PACF) anode and CI reached the maximumpower density of 107.35 mW/m2, which was two times higher as compared to MFC operated with usualanaerobic sludge as inoculum. The maximum coulombic efficiency (CE) of 74% was achieved from theMFC with CI, which was 50% higher than the CE with anaerobic sludge. But, it showed lower COD removalefficiency of about 32%, which might be due to the absence of required fermentative microorganisms in CIto utilize POME. The electrochemical activities have been investigated by electrochemical impedancespectroscopy (EIS). EIS and the simulated results showed the significant reduction of charge transferresistance (Rct) by �40% during the operation of the cell with CI. EIS results provided evidence that therewas a substantial improvement in electron transfer between the microorganisms and the anode with CI.These results demonstrate that the power output of MFCs can be increased significantly using CI.
� 2014 Elsevier Ltd. All rights reserved.
1. Introduction neutral energy sources [3]. MFCs are fuel cells that are capable of
Energy needs in the world continue to increase and in an effortto aid energy independence, research initiatives are focused onalternate, renewable and carbon neutral energy sources. Produc-tion of electrical energy using microorganisms through microbialfuel cells (MFCs) is one such renewable and sustainable technologythat is considered to be one of the most efficient [1,2] and carbon
converting chemical energy available in organic substrates intoelectrical energy using bacteria as a biocatalyst to oxidize the bio-degradable substrates. The fact that bacteria can oxidize the sub-strates to produce electricity makes MFCs an ideal solution forwastewater treatment and domestic energy production [4]. TheMFC is still at an early research stage, but it can be a revolutionarybreakthrough for capturing renewable energy sources [5]. Under-standing the fundamental relationship between the microbiologyand electrochemistry is critical to the advancement of this technol-ogy. It was found that the cell count, biofilm density and the type
E. Baranitharan et al. / Fuel 143 (2015) 72–79 73
of communities in the anode biofilm had a direct influence on thepower output of microbial fuel cells. Also the power density wasdirectly dependent on the biofilm growth that increased signifi-cantly during the initial biofilm growth period [6,7]. Current out-puts of microbial fuel cells (MFCs) are too low for most perceivedpractical applications. Most efforts for further optimization havefocused on modifications of fuel cell architecture or electrodematerials, with little investigation in the inoculum that are mostessential for maximal current production [8]. Usually anaerobicsludge (AS) has been used as inoculum in the MFC experimentswhen wastewater is used as substrate but many unwanted micro-organisms, which could reduce the MFC performance also presentin the sludge. Besides that, in most of the MFC experiments, singlesubstrate (Glucose, acetate) and known microorganisms (Geobactersulfurreducens, Shewanella oneidensis) has been used which showedhigh power generation [9]. But the same high power producingmicroorganisms when used in wastewater showed less power den-sity. This is due to the presence of different kinds of substrates inthe wastewater, which makes specific microbes not suitable tobe used as inoculum when wastewater is used as substrate.
In the recent MFC studies, it was found that biofilm plays animportant role in electricity production [10,11] but predominantmicroorganisms present in it was not identified which are crucialfor the high power generation. Moreover, in order to utilize waste-water, fermentative microorganisms are greatly needed in theinoculums. Katuri et al. [12] operated MFC with anaerobic sludgeas inoculum for batch studies, after 3rd cycle of operation; substratewas refilled without anaerobic sludge. During that refilling period,current density increased and within a short period it retained backto its previous current density level. This shows that the necessaryfermentative bacterial population needed to maintain power isretained in the anodic biofilm. But unfortunately fermentativemicroorganisms cannot completely oxidize the substrate and there-fore high power cannot be achieved. To achieve complete oxidation,electrogenic microorganisms are needed [13] however, electrogenicmicroorganisms cannot utilize all the substrates. Therefore, thepresence of atleast one electrogen in the inoculum is an importantrequirement for microbial fuel cells to oxidize organic substrateseffectively to achieve maximum electricity. So far, only few studieshave been reported about the use of biofilm as inoculum from theMFC run with AS [12,14] which is essential to enhance MFC perfor-mance. However, upto our knowledge, there is no study reportedthe use of combination of fermentative and electrogenic microor-ganisms as inoculum in MFC operation.
In this work, we prepared the controlled inoculum whichconsists of both fermentative and electrogenic microorganisms.Fermentative bacteria consume complex organic substrates andproduce intermediate products. Whereas, electrogenic microor-ganisms can consume those intermediate products produced byfermentative organisms and also certain molecules like acetateand hydrogen and completely oxidize them. This synergistic inter-action plays an important role in electricity production and waste-water treatment in MFC. Moreover, the performance of doublechamber MFC with CI and also its power generation, COD removalefficiency and Coulombic efficiency were investigated. Electro-chemical impedance spectroscopy (EIS) was used to study the cor-relation between the controlled inoculum and the electrochemicalperformance of microbial fuel cells operated for 14 days.
2. Materials and methods
2.1. MFC construction
MFCs consisting of two cylindrical compartments were madeusing glass material (borosilicate) and fabricated in China (Shangai
sunny scientific, China). A piece of Nafion 117 membrane (DupontCo., USA) was placed between the anode and cathode chambers toelectrically separate the anode and cathode compartments whilepermitting proton transport. PACF (Polyacrylonitrile carbon felt)was purchased from Shangai sunny scientific, China and used aselectrode material for all the experiments. Equal size of PACF(3.8 cm � 0.9 cm � 4 cm) was used as electrode in each compart-ment of dual chamber MFC. Prior to use, PACF was washed severaltimes with water to remove impurities and Nafion membrane wasdrenched overnight in dilute HCL followed by washing with DIwater for several times. The anode chamber was filled with450 mL of POME which was collected before it discharged intothe collection pond or mixing pond from palm oil industry effluentoutlet and inoculated with CI isolated from AS of Felda PanchingTimur, Kuantan, Malaysia. The cathode chamber was filled with450 mL of potassium permanganate solution and its concentrationwas kept constant throughout the experiment. All MFC materialswere sterilized prior to use by autoclave, bleach, or ethanol treat-ment and the cell components were assembled under sterile water.The anode and cathode electrodes were connected by using copperwires with a resistor to form a circuit. All experiments were carriedout at the constant temperature (29 ± 0.5 �C) with a 1 kX externalresistance connected unless otherwise specified.
2.2. Measurement and analyses
The voltage (V) and current (I) across an external resistor (1 kX)in the MFC circuit was continuously monitored (15 min intervals)using a multimeter with data logger (Fluke 289 True RMS Multim-eter, USA) connected to the computer through USB cable adapter.To obtain polarization data, the external resistance was variedfrom 50 to 20,000 X. Current density (I) was calculated fromI = V/R, and normalized by surface area. Power density normalizedby surface area (PA, W m�2) were measured and calculated usingthe following equations
P ¼ VI ð1Þ
P ¼ V2=AR ð2Þ
COD was periodically checked by taking small amount of sam-ple from the anode effluent for every 24 h. The COD removal effi-ciency (g) was calculated as described by Baranitharan et al. [15]and the CE of the complex substrates was calculated followingLogan et al. [5].
2.3. DNA extraction, PCR, cloning and sequencing
Extraction of total genomic DNA from the biofilm was doneusing a soil extraction kit (Nucleospin soil, Macherey – Nagel, Ger-many). For the identification of bacterial community, the bacterial16S rRNA genes were amplified with primer pair 27f and 1492r[16] using the Veriti� 96-Well Thermal Cycler (Applied Biosystems,USA). Amplification was carried out in 50 ll PCR reaction mixturesconsisting 100 ng of DNA template, 1.5 mM MgCl2, 0.2 mM nucle-otide mix, 0.2 lM of each primer and 1.25U of GoTaq� DNA Poly-merase (Promega, USA) with the following cycling condition:initial denaturation at 94 �C for 5 min; 35 cycles of denaturationat 94 �C for 30 s, annealing at 55 �C for 1 min, and extension at72 �C for 30 s; and a final extension at 72 �C for 10 min. PCR prod-ucts were then cloned with TOPO� TA Cloning� Kit for Sequencing,with One Shot� TOP10 Chemically Competent Escherichia coli(Invitrogen™, USA). Clone libraries were analysed by PCR withM13 forward and reverse primers, and nested PCR with primer pairGC341f and 517r were carried out for DGGE analysis [17] NestedPCR products were analyzed by DGGE with a denaturing gradient
74 E. Baranitharan et al. / Fuel 143 (2015) 72–79
from 45% to 60% (7.5% acrylamide, 8 h at 100 V) in the Cipher DGGEElectrophoresis System (CBS Scientific, USA) after which the gelwas stained using GelRed™ (Biotium Inc., USA) and visualized byUV transillumination. Selection of unique clones for identificationwas based on DGGE analysis [18]. Clones that were clustered onthe basis of band patterns were selected as representative clonesfor sequencing. The 16S rRNA sequences (625 bp) were checkedand aligned with comparative sequences of reference strainsretrieved from the GenBank database through the EzTaxon server[19] using MEGA 5 [20].
2.4. Phylogenetic tree
An unrooted phylogenetic tree was inferred by neighbour-join-ing tree-making algorithms [21] via evolutionary distances calcu-lated with the Kimura 2-parameter model [22] using MEGA 5(complete deletion option). The phylogenetic tree was statisticallytested using bootstrap phylogeny analysis with 1000 replications.
2.5. Biolog gene III analysis
Once the pure cultures from the samples were obtained,BIOLOG GEN III test (Biolog Inc., United States) was carried out toidentify the genus and species of microorganisms by performingcarbon consumption tests with the isolated microorganisms underaerobic conditions. Biolog microplate consists of 96 wells out ofthose 71 wells for source utilization assay and 23 wells for chemi-cal sensitivity assays. Tetrazolium redox dyes were used to colori-metrically indicate utilization of the carbon sources or resistance toinhibitory chemicals. The isolated colonies were precultivated onTryptic soy agar plates and incubated at 33 �C for 24 h. Picked upa pure culture of 3 mm diameter area of colony using cotton tippedinoculators swab from the agar plate containing pure cultures andimmediately released the bacteria into the inoculating fluid (IF)and stirred with the swab to obtain a uniform cell suspension thenfilled all wells with 100 ll of cell suspension and incubated at 33 �Cfor 36 h. All of wells start out colorless when inoculated but duringincubation there is increased respiration in the wells where cellscan utilize a carbon source leads to increased respiration causesreduction of the tetrazolium redox dye, forming purple color. Afterincubation, the microplates were read using BIOLOG’s microbialidentification system software and based on match, species levelidentification of the isolate was made [23].
2.6. U-tube MFC construction
The U-tube MFC consisted of two compartments; anode andcathode, with working volume of 30 and 60 mL respectively. Thetwo chambers were separated by a Nafion membrane 117 (Dupont,USA) and were joined together by a C-type clamp. Both the anodeand cathode tubes were sealed with rubber stoppers. Placing theanode on the bottom of the vertically aligned anode chamber tubeallowed bacteria to be quickly deposited directly on the electrodesurface. The U shape of the cathode chamber used hydrostaticpressure to keep the catholyte solution 200 mg/L KmNO4 solutionpressed against the cathode. PACF (Shangai sunny scientific, China)was used as anode material. A piece of the anode connected withwire extended through the top of the rubber stopper to make anelectrical connection. The cathode was made of long plain PACF(Shangai sunny scientific, China) wrapped at one end with a tita-nium wire, with the other end close to the Nafion membrane.The wire was extended through the top of the rubber stopper tocomplete the electrical connection. The PACF cathode provided alarger surface area (10 cm2) than the anode electrode (6.28 cm2)to reduce limitations on power generation by the cathode. The
anode was connected to the cathode via a 1000 X resistor, unlessotherwise noted [23].
2.7. Wastewater characterization and controlled inoculumpreparation
Chemical oxygen demand of POME was analyzed by standardmethods [24]. To prepare the controlled inoculum, the MFC wasoperated with AS for one month and the obtained biofilm onelectrode surface was scrapped using sterile knife and placed insterilized vial. Later, the predominant microorganisms were iso-lated from the scrapped biofilm by plating a serial dilution(10�6, 10�5and 10�4) of the consortium on nutrient agar. Theplates were incubated under anaerobic conditions for 5 daysand single colonies were purified by using at least two isolationsteps until they were morphologically pure. Pure cultures of iso-lates were prepared in nutrient broth after isolation from the agarplates. Once the pure cultures from the samples were obtained,PCR, DGGE and sequencing were carried out to identify the genusand species. The predominant microorganisms present in theanaerobic sludge were identified using BIOLOG Gene III (BiologInc., United States) test by performing carbon consumption tests[23]. Those identified fermentative microorganisms and electro-genic microorganisms from biofilm and AS were mixed andformed the controlled inoculum.
2.8. Infrared spectroscopy (FTIR) and Thermogravimetric analysis(TGA)
IR samples were prepared by first oven drying at 120 �Covernight to remove the water, and then grinding with dry KBrat 1 wt% sample. Samples were analyzed on a Nicolet Avatar 370DTGS FT-IR spectrophotomer under N2 with a dry KBr background.TGA samples (5 mg) were analyzed on TA Instruments Q500,thermogravimetric analyzer, at a heating rate of 10 �C min�1 inan atmosphere of N2.
2.9. Electrochemical impedance spectroscopy
Electrochemical impedance spectroscopy (EIS) was carried outusing an electrochemical workstation (AUTOLAB 2273, PAR, USA).A conventional three-electrode system was employed with theanode as the working electrode, the cathode as the counterelectrode, and an Ag/AgCl reference electrode which was placedas close as possible to anode electrode [25]. EIS tests wereperformed at AC signal amplitude of 10 mV, at 40 logarithmic fre-quency steps between 100 kHz and 5 mHz. The test duration wasapproximately 30 min. Impedance measurements were taken onanode (A) configuration. The impedance data were fitted to theequivalent electrical circuit to obtain key parameters such asthe electrochemical charge transfer resistance for the anode.The Nyquist plots of the impedance spectra were analyzed usingNOVA 1.9 (NOVA Software).
3. Results and discussion
3.1. Identification of predominant microorganisms in the biofilm
About 192 clones with the correct bacterial 16S rRNA geneswere analysed with DGGE. Generally, a DGGE analysis on 16S rRNAgenes optimally would be shorter than 400 bases [26], however theclone libraries approach enable a longer 16S rRNA gene fragmentto be sequenced and be used in the phylogenetic analyses [18].Furthermore, the clone libraries approach would also avoid thepossibility of excising multiple bands during DGGE gel excision

E. Baranitharan et al. / Fuel 143 (2015) 72–79 75
thus providing a more reliable identification [17]. Twenty-threeclones were selected for 16S rRNA gene partial sequencing forthe identification of the bacterial community. Seven sequencesdeciphered as chimera [27] were excluded from subsequent anal-ysis. Sixteen clones were then identified to the families Xanthomo-nadaceae (Group I), Rhodocyclaceae (Group II), Acetobacteraceae(Group III), and Solimonadaceae (Group IV) based on phylogeny ofthe 16S rRNA gene (Fig. 1). Sequences in Group I showed pairwisesimilarity below 97% and a distinct branching in the phylogenetictree indicating possible new taxa within the Xanthomonadaceae[28]. These yet to be cultured bacteria could present new insighton the workings of microbial fuel cells. Sequences in Group II, IIIand IV are found to be closely related to Azospira oryzae, Acetobac-ter peroxydans and Solimonas variicoloris respectively. All the iden-tified microorganisms are fermentative and no electrogen found inthe biofilm.
RhodanobacterFulvimonas soli LM
Luteibacter rhizovicinuFrateuria aurantia DSM 6
Dyella thiooxydans ATSB10Dyella ginsengisoli Gsoil
A32 532 (KJ136009) A32 502 (KJ136006)
StenotrophomonasPseudoxanthomonasXanthomonas campe
FerribacteriDechlorom
AzonexAzospira ory
A12 1005 (K A12 1006 (K A12 1022 (K A12 502 (KJ A12 518 (KJ
A32 543 (K A12 525 (KJ
Azospira restrictaRhodocyclus pur
AcidAcidocella
Acetobacter p A12 514 (KJ1 A12 1011 (KJ
AcetobacterAcetobacter
Nevskia ramosa Soe1T (APolycyclovorans algicola TG408
Fontimonas thermophila HA-0 A32 557 (KJ136012) A32 533 (KJ136010) A32 531 (KJ136008) A32 506 (KJ136007) A32 1024 (KJ136005)
Solimonas variicoloris DSSolimonas flava CW-KD 4
Pseudomonas aeruginosa LMG 1242T (Z76651
100
91
100
98
100
87
85
100
95
95
73100
99
79
78
69
98
100
98
55
69
5396
100
59
94
100
0.01
Fig. 1. Phylogenetic identification of the clones (neighbour-joining phylogenetic tree cowere denoted T) using 625 nucleotides (all sequences with GenBank accession number artaxa clustered together in the bootstrap test is shown next to the branches. The tree isdistances used to infer the phylogenetic tree (Kimura 2-parameter model). Pseudomona
3.2. Identification of electrogen from anaerobic sludge
The predominant microorganisms present in the anaerobicsludge were isolated and identified as Pseudomonas aeruginosa,Actinobacillus capsulatus, Acetobacter peroxydans, Pseudomonasmendocina, Acinetobacter schindleri and E. coli using BIOLOG geneIII analysis. Among the microorganisms identified the only knownelectrogen found in AS was P. aeruginosa.
3.3. Performance of isolated pure cultures from biofilm and anaerobicsludge
Polarization and power density curves were obtained for U-tubeMFC with S. variicoloris, A. peroxydans, A. oryzae and P. aeruginosa asinoculum in 30 mL of 1000 mg/L POME are shown in Fig. 2. Themaximum power attained for S. variicoloris, A. peroxydans, A. oryzae
lindaniclasticus RP5557T (AF039167)G 19981T (AJ311653)s LJ96T (AJ580498)220T (AGRV01000006)T (EF397574)3046T (AB245367)
Group I
maltophilia ATCC 13637T (AB008509)broegbernensis B1616/1T (AJ012231)stris ATCC 33913T (AE008922)
Xanthomonadaceae
um limneticum cda-1T (Y17060)onas agitata CKBT (AF047462)us fungiphilus BS5-8T (AF011350)
zae 6a3T (AF011347)J135998)J135999)J136001)136013)136003)J136011)136004)
Group II
SUA2T (DQ974114)pureus 6770T (M34132)
Rhodocyclaceae
iphilium cryptum ATCC 33463T (D30773)facilis ATCC 35904T (D30774)eroxydans IFO 13755T (AB032352)36002)136000)
Group III
senegalensis CWBI-B418T (AY883036)aceti NCIMB 8621T (X74066)
Acetobacteraceae
J001010)T (FJ176554)1T (JN415769)
Group IV
M 15731T (ARNM01000022)T (EF154515)
Solimonadaceae
)
nstructed for the 16 clones with 25 nearest species within the family (type strainse given in the parenthesis). The percentage of replicate trees in which the associateddrawn to scale, with branch lengths in the same units as those of the evolutionarys aeruginosa LMG 1242T (Z76651) was used as outgroup).

76 E. Baranitharan et al. / Fuel 143 (2015) 72–79
and P. aeruginosa are about 14 lW, 17 lW, 19 lW and 141 lWrespectively. Among the isolated microbes, P. aeruginosa showedhigher power in U-tube microbial fuel cell. P. aeruginosa has beenused previously in MFCs [13,29,30] and it is a known electrogen[31]. Rabaey et al. [32] reported the growth and electrochemicalperformance of P. aeruginosa in biofuel cell. In their study, the max-imum power density produced was about 23 W/m2 using nutrientbroth as substrate and in another study [33] they found the valueof about 1206 lW/m2 using 2.5 g/L glucose medium. Mavrodi et al.[34] reported that P. aeruginosa is capable of producing pyocyaninand several more shuttling compounds which can be able to trans-fer electrons from the bacterial cells to the electrodes. Further-more, these obtained results clearly shows the electrogeniccharacteristics of P. aeruginosa.
Whereas, A. oryzae is a known microbial fuel cell bacteria[35,36] which normally found in the MFC anode enriched withFe(III) citrate [37] and also found from the MFC operated with arti-ficial wastewater as substrate [38] but the individual performanceof this microorganism in the MFC has never been reported. A.peroxydans is also a known microbial fuel cell bacteria isolatedfrom the surface colony of marine sediment fuel cell anaerobicelectrodes [39] and its individual MFC performance also never beenreported. S. variicoloris also called as Singularimonas variicoloris
0 20 40 60 800.0
0.2
0.4
0.6
Cell voltage
I (A X 10-6)
V (V
)
0
2
4
6
8
10
12
14
Power density
P (W X 10
-6)
A
0 20 40 60 80 100 120
0.0
0.2
0.4
0.6
0.8
Cell voltage
I (A X 10-6)
V (V
)
0
2
4
6
8
10
12
14
16
18
20
Power density
P (W X 10
-6)
C
Fig. 2. Polarization and power density curve of MFC using (A) Solimonas variicoloris (B) A
has never been reported in MFC but it is a known hydrocarbondegrader isolated from biofilters for waste gas treatment [40,41].
3.4. Performance of controlled inoculum using MFC with POME
The MFCs were fed with diluted POME with an initial COD of1000 mg/L and CI as inoculum for all the experiments exceptAS study. CI (20 mL) was prepared from four liquid cultures (P.aeruginosa, A. oryzae, A. peroxydans, S. variicoloris) by pipetting5 mL of inoculum from each liquid culture and added into anodecompartment containing 450 mL POME. Since electrogen was notpresent in biofilm, electrogen (P. aeruginosa) isolated from anaero-bic sludge was used in controlled inoculum. The current generationfrom POME in the MFC system using AS and CI was compared overtime and presented in Fig. 3a. From the Fig. 3a, it was found thatthe current densities of both anaerobic sludge and controlled inoc-ulum tend to increase from day 1 until day 10 but after 7 days asharp increase in current generation occurred only in controlledinoculum. From day 11 to day 14, the current density was foundslightly decrease due to the accumulation of metabolite productsuch as the accumulation of ion H+ depressed the microbial activ-ities [42]. The COD removals of the POME in the MFC system usingAS and CI was compared over time are shown in Fig. 3b. As time
0 20 40 60 800.0
0.2
0.4
0.6
0.8
1.0
Cell voltage
I (A X 10-6)
V (V
)
4
6
8
10
12
14
16
18
Power density
P (W X 10
-6)
B
0 100 200 300 400 500 600 700 8000.0
0.1
0.2
0.3
0.4
0.5
0.6
0.7
0.8
Cell voltage
I (A X 10-6)
V (V
)
0
20
40
60
80
100
120
140
160
Power desnsity
P (W X 10
-6)
D
cetobacter peroxydans (C) Azospira oryzae (D) Pseudomonas aeruginosa as inoculum.

0 2 4 6 8 10 12 14 160
20406080
100120140160180200220240260280300
Cur
rent
den
sity
(mA
/m2 )
Time (in days)
Anaerobic sludge Controlled inoculum
Fig. 3a. Profile of current densities of MFC using CI and AS with time.
E. Baranitharan et al. / Fuel 143 (2015) 72–79 77
increased, the efficiency increased and reached a maximum ofapproximately 70%, and 32% for MFC with AS and CI respectivelyon 14th day of MFC operation. This result shows higher CODremoval than obtained by Jong et al. [43] using MFC with POME(23%). But in case of Coulombic efficiency, CI showed highercoulombic efficiency of about 74% whereas AS showed only 24%.Even though the COD removal efficiency was higher for AS, theproduced current density was lower compared to CI. So, a consid-erable amount of COD was lost without generating the power. ThisCOD loss was presumably due to biomass generation, incompletebiodegradation of the substrate, hydrogen production, methano-genesis, aerobic degradation, neutral metabolites diffusing to thecathode chamber [44]. Whereas, in MFC with CI, the currentdensity showed higher than produced by AS but showed lessCOD removal percentage compared to AS. Higher power densityproduction by CI might be due to the presence of predominantfermentative microorganisms and electrogens in the biofilm andexclusive of other microorganisms which produce unwanted prod-ucts that reduces power production. Fermentative microorganismswere included in the CI to utilize complex substrates and convertinto intermediate products and electrogenic microorganisms wereadded to completely oxidize the intermediate products therebycomplete utilization of substrates could be achieved which leads
0 2 4 6 8 10 12 14 160
10
20
30
40
50
60
70
80
CO
D re
mov
al e
ffici
ency
(%)
Time (in days)
Controlled inoculum Anaerobic sludge
Fig. 3b. Profile of COD removal efficiency of MFC using CI and AS with time.
to production of more electrons and it consecutively produce moreelectricity. Lower COD removal using CI is due to the lack of somefermentative and other microorganisms (which utilizes substratesonly for its growth) to utilize all the compounds present in thePOME.
3.5. Polarization and power density curves
The polarization and power density curves of MFC using AS andCI on 7th day are shown in Fig. 4. The maximum power density ofabout 107.35 mW m�2 and 33.62 mW m�2 was found on 7th day ofMFC operation with CI and AS respectively. The power density pro-duced using CI showed higher compared to AS as inoculum. Thisindicates that the controlled inoculum has the potential to achievehigher power density compared to most widely used AS.
3.6. FTIR analysis of the biofilm
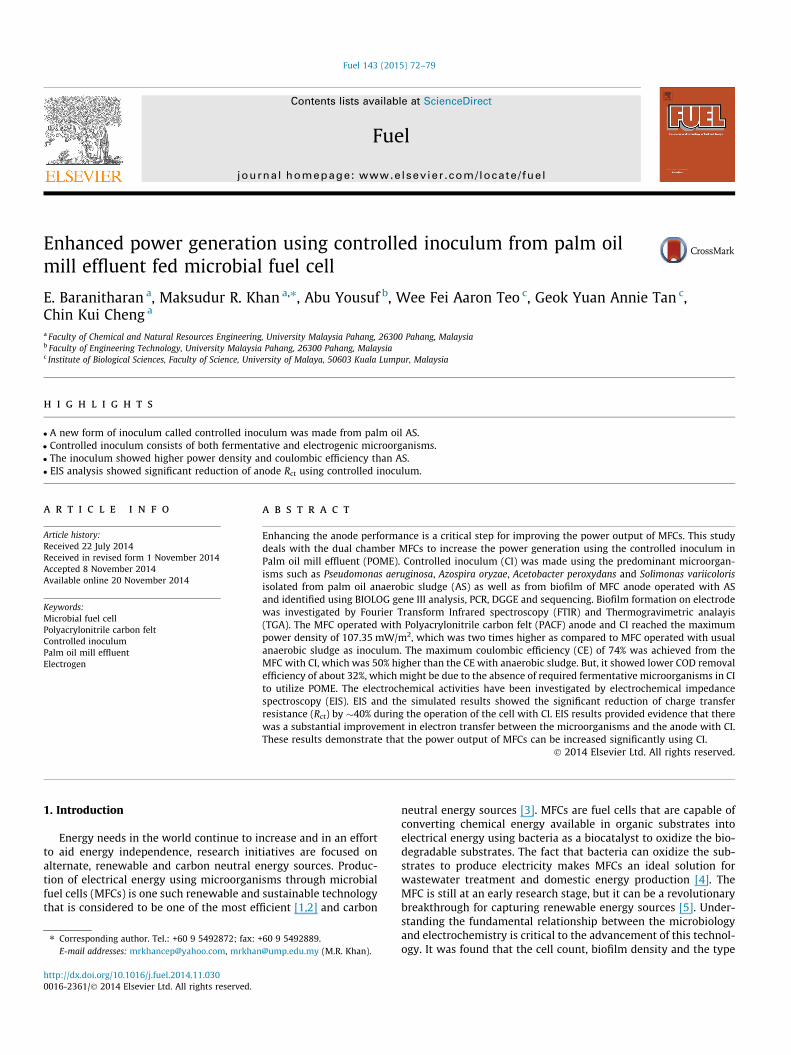
Anodes were investigated by FT-IR before and after MFC treat-ment for 14 days with CI and AS. The results are presented inFig. 5. The broad band observed in the 3500–3300 cm�1 range isattributed to the free and bound OAH and NAH groups, whichcould form hydrogen bonding with the carbonyl group of the pep-tide linkage in the protein [45]. The bands at 2919 cm�1 and2850 cm�1 can be attributed to the functional groups of membranefatty acids and by some amino acid side-chain vibrations since herethe characteristic CAH stretching vibrations of ACH3 and @CH2
functional groups dominate [46]. The band observed between2240 and 2280 cm�1 attributed to (AC„N) nitrile groups of PACF.The bands observed at 1538.99 cm�1 and 1578.44 cm�1 is charac-teristic of amide II bands of protein [47] present in the microorgan-isms (biofilm). The band at 1466.29 cm�1 is CAH deformation of@CH2 functional groups. These results confirm the presence of bio-film on the surface of electrode. The increased intensities of thebands in the AS operated biofilm indicates the presence of higherbiomass content than the CI operated biofilm.
3.7. TGA analysis on biofilm
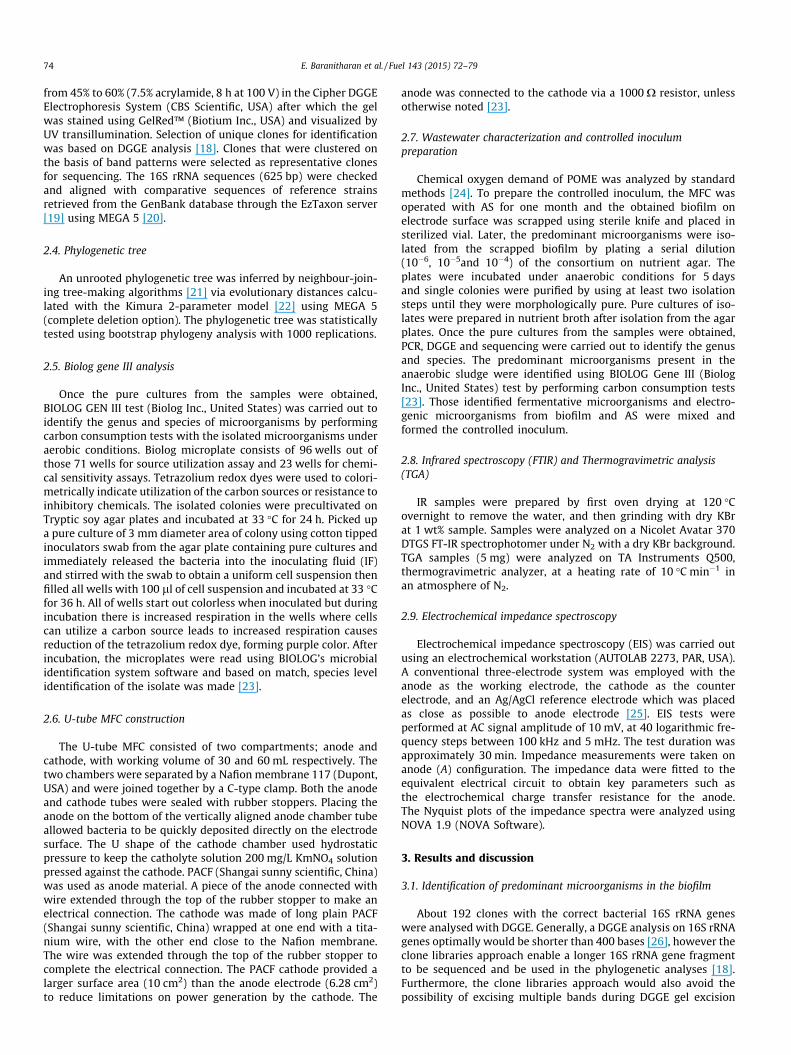
MFC anodes were examined using TGA before MFC treatmentand after MFC treatment with AS and CI are shown in Fig. 6.Distinct changes in overall mass loss were observed for both theanodes (before and after MFC treatment). Water adhered to theanode surfaces is likely to have contributed to mass losses from25 to 100 �C and so only losses between 100 �C and 900 �C wereconsidered significant. The anode before MFC treatment showeda 15.39% total weight loss from 100 �C to 600 �C. On 14th day,
0
20
40
60
80
100
120
0
0.2
0.4
0.6
0.8
1
1.2
1.4
0 50 100 150 200 250 300
V (V
)
I (mA/m2)
Anaerobic sludge Controlled inoculum
Anaerobic sludge Controlled inoculum
P (m
W/m
2 )
Fig. 4. Polarization and power density curves of PACF with AS and CI.
0 500 1000 1500 2000 2500 3000 3500 4000 4500
36
38
40
42
44
46
48
50
52
54
PACF with Controlled inoculum
PACF with Anaerobic sludge
PACF Control
%Tr
ansm
ittan
ce
Wavelength (cm-1)
Fig. 5. IR spectra of PACF anodes before and after MFC treatment with CI and AS.
0 200 400 600 800 10000
20
40
60
80
100
Wei
ght (
%)
Temperature0C
PACF before operation PACF after operation with Controlled inoculum PACF after operation with Anaerobic sludge
Fig. 6. TGA spectrum of PACF anodes before and after MFC treatment using AS andCI.
20 30 40 50 60 70 80 90
0
5
10
15
20
25
30
35
40R1 - Ohmic resistanceRCT - Charge transfer resistanceC - CapacitanceG - Gerischer impedance
RCT
C
R1
G
RCTRCT
-Z" (
ohm
)
Z' (ohm)
Anaerobic sludge Controlled inoculum
Fig. 7. EIS data of MFC with CI and AS after 14 days of operation.
78 E. Baranitharan et al. / Fuel 143 (2015) 72–79
anode after MFC treatment with AS showed an increase to 66.67%mass loss, whereas a significant increase to 72.22% loss wasobserved for the 14th day of anode after MFC treatment with CI.A 9% change in mass loss was observed between 100 �C and200 �C in the TGA weight loss profile in anode on 14th day ofMFC operation with AS but showed 12% loss with CI. Bacterialorganic matter is likely to decompose and burn in this temperaturerange, and thus this difference is attributed to a bacterial biofilm[48]. Two distinct mass loss events were observed during 14thday anode heating. With CI, 47.72% from 200 to 380 �C and 25.3%from 400 to 580 �C were observed whereas with AS, 43.5% from200 to 380 �C and 22.3% from 400 to 580 �C were observed. Thedistinct changes in TGA profiles can be attributed to the increasedamount of biofilm on the electrode surface and support the successof biofilm formation on electrode surface.
3.8. Electrochemical impedance spectroscopy
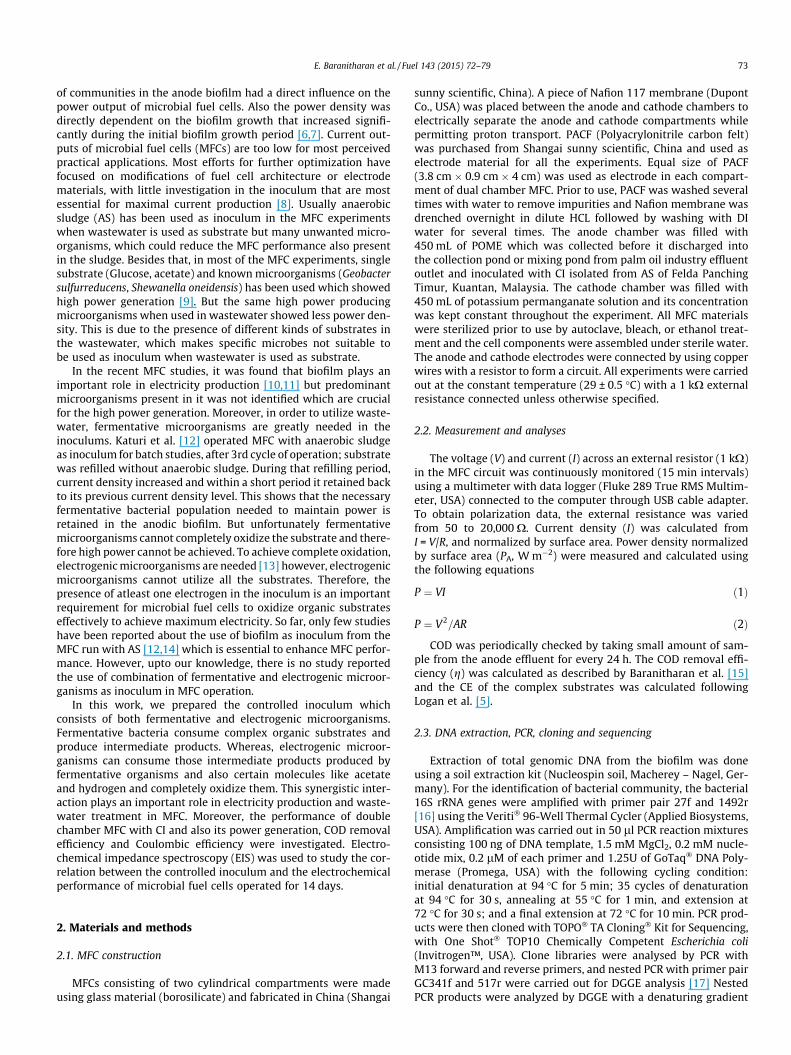
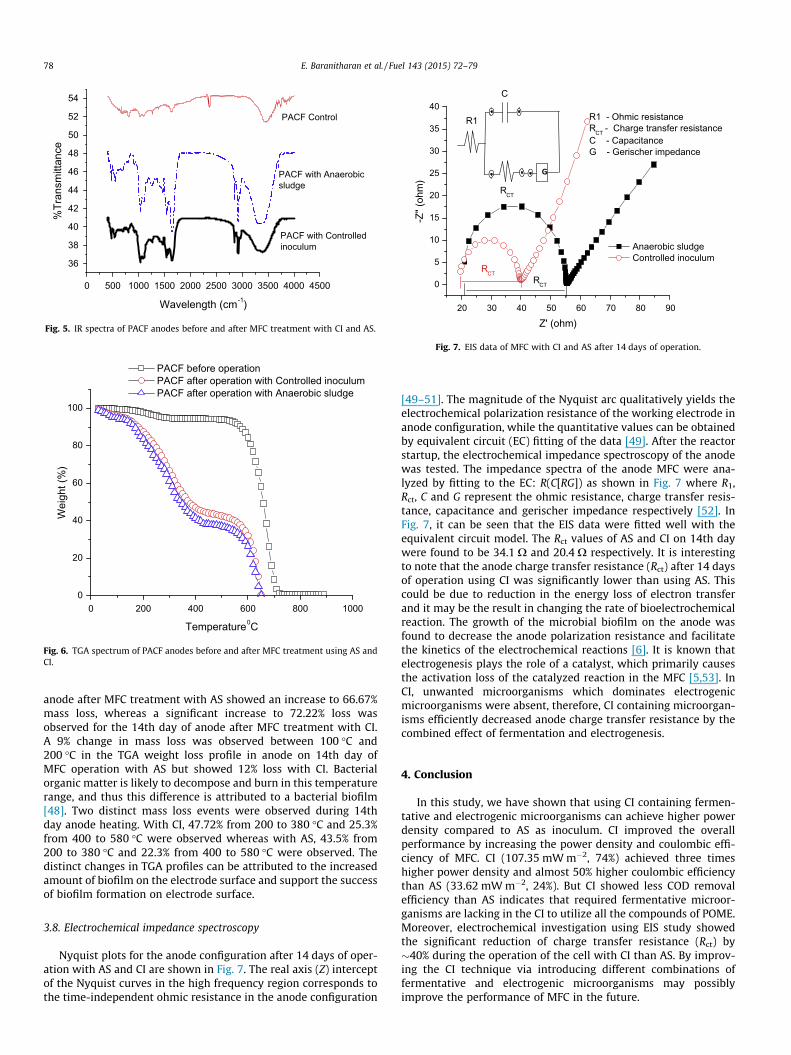
Nyquist plots for the anode configuration after 14 days of oper-ation with AS and CI are shown in Fig. 7. The real axis (Z) interceptof the Nyquist curves in the high frequency region corresponds tothe time-independent ohmic resistance in the anode configuration
[49–51]. The magnitude of the Nyquist arc qualitatively yields theelectrochemical polarization resistance of the working electrode inanode configuration, while the quantitative values can be obtainedby equivalent circuit (EC) fitting of the data [49]. After the reactorstartup, the electrochemical impedance spectroscopy of the anodewas tested. The impedance spectra of the anode MFC were ana-lyzed by fitting to the EC: R(C[RG]) as shown in Fig. 7 where R1,Rct, C and G represent the ohmic resistance, charge transfer resis-tance, capacitance and gerischer impedance respectively [52]. InFig. 7, it can be seen that the EIS data were fitted well with theequivalent circuit model. The Rct values of AS and CI on 14th daywere found to be 34.1 X and 20.4 X respectively. It is interestingto note that the anode charge transfer resistance (Rct) after 14 daysof operation using CI was significantly lower than using AS. Thiscould be due to reduction in the energy loss of electron transferand it may be the result in changing the rate of bioelectrochemicalreaction. The growth of the microbial biofilm on the anode wasfound to decrease the anode polarization resistance and facilitatethe kinetics of the electrochemical reactions [6]. It is known thatelectrogenesis plays the role of a catalyst, which primarily causesthe activation loss of the catalyzed reaction in the MFC [5,53]. InCI, unwanted microorganisms which dominates electrogenicmicroorganisms were absent, therefore, CI containing microorgan-isms efficiently decreased anode charge transfer resistance by thecombined effect of fermentation and electrogenesis.
4. Conclusion
In this study, we have shown that using CI containing fermen-tative and electrogenic microorganisms can achieve higher powerdensity compared to AS as inoculum. CI improved the overallperformance by increasing the power density and coulombic effi-ciency of MFC. CI (107.35 mW m�2, 74%) achieved three timeshigher power density and almost 50% higher coulombic efficiencythan AS (33.62 mW m�2, 24%). But CI showed less COD removalefficiency than AS indicates that required fermentative microor-ganisms are lacking in the CI to utilize all the compounds of POME.Moreover, electrochemical investigation using EIS study showedthe significant reduction of charge transfer resistance (Rct) by�40% during the operation of the cell with CI than AS. By improv-ing the CI technique via introducing different combinations offermentative and electrogenic microorganisms may possiblyimprove the performance of MFC in the future.

E. Baranitharan et al. / Fuel 143 (2015) 72–79 79
Acknowledgements
Authors would like to thank the Ministry of Higher Education,Malaysia and Universiti Malaysia Pahang, Malaysia for funding(RDU120611 and RDU110341) this project. We are thankful toProf. Dr. Jose Rajan and Baiju Vidyadaran, Faculty of Science andTechnology, Universiti Malaysia Pahang for providing the facilitiesto conduct EIS experiments and valuable consultations.
References
[1] HaoYu E, Cheng S, Scott K, Logan B. Microbial fuel cell performance with non-Ptcathode catalysts. J Power Sources 2007;171:275–81.
[2] Lovley DR. Microbial fuel cells: novel microbial physiologies and engineeringapproaches. Curr Opin Biotechnol 2006;17:327–32.
[3] Salgado CA. Microbial fuel cells powered by Geobacter sulfurreducens. MMG445 Basic Biotechnol eJ 2009;5:96–101.
[4] Schwartz K. Microbial fuel cells: design elements and application of a novelrenewable energy source. MMG 445 Basic Biotechnol eJ 2007;3:20–7.
[5] Logan BE, Hamelers B, Rozendal R, Schröder U, Keller J, Freguia S, et al.Microbial fuel cells: methodology and technology. Environ Sci Technol2006;40:5181–92.
[6] Ramasamy RP, Ren Z, Mench MM, Regan JM. Impact of initial biofilm growthon the anode impedance of microbial fuel cells. Biotechnol Bioeng2008;101:101–8.
[7] Baranitharan E, Khan MR, Prasad D, Teo WFA, Tan GYA, Jose R. Effect of biofilmformation on the performance of microbial fuel cell for the treatment of palmoil mill effluent. Bioprocess Biosyst Eng 2014:1–10.
[8] Malvankar NS, Lovley DR. Microbial nanowires: a new paradigm for biologicalelectron transfer and bioelectronics. ChemSusChem 2012;5:1039–46.
[9] Reguera G, Nevin KP, Nicoll JS, Covalla SF, Woodard TL, Lovley DR. Biofilm andnanowire production leads to increased current in Geobacter sulfurreducensfuel cells. Appl Environ Microbiol 2006;72:7345–8.
[10] Kim B, Park H, Kim H, Kim G, Chang I, Lee J, et al. Enrichment of microbialcommunity generating electricity using a fuel-cell-type electrochemical cell.Appl Microbiol Biotechnol 2004;63:672–81.
[11] Ren Z, Steinberg L, Regan J. Electricity production and microbial biofilmcharacterization in cellulose-fed microbial fuel cells. Water Sci Technol2008:58.
[12] Katuri KP, Scott K, Head IM, Picioreanu C, Curtis TP. Microbial fuel cells meetwith external resistance. Bioresour Technol 2011;102:2758–66.
[13] Lovley DR. The microbe electric: conversion of organic matter to electricity.Curr Opin Biotechnol 2008;19:564–71.
[14] Kim JR, Min B, Logan BE. Evaluation of procedures to acclimate a microbial fuelcell for electricity production. Appl Microbiol Biotechnol 2005;68:23–30.
[15] Baranitharan E, Khan MR, Prasad D, Salihon JB. Bioelectricity generation frompalm oil mill effluent in microbial fuel cell using polacrylonitrile carbon felt aselectrode. Water Air Soil Pollut 2013;224:1–11.
[16] Lane D. 16S/23S rRNA sequencing. Nucl Acid Tech Bacterial Syst 1991:125–75.[17] Gonzalez J, Ortiz-Martinez A, Gonzalez-delValle M, Laiz L, Sáiz-Jiménez C. An
efficient strategy for screening large cloned libraries of amplified 16S rDNAsequences from complex environmental communities. J Microbiol Methods2003;55:459–63.
[18] Schabereiter-Gurtner C, Piñar G, Lubitz W, Rölleke S. An advanced molecularstrategy to identify bacterial communities on art objects. J Microbiol Methods2001;45:77–87.
[19] Kim OS, Cho YJ, Lee K, Yoon SH, Kim M, Na H, et al. Introducing EzTaxon-e: aprokaryotic 16S rRNA gene sequence database with phylotypes that representuncultured species. Int J Syst Evol Microbiol 2012;62:716–21.
[20] Tamura K, Peterson D, Peterson N, Stecher G, Nei M, Kumar S. MEGA5:molecular evolutionary genetics analysis using maximum likelihood,evolutionary distance, and maximum parsimony methods. Mol Biol Evol2011;28:2731–9.
[21] Saitou N, Nei M. The neighbor-joining method: a new method forreconstructing phylogenetic trees. Mol Biol Evol 1987;4:406–25.
[22] Kimura M. A simple method for estimating evolutionary rates of basesubstitutions through comparative studies of nucleotide sequences. J MolEvol 1980;16:111–20.
[23] Zuo Y, Xing D, Regan JM, Logan BE. Isolation of the exoelectrogenic bacteriumOchrobactrum anthropi YZ-1 by using a U-tube microbial fuel cell. Appl EnvironMicrobiol 2008;74:3130–7.
[24] Rice EW, Bridgewater L, Association APH. Standard methods for theexamination of water and wastewater. Washington, DC: American PublicHealth Association; 2012.
[25] He Z, Mansfeld F. Exploring the use of electrochemical impedancespectroscopy (EIS) in microbial fuel cell studies. Energy Environ Sci2009;2:215–9.
[26] Muyzer G, De Waal EC, Uitterlinden AG. Profiling of complex microbialpopulations by denaturing gradient gel electrophoresis analysis of polymerasechain reaction-amplified genes coding for 16S rRNA. Appl Environ Microbiol1993;59:695–700.
[27] Wright ES, Yilmaz LS, Noguera DR. DECIPHER, a search-based approach tochimera identification for 16S rRNA sequences. Appl Environ Microbiol2012;78:717–25.
[28] Gevers D, Cohan FM, Lawrence JG, Spratt BG, Coenye T, Feil EJ, et al. Re-evaluating prokaryotic species. Nat Rev Microbiol 2005;3:733–9.
[29] Pham TH, Boon N, De Maeyer K, Höfte M, Rabaey K, Verstraete W. Use ofPseudomonas species producing phenazine-based metabolites in the anodesof microbial fuel cells to improve electricity generation. Appl MicrobiolBiotechnol 2008;80:985–93.
[30] Rabaey K, Rodriguez J, Blackall LL, Keller J, Gross P, Batstone D, et al. Microbialecology meets electrochemistry: electricity-driven and driving communities.ISME J 2007;1:9–18.
[31] Mukherjee S, Su S, Panmanee W, Irvin RT, Hassett DJ, Choi S. A microliter-scalemicrobial fuel cell array for bacterial electrogenic screening. Sens Actuat A2013;201:532–7.
[32] Rabaey K, Boon N, Siciliano SD, Verhaege M, Verstraete W. Biofuel cells selectfor microbial consortia that self-mediate electron transfer. Appl EnvironMicrobiol 2004;70:5373–82.
[33] Rabaey K, Boon N, Höfte M, Verstraete W. Microbial phenazine productionenhances electron transfer in biofuel cells. Environ Sci Technol2005;39:3401–8.
[34] Mavrodi DV, Bonsall RF, Delaney SM, Soule MJ, Phillips G, Thomashow LS.Functional analysis of genes for biosynthesis of pyocyanin and phenazine-1-carboxamide from Pseudomonas aeruginosa PAO1. J Bacteriol2001;183:6454–65.
[35] Borole AP, Mielenz JR, Vishnivetskaya TA, Hamilton CY. Controllingaccumulation of fermentation inhibitors in biorefinery recycle water usingmicrobial fuel cells. Biotechnol Biofuels 2009;2:1–14.
[36] Hunter WJ. An Azospira oryzae (syn Dechlorosoma suillum) strain that reducesselenate and selenite to elemental red selenium. Curr Microbiol2007;54:376–81.
[37] Michaelidou U, ter Heijne A, Euverink GJW, Hamelers HV, Stams AJ, GeelhoedJS. Microbial communities and electrochemical performance of titanium-based anodic electrodes in a microbial fuel cell. Appl Environ Microbiol2011;77:1069–75.
[38] Kim G, Webster G, Wimpenny J, Kim B, Kim H, Weightman A. Bacterialcommunity structure, compartmentalization and activity in a microbial fuelcell. J Appl Microbiol 2006;101:698–710.
[39] Holmes D, Bond D, O’neil R, Reimers C, Tender L, Lovley D. Microbialcommunities associated with electrodes harvesting electricity from a varietyof aquatic sediments. Microb Ecol 2004;48:178–90.
[40] Friedrich MM, Lipski A. Alkanibacter difficilis gen. nov., sp. nov. andSingularimonas variicoloris gen. nov., sp. nov., hexane-degrading bacteriaisolated from a hexane-treated biofilter. Int J Syst Evol Microbiol2008;58:2324–9.
[41] Sheu S-Y, Cho N-T, Arun A, Chen W-M. Proposal of Solimonas aquatica sp.nov., reclassification of Sinobacter flavus Zhou et al. 2008 as Solimonasflava comb. nov. and Singularimonas variicoloris Friedrich and Lipski 2008as Solimonas variicoloris comb. nov. and emended descriptions of thegenus Solimonas and its type species Solimonas soli. Int J Syst EvolMicrobiol 2011;61:2284–91.
[42] Jahim J, Wan Ramli W, Ismail M, Anuar N, Shari SN. Optimization of electricitygeneration and palm oil mill effluent (POME) treatment from microbial fuelcell. J Appl Sci 2010;10:3355–60.
[43] Jong B, Liew P, Juri ML, Kim B, Leo K, Awang M. Performance and microbialdiversity of palm oil mill effluent microbial fuel cell. Lett Appl Microbiol2011;53:660–7.
[44] Huang L, Logan BE. Electricity generation and treatment of paper recyclingwastewater using a microbial fuel cell. Appl Microbiol Biotechnol2008;80:349–55.
[45] Karnnet S, Potiyaraj P, Pimpan V. Preparation and properties of biodegradablestearic acid-modified gelatin films. Polym Degrad Stab 2005;90:106–10.
[46] Nanda PK, Krishna Rao K, Nayak PL. Biodegradable polymers. XI. Spectral,thermal, morphological, and biodegradability properties of environment-friendly green plastics of soy protein modified with thiosemicarbazide. JAppl Polym Sci 2007;103:3134–42.
[47] Krimm S, Bandekar J. Vibrational spectroscopy and conformation of peptides,polypeptides, and proteins. Adv Protein Chem 1986;38:181–364.
[48] Kramer J, Soukiazian S, Mahoney S, Hicks-Garner J. Microbial fuel cell biofilmcharacterization with thermogravimetric analysis on bare andpolyethyleneimine surface modified carbon foam anodes. J Power Sources2012;210:122–8.
[49] Barsoukov E, Macdonald JR. Impedance spectroscopy: theory, experiment, andapplications. New York: John Wiley & Sons; 2005.
[50] Orazem ME, Tribollet B. Electrochemical impedance spectroscopy. John Wiley& Sons; 2011.
[51] Scully JR, Silverman DC, Kendig MW. Electrochemical impedance: analysis andinterpretation. Philadelphia: ASTM International; 1993.
[52] He Z, Wagner N, Minteer SD, Angenent LT. An upflow microbial fuel cell withan interior cathode: assessment of the internal resistance by impedancespectroscopy. Environ Sci Technol 2006;40:5212–7.
[53] Clauwaert P, Aelterman P, De Schamphelaire L, Carballa M, Rabaey K,Verstraete W. Minimizing losses in bio-electrochemical systems: the road toapplications. Appl Microbiol Biotechnol 2008;79:901–13.