using py-gc/ms to fingerprint additives associated with paper mill effluent toxicity episodes
TRANSCRIPT

This article appeared in a journal published by Elsevier. The attachedcopy is furnished to the author for internal non-commercial researchand education use, including for instruction at the authors institution
and sharing with colleagues.
Other uses, including reproduction and distribution, or selling orlicensing copies, or posting to personal, institutional or third party
websites are prohibited.
In most cases authors are permitted to post their version of thearticle (e.g. in Word or Tex form) to their personal website orinstitutional repository. Authors requiring further information
regarding Elsevier’s archiving and manuscript policies areencouraged to visit:
http://www.elsevier.com/authorsrights

Author's personal copy
Journal of Analytical and Applied Pyrolysis 103 (2013) 8–16
Contents lists available at ScienceDirect
Journal of Analytical and Applied Pyrolysis
journa l h om epage: ww w.elsev ier .com/ locate / jaap
Using Py-GC/MS to detect and measure silicone defoamers in pulp fibres and milldeposits
Bruce Sitholea,∗, Chu Watanabeb
a Forestry and Forest Products Research Centre, University of KwaZulu-Natal/CSIR Natural Resources and the Environment, Durban, South Africab Frontier Laboratories, Fukushima, Japan
a r t i c l e i n f o
Article history:Received 25 June 2012Accepted 31 August 2012Available online 20 September 2012
Keywords:DefoamersSiliconePy-GC/MSAnalysisPulpDeposits
a b s t r a c t
Defoamers are often used to control or reduce foam problems in a variety of pulp and papermakingprocesses. It has been recognised that non-judicious use of defoamers can lead to undesirable deposi-tion problems. Amide-based defoamers have been largely supplanted by waterbased or water-extendeddefoamers that are supposed to be non-depositing. However, mill experience and research has shownotherwise. Hence, there is a need for analytical procedures to determine silicone defoamer components indeposits. In this work, for the first time, Py-GC/MS has been used to analyse for silicone defoamers in pulpand paper matrices. This work demonstrates that the technique is ideal for analysis and characterisationof silicone defoamers on pulp fibres and in mill deposits. The technique is easier and much more rapidthan using solvent extraction and solid phase extraction, previously developed for analysis of siliconeoil defoamers in deposits. It is applicable to silicone defoamers irrespective of molecular weight and canbe used to ascertain the source of a particular defoamer formulation. Application of the technique to awashed kraft pulp, previously treated with silicone defoamers, shows that silicone defoamer oil carryoveron pulp fibres can be substantial, depending on the defoamer formulation used. In pitch deposits, thelevel of silicone oil can be over 25% (w/w). In addition, analysis of deposits from mills using the defoamersshows that silicone defoamers have the potential to cause pitch deposition contrary to claims that thedefoamers do not cause such problems. Thus, the method can be used to assess the impact of defoamercarryover on pulp properties and the contribution of silicone defoamers to pitch deposition.
© 2012 Elsevier B.V. All rights reserved.
1. Introduction
Silicone defoamers are now widely used in pulp and papermills primarily for control or elimination of foam problems [1,2].The silicone-based defoamers typically use in their formulationhydrophobic silica in place of ethylene bis-stearamide, which isone of the active ingredients in amide-based defoamers. In addi-tion to providing excellent foam control, they are reported to havesuperior pulp drainage.
Similar to mineral oil-based defoamers, silicone defoamersare combined or formulated with other materials to producecost-effective products. To develop efficient silicone foam controlagents, specialty chemical formulators must consider a number offactors, including: the nature of the foaming media; process con-ditions in the application; the form of the defoamer; and perhapsmost important, the characteristics of the base silicone antifoamcompound technology.
The defoamer can be either an aqueous silicone emulsion ora non-aqueous silicone concentrate. The form of the product will
∗ Corresponding author.E-mail address: [email protected] (B. Sithole).
dictate which silicone technologies are likely to be the most effec-tive for the application and also what other additives or materialswill be required in the final product formulation.
Silicone concentrates are used globally, but aqueous siliconeemulsions are the predominant choice of pulp mills for their foamcontrol needs. The key active ingredient used in the productionof aqueous silicone emulsions is typically a 100% active siliconeantifoam compound. Silicone oil, that is, polydimethylsiloxane(PDMS), and silica particles are the two major ingredients of sili-cone defoamers. Silicone antifoam can be in the form of compound(100% active content), emulsion (variable active content) or powderformulations. In the simplest form, a silicone antifoam compoundcan be thought of as silica-filled silicone [1].
Formulated silicone defoamers combine the selected siliconeantifoam compound with a number of other raw materials. Theseinclude water, surface-active agents, hydrophobic particulates andanti-microbial agents. In addition, various organic moieties can beincorporated into the PDMS backbone to make organo-modifiedsiloxanes that are compatible with, or soluble in, aqueous and/ororganic systems [2]. A schematic of the PDMS structure is shown inFig. 1.
There are issues and problems associated with the use of siliconedefoamers in the pulp and paper industry. They include: silicone
0165-2370/$ – see front matter © 2012 Elsevier B.V. All rights reserved.http://dx.doi.org/10.1016/j.jaap.2012.08.013

Author's personal copy
B. Sithole, C. Watanabe / Journal of Analytical and Applied Pyrolysis 103 (2013) 8–16 9
CH3 Si
CH3
CH3
O Si
CH3
CH3
OSi
CH3
O Si
CH3
CH3
CH3
Rnm
Fig. 1. Structure of organo-modified PDMS (R = organic moiety).
carryover on pulp fibres, contribution to deposition problems, andenvironmental/health concerns related to bioaccumulation andoestrogen activity of siloxanes, especially the cyclic ones.
1.1. Silicone carryover
When mills conduct trials with silicone defoamers, the evalua-tion criteria are usually limited to cost and efficacy of the defoamer.However, according to a technical data sheet from a defoamer sup-plier “PDMS has a very high ability to adsorb on sludge and thereforemost of the injected PDMS (in an effluent treatment system) is attachedto the sludge. Later, sludge is disposed to land and abiotic degradationof the PDMS occurs. Any remaining small amount of PDMS (analyticaldetection limit) tends to bind to solid particles suspended in the processwater phase” [3]. From this it can be surmised that these defoamerscould also adsorb strongly onto pulp and paper matrices and couldhave an impact on pulp properties such as their bonding ability andwettability. Before the potential impact can be assessed, the extentof defoamer carryover with pulp fibres must first be determined.
1.2. Defoamer deposition
According to a paper by Habermehl [1], the key benefits notedsince the introduction of silicone defoamers in pulp and papermaking processes include reductions in addition rates relative tomineral oil-based defoamers; reductions in pitch deposits asso-ciated with defoamer usage; dramatic reductions or completeelimination of chemical pitch control additives; and lower costin use. However, silicone defoamer deposition issues have beenreported [4] and observed [5], possibly due to overdosing.
1.2.1. Environmental/health concernsSiloxanes have been detected in environmental matrices, espe-
cially in sewage sludge. In studies conducted by the Nordiccountries, D5 was the dominant siloxane in all environmen-tal matrices sampled except for air, where D4 dominated [6];D = (CH3)2SiO2. A cross comparison of the Environment Canada andUS EPA lists of persistent, bioaccumulative and toxic compoundslists siloxanes as contributing 8% to the list of 610 compounds [7].Dimethyl cyclic siloxanes with 4–6 siloxane groups appear to beparticularly bioaccumulative and recent laboratory measurementsconfirm this [8].
As the first step in addressing these two issues, reliable tech-niques must be available for determining silicone defoamers inpulp fibres and in pitch deposits. In this report, we examine therelative merits of various analytical techniques for analysing sili-cone defoamers, and we show that pyrolysis-GC/MS (Py-GC/MS) isparticularly well-suited for these analyses.
Several methods have been used to analyse for silicones in var-ious matrices. They are summarised in the following paragraphs.
1.3. Solvent extraction and atomic absorption (AA) spectroscopy
Gooch [9] ascertained that residual silicones in fruit juices can beseparated from the naturally occurring siliceous materials in fruitproducts and selectively recovered by solvent extraction, after suit-able pre-treatment. The recovered silicone was measured by atomic
absorption spectroscopy. Silicone concentrations as low as about1 ppm can be measured.
However, when the method was applied to tissue samplestreated with silicone defoamers, it was found that the solventextraction process was only 70–90% efficient [10]. Therefore, thismethodology will not be suitable for assessing carryover of siliconedefoamers with pulps.
1.4. Sample digestion and gas chromatography (GC)
With sample digestion and GC, the silicone defoamer is hydrol-ysed in strong acid to its monomer units that are derivatised withtrimethylsilyl groups, extracted into
hexamethyldisiloxane and subsequently analysed by GC [11].The turnaround time for this method is prohibitively high – approx-imately one week, with 18 h required to prepare each sample [11].Unlike solvent extraction, the digestion process is virtually 100%efficient, and GC has the added benefit of being able to differentiatethe functionality of the silicone. Thus any different groups presentin the PDMS backbone can be determined. Unfortunately, informa-tion about the original starting compound is lost since the sampleis digested into its monomer units.
1.5. Solvent extraction and solid phase extraction (SPE)
Sithole and Filion [5] described the determination of siliconedefoamers in pitch deposits by SPE. The methods used entailed sol-vent extraction followed by separation by solid-phase extractionand identification of the separated components by FTIR. They areapplicable to low molecular weight defoamers (up to 10,000 Da)and enable complete characterisation of deposits from mills thatuse such defoamers. The methods, however, are not applicable topulp fibres as they are not sensitive enough and fail when appliedto deposits that contain high molecular weight silicone oils.
1.6. Pyrolysis-gas chromatography (Py-GC)
Silicone vapours can be a problem in the electronics indus-try as they can affect electrical contacts. Aramata and Saitoh [12]developed a method for detecting silicone in the atmosphere thatentailed adsorption of silicone vapours onto charcoal, desorptionof the silicones with solvent, concentration by solvent evaporation,and analysis of the desorbed silicones by Py-GC. Atomic emissiondetection (AED) coupled to the Py-GC improved analytical precisionand sensitivity by eliminating interferences from non-silicone com-pounds collected on the adsorption media. The AED monitors theSi atom in the silicones. The AED pyrograms showed several peakscorresponding to D3, D4, D5, D6 and D7, where D = (CH3)2SiO2.
From the preceding information, it appears that Py-GC/MSshould be a viable technique for the analysis and characterisation ofsilicone defoamers in fibres and deposits. We therefore proceededto evaluate this technique on pulp and deposit samples.
2. Methods
2.1. Samples
Silicone defoamer samples were obtained from various suppliercompanies: they were obtained in formulations that are used inpulp and paper mills. The defoamers were homogenised well toassure sample homogeneity before analysis.
Pitch deposit samples were obtained from mills that used sili-cone defoamers in their processes. Typically the deposits occurredon wash process unit operations. The samples were freeze-driedand portions analysed by sequential solvent extraction with ace-tone and chloroform to yield three different fractions, namely,

Author's personal copy
10 B. Sithole, C. Watanabe / Journal of Analytical and Applied Pyrolysis 103 (2013) 8–16
acetone extracts, chloroform extracts and insoluble fractions. Theextractions were conducted using a Soxtec extraction apparatus.The various fractions were dried to constant weight before weigh-ing. Each fraction was then analysed for silicone oil content.
The samples were analysed by Py-GC/MS and the analytical con-ditions were as follows:Pyrolyser:
PY-2020 (Frontier Laboratories, Japan) attached to a capillary col-umnOven temperature: 300 ◦CPyrolysis temperature: 650 ◦C for 20 s10–30 �g samples were loaded into stainless steel sample cups0.5 �L of tetramethyl ammonium hydroxide (25% in methanol;Sigma–Aldrich) methylating agent were added onto the samplesto enable in situ methylation of the components
GC:
Varian 3900Injection temperature: 300 ◦CInjection method: 1:25 splitColumn: DB5-HT: 30 m × 0.25 mm i.d. × 0.10 �m film thickness
Flow rate: 1.6 mL/minTemperature programming: 50 ◦C for 2 min, 8 ◦C/min to 310 ◦C,hold for 0.5 min
MS:
Varian Saturn 2100 T ion trapInterface temperature: 300 ◦CIon trap temperature: 250 ◦CElectron ionisationScan range: m/z 50–650
Since siloxanes are ubiquitous, special care is required to avoidthe risk of contamination of samples during sample collection, stor-age and analysis. Analyses of blank samples were run frequently toassure that there were no contaminations from the environmentand from column bleed.
2.2. Silicone defoamer carryover
Silicone carryover on pulp fibres was determined by measur-ing the binding abilities of defoamers to a brownstock kraft pulp.
High MW fragments
1
32
45
6
1
3
24
5
6
1
32 45
6
132 4
56
Hydr ocarbon oil
Low MW fragments
Re
sp
on
se
, M
co
un
ts
Retention time, minutes
Res
po
ns
e,
Mc
ou
nts
Re
sp
on
se
, M
co
un
tsR
es
po
ns
e, M
co
un
ts
1
32
45
6
1
3
24
5
6
1
32 45
6
132 4
56
Hydr ocarbon oil
A
B
C
D
Re
sp
on
se
, M
co
un
ts
5 10 15 20 25 30 35
0.00
0.25
0.50
0.75
1.00
0
100
200
300
400
0.0
0.5
1.0
1.5
2.0
0
5
10
15
Res
po
ns
e,
Mc
ou
nts
Re
sp
on
se
, M
co
un
tsR
es
po
ns
e, M
co
un
ts
Fig. 2. (A) Pyrograms of different silicone defoamer formulations. Labels A, B, C, and D refer to different defoamer formulations that were analysed. Peaks labelled 1–6 areused for fingerprinting of the various silicone defoamer formulations. (B) Mass spectra and identities of the major pyrolysis products in defoamer formulations shown in A.Numbers 1–6 refer to peaks that are common in all the samples analysed.

Author's personal copy
B. Sithole, C. Watanabe / Journal of Analytical and Applied Pyrolysis 103 (2013) 8–16 11
Cyc lopentasilo xan e, de camethyl-
Cyclooctasiloxane, hexadecamethyl-
#1
Cyclotrisilo xan e, hexamethyl-40 70 100 130 16 0 190 220
0
50
100
7596 133
177191
207
SiO
O
Si
Si
O
m/v
Abundance
, %
#3
40 100 160 22 0 280 3400
50
100
45
73
154 193
267
355
SiO
O
Si
Si
O
O
Si
SiO
m/v
Abundance
, %
Cyclotetrasiloxan e, octamethyl-
#2
40 90 140 19 0 240 29 00
50
100
73
103133 193 265
281
SiO O
Si Si
O OSi
m/v
Abundance, %
#4
Cyclohexasiloxan e, dodecamethyl-40 120 200 280 36 0 440
0
50
100
45
73
147
207 271
341
429
SiO
O
Si
Si
O
O
Si
Si
O
OSi
m/v
Abundance, %
#5
Cycloheptasiloxan e, tetradecamethyl-40 130 220 31 0 400 490
0
50
10073
147
221
281
327 415 503
OSi
OSiO
Si
SiO
Si
OSiO
Si
O
m/v
Abundance, %
#6
40 150 260 37 0 48 0 5900
50
10073
147 221281
327
355
401
489577
SiO Si
OSiO
Si O
SiO
SiO
SiO
Si O
m/v
Abundance, %
Cyc lopentasilo xan e, de camethyl-Cyc lopentasilo xan e, de camethyl-
Cyclooctasiloxane, hexadecamethyl-
#1
Cyclotrisilo xan e, hexamethyl-40 70 100 130 16 0 190 220
0
50
100
7596 133
177191
207
SiO
O
Si
Si
O
m/v
Abundance
, %
#1
Cyclotrisilo xan e, hexamethyl-40 70 100 130 16 0 190 220
0
50
100
7596 133
177191
207
SiO
O
Si
Si
O
m/v
Abundance
, %
#3
40 100 160 22 0 280 3400
50
100
45
73
154 193
267
355
SiO
O
Si
Si
O
O
Si
SiO
m/v
Abundance
, %
#3
40 100 160 22 0 280 3400
50
100
45
73
154 193
267
355
SiO
O
Si
Si
O
O
Si
SiO
m/v
Abundance
, %
Cyclotetrasiloxan e, octamethyl-
#2
40 90 140 19 0 240 29 00
50
100
73
103133 193 265
281
SiO O
Si Si
O OSi
m/v
Abundance, %
Cyclotetrasiloxan e, octamethyl-
#2
40 90 140 19 0 240 29 00
50
100
73
103133 193 265
281
SiO O
Si Si
O OSi
m/v
Abundance, %
#2
40 90 140 19 0 240 29 00
50
100
73
103133 193 265
281
SiO O
Si Si
O OSi
m/v
Abundance, %
#4
Cyclohexasiloxan e, dodecamethyl-40 120 200 280 36 0 440
0
50
100
45
73
147
207 271
341
429
SiO
O
Si
Si
O
O
Si
Si
O
OSi
m/v
Abundance, %
#4
Cyclohexasiloxan e, dodecamethyl-40 120 200 280 36 0 440
0
50
100
45
73
147
207 271
341
429
SiO
O
Si
Si
O
O
Si
Si
O
OSi
m/v
Abundance, %
#5
Cycloheptasiloxan e, tetradecamethyl-40 130 220 31 0 400 490
0
50
10073
147
221
281
327 415 503
OSi
OSiO
Si
SiO
Si
OSiO
Si
O
m/v
Abundance, %
#5
Cycloheptasiloxan e, tetradecamethyl-40 130 220 31 0 400 490
0
50
10073
147
221
281
327 415 503
OSi
OSiO
Si
SiO
Si
OSiO
Si
O
m/v
Abundance, %
#6
40 150 260 37 0 48 0 5900
50
10073
147 221281
327
355
401
489577
SiO Si
OSiO
Si O
SiO
SiO
SiO
Si O
m/v
Abundance, %
#6
40 150 260 37 0 48 0 5900
50
10073
147 221281
327
355
401
489577
SiO Si
OSiO
Si O
SiO
SiO
SiO
Si O
m/v
Abundance, %
Fig. 2. ( Continued )
Defoamers were obtained from 2 suppliers: Defoamer E (100%actives) and defoamer F (30% actives). The defoamers were mixedwith a kraft brownstock pulp at 0.5 kg/ton. The amount of siliconeoil carryover was determined by measuring the amount of siliconeon the fibres after washing and vacuum filtration of the pulp with3 volumes of water to simulate washing in an industrial process(procedure recommended by a defoamer supplier).
Initially, the silicone oil on the fibres was analysed directlyby Py-GC/MS of small portions of the fibre but although thePDMS could be detected, the results were not reproducible dueto sample non homogeneity. It was therefore decided to extractthe defoamer from pulps with a solvent and analyse for the sil-icone defoamers in the extracts [5,6]. Hence, the pulp sampleswere Soxtec extracted with chloroform to recover the siliconedefoamers. The extracts were dried under nitrogen, weighed andthen reconstituted to a desired volume with chloroform. Knownportions of the extracts (�L quantities) were analysed by Py-GC/MS. The reference defoamers were used as standards forquantification.
3. Results and discussions
The pyrograms in Fig. 2A show that Py-GC combined with massspectrometric detection can differentiate silicone defoamers from
different suppliers. The pyrograms reveal a homologous series ofpeaks corresponding to PDMS monomer units. In addition, the
pyrograms show that the defoamers contain mainly low molec-ular weight silicone defoamer groups (peaks eluting between 2 and15 min) with smaller amounts of high molecular weight siliconeoil fragments (peaks eluting at retention times >15 min). The massspectra and identities of the major pyrolysis products are shownin Fig. 2B: it is evident that the major components in the formu-lation are comprised of cyclic moieties. An interesting observationis that Defoamer D contains a significant amount of hydrocarbonoil relative to the silicone oil as evidenced by the large hump elu-ting between 15 and 30 min. This hump profile is well known fromprevious analyses of hydrocarbon oils and is confirmed by massspectral data on the eluted peaks [13,14]. Thus Py-GC/MS has thepotential of not only determining the presence of silicone defoamer,but also can provide information about the type of defoamer for-mulation used.
3.1. Silicone defoamer carryover
Pyrograms and mass spectral data of the samples are shown inFigs. 3 and 4: it is evident that the pyrograms of the pulp extractsmatch very well with those of the starting defoamer compounds.The pyrograms display similar profiles and retention times. Further

Author's personal copy
12 B. Sithole, C. Watanabe / Journal of Analytical and Applied Pyrolysis 103 (2013) 8–16
Fig. 3. Pyrograms of Defoamer E and extracts of pulp treated with Defoamer E. Quantification was done using peak # 4, corresponding to dodecamethyl cyclohexasiloxane.
confirmation of the presence of defoamer in the extracts is providedby mass spectral analysis of the peaks: as can be seen in the top partof Figs. 3 and 4, the mass spectra of peaks that are common in thepyrograms are identical.
The two major peaks in the pyrograms were used for quan-tification. The results (Table 1) show that pulp washing reducesdefoamer content in the fibres by about 43%. Pulp samples treatedwith Defoamer E contain 10-fold lower amounts of defoamer thanpulps treated with the Defoamer F. This is despite the fact thatDefoamer E had 100% actives versus 30% actives in Defoamer F. Thisimplies that one cannot predict which defoamer will result in lowersilicone carryover based on their actives content. Thus it is clearthat carryover of silicone defoamers with pulp will vary depend-ing on the defoamer used. In addition, residual amounts of siliconedefoamers on the fibres are quite appreciable and can potentiallyaffect fibre properties.
3.2. Analysis of deposits
Pitch deposit samples from mills that were using siliconedefoamers were analysed by SPE as previously described [5]. Theresults revealed that the SPE method failed since silicone defoamer
compounds were present in the methanol and chloroform fractions,and also in the non-extractable fraction of the deposit (confirmedby FTIR and Py-GC/MS). The deposits contained high molecularweight silicone oils some of which eluted in the chloroform frac-tion but significant amounts appeared to have remained on theSPE columns. For example, the total acetone extractives of onedeposit were 77.65% but the total amount of material recoveredfrom SPE separation was only 57.08%. Results from the analysis ofseveral other deposits showed similar trends indicating that theSPE methodology fails when applied to samples that contain highmolecular weight silicone defoamers. Consequently, the depositswere then analysed by Py-GC/MS as illustrated in the followingexamples.
3.3. Deposit 1
A deposit sample from a kraft mill was analysed in two ways:pyrolysis analysis of the whole deposit and pyrolysis analysis ofdeposit fractions obtained from sequential extraction with acetoneand chloroform and of the residue after extraction. Previous workwith low molecular weight defoamers has shown that sequen-tial extraction is quantitative for silicone defoamer components
Table 1Determining silicone defoamer oil carryover on kraft pulps.
Sample description Pulp treated withDefoamer E, washed
Pulp treated withDefoamer F, washed
Pulp treated withDefoamer E, unwashed
Pulp treated withDefoamer F, unwashed
Pulp sample weight (g) 1.785 2.046 1.576 2.046Chloroform extracts (mg) 3.0 8.0 3.7 13.2Silicone defoamer content of extracts (%) 14.92 64.77 17.71 68.68Silicone defoamer content of pulp (%) 0.024 0.253 0.042 0.443

Author's personal copy
B. Sithole, C. Watanabe / Journal of Analytical and Applied Pyrolysis 103 (2013) 8–16 13
Mass spectrum o f peak 5
Mass spectrum of peak 5
in Defoamer E
Defoa m er E
100 20 0 30 0 40 0 500 m/z
45
73
148
193 221 250
282
328
415
502
45
73
147
221 252
282
327
415
503
2.5 5.0 7. 5 10. 0 12. 5 minute s
Resp
on
se
Rete nti on time, minutes
5
5
Mass spectrum of peak 5
in pulp extracts
Solvent extracts of
pulp treated withDefoamer E
Mass spectrum of peak 5
in Defoamer E
Defoamer E
100 20 0 30 0 40 0 500 60 0 m/z
0%
25%
50%
75%
100%
45
73
148
193 221 250
282
328
415
502
0%
25%
50%
75%
100%
45
73
147
221 252
282
327
415
503
2.5 5.0 7. 5 10. 0 12. 5 minute s
0
50
100
150
200
250
300kCounts
0
100
200
300
400
500
600
700
kCounts
Resp
on
se
5
5
Ab
un
dan
ce
Ab
un
dan
ce
Ma
ss
sp
ec
traP
yro
gra
ms
Fig. 4. Pyrograms of Defoamer E and extracts of pulp treated with Defoamer E. Quantification was done using peak # 5, corresponding to tetradecamethyl cycloheptasiloxane.
[5]. The defoamer used at the mill (Defoamer F) was used as areference. The pyrograms indicate that the deposit contained sili-cone defoamer fragments that corresponded to those identified inFig. 2B. Quantitative data shown in Tables 2 and 3, using DefoamerF as the standard, indicate that the deposit contained about 26%(w/w) silicone oil defoamer. The data on direct analysis of thedeposit are encouraging considering that only small amounts of
Table 2Analysis of silicone oil in the whole deposit sample.
Amount of deposit analysed (�g) Silicone oil in the deposit (%)
10.5 32.27100.9 31.63133.2 25.79150.9 22.13153.5 25.9693.6 23.0888.6 20.3247.1 27.62Average 26.10Std. deviation 4.30
Table 3Analysis of silicone oil in a fractionated deposit sample.
Deposit fractions Silicone oil content,% Trial 1
Silicone oil content,% Trial 2
Acetone fraction 7.24 8.37Chloroform fraction 2.67 1.02Non-extractable 15.28 17.14Total 25.18 26.52Average 25.85
Retention time, minutes
Res
po
ns
e, M
co
un
tsR
es
pon
se
, M
co
un
tsR
es
po
ns
e, M
co
un
ts
5 10 15 20 25 30
Acetone fraction
Insolub le fraction
Chloro form fraction
5 10 15 20 25 30
0
1
2
3
4
0
1
2
3
4
5
6
0
10
20
30
40
50
60
70
Acetone fraction
Insolub le fraction
Chloro form fraction
Retention time, minutes
Res
po
ns
e, M
co
un
tsR
es
pon
se
, M
co
un
tsR
es
po
ns
e, M
co
un
ts
5 10 15 20 25 30
Acetone fraction
Insolub le fraction
Chloro form fraction
5 10 15 20 25 30
0
1
2
3
4
0
1
2
3
4
5
6
0
10
20
30
40
50
60
70
Acetone fraction
Insolub le fraction
Chloro form fraction
Fig. 5. Pyrograms illustrating the presence of silicone oil in a fractionated depositsample. The asterisks refer to peaks that may be used for quantification.
Author's personal copy
14 B. Sithole, C. Watanabe / Journal of Analytical and Applied Pyrolysis 103 (2013) 8–16
Mass spectrum of peak 4 in Defoamer A
Kraft mill brownstockdeposit
Defoamer A
Mass spectrum of peak in deposit
Hydrocarbon oil
100 200 300 400m/z
0%
25%
50%
75%
100%
45
73
103
147
193 224252 268 296
342
397
429
0%
25%
50%
75%
100%
55
73
132
180 207223 251 267
325
341
429
477
5 10 15 20 25
0
50
100
150
200
0
100
200
300
400
500
600
Retent ion time, minute s
100 200 300 400m/z
0%
25%
50%
75%
100%
45
73
103
147
193 224252 268 296
342
397
429
0%
25%
50%
75%
100%
55
73
132
180 207223 251 267
325
341
429
477
5 10 15 20 25
0
50
100
150
200
0
100
200
300
400
500
600
Retent ion time, minute s
Re
sp
on
se
Re
sp
on
se
Ab
un
da
nc
e,
%A
bu
nd
an
ce
, %
Ma
ss
sp
ectra
Pyro
gr a
ms
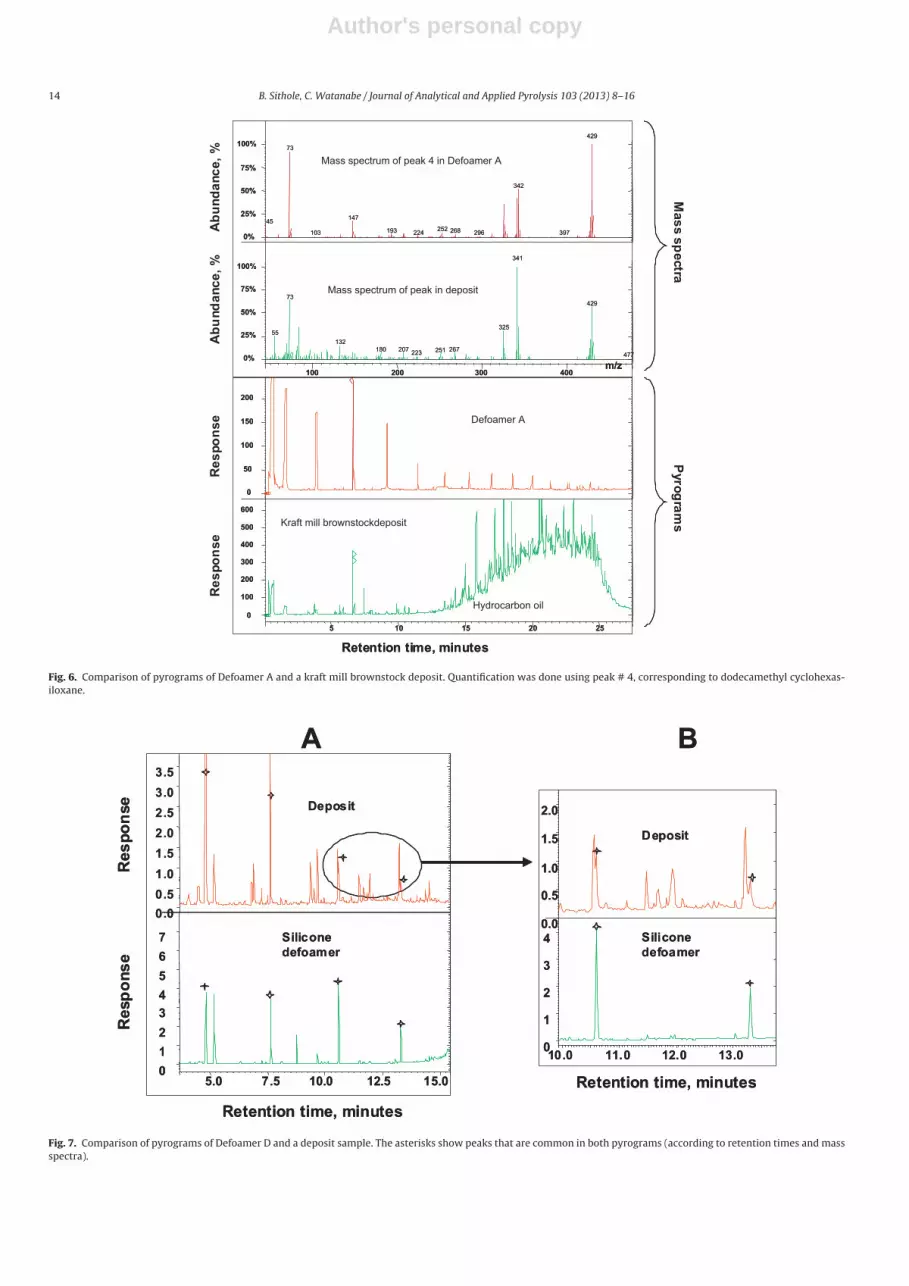
Fig. 6. Comparison of pyrograms of Defoamer A and a kraft mill brownstock deposit. Quantification was done using peak # 4, corresponding to dodecamethyl cyclohexas-iloxane.
Sil icone
def oamer
Deposit
Depo sit
Silicone
defoamer
10.0 11 .0 12 .0 13.0
0.0
0.5
1.0
1.5
2.0
0
1
2
3
4
5.0 7.5 10 .0 12.5 15. 0
0.0
0.5
1.0
1.5
2.0
2.5
3.0
3.5
0
1
2
3
4
5
6
7
Ret ention time, minute s
Re
sp
on
se
Res
po
nse
Ret ention time, minute s
A B
Sil icone
def oamer
Deposit
Depo sit
Silicone
defoamer
10.0 11 .0 12 .0 13.0
0.0
0.5
1.0
1.5
2.0
0
1
2
3
4
5.0 7.5 10 .0 12.5 15. 0
0.0
0.5
1.0
1.5
2.0
2.5
3.0
3.5
0
1
2
3
4
5
6
7
Ret ention time, minute s
Re
sp
on
se
Res
po
nse
Ret ention time, minute s
A B
Fig. 7. Comparison of pyrograms of Defoamer D and a deposit sample. The asterisks show peaks that are common in both pyrograms (according to retention times and massspectra).

Author's personal copy
B. Sithole, C. Watanabe / Journal of Analytical and Applied Pyrolysis 103 (2013) 8–16 15
Fig. 8. Mass spectral identification of silicone oil fragments in a pitch deposit sample.
material are added to the pyrolyser. Consequently, direct analysisof deposits is preferable as this saves time and effort.
The presence of silicone oil defoamer in the different fractionsof the deposit is illustrated in Fig. 5.
3.4. Deposit 2
The pyrogram of a kraft mill brownstock deposit sample (Fig. 6)shows that the deposit contains both silicone and hydrocarbon oils,but the silicone oil is present at lower concentration than the hydro-carbon oil. There is no evidence for the presence of high molecularweight silicone oils in the deposit. The average amount of siliconeoil in the deposit (based on Defoamer A used at the mill) was 7.4%which is somewhat higher than the 5.4% value obtained with theSPE method.
3.5. Deposit 3
A deposit from a newsprint mill was pyrolysed to examineits silicone fragments. As shown in Fig. 7A, similar silicone com-ponents (marked in asterisks) are present in the deposit and inDefoamer D used as a reference in the absence of the defoamerused at the mill. However, as can be seen in the circled area,the deposit sample contains silicone oil components that are notpresent in the defoamer. An expanded view of this section is shownin Fig. 7B. The mass spectra of the compounds (Fig. 8) show thatthe defoamer standard contains two silicone components (markedwith asterisks) that have a cyclic structure, namely, dodecamethylcyclohexasiloxane and tetramethyl cycloheptasiloxane, whereasthe deposit contains four silicone components, two that are cyclic(as in the defoamer) and two that are straight chains whosemass spectra closely matched with the mass spectra of hexas-iloxane, 1,1,3,3,5,5,7,7,9,9,11,11-dodecamethyl and heptasiloxane,1,1,3,3,5,5,7,7,9,9,11,11,13,13-tetradecamethyl. These results fur-ther confirm the need to use silicone defoamers used at the mill asstandards for quantification.
4. Conclusions
Py-GC/MS is a well-suited technique for analysis and characteri-sation of silicone defoamers on pulp fibres and in mill deposits. Thetechnique is easier and much more rapid than using solvent extrac-tion and solid phase extraction, previously developed for analysisof silicone oil defoamers in deposits. It is applicable to siliconedefoamers of all molecular weights and can be used to ascertainthe source of a particular defoamer formulation. Application of thetechnique to a kraft pulp treated with silicone defoamers showsthat silicone defoamer oil carryover on pulp fibres can be substan-tial, depending on the defoamer formulation used. In pitch deposits,the levels of silicone oil can be as high as 25% (w/w). In addition,analysis of deposits from mills using the defoamers shows thatsilicone defoamers have the potential to cause pitch depositioncontrary to claims that the defoamers do not cause such problems.
For quantitative analysis, a defoamer formulation used in theprocess should be used as standard for quantification of defoamercarryover or defoamer in deposits. In its absence, the results canonly be considered as qualitative.
The carry-over of silicone defoamers in pulp fibres may be acause for concern, especially in environments where there is poten-tial of inhaling pulp fibres in operations where such fibres areprocessed.
Acknowledgement
Many thanks to B. Ambayec, FPInnovations, for technical assis-tance.
References
[1] J. Habermehl, Silicone processing benefits pulp brownstock washing oper-ations, China Pulp Paper Technology, http://www.dowcorning.com/content/publishedlit/30-1147-01.pdf, 2005.
[2] G. Mudaly, Bubreak siloxane technology: the key to profitable pulp-ing, TAPPSA Journal, http://www.tappsa.co.za/archive/Journal papers/Bubreak siloxane/bubreak silo xane.html, 2002.

Author's personal copy
16 B. Sithole, C. Watanabe / Journal of Analytical and Applied Pyrolysis 103 (2013) 8–16
[3] Anonymous, Flofoam defoamers, Technical pamphlet, SNF Floeger SA,http://www.snf-group.com/IMG/pdf/Antifoam-FLOFOAM E.pdf, 2003.
[4] S.-D. Clas, L.H. Allen, Comparison of the performances of water and oil-baseddefoamers, Pulp and Paper Canada 95 (1) (1994) 33–36.
[5] B.B. Sithole, D. Filion, Determination of silicone defoamers in millpitch deposits, TAPPSA Journal, http://www.tappsa.co.za/archive2/APPW 2004/Title2004/Determination of silic one defo/determination ofsilicone defo.html, 2004.
[6] Norden, Siloxanes in the Nordic Environment, TemaNord 2005:593,Nordic Council of Ministers, Copenhagen, Available at http://www.norden.org/pub/miljo/miljo/uk/TN2005593.pdf, 2005.
[7] D. Muir, P.H. Howard, W. Meylan, Identification of new, possible PB&T sub-stances important in the Great Lakes region by screening of chemicals incommerce, http://www.epa.gov/glnpo/p2/PBTReport.pdf, 2007.
[8] K.R. Drottar, R.L. Jezowski, D.A. McNett, J.M. Regan, J.Y. Domoradzki, K.P. Plotzke,14C-Decamethylcyclopentasiloxane (14C-D5): dietary bioaccumulation in therainbow trout (Oncorhynchus mykiss) under flow-through test conditions, in:Presented at SETAC Europe, Porto, Portugal, 2007.
[9] E.G. Gooch, Determination of traces of silicone defoamer in fruit juices by sol-vent extraction/atomic absorption spectroscopy, Journal of AOAC International76 (3) (1993) 581–583.
[10] J.J. Kennan, L.L. Breen, T.H. Lane, R.B. Taylor, Methods for detecting silicones inbiological matrices, Analytical Chemistry 71 (15) (1999) 3054–3060.
[11] M. Costello, Just how do you determine the appropriate level of sil-icone addition for tissue substrates? Tissue World (April/May) (2006)32–35.
[12] M. Aramata, K. Saitoh, A new analytical method for silicone determination inthe environment by pyrolysis/GC-AED, American Laboratory 29 (15) (1997) 19.
[13] J.C. del Rio, R.P. Phil, J. Allen, Nature and geochemistry of high molecular weighthydrocarbons (above C40) in oils and solid bitumens, Organic Geochemistry 18(4) (1992) 541–553.
[14] C. Ovalles, P. Rengel-Unda, J. Bruzual, A. Salazar, Upgrading of extraheavy crude using hydrogen donor under steam injection conditions.Characterization by Pyrolysis GC–MS of the asphaltenes and effectsof a radical initiator, Fuel Chemistry Division Preprints 48 (1) (2003)60–61.