cod removal from anaerobically treated palm oil mill effluent (at - pome) via aerated heterogeneous...
TRANSCRIPT
1
2 COD removal from anaerobically treated palm oil mill effluent3 (AT-POME) via aerated heterogeneous Fenton process:4 Optimization study
5 M.R. TahaQ1a, A.H. Ibrahim b,*
6 aDepartment of Civil and Structural Engineering, Universiti Kebangsaan Malaysia,Bangi 43600, Malaysia
7 b School of Environmental Engineering, Universiti Malaysia Perlis, Perlis 01000, Malaysia
89 1. Introduction
10 Preservation of fresh water is a great concern of people
11 worldwide. With the increasing population in every part of the
12 world, the demands for clean and fresh water becomes a crucial
13 issue. On the other hand, industries also require a large amount of
14 fresh water to sustain their activities and processes. In 2012,
15 Malaysia was recorded as the world’s second largest producer of
16 palm oil with the production of 18.7 million tons of crude palm
17 oil (CPO) [1]. This crude palm oil was produced from 429 palm oil
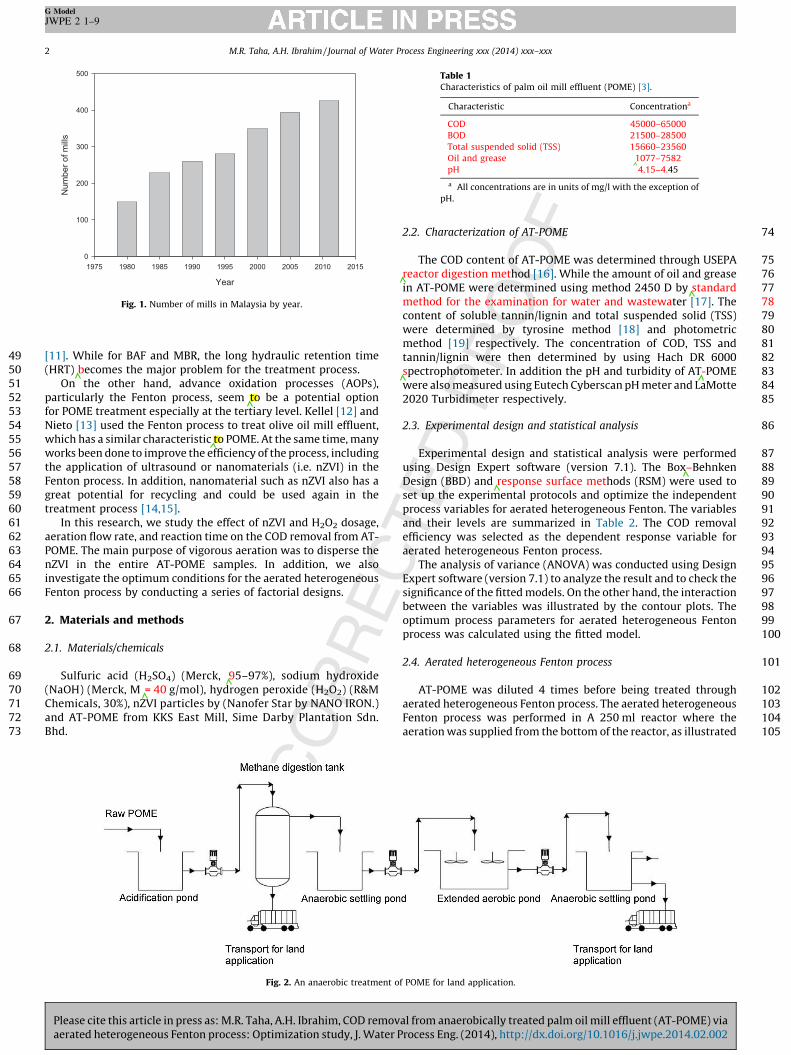
18 mills located all over Malaysia. Fig. 1 shows the number of palm
19 oil mills in Malaysia by year, and the trend shows that the number
20 of mills is increasing over the years.
21 As all oil palm mills in Malaysia utilize a wet milling method, a
22 lot of water is used during the milling process. This results in a
23 significantly large production of wastewater called palm oil mill
24 effluent (POME). It is estimated that for every ton of crude palm oil
25 yield, 2.5 tons of palm oil mill effluent (POME) is produced [2]. This
26effluent contains extremely high quantities of organic content, for
27which the chemical oxygen demand (COD) and biological oxygen
28demand (BOD) are between 45,000 and 65,000 mg/l and 21,500
29and 28,500 mg/l respectively [3]. The characteristics of raw POME
30are summarized in Table 1.
31Due to the extreme organic pollutant loading, palm oil mills
32employ three stages of treatment to ensure that the POME
33complies with the discharge standard enforced by the local
34authority. Fig. 2 shows the typical POME treatment process at palm
35oil mill. As an anaerobic treatment process properly treats
36wastewater containing high organic loading, most mill employ
37this type of treatment at their primary stage. In addition, studies by
38Poh [4], Choi [5] and Zinatizadeh [6] also demonstrated the success
39of anaerobic process to treat POME.
40While for the tertiary or polishing stage, the mills as well as
41technology providers are still looking for the best treatment for
42POME. Some of the approaches that have been studied for tertiary
43treatment of POME are ultra-filtration [7], biological aerated filter
44(BAF) [8], adsorption [9] and membrane bioreactor process (MBR)
45[10]. Although all methods show a positive result for POME
46treatment, they still have drawbacks which need to be addressed.
47Membrane fouling/scaling, frequent back washing, and high
48capital cost are main problems with membrane filtration process
Journal of Water Process Engineering xxx (2014) xxx–xxx
A R T I C L E I N F O
Article history:
Received 18 December 2013
Received in revised form 6 February 2014
Accepted 11 February 2014
Available online xxx
Keywords:
Palm oil mill effluent (POME)
Anaerobic digestion
Fenton process
Nano zero-valent iron (nZVI)
A B S T R A C T
Due to the extremely high content of organic pollutants, palm oil mill effluent (POME) requires multiple
stages of treatment. At the primary stage, because of the high loading of organics, anaerobic treatment
method was found to be the best practice nowadays. However, at the later stages, the treatment methods
vary. As an option to available secondary and tertiary treatment method, we used an aerated
heterogeneous Fenton process to remove chemical oxygen demand (COD) from anaerobically treated
palm oil mill effluent (AT-POME). The Box–Behnken design (BBD) and response surface method (RSM)
were used to design and optimize the performance of the process. Furthermore, the regression quadratic
model representing the COD removal efficiency of aerated heterogeneous Fenton was developed and
validated by the analysis of variances (ANOVA). The optimum parameters were determined as 3.91 g/l of
nZVI dosage, 1.84 g/l of H2O2 dosage, and 23.84 l/h of aeration and 240 min of reaction time. As 75% of
COD was predicted to be removed at the optimum condition, the aerated heterogeneous Fenton process
is a promising treatment method for AT-POME.
� 2014 Published by Elsevier Ltd.
* Corresponding author. Tel.: +60 125353897; fax: +60 389216147Q2 .
E-mail addresses: [email protected] (M.R. Taha), [email protected]
(A.H. Ibrahim).
G Model
JWPE 2 1–9
Please cite this article in press as: M.R. Taha, A.H. Ibrahim, COD removal from anaerobically treated palm oil mill effluent (AT-POME) via
aerated heterogeneous Fenton process: Optimization study, J. Water Process Eng. (2014), http://dx.doi.org/10.1016/j.jwpe.2014.02.002
Contents lists available at ScienceDirect
Journal of Water Process Engineering
jo ur n al ho m ep ag e: www .e ls evier . c om / lo cat e/ jw p e
http://dx.doi.org/10.1016/j.jwpe.2014.02.002
2214-7144/� 2014 Published by Elsevier Ltd.
49 [11]. While for BAF and MBR, the long hydraulic retention time
50 (HRT) becomes the major problem for the treatment process.
51 On the other hand, advance oxidation processes (AOPs),
52 particularly the Fenton process, seem to be a potential option
53 for POME treatment especially at the tertiary level. Kellel [12] and
54 Nieto [13] used the Fenton process to treat olive oil mill effluent,
55 which has a similar characteristic to POME. At the same time, many
56 works been done to improve the efficiency of the process, including
57 the application of ultrasound or nanomaterials (i.e. nZVI) in the
58 Fenton process. In addition, nanomaterial such as nZVI also has a
59 great potential for recycling and could be used again in the
60 treatment process [14,15].
61 In this research, we study the effect of nZVI and H2O2 dosage,
62 aeration flow rate, and reaction time on the COD removal from AT-
63 POME. The main purpose of vigorous aeration was to disperse the
64 nZVI in the entire AT-POME samples. In addition, we also
65 investigate the optimum conditions for the aerated heterogeneous
66 Fenton process by conducting a series of factorial designs.
67 2. Materials and methods
68 2.1. Materials/chemicals
69 Sulfuric acid (H2SO4) (Merck, 95–97%), sodium hydroxide
70 (NaOH) (Merck, M = 40 g/mol), hydrogen peroxide (H2O2) (R&M
71 Chemicals, 30%), nZVI particles by (Nanofer Star by NANO IRON.)
72 and AT-POME from KKS East Mill, Sime Darby Plantation Sdn.
73 Bhd.
742.2. Characterization of AT-POME
75The COD content of AT-POME was determined through USEPA
76reactor digestion method [16]. While the amount of oil and grease
77in AT-POME were determined using method 2450 D by standard
78method for the examination for water and wastewater [17]. The
79content of soluble tannin/lignin and total suspended solid (TSS)
80were determined by tyrosine method [18] and photometric
81method [19] respectively. The concentration of COD, TSS and
82tannin/lignin were then determined by using Hach DR 6000
83spectrophotometer. In addition the pH and turbidity of AT-POME
84were also measured using Eutech Cyberscan pH meter and LaMotte
852020 Turbidimeter respectively.
862.3. Experimental design and statistical analysis
87Experimental design and statistical analysis were performed
88using Design Expert software (version 7.1). The Box–Behnken
89Design (BBD) and response surface methods (RSM) were used to
90set up the experimental protocols and optimize the independent
91process variables for aerated heterogeneous Fenton. The variables
92and their levels are summarized in Table 2. The COD removal
93efficiency was selected as the dependent response variable for
94aerated heterogeneous Fenton process.
95The analysis of variance (ANOVA) was conducted using Design
96Expert software (version 7.1) to analyze the result and to check the
97significance of the fitted models. On the other hand, the interaction
98between the variables was illustrated by the contour plots. The
99optimum process parameters for aerated heterogeneous Fenton
100process was calculated using the fitted model.
1012.4. Aerated heterogeneous Fenton process
102AT-POME was diluted 4 times before being treated through
103aerated heterogeneous Fenton process. The aerated heterogeneous
104Fenton process was performed in A 250 ml reactor where the
105aeration was supplied from the bottom of the reactor, as illustrated
Year
1975 198 0 198 5 199 0 199 5 200 0 200 5 201 0 201 5
Num
ber
of m
ills
0
100
200
300
400
500
Fig. 1. Number of mills in Malaysia by year.
Table 1
Characteristics of palm oil mill effluent (POME) [3].
Characteristic Concentrationa
COD 45000–65000
BOD 21500–28500
Total suspended solid (TSS) 15660–23560
Oil and grease 1077–7582
pH 4.15–4.45
a All concentrations are in units of mg/l with the exception of
pH.
Fig. 2. An anaerobic treatment of POME for land application.
M.R. Taha, A.H. Ibrahim / Journal of Water Process Engineering xxx (2014) xxx–xxx2
G Model
JWPE 2 1–9
Please cite this article in press as: M.R. Taha, A.H. Ibrahim, COD removal from anaerobically treated palm oil mill effluent (AT-POME) via
aerated heterogeneous Fenton process: Optimization study, J. Water Process Eng. (2014), http://dx.doi.org/10.1016/j.jwpe.2014.02.002
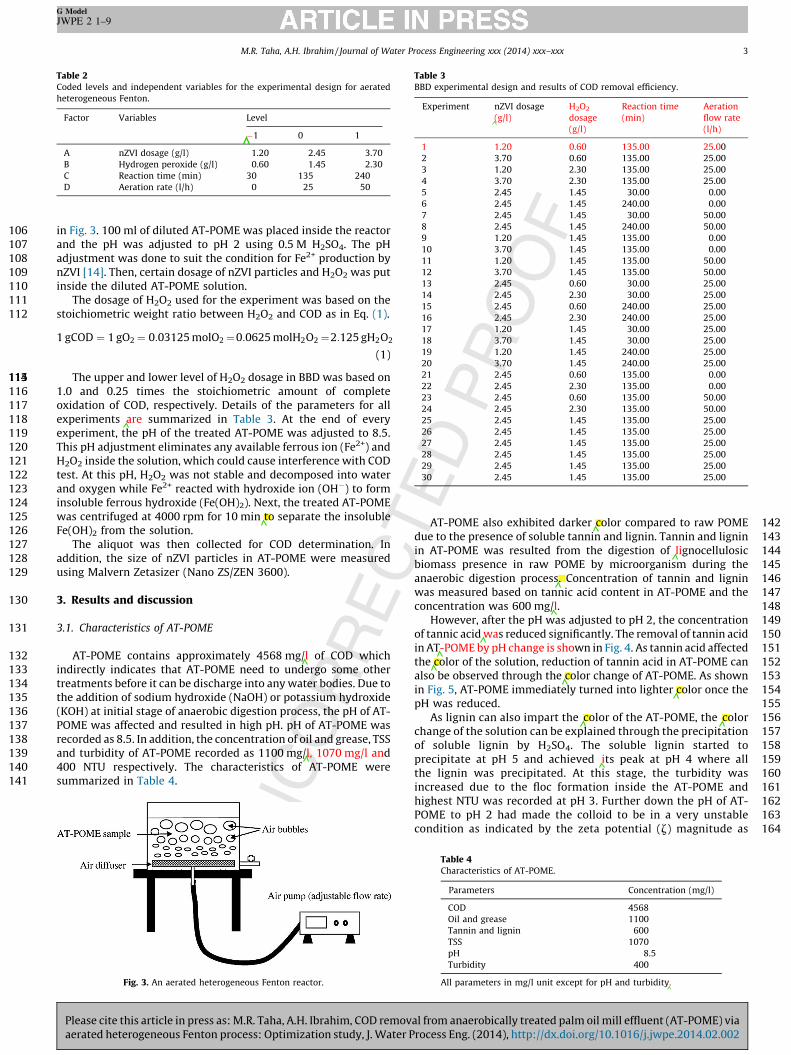
106 in Fig. 3. 100 ml of diluted AT-POME was placed inside the reactor
107 and the pH was adjusted to pH 2 using 0.5 M H2SO4. The pH
108 adjustment was done to suit the condition for Fe2+ production by
109 nZVI [14]. Then, certain dosage of nZVI particles and H2O2 was put
110 inside the diluted AT-POME solution.
111 The dosage of H2O2 used for the experiment was based on the
112 stoichiometric weight ratio between H2O2 and COD as in Eq. (1).
1 gCOD ¼ 1 gO2 ¼ 0:03125 molO2 ¼0:0625 molH2O2 ¼2:125 gH2O2
(1)
113114115 The upper and lower level of H2O2 dosage in BBD was based on
116 1.0 and 0.25 times the stoichiometric amount of complete
117 oxidation of COD, respectively. Details of the parameters for all
118 experiments are summarized in Table 3. At the end of every
119 experiment, the pH of the treated AT-POME was adjusted to 8.5.
120 This pH adjustment eliminates any available ferrous ion (Fe2+) and
121 H2O2 inside the solution, which could cause interference with COD
122 test. At this pH, H2O2 was not stable and decomposed into water
123 and oxygen while Fe2+ reacted with hydroxide ion (OH�) to form
124 insoluble ferrous hydroxide (Fe(OH)2). Next, the treated AT-POME
125 was centrifuged at 4000 rpm for 10 min to separate the insoluble
126 Fe(OH)2 from the solution.
127 The aliquot was then collected for COD determination. In
128 addition, the size of nZVI particles in AT-POME were measured
129 using Malvern Zetasizer (Nano ZS/ZEN 3600).
130 3. Results and discussion
131 3.1. Characteristics of AT-POME
132 AT-POME contains approximately 4568 mg/l of COD which
133 indirectly indicates that AT-POME need to undergo some other
134 treatments before it can be discharge into any water bodies. Due to
135 the addition of sodium hydroxide (NaOH) or potassium hydroxide
136 (KOH) at initial stage of anaerobic digestion process, the pH of AT-
137 POME was affected and resulted in high pH. pH of AT-POME was
138 recorded as 8.5. In addition, the concentration of oil and grease, TSS
139 and turbidity of AT-POME recorded as 1100 mg/l, 1070 mg/l and
140 400 NTU respectively. The characteristics of AT-POME were
141 summarized in Table 4.
142AT-POME also exhibited darker color compared to raw POME
143due to the presence of soluble tannin and lignin. Tannin and lignin
144in AT-POME was resulted from the digestion of lignocellulosic
145biomass presence in raw POME by microorganism during the
146anaerobic digestion process. Concentration of tannin and lignin
147was measured based on tannic acid content in AT-POME and the
148concentration was 600 mg/l.
149However, after the pH was adjusted to pH 2, the concentration
150of tannic acid was reduced significantly. The removal of tannin acid
151in AT-POME by pH change is shown in Fig. 4. As tannin acid affected
152the color of the solution, reduction of tannin acid in AT-POME can
153also be observed through the color change of AT-POME. As shown
154in Fig. 5, AT-POME immediately turned into lighter color once the
155pH was reduced.
156As lignin can also impart the color of the AT-POME, the color
157change of the solution can be explained through the precipitation
158of soluble lignin by H2SO4. The soluble lignin started to
159precipitate at pH 5 and achieved its peak at pH 4 where all
160the lignin was precipitated. At this stage, the turbidity was
161increased due to the floc formation inside the AT-POME and
162highest NTU was recorded at pH 3. Further down the pH of AT-
163POME to pH 2 had made the colloid to be in a very unstable
164condition as indicated by the zeta potential (z) magnitude as
Table 2
Coded levels and independent variables for the experimental design for aerated
heterogeneous Fenton.
Factor Variables Level
�1 0 1
A nZVI dosage (g/l) 1.20 2.45 3.70
B Hydrogen peroxide (g/l) 0.60 1.45 2.30
C Reaction time (min) 30 135 240
D Aeration rate (l/h) 0 25 50
Fig. 3. An aerated heterogeneous Fenton reactor.
Table 3
BBD experimental design and results of COD removal efficiency.
Experiment nZVI dosage
(g/l)
H2O2
dosage
(g/l)
Reaction time
(min)
Aeration
flow rate
(l/h)
1 1.20 0.60 135.00 25.00
2 3.70 0.60 135.00 25.00
3 1.20 2.30 135.00 25.00
4 3.70 2.30 135.00 25.00
5 2.45 1.45 30.00 0.00
6 2.45 1.45 240.00 0.00
7 2.45 1.45 30.00 50.00
8 2.45 1.45 240.00 50.00
9 1.20 1.45 135.00 0.00
10 3.70 1.45 135.00 0.00
11 1.20 1.45 135.00 50.00
12 3.70 1.45 135.00 50.00
13 2.45 0.60 30.00 25.00
14 2.45 2.30 30.00 25.00
15 2.45 0.60 240.00 25.00
16 2.45 2.30 240.00 25.00
17 1.20 1.45 30.00 25.00
18 3.70 1.45 30.00 25.00
19 1.20 1.45 240.00 25.00
20 3.70 1.45 240.00 25.00
21 2.45 0.60 135.00 0.00
22 2.45 2.30 135.00 0.00
23 2.45 0.60 135.00 50.00
24 2.45 2.30 135.00 50.00
25 2.45 1.45 135.00 25.00
26 2.45 1.45 135.00 25.00
27 2.45 1.45 135.00 25.00
28 2.45 1.45 135.00 25.00
29 2.45 1.45 135.00 25.00
30 2.45 1.45 135.00 25.00
Table 4
Characteristics of AT-POME.
Parameters Concentration (mg/l)
COD 4568
Oil and grease 1100
Tannin and lignin 600
TSS 1070
pH 8.5
Turbidity 400
All parameters in mg/l unit except for pH and turbidity.
M.R. Taha, A.H. Ibrahim / Journal of Water Process Engineering xxx (2014) xxx–xxx 3
G Model
JWPE 2 1–9
Please cite this article in press as: M.R. Taha, A.H. Ibrahim, COD removal from anaerobically treated palm oil mill effluent (AT-POME) via
aerated heterogeneous Fenton process: Optimization study, J. Water Process Eng. (2014), http://dx.doi.org/10.1016/j.jwpe.2014.02.002
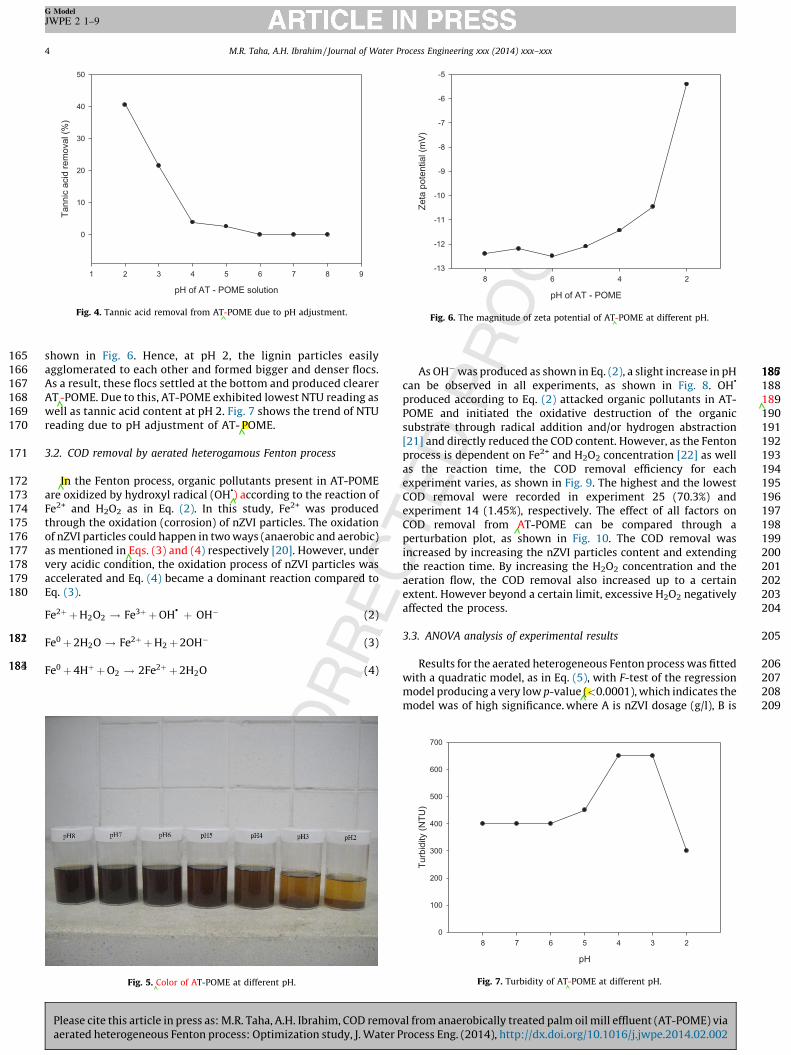
165 shown in Fig. 6. Hence, at pH 2, the lignin particles easily
166 agglomerated to each other and formed bigger and denser flocs.
167 As a result, these flocs settled at the bottom and produced clearer
168 AT -POME. Due to this, AT-POME exhibited lowest NTU reading as
169 well as tannic acid content at pH 2. Fig. 7 shows the trend of NTU
170 reading due to pH adjustment of AT- POME.
171 3.2. COD removal by aerated heterogamous Fenton process
172 In the Fenton process, organic pollutants present in AT-POME
173 are oxidized by hydroxyl radical (OH�
) according to the reaction of
174 Fe2+ and H2O2 as in Eq. (2). In this study, Fe2+ was produced
175 through the oxidation (corrosion) of nZVI particles. The oxidation
176 of nZVI particles could happen in two ways (anaerobic and aerobic)
177 as mentioned in Eqs. (3) and (4) respectively [20]. However, under
178 very acidic condition, the oxidation process of nZVI particles was
179 accelerated and Eq. (4) became a dominant reaction compared to
180 Eq. (3).
Fe2þ þ H2O2 ! Fe3þ þ OH�
þ OH� (2)
181182 Fe0 þ 2H2O ! Fe2þ þ H2 þ 2OH� (3)
183184 Fe0 þ 4Hþþ O2 ! 2Fe2þ þ 2H2O (4)
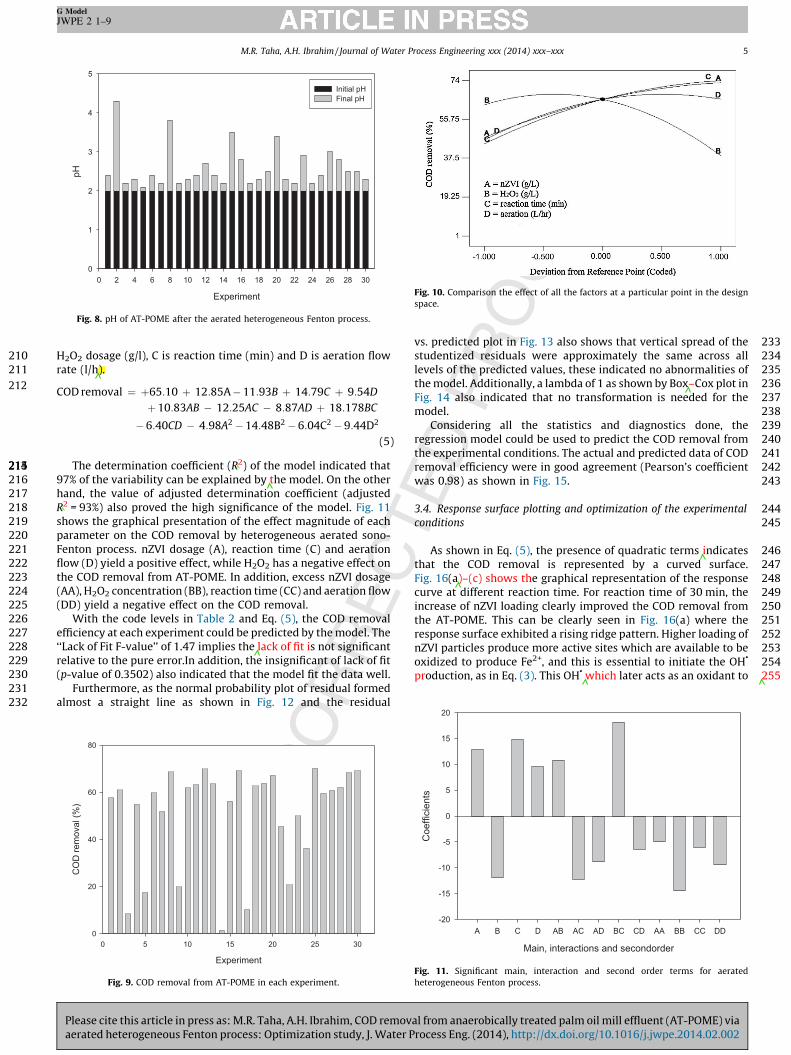
185186187As OH�was produced as shown in Eq. (2), a slight increase in pH
188can be observed in all experiments, as shown in Fig. 8. OH�
189produced according to Eq. (2) attacked organic pollutants in AT-
190POME and initiated the oxidative destruction of the organic
191substrate through radical addition and/or hydrogen abstraction
192[21] and directly reduced the COD content. However, as the Fenton
193process is dependent on Fe2+ and H2O2 concentration [22] as well
194as the reaction time, the COD removal efficiency for each
195experiment varies, as shown in Fig. 9. The highest and the lowest
196COD removal were recorded in experiment 25 (70.3%) and
197experiment 14 (1.45%), respectively. The effect of all factors on
198COD removal from AT-POME can be compared through a
199perturbation plot, as shown in Fig. 10. The COD removal was
200increased by increasing the nZVI particles content and extending
201the reaction time. By increasing the H2O2 concentration and the
202aeration flow, the COD removal also increased up to a certain
203extent. However beyond a certain limit, excessive H2O2 negatively
204affected the process.
2053.3. ANOVA analysis of experimental results
206Results for the aerated heterogeneous Fenton process was fitted
207with a quadratic model, as in Eq. (5), with F-test of the regression
208model producing a very low p-value (<0.0001), which indicates the
209model was of high significance. where A is nZVI dosage (g/l), B is
pH of AT - POME solut ion
1 2 3 4 5 6 7 8 9
Tannic
acid
rem
oval (%
)
0
10
20
30
40
50
Fig. 4. Tannic acid removal from AT-POME due to pH adjustment.
Fig. 5. Color of AT-POME at different pH.
pH of AT - POME
2468
Zeta
pote
ntial (m
V)
-13
-12
-11
-10
-9
-8
-7
-6
-5
Fig. 6. The magnitude of zeta potential of AT-POME at different pH.
pH
2345678
Turb
idity (
NT
U)
0
100
200
300
400
500
600
700
Fig. 7. Turbidity of AT-POME at different pH.
M.R. Taha, A.H. Ibrahim / Journal of Water Process Engineering xxx (2014) xxx–xxx4
G Model
JWPE 2 1–9
Please cite this article in press as: M.R. Taha, A.H. Ibrahim, COD removal from anaerobically treated palm oil mill effluent (AT-POME) via
aerated heterogeneous Fenton process: Optimization study, J. Water Process Eng. (2014), http://dx.doi.org/10.1016/j.jwpe.2014.02.002
210 H2O2 dosage (g/l), C is reaction time (min) and D is aeration flow
211 rate (l/h).
212COD removal ¼ þ65:10 þ 12:85A � 11:93B þ 14:79C þ 9:54D
þ 10:83AB � 12:25AC � 8:87AD þ 18:178BC
� 6:40CD � 4:98A2� 14:48B2
� 6:04C2� 9:44D2
(5)
213214215 The determination coefficient (R2) of the model indicated that
216 97% of the variability can be explained by the model. On the other
217 hand, the value of adjusted determination coefficient (adjusted
218 R2 = 93%) also proved the high significance of the model. Fig. 11
219 shows the graphical presentation of the effect magnitude of each
220 parameter on the COD removal by heterogeneous aerated sono-
221 Fenton process. nZVI dosage (A), reaction time (C) and aeration
222 flow (D) yield a positive effect, while H2O2 has a negative effect on
223 the COD removal from AT-POME. In addition, excess nZVI dosage
224 (AA), H2O2 concentration (BB), reaction time (CC) and aeration flow
225 (DD) yield a negative effect on the COD removal.
226 With the code levels in Table 2 and Eq. (5), the COD removal
227 efficiency at each experiment could be predicted by the model. The
228 ‘‘Lack of Fit F-value’’ of 1.47 implies the lack of fit is not significant
229 relative to the pure error.In addition, the insignificant of lack of fit
230 (p-value of 0.3502) also indicated that the model fit the data well.
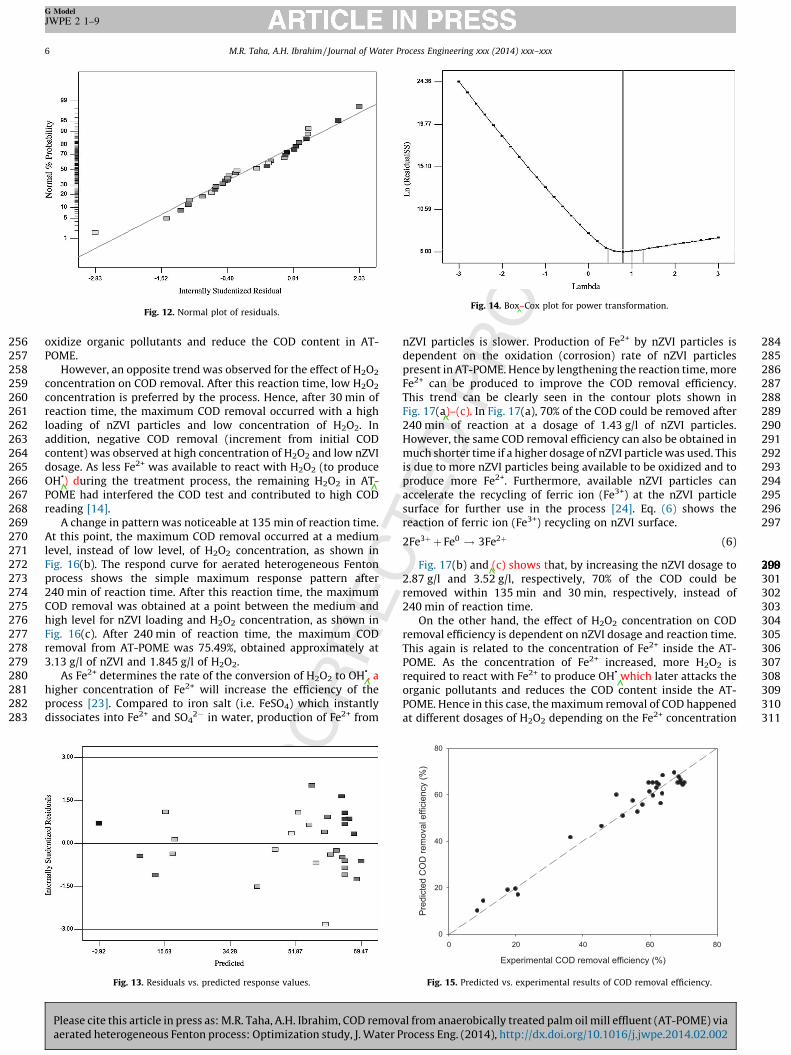
231 Furthermore, as the normal probability plot of residual formed
232 almost a straight line as shown in Fig. 12 and the residual
233vs. predicted plot in Fig. 13 also shows that vertical spread of the
234studentized residuals were approximately the same across all
235levels of the predicted values, these indicated no abnormalities of
236the model. Additionally, a lambda of 1 as shown by Box–Cox plot in
237Fig. 14 also indicated that no transformation is needed for the
238model.
239Considering all the statistics and diagnostics done, the
240regression model could be used to predict the COD removal from
241the experimental conditions. The actual and predicted data of COD
242removal efficiency were in good agreement (Pearson’s coefficient
243was 0.98) as shown in Fig. 15.
2443.4. Response surface plotting and optimization of the experimental
245conditions
246As shown in Eq. (5), the presence of quadratic terms indicates
247that the COD removal is represented by a curved surface.
248Fig. 16(a)–(c) shows the graphical representation of the response
249curve at different reaction time. For reaction time of 30 min, the
250increase of nZVI loading clearly improved the COD removal from
251the AT-POME. This can be clearly seen in Fig. 16(a) where the
252response surface exhibited a rising ridge pattern. Higher loading of
253nZVI particles produce more active sites which are available to be
254oxidized to produce Fe2+, and this is essential to initiate the OH�
255production, as in Eq. (3). This OH�
which later acts as an oxidant to
Experiment
0 2 4 6 8 10 12 14 16 18 20 22 24 26 28 30
pH
0
1
2
3
4
5
Initial pH
Final pH
Fig. 8. pH of AT-POME after the aerated heterogeneous Fenton process.
Experiment
0 5 10 15 20 25 30
CO
D r
em
oval (%
)
0
20
40
60
80
Fig. 9. COD removal from AT-POME in each experiment.
Fig. 10. Comparison the effect of all the factors at a particular point in the design
space.
Main, in tera ctions an d se condorder
A B C D AB AC AD BC CD AA BB CC DD
Coeffic
ients
-20
-15
-10
-5
0
5
10
15
20
Fig. 11. Significant main, interaction and second order terms for aerated
heterogeneous Fenton process.
M.R. Taha, A.H. Ibrahim / Journal of Water Process Engineering xxx (2014) xxx–xxx 5
G Model
JWPE 2 1–9
Please cite this article in press as: M.R. Taha, A.H. Ibrahim, COD removal from anaerobically treated palm oil mill effluent (AT-POME) via
aerated heterogeneous Fenton process: Optimization study, J. Water Process Eng. (2014), http://dx.doi.org/10.1016/j.jwpe.2014.02.002
256 oxidize organic pollutants and reduce the COD content in AT-
257 POME.
258 However, an opposite trend was observed for the effect of H2O2
259 concentration on COD removal. After this reaction time, low H2O2
260 concentration is preferred by the process. Hence, after 30 min of
261 reaction time, the maximum COD removal occurred with a high
262 loading of nZVI particles and low concentration of H2O2. In
263 addition, negative COD removal (increment from initial COD
264 content) was observed at high concentration of H2O2 and low nZVI
265 dosage. As less Fe2+ was available to react with H2O2 (to produce
266 OH�
) during the treatment process, the remaining H2O2 in AT-
267 POME had interfered the COD test and contributed to high COD
268 reading [14].
269 A change in pattern was noticeable at 135 min of reaction time.
270 At this point, the maximum COD removal occurred at a medium
271 level, instead of low level, of H2O2 concentration, as shown in
272 Fig. 16(b). The respond curve for aerated heterogeneous Fenton
273 process shows the simple maximum response pattern after
274 240 min of reaction time. After this reaction time, the maximum
275 COD removal was obtained at a point between the medium and
276 high level for nZVI loading and H2O2 concentration, as shown in
277 Fig. 16(c). After 240 min of reaction time, the maximum COD
278 removal from AT-POME was 75.49%, obtained approximately at
279 3.13 g/l of nZVI and 1.845 g/l of H2O2.
280 As Fe2+ determines the rate of the conversion of H2O2 to OH�
, a
281 higher concentration of Fe2+ will increase the efficiency of the
282 process [23]. Compared to iron salt (i.e. FeSO4) which instantly
283 dissociates into Fe2+ and SO42� in water, production of Fe2+ from
284nZVI particles is slower. Production of Fe2+ by nZVI particles is
285dependent on the oxidation (corrosion) rate of nZVI particles
286present in AT-POME. Hence by lengthening the reaction time, more
287Fe2+ can be produced to improve the COD removal efficiency.
288This trend can be clearly seen in the contour plots shown in
289Fig. 17(a)–(c). In Fig. 17(a), 70% of the COD could be removed after
290240 min of reaction at a dosage of 1.43 g/l of nZVI particles.
291However, the same COD removal efficiency can also be obtained in
292much shorter time if a higher dosage of nZVI particle was used. This
293is due to more nZVI particles being available to be oxidized and to
294produce more Fe2+. Furthermore, available nZVI particles can
295accelerate the recycling of ferric ion (Fe3+) at the nZVI particle
296surface for further use in the process [24]. Eq. (6) shows the
297reaction of ferric ion (Fe3+) recycling on nZVI surface.
2Fe3þ þ Fe0 ! 3Fe2þ (6)
298299300Fig. 17(b) and (c) shows that, by increasing the nZVI dosage to
3012.87 g/l and 3.52 g/l, respectively, 70% of the COD could be
302removed within 135 min and 30 min, respectively, instead of
303240 min of reaction time.
304On the other hand, the effect of H2O2 concentration on COD
305removal efficiency is dependent on nZVI dosage and reaction time.
306This again is related to the concentration of Fe2+ inside the AT-
307POME. As the concentration of Fe2+ increased, more H2O2 is
308required to react with Fe2+ to produce OH�
which later attacks the
309organic pollutants and reduces the COD content inside the AT-
310POME. Hence in this case, the maximum removal of COD happened
311at different dosages of H2O2 depending on the Fe2+ concentration
Fig. 12. Normal plot of residuals.
Fig. 13. Residuals vs. predicted response values.
Fig. 14. Box–Cox plot for power transformation.
Experimental COD removal efficiency (%)
0 20 40 60 80
Pre
dic
ted C
OD
rem
oval effic
iency (
%)
0
20
40
60
80
Fig. 15. Predicted vs. experimental results of COD removal efficiency.
M.R. Taha, A.H. Ibrahim / Journal of Water Process Engineering xxx (2014) xxx–xxx6
G Model
JWPE 2 1–9
Please cite this article in press as: M.R. Taha, A.H. Ibrahim, COD removal from anaerobically treated palm oil mill effluent (AT-POME) via
aerated heterogeneous Fenton process: Optimization study, J. Water Process Eng. (2014), http://dx.doi.org/10.1016/j.jwpe.2014.02.002
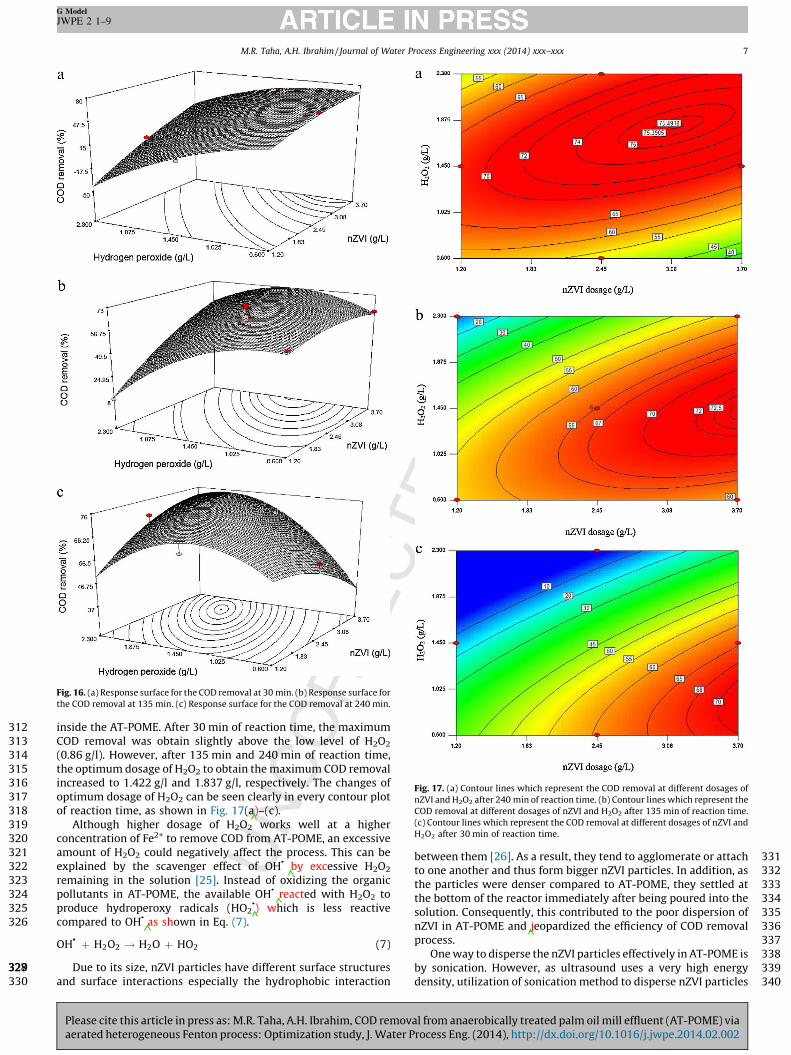
312 inside the AT-POME. After 30 min of reaction time, the maximum
313 COD removal was obtain slightly above the low level of H2O2
314 (0.86 g/l). However, after 135 min and 240 min of reaction time,
315 the optimum dosage of H2O2 to obtain the maximum COD removal
316 increased to 1.422 g/l and 1.837 g/l, respectively. The changes of
317 optimum dosage of H2O2 can be seen clearly in every contour plot
318 of reaction time, as shown in Fig. 17(a)–(c).
319 Although higher dosage of H2O2 works well at a higher
320 concentration of Fe2+ to remove COD from AT-POME, an excessive
321 amount of H2O2 could negatively affect the process. This can be
322 explained by the scavenger effect of OH�
by excessive H2O2
323 remaining in the solution [25]. Instead of oxidizing the organic
324 pollutants in AT-POME, the available OH�
reacted with H2O2 to
325 produce hydroperoxy radicals (HO2�
) which is less reactive
326 compared to OH�
as shown in Eq. (7).
OH�
þ H2O2 ! H2O þ HO2 (7)
327328329 Due to its size, nZVI particles have different surface structures
330 and surface interactions especially the hydrophobic interaction
331between them [26]. As a result, they tend to agglomerate or attach
332to one another and thus form bigger nZVI particles. In addition, as
333the particles were denser compared to AT-POME, they settled at
334the bottom of the reactor immediately after being poured into the
335solution. Consequently, this contributed to the poor dispersion of
336nZVI in AT-POME and jeopardized the efficiency of COD removal
337process.
338One way to disperse the nZVI particles effectively in AT-POME is
339by sonication. However, as ultrasound uses a very high energy
340density, utilization of sonication method to disperse nZVI particles
Fig. 16. (a) Response surface for the COD removal at 30 min. (b) Response surface for
the COD removal at 135 min. (c) Response surface for the COD removal at 240 min.
Fig. 17. (a) Contour lines which represent the COD removal at different dosages of
nZVI and H2O2 after 240 min of reaction time. (b) Contour lines which represent the
COD removal at different dosages of nZVI and H2O2 after 135 min of reaction time.
(c) Contour lines which represent the COD removal at different dosages of nZVI and
H2O2 after 30 min of reaction time.
M.R. Taha, A.H. Ibrahim / Journal of Water Process Engineering xxx (2014) xxx–xxx 7
G Model
JWPE 2 1–9
Please cite this article in press as: M.R. Taha, A.H. Ibrahim, COD removal from anaerobically treated palm oil mill effluent (AT-POME) via
aerated heterogeneous Fenton process: Optimization study, J. Water Process Eng. (2014), http://dx.doi.org/10.1016/j.jwpe.2014.02.002
341 in large volume of wastewater would consume much energy and
342 lead to cost issues to the industries [27]. To overcome this problem,
343 in this study, the dispersion of nZVI was done by creating a
344 turbulence flow inside the reactor through a vigorous aeration.
345 Without aeration, due to its density, all nZVI particles accumulated
346 at the bottom of the reactor after being poured into the solution.
347 The effect of aeration on COD removal at 30 min of reaction time
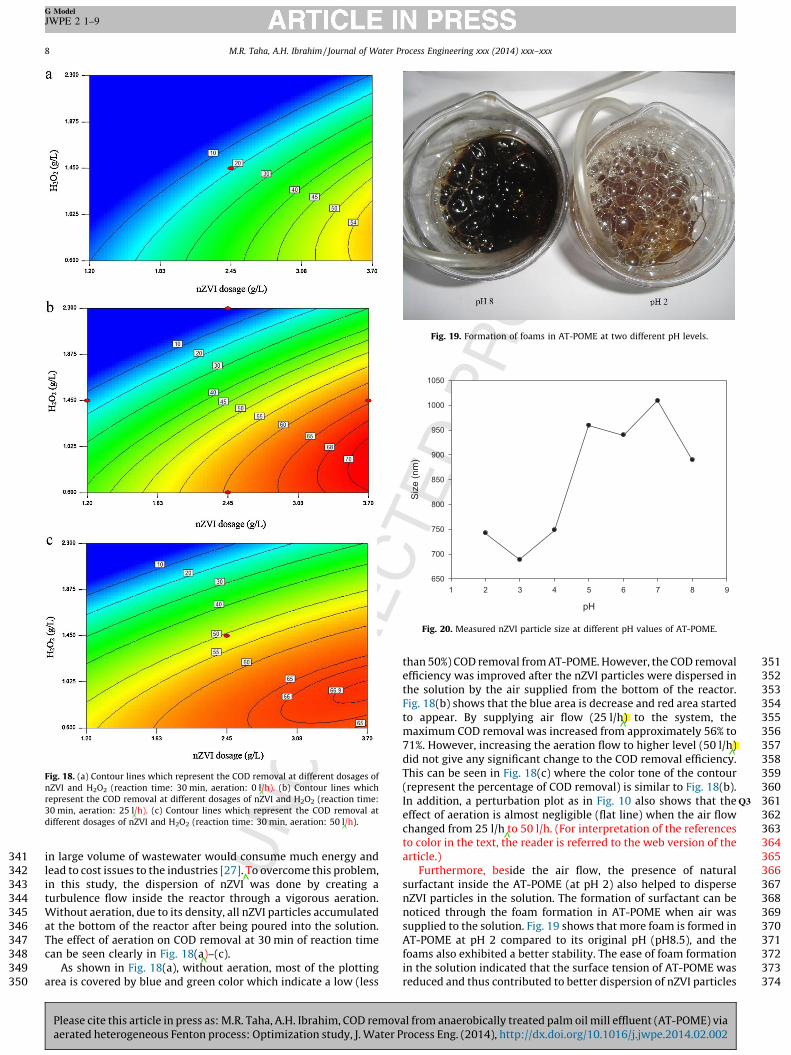
348 can be seen clearly in Fig. 18(a)–(c).
349 As shown in Fig. 18(a), without aeration, most of the plotting
350 area is covered by blue and green color which indicate a low (less
351than 50%) COD removal from AT-POME. However, the COD removal
352efficiency was improved after the nZVI particles were dispersed in
353the solution by the air supplied from the bottom of the reactor.
354Fig. 18(b) shows that the blue area is decrease and red area started
355to appear. By supplying air flow (25 l/h) to the system, the
356maximum COD removal was increased from approximately 56% to
35771%. However, increasing the aeration flow to higher level (50 l/h)
358did not give any significant change to the COD removal efficiency.
359This can be seen in Fig. 18(c) where the color tone of the contour
360(represent the percentage of COD removal) is similar to Fig. 18(b).
361In addition Q3, a perturbation plot as in Fig. 10 also shows that the
362effect of aeration is almost negligible (flat line) when the air flow
363changed from 25 l/h to 50 l/h. (For interpretation of the references
364to color in the text, the reader is referred to the web version of the
365article.)
366Furthermore, beside the air flow, the presence of natural
367surfactant inside the AT-POME (at pH 2) also helped to disperse
368nZVI particles in the solution. The formation of surfactant can be
369noticed through the foam formation in AT-POME when air was
370supplied to the solution. Fig. 19 shows that more foam is formed in
371AT-POME at pH 2 compared to its original pH (pH8.5), and the
372foams also exhibited a better stability. The ease of foam formation
373in the solution indicated that the surface tension of AT-POME was
374reduced and thus contributed to better dispersion of nZVI particles
Fig. 18. (a) Contour lines which represent the COD removal at different dosages of
nZVI and H2O2 (reaction time: 30 min, aeration: 0 l/h). (b) Contour lines which
represent the COD removal at different dosages of nZVI and H2O2 (reaction time:
30 min, aeration: 25 l/h). (c) Contour lines which represent the COD removal at
different dosages of nZVI and H2O2 (reaction time: 30 min, aeration: 50 l/h).
Fig. 19. Formation of foams in AT-POME at two different pH levels.
pH
1 2 3 4 5 6 7 8 9
Siz
e (
nm
)
650
700
750
800
850
900
950
1000
1050
Fig. 20. Measured nZVI particle size at different pH values of AT-POME.
M.R. Taha, A.H. Ibrahim / Journal of Water Process Engineering xxx (2014) xxx–xxx8
G Model
JWPE 2 1–9
Please cite this article in press as: M.R. Taha, A.H. Ibrahim, COD removal from anaerobically treated palm oil mill effluent (AT-POME) via
aerated heterogeneous Fenton process: Optimization study, J. Water Process Eng. (2014), http://dx.doi.org/10.1016/j.jwpe.2014.02.002
375 in AT-POME. The particles size analysis shows a decreasing trend
376 when AT-POME was reduced to lower pH as shown in Fig. 20.
377 Smaller size of nZVI as recorded at pH 2 indicated that the particles
378 were dispersed better in AT-POME at this pH condition compared
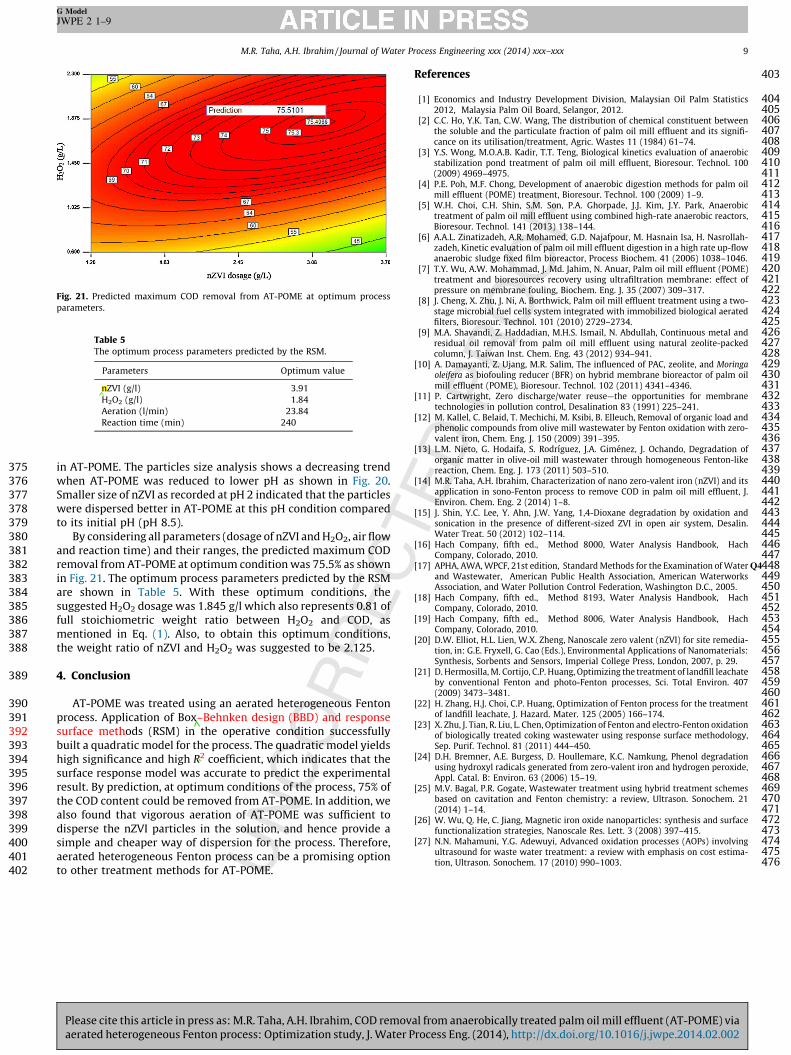
379 to its initial pH (pH 8.5).
380 By considering all parameters (dosage of nZVI and H2O2, air flow
381 and reaction time) and their ranges, the predicted maximum COD
382 removal from AT-POME at optimum condition was 75.5% as shown
383 in Fig. 21. The optimum process parameters predicted by the RSM
384 are shown in Table 5. With these optimum conditions, the
385 suggested H2O2 dosage was 1.845 g/l which also represents 0.81 of
386 full stoichiometric weight ratio between H2O2 and COD, as
387 mentioned in Eq. (1). Also, to obtain this optimum conditions,
388 the weight ratio of nZVI and H2O2 was suggested to be 2.125.
389 4. Conclusion
390 AT-POME was treated using an aerated heterogeneous Fenton
391 process. Application of Box–Behnken design (BBD) and response
392 surface methods (RSM) in the operative condition successfully
393 built a quadratic model for the process. The quadratic model yields
394 high significance and high R2 coefficient, which indicates that the
395 surface response model was accurate to predict the experimental
396 result. By prediction, at optimum conditions of the process, 75% of
397 the COD content could be removed from AT-POME. In addition, we
398 also found that vigorous aeration of AT-POME was sufficient to
399 disperse the nZVI particles in the solution, and hence provide a
400 simple and cheaper way of dispersion for the process. Therefore,
401 aerated heterogeneous Fenton process can be a promising option
402 to other treatment methods for AT-POME.
403References
404[1] Economics and Industry Development Division, Malaysian Oil Palm Statistics4052012, Malaysia Palm Oil Board, Selangor, 2012.406[2] C.C. Ho, Y.K. Tan, C.W. Wang, The distribution of chemical constituent between407the soluble and the particulate fraction of palm oil mill effluent and its signifi-408cance on its utilisation/treatment, Agric. Wastes 11 (1984) 61–74.409[3] Y.S. Wong, M.O.A.B. Kadir, T.T. Teng, Biological kinetics evaluation of anaerobic410stabilization pond treatment of palm oil mill effluent, Bioresour. Technol. 100411(2009) 4969–4975.412[4] P.E. Poh, M.F. Chong, Development of anaerobic digestion methods for palm oil413mill effluent (POME) treatment, Bioresour. Technol. 100 (2009) 1–9.414[5] W.H. Choi, C.H. Shin, S.M. Son, P.A. Ghorpade, J.J. Kim, J.Y. Park, Anaerobic415treatment of palm oil mill effluent using combined high-rate anaerobic reactors,416Bioresour. Technol. 141 (2013) 138–144.417[6] A.A.L. Zinatizadeh, A.R. Mohamed, G.D. Najafpour, M. Hasnain Isa, H. Nasrollah-418zadeh, Kinetic evaluation of palm oil mill effluent digestion in a high rate up-flow419anaerobic sludge fixed film bioreactor, Process Biochem. 41 (2006) 1038–1046.420[7] T.Y. Wu, A.W. Mohammad, J. Md. Jahim, N. Anuar, Palm oil mill effluent (POME)421treatment and bioresources recovery using ultrafiltration membrane: effect of422pressure on membrane fouling, Biochem. Eng. J. 35 (2007) 309–317.423[8] J. Cheng, X. Zhu, J. Ni, A. Borthwick, Palm oil mill effluent treatment using a two-424stage microbial fuel cells system integrated with immobilized biological aerated425filters, Bioresour. Technol. 101 (2010) 2729–2734.426[9] M.A. Shavandi, Z. Haddadian, M.H.S. Ismail, N. Abdullah, Continuous metal and427residual oil removal from palm oil mill effluent using natural zeolite-packed428column, J. Taiwan Inst. Chem. Eng. 43 (2012) 934–941.429[10] A. Damayanti, Z. Ujang, M.R. Salim, The influenced of PAC, zeolite, and Moringa430oleifera as biofouling reducer (BFR) on hybrid membrane bioreactor of palm oil431mill effluent (POME), Bioresour. Technol. 102 (2011) 4341–4346.432[11] P. Cartwright, Zero discharge/water reuse—the opportunities for membrane433technologies in pollution control, Desalination 83 (1991) 225–241.434[12] M. Kallel, C. Belaid, T. Mechichi, M. Ksibi, B. Elleuch, Removal of organic load and435phenolic compounds from olive mill wastewater by Fenton oxidation with zero-436valent iron, Chem. Eng. J. 150 (2009) 391–395.437[13] L.M. Nieto, G. Hodaifa, S. Rodrıguez, J.A. Gimenez, J. Ochando, Degradation of438organic matter in olive-oil mill wastewater through homogeneous Fenton-like439reaction, Chem. Eng. J. 173 (2011) 503–510.440[14] M.R. Taha, A.H. Ibrahim, Characterization of nano zero-valent iron (nZVI) and its441application in sono-Fenton process to remove COD in palm oil mill effluent, J.442Environ. Chem. Eng. 2 (2014) 1–8.443[15] J. Shin, Y.C. Lee, Y. Ahn, J.W. Yang, 1,4-Dioxane degradation by oxidation and444sonication in the presence of different-sized ZVI in open air system, Desalin.445Water Treat. 50 (2012) 102–114.446[16] Hach Company, fifth ed., Method 8000, Water Analysis Handbook, Hach447Company, Colorado, 2010.448[17] Q4APHA, AWA, WPCF, 21st edition, Standard Methods for the Examination of Water449and Wastewater, American Public Health Association, American Waterworks450Association, and Water Pollution Control Federation, Washington D.C., 2005.451[18] Hach Company, fifth ed., Method 8193, Water Analysis Handbook, Hach452Company, Colorado, 2010.453[19] Hach Company, fifth ed., Method 8006, Water Analysis Handbook, Hach454Company, Colorado, 2010.455[20] D.W. Elliot, H.L. Lien, W.X. Zheng, Nanoscale zero valent (nZVI) for site remedia-456tion, in: G.E. Fryxell, G. Cao (Eds.), Environmental Applications of Nanomaterials:457Synthesis, Sorbents and Sensors, Imperial College Press, London, 2007, p. 29.458[21] D. Hermosilla, M. Cortijo, C.P. Huang, Optimizing the treatment of landfill leachate459by conventional Fenton and photo-Fenton processes, Sci. Total Environ. 407460(2009) 3473–3481.461[22] H. Zhang, H.J. Choi, C.P. Huang, Optimization of Fenton process for the treatment462of landfill leachate, J. Hazard. Mater. 125 (2005) 166–174.463[23] X. Zhu, J. Tian, R. Liu, L. Chen, Optimization of Fenton and electro-Fenton oxidation464of biologically treated coking wastewater using response surface methodology,465Sep. Purif. Technol. 81 (2011) 444–450.466[24] D.H. Bremner, A.E. Burgess, D. Houllemare, K.C. Namkung, Phenol degradation467using hydroxyl radicals generated from zero-valent iron and hydrogen peroxide,468Appl. Catal. B: Environ. 63 (2006) 15–19.469[25] M.V. Bagal, P.R. Gogate, Wastewater treatment using hybrid treatment schemes470based on cavitation and Fenton chemistry: a review, Ultrason. Sonochem. 21471(2014) 1–14.472[26] W. Wu, Q. He, C. Jiang, Magnetic iron oxide nanoparticles: synthesis and surface473functionalization strategies, Nanoscale Res. Lett. 3 (2008) 397–415.474[27] N.N. Mahamuni, Y.G. Adewuyi, Advanced oxidation processes (AOPs) involving475ultrasound for waste water treatment: a review with emphasis on cost estima-476tion, Ultrason. Sonochem. 17 (2010) 990–1003.
Fig. 21. Predicted maximum COD removal from AT-POME at optimum process
parameters.
Table 5
The optimum process parameters predicted by the RSM.
Parameters Optimum value
nZVI (g/l) 3.91
H2O2 (g/l) 1.84
Aeration (l/min) 23.84
Reaction time (min) 240
M.R. Taha, A.H. Ibrahim / Journal of Water Process Engineering xxx (2014) xxx–xxx 9
G Model
JWPE 2 1–9
Please cite this article in press as: M.R. Taha, A.H. Ibrahim, COD removal from anaerobically treated palm oil mill effluent (AT-POME) via
aerated heterogeneous Fenton process: Optimization study, J. Water Process Eng. (2014), http://dx.doi.org/10.1016/j.jwpe.2014.02.002