engineering geologic factors influencing the stability of slopes
TRANSCRIPT
University of WollongongResearch Online
University of Wollongong Thesis Collection University of Wollongong Thesis Collections
1994
Engineering geologic factors influencing thestability of slopes in the northern Illawarra regionMohammad Hossein GhobadiUniversity of Wollongong
Research Online is the open access institutional repository for theUniversity of Wollongong. For further information contact the UOWLibrary: [email protected]
Recommended CitationGhobadi, Mohammad Hossein, Engineering geologic factors influencing the stability of slopes in the northern Illawarra region, Doctorof Philosophy thesis, Department of Civil and Mining Engineering, University of Wollongong, 1994. http://ro.uow.edu.au/theses/1244
ENGINEERING GEOLOGIC FACTORS INFLUENCING THE STABILITY OF SLOPES IN THE NORTHERN ELLAWARRA REGION
A thesis submitted in fulfilment of the requirements for the award of the degree of
DOCTOR OF PHILOSOPHY
from
THE UNIVERSITY OF WOLLONGONG
NEW SOUTH WALES, AUSTRALIA
by
M O H A M M A D HOSSEIN GHOBADI
(B.Sc in Geology; Ferdosi Uni. Mashad, Iran) (M.Sc in Eng. Geology; Tarbiat modarres Uni. Tehran, Iran)
DEPARTMENTS OF GEOLOGY AND CIVIL AND MINING ENGINEERING 1994

Except where otherwise acknowledged, this thesis represents the author's original research and the material included has not been submitted for a higher degree to any others institution.
M o h a m m a d Hossein Ghobadi

ABSTRACT
This thesis is concerned with understanding the engineering geologic factors influencing
the stability of slopes along a coastal escarpment in the northern Illawarra region. The
particular area covered by this study lies between Coalcliff and Clifton where a number
of known or visible areas of slope instability are present. Slope instability in the study
area is a function of the stratigraphy, structural geology, petrology, geomorphology,
climate and mechanical properties of the rock and soil.
In the northern Illawarra region the essentially flat-lying lower Narrabeen Group
conformably overlies the upper Illawarra Coal Measures and the strata consist of
repeated beds of sandstone, shale, claystone and coal seams. The lower Narrabeen
Group consists of thick sequences of weak fine-grained rocks which are rather more
easily eroded than the associated sandstone strata and hence relatively rapid rates of
recession occur. Undermining along this the contacts between claystone and sandstone
reduces the support for the overlying vertically-jointed sandstone and eventually leads
to stabs falling off along the vertical joint faces. Thin marker beds (coal seams) in the
Illawarra Coal Measures and sandstone beds in the Narrabeen Group commonly act as
aquifers, with claystone beds acting as aquitards. -Slope instability is usually related to
the presence of the aquifers which are the source of high pore water pressures:- Perched
water tables have been found to be quite common in the study area.
-The topography along the escarpment is mainly steep and highly irregular because of
past and present marine and fluvial erosion:- Large colluvial deposits have accumulated
at the base of the steeper slopes. Generally, colluvial deposits are clay-rich containing
abundant mixed-layer clay and smectite (montmorillonite).
-Based on the petrological study, the Narrabeen group was derived from the New
England Fold Belt to the north and consists predominantly of volcanic detritus. The
volcanic detritus is present in both the sandstone and shale units either in form of
detrital grains of volcanic rock or as fine volcanic ash- During post-depositional
alteration and diagenesis the original volcanic glass in the ash and matrix of larger
grains has devitrified to produce smectite clays. These clays not only cause swelling
and shrinkage near the surface as a response to wetting and drying, but also reduce the
permeability of the near the surface rock mass. This latter factor increases the aqueous
pore pressures and hence increases the likelihood of surficial mass movement of both
the rock mass and the adjacent talus deposits.
Based on X-ray diffraction, carbonates are mostly rare in the talus deposits. The natural
reduction in carbonate cement due to weathering is one a cause for talus slope
instability in the Illawarra area.
The high horizontal stress environment known to exist in the Illawarra area is an
important factor which also influences slope failure. The resulting joint strike maxima
for the lower Narrabeen Group show that the most prominent joint set exposed at the
surface, with a direction between 005° and 025°, has a significant effect on slope
stability in the study area.
Fracture permeability is also the most important feature of groundwater movements with
it most of the fractures occurring in areas of stress relief near the face of the
escarpment. It is quite obvious from studying the rainfall figures and periods of
prevalence of landslides that the most unstable periods are those when the rainfall is
above 400 mm per month.
A significant decrease in durability was found to accompany changes in mineralogy and
an increase in weathering from fresh to weathered rocks. Moderately and highly
weathered claystone and shale in the Narrabeen Group rocks have low to very low
durability; it is dependent on their mineralogy, and especially on the type and quantity
of clay minerals present. Claystone samples interbedded in the Bulgo Sandstone also
show very low durability. In contrast, claystone interbedded in the Scarborough
Sandstone shows a medium durability whereas claystone in the Coal Cliff Sandstone has
a high durability. The differences in the behaviour of samples is that slake durability
is sensitive to the abundance of clay minerals as opposed to carbonate in these samples.
Claystone interbeds in the Bulgo Sandstone and the highly weathered Stanwell Park
Claystone both have very low durability. This has a significant effect on slope stability
in the Bulgo Sandstone especially where the Stanwell Park Claystone acts as the
bedrock for the talus mantle between Clifton and Stanwell Park.
The Wombarra Shale and Stanwell Park Claystone, two units of the Narrabeen Group,
appear to dominate the study area as being the units most prone to instability problems.
Failure surfaces of landslides are located at or near the base of highly weathered shale
or claystone sequences.
A significant decrease in strength was also found to occur with an increase in
weathering from fresh to weathered rocks. The geotechnical properties of the talus
most related to its stability, are clay content, plasticity index and residual friction angle.
These parameters and the angle of natural slopes show the talus is unstable in the long-
term at slopes above 10-12°.
Man's construction activities have also caused some landslides in the northern Illawarra,
especially along the excavations for the railway and road. Two main transport routes,
the Illawarra Railway and Lawrence Hargrave Drive, pass through the study area.
Along Lawrence Hargrave Drive major movement in gently sloping land has been
triggered by high pore-water pressures in highly weathered Wombarra Shale covered by
a talus mantle. Increased urban development has and will continue to complicate the
issue in the future. Seven landslides have been detailed in this thesis. The majority
of these have or are presently undergoing block type movements at creep rate. Detailed
geotechnical investigations with survey monitoring is often necessary to identify these
failures.
The area has also been extensively mined for coal, resulting in minor subsidence. This
has usually caused fracturing of the rock strata and opening of the joint system which
have increased water ingress, resulting in higher subsurface flows and altered
groundwater regimes. Based on observations, mine subsidence has been one
contributory factor to slope instability in the northern Illawarra.
ACKNOWLEDGMENTS
The work represented in this thesis was carried out under the supervision of Associate
Professors B.G. Jones and R.N. Chowdhury. I am indebted for their constant
encouragement, guidance and discussions.
Facilities for carrying out the investigations were provided by the Departments of
Geology and Civil and Mining Engineering at the University of Wollongong.
My sincere thanks are due to Dr D. Titheridge and Mr P. Lamb (Kembla Coal & Coke
Pty Ltd) for their help in preparation of rock samples in the field and access to
photographs and comparative data. Special thanks are due to Messrs J. Peterson from
the Department of Main Roads (Wollongong office) and H.D. Christie from State Rail
Authority of New South Wales (Geotechnical Section) for their assistance.
I am thankful to Dr J.V. Hamel (Hamel Geotechnical Consultants, USA) for offering
valuable suggestions and advice. I am also grateful to the staff of the Departments of
Geology and Civil and Mining Engineering, and my friends for their support and co
operation.
Financial assistance was received for this study from a Postgraduate Scholarship
provided by the Islamic Republic of Iran. I wish to acknowledge this financial
assistance in preparing this thesis.
Consistent encouragement and deep interest shown by family members, especially my
wife, have provided necessary inspiration. I appreciate their thoughtfulness in bearing
with me and the inconvenience due to my constant occupation with this work in the
final stages.
CONTENTS
CHAPTER 1
1.1 INTRODUCTION 1
1.2 AIMS 3
1.3 ILLAWARRA REGION 5
1.4 PREVIOUS WORK 6
1.5 STUDY METHODS 8
1.6 MASS MOVEMENT 10
1.6.1 LANDSLIDE TERMINOLOGY 10
1.6.2 TYPE OF MASS MOVEMENT 10
1.6.3 FACTORS CAUSING MASS MOVEMENTS 14
1.7 MAIN CAUSES OF LANDSLIDES IN THE 18 ILLAWARRA AREA
CHAPTER 2 GEOLOGICAL AND GEOGRAPHICAL REVIEW
OF THE ILLAWARRA REGION
23
24
26
26
28
29
30
30
30
31
32
32
2.1
2.2
2.3
2.3.1
2.3.2
2.3.3
2.3.4
2.3.4.1
2.3.4.2
2.3.4.3
2.3.4.4
2.3.4.5
REGIONAL GEOLOGY
STRUCTURAL GEOLO<
ILLAWARRA AREA
GEOMORPHOLOGY
CLIMATE
GEOLOGY
STRATIGRAPHY
Shoalhaven Group
Illawarra Coal Measures
Narrabeen Group
Coal Cliff Sandstone
W o m b a r r a Shale
2.3.4.6
2.3.4.7
2.3.4.8
2.3.4.9
2.3.4.10
2.3.4.11
2.3.5
2.3.5.1
2.3.5.2
2.3.5.3
2.3.5.4
2.3.6
2.3.6.1
2.3.6.2
2.3.6.3
2.7
Scarborough Sandstone
Stanwell Park Claystone
Bulgo Sandstone
Bald Hill Claystone
Garie Formation
Newport Formation
POST-NARRABEEN UNITS
Hawkesbury Sandstone
Wianamatta Group
Igneous Rocks
Tertiary and Quaternary Deposits
STRUCTURAL GEOLOGY
Folds
Faults
Joints
STRESS FIELDS
33
33
34
34
35
35
35
35
36
36
37
37
37
38
39
40
CHAPTER 3 GEOLOGY OF THE UPPER COAL MEASURES AND LOWER NARRABEEN GROUP
IN THE SCARBOROUGH-STANWELL PARK AREA 3.1 INTRODUCTION 41
3.2 ILLAWARRA COAL MEASURES 42
3.2.1 UPPER ILLAWARRA COAL MEASURES 43 (SYDNEY SUB-GROUP)
3.2.2 WILTON FORMATION 43
3.2.3 TONGARRA COAL 44
3.2.4 BARGO CLAYSTONE 44
3.2.5 DARKES FOREST SANDSTONE 44
3.2.6 ALLANS CREEK FORMATION 45
3.2.7 KEMBLA SANDSTONE A*
3.2.8 WONGAWILLI COAL 46
3.2.9 ECKERSLEY FORMATION 46
3.2.10 BULLI COAL 47
3.3 NARRABEEN GROUP 47
3.3.1 LOWER NARRABEEN GROUP 48
3.3.1.1 Coalcliff Sandstone (CSs) 48
3.3.1.2 Wombarra Shale (WSh) 49
3.3.1.3 Scarborough Sandstone (SSs) 50
3.3.1.4 Stanwell Park Claystone (SPC) 50
3.3.1.5 Bulgo Sandstone (BSs) 51
3.4 IGNEOUS ROCKS 52
3.5 TALUS 53
3.6 SEDIMENTARY STRUCTURES 54
3.6.1 SEDIMENTARY ENVIRONMENTS 54
3.7 SUBSURFACE GEOLOGICAL SEQUENCES AND 55 STRUCTURES RECOGNISED IN DRILL HOLES
3.8 GEOLOGY AND SEDIMENTARY STRUCTURE 55
3.8.1 UPPER ILLAWARRA COAL MEASURES 55
3.8.2 COAL CLIFF SANDSTONE 56
3.8.3 WOMBARRA SHALE 56
3.8.4 SCARBOROUGH SANDSTONE 57
3.8.5 STANWELL PARK CLAYSTONE 58
3.8.6 BULGO SANDSTONE 58
3.9 DISCUSSION 59
CHAPTER 4 PETROLOGY OF NARRABEEN GROUP SANDSTONE
4.1 INTRODUCTION 63
4.2 STUDY METHODS 63
3 MINERAL COMPOSITION 64
4.3.1 QUARTZ 64
4.3.2 FELDSPAR 65
4.3.3 ROCK FRAGMENTS 66
4.3.4 CHERT 66
4.3.5 MICA 66
4.3.6 ACCESSORY MINERALS 67
4.3.7 IRON OXIDES 67
4.3.8 CARBONATE 67
4.3.9 KAOLINITE 68
4.3.10 CLAY MATRIX 68
4.3.11 CEMENT 69
4.3.12 POROSITY 69
4.3.13 TEXTURE OF SANDSTONES 70
4.3.14 CLASSIFICATION OF SANDSTONE 70
4.4 PETROLOGICAL AND MINERALOGICAL ASPECTS 71 OF WEATHERING
4.5 MINERAL IDENTIFICATION USING X-RAY 74 DIFFRACTION
4.5.1 INTRODUCTION 74
4.5.2 AIM OF STUDY 74
4.5.3 METHOD OF STUDY 75
4.5.3.1 Sample Collection 75
4.5.3.3 Whole Rock Analysis 75
4.5.3.4 Clay Mineral Analysis 77
4.5.3.5 Normal or Untreated samples 7g
4.5.3.6 Glycolation 7g
4.5.3.7 Heated Samples 79
4.6 RESULT OF X-RAY ANALYSIS 79
4.6.1 KAOLINITE 80
4.6.2 ILLITE 80
4.6.3 SMECTITE (MONTMORILLONITE) 81
4.6.4 MIXED - LAYER CLAYS 81
4.7 MUD ROCKS AND SANDSTONES 81
4.8 TALUS 83
4.8.1 COMPOSITION 83
4.9 INTERPRETATION OF THESE RESULTS 84
4.10 CLAY MINERAL STRUCTURE AND SLOPE 84 STABILITY
4.11 DISCUSSION 85
4.12 RELATIONSHIP BETWEEN PETROLOGY, SOURCE 88 AND SLOPE STABILITY
CHAPTER 5 STRUCTURAL GEOLOGY IN THE SLIP AREA
5.1 INTRODUCTION 91
5.2 STRUCTURAL FACTORS WHICH ARE IMPORTANT 91 IN SLOPE STABILITY
5.3 FAULTS IN THE SLIP AREA 94
5.3.1 HARBOUR FAULT 95
5.3.2 JETTY FAULT 95
5.3.3 CLIFTON FAULT 96
5.3.4 SCARBOROUGH FAULT 96
5.4 JOINTS IN THE SLIP AREA 96
5.4.1 JOINTS IN COAL 97
5.4.2 JOINTS IN THE NARRABEEN GROUP AND 98 HAWKESBURY SANDSTONE
5.5 THE IMPORTANCE OF FAULTS AND OTHER THROUGH-GOING GEOLOGIC STRUCTURES
101
5.6 JOINTING AND TECTONIC FRACTURING OF ROCK 102
5.6.1 BEDDING 103
5.7 THE RELATIONSHD? BETWEEN JOINTS AND THE 104 ORIENTATION OF CLIFF FACE
5.7.1 STRESS RELIEF 104
5.8 THE RELATIONSHIP BETWEEN JOINTS AND 106 RATES OF EROSION OF STRATIGRAPHIC UNITS IN DIFFERENT TYPES OF EXPOSURES
5.8.1 DIFFERENTIAL EROSION 107
5.9 SUMMARY AND CONCLUSION 110
CHAPTER 6 REVIEW OF THE ROLE OF GROUNDWATER, RAINFALL,
HYDROGEOLOGY AND EARTHQUAKES
6.1 GROUNDWATER 115
6.2 INTRINSIC PROPERTIES 115
6.2.1 POROSITY 116
6.2.2 PERMEABILITY 116
6.2.3 RELATIONSHIP BETWEEN POROSITY AND 117 PERMEABILITY
6.2.4 FRACTURE (SECONDARY) PERMEABILITY 117
6.3 POREWATER PRESSURE 118
6.4 CHANGES IN WATER CONTENT 119
6.5 EFFECTS OF SOLUTION 120
6.6 GROUNDWATER FLOW IN SLOPE STABILITY 120 PROBLEMS
6.7 SLOPES COVERED WITH LANDSLIDE DEBRIS 121
6.8 HIGH WATER PRESSURES IN THE ESCARPMENT 122
6.9 SPECIAL EFFECTS OF FAULTS ON THE 123 HYDROGEOLOGY OF SLOPES
6.10 HYDROGEOLOGICAL ASPECTS OF THE ESCARPMENT IN THE STUDY AREA
124
6.11 RAINFALL AND ITS RELATIONSHIP TO 127 HYDROGEOLOGY
6.12 RAINFALL AND ITS RELATIONSHIP TO LAND 128 MOVEMENTS
6.12.1 THE CONCEPT OF THRESHOLDS 130
6.13 GROUNDWATER AND ITS RELATIONSHIP TO 131 LAND MOVEMENTS
6.14 SUMMARY AND CONCLUSION 132
6.15 EARTHQUAKES 135
6.15.1 EARTHQUAKES IN THE STUDY AREA 136
6.15.2 SECONDARY EFFECTS OF EARTHQUAKES 137
6.15.3 INTERPRETATION AND EFFECTS OF 137 EARTHQUAKES AND STRESS ENVIRONMENT
CHAPTER 7 ENGINEERING GEOLOGY
7.1 ENGINEERING PROPERTIES OF ROCKS IN THE 139 LOWER NARRABEEN GROUP
7.2 WEATHERING 140
7.2.1 ENVIRONMENTAL FACTORS CONTROLLING 140 ROCK WEATHERING
7.2.2 MINERAL HYDRATION 141
7.2.3 MINERAL SOLUTION 142
7.2.4 PROCESSES AND MECHANISMS OF WEATHERING 143 IN THE STUDY AREA
7.2.5 WEATHERING, STRENGTH AND LANDSLIDES 148
7.3 SLAKE DURABILITY TEST 149
7.3.1 INTRODUCTION 149
7.3.2 SLAKE DURABILITY 151
7.3.3 AIM OF STUDY 152
7.3.4 METHOD OF STUDY 152
7.3.4.1 Sample Collection 152
7.3.4.2 Sample Preparation 153
7.3.4.3 Procedure 153
7.3.4.4 Calculations 154
7.3.5 RESULTS 154
7.3.6 SLAKE DURABILITY CLASSIFICATION 156
7.3.7 STATIC (LONG-TERM) DURABILITY TESTING 156
7.3.8 CONCLUSIONS 157
7.4 POINT LOAD STRENGTH TEST 160
7.4.1 INTRODUCTION 160
7.4.2 THE AIM OF STUDY 161
7.4.3 METHOD OF STUDY 161
7.4.3.1 Sample Collection and Preparation 161
7.4.5 DIAMETRAL TESTS 162
7.4.6 AXIAL TESTS 162
7.4.7 IRREGULAR LUMP TESTS 162
7.4.8 CALCULATIONS 163
7.4.9 RESULTS 164
7.4.10 RELATIONSHIP BETWEEN POINT LOAD 165 STRENGTH INDEX AND UNIAXIAL COMPRESSIVE STRENGTH
7.4.11 CONCLUSIONS 166
7.4.12 RELATIONSHIP BETWEEN UNIAXIAL 167 COMPRESSIVE STRENGTH (UCS) AND SLAKE DURABILITY INDEX (SDI)
7.5 ROCK COMPOSITION IN RELATION TO 168 MECHANICAL PROPERTIES
7.5.1 ROCK COMPOSITION AND STRENGTH 168
7.5.2 ROCK COMPOSITION AND SLAKE DURABILITY 169
7.5.3 RELATIONSHIPS BETWEEN SLAKE DURABILITY, 172 ROCK STRENGTH AND WEATHERING IN RELATION TO ROCK SLOPE AND TALUS FAILURE ALONG THE NORTHERN ILLAWARRA COASTLINE
CHAPTER 8 SLOPE STABILITY IN THE NORTHERN ILLAWARRA
8.1 INTRODUCTION 177
8.2 SLOPE DEVELOPMENT PROCESS 178
8.3 RELATIVE IMPORTANCE OF OTHER 180 GEOLOGICAL FACTORS FOR SLOPE FAILURES ALONG THE ILLAWARRA COASTLINE
8.4 ENGINEERING GEOLOGIC FAILURE MODELS FOR 182 SLOPE INSTABILITY ALONG THE NORTHERN ILLAWARRA COASTLINE
8.5 TYPES OF SLOPE INSTABILITY 184
8.5.1 ROCKFALLS AND TOPPLING 184
8.5.2 SHALLOW DEBRIS SLIDES 185
8.5.3 DEBRIS FLOWS 185
8.5.4 DEEP-SEATED SLUMP-EARTH FLOWS 185
8.5.5 CREEP 186
8.6 FAILURE OF TALUS SLOPES 186
8.6.1 INTRODUCTION 186
8.6.2 ORIGIN OF THE TALUS 187
8.6.3 PARENT MATERIAL OF TALUS 187
8.6.4 CLAY MINERAL ANALYSES 188
8.6.5 GEOTECHNICAL PROPERTIES OF TALUS 189
8.6.6 TEST RESULTS 190
8.6.6.1 Strength Characteristics of the Talus Matrix 190
8.6.6.2 Correlation of Engineering Indices and Properties 191
8.6.7 CONCLUSION 193
8.7 CASE STUDIES 195
8.7.1 SITE 1 CLIFTON EARTH SLUMP 196
8.7.1.1 Location 196
8.7.1.2 Geology 196
8.7.1.3 Description of the slump 197

8.7.1.4 Geotechnical properties of the talus 198
8.7.1.5 Conclusions 198
8.7.2 SITE 2 MORONGA PARK SLUMP-EARTH FLOW 199
8.7.2.1 Location 199
8.7.2.2 Geology 199
8.7.2.3 Description of the slump-earth flow 200
8.7.2.4 Geotechnical properties of the talus 201
8.7.2.5 Conclusions 202
8.7.3 SITE 3 SOUTHERN AMPHITHEATRE COMPLEX 203 LANDSLIDE (GRABEN A)
8.7.3.1 Introduction 203
8.7.3.2 Location 203
8.7.3.3 Geology 203
8.7.3.4 Description of the slide 205
8.7.4 SITE 4 NORTHERN AMPHITHEATRE COMPLEX 206 LANDSLIDE (GRABEN B)
8.7.4.1 Location 206
8.7.4.2 Geology 206
8.7.4.3 Description of the slide 206
8.7.4.4 Conclusion 208
8.7.5 SITE 5 JETTY ROCK SLUMP 210
8.7.5.1 Location 210
8.7.5.2 Geology 210
8.7.5.3 Description of rock slump 211
8.7.5.4 Geotechnical properties of the talus 211
8.7.5.5 Conclusion 212
8.7.6 SITE 6 HARBOUR SLUMP 212
8.7.6.1 Location 212
8.7.6.2 Geology 212
8.7.6.3 Description of the slump 213
8.7.6.4 Geotechnical properties of the talus 213
8.7.6.5 Conclusion 214
8.7.7 SITE 7 COALCLIFF SLUMP 214
8.7.7.1 Location 214
8.7.7.2 Geology 214
8.7.7.3 Description of the slump 215
8.7.7.4 Geotechnical properties of the talus and Stanwell Park 215 Claystone
8.7.7.5 Conclusion 217
8.8 SURFACE SURVEY RESULTS 217
8.9 FAILURE OF ROCK 218
8.9.1 INTRODUCTION 218
8.9.2 MECHANICS OF ROCK FAILURES 219
8.9.3 EFFECTS OF WEATHERING AND JOINTING 220
8.9.4 CREEP 222
8.9.5 ROCKFALL AND TOPPLING ALONG THE 223 LAWRENCE HARGRAVE DRIVE
8.9.6 ROCKFALLS AND TOPPLING ALONG THE 224 COASTLINE
8.9.7 CONCLUSIONS 224
8.10 TREATMENT, STABILISATION AND PREVENTION 226
CHAPTER 9 SUMMARY AND CONCLUSIONS
9.1 INTRODUCTION 231
9.2 STRATIGRAPHY 232
9.3 PETROLOGY 232
9.4 STRUCTURE 233
WATER 234

9.6 GEOTECHNICAL PROPERTIES OF ROCK AND 234 TALUS
9.7 SLOPE DEVELOPMENT PROCESS 235
9.8 REMEDIAL WORKS 237
9.9 CONCLUSIONS 238
REFERENCES 241
FIGURES
FIGURES TO CHAPTER 1
FIGURES TO CHAPTER 2
FIGURES TO CHAPTER 3
FIGURES TO CHAPTER 4
FIGURES TO CHAPTER 5
FIGURES TO CHAPTER 6
FIGURES TO CHAPTER 7
FIGURES TO CHAPTER 8
FIGURE 1.1 - FIGURE 1.12
FIGURE 2.1 - FIGURE 2.12
FIGURE 3.1 - FIGURE 3.23
FIGURE 4.1 - FIGURE 4.16
FIGURE 5.1 - FIGURE 5.25
FIGURE 6.1 - FIGURE 6.15
FIGURE 7.1 - FIGURE 7.33
FIGURE 8.1 - FIGURE 8.55
TABLES
TABLES TO CHAPTERS 1-3 TABLE 1.1 - TABLE 3.1
TABLES TO CHAPTER 4 TABLE 4.1 - TABLE 4.25
TABLES TO CHAPTERS 5-6 TABLE 5.1 - TABLE 6.1
TABLES TO CHAPTER 7 TABLE 7.1 - TABLE 7.29
TABLES TO CHAPTER 8 TABLE 8.1 - TABLE 8.3
APPENDICES
APPENDIX TO CHAPTER 7 TABLE 1 - TABLE 16
APPENDIX TO CHAPTER 8
APPENDIX - SAMPLE LOCATIONS
EXAMPLES OF SHEAR TEST
GLOSSARY
CHAPTER 1
INTRODUCTION
1.1 INTRODUCTION
It is commonly accepted that geological understanding can provide the basis for
predicting slope stability in any area, and considerable research effort has been directed
towards understanding and quantifying the influence of geological factors such as
structure, stratigraphy, sedimentology, petrography, weathering, groundwater,
geomorphology and earthquakes on slope stability (Guadogno et aL, 1994; Cascini et
al, 1994).
Many types of slope movement and landslides occur in residual soils, talus and
colluvium. A proper understanding of these landslides also requires an understanding
of geological processes, local geological details and the role of geological discontinuities.
Of all the geologic factors influencing the stability of rock slopes, there is little doubt
that joints, bedding planes, faults and shear zones, and intersections of such structures,
are the most significant. Chemical alteration of the surrounding rock and presence of
clay gouge are also commonly associated with fault and shear zones. The presence of
clay gouge adjacent to the polished or smooth rock surfaces of faults is often associated
with the unusually low shear strength for soil-rock surfaces.
Stratigraphy is the basis for most rock slope design procedures (Philbrick, 1960).
Therefore, one of the first steps in the investigation of a slope should be the
determination of the stratigraphy of the area. Particular attention should be directed
towards recognition and description of thick sequences of weak rocks (claystone,
siltstone and shale) that are very important in slope development, and have a notoriously
high landslide potential (Kelley, 1971; Winters, 1972). They may have also contributed
to deep-seated ancient landsliding. Thin marker beds, such as fossiliferous and non-
fossiliferous limestone, coal and clay seams, and carbonaceous shale are extremely i
important in determining the extent of previous landsliding. Coal seams commonly act
2
as aquifers and their underclays (claystone) often contribute to failure surface
development in colluvial slopes. For example, coal beds in both the Newcastle and
Illawarra Coal Measures commonly act as aquifers, with claystone beds acting as
aquitards. Landsliding is usually related to the presence of the aquifers which are a
source of high pore water pressures. The shear strength along any potential surface of
sliding decreases as the pore water pressure increases.
The distribution and properties of rocks in an area is largely controlled by conditions
at the time of their original deposition. Depositional environments in the Illawarra
region range from fluvial to deltaic, intertidal facies, marginal marine and marine. Each
environment has a characteristic association of sedimentary facies with a specific range
of properties, and this stratigraphy affects slope stability in each area.
Another geological factor affecting slope stability is petrography; percentages of the
principal rock-forming minerals and cements provide a key index to mechanical
performance. Quartz percentage is an important characteristic of sedimentary rocks,
particularly of siltstone and shale, and is an indicator of their strength and abrasiveness.
The total clay content, and at least the approximate percentage of clay mineral types,
are useful indicators of the potentially plastic and swelling behaviour of shale (Franklin
and Dusseault, 1989). The engineering behaviour and especially the residual strength
of colluvium derived from argillaceous rocks also depends on its (original and
weathered) petrography (Hamel, 1980).
Weathering, both mechanical and chemical, gradually disturbs the cohesion of rocks.
In many landslide events, chemical alterations, such as hydration and ion exchange in
clays, are thought to have contributed to the triggering of landslides (Zaruba and
Mencel, 1969).
Geomorphology is concerned with the nature and origin of landforms and the study of
processes of landform development. Geomorphological information is useful in
3
understanding the complex phenomena and many interacting factors which control
landform evolution and shape, and its relationship to slope behaviour.
Regional and local groundwater conditions are often very critical to slope stability.
Slope failures are often associated with high groundwater levels following prolonged or
intense rainfall. The influence of groundwater on stability can operate in two ways:
(1) excessive seepage; and
(2) excessive pore water pressure.
If the rock mass is very tight, or if the soil mass is impermeable, water pressure can
exist when groundwater seepage is low. Alternatively, if abundant water is available
and the rock mass is open or the soil mass is permeable, then substantial seepage of
water can occur under quite low hydrostatic pressure.
The manner in which water pressure enters into the consideration of stability is made
clear by an understanding of the concept of effective stress. Water pressure reduces the
normal effective stress resulting in shear strength decrease; consequently draining a rock
or soil mass will reduce the water pressure and increase the shear strength.
Almost every earthquake in mountainous country, strong enough to be reported in the
literature, has caused at least some landslide and/or rock fall. Unless these slides or
falls damage structures or seriously block transportation, they often go unreported. For
example, in northeastern Honshu (Japan), an earthquake in 1978 (magnitude 7.4) caused
thousands of slides, most of them less than 10 cubic metres in volume, but some big
rockfall occurred as well.
1.2 AIMS
Comprehensive evaluation of the geological aspects of slope stability in the area
between Coalcliff and Clifton (Fig. 1.4) is the primary and main objective of the
work reported in this thesis. Therefore, in accordance with the approved
programme, about 90 percent of the total research effort has been devoted to the
4
first two of the following four aims. The remaining 10 percent of total research
effort has been devoted to the third and fourth aims in the list.
The four aims, with relative weighting shown in parentheses at the end of each aim, are
as follows.
Maior Aims
(1) To conduct a literature review on the mechanisms of landslides and factors
affecting slope stability. In particular, the influence of geological factors, such as
stratigraphy, petrography, structure, weathering and groundwater, which cause talus
failure and rock failure (toppling and rockfall), is to be investigated. (20 percent
of work)
(2) To test and develop an understanding of the effects of weathering and slaking on
mechanical and mineralogical properties of fresh and weathered rocks in the
Narrabeen Group between Coalcliff and Clifton, and to discuss the implications
of these processes on slope stability. (70 percent of work)
Minor Aims
(3) To determine the role of geotechnical properties of talus which control the stability
of slopes at shallow depths within talus. The third aim includes an integration of
currently available and new data from talus deposits in the Northern Illawarra with
the previously defined geological constrains provided in the second aim. It should
be noted that facilities and funds were not available to carry out appropriate
drilling necessary for any new stability analyses. Therefore, work concerning
properties of talus was a relatively minor aim of the thesis. (8 percent of work)
(4) To briefly review remedial measures that could alleviate the problem of land
instability in the Illawarra region, and to identify the relevance of the obtained
geological data in defining future directions for research. (2 percent of work)
Geotechnical stability analyses were outside the scope of the thesis due to the lack of
funding to carry out a significant amount of expensive drilling in very steep and
5
inaccessible terrain in the northern Illawarra region. Moreover, preparation of
engineering geological maps or stability maps was also outside the scope of this thesis.
Such maps are being developed for associated doctoral programme at the University of
Wollongong using a Geographical Information System (GIS) package (Flentje, 1996).
1.3 ILLAWARRA REGION
In New South Wales, four main regions of landsliding have been identified: Illawarra,
Campbelltown-Picton, Gosford-Wyong (south, southwest and north of the Sydney,
respectively) and Lismore (Fig. 1.1). The Illawarra is located in the Greater
Wollongong area, as shown in (Figs 1.2 and 1.3). The specific area chosen for study
is between Coledale and Coalcliff as illustrated in (Fig. 1.4). The Greater Wollongong
area has long been recognised as a region of major landslide activity (e.g Hanlon, 1952,
1953, 1958; Walker, 1960; Bowman, 1972; Chowdhury, 1976; Young, 1977, 1978).
This activity is directly related to the geology, geological history and geomorphology
of the area.
The 300 m high escarpment consists of flat-lying Permo-Triassic volcaniclastic coal
measures plus fluviatile sequences capped by a well cemented quartz sandstone (Fig.
1.5). Flat-lying interbedded strong and weak sedimentary rocks in the Illawarra region
have been acted upon by erosion, stress relief, weathering, creeping and sliding
processes to produce masses of marginally stable colluvial soil and zones of potentially
unstable rock masses on many of the steep hillsides that are common to the area.
The traditional modes of failure, namely plane failure, wedge failure and rotational
failure often occur, and the type of failure is related to the rock structure and
weathering which play an important role (Fig. 1.6). Toppling failures, rockfalls and
failures of talus or colluvium have occurred in the past and continue to occur now on
moderate to steep slopes in the Illawarra area. Many of the rock slopes are relatively

6
simple in their form and shape. In the vast majority of places the bedding is nearly
horizontal and jointing in the rock is approximately vertical.
Slope stability evaluations in the Illawarra area are interdisciplinary geotechnical
endeavours requiring concepts from engineering geology, soil mechanics and rock
mechanics. Of these disciplines, engineering geology is probably the most important.
Reliable evaluations of slope stability must begin with an understanding of regional and
site geology and the geologic processes which formed the site and continue to act upon
it. Once this level of geologic understanding is reached, slope behaviour can often be
assessed on the basis of judgement aided by simple analyses, experience and precedence.
Where detailed stability analyses are required, the above-mentioned geologic
understanding is mandatory for development of appropriate geotechnical models.
Many instability problems in this area relate to failures of talus or colluvium, which is
derived from older failures on the escarpment. Studies concerned with this type of
slope stability, also need to deal with failure of the escarpment and characteristics of
materials which affect these failures. These materials range from fresh to completely
weathered claystone and sandstone.
This thesis has focused on the talus and rock slopes, and an understanding of the
engineering geological features of the area. However, considerably more attention must
be paid to the environmental geology of Illawarra (including weathering, excavation,
drainage, storms and rainfall intensity) because these aspect need comprehensive
understanding for improved assessment of the problems associated with various types
of mass movement.
1.4 PREVIOUS WORK
Experience in the Illawarra area has shown that slope instability is an old problem that
can be worsened by disturbance and development (Fig. 1.1). Moreover, slope instability
has had disastrous effects on urban area as well as road and rail routes. As long ago
7
as 1890, W . Shellshear published a paper entitled "on treatment of slip on the Illawarra
railway at Stanwell Park ". This was at the time when the railway line occupied the
position of the present main road (Lawrence Hargrave Drive).
Hanlon (1952, 1953, 1958) discussed in some detail the causes of rock failures in the
Wollongong area and suggested various remedial measures. Hanlon's studies focussed
on the role of lithology and structure in determining the stability of escarpment slopes.
Walker (1960) mapped soils "developed on debris avalanche deposits" in a continuous
zone right along the escarpment from Wollongong to Nowra. Since then, many authors
have continued to research the problems. B o w m a n (1972) made a thorough descriptive
investigation of the natural slope stability in the Greater Wollongong area and although
he was mainly concerned with slope stability in relation to the residential subdivisions,
he highlighted the importance of water and jointing in relation to the stability of the
escarpment. Young (1976) studied talus-mantled deposits, which she referred to as
'taluvium'. She also mentioned the escarpment evolution and assessed the influence of
local climatic variation on slope stability near Wollongong (1977, 1978). Chowdhury
(1976) highlighted the importance of the mechanism of progressive slope failures based
on the decrease in shear strength due to weathering and stress release. Evans (1978)
studied "time dependent factors influencing the rock slope stability of the Illawarra
escarpment". His work was concerned with weathering and creep, but he also described
a differential settlement mechanism which involves stress relaxation in the basal softer
rock (claystone) in relation to secondary toppling rock failures on the Illawarra
escarpment (Evans 1981). Chestnut (1981) mapped the Wollongong-Port Hacking area
with an emphasis on engineering geology and environmental geological hazards. Walker
et al. (1987) presented some of the results of a geotechnical study of the Coledale area
which is located on the Illawarra escarpment about 17 k m north of Wollongong.
More recently Hutton et al. (1990) studied the landslide activity after the heavy rains
of April 1988 in the Coalcliff area of the northern Illawarra. They briefly described

8
landslides that have been prominent during the last few years along Lawrence Hargrave
Drive between Clifton and Coalcliff (Fig. 1.4). This section of Lawrence Hargrave
Drive has a history of slippage, rock falls and mud-slips. The area is geologically
unstable and is particularly vulnerable during periods of heavy rain.
During 1988 the road was closed between Clifton and Coalcliff on 30 April following
major rock falls, mud-slides and subsidence. The restoration work was carried out by
the Road and Traffic Authority (RTA) at a cost of $4.8 M and the road re-opened on
15 November. The majority of restoration work was in the Coalcliff area but some
repairs were also carried out on the "Clifton Fault" where further problems have now
been encountered.
1.5 STUDY METHODS
The present study has concentrated on geological factors affecting slope stability and a
literature review of general problems of, and strategies for, assessing slope stability.
Field work has concentrated on the mapping and investigation of landslides and rock
failures with the particular aim of gaining an understanding of the engineering geological
features of the area between Clifton and Coalcliff. This study consists of an assessment
of the following factors.
(1) Previous studies of slope stability and engineering properties of rock sequences in
the Scarborough-Stanwell Park area.
(2) Geology of the upper Illawarra Coal Measures and lower Narrabeen Group in the
Scarborough-Stanwell Park area. This includes outcrop characterisation, the
thickness of sedimentary units, types of lithology, types of bedding, bedding
sequences and sedimentary structures.
(3) Structural geology in the slip area including the nature, size and orientation of
faults and faults planes; and the relationship between fault planes, weathering and
geomorphology; the nature, spacing type, regularity and orientation of joints in the
9
sandstone and shale units. The relationship between joints and orientations of cliff
faces and rates of erosion of stratigraphic units in different type of exposures is
also considered.
(4) Permeability of the various rock units for predicting groundwater movement based
on observation of surface seepage. The relationship between predicted groundwater
movement and the structural and stratigraphic features was also considered.
(5) Petrology of coarse- and fine-grained sandstone and the intervening shales in fresh
drill hole samples. Petrology of the same units in outcrop samples to determine
the effects of surface weathering. Petrology of talus material, with special
reference to material in slip zones. Scanning Electron Microscope (SEM) studies
of clays and cements occurring in joints and on slip planes have been carried
out.
(6) Detection of slip surfaces, water table level and lithological boundaries for
assessing the possible effects of fault activity and earthquake shaking.
(7) Rock strength and durability - comparison of fresh, weathered and talus material.
The relationship between engineering test results and penological characteristics
of each unit.
(8) Soil instability, including case examples of slips in the area.
(9) Rock instability in the Narrabeen Group, including case example of rockfall and
toppling in the area.
(10) Predicted rates of weathering based on petrography.
(11) Predicted controls on land stability - fall and slip.
(12) Preventative measures that can be used to minimise rockfalls, toppling and slips
affecting the road between Clifton and Stanwell Park.
(13) preventive measures that can be used to minimise slippage of talus deposits in the
area.

10
1.6 MASS MOVEMENT
The study of mass movement, especially landslides, encompasses over one hundred years
of specialist work. During that time understanding the form and processes governing
these displacements of material has increased considerably. As the gaps in our
knowledge are filled, so the variety and complexity of moving soils and rocks becomes
more obvious.
The term mass movement is used here as a general term to include falls, topples, slides,
flows and or slumps along distinct slide planes or zones of sliding. Gravity is the
principal driving force; the movement is directed down and out, and the displaced
material may include soil (regolith), bedrock and or artificial fills. The term, as used
here, includes rockfalls, topples and debris flows which involve little or no true sliding
on a slide surface (Hansen, 1984).
Consideration of soil creep, which occurs without a well defined failure surface, is
excluded from this thesis. Creep is taken to refer to mass movements at rate of less
than about 0.06 m/y (Varnes, 1978). Many landslides creep before readily observed
movement occurs.
1.6.1 LANDSLIDE TERMINOLOGY
The terminology used to describe landslides is defined in Figure 1.7. The definitions
largely follow those of Varnes (1978).
1.6.2 TYPE OF MASS MOVEMENT
Landslide classification has been based on:
(1) the shape of the slide surface (landslide morphology);
(2) the mode of movement;
(3) the rate of movement;
11
(4) the type of material involved;
(5) the age of material;
(6) the age of failure; and
(7) various combinations of the above.
Many classifications of landslides and discussions of mechanisms of failure have been
reported in the literature, e.g. Sharp (1938), Terzaghi (1950), Skempton (1953, 1964),
Varnes (1958, 1978), Selby (1967), Hutchinson (1968, 1988), Skempton and Hutchinson
(1969), Zaruba and Mencel (1969), Blong (1973), East (1978), Chowdhury (1980),
Crozier (1986) and Vaunat et al. (1994).
This section considers aspects of only a few classification schemes. In a computer-
based study of landslide morphology, Blong (1973) concluded with a very simple and
useful classification whereby the primary divisions recognised were slide, rotational slide,
flow and fall (Fig. 1.8).
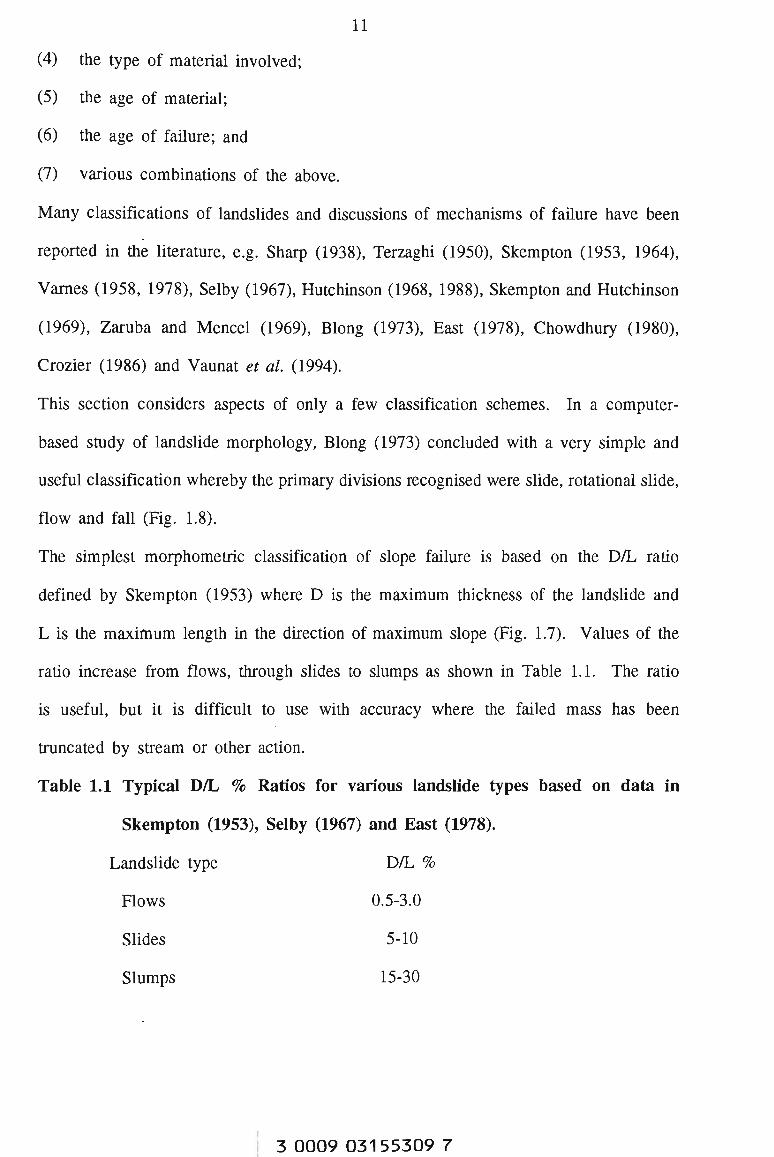
The simplest morphometric classification of slope failure is based on the D/L ratio
defined by Skempton (1953) where D is the maximum thickness of the landslide and
L is the maximum length in the direction of maximum slope (Fig. 1.7). Values of the
ratio increase from flows, through slides to slumps as shown in Table 1.1. The ratio
is useful, but it is difficult to use with accuracy where the failed mass has been
truncated by stream or other action.
Table 1.1 Typical D/L % Ratios for various landslide types based on data in
Skempton (1953), Selby (1967) and East (1978).
Landslide type D/L %
Flows 0.5-3.0
Slides 5-10
Slumps 15-30
3 0009 03155309 7

12
Chowdhury (1980) classified slides according to their causes:
(1) landslides arising from exceptional causes such as earthquakes, exceptionally high
precipitation, severe flooding, accelerated erosion from wave action, and
liquefaction;
(2) ordinary landslides, or landslides resulting from known or usual causes which can
be explained by traditional theories; and
(3) landslides which occur without any apparent cause. Although all of the above
classification schemes are simple and useful they are not widely used, and it is
often necessary to refer descriptions of slope failures to a more detailed
classification.
Varnes' classification (1978) is very useful for many research relationships on slope
stability. The basic types of slope movement in the classification are summarised in
Figure 1.9. An important reason for the acceptability of Varnes' classification was the
presentation of a set of three-dimensional diagrams such as those reproduced in Figure
1.10. Varnes recognised six principle types of mass movement:
(1) Falls
Falls are slope movements on steep slopes where a discrete mass of material, regardless
of size, is detached and moves downslope by travelling through the air, bouncing, or
rolling. More detailed classifications of falls are based on the type of material. Rock
falls involve bedrock, while debris falls involve coarse-grained fragments, and earth
falls involve fine-grained aggregates of material.
(2) Topples
Topples occur when a tensile failure in the rock mass causes it to rotate about a point
below its centre of gravity. These types of movement usually occur on steep slopes and
may terminate as a fall or slide, depending on the geometry of the slope below the
point of rotation. Topples can occur in any cohesive material and may range in size
13
from very small to extremely large. The size of the mass that topples is controlled by
the substance and mass characteristics of the topple material.
(3) Slides
Slide movement is either rotational or translational. Rotational slides occur in earth
materials when the strength of the slide material is nearly equal to the strength along
discontinuities in the rock or soil mass. Rotational slides commonly appear as slumps
of material along slopes, road cuts and fills. Translational slides occur along planar or
gently undulating failure surfaces. These types of slides usually occur in earth materials
where the strength of the slide material is greater than the shear strength along
discontinuities in the rock or soil mass.
(4) Spreads
In spreads the sense of movement is nearly horizontal, and the earth material fails both
by shear along a failure surface, and by tension or extension along one or more nearly
vertical surfaces. This type of movement requires that some underlying geologic unit
fails and moves outward, carrying the overlying materials. The stability of the slope
is controlled by the geologic units at the site and by the loading conditions.
(5) Flows
Flows are slope movements in which the mechanical properties of the slope material
behave as a plastic body, viscous fluid or true fluid. In bedrock, these include spatially
continuous deformations, and deep creep involving extremely slow and generally non-
accelerating differential movements along relatively intact units. In soil, movement
occurs within a displaced mass, whereby the form or apparent distribution of velocities
resemble that of a viscous fluid.
(6) Complex slides
Landslides m a y exhibit a combination of two or more of the five principal types of
movement listed above.
14
Varnes (1978) also defined another useful term: multiple movements are those in which
repeated failure of the same style occur one after the other (Fig. l.lOe).
1.6.3 FACTORS CAUSING MASS MOVEMENTS
It is important to recognise the conditions that cause a slope to become unstable and
the factors that trigger the movement. An early recognition of some of the
environmental influences on slope stability was made by Terzaghi (1950) who listed
external changes which increased shearing stress, and internal changes which decreased
shearing resistance. Rainfall and earthquakes were recognised as contributing to slope
failure. A modified version of Terzaghi's work is presented in Table 1.2.
Zaruba and Mencel (1969) elaborated upon this as follows: "preventive treatment of a
landslide or an area susceptible to sliding must be based on a detailed, integrated
geological investigation. It is necessary to study the geological structure of the area,
the petrographical and physical properties of rocks, and the hydrogeological conditions.
As the form of a slope is the end product of geological processes of the past, the
morphological history of the slope must also be understood". These statements certainly
apply to the Illawarra area where, as indicated previously, marginally stable or unstable
colluvial masses exist on many slopes.
General procedures for engineering geological investigations of slopes have been outlined
in numerous references and will not be reviewed here. Procedures described by
Dearman and Fookes (1974), Deere and Patton (1971), Patton and Hendron (1974) and
Bhandari and Thayalan (1994) are particularly applicable to the Illawarra area. This
section attempts to explain the relationships between landslide occurrence and
environmental and geological factors.
(1) Relationship between slope movement and precipitation
Rainfall is generally accepted as one of the chief factors controlling the frequency of
landslides. The magnitude of its influence depends on climatic conditions (such as the
15
distribution of precipitation and changes in temperatures), topography of the area, the
geological structure of slopes, and the permeability and other properties of rocks and
soils.
(2) Slope
Usually, landsliding will occur more readily on steep slopes. While reality is more
complicated than this, it is often possible to determine lower limits (thresholds) of slope
below which landslides are unlikely to occur. But care must be taken in transfering
information about threshold slopes even to an adjacent area. For example, Dunkerley's
(1976) work at Razorback, south of Sydney, indicates that for this area of Wianamatta
Shale with numerous landslides, the threshold angle for earthflows is 11 degrees. While
at West Pennant Hills where the parent materials are also Wianamatta Shales, landslides
occur on slopes as gentle as 6 degrees (Fell, 1985).
(3) Slope shape
Slope shape both across the slope and down the slope may affect landslide location.
Slope shape in a downslope direction may be a reflection of slope steepness. One study
that examined landslide-slope shape relationships (Waltz, 1971) indicated for the San
Fransisco Bay area that landslides were commonly located on sites that are relatively
convex in both downslope and across slope direction.
(4) Stratigraphy
The stratigraphy at a particular site has a major influence on the slope stability.
Therefore, one of the first steps in the investigation of a slope should be the
determination of the stratigraphy of the area. Details of stratigraphy should be
determined to a degree commensurate with engineering requirements of the region.
In stratigraphic studies, particular attention should be directed toward recognition and
description of thick sequences of weak rocks such as claystones, thin marker beds such
as coal and clay seams, carbonaceous shales and old failure surfaces or shear zones.
16
Coal seams require special emphasis. They commonly act as aquifers and their
underclays often contribute to failure surface development in colluvial slopes.
(5) Structural geologic factors
Two main groups of geologic factors distinguish slope stability problems in soil from
those of rock. One group of geologic factors is related to the structural defects found
in rock masses and the special strength problems that result, whereas the other group
is related to special groundwater conditions which are more commonly associated with
rock masses than with soil. The critical groundwater conditions are often a direct
consequence of the presence of structural defects. In general, rock masses are best
considered as possessing anisotropic strength, permeability and deformability
characteristics to a much greater and more significant degree than soils.
The presence, continuity, spacing, orientation and nature of joints and bedding in the
weathered rock beneath the soil will in many cases be the dominant control over
landsliding. Shear zones and faults can also have a major effect on hydrological
conditions since they act as aquifers or aquitards depending on particular circumstances.
A search for faults or shear zones having low shear strengths due to previous
displacements is very important. The search is aided by the knowledge that faults or
shear zones are characteristically associated with particular geologic environments.
These consist of: (a) joints and faults subparallel to, or in secondary or conjugate
alignment to, regional faults; and (b) bedding plane faults and joints in shales where
they are interbedded with other rock types. Item (b) above is particularly common in
folded or inclined sediments adjacent to thick layers of a relatively less deformable rock
such as sandstone.
(6) Hydrogeological factors
Water pressure within a rock mass acts perpendicular to the surfaces of the
discontinuities. When there are many joint sets with different orientations and when the
joint spacing is small, the water pressure within the rock mass can be treated in a
17
similar model to that used for soil slopes. However, when the distribution of joint
orientations is anisotropic, and when the spacing between joints is increased, many
unusual distributions of water pressure can result. In rock masses it is possible to have
the water pressure, and hence the corresponding disturbing force, change appreciably
from one joint to the next. As shown in (Fig. 1.11) the water level is much lower in
joint a-a than in joint b-b. As a result, the magnitude of the force Pb due to the
hydrostatic pressure along joint b-b is several times the force Pa acting normal to joint
a-a. Groundwater fluctuations affect slope stability in both rock and soil slopes.
Groundwater levels are likely to fluctuate much more in rock slopes than in many soil
slopes due to the smaller percentage of void space in rocks and the more open joint
systems. The effects on the groundwater table of a 2.5 cm rainfall which entirely
infiltrates into a porous soil slope and a low porosity rock slope is shown in Figure
1.12. In porous soils (Fig. 1.12a) 2.5 c m of rainfall can produce an 8 c m to 25 c m rise
in the groundwater level assuming porosities of 3 3 % to 10%, respectively. The same
rainfall on a rock slope could produce increases in groundwater levels of the order of
many metres (Fig. 1.12b).
Fortunately, the rock mass adjacent to many rock slopes becomes more permeable
because the joints open due to stress relief. This zone of more open jointing serves to
retard the development of high water pressures near the slope surface.
(7) Earthquakes
Earthquakes affect slope stability as follows, (a) Earthquakes produce horizontal and
vertical accelerations in soil masses. The horizontal acceleration may reach 0.5 g
(gravitational acceleration) or more, altering the distribution of forces in hillslopes in a
manner equivalent to a temporary steepening of the slope, (b) Earthquakes can change
the magnitude and distribution of the pore water pressure and increased pore water
pressure reduces soil shear strength. Rapid increase of pore water pressure in some
18
coarse-grained soils occurs by repeated shear stress fluctuations. In loose sandy soils
this cyclic shear loading may lead to liquefaction, i.e. total loss of shear strength.
Keefer (1984) suggested that rockfalls, rockslides, soil-falls and soil slides can be
triggered by the weakest seismic activity while deep seated slumps and earthflows are
generally initiated by stronger and perhaps longer ground shaking.
1.7 MAIN CAUSES OF LANDSLIDES IN THE ILLAWARRA AREA
Observation and study of areas of instability in the Illawarra region have shown that
many slides are associated with the Illawarra Coal Measures and Narrabeen Group.
Different thicknesses of talus cover the slopes over a large area. Depending on their
topographical position, these talus deposits may be derived from the Hawkesbury
Sandstone, Narrabeen Group, Illawarra Coal Measures or combinations of these older
strata.
Landslides have taken place in the Illawarra area due to:
(1) Properties of the talus
The talus usually consists of sandstone boulders in an iron-stained clayey matrix. With
any heavy rain, pore water pressure rises, decreasing the shear strength of the talus. As
the shear strength reduces to the level of the applied shear stress, the talus matrix is
mobilised, resulting in mass movement. Where natural drainage occurs, the talus has
become consolidated and, with compaction and deposition of cementing materials from
solutions, it is relatively impervious to percolating waters. Such talus is often stable on
gentle topographic slopes.
(2) Rock jointing and erosion by the sea
The properties of the underlying rocks have important effects on the nature and stability
of talus. Sandstone cliffs along the sea are vertically jointed and blocks of rock will
break off leaving vertical faces. Rockfalls occur in these places because the toe of the
19
slope is eroded by the sea; relaxation of the material above produces toppling along
joint faces.
Soft rocks and weathered volcanic sandstone (Illawarra Coal Measures) are exposed at
sea level and at the base of some landslides; slips occur from fretting and weathering
of these lower strength rocks.
(3) Properties of the Illawarra Coal Measures
The Illawarra Coal Measures consist of a repetitious sequence of sandstone interbedded
with shale and coal. Coal beds commonly act as aquifers, with shale acting as
aquitards. Landsliding can be related to the presence of the aquifers.
(4) Petrology of Illawarra Coal Measures and Narrabeen Group
The volcanic detritus is present in both the sandstone and shale units either in form of
detrital grains of volcanic rock or as fine volcanic ash. During post-depositional
alteration and diagenesis the original volcanic glass in the ash and matrix of larger
grains has devitrified to produce smectite clays. These clays not only cause swelling
and shrinkage near the surface as a response to wetting and drying, but also reduce the
permeability of the near the surface rock mass. This latter factor increase the aqueous
pore pressures and hence increase the likelihood of surficial mass movement of both the
rock mass and the adjacent talus deposits.
(5) Geotechnical Properties of the Illawarra Coal Measures and Narrabeen Group
High proportions of expansive clay minerals were detected in volcanic rock fragments
(cherts) which suggest that clay softening in the presence of water is important in
controlling moisture related reduction in strength of sandstone in the Illawarra area. The
nature of the cement (kaolinite) and the rate of weathering also influences slake
durability. Weathered shale and Claystone in the Narrabeen Group have low to very
low durability. Weathered sandstone in the Narrabeen Group is moderately strong to
strong whereas measured values from weathered shale and claystone are moderately
weak to moderately strong.
20
(6) Local structural geology
The relationship of landslides to structural geology in this area appears to be very
important. Local structural features such as fractures and faults influence the
underground water circulation. They cause an increase in local water flow and appear
to be directly related to landslides. Regional tilt is about 5° to the north-northwest
causes joint blocks initially tilt landwards. The intersect of joints and bedding planes
causes additional surfaces of weakness which accompany to lithological changes
(sandstone to shale or sandstone to claystone and sandstone interbedded with claystone
and coal causes slope instability in the Illawarra area.
(7) Effects of long-term weathering
M a n y rock falls and topples occur along the Lawrence Hargrave Drive between Clifton
and Coalcliff where the bedding is nearly horizontal and jointing is approximately
vertical. Most effects of weathering are concentrated along the cliffs and in the soft
interbedded shale units. Fretting and weathering of shales have undermined sandstone
layers. This causes large blocks of the overlying sandstone to break off and
considerable tonnages of rock have fallen on many occasions, often completely blocking
the road.
(8) Influence of water
Increase in the pore water pressure within a talus slope affects its stability. Lack of
adequate drainage can cause a rapid increase in the pore water pressure after heavy i
rainfall; this leads a decrease in the shearing resistance of the talus material, and causes
mass movement.
Water flow within the rock mass is concentrated along discontinuities at the base of
sandstone units, i.e. between claystone and sandstone beds. This increases the rate of
weathering of the claystone and causes fretting and weathering of the sandstone as well
as toppling failures in the area.

21
To understanding and quantify the causes of failure and to provide the basic data
necessary for later study, it was first necessary to study of regional geology and carry
out laboratory testing of rock and soil material involved. Fresh and weathered
sandstone, shale, claystone and talus with varying moisture content were sampled over
the area under investigation and tested for a range of laboratory properties. Particular
emphasis was placed on understanding the change of the petrological and mechanical
properties with an increase in weathering.

22
23
CHAPTER 2
GEOLOGICAL AND GEOGRAPHICAL REVIEW OF THE
ILLAWARRA REGION
2.1 REGIONAL GEOLOGY
The Sydney region forms part of an interconnected network of Permo-Triassic basins
in eastern Australia. It extends from the highly deformed middle Palaeozoic Lachlan
Fold in the west to the continental margin in the east. Its eastern extent was
terminated at the outer edge of the present continental shelf by the opening of the
Tasman Sea (Veevers et al, 1991) and the basin is bordered by the New England
Fold Belt in the northeast (Fig. 2.1).
The rocks of the Sydney region are dominantly of sedimentary origin and have been
deposited within a broad zone of subsidence known as the Sydney Basin (Fig. 2.1).
-Deposition took place from carboniferous to the latter part of the Triassic upon a
basement of Early to Middle Palaeozoic metamorphic and igneous rocks-(Rickwood,
1985). For the most part, the strata are conformable and close to horizontal.
The present Sydney Basin succession comprises up to 6 km of Permo-Triassic
sediments (Mayne et al., 1974). The thickest part of the succession is adjacent to
the New England Orogen in the Newcastle area but the sequence is also thought to
thicken eastwards towards the continental shelf. The succession gradually thins to
the south and west. In the southern Sydney Basin, where the present study was
conducted, the maximum thickness is more than 2.5 km. The depositional and
tectonic history of the basin has been well described in the literature (Conolly and
Ferm, 1971; Mayne et al, 197'4; Herbert, 1980a; and Branagan 1985). A marine
transgression during the Early Permian allowed the deposition of thick sequences of
24
marine sediments (Shoalhaven Group) and a major regression in the Late Permian
resulted in the deposition of the Illawarra Coal Measures about 250-260 million years
ago.
Deposition in the Late Permian and Early Triassic took place essentially in marginal
marine to fluvial environments with numerous coal swamps. Deposition is postulated
to have extended into Jurassic times with an hiatus in the Late Triassic (Herbert,
1980a).
Permian deformation mainly produced broad folding and some faulting in the
northern part of the basin near the thrust margin with the N e w England Fold Belt.
The basin contains minor occurrences of irregularly distributed Cainozoic deposits.
Occasional volcanic activity in the form of dykes and other intrusive bodies persisted
from Permian to Tertiary.
2.2 REGIONAL STRUCTURE
The Sydney Basin developed its structural entity in the mid Permian, after the N e w
England Orogeny (Herbert, 1980a). Subsidence of the basin started with initial
sedimentation in the Newcastle area to the north of the present study area, and
comprised molasse sediments derived from the N e w England Fold Belt (Herbert,
1980a; Roberts and Engle, 1987). Subsidence continued throughout the Early
Permian and transgressive shallow marine and paralic sediments were deposited
(Herbert, 1980a; Roberts and Engle, 1987). Subsequently, during the Late Permian,
intense crustal movement occurred and N e w England Orogen was uplifted to the
north of Hunter Thrust System during the Hunter Orogeny (Scheibner, 1976).
The Hunter Orogeny was immediately followed by molasse sedimentation and marine
regression. Most of major coal deposition in the Sydney Basin was in alluvial and
deltaic environments during this Late Permian regressive phase (Bamberry, 1992).
25
Towards the end of the Late Permian, coal measure sedimentation terminated and
was followed by the deposition of predominantly fluvial sequences, in the Triassic.
The time at which sedimentation ceased in the Sydney Basin is not known.
Palynological studies of spores preserved in diatremes in the Sydney Basin indicated
that they are of Early Jurassic age (Crawford et al, 1980). Therefore, it has been
postulated that deposition in the basin continued at least up to Early Jurassic with a
hiatus in the Late Triassic (Herbert, 1980a). Recent investigation by Jenkins et al.
(1993) on the continental slope off the southeastern coast of Australia suggest that
some deposition may have also occurred in the Cretaceous.
-Studies have indicated that the present continental margin along the southeastern
coast of Australia developed as a result of continental break-up in the Late
Cretaceous. Palaeomagnetic, radiometric and fission track data indicate that rifting
began approximately 100 Ma and sea floor spreading (drifting) occurred
approximately 85 Ma (Weissel and Hayes, 1977; Shaw, 1978; Jones and Veevers,
1983; Moore et al, 1986; Dumitru et al, 1991; Veevers et al, 1991). The major
uplift and erosion of Sydney Basin sequence is believed to have been initiated in
relation to this spreading event in the Late Cretaceous-(Mayne et al, 1974; Oilier,
1982; Moore et al, 1986).
The Sydney region does not show evidence of strong deformation but detailed
investigations of the rocks shows that gentle deformation occurred both during and
after the main period of deposition in Permian and Triassic times.
In general, a variety of structural features can be recognised in the region. -These
features consist of broad depressions and gently inclined plateaux, folds, warps (Fig.
2.2), fault zones, faults and joints. Folds are gentle with north-northeast to northeast
axial trends in the central and northern parts of the basin (Branagan et al, 1988).
Fault zones have a patchy distribution. Where faulting occurs it is common to find
a variety of faults (normal, reverse, low angle thrusts and strike slip) within the area.
26
Normal faults occur in a number of orientations but faults trending northwest, north-
northeast and northeast appear to be the most common (Norman and Branagan, 1984;
Branagan, 1985). Thrust faults in the Sydney region have orientations ranging from
northwest to north-northeast and northeast, with occasional more east-west oriented
thrusts. Most are low angle or bedding-parallel structures (Branagan et al, 1988).
The Sydney region is also characterised by sub-vertical north-northeast trending shear
zones which parallel an important joint direction (Norman and Branagan, 1984). The
dominant movement appears to be strike-slip, although some normal and reverse
displacements may also be present.
Jointing is widespread and at least four main trends have been recorded in the region
(Fig. 2.3). These joints show a wide variety in their shape, continuity, inclination
and openness. Vertical north-northeast planar joints are continuous for many metres
throughout the sandstone units and control the orientation of many cliff-lines and
stream courses. Many joints are the passageways for groundwater and this results in
a variety of rock conditions. Some joints and adjacent rock masses are strongly
leached and usually weakened while elsewhere significant deposition of iron oxide
cements has occurred often producing a more resistant material.
Jointing in the shale is tighter than in the sandstone when first exposed. These
joints maybe coated by calcium carbonate, clay or pyrite. Open joints in sandstone
maybe coated with these substances and with quartz or iron oxides. Joint faces in
sandstone retain their character, whereas joints faces in shale become rapidly
modified and exfoliate on exposure.
2.3 ILLAWARRA AREA
2.3.1 GEOMORPHOLOGY
The niawarra area is located in the southern part of Sydney Basin and comprises
tableland, the coastal plain, and the escarpment and slopes (Figs 1.4 and 1.5). The
27
tableland was named the Woronora Plateau by Branagan and Packham (1967). It
ranges in elevation from about 360 m in the north to a maximum of 760 m in the
south. Hawkesbury Sandstone crops out over much of the plateau, ranging in height
about 350 m behind Stanwell Park to 469 m in the M t Keira area.
The niawarra coastal plain stretches southward from Coledale where softer rocks,
particularly of the Illawarra Coal Measures, are exposed at or above sea level. It is
widest in the south due to the presence of large streams and more rapid erosion of
the weathered marine rocks. The Illawarra coastal plain has been formed by
westward recession of the plateau giving a faceted slope or scarp (Fig. 1.5). The
Hawkesbury Sandstone forms prominent cliffs on the crest of the escarpment.
Differential erosion of the underlying interbedded sandstone and claystone has
produced structural benches on the escarpment, with steep sandstone rises and
relatively flat claystone slopes. Debris or talus partly covers the structural benches
and bluffs and results from erosion of the interbedded sandstone and claystone of the
area. The Illawarra Coal Measures do not form major benches because the sandstone
units are thinner and less resistant to erosion.
The escarpment bounds the area along the western edge; and hence the coastal
lowland varies in width, from 5 to 20 k m (Fig. 1.4). The northern coastline is
characterised by steep cliffs of sandstone; these cliffs range in height from 3 m to 70
m, accompanied by alternating bays and barrier beaches of variable width. The
exposures along the cliffs are generally good, as a result of wave abrasion, whereas
little exposure is found on the cliff tops which have been covered by surficial
deposits, especially in residential areas.
Rock platforms with cliff notches are extensively developed in the softer Permian
sequences. Harder Triassic rocks north of Clifton form narrower platforms. The
platforms are composed of sandstone, which is more resistant to erosion by the sea
28
than the interbedded shale. O n these rock platforms, systems of joints are
particularly well exposed, especially between Clifton and Coalcliff.
2.3.2 CLIMATE
In general, the Illawarra area has a temperate marine climatic regime. It is a
characteristically moist climate with no major dry season. The rainfall is fairly
evenly distributed throughout the year although slightly more rain falls in late
summer and early winter. Factors such as topography, structure of the region and
the nature of prevailing air masses all affect the rate of rainfall in the area.
Higher rainfalls are recorded on the plateau than on the coastal plain. About 1600
m m per year falls on the high ground west of the escarpment. Approximately 1500
m m per year falls along most of the escarpment while around 1200 m m per year
falls on the coastal plain. The average annual rainfall contours for the study area are
shown (Fig. 2.4).
It is known that higher rainfalls occur at higher elevations where temperature and
evaporation are lower. In the Wollongong area precipitation exceeds evaporation for
three months per year. Near the crest of the escarpment, precipitation is more than
evaporation for all months. The annual average excess is about 700 m m and results
in an increase of soil moisture, which leads to mass movement along the niawarra
escarpment (Chowdhury and Young, 1987).
The important point is that intense storms accompanied by a high rainfall occur
within a short period of time in this area. Often slips were caused by these rainfalls
(e.g. the landslide in the Coalcliff area in April 1988).
Information from B o w m a n (1972) shows an average maximum temperature for the
hottest month, February, of 26.9°C and an average minimum for coldest month, July,
of 8.4°C with an average daily temperature over the whole year of 17.5°C. Winter
29
winds are from the west and southwest while summer winds are commonly from the
south or northeast.
2.3.3 GEOLOGY
The study area is located in the southeastern portion of the Sydney Basin (Fig. 2.1).
It comprises a sedimentary sequence with several volcanic units. The rocks range in
age from Permian to Triassic. This part of the Sydney Basin has received
considerable attention from geologists because of its long history of coal mining.
Harper (1915) produced the first comprehensive description of the geology of the
Illawarra area. H e described the general stratigraphy and structure and recorded
many observations about the various coal seams. The work of Hanlon (1952, 1953,
1958) greatly expanded the knowledge of the area. He revised and modernised the
stratigraphic nomenclature and described in considerable detail the stratigraphy of the
area between Coledale and Stanwell Park. Much of detail available about the
various rock sequences is due to Hanlon's work.
B o w m a n (1974) mapped the geology of Wollongong, Kiama and Robertson sheets at
a scale of 1:50000. Adamson (1974), in an investigation for Coalcliff Colliery,
added some detail not previously recorded. Chestnut (1981) mapped the
Wollongong-Port Hacking area with emphasis on engineering and environmental
geological hazards. Finally the Geological Survey of N e w South Wales published a
report on the geology of Wollongong and Port-Hacking (Sherwin and Holmes, 1986).
Although the geology of the niawarra has been studied for a century or more, few
studies have attempted to understand the slope stability in this area.
Slope instability in the northern niawarra almost totally occurs within the upper
Illawarra Coal Measures and Narrabeen Group. Therefore this study is concerned
with upper Illawarra Coal Measures, Narrabeen Group and associated talus. Other
formations are described only briefly.

30
2.3.4 STRATIGRAPHY
2.3.4.1 SHOALHAVEN GROUP
Shoalhaven Group in the southern Sydney Basin consists predominantly of alternating
sandstone and siltstone sequence (Jones, 1990). The Broughton Formation at the top
of Shoalhaven Group is the oldest rock exposed in the study area (Carr, 1983). It
crops out along the coastal plain in the Wollongong area. The sandstone is a red to
green-grey lithic sandstone with thin interbeds of siltstone and conglomerate. Five
tabular latite bodies are interbedded in the Broughton Formation in the Kiama area to
form the Gerringong Volcanic facies. One of them is the Dapto Latite Member
which occurs around Lake Illawarra. This volcanic unit is responsible for the higher
topographic area between Wollongong and Lake Illawarra. Its presence has
significantly influenced the evolution of the coastal plain in this region. The
maximum thickness of Broughton Formation reaches 370 m at Saddleback Mountain
(Bowman, 1980).
2.3.4.2 ILLAWARRA COAL MEASURES
The Illawarra Coal Measures are generally located at the base of the escarpment in
the northern Illawarra. The coastal plain is formed partly on this formation, although
Quaternary alluvium frequently overlies the coal measures. The idealised stratigraphy
of Illawarra Coal Measures is presented in Figure 2.5. This formation had been
studied by numerous authors, e.g. Harper (1915), Hanlon (1952, 1953, 1958),
Bowman (1974), Odins et al (1990) and Bamberry (1992).
In general the coal measures are subdivided into the Cumberland Subgroup and the
overlying Sydney Subgroup. The Pheasants Nest Formation is the basal formation
within the Cumberland Subgroup and hence the niawarra Coal Measures. It
represents a transition from the underlying marine Shoalhaven Group strata to a
31
fluvio-deltaic depositional regime. This unit consists of sandstone with shale,
siltstone and conglomerate interbeds. Two small lenticular coal seams are located
within the Pheasants Nest Formation. The overlying marginate marine Erins Vale
Formation is a fine- to medium-grained lithic sandstone with few shale and
conglomerate lenses.
The Sydney Subgroup disconformably overlies the Cumberland Subgroup and is
composed of numerous sedimentary formations, as well as many members. The
subgroup consists of interbedded quartz-lithic sandstone, grey laminated mudstone,
and nine coal units. The uppermost formation is the Bulli Coal which is the main
commercial coal seam in the niawarra area. It varies in thickness from 4 m in the
north to 1.5 m near Port Kembla and contains few claystone bands. Large areas of
the Bulli Coal have now been mined.
Sandstone units within the coal measures are commonly moderately to well sorted,
with fine- to medium-grained subrounded to rounded grains. Cement is usually
calcite and porosity is generally low (Table 2.1).
2.3.4.3 NARRABEEN GROUP
The Narrabeen Group is known to occur throughout the Sydney Basin. It extends
along the Illawarra coastal escarpment and also crops out to the west of the
escarpment. This group includes the main sequence of rocks along the coastal cliffs
between Stanwell Park and Scarborough, where it is particularly well exposed.
The lowest units of the Narrabeen Group are Late Permian and the upper unit is
Middle to Late Triassic in age. The thickness of the Narrabeen Group decreases to
the south. For example it has a thickness of 330 m north of Otford (Loughnan,
1963) while at Clifton it is 253 m thick (Hanlon, 1953).
The Narrabeen Group includes the Coal Cliff Sandstone, Wombarra Shale, Otford
Sandstone Member, Scarborough Sandstone, Stanwell Park Claystone, Bulgo
32
Sandstone, Bald Hill Claystone, Garie Formation and Newport Formation. The
Hawkesbury Sandstone overlies the Narrabeen Group.
2.3.4.4 COAL CLIFF SANDSTONE
The Coal Cliff Sandstone is the basal unit of the Narrabeen Group and overlies the
Illawarra Coal Measures. The thickness of the unit ranges between 6 and 20 m,
being approximately 9 m thick in the type section at Clifton (Hanlon, 1953). The
Coal Cliff Sandstone is a light-grey, fine- to medium-grained, quartz-lithic and lithic
sandstone with a number of pebble and shale bands. It crops out in the coastal
section near Clifton and passes below sea level north of Coalcliff. Angular siderite
fragments up to 10 c m in size are common in the basal Coal Cliff Sandstone.
This unit forms the roof of some colliery workings and is exposed underground for
several kilometres to the west of the Illawarra escarpment. In the some places
colliery roofs are less stable because the fine sandstone near the base of the Coal
Cliff Sandstone sometimes grades into shale.
2.3.4.5 WOMBARRA SHALE
The Coal Cliff Sandstone is overlain by 6 to 30 m of greenish-grey shale with lithic
sandstone interbeds. It is well exposed in road cuttings and cliffs south of Coalcliff.
A measured section of the Wombarra Shale (Fig. 2.6) illustrates the frequency of the
interbedded sandstone. The sandstone interbeds are generally quite thin, lenticular,
fine-grained and carbonate-cemented. Asymmetrical ripple marks occur at the base
of the Wombarra Shale at Coalcliff (Bowman, 1974).
Towards the top of the formation a thicker sandstone unit is called the Otford
Sandstone Member (Hanlon, 1952). This member is approximately 7 m thick but
varies because of lateral changes to shale.
33
A clear facies change occurs in the Wombarra Shale between Clifton and
Helensburgh (Loughnan, 1963). It comprises 7 7 % lutite at Clifton but contains only
4 0 % at Helensburgh. The lateral facies changes essentially affect its stability. If the
arenite content increases a little, weathering will decrease within the unit and stability
will be maintained.
2.3.4.6 SCARBOROUGH SANDSTONE
The Scarborough Sandstone rests on the Wombarra Shale. This unit is a massive
sandstone nearly 24 m thick for most of its outcrop length. Commonly the
Scarborough Sandstone is conglomeratic with coloured chert clasts especially in the
basal half. It consists of beds up to several metres in thickness which become finer
upwards. This unit comprises lithic to quartz-lithic sandstone with pebbles and
minor amounts of grey shale. The coarse nature of the sandstone has resulted in the
development of important cliffs between Stanwell Park and Clifton.
2.3.4.7 STANWELL PARK CLAYSTONE
This unit separates the Scarborough Sandstone from the Bulgo Sandstone. The
Stanwell Park Claystone is about 37 m thick at the type section between Clifton and
Coalcliff. It consists of interbedded green to chocolate shale and sandstone. Three
claystone intervals and two sandstone beds can be recognised.
The lower section of the unit consists of greenish-grey claystone and sandstone
which slowly changes upward into red-brown claystone and clay. The sandstone
beds are composed of weathered lithic fragments and are usually light greenish-grey
in colour. The relative proportion of claystone and sandstone varies but overall they
are sub-equal (Bowman, 1974).
34
2.3.4.8 BULGO SANDSTONE
The Bulgo Sandstone, which rests on the Stanwell Park Claystone is the thickest unit
of the Narrabeen Group on the Illawarra coast. It forms prominent outcrops in the
area and between Coalcliff and Clifton. The Bulgo Sandstone is 120 m thick at
Clifton forming over half the total Narrabeen Group (Ward, 1980). It consists of
thickly bedded sandstone with intercalated siltstone and claystone beds up to 3 m
thick. Conglomerate is also present, especially toward the base.
A complete section of the Bulgo Sandstone is exposed in the cliffs south of Otford,
but it has not been studied due to the difficulty of access. Ward (1971a) subdivided
the formation into three facies: the basal "pebbly facies", the middle "volcanic facies"
and the upper "shaley facies".
The "pebbly facies" consists of pebbly sandstone like the Scarborough Sandstone.
This sandstone is mostly lithic. The "volcanic facies" consists of green sandstone
and shale. The sandstone consists predominantly of intermediate to basic volcanic
rock fragments which are altered to chlorite and iron oxides. The "shaley facies" has
a high proportion of siltstone. The shale is often red owing to hematite staining.
The Bulgo Sandstone has a higher proportion of quartz than of rock fragments.
Sandstone beds rarely exceed 4 m in thickness while the siltstone and shale interbeds
are usually less than 1 m thick. The red shale beds of the upper "shaley facies" are
up to 2 m in thickness.
2.3.4.9 BALD HILL CLAYSTONE
The Bald Hill claystone, which overlies the Bulgo Sandstone, crops out in the hills
near Otford and on the Mt Ousley road to the south. This formation is about 15 m
thick at its type locality in the Bald Hill area (Hanlon, 1953). It consists almost
entirely of claystone, but lithic sandstone interbeds are found towards the base of the
unit. Mottled chocolate and green claystone zones are common. The mineralogy of
35
the Bald Hill Claystone is quite simple. Kaolinite, hematite and/or siderite being
almost exclusively the only minerals present (Bowman, 1974).
2.3.4.10 GARIE FORMATION
Toward the top of the Bald Hill Claystone, thin beds of light coloured claystone
become more common. This upper zone passes into a mid-grey slightly
carbonaceous massive claystone, which is overlain in turn, by the Newport Formation
(Fig. 2.7). The Garie Formation is usually less than 3 m thick but it is a very good
marker horizon in the southern Sydney Basin.
2.3.4.11 NEWPORT FORMATION
The mid-grey shale and minor interbedded lithic sandstone of the Newport Formation
overlies the Garie Formation (Fig. 2.7). The formation is 18.5 m thick in its type
section on the coast 3 km north of Garie Beach (Hanlon, 1953), but is reduced to
11 m near Clifton.
Mud-rocks of this formation are thinly bedded. The dark-grey mud-rocks contain
plentiful plant fossils. Claystone beds consisting of sand-sized flakes of kaolinite,
with a large original porosity, are common in the Newport Formation (Bowman,
1974).
2.3.5 POST-NARRABEEN UNITS
2.3.5.1 HAWKESBURY SANDSTONE
This unit is a flat-lying Middle Triassic quartz sandstone with an areal extent of
about 20,000 km2 and a maximum thickness of 250 m (Standard, 1969; Conaghan,
1980). The Hawkesbury Sandstone crops out at the top of most the niawarra
escarpment. It forms a resistant plateau to the west of the escarpment, which gently
dips to the northwest. The formation has a thickness of about 180 m at Stanwell
36
Park. It contains a minor amount of mudstone, interbedded with fine sandstone, but
it consists dominantly of sandstone beds (Jones and Rust, 1983) typically 2 m to
5 m but up to 15 m in thickness. Transition into conglomerate is seen in some of
the sandstone beds. Strong cross-bedding is common in the Hawkesbury Sandstone
and it was discussed by Bowman (1974), Conaghan and Jones (1975), Conaghan
(1980) in some detail. The interbedded mudstone is very prone to weathering upon
exposure. The Hawkesbury Sandstone is often involved in rockfalls from the
escarpment,
2.3.5.2 WIANAMATTA GROUP
The Wianamatta Group crops out on the plateau to the west of the Elawarra
escarpment and overlies the Hawkesbury Sandstone. It consists of interbedded grey
shale, lithic and quartzose sandstone, and has a maximum thickness in the study area
of nearly 15 m. Helby (1973) has suggested a Middle Triassic age for the
Wianamatta Group.
2.3.5.3 IGNEOUS ROCKS
Illawarra area has numerous intrusive igneous bodies with one significant Tertiary
extrusive unit. The flow is called the Robertson Basalt. It covers the Robertson
plateau and is an alkaline basalt with a maximum thickness of 100 m (Sherwin and
Holmes, 1986).
A few small dykes and sills crop out, but they are usually weathered to clay.
Bowman (1974) indicated that most of the dykes have intruded along tension joints,
although Harper (1915) reported some intrusions along faults.
These igneous bodies locally affect the slope profile. They may typically weather to
montmoriUonite and are deleterious for stability.
37
2.3.5.4 TERTIARY A N D Q U A T E R N A R Y DEPOSITS
Significant areas of the coastal plain and escarpment slope are covered by talus
which is Quaternary in age. It has a variable thickness below the Illawarra
escarpment. Generally the talus consists of large sandstone blocks, derived either
from the Hawkesbury Sandstone or from sandstone units in the Narrabeen Group, set
in a clayey matrix which is frequently iron-stained or leached.
This process is directly related to slope stability and is discussed more fully later.
2.3.6 STRUCTURAL GEOLOGY
The niawarra area lies near the southern edge of the Sydney Basin. The structural
geology of the area has been discussed by David (1896), Harper (1915), Wilson et
al (1958), Bowman (1974) and Mauger et al. (1983). In general, the strata in the
area have a regional dip of a few degrees to the north-northwest towards the centre
of the basin. The escarpment has a trend toward north-northeast. Anticlinal and
synclinal crenulations are developed on the eastern limb of the Camden Syncline
(Fig. 2.8).
2.3.6.1 FOLDS
A series of gentle folds occur along the southeastern edge of the Sydney Basin (Fig.
2.8). The axes trend about 155° and gently plunge towards the centre of basin.
Bowman (1974) suggested that the folding may have resulted from crustal
foreshorting during the deformation of the basin. Wilson et al, (1958) noted the
thickening of units in the synclines and thinning of units on the crest of anticlines
and he pointed out that sedimentation was contemporaneous with deformation.
Jakeman (1980) also discussed about the relationship between the formation structure
and thickness in Permo-Triassic succession of southern coalfield in the Sydney Basin.
38
According to Branagan and Pedram (1990) the monoclinal folding is associated with
faulting and may be associated with stress relief along a 105° -striking regional ac
(perpendicular to fold axis) joint set.
Several domes are developed in the area. Only the two largest, Mount Lindsay
Dome and Mount Burke dome are shown in Figure 2.8.
2.3.6.2 FAULTS
Most faulting in the area is normal faulting, although strike-slip and high-angle
reverse faults are known to exist. Wilson et al. (1958) recorded fault directions
consistent with the 110° and 155° folded directions. As well they reported another
set of faults striking approximately 050° with throws of less than 3 m. These faults
are generally difficult to recognise on the surface but are commonly encountered in
underground coal mines.
Generally they are downthrown to the north in the northern part of the niawarra area
(e.g Clifton Fault). Most of the major faults are clean breaks without a crush zone.
They usually form a series of small en echelon faults or fault zones (Fig. 2.9) and
horst and graben structures.
Bowman (1974) stated that three groups of faults occur (110°, 155° and 005° in the
area (Fig. 2.10). The first two group correspond with those of Wilson et al (1958).
The lack of the 050° set in Bowman's data probably results from the difference
between underground and surface observations and hence measurements. Of these
faults directions, faults striking 110° are the most numerous. These directions
correspond to the tensional directions associated with the two directions of synclinal-
anticlinal folding. The displacement on the faults striking 005° is generally less than
5 m. Faults striking 110° and 155° can have much greater displacements. Minor
faults are normal faults with steep dips toward north. Most of the minor faults are
fracture zones several hundred metres across (Sherwin and Holmes, 1986). Evidence
39
exists that some faults may have been active during deposition, with a greater
thickness of sediment developing on the downthrown side and with a decreasing
throw up the section. For example, Figure 2.11 shows that the throw of the Jetty
Fault at Coalcliff decreases on ascending stratigraphically (Hanlon, 1953). Faulting
has taken place along the major joint direction and appears to be a tension feature.
Also a dyke occurs along the tension feature in this area.
2.3.6.3 JOINTS
Generally joints are the most significant structural feature in the area. Folding of the
sediments is commonly negligible and the strata are very close to horizontal.
Faulting is c o m m o n and fault zones influence the groundwater movement. Faults
usually play a similar role to jointing in assessing slope stability in this area.
M a n y workers have studied the distribution of joints in the Illawarra region,
including Dickson and Weber (1966), Connelly (1970), B o w m a n (1974) and Mauger
et al (1983). They found that there are four sets of prominent joint directions, at
005°, 055°, 105°, 155°. These directions are similar to the regional pattern (Fig. 2.3)
and are parallel the be (parallel to fold axis) and ac (perpendicular to folded axis)
directions of the two main fold orientations (Fig. 2.12). Therefore the joint sets are
probably tensional features resulting from stress relief after folding. But Cook and
Johnson (1970) studied joint patterns in ironstone intraclasts and in the ironstone
layers from which they were derived on the coastal platform north of Wollongong.
They concluded that the jointing pattern present in the sediment, a set striking 078°
and 105°, was developed at the time of sedimentation. These suggests that the
regional northwest folds may have been synsedimentary - a concept confirmed by the
thickness trends for the Bulli Coal (Jakeman, 1980). Memarian (1993) also studied
the fracture history of the Coal Cliff Sandstone at Coalcliff. H e stated that these
joints are extensional in origin and formed from tectonic stresses during burial.
40
2.7 STRESS FIELDS
Many authors have commented on the stress fields affecting the Sydney Basin
including Scheibner (1976), Dolye et al. (1968), Denham (1980), Herbert (1980a),
Denham et al. (1981), Gray (1982), Everingham et al. (1987), Scheibner (1987),
Fredrich et al (1988), Greenhalgh et al. (1989), Michael-Leiba (1989) and Stone
(1990). Most of them agree that the Sydney Basin was subjected to east-west
compression from commencement of sedimentation in the Permian through most of
the Mesozoic. This east-west compression was probably related to subduction to the
east of the Australian continent (Scheibner, 1976).
In the Illawarra region the principal feature associated with this east-west stress field
is the Camden Syncline. In addition to this stress field, evidence exists that the
rocks were also subjected to northeast-southwest compression in much the same
period. This stress field caused the anticlinal-synclinal crenulations on the eastern
limb of the Camden Syncline.
Since the Cainozoic the basin has been subjected to north-south compression (Gray,
1976), features such as the monoclines and recent earthquakes are associated with
this later stress field.
Scheibner (1976) considered that this stress field was associated with movement of
the Australian plate away from the Antarctic plate.
41
CHAPTER 3
GEOLOGY OF THE UPPER COAL MEASURES AND LOWER NARRABEEN
GROUP IN THE SCARBOROUGH-STANWELL PARK AREA
3.1 INTRODUCTION
The lower Narrabeen Group and upper Illawarra Coal Measures in the Scarborough-
Stanwell Park area are essentially flat-lying strata consisting of repeated beds of
sandstone, shale, claystone and coal seams. The coal measure rocks consist of
tuffaceous sandstone, carbonaceous siltstone, claystone and coal seams. The lower
Narrabeen Group consists of a succession of sandstone units with interbedded sequences
of claystone and shale.
The niawarra Coal Measures crop out south of Clifton and generally form much of the
coastal plains in the Illawarra region, although they are frequently covered by
Quaternary alluvium.
The coal measures sequence is approximately 250 m thick extending downwards from
the base of the Coal Cliff Sandstone. The upper most layer is the Bulli Coal, which
consists of black bituminous coal of coking grade in a seam between 1.5 and 2 m thick.
Below the Bulli seam the sequence consists of carbonaceous shale and lithic sandstone
with interbeds coal sandstone and conglomerate lenses. Only the Bulli Coal has been
mined in this area.
The Narrabeen Group extends for the full length of the escarpment in the study area and
also crops out to the west of the escarpment. It is the principal group of rocks making
up the coastal cliffs between Scarborough and Stanwell Park where it is particularly well
exposed.
The lower Narrabeen Group contains the following units from top to base. The Bulgo
Sandstone consists of grey quartz-lithic sandstone with minor reddish-brown claystone

42
and some thin conglomerate bands. The Stanwell Park Claystone consists of red-brown
and greenish claystone containing two prominent quartz sandstone beds. The
Scarborough Sandstone consists of thickly bedded sandstone with some conglomerate
beds and rare shale. It outcrops boldly and forms the major part of the coastal cliffs.
The Wombarra Shale consists of grey shale, but it contains one thick sandstone layer
known as the Otford Sandstone Member. The Coal Cliff Sandstone is a massive grey
lithic sandstone which forms the coastal cliffs in the southern part of the study area.
3.2 ILLAWARRA COAL MEASURES
The niawarra Coal Measures overlie marine sediments of the Shoalhaven Group and are
in turn overlain by alluvial sediments of the Narrabeen Group in the Wollongong area.
Rocks of the Narrabeen Group crop out in the lower coastal cliffs and shore platforms,
extending as a narrow zone northeastwards from the base of the cliff north of Clifton.
South of Clifton the coastline is composed of Illawarra Coal Measures but the main
outcrop zone of the coal measures south of Wombarra is mainly located on the steep
slope at the base of the Illawarra escarpment. Here these strata are overlain by
extensive accumulations of talus, commonly in excess of 5 m thick.
The stratigraphy, depositional settings and petrography of the Late Permian Illawarra
Coal Measures have reported by Bamberry (1992). The Illawarra Coal Measures has
been divided into two subgroups. These are the Sydney and underlying Cumberland
Subgroups.
The Sydney Subgroup is some 90-130 m thick in the northern niawarra region and
consists of lithic sandstone, siltstone, claystone and coal with a minor amount of tuff.
Commonly along the outcrop of this unit the coal seams have been observed by the
author to be permeable and to act as aquifers. The Cumberland Subgroup is described
as being about 110 m thick beneath the northern Illawarra region where it consists of
sandstone with some interbedded claystone. The Shoalhaven Group underlies the

43
Illawarra Coal Measures and consists of sandstone and siltstone below the northern
Illawarra area, but includes latite members to the south which represent the Gerringong
Volcanic Facies.
3.2.1 UPPER ILLAWARRA COAL MEASURES (SYDNEY SUBGROUP)
The base of the Sydney Subgroup is marked by the base of the Wilton Formation
(Bamberry, 1992). The Sydney Subgroup in the Illawarra area contains the following
units.
3.2.2 WILTON FORMATION
The basal formation of the Sydney Subgroup is the Wilton Formation. It is 15 to 30 m
thick and comprises a basal coarse sandstone fining up to a predominantly siltstone
sequence. Typical examples of the sandstone sequence in the basal Wilton Formation
occur in the railway cutting at Thirroul (Fig. 1.3). It comprises very coarse-grained to
conglomeratic cross-bedded sandstone with a maximum thickness of about 1.5 m. The
Woonona Coal Member overlies the coarse basal sandstone and varies in thickness from
a few centimetres to greater 6 m (Bamberry, 1992) but it most commonly consists of
about 1.5 m of thinly bedded coal, carbonaceous shale and shale.
Higher sandstone beds within this formation are fine- to medium-grained and well
sorted. They exhibit a general increase in quartz content up through the formation and
northwards, and are classified as litharenite to sublitharenite. Matrix material consists
predominantly of authigenic illite, smectite, chlorite and kaolinite, with lesser
microcrystalline quartz. Commonly, the cement is calcite with lesser siderite. Siltstone
and shale in the Wilton Formation were examined using XRD analysis of whole rock
and clay fractions. The major components are quartz, illite, smectite and kaolinite
(Odins et al, 1990).
44
This formation is overlain by the Tongarra Coal (Bowman, 1974) which, in turn, is
overlain by the Bargo Claystone (Fig. 3.1).
3.2.3 TONGARRA COAL
This is the next persistent coal above the Woonona Coal Member. It consists of
interbanded dull and bright coal with interbeds of carbonaceous shale and tuffaceous
claystone. The Tongarra Coal has a regular thickness (Bamberry, 1992) of between 2.8
and 3 m in the coastal exposures. A tectonic control, namely the stable tectonic setting
of southern Sydney Basin, exerted a significant control on the distribution of the
Tongarra Coal (Bamberry, 1992).
3.2.4 BARGO CLAYSTONE
The Bargo Claystone typically consists of dark gray to black claystone, locally
containing minor sandstone (Austinmer Sandstone Member) and tuff (Huntley Tuffaceous
Claystone Member). This unit is commonly a soft, parallel laminated, pale claystone
which, in some cases, exhibits normal grading (Bamberry, 1992). The unit immediately
overlies the Tongarra Coal and is overlain by the Darkes Forest Sandstone.
The Bargo Claystone is about 15 m thick in the Illawarra region (Bowman, 1974), but
it ranges in thickness from less than 10 m to 38 m in the northeastern part of the
coalfield (Hutton et al, 1990). The Austinmer Sandstone Member is very fine- to fine
grained sandstone and is moderately to well sorted. It is present near the base of this
formation interbedded with siltstone.
3.2.5 DARKES FOREST SANDSTONE
The Darkes Forest Sandstone is 10 m thick (Bowman, 1974), overlies the Bargo
Claystone and is immediately overlain by the Allans Creek Formation. The sequence
records the deposition of fine- to medium-grained sand, silt and clay in a delta front
45
setting (Bamberry, 1992). This unit is predominantly a well sorted, fine-grained
litharenite. Matrix material is predominantly clay minerals and microcrystalline quartz.
The unit is cemented by coarse-grained calcite, with lesser siderite. Porosity within the
unit is very low due to this widespread cementation (Odins et al, 1990).
3.2.6 ALLANS CREEK FORMATION
The Allans Creek Formation directly overlies the Darkes Forest Sandstone and is
overlain by the Kembla Sandstone. Its thickness is usually between 4 and 16 m (Hutton
et al, 1990). This formation consists predominantly of fine-grained lithologies.
Typically, sandstone within the formation consists of moderately to well sorted, fine-
to medium-grained, subangular to subrounded chert grains, with lesser volcanic rock
fragments (Odins et al, 1990). Typical matrix materials include microcrystalline quartz
and clay minerals. The American Creek Coal Member in the upper part of the Allans
Creek Formation occurs immediately below the Kembla Sandstone.
3.2.7 KEMBLA SANDSTONE
This unit is situated between the American Creek Coal Member and the Wongawilli
Coal. The contact between the Kembla Sandstone and Allans Creek Formation is a
sharp erosional surface that is marked by abundant chert pebbles, intraclasts and
preserved fossil wood (Bamberry, 1992). The Kembla Sandstone is between 4 and 8 m
thick (Hutton et al, 1990). It is a well sorted, fine- to medium-grained litharenite.
Matrix material mainly consists of clay minerals. Porosity within this unit is low,
although where pores occur they are commonly very open in nature (Odins et al, 1990).
Two major lithofacies associations are recognised within the Kembla Sandstone. The
fining upwards sequence of the lower coarse member of the Kembla Sandstone, together
with the terrestrial aspect of surrounding strata attests to a fluvial origin for this
succession. The well ordered internal lamination within the overlying fine member
46
indicates a floodplain environment and suggests that the sequence was deposited in
meandering river setting (Bamberry, 1992).
3.2.8 WONGAWILLI COAL
Overlying the Kembla Sandstone is the 3 to 9 m thick Wongawilli Coal consisting of
coal, carbonaceous shale and tuffaceous claystone (Table 3.1). Coaly beds in the upper
and lower parts of the Wongawilli Coal are separated by tuffaceous claystone. The
upper coaly beds consists of carbonaceous claystone with coaly laminae whereas well-
developed coal, comprising interbanded bright and dull coal with bands of carbonaceous
mudstone and claystone, is found in the lower half of the unit.
The tuffaceous character of the claystone bed within the Wongawilli Coal indicates that
it represents an airfall ash deposit (Bamberry, 1992). In coastal outcrops, the basal
section of the Wongawilli Coal consists of a thick sequence of laminated carbonaceous
claystone and siltstone (2 to 4 m). At Scarborough (Fig. 1.3) the basal section overlies
overbank sequences of Kembla Sandstone with a low-angle erosional basal contact.
3.2.9 ECKERSLEY FORMATION
This formation overlies the Wongawilli Coal and is an interbedded sequence of fine- to
coarse-grained, quartz-lithic sandstone, siltstone, claystone and coal with tuff as an
important component of the clastic beds. Several units of member status, mostly coal
seams, are defined within the Eckersley Formation (Fig. 3.12). This formation generally
ranges 35 m thick to a maximum thickness of 112 m in the northern part of the
coalfield (Hutton et al, 1990). The Eckersley Formation is dominated by fine- to
medium-grained sandstone at the base. Overlying this sandstone is up to 14 m of
interbedded coal, carbonaceous siltstone and claystone of the Woronora Coal Member.
In cliffs near Scarborough and Clifton, Hanlon (1953) formally named the Hargrave,
Cape Horn and Balgownie Coal Members and the Lawrence Sandstone Member. The
47
respective outcrop type-section thickness of the Hargrave, Cape Horn and Balgownie
Coal Members are 0.46 m, 1.32 m and 1.30 m. The Lawrence Sandstone Member has
a maximum thickness of 18 m. The interval between the Balgownie Coal Member and
Bulli Coal normally comprises an upward fining coarse- to fine-grained fluvial sandstone
sequence capped by siltstone and shale (Loddon Sandstone Member; Bamberry, 1992).
This forms the uppermost clastic unit in the niawarra Coal Measures. It typically
occurs as a moderately to poorly sorted, medium- to coarse-grained litharenite with
minor feldspathic litharenite. Matrix material is commonly well-crystallised kaolinite
and less common illite and smectite. This sandstone has a carbonate cement and is
relatively non-porous.
3.2.10 BULLI COAL
The top of the Illawarra Coal Measures is clearly indicated by the Bulli Coal which is
2 to 3 m thick in the area of the detailed study. The unit can be seen to outcrop along
the waters edge from the Jetty Fault to Clifton Fault where it forms the weakest layer
in the lower cliff (Fig. 3.2). The original entrance to Coalcliff Colliery can still be seen
on the rock platform just to the south of the Jetty Fault. North of the Jetty Fault, the
coal seam is believed to outcrop below sea level at the base of the Coal Cliff Sandstone
rock platform.
3.3 NARRABEEN GROUP
Narrabeen Group strata (Table 3.1) generally create significant problems for slope
stability within the niawarra region. When unweathered rocks are tested, the massive
sandstone and dense thinly bedded siltstone and shale members show high values for
most engineering parameters such as strength and durability (see chapter 7). However
weathered rocks show low values for most engineering parameters. Outcrop of
48
Narrabeen Group rocks tend to be deeply and intensely weathered, whilst even fresh
rock commonly deteriorates rapidly on exposure.
Constraints on the simple acceptance of engineering test data arise from the specific
lithologies in the Narrabeen Group. These include the common lithic nature of sand
grains in the sandstone units and the presence throughout the sequence of interbedded
claystone units which are prone to rapid weathering (Fig. 3.3). The presence of unstable
cements and swelling clays contribute to this rapid weathering and disintegration. In
addition, well-developed joints further reduce the overall rock mass quality.
A combination of these factors results in Narrabeen Group rocks commonly giving rise
to fall and slip-prone scree slopes and talus soils where the unit crops out on hillsides.
In sea cliffs, the Narrabeen Group strata are rather more easily eroded than the
Hawkesbury Sandstone strata, and hence relatively rapid rates of cliff-line recession
occur leaving the escarpment protected by the erosion resistant Hawkesbury Sandstone.
Differential weathering of the interbedded Narrabeen Group sequence, coupled with cliff-
line collapse and retreat has generated a benched topography on the Illawarra escarpment
(Fig. 1.4). As a consequence of their poor weathering characteristics, the rocks of the
group give rise to a disproportionate range of stability problems.
3.3.1 LOWER NARRABEEN GROUP
3.3.1.1 COALCLIFF SANDSTONE (CSs)
This is quite a competent unit being composed of fine- to medium-grained quartz lithic
and lithic moderately sorted sandstone. The unit forms a protective rock platform
extending from south of Coalcliff beach to the Clifton Fault at Moronga Park (Figs 3.7,
5.1). The unit is typically 10-12 m thick in the Coalcliff area near the Jetty Fault (Fig.
3.3). It consists of silt and clay laminae, normally exhibiting small-scale cross-
lamination parallel to irregular bedding (Fig. 3.3). Repeated 'fining upwards' sequences
are present within Coal Cliff Sandstone (Ward, 1972). Rockfalls are common in the

49
Coal Cliff Sandstone, especially between Clifton and Coalcliff, where undermining along
the shale bands reduces the support for the overlying vertically-jointed sandstone and
eventually leads to stabs falling off along the vertical joint faces (Fig. 3.3). The retreat
of the coastline is also brought about by rockfalls associated with the marine
undercutting of the Coal Cliff Sandstone (Fig. 3.2). The presence of the Bulli Coal
beneath this sandstone also enhances rockfalls since its permeability and aquifer
properties cause seepage concentrations and the rapid weathering of the underlying
siltstone, which breaks down to form clay typically possessing low shear strength
properties.
3.3.1.2 WOMBARRA SHALE (WSh)
This unit is troublesome in regard to slope stability along the entire escarpment. The
Wombarra Shale is typically 30 to 35 m thick in the area of the study and is composed
of greenish grey shale with fine-grained lithic sandstone interbeds and a thicker coarse
sandstone unit (Otford Sandstone Member). The Otford Sandstone Member has a
maximum thickness of 7 m with cross-bedding and a thin conglomerate bed (Fig. 3.5).
Undercutting occurs at the contact between Conglomerate sandstone and the cross-
bedded finer grained upper portion of the Otford Sandstone Member between Clifton
and Coalcliff along the Lawrence Hargrave Drive. The rapid weathering of the
interbedded siltstone along this contact produces a low shear strength clay while
indicates small rockfalls (Fig. 3.5). In the detailed study area, the formation is subject
to rapid weathering and erosion, with active marine erosion occurring along the coastal
cliff-line (Fig. 3.4). Weathering of the Wombarra Shale, which breaks down to form
low strength clay, and the existence of seepage concentrations within the fractured and
exposed surface layer cause instability along the coastal cliffs. Thus the Wombarra
Shale acts as a bedrock for many landslides along the Lawrence Hargrave Drive (Fig.
1.4). From the north headland at Coalcliff to the Clifton Fault the road is founded on
50
a small bench within this unit. This has led to numerous stability problems along the
road.
3.3.1.3 SCARBOROUGH SANDSTONE (SSs)
This unit forms the sheer cliff-line immediately adjacent to the coast extending from
north of Stanwell Park Beach to the north end of Coalcliff beach (Fig. 1.4). It also
crop out in the steep cuttings immediately above Lawrence Hargrave Drive from south
of Coalcliff to the Clifton Fault. The unit is typically 25 to 30 m thick and consists
predominantly of coarse-grained quartz lithic sandstone. Smaller scale 'fining upwards'
sequences are repeated within unit (Ward, 1972). This unit includes a few thin shale
beds and fairly common fine pebble to granular conglomerate beds. The presence of
interbedded claystone within the Scarborough Sandstone, which weathers to form low
strength clay, and the presence of vertical joints causes many rockfalls (Fig. 3.6). South
from the Coalcliff tunnel to the Clifton Fault it forms the foundation for the railway line
in a very unstable area (Rube Hargrave Park; Fig. 3.7). Below the railway line and
above Stony Creek the outcrop of the Scarborough Sandstone is completely obscured
by steeply sloping talus detritus down to the level of the Wombarra Shale (cf. Fig. 1.5).
It would underlie the road at Stony Creek crossing if it had not been eroded away.
3.3.1.4 STANWELL PARK CLAYSTONE (SPC)
The Stanwell Park Claystone is approximately 36 to 40 m thick in the area of the
detailed study. It is made up of interbedded green to purple/brown claystone and minor
quartz lithic sandstone. Hanlon (1953), in his section of the Stanwell Park Claystone,
recorded numerous sandstone beds up to 4 m thick and estimated the claystone to
sandstone ratio as about 2 to 1. The land slides referred to by Shellshear (1890)
between Stanwell Creek and Coalcliff Railway Station were associated with this
formation. The author has observed several landslides within the Stanwell Park

51
Claystone in the State Rail Authority area. It forms the foundation for the railway line
between Coalcliff Station and the Coalcliff tunnel (Fig. 3.8). The rapid weathering of
the StanweU Park Claystone unit, which breaks down to form clay typically possessing
low shear strength properties and the existence of seepage concentrations within the
fractured surface layers of the Stanwell Park Claystone cause instability in the study
area. Many of the slides associated with the Stanwell Park Claystone have other
complicating causes and are discussed later.
Fractured zones within this unit also appear to act as outlet points for subsurface water
which is believed to percolate down through joints and fractures in the overlying strata.
This unit is quite prone to rapid weathering and is responsible for the creation of the
relatively flat benches within the slopes of the escarpment.
3.3.1.5 BULGO SANDSTONE (BSs)
The Bulgo Sandstone is the thickest of formation in the Narrabeen Group in the
Illawarra area. It is 120 m thick at Clifton, forming over half the total Narrabeen
succession (Ward, 1980). The unit crops out at the top of the escarpment cliffs between
Clifton and Coalcliff and at sea level in the coastal headlands to the north of Stanwell
Park.
The Bulgo Sandstone in coastal districts can be divided into three distinct facies (Ward,
1980). The lower part is very similar to the underlying Scarborough Sandstone and it
was called "pebbly facies" by Ward (1980). Overlying the pebbly facies is a succession
of sandstone, shale, and granule conglomerate which has a very characteristic green
colour in the field. Because this green sediment consists of altered intermediate to basic
volcanic material it is referred to as the "volcanic facies". The sequence between the
top of the volcanic facies and the base of the Bald Hill Claystone has a considerably
higher proportion of shale than the remainder of the Bulgo Sandstone. This part of unit
was called "shaly facies" by Ward (1972).
52
The sediments of the Bulgo Sandstone are fluvial deposits (Ward, 1972). The varying
grain size and the proportion of shale reflect the relative intensity of river action
involved.
This unit is typically quartz lithic sandstone with mainly a medium to coarse grain size,
even conglomeratic in part. Smaller scale 'fining upwards' sequences are repeated
within Bulgo Sandstone (Ward, 1980). Interbedded bands of claystone are present at
the bottom and top of the unit. The presence of interbedded claystone within the Bulgo
Sandstone, which weathers to form low strength clay and undercuts the contact between
sandstone and claystone, causes many small rockfalls along the Lawrence Hargrave
Drive between Coalcliff and Clifton (Fig. 3.9).
In the study area, the Bulgo Sandstone was found to be approximately 120-125 m thick.
It is well jointed and forms the steep slopes below the Hawkesbury Sandstone cliff-
line. High plasticity clay bands exist within the unit which have been found to
contributed to slope stability problems in the area.
3.4 IGNEOUS ROCKS
Igneous activity is limited to small intrusions in the sedimentary rocks. Mining
operations in the area have provided valuable information on dykes and sills. The rocks
forming the dykes and sills are basalt or lamprophyre. Colliery investigation boreholes
in the Stanwell Park valley, to the east of the Illawarra Railway, are reported to have
detected intrusive sills in the Bulli Coal. It is reported that this has resulted in the coal
deposit becoming cindered and thus undesirable for extraction. These data are supported
by the exposure of a fresh basaltic sill which intrudes the Scarborough Sandstone about
700 m north of Stanwell Park Beach (Fig. 1.3).
The plans of the mine workings clearly display the multitude of dykes in the area, the
directions of which are highly dependant upon the jointing and faulting. A s a result,
53
the majority of the intrusions run in a north-south direction, with the remainder typically
following the minor maxima of 055° and 155°.
Few dykes are visible on the ground surface in the study area. One is visible in the
Scarborough Sandstone cliff-line some 30 m south of Stanwell Park Beach. It is
believed that this dyke extends in a southwest direction influencing the shape of the
upper headland. The second exposure, which is actually a dyke zone can be seen some
150 m upstream from the Stanwell Creek railway viaduct. This zone is about 15 m
wide and contains three separate dykes up to 1 metre wide (Adamson, 1974). A third
exposure is a weathered dyke mentioned by (Hanlon, 1958) on the road between
Coalcliff and Clifton. The presence of dykes is a contributing factor for slope
instability, but their effect needs to be determine with more exploratory work. The
dykes can affect the underground water flow and may increase seepage. The properties
seem to vary depending upon the contact strata. Observations by Harper (1915) and
Adamson (1974) suggested that strong alteration of the intrusions occurs when they are
in contact with coal. This is confirmed by many of the dykes reported in the mine
workings consisting of green clay. If not in contact with coal, the dyke material may
exist as a fresh, hard, unaltered basalt or lamprophyre.
3.5 TALUS
M u c h of the bedrock exposures are blanketed with a talus mantle of variable thickness
and nature. Talus thickness along the escarpment ranges from zero to 20 m. Drilling
and excavations conducted by the State Rail Authority in the course of the major slip
remedial works from 1988-1992 revealed typical thicknesses of 5-10 m in the detail
study area.
Multiple massive talus deposits were observed which appear to have resulted from
ancient landslides. The properties of the talus are highly dependent upon its source.
Coarse talus is derived from sandstone strata and commonly consists of very large
54
boulders within a sand clay matrix (Fig. 3.10). Talus derived from claystone is often
finer grained having a larger clay fraction and higher plasticity index. This often occurs
at the base of the talus deposits which commonly mantle the coastal terraces developed
on the shale units. As a result, in a landslide situation, residual shear strengths often
reflect the properties of the clays which are derived from the basal claystone strata.
3.6 SEDIMENTARY STRUCTURES
Sedimentary structures are very common in the Illawarra Coal Measures and Narrabeen
sequences. Brief mention is made of them here because of their influence on the
escarpment stability. Some units within the niawarra Coal Measures are characterised
by the presence of flat bedding and burrowing.
The Narrabeen Group sandstone is characterised by ripple marks and planar high-angle
and trough cross-beds. Shale is characterised by laminated. The claystone units trend
to be structureless other than for some graded bedding. The Wombarra Shale and
Stanwell Park Claystone usually lacks structures apart from bedding. The larger
sedimentary structures result in anisotropy in many of the rocks. However, the
structures are always cemented, thereby reducing their effect on the variation in
orientation of mechanical properties.
3.6.1 SEDIMENTARY ENVIRONMENTS
The depositional settings of the Late Permian Illawarra Coal Measures are deltaic to
fluvial system (Bamberry, 1992). The sedimentary environment of the Narrabeen Group
in the southern part of the Sydney Basin indicates several different type of fluvial
deposits, with an upward succession from piedmont conditions with braided streams to
a swampy deltaic plain (Ward, 1972). This sequence is interpreted as the onshore
portion of a slow marine transgression, probably brought about by subsidence coupled
with declining erosive activity in the hinterland.
55
3.7 SUBSURFACE GEOLOGICAL SEQUENCES AND STRUCTURES
RECOGNISED IN DRILL HOLES
Kembla Coal and Coke (KCC) have carried out a drilling program associated with
planned development in the West Cliff and North Cliff Collieries. Boreholes have been
drilled to some 500 m depth, with the lower 30 to 40 m being fully cored, to cover:
(1) 20 m of roof rock above the coal;
(2) the BuUi seam; and
(3) the immediate floor to about 10 m below the seam.
Some of the boreholes have been fully cored through the Narrabeen Group.
This part of the chapter presents the lithology of the upper coal measures and lower
Narrabeen Group in the fully cored boreholes IL55, IL57, IL60 and IL64 drilled in the
West Cliff area at the locations shown in Figure 3.11.
3.8 GEOLOGY AND SEDIMENTARY STRUCTURES
3.8.1 UPPER ILLAWARRA COAL MEASURES
The upper niawarra Coal Measures, which range in thickness from 10 m to 46 m,
consists of Eckersley Formation (Hargrave seam, Cape Horn seam, and Lawrence
Sandstone, Balgownie Coal and Loddon Sandstone Members) and Bulli Coal at borehole
IL57 (Fig. 3.12b). Only the upper part of this sequence above the Balgownie Coal was
intersected in boreholes IL60 (Fig. 3.12a) and IL64 (Fig. 3.12c). The lower part of the
Eckersley Formation is 27.8 m thick and comprises coal (Hargrave and Cape Horn),
claystone, coaly claystone, carbonaceous claystone and fine-grained sandstone at borehole
IL57 (Fig. 3.12b). Lawrence Sandstone Member is 8 m thick and contains fine- to
medium-grained sandstone with ripple bedding at borehole IL57 (Fig. 3.12b). The
Balgownie Coal is about 0.8 m thick in each borehole. The thickness of the fine- to
medium-grained Loddon Sandstone Member is more variable being 5.7 m thick at
56
borehole IL57, 7 m at borehole IL60 (Fig. 3.12a) and 6.4 m at borehole IL64
(Fig. 3.12c). The Bulli Coal at the top of the niawarra Coal Measures is 2.8 m thick
at borehole IL60, 2.3 m thick at borehole IL57 and 1.90 m thick at borehole IL64.
3.8.2 COAL CLIFF SANDSTONE
The Coal Cliff Sandstone, which ranges in thickness from 6 m to 26.6 m, consists of
interbedded sandstone and siltstone with conglomerate occurring locally. Sandstone is
dominant in the four boreholes (Fig. 3.13). In borehole IL57 (Fig. 3.13b) this unit
consists largely of fine- to medium-grained sandstone, with conglomerate at the base of
the formation. In boreholes IL60 (Fig. 3.13a), IL64 (Fig. 3.13c) and IL55 (Fig. 3.13d)
sandstone is dominant throughout ranges from fine- to coarse-grained and is massive or
cross-bedded. In some beds is the cross-bedding poorly defined. The sandstone
commonly shows an upward decrease in grain size. It is overlain by shale or claystone.
The basal part of this unit consists of dark grey to black claystone or carbonaceous
claystone (boreholes IL55, IL60 and IL64). The dark colour results from the preserved
organic matter in these claystone units. Lower part of the unit contains several fractures
at intermediate angles to the core which have well developed slickensides. The
gradational arrangement of the coarse and fine members suggest that the sandstones
were deposited as channel-fill successions.
3.8.3 WOMBARRA SHALE
The Wombarra Shale ranges in thickness from 26 to 49.5 m. This unit consists of
mostly shale and claystone with interbedded sandstone and conglomerate occurring
locally (Otford Sandstone Member; Fig. 3.14). The ratio of sandstone to shale/claystone
varies from one borehole to another. In boreholes IL55 (Fig. 3.16d), IL57 (Fig. 3.16b)
shale/claystone dominates whereas in borehole IL64 (Fig. 3.16c) this unit consists of
subequal quantities of sandstone and claystone.

57
The sandstone in this unit is dominantly fine- to medium-grained and it commonly
shows an upward decrease in grain size. The basal part of this unit consists of dark
grey shales and interbedded very fine- to fine-grained sandstone. The dark colour
resulted from the preserved organic matter in some shale/claystone beds. The interbedded
very fine- to fine-grained sandstone shows ripple bedding IL60 (Fig. 3.16a). The green
to grey colour through most of the shale/claystone was related to the paucity of
preserved organic matter in it. Fissility in Wombarra Shale is very clear (Fig. 3.15).
The coarse members represent channel-fill or crevasse splay deposits and the fine
members are overbank and floodplain sediments.
3.8.4 SCARBOROUGH SANDSTONE
The Scarborough Sandstone ranges in thickness from 37-50 m and consists of mostly
sandstone and conglomerate with interbedded claystone and shale. Sandstone is the
dominant lithology in the four boreholes. In boreholes IL60 (Fig. 3.17a), IL57 (Fig.
3.17b) and IL64 (Fig. 3.17c) this formation consists largely of sandstone, especially in
borehole IL64. The sandstone in this formation is dominantly fine- to very coarse
grained. Most of the sandstone is massive but some shows cross-bedding, a prominent
vertical joint with a length about 1 m is present in the sandstone at borehole IL55 (Fig.
3.18). The grey claystone/shale interbeds are usually thin (about 0.5-0.7 m ) . The grey
colour of the claystone/shale is related to the paucity of preserved organic matter in
them. The basal part of formation consists of conglomerate (boreholes IL55, IL57) or
fine- to medium-grained sandstone (boreholes IL60, 1164) which overlies the Wombarra
Shale. The fining upwards sequences in the Scarborough Sandstone suggest a fluvial
origin for this succession.
58
3.8.5 STANWELL PARK CLAYSTONE
The Stanwell Park Claystone ranges in thickness from 12-19.5 m. It consists mainly
of claystone and siltstone, with sandstone and conglomerate occurring locally (Fig.
3.19a). The ratio of claystone to sandstone varies from one borehole to another. In
boreholes IL55 (Fig. 3.19d), IL57 (Fig. 3.19b) and IL64 (Fig. 3.19c) claystone is
dominant whereas in borehole H64 this formation consists largely of sandstone with
minor claystone mainly at the base. The sandstone in this formation ranges from fine-
to coarse-grained and commonly shows an upward decrease in grain size. The basal
part of this unit consists of dark greenish-grey and reddish-brown to purplish claystone.
The dark colour results from the preserved organic matter in greenish-grey claystone
beds. The coarse members are probable channel (IL60) or crevasse splay deposits
whereas the fine members represent overbank and floodplain sediments.
3.8.6 BULGO SANDSTONE
The Bulgo Sandstone ranges in thickness from 154-167 m. It is extremely sandy in the
boreholes studied. In boreholes IL57 and IL64 sandstone accounts for about 85% of
the unit. The majority of the sandstone shows cross-bedding and ripple bedding.
Sandstone beds in the upper of the formation are generally finer than those in the lower
part of the formation and claystone is slightly more abundant. The basal part of
formation consists of fine- to coarse-grained sandstone in the four boreholes (Fig. 3.20).
At the base of formation dark greyish-green coarse- to very coarse-grained sandstone
containing abundant lithic grains has a sharp erosional contact with the underlying
Stanwell Park Claystone. This lower part is very similar to the underlying Scarborough
Sandstone and represented the "pebbly facies", of Ward (1980).
The succeeding 51 m of this unit consists of fine- to very coarse-grained sandstone
interbedded with dark grey shale, grey claystone and very coarse granule conglomerate.
The thickness of interbeds ranges between 0.5-0.8 m for shale, between 0.02-1.7 m for

59
claystone, between 0.04-1.0 m for fine siltstone and between 0.07-0.75 m for
conglomerate (Fig. 3.20). It is referred to as the "volcanic facies" (Ward, 1980).
The fine- to medium-grained sandstone contains prominent vertical joints with a length
of between 0.7-1.5 m and subvertical joints with a maximum length of 1.5 m (e.g. Fig.
3.21). The upper part of the unit contains more greyish-grey claystone (Fig. 3.20a) and
represents the "shaly facies") of Ward (1980). It was overlain by the Bald Hill
Claystone. The fining upwards sequences in the Bulgo Sandstone suggest a fluvial
origin for this succession.
3.9 DISCUSSION
The importance of stratigraphy in slope development was emphasised previously.
Stratigraphy must be determined in considerable detail for stability evaluations or design
investigations. All stratigraphic work and sample logging should be oriented toward
engineering applications. Particular attention should be directed toward recognition and
description of (a) thick sequences of weak rocks (claystone and shale) and the nature
of interbedded sequences, (b) thin marker beds, and (c) old failure surfaces.
In the Narrabeen Group, thick sequences of weak rocks (Stanwell Park Claystone and
Wombarra Shale) are rather more easily eroded than sandstone strata and hence
relatively rapid rates of recession occur. Undermining along these thick sequences of
weak rocks, at the contacts between the claystone and sandstone, reduces the support
for the overlying vertically-jointed sandstone and eventually leads to stabs falling off
along the vertical joint faces. Thin marker beds (coal seams) in the niawarra Coal
Measures commonly act as aquifers, with claystone beds acting as aquitards. Slope
instability is usually related to the presence of the aquifers which are the source of high
pore water pressures.
60
The lithic nature of sand grains in the sandstone units, the presence throughout the
sequence of interbedded claystone units which are prone to rapid weathering, and the
weU developed joints all tend to reduce the overall rock mass quality.
Landslides that occur within in soft rock masses (Stanwell Park Claystone and
Wombarra Shale) typically involve bedding as the basal shear surface, and joints or
other defect controls for lateral and headscarp release (Brown, 1974; Hancox, 1974).
According to Bell and Pettinga (1988) two types of bedding control can be identified:
(a) the presence of clay-rich interbeds, such as claystone within the Bulgo Sandstone,
and (b) the presence of organic-rich sediments, such as carbonaceous claystone in the
Illawarra Coal Measures. The geotechnical significant of bedding control is two-fold:
firstly by providing a layer of lower permeability above which positive pore water
pressures can increase; and secondly the presence of relatively low shear strength
materials within which or upon which sliding may occur (Bell and Pettinga, 1988).
According to Barton (1988) sedimentological control has an affect on slope stability by
(a) changes in lithology causing a permeability contrast allowing localised high pore
pressures; (b) increased clay content - this was suggested by Simpson and Walton
(1970) as the initial cause of most continuous bands of clay mylonite observed in the
English coal measures; (c) changes in clay mineralogy - this has been suggested by
Fookes (1967) for shear surfaces in the Siwalik Clay; and (d) dissolution of soluble
minerals resulting in increased porosity and lower shearing resistance.
In the Coal Cliff Sandstone along the coast-line between Clifton and Coalcliff the fine
grained sandstone near the base of the formation sometimes grades into claystone (Fig.
3.22a). Weathering and erosion of this claystone reduces the slope stability on the Coal
Cliff Sandstone. In some places, near the top and middle of this formation, claystone
interbeds occur within the dominantly sandstone units, and result in the stability of the
sandstone unit being decreased by the water flow and weathering of the claystone
(Fig. 3.22b).
61
Fractured zones within Narrabeen Group rocks appear to act as outlet points for water
percolation. Commonly the Scarborough Sandstone is conglomeratic with chert clasts,
and shows moderately porosity and permeability especially in the basal half. This has
produced a perched water table in this formation, with water flow concentration along
the junction with the underlying Wombarra Shale. Weathering and erosion of the
Wombarra Shale causes many rockfalls (Fig. 3.23). Between Clifton and Coalcliff along
the Lawrence Hargrave Drive some sandstone beds are present within the Wombarra
Shale. The sandstone beds are more prominent and have the effect of reducing the
amount of weathering of the shale that is exposed and eroded away. It has been
observed at this locality, and at other localities throughout the study area, that often
when interbeds of a more competent rock type occur within a claystone unit, they have
the effect of stabilising the claystone unit. In contrast, whenever claystone interbeds
occur within dominantly sandstone units, the stability of the sandstone unit is decreased.
In considering the Narrabeen Group rocks, the Wombarra Shale and the Stanwell Park
Claystone are generally least influenced by the stability afforded by sandstone interbeds.
The greatest stability for sandstone unit occurs when there is a low thickness of
claystone interbeds. Amongst the Narrabeen Group sandstones, the Bulgo Sandstone is
likely to be the most unstable because this formation consist of thickly bedded sandstone
with numerous intercalated siltstone and claystone beds up to 3 m thick. This
interbedded claystone has most effect on the stability of formation. Weathering and
erosion of claystone causes many rockfalls in the study area especially between Clifton
and Coalcliff along the Lawrence Hargrave Drive (Fig. 3.9b). In contrast the most
stable unit is the Scarborough Sandstone which overlying a few lenses of claystone.

62
63
CHAPTER 4
PETROLOGY OF NARRABEEN GROUP SANDSTONE
4.1 INTRODUCTION
McElroy (1954) studied the composition and texture of the Narrabeen Group sediments
in a systematic manner. Loughnan (1963) presented a petrological study of a vertical
section through the Narrabeen Group at Helensburgh. Ward (1971a,b) made a
comprehensive petrological study of the Narrabeen Group sediments in the southern
Sydney Basin. Bai (1991) studied the petrology, diagenesis and reservoir potential of
the Narrabeen Group sandstone in the Sydney Basin. All these studies show that the
content of detrital quartz grains generally increases towards the top of the group and
that the detrital lithic fragment content generally decreases.
The aims of this petrological study are to determine variations in the detrital
composition of the sandstone units, and to assess the effects of these compositions on
weathering, engineering properties and slope stability in the northern niawarra. The
influence of composition of sandstone on engineering properties of the Narrabeen Group
and land instability will be discussed in chapters 7 and 8.
4.2 STUDY METHODS
Thin sections were cut from 40 sandstone samples collected from the geologically
logged borehole DL55 in the North Cliff area and outcrops between Scarborough and
Stanwell Park Station. They were impregnated with blue dye to facilitate observation
of porosity in thin sections. All thin sections were examined under a petrological
microscope to observe grain size, mineralogy, texture, porosity, dissolution features,
sorting and roundness. Some samples are altered to such an extent that the detrital
lithic fragments could not be distinguished from the clay matrix and such samples are
64
considered to be unsuitable for reliable point counting. Of the 40 samples, a total of
36 thin sections were selected for point counting. Photomicrographs were taken of
selected thin sections using an Olympus (Model BHSP) Camera with 100 ASA film.
Except in a few cases, at least 250 counts were made for each slide to ensure a
reasonably high accuracy in the result. The results of point counting are presented in
Tables 4.1 to 4.4.
Sorting and rounding were estimated from thin section examinations. The degree of
sorting ranges from very poorly, through poorly to well sorted and the degree of
rounding ranges from angular, through subangular and subrounded to well rounded.
Even though porosity characteristics were examined under the petrological microscope,
the study of porosity characteristics is not an easy task since the blue dye penetration
is not always complete in every thin section.
4.3 MINERAL COMPOSITION
4.3.1 QUARTZ
The detrital quartz grains recognised consist of three types:
(1) unstrained monocrystalline grains displaying uniform extinction;
(2) strained monocrystalline grains displaying undulatory extinction; and
(3) polycrystalline grains.
In addition, a trace amount of chalcedony was also recognised in a few thin sections.
Usually fresh samples have the highest quartz content, whereas weathered samples have
the lowest quartz content.
It seems that at least some of the quartz grains were derived from granite (Blatt et al,
1980). Some of the detrital monocrystalline quartz grains contain many fluid inclusions
and have a very cloudy appearance under plane polarised light. They are most likely
derived from hydrothermal vein sources (Fig. 4.1).
Detrital polycrystalline quartz grains are present in three different forms:
65
(1) composite grains consisting of uniformly sized crystals, which have mostly straight
or sutured contacts;
(2) composite grains consisting of different sized crystals; and
(3) composite grains with preferred orientation of elongate crystals, some of which
have sutured contacts. Type (3) is the least abundant.
The detrital polycrystalline quartz grains (Fig. 4.1) are considered to be largely derived
from metamorphic rocks, including quartzite, as most of them contain more than 5
individual crystals, sutured contacts and or preferred orientation (Blatt et al, 1980). In
addition, a small number of the polycrystalline quartz grains show a cloudy appearance
under plane polarised light, which is caused by abundant fluid inclusions. Quartz
overgrowths were recognised in a number of thin sections (e.g. Fig. 4.5), particularly
those rich in quartz, and in some thin sections it is not easy or possible to distinguish
the quartz overgrowth from the detrital quartz grain due to lack of a clear boundary.
For this case cathodoluminescence is used to determinate the quartz overgrowth from
the detrital quartz grain.
4.3.2 FELDSPAR
The majority of the sandstones, especially those rich in detrital quartz grains, have less
than 2% detrital feldspar. Detrital feldspar grains are generally altered. In fact, some
of them have altered to such an extent that it is impossible to identify the feldspar. In
addition detrital feldspar grains are easy targets for carbonate replacement (Fig. 4.2).
Some have been partly or completely replaced by carbonate and some of the secondary
pore spaces in thin sections were probably created by the dissolution of detrital feldspar
grains.
Patchy kaolinite flakes, filling the outline of detrital feldspar grains; are considered to
result from replacement.
66
4.3.3 ROCK FRAGMENTS
Rock fragments include volcanic, metamorphic and sedimentary rock fragments.
Volcanic rock fragments mostly comprise chert grains that may have been derived from
silicic volcanic rocks or from silicified flows and tuff. Sedimentary clasts consist of
mudstone, shale and siltstone fragments. Metamorphic rock fragments consist mainly
of slate and schist and were recognised by the preferred orientation of elongate minerals
in the fragment. Rock fragments make up more than 50% in some of the lithic
sandstones (cf. Boggs, 1992).
4.3.4 CHERT
Chert is made up of microcrystalline quartz (Midgley, 1951) as determined by X-ray
diffraction. It is distinguished from detrital polycrystalline quartz grains by its crystal
size, and from volcanic rock fragments by its relatively clean surface under the
petrological microscope and its quartz composition. The distinction between silicified
volcanic chert and detrital chert grains is not possible in some thin sections. In this
study, the uncertain detrital clasts were counted as chert. In some chert grains,
radiolarian remains, which occur as nearly perfect spheres filled with quartz, were
recognised. Their presence provides strong evidence for the identification of the grain
as detrital chert.
4.3.5 MICA
Mica includes muscovite and biotite with muscovite being more abundant. Due to
mechanical compaction, elongated muscovite plates are usually deformed around the
adjacent hard detrital grains. Mica content ranges from 0.2% to 3.6% of the total
sandstone.

67
4.3.6 ACCESSORY MINERALS
In the majority of samples, no accessory minerals were identified. Where present they
include tourmaline, zircon and opaque grains. In the samples with accessory minerals,
the content is generally 0.2% to 1%.
4.3.7 IRON OXIDES
Iron oxides are present in the all of the samples. They range from 0.6% to 14.5% of
the total sandstone. They are determined by the brownish colour, irregular shape,
opaqueness and aphanitic texture. They occur both as detrital grains and as secondary
cement.
4.3.8 CARBONATE
Carbonate occurs in two types of texture: microcrystalline and macrocrystalline, with the
latter as the dominate one. The former usually occurs as irregular patches filling inter-
grain pore spaces. The macrocrystalline carbonate crystals generally show two clear
cleavage directions and have clean surfaces under plane polarised light. The Carbonate
not only fills inter-granular pore spaces but also partly or completely replaces/corrodes
detrital grains, as well as forming a coat on detrital grains. Carbonate cement coating
detrital grains is much less common than cement filling inter-granular pore spaces and
the secondary carbonate replacing/corroding detrital grains.
The majority of the sandstone samples contain carbonate cement. The highest content
of carbonate (carbonate cements and replacement carbonate) was recorded as 35.6% of
the total sandstone in a fresh core sample from the Coal Cliff Sandstone (Fig. 4.2). In
some thin sections, partially dissolved carbonate cements were recognised. The
dissolution has created secondary pore spaces. In the point counting no attempt was
made to record the components replaced by carbonate (mainly feldspars and volcanic
rock fragments). Therefore, the content of carbonate is high.
68
The carbonate cements include calcite, siderite and perhaps ferroan calcite, dolomite and
ankerite. However, the differentiation of them is not easy under the petrological
microscope.
4.3.9 KAOLINITE
Kaolinite occurs in the all of the samples, ranging from 0.6% to 31.3% of the total
sandstone. Kaolinite flakes filling inter-granular pore spaces can often be identified
positively under the petrologic microscope (Fig. 4.3) and by scanning electron
microscopy (SEM; Fig. 4.4a). It is generally the product of intense weathering of
feldspar or clayey rocks in warm and humid climates; kaolinite is often difficult to
distinguish from chert and finely crystalline volcanic rock fragments. X-ray diffraction
provides the most certain method of identification.
4.3.10 MATRIX
The definition of matrix used here follows that of Morris et al. (1979). It generally
refers to all particles which are too fine to be identified with the petrological
microscope. Thus it includes all clay minerals, which may be detrital or diagenetic, clay
(< 4 microns) and silt-sized (4-62.5 microns) mica, quartz and feldspar, and the products
created by breakdown of fine-grained rock fragments.
The definition of clay fraction in soil mechanics is different. In the latter definition clay
fraction is that percentage of soil which has a particle size below 0.002 mm (2 microns)
and which consists of clay minerals. The fraction below 0.002 mm which does not
consists of clay minerals is called "clay-size" fraction and not clay fraction. Silt sized
particles are not included in either definition.
The matrix commonly occurs as patches filling inter-granular pore spaces. The most
common matrix observed in the thin sections consists of detrital clay minerals and silt-
sized quartz grains. Most of the sandstones studied have a matrix content forming more
69
than 10% of the total sandstone. The highest matrix content of 28.6% was recorded in
a slightly weathered Bulgo Sandstone (Table 4.3b, sample SWBSs6). The point count
data show that the amount of matrix is generally inversely related to the grain size.
The coarse-grained sandstones tend to have less matrix than the fine-grained sandstones.
In addition, the amount of matrix generally increases at the same time as the volcanic
rock fragment context decreases.
The quantities of matrix and carbonate cement are also inversely related. The higher
the carbonate cement, the lower the clay matrix. This is illustrated in Table 4.4b where
the Otford Sandstone Member conglomerate sample (SWCONG5) has a much higher
carbonate content than the matrix-rich sandstone sample (SWOSM4).
4.3.11 CEMENT
The majority of the sandstone samples contain calcite, kaolinite and iron oxide cement,
but minor chlorite and quartz cement is present in some samples (e.g. Fig. 4.4b).
Calcite and kaolinite are the most common cementing agents in the Coal Cliff
Sandstone. Calcite, siderite and kaolinite cements occur in the sandstones of Wombarra
Shale (Otford Sandstone Member). Kaolinite and calcite are common cementing agents
for the Scarborough and Bulgo Sandstones (Figs 4.5, 4.6), but minor quartz cement is
also present in some samples.
In some thin sections, authigenic chlorite coating detrital grains can be identified
positively under the petrologic microscope.
4.3.12 POROSITY
Since all thin sections were impregnated with blue dye, the pore space were identified
by the blue colour under plane polarised light. Porosity includes pores of both primary
and secondary origin. Visual porosity varies from 0.2% to 4% of the total sandstone.
70
4.3.13 TEXTURE OF SANDSTONES
As indicated by point count data, the Narrabeen Group sandstone in the northern
Illawarra between Scarborough and Stanwell Park consists principally of detrital quartz
grains, lithic fragments (including chert) and detrital feldspar grains.
The rock fragments range in roundness from angular to well rounded with the majority
of them being subangular to subrounded. The well rounded quartz grains probably
represent second cycle sediment and were derived from earlier deposited sandstone
sequences. The poorly rounded angular quartz clasts were derived from volcanic
sources.
The sandstone of the Narrabeen Group in this area ranges in sorting from very poorly
to well sorted. Coarser sandstones tend to be poorly to very poorly sorted whereas finer
sandstones tend to be moderately to well sorted.
4.3.14 CLASSIFICATION OF SANDSTONE
The classification of sandstone is a controversial subject. A summary of sandstone
classifications was given by Pettijohn et al (1987). The sandstone classification (Fig.
4.7) used in this thesis is modified from the one proposed by Folk (1980). A 50%
quartz line is added to Folk's classification to emphasise those sandstones with more
than 50% but less than 75% detrital quartz grains. The adjectival modifier "quartzose"
is used to differentiate these lithologies, e.g. quartzose litharenite. The results of
calculations for the classification of Narrabeen Group sandstones are shown in Tables
4.5 to 4.8. Based on this classification fresh Coal Cliff Sandstone is quartzose
litharenite whereas slightly weathered to moderately weathered sandstone generally falls
in the litharenite field (Fig. 4.7a). All of the samples are moderately sorted. Fresh and
slightly weathered samples from the Otford Sandstone Member are litharenite and
quartzose litharenite (Fig. 4.7b). Fresh, slightly and moderately weathered Scarborough
Sandstone samples are all quartzose litharenite (Fig. 4.7c). They are moderately sorted
71
sandstones. Fresh Bulgo Sandstone ranges from litharenite to sublitharenite. Slightly
weathered and moderately weathered samples are quartzose litharenite (Fig. 4.7d). These
samples are moderately sorted.
4.4 PETROLOGICAL AND MINERALOGICAL ASPECTS OF WEATHERING
Thin sections have been cut from fresh and weathered sandstone from the Narrabeen
Group so that the effects of alteration with an increase in weathering could observed.
Forty thin sections were examined, however, only those thin section which show specific
relevant features are described. The rocks have been sampled from a variety of
locations. Fresh samples came from borehole IL55 at different depths. This borehole
was drilled by Kembla Coal & Coke Pty Ltd (KCC) in the North Cliff Collieries.
Table 4.1 shows the analyses of fresh, slightly weathered and moderately weathered
samples from the Coal Cliff Sandstone. Weathered samples were selected between
Clifton and Coalcliff and fresh samples came from borehole IL55 at depths of 435.75 m
to 442.3 m.
Table 4.4 shows analyses of fresh and slightly weathered samples from the Otford
Sandstone Member. Fresh samples came from borehole IL55 at depths of 411.5 m to
414.7 m. Slightly weathered samples were selected from the side of the road just south
of Jetty Fault between Clifton and Coalcliff.
Table 4.2 shows analyses of fresh, slightly weathered and moderately weathered samples
from the Scarborough Sandstone. Weathered samples were collected between Clifton
and Coalcliff. Fresh samples came from the borehole IL55 at depths of 394.7 m to
402.1 m.
Table 4.3 shows analyses of fresh, slightly weathered and moderately weathered
samples from the Bulgo Sandstone. Fresh samples came from the IL55 borehole at
depth of 289.6 m to 316 m. Slightly weathered samples were selected between Clifton,
and Coalcliff, while moderately weathered samples came from Stanwell Park Station.
72
It was not necessary to make thin sections of all the highly weathered specimens; X-
ray diffraction was a valuable tool in determining the mineralogy of these specimens.
These specimens have been weathered at the surface. Specimens have a distinct milky
appearance indicating that the fresh constituents of the rock show some degree of
alteration, especially the feldspar and rock fragments. The progressive increase in iron
oxide content and related decrease in siderite content is a result of the soluble ferrous
ion being unstable in an oxidising environment. With a fluctuating water table the
ferrous ion from the siderite is converted into the insoluble ferric ion to form iron
oxides, usually limonite. It appears that the formation of the iron oxides is accompanied
by a wedging action which prises some grains apart and thus reduces the perfect
packing. Decrease in chlorite content is evident with an increase in weathering (Figs
4.8 to 4.10).
Some samples have been weathered in a non-oxidising environment because they were
in a location where alteration was due to the effect of groundwater flow. This
groundwater was probably in a confined aquifer which was in a reducing environment.
The coarse-grained nature of the sandstone would have undoubtedly aided the passage
of water and thus weathering. In strongly ferruginised moderately weathered sandstone
most of the matrix and cement has been replaced by iron oxides, and rock fragments
have been partially altered.
From all the thin sections examined, some general conclusions have been drawn
concerning the changes occurring due to an increase in weathering from fresh to
weathered strata. These are listed below :
(1) Decrease in siderite and calcite content with an increase in weathering (Fig. 4.11).
This is caused by dissolution of the carbonate cement once it comes into contact
with bicarbonate-bearing meteoric water.
(2) Increase in the angularity of the edges of the feldspars and rock fragment grains
resulting from dissolution.
73
(3) Quartz and rock fragments become progressively more fractured, probably as a
result of matrix dissolution increasing the pressure on grain contacts.
(4) Increase in overall iron staining and increase in thickness of iron oxides around
the edges of the quartz grains and rock fragments with increase in weathering (Fig.
4.12).
(5) Increase in chlorite content and diagenetic alteration of chlorite enhances the
weatherability of rock fragments.
(6) Biotite becomes progressively degraded to become very pale hydrobiotite.
(7) Slight decrease in grain to grain contact and perfection of packing compaction
resulting from matrix and cement dissolution.
(8) Increase in the amount of matrix with increase in weathering (Fig. 4.13).
(9) Decrease in the amount of chert with increase in matrix (Fig. 4.14), due to break
down of silty volcanic chert grains.
These changes are a combination of physical and chemical weathering processes. The
main chemical changes are the transformation of the cement and matrix, primarily
siderite to chlorite and matrix clay to sericite, and the overall increase in the iron oxide
content. M a n y of the rock fragments are already quite milky in thin section in the fresh
rock and their subsequent alteration is only slight. O n the other hand the physical
changes are more widespread and cover the fracturing of the grains and the overall
decrease in grain to grain contacts. It is considered that, resulting from grain and
matrix dissolution, both the physical and chemical weathering processes play a very
significant effect on the mechanical properties of rock. The clear exception is that of
the increase in iron oxide cement, however, this feature only affects the surface rocks
and the vast majority are unaffected by significant iron staining. It has been observed
in the field between Clifton and Coalcliff that there are two distinct types of shale in
the Wombarra Shale. Both have an overall greenish grey colour and appear in hand
specimen to be of similar composition. One type is massively bedded with a hackly
74
fracture and is interbedded with sandstone units. The hackly fracture only occurs on
exposed and weathered surfaces. The other type of shale shows strong bedding and is
characteristically laminated and fissile. Slightly weathered specimens crumble easily and
flakes readily fall off. This distinction in shale types is most important because it has
a marked effect on the stability of coastal cliffs. The different textures could be due
to the mechanism of sedimentation. It is believed that the massive shale consists of
randomly orientated flocculated clays and fine-grained quartz. The fissile shale consists
of dispersed clay, which have ideal parallel orientation, but the parallel orientation has
been disrupted in places by coarse quartz grains and rock fragments. These coarse
grains would have the effect of increasing the fracture permeability of the shale and so
this fissile shale is much more easily weathered.
4.5 MINERAL IDENTIFICATION USING X-RAY DIFFRACTION
4.5.1 INTRODUCTION
X-ray diffraction is a valuable tool in determining the mineralogy of sedimentary rocks.
This is especially important for claystone, shale and weathered rocks where petrographic
methods are of limited utility (Lewis and McConchie, 1994).
The basic concept in X-ray diffraction is that a beam of X-rays is diffracted from the
lattice planes of any crystalline substance. This phenomenon is similar to the reflection
of white light from a plane mirror. It should be noted that non-crystalline (amorphous)
substances such as glass do not produce a diffraction pattern.
4.5.2 AIM OF STUDY
Knowledge of clay mineralogy is very important in engineering geology. These minerals
are common in soil, claystone, shale, sandstone and limestone. One member of this
family is smectite (montmorillonite) which is known as a swelling or expanding clay,
75
because it expands when saturated with moisture, and can cause serious problems such
as:
(1) swelling clays can contribute to instability of cliffs and rock slopes especially in
the region above the groundwater table where the rocks are subjected to alternating
wet and dry conditions as a function of rainfall and infiltration;
(2) swelling clays can cause mass movement because expansion of clays occurs during
or after periods of heavy rainfall in hillslope materials (e.g. the talus deposits);
(3) expanding clays can cause failure of open mine faces or failure of parts of
underground workings; and
(4) swelling clays can cause uplift of foundations, and damage to tunnels, railway lines
and roads.
The aim of this study is to identify the clay species present in the soils and weathered
materials and to compare them with clay minerals from weathered and fresh rocks and
subsoils. This should enable a determination of the effects of weathering in regard to
slope stability.
4.5.3 METHOD OF STUDY
Method of study can be divided into six sections as follows.
4.5.3.1 SAMPLE COLLECTION
More than one hundred samples were collected for this study. Samples of weathered
rocks, and surface soils were collected from the northern Illawarra district between
Coledale and Stanwell Park Station. The samples included weathered sandstone
interbedded with coal in the upper Illawarra Coal Measures, weathered shale interbedded
with the Coal Cliff Sandstone, fresh and moderately weathered Wombarra Shale, highly
weathered Scarborough Sandstone, weathered shale interbedded with the Scarborough
Sandstone, fresh and moderately weathered Stanwell Park Claystone, highly weathered
76
Bulgo Sandstone and weathered shale interbedded with the Bulgo Sandstone. These
samples were studied using X-ray diffraction to determine the variability in clay
mineralogy, which may accompany an increase in weathering, and the associated
changes of mechanical properties of the rocks. For comparison, fresh samples were
selected from borehole IL55 between the depths of 431.20 m in the Wombarra Shale
to 347.7 m in the Stanwell Park Claystone. Weathered Bulgo Sandstone and
interbedded shale were collected from Stanwell Park Station. Weathered Stanwell Park
Claystone was selected from north of Coalcliff Station and beside the Harbour Fault
between Coalcliff and Clifton. Weathered Wombarra Shale was sampled from beside
the Jetty Fault, north of the Jetty Fault, the road down to the old Coalcliff tunnel portal
and between Wombarra Station and Coledale Station. Weathered shale interbedded with
Coal Cliff Sandstone was collected from the road down to the old Coalcliff tunnel
portal. Weathered sandstone interbedded with coal in the upper niawarra Coal Measures
was selected from the base of the Moronga Park slump at Clifton. Talus samples were
collected from all the studied landslide areas (head, crown and toe).
4.5.3.3 WHOLE ROCK ANALYSIS
The most basic application of X-ray diffraction for mineral identification is in the
analysis of whole rock samples. For good results, grain size must be reduced to a
diameter of 5-10 microns. Care must be taken in particle size reduction because
crystalline grains may be damaged during grinding.
For sample preparation, first the sample must be ground to a fine powder. This can be
done quite simply with a mortar and pestle or mechanical grinder. In this study both
techniques were used. First, the rock samples were reduced to fragments less than
10 mm in diameter with the aid of geological hammer. Approximately 50 grams of this
reduced fraction was crushed in a mortar and pestle over a period 30-45 minutes. The
mechanical crusher took between 5 and 15 seconds depending upon the hardness of the
77
sample, usually harder and fresher samples taking 15 seconds, while the weathered and
softer samples took 4 to 10 seconds.
The crushed sample was mounted in an aluminium holder and X-rayed. A simple
qualitative analysis is required for the interpretation of the chart record (e.g. Fig. 4.15).
The 20 angle increases from left to right on the horizontal, and the intensity of the
diffracted peak is given by the vertical scale. The peaks are identified in terms of 20
which is converted to lattice spacing. For experimental purposes the position of the
diffraction peak is taken as the position of the point of greatest intensity.
As all minerals and all crystalline materials possess a unique X-ray diffraction pattern,
a comparison of diffraction patterns of the unknown mineral phases with a set of
standard patterns wUl lead to their identification. This method is very similar to human
fingerprint identification (Hardy & Tucker, 1988).
These standard patterns have been compiled by an international organisation called the
Joint Committee on Powder Diffraction Standards (JCPDS), which collects and updates
powder diffraction data. In principle, by a systematic searching of the JCPDS powder
diffraction index for minerals, it is possible to identify almost any mineral that may be
present, provided that sufficient peaks are present for that mineral (usually a minimum
of three). This operation can be carried out by computer using the JCPDS file and a
commercially available computer system.
Problem may arise with complex mineral mixtures since numerous peaks will be
produced which may lead to erroneous combinations.
4.5.3.4 CLAY MINERAL ANALYSIS
X-ray diffraction is the most efficient method for determining the presence of clay
minerals in claystone, shale (Surendra and Lovell, 1984), sandstone and limestone.
Although some clay minerals are evident in whole rock diffractograms, the most
satisfactory method is to extract and separately analyse the clay fraction (usually defined

78
as less than 4 microns). It is particularly important to do this in the case of very fine
grained and poorly crystalline clays, which are unlikely to give a recognised diffraction
pattern in a whole rock scan (Hardy and Tucker, 1988).
In general, for identification of clay minerals by X-ray diffraction a sample must be run
on the diffractometer three times. On the first run an untreated oriented sample,
prepared by suction onto a ceramic disc, is used. On the second run the sample is
glycolated to expand any expandable clays. For the third run a sample that has been
heated to 600°C for 1 h to 2 h is used (on the ceramic disc). This heating causes some
clay lattices to collapse.
4.5.3.5 NORMAL OR UNTREATED SAMPLES
Such samples were run after they had come to equilibrium with the atmosphere in a
silica gel desiccator. They were run at 2° 20 per minute, initially between 4° and 70°
20, at scan speed of 2° per minute. For Cu radiation all (001) basal reflections for
kaolinite, chlorite, illite, montmorillonite (smectite) and mixed layer clays lie between
4.5 and 14° 20. The (002) and (004) reflections of kaolinite and chlorite occur at
24.85° and 25.15° 20 respectively.
4.5.3.6 GLYCOLATION
After the samples had been run in their untreated state, they were glycolated and run
again between 4° and 16° 20. The object of the glycolation was to expand the
expandable clays to aid identification.
The process of glycolation is as follows: clay samples were prepared by suction system
on the ceramic discs and were placed in a vacuum desiccator, one or two drops of
ethanediol (ethylene glycol - CH2OH.CH2OH) was gently placed in the centre of each
disc. Samples were ready for X-ray analysis between 1 and 2 hours later.
79
4.5.3.7 HEATED SAMPLES
One episode of heating was carried out on each sample. Samples were heated to 600°C
in a muffle furnace for one hour. After the sample was removed from the muffle
furnace it was allowed to cool, placed in a silica gel desiccator and then rerun between
4° and 16° 20. This was to measure the true area of the 8.85° 2 (10A) 001 illite peak
(Gillott, 1989). X-ray analysis was carried out on batches of 7 to 10 samples, with
each batch being glycolated and heated as a group.
4.6 RESULT OF X-RAY ANALYSIS
The results of the relative abundance of minerals for whole rock samples are tabulated
in Tables 4.9 to 4.21 and for fill and talus materials the data are provided in Tables
4.22 to 4.25.
Sixty four whole rock samples were used for determining the bulk mineral composition
(claystone, shale and highly weathered rocks), 26 samples were used for determining the
composition of the talus (Table 4.23 to 4.25), and 10 samples were used for determining
the composition of the fill (Table 4.22). One hundred clay samples were used to
determine the type of clay minerals in the clay-rich samples (ceramic discs).
The raw intensity of the main clay minerals kaolinite, illite and smectite
(montmorillonite) vary from trace amounts in some samples to a moderate amount in
other samples.
Kaolinite content is generally moderate. Illite is usually present in rare to trace amounts
but is moderate in sample H4 (Table 4.22) from the Harbour slip and common in
sample J9 (Table 4.23) from the Jetty Fault slip.
Smectite (montmorillonite) is commonly in rare to trace amounts in the majority of
samples. Quartz is abundant in all samples.
Feldspar has not been detected in many samples. Some samples have a little orthoclase
(rare to trace) but it is common in sample C3 (Table 4.25). Micaceous minerals are
80
generally few to rare except in samples Jl, J9 and sample VSS4 (Table 4.9; highly
weathered sandstone belonging to the Illawarra Coal Measures) where they are common.
Carbonate minerals (Ca, Mg, Ba) are usually rare to trace in the whole rock sample.
Goethite is mostly rare, but it is generally moderate in fill derived from weathering of
interbedded lower strength rocks (Harbour slip). This mineral has not been detected in
the volcanic sandstone samples (VSS1-VSS5) from the Illawarra Coal Measures.
For this study the result of glycolation and heating of one sample is shown graphically
in Figure 4.16 and described in more detail in the smectite section.
4.6.1 KAOLINITE
In general, the determination of kaolinite group minerals by X-ray diffraction is simple.
All (001) basal reflections for kaolinite lie at 12.28° 20 (7.15A) and the (002) reflection
lies at 24.94° 20 (3.57A). Usually higher-order reflections are too weak for recognition
in samples composed of several clay minerals. Disordered (poorly crystallised) kaolinite
shows broader and less intense basal reflections (Lindholm, 1987).
After glycolation there is no change for this mineral but after heating to 600°C, the
kaolinite structure collapses (peaks disappear). Kaolinite and chlorite both have 7A
reflections in untreated samples. After heating, the kaolinite loses its crystalline
character and its 7A reflection disappears; chlorite is also affected by heating and its
7A peak collapses, but its 14A peak is enhanced after heating, thus confirming the
presence of chlorite.
4.6.2 ILLITE
Illite generally has a broad (001) reflection at approximately 8.8° 20 (10A) with an
integral series of basal reflections including 17.7° 20 (5A) and 26.75° 20 (3.3A). After
glycolation there is no change for this mineral but after heating the (001) reflection may
become more intense.
81
4.6.3 SMECTITE (MONTMORILLONITE)
The basal reflection of smectite is variable from 6.80° to 5.89° 20 (13-15A), higher-
order basal reflections are irregular. Glycolation is accompanied by expansion for this
mineral. The (001) reflection increases to approximately 5.2° 20 (17A) with an integral
series of basal reflections including 10.4° 20 (8.5A) and 15.5° 20 (5.7A). After heating,
the (001) reflection collapses to between 9.83° and 8.84° 20 (between 9 and 10A) with
corresponding decreases for the integral series of higher-order basal reflections
(Lindholm, 1987).
4.6.4 MIXED-LAYER CLAYS
Disordered mixed-layer clays are difficult to identify, in some instances where illite is
the dominant clay mineral present in a sample, there is sometimes a marked "tail"
present on the low-angle side of the 10A peak. This is taken to indicate the presence
of mixed-layer clay minerals. Following sample treatment with ethylene glycol, a 10A
illite peak broadens towards the high angle side. This may be interpreted as an
indication of disordered mixed-layer minerals (Lindholm, 1987).
After heating to 600°C mixed-layer clays are identified by a the presence of a sharp
peak at 8.84° 20 (10A), a broad peak between 7.8° and 9° 20, and illite is identified by
the presence of a sharp peak at 8.84° 20 (10A).
4.7 MUD ROCKS AND SANDSTONES
At the base of Moronga Park slump, highly weathered sandstone consists of mainly of
quartz, mica and kaolinite; feldspar and carbonate are rare (Table 4.9). Weathered grey
shale interbedded with the Coal Cliff Sandstone (Table 4.10) consists of mainly quartz
but mica, kaolinite and smectite are in rare to trace amounts and carbonate content is
minor to rare.
82
Moderately weathered Wombarra Shale (between Coalcliff and Clifton, and beside the
Jetty Fault) consists of quartz, kaolinite, mica and smectite (Table 4.11). There is no
significant difference in composition between the fresh (Table 4.12) and moderately
weathered Wombarra Shale. Tables 4.13 and 4.14 show the results of X-ray diffraction
for moderately weathered Wombarra Shale between Coalcliff and Clifton north of Jetty
Fault and between Wombarra and Coledale. The latter consists of mainly quartz but
mica, smectite and illite are rare to trace and kaolinite is fair to trace. The former
comprises mainly quartz but kaolinite and carbonate are rare and smectite is fair to rare.
Highly weathered Scarborough Sandstone (Table 4.15) comprises mainly quartz, mica,
kaolinite and smectite. Feldspars and carbonate are rare. Weathered grey shale
interbedded with the Scarborough Sandstone (Table 4.16) consists of quartz, mica,
kaolinite and smectite without feldspar.
Fresh Stanwell Park Claystone in the West Cliff (Table 4.17) consists of abundant
quartz, a moderate amount of kaolinite and mica, and a fair smectite but no feldspar or
carbonate. Fresh Stanwell Park Claystone in the north of Coalcliff Station (Table 4.18)
consists of common quartz, a moderate amount of kaolinite and illite, a fair smectite and
a fair to moderate amount of carbonate. Moderately weathered Stanwell Park Claystone
(Table 4.19) comprises fair to moderate quartz, kaolinite, carbonate, smectite, moderate
illite and rare mica.
Highly weathered Bulgo Sandstone (Table 4.20) consists mainly of quartz, mica,
kaolinite and smectite. Weathered grey shale interbedded in the Bulgo Sandstone (Table
4.21) consists of quartz, kaolinite, mica, smectite and illite.
The fresh and moderately weathered Wombarra Shale samples have a similar
composition. Both of them contain significant amounts of all three clay mineral types
and no significant change in the relative proportions of these minerals takes place with
an increase in weathering. Hence, physical weathering processes and not chemical
weathering appear to be dominant. On the other hand, the Wombarra Shale has a

83
different composition to the Stanwell Park Claystone and hence, it has different
mechanical properties to the Stanwell Park Claystone (to be discussed in chapter 7).
Fresh Stanwell Park Claystone compared to weathered Stanwell Park Claystone has more
quartz and less clay minerals. The samples appear to show a change in the clay
mineralogy with an increase in chemical weathering. Grey shale interbedded with the
Bulgo Sandstone a moderate content of mixed-layer clays and smectite which generally
makes the Bulgo Sandstone relatively unstable.
4.8 TALUS
Generally the talus is a thin, surficial cover of unconsolidated material commonly
between 0.5 and 2 m in depth, but in some places attaining depths of up to 40 m. It
consists of blocks, up to several metres in size, of Hawkesbury Sandstone and Narrabeen
Group sandstone in a clayey matrix which may be iron stained or leached. The relative
proportion and size of the sandstone blocks vary considerably from area to area.
4.8.1 COMPOSITION
As mentioned earlier the talus consists of blocks of sandstone in a sandy, clayey matrix.
Forty one soil samples were collected from the landslide area (head, crown and toe).
Ten samples were selected from the Harbour slump beside the Harbour Fault in
Coalcliff Harbour. Nine samples were collected from the Jetty rock slump beside the
Jetty Fault between Clifton and Coalcliff. Ten samples were selected from the Moronga
Park slump and seven samples were collected from the Clifton Hotel slump beside the
Clifton Hotel.
Generally talus consists of quartz, mica, kaolinite, smectite, illite and goethite (Tables
4.22 to 4.25). Kaolinite is the dominant clay mineral in all the talus. Mixed-layer
clays are important in the talus material in whole rock samples. Commonly the more
unstable talus samples have a higher proportion of mixed-layer clays and smectite than
84
the more stable ones. This results from the lower shearing strength of smectite, mixed-
layer clay and illite-rich talus compared to the kaolinite-rich talus.
4.9 INTERPRETATION OF THESE RESULTS
Kaolinite is the dominant clay mineral in talus and rock samples. This mineral may be
either a result of direct derivation from the Narrabeen Group (Wombarra Shale, Stanwell
Park Claystone) or be the result of weathering of talus during past periods of higher
rainfall. The present average yearly rainfall is about 1700 mm and the mean daily
temperature is 17.5°C; even these condition would produce complete weathering of the
clay fraction to produce kaolinite over a period of a few thousand years. Also, several
talus samples showed that they have a large amount of kaolinite and less illite and
smectite which may indicate that they represent more mature (weathered) talus.
4.10 CLAY MINERAL STRUCTURE AND SLOPE STABILITY
The relationship between slope stability and clay mineralogy can be explained by the
structure of the clay minerals, which influences the behaviour of any soil containing
these clays. In particular the shear strength and deformation of soils depends on the
type and content of clay present in that soil.
Clay minerals consist of different stacking arrangements of tetrahedral sheets and
octahedral layers. Kaolinite has a stacking of one tetrahedral sheet to one octahedral
sheet and has no ionic charge deficiency. Formula units of kaolinite have relatively
strong hydrogen bonding, unlike other clay layers which have weaker oxygen bonds.
As a result, kaolinite would be expected to have the strongest cohesiveness and greatest
stability of all clay minerals. Another result of the strong hydrogen bonding is that
water molecules have difficulty penetrating between the layers. In haUoysite, a mineral
of similar structure to kaolinite, water can penetrate between the tetrahedral and the
85
octahedral layers and, as a result, this mineral has a much lower cohesiveness (Grim,
1968; Gillott, 1989). However halloysite has not been detected during the present study.
Illite consists of two tetrahedral sheets, with some aluminium substitution for silicon,
sandwiching an octahedral sheet stacked so that oxygen layers of each unit are adjacent
to oxygen layers of the neighbouring units, resulting in a very weak oxygen-oxygen
bond between sheets. This gives a good basal cleavage and hence a weaker shear
strength or cohesiveness than kaolinite.
Structurally, smectite is similar to illite except that no substitution of silicon by
aluminium occurs in the tetrahedral sheet. If all the octahedral positions in smectite are
occupied the mineral is termed trioctahedral, and if only two-third of the sites are
occupied the mineral is dioctahedral. The second type is most c o m m o n in soil, and
water can enter between the layers and cause lattice expansion.
The ability to absorb water is influenced by the exchangeable cations. Thus sodium
montmorillonite (smectite) can absorb more water than calcium montmorillonite (Franklin
& Dusseault, 1989), and is more sensitive to water with a resulting greater loss in
cohesiveness.
The whole rock sodium to calcium and magnesium ratio may be relatively moderate for
sandstone in the Narrabeen Group and Hawkesbury Sandstone (Bowman, 1972). Thus
sodium montmoriUonite would be expected to form on weathering in the niawarra area
more than calcium montmorillonite. Therefore, it will be a cause of slope instability in
the area.
4.11 DISCUSSION
Petrology and weathering of rocks are two very important aspects from an engineering
geological point of view. As mechanical properties of rocks are sensitive to their
petrology and weathering, evaluation of both petrology and degree of weathering of the
rocks is important for different study purposes, such as the estimation of long-term
86
stability of the slopes. The relationship between mineralogical and mechanical properties
of rocks and their degree of weathering has been studied by many research workers.
For example Ramana and Gogte (1982) proposed the percentage of decomposition as
an index of the weatherability of rocks, and Gunsalus and Kulhawy (1984) obtained a
positive correlation between shear strength parameters and quartz content.
Petrological studies reported in this chapter indicate that the Narrabeen Group sandstone
in the northern Illawarra between Scarborough and Stanwell Park consists principally of
detrital quartz grains, lithic fragments (including chert) with detrital feldspar grains.
The well-rounded quartz grains probably represent second cycle sediments and were
derived from earlier deposited sandstones. The poorly rounded to angular quartz clasts
were derived from volcanic sources. Volcanic rock fragments mostly comprise chert
grains, probably derived from silicified silicic volcanic rocks and tuff.
All these studies show that the content of detrital quartz grains generally increases
towards the top of the group and that the detrital lithic fragment content generally
decreases. Some fresh samples of Bulgo Sandstone (lower part) and Scarborough
Sandstone contains more than 50% quartz, while some samples of Coal Cliff Sandstone
only contain about 30% quartz. Therefore, the Bulgo Sandstone and Scarborough
Sandstone are stronger than the Coal Cliff Sandstone.
The percentage of rock fragments in the Coal Cliff Sandstone is more than the
percentage of rock fragment in Bulgo Sandstone and Scarborough Sandstone.
Consequently the sandstones in the Coal Cliff Sandstone are easier targets than the
Bulgo Sandstone and Scarborough Sandstone for long-term weathering. This is most
important when it is considered that rock fragments are mostly chert and volcanic
detritus in the Narrabeen Group.
The middle of the Bulgo Sandstone consists of green sandstone and shale. The
sandstones comprises predominantly volcanic rock fragments which are altered to
chlorite and iron oxides. These sandstones have a higher proportion of rock fragments
87
than quartz and, therefore, they are easy targets for long-term weathering and
decomposition.
The majority of the sandstone samples contain carbonate cement. The carbonate
cements include calcite, siderite, and perhaps ferroan calcite, dolomite and ankerite. In
some thin sections, partially dissolved carbonate cements were recognised. The
dissolution has created secondary pore spaces. For short-term weathering, the quantity
of carbonate cement is a useful parameter for determining the stability of the rock.
During long-term weathering, dissolved carbonate cement causes more pore space in the
rock, and consequently secondary porosity and permeability increases. The resultant
increase in water flow into the rock mass can affect its weathering. Most of the effects
of weathering are concentrated along cliffs and in the soft underlying shale beds. For
example, fretting and weathering of the Wombarra Shale have undermined the
Scarborough Sandstone. Also fretting and weathering of the Stanwell Park Claystone
have undermined the Bulgo Sandstone. This causes large blocks of the overlying
sandstone to break off, either sliding or toppling.
Results of X-ray diffraction analyses indicate that the rocks and talus materials typically
contain quartz, iron oxides, kaolinite, illite, smectite and expanded-lattice mixed-layer
clay minerals. Quartz and kaolinite are abundant in most rocks and talus materials in
the northern Illawarra.
Clay minerals consists of kaolinite with less illite and smectite (montmorillonite). Most
clay samples mainly contain kaolinite which is poorly crystalline. On the other hand,
some of the clay samples mainly consist of mixed-layer clays (illite and smectite).
These clays cause swelling and shrinkage near the surface. They lead to decrease in
the shearing resistance of the talus and surface rock materials. Decreased shear strength
increases the susceptibility to mass movement.
X-ray analyses proved that in the transition from fresh rock samples to weathered rock
samples the amount of primary minerals such as feldspars decrease while that of
88
secondary minerals (i.e clay minerals) increases. As the proportion of secondary
minerals such as clay minerals and iron oxides increases, the strength of the rock
decreases while the porosity increases.
The results revealed that the petrology and weathering phenomenon affect both physical
and mechanical behaviours of the rocks. The physical and mechanical properties of
rocks change with change in mineralogy and the degree of weathering.
4.12 RELATIONSHIP BETWEEN PETROLOGY, SOURCE AND SLOPE
STABILITY
The lithology of the source area exerts control on the abundance of sand-size rock
fragments released into the transport mill. The tectonic setting, which ultimately
controls source-rock lithology, has an influence also on rock-fragment abundance.
Dickinson and Suczek (1979) and Dickinson (1985) suggested in their provenance
diagrams that rock fragments are more abundant in sediments derived from magmatic
arcs than in sediments derived from recycled orogenic or continental-block provenance.
The Narrabeen Group was derived from the New England Fold Belt to the north and
consists predominantly volcanic detritus. The volcanic detritus is present in both the
sandstone and shale units either in form of detrital grains of volcanic rock or as fine
volcanic ash. During post-depositional alteration and diagenesis the original volcanic
glass in the ash and matrix of larger grains has devitrified to produce smectite clays.
These clays not only cause swelling and shrinkage near the surface as a response to
wetting and drying, but also reduce the permeability of the near surface rock mass.
This latter factor increases the aqueous pore pressures and hence increases the likelihood
of surficial mass movement of both the rock mass and the adjacent talus deposits.
Based on the X-ray diffraction analysis, carbonates are mostly rare in the talus deposits
(Tables 4.23 to 4.25). The natural reduction in the carbonate due to dissolution on
weathering is a factor in the talus slope instability in the Illawarra area. Hawkins et
89
al (1988) have discussed the similar importance of calcite content in the stability of
Fuller's Earth in the UK. Hawkins and McDonald (1992) pointed out the importance
of the decalcification which effects the instability in both natural and engineered slopes.
Trotter (1993) reported earthflows which developed in regolith overlying Tertiary
calcareous mudrock of marine origin in the North Island, New Zealand. He showed that
slope stability is reduced by natural reduction in the calcite content as a result of
exposure and weathering.

90

91
CHAPTER 5
STRUCTURAL GEOLOGY IN THE SLIP AREA
5.1 INTRODUCTION
It is well known that the properties of intact rock units are often relatively unimportant
as controls for slope stability in rock, and that failures are governed by structural
discontinuities such as bedding planes, joints and faults in the rock mass (Hoek, 1971).
The frequency, orientation and inclination of these discontinuities, as well as their
strength characteristics, are important factors to be considered in any rock slope analysis.
They also control the flow of groundwater which has a very important influence on
slope stability. Hence, the need to locate and establish the orientation and strength
properties of the critical discontinuities in a rock mass is obvious.
5.2 STRUCTURAL FACTORS WHICH ARE IMPORTANT IN SLOPE
STABILITY
Theoretical studies and practical experience of rock slope problems suggest that the
structural factors which are important in slope stability are as follows:
(1) The dip of joints, faults and bedding planes. This inclination plays a major role
in defining the stability of a slope.
(2) The strike of structural features. Obviously the relationship between the strike
directions of important structural features and the orientation of a slope face will
define the freedom of movement of potentially unstable blocks. The most
dangerous conditions occur when an unfavourably inclined structural feature has
a strike parallel to the slope face such that the entire face is free to slide.
(3) The number of structural features or sets of such features. The behaviour of a
slope containing a single set of bedding planes is likely to differ from that of a

92
slope containing additional sets of intersecting joints. Not only will the entire rock
mass have greater freedom to deform in the latter case but the flow of
groundwater, which plays a major role in controlling the stability of a slope, will
be markedly different in the two cases.
Spacing. Spacing is defined as the average distance between adjacent
discontinuities in a set, measured normal to the discontinuity plane. Descriptions
can be used such as widely or closely spaced joints, thickly or thinly bedded. For
engineering purposes, these spacings should always be defined. The block size is
related to joint and bedding spacing in that it is governed by, and approximately
equal to, the average spacing for all sets in the jointing-bedding system. Intensity
of jointing is the inverse of spacing, i.e. the number of joints per metre. As an
alternative parameter to spacing it has the practical disadvantage that large number
must be counted when joints are closely spaced (e.g. 1 cm, or less).
The continuity or persistence of structural features. Structural features are often
modelled as disk shaped, or as terminating in straight edges where they meet
other, nOn-parallel joints (Merritt and Baecher, 1981). In stability calculations for
any slide area, the persistence of joints has a great effect on the shear strength,
and an engineer needs to know the total surface area over which sliding could
occur. Faults, because of their mode of formation, can be inferred as 100%
persistent and often are plotted for many kilometres on geological maps. Most
bedding joints are also highly persistent usually on a regional scale.
The surface properties and infilling material in joints and faults. Surface
characteristics such as roughness and the nature and thickness of any infilling
material which may be present in a structural discontinuity have been shown to
have a major influence upon the shear strength characteristics of such
discontinuities. The permeability of these discontinuities is also significantly
influenced by the presence of filling materials. Filling materials vary greatly in
93
their mechanical characteristics, from very soft to very hard and strong. Materials
of extremely low strength, that call for precautions when encountered, include clay,
platy and very soft minerals, such as smectite, illite, chlorite, graphite and talc.
Clays are soft and soapy in texture and usually have a high water content. W h e n
they have a bearing on rock mass stability they should be further characterised
by X-ray diffraction or optical mineralogical testing and by plasticity and water
content measurements. The clay mylonites found in shales consist of finely
ground and highly plastic shale created by shearing. Even when only 1 to 2 m m
thick and dipping at a few degrees, they have been known to cause extensive slope
failures. Fillings of intermediate strength include those of sandy consistency, such
as crushed or brecciated hard or moderately hard rock, lightly altered wall rock,
or veins of calcite when weaker than the surrounding wall rock. Strong fillings
such as vein quartz, calcite and limonite can heal and recement a joint, which m a y
become as strong as the surrounding rock or even stronger than it if the latter
becomes weathered.
Most joints have no filling and are, therefore, neither strengthened nor weakened
by filling materials. Their unaltered surfaces are in contact. Stained joints can be
included in the "no filling" category. Staining is important as an indicator that a
joint has conducted groundwater, but usually has little or no influence on strength
or other mechanical properties.
Aperture. The aperture of a joint (also known as its openness or separation) is
the mean distance separating the two intact joint walls. Note that aperture includes
the thickness of any filling that may be present. A joint may be termed open or
tight according to whether its aperture is large or small. The aperture is usually
greatest for near-surface joints, as a result of rebound and stress release, and joints
become tighter as the depth increases. Apertures are usually just a few microns
94
wide, except where the rock has been loosened by near-surface weathering or
blasting, or dissolved by water flowing through the joints.
Therefore, it is important that adequate provision is made for the collection of structural
information (Bell and Pettinga, 1984) and this means that a geologist who has some idea
of what structural features are important in controlling slope stability must be allocated
to the task of structural mapping.
5.3 FAULTS IN THE SLIP AREA
The study area has been subject to extensive geological activity in the past. Several
major faults and dykes are present which have resulted in the formation of prominent
topographical features such as the creek beside Clifton Fault. The majority of faults in
the study area possess strike maxima at 005° and 110° (Bowman, 1974).
The major faults which are identifiable on the surface are named the Scarborough Fault,
Clifton Fault, Jetty Fault and Harbour Fault (Fig. 5.1). Several other fault zones were
identified in mine workings but do not extend to the surface. The largest is the
Coalcliff Fault. This fault at the level of the Bulli seam has a dip to south of about
70° from horizontal. Some other smaller faults, although present in the Bulli seam,
could not be located on the surface (cf. Fig. 2.11). This may either be due to the
blanketing effect of the talus mantle or simply that they do not project to the surface.
Two small un-named faults occur in the Bulgo Sandstone (Fig. 5.2) and Stanwell Park
Claystone (Fig. 5.3) between Clifton and Coalcliff.
It appears that the faults with east and southeast trends observed in the mine working
have little or no displacement at the level of the Hawkesbury Sandstone. The north-
trending faults however show displacement in both the Bulli Coal seam and the
Hawkesbury Sandstone (Bowman, 1974). North-trending faults remained active at least
until after the deposition of the Hawkesbury Sandstone, whereas the east-trending faults
95
had become inactive or were only weakly active by this stage (Bowman, 1974;
Adamson, 1974).
East-west striking (110°) faults are concentrated in the coastal area between Clifton and
Coalcliff. This group includes the Scarborough, Clifton, Jetty and Harbour Faults, all
of which appear to have steeply dipping fault planes. These faults are most readily
observed because of the rugged coastal outcrop in this locality which is almost normal
to the fault trend.
5.3.1 HARBOUR FAULT
The Harbour Fault was named by Hanlon (1953), as were the other faults in the study
area. This fault is seen to dislocate the lower section of the Narrabeen Group in the
cliffs adjacent to the old Coalcliff Harbour, south of Coalcliff Beach (Fig. 5.4).
The fault has cut the rock platform with a readily distinguished lineament. A
downthrow to the south of 20 m was measured by the author in the coastal platform
at the top of the Coal Cliff Sandstone. To the west of the Lawrence Hargrave Drive,
erosion has revealed the fault plane surface, which dips at about 70° to the south and
strikes east-west.
5.3.2 JETTY FAULT
The Jetty Fault crops out in the coastal cliff a short distance north of the old Coalcliff
adit. The dip of the fault plane is 70° north on Lawrence Hargrave Drive and 45° north
in the lower coastal cliff north of the old Coalcliff adit; its strike is east-west (Figs 5.5a,
5.5b). This fault is particularly well exposed and Hanlon described a decrease in throw
with stratigraphic ascent. A displacement of about 8 m at the Bulli seam level
decreases to about 7.5 m at the top of the Coal Cliff Sandstone, about 2.8 m at the
level of the Otford Sandstone Member and about 1.1 m at the base of the Scarborough
Sandstone (Fig. 2.11).
96
5.3.3 CLIFTON FAULT
The Clifton Fault crosses the coast just north of Clifton. The strike of the fault is east-
west, and it is downthrown to the north. The dip of the fault plane is nearly vertical
in the coastal cliff exposure (Fig. 5.6). It is marked by a prominent, straight creek and
an abrupt termination of the coastal platform. The Bulli Coal crops out approximately
at sea level on the northern side of the fault. The fault has a displacement of up to
60 m in the study area.
5.3.4 SCARBOROUGH FAULT
The Scarborough Fault crosses the coast just north of Wombarra (Fig. 5.7). The vertical
displacement is as given 55 m on old plans from the southern workings of CoalcHff
Colliery. Harper (1915) gave the dip of the fault plane as 15° north but Hanlon (1953)
measured the dip of the fault plane to be between 40° and 60° north. The dip of the
fault is certainly steeper in the Triassic beds in the area. There is evidence of splitting
of the fault in both easterly and westerly directions. It is possible the main Scarborough
Fault swings away to the southeast.
5.4 JOINTS IN THE SLIP AREA
Joints are discontinuities in the rock mass along which there has been no relative
movement. When there has been movement along the structure then it becomes a fault.
For this reason, in many cases, it is difficult to identify a small fault when no
lithological variations are present permitting determination of movement.
The most significant structural feature in the escarpment is jointing. On the local scale
of the escarpment, folding of the strata is generally negligible and the bedding is very
close to horizontal a dip of 2-5° to the northwest. Faulting is common and, although
fault zones influence the groundwater, it generally plays a very similar role to jointing
97
when considering discontinuities as an influence on the escarpment's stability. During
the measurement of joints for this study, examination of aerial photographs revealed the
predominant pattern which is closely related to the pattern of faults exposed in the
underground workings.
The most prominent joint set exposed at the surface is close to vertical with a north-
south trend or a trend a few degrees east of this direction. This joint direction is
subparallel to the main trend of cliffs in the study area. Hence the prominent sandstone
beds generally outcrop as vertical or near vertical faces.
The frequency of joint spacing in the various rock units varies. Joint spacing has been
measured in this study in an attempt to predict how this property may affect rock slope
stability in the niawarra area.
5.4.1 JOINTS IN COAL
Joints in coal have been recognised and utilised by coal miners for centuries in the
layout of mines and in the mining of coal beds (Kendall and Briggs, 1933). Coal beds
of lignitic to bituminous rank are usually cut by an orthogonal system of two mutually
perpendicular joint sets; a prominent set termed cleats or face cleats and a secondary
set called cross-cleats or butt cleats. Butt cleats or butt joints commonly break away
at the face cleats or face joints which produce the larger and more continuous faces
seen in the mine. Joints in coal vary in spacing from 1 millimetre or less to several
centimetres. Widely spaced joints divide the bed into rectangular blocks, giving rise to
the miner's term "block coal". Where the coal bed is relatively homogeneous, jointing
is closely spaced. Also joint spacing varies with the amount of weathering. Well-
weathered coals show more joints than do fresh exposures. Coals are distinct structural
rock units because they display joint systems differing in orientation and frequency
from those of other rock types. In addition, bright bands within the coal beds show
98
more prominent and, in places, differently oriented joints than do dull bands. Bright
bands thus act as minute structural rock units within the coal bed.
5.4.2 JOINTS IN THE NARRABEEN GROUP AND HAWKESBURY
SANDSTONE
B o w m a n (1974) identified joint distributions in the Hawkesbury Sandstone with maxima
at 005° and 105°. W e a k maxima of 055° and 155° are also present in the niawarra.
These data are based on air-photograph tracing of exposures of the Hawkesbury
Sandstone along the main scarp. The distinct vertical faces in the Hawkesbury cliff line
also highlight an obvious subvertical joint group. Joint spacing has been observed to
be generally from 2-5 m.
The author has measured joints at specific critical locations to determine if localised
joints patterns are important. Figure 5.8 shows where joint measurements were taken.
The results are shown as computer plotted joint rosettes in Figures 5.9 to 5.14. All
joints rosettes are based on an interval of 10°.
Joints were studied in the Bulgo Sandstone (BSs), Stanwell Park Claystone (SPC),
Scarborough Sandstone (SSs), Wombarra Shale (WSh) and Coal Cliff Sandstone (CSs).
The resulting strike maxima for the Bulgo Sandstone (localities 1, 2, 3) are 025°, 045°
and 105° (Fig. 5.9); for Stanwell Park Claystone (localities 4, 5) they are 025°, 050° and
105° (Fig. 5.10); for the Scarborough Sandstone (localities 6, 7, 8, 9) they are 015°,
035°, 135° and 165° (Fig. 5.11); for the Wombarra Shale (9, 10) they are 015°, 115° and
165° (Fig. 5.12); and for the Coal Cliff Sandstone (localities 10, 11, 14) they are 015°,
025° 045° and 145° (Fig. 5.13) and for localities 12 and 13 they are 005°, 035°, 065° and
135° (Fig. 5.14). As mentioned above the most prominent joint set exposed at the
surface has a nearly north-south trend (005° to 025°).
The pattern of faults is similar in orientation to one of the joint sets (105° to 115°).
They appear to be tensional features which occurred as a stress relief process in the
99
Sydney Basin strata along convenient zones of weakness. The northwest-southeast set
is subparallel to the zone of tension along the Woronora Anticline an important
synsedimentary flexure within the Sydney Basin (Fig. 2.8). Several prominent joint sets
also exist and strongly influence the surface features. Jointing appears to be influenced
by the regional stress regime and localised destressing along the escarpment. The
principal north-south joints are likely to be tensional features resulting from tectonic
stress relief induced by consolidation within an east-west compressive stress field that
affected the area during the Permian and Early Mesozoic. They are also parallel to the
rift opening of the Tasman Sea in the Cretaceous (east-west tension).
Localised destressing is possible near the exposed face of the escarpment. In the
Illawarra area the horizontal in situ stress is two to three times greater than the vertical
stress (Walton et al, 1990) and thus a large degree of destressing must occur at the
escarpment face. This, combined with weathering, would result in increased jointing
closer to the outer exposed face of the escarpment. Vertical permeability (fracture
porosity) is, therefore, expected to be greatest near the outer face of the escarpment.
Jointing in the Scarborough Sandstone is typically widely spaced (1-4 m) whereas in the
interbedded sandstone and siltstone of the Bulgo Sandstone it usually shows a 0.5-
1.5 m spacing and in the intervening Stanwell Park Claystone the joints are closely
spaced (0.1-0.5 m). Joint spacing in the Coal Cliff Sandstone is usually 0.6-2 m and
in the intervening Wombarra Shale the joints are 0.2-0.6 m apart. Many of the joints
on the escarpment and coastline are filled with calcite and/or clay.
A comparison with Bowman's (1974) joint pattern shows a reasonably good match
between the local and regional joint sets (cf. Fig. 2.12, Table 5.1).
The resulting strike maxima at 005° for the Coal Cliff Sandstone (Fig. 5.14) shows a
good fit with the 005° be (Fig. 2.12) regional group of Bowman (1974). Strike maxima
at 105° for the Bulgo Sandstone (BSs) and Stanwell Park Claystone (SPC) show a good
fit with the 105° ac (Fig. 2.12) regional group of Bowman (1974). Strike maxima at
100
045° for the Bulgo Sandstone (BSs), at 050° for the Stanwell Park Claystone (SPC), and
at 045° and 065° for the Coal Cliff Sandstone (Fig. 5.14) are close to the 055° ac (Fig.
2.12) local folding of Bowman (1974). Strike maxima at 165° for the Scarborough, at
145° for the Coal Cliff Sandstones (SSs, CSs) and at 165° for the Wombarra Shale
(WSh) are close to the 155° be (Fig. 2.12) local folding of Bowman (1974). Strike
maxima at 115° for Wombarra Shale (WSh) is very close to 105° ac (Fig. 2.12) regional
group of Bowman (1974). Strike maxima at 015° for Wombarra Shale (WSh) and
Scarborough Sandstone (SSs) are very close to 005° be regional group of Bowman
(1974). Total joint directions for Narrabeen Group show two prominent joint sets,
north-northeast and east-southeast in the study area (Fig. 5.15). A comparison with
Bowman's (1974) joint pattern (Fig. 2.12) shows a reasonably good match between the
local and regional joint sets. The resulting strike maxima at 105° in the study area
shows a good fit with the 105° Bowman's (1974) joint pattern (Fig. 2.12). The small
differences are probably due to local variations in the regional pattern. Strike maxima
at 035° for the Scarborough and Coal Cliff Sandstones (Figs 5.11, 5.14) and at 025° for
the Bulgo Sandstone (Fig. 5.9) have probably been caused by stress relief. The strike
maxima at 015° for the Wombarra Shale has a great effect on slope stability between
Clifton and Coalcliff (Fig. 5.16).
Considering all the localities mentioned above, it appears that the regional joint set is
most important and the development of local sets is dependent on the closeness to local
faults or folds. Local stress relief probably caused some joint sets to form. The
resulting strike maxima for the lower Narrabeen Group show that the most prominent
joint set exposed at the surface, with a direction between 005° and 025°, has a
significant effect on cliff orientation and slope stability in the study area.
101
5.5 THE IMPORTANCE OF FAULTS AND OTHER THROUGH-GOING
GEOLOGIC STRUCTURES
The importance of faults and through-going structures may sometimes be forgotten
because of the enormous amount of work and expense that may be involved in detailed
joint surveys and in the plotting and analysis of these data. There are relatively few
instances in which the joint orientation data turn out to be more important than
knowledge of the position, orientation, and strength characteristics of the major through-
going structures. A sketch summarising many of the reasons for the increased
significance of the through-going structures appears as Figure 5.17.
Figure 5.17a shows a rock mass with discontinuous and/or irregular rock joints; Figure
5.17b shows the same rock mass after a shearing displacement of natural origin has
occurred along one of the pre-existing sets of joints. The effects of the shearing
displacement are as follows:
(1) Continuity is increased. Therefore, the area of influence of the structure is
increased and the cohesive component of the strength is decreased.
(2) Irregularities are decreased. Therefore, one or both of the shear strength
parameters § and c may be reduced and the strength parameters may approach
those of the residual shear strength.
(3) Permeability is altered. The increase or decrease in permeability can be complex.
If the change in permeability is sufficient to allow significant pore water pressures
to develop, a decrease in the shearing resistance along the fault will then be the
consequence.
(4) Weathering and alteration are common along faults. The new weathering products
are frequently clay or other silicate minerals, e.g. chlorite. Therefore, reduced
angles of shearing resistance are common.
Figure 5.18 is a sketch of a typical cross-section of a fault. The fault has a central
zone of crushed and sheared rock called fault breccia (a), flanked by fine-grained, often
102
clay-rich, fault gouge on either side (b) and with striated and slickensided surfaces found
on the bedrock surface (c). The zone of rock (d) adjacent to either side of the fault is
likely to be more highly fractured than the surrounding country rock (e). This sequence
of materials can be referred to as the typical composite fault.
There are many variations to this sequence. For example, the breccia may be missing,
the breccia and gouge may be missing, the fractured rock may be missing and any or
all of these layers may have been re-cemented. In addition, weathering often extends
appreciably deeper along fault zones, due to the more intense jointing and alteration is
common along faults due to groundwater movement. The weathering and alteration can
superimpose additional zones of materials with different physical properties.
The most significant engineering properties of the zones in the composite fault are also
indicated on Figure 5.18. These include the low shear strength of the gouge-rock
contact.
Small faults may have little or no influence on the slope stability. Other faults or
combinations of faults can be the most significant geological factors in the analysis and
prediction of the slope stability problem. The orientation of the structure relative to the
slope is usually critical.
5.6 JOINTING AND TECTONIC FRACTURING OF ROCK
In any particular cliff section joints play a major role in the stability of the cliff,
although the overall effect is not such that the cliff is joint controlled. The cliff-line
tends to represent the surface of least resistance to block movement. The movement
of joint-bound blocks is aided by the orientations of the joints. Therefore, the
orientation and number of joint sets and the number of joints (spacing) all affect cliff
stability. The joints are often vertical or subvertical and so provide the unfavourable
orientation necessary for failure. They acts as discontinuities unable to sustain tension
and, combined with other factors, permit failure (Fig. 5.19). Any blocks which are
103
undercut by the weathering will very easily fall off under the pull of gravity (Fig. 5.20).
S o m e precipitating action is needed to remove the supporting material from the base of
the sandstone cliffs. Lubrication of the joint planes is also helpful in starting the rock
movement. Open joints at the crest of slopes act as drainage channels and very largely
determine the course of water in critical locations (Fig. 5.21). Root pry, due to
vegetation growing in joints, also causes them to open up and promotes failure.
The joints are often discontinuous both laterally and vertically. Thus blocks adjacent
to an unstable section may not necessarily become unstable at the same time. Blocks
above or adjacent to an unstable section will not necessarily be jointed in precisely the
same place or direction. So that more undermining may be necessary to cause failure
of some blocks than others.
Weathering is the second major factor. It is responsible not only for the overall
decrease in strength of the rock as a whole and the asperity of the joint surfaces, but
also is the primary cause of undercutting. Figure 5.22 shows strong undercutting of
sandstone cliffs (now buttressed by concrete).
5.6.1 BEDDING
Bedding appears to play only an indirect role in the stability of the cliffs. The dips are
about 5°, or less, and the beds almost always dip toward the west or northwest (away
from the escarpment). For this reason the bedding planes are only the seats of block
sliding near the edge of the escarpment when the bedding plane is strongly weathered
and the surface is lubricated with groundwater.
In discussions of bedding in the lower Narrabeen Group sandstones, the effect of local
diastems is important. The diastems are often zones of dislocation between blocks in
the cliff sequence. This feature effects the stability of the cliffs because the diastem
provides a distinct break in the cliff.
104
Another feature which may prevent block sliding along suitable bedding planes is the
apparent roughness on some bedding planes. The major breaks between layers often
have ferruginous and calcareous nodules on them as well as having wavy irregularities
due to contemporaneous channelling during deposition.
Cross-stratification or cross-bedding is commonly present in granular sedimentary rocks
such as sandstones. It consists of tabular, irregularly lenticular or wedge-shape bodies
that show a pronounced laminated structure which is steeply inclined to the general
bedding. The cross-stratification planes vary from unit to unit. Most layers can be
recognised by slight changes in grain size. Some have very marked and distinct
bedding planes. The cross-stratification planes rarely affect the stability of the cliffs as
a whole, but some individual blocks can be removed by translational sliding along the
plane of a cross-bed. Normally the joints provide a more strongly defined zone of
weakness, but occasionally the cross-bed planes are particularly marked. Since the
general palaeocurrent trend is to the southeast (Bamberry, 1990), many of the cross-
bed planes dip toward the edge of the cliff and movement of a pyramidal block could
occur. Although this kind of movement is probably fairly rare, it could be precipitated
by gravity at the moment of failure, but the plane would have to be clay-lined and well
lubricated by water before the block could move.
It is apparent that the sandstones of the Narrabeen Group only tend to be markedly
weaker along the bedding in special cases where the cross-stratification planes are
marked by sharp fissility planes. Most of these sandstones would tend to break away
along subvertical fractures such as joints.
5.7 RELATIONSHIP BETWEEN JOINTS AND CLIFF ORIENTATION
5.7.1 STRESS RELIEF
Rock mechanics investigations (Nichols, 1980; Kulhway and O'Rourke, 1981) have
shown that many flat-lying sedimentary sequences near the earth's surface have a
105
horizontal stress equal to or greater than the vertical stress corresponding to existing
overburden. These high horizontal stresses are presumably related to previous over
burden removed by erosion (Ferguson et al, 1981).
In the Illawarra region the horizontal in situ stress is two to three times greater than the
vertical stress (Walton et al, 1990; Hilleard, 1993) and thus a large degree of
destressing must occur at the escarpment face.
Erosion removes horizontal support from escarpment walls, which then tend to deform
internally. The mechanics of this deformational response are well understood in concept
from elastic theory, but details of this deformational response are often complex,
depending on time dependent phenomena and stratigraphic sequences. Deformational
response due to escarpment erosion in flat-lying sedimentary rocks will be enhanced by
high horizontal stress in the rocks.
Deformational response and rock discontinuities due to escarpment erosion and stress
relief in flat-lying sedimentary rocks are shown schematically in (Fig. 5.23a). The
escarpment walls are zones of extension. Rock discontinuities in the escarpment walls
reflect these deformation conditions and also the stratigraphy, particularly the strength
and stiffness of individual beds.
Erosional retreat of escarpment walls concentrates in the weaker and more deformable
beds which sometimes develop diagonal to curved shear joints, and commonly develop
shear zones at contacts with stronger stiffer beds (Fig. 5.23b). Stronger and stiffer beds
develop vertical to sub-vertical tension joints which typically do not extend across
weaker beds or bedding contacts. The spacing of tension joints in a given bed is
directly proportional to the bed stiffness. Stress relief effects diminish with distance into
the escarpment wall. The width of the relaxed zone along an escarpment wall is highly
variable.
Most deformation occurs beneath relaxed zones in the escarpment walls. Lateral
compression plus vertical load removal causes arching and buckling of beds in the
106
escarpment bottom (Fig. 5.24). Bedding planes open in strong stiff beds while fractures
develop in weaker and more deformable beds. Very gradual straining and fracturing
would be continually occurring far back from the scarp edge, but the overall effect
would be far less dramatic than in an open pit mine. Well before a particular rock
block was actually located on the edge of the scarp, due to cliff retreat over geologic
time, it would have had stress relief perpendicular to the cliff line. However, the
horizontal stresses acting parallel to the length of cliff edge often would not have been
relieved, as evidenced by joints, striking perpendicularly to the scarp, being closed.
Considering the escarpment shape (Fig. 5.23), it is clear that some situations exist where
these horizontal stresses have been relieved. However, the remaining unrelieved
horizontal stresses may act to stabilise a particular rock column by providing a lateral
shear stress inhibiting vertical movement. In other situations, these stresses may act to
induce failure.
5.8 THE RELATIONSHIP BETWEEN JOINTS AND RATES OF EROSION OF
STRATIGRAPHIC UNITS IN DIFFERENT TYPES OF EXPOSURES
The entire niawarra Escarpment has been retreating westward for many years (about 90
Ma since the opening of the Tasman Sea; Veevers et al, 1991). At present most of
escarpment south of Wombarra is protected from active marine erosion by the coastal
plain. North of Wombarra, the base of the escarpment is subject to active marine
erosion. Only positive erosion control measures prevent the Lawrence Hargrave Drive
between Coalcliff and Clifton from being completely eroded away. Therefore, in this
critical location, marine erosion is a major factor; whereas along most of the length of
the escarpment it has minor indirect effects, for example sea spray may be an active
weathering factor.

107
5.8.1 DIFFERENTIAL EROSION
Differential erosion is the result of weathering of rocks which are not uniform in
character but are softer or more soluble in some places than in other areas. The result
is usually an uneven surface with the softer rocks being removed more quickly than the
harder sequence. Differential erosion is caused mainly by the erosive processes of
rainfall and sea acting on the various lithologies in the cliffs. The coarser sandy
lithologies of the Scarborough and Bulgo Sandstones form the harder units which are
eroded more slowly and which jut out as cliffs. The weathered Coal Cliff Sandstone
lithology is slightly softer and erodes slowly. Hence the sandstone is cut back by a
number of processes resulting in the loosening and removing of small sheets of rock
surface and of individual crystal grains.
W h e n a unit has been deeply incised, the overlying units become unsupported and
ultimately blocks of the harder lithologies fall down. This undermining of the cliff
leads to a series of small collapses of individual blocks. These block collapses
commence at the base of the cliff and progressively move upwards, or alternatively the
entire cliff face can collapse at one time as occurred in the Coalcliff area in 1988. The
physical processes of erosion which are operating on the cliffs are fairly easy to
delineate and define. At least five processes are thought to be acting on the cliffs and
causing differential erosion in this critical location. These processes are outlined below,
along with the effect that they appear to have on the rocks.
(1) W a v e action causes hydraulic pumping at sea level, giving alternately high and
low pressure in joints due to direct wave action. It is probably more effective
than abrasion, especially where closely jointed coal and claystone are present at
water level.
(2) Direct physical abrasion by seawater laden with sand and small pebbles. Running
water has an acknowledged effect on rocks of all kinds and this abrasion could
be a major feature in the cliff decay. It is likely that the more particles carried
108
by the sea, the greater would be erosive effect of the waves. Storm waves are
likely to do more erosion in a given period of time than do normal sea waves.
The Coal Cliff Sandstone is the most susceptible to this battering, particularly
when it occurs at sea-level (Fig. 5.25).
Related to waves, is sea spray tossed up when the waves break. This spray often
travels long distances and could, over extremely long periods of time, erode a soft
rock unit by salt crystallisation and thus cause it to recede. During storm periods
the spray is thrown faster and farther, and often it is accompanied by salt
weathering up to several hundred metres above sea level.
Another feature is the marine cyclic wetting and drying that occurs between
regular tides and between seasonal storms. Simple tests on soft rocks show that
wetting a sample after a cycle of drying and heating will greatly increase the rate
of breakdown. Wetting and drying is probably very effective and accounts for the
development of most of the shore platform in the area. Between successive high
tides the preserved portions of the platforms remain saturated whereas the rock
above mid-tide level is subjected to wetting and drying. This allows the
development of a notch at the base of the cliff which promotes cliff retreat by
collapse. Similar processes can act on the exposed escarpment due to rainfall.
The sea level at times during the Quaternary was at least several metres higher
than its present level. The lower units of the Narrabeen Group including the
Wombarra Shale in the north and much of the Illawarra Coal Measures would
have been either below sea level or within the zone of wave breaking. Active
erosion and weathering would have occurred in the low strength portions of these
units.
During rain storms, there is an increase in the volume of water getting into the
surface pores of the rocks. The Coal Cliff Sandstone is slightly porous but they
are permeable through secondary openings such as joints. As weathering advances
109
the porosity of a rock generally increases due to removal of cementing materials.
Into the resulting openings, water could be splashed and on drying salts would
crystallise out. With time and repeated cycles of wetting and evaporation, the salt
could build up and force grains off the sandstone surface. The Coal Cliff
Sandstone appears to be susceptible to such salt build up probably become it is
close to sea level through much of the area. Also where the content of clays in
a rock is high, destruction caused by expansion and contraction related to the
cyclical wetting and drying may occur, especially in the upper part of cliffs.
(6) The last process considered here is differential erosion caused by groundwater.
Groundwater can affect the Coal Cliff Sandstone where the water is channelled
down joint planes and forced out along a diastem. Openings with different
heights, lengths and widths appear to have resulted from groundwater flowing
down joints and along the interface between the Coal Cliff Sandstone and the
underlying laminated sandy shale. Also in Bulgo and Scarborough water moves
laterally above clay aquicludes.
The petrology and mineralogy of the interbedded shale and claystone are such that the
expandable clay minerals present promote breakdown of the rocks. The most c o m m o n
cause is the influence of water, whether that influence be as a high pore pressure in a
joint complex in the weathered rocks (high artesian water pressures significantly
accelerating weathering, erosion and creep) or simply by saturating a rock mass and
increasing its weight. Solution of the siderite and calcite cements in the sandstones also
aids breakdown. The cyclic nature of the sedimentary sequence, specifically the
alternation of relatively permeable sandstone with impermeable claystone and shale
produces perched water tables and confined aquifers which invariably promote the
presence of significant pore water pressures. Artesian groundwater conditions, which
have been mentioned above, serve to illustrate the important influence of water in rock
failure.

110
On the basis of observations during this research, slides in talus often occur after rainfall
in the Illawarra area exceeds 350 mm per month and catastrophic slides invariably occur
when it is more than 450 mm.
5.9 SUMMARY AND CONCLUSION
Of all the geological factors influencing the stability of rock slopes, there is little doubt
that the through-going faults and shear zones and the intersections of such structures are
the most significant. Because of their continuity they can influence large areas of a
rock slope. In addition, geologic displacement along faults and shear zones have led
to the crushing or overriding of most irregularities in at least one direction so that low
residual shear strength values are often applicable rather than the higher strength values
associated with more irregular rock surfaces.
Chemical alteration of the surrounding rock and the frequent presence of breccia and
clay gouge are also commonly associated with faults and shear zones. These factors
lead to a decrease in influence of surface irregularities as the intact material is more
readily sheared off. Finally, the presence of clay gouge adjacent to the polished or
smooth rock surfaces of faults can mean that the usually low strength encountered in
the laboratory for soil-rock surfaces is applicable to the field problem. In spite of their
size and continuity, the major faults and their intersections are not always readily seen
until after the slope failure develops.
The relationship of landslides to structural geology in the slip area appears to be very
important. These relationships may have direct and indirect effects on the landslide
problem. The direct effects occur in areas such as faults zones, where water movement
can give rise to major stability problems; the indirect effects are due to the structural
pattern causing certain beds to may form unstable foundations (for example the
Wombarra Shale occurs at road and railway levels). The best example of the direct
effects is the area of the Clifton Fault. At this point the road was completely cut in
Ill
1988 and remained so for a long period. The road from the north rises through a
cutting in the Scarborough Sandstone until the fault zone is reached. South of the fault
the movement has brought the basal portion of the Wombarra Shale against the fault at
road level. At rail level the northern and southern faces of the fault zone are occupied
by the Stanwell Park Claystone and Wombarra Shale respectively. The fault-zone also
acts as a drainage channel. Weathering and erosion along it have resulted in a thicker
talus cover than in nearby areas. The fault acts as a feeder for underground water and
even after prolonged dry spells water still runs from the area. The net result is that a
relatively small rainfall can thoroughly saturate the talus in the fault zone, where it is
already in a highly unstable position. This fault causes an increase in local water flow
and appears to be directly related to the Moronga Park slump in the area. The Jetty
Fault between Clifton and Coalcliff also appears to be responsible for the slide known
as the Jetty rock slump. The fault acts as a drainage channel for groundwater
circulation under the road. Similarly the Harbour Fault, south of Coalcliff, affects land
stability in the slip area and appears to be responsible for the slide known as the
Harbour slump.
The stabilities of the cliffs are mostly affected by the steeply dipping joints and by the
differential erosion of sandstone, shale and claystone. Bedding and cross-stratification
also affect the rate of retreat, and the shape of the blocks. The overall retreat rate is
quite slow, but there are occasional zones which suffer short-term, sudden movements.
The lithology forming the cliffs in the study area is the lower Narrabeen Group. This
can be divided in the field into six basic lithological types comprising Coal Cliff
Sandstone, Wombarra Shale, Otford Sandstone Member, Scarborough Sandstone,
StanweU Park Claystone and Bulgo Sandstone. Sandstones are the units most resistant
to differential erosion and generally define the line of cliffs. The Wombarra Shale and
Stanwell Park Claystone comprises the weak rocks (soft, fractured and weathered rocks)
which are subject to differential erosion. They cause cliff collapse by undercutting
112
(weathering and erosion). Interbedded layers of shale are commonly associated with the
Coal Cliff Sandstone, Scarborough Sandstone and Bulgo Sandstone and provide minor
zones of weakness.
Lithologic control of joint types and spacing, including their orientation, planeness and
the existence of certain joints, is important in the study area. Joints were studied in the
various sandstone, shale and claystone units. Joints systems, which are well developed
in sandstones, may also occur in claystones and shales but the latter units usually
contain a great or number of joints. Joints in sandstones pass downward into the
claystones and shales with little change in strike or surface characteristics but a slight
increase in frequency. Joints are parallel and of similar planeness in shales and
sandstones but are more widely spaced in sandstones. A sharp discontinuity in joint
spacing occurs at the contact between shale, claystone and overlying sandstone. The
joints in claystone and shale are spaced at intervals of fractions of millimetres to several
centimetres, whereas joints in the overlying sandstone are at intervals of several
centimetres to many metres.
Lithologic control of joint characteristics is apparent throughout the stratigraphic section.
Joints in the Scarborough Sandstone are typically widely spaced (1-4 m) whereas in the
interbedded sandstone and siltstone of Bulgo Sandstone they usually show a 0.5-1.5 m
spacing. Thus the widely spaced joints divide the Scarborough Sandstone into big
rectangular blocks while closely spaced joints divide the Bulgo Sandstone into moderate
to small blocks. As a result, more rockfalls occur from the Bulgo Sandstone than from
the Scarborough Sandstone in the study area. However, falls that occur in the
Scarborough Sandstone are usually much larger and more destructive.
The high horizontal stress environment known to exist in the Illawarra area is an
important factor which influences slope failure. In the geologic past, and to a certain
extent now, the high inherent confining stresses produced stress relief joints in the
vicinity of the escarpment. Stress relaxation would be at a maximum on the very edge

113
of the scarp with the ensuing fracturing contributing to the instability of the slope as
follows.
(1) Stress relief loosens and weakens rock in escarpment walls and thereby enhances
weathering and erosion.
(2) Escarpment development may proceed independently of tectonic processes via
progressive stress relief fracturing and erosion of escarpment bottom rock.
(3) Stress relief fracturing increases rock mass permeability and deformability and
decreases rock mass strength. Groundwater flow through stress relief fractures in
the escarpment walls contributes to weathering and colluvium development.
(4) Stress relief fracture permeability and variations in lithologic layering control
groundwater flow in escarpment walls and bottom. Therefore, artesian groundwater
systems may occur and contribute to escarpment bottom heave and fracturing.
Escarpment bottom heave and fracturing, along with groundwater flow, contribute
to talus instability.
(5) Stress relief tension joints and bedding planes are also involved in colluvium
development, as well as rock falls and rock-block creep on escarpment walls.
(6) Stress relief fracturing expedites rock weathering, alteration and solution and
influences groundwater flow as mentioned above. It influences the stability of
natural, excavated slopes, tunnels and also the stability and deformation of
foundations placed on rock in the destressed zone along the escarpment wall.
An analysis of the joints cutting the sandstone was performed to determine if they had
any preferred orientations. The resultant data show that major joint directions indicate
stress directions compatible with the probable stress directions present during the
formation of major structures in the Sydney Basin. The resulting joint strike maxima
for the lower Narrabeen Group show that the most prominent joint set exposed at the
surface, with a direction between 005° and 025°, has a significant effect on slope
stability in the study area.

114

115
CHAPTER 6
REVIEW OF THE ROLE OF GROUNDWATER, RAINFALL,
HYDROGEOLOGY AND EARTHQUAKES
6.1 GROUNDWATER
In most large landslides groundwater has an important influence in controlling stability.
The most important influence is the reduction in shear strength along the slip surface
due to an increase in pore water pressure. Water flow also creates seepage pressures
which usually act in the direction of flow or seepage. Thus groundwater flow can play
a significant role in the development or triggering of landslides. Moreover, seepage
pressures may facilitate external and internal erosion in soils and weathered or closely
jointed rocks (Coates, 1990).
6.2 INTRINSIC PROPERTIES
Porosity and permeability are the two important factors governing the accumulation,
migration and distribution of water in soils and rocks. However, both may change
within a rock or soil mass in the course of its geological or weathering evolution.
Furthermore, it is not uncommon to find changes in both porosity and permeability with
depth due to variation in a number of features, including pore size distribution. The
actual size of the pores is significant since in narrow pores or capillaries surface tension
forces exert a control over the movement of fluids. In addition, chemical interaction
may occur between the water and dissolved gases and certain rock or soil constituents,
particularly clay and soluble minerals such as carbonate cement.
116
6.2.1 POROSITY
The factors affecting the porosity of a rock include particle size distribution, sorting,
grain shape, fabric, degree of compaction and cementation, solution effects and lastly
mineralogical composition, particularly the presence of clay particles.
The highest porosity is commonly attained when all the grains are the same size. The
addition of grains of different sizes to such an assemblage lowers its porosity and this
is, within certain limits, directly proportional to the amount added. Irregularities in
grain shape also result in a large possible range of porosity, as irregular grains may
theoretically be packed either more tightly or loosely than spheres. Similarly angular
grains may either cause an increase or decrease in porosity.
After a sediment has been buried and indurated, several additional factors help determine
its porosity. The chief amongst these are closer spacing of grains, deformation and
crushing of grains, recrystallisation, secondary growth of minerals, cementation and, in
some cases, dissolution. Hence the diagenetic changes undergone by a rock may either
increase or decrease its original porosity.
The porosity of a deposit does not necessarily provide an indication of the amount of
water that can be obtained therefrom. Even though a rock or soil may be saturated,
only a certain proportion of water can be removed by drainage under gravity or by
pumping. The remainder of the water is held in place by capillary or molecular forces.
6.2.2 PERMEABILITY
In ordinary hydraulic usage, a substance is termed permeable when it permits the
passage of a measurable quantity of fluid in a finite period of time, and impermeable
when the rate at which it transmits that fluid is slow enough to be negligible under
existing temperature-pressure conditions.
The flow through a unit cross-section of material is modified by temperature, hydraulic
gradient and the permeability. The latter is affected by the uniformity and range of
117
grain sizes, shape of the grains, size and shape of the pore throats stratification, the
amount of consolidation and cementation undergone and the presence and nature of
discontinuities.
The permeability of a rock or soil material is strongly affected by the interconnections
between the pore spaces. If these are highly tortuous then the permeability is
accordingly reduced. Consequently tortuosity figures are important in permeability
considerations, since they influence the extent and rate of free water movement.
Tortuosity can be defined as the ratio of the total path covered by a current flowing in
the pore channels between two given points to the straight line distance between them.
Stratification in a formation varies within limits both vertically and horizontally. It is
frequently difficult to predict what effect stratification has on the permeability of the
beds. Nevertheless in the great majority of cases where a directional difference in
permeability exists, the greater permeability is parallel to the bedding.
6.2.3 RELATIONSHIP BETWEEN POROSITY AND PERMEABILITY
Porosity and permeability are not necessarily as closely related as would be expected.
For instance, very fine textured sandstone frequently has a higher porosity than coarse
sandstone though the latter may be much more permeable. In other words, the size and
interconnectedness of the pores is all important as far as the permeability of a formation
is concerned. It is not uncommon to find variations in both porosity and permeability
throughout a formation.
6.2.4 FRACTURE (SECONDARY) PERMEABILITY
The permeability of intact rock sample does not necessarily bear any relation to the
permeability of the rock mass. The permeability of intact rock (primary permeability)
is usually several orders magnitude less than the in situ permeability (fracture
permeability). Although the secondary permeability is affected by the frequency
118
(spacing), continuity, openness, degree of interconnection of discontinuities and amount
of infilling of discontinuities, a rough estimate of the permeability can be obtained from
their frequency. Admittedly such estimates must be treated with caution and cannot be
applied to rocks which are susceptible to solution. In rock masses the discontinuities
are the most important conduits for water movement. Discontinuities allow water to
percolate through rocks with extremely low values of porosity. Indeed the frictional
resistance to flow through discontinuities is frequently much less than that offered by
a porous medium. Hence appreciable quantities of water may be transmitted.
6.3 POREWATER PRESSURE
Long-term landslides are not triggered by a rapid increase in shear stress, but either by
a slow, progressive decrease in shear strength parameters or commonly by an increase
in porewater pressure which also has the effect of reducing shearing resistance within
the slope (Crozier, 1986). Porewater pressure may be positive, resulting from a build
up of groundwater above the shear plane, in which case the normal stresses are reduced.
Positive porewater pressure at any point in a freely draining slope is determined by the
product of the height of the water table or, more accurately, the piezometric surface,
vertically above that point and the unit weight of water. It exerts an upthrust which,
by reducing normal stress, reduces the resistance within the slope. This upthrust will
be enhanced if groundwater within the slope is under artesian pressure. Under
unsaturated conditions, porewater pressure may have a negative value, resulting from
tension exerted by attached water, and hence may provide an increment of strength.
If groundwater is already within the zone subject to applied loads or surcharge, sudden
loading will prevent drainage and excess porewater pressure will develop, immediately
reducing resistance. Hutchinson and Bhandari (1971) have described such 'undrained
loading' resulting from debris accumulating on the head of a mudslide as an important
mechanism in promoting downslope movement. Their work was prompted by the

119
observation that certain coastal mudslides advanced on slopes flatter than those
corresponding to the limiting equilibrium for conditions of residual strength and
groundwater flowing parallel to the slope surface. From both theoretical considerations
and porewater pressure measurement in the field, they determined that debris
accumulating at the rear of a mudslide loaded the landslide sufficiently quickly to
prevent drainage and to increase porewater pressure to artesian levels. Such pressure
appears to induce a forward thrust which may initiate shearing movement or accelerate
the rate of movement downslope.
6.4 CHANGES IN WATER CONTENT
Changes in water content can quickly affect the stability of slope materials and have
been responsible for triggering, reinitiating and accelerating more landslide, than any
other factor. In nearly all cases, an increase in water content decreases stability in one
or more of the following ways.
(1) Increasing interstitial porewater pressure. Positive porewater pressure, which
reduces resistance, can be developed within the phreatic zone or within
groundwater zones perched above a relatively impermeable substrate.
(2) Developing cleft-water pressure within joints, voids and fissures. This has a
similar effect on resistance to that produced by interstitial porewater pressure.
(3) Developing seepage pressure where a drag stress is set up in the direction of water
percolation, thus contributing to shear stress. Seepage pressure may also lead to
gradual subterranean erosion and removal of underlying support.
(4) Increasing weight. The effect of an increase in weight provided by water is to
increase the disturbing forces along a potential slip surface. Increase of weight
can only instigate failure where the slope is already close to the critical
equilibrium.
120
Slopes consisting of clay, particularly the expanding-lattice variety, are the most
susceptible to failure though the loss of cohesion. Some cohesion soils can take
up large amounts of water, and commonly exhibit desiccation cracking which
facilitates the entry of water.
(5) Decreasing cohesion (apparent cohesion). In soils, cohesion results mainly from
capillary and electro-molecular forces which are reduced as the amount of
interstitial water increases. In weathered granite saprolite, for example, Lumb
(1966) noted that apparent cohesion can be as high as 200 kPa but that it will
drop to zero when the material is saturated.
6.5 EFFECTS OF SOLUTION
The movement of groundwater within rock masses containing a significant proportion
of soluble minerals exerts a major control over their removal in solution. The actual
site of dissolution is often controlled by the presence of rock mass discontinuities and
other variations in mass permeability, including low permeability clay seams. However,
besides removal of soluble materials from surfaces, reductions in bulk density or cavity
formation may also be prevalent. The amount of mineral removed from the rock mass
depends mainly on the rate of flow, quantity, temperature and chemistry of the water
passing through it. Also of major significance is the solubility characteristics of the
rock forming mineral.
6.6 GROUNDWATER FLOW IN SLOPE STABILITY PROBLEMS
In slope stability problems only a portion of the regional flow system remains of interest
- that portion of the flow system which occurs within and adjacent to the slope. In
previous geotechnical literature the most common way to portray the groundwater flow
was to show the flow occurring subparallel to the groundwater table which could be
delineated by the groundwater level encountered by borings penetrating the slope (Fig.
121
6.1). Such a portrayal of groundwater flow within a slope is quite different from the
present view of the general case for groundwater flow in slopes (Fig. 6.2).
One significant result of the recent developments in the theory of groundwater flow
systems applicable to slope stability is that there is normally a downward pore-pressure
gradient in holes drilled in the upper portion of a slope and an upward pore-pressure
gradient in holes drilled in the lower portions of slopes (Fig. 6.1b); assuming
homogeneous and isotropic permeability.
Significant variations from this would occur in areas where there is a regional
groundwater recharge or discharge, and where the permeability within, or recharge to,
the slope is non-uniform. Perhaps the greatest difference between the two portrayals of
groundwater flows in Fig. 6.1 occurs in the discharge area; an area of considerable
interest in the slope stability problem. According to the first case shown in Fig. 6.1a,
no adverse groundwater flow conditions are likely to result from the placing of an
impervious fill at the base of the slope. This is because the flow is parallel to the
surface and, therefore, the fill has no appreciable influence on the flow of groundwater
in the region of the base of slope. However, it is obvious from the second case (Fig.
6.1b) that placing an impervious fill at the toe of the slope would result in an
appreciable disruption of the groundwater flow within the hill and a build-up of
porewater pressure.
6.7 SLOPES COVERED WITH LANDSLIDE DEBRIS
Most geologists have observed that landslide debris is frequently wet and unstable,
usually much less stable than the original slope and adjacent slopes. Fig. 6.2 illustrates
the manner in which the slide debris can block the normal groundwater discharge area
of the slope to produce a characteristically unstable deposit of slide debris. The
equipotential lines and flow lines shown in Fig. 6.2a illustrate the distribution of
groundwater pressures and the flow of water within a slope before a slide develops.
122
Fig. 6.2b indicates the case where the slide debris covering the slope increases the level
of the groundwater table and increases the groundwater pressures in the area of the slide
debris.
A similar effect can occur in slopes formed in thinly bedded materials where adjacent
layers possess quite variable permeabilities. A shearing displacement can cut off the
outlet for the groundwater flow within the hill and allow porewater pressure to build up
to critical values more readily following the initial displacement than before the slide
began. The overall effect of either phenomena is to accelerate the movement of the
slide and will tend to remove the slide debris from the hillside in a relatively short
period of geologic time. This type of groundwater behaviour is also one of the main
factors which cause deposits of slide debris to be so unstable, even though they have
much flatter slopes than the original slope.
6.8 HIGH WATER PRESSURES IN THE ESCARPMENT
The significance of high water pressures beneath escarpments and in escarpment walls
has not been widely recognised for several reasons:
(1) very few piezometer installations have been made which are extensive and deep
enough to illustrate the phenomena;
(2) significant features can be masked by the effects caused by landslide debris;
(3) the groundwater discharges (springs) tend to occur at the base of the escarpment
where they are not noticed; and
(4) in areas of harder rocks not prone to landslides, and where better exposures are
available, the influence and effects of the regional groundwater discharge are
minimal.
Certain geologic environments (flat lying and inclined layered rocks with great difference
in their permeability) provide conditions for high porewater pressures to develop at the
base of an escarpment. In particular, the presence of thick low permeability rocks, such

123
as shales and related clay-rich rocks, volcanic ash deposits, thick fault zones and buried
soil profiles, would tend to be associated with zones of excess porewater pressure within
and at the base of escarpment slopes.
A schematic diagram showing the various effects that can develop due to the presence
of groundwater discharge at the base of an escarpment is given in Fig. 6.3. The high
porewater pressures can also act on pre-existing joints and bedding planes to decrease
the stability of the slopes and could lead to widespread landslides.
6.9 SPECIAL EFFECTS OF FAULTS ON THE HYDROGEOLOGY OF SLOPES
A significant engineering property of faults is their effect upon the permeability of a
rock mass. The typical composite fault that was shown in (Fig. 5.1) may have one or
more low permeability zones associated with the fault gouge which separates two zones
of high permeability in the fractured rock (e.g. Fig. 6.4a). In addition, the fault breccia
(if present) may be more permeable than the gouge (Fig. 6.4b, c). Thus, faults can act
as groundwater barriers as well as groundwater conduits, or as both at the same time.
The net result of this complex permeability layering within a fault zone is that faults
can have a variety of effect on the flow of groundwater and the resulting distribution
of fluid pressures has a major effects on the stability of a slope. It is not uncommon
to find springs and seepage of groundwater along faults which have served as a failure
surface in open pit or underground mines. Wilson (1959) described such conditions
for a failure of a portion of the Bingham Canyon pit.
Several consequences of this zonation are illustrated in (Fig. 6.4). One possibility is
that the fault may act as a groundwater barrier as shown in (Fig. 6.4a). In this case the
rock adjacent to the pit slope may be well drained yet unfavourable groundwater
conditions may exist that could lead to a slope failure. Fig. 6.4b shows a fault serving
as a groundwater conduit leading water from a nearby stream into the pit slope. In this
case the dual behaviour of the fault due to the presence of one or more low
124
permeability layers in addition to the fractured rock may prevent the groundwater in the
fault zone from reaching the drainage gallery shown. Fig. 6.4c shows a fault serving
as a subsurface drain which would increase the stability of the mine slope. These
conditions are equally applicable for groundwater condition adjacent to a natural
escarpment or artificial cutting.
6.10 HYDROGEOLOGICAL ASPECTS OF THE ESCARPMENT IN THE STUDY
AREA
In a consideration of the hydrogeological aspects of the northern niawarra slip area the
conditions in each of the Hawkesbury Sandstone, Narrabeen Group and Illawarra Coal
Measures are important. On the basis of field observations the Hawkesbury Sandstone
is quite porous, although the fracture porosity may be very localised. Along the
Lawrence Hargrave Drive between Clifton and Coalcliff, the Scarborough Sandstone and
Bulgo Sandstone also show high fracture porosity along the joints (Fig. 6.5).
Along the outcrop of the Illawarra Coal Measures the coal seams have been observed
by the author to be permeable and to act as aquifers. The presence of aquifers, unstable
cements and swelling clays contribute to rapid weathering and disintegration and reduce
the overall rock mass quality in the Illawarra Coal Measures in outcrop.
Rainwater enters the various Narrabeen Group aquifers where they intersect a surface
recharge zone, be that along creek beds on the plateau or on the slopes of the
escarpment and under scree slopes. The plateau areas act as the major catchment to
replenish the groundwater table within the escarpment slope. However, sandstone
aquifers along the edge of the escarpment would be exposed to recharge from the
escarpment slopes. The area west of Coledale Station on the Illawarra Railway is an
example of a mid-escarpment recharge zone (Fig. 6.6a, b). A series of perched and
confined aquifers are also present in the escarpment because most of the claystone
sequences within the Narrabeen Group are relatively impermeable. The primary porosity
125
and permeability of the Narrabeen Group is very low. It is considered that the vast
majority of the groundwater is stored in fissures and fracture systems such as faults,
dykes, joints and bedding plane partings. Lateral facies changes would also inhibit the
horizontal flow of groundwater via cracks to some extent. However, water is
transmitted via these secondary discontinuities usually as a vertical flow over limited
distances until a relatively thick impermeable claystone bed was encountered. In the
cliffs between Coalcliff and Clifton water was observed by the author to be issuing at
an estimated rate of about 8 litres per hour from the base of the Scarborough Sandstone
(Fig. 6.5). The outlet pipes were roughly spaced every 1 m and this was several days
after moderately heavy rainfall. This confirms the impermeable nature of the underlying
Wombarra Shale at this locality. Water is commonly seen issuing at other locations
along the escarpment. For example, between Stanwell Park and Coalcliff, where water
is flowing from the weathered Wombarra Shale and Coal Cliff Sandstone, or between
Scarborough and Clifton where water is flowing from the colluvium and over buried
Wombarra Shale (Fig. 6.10). It would be expected that the rocks in the immediate
vicinity of the escarpment would have a higher permeability due to stress relief joints
and weathering of the joint and bedding plane partings.
The relatively common observation of water issuing from the coastal cliffs and
escarpment slopes is most likely explained by discontinuities in the rock mass. The
sandstone of the Narrabeen Group appears quite permeable although the aquifers are
sporadically and irregularly spaced. Stress relief with the opening of discontinuities
would be most significant on the edge of the escarpment. The Southern Coalfield is
intersected by faults, with throws of up to 100 m, and by intrusive dykes. None of
these structures yield any significant amount of water into the mine workings. This is
most likely due to the alteration and the presence of impermeable clay lined fault zones
and dykes and to the relatively impermeable nature of the claystone and shale units,
especially the Wombarra Shale.
126
Many of the slopes are blanketed with relatively impervious clayey talus which covers
horizontally bedded strata in the study area. High groundwater pore pressures and
artesian conditions develop and cause failure of the talus, whose shear strength
approximates its residual value. For example, a deep seated failure has been active for
some time at Coledale and was moving slowly toward the sea in this place (Fig. 6.6c).
This was exacerbated by the heavy rainfall in April 1988 (Figs 6.7 to 6.9). This failure
was most probably controlled by a weak colluvial soil layer beneath the fill embankment
and overlying the bedrock (Mostyn and Alder, 1991). The Coalcliff slump between
Coalcliff and Stanwell Park is another example; this slump is active and will be
explained in chapter 8.
The effect of Water Board dams, which are located to the west of the escarpment, is
important for the slope stability in some places. For example, Coalcliff dam is 1.7 km
west of the railway at Coalcliff and at an elevation of 210 m above the railway level
(Fig. 1.4). The gully along which the dam is situated appears to correlate with the large
north-trending fault zone which includes the Ladysmith and Western Gully Faults. In
view of the probability that subsidence associated with the extensive coal mining in this
area would have caused disturbance to the rock, sufficient to cause opening up of pre
existing fault related fractures, it is probable that the rock beneath the catchment and
storage area would have a greater than normal vertical permeability. Figure 6.11 (also
see Fig. 6.4c) illustrates this hypothesis.
It is thought that this type of groundwater infiltration has probably increased due to coal
mine subsidence between 1967 and 1973. This would have caused a significant increase
in the water flow in the vicinity of the escarpment and also raised the regional
groundwater level.
127
6.11 RAINFALL AND ITS RELATIONSHIP TO HYDROGEOLOGY
Field studies and previous investigations suggest that groundwater flows, with or without
the contribution of local surface infiltration, may be a major cause of the slope
instability in the northern Illawarra slip area. Consequently, this factor has received
considerable investigation with several dozen piezometers having been installed
throughout the area of slip over the last ten years. Evidence of artesian groundwater
flows was discovered in the region (Coalcliff area, at between 5 and 6.5 m depth; State
Railway Authority, 1982). It would appear that the water is flowing within the top part
of the Stanwell Park Claystone. The layer was isolated above and below by grey shale
beds.
Correlation of rainfall with groundwater levels and slip movement has been attempted
during this and previous investigations, however no obvious correlation was found
linking short term events. During the flood rains of April 1988 along Lawrence
Hargrave Drive between Coalcliff and Clifton, large quantities of talus and topsoil from
above the road slipped down toward the ocean at six locations. Rainfall records at
Wombarra and Stanwell Park showed falls of about 656 mm for the 3 days of April,
just before the slip, which came on top of the earlier rainfall in the same month that
had saturated the area.
Young (1978), in attempting to predict rainfalls likely to initiate landslip in the Illawarra
area, stated that in Wollongong the recurrence interval of the most intense storms bears
little relation to the frequency of severe landslip activity. This proposition appears to
be supported by surveys of the rainfall and historical records which show that the
periods of greatest slope instability in the Illawarra area coincide with the years with
the highest cumulative rainfall, not necessarily the years with the most intense storms.
For example, Young (1978) noted that, for the Illawarra area in general, daily rainfall
exceeding 400 mm/day has occurred as follows :
128
10/2/1975 493 mm
11/9/1950 433 mm
15/3/1936 508 mm
05/5/1925 510 mm
13/1/1911 443 to 529 mm
The point to note is that although 1950 did not experience the most intensive storms,
it did have the highest yearly rainfall on record, and this year was noted for its large
number of slope failures and, in particular, major slipping at Coalcliff. It is also
interesting to note that, according to Young (1978), the storm on the 11/9/1950, despite
being the most intense of the year, did not appear to cause any specific slope
movements. For the Illawarra area during this study annual rainfall has been low and
daily rainfall exceeding 100 mm/day has only occurred as follows:
07/6/1991 110 mm
11/6/1991 225 mm
12/6/1991 168 mm
09/2/1992 101 mm
10/2/1992 240 mm
22/3/1992 104 mm
14/9/1993 102 mm
6.12 RAINFALL AND ITS RELATIONSHIP TO LAND MOVEMENTS
The topography of the Illawarra escarpment tends to encourage rainfall. It rises steeply
from the sea some 300 m to the upper plateau over a small horizontal distance. As a
result heavily laden clouds travelling inland from the sea lose rain as they pass over the
scarp. Geomorphological features highlight periods of intense past surface water flows.
Erosion of the main gullies, particularly noticeable above the main cascades at the top
of the escarpment, has occurred in at least two cycles. Adamson (1974) described how
129
the western and eastern gullies above Coalcliff had excavated the main bulk of the
valleys in the first cycle of erosion after which a lower flow situation occurred which
created a narrow entrenched stream in the base of the gully.
Hydrograph data shows that rainfall is highly variable along the escarpment but is
commonly concentrated within isolated areas on the steeper slopes. This leads to high
surface water flow and infiltration. Annual average rainfall along the coastal plain
ranges from 1100 - 1200 mm but exceeds 1700 mm (Fig. 2.4) at the crest of the
escarpment. Records are available for 1950 showing more than 3000 mm along part
of the escarpment at Mt Keira (Young, 1978).
In contrast to Young (1978), Brand (1993) and Olivier et al. (1994) documented that
mass slope failures appear to have occurred during high intensity rainfall events of more
than 400 mm over 24 hours, which occurred within a longer duration rainfall period.
Individual high intensity rainfall events such as in June 1991 and February 1992 (Figs
6.7 and 6.8) appear to have caused scours and flooding rather than activating major
landslips.
Bowman (1972) found no correlation of landslip with daily rainfall events, however he
postulated a connection of major failure with monthly rainfall in excess of 400 mm.
This was confirmed by Young (1978) and she suggested a monthly rainfall in excess
of 250 mm as likely to trigger landslip. She also noted a lag time between heavy
rainfall and accelerated movement. By studying rainfall and evaporation data, she
compared excess precipitation levels for the low coastal plain (Albion Park) with the
upper levels of the escarpment (Mt Keira). She concluded that on the higher slope the
average quantity of water available for runoff and infiltration is 55% of the average
rainfall, as compared to 15% in the lower slopes. This is even more dramatic when it
is considered that the upper levels receive more rainfall than the lower regions.
In reality, any prediction of movement with respect to rainfall is dependent upon
infiltration levels and the reaction of phreatic surfaces to cumulative rainfall events. As

130
the phreatic surface rises to a threshold level, movement occurs. This level represents
a situation where the factor of safety is unity. Longmac Associates (1991, see also Fig.
6.12 and Table 6.1) studied the relationship of monthly rainfall with respect to landslide
activity and found a poor correlation existed for the 1988 - 1992 period. They
concluded that data for three monthly rainfall records (e.g. 1950 with 1171 mm per 3
months) correlated better to the current large scale landslide (Moronga Park) in the
detailed study area. Fig. 6.12 depicts rainfall versus recurrence interval highlighting the
major rainfall events.
Between 1988 and 1990 was an active period for landslip occurrences. Referring to the
rainfall data (Table 6.1 and Figs 6.7 and 6.8), 1988 involved both high intensity and
long duration rainfall events. On the other hand, 1989 and 1990 displayed low monthly
and high three monthly levels. Landslip was equally active in each year. The year
1991 was mainly dry with only one major rainfall event in June (Figs 6.7 to 6.9; Fig.
6.9 shows a positive correlation between rainfall in the Clifton and Wollongong areas).
This resulted in many new debris flows but did not activate the existing larger landslips.
The writer installed in late 1991 a series of surface survey pegs on the four landslides
(Clifton Hotel earth-slump, Moronga Park slump-earth flow, Jetty slump and Harbour
slump) for measuring slip movement, but no movement occurred during the study
period because of very dry conditions.
6.12.1 THE CONCEPT OF THRESHOLDS
Because of the relationship between the occurrence of landslides and rainfall events,
there have been numerous attempts to derive thresholds beyond which slopes will
become unstable, the objective being to establish a value of rainfall which, when
exceeded, results in landslides (Guidicini et al, 1977; Crozier, 1986; Bhandari et al,
1991; Olivier et al, 1994). Guidicini et al. (1977) analysed rainfall records for nine
regions in Brazil and the results indicated that when rainfall exceeded 12% of the mean

131
annual rainfall, a critical level of soil saturation was reached which in most cases
triggered landslides. When the intensity of rainfall was greater than 20% it appeared
that catastrophic landslides occurred.
General observations by the author over the 1988 - 1994 period have confirmed previous
deductions that land instability occurs after prolonged rainfall which acts to top up the
phreatic surface until a critical threshold is reached (more than 400 mm per month,
when rainfall exceeded 25% of the mean annual rainfall). This contrasts with an
isolated high intensity event during low rainfall periods which generally tends to cause
flooding and failure by scour or debris flow.
6.13 GROUNDWATER AND ITS RELATIONSHIP TO LAND MOVEMENTS
All of the rainfall evidence, when considered as a whole, tends to suggest that only
longer term rainfall trends on a scale of several months to years, appear to significantly
influence the output of aquifers affluxing beneath the slip and hence the groundwater
levels in the adjacent talus and embankment materials. Within the Narrabeen Group,
groundwater flow from weathered porous sandstone aquifers into the interface between
the bedrock and overlying talus would be expected to apply hydrostatic pressures of at
least 60 kPa to the talus at a depth of 6 m. The important factor to consider in this
case is that the groundwater pressure applied to the lower boundary of the talus resulted
from upward flow from beneath and to the west, and it is not simply due to the height
of the column of water represented by the water table in the talus.
The possibility of the occurrence of serious slip movement during relatively dry periods
can be explained by the time lag between the previous major rainfaU period, capable
of significant aquifer recharge, and the emergence of the groundwater flows and pressure
at the aquifer/talus interface.
132
6.14 SUMMARY AND CONCLUSIONS
It is clear that groundwater flow in and around faults and similar features, such as dykes
and sills, requires special attention in slope stability studies. The physical properties of
the fault zone materials must be considered as well as any change in permeability or
change in physical properties due to an offsetting of lithologic units or other geologic
structures. Intersections of faults require additional attention as the jointing intensity can
be much higher here and the effects of weathering much deeper.
Perched water tables have been found to be quite common in the study area because
the many claystone sequences within the Narrabeen Group are relatively impermeable.
This involves the collection of surface water in a basin of higher permeability material
above the regional water table. Infiltration of the water then results, forming a local
rise in the phreatic surface aggravating creep type slides. Depending upon the
catchment, large water volumes may be involved which can often lead to rapid mud
flow failures. The Coledale Rawson Street disaster (1988) is a notable example of this
failure mechanism.
The natural pore spaces in the soil or rock constitute the primary porosity which may
be filled with water. In cohesive soils this water can be further subgrouped into free
or combined water. In rock, the permeability is controlled by the interconnection of
pores and fractures. Unfractured claystone often has a low permeability due to its fine
grain size whereas sandstone with little intergranular cement would be expected to
possess a higher permeability.
Adamson (1974) discussed the relative permeability of the strata in the detailed study
area. The Hawkesbury Sandstone is the most permeable of the rocks, with Scarborough
Sandstone being reported to be the most permeable rock unit in the Narrabeen Group.
Water may also be contained within joints, fault zones or fractures which constitute the
fracture (secondary) porosity. This form of water results in seepage concentrations
which are often under a considerable head of pressure.
133
Theoretically, in strata which are sub-horizontally bedded and comprised of interbedded
sandstone and claystone, horizontal permeability is often much greater than the vertical
permeability. The more impermeable claystone beds act as barriers to the flow. This,
however is susceptible to local influences, especially jointing.
In the detailed study area a complex hydrological environment exists. Mine plans
indicate that the area contains scattered faults, dykes and sills whereas weathered open-
jointed strata near the scarp face result from stress relief. Although many fault and
dyke locations are unknown at the surface, they are believed to effect the water regimes
and create water concentrations, and thus high hydrostatic pressure, if confined by a
more impermeable outer layer. M a n y of these joints are noticeable on the surface in
the Bulgo Sandstone outcrop and they may be present, to a lesser extent, in the
underlying Stanwell Park Claystone unit. Several explanations exist for the weak, highly
jointed nature of the Bulgo Sandstone unit near the outer face of the escarpment. It is
likely that stress relief, mine subsidence and the intrinsic composition of the material
contributed to this characteristic. All these factors combine to provide high vertical
permeability often resulting in seepage concentrations.
With a relatively impermeable colluvium mantle existing at the base of the steeper
sandstone slope where it joints the claystone terrace, seepage is restricted in its passage
from the more permeable bedrock resulting in large hydrostatic water pressures. The
Bulgo Sandstone overlying the Stanwell Park Claystone is highly jointed. Water tends
to enter the rock strata along the top of the escarpment and upper slopes through open
joints, flowing downwards until a relatively impermeable layer is encountered. Water
also enter the Scarborough and Coal Cliff Sandstone though open joint system along the
escarpment and passes down to the underlying shale units.
Water then travels horizontally and attempts to outlet on the outer face of the
escarpment at the base of the sandstone units. ff a deep colluvium deposit is situated
134
adjacent to the aquifer, the hydrostatic pressures will build up and m a y result in creep
movement or even a more active slope failure.
The Stanwell Park Claystone has been observed by the author to the north of Coalcliff
Station to possess high fracture porosity in surface outcrops. Flow rates of up to 24
litres/minute have been reported from the fractured unit at Coalcliff site (Ghobadi &
Pitsis, 1993). Borehole data for this unit show that, behind the escarpment, the rock
is much less fractured (chapter 3.8.5).
Based on observations by the author and the previous studies, it appears that fracture
permeability is the most important feature of groundwater movement, with most of the
fractures occurring in areas of stress relief.
Variation in water content of the talus has a marked effect on its shearing resistance and
hence on its stability. The presence of some water m a y increase the appearance
cohesion in partially saturated soil, as against perfectly dry material. However, in
saturated soil pore water pressure due to groundwater and seepage will be positive and
shear strength will decrease with any increase in pore water pressure. The effect of
increasing the water content has been discussed by Terzaghi (1950) and many others.
It acts in several ways, including:
(1) decreasing cohesion due to filling voids with water and expelling the air;
(2) increasing the weight and hence shearing stresses;
(3) possibly dissolving cementing materials; and
(4) causing a rise in the piezometric surface, involving increase of pore-water pressure
and decrease of shearing resistance.
It is quite obvious from studying the rainfall figures and periods of prevalence of
landslides that the most unstable periods are those when the rainfall is the highest over
an extended time interval.
135
On the basis of observations during the site visits, rockfalls are triggered by prolonged
rainfall and their behaviour is very similar to that of talus slides, which appear to occur
after cumulative rainfall exceeds some threshold (more than 400 mm per month).
Debris flows may be triggered by intense storms whereas most slope movement and
slides occur as a result of prolonged rainfall of certain magnitude (more 400 mm per
24 hours). Commonly a distinct time delay occurs between heavy rainfall and failure.
This time delay varies greatly, from merely a day to several months.
In any part of the escarpment the water may fall directly on it during rainfall, be
brought to it by surface drainage or be derived from underground sources. It is where
these source are combined that the maximum effects are felt, a good example being
along the zone of the Clifton Fault, which has been described previously is an active
aquifer system.
An important factor to consider in this area is that the groundwater pressure applied to
the lower boundary of the talus results from upward flow from beneath and is not
simply due to the height of the column of water represented by the water table in the
talus. Consequently, lowering of the water table in the talus cannot be expected to
produce the normally required decrease in hydrostatic and uplift pressures on the
talus/bedrock interface where the bedrock aquifer affluxes. This aspect is particularly
relevant to the failure mechanism and the choice of remedial measures.
6.15 EARTHQUAKES
Earthquakes reduce stability by imparting both a shearing stress and a reduction in
resistance to slope material. Earthquake wave propagation is thought to have three
principal effects on slip materials:
(1) the direct mechanical effect of horizontal acceleration which, at high shaking
intensity, may exceed acceleration due to gravity. This provides a temporary
increment to shearing stress which is sufficient on occasions to trigger landslides;
136
(2) cyclic loading in clays, sands and silts with weak inter-particle bonding. In
saturated material, seismic loading shifts the weight of particles from its granular
support onto the porewater, thereby increasing interstitial pressure, buoying up the
mass and causing liquefaction. Loose sands and sensitive clays are particularly
susceptible to liquefaction by earthquake shaking and other vibrations; and
(3) reduction of intergranular bonding afforded by cohesion and internal friction, due
to sudden shock, irrespective of the degree of saturation. This may lower the
shear strength of material towards its residual value. The effect is similar to that
experienced by a brick building when shaking breaks the bonds between mortar
and bricks. Although this response may not immediately initiate movement, it
serves to make the slope susceptible to future triggering activity.
6.15.1 EARTHQUAKES IN THE STUDY AREA
Compared to countries which are situated in active tectonic zones, such as Japan,
Turkey, Iran and Chile, Australia is considered to have only a small earthquake hazard.
Two significant earthquakes have taken place in the vicinity of study area since
recording began in 1909; they are the Robertson earthquake of 21 May 1961 and the
Picton earthquake of 9 March 1973, both of magnitude 5.5 on the Richter scale and
they both occurred at depths of about 20 km. Also a significant earthquake took place
at a more distance location, Newcastle. The Newcastle earthquake of 28 December
1989 had a magnitude 5.6 on the Richter scale (Melchers, 1990). This earthquake
occurred at depth of about 13 km. Recently an earthquake took place at Cessnock
(49 km from Newcastle), it occurred on 6 August 1994 with a magnitude of 5.3 on the
Richter scale. Earthquakes of this size occur on average about once every eighteen
months in Australia (McCue et al, 1990).

137
6.15.2 SECONDARY EFFECTS OF EARTHQUAKES
The effects of the Picton earthquake have been described by Denham (1976, 1979), and
those of the Robertson earthquake by Cleary and Doyle (1962). The isoseismal maps
are given in Figs 6.13 and 6.14. In both earthquakes the damage was confined to old
buildings (some more than 100 years old). For the Picton shock, which was felt over
an area of about 6000 km2, light damage was experience over about 4000 km2. This
consisted of damage to plaster, brickwork and the tops of chimneys where the heat from
fires had destroyed the adhesive properties of the mortar. The Newcastle earthquake
resulted in 12 deaths, hundreds of injuries and serious damage to, or destruction of,
thousands of homes and buildings. The isoseismal map is given in (Fig. 6.15). This
was the first time in written history that lives have been lost as the result of an
earthquake in Australia.
No reports were received of any sand boils during the Newcastle earthquake. The only
documented coseismic subsidence was on the southern abutment of the Stockton Bridge,
10 km north of Newcastle. The lack of surface faulting is not surprising for an
earthquake of this size and focal depth. In Australia during the last twenty years, five
faults have ruptured the surface following large, very shallow earthquakes in Western
Australia, South Australia and the Northern Territory. In eastern Australia there are at
least two recent earthquake scarps, in Victoria and Tasmania, but each predate written
history.
6.15.3 INTERPRETATION AND EFFECTS OF EARTHQUAKES AND
STRESS ENVIRONMENT
The Robertson, Picton and Newcastle earthquakes occurred at shallow depths as have
virtually all the other earthquakes reported in the Sydney Basin. It is well known that
shallow earthquakes are much more damaging than deeper earthquakes.
138
Any earthquakes occurring to the west of the Illawarra escarpment and at shallow depth
would have a very significant effect on the escarpment. High accelerations could well
be expected on the edge of the escarpment and on the edges of local benches on the
slopes of the scarp. Typical stress concentrations at the base of the escarpment are
likely, with possible tensile regions near the edge of the cliff tops. These very small
compressive forces and possible tensile zones are likely to result in stress relief which
induces fracturing of the rock parallel to the escarpment. This phenomenon is common
throughout the world and has been noted by Mencel (1974). Thus the horizontal stress
perpendicular to the escarpment at the edge of the escarpment equals zero. Joints which
occur perpendicular to the escarpment are always closed, indicating the presence of a
horizontal stress parallel to the escarpment. The value of this horizontal stress is
difficult to estimate and would obviously increase with depth. It is likely that the joints
which occur at mean orientations of 005° and 055° and produce a saw tooth plan on
the edge of the escarpment cause localised stress changes in the vicinity of the joints.
This could have a significant effect on stability as a wedging system may result.
Slow structural deformation would continue in the study area in the month following
the earthquake. The effect of earthquakes on slope stability are most likely to be
important in the study area when the earthquake occurs during a wet period which has
produced high porewater pressures and decreased shearing resistance.
Two additional aspects of the effect of earthquakes on mining may be considered.
Firstly, it is possible that subsidence due to mining may increase as a result of an
earthquake. A second aspect relates to damage to the mines themselves; water leakage
problems may be enhanced or the upper level faults or joints may result in a rupture
surface farther down. These factors will also affect the regional groundwater conditions
and may have implications for land stability in the escarpment area.

139
CHAPTER 7
ENGINEERING GEOLOGY
7.1 ENGINEERING PROPERTIES OF ROCKS IN THE LOWER NARRABEEN
GROUP
The factors which influence the engineering properties of rocks can be divided into
internal and external categories. The internal factors include the inherent properties of
rock itself, whilst the external factors are those of its environment at a particular point
in time.
As far as the internal factors are concerned the mineralogical composition and texture
are obviously important but planes of weakness within a rock and the degree of
weathering are frequently more important.
Over the last decade the influence of weathering on the engineering properties of many
igneous and sedimentary rocks, under dry and saturated conditions, has been investigated
by numerous authors (e.g. Gunsallus and Kulhawy, 1984; Dobereiner, 1986; Kembla
Coal & Coke Pty Ltd, 1990, 1991; Jeffrey and Shakoor, 1990; Olivier, 1990; McNally,
1993; Ghayoumian et al, 1993; Haney and Shakoor, 1994; Ghafoori et al, 1994). A
great deal of test data has been accumulated on engineering properties of fresh and
weathered rocks. It is very well known that weathering generally affects the structure
and behaviour of rock. As the degree of weathering increases, rocks become more
porous and weaker. Additionally, it is also very well documented that the presence of
water decreases the strength of rocks. However, in nature rocks are found under
varying degrees of saturation. Therefore, it is important to know not only the
weathering state of the rock mass but also its strength and durability in order to predict
the stability of a rock (Bell, 1993).
140
7.2 WEATHERING
Many definitions of the term weathering have appeared in the abundant literature which
covers this large and somewhat diverse subject (e.g. Merril 1897; Rieche, 1950; Keller,
1957; Dearman, 1974; Oilier, 1984; Turk and Dearman, 1986). Weathering includes the
processes of alteration of a rock occurring under the direct influence of the hydrosphere
and the atmosphere at or near to the earth's surface. Weathering as a natural process
may be either mechanical or chemical or a combination of the two. Mechanical
weathering is dominated by physical breakdown with opening of discontinuities, the
development of new discontinuities and the opening of mineral grain boundaries and
cleavages. Decomposition is the dominant process in chemical weathering and leads
through stages of discolouration of the original fresh rock to decomposition of silicate
minerals to from clay minerals, with attendant opening of grain boundaries. Thus
chemical weathering leads to changes in colour, strength and porosity, but original rock
mineral texture is largely retained until the final stages when a residual soil is formed.
7.2.1 ENVIRONMENTAL FACTORS CONTROLLING ROCK WEATHERING
The influence of weathering on the engineering properties of rocks is well known,
because of its importance. The natural weathering processes described are closely
related to three important environmental factors; the hydrosphere, the climate and the
topographical situation (Fookes et al, 1988). The influence which the hydrosphere has
on the weathering processes is evident from the vital role that water plays in the
degradation processes outlined above. The presence of water in the rocks also affects
their mechanical properties. In nature the degree of saturation will depend on the
position of the rock mass relative to the groundwater table. The position of the
watertable, and moisture content in the overlying vadose zone, both vary seasonally.
Consequently the physical properties of rock material can be expected to fluctuate
according to the position of the groundwater table and the moisture content in the rock.
141
The main climatic controls on rock weathering are related to the precipitation,
evaporation and temperature variations within the local environment. The intensity,
frequency and duration of precipitation events, along with seasonal and diurnal
temperature ranges, are important factors in the determination of which physical and/or
chemical weathering processes dominate within a given climatic regime.
Oilier (1984) noted the important influence of topographical attitude of an area on the
weathering processes. Slope angle, whether in a natural slope or engineering structure
such as an embankment or cut slope, can have an important effect because as the angle
increases, weathered products can be more easily removed, thus exposing new materials
to the weathering environment. Relief and slope angle markedly influence the amount
of surface run-off, and thus influence subsurface through-flow of water which affects
the rock materials. The orientation and shape of slopes will help determine the
microclimate, rate of evaporation and soil temperature (Brunsden, 1979).
7.2.2 MINERAL HYDRATION
Mineral hydration causes modifications to the engineering behaviour of soil and rocks
by virtue of changes in volume or density, the interaction between mineral grains, and
the physical properties of the materials involved.
Grim (1962) distinguished two hydration processes in clay soils: namely, intercrystalline
ard intracrystalline swelling. Intercrystalline swelling takes place when the uptake of
moisture is restricted to the external crystal surfaces and void spaces between crystals.
Such swelling may occur in all materials but it is most significant in fine-grained ones,
particularly clays. In relatively dry clays the particles are held together by relict water
under tension from capillary forces. On wetting these forces are relaxed and the
material expands. Such swelling occurs in any type of clay, irrespective of
mineralogical composition, although the amount of swelling depends on a number of
factors including mineral species and the type and concentration of cations present in
142
the porewater. Intracrystalline swelling, on the other hand, is characteristic of the
smectite family of clay minerals, in particular of montmorillonite. Verrniculite and some
varieties of chlorite also display intracrystalline swelling behaviour. In swelling minerals
the individual molecular layers of the mineral are weakly bonded so that on wetting
water enters not only between the crystals, but also between the unit layers which
comprise the crystals. Here the magnitude of swelling is a function of clay mineral
type, especially the type of interlayer cations present in the mineral (Taylor and Cripps,
1984). For example kaolinite is not expansive whilst montmorillonite is; Na-
montmorillonite being able to expand to many times its original volume. Swelling in
Na-montmorillonite can amount to 800 to 1000 times the original volume (Bell et al,
1986) the clay then having formed a gel of dissociated platelets with dimensions similar
to those of the unit cell (10A). Since swelling is principally due to the ingress of
water, the rock must be porous or fractured. If a rock has an intact unconfined
compressive strength exceeding 40 MPa, it is not subject to swelling (Bell et al, 1986).
Failure of consolidated and poorly cemented rocks occurs during saturation when the
swelling pressure developed by capillary suction exceeds their tensile strength.
7.2.3 MINERAL SOLUTION
Surface and near surface environments can represent conditions in which certain rock
and soil forming minerals are susceptible to chemical change within the context of
weathering. The most important processes, namely solution, oxidation and hydrolysis,
may be controlled by the movement and composition of groundwater since it will act
as the medium of transfer, both into and out of the reaction site, of active components
and products respectively. It is pertinent that the removal of individual grains in
heterogeneous materials will lead to reductions in density and strength, together with
increases in porosity and permeability. In dry air, rocks decay very slowly. The
presence of moisture hastens the rate tremendously, firstly because water is itself an
143
effective agent of weathering and secondly because it holds in solution substances which
react with the component minerals of the rock. The most important of these substances
are free oxygen, carbon dioxide, organic acids and acids of nitrogen.
Weathering of silicate minerals, for example feldspar and mica, is primarily a processes
of hydrolysis. The process whereby feldspars are decomposed to form clay minerals is
affected by the hydrolysing action of weakly carbonated water. Clays are hydrated
aluminium silicates and when they are subject to severe chemical weathering in seasonal
tropical regimes some of them break down to form laterite or bauxite.
7.2.4 PROCESSES AND MECHANISMS OF WEATHERING IN THE STUDY
AREA
It is often difficult to distinguish between physical and chemical processes in rock
weathering because they frequently work together to complement each other.
Nonetheless, for the rocks considered here the physical processes are dominant and
chemical changes are generally only significant in the later stages of weathering, where
the claystone, for example, has been altered to a residual soil. Other than wetting and
drying, physical weathering may involve unloading due to erosion (differential release
of confining pressures), which leads to differential stresses and strains in interbedded
sedimentary strata. Considering the effects of weathering on the rock slope stability of
the upper part of the niawarra escarpment, only the earlier stages of alteration are
usually relevant. In this area, the rock is only slightly to moderately weathered, as
failures often occur before the rock has been completely altered to a residual soil.
The fissile claystones are generally much weaker than the more massive claystones.
This is partly due to the ease of moisture movement into the fissile claystone. The
influence of primary sedimentary structures on the breakdown of the sandstones is small.
Clearly the sandstone is much more permeable than the claystone and hence moisture
migration is more important as a weathering factor in the sandstone. The structural
144
changes accompanying an increase in weathering are most important in decreasing the
strength of the rock mass. The effect of wetting (producing swelling) and drying
(desiccation and shrinkage), as shown by the slake durability test, is more pronounced
in some of the claystones, even if the strata have been weathered only slightly.
According to the petrological study (XRD), the Wombarra Shale contains expandable
illite-montmorillonite mixed-layer clay minerals (chapter 4.5.3.4). These minerals expand
by adding interlayer water molecules into their structure and although the process is
reversible, the rocks break down by the generation of unequal local pressures between
grains. Consequently, wet-dry cycling would cause the rocks to disintegrate rapidly as
they do when they are exposed in the vadose zone weathering. Attewell and Farmer
(1976) have discussed the factors influencing the magnitude of the swelling of a clay
in the presence of water. According to their discussion minor sweUing may also
accompany a decrease in confining stress level due to unloading.
Failure of the mineral skeleton along the weakest plane ensues from weathering and an
increased surface area is then exposed to a further sequence of weathering events.
Considering the extremes of rainfall followed by dry periods these cycles are very
common in the Illawarra area. The crack density patterns in claystone illustrate the
increased surface area which this physical breakdown produces. Intra-particle swelling
of the expandable clay minerals is also believed to be very important in the breakdown
of the claystones. As weathering progresses the crack pattern produced by intra-particle
swelling increases the surface area and water intake and drainage is more rapid. Slaking
produced by wetting and drying mechanisms tends to destroy any primary sedimentary
structures, principally bedding. The fissile claystones, even in the fresh state, are more
open to this type of attack than the massive claystones.
Dearman (1976) has stressed the importance of direct solution in the weathering of
silicate rock material. The solution of siderite and calcite cement in both the sandstones
and claystone in the Illawarra area is a contributing factor affecting breakdown of the
145
strata. This solution is usually a slow change, much slower than the associated physical
processes; however, over long periods of time it may be more important. Breakdown
of the sandstone and some siltstone is primarily controlled by geological structures
which allow the entry of water. The surface weathering of sandstones can result in
heavy iron staining and case hardening due to the conversion of ferrous oxide to ferric
oxide. The weathering of the sandstone and claystone in a non-oxidising environment,
which is substantially below the watertable, is often quite different. In the latter case,
the claystone and sandstone are permanently saturated and the rate of weathering is
much slower. Solution appears, from thin section studies, to be the major factor
affecting breakdown in this regime but ionic dispersion is also very likely. Chemical
alteration of the component minerals is more evident as the physical processes are
suppressed. The claystone has a more open structure with quite c o m m o n evidence of
solution. The same is seen in the sandstone although secondary deposition of quartz
may occur. The siderite and calcite cement are generally reduced in amount and the
shearing strength of the remaining cement and matrix is reduced by the mineralogical
changes resulting from near permanent saturation. However, the rate of strength
reduction is much slower than it is for surface weathering processes, especially wetting
and drying. It is quite possible that salt weathering is also an important breakdown
mechanism for surface rocks in the northern Illawarra area. The salts are provided from
spray and the splashing of waves. Violent storms in the niawarra area are known to
blow sea spray to great heights and it is quite likely that the entire escarpment would
be covered by sea spray, even the top of the plateau, although the zone just above the
reach of the waves would be most affected. However these effects must be minor in
this area since the vegetation is not specifically salt tolerant. Wellman and Wilson
(1965) listed the conditions necessary for salt weathering: supply of salts; site protected
from wind and rain in which salts can accumulate; and cyclic changes in humidity
and/or temperatures that include the crystallisation point of at least one of the salts
146
present. The salts crystallise in the interstices or pores of the rock and fractures occur
if the stress produced by the growing crystal is greater than the mechanical strength of
the rock. This process is more prone to attacking sandstones than claystones, although
original fissures within claystone could well be opened and expanded by salt weathering.
A slightly weathered sandstone with some outer-most pores exposed would be very
susceptible and may result in honeycomb weathering (e.g. Scarborough Sandstone, south
of Coalcliff along Lawrence Hargrave Drive).
The deposition of salts in the outer pores of rocks could well tend to break the outer
shell of the rock. Wetting and drying, and temperature and humidity fluctuations cause
alternating solution and crystallisation of the salt and create shear stresses in this outer
zone which could induce failure. The common observation of so-called "onion skin"
weathering may be caused partially by this mechanism.
Thermal stresses may develop in rocks depend on the rate of heating and cooling.
Although it may be important in some localised situations it is not considered to be an
overall significant physical weathering process in the Narrabeen Group strata, as the
normal range of temperature variation is not very great.
Wind erosion is believed to aid salt weathering and the removal of weathering materials
and so permit deeper weathering; however by itself wind action is not considered to be
a significant cause of breakdown.
The Narrabeen Group claystones were essentially formed in a fresh water environment
and connate water would have had a low salt content. Salts from sea spray find their
way into the groundwater in the Illawarra area. Wallis and Johnson (1969) stated that
Na+ is the principal cationic contaminant in the southern Sydney Basin and CI" is the
main anionic contaminant, thus illustrating the importance of NaCl from sea spray.
These salts, especially Na\ could replace some exchangeable cations in the clays
(principally Ca~ and H+) and there by cause expansion.
147
This is likely to occur more in the massive claystone where randomly orientated clays
were flocculated due to an excess of C a ~ and H+. In contrast, the fissile dispersed
claystones were possibly formed in a more alkaline environment due to excess Na+.
However, this cationic substitution effect would be very small and could almost be
disregarded as a significant breakdown mechanism.
The excess sodium in the groundwater prompted B o w m a n (1972) to believe that sodium
montmoriUonite would tend to form on weathering in preference to calcium
montmoriUonite. It is well known that the former is much more susceptible to swelling
and breakdown than the latter.
Results of X-ray diffraction analysis indicate that Narrabeen Group rocks and talus
consist of quartz, kaolinite, illite, smectite, mixed-layer clay minerals and iron oxide.
Quartz and kaolinite are abundant in most rocks and talus in the Illawarra area. A n
increase in weathering correlates with an increase in the expandable lattice mixed-layer
clay minerals in the sandstone, shale and claystone. Weathered Stanwell Park Claystone
and Wombarra Shale show a decrease in the kaolinite content and an increase in the
mixed-layer clay minerals.
B o w m a n (1972) recorded analyses of clays resulting from weathering of the Narrabeen
sandstones, with the kaolinite content increasing up the sequence while the content of
mixed-layer clays and illite decrease on ascending stratigraphically. B o w m a n believed
that the illite is degraded into mixed-layer clays with an increase in weathering.
Nonetheless, from aU of the results it is clear that although chemical weathering does
occur, especially in the more highly weathered materials, the main mechanisms of
breakdown of both the claystones and sandstones are fundamentally physical weathering
processes.
148
7.2.5 WEATHERING, STRENGTH AND LANDSLIDES
Weathering of the Narrabeen Group rocks and talus materials will lead to a decrease in
strength which will increase the possibility of landsliding.
(1) The degree of weathering is usually at a max i m u m at the ground surface and,
therefore, changes of strength are maximum near the ground surface. For example,
along the coast line especially between Clifton and Coalcliff.
(2) For sandstone units in the Narrabeen Group, the rate of structural disintegration
and chemical alteration is usually slow so that strength changes of these rocks due
to weathering only need be taken into consideration in the long-term situation.
(3) For claystone and shale in the Narrabeen Group, the influence of structural
disintegration on shear strength is much larger than that which could be normally
caused by chemical alteration of the minerals.
(4) Structural disintegration by weathering occurs more readily and rapidly in claystone
and shale in the Narrabeen Group, which have the capacity for significantly greater
volume change than in the associated sandstone units. The latter have little
capacity for volume change.
(5) Structural disintegration occurs most readily in the Stanwell Park Claystone,
Wombarra Shale and the grey claystone interbeds in the Bulgo Sandstone which
fail during minor deformation.
(6) Structural disintegration should also occur very readily in claystone interbedded in
the Coal Cliff Sandstone, which has a great latent capacity for volume change due
to clay minerals (smectite).
(7) Structural disintegration of argillaceous rocks, especially the Stanwell Park
Claystone and claystone in the Bulgo Sandstone in the Illawarra area, can occur
rapidly after either artificial or natural exposure and its effect on rock strength
should be taken into account. O n the other hand, the rate of change of mineralogy
149
is slow, but is important during the long term weathering when considering the
secondary processes of land-sliding.
(8) The effect of chemical alteration (either of mineralogy or matrix material) on the
effective stress and shear strength of talus soils is small in the short-term, to the
point of being inconsequential, when considering the initiation of land-sliding.
(9) The strength of talus soils changes very little due to weathering effects over
human life spans, and landsliding of these materials is primarily initiated by
changes of water pressure, environmental changes, changes of slope geometry,
external loading, excavation, or by such natural occurrences as strong-motion
earthquakes.
7.3 SLAKE DURABILITY TEST
7.3.1 INTRODUCTION
Of particular engineering interest in rocks, especially shales and other mudrocks, is their
durability to weathering upon exposure to surface and underground conditions following
excavation. Weathering effects at the surface are important for assessing the stability
of slopes in road, railway, canal, spillway and other cuts (Dearman, 1976; Rodrigues and
Jeremias, 1990; Hawkins and Pinches, 1992). Durability may vary considerably from
bed to bed in a single outcrop or road cut.
The potential breakdown during slake-durability testing may result from one or more of
the following causes or mechanisms: (a) permeability and porosity which control the
entry and retention of water and its mobility inside the rock; and (b) the action of water
can cause solution of cement, disruption of interparticle bonds, or may set up disruptive
forces due to pore-pressure. Hence a rock that is impermeable usually will be durable.
Clay-bearing rocks, not only mudstone but some sandstone and weathered igneous rocks,
are most susceptible to slake deterioration. The types of clay minerals present are also
important. Sodium clays are easier to disperse than potassium, magnesium and barium
150
clays. In the Illawarra area, for example the dominant clays are illite and
montmorillonite which contain inter-layer cations that favour hydration. In these cases,
swelling of the crystal lattice may well assist in dispersion and disruption processes.
Stress relief is probably also an important mechanism, since consolidated clay-bearing
rocks that have been subjected to burial, tectonic or diagenetic forces are likely to store
elastic strain which will be released if intergranular bonds are weakened by the action
of water.
Various testing procedures are available for the characterisation of argillaceous materials,
but their range of applicability, given the need for a useful test result, are significantly
limited. There are many standardised tests for design parameters of soil-like materials,
and conventional rock testing techniques can be applied to heavily compacted or
cemented soils and rocks. There are, however, few test which sensitively quantify the
properties of materials spanning the range between soil and rock.
The major problem in slope stability caused by argillaceous materials is their
susceptibility to degradation upon exposure. Potential results of such behaviour are
rapid slope degradation by loss of strength of the surface material, undercutting of
overlying more competent units, and long-term loss of intact strength affecting the
stability of rock walls.
In the slake durability test (ISRM, 1985) lumps of rock are agitated in a cylindrical
mesh drum while immersed in water. Following this, the material retained in the drum
is oven-dried and weighed. This cycle is repeated; the slake durability index is the
amount of rock remaining after the second cycle, expressed as a percentage of the
original amount. The processes acting in the test are equivalent to those operating
during natural surface exposure. The results may therefore aid in predicting
susceptibility to and rates of surface weathering. It may also be argued that, since the
sample is subjected to stress because of the slaking and abrasion, the slake durability
index may give an indication of rock behaviour under stress conditions. In other words,

151
it m a y be used as a rock index test capable of predicting certain aspects of engineering
performance. However, since the test is rapid, it does not take into account any longer
term dissolution or alteration effects.
7.3.2 SLAKE DURABILITY
The two-cycle slake durability test is an accelerated weathering test. Durability is
defined in this circumstance as the resistance of a rock to weakening processes. It is
really the inverse of the term weatherability. The durability index can vary from 0 %
where a material completely disintegrates, to 1 0 0 % durability when no disintegration
takes place.
A brief review of the likely processes of degradation operating in the slake durability
test is necessary to establish the applicability of the test results. The test is a
combination of slaking (i.e. breakdown upon exposure to moisture) and abrasion. Van
Eeckhout (1976) concluded that shear strength was reduced by expansion of fractures
due to capillary tension changes, pore pressure increase, friction reduction and chemical
deterioration. If these mechanisms of strength reduction (rather than active breakdown)
are relevant in the slake durability test, then the abrasive action of the test would be
significant. However, Hudec (1976) found that losses in the slake durability test were
no more than those in an alternating wet-dry test. Thus it seems that the slaking effect
is the most important process; the agitation merely enables all the small fragments
generated to pass through the mesh.
The mechanisms causing slaking breakdown are, however, far from completely
understood. Various authors have used liquids of different surface tensions to elucidate
the slaking process.
Colback and Wiid (1965), Nakano (1967), Taylor and Spears (1970) all recognised a
decrease in durability or strength when rocks were immersed in liquids of increasing
surface tension. Oliver (1980) summarised work based on strain measurement of shale
152
during changes in humidity and moisture content. The degrading processes were related
to partially irreversible anisotropic expansion and shrinkage of the rock when subjected
respectively to capillary action and drying. Also noted was the relative importance of
microfracturing in controlling breakdown compared with the influence of mineralogy.
These microdiscontinuities provide the conduits for the moisture redistribution that
resulted in slaking.
7.3.3 AIM OF STUDY
The primary objectives of this study were to: (a) identify the durability index and
delineate the engineering properties of strata in the lower Narrabeen Group. Such index
properties would be applied in a classification scheme for engineering purposes and
possibly to aid in geological classification; (b) derive a relationship between the slake
durability result and the mineralogy and fabric of the rocks; (c) account for differing
behaviours of shale units of similar age; and (d) interpret the processes occurring in the
test.
7.3.4 METHOD OF STUDY
The method of study can be divided into subsections as follows.
7.3.4.1 SAMPLE COLLECTION
Samples of weathered rocks were collected from the northern niawarra district between
Clifton and Coalcliff, and between Scarborough Station and Stanwell Park Station. Coal
Cliff Sandstone samples came from the base of the landslide at Coalcliff Harbour.
Wombarra Shale, Otford Sandstone Member and Scarborough Sandstone samples came
from cliffs beside the road near the Jetty Fault and the railway cutting at Scarborough
Station. Bulgo Sandstone samples came from the railway cutting at Stanwell Park
Station,
153
Core samples were collected from boreholes IL64 and IL55, drilled in the North Cliff
area (Fig. 3.11) approximately 10 km west of the coastal exposure.
7.3.4.2 SAMPLE PREPARATION
Samples from each site consisted of ten representative, intact, roughly equidimensional
rock fragments weighing 40 g to 60 g each (ASTM, 1991). These fragments were
produced by breaking the rock with a hammer. Fragments were obtained from rock
cores and from weathered rock outcrops. Sharp corners were broken off and dust was
removed by brushing the sample just prior to weighing. The total sample weight from
each site was 450 g to 550 g.
7.3.4.3 PROCEDURE
(1) For each test the rock fragments were placed in a mesh drum. They were
weighed, and dried in an oven (110°C) for 16 h. The rock and drum were
allowed to cool to room temperature for 20 minutes and weighed again. The
natural water content was calculated as follows:
W = [(A - B)/(B - Q] x 100
Where
W = percentage water content
A = mass of drum plus sample at natural moisture content
B = mass of drum plus oven-dried sample before the first cycle
C = mass of drum
(2) The drum was mounted in the trough and coupled to the motor. The trough was
filled with tap water, at room temperature, to 20 mm below the mesh drum axis.
The mesh drum is rotated at 20 rpm for a period of 10 minutes.
154
(3) The mesh drum was removed from the trough immediately after the rotation period
was completed and the mesh drum and the retained sample were dried in the oven
for a further 16 h.
The mesh drum and sample were weighed to obtain the oven-dried mass for the
second cycle. Steps 2 and 3 were repeated. Again the drum and sample were
weighed to obtain a final mass.
7.3.4.4 CALCULATIONS
The slake durability index is calculated, as follows :
Id2 = t(Wf - C)/(B - C)] x 100
Where
Id2 = slake durability index (second cycle)
B = mass of mesh drum plus oven-dried sample before the first cycle
W f = mass of mesh drum plus oven-dried sample retained after the second cycle
C = mass of mesh drum.
7.3.5 RESULTS
Thirty six samples were subjected to slake durability testing. The samples ranged from
fresh to highly weathered claystone, shale, coal, sandstone and interbedded claystone.
A third and fourth cycle was performed in an effort to make the test more realistic for
long term weathering (Figs 7.1 to 7.8). The results are given in Tables 7.1 and 7.3.
The slaking fluid was tap water at 21°C. The slake durability index is defined after the
second cycle and it is used for slake durability classification. According to Hopkins and
Deen (1984) the in-situ (natural) moisture content of shales provides a strong indication
of their slake-durability properties. They considered shales with a natural water content
below approximately 3.5% to have a high slake-durability index while those with natural
water contents of between 3.5% and 7.5% appear to have an intermediate slake-
155
durability rating. In general, there is a decrease in durability from the fresh to
weathered specimens, especially for the Stanwell Park Claystone (Figs 7.4b, 7.5a). The
durability of this claystone is highly dependent on its water content (Fig 7.8a), the
durability decreases rapidly as water content increases. Grey claystone interbedded in
the Bulgo Sandstone has a very low durability (Figs 7.6 and 3.9a) and appears to be
akin to the underlying Stanwell Park Claystone. Weathered Wombarra Shale has a
natural water content between 1.43% and 7.25% (Fig 7.8b), and the durability decreases
as water content increases (samples were collected one week after heavy rainfall).
Sandstone samples 1, 2, 3, 12, 13, 14, 15 (Fig 7.9), 16, 17, 18, 19, 25, 26 and 27, and
shale samples 17, 18, 19, 22 and 23 showed only relatively a small breakdown, whereas
claystone samples 4 and 5 showed a moderate durability. Claystone samples 6, 7, 8,
9 and 11 showed lower slake durability index values for weathered rocks compared to
fresh claystone rocks, especially samples 4 and 5 (Fig 7.10) which belong to the Stawell
Park Claystone.
Field observations and slake durability tests indicate a distinct difference between the
rates of weathering of the claystone interbedded in the Narrabeen Group sandstone. In
(Table 7.2) grey claystone interbedded in the Bulgo Sandstone (Fig. 3.9a; samples 1 and
2) showed lower slake durability, whereas claystone interbedded in the Scarborough
Sandstone (Fig. 3.6; samples 3 and 4) and claystone interbedded in the Coal Cliff
Sandstone (Fig. 3.22; samples 5 and 6) showed medium slake durability and only a
small breakdown respectively. It is dependent on their mineralogy, and especially on
the amount of carbonate cement. Distinct differences in durability between the coal
(sample 3 in Table 7.3) and highly weathered sandstone (samples 1, 2 in Table 7.3) in
the niawarra Coal Measures may have important consequences for slope stability in this
formation in the Clifton area.

156
7.3.6 SLAKE DURABILITY CLASSIFICATION
Gamble (1971) proposed using the results from the second 10 minute cycle after drying
as a basis for slake durability classification. Values of the slake durability index for
representative shales and claystones tested by Gamble varied over the whole range from
0% to 100%. Based upon his results, Gamble proposed a classification of slake
durability (Table 7.4). Franklin and Chandra (1972) proposed a different subdivision
for slake durability classification (Table 7.5). Slake durability classification for
Narrabeen Group strata according to Franklin and Chandra (1972) is shown in Table 7.6.
7.3.7 STATIC (LONG-TERM) DURABILITY TESTING
Static durability tests were carried out on selected samples from the Narrabeen Group
which included both fresh core and weathered outcrop materials. Each sample was
subdivided into two portions, which were weighed and then tested with distilled water
or tap water respectively. Each sample was placed in a beaker, that was filled with
water to provide about 20 mm sample cover. Visual assessments of the specimen
condition were made at elapsed times of 1 minute, 10 minutes, 1 hour, 5 hours,
24 hours (Fig. 7.11) and two days. The specimen condition was reported as a
letter/number code as defined in Table 7.7.
In an effort to make the tests more realistic for long term weathering, the samples were
subjected to repeated wetting and drying events to simulate wet and dry conditions on
the outcrop. The samples were, therefore, drained and dried in an oven (65°C) for 24
hours. The rock and beaker were allowed to cool to room temperature for 10 minutes
and weighed again. This process was then repeated after one week, two weeks
(Fig. 7.12), four weeks and then at monthly interval to six months or until the sample
totally disintegrated. The results are shown in (Tables 7.8 to 7.13) for fresh and
weathered samples respectively. Solubility and disaggregation of the Coal Cliff
Sandstone, Otford Sandstone Member, Scarborough Sandstone and Bulgo Sandstone in
157
water are shown in Figures 7.13 to 7.15 and Table 7.14. During the 6 months of
testing the percentage of weight loss per cycle for the Coal Cliff Sandstone,
Scarborough Sandstone and Bulgo Sandstone were 0.3%, 0.17%, and 1.11% respectively.
During the first two months the percentage of weight loss per cycle for the Otford
Sandstone Member was 1.22% but at the end of two months the sample became
completely disaggregated.
7.3.8 CONCLUSIONS
Slake durability tests approximately reproduce, on an experimental scale, the conditions
in the cliffs that cause differential erosion. They illustrate an accelerated reduction in
durability from repeated wetting and drying, which is one of the main factors affecting
the surface layers of the cliffs (Norris, 1990). Also it is useful for comparing the
weathering characteristics and associated lithological changes between the Wombarra
Shale and Stanwell Park Claystone and claystone interbedded in the Narrabeen Group
sandstone. Moderately and highly weathered Stanwell Park Claystone samples have very
low durability (Fig. 3.8); it is dependent on their mineralogy, and especially on the type
and quantity of clay minerals present. Different clay minerals have different influences
on the mechanical behaviour of rock. Cripps and Taylor (1981) demonstrated the
importance of expansive clay minerals within argillaceous rocks in controlling moisture
sensitivity. The predominant lithological characteristic of claystone is its high proportion
of detrital and authigenic clay (Dick and Shakoor, 1992). Consequently, the clay
minerals have the most pronounced influence on the durability behaviour of claystone.
Kaolinite, illite, mixed-layer (illite-smectite) and montmorillonite are common in the
Stanwell Park Claystone and grey claystone interbedded in Bulgo Sandstone. The
expandable mixed-layer illite-smectite and montmorillonite varieties are particularly
important because their presence makes the Stanwell Park Claystone highly susceptible
to slaking when exposed to water. The relatively high durability of the Wombarra Shale
158
is attributed to its higher degree of consolidation and cementation compared with the
Stanwell Park Claystone.
It is the structural laminations in shale that distinguishes it from other mudrocks. The
laminations are, in part, a manifestation of the degree of uniform orientation of platy
minerals in the rock (Potter et al, 1979). As the degree of orientation increases, so
does the degree of consolidation.
Field observations show that the Wombarra Shale is well laminated in parts of formation
indicating a relatively high degree of consolidation.
Presumably the main problem with the slake durability test is that it is not totally
analogous to the natural processes which are acting on the cliffs. It gives quantitative
data concerning the rocks but, unless the complex processes of nature can be reproduced
in the laboratory, the results can not be expected to necessarily give values which are
directly useable. However, they should give the relative proportion of disintegration that
each lithology is likely to undergo.
The third and fourth cycles were performed in an effort to make the slake durability test
more realistic. However, the results are not significantly different from the previous two
cycle losses. The extended testing was useful for the Stanwell Park Claystone and
weathered Wombarra Shale samples because they showed much lower index values.
Although the tests show little difference in durability or strength, except for the Stanwell
Park Claystone ( M W and H W samples), the lithologies are in fact different for each
formation, and the differential erosion in the cliff sections is probably controlled by
these differences.
The Coal Cliff Sandstone has a clay matrix content of around 3 0 % of the total rock.
It consists of cross-bedded sandstone with interbeds of shale and sandy shale. Marine
abrasion attacks these sandstones just above mean sea level at the base of the cliff and
tends to wash the clay from between the quartz grains in the sandstone beds. This
would cause a large increase in the porosity and also a significant decrease in the
159
strength of the surface layers. Small rock fragments or individual crystals can then fall
off, or be washed off by waves. The increased porosity of the surface would also
facilitate the deposition of salt from evaporating sea water. Such salt deposits expand
during crystallisation and can force off grains or thin layers of the surface material by
repeated solution and precipitation mainly just above high tide level.
In the Scarborough Sandstone and Bulgo Sandstone, the quartz content is higher, and
the rocks appear to be strongly cemented with calcite and kaolinite. If the clay were
washed out, the porosity increase would be less than the increase suffered by the Coal
Cliff Sandstone, so that the strength decrease of the surface layers would be marginal.
It has been well established that the moisture content in argillaceous rock masses such
as claystone and shale can have a significant effect on their properties. The
compressive strength of quartzitic shale under saturated conditions is in the order of
5 0 % of that under dry conditions (Colback and Wild, 1965). The weathered Stanwell
Park Claystone has a high water content which may be a useful index for determining
other engineering properties, especially the strength of the intact rock.
The petrological study (see chapter 4) also provided a useful indication of the character
of the rock, and gave a guide to the likelihood of differential erosion. The latter is
dependent on the clay content of the sandstone, and this feature, combined with the
secondary cement, is the most important factor controlling the erosion of these coastal
cliffs.
Sandstone units in the Narrabeen Group, which contain abundant clay minerals and
volcanic rock fragments, show significant strength loss on wetting. In the clay-rich
varieties the change in strength is likely to be related to the softening and possible
expansion of the clay minerals. The petrological study in this research showed that the
Narrabeen Group sandstone contains swelling clays. Therefore, expansive forces in these
rocks are a mechanism contributing to strength loss. High proportions of expansive clay
minerals were detected in volcanic rock fragments (cherts) which suggest that clay
160
softening in the presence of water is important in controlling moisture related reduction
in strength of sandstone in the Illawarra area. The nature of the cement also influences
slake durability. Sandstone units in the Narrabeen Group containing kaolinite and calcite
cements are generally less susceptible to moisture effects. Therefore, slake durability
of intact samples from the Narrabeen Group rocks is controlled primarily by the
mineralogy of rocks and to a lesser extent by the rock microfractures.
The static durability test was performed in an effort to make the durability more
realistic. The results are useful for a better understanding of weathering and slope
stability. In the long term, solubility and disaggregation in the Otford Sandstone
Member would cause an increase in the secondary porosity of this sandstone. The
percentage of weight loss per cycle for the Otford Sandstone Member was 1.22% and
at the end of two month the sample become completely disaggregated. Small rock
fragments or individual crystals fell off and in the outcrop situation could have been
washed off by surface or groundwater movement (Fig. 3.5). The percentage of weight
loss per cycle for the Coal Cliff Sandstone, Scarborough Sandstone and Bulgo Sandstone
are 0.3%, 0.17%, and 1.11% respectively. The results of solubility and disaggregation
provide answers as to why the cliffs in Narrabeen Group strata have high fracture
porosity. It would appear that zones with soluble cement are eroded more quickly than
adjacent areas with less soluble material.
7.4 POINT LOAD STRENGTH TEST
7.4.1 INTRODUCTION
Strength determination of a rock usually requires, careful test set up and specimen
preparation, and the results are highly sensitive to the method and style of loading.
Many methods are available for the strength determination of rocks. An easy and
inexpensive field technique for measurement of rock strength is the point load test
described by Broch and Franklin (1972). This test provides an index for the strength

161
classification of rock materials. It may also be used to predict other strength parameters
with which it is correlated, for example uniaxial tensile and compressive strengths
(ISRM, 1985).
7.4.2 AIM OF STUDY
Point load strength tests were carried out so that: (a) a greater number of weathered
specimens could be tested for comparison with test results from fresh specimens; (b)
tests could be made both perpendicular and parallel to bedding and hence a
consideration of effect of anisotropy could be made; and (c) the strength classification
of the various rock units could be determined.
7.4.3 METHOD OF STUDY
The method of study can be divided into seven sub-sections as follows.
7.4.3.1 SAMPLE COLLECTION AND PREPARATION
Approximately 240 samples were gathered for point load testing.
Samples of weathered rocks (irregular lumps) were collected from the northern Illawarra
district between Clifton and Coalcliff, and between Scarborough Station and Stanwell
Park Station. Coal Cliff Sandstone samples were obtained from the base of the
landslide at Coalcliff Harbour. Wombarra Shale, Otford Sandstone Member and
Scarborough Sandstone samples came from cliffs beside the road near the Jetty Fault
and from the railway cutting at Scarborough Station. Bulgo Sandstone samples came
from the railway cutting at Stanwell Park Station.
Core samples were collected from Kembla Coal & Coke (KCC) boreholes IL64 and
IL55, drilled in the North Cliff area (Fig. 3.11). Diameters of core samples were 60
mm and diameters of irregular lumps were generally greater than 40 mm but this was
not always possible. The International Society for Rock Mechanics (1972) has
162
suggested a minimum of twenty lumps for the irregular lump test; this was possible due
to the large number of suitably weathered outcrop samples.
7.4.5 DIAMETRAL TESTS
Core samples with a length/diameter ratio greater than 1.0 were used for diametral
testing. At least 10 tests were carried out per sample. Each sample was inserted in the
test machine and the platens closed to make contact along a core diameter. The
distance L between the contact points and the nearest free end was at least 0.5 times
the core diameter (Fig 7.16a). The load was steadily increased so that failure occurred
within 1-2 minutes, and the failure load P was recorded. If the fracture surface passed
through only one loading point (Fig 7.17c) the test was carried out again.
7.4.6 AXIAL TESTS
Core samples with a length/diameter ratio of 0.3-10 were used for axial testing (Fig.
7.16b). At least 10 tests were carried out per sample. The sample was inserted in the
test machine and platens closed to make contact along a line perpendicular to the core
end faces. The load was steadily increased so that failure occurred within 1-2 minutes,
and the failure load P was recorded. If the fracture surface passed through only one
loading point (Fig. 7.17d), the test was carried out again.
7.4.7 IRREGULAR LUMP TESTS
Irregular lumps with a ratio D/W between 0.3 and 1.0 were used for these tests (Fig.
7.16c). At least 10 tests were carried out per sample. The specimen was inserted in
the testing machine and the planes closed to make contact with smallest dimension of
the lump.

163
The load was steadily increased so that failure occurred within 1-2 minutes, and the
failure load P was recorded. If the fracture surface passed through only one loading
point, the test was carried out again.
7.4.8 CALCULATIONS
The point load index (L) indicates the rock strength at the time of failure;
Is = P/D2
The uncorrected Point Load Strength L. was calculated as P/De2 where De, the "equivalent
core diameter", was given by:
De2 = D2 for diametral tests
De2 = 4A/ for axial block and lump tests
A = WxD = minimum cross-section area of a plane through the platen contact points
(Fig. 7.16c).
Since Is varies as a function of D in the diametral test, and as a function of De in axial,
block and irregular lump tests, a size correction must be applied to obtain a unique
Point Load Strength value for the rock sample. The latter can be used for the purpose
of rock strength classification.
The size-corrected Point Load Strength Index L(50) of a rock sample is defined as the
value of Is that would have been measured by a diametral test with D = 50 mm.
The "Size Correction Factor F" can be obtain from the expression:
F = (D/50)045 (after Greminger, 1982)
For general purposes and for tests near the standard 50 mm size, very little error was
introduced by using the approximate expression:
F = 0V50) (after ISRM, 1985)
Therefore the necessary formulae for the strength calculation could be written as :
L = F.P/De2 (after ISRM, 1985)
164
Mean values of Is(50) can be used when classifying samples with regard to their Point
Load Strength anisotropy indices. The mean value was calculated by deleting the
highest and lowest values from the conducted valid tests and averaging the remaining
values.
The strength anisotropy index 1.(50) was defined as the ratio of the mean 1,(50) values
measured perpendicular and parallel to planes of weakness. This ratio would be near
1.0 for quasi-isotropic rocks and higher values would be obtained for anisotropic rocks.
7.4.9 RESULTS
The Point Load Strength classification for Narrabeen Group samples is shown in Table
7.15 for fresh core samples, and Table 7.16 for weathered samples. Summarised point
load strength results for the Coal Cliff Sandstone, Wombarra Shale, Otford Sandstone
Member, Scarborough Sandstone, Stanwell Park Claystone and Bulgo Sandstone are
shown in Tables 7.17 to 7.22. In general, there is a decrease in strength from the
fresh to weathered specimens and the strengths parallel to the bedding are generally
much lower than those normal to bedding (Fig. 7.18). The fresh core samples are very
strong (Table 7.15); in contrast, some of the weathered specimens sampled at the surface
show low strength as noted for moderately weathered Stanwell Park Claystone (Table
7.16 and Fig. 7.19). The Ia(50) results indicate the effect of orientation on the strength
(Fig. 7.20). The sandstones are generally only slightly anisotropic, whereas fresh shale
and claystone are strongly anisotropic.
Many surface samples show medium to high strength, for example highly weathered
Bulgo Sandstone, highly weathered Scarborough Sandstone and moderately weathered
Wombarra Shale (Table 7.16). Some of the weathered samples are still strong to very
strong, for example moderately weathered Bulgo Sandstone, Scarborough Sandstone and
Coal Cliff Sandstone (Table 7.16). In these cases, it seems likely that the weathering
of the samples has caused alteration of the siderite cement to hematite and other iron
165
oxides cements, thus producing secondary hardening. Among the weathered specimens,
Otford conglomerate is interesting because it is very strong (probably because it is well
cemented).
7.4.10 RELATIONSHIP BETWEEN POINT LOAD STRENGTH INDEX AND
UNIAXIAL COMPRESSTVE STRENGTH
Various correlations between the Point Load Strength Index (PLSI) and the Uniaxial
Compressive Strength (UCS) have been reported in the literature (e.g. Bieniawski, 1975;
Ghosh and Srivastava, 1991; Tsidzi, 1991). Bieniawski (1975) reported that for a
variety of rock types the global average (UCS) to Is ratio was approximately 23.50.
Ghosh and Srivastava (1991) recently reported that a ratio of 16 was more appropriate
for rocks from India.
For this study, the average Is was correlated with the (UCS) of the rock by the
following equation (after Bieniawski, 1975):
U C S = (14 + 0.175 D J L
Based on tests concluded in the laboratory on core and lump samples the relationship
between PLSI and U C S for various members of the Narrabeen Group are presented in
Tables 7.17 to 7.22.
In general there is a decrease in strength from the fresh to weathered specimens (Figs
7.21 to 7.23). The fresh samples are strong to very strong; in contrast, some of the
weathered specimens sampled at the surface are moderately strong to strong (Table
7.23). A m o n g the weathered specimens, moderately weathered Stanwell Park Claystone
is interesting because it is moderately weak (probably because of mineral composition).
The strengths parallel to the bedding are generally much lower than the strength
perpendicular to bedding (Fig 7.24). This reflects the presence of oriented elongate and
platy grains or clearly defined bedding planes.
166
7.4.11 CONCLUSIONS
The majority of samples subjected to the point load testing were sandstone because
much of the Narrabeen Group consists of sandstone and the shale units are commonly
unsuitable for testing because of the presence of closely spaced joints. The weathered
Stanwell Park Claystone and weathered Wombarra Shale usually broke up prior to
testing, or at the start of testing the specimens broke immediately upon the application
of the load before obtaining any record on the pressure gauge. It was not possible to
test highly weathered claystone at all.
Anisotropy seriously affected the test values. Failures very often occurred along the
bedding planes rather than through the rock substance, particularly when the rock was
weathered.
These results provide answers as to why the cliffs in Narrabeen Group strata are
undergoing differential erosion. Differential erosion is the result of weathering of rocks
which are not uniform in character, but are softer or more readily altered in some places
than in others. The result is usually an uneven surface, with the softer rocks being
removed more quickly than the harder strata. As expected, the data presented here
show that the fresh rocks are stronger than weathered rocks. The Scarborough
Sandstone and Bulgo Sandstone are marginally stronger than the Coal Cliff Sandstone.
The Wombarra Shale is stronger than the Stanwell Park Claystone. Based on the
Uniaxial Compressive Strength fresh Scarborough Sandstone and Bulgo Sandstone can
be classified as being very strong whereas fresh Coal Cliff Sandstone is strong to very
strong. Fresh Wombarra Shale can be classified as moderately to very strong whereas
fresh Stanwell Park Claystone is moderately strong to strong. Weathered sandstone in
the Narrabeen Group is moderately strong to strong whereas measured values from
weathered shale and claystone range from moderately weak to moderately strong. The
highly weathered shale and claystone were too weak to test.
167
Strength is related to porosity, amount and type of cement and/or matrix, the
composition of the individual grains, and the amount and type of weathering. The
Narrabeen Group sandstones all contain variable proportion of quartz, clay and carbonate
cements, with the content of the latter generally being lower in weathered samples than
in fresh core material.
The amount of cementing material is more important than the type of cement, although
if two sandstones are equally well cemented, one having a siliceous, the other a
calcareous cement, then former is the stronger (Bell, 1983). Thus the cemented shales
are invariably stronger and more durable than poorly cemented varieties whereas
carbonaceous shale containing a significant proportion of organic matter, is still less
durable. Moderate weathering increases the fissility of shale by partially removing the
cementing agents along the laminations or by expansion due to the hydration of clay
particles. This has certainly occurred in the Wombarra Shale and accounts for the
relatively low strength of moderately weathered Wombarra Shale (Table 7.23).
Petrological studies (chapter 4) provided a useful indication of the character of the
sandstone, and give a reasonable guide to the likelihood of differential strength. The
clay content of the rocks, combined with the secondary cement, is probably the most
important control on the differential strength of these sandstone units.
7.4.12 RELATIONSHIP BETWEEN UNIAXIAL COMPRESSIVE STRENGTH
(UCS) AND SLAKE DURABILITY INDEX (SDI)
The relationship between uniaxial compressive strength (UCS) and slake durability index
(SDI) is shown in Fig. 7.25. The relationship between uniaxial strength (UCS) and
slake durability index (SDI) for weathered Wombarra Shale and weathered Stanwell Park
Claystone are shown in Figs 7.26 and 7.27. In general, there is a decrease in strength
and durability from fresh to weathered specimens. The fresh samples which are strong
to very strong show extremely high durability; in contrast, weathered samples which are
168
moderately strong to strong show high to very high durability. Among the weathered
specimens, moderately and highly weathered Stanwell Park Claystone are moderately
weak to moderately strong and show very low durability.
7.5 ROCK COMPOSITION IN RELATION TO MECHANICAL PROPERTIES
The petrographic description of rocks for engineering purposes includes the
determination of all parameters which have a bearing on the mechanical behaviour of
the rock or rock mass but cannot be obtained from a macroscopic examination of a rock
sample, for example, parameters such as mineral content, grain size and texture
(Hallbauer et al, 1978). Microscopic characteristics, in particular in the areas of grain
contact and cementation, explain the strength and behaviour of sandstones (Dyke and
Dobereiner, 1991).
The ISRM recommends that the report of a petrographic examination should be
confined to a short statement on the origin, classification and details relevant to the
mechanical properties of the rock concerned.
7.5.1 ROCK COMPOSITION AND STRENGTH
The compressive strength of a sandstone is influenced by its porosity, amount and type
of cement and/or matrix material as well as the composition of the individual grains
(Hawkins and McConnell, 1991, 1992; Haney and Shakoor, 1994). Price (1963) showed
that the strength of sandstones with a low porosity (less than 3.5%) was controlled by
their quartz content and degree of compaction. In those sandstones with a porosity in
excess of 6% he found that there was a reasonably linear relationship between dry
compressive strength and porosity, for every 1% increase in porosity the strength
decreased by approximately 4%. If cement binds the grains together then a stronger
rock is produced than one in which a similar amount of detrital matrix performs the
same function. However, as noted previously the amount of cementing material is more
169
important than the type of cement (Bell, 1983). For example, ancient quartzarenites, in
which the voids are almost completely occupied with siliceous material are extremely
strong with crushing strengths exceeding 240 MPa. By contrast poorly cemented
sandstones may possess crushing strengths of less than 3.5 MPa. In the Narrabeen
Group sandstones, porosity is generally less than 3.5 % (see chapter 4) and their
strength was controlled by their quartz content (Tables 7.24 to 7.26). Figures 7.28 to
7.31 show a reasonably linear relationship between unconfined compressive strength and
percentage of quartz for fresh and slightly weathered Coal Cliff Sandstone samples, fresh
Scarborough Sandstone samples, fresh Bulgo Sandstone samples and the total fresh,
slightly and moderately weathered Narrabeen Group sandstones samples respectively.
Also there is a linear relationship between point load strength index and percentage of
quartz for fresh, slightly and moderately weathered Narrabeen Group sandstone samples
(Figs 7.32 and 7.33).
7.5.2 ROCK COMPOSITION AND SLAKE DURABILITY
Mudrocks are sedimentary rocks in which more than 50% of the grains have a diameter
of less than 0.062 mm. Mudrocks can be distinguished on the basis of percent clay and
presence of structural laminations (Potter et al, 1979). Within the mudrock group, five
different classes of rocks are recognised: shale, mudstone, claystone, siltstone and
argillite. It has been estimated that mudrocks account for as much as 70% of all
sedimentary rocks (Picard, 1971). Consequently, mudrocks are frequently encountered
in all types of geotechnical engineering projects. Where mudrocks are excavated and
left exposed to weather, they rapidly slake to produce a soil-like material having
significantly inferior engineering properties to those of the original rocks. In these
situations, the durability of mudrocks becomes their most important engineering property.
The prediction of mudrock durability is complex because there are multiple lithological
factors controlling durability. This complexity is aggravated by the very fine-grained
170
nature of mudrocks which makes the lithology difficult to study except by XRD (Table
7.27). The durability of shales is related to the fabric as expressed by void ratio and
absorption. Mudstones are distinguished on the basis of an absence of well developed
structural laminations and the presence of micro-fractures. The durability of mudstones
is related to the frequency of the micro-fractures. The durability of argillite is not a
problem. The mineral grains in argillite have been recrystallised resulting in a very
durable rock (Russell, 1981). Obviously, the presence of swelling clays in any of these
rocks will have an effect on durability.
Testing of samples from the Wombarra Shale has shown that the slake durability test
is capable of making a sensitive differentiation between shale of varying composition.
It is reasonable to expect that properties such as strength will vary with these
compositional changes. The form and amount of calcite is the principal control over
large scale variations of the slake durability index in the Wombarra Shale for fresh
samples (1 and 2 in Table 7.27) and weathered samples (3 to 8 in Table 7.27). The
presence of calcite in shale will usually cause high durability. The Wombarra Shale is
cemented in the Clifton area beside the Jetty Fault but north of Wombarra Station it
is not. Another difference in the behaviour of samples is that the slake durability of
Wombarra Shale from south of Wombarra Station (samples 7 and 8 in Table 7.27) is
sensitive to the abundance of clay minerals in the clastic fraction whereas the shale in
the Clifton area is not (samples 3 and 4 in Table 7.27). The shale south of Wombarra
Station is less durable than that at Clifton perhaps because of its fabric. Reflecting the
arrangement of individual clay particles, the microcracks, which allow access for water
and along which degradation is concentrated, have greater curvature in the fissile shale
south of Wombarra Station. The cracks will, therefore, tend to meet more frequently
during slaking of this shale, generating smaller and more equant particles which will fall
through the test mesh. There is, therefore, a complex interplay of geological factors that
control the durability and presumably all the other properties of the Wombarra Shale
171
from south of Wombarra Station and from Clifton. Similar variability is expected in
other units of similar lithology.
A higher proportion of clay minerals in any rock may be expected to cause a greater
tendency to slake. For example pure claystone durability is controlled by clay content.
The complex interaction of sedimentation conditions, diagenetic processes and stress
history that produce claystone apparently causes them to have a generally low durability.
Testing of samples in the Stawell Park Claystone show that this claystone to the north
of Coalcliff Station has a lower durability than that located beside the Harbour Fault
(Table 7.28). Variation in durability within this claystone is again controlled by
mineralogy. The distinct difference between the durability of fresh samples 1 and 2
(Table 7.28) and weathered samples 3 and 4 (Table 7.28) is controlled by the quantity
and condition of the clay minerals. The diffraction intensity of clay minerals in samples
3 and 4 is more than that in samples 1 and 2 (Table 7.28).
Testing of samples of interbedded claystone in the lower Narrabeen Group sandstone
units shows different durability in each unit (Table 7.29).
Claystone interbedded in the Bulgo Sandstone (samples 3 and 4, Table 7.29) shows very
low durability. Claystone interbedded in the Coal Cliff Sandstone (samples 1 and 2,
Table 7.29) have a high durability whereas claystone interbedded in the Scarborough
Sandstone (samples 5 and 6, Table 7.29) shows medium durability. The differences in
the behaviour of the samples is that slake durability is sensitive to the abundance of
clay minerals in these samples. Differences between the durability claystone interbedded
in the Coal Cliff Sandstone (samples 1 and 2, Table 7.29) is related to the intensity of
carbonate cementation. The claystone interbedded in the Bulgo Sandstone and highly
weathered Stanwell Park Claystone have very low durability (samples 3 and 4 in Table
7.29 and sample 11 in Table 7.1). This has a significant effect on slope stability in
the Bulgo Sandstone and in the Stanwell Park Claystone while acts as the bedrock for
much of the talus mantle between Clifton and Stanwell Park.
172
7.5.3 RELATIONSHIPS BETWEEN SLAKE DURABILITY, ROCK STRENGTH
AND WEATHERING IN RELATION TO ROCK SLOPE AND TALUS
FAILURE ALONG THE NORTHERN ILLAWARRA COASTLINE
In general, weathering has a major effect on the strength and slake durability of rocks
in the northern Illawarra region since they consist of unstable lithic sandstone largely
derived from a volcanic source. As the degree of weathering increases, the rock masses
become more porous and weaker with clay minerals concentrated along bedding planes
and joint surfaces. Therefore, a consideration of the weathering state of the rock, and
its resultant strength and durability, is essential for assessing the relative stability of the
rock.
The effects of weathering and alteration processes on the weak sedimentary rock
sequences in the niawarra region has been studied here. Weak sedimentary rocks
(shale, siltstone and mudstone) are commonly characterised by having a high sensitivity
to variations in moisture content that cause alternating swelling and shrinking, especially
in smectite-rich volcanic derived sequences. Volume changes within the rock mass
result in significant strength reduction and considerable deformation occurs as a
consequence. These volume changes are very difficult to control without an extensive
drainage system being emplaced both on the surface slope and within the adjacent rock
mass. Most cases of rock-slope instability within the northern Illawarra can generally
be directly attributed to the alteration and weatherability of the weak rock units.
In the argillaceous rocks in the study area, although the differences in lithology and rock
moisture content are small, weathering produce considerable changes in the mechanical
properties of adjacent layers. Weathering is limited in depth to the zone above the
permanent water table position. Above the capillary zone, because of the great variation
in moisture content, weathering processes increase, causing intense fracturing and
strength reduction in the surficial portion of the rock mass.

173
In the low permeability rocks in the northern Illawarra region, a 0.5 - 1 m thick layer
of very weathered rock is formed at the surface by the fluctuation of moisture due to
cycle of wet and dry periods. Apparently this layer acts as a natural protection against
the further development of weathering process, but if removed by slippage or slumping,
the process is reactivated, initiating the development of a new layer. Because sandstone
layers are interbedded with the argillaceous rocks, and these low permeability coarser
rocks have a higher strength and resistance to weathering, they form a series of small
benches which are generally fractured along joints, creating unstable blocks.
The rocks in the northern Illawarra area have been subjected to unloading stresses due
to weathering and scarp formation (differential release of confining pressures), which
has led to differential stresses and strains being generated in interbedded sandy and
argillaceous strata. The fissile claystone units are generally much weaker than the
associated sandstone strata. This is partly due to the ease of moisture movement into
the fissile claystone resulting from expansion and contraction of clay minerals. Hence
an increase in weathering of the claystone beds is the most important factor controlling
the decrease in strength of these rocks and thus increasing slope instability.
In the Narrabeen Group rocks slake durability is low in claystone laminae interbedded
in the Coal Cliff Sandstone, and its effect on rock strength should be taken into account
even if the adjacent strata have been weathered only slightly. The rate of change in the
physical characteristics of the rock mass due to slaking is slow, but it is important
during longer term weathering, especially when considering the secondary processes of
land-sliding. Slaking produced by natural wetting and drying mechanisms tends to
destroy any primary sedimentary structures, principally bedding. It also produces closely
spaced fractures and m a y completely disaggregate the swelling clay minerals. The
Wombarra Shale and the fissile claystone interbedded in the Coalcliff Sandstone, even
in fresh samples from drill holes, are particularly prone to this type of attack.
174
The potential for rock breakdown during slake-durability testing depends upon the
permeability and porosity, which control the entry and retention of water and its
mobility inside the rock; the presence of water, which can cause solution of cement,
disruption of interparticle bonds, and reduce shear strength due to increase of pore-
pressure, has a major effect on slope failure.
The solution of siderite and calcite cement in both the sandstone and claystone units
along the coastline is a contributing factor affecting breakdown of the strata. This
solution is usually a slow change, much slower than the associated physical processes;
however, over long periods of time it is more important. Breakdown of the sandstone
and some siltstone beds is primarily controlled by geological structures which allow the
entry of water. An increase in water content will lead to an increase in slaking and a
decrease in strength, which, in turn, will increase the possibility of landsliding along the
coastline.
The Coal Cliff and Scarborough Sandstone units consist of cross-bedded sandstone with
interbeds of shale and sandy shale. Marine abrasion and salt riving attacks this
sandstone just above mean sea level where it occurs at the base of the cliff and tends
to wash the clay from between the quartz grains in the sandstone beds. This causes a
significant decrease in the strength of the surface layers. Small rock fragments or
individual crystals can then fall off, or be washed off, by waves. The increased
porosity in the surface layer also facilitates the deposition of salt from evaporating sea
water. Such salt deposits expand during crystallisation and can force grains or thin
layers off the surface by repeated solution and precipitation mainly just above high tide
level.
Sandstone units along the coastline, which contain abundant clay minerals and volcanic
rock fragments, show significant strength loss on wetting. In the clay-rich varieties the
change in strength is likely to be related to the softening and expansion of smectitic
clay minerals. The petrological study in this research showed that the Narrabeen Group
175
sandstone contains common swelling clays. Therefore, expansive forces within these
rocks represent an important mechanism contributing to strength loss. High proportions
of expansive clay minerals were detected in both the volcanic rock fragments (which
were also partly replaced by chert) and in the matrix, which suggest that clay softening
in the presence of water is very important in controlling moisture-related strength
reduction in the sandstone in the niawarra area. The nature of the cement also
influences slake durability. Sandstone units in the upper Narrabeen Group, containing
mainly kaolinite and calcite cements, are generally less susceptible to moisture effects.
Therefore, slake durability of intact samples from the Narrabeen Group rocks is
controlled primarily by the mineralogy of rocks and to a lesser extent by the rock
microfractures.
The cliffs along the northern Illawarra coastline are undergoing differential erosion.
Differential erosion is the result of weathering of rocks which are not uniform in
character, but are softer or more readily altered in some places than in others. The
result is usually an uneven surface, with the softer rocks being removed more quickly
than the harder strata. Weathered sandstone in the Narrabeen Group is moderately
strong to strong, whereas measured slake durability values from weathered shale and
claystone show that these rocks range in strength from moderately weak to moderately
strong. The highly weathered shale and claystone samples were too weak to test and
became totally disaggregated on wetting.
Rock strength is related to the amount and type of weathering. In the Illawarra samples
there was a marked decrease in strength and durability from fresh to weathered
specimens. Among the weathered specimens, moderately and highly weathered Stanwell
Park Claystone samples are moderately weak to moderately strong but generally show
a very low durability. Where mudrocks are excavated and left exposed to the weather,
they rapidly slake to produce a soil-like material having significantly inferior engineering
176
properties to those of the original rocks. In these situations, the durability of mudrocks
becomes the most important factor affecting the slope stability.
The claystone interbeds in the Bulgo Sandstone and the highly weathered Stanwell Park
Claystone samples have a very low durability. This has a significant effect on slope
stability in the Bulgo Sandstone and in the Stanwell Park Claystone which is the
bedrock below much of the talus mantle between Clifton and Stanwell Park.
The effect of chemical alteration (either of detrital mineralogy or matrix material) on
the effective stress and shear strength of talus soils is small in the short-term, to the
point of being inconsequential, when considering the initiation of land-sliding. The
strength of talus soils changes very little due to chemical weathering effects over human
life spans, and landsliding of these materials is primarily initiated by changes of water
pressure. A s the degree of chemical weathering increases, the proportion of fine
particles in the talus materials increases which, in turn, increases the total surface area
of the particles. With an increase in the proportion of fine particles, the void ratio
decreases, drainage potential drops and consequently water pore pressure increases.
Therefore, over the long-term, this latter factor has a very important influence on
potential slope stability. However, it should be emphasised, that these changes in
permeability and drainage potential are gradual and not important on a human time-
scale.
177
CHAPTER 8
SLOPE STABILITY IN THE NORTHERN ILLAWARRA
8.1 INTRODUCTION
In the Illawarra area, with its steep coastal escarpment, slope stability is an old problem
and can have disastrous effects on development. This is directly related to the geology
and geological history of the area. The 300 m high escarpment consists of flat-lying
Permo-Triassic volcaniclastic coal measures plus fluviatile sequences capped by a well
cemented quartz sandstone. The interbedded strong sandstone and weak shale succession
(Fig. 1.5) in the lower part of escarpment has been acted upon by erosion, stress relief,
weathering, creep and sliding processes to produce masses of talus on many of the steep
hillsides (Chowdhury, 1976). Rockslides are rare but rockfalls and toppling are common
on the steep rock slopes in the area.
The majority of slope stability problems of economic significance in northern Illawarra
involve translational or rotational slides, or slow to rapid flows of soil, talus or fill.
The precarious equilibrium of talus masses is frequently upset by heavy precipitation and
by man's activities, e.g. removal of toe support, loading the slope, and changing the
surface and subsurface drainage.
Artificial slides, many of which include underlying or adjacent talus, almost invariably
result from poor site selection or poor design and construction practices. Slope stability
evaluation in the northern niawarra should be an interdisciplinary geotechnical endeavour
requiring concepts from engineering geology, soil mechanics and rock mechanics. Of
these three disciplines, engineering geology is probably the most important. Reliable
evaluations of slope stability must begin with an understanding of regional and site
geology and of the geologic processes which formed the site and continue to act upon
it. Once this level of geologic understanding is reached, slope behaviour can often be
assessed on the basis of professional judgement, experience and precedent. Where
178
detailed stability analysis is required, the above-mentioned geologic understanding is
mandatory for development of appropriate geotechnical models. This study is structured
according to the above philosophy, with emphasis on the talus slope deposits.
8.2 SLOPE DEVELOPMENT PROCESS
Various aspects of slope development in the northern Illawarra have been described by
Hanlon (1952, 1953, 1958), Bowman (1972, 1974), Amaral (1975), Chowdhury (1976),
Evans (1978, 1981), Young (1977, 1978), Walker et al. (1987), Hutton et al. (1990) and
Ghobadi (1993, 1994). Slope development processes can be simplified and generalised
as follows: stream erosion has carved longitudinal and transverse escarpment profiles
reflecting local stratigraphy, and has also removed lateral and vertical support from
escarpment walls. Stress relief accompanying lateral support removal produced tension
fractures and bedding plane shear zones in rocks adjacent to the escarpment walls.
These stress relief features, along with stratigraphic and lithologic details, control
groundwater flow in the vicinity of the slopes; perched water tables and hillside springs
are common. Stress relief features and related groundwater phenomena have accelerated
physical and chemical weathering of rocks on the slopes. Under these conditions,
rockfalls and topples are common. They occur on the natural slopes, with weathering
and erosion undercutting joint-bounded rock blocks which slump backward or topple
forward depending on the their geometry, support conditions, and applied forces which,
in addition to gravity, often include water. Rockfall volumes are typically small,
ranging from approximately 0.1 to 24 m3. Fine-grained and argillaceous rocks
predominate in the typical stratigraphic section, so the weathering products are usuaUy
silty clay or clayey silt with rock fragments ranging in size from sand to very large
boulders. As weathering progresses, the strength of the near-surface soil and rock
materials decreases and they begin to creep or slide down the relatively steep
escarpment walls under the action of gravity and water forces. Deeper seated
179
landsliding along bedding plane shear zones resulting from escarpment stress relief have
also occurred in certain locations.
Eventually, these processes produced mantles of talus soil and rock fragments on many
slopes. The composition, thickness and inclination of talus on a given slope reflect the
stratigraphy and erosional history of the slope. A great variety of talus slope
configurations are present. T w o cross-sections of talus slopes are shown in Figure 8.1.
Where slopes are relatively flat, on ridge tops or large erosional benches, residual soils
have formed. Residual soil on benches below steeper slope segments are often covered
with talus.
Where erosion was intense, little or no talus has accumulated and rock strata are
exposed on steep slopes. Talus thickness can range from about 1 m to more than 10 m
but is typically in the order of 5-10 m in the study area. A maximum thickness
approaching 20 m occurs at the toes of slopes in thick sequences of weak rocks (e.g.
claystone and shale) where deep-seated landsliding has occurred or where accumulated
talus has not been removed by erosion. Such conditions are rare.
The most important engineering implication of talus slope development is the presence
in talus of surfaces, or zones, along which shear strength has been reduced to, and
maintained at, residual or near residual levels by a combination of softening and strain
effects. Talus soils in the northern niawarra are generally cohesive and in most cases
are fissured. Such soils containing a significant clay fraction have pronounced
tendencies for softening on wetting (Terzaghi, 1936), as well as strain-softening
(Skempton, 1964).
Movement due to creep, sliding, or both, during slope development is generally
concentrated along one or more surfaces or zones, commonly at the soil-rock contact.
Additional surfaces or zones of movement may exist at levels within the talus,
particularly where talus is thick.
180
A talus derived from claystone is often finer grained than the original rock, having a
larger clay fraction and plasticity index. This is often found at the base of talus
deposits which commonly mantle the coastal terraces. As a result, in a landslide
situation, the operative strengths in the clays, which are derived from the basal claystone
strata, are the residual shear strengths.
8.3 RELATTVE IMPORTANCE OF OTHER GEOLOGICAL FACTORS FOR
SLOPE FAILURES ALONG THE ILLAWARRA COASTLINE
(1) Platform recession
The study area experiences a low tidal regime (1.2-1.6 m), moderate swell conditions
and infrequent storms. Platforms are susceptible to weathering which is related to the
degree of exposure to wave assault. Minor erosion takes place along the outer edge of
the platform due to hydraulic action of waves, acting along joints, especially during
storms. Platform surfaces appear to be reasonably stable since the low permeability of
the rocks prevents water loss during low tides and the saturation enhances the stability
of the diagenetic mineral cements and detrital grains. However, abrasion does occur,
especially along joint surfaces, due to movement of material across the top of the
platform by wave action. Most erosion is concentrated along the base of the headland
at the back of the platform.
(2) Cliff erosion
Recession of the sea cliffs in the northern niawarra region is caused by active
weathering and wave erosion in the splash zone within and at the base of Coal Cliff
Sandstone and within the Illawarra Coal Measures at Clifton (Figs 3.22, 8.34, 8.36 and
8.40b) and within the Scarborough Sandstone in the Stanwell Park area (Fig. 8.48).
This erosion causes undercutting and subsequent collapse of vertical joint blocks.
Although the rate of cliff recession is low to the east of the slope failures, it has caused

181
oversteeping of the talus adjacent to the cliff and has initiated slumping and sliding of
the talus layer progressively back from the cliff edge. This would, in turn, have a
destabilising effect on the whole of the talus layer.
(3) Erosion of headlands
According to field observations during this study, marine erosion of the cliff sequences
is concentrated at the toe of exposed headlands and is less significant in the bay areas.
Since most of the slip areas along the coastline in the northern niawarra region occur
on headland areas, this faster rate of cliff erosion is significant in initiating slips and
maintaining unstable slopes. The higher wave energy in these areas also serves to
remove fallen material from the base of the cliffs, thus preventing the build-up of a
protective toe layer of talus.
(4) Coal mine subsidence
Coal mine subsidence would act as a triggering and contributing factor to land instability
in the northern Illawarra region in that it reduces normal forces across horizontal
bedding planes and rock defects, encouraging bedding plane slip and, hence, facilitating
progressive expansion of the rock mass in an easterly direction (Fig. 3.22a, see adit).
Examination of the Coalcliff Colliery mine plan revealed that extensive coal extraction
has been undertaken in the Bulli Coal below and to the west of the Coalcliff Slip
(Fig. 6.11a). The goaf resulting from this mining would have been deflected towards
the exposed (unconfined) portion of the escarpment causing additional opening of joints
throughout the Narrabeen Group which overlies the extracted coal. This factor,
combined with the high horizontal stress regime in the region, is probably a major
contributor to the destabilisation of the rock mass along the escarpment.

182
(5) Dykes
Dykes are easily recognised at the surface, because the physical characteristics of the
dykes are different from those of the host rock. Rapid surface weathering and alteration
of the mafic dykes magnifies the lithological differences.
The dykes have commonly intruded along pre-existing zones of weakness such as faults
or more closely jointed rock masses. Dyke intrusion has locally caused hydraulic
fracturing and brecciation of the adjacent rock mass during intrusion. Thus most dykes
were intruded parallel to the major joint sets in areas where the joints are closely
spaced.
Dykes may affect slope stability in the study area since they: (a) change the rock mass
characteristics as they rapidly weather to considerable depths; (b) cause water ingress
into the rock mass; and (c) are generally associated with more closely jointed rock
masses.
Few dykes are visible on the ground in the study area (see section 3.4) but some are
known from adjacent mine workings. The presence of dykes is a contributing factor
for slope instability since they rapidly weather to clay and allow water ingress at the
surface, but their effects needs to be determined with more exploratory and research
work.
8.4 ENGINEERING GEOLOGIC FAILURE MODELS FOR SLOPE
INSTABILITY ALONG THE NORTHERN ILLAWARRA COASTLINE
In the study area, especially between Scarborough and Coalcliff, crests and main slump
scarps are parallel to, and probably coincide with, vertical open fractures in the
underlying bedrock (Fig. 5.16). Along the coastline, the bedrock fractures can be seen
to have controlled the location and orientation of most small slumps. A slip surface can
develop at least partly along bedding planes in the bedrock (Fig. 8.2a), or the slip
surface may be confined along the contact of talus with the bedrock (Fig. 8.2b). In

183
two cases discussed in this thesis (Clifton Earth Slump, Fig. 8.34, and Harbour Slump,
Fig. 8.46), opening or movement along the 015° - 020° striking vertical fractures in the
bedrock stretched the overlying talus, forming cracks which allow ingress of surface
water and mark the crests of the resultant slides. Although the rock sequence in the
Illawarra escarpment is under the influence of a high horizontal stress (Stone, 1990;
Walton et al, 1990), the faults and fractures are not tectonically active, and no recorded
earthquakes have been reported to have epicentres related to any faults in the study area.
Hence, any recent movement along these fractures must be gravitational.
It is possible that at least some segments of the rupture surfaces in the niawarra region
may pass through the upper part of the bedrock, which is generally weathered and has
a relatively lower strength than intact bedrock. This type of failure was recorded in part
of the Moronga Park slump (Fig. 8.36). O n the edge of the escarpment, slight lateral
spreading of laterally unconfined blocks of bedrock, along lubricated bedding planes, can
widen bedrock fractures at the backs of the blocks, which in turn stretches the overlying
soil and forms tension cracks at the surface (Fig. 8.2a, b). Downhill movement of
blocks of rock is caused by forces exerted by expanding clays, which fill these open
fractures, as well as a sudden rise of cleft water pressure after heavy rains.
More frequently, the slip surface is the contact between bedrock and talus. The step
like topography of the bedrock, with steps dropping at vertical fractures, forms wedges
of talus soil (Fig. 8.2b). The base of a wedge has a general downslope dip and the
back of it is marked by a fracture wall. In wet seasons, water flows along the contact
between talus and bedrock, drops at the joint steps and washes away finer grains. After
heavy rain, the water table rises sharply, reducing the shear strength along potential slip
surfaces within the talus material. The weight of saturated soil exerts a downhill
component to any expansion movement caused by swelling clays. This slight downhill
movement of soil can develop a tabular vertical gap at the back of the talus wedge,
which, in turn, stretches the overlying soil. The resulting crack marks the crest of the
184
landslip involving curved slip surfaces within the talus (Figs 8.2c, 8.39). Opening of
cracks to bedrock promotes further ingress of water and further enhances slip movement.
Most slips occur after heavy rain but they usually follow periods of wetter-than-norrnal
conditions that have already fully saturated both the rock and talus.
8.5 TYPES OF SLOPE INSTABILITY
8.5.1 ROCKFALLS AND TOPPLING
Rockfall and toppling along the escarpment usually occurs when joint-bounded blocks
of sandstone fall as a result of undercutting. They are widely-spaced along the
escarpment and do not happen frequently. Rockfalls are clearly visible along the
escarpment west of Coledale and especially between Clifton and Coalcliff.
In the northern niawarra, across the Bulgo Sandstone outcrop, debris from these
rockfalls spills down the steep upper slope of the escarpment. The large broken blocks
remain on the upper slopes until further movement occurs above. Erosion by rockfalls
along the escarpment is not a very active process under natural conditions. An
estimated rate of retreat of the cliff-line for the period 1950-1975, of 0.15 m/1000 years
may have little relevance to the long-term average (Chowdhury and Young, 1987). Cliff
retreat since the initiation of Tasman Sea rifting 100 Ma ago is estimated to be 25-
40 km with an average rate of 0.25-0.4 m/1000 years. It was probably faster in the
past when continental shelf and coastal plan were narrow and, therefore, the 0.15 mm/
years would be a very realistic rate for present retreat.
The present-day rockfalls produce limited deposits of coarse debris because the fine
matrix is rapidly washed out of the surficial deposit. They do not generate extensive
mixed deposits like the relict talus.
185
8.5.2 SHALLOW DEBRIS SLIDES
Shallow debris slides are common especially after prolonged heavy rainfalls on the
upper slopes of the escarpment. These debris slides may involve only the shallow soil
cover but also may remove weathered bedrock. They appear to be more likely to occur
after heavy rainfalls of short duration than after light rain over long periods.
These movements are typically long and narrow with planar slip surfaces. Because they
are restricted to the forested upper slopes they rarely present a problem to the inhabited
part of the area.
8.5.3 DEBRIS FLOWS
Debris flows are more common where large volumes of surface water are present. The
best known of this type failure is the State Rail Coledale Rawson Street failure which
occurred in April 1988. Failure occurred in the form of a mudflow.
8.5.4 DEEP-SEATED SLUMP-EARTH FLOWS
Deep-seated slump-earth flows off the faces of benches and the lower ridges of the
escarpment are the most extensive and severe natural failures in the northern Illawarra
area. They occur in a variety of slope materials including talus mantle, Narrabeen
Group and niawarra Coal Measures. The failure planes of these movements may be as
much as 15 m below the ground surface and they occur in materials of low shear
strength.
Upper slopes and benches of the escarpment allow water to seep deeply into the
talus/weathered rock rather than flowing rapidly off. Major slumps develop on the face
of the Wombarra Shale where this seepage emerges.
These failures are triggered by pore water pressures which develop as water moves at
depth through the slopes. They are not associated with isolated intense heavy rainfalls
where most of the rainfall flows off rapidly as overland flow. Rather they are
186
associated with periods of prolonged moderate to heavy rain and begin a few days after
particularly heavy falls within such periods. Because of the strong influence of
subsurface seepage these failures occur on slopes of gentle gradient. The angle of
instability of slopes is between 15° and 25° in the Illawarra Coal Measures and
Narrabeen Group and between 10° and 15° in talus. Slopes gentler than these values
may alsp be unstable if groundwater conditions are unfavourable.
8.5.5 CREEP
Creep is common along the slopes of the Illawarra escarpment and is likely to become
more of an issue in the future. Creep movement is difficult to detect from walk-over
inspections, especially if fall or regional movement has occurred. Survey techniques and
movement detectors such as inclinometers are often necessary to identify creep failure
(Huang et al, 1994).
8.6 FAILURE OF TALUS SLOPES
8.6.1 INTRODUCTION
Talus is geological material which has moved downslope under the influence of gravity,
i.e., landslide or creep debris. Talus slopes are natural slopes which have a geological
history of landslides or creep, or both. The zone of talus along these slopes is
potentially unstable because the shearing displacements associated with past movements
have reduced the shear strength along the surface (or surfaces) of sliding or creep, or
both. When an excavation is made at the toe of a talus slope, failure is frequently
initiated along the existing surface (or surfaces) of sliding in the slope.
Many landslides have occurred in the northern Illawarra area, some of them are along
the Lawrence Hargrave Drive. A section of the road between Clifton and Coalcliff
passes through the Wombarra Shale and a zone of talus in the wall of the escarpment.
187
When construction began last century on this section of road, several slides were
initiated along ancient landslide surfaces in the talus. Modern landslides were
investigated along this section of road during this study. The location and geology of
the slide sites are described herein, along with engineering and geological features of
the slides.
8.6.2 ORIGIN OF THE TALUS
The origin of the talus is complicated because no reliable estimate of its age is
available. While the talus has often been considered to be of Quaternary age, the
Illawarra escarpment is no younger than Miocene and the talus may in some places also
be of Tertiary age. Duricrusted surfaces and subaerial basalts on the coastal plain below
the escarpment demonstrate that uplift of strata in the southern Sydney Basin and
formation of at least part of the coastal escarpment took place prior to 30 Ma B.P.
(Wellman and McDougall, 1974). Young commented that linear dissection has
dominated slope processes since uplift and that scarp retreat has been extremely slow.
Nevertheless, even very slow rates of retreat since the Miocene could account for the
2-3 km distance now separating the upper cliff-line of the Illawarra escarpment and
outliers of talus on the coastal plain.
8.6.3 PARENT MATERIAL OF TALUS
The talus in the northern niawarra has been derived mainly from the strata outcropping
on the middle and upper slopes of the escarpment (the Triassic Hawkesbury Sandstone
and the Late Permian - Triassic Narrabeen Group). The early Late Permian Illawarra
Coal Measures have been of minor importance as a source of talus in the northern
Illawarra. In this area talus often lies above the niawarra Coal Measures outcrop.
Therefore, the major source rocks have been claystone and quartz-lithic sandstone unit
in the Narrabeen Group.
188
The jointed Hawkesbury Sandstone has supplied most of the boulders found in the talus,
even in deposits now several kilometres distant from the cliffs. Narrabeen Group
sandstone floaters occur less frequently and the more friable and easily weathered
sandstone of the Illawarra Coal Measures are not represented in the boulder fraction.
The Hawkesbury Sandstone is highly quartzose and is very resistant to weathering.
Therefore, its boulders remain hard and angular with no sign of spheroidal weathering
or disintegration since deposition.
In contrast the sandstones of the Narrabeen Group and Illawarra Coal Measures are
more easily weathered and more likely to have disintegrated during transport. They
have a higher percentage of rock fragments; and the rock fragments are often volcanic
rather than siliceous. The most common clay mineral in the Narrabeen Group is
kaolinite with illite and mixed-layer clays also present in the lutites. Because of
weathering changes and the range of clay minerals in the parent strata, only the boulder
fraction provides direct evidence of the source of the talus. Therefore, the origin of the
unstable boulder material must result from small shallow debris flows or avalanches
from the slope above them. Falls of weathered rock, like the fall from the Narrabeen
Group mentioned earlier (section 8.3.1), produce slides with some iron staining and with
sandstone fragments in a clayey matrix.
8.6.4 CLAY MINERAL ANALYSES
Clay minerals have a significant influence on the engineering behaviour of talus. The
engineering behaviour, and especially the residual strength of talus derived from
argillaceous rocks in the northern Illawarra, depends on mineralogy. In particular, pore
fluid composition and types of cations adsorbed on mineral particles exert a significant
influence on the residual strength and on time-dependent strength changes, if any, along
existing failure surfaces in talus (Kenney, 1967; Mitchell, 1976).
189
The X-ray diffraction study of the talus materials, Wombarra Shale, Stanwell Park
Claystone, and interbedded clay and highly weathered sandstones in the lower Narrabeen
Group indicate that they contain quartz, iron oxides, kaolinite and expandable lattice
mixed-layer clay minerals (see chapter 4). The latter consists of randomly interstratified
illite and smectite (montmorillonite). N o significant feldspar was detected in the
previous petrological study (see chapter 4).
For more information fifteen clay samples from the five landslides were analysed. The
X-ray diffraction traces of clay samples with particles less than 2 microns show no
chlorite (Fig. 8.3a) in the matrix of the talus. Kaolinite and mixed-layer smectite clay
are the dominate clay minerals in all the talus samples (Fig. 8.3a). The limited data
suggest that expandable lattice clay minerals m a y occur preferentially along the failure
surfaces of ancient landslides in this area.
Groundwater flow through the relatively permeable shear zones m a y have caused
geochemical changes that resulted in the formation or concentration of these expandable
clay minerals, or both, along the failure surface. Further investigations are needed to
clarify this but it is noted that similar phenomena have been inferred for a failure in
colluvium derived from Carboniferous claystone at Walton's Wood, England (Early and
Skempton, 1972).
8.6.5 GEOTECHNICAL PROPERTIES OF TALUS
Index properties were determined for samples of talus materials obtained from 15
locations (five landslides) in the northern Illawarra study area between Clifton and
Stanwell Park. They include seventy five direct shear tests, sixty liquid limit tests,
thirty plastic limit tests, fifteen determinations of in-place soil density, water-content
determination and particle-size analysis.
190
8.6.6 TEST RESULTS
The shear strength of talus has been determined from laboratory tests. The result of
tests are shown in Figures 8.4 to 8.22 and in Table 8.1.
The peak shear strength values in this study refer to samples from slipped talus
materials, moderately weathered Wombarra Shale and highly weathered sandstone. The
talus is already in a weakened or softened condition after failure. Therefore, these
measured peak shear strength values from extracted samples may be lower than the true
undisturbed peak shear strength of talus before the process of failure began.
8.6.6.1 Strength Characteristics of the Talus Matrix
Shear strength depends on physico-chemical cohesion and on interlocking and friction
between grains in clay soils (Trotter, 1993). It is affected by the pressure of pore water
filling the voids. Therefore, soils of similar texture, clay mineralogy and permeability
can be expected to have similar engineering behaviour and are generally classified by
a chart relating their plasticity index to their liquid limit (Terzaghi and Peck, 1967).
Liquid and plastic limit tests in this study showed that, based on soil classification, the
talus matrix in the northern Illawarra (between Clifton and Stanwell Park) is inorganic
clay of low plasticity (Fig. 8.23).
General relationships between the index properties of a soil and its strength have been
widely accepted. In considering the long-term stability of clayey soils, Skempton's
(1964) finding that cohesion is very small and that the angle of shearing resistance (<(>)
falls with increasing strain to a value which is constant (residual angle (|)r) has been
frequently applied. <t>r declines with increasing clay content. This decline is echoed by
a fall in (J)r with increasing plasticity index, from which the angle of shearing resistance
is usually predicted. A relationship between <j)r and plasticity index (Ip) was presented
by Voight (1973; see Fig. 8.24), Kanji (1974; see Fig. 8.25), and Lupini et al, (1981;
191
see Fig. 8.26). Also a relationship between residual friction angle with clay fraction
was presented by Lupini et al. (1981; see Fig. 8.27).
The following relationship was preposed by Kanji (1974):
((>= 46.6/L0466
The residual angles of internal friction estimated for the talus are shown in Table 8.2.
If w e assume that long-term stability of the talus is governed by the residual strength
and by seepage parallel to the ground surface, with the top flow line at the ground
surface on long straight slopes (Carson, 1969), then we can estimate the approximate
inclination of a stable ground surface slope, p, as:
tan f3 = 1/2 tan §,
Taking (f>r to be 19°, 22°, 17°, 15.5° and 17° (from Table 8.2), this equation yield
estimates of |3 as 9.5°, 11°, 8.5°, 8°25' and 8.5° for the Clifton Hotel slump, Moronga
slump-earth flow, Jetty rock slump, Harbour slump and Coalcliff slump respectively.
These estimates are not presented here as definitive angles for the gradients of long-
term stable slopes on the talus; clearly the assumptions on which they are based may
not always be satisfied. Rather they are presented to indicate that the stable gradients
on the talus are low, comparable with angles suggested for clayey slopes elsewhere.
For example, Carson and Kirkby (1972) suggested 8°-ll° for clay slopes in general, and
Chandler (1974) noted 4° for weathered fissured Lias Clay.
Along the Lawrence Hargrave Drive between Clifton and Stanwell Park, slopes in talus
are unstable at angles above 10° and in some cases may be unstable at even lower
gradients depending on groundwater conditions.
8.6.6.2 Correlation of Engineering Indices and Properties
1. Atterberg limits
The relationship between the liquid limit and plastic limit is shown in Fig. 8.28). There
is a clear trend of increasing plastic limit with increasing liquid limit. Figure 8.29
192
shows a plot of liquid limit against natural water content. A rough trend can be seen
showing the liquid limit to increase with increasing natural water content.
2. Natural water content
It has been well established that the moisture content in talus can have a significant
effect on its engineering behaviour. A plot of bulk density versus moisture content (Fig.
8.30; Table 8.1) shows a definite tendency for bulk density to increase with increasing
water content as the pores become filled.
3. Clay fraction
The results of grain size analyses indicate that the clay fraction, that is material finer
than 2 microns, varies between 1.60% and 26.06% (Table 8.1). For the niawarra talus,
there is a relationship between the percentage of mixed-layer (expansive) clay and the
liquid limit for the samples listed in Table 8.1. An increased clay fraction (less than
2 microns) is associated with an increase in liquid limit and an increase in plasticity
index. The poor correlation may result from many factors, for example small sample
size, differing sizes of clay particles (Hawkins and McDonald, 1992), or partial
adsorption of iron or aluminium hydroxide cations by the expanded clays (Grice et al,
1982). It emphasises the difficulty of estimating one soil property from a different
property.
Figure 8.31 shows the relationship between the angle of shearing resistance (peak and
residual) for the matrices of the niawarra talus versus the clay fraction. Figure 8.32
show the relationship between the peak angle of shearing resistance of the niawarra
talus versus percentage of clay and silt. Most of the points indicate a definite tendency
for <|>r and <|>p to decrease with increasing content of clay particles. Figure 8.33 shows
the relationship between clay fraction and liquid limit (WL%) for Illawarra talus.
Increasing clay fraction is associated with an increase in liquid limit.
193
8.6.7 CONCLUSION
The clay mineralogy can be used to identify the likelihood of instability in talus in the
northern Illawarra. The main clay minerals in the talus, claystone and shale of
Narrabeen Group are kaolinite, illite, montmorillonite and mixed-layer clays. In general,
samples with a high percentage of kaolinite are more stable than those high in illite.
Montmorillonite, although less common, was found to be less stable again in the
Illawarra area. In the detailed study area, samples with high percentages of kaolinite
are also unstable. This is related to discontinuities in the talus and existence of mixed-
layer clay minerals in the talus.
Discontinuities cause an increase in bulk permeability, allowing more rapid percolation
of water to depth. Where discontinuities penetrate to a sufficient depth, the associated
loss in shear strength may be enough to initiate slope failure and to reduce the shear
strength to its residual value (Trotter, 1993).
The geotechnical properties of talus derived from the Narrabeen Group rocks in the
northern niawarra vary widely but can be generalised. Talus ranges from GM and GC
through SM and SC to CL and ML soils in the Unified Soil Classification System
(Terzaghi and Peck, 1967). Failure surface clay usually consists of CL or ML soils and
occasionally CH, SC or SM soils.
Index properties and Unified Soil Classes give insight into the engineering behaviour of
talus. But engineering behaviour is governed largely by pre-existing discontinuities, such
as shear zones and failure surfaces. Index properties of shear zone and failure surface
materials usually differ little from those of the overlying talus, with one important
exception. Due to seepage along the relatively pervious shear zones and perhaps due
to related mineralogical and geochemical changes, many shear zones and failure surfaces
have water contents a few percent higher than those of overlying and underlying
materials.
194
The nature and geological setting of talus are such that its undrained or total stress shear
strength is virtually meaningless, except perhaps as an index property (Morgenstern,
1967). Drained or effective stress shear strength are much more meaningful in
situations involving either short term or long term stability, despite the inevitable
uncertainties associated with estimating in situ pore water pressures.
Peak and residual strengths of talus and its discontinuities depend on four inter-related
factors: (a) clay fraction; (b) amount of particles of sand size and larger (mainly rock
fragments of various types); (c) soil structure which includes fabric, composition and
inter-particle forces (Mitchell, 1976); and (d) degree of weathering or alteration.
Augmentation of talus by fine particles increases the total surface area of the particles
and consequently increases the angle of internal friction. With an increase in the
proportion of fine particle, void ratios decrease. Drainage potential drops and the
likelihood of developing positive pore water pressure consequently increase. Despite the
increase in the angle of internal friction of this material, the changes to hydrological
properties have an overriding influence on potential stability. In first time slides, the
value of the shear strength is close to peak shear strength, whereas in second or later
slides along the same slip surface the value of the shear strength is close to the residual
shear strength (Skempton, 1964). Residual angle (tyt) values for talus matrix are
between 15.5° and 22°.
Calculation of shear strength parameters required for the limiting equilibrium of talus
masses is subject to significant uncertainties regarding in situ pore water pressures and,
to a lesser extent, slide mass geometry. Nevertheless, if the geological framework is
well understood, it is usually possible to calculate sets of strength parameters
corresponding to the limiting equilibrium of talus masses for reasonable bounding
conditions of water pressure and geometry. Interpretation of calculated strength
parameters, within the geological framework of the slope and known range of talus

195
strengths, often permit the range of possible strength value to be narrowed sufficiently
for use, with judgement, in design.
The low ((>, values for talus deposits in the northern niawarra may give some confidence
in the above techniques for evaluating stability of talus slopes but they also point out
the need for field observations and monitoring of water pressures in these slopes. Talus
failures that were observed on talus slopes in the northern Illawarra appear, on the basis
of literature review, to resemble similar features in colluvium derived from the
argillaceous rocks in England, such as at the famous Walton's Wood landslide (Early
and Skempton, 1972) and colluvium derived from the argillaceous rocks in Western
Pennsylvania (Hamel, 1969, 1980).
8.7 CASE STUDIES
The study area site plan (Fig. 8.34), shows three regions containing seven study sites.
In general, distinction between bedrock and intra-talus surface failures needs subsurface
information (drilling or geophysical investigation) but it is certainly possible distinguish
common bedrock blocks in the talus mantle along the coastline (e.g. Fig. 3.10).
Bedrock blocks are from the upper niawarra Coal Measures in the south and from the
lower Narrabeen Group in the north, respectively. For example in the Clifton earth
slump bedrock is the Coal Cliff Sandstone and the failure surface is in the talus and
weathered Wombarra Shale (Figs 8.35, 8.36). In the Jetty rock slump the failure surface
is related to the Jetty Fault (a series of small en echelon faults in the Jetty Fault
suggests that this fault may have been active during deposition, Fig. 2.11). In the Jetty
rock slump part of the surface of the Jetty Fault acts as a failure surface in the Coal
Cliff Sandstone (Figs 8.45, 8.46).
196
REGION A
8.7.1 SITE 1 CLIFTON EARTH SLUMP
8.7.1.1 Location
This slump is located beside the Clifton Hotel. The area is on a small flat portion of
ground on the east side of the Lawrence Hargrave Drive above the sea cliffs (Fig. 8.35).
8.7.1.2 Geology
The town of Clifton is located on a narrow coastal terrace within the steep slope of the
escarpment above the coastal cliff-line. The natural landforms generally slope to the
south-southeast at a gentle angle of approximately 12° to 17° both uphill and downhill
of the road respectively (Ghobadi and Pitsis, 1993).
The rocks at the site are essentially flat-lying strata consisting of alternating beds of
sandstone, shale and claystone. The talus mantle comprises a heterogenous mixture of
angular, gravel to boulder size sandstone fragments with variable amounts of sand, silt
and clay. The average size of boulders is about 50 cm. Information from drilling done
by the Department of Main Roads (DMR) shows the talus to consist of yellow brown
and brown sandy clay with medium plasticity, medium to coarse sand with traces of
fine gravel, and some highly weathered sandstone fragments.
The head of the slump is underlaid by the upper beds of the Wombarra Shale (Fig.
8.36) close to the junction with the overlying Scarborough Sandstone which is visible
in a small cutting on the west side of the road. The Scarborough Sandstone contains
numerous vertical joints; this is an ideal condition for the development of contact
springs. Surface water infiltrates the Scarborough Sandstone and seeps down through
it to the contact with the relatively impermeable Wombarra Shale. This seepage
increases water pressures in the talus and contributes to alteration of the Wombarra
Shale. Both of these effects contribute to further landsliding (Fig. 8.36). The base of
the slump near the edge of the cliff lies on the Coal Cliff Sandstone and water drains
197
from the base of the colluvium just above the Wombarra Shale-Coal Cliff Sandstone
contact.
8.7.1.3 Description of the slump
The effects of movement, observed along the Lawrence Hargrave Drive beside the
Clifton Hotel, is a rotational slide (Fig. 8.35) with a tension crack at the ground surface.
The dip of the surface of sliding is between 8° and 10° toward the sea and subsidence
movement on the road at this site coincided with the April rains of 1988. It is
considered likely that the sliding surface flattened or became convex-upward because this
slump moved very slowly. The slump is about 65 metres long and 40 metres wide.
The crown, main scarp, head and toe of the slump are recognisable, but the flanks are
obscured under dense vegetation. The main scarp is low and lies along Lawrence
Hargrave Drive. One creek occurs beside the slump to the south and has a direct
influence on slump by the introduction of water (Fig. 8.35). The main body of the
slump comprises talus and weathered Wombarra Shale. With any heavy rain, water
percolates into the slump and mobilises the matrix of the talus. One can expect the
formation of cracks as the slip develops further, including en-echelon, longitudinal and
crescentic cracks which extend back to the base of the Scarborough Sandstone.
Based on drilling information, between 4.5 m and 5.9 m depth, there is high plasticity
clay with highly weathered shale layers at or near the slip surface. A seepage zone is
possibly present in this area at 5.5-6 m. Bedrock is at a depth of 6 m and consists of
moderately to highly weathered jointed siltstone. This siltstone continues to a depth of
7 m. Joints in the siltstone range from horizontal to a maximum dip of 60°. Spacing
between joints is between 4 c m and 10 cm and the joints are infilled with clay. The
strength of the siltstone is very low (Is(50) = 0.03-0.1 MPa).
Three inclinometers and two piezometers were installed at this site by the Department
of Main Roads ( D M R ) . These inclinometers show a slip plane has developed at depth
198
between 4.5 m and 5.5 m in clay, immediately above the bedrock. The piezometers
show that the groundwater table ranges between 1.5 m and 4.5 m at this site. At the
present time the slump is active and it is moving toward the sea very slowly; the
direction of movement is southeast (strike = 055°, or movement direction = 145°).
8.7.1.4 Geotechnical properties of the talus
Index properties were determined for samples of talus materials obtained from 3
locations (crown, head and toe) in this slump. The range and average values of these
index properties are given in Table 8.1. It must be noted that these values of shear
strength parameters do not represent the properties of soil at the slip surface. Very
careful drilling, undisturbed sampling and testing would be required to obtain the
operative shear strength parameters on the actual slip surface. No resources for these
detailed studies were available for this Ph.D. thesis.
According to the results from the tests, the peak friction angle (§p) decreases from 45°
in the crown to 40° in the head and to 23° in the toe of the slump (Fig. 8.7). Probably
the value in the toe of the slump represents a residual friction angle since this material
has moved. Also residual shear strength is primarily dependent on mineral composition
and system chemistry (Kenney, 1967). Mineral composition affects atterberg index
parameters, so it does not seem surprising that strength and plasticity can be correlated
(Fig. 8.31). Mineral composition is valuable in studying the residual strength of a
particular variable soil deposit, provided that they properly reflect changes in the more
fundamental properties of shape, grading, mineralogy (Lupini et al, 1981).
8.7.1.5 Conclusions
The slump occurred in a weak zone composed of talus, claystone and shale. The failure
surface of the slump was located at the base of the talus or just into the Wombarra
Shale. Movement of the slump reduced the shear strength along the failure surface to
199
a residual level. The strength of the failure surface materials probably remains at or
very near residual levels until times of very heavy rainfall (West, 1994).
One of the causes of the instability in this slump is erosion of the toe of the slope by
the sea, resulting in relaxation of the materials above (Fig. 8.36). The movement
detected by inclinometers is aided by the high perched water table above the Wombarra
Shale. For improving short to medium term stability in this area the water table must
be lowered to or below the top of the bedrock by drainage either out to the edge of the
cliff or downwards into the Coal Cliff Sandstone.
8.7.2 SITE 2 MORONGA PARK SLUMP-EARTH FLOW
8.7.2.1 Location
This slump-earth flow is located in the Clifton area, opposite the School Parade and east
of Moronga Park. It was initiated during the April rains of 1988 and has remained
active until now (Fig. 8.37). This slip is a retrogressive landslide but retrogression has
been slow during the last few years because of low rainfall.
Comparing an aerial photograph taken by B.H.P. in 1988 and my field observations in
October 1994 the average rate of retrogression is 25 cm per year. This rate may
increase dramatically in the future if rainfall is exceptional high.
8.7.2.2 Geology
The rocks at the site are lower Narrabeen Group and upper niawarra Coal Measures.
They are essentially flat-lying strata consisting of repeated beds of sandstone, shale, coal
and claystone (Figs 8.38 and 8.39). The head of the slump is underlaid by the Illawarra
Coal Measures.
The talus consists of silty clay, sandy clay and gravel of medium high plasticity and
mottled light grey, red and brown colours. Large sandstone boulders were encountered
in the main body of the slump (Fig. 3.10). The typical thickness of the talus may be
200
about 10 m. Underlying the talus soils are weathered coal measure rocks consisting of
tuffaceous sandstone, carbonaceous siltstone, claystone and minor coal seams. Coal
seams are found to often provide groundwater paths within the Illawarra Coal Measures
rocks.
The toe of the slump is in the upper Illawarra Coal Measures (Fig. 8.40). Water flows
over the surface of the slope and then permeates the talus, infiltrates the tuffaceous
sandstone and seeps down through it to the contact with the next relatively impermeable
claystone. The water then moves laterally along this contact to the ground surface
where it emerges as a line of springs. This seepage increases water pressures in the
talus and contributes to further landsliding. The Clifton Fault is located to the north of
this slip (Fig. 8.38). This fault has an approximate east-west strike with a steep dip
(85°) to the north. A tension crack regularly opens up along the strike of the fault
during prolonged periods of wet weather due to water movement along the weathered
fault plane. The past performance along this fault would suggest that it is a major zone
of weakness. Consequently, there is a possibility that any such movement could have
an influence on the slump, either directly by transference movement or indirectly by the
introduction of water (Ghobadi, 1993). This fault also creates an additional area of
instability near the Lawrence Hargrave Drive. Recent movement within Rube Hargraves
Park (Fig. 8.38) to the northwest of the slip, and the first house near the railway
corridor, is believed to be attributed to a zone of weakness association with the Clifton
Fault.
8.7.2.3 Description of the slump-earth flow
This slump is about 100 m long and 50 m wide. The crown, main scarp, head, flanks
and toe are clearly recognisable. The main scarp is about 12 m high, it is a nearly
vertical scarp surface stained by iron oxides. The toe of the slump-earth flow extends

201
onto the niawarra Coal Measures, comprising interbedded shale, coal and sandstone
(Figs 3.10, 8.40).
The natural talus slope lies on a typical talus deposit. The talus body shows clear
separation of components by grain size. The larger, heavier blocks are mostly toward
the base of the main body of the slump, which comprises soil and weathered boulders.
Wave action has winnowed some of the distal toe of the talus slope.
The morphology of these earth flows and slumps are the result of the interaction
between mass movement and the underlying geology. The flows developed in an older
talus body which came to rest above a bed of highly weathered sandstone and claystone
of the niawarra Coal Measures. The upper surface of this sandstone bed forms the
basal shear surface. The presence and continuity of low angle joints in the weathered
Illawarra Coal Measures beneath the talus confirms that the main failure plane is located
in the upper niawarra Coal Measures. Critical groundwater conditions are often a direct
consequence of the structural defects. Coal beds in the Illawarra Coal Measures act as
aquifers, with claystone units acting as aquitards. Landsliding is commonly related to
the presence of the aquifers.
The rate of movement is uncertain and likely to be erratic depending on rainfall. Based
on observations during the three years of study, the average rate of movement is 20 mm
to 30 mm per year.
8.7.2.4 Geotechnical properties of the talus
Index properties were determined for samples of talus materials obtained from 3
locations (crown, head and toe) in this slump. The range and average values of these
index properties are given in Table 8.1. As noted before these values represent peak
shear strength parameters and not the properties at soil of the slip surface.
According to the result of the tests peak friction angle ((|)p) decreases from 38° in the
crown to 33° in the head and to 30° in the toe of the slump (Fig. 8.10). The reduced
202
value for the head of the slump is dependent on the higher percentage of clay fraction
(Table 8.1) in comparison to the peak friction angle on the crown of the slump. The
value in the toe of slump represents peak friction angle in the earth flow (Fig. 8.37).
8.7.2.5 Conclusions
The slump-earth flow occurred in a weak zone of talus and clay-rich stratigraphic
section composed of the upper Illawarra Coal Measures (claystone, tufaceous sandstone
and coal seams). The main failure surface of the slump-earth flow is located in the
jointed and weathered upper Illawarra Coal Measures. The bedrock is highly fractured
and weathered. The geological and geomorphological field investigations have shown
that jointing and faulting in combination with weathering, steep topography, water
incision and heavy rainfall, played a significant role in the movement of the slump-
earth flow.
The presence of the Clifton Fault and joints in the weathered rock mass contributed to
the mass movement. Movement reduced the shear strength along the main failure
surface to a residual level, where it probably remained until times of very heavy rainfall.
Geotechnical experience with this type of landsliding generally shows that groundwater
pressure is often the dominant factor activating landsliding, when compared with soil
strength parameters and slope angle. Based on observations in the field, groundwater
pressures are present in the crown area of the landslide and these pressures are assessed
to be responsible for driving the landslide. N o laboratory testing of slide plane material
has been undertaken to date (because the depth of sliding is not accurately known at
present). Coal beds in the niawarra Coal Measures act as aquifers, and water flow
within the coal beds is concentrated along discontinuities at the base of coal unit. This
increases the rate of weathering of the already highly weathered sandstone and leads to
the next slump.
203
Due to the sensitivity of the slide to fluctuations of water table level, the remedial
works can be basically aimed at draining the slope and preventing surface water
infiltration.
REGION B
8.7.3 SITE 3 SOUTHERN AMPHITHEATRE COMPLEX LANDSLIDE
(GRABEN A)
8.7.3.1 Introduction
The southern amphitheatre complex landslide consists of large planar slides involving
both block and wedge failures, which occur within the less deformed cover strata (cf.
Pettinga, 1987a, b). They are controlled by grain size variation in the alternating
sandstone-mudstone successions, which permit the development of high pore pressures
at potential bedding-plane failure surfaces (Pettinga and Bell, 1991). The failure was
apparently triggered by this water pressure which existed in the slope. The rear of the
failure mass was defined by a vertical joint at the crest of the slope. This joint began
to open several years prior to the slide. Most of the failure surface passed through
layers of soft claystone and shale at the base of the slope.
8.7.3.2 Location
This landslide is located immediately north of the Jetty Fault along the Lawrence
Hargrave Drive between Coalcliff and Clifton (Fig. 8.41a, b, c).
8.7.3.3 Geology
The rocks consist of sandstone, with interbeds of claystone and shale overlying the Bulli
Coal.
The Bulgo Sandstone consists of grey quartz-lithic sandstone with minor reddish-brown
claystone and some thin conglomerate bands. It has an average thickness of

204
approximately 130 m in the study area. The sandstone beds are normally between
0.3 m and 3 m thick and the claystone interbeds are normally between 0.1 m and 1 m
thick (Fig. 3.9). Joint spacing averages 0.3 m. The Stanwell Park Claystone is
approximately 40 m thick (Fig. 8.42) and consists of red-brown and greenish claystone
with two lensoidal quartz sandstone beds between 0.1 m to 1 m thick. The Scarborough
Sandstone consists of thickly bedded sandstone with conglomerate beds and minor shale
(Fig. 3.6). It outcrops boldly, forms the major part of the coastal cliffs and is
approximately 25 m thick.
Wombarra Shale is about 40 m thick and consists of predominantly grey shale but it
contains one sandstone layer 6 m thick known as the Otford Sandstone Member. The
Coal CUff Sandstone is a massive grey lithic sandstone which forms the lower coastal
cliffs in the landslide area. Joints are spaced up to 10 m apart but are normally spaced
at 1 to 3 m. In the landslide area this sandstone is about 8 m thick.
The niawarra Coal Measures is a sequence approximately 250 m thick extending
downwards from the base of the Coal Cliff Sandstone. The uppermost layer is the Bulli
Coal which, in the landslide area, only occurs to the south of the Jetty Fault. Below
the Bulli Coal the unit consists of claystone, shale (Fig. 3.22) and lithic sandstone down
to the base of the cliff. The Bulli coal has been mined to the west of the slip area
(Fig. 3.22).
The sandstone beds are permeable because of jointing. Claystone and shale beds are
generally quite impermeable. Perched water tables are common where these
impermeable beds underlie the more permeable beds.
The Jetty Fault is located to the south of this landslide. The dip of the fault plane is
70° N on Lawrence Hargrave Drive and 45° N in the lower coastal cliff north of the old
Coalcliff adit; its strike is east-west. This fault appears to be responsible for
groundwater circulation under the road. It has a throw of 8 m at the level of the Bulli
seam which dies out to zero within the Scarborough Sandstone. This change in

205
displacement is explained by considering that the fault was only active during deposition
of the sediments. This fault has had an influence on the landslide indirectly by the
introduction of water. It also creates an additional area of instability to the east of
Lawrence Hargrave Drive (Jetty rock slump) which will be discussed later. Fault 2 (F2)
is located to the north of the landslide. The dip of the fault plane is about 45° S W , its
strike is northwest-southeast. Fault 1 (Fl) is to the south of landslide and it is parallel
to the Jetty Fault. The dip of the fault plane is about 55° N (Fig. 8.41a). The
sandstone beds (Bulgo Sandstone and Scarborough Sandstone) overlie claystone and
shale and have numerous vertical joints almost parallel to the face of the slope. These
joints are attributed to stress relief in the escarpment walls. The mechanism of this
escarpment wall stress relief and joint formation has been discussed in chapter 5.
8.7.3.4. Description of the slide
Very little slide movement seems to have occurred after the initial slump (Jetty rock
slump). The location of the failure surface was determined from surface indications
(Fig. 8.42). The lower part of the failure surface generally followed the base of the
Wombarra Shale. The upper part of the failure surface met the open vertical joint in
the Scarborough Sandstone (Fig. 8.42). Normally, surface water infiltrating the upper
part of the slope would pass down through the vertical joints in the Bulgo Sandstone
and drain laterally to the surface of the cut through the Wombarra Shale. Water in the
middle to lower part of the slope would likewise drain laterally along the three fault
(Jetty Fault, Fl and F2, Fig. 8.41a). It is likely that infilling material (clay) essentially
plugged most of the natural drainage outlets in the slope face and that hydrostatic
pressures in the open joint at the rear of the failure mass trigged the slide. The long
term water seepage to the north of this landslide indicates a zone of high fracture
permeability. It confirms the existence of a penetrative rock defect, such as a fault (F2)
or shear zone beside the landslide.
206
Generally water flow within the rock mass is concentrated along discontinuities at the
contact between the Bulgo Sandstone and Stanwell Park Claystone at the middle of
southern amphitheatre and at the contact between the Scarborough Sandstone and
Wombarra Shale at the bottom of southern amphitheatre. This increases the rate of
weathering of the Wombarra Shale, causes fretting and weathering of the sandstone and
leads to toppling failures and rock falls.
8.7.4 SITE 4 NORTHERN AMPHITHEATRE COMPLEX LANDSLIDE
(GRABEN B)
8.7.4.1 Location
This landslide is located beside the Harbour Fault along the Lawrence Hargrave Drive
south of Coalcliff (Fig. 8.43).
8.7.4.2 Geology
The succession is composed generally of interbedded sandstone and claystone and is
similar to that in southern amphitheatre (Fig. 8.41a, b). The Harbour Fault forms a
prominent indentation in the coastal cliffs where it has a vertical displacement of 20 m.
It has a strike of 080° and dips 62° toward the south. This fault also appears to be
responsible for groundwater circulation under the road. It has had an influence on the
landslide indirectly by the introduction of water. This fault also creates an additional
area of instability in the east of Lawrence Hargrave Drive (Harbour Slump) which will
be discussed later. The fault 3 (F3) is to the south of this landslide. The dip of the
fault plane is about 45° N W , its strike is southwest-northeast.
8.7.4.3 Description of the slide
The whole northern amphitheatre has been considered to be moving towards the sea as
a massive landslide. The possible plane of failure would be in the Wombarra Shale

207
(Fig. 8.44). A major fault to the north of the landslide (Harbour Fault) and F3 to the
south of the landslide are good localities for water flow. Movement of this type would
be expected to increase dramatically in the future. This amphitheatre area could in fact
represent or develop into a deep seated but slow moving rock slide. The slow
movement can be related to: (a) serious slippage of rock support along the amphitheatre
cliff line: (b) collapse of the underlying coal workings; and (c) the long term water
seepage at the north of this landslide which indicates a zone of high fracture
permeability.
This landslide comprises surficial mass movements, within the soft rock (Stanwell Park
Claystone), and a variety of complex failures can be recognised, including earthflow,
debris flow and talus slump. The Stanwell Park Claystone contains appreciable
montmoriUonite clay (laboratory swelling tests on the fresh claystone core samples
produced unconfined swelling strains up to 10% and swelling pressures of 100 KPa for
Stanwell Park Claystone, Railway Authority, 1983), and is prone to slaking (chapter 7)
when subject to moisture variation above the perched water. From shear strength values
compiled by Pitsis (1992), it is clear that the Stanwell Park Claystone has a generally
low friction angle. The magnitude of the friction angle may be as low as 11° (Table
8.3). Claystones are thus readily transformed into material with clay soil properties,
such as plasticity and volume change, whilst the associated siltstone and fine sandstone
readily disaggregate when saturated and disturbed.
Intense fracturing accompanying normal faulting (Harbour Fault) has additionally
weakened the rock mass, greatly assisting the slaking process by permitting rapid
variations in moisture content. Surficial mass movements occur extensively and they
involve the entire length of a slope from ridge crest to amphitheatre floor. Generally
water flow within the rock mass is concentrated along discontinuities at the contact
between the Bulgo Sandstone and Stanwell Park Claystone at the top of northern
amphitheatre. This increases the rate of weathering of the Stanwell Park Claystone,
208
causes fretting and weathering of the sandstone and leads to toppling failures and rock
falls.
8.7.4.4 Conclusion
T w o grabens (A and B) containing two amphitheatre complex landslides are located
between Clifton and Coalcliff along the Lawrence Hargrave Drive. Amphitheatre
complex landslide associations are identified which reflect mass movement controlled
by bedrock lithology, rock mass structure and climate. The southern amphitheatre
complex landslide is a deep-seated block and wedge slide on the gently deformed lower
Narrabeen Group (alternating sandstone, claystone, shale) and upper niawarra Coal
Measures (Bulli Coal). The northern amphitheatre complex landslide is a deep-seated
block slide accompanying surficial creep earthflows and debris-flow slides on the lower
Narrabeen Group. Shallow talus failure, which is independent of bedrock, is normally
triggered by high intensity rainfall.
Landslides were triggered by the water which accumulated in the slopes. Water flow
within the rock mass is concentrated along discontinuities at the base of lower
Narrabeen Group sandstones.
Opening of the vertical joint at the rear of the failure mass occurred progressively over
a period of several years but the failure itself occurred suddenly when water pressure
in the slope reached a critical value. These critical pressures probably corresponded to
water level of the head of the slump is at or near the top of the open joint.
The failure surface was largely defined by structural features in the slope. The open
vertical joint defined the rear of the failure mass and the lower part of the failure
surface followed two weak strata (Stanwell Park Claystone and Wombarra Shale) in
the slope.

209
These amphitheatre complex landslides rotated slowly and incrementally (creep) on their
failure surfaces. These incremented movements are characteristic of failure surfaces
along which strength has been reduced to a residual value.
To produce a comprehensive engineering geological failure model for the southern and
northern amphitheatre slides, that would account for the deformation and failure
mechanisms along the large creeping rock slopes, data from surface surveys would have
to be combined with data from exploration adits and a series of carefully positioned
boreholes. Such data, to be collected from future research, would probably show that
the slopes have been deformed and relaxed. Boreholes through the slopes would obtain
rock quality designation (RQD) values for the major rock units and would permit an
assessment of the fissility in the Wombarra Shale unit (Fig. 3.15). The presence of
extensive near-surface fissility, in combination with unstable cements and swelling clays,
would account for the rapid weathering, disintegration and reduced overall rock mass
quality in this unit.
Further drill-supported field investigations should reveal that deformation of whole slopes
resulting from escarpment stress relief may have occurred in some locations.
In the upper parts of slides in both amphitheatres, tensile cracking zones, about 40 m
wide and composed of a series of vertical joints, can be observed. Within these zones
bending-toppling failure of the rock mass has occurred near the surfaces, and has
resulted in depression zones, about 10 m wide, at the backs of the slides. Tensile
cracking zones at the backs of these slides could not have resulted solely from
superficial bending-toppling deformation occurring at the top of the slopes. Rather it
appears to be associated with depth-creep deformation of the whole slope.
In summary, it can be concluded that the creep-formed slides probably have a composite
deformation mechanism, which is mainly controlled by creep along major faults which
bound these slide areas (faults 1 and 2 in the southern amphitheatre [Fig. 8.42], and
fault 3 and the Harbour Fault in the northern amphitheatre; Fig. 8.44), and creep-
210
induced tensile fracturing of the rock mass within the slide area. Slides in both
amphitheatres thus appear to fail due to progressive fracturing of the rock mass.
It is apparent that the slip failures on both slopes are still developing, so a basic
prerequisite of stability assessment of creeping slides needs to thoroughly investigate
the full course of slope deformation, that is the mechanism of deformation and failure.
Finally, using the above mechanism and present stage of slope deformation, a qualitative
assessment of slope stability can be made, and its future development and final failure
(sliding) form can be predicted.
Case studies used in this research also suggest that future research should include not
only systematic engineering geological investigations and geological surveys, but also
detailed exploration, rock mechanics tests and numerical simulation. Risk assessment
and prediction of movement in such complex slides is by no means an easy task.
8.7.5 SITE 5 JETTY ROCK SLUMP
8.7.5.1 Location
This slump is located at the toe of the southern amphitheatre complex landslide (Graben
A) between Clifton and Coalcliff beside the Jetty Fault and east of Lawrence Hargrave
Drive above the sea (Fig. 8.45).
8.7.5.2 Geology
The rocks are essentially flat-lying strata consisting of Wombarra Shale, Coal Cliff
Sandstone and Bulli Coal. The middle beds of the Wombarra Shale are visible at the
head of the slump in a small cutting on the east side of the road. The Wombarra Shale
contains numerous vertical joints; this is an ideal condition for the development of
contact springs. Water drains from the toe of the rock slump at the contact between
the Coal Cliff Sandstone and Bulli Coal. The thickness of the Coal Cliff Sandstone and
211
Bulli Coal is about 5 m and 1.5 m respectively in this rock slump. The Jetty Fault
causes an increase in local water flow and is directly related to this rock slump.
8.7.5.3 Description of rock slump
The rock slump consists of a talus mantle, and middle and lower beds of Wombarra
Shale and Coalcliff Sandstone. The base of rock slump is in the Coalcliff Sandstone,
where it was displaced by the Jetty Fault.
The slump is about 60 m long and 50 m wide, the main scarp is steep and
approximately parallel to Lawrence Hargrave Drive. The crown, head, flanks, and toe
of the slump are recognisable.
This rock slump is a wedge slide failure and involves translational movements on low
shear strength planes that dip at angles as low as 15°. Surface water infiltrates though
the talus and seeps down through it to the contact with the relatively impermeable
Wombarra Shale (Fig. 8.46). Seepage increases water pressures in the talus and
contributes to alteration of the Wombarra Shale. The failure surface can be lubricated
by montmorillonite clays, whilst water moves laterally along two discontinuities (Fig.
8.45). Both of these effects contribute to further landsliding.
8.7.5.4 Geotechnical properties of the talus
Index properties were determined for samples of talus materials obtained from 3
locations (crown, head and toe) in this slump. The range and average values of these
index properties are given in Table 8.1. It must be noted that these values of shear
strength parameters do not represent the properties of soil at the slip surface.
According to the result of tests peak friction angle decreases from 47° in the crown to
42° and 40.5° in the head of the slump (Fig. 8.13). These angles are higher than the
peak friction angles ((J)p) in the Moronga Park slump. This is relation to composition of
the talus materials. In this slump, the talus contains cemented shale fragments of
212
Wombarra Shale. The Wombarra Shale has a calcite cement in this location, which
results in the high peak friction angle found in this rock slump.
8.7.5.5 Conclusion
The main causes of slumping are, erosion of the toe of the slope by sea, water
percolation into the slump along the Jetty Fault, and mobilisation of the material after
any heavy rain in the area. This slump is an active but it is moving very slowly
toward the sea. During the last three years hardly any creep movement has been
observed on the basis of surface markers.
8.7.6 SITE 6 HARBOUR SLUMP
8.7.6.1 Location
This slump is located immediately south of Coalcliff, east of Lawrence Hargrave Drive
along the road and above the sea (Fig. 8.47).
8.7.6.2 Geology
The rocks consist of the Wombarra Shale and Coal Cliff Sandstone. The upper beds
of the Wombarra Shale are overlaid by the Scarborough Sandstone which is visible on
the west side of the road. Water flow within the Scarborough Sandstone is concentrated
along joints at the contact between this sandstone unit and the relatively impermeable
Wombarra Shale. This seepage increases water pressure in the fill (ashes, slag and soil)
and talus material and causes alteration of the Wombarra Shale. Both of these effects
contribute to instability of the slope.
The Harbour Fault is located immediately south of this slump. This fault has an
approximately east/west strike with dip of 70° toward the north. This fault has created
an additional area of instability to the south of this slump.
213
8.7.6.3 Description of the slump
This slump is about 25 m long and 65 m wide. The crown, main scarp, head, flanks
and toe of slump are recognisable; the main scarp is sharp and lies along the outer edge
of Lawrence Hargrave Drive. The base of the slump lies on the Coalcliff Sandstone
and water seeps from the toe of slump (between the base of the slip and the sandstone
(Fig. 8.48). The main body of the slump comprises fill and talus (weathered boulders
in a clay matrix). This slump can divided in two parts. The northern part of the
slump, comprising a shallow fill/talus failure involving the weathered mantle, occurs
irrespective of the bedrock lithology and is triggered on the steep slope (about 30°) by
high intensity rainfall. The southern of part the slump is a creep mass involving talus
and weathered Wombarra Shale; it is moving very slowly southeast toward the sea.
8.7.6.4 Geotechnical properties of the talus
Index properties were determined for samples of talus materials obtained from 3
locations (crown, head and toe) in this slump. The range and average values of these
index properties are given in Table 8.1. As noted before these values of shear strength
parameters do not represent the properties of soil at the slip surface.
According to the results of tests the peak friction angle ((J)p) decreases from 44° in the
crown to 30° in the head and 16° in the toe of the slump (Fig. 8.13). This is related
to the grain size of talus materials which decreases from the crown to the toe of the
slump but not the clay content. Talus in the crown of the slump mostly consists
fragments of the Wombarra Shale as noted before for the Jetty rock slump. The value
in the head of slump represents a peak friction angle for soil fill and the value in the
toe of the slump show residual friction angle since this material has moved toward the
sea (Fig. 8.47).
214
8.7.6.5 Conclusion
The slump comprises a shallow fill/talus failure in the north, which is independent of
bedrock control, and a creep mass in the southern part of slump. It is triggered by very
heavy rainfall. The toe of the slump is being eroded by the sea, resulting in relaxation
of the material above. Also with any heavy rain, water percolates into the slump and
mobilises the material. This slump is active but the southern part of the slump has been
stabilised by remedial measures (retaining wall). Most of the slide area is moving very
slowly (creep) southeast toward sea.
REGION C
8.7.7 SITE 7 COALCLIFF SLUMP
8.7.7.1 Location
This slump contains a broad active slip zone and is located between Coalcliff and
Stanwell Park between the Railway and Lawrence Hargrave Drive (Fig. 8.49).
8.7.7.2 Geology
The sedimentary rock units exposed in the vicinity of this slump belong to the
Narrabeen Group. The two members of immediate relevance are the Bulgo Sandstone,
the base of which is exposed about 4 m above the railway level, and Stanwell Park
Claystone which underlies the railway embankment and talus slope (Fig. 8.49). The
Stanwell Park Claystone is approximately 40 m thick at this location and consists of
three main claystone intervals and two sandstone intervals. The Bulgo Sandstone
overlies the Stanwell Park Claystone and is approximately 130 m thick. This unit
consists of grey quartz-lithic sandstone, medium- to coarse-grained with some thin
conglomeratic bands. A chocolate brown claystone bed about 1.5 m thick is present
near the base of the Bulgo Sandstone uphill of the slip area. The claystone interbed
215
is composed mainly of quartz, and kaolinite, with montmorillonite and illite. This
composition is similar to the Stanwell Park Claystone.
The dominant rock defects apparent in the bedrock exposed on the uphill side of the
slump belong to a close spaced joint set oriented subparallel to the cutting and the
hillslope. A n outcrop at this location exhibits the joints, spaced as closely as 5 m m
to 20 m m , striking between 050° to 060° with dip of between 70° and 80° to the east.
The close spaced joints were produced by weathering and stress relief subparallel to the
hillslope.
8.7.7.3 Description of the slump
This slump is about 150 m long and 600 m wide. The crown and main scarp are
recognisable. The main scarp lies along the railway line. The main body of the slump
comprises fill and talus, and base of slump lies on the Stanwell Park Claystone.
Evidence of artesian groundwater flows was discovered in February 1972 during the
diamond drilling by the State Rail Authority. From examination of drilling records it
would appear that the water flow originated from a soft sandstone layer (between 5.3 m
and 6.4 m depth) within the top of part of the Stanwell Park Claystone. The layer was
isolated above and below by grey shale beds. The core of the Stanwell Park Claystone
bedrock was highly fractured and displayed highly ferruginised joints indicating the
presence of water. This flow may provide significant piezometric pressures at the
failure surface and cause saturation of the colluvial mantle. In addition to this, it is
possible that a fault detected in the nearby mine workings may crop out in the vicinity
of the slip and result in an altered groundwater regime.
8.7.7.4 Geotechnical properties of the talus and Stanwell Park Claystone
Index properties were determined for samples of talus materials obtained from 3
locations (crown, head and toe) in this slump. The range and average values of these
216
index properties are given in Table 8.1. It must be noted that these values of shear
strength parameters do not represent the properties of soil at the slip surface.
According to the result of tests peak friction angle (<|>p) decreases from 34° in the crown
to 29° in the head and to 18° in the toe of the slump (Fig. 8.20). Talus in the crown
of the slump consists of claystone rock fragment (Stanwell Park Claystone). Depending
on the degree of breakdown of the claystone rock fragments in the talus materials the
difference of the peak friction angle occurs in this slump. The low peak friction angle
in the toe of the slump is related to the high percentage of silt and clay (Table 8.1).
The slump contains a broad active slip zone of talus, but the actual location of the
failure plane is somewhere within the uppermost weathered zone of the underlying
Stanwell Park Claystone and not in the talus layer itself. Cores recovered from diamond
drilling by the State Rail Authority (1982) showed that within this zone the top of the
Stanwell Park Claystone was highly to completely weathered for a distance of 1 m to
4 m. The assessment that the failure plane is more likely to be located in this
weathered claystone than in the talus, is suggested by an examination of measured
physical properties of the two materials.
Since cohesion (c) in a residual strength situation is progressively reduced with small
increments of creep strain, the controlling strength parameter is generally considered to
be the residual angle of internal friction (cj)r).
The results of tests (State Rail Authority, 1982) indicate that the average ((j)r) for
undisturbed talus (27°) exceeds that of the completely weathered claystone (16°) by 70%.
An approximate comparison of the relative residual strength of the colluvium and the
completely weathered claystone can be made by using the relationship between plasticity
index (Ip) and residual angle of internal friction (<\>T) published by Kanji (1974):
<|)r = 46.6/Ipa446
The relevant values of Ip for talus and completely weathered claystone are 19.6% and
33.2% respectively. The equivalent values of <j)r are found to be 12.4° and 9.7°. Again
217
the angle for the talus is seen to exceed that for the completely weathered claystone,
suggesting that the basal sliding surface would more likely be located within the
weathered claystone.
8.7.7.5 Conclusion
The major feature of the Coalcliff slump is sliding of the talus layer on an inclined
failure surface toward the sea, with internal tension cracks and minor scarps. As
described before the Stanwell Park Claystone is highly to completely weathered for a
distance of 1 m to 4 m. The assessment that the failure plane is more likely to be
located in this weathered claystone than in the talus was suggested by a comparison of
the measured physical properties of the two materials. Since cohesion (c) in a residual
strength situation is progressively reduced with small creep strains, the controlling
strength parameter is generally considered to be the residual angle of internal friction.
Groundwater flow appears to be introduced from an aquifer in the Stanwell Park
Claystone into the bedrock/talus interface. This could have a controlling effect on the
instability of this slope. Therefore, lowering of the groundwater within the talus and
fill may not produce the full anticipated reduction in water pressures at the failure plane
due to the relatively constant pressure applied by the flow from the aquifer below the
interface. The relative effect of the aquifer uplift pressure would appear to depend on
the surface area and the permeability of the interface materials. For example, a decrease
in the permeability of the basal talus materials (which may include completely weathered
claystone) would cause an increase in the uplift pressures on the overlying slip mass.
8.8 SURFACE SURVEY RESULTS
The writer installed in late 1991 a series of surface survey pegs on the four landslides
(Clifton hotel earth-slump, Moronga Park slump-earth flow, Jetty slump and Harbour
218
slump) for measuring slip movement. The survey pegs are arranged along three transect
lines which extend across each landslide. The survey pegs are positioned about 10 m
apart along each transect line. The landslides did not show any surface movement for
more than three years of this study. The only exception was at the Moronga Park
slump, where the rate of opening of a tension crack in Moronga Park is about 3 mm
per year on the surface. Even the Newcastle earthquake on 6 August 1994, which
measured 5.3 on the Richter scale (4.2 magnitude in the study area) had no effect on
the slumps. A monitoring program with inclinometers by the State Rail Authority
(1982) showed that the landslides are moving very slowly (creep). The rate of
movement is between 30 mm and 50 mm per year depending on the amount and rate
of rainfall in the landslide areas.
8.9 FAILURE OF ROCK
8.9.1 INTRODUCTION
The toppling mass-wasting process has been recognised throughout the world but little
is known about its long-term effect in natural rock slopes (Pritchard et al, 1990;
Culshow and Bell, 1991; Glawe et al, 1993; Cruden and Xian, 1994).
In the northern Illawarra, the Narrabeen Group is thick and slopes are steep with the
sandstone beds locally forming significant cliffs. The extreme is between Coalcliff and
Clifton where the Scarborough and Bulgo Sandstone bluffs obscure the topmost
Hawkesbury Sandstone cliff when viewed from the road. The cliff section from just
south of Clifton to Austinmer is very steep and significant toppling and falls occur in
this area. Rock failures are considered significant when a clear surface expression
results; which generally means that newly exposed faces are evident and vegetation
below the fall has been severely damaged. The rock mass involved may range in
weight from approximately one tonne to hundreds of tonnes.
219
During the present study very heavy rainfalls (700 mm per month) were not recorded
but heavy falls (400 mm per month) occurred in recent years (April 1988). This
resulted in some significant rock failure and talus failure on the escarpment as a whole,
especially between Coalcliff and Clifton along Lawrence Hargrave Drive.
A common occurrence is the flaking off of claystone fragments and after heavy rainfall
accumulations of fine claystone fragments up to 1 m deep may be seen on the sides of
road. This common feature generally goes unnoticed and only the large rock falls are
recorded. However extreme fretting of the fine-grained rock units occurs which
eventually leads to undercutting the sandstone cliffs.
8.9.2 MECHANICS OF ROCK FAILURES
The interbedded sandstone and claystone of the Narrabeen Group often produce near
vertical cliff faces which evolve by rockfall, toppling (Fig. 8.50a) and general
degradation processes. Commonly a distinct time delay occurs between heavy rainfall
and failure. This time delay varies greatly from merely a day to several months.
Rock failures on the Illawarra escarpment are relatively simple in their form and shape
because the bedding is very close to horizontal and jointing is approximately vertical.
The iron staining often extends to the base of the failure surface indicating open joint
systems at least near the surface. At the base of the massive, horizontally bedded
sandstone is a highly weathered claystone or shale. The rock failures are bounded by
joints and the basal weathered claystones or shale. Erosion of the claystone or shale
by fretting has undercut the sandstone.
In summary, several features of rock failure have been observed in the study area.
(1) Commonly, bedding is horizontal and jointing is vertical.
(2) Failures are usually associated with heavy rainfall but usually a distinct time delay
is found.

220
(3) The joint surfaces often are iron-stained, which means they are open to weathering
agents down to the base of the failures.
(4) Weathering and fretting of the basal claystone and shale causes significant
undercutting of the sandstone cliff, for example at the contact between Scarborough
Sandstone and Wombarra Shale between Clifton and Coalcliff along Lawrence
Hargrave Drive (Fig. 8.50b).
(5) Variation in mechanical properties of the weathered rocks, and the importance of
creep.
(6) High horizontal stresses parallel to the cliff faces. The vertical joints perpendicular
to the cliff face are generally closed.
8.9.3 EFFECTS OF WEATHERING AND JOINTING
The main effect which alters the properties of rocks on a slope is weathering. The rate
of weathering is variable; it is greatly dependent on the rock type and may be a short
or long term factor. The variations, usually seasonal, of temperature and rainfall can
induce alternating stresses within a rock mass which invariably reduces its strength. In
a very long-term sense, the regional stresses within an area may vary and these may
effect the stability over a period of time. Variations in the position of the water table
are often time-dependent and this causes water pressure fluctuations and various
consolidation effects in the colluvium. Variations over time in the physical and
chemical action of the groundwater also induce breakdown of the rock mass.
Rocks containing soluble minerals are particularly susceptible to breakdown over time,
as are those containing swelling clay minerals. The permeability of a rock may,
therefore, alter greatly resulting in a complex relationship of permeability and strength
between unweathered and weathered rock.
The properties of discontinuity surfaces are significantly altered with increased
weathering. The influence of joint irregularities is decreased as the strength of the joint
221
asperities is reduced (Glawe et al, 1993). This increases the possibility of them being
sheared off rather than overridden. Although the cohesion may increase due to the large
amount clay minerals produce during weathering, the friction between the joint surfaces
is likely to decrease markedly. This needs to be confirmed by scientific observation.
Patton and Deere (1970) have pointed out that weathering tends to zones of materials
with different permeabilities. A lower permeability layer overlying a higher permeability
bed can result in the formation of artesian pore water pressures in weathered slopes,
which could induce a slope failure. Weathering also is a strong undercutting agent
because of its differential action and thus it is most important in rock slope stability
studies. The toppling mechanism of failure is very often induced by undercutting
(Canuti et al, 1993).
In the study area relatively thick sandstone beds usually overlie thinner claystone beds.
The weathering of sandstone beds occurs, but the rate of weathering of the claystone
is much greater than for the sandstone. As a result, the sandstone units are relatively
fresh to slightly weathered, while the claystone units are slightly, moderately, highly or
completely weathered. The sandstone beds possess a number of vertical joints which
become less dominant back from the free face. Water movement down the joints in the
sandstone causes more intense weathering in the claystone. Water movement away from
the joints is along the contact between the sandstone and claystone causing weathering
and fretting in the claystone. Field observations of failure have shown the existence of
completely weathered to moderately weathered zones at these junctions. The intensity
and continuity of jointing, and the extent of basal weathering and undercutting determine
the size of the rock-falls and toppling. Tectonic joints are usually continuous over long
distances. The joints tend to break the rock mass into various shaped prisms. Thicker
and coarser sandstone units usually have a lower intensity of jointing than the thinner
sandstone units.
222
8.9.4 CREEP
In long term rock slope stability studies, creep is an important factor. It is well known
that creep occurs when rock material is subjected to relatively high stresses for a long
time. Weathered rocks especially are very susceptible to creep. Even at low stresses,
certain rock types with moderate to high moisture contents can exhibit large time
dependent strains (creep). Creep is a movement which is a consequence of erosion and
unloading at the bottom of a slope where the beds bulge upwards. Creep may occur
on wett defined planes but this is difficult to observe because it may be taken up by
an infinite number of small shear planes (Huang et al, 1994). A failure may not exist,
although progressive displacements may have been measured.
Hamel and Adams (1974) suggested that creep may be an initial or intermediate stage
in the development of toppling failures. This suggestion is important and there appears
to be a relationship between toppling and rock creep in this study. With time, there
is usually an increase in water content and a reduction in shear strength in the
claystone. The increase in water content occurs as a result of weathering with a
consequent decrease in grain to grain contact and perfection of mineral packing, and an
increased porosity. Seasonal variation in groundwater level causes a variation in shear
strength of clay. So that the time until failure is strongly dependent on the climatic
conditions.
As the clay in a slope is weathered, it is able to creep downslope if the shear stresses
in the failure zone due to gravitational forces are equal to the residual shear strength.
If the clay is highly disturbed and the strength of the failure surface has been reduced
from the peak to a residual strength, a slide may follow.
A distinction should be drawn between creep along discontinuities and within the rock
material itself. In the former case, slow gradual movements occur primarily along joint
surfaces or along bedding or failure planes. In the latter case, the intact rock material
223
deforms at a microscopic scale under the influence of a load. Both types of creep are
likely to occur prior to a rock failure.
8.9.5 ROCKFALL AND TOPPLING ALONG THE LAWRENCE HARGRAVE
DRIVE
Along Lawrence Hargrave Drive between Clifton and Coalcliff the road is subject to
both rockfall and toppling from above and slumping of the underlying Wombarra Shale
(Fig. 8.51). Along this road many slumps are located in the talus and Wombarra Shale;
the latter generally occurs within approximately 2 m of the surface. These slumps have
been initiated by the removal of support from the Wombarra Shale due to coastal
erosion processes. The interbedded sandstone and shale sequence in the lower
Narrabeen Group are responsible for rock slope instability within the detailed study area.
Undercutting (weathering and erosion) of cliffs at the top of claystone and shale units
produces topples and rockfalls. Between Clifton and Coalcliff the Wombarra Shale is
located at the base of the Scarborough Sandstone cliff which fails due to weathering of
the basal shale (Fig. 8.51b).
The Bulgo Sandstone forms the majority of the steep escarpment in the study area. The
Stanwell Park Claystone is located at the base of Bulgo Sandstone cliff. This claystone
unit rapidly weathers and breaks down to form clay typically possessing low shear
strength properties. This process is aided by the many joints in the Bulgo Sandstone
and Stanwell Park Claystone. Also it is considered that, over geological time, creep
strains would affect rock slope stability because the claystone is more likely to creep
than the sandstone unit. Therefore partings along bedding planes occur, and the Bulgo
Sandstone commonly fails due to weathering of the basal claystone (Fig. 8.52a, b), and
in small scale due to the interbedded claystone or shale in the Bulgo Sandstone.
224
Minor rockfalls are particularly evident where the finely laminated shales are being
weathered continuously causing the more competent sandstone blocks to fall from the
cliffs between Clifton and Coalcliff.
8.9.6 ROCKFALLS AND TOPPLING ALONG THE COASTLINE
Marine undercutting takes place where the cliffs are approximately vertical and this
includes virtually all of the cliffs between Clifton and Coalcliff. Failure due to
undercutting may take one of two forms: that of toppling where the weight vector of
a block (with an approximately rectangular cross-section defined by dimensions b and
h) falls outside of the base of the block (Fig. 8.53). A master joint aUows release of
the block from the cliff and toppling occurs. Alternatively, fracturing through rock
bridges may take place, the fracture joints a line of existing joints leading to failure
(Fig. 8.53). In fact coastal erosion has undermined the Coal Cliff Sandstone leading to
rockfalls into the sea. This in turn leads to slides from the overlying Wombarra Shale
(Fig. 8.53). A notch exists at the high water mark level in the Coal Cliff Sandstone
indicating the strong coastal erosion forces. King tides combined with heavy storms
resulted in large rockfalls on the coast immediately north and south of Stanwell Park
in the Scarborough Sandstone (Fig. 8.53). In these areas the Scarborough Sandstone is
very coarse and tends to be conglomeratic. It was observed that during failure the rock
broke almost invariably at the conglomerate/sandstone interface.
8.9.7 CONCLUSIONS
There are several factors contributing to the present instability on the lower Narrabeen
Group exposed in the northern Illawarra. These include:
(1) the high rainfall levels experienced and, as a result, the high rates of infiltration
and runoff;
225
(2) the steep surface slope angle which forms a potentially unstable condition in the
Bulgo Sandstone and Scarborough Sandstone;
(3) the rapid weathering of the Stanwell Park Claystone unit which breaks down to
form clay typically possessing low shear strength properties. This unit has a very
low durability (see chapter 7);
(4) the low surface slope angle on the Stanwell Park Claystone which allows the
accumulation of deep talus deposits;
(5) pre-existing discontinuities, such as shear zones and failure surfaces in the talus;
(6) blanketing of the jointed Bulgo Sandstone and any fractured basal Stanwell Park
Claystone by talus causes hydrostatic pressures to build up within the overlying
impermeable talus deposit. This is confirmed by the many failures which occur
on the Bulgo Sandstone and Stanwell Park Claystone;
(7) concentration of hydrostatic pressures within fractured rock immediately behind the
talus;
(8) the presence of interbedded claystone within the Bulgo Sandstone, Scarborough
Sandstone and Coal Cliff Sandstone which weathers to form low strength clay.
For example, claystone bands within the Bulgo Sandstone show very low durability
and cause many rockfalls;
(9) The weathering of the Wombarra Shale which breaks down to form low strength
clay;
(10) the existence of seepage concentrations within the fractured Wombarra Shale;
(11) marine undercutting (Coal Cliff Sandstone and Scarborough Sandstone) especially
between Clifton and Coalcliff and the north of Stanwell Park Beach.
(12) the presence of coal seams results in seepage concentrations because of their
permeable and aquifer properties; and
226
(13) the difference in the creep properties of the two predominant rocks (sandstone and
claystone). The weathered claystone has a faster creep rate than the sandstone
(Evans, 1978).
8.10 TREATMENT, STABILISATION AND PREVENTION
Landslides are natural geomorphic processes. For natural slopes in areas where there
will be no adverse effects, landslides are simply left alone. In critical areas, landslides
on natural slopes are treated similarly to those in man-made slopes. The most critical
item here is understanding the geotechnical framework of the slope. If this framework
is understood, it is not usually difficult to implement proper design and construction
procedures, provided that the economics of such procedures can be justified.
Deep-seated rock slides are treated on an individual basis because of their rarity.
Standard procedures are available for dealing with the more common shallow, slab-
type, rockfalls and rock topples. In natural rock slopes, the options are usually limited
to removal of potentiaUy unstable rock masses or supporting and/or stabilising such rock
masses.
With talus slopes, the key is recognition of old landslide masses (Gray at al, 1979;
Hamel and Adams, 1981). Talus masses, especially the larger ones, should be avoided
to the extent practicable. If they cannot be avoided, talus masses can sometimes be
stabilised with drained buttress fills or retaining structures. Stabilisation of a talus mass
by excavation alone generally requires removal of virtually the entire mass in order to
ensure stability. This is seldom practical with large talus masses. Improvement of
subsurface and surface drainage is an important component of stabilisation measures for
many talus slides, though drainage by itself may not be sufficient for slide stabilisation
(Chowdhury, 1980).
The stability of filled slopes begins with the foundation. All foundations must be
carefully investigated. Fills placed on talus are seldom stable in the long term.
227
Assuming a stable foundation, good grading practices are mandatory to ensure a stable
fill slope. Surface and subsurface drainage must also be provided for a stable fiU.
With rock slopes, individual methods of stabilisation will very rarely be used by
themselves. A realistic design will frequently involve a combination of control of
passive factors, such as weathering, the use of structural restraints, such as rock anchors,
and drainage. In many cases in the study area, the prevention of rock failures in natural
rock slopes will not be viable as access is very difficult and the cost would be very
high.
As weathering plays an important role, its minimisation as an undercutting factor in
softer rocks is most important. Physical weathering processes, especially wetting and
drying, need to be prevented as soon as possible after a fresh claystone bed is exposed
by rock failure. Detailed work on such beds is described by Fookes and Sweeney
(1976) and usually involves the sealing of the exposed bed with reinforced concrete but
with appropriate drainage requirements. Complete sealing would minimise wetting and
drying and also salt weathering processes. The rapid rate of weathering of the claystone
necessitates prompt action, especially as the strength decrease with weathering is most
pronounced in the progression from the fresh to slightly weathered stage. Large areas
of high weatherable rocks can be treated by the use of mortar screeding where
groundwater erosion is not important. Figure 8.54 shows several stabilisation and
prevention measures carried out between Coalcliff and Clifton. The Scarborough
Sandstone is at the top of the figure. The Wombarra Shale (middle) overlies the Coal
Cliff Sandstone (bottom) and the Otford Sandstone Member form the small cliff beside
the roadway. For controlling lateral movement, rockfalls, toppling and subsidence,
significant work has been carried out by the Department of Main Roads along Lawrence
Hargrave Drive including concrete retaining walls, shotcrete, gabions, rock bolts and
steel mesh to prevent falls and slumps from and onto the side of the road (Fig. 8.54).
Figure 8.55a shows destruction of the shotcrete by swelling of the rock mass. The

228
Wombarra Shale is strongly affected by wetting and drying processes which lead to the
expansion of the surface rockmass and water access is provided via the joint systems
in the overlying rock.
This study indicates the progressive nature of toppling and the general degradation
processes whereby open joints become enlarged and failure ensues. The principal
method of minimising the effects of jointed regions is the use of structural restraints in
the form of rock bolts or anchors. They should be applied as soon as possible after
exposure of the particular face so as to minimise joint dilation. The interlocking effect
of joints imparts a considerable strength to a jointed rock mass. If loosening is
permitted strength is reduced. Rock bolts or anchors act as shear keys and are designed
to provide an increased shear resistance across thinly bedded rocks.
The provision of adequate drainage is a necessary requirement of almost all stabilisation
designs. This may be in the form of subhorizontal drains drilled both paraUel and
perpendicular to the slope, or drains at the crest and toe of the slope (Fig. 8.55b). The
drains should have an impermeable lining and may act to re-channel existing permanent
flow or collect surface runoff. The amount of infiltration of surface water into the
joints at the back and sides of the slope is most critical. This can be minimised by
using drains or by sealing the cracks. The time delay noted following heavy rainfall
gives an indication of the pore pressure build-up in these joints. Subsurface
groundwater flow is an important weathering agent. This can only be avoided by
tapping the groundwater far back from the exposed face with drainage adits which will
be warranted in large scale failures.
Other methods used to control local rockfalls and general degradation are benches,
concrete or masonry retaining walls, free hanging mesh nets suspended from above,
stone facing with graded filter, rock trap ditches at the toe of the slopes, scaling of
loose blocks the construction of fences or walls and finally the flattening of the slope.
Local benches exit throughout the Narrabeen Group and greater use could be made of
229
them as they can act as access roads, rockfall arresters and can form the basis of a
contour drainage system (Fookes and Sweeney, 1976).
The coastal erosion is most critical and large breakwater walls must be constructed to
combat this process. Rock failure, both of the coastal cliffs and of the escarpment itself
must be seen as a normal phenomenon of the erosion cycle and hence most measures
to prevent them will have a definite and limited life unless they are maintained updated,
periodically and replaced.
At present, to enhance stability along Lawrence Hargrave Drive between Coalcliff and
Clifton, the following measures need to be considered:
(1) repair the rock retaining fences;
(2) seal cracks and fill depressions in the road surface;
(3) remove all loose, failed and slipping material;
(4) rockbolt, mesh and shotcrete can be applied to some locations, for example the top
of the southern and northern amphitheatre areas could be protected.
(5) replace rock fences with double strength fences;
(6) replace drainage pipes with larger sizes, and improve the inlet conditions for, and
outlet dispersal of, surface runoff water.
(7) excavate new drainage trenches where possible (between the cliff and the road).
(8) construction of a breakwater at base of the cliff between Clifton and Stanwell Park
along the coastline where the coastal erosion is critical.
(9) a series of deep subsoil slot drains is needed in the lower part of the landslides.
These should be taken down to bedrock and extended partially under the road to
intercept the regional water table and provide adequate drainage from the
subsurface aquifer.
A n alternative to remedial work along the existing roadway would be the excavation of
a tunnel to carry traffic past the dangerous section or construct a bridge across the shore
platforms. However, such proposals may not be cost effective.

230
231
CHAPTER 9
SUMMARY AND CONCLUSIONS
9.1 INTRODUCTION
In the niawarra area, with its steep coastal escarpment, slope stability is an old problem
and can have disastrous effects on development. This is directly related to the geology
and geological history of the area. The 300 m high escarpment consists of flat-lying
Permo-Triassic volcaniclastic coal measures plus fluviatile sequences capped by a well
cemented quartz sandstone. The interbedded strong sandstone and weak shale succession
in the lower part of escarpment has been acted upon by erosion, stress relief,
weathering, creep and sliding processes to produce masses of talus on many of the steep
hillsides. Rockslides are rare but rockfalls and toppling are common on the steep rock
slopes in the area.
The majority of slope stability problems of economic significance in northern Illawarra
involve translational or rotational slides or slow to rapid flows of soil, talus or fill. The
precarious equilibrium of talus masses is frequently upset by heavy precipitation and by
man's activities, e.g. removal of toe support, loading the slope, and changing the surface
and subsurface drainage.
Artificially induced slides, many of which include underlying or adjacent talus, almost
invariably result from poor site selection or poor design and construction practices.
Slope stability evaluation in the northern Illawarra should be an interdisciplinary
geotechnical endeavour requiring concepts from engineering geology, soil mechanics and
rock mechanics. Of these three disciplines, engineering geology is probably the most
important. Reliable evaluations of slope stability must begin with an understanding of
regional and site geology and of the geologic processes which formed the site and
continue to act upon it. Once this level of geologic understanding is reached, slope
232
behaviour can often be assessed on the basis of common sense or precedence. Where
detailed stability analysis is required, the above-mentioned geologic understanding is
mandatory for development of appropriate geotechnical models. This study is structured
according to the above philosophy, with emphasis on the talus slope deposits.
9.2 STRATIGRAPHY
The lower Narrabeen Group and upper Illawarra Coal Measures are essentially flat-
lying strata consisting of repeated beds of sandstone, shale, claystone and coal seams.
In the lower Narrabeen Group, thick sequences of weak rocks (Stanwell Park Claystone
and Wombarra Shale) are rather more easily eroded than sandstone strata and hence
relatively rapid rates of recession occur. Undermining along this thick sequence of
weak rocks at the contact between claystone and sandstone reduces the support for the
overlying vertically-jointed sandstone and eventually leads to stabs falling off along the
vertical joint faces. Thin marker beds (coal seams) in the Illawarra Coal Measures
commonly act as aquifers, with claystone beds acting as aquitards. Slope instability is
usually related to the presence of the aquifers which are the source of high pore water
pressures.
9.3 PETROLOGY
The Narrabeen Group was derived from the New England Fold Belt to the north and
consists predominantly of volcanic detritus. The volcanic detritus is present in both the
sandstone and shale units either in form of detrital grains of volcanic rock or as fine
volcanic ash. During post-depositional alteration and diagenesis, the original volcanic
glass in the ash and matrix of larger grains has devitrified to produce smectite clays.
These clays not only cause swelling and shrinkage near the surface as a response to
wetting and drying, but also reduce the permeability of the near the surface rock mass.

233
This latter factor increases the aqueous pore pressures and hence increases the likelihood
of surficial mass movement of both the rock mass and the adjacent talus deposits.
Based on the petrological study the rock fragments mostly comprise chert grains. The
majority of the chert contains clay minerals. Coarser sandstones tend to be poorly to
very poorly sorted whereas finer sandstones tend to be moderately to well sorted. Due
to an increase in weathering from fresh to weathered rock there is: (a) a decrease in
siderite and calcite content and a resultant decrease in the percentage of the cementing
matrix with an increase in weathering; (b) an increase in overall iron staining and
increase in thickness of iron oxide coatings around the edges of the quartz grains and
rock fragments with an increase in weathering; (c) an increase in chlorite content and
diagenetic alteration to chlorite enhances the weatherability of rock fragments; and (d)
quartz and rock fragments become progressively more fractured.
Based on X-ray diffraction analyses the carbonates are mostly rare in the talus deposits.
The natural reduction in the carbonate due to weathering is one cause of talus slope
instability in the niawarra area.
9.4 STRUCTURE
The faults act as feeders for underground water and even after prolonged dry spells
water is still running from area. The net result is that a relatively small rainfall can
thoroughly saturate the talus in the fault zone, where it is already in a highly unstable
position. Joints in the Scarborough Sandstone and Bulgo Sandstone vary in spacing.
The widely spaced joints divide the Scarborough Sandstone into big rectangular blocks
while closely spaced joints divide the Bulgo Sandstone into moderate to small blocks.
As a result, more rockfalls occur in the Bulgo Sandstone than in the Scarborough
Sandstone in the study area. However, falls that occur in the Scarborough Sandstone
are usually much larger and more destructive.
234
The high horizontal stress environment known to exist in the Illawarra area is an
important factor which influences slope failure. The resulting joint strike maxima for
the lower Narrabeen Group shows that the most prominent joint set exposed at the
surface, with a direction between 005° and 025°, has a significant effect on slope
stability in the study area.
9.5 WATER
Perched water tables have been found to be quite common in the study area because
the many claystone sequences within the Narrabeen Group are relatively impermeable.
Fracture permeability is the most important feature of groundwater movements with most
of the fractures occurring in areas of stress relief. It is quite obvious from studying the
rainfall figures and periods of prevalence of landslides that the most unstable periods
are those when the rainfall is above 400 mm per month.
9.6 GEOTECHNICAL PROPERTIES OF ROCK AND TALUS
A significant decrease in strength and durability was found to occur with a change in
mineralogy and an increase in weathering from fresh to weathered rocks. Moderately
and highly weathered claystone and shale in Narrabeen Group rocks have low to very
low durability; the later is dependent on their mineralogy, and especially on the type and
quantity of clay minerals present. The presence of calcite in shale will usually cause
high durability. Claystone samples interbedded in the Bulgo Sandstone show very low
durability. In contrast, claystone interbedded in the Scarborough Sandstone shows a
medium durability whereas claystone in the Coal Cliff Sandstone has a high durability.
The differences in the behaviour of samples is that slake durability is sensitive to the
abundance of clay minerals in these samples. Claystone interbedded in the Bulgo
Sandstone and the highly weathered Stanwell Park Claystone both have very low
durability. This has a significant effect on slope stability in the Bulgo Sandstone
235
especially when the Stanwell Park Claystone acts as the bedrock for the talus mantle
between Clifton and Stanwell Park.
Sandstone units in the Narrabeen Group, which contain abundant clay minerals and
volcanic rock fragments, show significant strength loss on wetting. The Narrabeen
Group sandstone contains swelling clays, therefore, expansive forces in these rocks are
a mechanism contributing to strength loss. High proportions of expansive clay minerals
were detected in volcanic rock fragments (cherts) which suggest that clay softening in
the presence of water is important in controlling moisture related reduction of strength
in sandstone in the Illawarra area. In the long term, solubility and disaggregation in the
Otford Sandstone M e m b e r would cause an increase in the secondary porosity in this
sandstone. Differential subsidence of the Wombarra Shale is the result of solution and
disaggregation of the Otford Sandstone Member which is not uniform in character and,
therefore, increases slope instability in the area.
The geotechnical properties of talus most related to its stability are clay content,
plasticity index and residual friction angle. These parameters and the angle of natural
slopes show the talus is unstable in the long-term at slopes above 10-12°.
9.7 SLOPE DEVELOPMENT PROCESS
Slope development processes can be simplified and generalised as follows: stream
erosion has carved longitudinal and transverse escarpment profiles reflecting local
stratigraphy, and has also removed lateral and vertical support from escarpment waUs.
Stress relief accompanying lateral support removal produced tension fractures and
bedding plane shear zones in rocks adjacent to the escarpment walls. These stress relief
features, along with stratigraphic and lithologic details, control groundwater flow in the
vicinity of the slopes; perched water tables and hillside springs are common. Stress
relief features and related groundwater phenomena have accelerated physical and
chemical weathering of rocks on the slopes. Under these conditions, rockfalls and
236
topples are common. They occur on the natural slopes, with weathering and erosion
undercutting joint-bounded rock blocks which slump backward or topple forward
depending on the their geometry, support conditions, and applied forces which, in
addition to gravity, often include water. Rockfall volumes are typically small, ranging
from approximately 0.1 to 24 m\ Fine-grained and argillaceous rocks predominate in
the typical stratigraphic section, so the weathering products are usually silty clay or
clayey silt with rock fragments ranging in size from sand to very large boulders. As
weathering progresses, the strength of the near-surface soil and rock materials decreases
and they begin to creep or slide down the relatively steep escarpment walls under the
action of gravity and water forces. Deeper seated landsliding along bedding plane shear
zones resulting from escarpment stress relief have also occurred in certain locations.
Eventually, these processes produced mantles of talus soil and rock fragments on many
slopes. The composition, thickness and inclination of talus on a given slope reflect the
stratigraphy and erosional history of the slope. Where slopes are relatively flat, on ridge
tops or large erosional benches, residual soils have formed. Residual soils on benches
below steeper slope segments are often covered with talus.
Where erosion was intense, little or no talus has accumulated and rock strata are
exposed on steep slopes. Talus thickness can range from about 1 m to more than 10 m
but is typically in the order of 5-10 m in the study area. A maximum thickness
approaching 20 m occurs at the toes of slopes in thick sequences of weak rocks (e.g.
claystone and shale) where deep-seated landsliding has occurred or where accumulated
talus has not been removed by erosion. Such conditions are rare.
Talus soils in the northern niawarra are generally cohesive and in most cases are
fissured. The most important engineering implication of talus slope development is the
presence in talus of surfaces, or zones, along which shear strength has been reduced to,
and maintained at, residual or near residual levels by a combination of softening and
strain effects. Movement due to creep, sliding, or both, during slope development are
237
generaUy concentrated along one or more such surfaces or zones, commonly at the soil-
rock contact. Additional surfaces or zones of movement may exist at levels within the
talus, particularly where talus is thick.
A talus derived claystone is often finer grained than the original rock, having a larger
clay fraction and plasticity index. This is often found at the base of talus deposits
which commonly mantle the coastal terraces. As a result, in a landslide situation,
residual shear strengths often reflect the properties of the clays which are derived from
the basal claystone strata.
9.8 REMEDIAL WORKS
With talus slopes, the key is recognition of old landslide masses. Talus masses can be
stabiUsed with drained buttress fills or retaining structures. Stabilisation of a talus mass
by excavation alone generally requires removal of virtually the entire mass in order to
ensure stability. This is seldom practical with large talus masses. Improvement of
subsurface and surface drainage is an important component of stabilisation measures for
many talus slides, though drainage by itself may not be sufficient for slide stabilisation.
With rock slopes, a realistic design will frequently involve a combination of control of
passive factors, such as weathering, the use of structural restraints, such as rock anchors,
and drainage. They should be applied as soon as possible after exposure of the
particular face so as to minimise joint dilation. If dilation is permitted this strength
lost.
Subsurface groundwater flow in both jointed rock sequences and talus can only be
avoided by tapping the groundwater far back from the exposed face with drainage adits
which will be warranted in large scale failures.
The coastal erosion, which causes oversteepening of the cliffs, is most critical and large
breakwater walls must be constructed to combat this process.
238
An alternative to remedial work along the existing roadway would be the excavation of
a tunnel to carry traffic past the dangerous section or construct a bridge across the shore
platforms. However, such proposals may not be cost effective.
9.9 CONCLUSIONS
Main causes of slope instability in the northern Illawarra region is due to:
(1) repeated beds of sandstone, shale, claystone in the Narrabeen Group;
(2) thin marker beds (coal seams) in the Illawarra Coal Measures;
(3) the presence of interbedded claystone within the Bulgo Sandstone, Scarborough
Sandstone and Coal Cliff Sandstone;
(4) the steep surface slope angle which forms a potentially unstable condition in the
Bulgo Sandstone and Scarborough Sandstone;
(5) the low surface slope angle on the Stanwell Park Claystone which aUows the
accumulation of deep talus deposits;
(6) the rapid weathering of the Stanwell Park Claystone and Wombarra Shale which
break down to form clay typically possessing low shear strength properties;
(7) the volcanic detritus in both the sandstone and shale units either in form of detrital
grains of volcanic rock or as fine volcanic ash;
(8) the natural reduction in the carbonate due to weathering in the talus slopes;
(9) pre-existing discontinuities, such as shear zones and failure surfaces in the talus;
(10) the horizontal beddings, vertical joints, faults and high horizontal stress;
(11) the high rainfall levels experienced (more than 400 mm per month) and, as a
result, the high rates of infiltration and runoff;
(12) high fracture permeability and perched water tables;
(13) blanketing of the jointed Bulgo Sandstone and any fractured basal Stanwell Park
Claystone by talus causes hydrostatic pressures to build up within the overlying
239
impermeable talus deposit. This is confirmed by the many failures which occur
on the Bulgo Sandstone and Stanwell Park Claystone.
(14) concentration of hydrostatic pressures within fractured rock immediately behind the
talus;
(15) the existence of seepage concentrations within the fractured Wombarra Shale and
Stanwell Park Claystone;
(16) significant decrease in strength and durability due to change in mineralogy and
increase in weathering from fresh to weathered rocks;
(17) very low durability in the claystones and shales; and
(18) marine undercutting (Coal Cliff Sandstone and Scarborough Sandstone) especially
between Clifton and Coalcliff and the north of Stanwell Park Beach.
At present, to enhance stability in the northern Illawarra region along Lawrence
Hargrave Drive between Coalcliff and Clifton, the following measures need to be
considered:
(1) repair the rock retaining fences;
(2) seal cracks and fill depressions in the road surface;
(3) remove all loose, failed and slipping material;
(4) rockbolt, mesh and shotcrete can be applied to some locations, for example the top
of the southern and northern amphitheatre areas could be protected;
(5) replace rock fences with double strength fences;
(6) replace drainage pipes with larger sizes, and improve the inlet conditions for, and
outlet dispersal of, surface runoff water;
(7) excavate new drainage trenches where possible (between the cliff and the road);
(8) construction of a breakwater at base of the cliff between Clifton and Stanwell Park
along the coastline where the coastal erosion is critical; and

240
(9) a series of deep subsoil slot drains is needed in the lower part of the landslides.
These should be taken down to bedrock and extended partially under the road to
intercept the regional water table and provide adequate drainage from the
subsurface aquifer.
241
REFERENCES
Adamson, C.L., 1974. Geological report on the stability of the Western GuUy Site.
Report submitted to Coalcliff Collieries Pty Ltd.
Amaral, R.H., 1975. Special instability problems in the niawarra and Warringah Shire
areas of N e w South Wales. Proceeding 2nd Australian-New Zealand Conference
on Geomechanics, pp. 311-325. Institution of Engineers, Brisbane.
A S T M , 1991. Standard method for slake durability of shale and similar weak rocks.
Annual Book of ASTM Standards, 04.08, section 4, 880-882.
Attewell, P.B., and Farmer, I.W., 1976. Principles of Engineering Geology. Chapman
and HaH, London.
Bai, G.P., 1991. Petrology, diagenesis and reservoir potential of Narrabeen Group
sandstone, Sydney Basin, N e w South Wales. PhD thesis, University of Sydney,
Sydney (unpubl.).
Bamberry, W.J., 1992. Stratigraphy and sedimentation of the Late Permian Illawarra
Coal Measures, southern Sydney Basin, New South Wales. PhD thesis, University
of Wollongong, Wollongong (unpubl.).
Barton, M.E., 1988. The sedimentological control of bedding plane shear surfaces.
Proceedings of the 5th International Symposium on Landslides, pp. 73-76.
Balkema, Rotterdam.
Bell, D.H., and Pettinga, J.R., 1988. Bedding-control landslides in N e w Zealand soft
rock terrain. Proceedings of the 5th International Symposium on Landslides, pp.
77-83. Balkema, Rotterdam.
Bell, D.H., and Pettinga, J.R., 1984. Presentation of geological data. Proceedings of
the Symposium on Engineering for Dams and Canals, Alexandra. IPENZ Proc.
Tech. G p - N.Z. Geomechan. Soc. 9/49: 4.1-4.33.
Bell, F.G., 1983. Engineering Properties of Soil and Rock. Butterworths, London.
Bell, F.G., Cripps, J.C., and Culshaw, M.G., 1986. A review of the engineering
behaviour of soils and rocks with respect to groundwater. In: Cripps, J.C., Bell,
F.G., and Culshaw, M.G. (eds), Groundwater in Engineering Geology, pp. 1-23.
Geological Society of London, London.
Bell, F.G., 1993. Engineering Geology. Blackwell Scientific Publications, London.
Bhandari, R.K., Senanayake, K.S., and Thayalan, N., 1991. Pitfall in the prediction
on landslide through rainfall data. Proceedings 6th International Symposium on
Landslides, pp. 887-890. Balkema, Rotterdam.
Bhandari, R.K., and Thayalan, N., 1994. Landslides and other mass movements
including failure of cuttings in residual soils of Sri Lanka. National Symposium

242
on Landslides in Sri Lanka, pp. 73-82. National Building Research Organisation,
Ministry of Housing, Colombo.
Bieniawski, Z.T., 1975. The point load test in geotechnical practice. Engineering
Geology 9, 1-11.
Blatt, H., Middleton, G., and Murray, R., 1980. Origin of Sedimentary Rocks.
Prentice-Hall, Englewood Cliffs.
Blong, R.J., 1973. A numerical classification of selected landslides of the debris slide-
avalanche-flow type. Engineering Geology 7, 99-114.
Blong, R.J., and Eyles, G.O., 1989. Landslides: extent and economic significant in
Australia, N e w Zealand and Papua New Guinea. In: Brabb, E.E., and Harrod, B.L.
(eds), Landslides: extent and economic significance, pp. 343-353. Balkema,
Rotterdam.
Boggs, S., 1992. Petrology of Sedimentary Rocks. Maxwell Macmillan, N e w York.
Bowles, J.E., 1992. Engineering Properties of Soils and their Measurement. McGraw-
Hill, N e w York.
Bowman, H.N., 1972. Natural slope stability in the City of Greater Wollongong.
Geological Survey of New South Wales Report 14, 159-222.
Bowman, H.N., 1974. Geology of the Wollongong, Kiama, and Robertson 1:50,000
Sheets. N e w South Wales Geological Survey, Sydney.
Bowman, H.N., 1980. Southern Coalfield, upper Shoalhaven Group and Illawarra Coal
Measures. New South Wales Geological Survey Bulletin 26, 116-132.
Branagan, D.F., and Packham, G.H., 1967. Field Geology of New South Wales.
Science Press, Sydney.
Branagan, D.F., 1985. An overview of the geology of the Sydney region. In: Pells,
P.J.N, (ed.), Engineering Geology of the Sydney Region, pp. 3-46. Balkema,
Rotterdam.
Branagan, D.F., Mills, K.J., and Norman, A.R., 1988. Sydney faults: facts and
fantasies. Proceeding of the 22nd Newcastle Symposium, Advances in the Study
of the Sydney Basin, pp. 111-118. University of Newcastle, Newcastle.
Branagan, D.F., and Pedram, H., 1990. The Lapstone structure complex, N e w South
Wales. Australian Journal of Earth Sciences 37, 23-36.
Brand, E.W. 1993. Landslides in Hong Kong caused by the severs rainfall event of
8 May 1992. Landslide News 7, 9-11.
Broch, E., and Frankline, J.A., 1972. The point load strength test. International
Journal of Rock Mechanics and Mining Sciences 9, 669-697.
243
Brown, I.R., 1974. The stability of slopes in Tertiary sedimentary rocks of N e w
Zealand. New Zealand Geomechanics Society. Proceedings of the Symposium on
the Stability of slopes in natural ground, 7.23-7.33.
Brunsden, D., 1979. Weathering. In: Embleton, C. and Thomas, J. (eds), Process in
Geomorphology, pp. 73-129. Edward Arnold, London.
Canuti, P., Casagli, N., and Garzonio, C.A., 1993. Slope instability at a historical
site La Verva Monastery, Italy. Landslide News 7, 11-14.
Carr, P.F., 1983. A reappraisal of the stratigraphy of the upper Shoalhaven Group and
lower niawarra Coal Measures, southern Sydney Basin, N e w South Wales.
Proceedings of the Linnean Society of New South Wales 106, 287-297.
Carson, M.A., 1969. Models of hillslope development under mass failure.
Geographical Analysis 1, 77-100.
Carson, M.A., 1972. Hillslope Form and Process. Cambridge, London.
Cascini, L., Critelli, S., Nocera, S.D., Gulla.G., and Matano, F., 1994. Weathering
and landsliding in Slia Massif gneiss (Northern Calabria, Italy). Seventh Congress
of the International Association of Engineering Geology, pp. 1613-1622. Balkema,
Rotterdam.
Chandler, R.J., 1974. Lias clay, the long-term stability of cutting slopes.
Geotechnique 24, 21-38.
Chestnut, W., 1981. Wollongong-Port Hacking 1:100,000 Sheet. Engineering
geological consideration and environmental geological hazards. Geological Survey
N e w South Wales, Report GS81/202 (unpubl).
Chowdhury, R.N., 1976. Mechanism of natural slope failures in the Greater
Wollongong area of N e w South Wales. Search 7, 396-397.
Chowdhury, R.N., 1980. Landslides as natural hazards - mechanisms and uncertainties.
Geotechnical Engineering 11, 135-180.
Chowdhury, R.N., and Young, A.R.M., 1987. Field guide to slope instability in the
Wollongong-Picton-Nattai Region of New South Wales. Fifth International
Conference and Field Workshop on Landslides. University of Wollongong,
Wollongong.
Cleary, J.R., and Doyle, H.A., 1962. Application of a seismograph network and
electronic computer in near earthquake studies. Bulletin Seismic Society American
52, 673-682.
Coates, D.R., 1990. The relation of subsurface water to downslope movement and
failure. In: Higgins, C.G., and Coates, D.R., (eds), Groundwater Geomorphology;
244
The Role of Subsurface Water in Earth-Surface Processes and Landforms, pp. 51-
76. The Geological Society of America.
Colback, P.S.B., and Wild, B.L., 1965. The influence of moisture content on the
compressive strength of rocks. Proceedings of the 3rd Canadian Rock Mechanics
Symposium, pp. 65-83. Toronto.
Conaghan, P.J., and Jones, J.G., 1975. The Hawkesbury Sandstone and the
Brahmaputra: a depositional model for continental sheet sandstones. Journal of
Geological Society of Australia 22, 275-283.
Conaghan, P.J., 1980. The Hawkesbury Sandstone: gross characteristics and
depositional environment. New South Wales Geological Survey Bulletin 26, 188-
253.
Connelly, M.A., 1970. A geological structural assessment at Appin Colliery with
reference to roof failure and directional mining. Proceedings of the Australasian
Institute of Mining and Metallurgy 234, 17-26.
Conolly, J.R., and Ferm, J.C., 1971. Permo-Triassic sedimentation patterns, Sydney
Basin, Australia. American Association of Petroleum Geologists Bulletin 55, 2018-
2032.
Cook, A.C., and Johnson, K.R., 1970. Early joint formation in sediments. Geological
Magazine 107, 361-368.
Crawford, E.A., Herbert, C , Taylor, G., Helby, R., Morgan, R., and Ferguson,
J., 1980. Diatremes of the Sydney Basin. New South Wales Geological Survey
Bulletin 26, 294-323.
Cripps, J.C., and Taylor, R.K., 1981. The Engineering properties of mudrocks.
Quarterly Journal of Engineering Geology 14, 325-346.
Crozier, M.J., 1986. Landslides: Causes, Consequences and Environment. Croom
Helm, London.
Cruden, D.M., and Xian-Qin Hu, 1994. Topple on underdip slopes in the Highwood
Pass, Alberta, Canada. Quarterly Journal of Engineering Geology 27, 57-68.
Culshow, M.G., and Bell, F.G., 1991. The rockfalls of James Valley, St Helena.
Proceedings of the Sixth International Symposium on Landslide, pp. 925-935.
Balkema, Rotterdam.
David, T.W.E., 1896. Summary of our present knowledge of the structure and origin
of the Blue Mountains of New South Wales. Journal and Proceedings of the
Royal Society of New South Wales 30, 33-69.
245
Dearman, W.R., 1974. Weathering classification in the characterisation of rock for
engineering purposes in British practice. Bulletin of the International Association
of Engineering Geology 9, 33-42.
Dearman, W.R., 1976. Weathering classification in the characterisation of rock.
Bulletin of the International Association of Engineering Geology 13, 123-127.
Dearman, W.R., and Fookes, P.G., 1974. Engineering geological mapping for civil
engineering practice in the United Kingdom. Quarterly Journal of Engineering
Geology 7, 223-256.
Deere, D.U., and Patton, F.D., 1971. Slope stability in residual soils. Proceedings
of the Fourth Panamerican Conference on Soil Mechanics and Foundation
Engineering, pp. 87-170. American Society of Civil Engineers, N e w York.
Denham, D. 1976. Effects of the 1973 Picton and other earthquakes in eastern
Australia. Bureau of Mineral Resources, Geology and Geophysics, Bulletin 164.
Denham, D., 1979. Earthquake hazard in Australia. Proceeding of a Symposium on
Natural Hazards in Australia, pp. 94-118. Australian Academy of Science,
Canberra.
Denham, D., 1980. The 1961 Robertson earthquake - more evidence for compressive
stress in southern Australia. BMR Journal of Australian Geology and Geophysics
5, 153-156.
Denham, H.A., Weeks, J., and Krayshek, C , 1981. Earthquake evidence for
compressive stress in southern Australian crust. Journal of the Geological Society
of Australia 28, 323-332.
Dick, J.C., and Shakor, A., 1992. Lithological control of mudrock durability.
Quarterly Journal of Engineering Geology 25, 31-46.
Dickinson, W.R. 1985. Interpreting provenance relation from detrital modes of
sandstones. In: Zuffa, G.G. (ed.), Provenance of Arenites, pp. 333-361. D.
Reidel, Dordrecht.
Dickinson, W.R., and Suczak, C.A., 1979. Plate tectonics and sandstone compositions.
American Association of Petroleum Geologists Bulletin 63, 2164-2182.
Dickson, T.W., and Weber, C.R., 1966. Investigation of roof fall in Oakdale State
Mine. New South Wales Geological Survey Report 44.
Dobereiner, L., and Freitas, M.H., 1986. Geotechnical properties of weak sandstones.
Geotechnique 36, 79-94.
Dolye, H.A., Clearly, J.R., and Gray, N.M., 1968. The seismicity of the Sydney
Basin. Journal of the Geological Society of Australia 15, 175-181.

246
Dumitru, T.A., Hill, K.C., Coyle, D.A., Duddy I.R., Foster, D.A., Gleadow, A.J.W.,
Green, P.F., Kohn, B.P., Laslett, G.M., and O'Sullivan, A.J., 1991. Fission
track thermochronology application to continental rifting of south-eastern Australia.
Australian Petroleum Exploration Association Journal 31, 131-142.
Dunkerely, D.L., 1976. A study of long-term slope stability in the Sydney Basin,
Australia. Engineering Geology 10, 1-12.
Dyke, C.G., and Dobereiner, L., 1991. Evaluating the strength and deformability of
sandstones. Quarterly Journal of Engineering Geology 24, 123-134.
Early, K., and Skempton, A.W., 1972. Investigation of the landslide at Walton's
Wood, Staffordshire. Quarterly Journal of Engineering Geology 5, 19-41.
East, T.J., 1978. Mass movement landforms in Baroom Pocket, south-east Queensland:
a study of form and process. Queensland Geographical Journal 4, 37-67.
Evans, R.S., 1978. Time dependent factors influencing the rock slope stability of the
Illawarra Escarpment, N e w South Wales. PhD thesis, University of N e w South
Wales, Sydney (unpubl.).
Evans, R.S., 1981. An analysis of secondary toppling rock failures - the stress
redistribution method. Quarterly Journal of Engineering Geology 14, 77-86.
Everingham, I.B., Denham, D., and Greenhalgh, S.A., 1987. Surface wave
magnitudes of some early Australian earthquakes. BMR Journal of Australian
Geology and Geophysics 10, 253-259.
Fell, R., 1985. Slope stability in the Wianamatta Group. In: Pells, P.J.N.(ed.),
Engineering Geology of the Sydney Region, pp. 163-175. Balkema, Rotterdam.
Ferguson, H.F., and Hamel, J.V., 1981. Valley stress relief in flat-lying sedimentary
rocks. Proceedings of the International Symposium on Weak Rocks, pp. 1235-
1240. Balkema, Rotterdam.
Flentje, P., 1996. Assessment of slope stability in the Illawarra. PhD thesis, University
of Wollongong, Wollongong (in preparation).
Folk, R.L., 1980. Petrology of Sedimentary Rocks. Hemphill Publishing Company,
Austin.
Fookes, P.G., 1967. Site Investigation of the Siwalik Clay Bedrock, Mangla Dam.
PhD thesis, University of London, London (unpubl.).
Fookes, P.G., and Sweeney, M., 1976. Stabilisation and control of local rock falls and
degrading rock slopes. Quarterly Journal of Engineering Geology 9, 37-55.
Fookes, P.G., Gourly, C.S., and Ohikere, C , 1988. Rock weathering in engineering
time. Quarterly Journal of Engineering Geology 21, 33-57.

247
Franklin, J.A., and Chandra, R., 1972. The slake-durability test. International
Journal of Rock Mechanics and Mining Sciences 9, 325-341.
Frankline, J.A., and Dussealts, M.B., 1989. Rock Engineering. McGraw-Hill, N e w
York.
Fredrich, J., McCaffrey, R., and Denham, D., 1988. Source parameters of large
Australian earthquakes from body wave form inversion. Geophysical Journal 95,
1-13.
Gamble, J.C., 1971. Durability-plasticity classification of shales and other argillaceous
rocks. PhD thesis, University of niinois, niinois (unpubl.).
Geological Society Engineering Group Working Party, 1972. The preparation of
maps and plans in terms of engineering geology. Quarterly Journal of
Engineering Geology 5, 293-381.
Ghayoumian, J., Nakajima, S., Fatemi, S.M., and Ozaki, M., 1993. Weathering
characteristics of slate and green rocks. In: Anagnostopoulos et al (eds),
Geotechnical Engineering of Hard Soils-Soft Rocks, pp. 105-112. Balkema,
Rotterdam.
Ghafoori, M., Airey, D.W., and Carter, J.P., 1994. The durability of Ashfield Shale.
Seventh Congress of the International Association of Engineering Geology, pp.
3315-3321. Balkema, Rotterdam.
Ghobadi, M . H . and Pitsis, S.E., 1993. Notes for technical tour TT3 - Urban slope
stability. Compiled by Chowdhury, R.N. International Conference on
Environmental Management Geo-Water and Engineering Aspects. University of
Wollongong, Wollongong.
Ghobadi, M.H., 1994. Landsliding in the northern Illawarra, N e w South Wales.
Geological Society of Australia Abstracts.
Ghobadi, M.H., 1994. Geology and slope stability in the northern Illawarra, N e w
South Wales, Australia. Seventh Congress of the International Association of
Engineering Geology, pp. 1307-1314. Balkema, Rotterdam.
Ghosh, D.K., and Srivastava, M., 1991. Point load strength: an index for classification
of rock material. Bulletin of the International Association of Engineering Geology
44, 27-33.
Gillott, J. 1989. Clay in Engineering Geology. Elsevier, Amsterdam.
Glawe, U., Zika, P., Zvelebil, M., and Rybar, J., 1993. Time prediction of a rockfall
in the Carnic Alps. Quarterly Journal of Engineering Geology 26, 185-192.
248
Gray, N.M., 1976. Geological appreciation of the seismicity of the southern portion
of the Sydney Basin. Bureau of Mineral Resources, Geology and Geophysics,
Bulletin 164, 9-10.
Gray, N.M., 1982. Direction of stress, southern Sydney Basin. Journal of the
Geological Society of Australia 29, 277-284.
Gray, R.E., Ferguson, H.F., and Hamel, J.V., 1979. Slope stability in the
Appalachian Plateau, Pennsylvania and West Virginia, USA. In: Voight, B. (ed.),
Rockslides and Avalanches, pp. 447-471. Elsevier, Amsterdam.
Greenhalgh, S.A., Denham, D., McDougall, R., and Rynn, J.M., 1989. Intensity
relations for Australian earthquakes. Tectonophysics 166, 255-267.
Greminger, M., 1982. Experimental studies of the influence of rock anisotropy on size
and shape effects in point load testing. International Journal of Rock Mechanics
and Mining Sciences and Geomechanics, Abstract 19, 241-246.
Grice, R.H., Kim, C.S., and Brown, G.R., 1982. Relationship of texture, composition
and absorption properties to the weathering of mudrocks. Geological Survey of
Canada, Paper 82-1A, 359-367.
Grim, R.E., 1962. Applied Clay Mineralogy. McGraw-Hill, N e w York.
Grim, R.E., 1968. Clay Mineralogy. McGraw-Hill, N e w York.
Guadagno, F.M., Mele, R., and Bassi, M.T., 1994. Slope instabilities and geological
conditions in the Sant' Arcangelo Basin (Southern Italy). Seventh Congress of the
International Association of Engineering Geology, pp. 1557-1562. Balkema,
Rotterdam.
Guidicini, G., and Iwasa, O.Y., 1977. Tentative correlation between rainfall and
landslides in a humid, tropical environment. Bulletin International Association
Engineering Geology 16, 13-18.
Gunsallus, K.L., and Kulhawy, F.H., 1984. A comparative evaluation of rock strength
measures. International Journal of Rock Mechanics and Mining Sciences and
Geomechanics 21, 233-248.
Hallbauer, D.K., Nieble, C , Berard, J., Rummel, F., Houghton, A., Broch, E., and
Szlavin, J., 1978. Suggested methods for petrographic description, ISRM
commission on standardisation of laboratory and field tests. International Journal
of Rock Mechanics and Mining Sciences and Geomechanics, Abstracts 15, 41-
45.
Hamel, J.V., 1969. Stability of slopes in soft, altered rocks. PhD thesis, University
of Pittsburgh, Pennsylvania (unpubl.).
249
Hamel, J.V., 1980. Geology and slope stability in Western Pennsylvania. Bulletin of
the Association of Engineering Geologists 17, 1-26.
Hamel, J.V., and Adams, J.R., 1974. Discussion on some field examples of toppling
failure. Geotechnique 24, 691-693.
Hamel, J.V., and Adams, W.R., 1981. Claystone slides, interstate route 79, Pittsburgh,
Pennsylvania, USA. Proceedings International Symposium on Weak Rocks, pp.
549-553. Balkema, Rotterdam.
Hancox, G.T., 1974. Geological aspects of slope stability. New Zealand Geomechanics
Society. Proceedings of the Symposium on the Stability of slopes in natural
ground, 4.1-4.13.
Haney, M.G., and Shakoor, A., 1994. The relationship between tensile and
compressive strengths for selected sandstones as influenced by index properties and
petrographic characteristics. Seventh Congress of the International Association of
Engineering Geology, pp. 493-500. Balkema, Rotterdam.
Hanlon, F.N., 1952. Southern Coalfield coal seams. Geological Survey New South
Wales Report 46 (unpubl.).
Hanlon, F.N., 1953. Southern Coalfield, geology of the Stanwell Park-Coledale area.
Technical Report, Department of Mines, New South Wales 1, 20-35.
Hanlon, F.N., 1958. Presidential address. Geology and transport with special
references to landslides on the near South Coast of N e w South Wales. Journal
and Proceedings of the Royal Society of New South Wales 92, 2-15.
Hardy, R., and Tucker, M., 1989. X-ray powder diffraction of sediments. In: Tucker,
M . (ed.), Technique in Sedimentology, pp. 191-228. Blackwell Scientific
Publications, London.
Harper, L.F., 1915. Geology and mineral resources of the Southern Coalfield. New
South Wales Geological Survey Memoir 7.
Hawkins, A.B., Lawrence, M.S., and Privett, K.D., 1988. Implication of weathering
on the engineering properties of the Fuller's Earth Formation. Geotechnique 38,
517-532.
Hawkins, A.B., and McConnell, B.J., 1991. Influence of geology on geomechanical
properties of sandstones. Proceedings of the International Society for Rock
Mechanics, pp. 257-260. Balkema, Rotterdam.
Hawkins, A.B., and McConnell, B.J., 1991. Sandstone as geomaterial. Quarterly
Journal of Engineering Geology 24, 135-142.
250
Hawkins, A.B., and McConnell, B.J., 1992. Sensitivity of sandstone strength and
deformability to changes in moisture content. Quarterly Journal of Engineering
Geology 25, 115-130. Hawkins, A.B., and MacDonald, B.J., 1992. Decalcification and residual strength
reduction in Fuller's Earth Clay. Geotechnique 42, 453-464.
Hawkins, A.B., and Pinches, M., 1992. Engineering description of mudrocks.
Quarterly Journal of Engineering Geology 25, 17-30.
Helby, R., 1973. Review of Late Permian and Triassic palynology of N e w South
Wales. Geological Society of Australia Special Publication 4, 141-155.
Herbert, C , 1980a. Depositional development of the Sydney Basin. New South Wales
Geological Survey Bulletin 26, 10-52.
Hilleard, P.R., 1993. Bedrock movement and the failure of Stanwell Park Railway
via'duct. In: McNally, G.H., Knight,M., and Smith, R., (eds), Collected Case
Studies in Engineering Geology, Hydrology and Environmental Geology, pp. 1-
27. Butterfly Books, Sydney.
Hoek, H., 1971. Influence of rock structure on the stability of rock slopes.
Proceedings of the First International Conference on Stability in Open Pit Mining,
pp. 49-63. The American Institute of Mining, Metallurgical, and Petroleum
Engineers, N e w York.
Hoek, E., and Bary, J.W., 1981. Rock Slope Engineering. The Institute of Mining
and Metallurgy, London.
Hopkins, T.C, and Deen, R.C., 1984. Identification of shales. Geotech. Testing
Journal 7/1, 10-18.
Huang, R.Q., Zhang, Z.Y., and Wang, S.T., 1994. Engineering geological studies of
creeping rock slopes. Seventh Congress of the International Association of
Engineering Geology, pp. 1401-1407. Balkema, Rotterdam.
Hudec, P.P, 1976. Development of durability tests for shales in embankment and
swamp backfills, Ontario. Ontario Ministry of Transportation and
Communications, Research Report 216.
Hutchinson, J.N., 1968. Mass movement. In Fairbridge, R.W. (ed.), Encyclopaedia
of Geomorphology (Encyclopaedia of Earth Sciences Series III), pp. 688-695.
Reinhold Pubs, N e w York.
Hutchinson, J.N., 1988. General report: morphological and geotechnical parameters of
landslides in relation to geology and hydrogeology. Proceedings of the 5th
International Symposium on Landslides, pp. 3-35. Balkema, Rotterdam.
251
Hutchinson, J.N., and Bhandari, R.K., 1971. Undrained loading: a fundamental
mechanism of mudflows and other mass movement. Geotechnique 21, 353-358.
Hutton, A.C., Ferguson, C.L., and Jones, B.G., 1990. Landslip in the northern
Illawarra Coalfield. Proceedings of the 23th Newcastle Symposium, Advances in
the Study of the Sydney Basin, pp. 37-44. University of Newcastle, Newcastle.
Hutton, A.C., Jones, B.G., Bamberry, W.J., Odins, P. and Clark, B., 1990. The
distribution and evaluation of coal in the southern Sydney Basin, N E R D D P Final
Report, Project 1019, Volume 2. University of Wollongong, Wollongong.
ISRM, 1985. Suggested method for determining point load strength. International
Journal of Rock Mechanics and Mining Sciences and Geomechanics, Abstract 22,
51-60.
Jakeman, B.L., 1980. The relationship between the formation structure and thickness
in Permo-Triassic succession of the southern coalfield, Sydney Basin, N e w South
Wales, Australia. Journal of Mathematical Geology 12, 185-212.
Jeffrey, CD., and Shakor, A., 1990. The effects of lithological characteristics on
mudrock durability. Sixth Congress of the International Association of Engineering
Geology, pp. 3061-3066. Balkema, Rotterdam.
Jenkins, C.J., Keene, J.B., Helby, R. and Seismic cruise 112B shipboard party,
1993. Proceedings of the 25th Newcastle Symposium, Advances in the Study of
the Sydney Basin, pp. 12-21. University of Newcastle, Newcastle.
Jones, B.G., 1990. The Shoalhaven Group: implications for subsequent coal measures
deposition in the southern Sydney Basin. In: Hutton, A.C., and Depers, A.M.,
(eds), Proceedings of the Southern and Western Coalfields of Sydney Basin
Workshop 3, pp. 11-19. University of Wollongong, Wollongong.
Jones, B.G., and Rust, B.R., 1983. Massive sandstone facies in the Hawkesbury
Sandstone, a Triassic fluvial deposit near Sydney, Australia. Journal of
Sedimentary Petrology 53, 1249-1259.
Jones, J.G., and Veevers, J.J., 1983. Mesozoic origins and antecedents of Australia's
Eastern Highlands. Journal of the Geological Society of Australia 30, 305-322.
Kanji, M.A., 1974. The relationship between drained friction angles and Atterberg
limits of natural soils. Geotechnique 24, 671-674.
Keefer, D.K., 1984. Landslides caused by earthquakes. Geological Society of America
Bulletin 95, 406-421.
Keller, W., 1957. The Principles of Chemical Weathering. Lucas Bros, Columbia.
252
Kelley, D.R., 1971. Basic geological factors in landsliding and rockfalls of the
Pittsburgh region, Pennsylvania. Pennsylvanian Geological Survey, Open File
Report, 47p.
Kembla Coal & Coke Pty Ltd, 1990. Geotechnical study for underground
development, West Cliff Colliery assessment - borehole IL57. Report 253/16,
(unpubl).
Kembla Coal & Coke Pty Ltd, 1991. Geotechnical study for underground
development, West Cliff Colliery assessment - borehole IL64. Report 253/18,
(unpubl).
Kendall, P.F., and Briggs, H., 1933. The formation of rock joints and the cleat of
coal Proceedings of the Royal Society of Edinburgh 53, 164-187.
Kenney, T.C., 1967. The influence of mineral composition on the residual strength of
natural soils. Proceedings of the Geotechnical Conference, pp. 123-129. Oslo.
Kulhawy, F.H., and O'Rourke, T.D., 1981. Rock mass response and machine
performance in a full-face T B M tunnel in Rochester. Proceeding of the RETC,
San Francisco.
Lewis, D.W., and McConchie, D., 1994. Analytical Sedimentology. Chapman and
Hall, London.
Lindholm, R., 1987. A Practical Approach to Sedimentology. Unwin Hyman, London.
Longmac Associates Pty Ltd, 1991. Recent instability problems 1989-1990. Report
for State Rail Authority of New South Wales (unpubl).
Loughnan, F.C., 1963. A petrological study of a vertical section of the Narrabeen
Group at Helensburgh, New South Wales. Journal of the Geology Society of
Australia 10, 177-192.
Lumb, P., 1966. The variability of natural soils. Canadian Geotechnical Journal 3,
74-97.
Mauger, A.J., Huntington, J.F., and Cressy, J.W., 1983. Report to N E R D D C Grant
No. 81/1357. Commonwealth Scientific and Industrial Research Organisation,
Division of Mineral Physics, Sydney (unpubl).
Mayne, S.J., Nicholas, E., Bigg-Wither, A.L., Rasidi, J.S., and Raine, M.J., 1974.
Geology of the Sydney Basin - a review. Bureau of Mineral Resources, Geology
and Geophysics, Bulletin 149.
McCue, K., Wesson, V., and Gibson, G., 1990. The Newcastle, N e w South Wales,
earthquake of 28 December 1981. BMR Journal of Australian Geology and
Geophysics 11, 559-597.
253
McElroy, C.T., 1954. Petrology of sandstones of the southern coalfield. M S c thesis,
University of Sydney, Sydney (unpubl).
McNally,G.H., 1993. Effects of weathering on the engineering properties of the
Terrigal Formation. In: McNally, G.H., Knight, M., and Smith, R. (eds), Collected
Case Studies in Engineering Geology, Hydrology and Environmental Geology, pp.
92-101. Butterfly Book, Sydney.
Melchers, R.E. (ed.), 1990. Newcastle Earthquake Study. The Institution of Engineers,
Canberra.
Memarian, H., 1993. Fracture history of Coal Cliff Sandstone in Coalcliff area, N e w
South Wales. Proceedings of the 27th Newcastle Symposium, Advances in the
Study of the Sydney Basin, pp. 113-121. University of Newcastle, Newcastle.
Mencel, V., 1974. Engineering geological importance and possible origin of the stress
relief of the rocks of the Cordillera Blanca, Peru. Bulletin of the International
Association Engineering Geology 9, 69-74.
Merril, G.P., 1897. A Treatise on Rocks, Rock Weathering and Soil. Macmillan,
London.
Merritt, A.H., and Baecher, G.B., 1981. Site characterisation in rock engineering.
Proceedings of the 22nd Symposium Rock Mechanics, pp. 47-63. Balkema,
Rotterdam, Cambridge.
Michael-Leiba, M.O., 1989. Macroseismic effects, locations and magnitudes of some
early Tasmanian earthquakes. BMR Journal of Australian Geology and Geophysics
11, 89-99.
Midgley, H.G., 1951. Chalcedony and flint. Geological Magazine 88, 179-184.
Mitchell, J.K., 1976. Fundamentals of Soil Behaviour. John Wiley and Sons, N e w
York.
Moore, M.E., Gleadow, A.J.W., and Lovering, J.F., 1986. Thermal evolution o
rifted continental margins: new evidence from fission tracks in basement apatite
from southern Australia. Earth and Planetary Science Letters 78, 255-270.
Morgenstern, N.R., 1967. Shear strength of stiff clay. Proceedings of the
Geotechnical Conference, pp. 59-76. Oslo.
Morris, R.C., Proctor, K.E. and Koch, M.R., 1979. Petrology and diagenesis of
deep-water sandstone. Society of Economic Palaeontologists and Mineralogists
Special Publication 26, 263-279.
Mostyn, G.R., and Adler, M.A., 1991. Design of the remedial works for the Coledale
Landslide. Proceedings of the Sixth International Symposium on Landslides, pp.
791-796. Balkema, Rotterdam.
254
Nakano, R., 1967. O n the weathering and change of Tertiary mudstone related to
landslides. Soil and Foundations 7, 11-14.
Nichols, T.C., 1980. Rebound, its nature and its effects on engineering works.
Quarterly Journal of Engineering Geology 13, 133-152.
Norman, A.R., and Branagan, D.F., 1984. Sydney faults: more conundrums?
Proceedings of the 18th Newcastle Symposium, Advances in the Study of the
Sydney Basin, pp. 125-127. University of Newcastle, Newcastle.
Norris, R.M., and Bock,W., 1990. Erosion of seacliffs by groundwater. In: Higgins,
C.G., and Coates, D.R., (eds), Groundwater Geomorphology; The Role of
Subsurface Water in Earth-Surface Processes and Landforms, pp. 283-317. The
Geological Society of America.
Odins, P., Bamberry, J., Hutton, A., Jones, B., and Organ, M., 1990. Petrology of
sandstones and other rocks in the Illawarra Coal Measures. In: Hutton, A.C., and
Depers, A.M., (eds), Proceedings of the Southern and Western Coalfields of the
Sydney Basin Workshop, pp. 59-70. University of Wollongong, Wollongong.
Olivier, H.J., 1980. Some aspects of the influence of mineralogy and moisture
redistribution on the weathering behaviour of mudrocks. Proceedings of the
Fourth International Congress of Rock Mechanics, pp. 1-8. Balkema, Rotterdam.
Olivier, H.J., 1990. Some aspects of the engineering-geological properties of swelling
and slaking mudrocks. Sixth Congress of the International Association of
Engineering Geology, pp. 707-712. Balkema, Rotterdam.
Olivier, M., Bell, F.G., and Jermy, C.A., 1994. The effect of rainfall on slope failure,
with examples from the greater Durban area. Seventh Congress of the
International Association of Engineering Geology, pp. 1629-1636. Balkema,
Rotterdam.
Oilier, CD., 1982. The great escarpment of eastern Australia: tectonic and geomorphic
significance. Journal of the Geological Society of Australia 29, 13-23.
Oilier, CD., 1984. Weathering Geomorphology Texts. Oliver and Boyd, Edinburgh.
Patton, F.D., and Deere, D.U., 1970. Significant geologic factors in rock slope
stability. In: Van Rensburg, P.W.J, (ed.), Planning Open Pit Mines, pp. 143-
151. Johannesburg.
Patton, F.D., and Deere, D.U., 1971. Geological factors controlling slope stability in
open pit mines. Proceedings of the First International Conference on Stability in
Open Pit Mining, pp. 23-47. The American Institute of Mining, Metallurgical, and
Petroleum Engineers, N e w York.
255
Patton, F.D., and Hendron, A.J., 1974. General report on mass movements.
Proceedings of the Second International Congress of the International Association
of Engineering Geology, pp. 1-57. Sao Paulo.
Pells, P.J.N., 1985. Engineering properties of rocks in the Narrabeen Group. In: Pells,
P.J.N. (ed.), Engineering Geology of the Sydney Region, pp. 205-211. Balkema,
Rotterdam.
Pettijohn, F.J., Potter, P.E., and Siever, R., 1987. Sand and Sandstone. Springer-
Verlag, Berlin.
Pettinga, J.R., 1987a. The Waipoapoa landslide, a deep-seated complex block slide in
Tertiary weak rock flysch, southern Hawke's Bay, N e w Zealand. New Zealand
Journal of Geology and Geophysics 30, 401-414.
Pettinga, J.R., 1987b. Ponui landslide, a deep-seated wedge failure in Tertiary weak
rock flysch, southern Hawke's Bay, New Zealand. New Zealand Journal of
Geology and Geophysics 30, 415-430.
Pettinga, J.R., Bell, D.H., 1991. Engineering geological assessment of slope instability
for rural land-use, Hawke's Bay, N e w Zealand. Proceedings of the Sixth
International Symposium on Landslides, pp. 1467-1480. Balkema, Rotterdam.
Philbrick, S.S., 1960. Cyclic sediments and engineering geology. Proceedings of the
21st International Geological Congress, 49-63.
Picard, M.D., 1971. Classification of fine grained sedimentary rocks. Journal of
Sedimentary Petrology 41, 179-195.
Pitsis, S.E., 1992. Slope instability along the niawarra escarpment. M S c thesis,
University of N e w South Wales, Sydney (unpubl).
Potter, P.E., Maynard, J.B., and Pryor, W.A., 1979. Sedimentology of Shale.
Springer-Verlag, N e w York.
Price, N.J., 1963. The influence of geological factors on strength of coal measures
rocks. Geological Magazine 100, 428-443.
Pritchard, M.A., Savigny, K.W., and Evans, S.G., 1990. Toppling and deep-seated
landslides in natural slopes. In: Rossmanith, H.P. (ed.), Mechanics of Jointed and
Fractured Rocks, pp. 937-942. Balkema, Rotterdam.
Ramana, Y.V., and Gogte, P.S., 1982. Quantitative studies of weathering in
saprolitized charnockites associated with a landslip. Bulletin of the International
Association of Engineering Geology 19, 29-46.
Reiche, P., 1950. A survey of weathering processes and products. New Mexico
University Publication in Geology 3.
256
Rickwood, P.C, 1985. Igneous intrusives in the Greater Sydney Region. In: Pell,
P.J.N., (ed.), Engineering Geology of Sydney Region, pp. 215-307. Balkema,
Rotterdam.
Roberts, J., and Engel, B.A., 1987. Depositional and tectonic history of the southern
N e w England Orogen. Australian Journal of Earth Sciences 34, 1-20.
Rodrigues, J.D., and Jeremias, F.T., 1990. Assessment of rock durability through
index properties. Sixth Congress of the International Association of Engineering
Geology, pp. 3055-3060. Balkema, Rotterdam.
Russell, D.J., 1981. Controls on slake durability: the response of two Ordovician shales
in the slake durability test. Canadian Geotechnical Journal 19, 1-13.
Scheibner, E., 1987. Paleozoic development of eastern Australia in relation to the
Pacific region. In: Monger, J.W.H., and Franchetau, J. (eds), Circum-Pacific
orogenic belts and evolution of the Pacific Ocean basin. American Geophysical
Union Geodynamics Series 18, 133-165.
Scheibner, F., 1976. Explanatory notes on the Tectonic Map of New South Wales.
Scale 1: 1,000,000. Geological Survey of N e w South Wales, Sydney.
Selby, M.J., 1967. Aspects of the geomorphology of the greywacke ranges bordering
the lower and middle Waikato Basins. Earth Sciences Journal 1, 37-58.
Sharpe, C.F.S., 1938. Landslides and Related Phenomena. Colombia University Press,
N e w York.
Shaw, R.D., 1978. Seafloor spreading in the Tasman Sea: a Lord Howe Rise-eastern
Australian reconstruction. Australian Society of Exploration Geophysicists 9, 75-
81.
Shellshear, W., 1890. On the treatment of slips on the Illawarra railway at Stanwell
Park. Journal and Proceedings of the Royal Society of New South Wales 24, 58-
62.
Sherwin, L., and Holmes, G.G., 1986. Geology of the Wollongong and Port-Hacking
1:100,000 Sheets 9029, 9129. Geological Survey of N e w South Wales, Sydney.
Simpson, B., and Walton, G., 1970. Clay mylonites in the English Coal Measures:
their significance in opencast slope stability. Proceedings of the 1st International
Congress of Engineering Geology, pp. 1388-1393.
Skempton, A.W., 1953. Soil mechanics in relation to geology. Proceedings of the
Yorkshire Geological Society 29, 33-62.
Skempton, A.W., 1964. Long-term stability of clay slopes. Geotechnique 14, 77-
101.
257
Skempton, A.W., and Hutchinson, J.N., 1969. Stability of natural slopes and
embankment foundations. State-of-the Art Report. 7th Int. Conf. Soil Mech. &
Foundation Eng. Mexico, State-of-the-Art Vol, 290-340
Standard, J.C, 1969. The Sydney Basin, Triassic system, Hawkesbury Sandstone.
Journal of the Geological Society of Australia 16, 407-417.
State Rail Authority of N e w South Wales. 1982. Geotechnical report and
recommendations on stabilisation of the Coalcliff slip. State Rail Authority,
Sydney.
State Rail Authority of N e w South Wales, 1983. Geotechnical progress report and
remedial works in the Coalcliff tunnel. State Rail Authority, Sydney.
Stone, I.J., 1990. Geological assessment of coal mine roof conditions, southern Sydney
Basin. PhD thesis, University of Wollongong, Wollongong (unpubl).
Surendra, M., and Lovell, C.W., 1984. Estimation of clay minerals in clay shales by
X-ray diffraction techniques. Fifth International Conference on Expansive Soils,
pp. 27-31. The Institution of Engineers, Australia, National Conference Publication
No.84/3, Adelaide.
Taylor, R.K., and Spears, D.H., 1970. The breakdown of coal measures rocks.
International Journal of Rock Mechanics and Mining Sciences 7, 481-501.
Taylor, R.K., and Cripps, J.C, 1984. Mineralogical controls of volume change. In:
Arte we 11, P.B., and Taylor, R.K. (eds), Ground Movements and their Effects on
Structures. Surrey University Press.
Terzaghi, K., 1936. The stability of slopes in natural clay. Proceedings of the 1st
International Conference on Soil Mechanics and Foundation Engineering, pp. 161-
165. Cambridge.
Terzaghi, K., 1950. Mechanism of landslides. Geological Society of America, Berkley
Volume, 83-123.
Terzaghi, K., and Peck, R.B., 1967. Soil Mechanics in Engineering Practice. John
Wiley and Sons, N e w York.
Trotter, C M . , 1993. Weathering and regolith properties at an earthflow site.
Quarterly Journal of Engineering Geology 26, 163-178.
Tsidzi, K.E.N., 1991. Point load - uniaxial compressive strength correlation. Seventh
International Congress on Rock Mechanics, pp. 637-639. Balkema, Rotterdam.
Turk, N., and Dearman, W.R., 1986. Influence of water on engineering properties of
weathered rocks. In: Cripps, J.C, Bell, F.G., and Culshaw, M.G. (eds),
Groundwater in Engineering Geology, pp. 131-138. The Geological Society of
London, London.
258
Van Eechhout, E.M., 1976. The mechanisms of strength reduction due to moisture in
coal mine shales. International Journal of Rock Mechanics and Mining Sciences
13, 61-67.
Varnes, D.J., 1958. Landslide type and processes. In: Landslides and Engineering
practice. Highway Research Board, Washington, Special Report 29, 20-47.
Varnes, D.J., 1978. Slope movement types and processes. In: Schuster, R.L., and
Krizek, R.J. (eds), Landslides, Analysis and Control. National Academy of
Sciences, Washington, Special Report 176, 11-35.
Vaunat, J., 1994. Slope movement: A geotechnical perspective. Seventh Congress of
the International Association of Engineering Geology, pp. 1637-1646. Balkema,
Rotterdam.
Veevers, J.J., Powell, CMcA., and Roots, S.R., 1991. Review of seafloor spreading
around Australia. I. Synthesis of the patterns of spreading. Journal of the
Geological Society of Australia 38, 373-389.
Veevers, J.J., and Li, Z.X., 1991. Review of sea floor spreading around Australia. H.
Marine magnetic anomaly modelling. Australia Journal of Earth Sciences 38, 391-
408.
Voight, B., 1973. Correlation between Atterberg plasticity limits and residual shear
strength of natural soils. Geotechnique 23, 265-267.
Walker, B.F., Amaral, B., and MacGregor, J.P., 1987. Slope instability in the
Coledale area of the Illawarra Escarpment. In: Walker, B.F, and Fell, R. (eds),
Soil Slope Instability and Stabilisation, pp. 417-430. Balkema, Rotterdam.
Walker, P.H., 1960. A reconnaissance of the soils and land use of part of the South
Coast of N e w South Wales. Soils and Land Use Series 38. CSIRO Division of
Soils, Sydney.
Wallis, R.G., and Johnson, M., 1969. Hydrogeological study of the Sydney Basin.
Geological Survey New South Wales, Progress Report 11, 23-34.
Walton, R.J., Enever, J.R., and Windsor, C.R., 1990. Stress regime in the Sydney
Basin and its implications for excavation design and construction. The Institution
of Engineers, Australia, Tunnelling Conference, Sydney.
Waltz, J.P., 1971. A n analysis of selected landslides in Almeda and Contracosta
Counties, California. Bulletin of the Association Engineering Geologists 8, 153-
163.
Ward, C.R., 1971a. Mesozoic sedimentation and structure in the southern part of the
Sydney Basin: Narrabeen Group. PhD thesis, University of N e w South Wales,
Sydney (unpubl).
259
Ward, C.R., 1971b. Mineralogical change as marker horizons for stratigraphic
correlation in the Narrabeen Group of the Sydney Basin, N e w South Wales.
Journal and Proceedings of the Royal Society of New South Wales 104, 77-88.
Ward, C.R., 1972. Sedimentation in the Narrabeen Group, southern Sydney Basin,
N e w South Wales. Journal of the Geological Society of Australia 19, 393-409.
Ward, C.R., 1980. Notes on the Bulgo Sandstone and Bald Hill Claystone. New
South Wales Geological Survey Bulletin 26, 178-186.
Weissel, J.K., and Hayes, D.E., 1977. Evolution of the Tasman Sea reappraised.
Earth and Planetary Science Letters 36, 77-84.
Wellman, H.W., and Wilson, A.T., 1965. Salt weathering, a neglected geological
erosive agent in coastal and arid environments. Nature 205, 1097-1098.
Wellman, P., and McDougall, L., 1974. Potassium - argon ages on Cainozoic volcanic
rocks of N e w South Wales. Journal of the Geological Society of Australia 21,
247-272.
West, L.J., 1994. The Scarborough landslide. Quarterly Journal of Engineering
Geology 27, 3-6.
Wilson, R.G., Wright, E.A., Taylor, B.L., and Probert, D.H., 1958. Review of the
geology of the Southern Coalfield, New South Wales. Proceedings of the
Australasian Institute of Mining and Metallurgy 187, 81-104.
Wilson, S.D., 1959. Application of the principles of soil mechanics to open pit mining.
Quarterly Journal of the Colorado School of Mines 54.
Winters, D.M., 1972. Pittsburgh red beds: stratigraphy and slope stability in Allegheny
County, Pennsylvania. M S c thesis, University of Pittsburgh, Pennsylvania
(unpubl).
Young, A.R.M., 1976. The distribution, characteristics and stability of debris mantled
slopes in the northern Wollongong. M S c thesis, University of Wollongong,
Wollongong (unpubl).
Young, A.R.M., 1977. Characteristics and origin of coarse debris deposits near
Wollongong, N S W , Australia. Catena 4, 289-307.
Young, A.R.M., 1978. Influence of debris mantle and local climatic variations on
slope stability near Wollongong, Australia. Catena 5, 95-107.
Zaruba, Q., and Mencel, V., 1969. Landslides and Their Control. Elsevier,
Amsterdam.

FIGURES TO CHAPTER 1
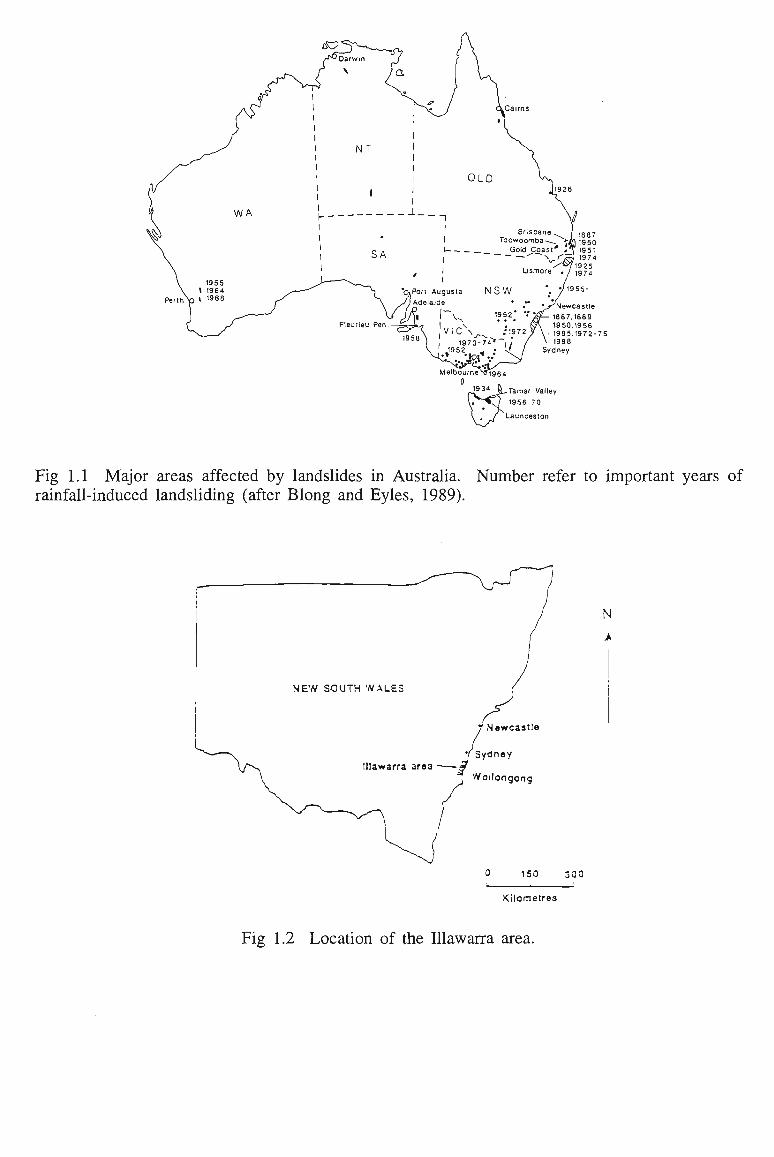
Newcastle 1887,1889 1950.1956 1985.1972-75
Tamar Valley
1956 70
Fig 1.1 Major areas affected by landslides in Australia. Number refer to important years of rainfall-induced landsliding (after Blong and Eyles, 1989).
N
Wollongong
0 150 300
Kilometres
Fig 1.2 Location of the Illawarra area.
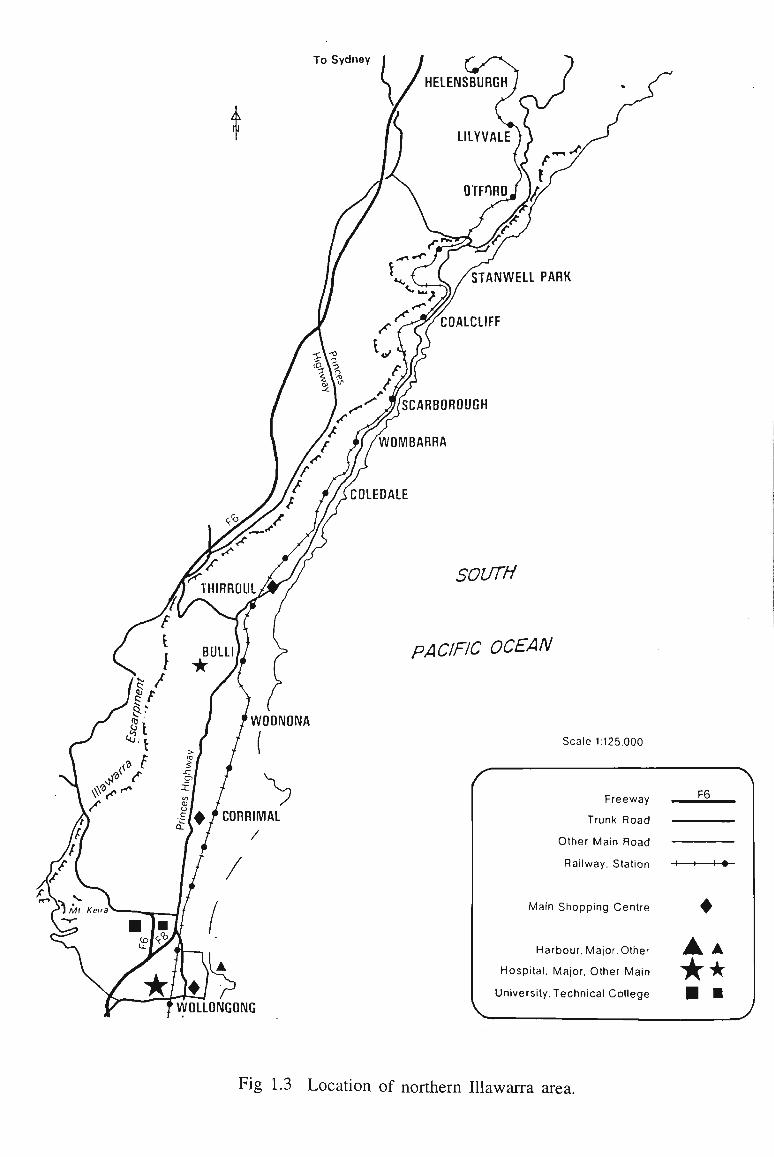
To Sydney
HELENSBURGH
LILYVALE
OTFORDJ 1^
STANWELL PARK
'<* <f
THIRROUL,
BULLI
/SCARBOROUGH
'WOMBARRA
SOUTH
PACIFIC OCEAN
'WOONONA
( Scale 1:125.000
Si •c I
CORRIMAL /
/
ffl^
WOLLONGONG
Freeway
Trunk Road
Other Main Road
Railway, Station
Main Shopping Centre
Harbour, Major, Other
Hospital. Major, Other Main
University, Technical College
F6
-t 1 - * -
A A
* •
Fig 1.3 Location of northern Illawarra area.

34°14W 150°550d 151°0000
34°14'00
34°1800 |34°18'00' 150°550p 151°00'00'
Fie 1.4 Topography of the specific area chosen for study showing the steep slope on the lower part of the escarpment and the lack of coastal plan.
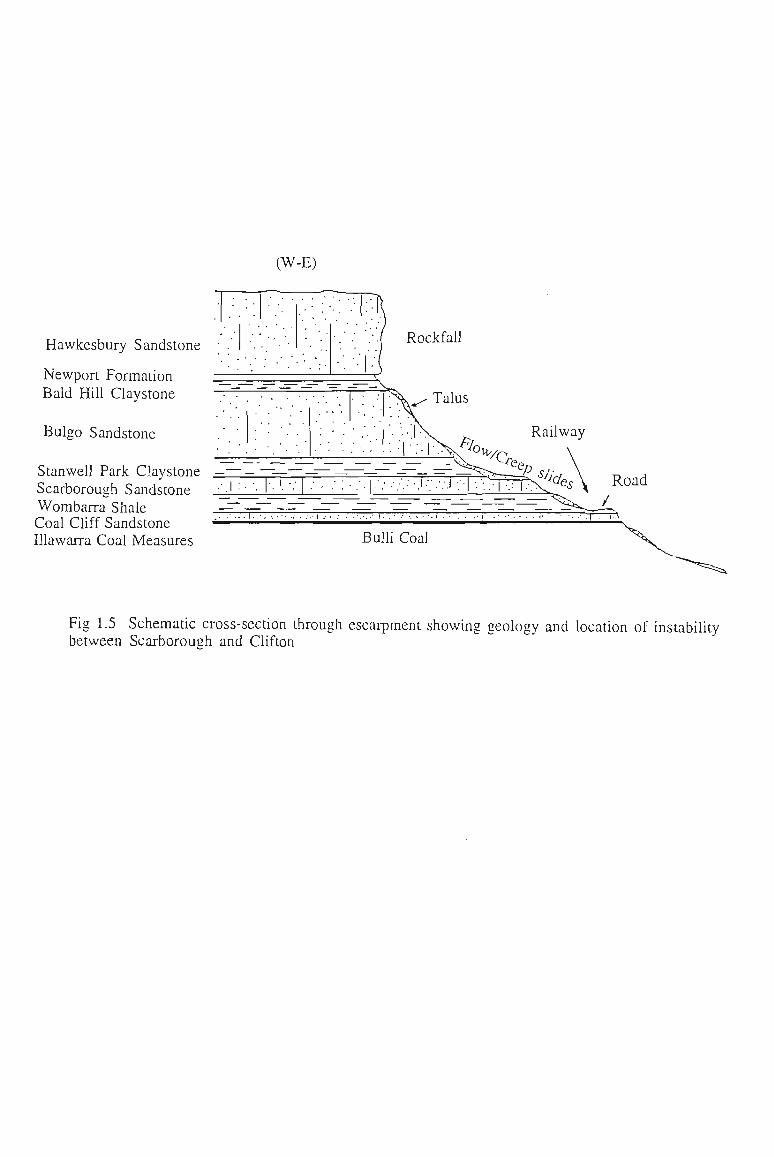
(W-E)
Hawkesbury Sandstone
Newport Formation Bald Hill Claystone
Bulgo Sandstone
Stanwell Park Claystone — — — Scarborough Sandstone Wombarra Shale Coal Cliff Sandstone Illawarra Coal Measures Bulli Coal
Fig 1.5 Schematic cross-section through escarpment showing geology and location of instability between Scarborough and Clifton
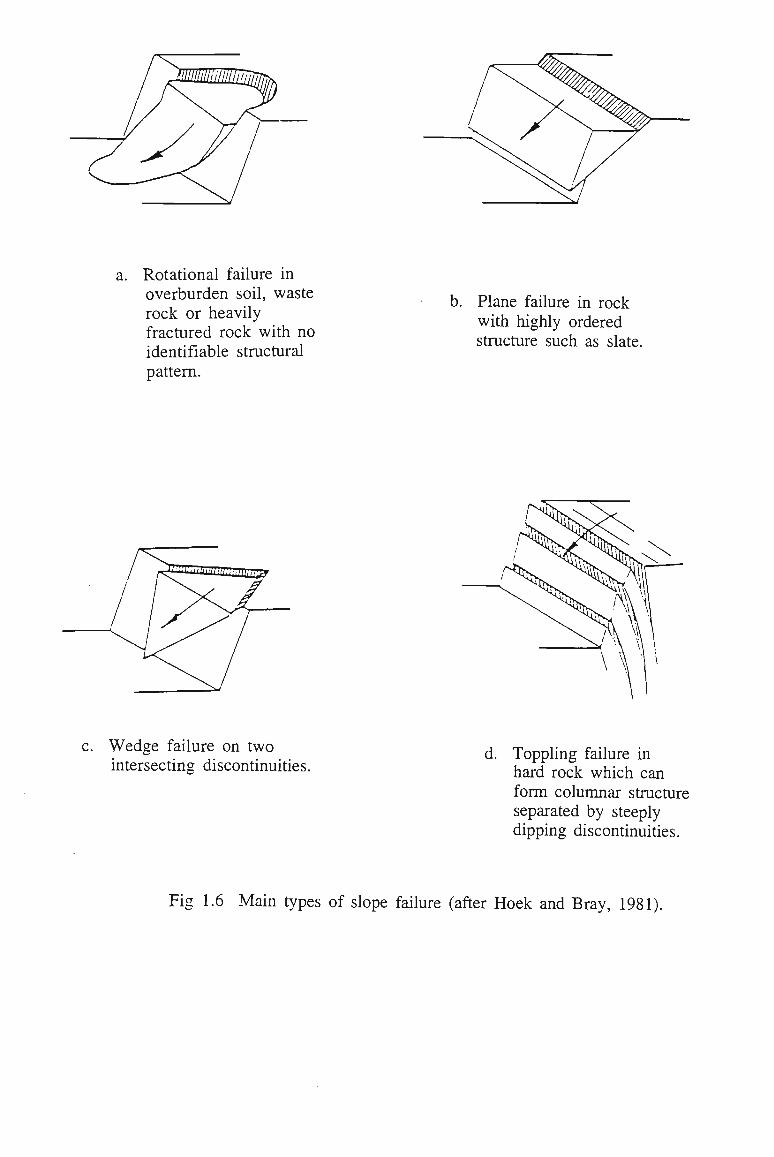
/
a. Rotational failure in overburden soil, waste rock or heavily fractured rock with no identifiable structural pattern.
W e d g e failure on two intersecting discontinuities.
b. Plane failure in rock with highly ordered structure such as slate
d. Toppling failure in hard rock which can form columnar structure separated by steeply dipping discontinuities.
Fig 1.6 Main types of slope failure (after Hoek and Bray, 1981).
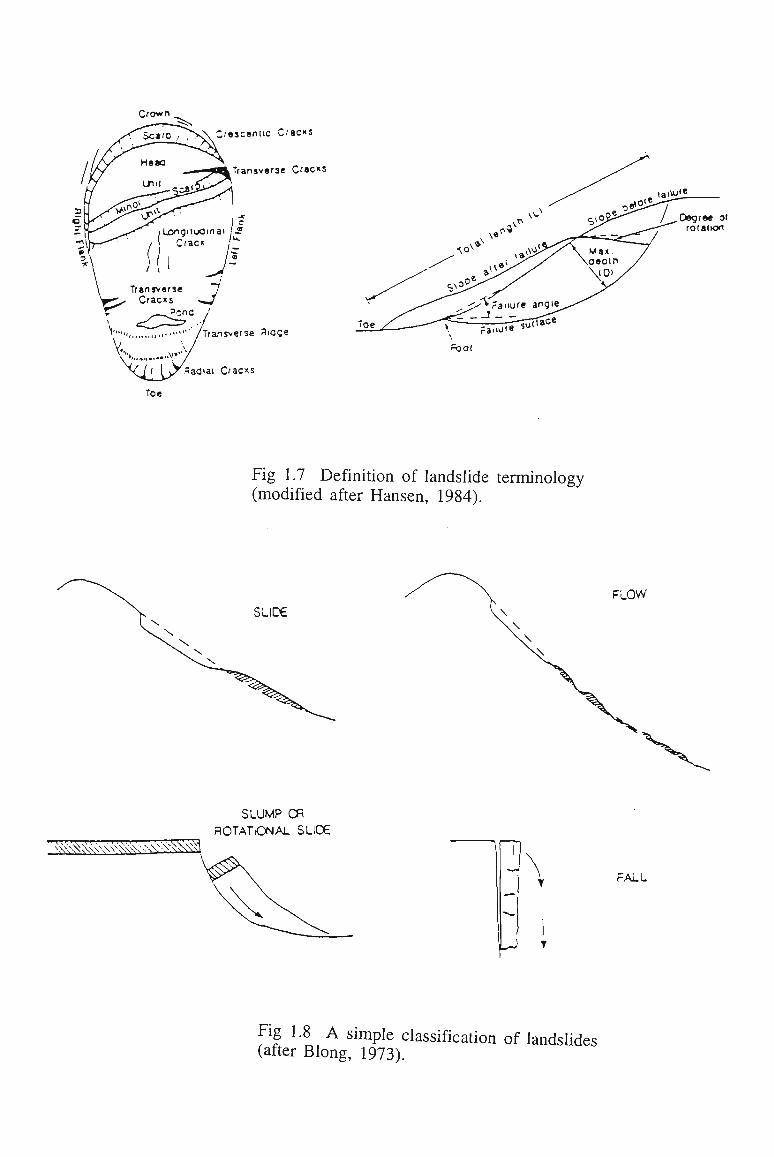
Crown
sceniic Cracxs
Transverse Cracxs
\ Transverse ~J W ^ , C'acxs ^J
'one
3aaiai Cracks
Toe
rOOl
Fig 1.7 Definition of landslide terminology (modified after Hansen, 1984).
Degree ol rotation
SLIDE
FLOW
SLUMP CR
ROTATIONAL SLIDE
ZM^^^S ^ivxv'.v^y
M
FALL
Fig 1.8 A simple classification of landslides (after Blong, 1973).
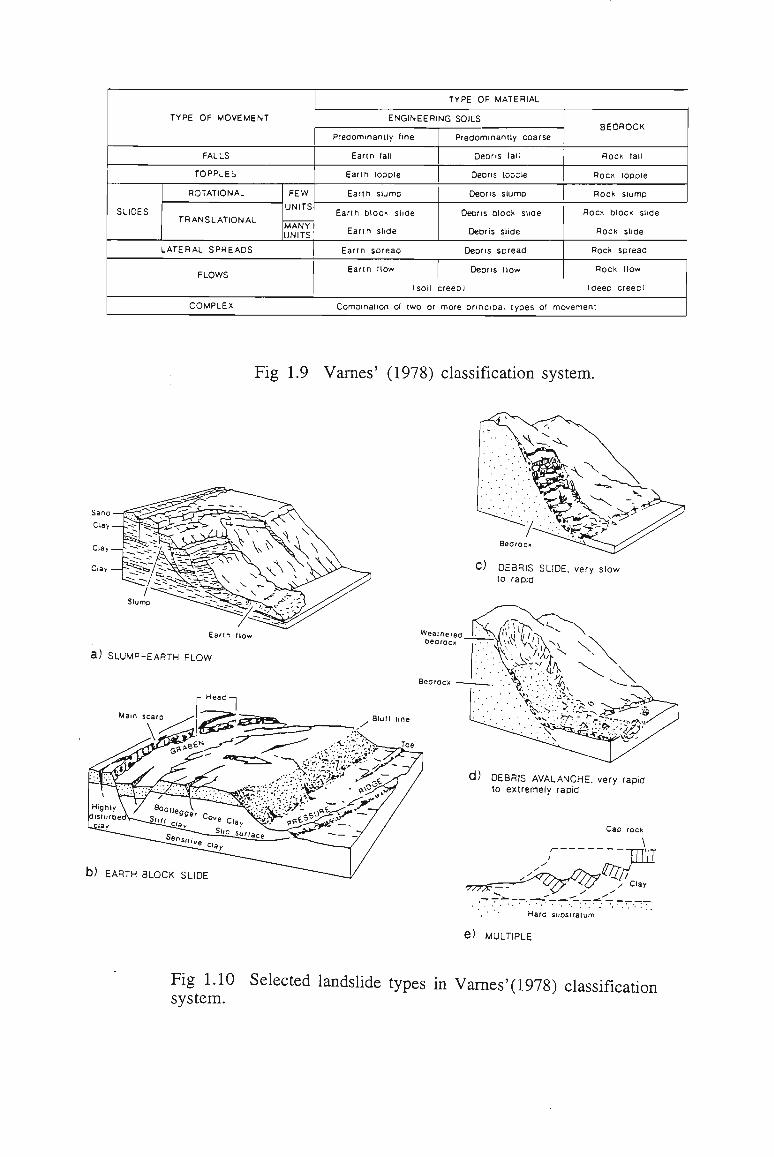
TYPE OF MOVEMENT
FALLS
TOPPLES
SLIDES
ROTATIONAL
TRANSLATIONAL
FEW
UNITS
MANY UNITS
LATERAL SPREADS
FLOWS
COMPLEX
TYPE OF MATERIAL
ENGINEERING SOILS
Predominantly fine
Eann tail
Earth topple
Earth slump
Earth bloc* slide
Earth slide
Earm spread
Eartn How
(soil
Predominantly coarse
Deoris tall
DePris topple
Debris slump
Deoris block slide
Deoris slide
Deoris spread
Deoris (low
creep)
BEDROCK
RO C K fall
R O C K topple
RocK slump
Rock blocK slide
RO C K slide
ROCK spread
Rock How
Ideeo creep 1
Comomation ol two or more principal types ot movemeni
Fig 1.9 Varnes' (1978) classification system.
Hare substratum
e) MULTIPLE
Fig 1.10 Selected landslide types in Varnes'(1978) classification system.
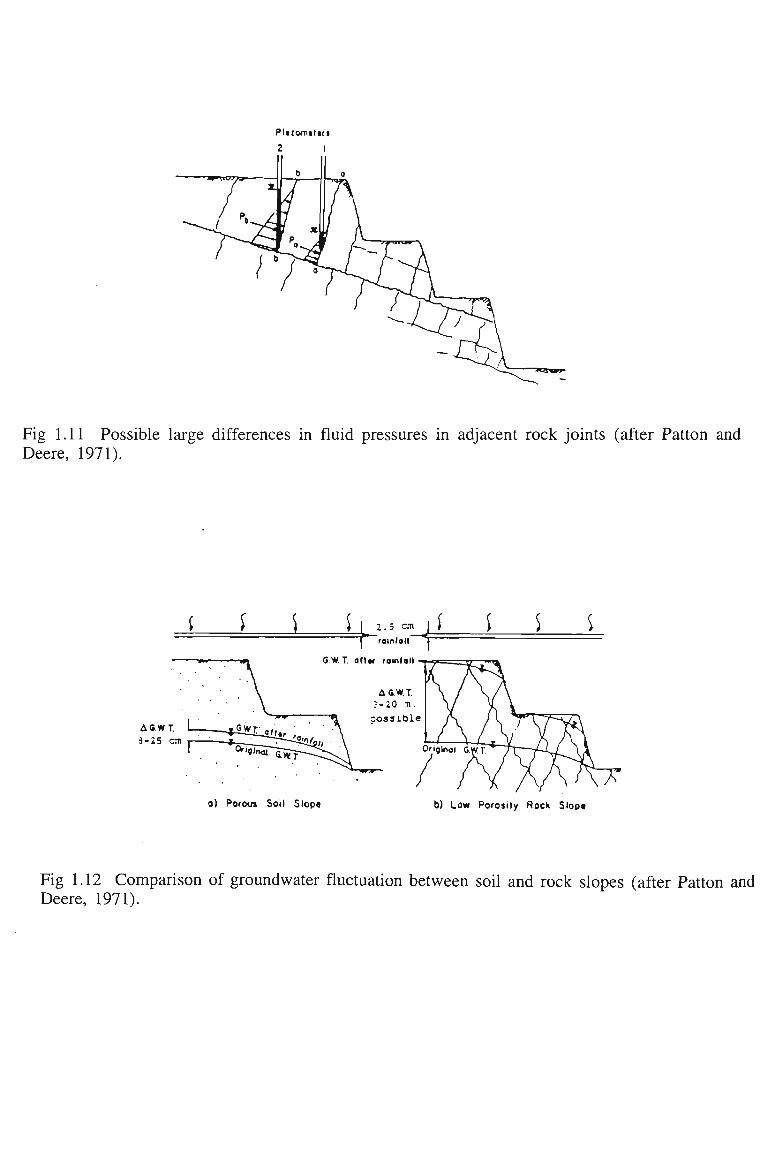
Fig 1.11 Possible large differences in fluid pressures in adjacent rock joints (after Patton and Deere, 1971).
f f S S
a) Porous Soil Slop* b) Low Porosity Rock Slop*
Fig 1.12 Comparison of groundwater fluctuation between soil and rock slopes (after Patton and Deere, 1971).

FIGURES TO CHAPTER 2
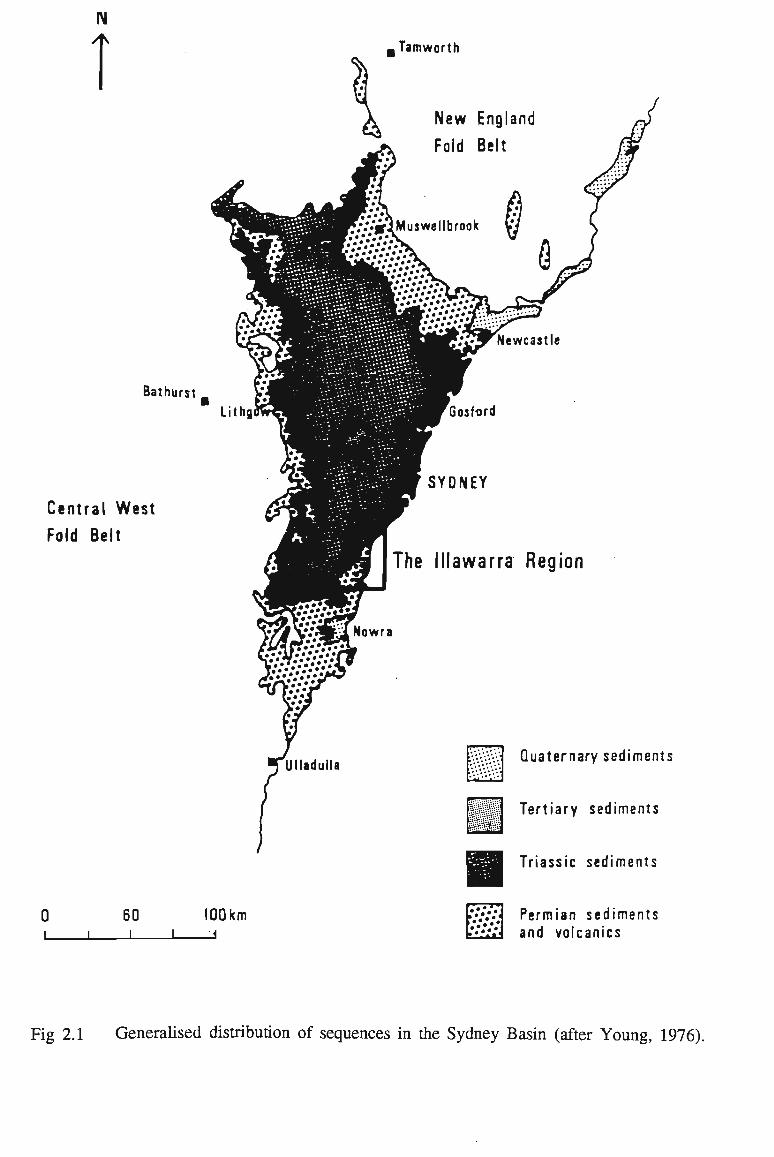
N
1
Bathurst
Central West
Fold Belt
Tamworth
The Illawarra Region
Ulladulla Quaternary sediments
vii±-Tertiary sediments
Triassic sediments
0 i_
60 _L_
100 km %':::\\ Permian sediments *""/.N and volcanics
Fig 2.1 Generalised distribution of sequences in the Sydney Basin (after Young, 1976).
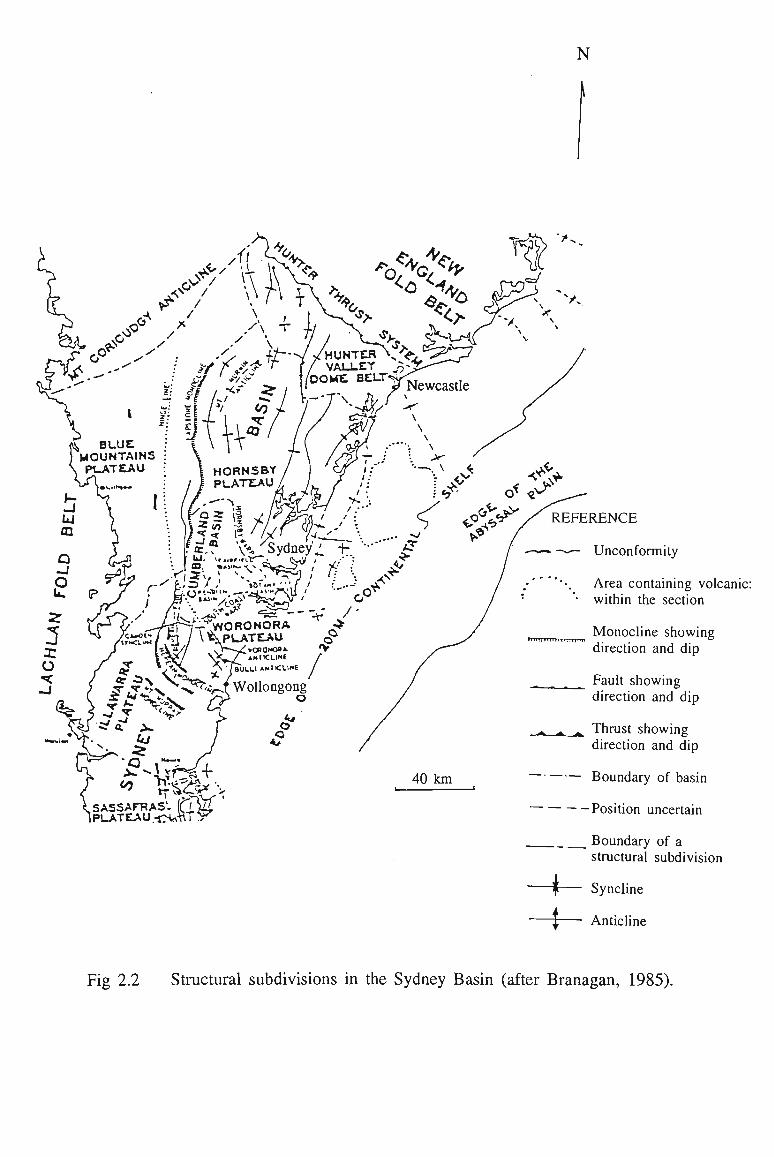
N
"L^WORONORA V PLATEAU *•<£
rW~y»coox)B*. o
yj>N, ->v<V.t Wollongong
c^ &
.SASSAFRAS'. f j ¥
40 k m
R E F E R E N C E
•~— Unconformity
Area containing volcanic: '• within the section
Monocline showing direction and dip
Fault showing direction and dip
Thrust showing direction and dip
Boundary of basin
Position uncertain
Boundary of a structural subdivision
Syncline
Anticline
Fig 2.2 Structural subdivisions in the Sydney Basin (after Branagan, 1985).
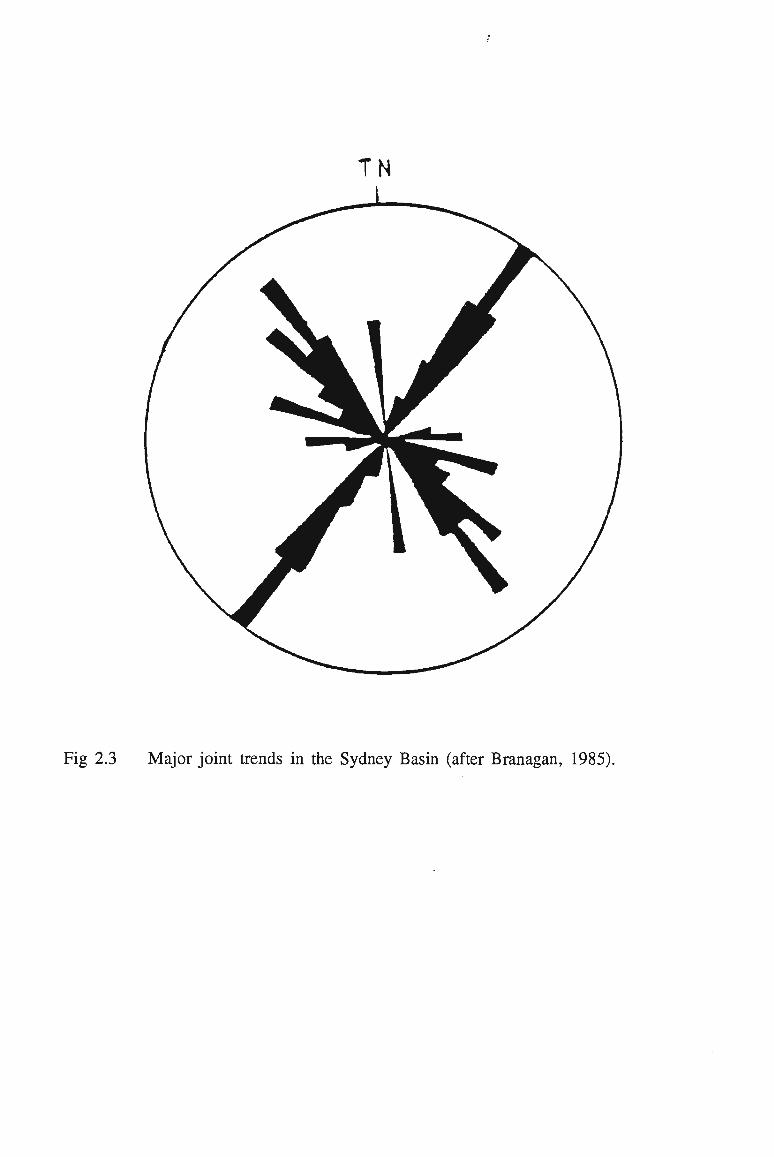
TN
Fig 2.3 Major joint trends in the Sydney Basin (after Branagan, 1985).
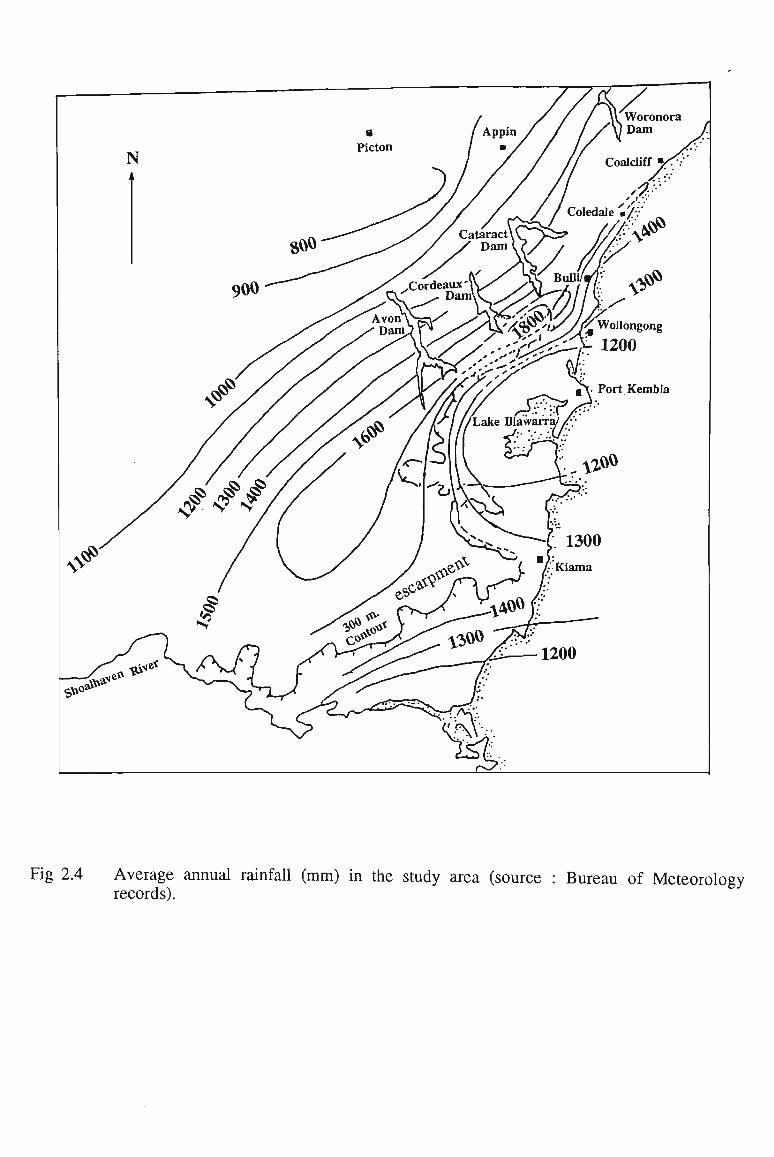
N
Wollongong
1200
^\. Port Kembla
Fig 2.4 Average annual rainfall (mm) in the study area (source : Bureau of Meteorology records).
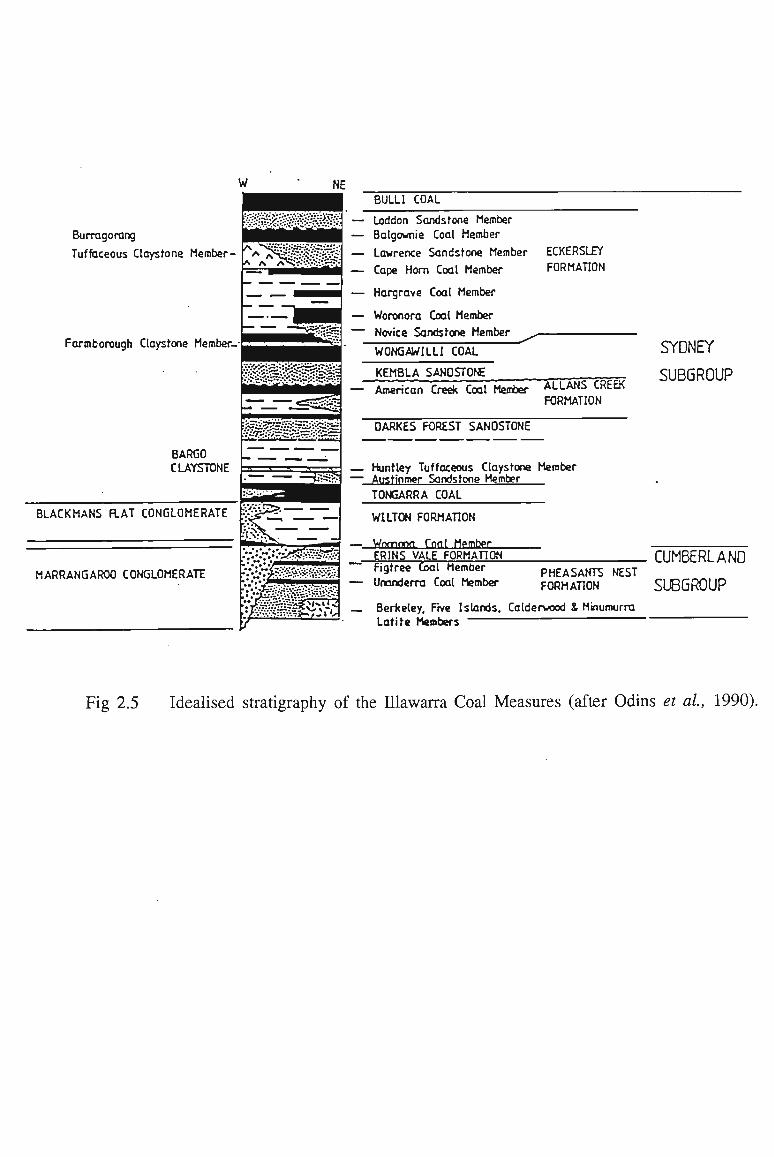
W NE BULLI COAL
Burragorang
Tuffaceous Claystone Member-
Farmborough Claystone Member-'
BARGO CLAYSTONE
Loddon Sandstone Member Balgownie Coal Member
Lawrence Sandstone Member Cape Horn Coal Member
Hargrave Coal Member
Woronora Coal Member Novice Sandstone Member
WONGAWILLI COAL
KEMBLA SANOSTONE
ECKERSLEY FORMATION
BLACKMANS FLAT CONGLOMERATE
MARRANGAROO CONGLOMERATE
American Creek Coal Member ALLANS CREEK FORMATION
DARKES FOREST SANDSTONE
Huntley Tuffaceous Claystone Member Austinmer Sandstone Member TONGARRA COAL
w****
WILTON FORMATCON
— Womtmn Ton I Mpmber ERINS VALE FORMATION
SYDNEY
SUBGROUP
Figtree Coal Member Unanderra Coal Member
PHEASANTS NEST FORMATION
CUMBERLAND
SUBGROUP Berkeley. Five Islands, Calderwood & Minumurra Latite Members
Fig 2.5 Idealised stratigraphy of the Illawarra Coal Measures (after Odins et al, 1990).
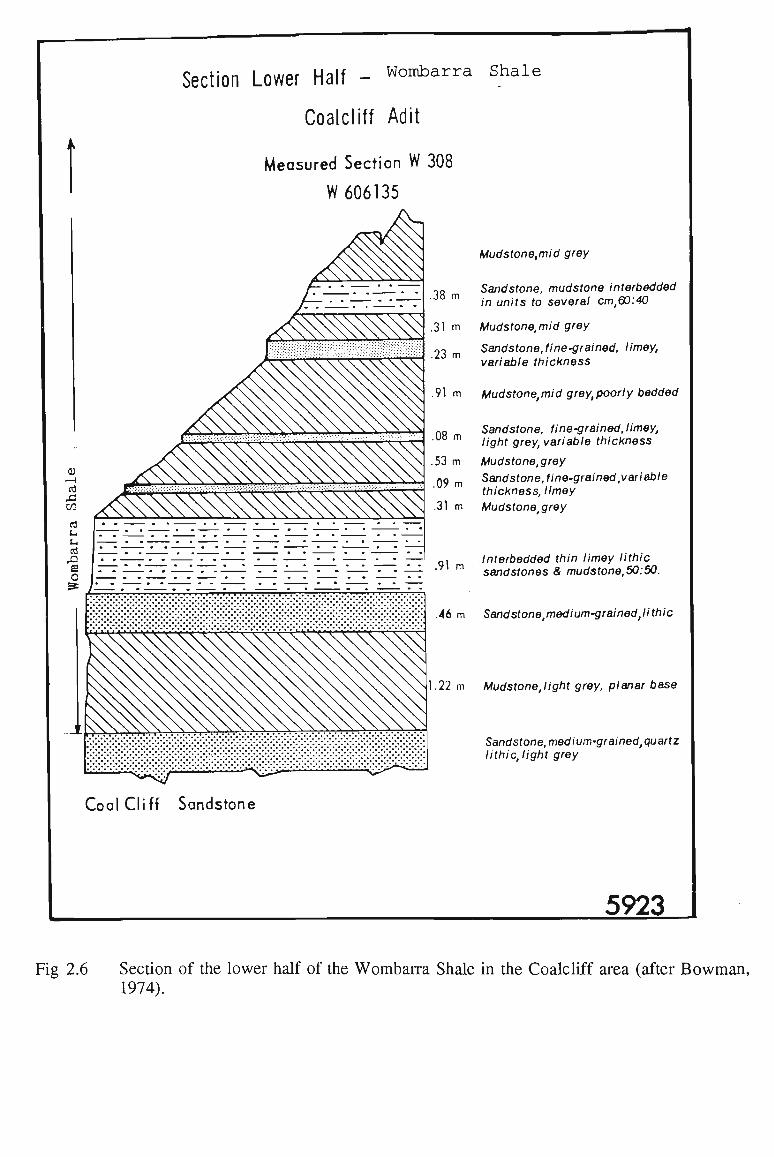
Section Lower Half - Wombarra Shale
Coalcliff Adit
Measured Section W 308
W 606135
Mudstone,mid grey
' ' T—\ -„ Sandstone, mudstone interbedded J m in units to several cm,60:40
31m Mudstone,mid grey
23 Sandstone,fine-grained, limey, variable thickness
.91 m Mudstonetmid grey,poorly bedded
.08 m
.53 m
.09 m
.31 m
Sandstone, fine-grained,limey, light grey, variable thickness Mudstone,grey Sandstone, fine-grained,variable thickness, limey Mudstone\grey
Q, Interbedded thin limey lithic m sandstones & mudstone,50:50.
.46 m Sandstone^edium-grainedjlithic
1.22 m Mudstone,light grey, planar base
Sandstone, medium-grained, quartz lithic, light grey
Coal Cliff Sandstone
5923
Fig 2.6 Section of the lower half of the Wombarra Shale in the Coalcliff area (after Bowman, 1974).
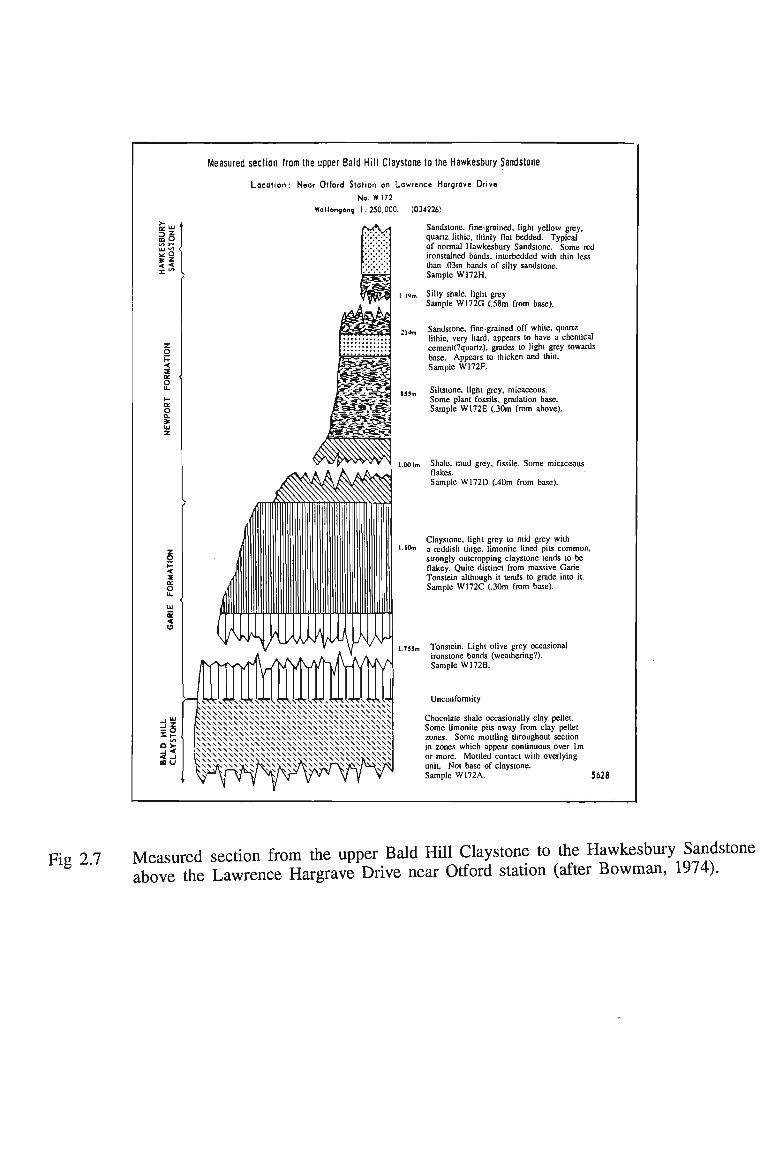
Measured section from the upper Bald Hill Claystone to the Hawkesbury Sandstone
Location: Near Otford Station on Lawrence Hargrove Drive
No. W 172
Wollongong 1 : 250,000. (034226!
Sandstone, fine-grained, light yellow grey, quartz lithic, thinly flat bedded. Typical of normal Hawkesbury Sandstone. Some red ironstained bands, interbedded with thin less than ,03m hands of silty sandstone. Sample VV172H.
I ,qm Silty shale, light grey Sample W 1 7 2 G (.58m from base).
'lAn Sandstone, fine-grained off white, quartz lithic. very hard, appears to have a chemical cement(?quartz), grades to light grey towards base. Appears to thicken and thin. Sample W172F.
|5?m Siltstone, light grey, micaceous. Some plant fossils, gradation base. Sample W 1 7 2 E (.30m from above).
l.ooim Shale, mud grey, fissile. Some micaceous flakes. Sample W 1 7 2 D (.40m from base).
Claystone, light grey to mid grey with a reddish tinge, limonile lined pits common, strongly outcropping claystone lends to be flakey. Quite distinct from massive Garie Tonstein although it tends to grade into it. Sample W 1 7 2 C (.30m from base).
1.7J5m Tonstein. Light olive grey occasional ironstone bands (weathering?). Sample W172B.
Unconformity
Chocolate shale occasionally clay pellet. Some limonite pits away from clay pellet zones. Some mottling throughout section in zones which appear continuous over lm or more. Mottled contact with overlying unit. Not base of claystone. Sample W 1 7 2 A . 5628
Fig 2.7 Measured section from the upper Bald Hill Claystone to the Hawkesbury Sandstone above the Lawrence Hargrave Drive near Otford station (after Bowman, 1974).

CD
O CD
CD C — u c o :>
QJ C :s o
• ~
c <
CD c o c >. c/>
n> L.
.n m CD ' L-co 03 c _J
j?X <tuj >5 / h-<o3 So »' 5 0 0 OC <J 2°
rro rrO = 2
SO
y
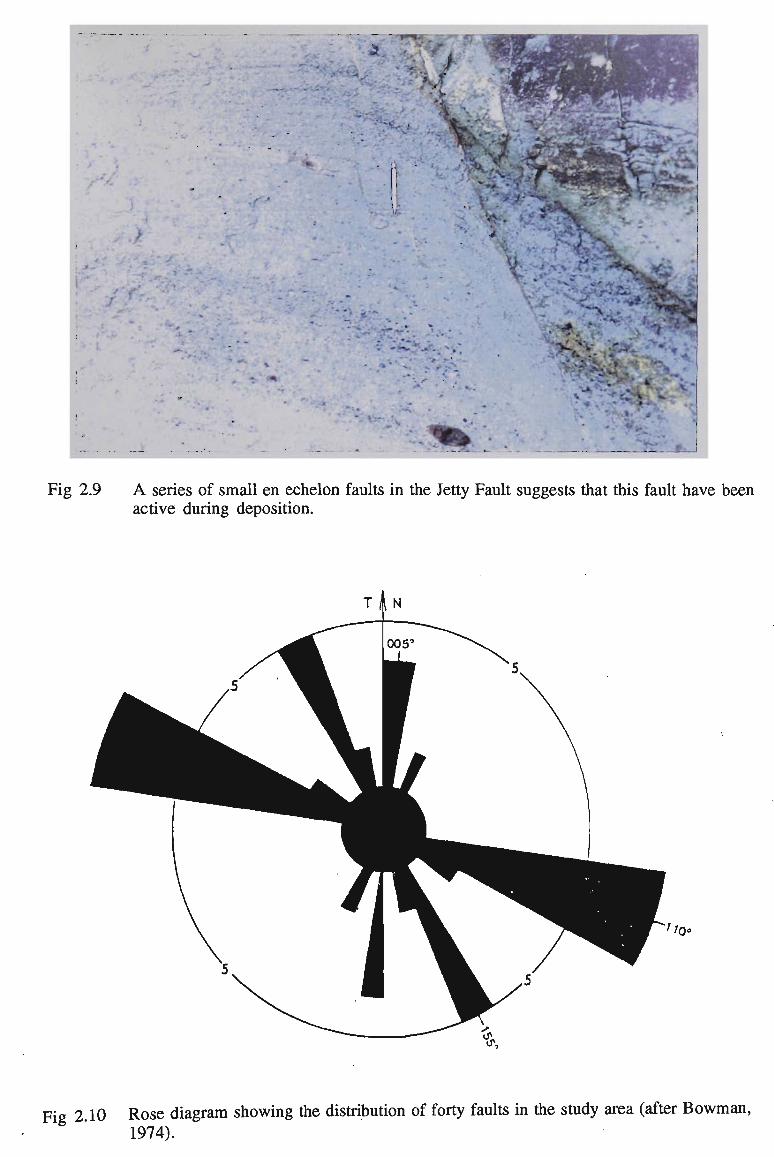
^^^^^^^^^^^^^^^^H
* -. - • - ' . -
• * -
-* - \ -'- r'
•* -
-,-A,
«•» C/^^^B
* .
• I
"
_. -•
\
* „ • ^fcVfc.
Fig 2.9 A series of small en echelon faults in the Jetty Fault suggests that this fault have been active during deposition.
Fig 2 10 Rose diagram showing the distribution of forty faults in the study area (after B o w m a n , 1974).
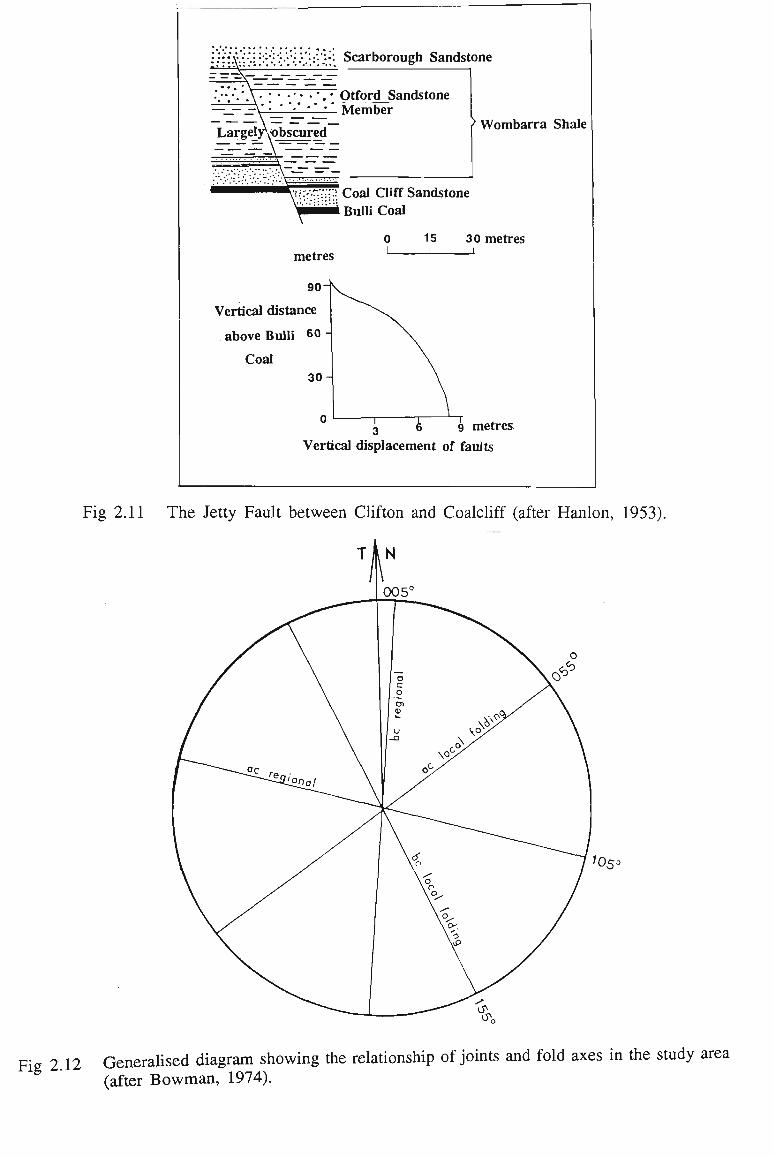
::::A\V".::::V/.*'.:.:!:::';': Scarborough Sandstone
Otford Sandstone Member
> Wombarra Shale
£'{:'{?. Coal Cliff Sandstone
Bulli Coal
metres
90-
Vertical distance
above Bulli 60 "
Coal
30 J
15 30 metres _j i
3 6 9 metres
Vertical displacement of faults
Fig 2.11 The Jetty Fault between Clifton and Coalcliff (after Hanlon, 1953).
Fig 2 12 Generalised diagram showing the relationship of joints and fold axes in the study area
(after B o w m a n , 1974).
\
FIGURES TO CHAPTER 3

Fig. 3.1 The basal formation of the Sydney Sub-group is the Wilton Formation which, in this area, consists of an upward coarsening interdistributary bay fill facies overlain by the delta top Tongarra Coal. The continuous shaly bands in the coal represent beds of volcanic ash. The overlying Bargo Claystone strata with the 1.5 m thick Austinmer Sandstone Member comprises coarse sandstone fining up to siltstone. South of Wombarra Beach.
Fig. 3.2 The Bulli Coal can be seen along the waters edge from the Jetty Fault to Clifton Fault. At the top of the photo Coal Cliff Sandstone overlies Bulli Coal and is in turn overlain by Wombarra Shale at the top right of the photo. The laminated overbank unit in the Coal Cliff Sandstone is truncated by erosion at the base of the second channel-fill sequence.
Fig. 3.3 A section of the Narrabeen Group at Coalcliff. At the base of the section the Coal Cliff Sandstone (CSs) erosionally overlies the Bulli Coal. The Wombarra Shale (WSh), on which Lawrence Hargrave Drive is built, overlies the Coal Cliff Sandstone and the Otford Sandstone Member (OSM) is above the roadway. The Scarborough Sandstone (SSs) forms the next cliff which is overlain toward the top of the photo by Stanwell Park Claystone (SPC). The Bulgo Sandstone (BSs) forms the cliff at the top of the photo. It is down-thrown on the right of the photo by Fault 1. At the top left of the photo the Hawkesbury Sandstone forms top of the escarpment. Exposed joint surfaces on the Coal Cliff Sandstone and Scarborough Sandstone show the locations of the recent rockfalls.
Fig. 3.4 Wombarra Shale is composed of greenish grey shale with fine-grained lithic sandstone interbeds. In the detailed study area, the unit is subject to weathering and erosion, with active marine erosion occurring along the coastal cliff-line. The weathering of the Wombarra Shale, which breaks down to form low strength clay, and the existence of seepage concentrations within the fractured Wombarra Shale cause instability and differential erosion along the coastal cliffs just south of Coalcliff adit.
Fig. 3.5 The Otford Sandstone Member has a maximum thickness of 7 metres with cross-bedding, erosional scours, conglomeratic lenses and a few siltstone interbeds. Undercutting is evident at the contact between the conglomeratic portion and the cross-bedded fine-grained Otford Sandstone Member. Also the rapid weathering of the interbedded siltstone, which breaks down to form clay, typically possesses low shear strength properties and causes, small rockfalls. Lawrence Hargrave Drive between Clifton and Coalcliff.
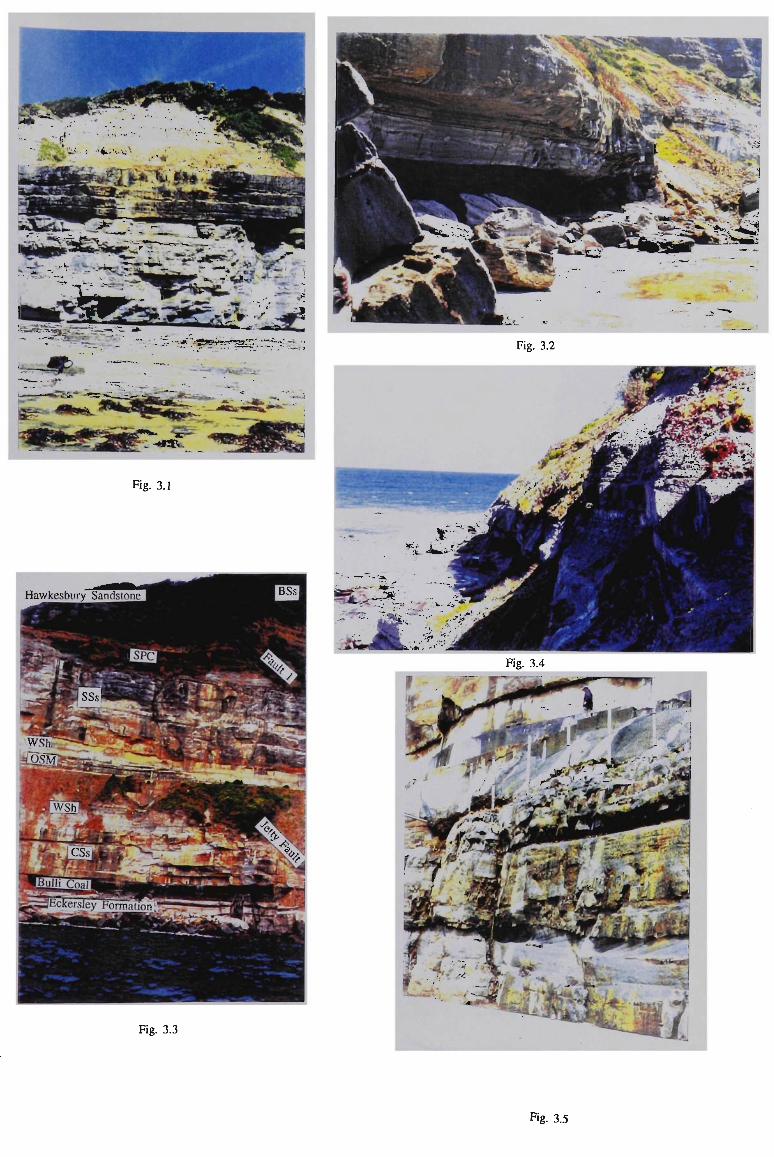
Fig. 3.3
Fig. 3.5
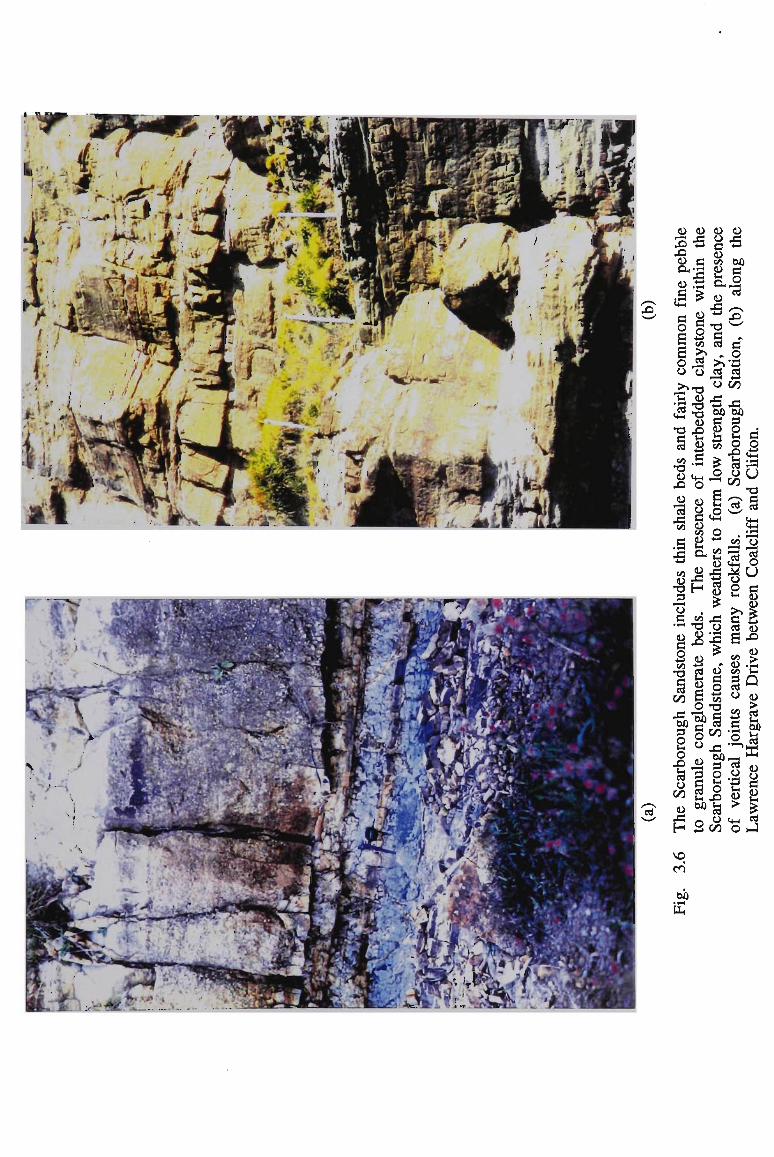
umi
'"'/ / L ^ T to *& •' * »' \ \ i_< MM Mi s I. 5T. -*
^ /
J
2*.
^ \ 1
l'l£ ,]
M*m
^^^•^^••B W l j£__
Cj
in aO J3 CU a.
c <+-<
c o
e a o o T! • fH
•a
C/3
•a CD
JS (4 X! C/5
.s •s CD T3 j3 13 G
• •c
CD
C o 4-*
&0
-a C/3
X
00 3 o s o
1 o C/3 <D XI
H
vq fri
00 • i-l
PLH
(D X! \3 G
£ CD G O </> £> o •o 0) "O T3 CD
1 4->
c • fH
o CD
o
CD O c S 00
8 CD X! <*->
G Bj ^ >> 43 "o x t3 BO G 8
Z O
£ o a «w cD 60
8 OH
4) X! H
&0 T3 CD
CD
CD
s s* G
o u CD
13
00
o
o *-> 0 0 l-i
CD
X 3 <D X o X
CD
c o oo "O
c/3 Xi 60 3 p s-O X S3 o GO
CD X ^ 00 c
13 z^^\
X x~"'
cT o •^ *-> C/3
X! 00 3
s 0 f 0 c/3
3 00
5 8 >> c at B 60 CD 00
3 0
2 c
• 1-1
0 73 0
CD >
(4-1
O
G O
0 •a G H-i <4-< «1H
0 13 0 U G
8 B CD
CD
> •c Q a? > U 00
la CD
G
£
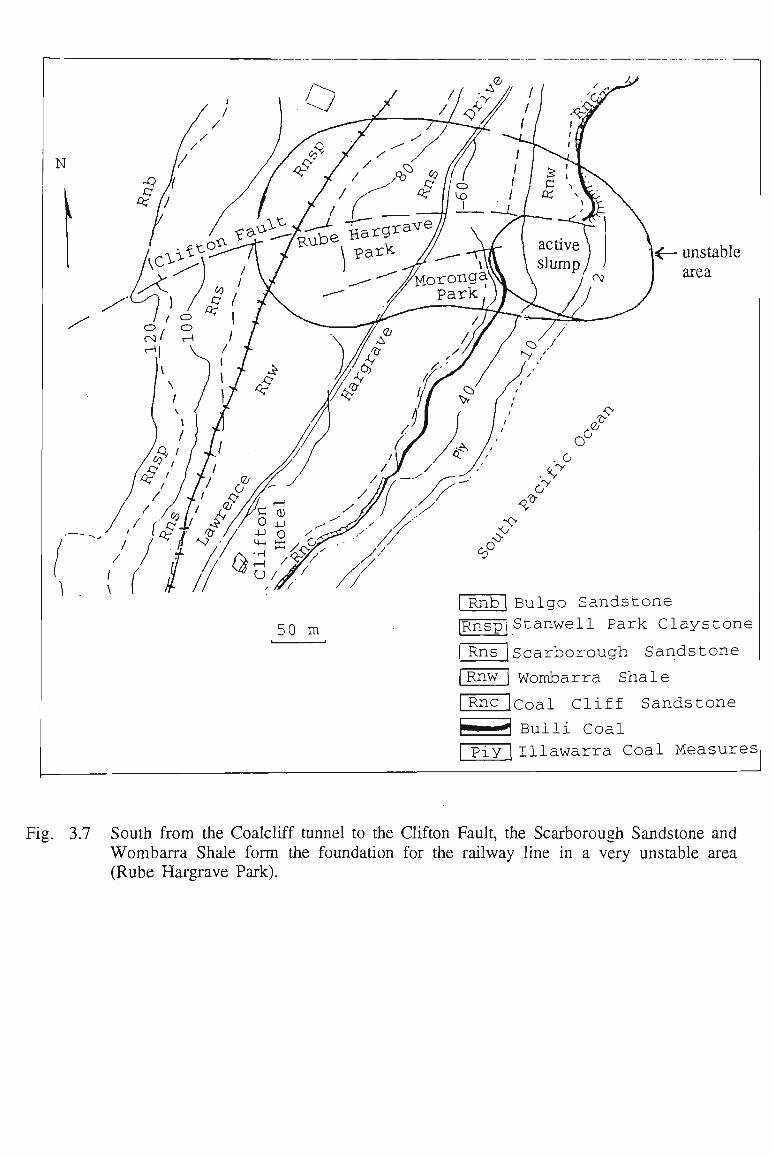
N
{ \<— unstable
area
Rnbl Bulgo Sandstone
50 m RnspiStanwell Park Claystone
I Rns (Scarborough Sandstone
Rnw j Wombarra Shale
Rnc |coal Cliff Sandstone
Bulli Coal 1 pjy \illawarra Coal Measures
Fig. 3.7 South from the Coalcliff tunnel to the Clifton Fault, the Scarborough Sandstone and Wombarra Shale form the foundation for the railway line in a very unstable area (Rube Hargrave Park).

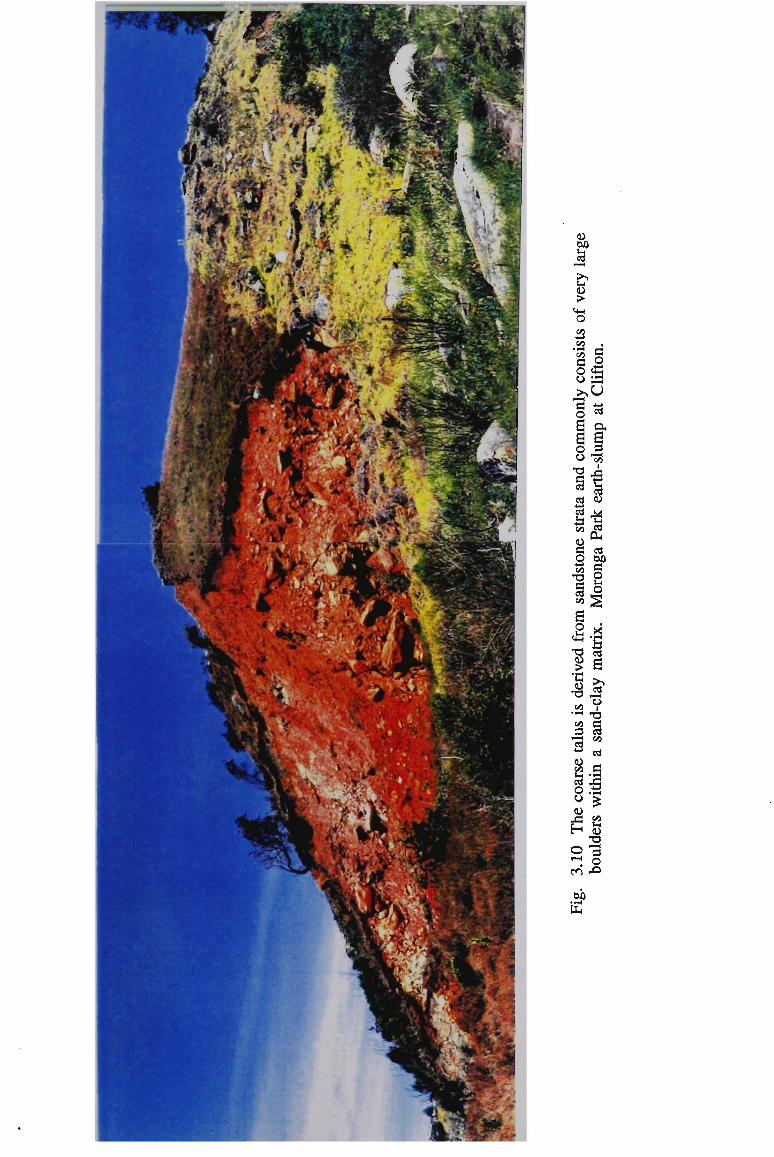
CD
If 1-1
CD
> <4H
O GO • *H 40
G
G O
O <4H
i—I
c a S o. ° xl
G ed O 00 GO G
"S s s s * £ s •8J? 3 S
oo G t-l -TH
cd X
sf <D H CD
""I O CD 1 00
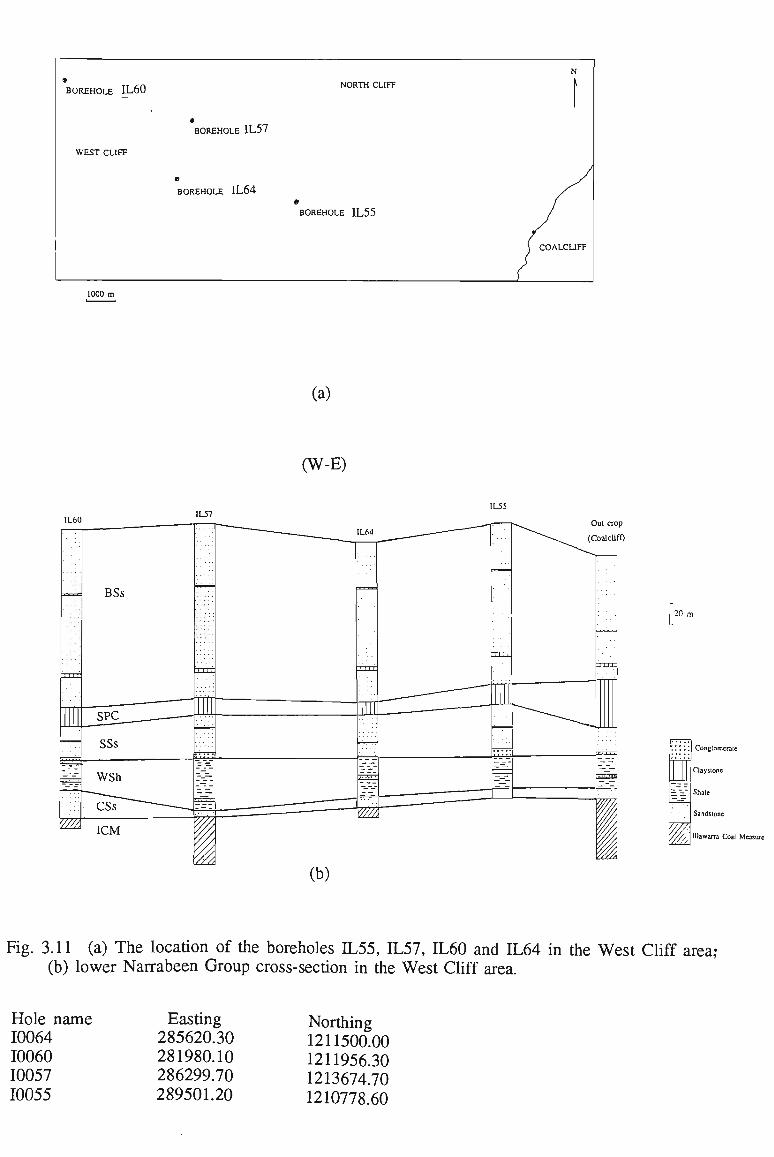
9
BOREHOLE IL60
WEST CLIFF
• BOREHOLE 1L57
0
BOREHOLE IL64
NORTH CLIFF
e BOREHOLE IL55
N i
( COALCUFF
1000 m
(a)
(W-E)
IL60 IL57
[L55
Out crop
(Coalcliff)
|2f)
T
Conglomerate
Claystone
Shale
Sandstone
Illawarra Coal Measure
Fig. 3.11 (a) The location of the boreholes IL55, IL57, IL60 and IL64 in the West Cliff area; (b) lower Narrabeen Group cross-section in the West Cliff area.
Hole name 10064 10060 10057 10055
Easting 285620.30 281980.10 286299.70 289501.20
Northing 1211500.00 1211956.30 1213674.70 1210778.60
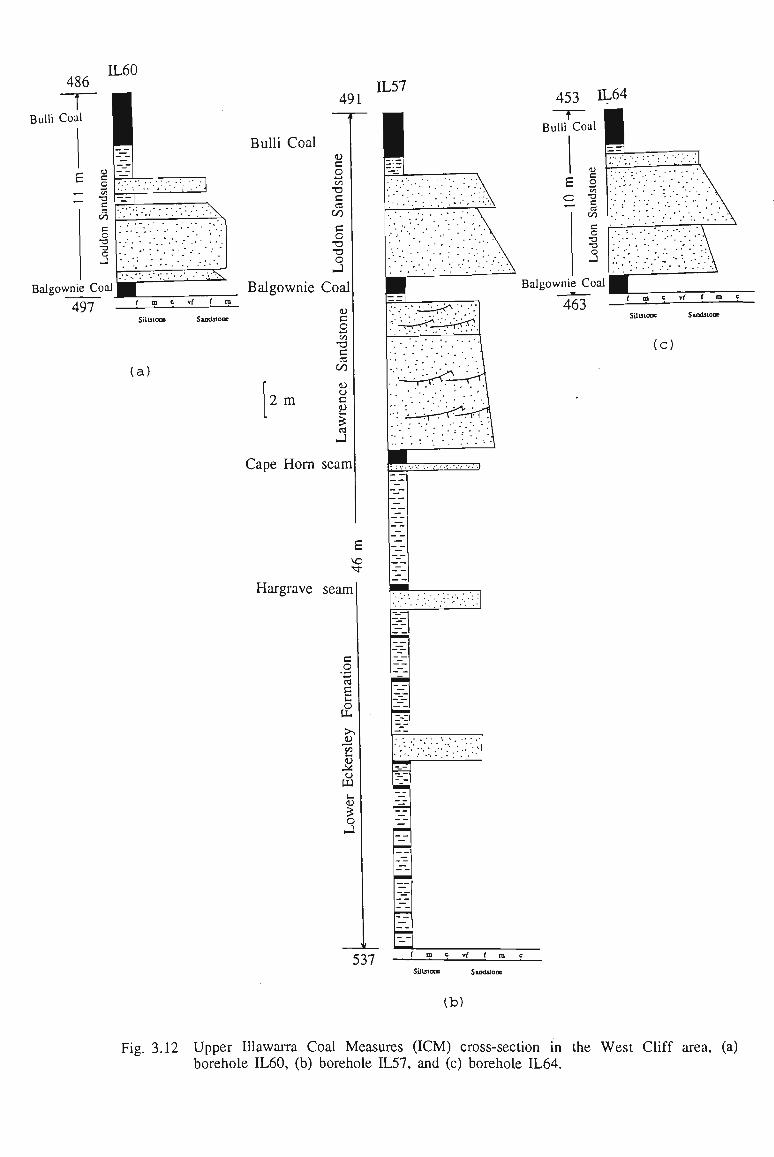
IL60
Bulli Coal 491
Bulli Coal u c o «-< C/)
T3 C C3
on c o •a
c -J
Balgownie Coal
497
Balgownie Coal
(a)
2 m
u c c w
•a
c CO
ca u c S ed Cape Horn seam
"cf
Hargrave seam
o
CJ
W CO
o
IL57 453 1L64
Bulli Coal I E c
Balgowni
~~A
p Lo
ddon
San
dsto
ne
— t
;;•:'• '/ :'.':'•'; . ' . - . I
Bilk sSil •
f m c yf f ra e
Siltstooc
(c)
537
(b)
Fig. 3.12 Upper Illawarra Coal Measures (ICM) cross-section in the West Cliff area, (a) borehole IL60, (b) borehole IL57, and (c) borehole IL64.
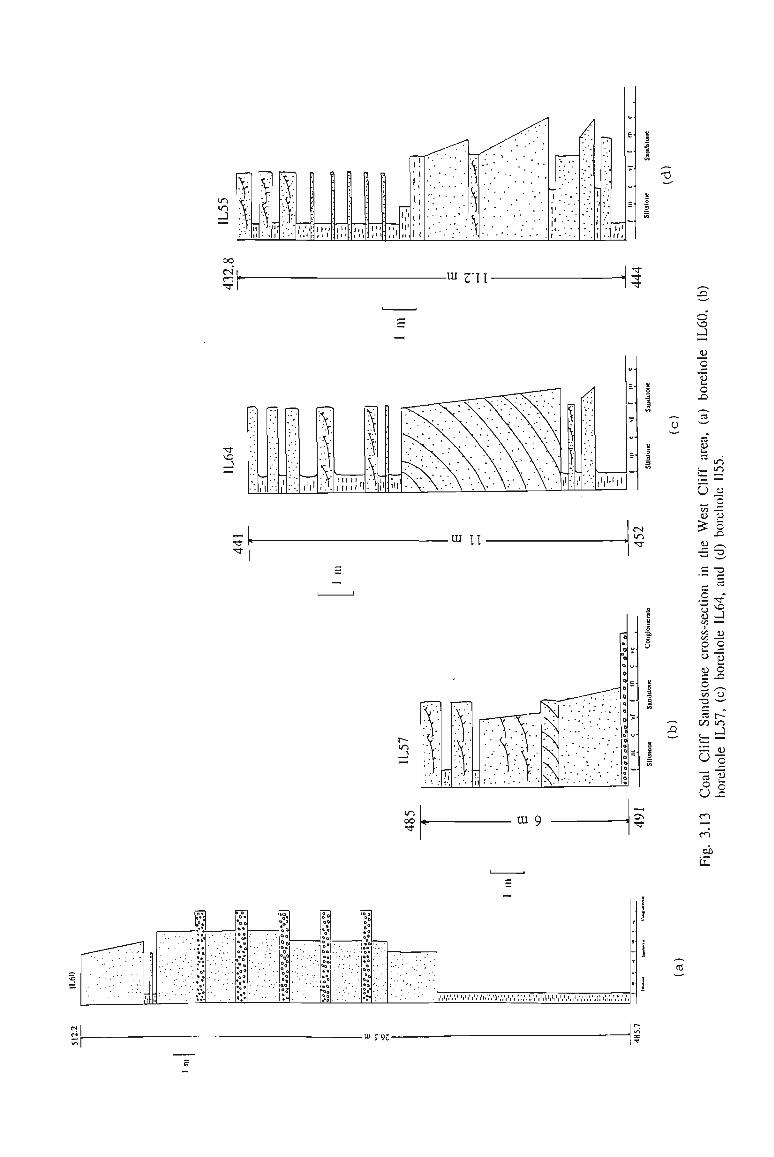
m • > • .
II I
tl
• i i i
id
CNl en -°i rn
• *
• *
•*
• • . • ' • - . J '••
?* • • • ft •"I *0*
Ov
«• 00 0*
V
• ' • ' - " •
a*
> a *
• %
Sol 0* a
«o
o* oo
•• fta .0 * 0 • a
• 0
••• 0 0 • a 0* o» 0
•o
i*i«/.v.,r'i'i,i,iVi.v.,,'iv/1tl',
,::/;:.\t,i,i|i,ii,1,1,1'.
,,'/1'1i<'.-„i:;<:.:/.':.- .•-
r
i
T
1'
3
:-y::/s .V
1
I L III II lllll'l
1 $
& :iii'
P J :;
H i ,i -;.,•'.•••:
».
-
» •
=•
I'IVI'
_eu C
O X
u
in
U «
• *
• *
-UI n. rN in
CO u
•5 "3
= "3
OO ui 9 1§
c
a) c/5
U) UI C u
a) r"
c U5 -n
a i/: C_i
« u C3 o u m ^ H
rn
eb u_
TT vC _J "* 1)
O
u o JC
u
r-m , 1 0) c !U n r»
-m c-9:
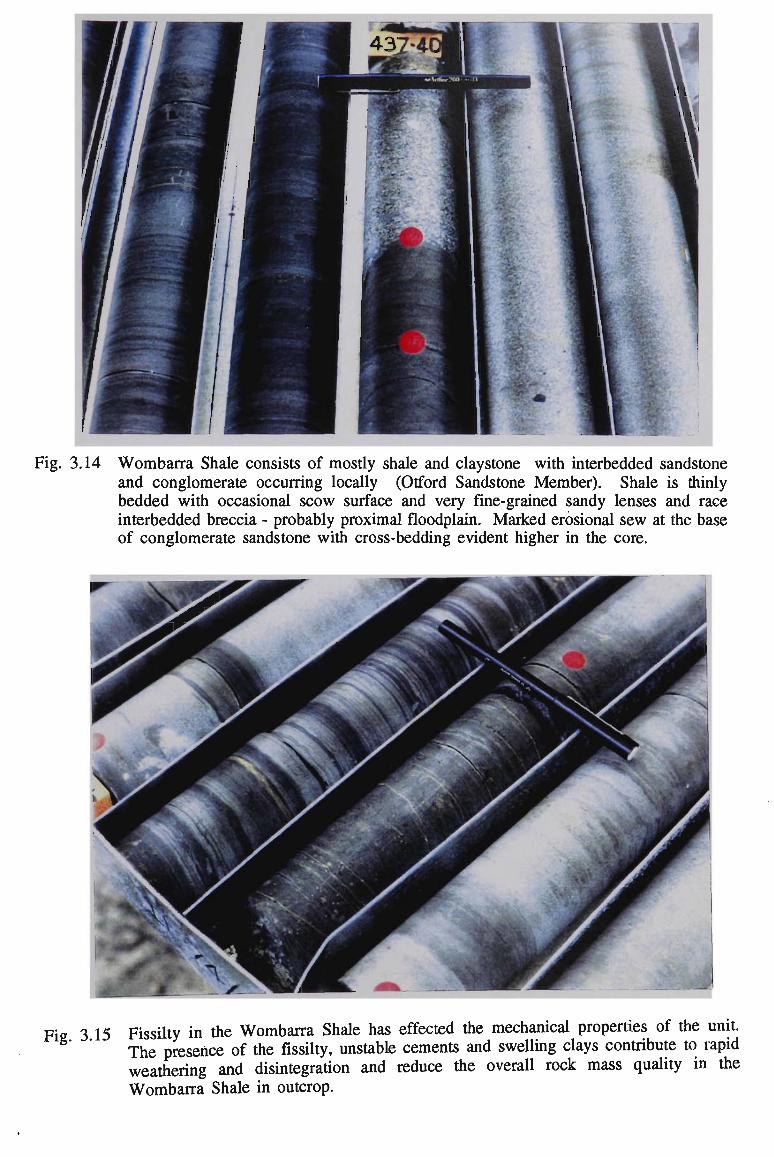
Fig. 3.14 Wombarra Shale consists of mostly shale and claystone with interbedded sandstone and conglomerate occurring locally (Otford Sandstone Member). Shale is thinly bedded with occasional scow surface and very fine-grained sandy lenses and race interbedded breccia - probably proximal floodplain. Marked erosional sew at the base of conglomerate sandstone with cross-bedding evident higher in the core.
Fie 3 15 Fissilty in the Wombarra Shale has effected the mechanical properties of the unit. The presence of the fissilty, unstable cements and swelling clays contribute to rapid weathering and disintegration and reduce the overall rock mass quality in the Wombarra Shale in outcrop.
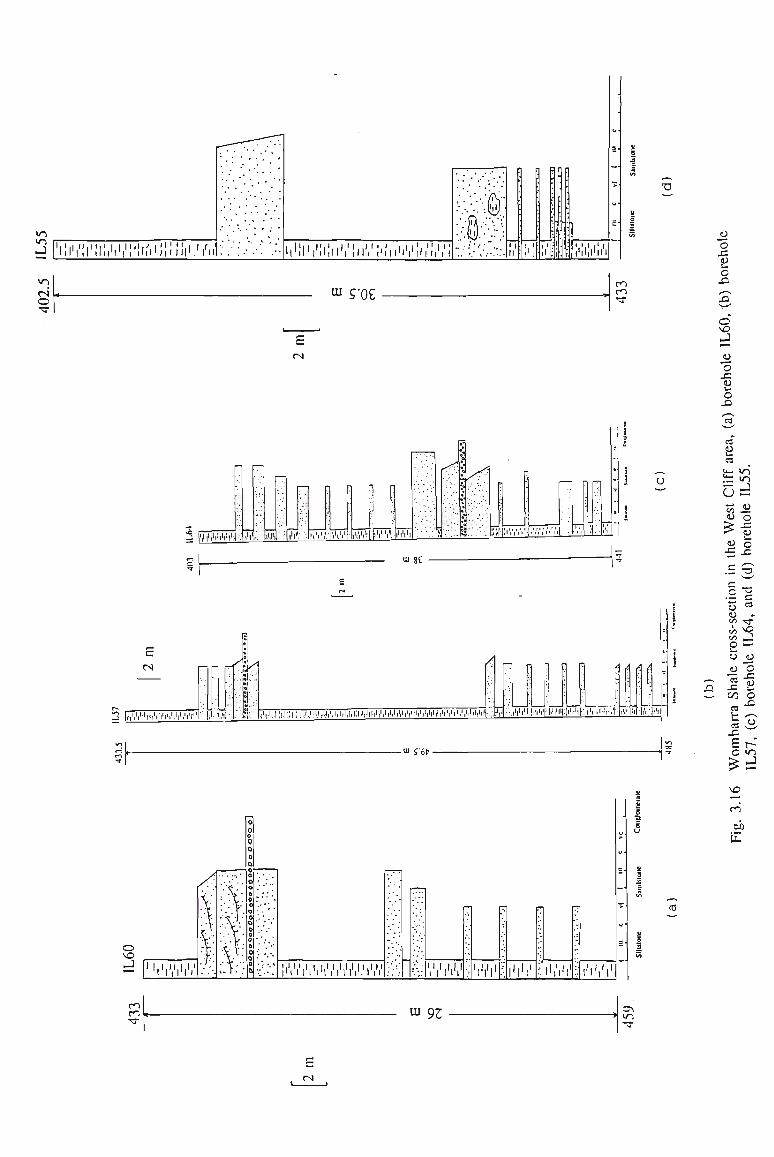
>n in J(!i!i|
l'!i'!iil'l|iliiifriiJ!iiii'ilif. iii!l|
li:i!iiV!ii,.l!',,i.'.|
1|!i.,i,,,
1,i ' . ' . i i ' i
I'liti'm
v
m CN
o ™ C-Q£
m en
c CN
2 IVl'iMi'ri'il-
C
CN
3 IIVI'.'I'I'IVI'I'I'I'I'.'I'I1. i.'ii
m si
rl
,1,1,1;,;[;[; I I|I1I||,I,I,I,I,I,III,|,I,V,I|I|I,'IV,'I',I|'I'||I'III'I'III'III'I'III'I'|II'I
I l.'.'M if'ii.it'r'.T-frrr
t
. I
IF .HI c"6f-
O >0
= 2 I ' I ' I ' I V I ' I V I'm I '.'iV.'i'rVriV,'
Fl
'•Yl'.',1 Wi 1:1,' l',Vl' I'lVl'
co c XI u u c J3
,, s XI
„ o vi; J H-"
93
c J= fl) u O .C •-N
ed s— „ cd 9J
« '_
u — J
CO
£ co JE
c c c o a) u:
U3 O
m CO
-J 4J C
"o o X
• o
s->
c cd » rr c _J
.—. CO
C- c/3 cd fc cd X
E c £ VO *— cn D£
fc
co o J2
o
r— in
cn cn •"3" I
m 92 in -3-

^
»« I O a
ui oe
in
0=>o r>o
°U«? 0 0 O O O 0 0 , r>o° o o °0 0 oO 000 no „0° 00°
O Q O •0°00 .£oO . T) O
• A'' •. YV
" v ' . •' • V .- v '. -L. • '•'/[:.• " • . • '
• : % ' ,
'' • \ ••
• V :•'.'.'•'.'•
1 •':'•
o.o oo0 OO ooo
Q
o o -oo
nO
Oo(
§8
«
i o
-a s u it G
1 T3
m CN
o
o I—I
"o
I—
O
cd
U
a u
CD —
^ o u -°
cn
o •3-
UJ 6£-CN CN
in
-J
in in cn
• . " - • •
• '„•.' •.;
• " ' . • • • . •• I • • '.
". • . ; ; . •
. . • • •
' . - • ' • " .
. • • ' " ' • •
• . ' . " . • • • " • •
- • .- . . . . • . .
•* • , •
. • " ' ' • •
' • - . • " . • ' . ' '
_ •* \
•> *.
;. -' *
-1 ,•
*'
1
Oop
0 6 0
0 0
6 o: Oo • © oo bo 0
0 oO
So
oo Q o 0
o°,?
. Oo
. u 0 -• O o .• O O ' 0 0 : oo° •OOQ
'• o°o
•a S U
Si B
5
- U I C-Tfr.
-o e w
— -a c c o rt CD VO c/3 I—I
S <u g £ n ° 2 X> CD Cfl
C cd
"O1—I oo 3 O
CD O O
Cd •_!
o o t>0 JQ
r-i — i
rn
o -J
c
(
/ •'•'•-^n
• . * _
•••*•
.* • .• * • • <
.„•• i
• . • '
;.. i
* • »
; ,< . • .' * * I
> 1 i
> 3
)
>' •. >':.
> • .* > •• >... 3 ".•
s '-> .'.
I--. ft .'. 0 •-*
/\
"••'.
• • " •
• , 1
'•••
':'•
;
•
. ; '
• ' • . , .
\ * • * • .
* • , . • •
» . . • . • * . • *
0 0 0 a o. a 0 0 o o o « 0
n° r» °0 0 o a0
Cl
°r, °o ou >
• • . •' I *
• • I . ' .
» • • .'**.
. • •
'.'..' ' '
~*1 u,« 0 n « ^ n .i° > tf Q1 0
".? Q
S-0 ft
»?. o" rB oft
cn -"*££
5
B
5 3
It3
cn
00
tLi

Fig. 3.18 The Scarborough Sandstone in borehole IL55. The photo presents the middle part of formation consisting of fine- to very coarse-grained sandstone interbedded with fine siltstone and conglomerate. A prominent single vertical joint with a length about 1 m is present in the sandstone.
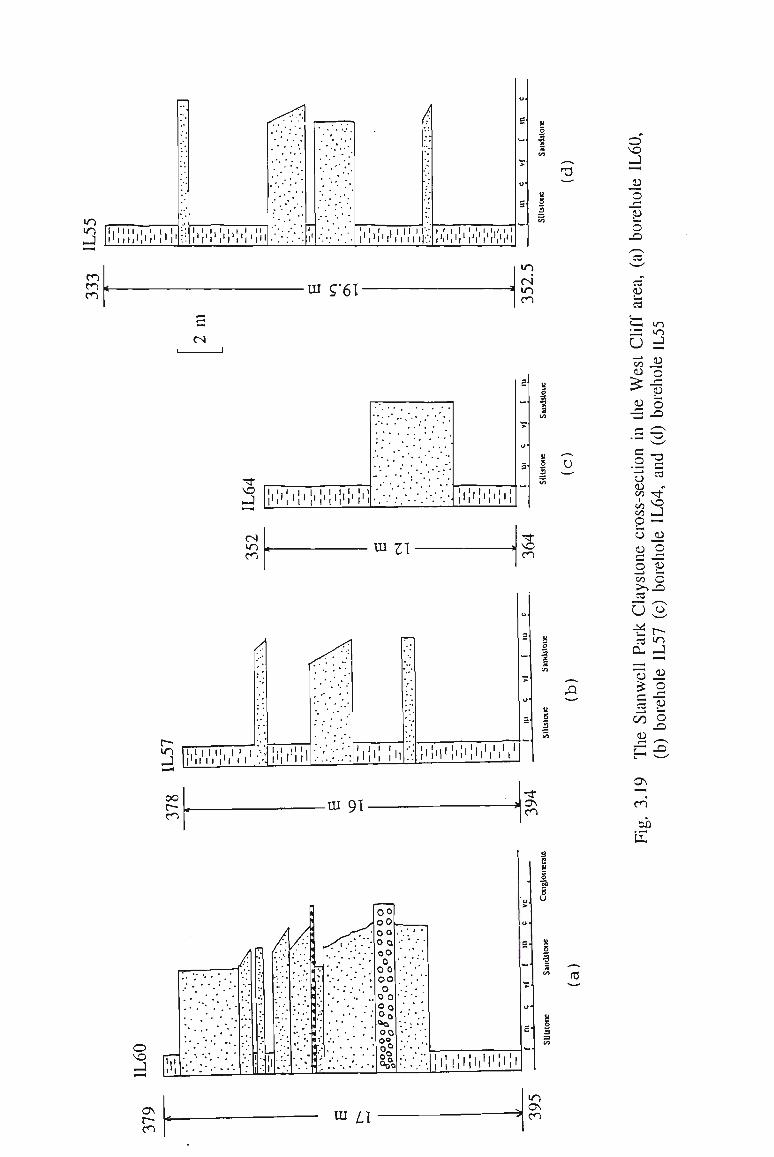
>n in
-J I ' l l l l ' i ' l 1 I 1 ! 1
^1
i'X'X'lvll.
'-•".••
7" I1
'.' .'; V'
A
!':»{'.«.,.,.v.
}
!•:«!»!« I'!'!'!';'!-!
- -3
T3
O so J JD "o
CD
O
cn cn cn
in g-6i-n CN in cn
CN
SO
CN m cn
g
:'••'.'••:••:'••"•'.. :I!I!.!.!I!'"
- 1
m z\ SO cn
/4
m 1 , 1 1 1 I I . 1 1 , 1 I'll I I l'l I I
« » t | f •
I'll II !I!«!I!M 'I 'ill ' I ' I ' I . I 'J !
l'l11' I ' I ' I ' I I ) I
U
cd CO
cd
t! •""1
U oc <D
£ CD
C O CD CD oo
00
O CD CD
O 00
n in _J co n 13 n J3
,.—N •a • — - • '
•a
cd r,
Tj" SO -J 1—H
CD
O D
c >..£. cd
u M cd Cu
co i—
cd
r/i CD
O
t> in -1 ^ co o CD
O J3
EZ -°
oo
en -m 91- cn
Jl
o SO J I1
i ' l
'. • • ' . ' . ' •
. • • • •':. v ' • •
• ' . . ' . ' • • . . ' .
•;•
: -'Hi •:i !
- . • • •
-.'•'
•;.'
/. /•'• ' - *
* . •
. " .
". "' -
^S*\ ' y -''
•
t -; •/ 1*. 1 . 1 '
*. I".
:"
. . . • . , ' , • • _ • •
' . • * * • • * •
.*. • * ' . ' • . • • •
-•••••'•
00 O0 0O OO oo 0 0 0
oo 0 o o
2° Oo <*o OO
o? 0" 0°n "oc
.' ' ' '
''•".'
' . • • • . :
* • " . •' • • • . * , • *
1 l1 l ' l ' t . l f l ' l 'l I l| \\\ | M J t1 I '
e u o •a
s u
B
S 5
e-
tO
ON
cn
oh
as
m tu Z.I
in
cn
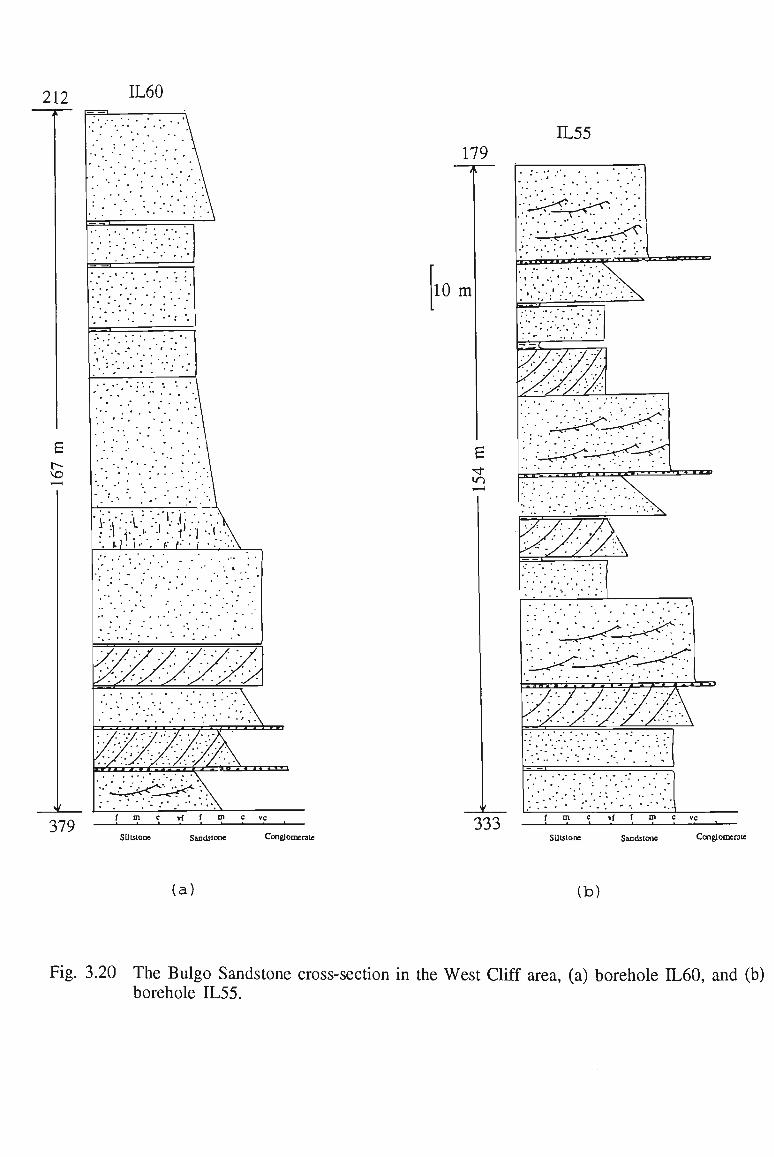
212 IL60
IL55
10 m
333 Siltstone Sandstone Conglomerate Siltstone Sandstone Conglomerate
(a) (b)
Fig. 3.20 The Bulgo Sandstone cross-section in the West Cliff area, (a) borehole IL60, and (b) borehole IL55.
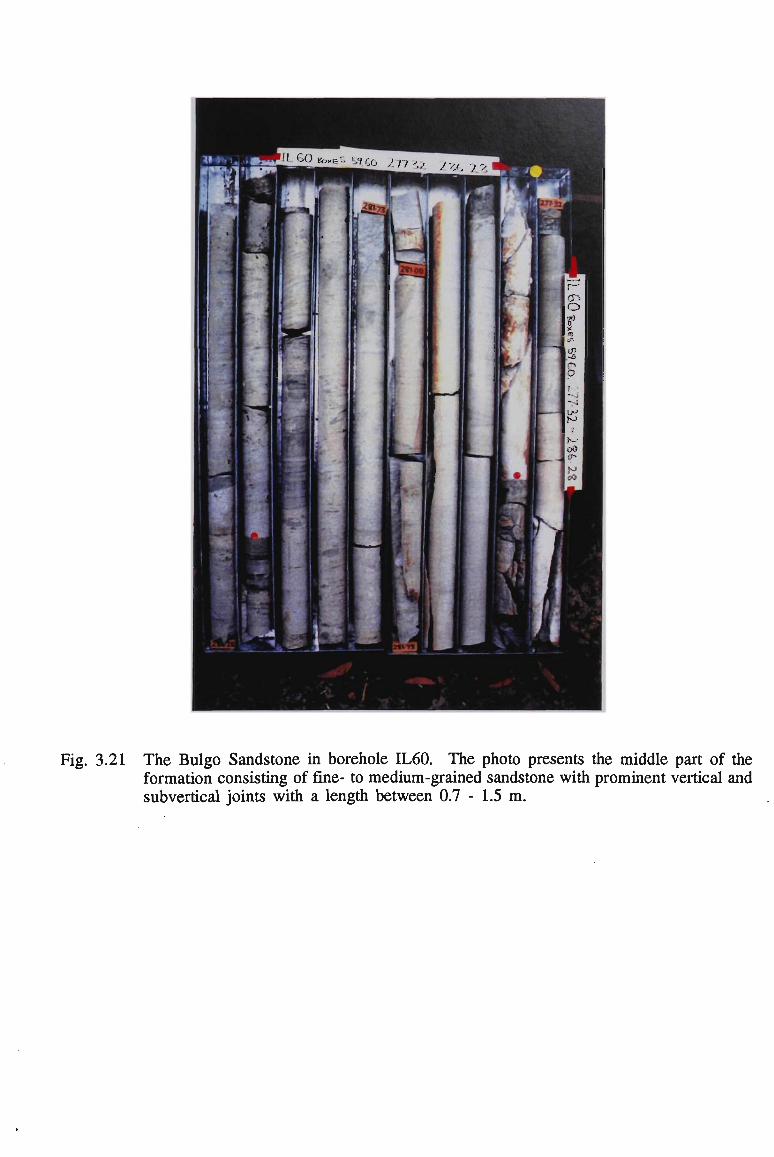
Fig. 3.21 The Bulgo Sandstone in borehole IL60. The photo presents the middle part of the formation consisting of fine- to medium-grained sandstone with prominent vertical and subvertical joints with a length between 0.7 - 1.5 m.
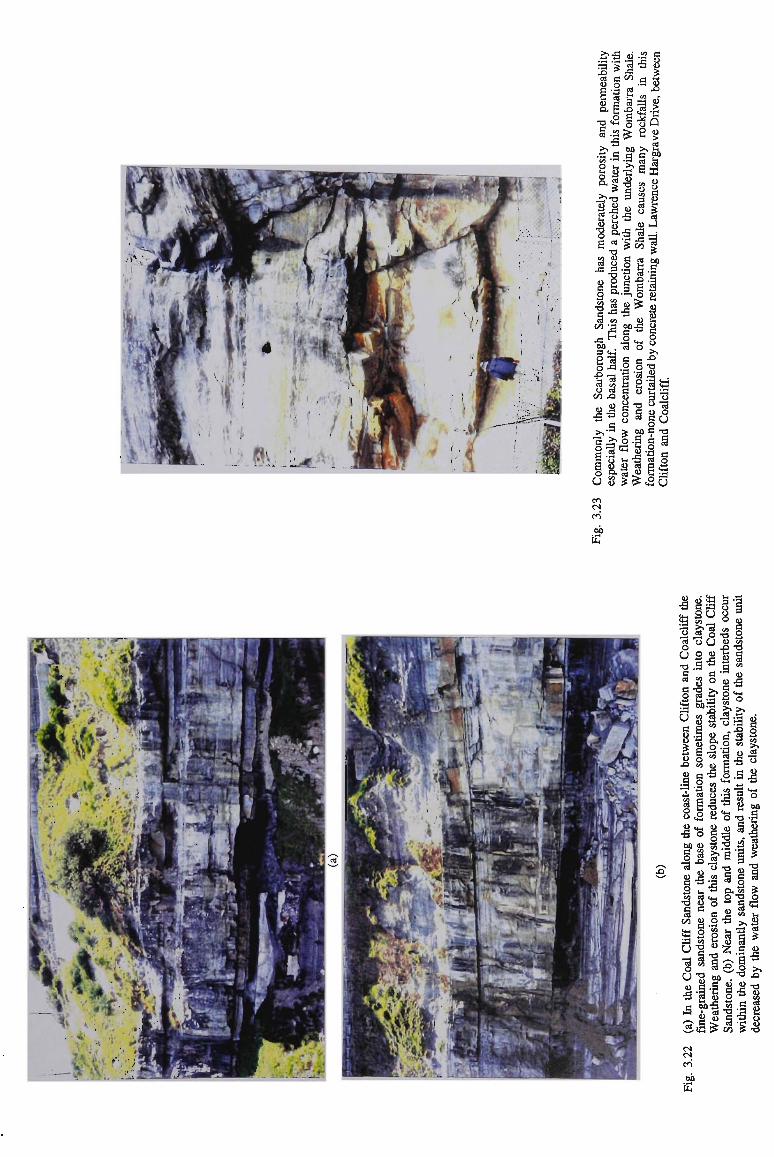
JO cd U g
w . a | cd
u a, T3 w 11 2> - «> 2> fck .ti 3 a a po
e
u o E * S3 « e
<u ^ 5 l
S 00 3 u 2 °*
- J -2 i -s
•8jj*s
21 3-3.2,
oo x> 3
5-s g §
5 T3
•a 3 . 2"1«S s'S ""^
o S u o 8 * g U
u 8 *£<2u cn CN
on
di .; S*-i ^ ^J
<H so a 3
75 £» « c« 5 « o Cj u <* o .g -o •a .3 ^ c M
S » S <u 3 8 o 0.5
« « « .§ .3 £ 11 Ji cd Cj
co q a
U US 'S «H
•sg _ so « o -a -c o =3 .„-12
8c2
•3 U'S 2lr2
"as g al S a M b o § '
i •§ g •
a ,£, o •a o - - ,-» DC.S8STJ 5 'S § 2 * § -a* 8^ Sf 8 v5« i> oo -o fN CN
00

FIGURES TO CHAPTER 4
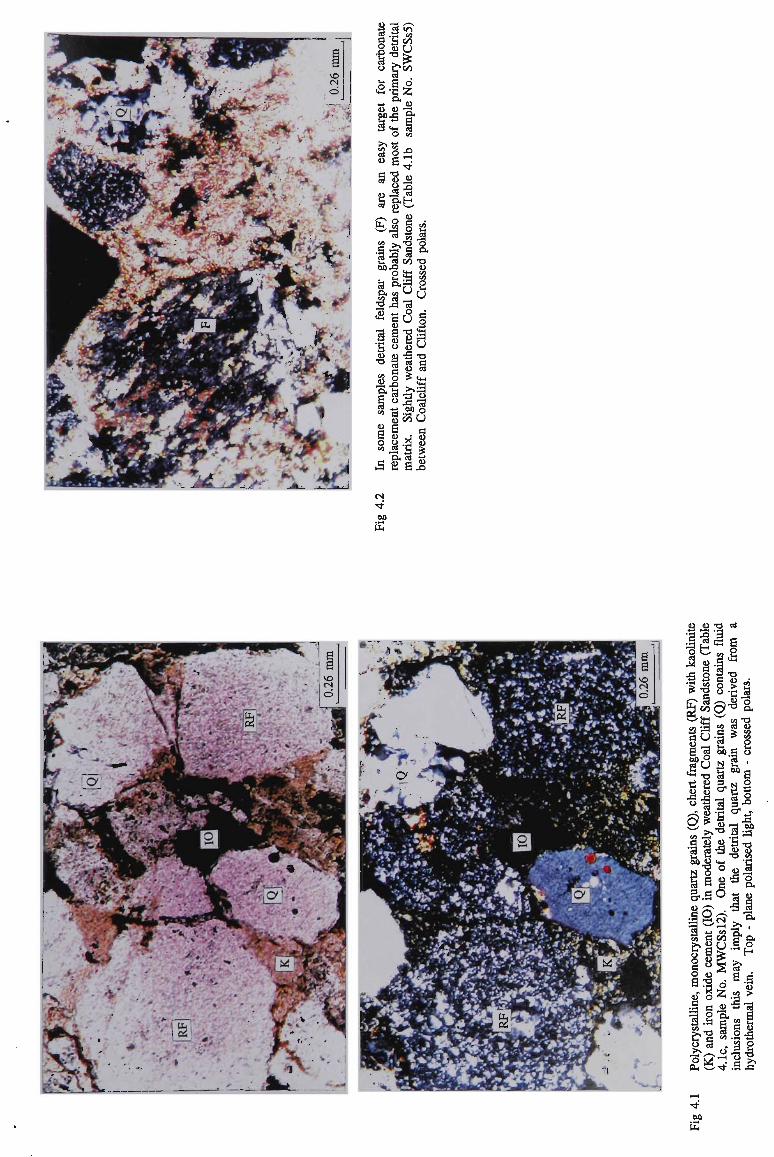
ag <d .a
R co
S 00 •2.U
3 o •a 2
5" 2 «i 2 ;
« s: 9"§J3
ag-b UH
cd CO 13
a s.g u
... o a CJ <D
S a •^ cd fi
flj
O X)
a
I cd
B O
8 CJ
_
co
U
| CO 3
B U
3 CO .j
.3 a a. cd
2 3
•a Q -B •a ao o
00
a
2 •a •3 § 1>2 •g co
U T3 cd
5 « 3 g
©.22 o ^» a.
ill? 3 « oo i So o
JfU§ "-1 -o a
•o
00
cd
S 2 2 S-o •a cd -S O g
I a a* co Jg
o a.
cd g
.-S § l.CS
ii co
if CJ
o a o <u D O
3 -a
1-1 xf > *-• co 73. a oo a a.
a
B S
- ™ « S3 o 5^1
OO
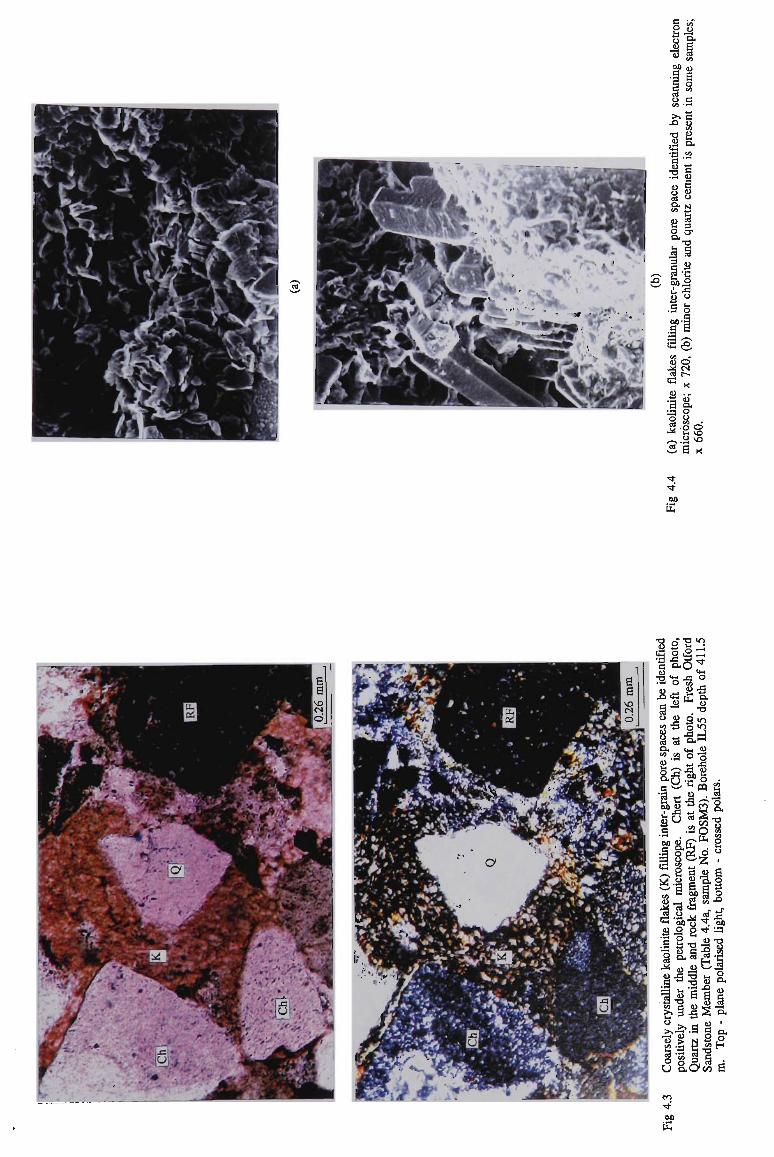
c c fa
k •j
8
t <»
00 o B c c 0 co
a o CO
c "-1 4-*
>> B .O T>
•c B a:
u <j
cd
S pa 2. CO
B
I o 8-3
a o a 3 cr o, -
•2$
3
1 OO i a _B
OO a
1 1/1
•o a
a ° XI cj
O a
a „
o o •a c 2 'B a 2 cd M /—\ cd
"3-f oo • M
KL,
CM
X
i) Q. O 8 . o o o Co 'a x
"8 2"2^
"2 "ft -*5. °
•° 't* li °-
a-8 -8 jo-5 o>r>
8 --ad a a °<M
9" «-• .a <0 co o "S
_ O-fl P
1-1 s—' ** o . « S3
id « 5J - 5 i X! w *5
S CJ <«S-o
I .so 8 •B rr co
•a o « o °
§ a—z • -2 gas ^ .a g §. 2 ^ 13 « o
a
00 rf
4 2 CJ ^. 0
1.2 *S4?.B <H oo"3 . oo
o - • • —
i * 11 s •* o.ac-s <D .a =3 i- 2 - a „ o« 'a •) 6 E g
SI a -8 H s •« 2 a
3 aSl s
oo S3

cd
O 3 * .* •s oo --' a -a w <~N"O
2uBa u cd oo , 5 a a §•
5 2 3f2
5 °* . aj 8 e
"•Sao
a -! °
a _ ~s 8 « ia CJ,
8
Cob • •- H ^
^ o
•3l"£ u 00.2
a a o T>
&a 3d 3 A
53 =3 <t! o co
Il-a-° a
o I-0* I
1 a-SZ V w ° - « « "B, O 2 O B „ _ ,c J3 a a o
OO
O P T ) C
a | 3*3 g CO •M _
o -o fl
erf* a co o
C-2 ^ g
:§. « -B «3
•" § a 3 2 *•*
- o
S «2 ,
* 1
u CO
•g oo-g .a
§1*33 •I laa-o
a g r. «
£^g 2 •! J <« « a S^-s,0-CJ o ^ op
.B cd cd
cd u "S- co sa " B p -1 a i£ cj
a o c >>cj *
oo?? 00 d
op S3
.a-S 9
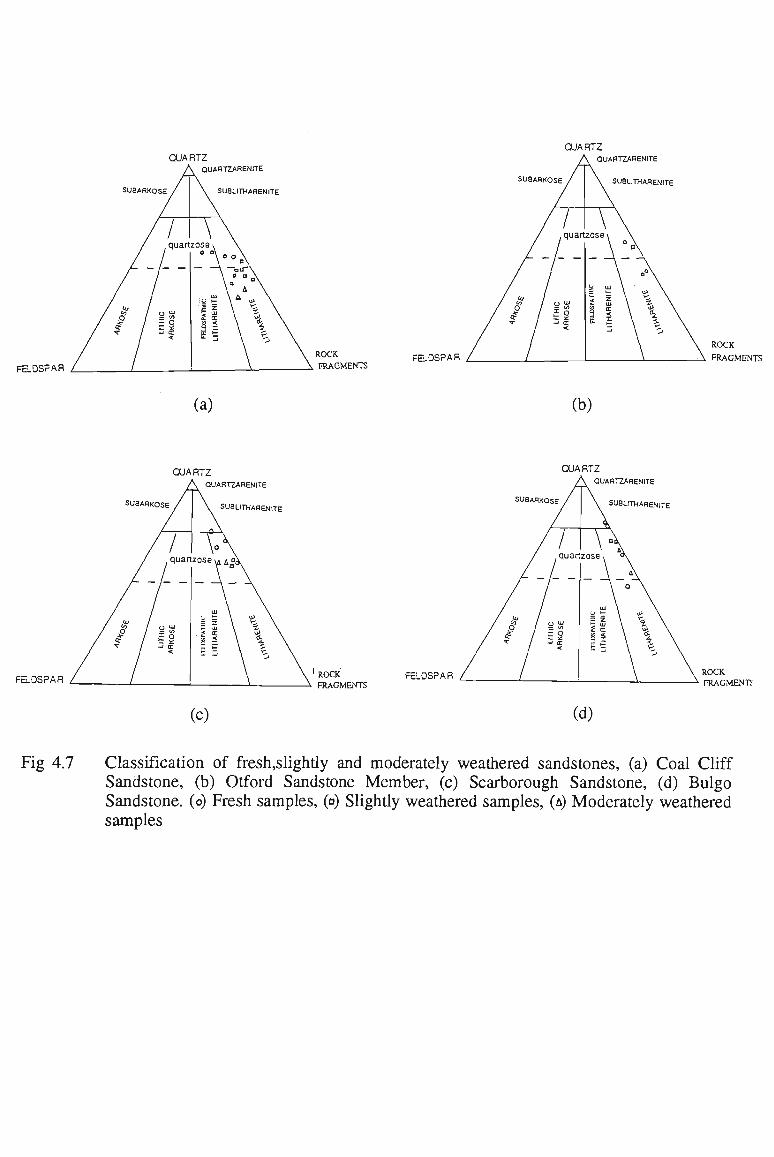
QUARTZ QUARTZARENITE
SUBUTHARENITE
QUARTZ
QUARTZARENITE
FELDSPAR
SUBARKOSE SUBUTHARENITE
ROCK
FRAGMENTS FELDSPAR
(a) (b)
QUARTZ
QUARTZARENITE
SUBUTHARENITE
FELDSPAR
SUBARKOSE
QUARTZ
QUARTZARENITE
SUBUTHARENITE
ROCK
FRAGMENTS FELDSPAR ROCK
FRAGMENTS
(c) (d)
Fig 4.7 Classification of fresh,slightly and moderately weathered sandstones, (a) Coal Cliff Sandstone, (b) Otford Sandstone Member, (c) Scarborough Sandstone, (d) Bulgo Sandstone, (o) Fresh samples, (o) Slightly weathered samples, (A) Moderately weathered samples
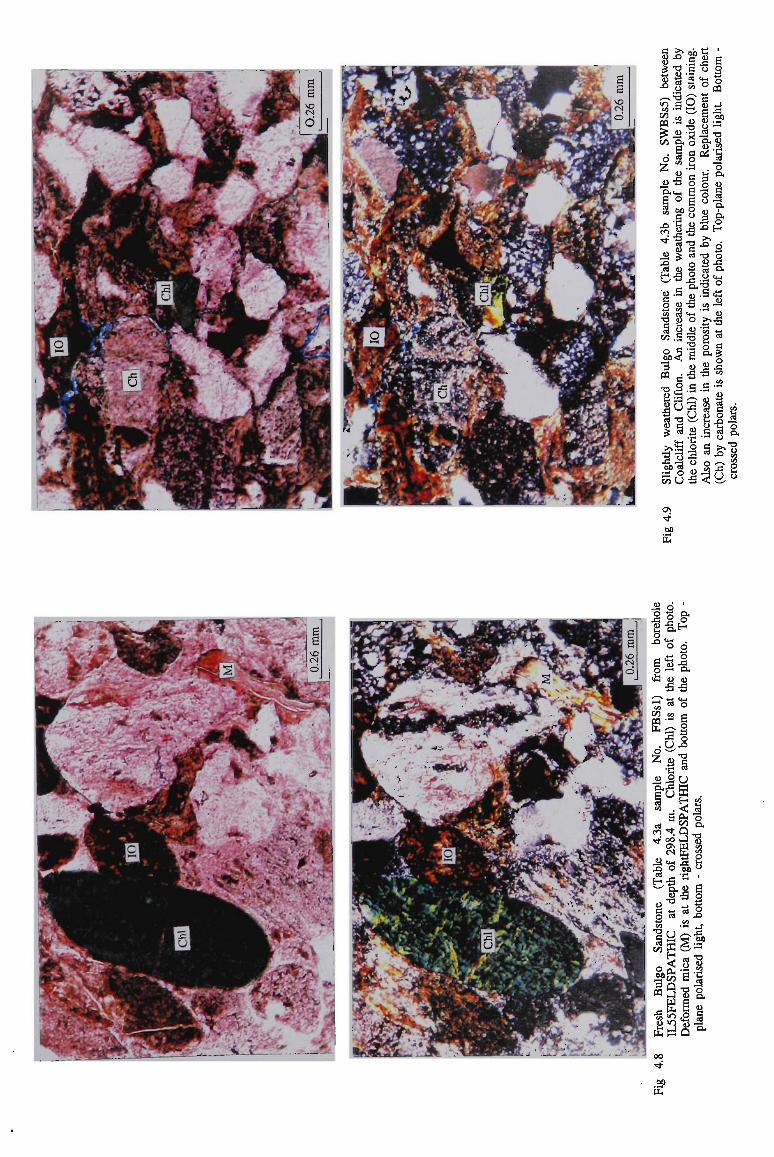
8-S0
HI \r> fl g
co a, 3 • S a
p
=1 a , B -B S.2f
a ^
00
a •a D<ci-i
B O
CO
a o
a a
oo o •3 ° G o cd T3
3S
•o.a o u co cd
9 aa co .3 -a
«*1 oo
I
•I 2 =i
I 9a a 73 3 MS
co CJ -5
oo
S3
£-a *! . "o »-i ex 3
2 a" o a CJ -zi
5 o •° 2 T3 O
2-S cd B" 2 <J-I
•12 .3. d
_ CO — '
"* *2
J5>-S CO *i O cd
o a a. 5
Ji-S •a co
a.a """ CO
Si? cd . cd a JO
p o a 2 a ° .3 n a.
9 CJ
o CJ cj
CO XJ
oo S3
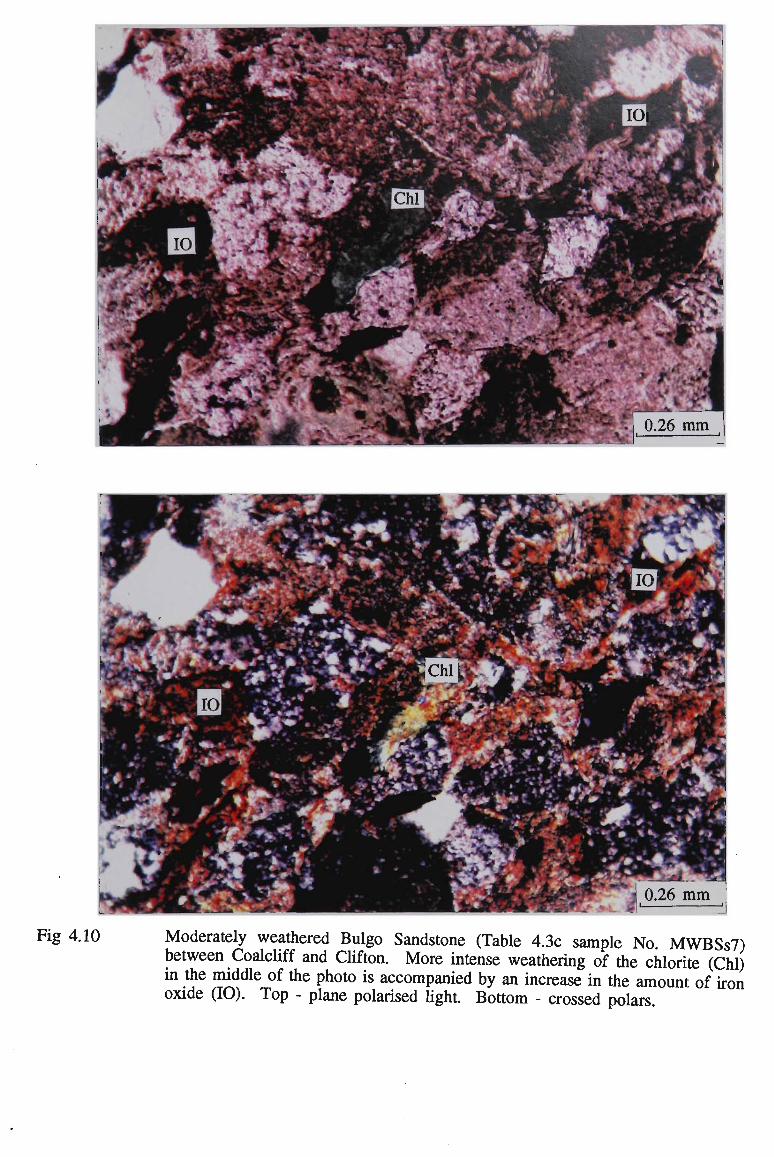
Fig 4.10 Moderately weathered Bulgo Sandstone (Table 4.3c sample No. M W B S s 7 ) between Coalcliff and Clifton. More intense weathering of the chlorite (Chi) in the middle of the photo is accompanied by an increase in the amount of iron oxide (10). Top - plane polarised light. Bottom - crossed polars.

20 -i
16
'B
U
1 ' ' ' ' ' ' M i i i i i i i i i i i i i i i i i i i i | i i i i i i i i i •
0 1 2 3 4
Grade of the weathering
Fig 4.11 Decrease in calcite content with an increase in weathering for Narrabeen Group sandstones, (1) fresh samples, (2) slightly weathered samples, (3) moderately weathered samples.
10-i
X
o c o &
6-
T i i r~i i i n j r*T~r-1 i n i i | i i i n i i i i | i n i i r n i r~
Grade of the weathering
Fig 4.12 Increase in iron oxide content with increase in weathering for Narrabeen Group sandstones, (1) fresh samples, (2) slightly weathered samples, (3) moderately weathered samples.
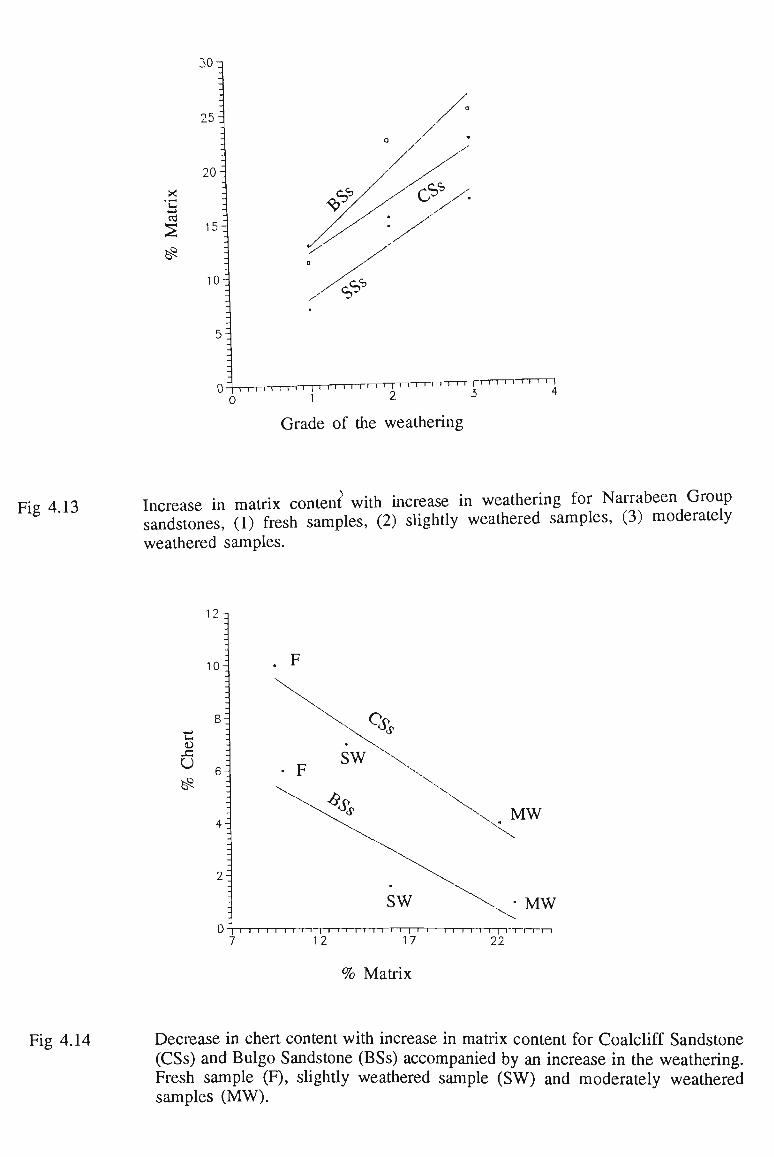
X
^
15
10
5-
0 i I I I I I I M I | I i i ' ' ' ' ' ' l ' |-r
0 1 2
•i l i I i I T ' ' ' ' ' ' ' ' ' '
3 4
Grade of the weathering
Fig 4.13 Increase in matrix contend with increase in weathering for Narrabeen Group sandstones, (1) fresh samples, (2) slightly weathered samples, (3) moderately weathered samples.
12a
10
u CD
U
4-
2-
. F
O
• F SW
4
SW
\ \ * MW
MW D i i i n i n r-1 i i i i i i r~i i ] i n i i i i i r-] n i—r~i—i
7 12 17 22
% Matrix
Fig 4.14 Decrease in chert content with increase in matrix content for Coalcliff Sandstone (CSs) and Bulgo Sandstone (BSs) accompanied by an increase in the weathering. Fresh sample (F), slightly weathered sample (SW) and moderately weathered samples ( M W ) .
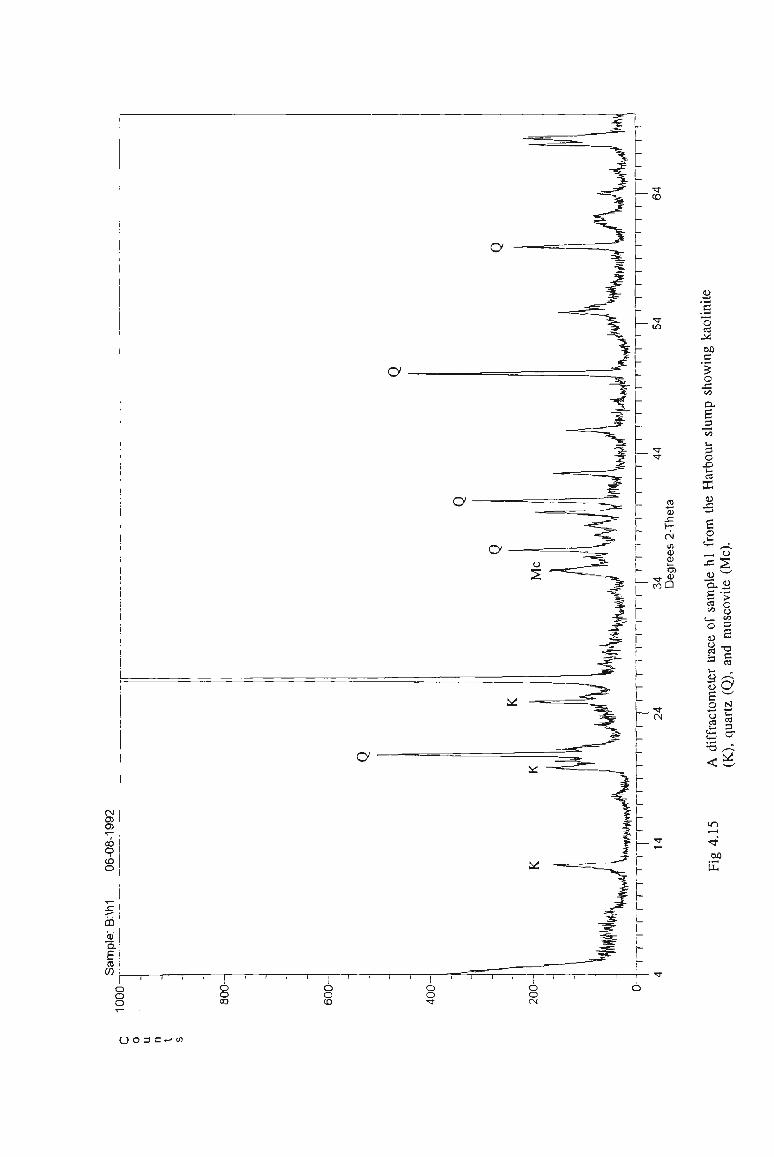
o
a
CD
•cr
cn 4-1 ID
CM
m <D C3)
C<->Q
CN 0> 0) I
CO
o CO
o
CD aj o. P 5 i CO ; o o o
CN
> I-O
^ —
X ~* r
^ L
r
o o CO
o o CO
o o
o o CN
CJ O 3 C-M CO
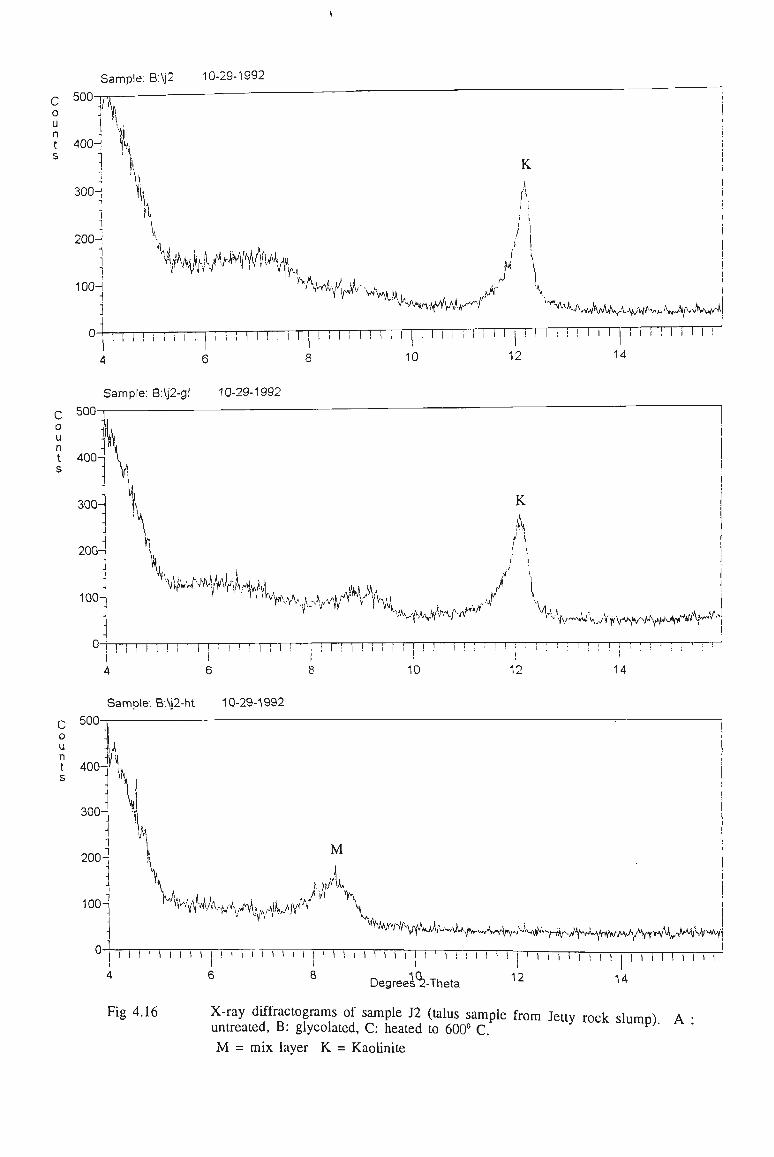
y
Sample: B:\j2 10-29-1992
r 500-T7
U
t 4 0 0 ^ 1
300-3
_j
•i
I
] 200-H
1 1 ]
100-1 -I ]
'\\
^h^l/^h«\ MJ,-. l r v v -v*v>ji M i
o ! I I l
4
i i ; i i i M i i i j i i i
6 8
n i i i i i i
10
K i
A '!
/ ! H \ i
r> I i ,Jr \ !
I | ! II Ill I ! '
12 14
Sample: B:\j2-gf 10-29-1992
c 500 o u n t 400-i s
300-
200-1
100-
K
t> \
•/ '~v^v^,^\y,^^r^s^/^AJ^^\^
,A-'j
0 ! I I I I I ! i I I I I I M I I I I I 4 6
Sample: B:\j2-ht 10-29-1992
! I I I ! I I ! I ! ! ! I I ! ! : M - i — i — ; — ' — • — r -I i I ! I i ! i
10 12 I
14
500-C o u n t 400-s
300-
A \
; 200-
100-
\ M
w^Vf^^'1^^
1 I I I I I M I ] ! I I I I I I I I 1 I I I I I I I I | I [ | 1 I I | || M ! I I | I | i | ! I I I I I I I I I I
6 8 Degree^-Theta 12 14
Fig 4.16 X-ray diffractograms of sample J2 (talus sample from Jetty rock slumo) A • nntrp.ntp.ri. B: elvcnlsifpH P- hpatoH tr> Anno n v>' untreated, B: glycolated, C: heated to 600° C.
M = mix layer K = Kaolinite

FIGURES TO CHAPTER 5
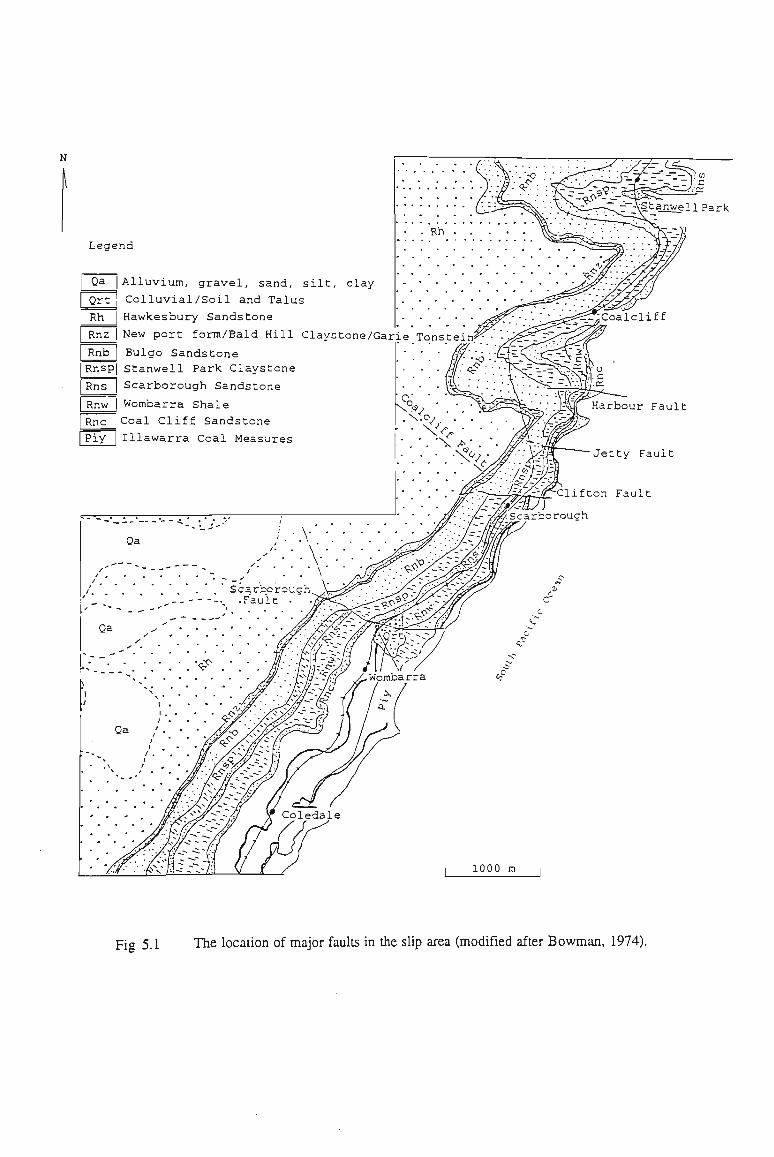
Leaend
Qa
Qrt Rh
Rnsp Rns
Alluvium, gravel, sand, silt, clay Colluvial/Soil and Talus Hawkesbury Sandstone
New port form/Bald Hill Claystone/Garie Tonstein^-
Bulgo Sandstone Stanwell Park Claystone Scarborough Sandstone
Wombarra Shale Coal Cliff Sandstone
Illawarra Coal Measures
-;Coalcliff
ur Fault
ty Fault
Fault
Fig 5.1 The location of major faults in the slip area (modified after Bowman, 1974).
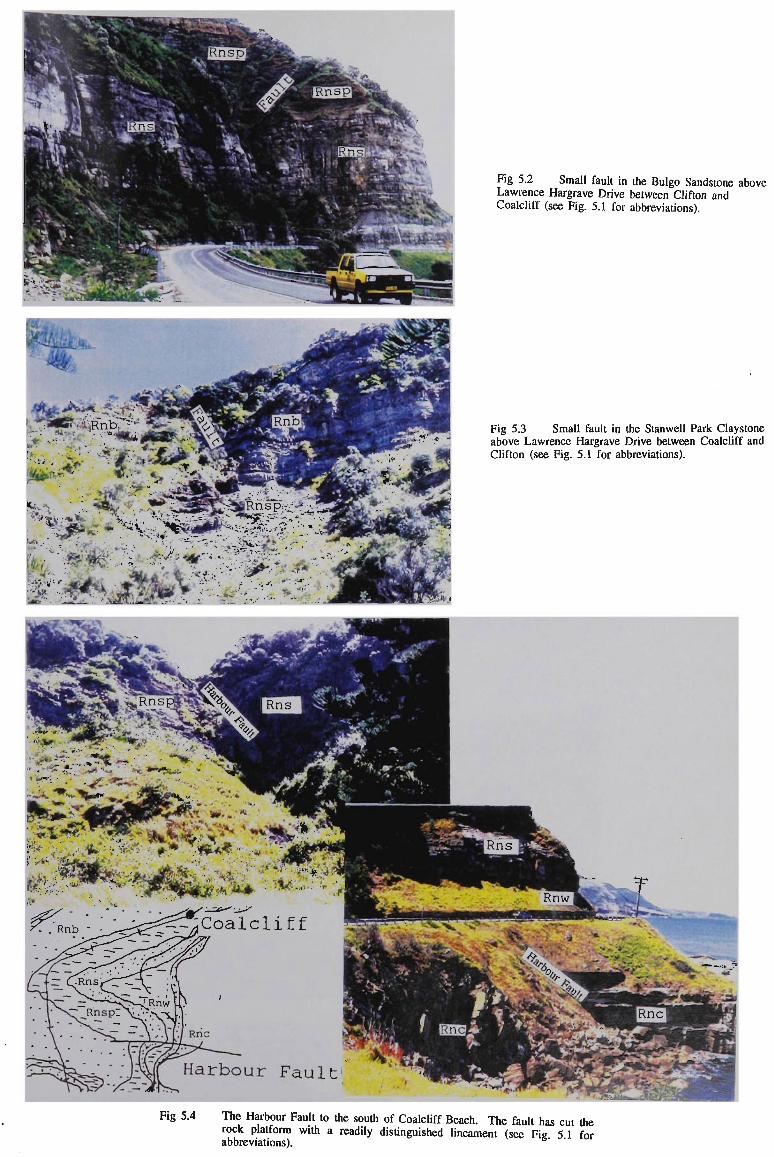
"*+n e»' 5
. SEES
ft>3 Xv
•
Fig 5.2 Small fault in the Bulgo Sandstone above Lawrence Hargrave Drive between Clifton and Coalcliff (see Fig. 5.1 for abbreviations).
,-r~- (Mil t Fig 5.3 Small fault in the Stanwell Park Claystone above Lawrence Hargrave Drive between Coalcliff and Clifton (see Fig. 5.1 for abbreviations).
Fig 5.4 T h e Harbour Fault to the south of Coalcliff Beach. T h e fault has cut the rock platform with a readily disdnguished lineament (sec Fig 5 1 for abbreviations).
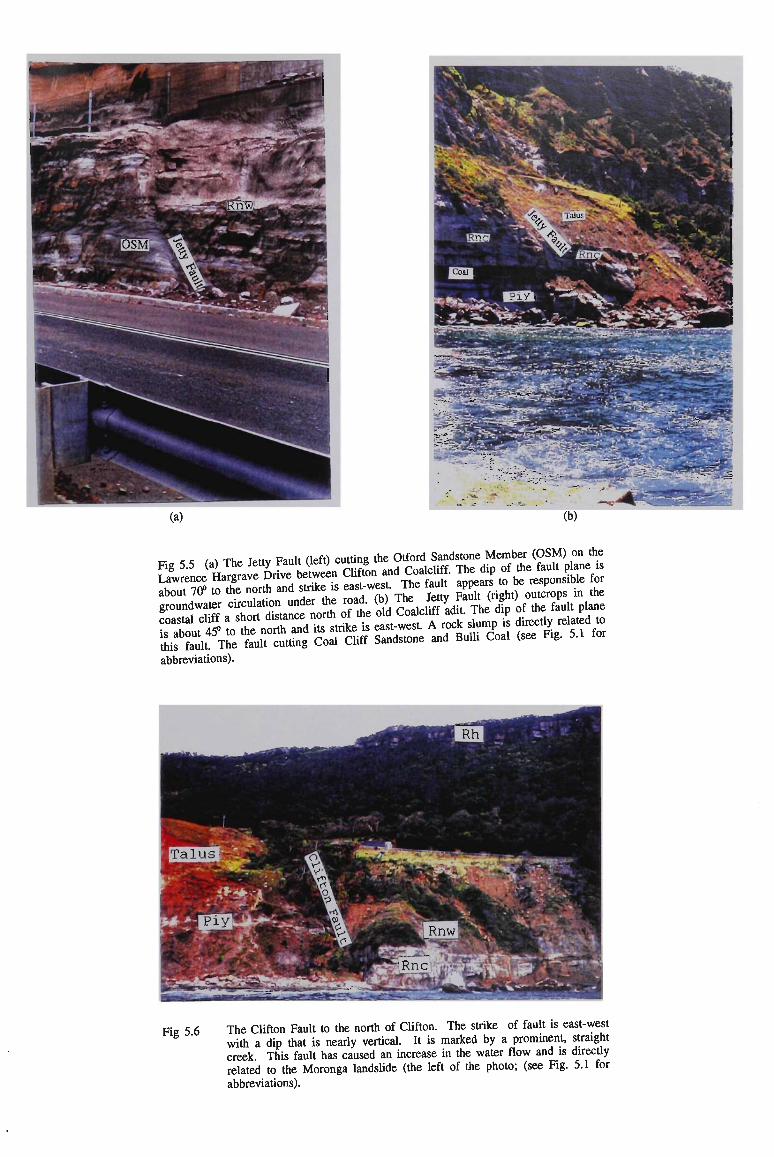
c- < « ^ The Jettv Fault (left) cutting the Otford Sandstone Member (OSM) on the
about 70P to the north and strife is east-wes The fau t J^ » * J^, in the groundwater circulation under the r o a d ^ T h ^ J ^ y ^ fa
Pult pla„e
abbreviations).
Fie 5 6 The Clifton Fault to the north of Clifton. The strike of fault is east-west " with a dip that is nearly vertical. It is marked by a prominent, straight
creek This fault has caused an increase in the water flow and is directly related to the Moronga landslide (the left of the photo; (see Fig. 5.1 for abbreviations).
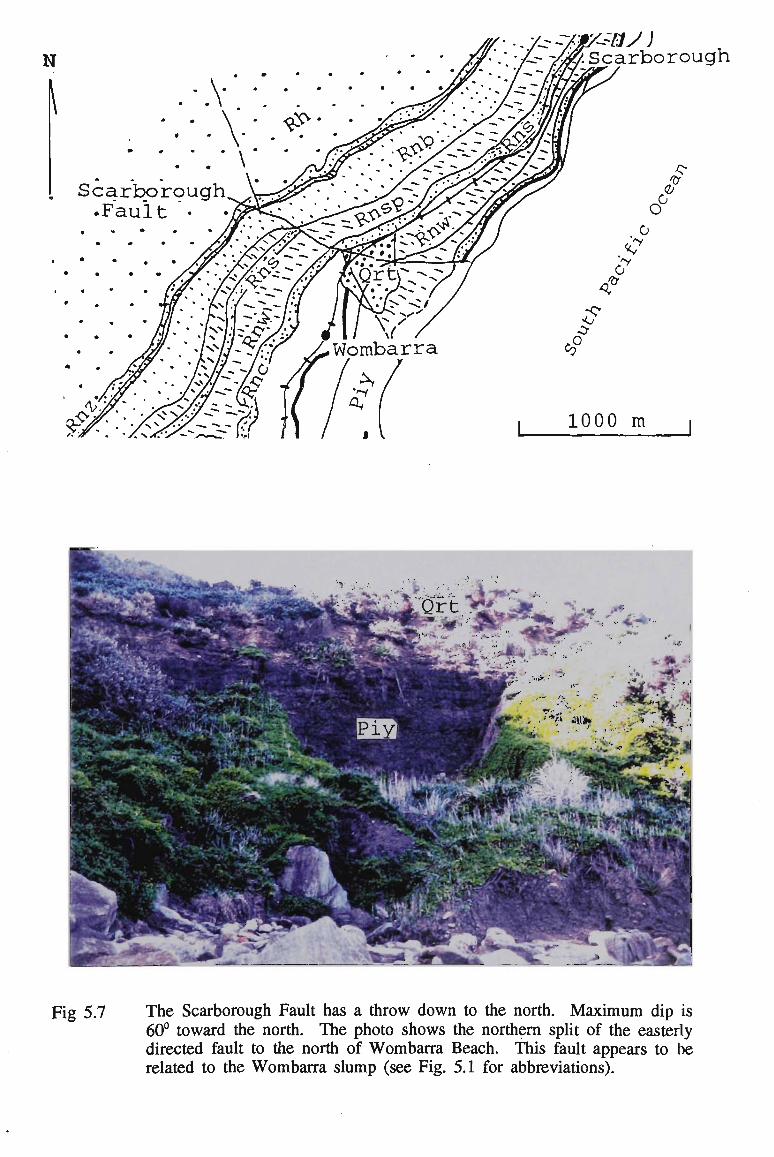
N
Scarborough •Fault "•
Scarborou
J?
c ft
o
1000 m
Fig 5.7 The Scarborough Fault has a throw down to the north. Maximum dip is 60° toward the north. The photo shows the northern split of the easterly directed fault to the north of Wombarra Beach. This fault appears to be related to the Wombarra slump (see Fig. 5.1 for abbreviations).
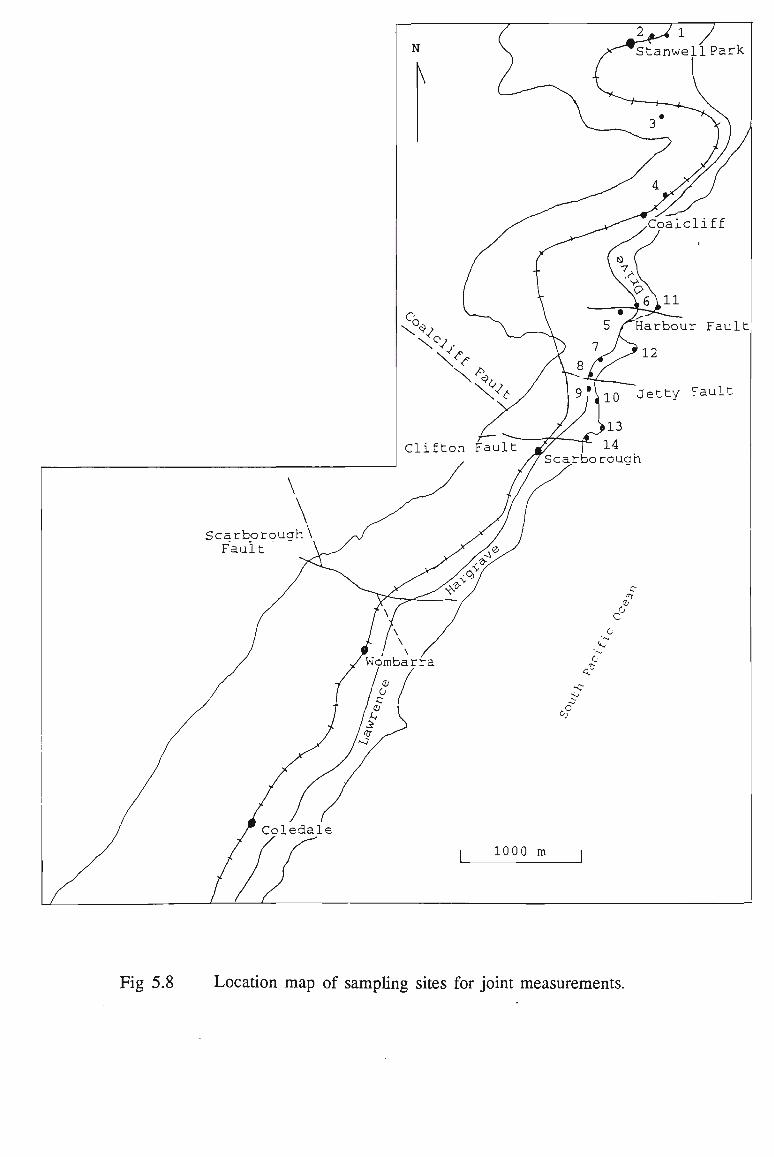
\
\ Scarborough\ Fault ' \ '
/ F Coledale
/ iff
N \
\ £_
C] .ifton Fault
AAA \ ^AAf
f\ / 9 ! \ /
y Wombarra / <D f <-> /
/ c / / ru
| 1000
/X^^Stanwell Park
V _ ^ 7 ^ ^
^^A A^J •^^Coal c 1 i f f
T vA.
/ \ 8
9
5 ,T Harbour Fault
1AA1-2 Jio Jetty Fault
_>13
~t/~~~^~ 14
"/Scarborough
c° . 0 C
-c
m ,
Fig 5.8 Location map of sampling sites for joint measurements.
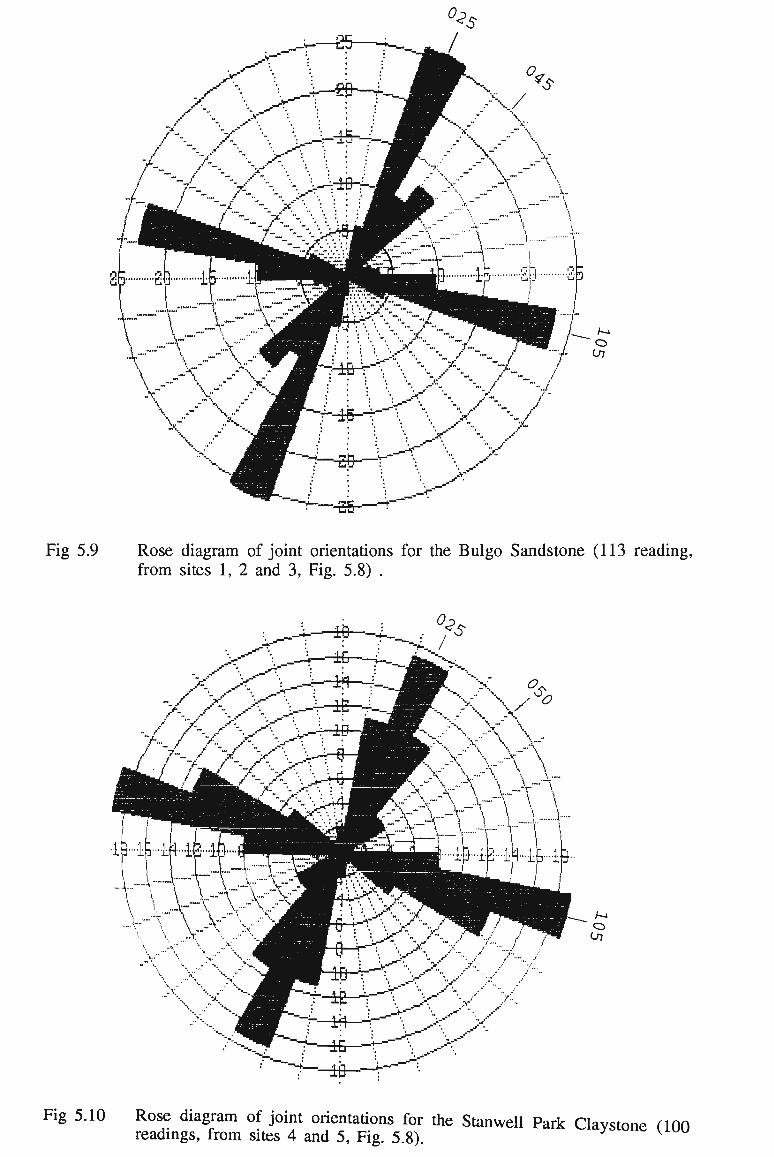
Fig 5.9 Rose diagram of joint orientations for the Bulgo Sandstone (113 reading, from sites 1, 2 and 3, Fig. 5.8) .
Fig 5.10 Rose diagram of joint orientations for the Stanwell Park Clavstone flOO readings, from sites 4 and 5, Fig. 5.8).
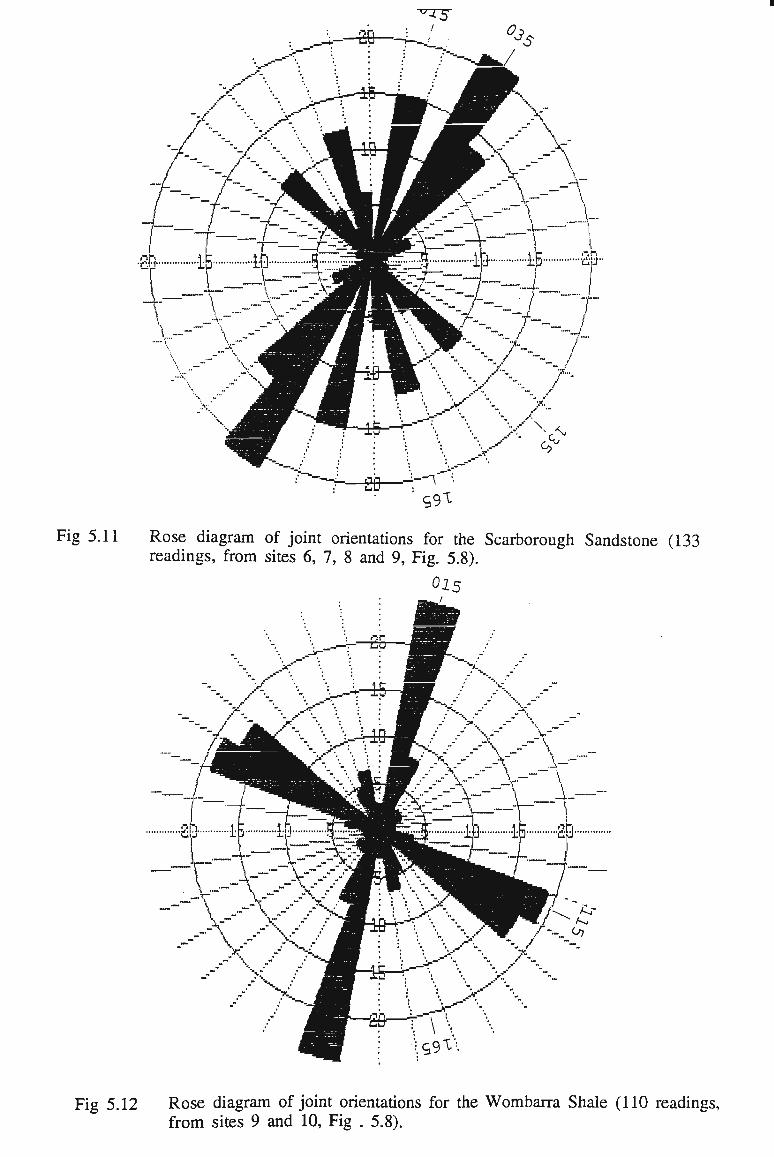
Fig 5.11 Rose diagram of joint orientations for the Scarborough Sandstone (133 readings, from sites 6, 7, 8 and 9, Fig. 5.8).
Fig 5.12 Rose diagram of joint orientations for the Wombarra Shale (110 readings, from sites 9 and 10, Fig . 5.8).
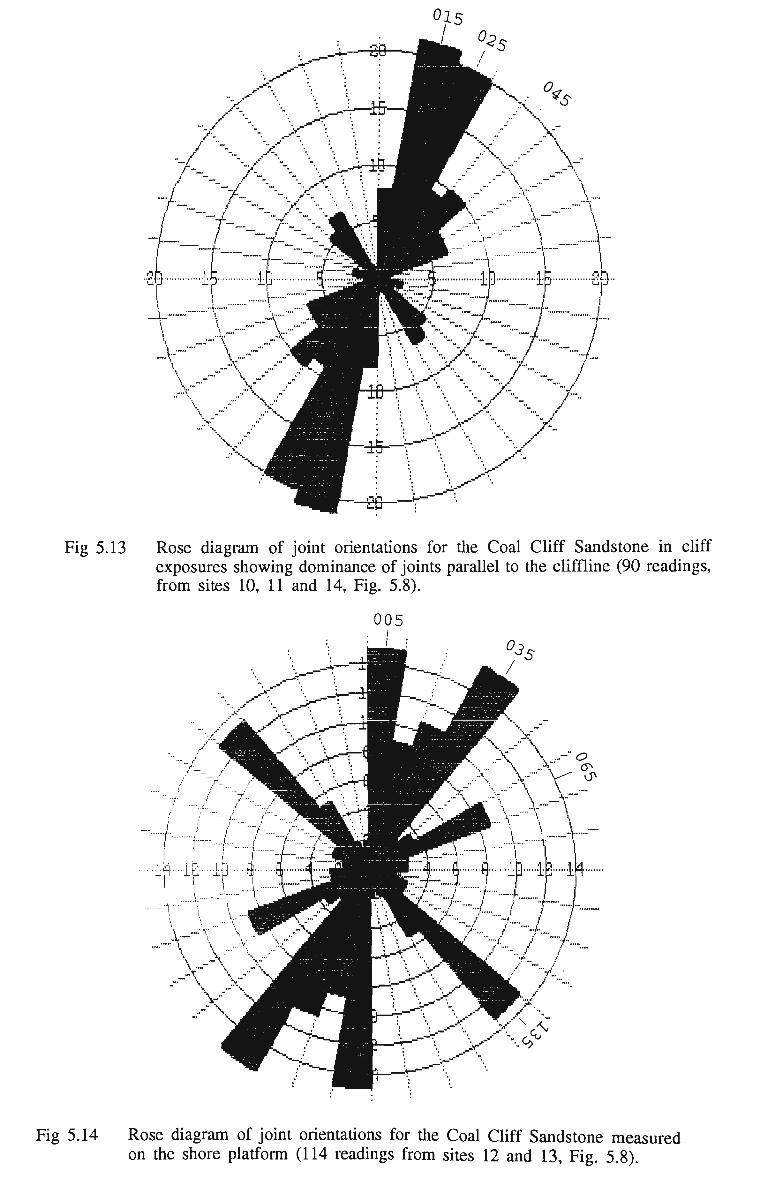
• - /
r-
i-Sf T^fc "Jf tp ::::3
\ \
-I
-- /
Fig 5.13 Rose diagram of joint orientations for the Coal Cliff Sandstone in cliff exposures showing dominance of joints parallel to the cliffline (90 readings, from sites 10, 11 and 14, Fig. 5.8).
Fig 5.14 Rose diagram of joint orientations for the Coal Cliff Sandstone measured on the shore platform (114 readings from sites 12 and 13, Fig. 5.8).
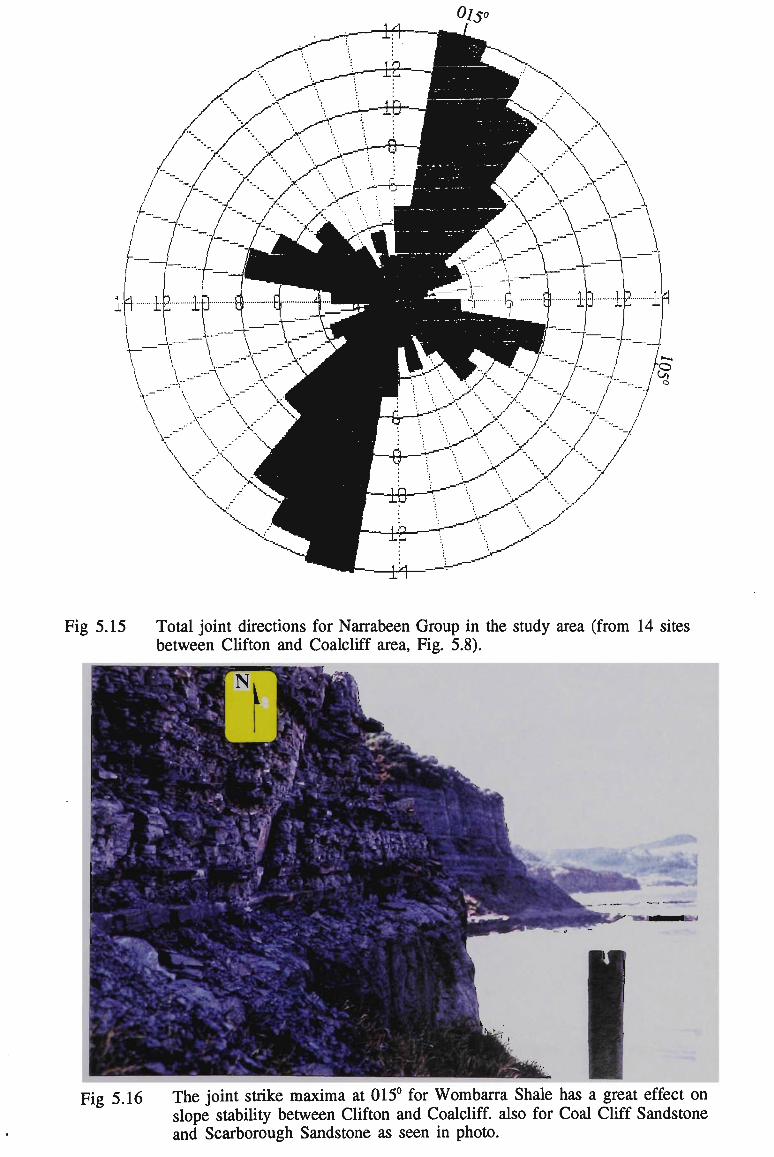
Fig 5.15 Total joint directions for Narrabeen Group in the study area (from 14 sites between Clifton and Coalcliff area, Fig. 5.8).
Fig 5.16 The joint strike maxima at 015° for Wombarra Shale has a great effect on slope stability between Clifton and Coalcliff. also for Coal Cliff Sandstone and Scarborough Sandstone as seen in photo.

/C XC / s/v a) Jointed rock mass, no pronounced X > \\
effects of previous shearing displacement
b) Similar rock mass, fault present;/ J
Fig 5.17 Significance of faults in slope stability problems (after Patton and Deere, 1971).
SIGNIFICANT STRENGTH & PERMEABILITY CHARACTRISTICS
Average permeability & strength of country rock.
High permeability zone
Low permeability low strength zone
Low to high perm.
low to moderate strength zone Low permeability low strength zone
High permeability zone
Unaffected (country)
rock (e) Fractured rock (d)
Slickensided, striated surface (c)
Fault Gouge (b)
Fault breccia (a)
(with gouge) \ Fault gouge(b) - Slicken, str. surface (c) • Fractured rock (d)
Unaffected (country) rock (e)
Fig 5.18 Typical cross-section of a composite fault (after Patton and Deere, 1971).
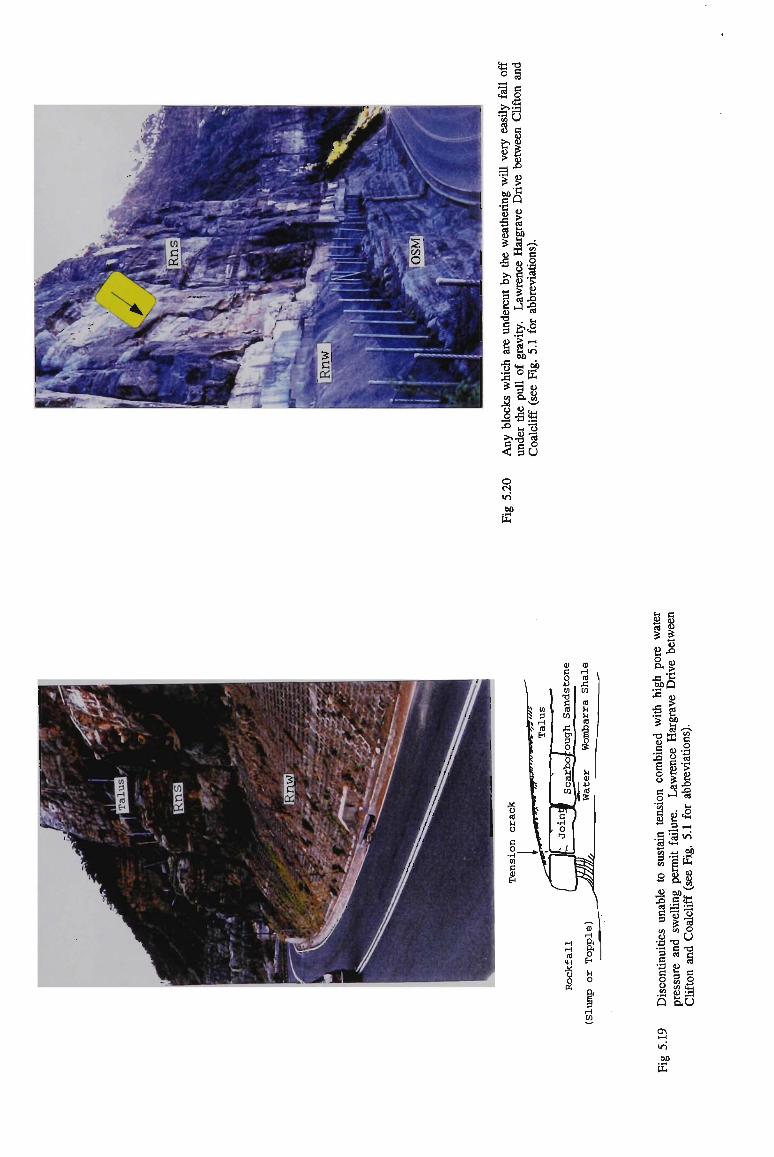
SB o
4-1
if > =i
'% 00
e •n cd
<u •S
•o
§ c o Xi
U c 8 XJ
g •d
Q
1 £? cd
as >> c X>
0
T3 C 9
s J3
o 2 *
J2 o _2 xi Sj
3 o <N w-i 01
iS
i2
/-N CO
a I cd
1 S xi J
00
o
•a IH
•S »—i
00
18 o.
•s t-l
c 3
>£• SB 73 -a o U
Ui
cd is
ss o J3 00
'2
'$
CJ
g £ E o o e .2 *CO C
«-» a 'B CO 3 CO g
CO 3 cd c s CO <D •a *3 c •a c o u v.
s o\ T—
m
c <0
<D £1
Q
cd w 00
DC CD
o
ed j
a 0
'S « 4-t • t-l
I ft OO B r^4
o £ CO
•o
i P
2
^-N CO
c o 2 >
x>
•s 1-
.2 i—i
vS
eb E 8 CO N— '
"o •a o u T3
S 1= Q CM ^
o.O
00
E
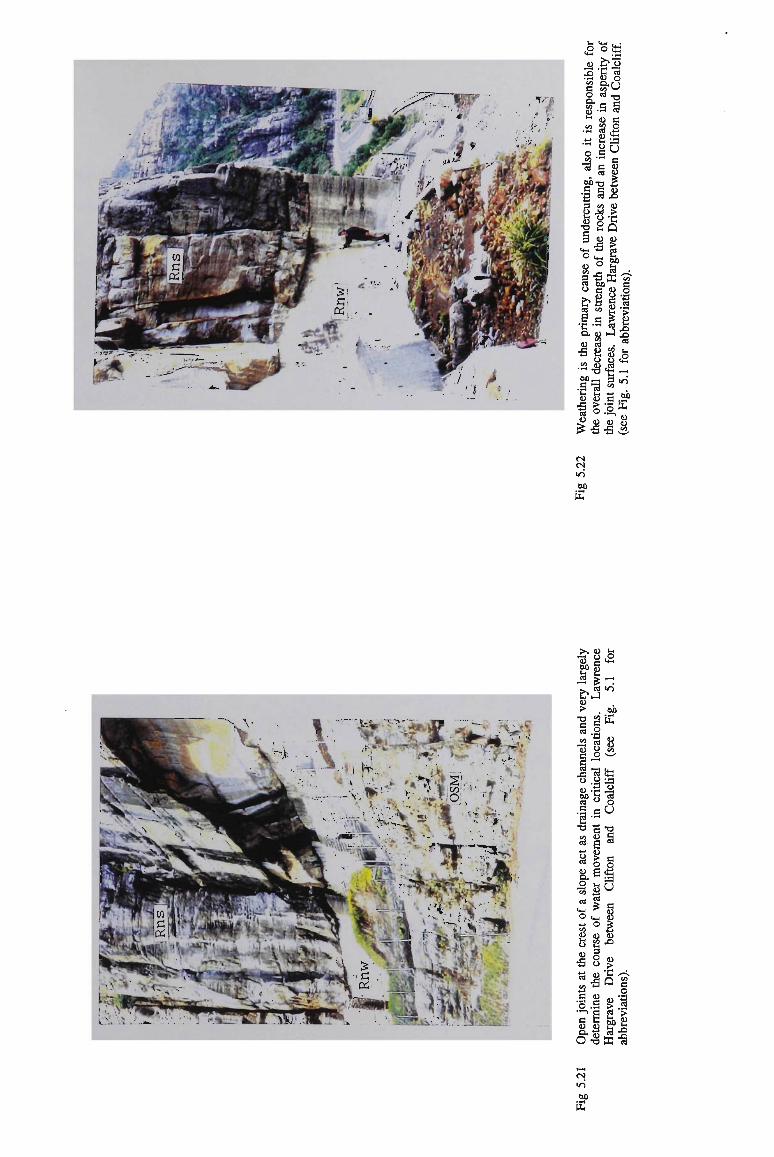
•i t-l aJ C4_i rt3
^ fl • «H <D O
•-DC
.a 8|
.S8S o .s 73 S8 OOx, £ C e o
•gs* 3 •a
o^ &
° ° I? S8. ?P™ c
J3 £ SO
cd oo O fl o
«* t/> jy *r* 3 » K
a. <D J £ o 8 . «
B U S .S3 8 J"2 §00— 3 ^
1 o .Ufc
CN
00
E
xfH o CO fl «B
.3 £~.
> . 00
- jj 8 a) 3 x! " S3 U . U 3 00 h « cd ° o
.5 eU 2'" "O fl -o
a I a s P « CI, -^
co
b a x^§ •5 o cd CO
a*
;s.s 3 C CO CO
£•« O T3
CO
> •c .
Q a o
£ -2 2 >
&£ DC-S
<N IT)
00
E
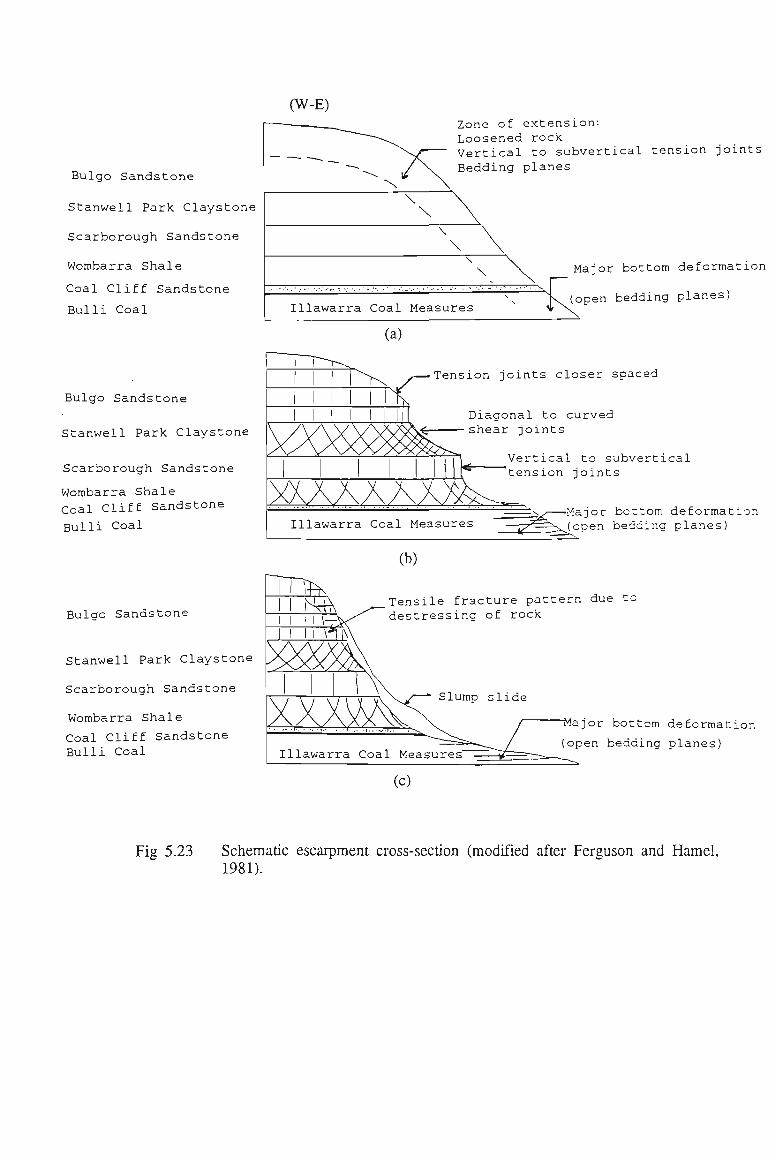
(W-E)
Bulgo Sandstone
Stanwell Park Claystone
Scarborough Sandstone
Wombarra Shale
Coal Cliff Sandstone
Bulli Coal
Zone of extension: Loosened rock Vertical to subvertical tension joints Bedding planes
\ \
\
\
Illawarra Coal Measures
Major bottom deformation
(open bedding planes)
(a)
Bulgo Sandstone
Stanwell Park Claystone
Scarborough Sandstone
Wombarra Shale Coal Cliff Sandstone
Bulli Coal
Bulgo Sandstone
Stanwell Park Claystone
Scarborough Sandstone
Wombarra Shale
Coal Cliff Sandstone Bulli Coal
Tension joints closer spaced
Diagonal to curved shear joints
Vertical to subvertical tension joints
Major bottom deformation (open bedding planes)
(b)
Tensile fracture pattern due t; destressing of rock
Slump slide
"Major bottom deformation
(open bedding planes)
(C)
Fig 5.23 Schematic escarpment cross-section (modified after Ferguson and Hamel, 1981).
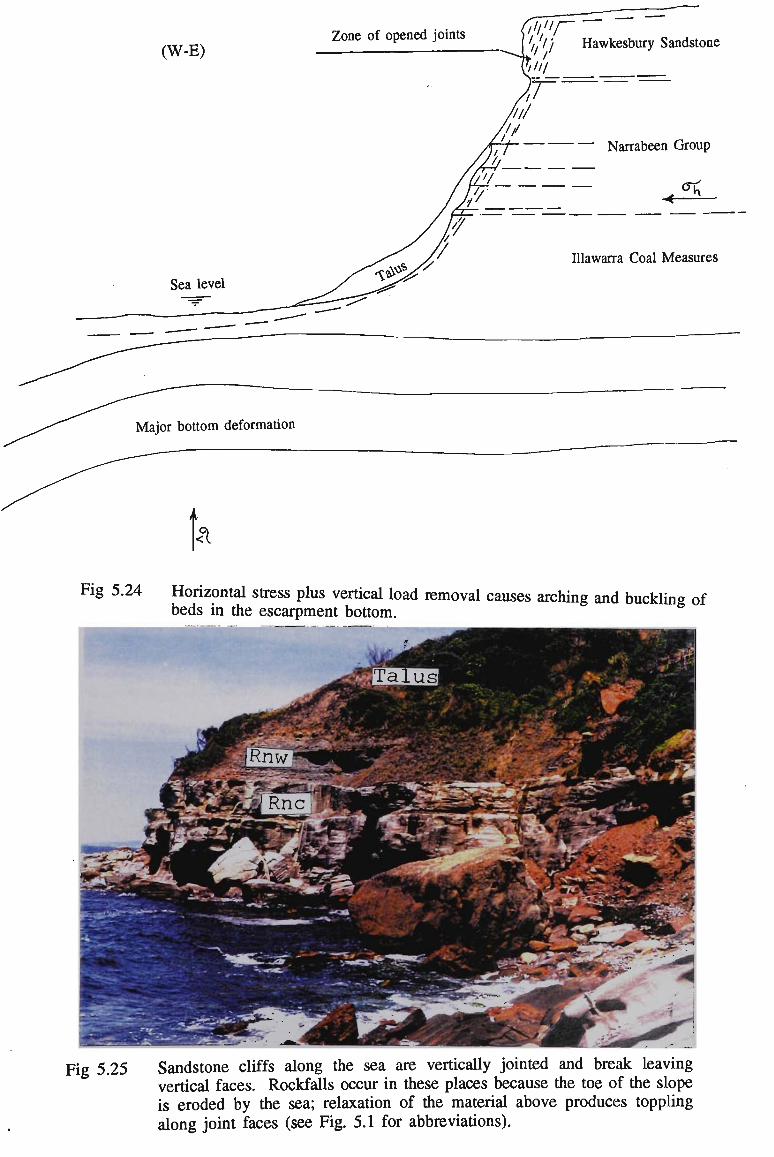
(W-E) Zone of opened joints
-H-' JI'I'I— '/.// Hawkesbury Sandstone
Major bottom deformation
Illawarra Coal Measures
<°l
Fig 5.24 Horizontal stress plus vertical load removal causes arching and buckling of beds in the escarpment bottom.
Fig 5.25 Sandstone cliffs along the sea are vertically jointed and break leaving vertical faces. Rockfalls occur in these places because the toe of the slope is eroded by the sea; relaxation of the material above produces toppling along joint faces (see Fig. 5.1 for abbreviations).

FIGURES TO CHAPTER 6

CD <U l_
TO SJ cn •_ CD X. u CO L.
1_ CJ 4-J
TO 2 T3 C 3 0 L.
cn
XL *-/ — 2 CJ c •— ~-u V T3
l/l
— CO > CJ — L. CJ 4-1
CD
2
„—.
.c 4-1
CL CJ T3
cn c .— l/l
ro OJ L.
u c —
LU 1-< 2 Q CO •Z. LU n CL
o o ex. _l tD CO
J Z < —
o — 2 Q- O > -1 h- Ll_
r-o\ r-H
a cd I--a c
c cd
C O
u ^ C4-1
cd
C/3
Q.
H 3 CQ
LU
Z3 1-< ex LU H » — 1
_I LU U
_l — < H u u •— < z ce X 0_ CJ LU 2 h- — O LU Q tD 2
ZD 2 O •— LL.
z 2: 0 0 2: Q S:_J O LU (_) CO
0 h-
_l LL' 1
_l <
ex < D-
Q LU S Z) CO CO <
LU 2 —1 O Cfl _l< LL. h-
cx ex LU LU
l-H < < 3: 2 QC3 2 z: 0 0 ex ex. tD CD
'cd ^ ^
£ O
a u
-a c 3 p S-i
C4-I
O c 0 Cfl
•c cd Cu
6 0
u
^H
vd • i-H
PH
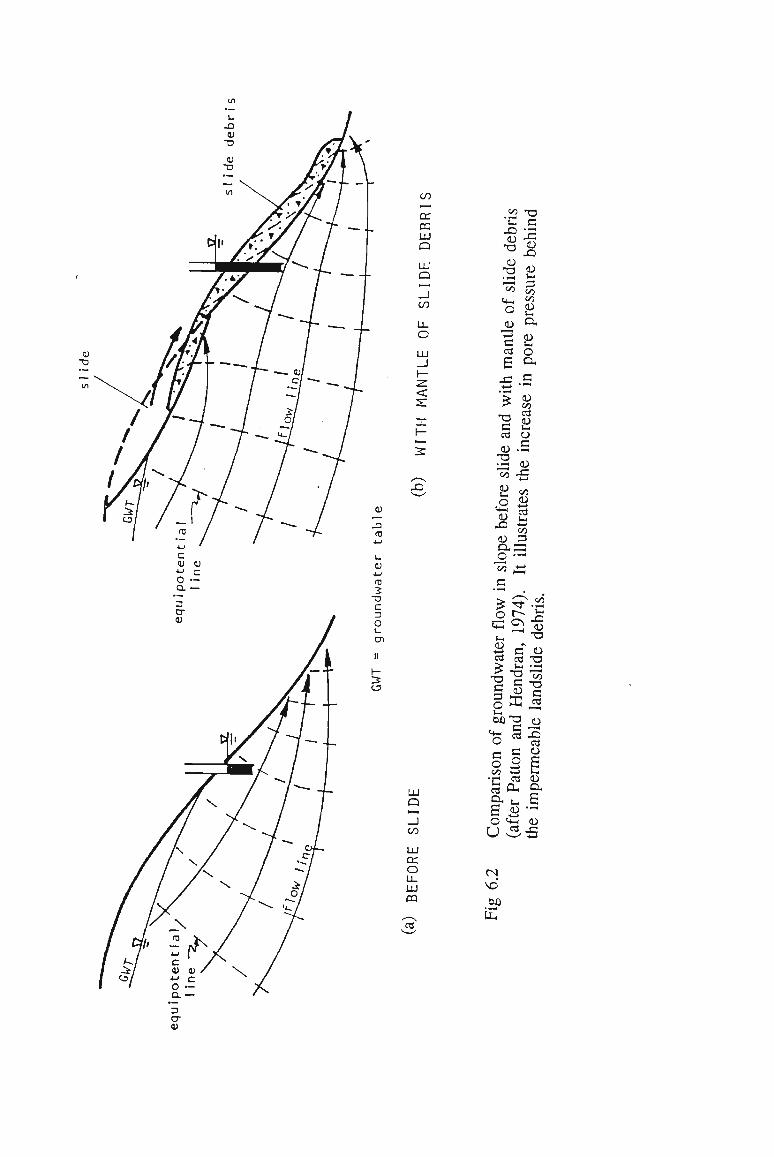
3 CT
CO .— J3 TO 4-1
L. CJ 4-1
TO 2 C 3 o L.
cn II h-
CJ
CO _
03 LU a LU
a t—,
_ i C O
u_ o LU _J h-•z. <
r-•—• 2
i*1-"N
JD
LU Q
—1 CO
LU CC O LL LU P3
C3 TJ
cu -^ • s ^ (L)
•a p
Of si
ressu
tu o,
c a cd o
E o-4—> " " "
>* c/3
and
crea
.. c
slide
he i:
+-> <U rn C 53 O CD ^ cd u 2
pe b
llust
o •-* « « c • 1—1 ,
£ ^.{S
ter flo
n, 197
e debr
cd cd "O
of groundw
and Hendr
able landsli
c c <u
§ o £ u/ w H
C/3 4_> tn
•rl cd <U
& u s E a-O <+-i dJ
W V-' 4—1
CN
*d 00
E cd
3 CT CJ
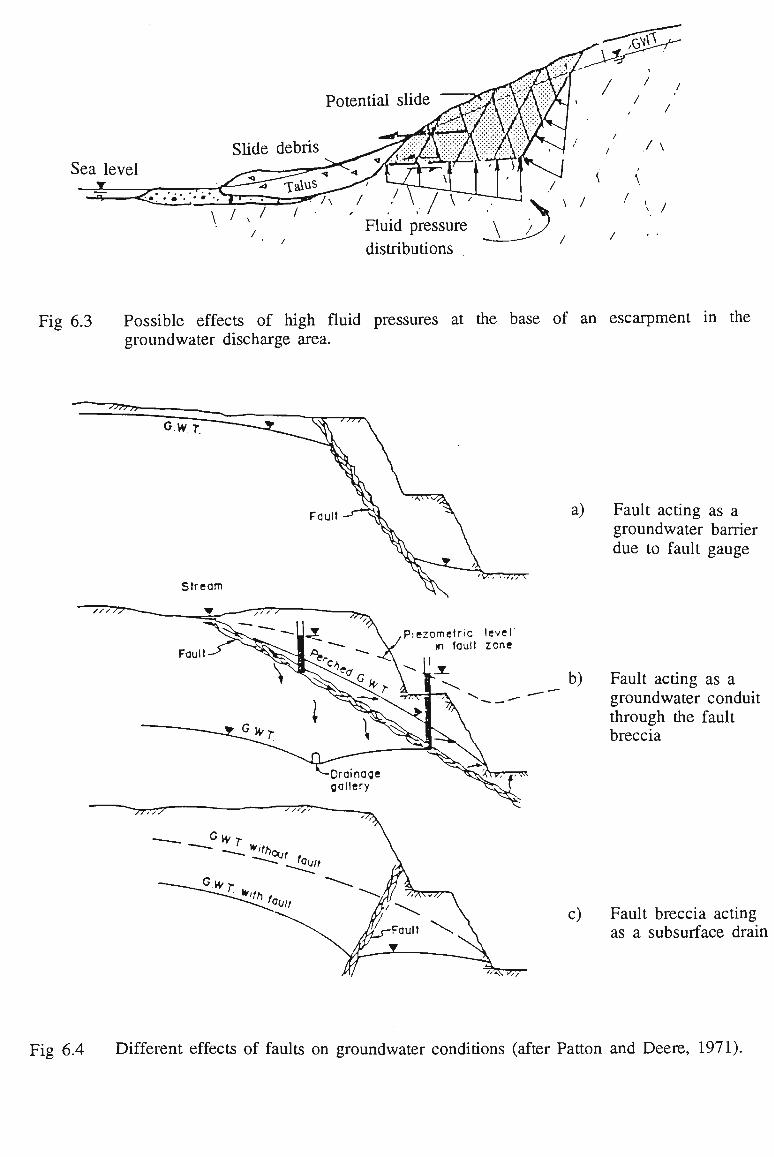
Sea level
Potential slide
\ / */ ' \l Fluid pressure distributions
6.3 Possible effects of high fluid pressures at the base of an escarpment in the groundwater discharge area.
a)
b)
Fault acting as a groundwater barrier due to fault gauge
Fault acting as a groundwater conduit through the fault breccia
c) Fault breccia acting as a subsurface drain
6.4 Different effects of faults on groundwater conditions (after Patton and Deere, 1971).
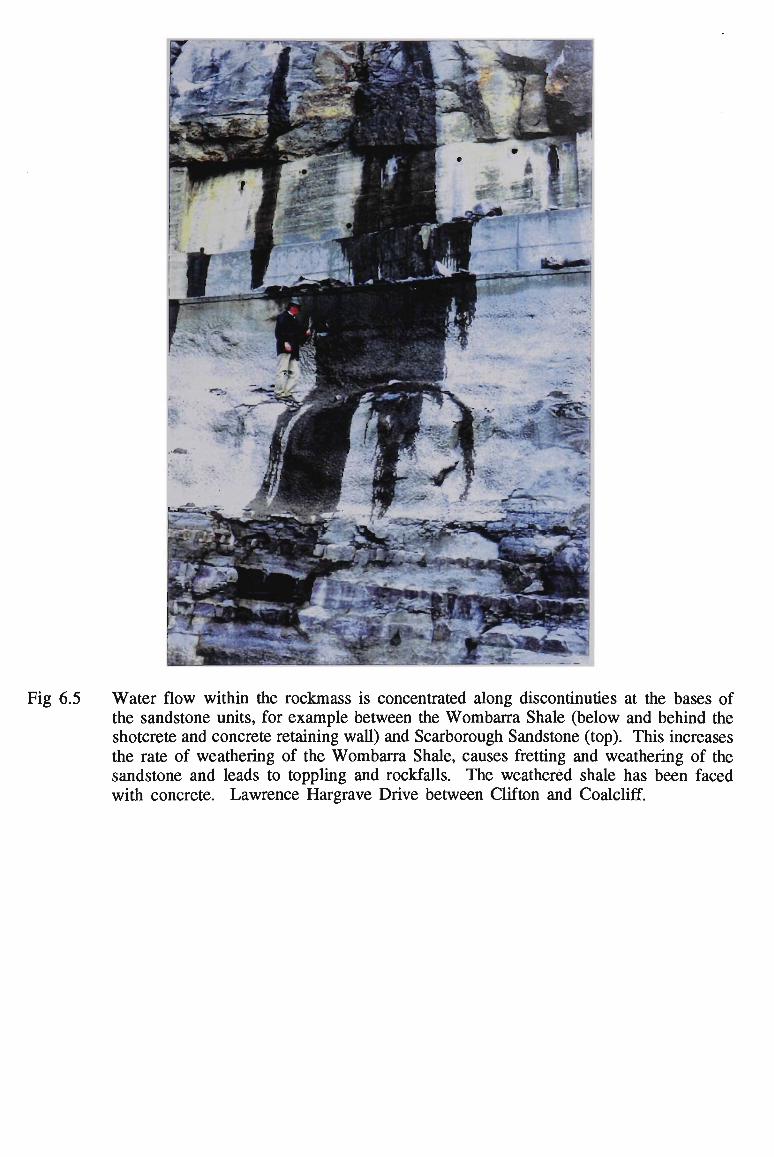
Fig 6.5 Water flow within the rockmass is concentrated along discontinuties at the bases of the sandstone units, for example between the Wombarra Shale (below and behind the shotcrete and concrete retaining wall) and Scarborough Sandstone (top). This increases the rate of weathering of the Wombarra Shale, causes fretting and weathering of the sandstone and leads to toppling and rockfalls. The weathered shale has been faced with concrete. Lawrence Hargrave Drive between Clifton and Coalcliff.
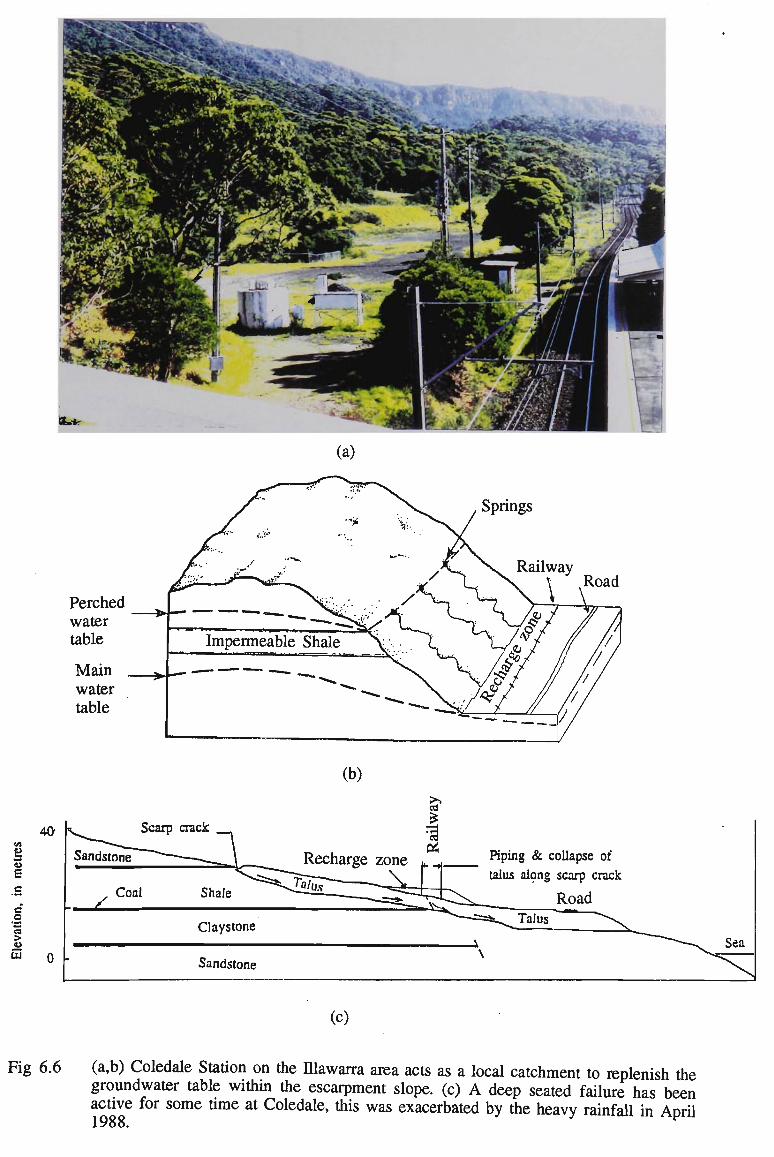
Perched water table
(a)
Main - — • — water table
40 Scarp crack
(b)
Piping & collapse of
talus along scarp crack
Road
(c)
6.6 (a,b) Coledale Station on the Illawarra area acts as a local catchment to replenish the groundwater table within the escarpment slope, (c) A deep seated failure has been active for some time at Coledale, this was exacerbated by the heavy rainfall in April 1988.
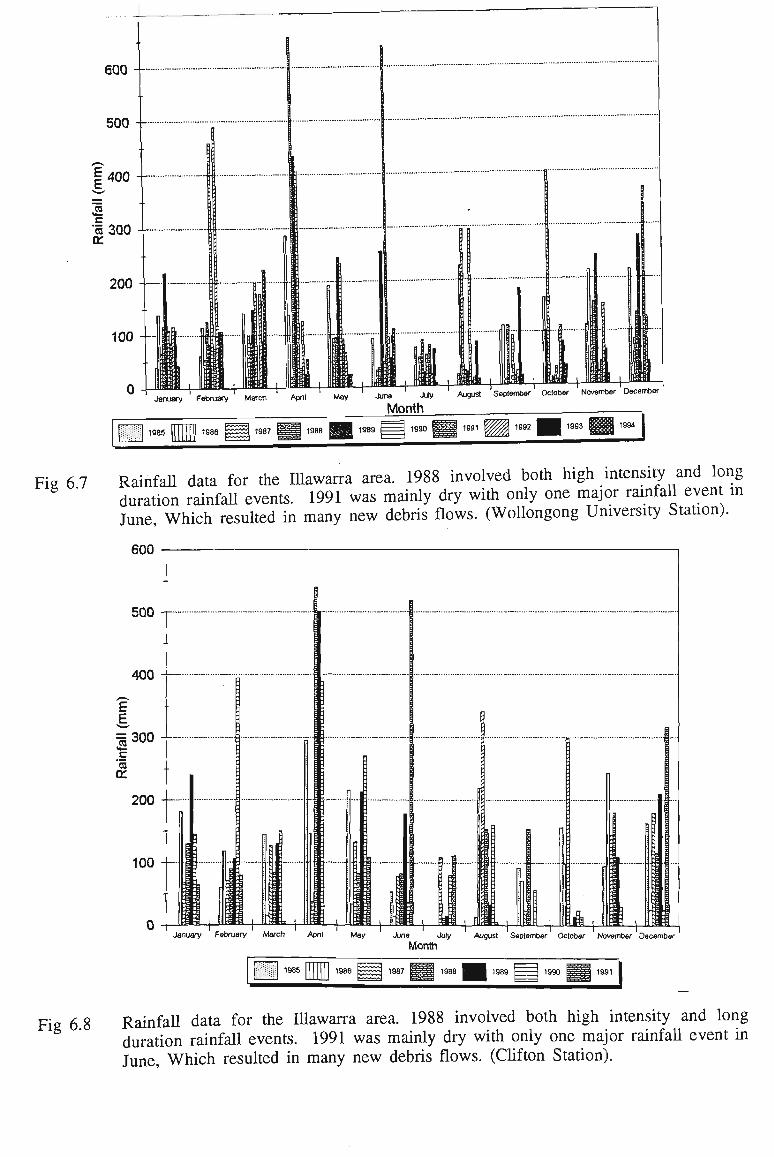
Fig 6.7
Fig 6.8
I w y ' February ' March ' Apn7 ' May ' Juno Ju* August S e p t e t October November December
Month
m 1985 1986 1987 1988 1990 1092 1994
Rainfall data for the Illawarra area. 1988 involved both high intensity and long duration rainfall events. 1991 was mainly dry with only one major rainfall event in June, Which resulted in many new debris flows. (Wollongong University Station).
600
500 -
400 —
E E, = 300 c '5
m 200 —
100
January February March April May June July August September October November December
Month
1985 1988 1990
Rainfall data for the Illawarra area. 1988 involved both high intensity and long duration rainfall events. 1991 was mainly dry with only one major rainfall event in June, Which resulted in many new debris flows. (Clifton Station).
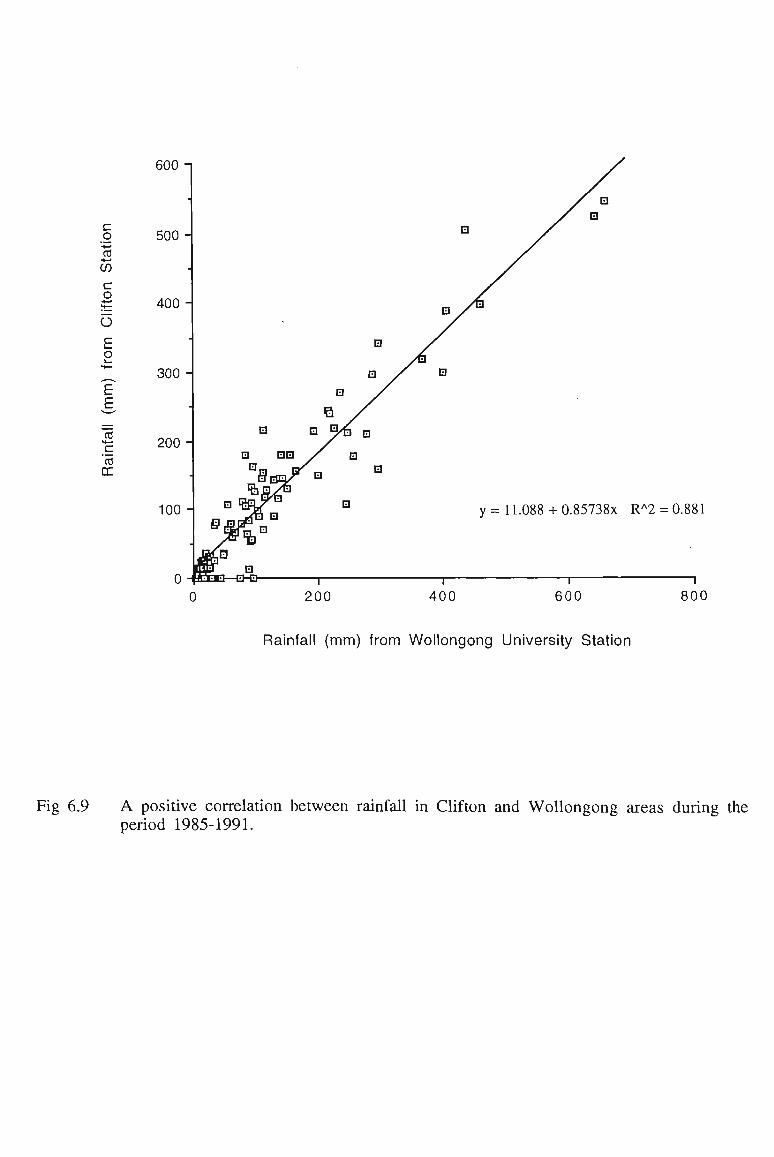
•
e
0
y = 11.088+ 0.85738x RA2 = 0.881
200 400 600 800
Rainfall (mm) from Wollongong University Station
A positive correlation between rainfall in Clifton and Wollongong areas during the period 1985-1991.
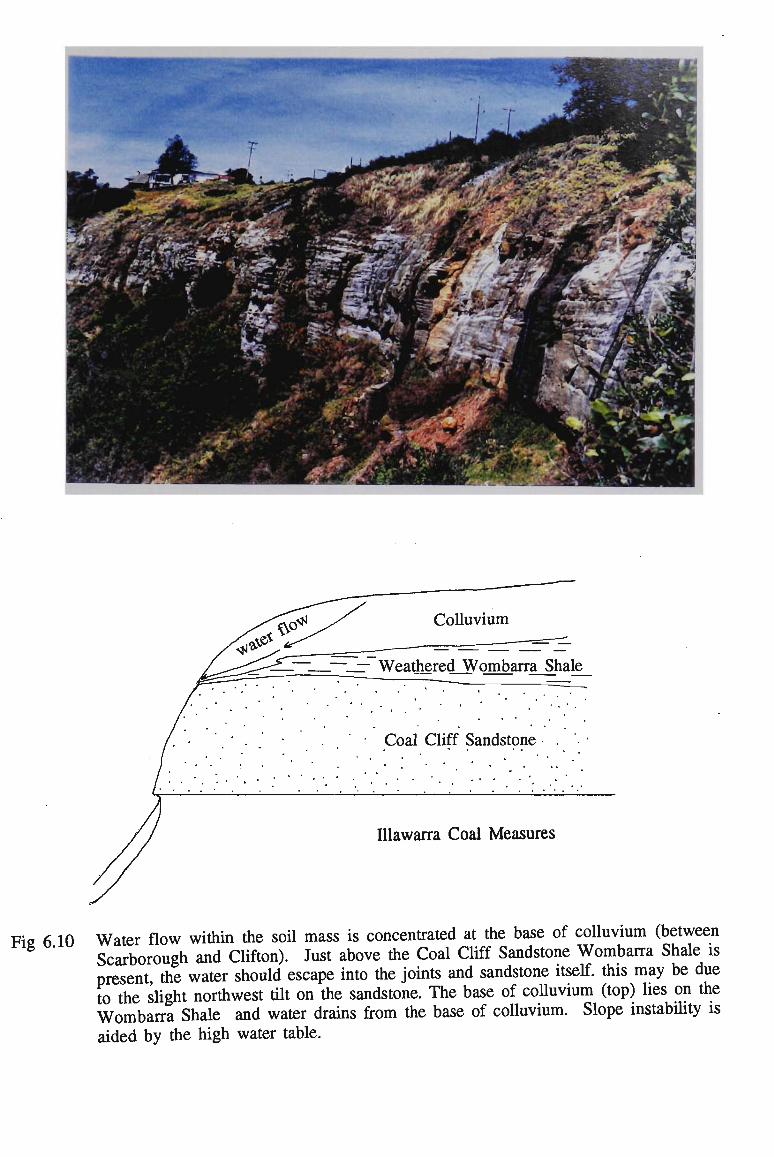
1! t&''~yr:^*'&$i%-i IIP? x r • "}?*•'' | flifcjj' <"' i W^'l^'''
4t' '••
- ^
N ,
•^ffiaSaflflfi
Colluvium
.—__—-_^~ Weathered Wombarra Shale
Coal Cliff Sandstone
Illawarra Coal Measures
Fis 6 10 Water flow within the soil mass is concentrated at the base of colluvium (between ' Scarborough and Clifton). Just above the Coal Cliff Sandstone Wombarra Shale is
present the water should escape into the joints and sandstone itself, this may be due to the slight northwest tilt on the sandstone. The base of colluvium (top) lies on the Wombarra Shale and water drains from the base of colluvium. Slope instability is aided by the high water table.
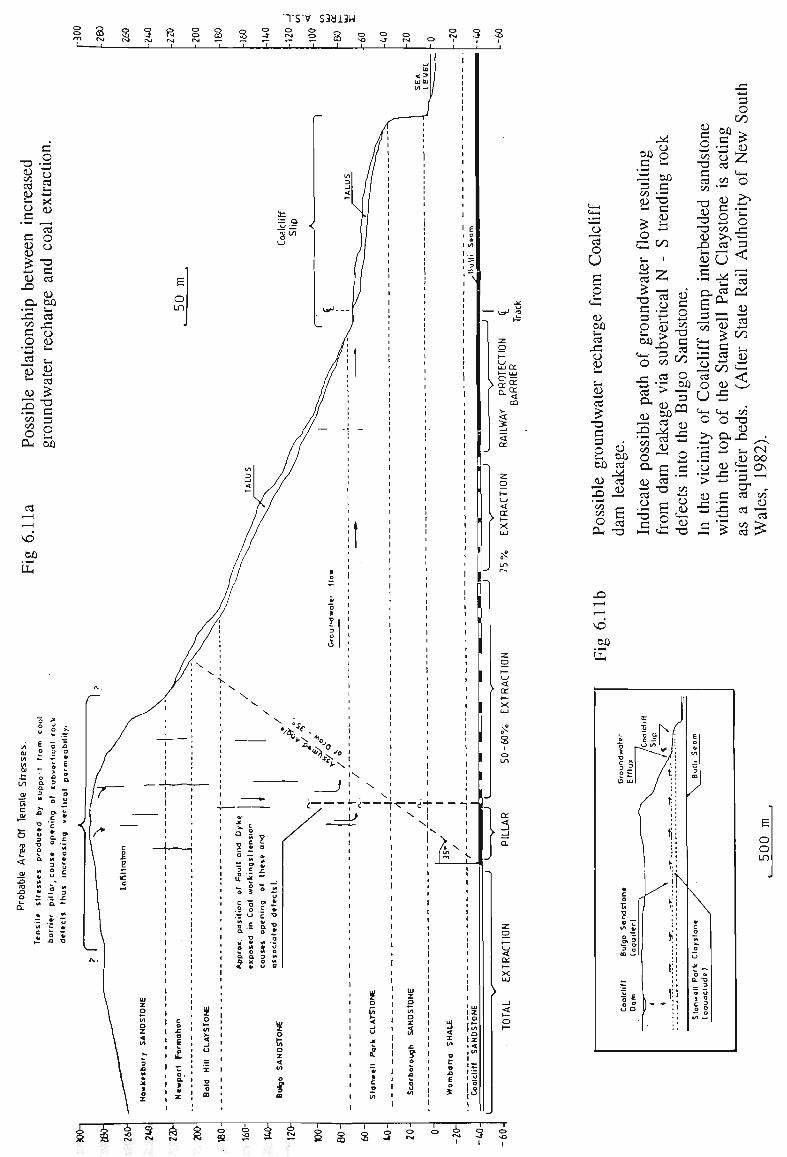
"TS'V S3bi3H S 3 £5 o S 8 -* 3 S
•a
C/3 cd <i j !—i
a s c OJ <u =5 — » CL) J3
Q,
.3 C/3
s o *- l
cd <u *"* <D J3 CO C/3 O LL
O —»
4-4
X 11
cd O O
T3 C cd
<U 00 •— cd .3 o ft) •_ . CD cd
£ •a c -! o 00
cd
|-H
DO •f-H
CD
73 o U E o CD 00 cd
o CD
ftJ cd
-a s 3 O
M OO o C i-
2 oo 3 3 CD ^3 i-l c
*s O G c/j S-i i
CD t_w cd
00 P -S oo •a
c rd 00
T3 CD
•a TJ CD X)
O cd
c/3 • " *
<D 3 O on >» cd
3 O in
CD
2
* • *
•§.a cd O
3
CD 00
00 cd O "ccl
oo E O cd
CU -a
3 '-3 P p <5 J2 00 £ 3 o «w _e cd o •S •:? oo cd > -3_
35 §1 *"•
s ° ^ a s CD cd o i- <-> •a n1^
3 2 4J M C4_| "T3
<D rj
rv cd
E^ 3 32
C4-I *
5H 3 3 cd cd < O O w
u-s
3 <
cd CX\
£ cd —•
33
C4-I < 4 ^
o o
•~ 2 3 •" 'o ftJ > •<-'
CD 3
a z
00
-a CD
-°^ ;- CN 0) 00 !t3 ON 3 —' CT r cd 00
* Id cd ^
00
c I
1 r\l?r c 5 0 — O UJ
fi\ J '' / i\
i\
c 0 f
x; 0 "C V> V
11 3 0 m —
~ £e 0 <• 0 0
^!N til * 1
f; : i .
. 1
1 *-' :l
E
ZJ
X
\ a*
"5 3K
O Or
a. -D
0 0
* 2 C = — O (/I —
o o LD
g 3 A B S TTT 8 3 S ^"i"
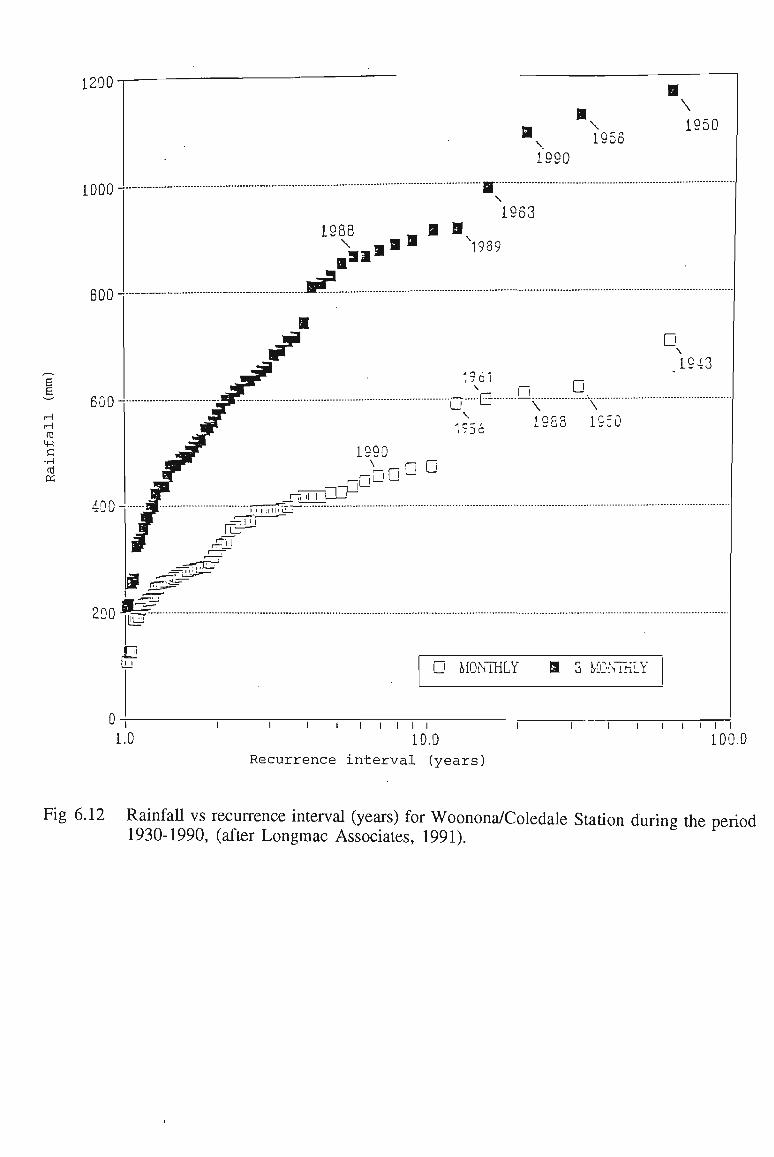
• B 1990
L956
\
1950
1963 1988
\
• 91 • »
a n. 1939
W§L Oyj
& D MONTHLY 9 3 &£NIHLY
1.0 i i i i i i i i
10.0 Recurrence interval (years)
i i i i i i i
100.0
6.12 Rainfall vs recurrence interval (years) for Woonona/Coledale Station during the 1930-1990, (after Longmac Associates, 1991).
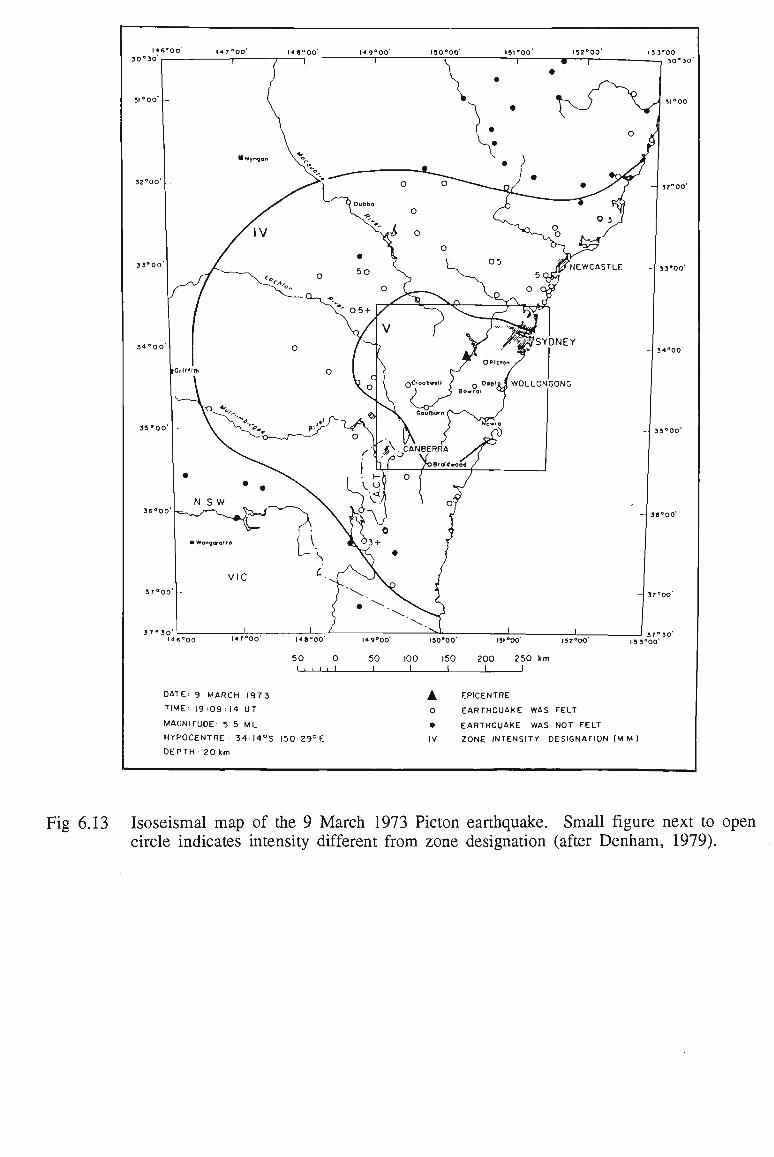
Fig 6.13 Isoseismal map of the 9 March 1973 Picton earthquake. Small figure next to open circle indicates intensity different from zone designation (after Denham, 1979).
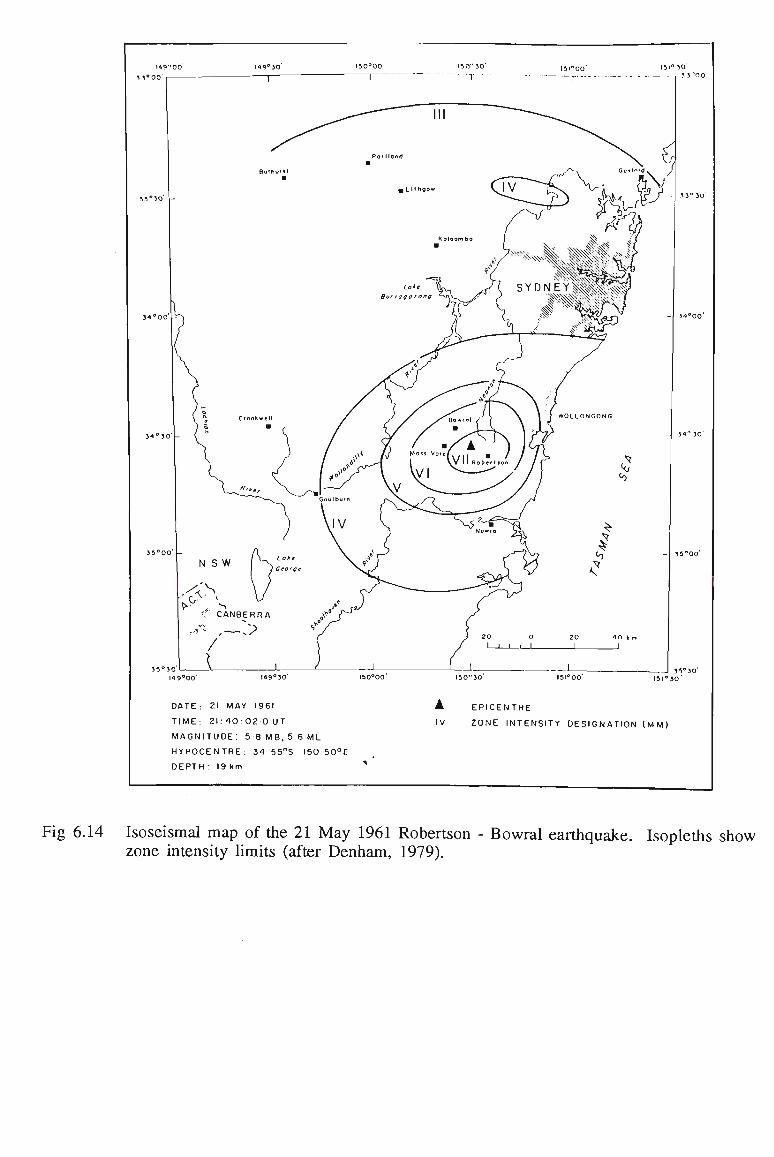
DATE: Zl MAY 1961
TIME: 21: 40:020 UT
MAGNITUDE: 5 8 M B , 5 6 M L
HYPOCENTRE: 34 55°S 150 50°E
DEPTH: 19 km
A EPICENTRE
IV ZONE INTENSITY DESIGNATION (MM)
Fig 6.14 Isoseismal map of the 21 May 1961 Robertson - Bowral earthquake. Isopleths show zone intensity limits (after Denham, 1979).
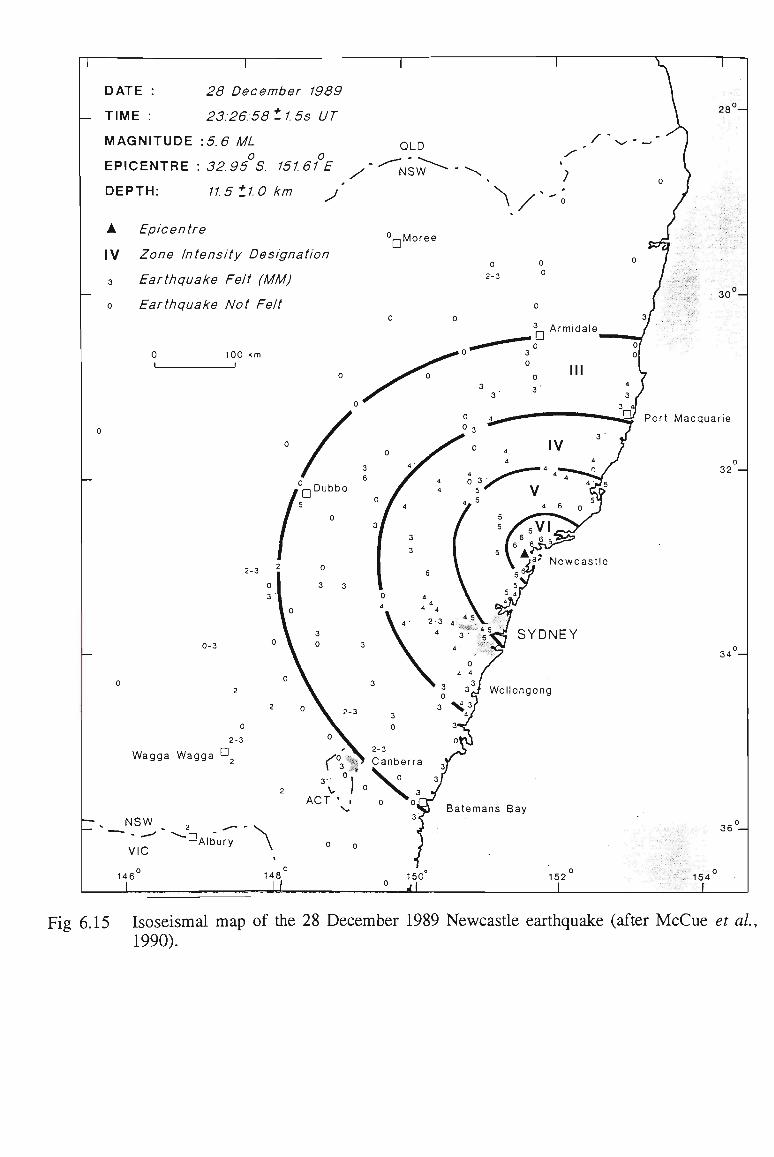
DATE
I- TIME
28 December 1989
23:26:58 ± 1.5 s UT
MAGNITUDE :5.6 ML
EPICENTRE : 32. 95° S. 151.61°£
DEPTH: 11.5 ±1.0 km j
A Epicentre
IV Zone Intensity Designation
3 Earthquake Felt (MM)
o Earthquake Not Felt
100 km I
Port Macquarie
o 2-3
Wagga Wagga O
— s NSW
VIC .0
"' Albury \
146
30 —
32 —
34 —
Batemans Bay
36°^
148 152
_L 154
Fig 6.15 Isoseismal map of the 28 December 1989 Newcastle earthquake (after McCue et al., 1990).

FIGURES TO CHAPTER 7

?
«
*• GO B
3
n 20-(0
•— • • - — Coai
Sandstone
^ ^ - * 1 2 3
No. or Slaking cycles 4
S 9 5
CD C
'« 2 90-
8.
i" I 85 -a-15 2 § 80 -T3 O
ffi " 75-
70 •
• ^
™ v ^ " \ ^ ^ SW
r x. ~*^^« ^ \
\. MW
2 J " No. of slaking cycles
A
(a) (b)
Fig 7.1 Effect of number of cycles on slake durability (a) for upper Illawarra Coal Measures (coal and interbedded highly weathered sandstone), (b) for Coal Cliff Sandstone (interbedded claystone, sw = slightly weathered; m w = moderately weathered).
2 3 No. of slaking cycles 2 3
No. of slaking cycles
(a) (b)
Fig 7.2 Effect of number of cycles on slake durability (a) for Coal Cliff Sandstone (sw = slighdy weathered; m w = moderately weathered), (b) for Wombarra Shale weathered samples from different locations, (top)from Clifton area beside Jetty Fault and (bottom) from south of Wombarra Station.
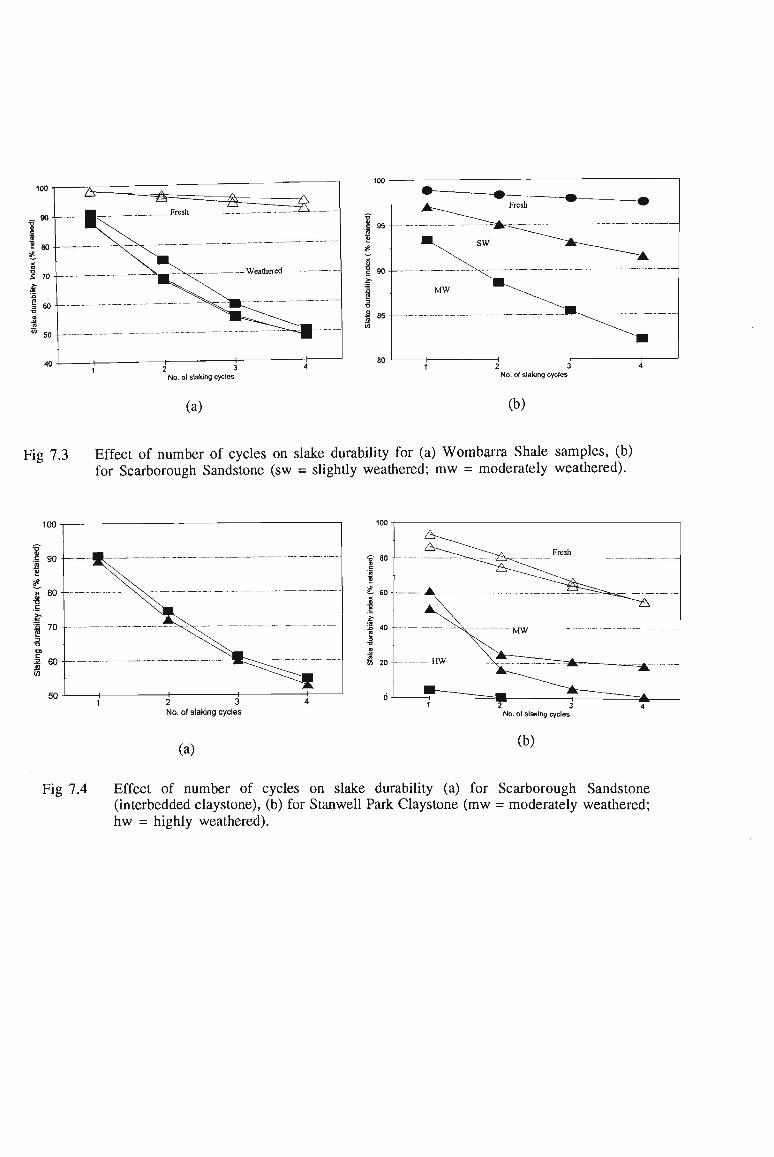
2 3 No. of slaking cycles
(a)
2 3 No. of slaking cycles
(b)
Fig 7.3 Effect of number of cycles on slake durability for (a) Wombarra Shale samples, (b) for Scarborough Sandstone (sw = slightly weathered; m w = moderately weathered).
100
2 3 No. of slaking cycles
2 3 No. of slaking cycles
(a) (b)
Fig 7.4 Effect of number of cycles on slake durability (a) for Scarborough Sandstone (interbedded claystone), (b) for Stanwell Park Claystone (mw = moderately weathered; hw = highly weathered).
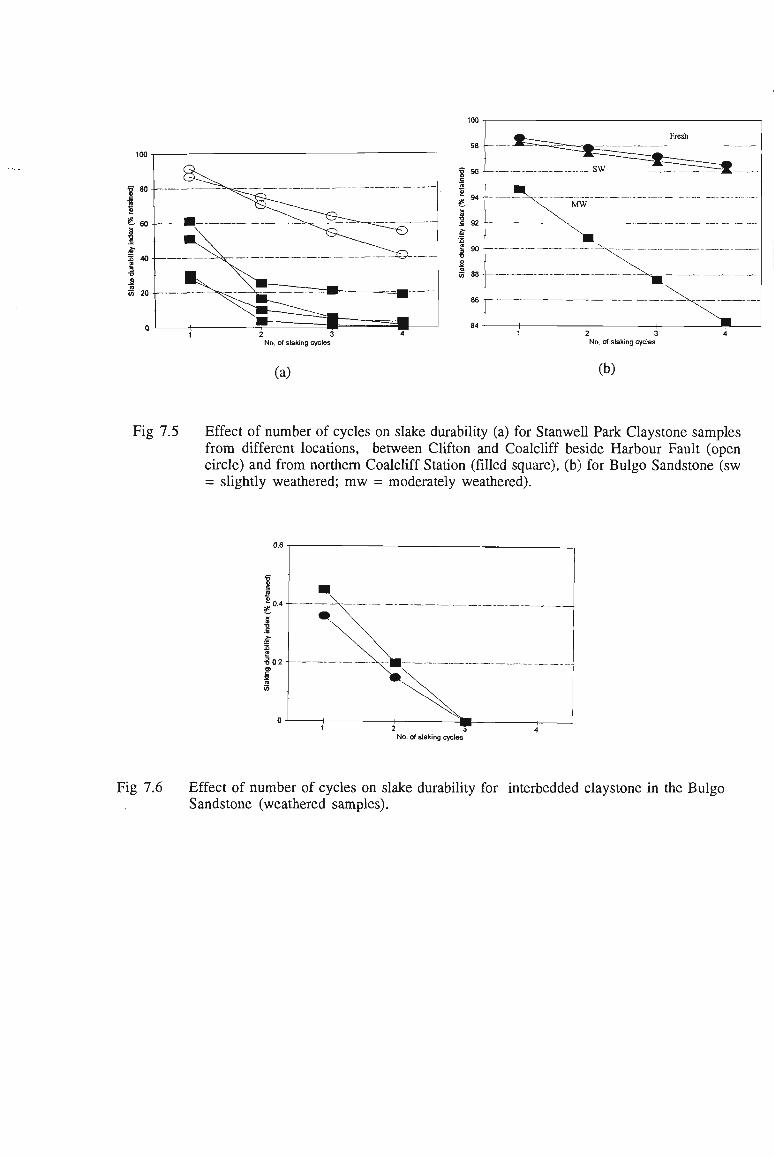
£ 92 2-
t = r _
"k .„
— - —
SW
MW
^ .
-^ITrrrE^t -
— - - - • • —
^ " \
J — i 1 , • — i 2 3 No. of slaking cycles
2 3 No. of slaking cycles
(a) (b)
Fig 7.5 Effect of number of cycles on slake durability (a) for Stanwell Park Claystone samples from different locations, between Clifton and Coalcliff beside Harbour Fault (open circle) and from northern Coalcliff Station (filled square), (b) for Bulgo Sandstone (sw = slightly weathered; m w = moderately weathered).
No. of slaking cycles
Fig 7.6 Effect of number of cycles on slake durability for interbedded claystone in the Bulgo Sandstone (weathered samples).

O S M SSs Name of formation
CSs SSs Name of formation
SPC
(a) (b)
Fig 7.7 Slake durability index (a) for Narrabeen Group fresh samples (West Cliff, boreholes IL55 and 1164), (b) for Narrabeen Group weathered samples (between Clifton and Coalcliff).
Water content (W%) 4.28 5.05
Water content (W%) 775
(a) (b)
Fig 7.8 Water content versus two cycles of slake durability (a) for Stanwell Park Claystone ( m w = moderately weathered; h w = highly weathered), (b) for Wombarra Shale weathered samples. (Samples were collected one week after rainfall).
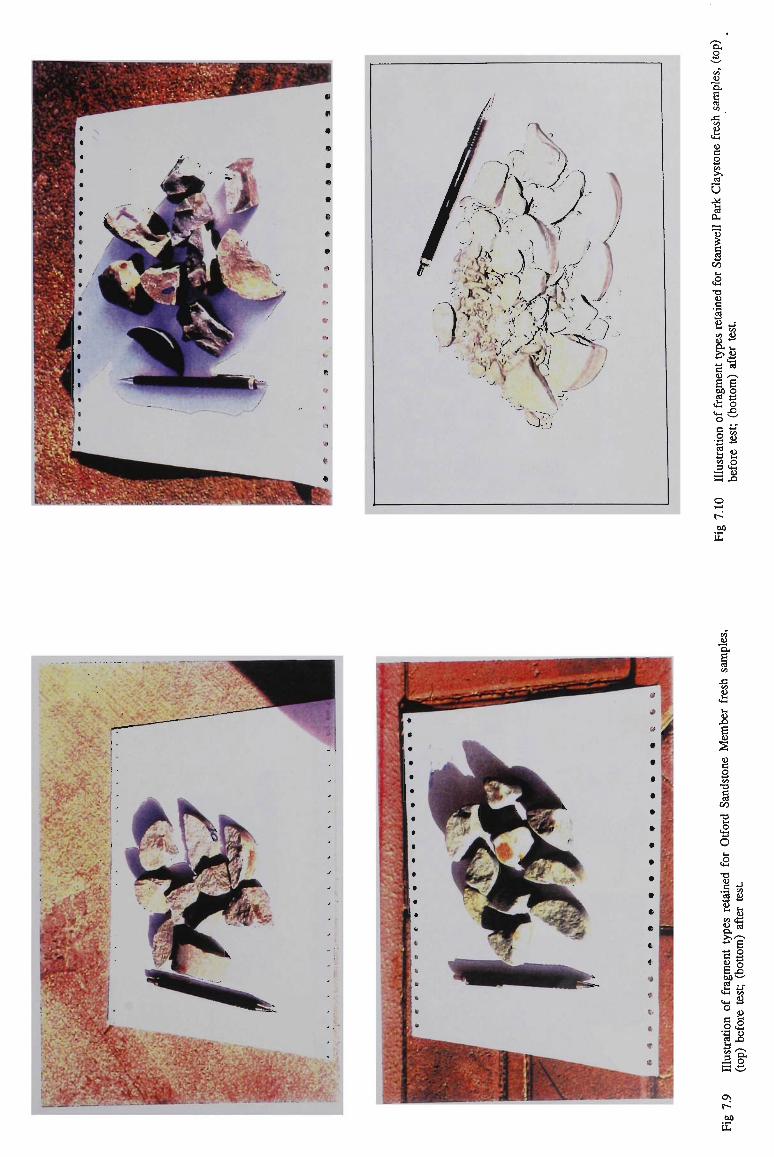
tm.t^s< AAA,
a, R
"a.
CO
(4-1
c
S. 0
t a,
«S •a o
1 CO j8
£§ £ £ oo o a a <H O •8 a
u cd
h) _. co o 3 cK
oo
IE
E cd
a) j :
a 0)
s a) e o CO X) c cd CO
TJ
CI
•a O u O
X) CI) c Pf 1)
a. >, «-» C u
E an cd
Ct-l
o c o •a CO
3 >-M
o\ r on li
co
H <4 iJ
E o 4-1
e . •>
a u c2 8 *3 O
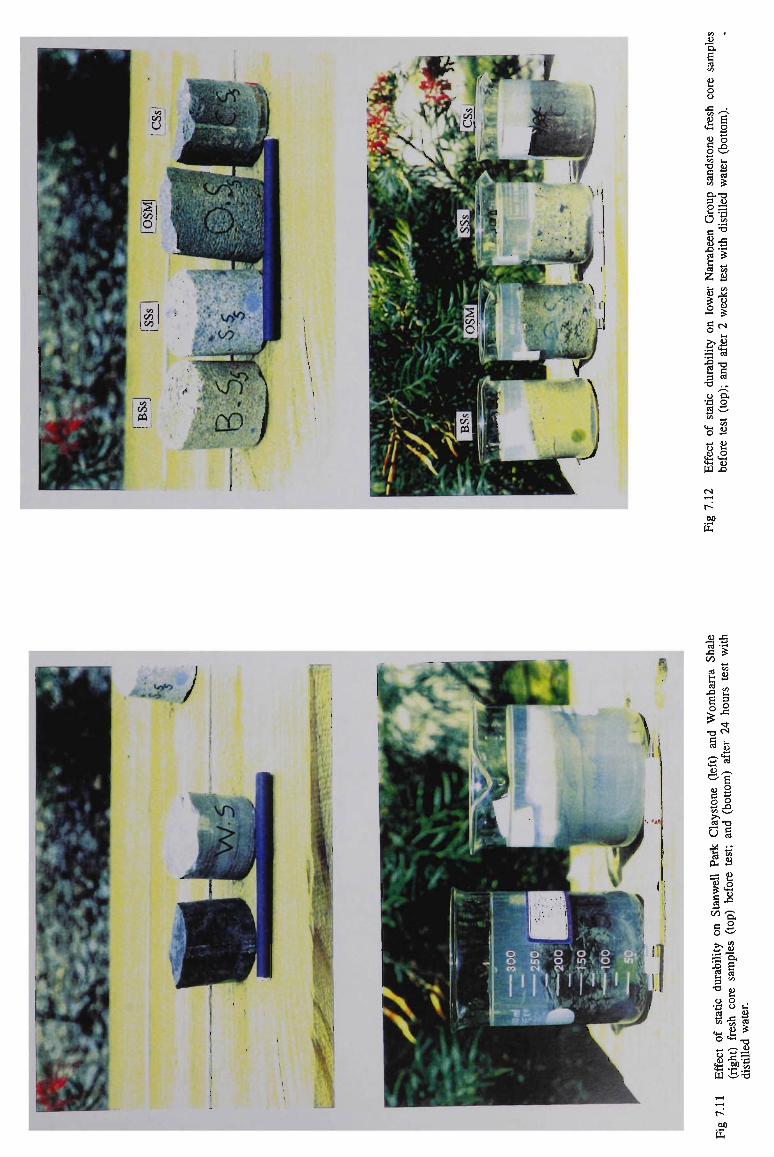
.^I^I^I^I^H
O o
K £ <H 2 JJ o
s ^ CO L* CO >
{J CO
8-s .o •-
53 J2
II g^
2 "° 3 c3
XJ .. Cu
o co w
<-> <u
SB'S
r-oo
E
00
:=?S
5 ° CO \ /
ed xj
U cd
£ a
icS
§2 (5 2 o --'
^ co
•3 "S"
£ i £ co
Ui
o o , •a o t. 3-8 •S^XJ
111 P3 SXJ
oo
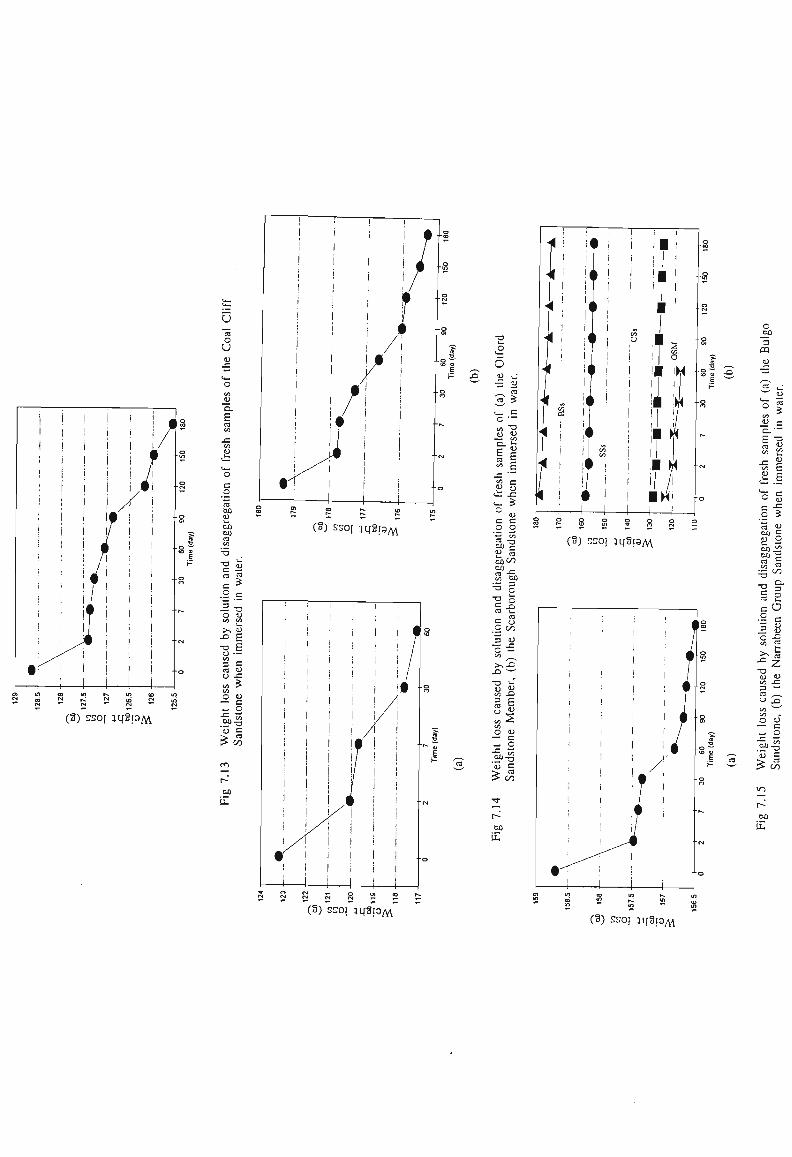
(3) ssoj iq3[3M
U
c U
oo
B CO
oo
3 *
.2 c
= Z o u CO CO
>, U •= E XJ E u •-3 C cd OJ CJ JS CO * CO
o «J — o
•a I on
oo
E
(3) ssof iifSra/w
: l 1 i 1
i l l ,
! i 1 1 1 1 I
M U M / ! ! ! ! ! W . i < ! ! ! A
V • 1 /! |
1
r 1
• i i . i . i
/ | ' 1 i l
i j
• i
j |
i i
— — [ — — i — —
XJ
,c
n E CO
J= c/:
P d_ -—
XJ
a;
E b
• • "
u J=
S
cd CO
u on CO
XJ
XJ
c
c c 3
n CO
XJ
c cd l/J jr Oil
n
00
91 « j
>,£ XI
X!
CO 3 cd
CO O
_ 00
*-' u U X)
E o ii 3J 3
c CO XI
r-oo
E
(3) ssoj ;LI3!3^
C3) ssoj aq3ia^\
o _C0 3
CP
o
OJ
c E cd CO
co
£ c
c
0/
p CO CO cd
•u
XJ
Cd
c c _3
f-i
>% x: X)
a) y; 3 cd
o CO O - j
x; CO u
ca
3
XJ U
u
F E c 5)
x: i*
3
a XJ 3 cd C/1
D.
C
— O c OJ OJ X:
t
z OJ 3
*"' , s X)
0) 3 O
CO XJ 3
-s £
oo E
(3) ssoj jijaiayvj
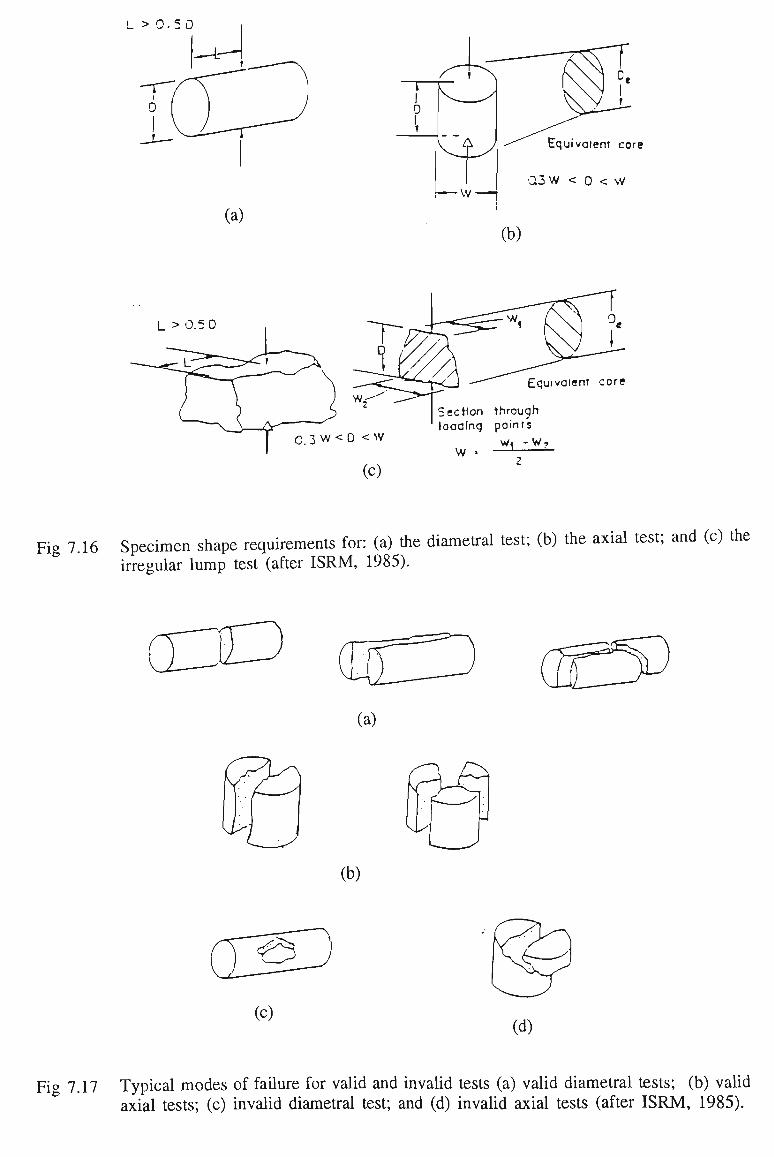
L > O.50
(a)
Equivaienr core
0.3 W < 0 < W
(b)
L > 0.5 0
Equivaier
<0 < W
(C)
Section through loaainq points
W
Fig 7.16 Specimen shape requirements for: (a) the diametral test; (b) the axial test; and (c) the irregular lump test (after ISRM, 1985).
(a)
(b)
(c) (d)
Fig 7.17 Typical modes of failure for valid and invalid tests (a) valid diametral tests; (b) valid axial tests; (c) invalid diametral test; and (d) invalid axial tests (after ISRM, 1985).

8
6
<\
2
0
Y
•1
1 II B H H Hi
-1 I I Hi
• xjifl HI
^1 ^B^
^•^
1 •!
I S
is CO
5 -
4 -
3 -
2 -
1 -
0 -
/
•|
1 B:
II • 1 1 l i • • •
1 B P 9 Wis? CSs WSh OSM SSs SPC BSs CSs WSh OSM SSs SPC BSs
Formation Formation
(a) (b)
Fig 7.18 (a) Axial point load strength results, and (b) diametral point load strength results for Narrabeen Group (fresh core samples).
CO
CO
O t
CO
CO
o g
5 Formation
CO
g 1
CO
CO
o 5 2
j? % ^
CO
CO CO g CO
CO
CO CO g
5
O 0-co g
2
CO
CO
m g CO
CO
CO
m g 5
c
00 -
80 -
60 -
40 -
20 -
0 -
/ ^ |
ISx BB
1 H:;'
Bf>
B B B /—jiMBl IBH
IB
.CSs
CSs
§ I FORMATION
CO
g
1
2 CO
n g
2
CO CO
g CO
CO CO
o Q. CO
CO
m
CO
m
(a) (b)
Fia 7 19 (a) Point load strength results for Narrabeen Group (weathered irregular samples), (b) ' Uniaxial compressive strength for Narrabeen Group (weathered irregular samples).
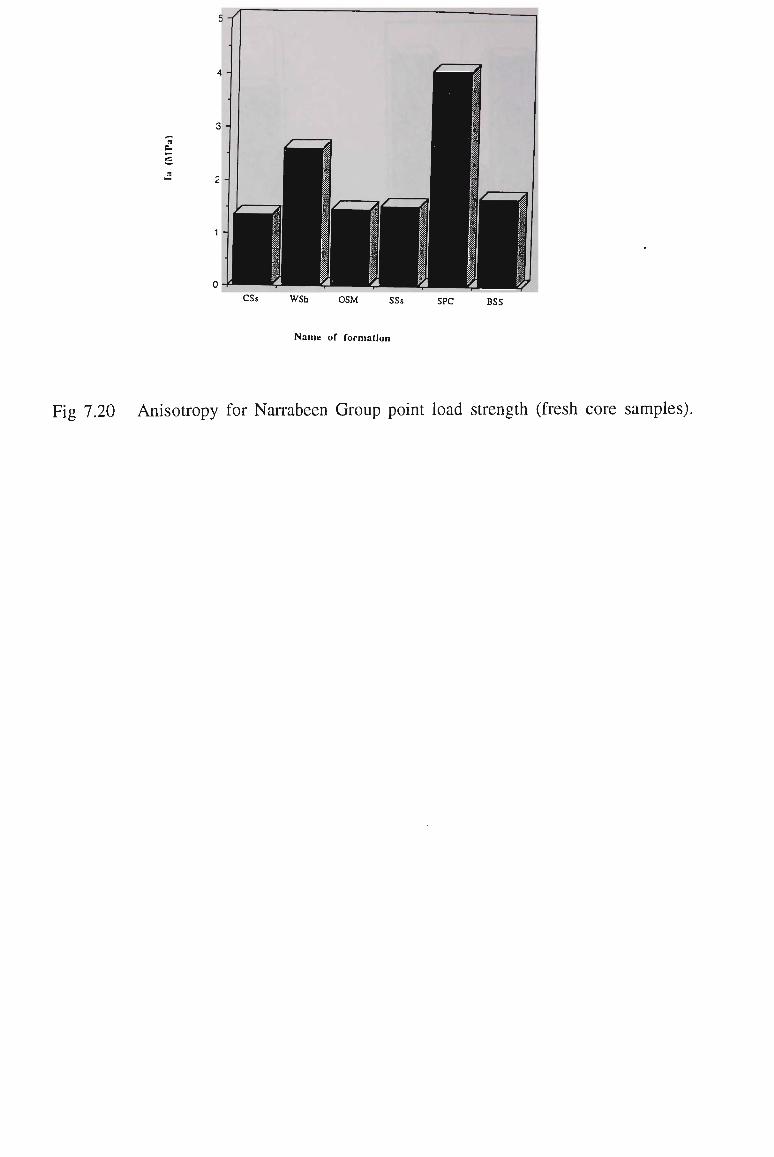
CSs WSh OSM SSs SPC BSS
Name of formation
Fig 7.20 Anisotropy for Narrabeen Group point load strength (fresh core samples).
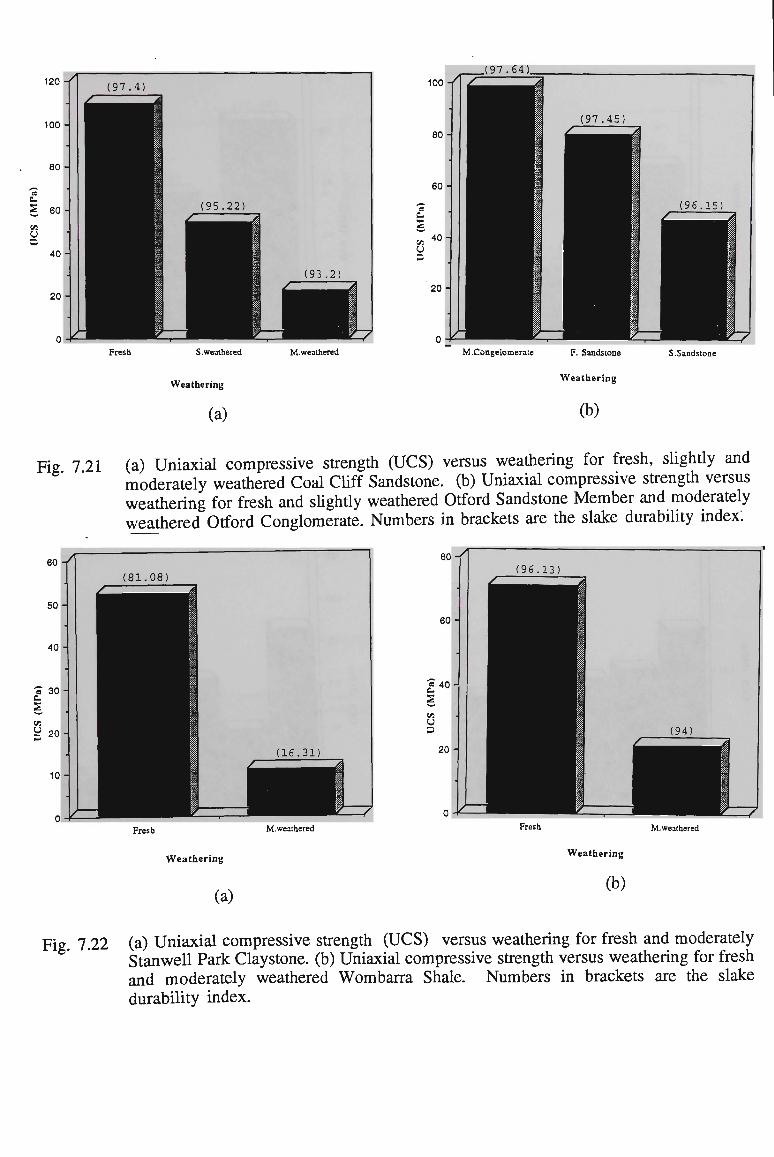
120
100
VI
O
Fresh S. weathered
Weathering
(a)
M.weathered
Fig 7 21 (a) Uniaxial compressive strength (UCS) versus weathering for fresh, slightly and moderately weathered Coal Cliff Sandstone, (b) Uniaxial compressive strength versus weathering for fresh and slightly weathered Otford Sandstone Member and moderately weathered Otford Conglomerate. Numbers in brackets are the slake durability index.
Fresh M.weathered
Weathering
(a)
Fig. 7.22 (a) Uniaxial compressive strength (UCS) versus weathering for fresh and moderately Stanwell Park Claystone. (b) Uniaxial compressive strength versus weathering for fresh and moderately weathered Wombarra Shale. Numbers in brackets are the slake durability index.
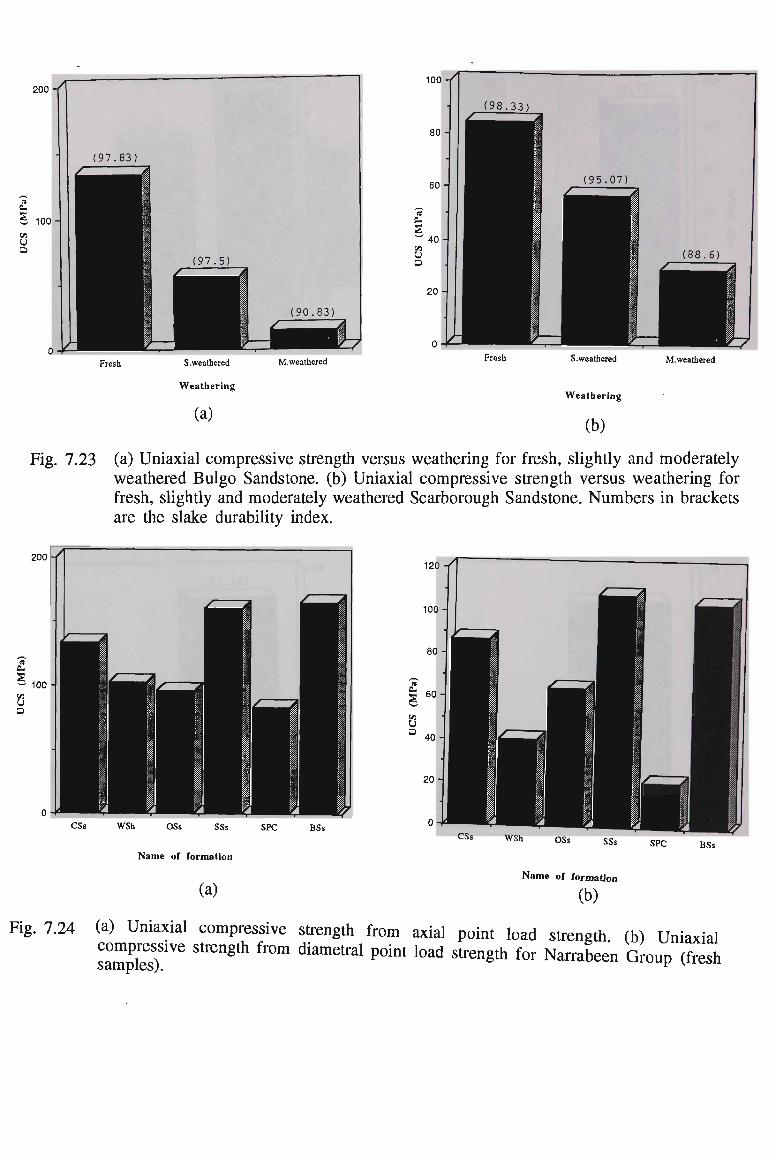
Fresh S.weathered
Weathering
M.weathered Fresh S. weathered
Weathering
M.weathered
(a) (b)
Fig. 7.23 (a) Uniaxial compressive strength versus weathering for fresh, slightly and moderately weathered Bulgo Sandstone, (b) Uniaxial compressive strength versus weathering for fresh, slightly and moderately weathered Scarborough Sandstone. Numbers in brackets are the slake durability index.
200 -
"c? 0. H. <ool — 100 1 C/3 U 3
0 -
/
HH HB#
• 11 fl fl?
Hi 1 mm 91 iH> CSs WSh OSs SSs
Name of formation
SPC BSs CSs WSh
OSs SSs SPC BSs
(a) Name of formation
(b)
Fig. 7.24 (a) Uniaxial compressive strength from axial point load strength, (b) Uniaxial
samplesT1^ ^"^ ^ ^^ P°int l0ad Strength f°r Narrabeen GrouP (f«sh
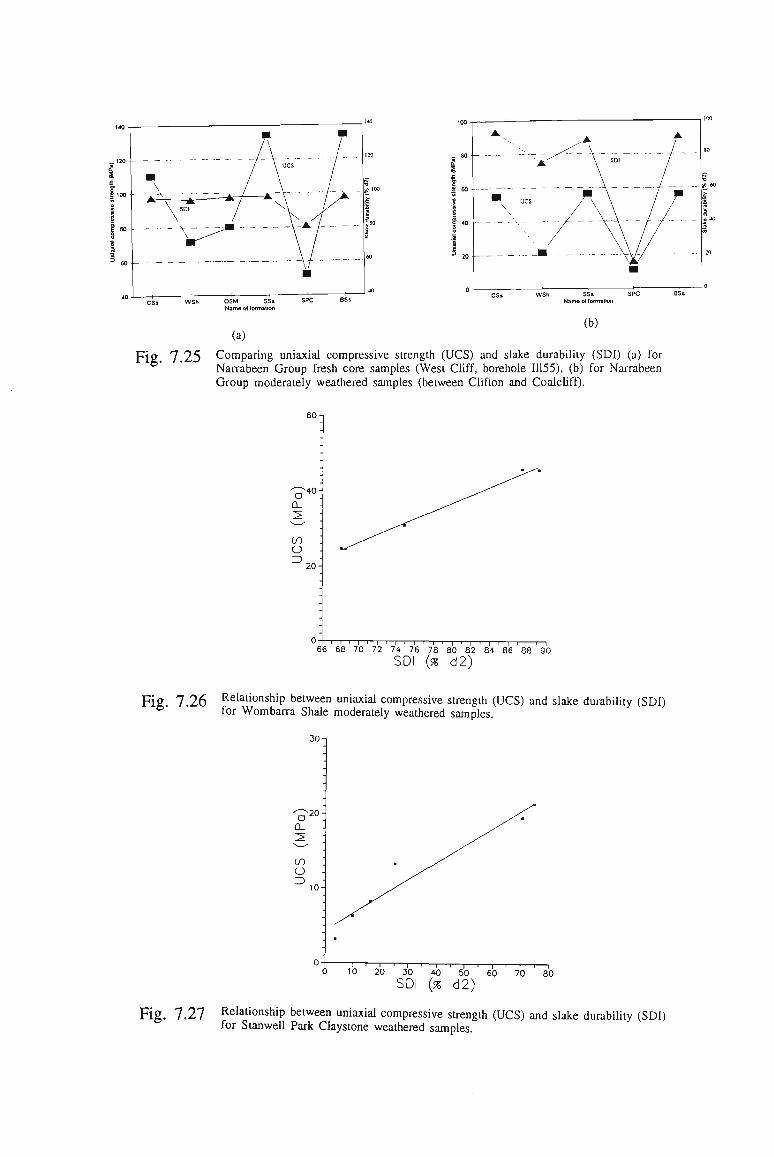
_12d
i a? 100
CSs W S h O S M SSa Name of formation
SPC BSs
(a)
SSs
Name of formation
(b)
Fig. 7.25 Comparing uniaxial compressive strength (UCS) and slake durability (SDI) (a) for Narrabeen Group fresh core samples (West Cliff, borehole 11155), (b) for Narrabeen Group moderately weathered samples (between Clifton and Coalcliff).
60
40-
o 3 20-
I i I i I i — r — i — i i i i — i i i i — i i i i — r — i — i
66 68 70 72 74 76 78 80 82 84 86 88 90 SDI (% d 2 )
Fig. 7.26 Relati°nship between uniaxial compressive strength (UCS) and slake durability (SDI) for Wombarra Shale moderately weathered samples.
30
O CL
20-
V)
0 10 20 30 40 50 60 70 80
SDI {% 62)
Fig. 7.27 Relationship between uniaxial compressive strength (UCS) and slake durability (SDI) for Stanwell Park Claystone weathered samples.
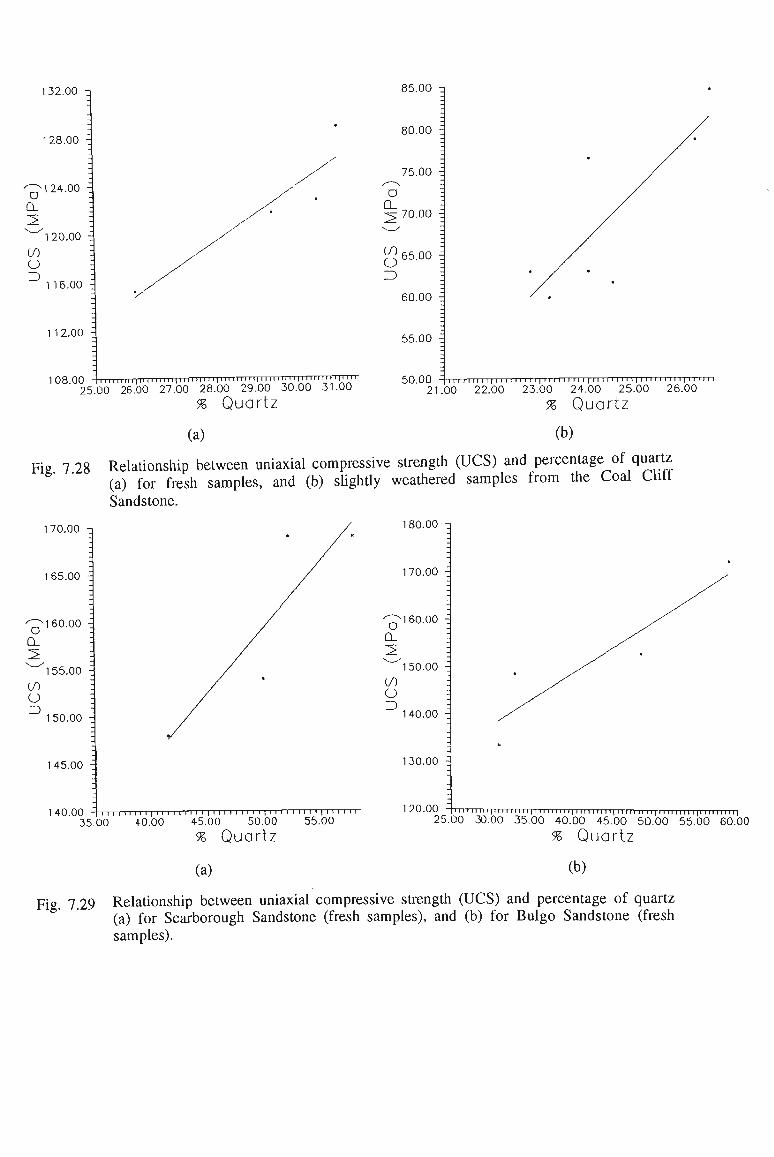
132.00 z\
1 28.00
85.00
80.00
75.00
a CL
124.00 D Q_
70.00 i
120.00 -;
00
o D
00
O 65.00 i
116.00 -
1 1 2.00 i
60.00
55.00
108.00 1111111 n1111 n n 11111111 n 1111 i-rrrr 11 m 11111 M 111i1111111 11 I|i 111 25.00 26.00 27.00 28.00 29.00 30.00 31.00
% Quartz
(a)
50.00 "1111 M II 1111 M 111111111 i M 1111 M 11111111 M 11111111 21.00 22.00 23.00 24.00 25.00 26.00
% Quartz
(b)
Fie 7 28 Relationship between uniaxial compressive strength (UCS) and percentage of quartz (a) for fresh samples, and (b) slightly weathered samples from the Coal Clitt
Sandstone.
1 70.00
165.00 -
D CL
160.00 z
1 55.00
00 O D 1 50.00
1 45.00
D
180.00 n
170.00
160.00
150.00
00 O D 140.00
130.00
1 4 0 . 0 0 - i i i i 1 1 1 1 1 1 1 1 i i i 1 1 i i i i i i i i i i i i i 1 1 i i i i i ' i i ''' M ' 35.00 +0.00 45.00 50.00 55.00
% Quartz
(a)
1 20.00 11 in 11 II in 11 n i n i ui i in m i 1111 n i II n|i i II in 11 II i II n n 11 25.00 30.00 35.00 40.00 45.00 50.00 55.00 60.00
% Quartz
(b)
Fig. 7.29 Relationship between uniaxial compressive strength (UCS) and percentage of quartz (a) for Scarborough Sandstone (fresh samples), and (b) for Bulgo Sandstone (fresh samples).
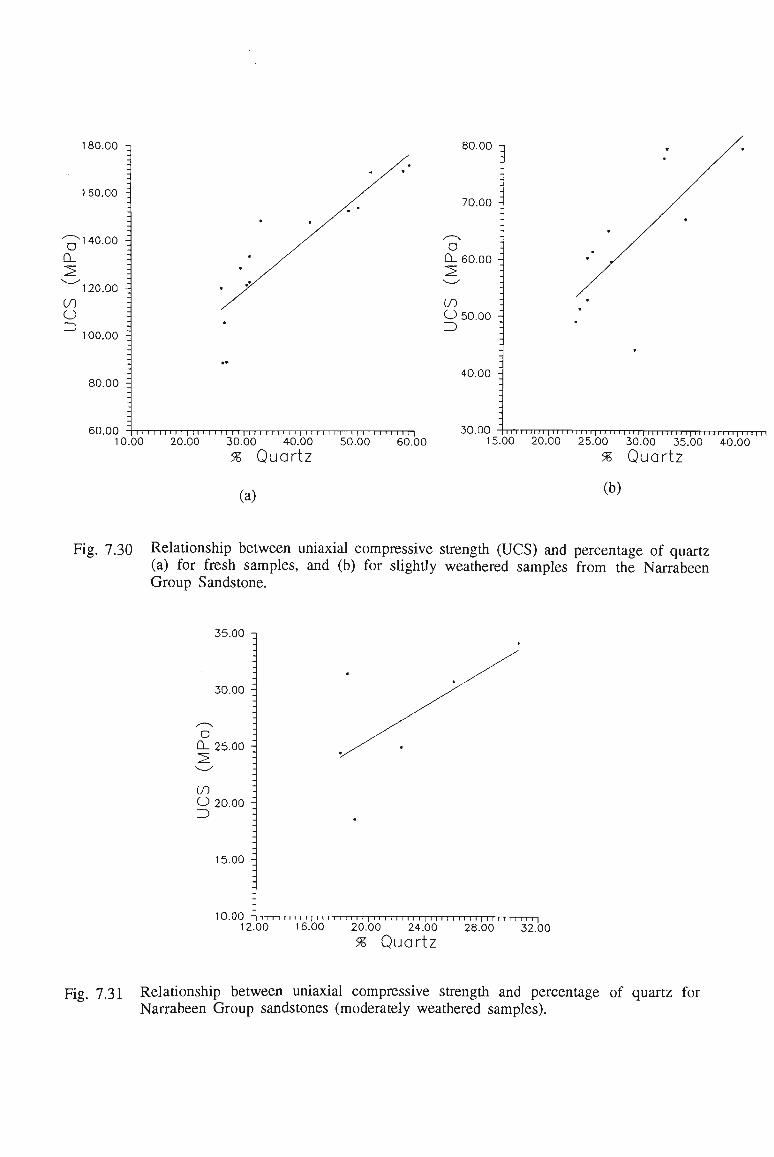
180.00
160.00 -
D CL
140.00
120.00 00 O Z) 100.00 -
80.00
60.00 i i i i 1 1 i i i i 1 1 i I I 1 1 i i i 1 1 i i i 1 1 i i i 1 1 i i i i i i i i i i i i i i i i i i 10.00 20.00 30.00 40.00 50.00 60.00
% Quartz
80.00
70.00
D CL 60.00
00 O 50.00
z>
40.00
30.00 111111 II 11111111111111111111111 M M 1111111111111111111111
15.00 20.00 25.00 30.00 35.00 40.00 % Quartz
(a) (b)
Fig. 7.30 Relationship between uniaxial compressive strength (UCS) and percentage of quartz (a) for fresh samples, and (b) for slightly weathered samples from the Narrabeen Group Sandstone.
35.00 -j
30.00
D CL 25.00 :
00 O 20.00 :
z>
15.00
1 0 . 0 0 | i 1 1 i 1 1 1 1 i i 1 1 i i i 1 1 i i i i i i i i i i i i | i i i i i i i i i i i i i
12.00 16.00 20.00 24.00 28.00 32.00 % Quartz
Fig. 7.31 Relationship between uniaxial compressive strength and percentage of quartz for Narrabeen Group sandstones (moderately weathered samples).
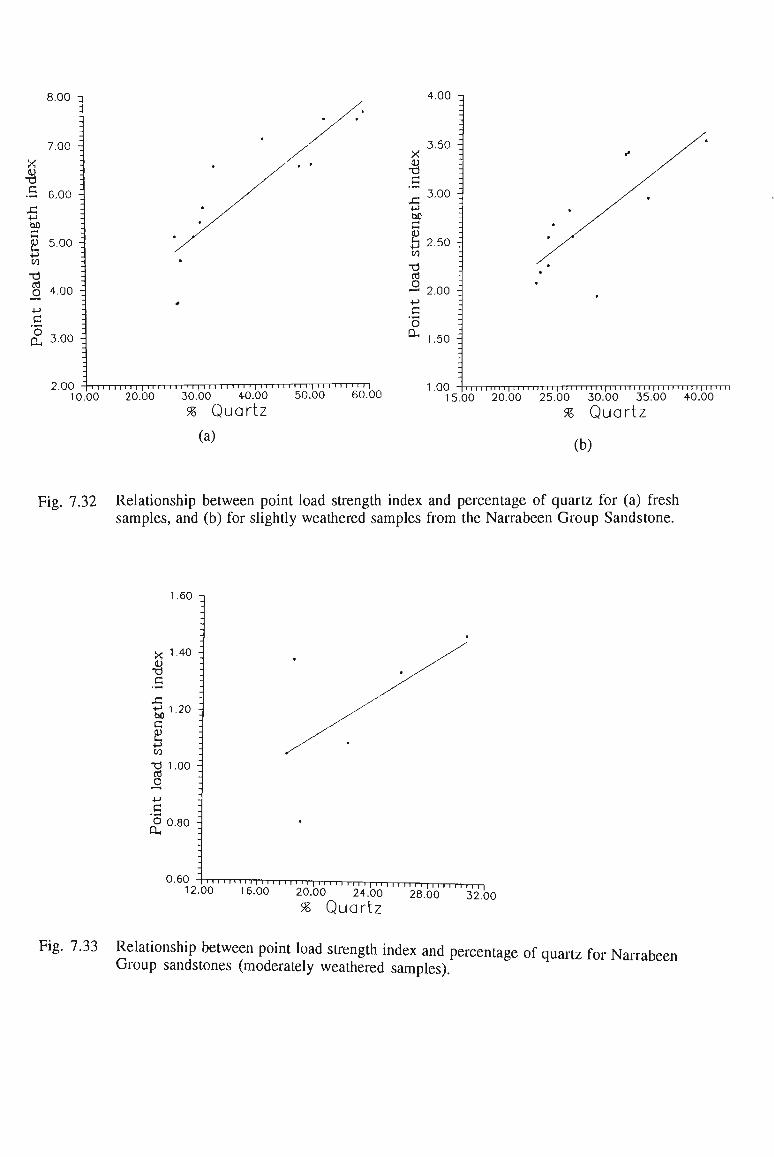
8.00 -n
7.00 -
X (1) •d c X3 +J til
c e +•>
W T3 cd n +->
c o DH
6.00
b.ao
4.00
3.00
4.00 -i
2.00 - 1 1 1 i i 1 1 i i | i i i i i 1 1 i 1 1 1 1 i i i 1 1 i i i 1 1 i i 1 1 i i i i
10.00 20.00 30.00 40.00 50.00 60.00
% Quartz
(a)
•a 3.50 -_
3.00
bo C {5 2.50 w
cd ° 2.00
o OH 1.50 T
1.00 11II 1111111111111111111111111111111111111111111111111 15.00 20.00 25.00 30.00 35.00 40.00
% Quartz
(b)
Fig. 7.32 Relationship between point load strength index and percentage of quartz for (a) fresh samples, and (b) for slightly weathered samples from the Narrabeen Group Sandstone.
1.60
X 140
c
tJ, 1 -20 bfl
c K w T3 1.00 cd O O 0.80
a,
0.60 1 . „ ' " ' " " ' I ' 11111111111111111 1, 111,
12.00 16.00 20.00 24.00 28.00 32 00
% Quartz
Fig. 7.33 Relationship between point load strength index and percentage of quartz for Narrabeen Group sandstones (moderately weathered samples).

FIGURES TO CHAPTER 8
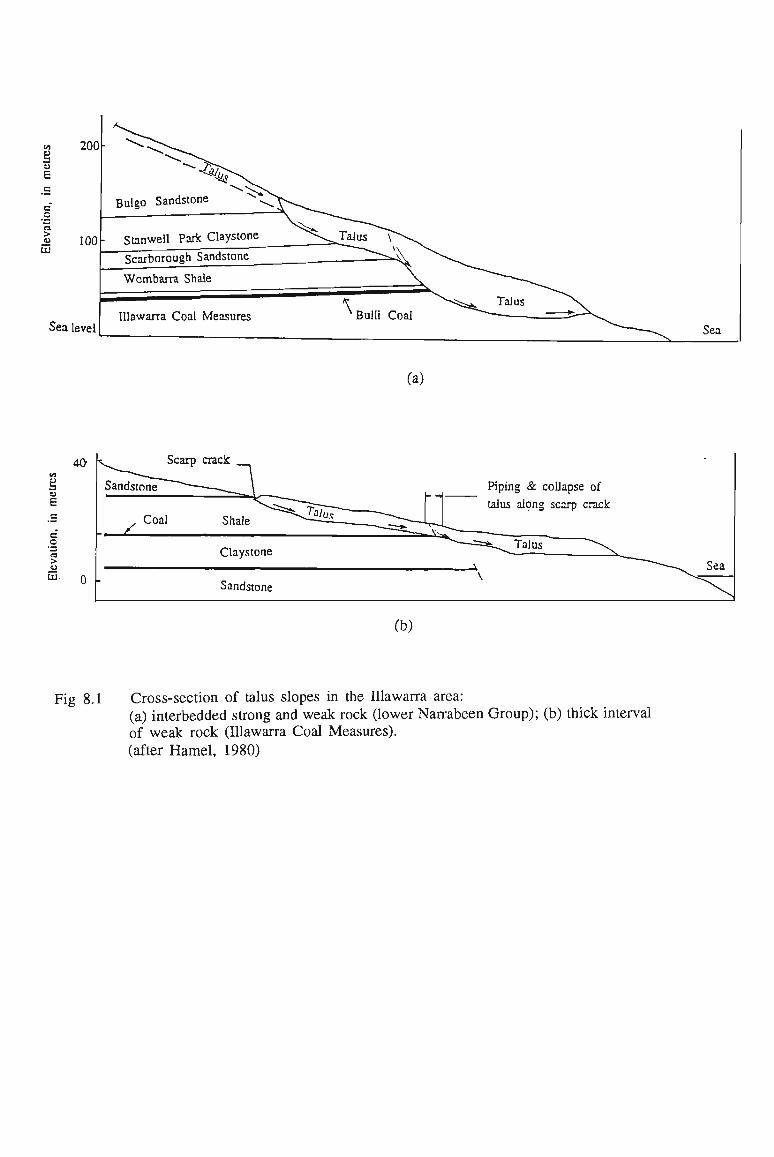
g u
E
c c > cu
Sea level
40 Scarp crack
E c
c o •3
(a)
Piping & collapse of
talus along scarp crack
Sandstone
(b)
Fig 8.1 Cross-section of talus slopes in the Illawarra area: (a) interbedded strong and weak rock (lower Narrabeen Group); (b) thick interval of weak rock (Illawarra Coal Measures). (after Hamel, 1980)
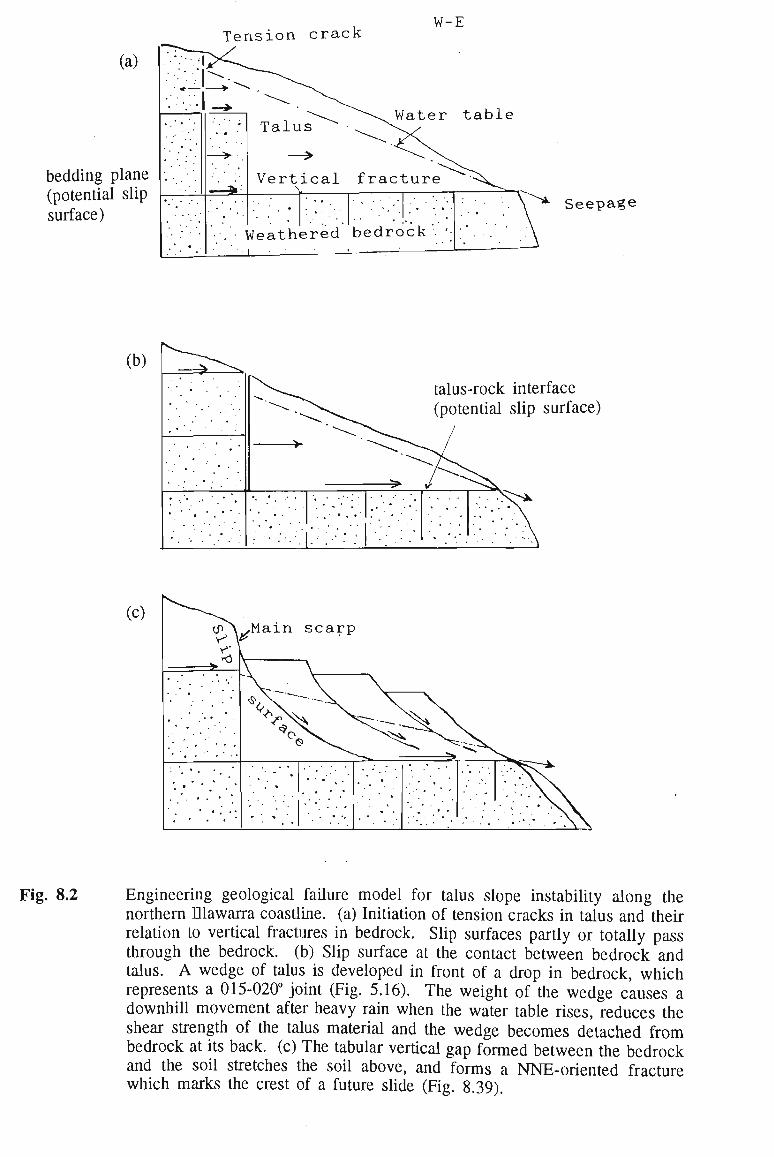
Tension crack W-E
(a)
bedding plane (potential slip surface)
Talus
Vertical fracture -»
Water table
Weathered bedrock' •
Seepage
(b)
talus-rock interface (potential slip surface)
(c)
'•'.'• • . ' * * *
'•''.' ' • "•
-Main
•. . • '
- • .
scarp
. . • •
•. '• • ••
• • ' . . ' •
. • ' •
^ ^
• ." . • . • • ,
. • .* ',
, -• V*
• '*."' * \ \.
Fig. 8.2 Engineering geological failure model for talus slope instability along the northern niawarra coastline, (a) Initiation of tension cracks in talus and their relation to vertical fractures in bedrock. Slip surfaces partly or totally pass through the bedrock, (b) Slip surface at the contact between bedrock and talus. A wedge of talus is developed in front of a drop in bedrock, which represents a 015-020° joint (Fig. 5.16). The weight of the wedge causes a downhill movement after heavy rain when the water table rises, reduces the shear strength of the talus material and the wedge becomes detached from bedrock at its back, (c) The tabular vertical gap formed between the bedrock and the soil stretches the soil above, and forms a NNE-oriented fracture which marks the crest of a future slide (Fig. 8.39).

C 2000-Sample: B:\GHOBADI\ch2 • 07-27-1994
1600-
1200-
Kaolinite
800-
\
400-
Swelling clays
i0H^r "^Atfrw^m^^ *%4tA
1111111111 n n 11111111 n 1111111111111 ri p 1111111111111111111 rr 11 n 11 r m M M i M 111111111111111111111111111111 n 11111111111111 ITI 111111111111111111 in 1111 n i ITI 1111111111111111 irrr
2 4 6 8 10 12 14 16 18 20 Degrees 2-Theta
(a)
2000-Sample: B:\GHOBADHch1gly * 07-27-1994
1600-
1200-
800-
Kaolinite
400- WwW%M^ muMrtfV w^w^V^
°~| 111 n 1111111111111111111 111111 u 111111111111111111111111111111111 -i 111 111111111111111 111111111111111111111 n 11111 m Trm 1111 m 111111 m 11111111 n 111
2 4 6 8 10 12 14 16 18 20 Degrees 2-Theta
(b)
Fig. 8.3 The X-ray diffraction trace of clay samples from the Clifton earth slump (a) before glycolation and (b) after glycolation.
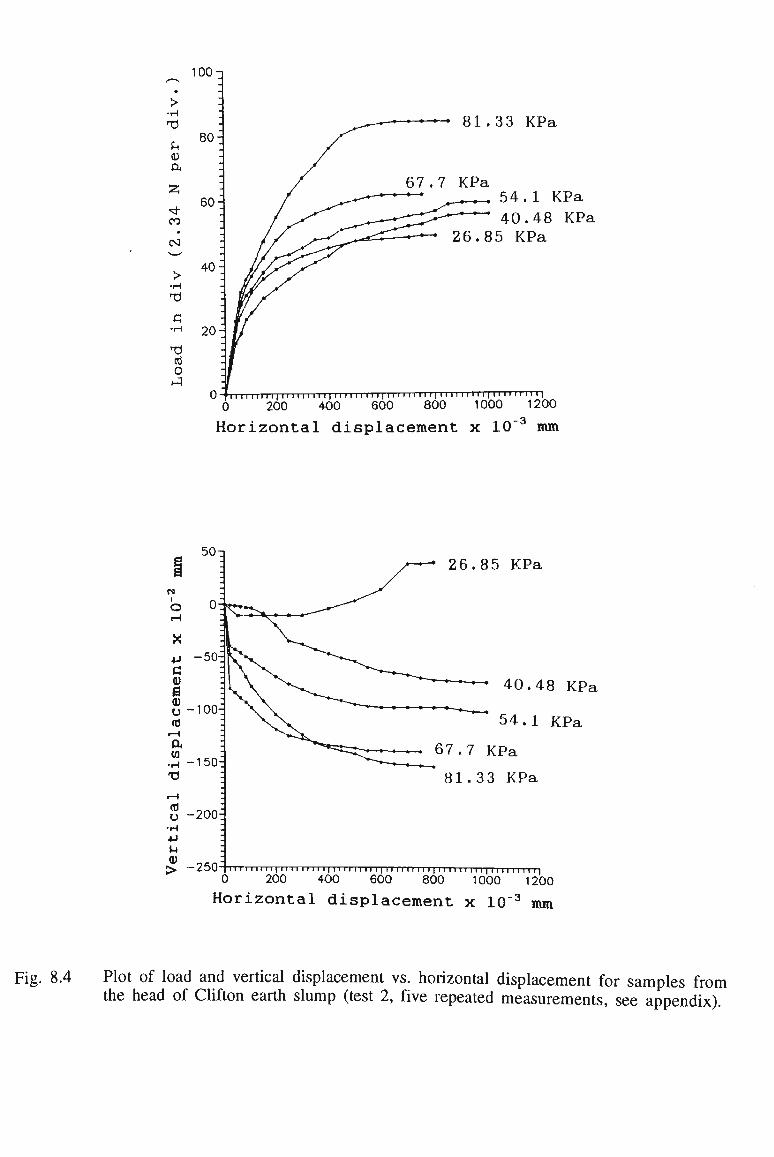
> •H
U
ft
co
CM
> •H T) G •H
R3
0
100n
80-
60-
40-
20-
81.33 KPa
67.7 KPa „ 54.1 KPa
40.48 KPa 26.85 KPa
0 f I I I I I I I I I I I I I I I I I I I I I I I | I I I I I I I I I | I I I I I H I I | I I I I I I I I I | 0 200 400 600 800 1000 1200
Horizontal displacement x 10" mm
26.85 KPa
111111111111111111111111111111111111111111111111111111111111
) 200 400 600 800 1000 1200
Horizontal displacement x 10"3
mm
Fig. 8.4 Plot of load and vertical displacement vs. horizontal displacement for samples from the head of Clifton earth slump (test 2, five repeated measurements, see appendix).
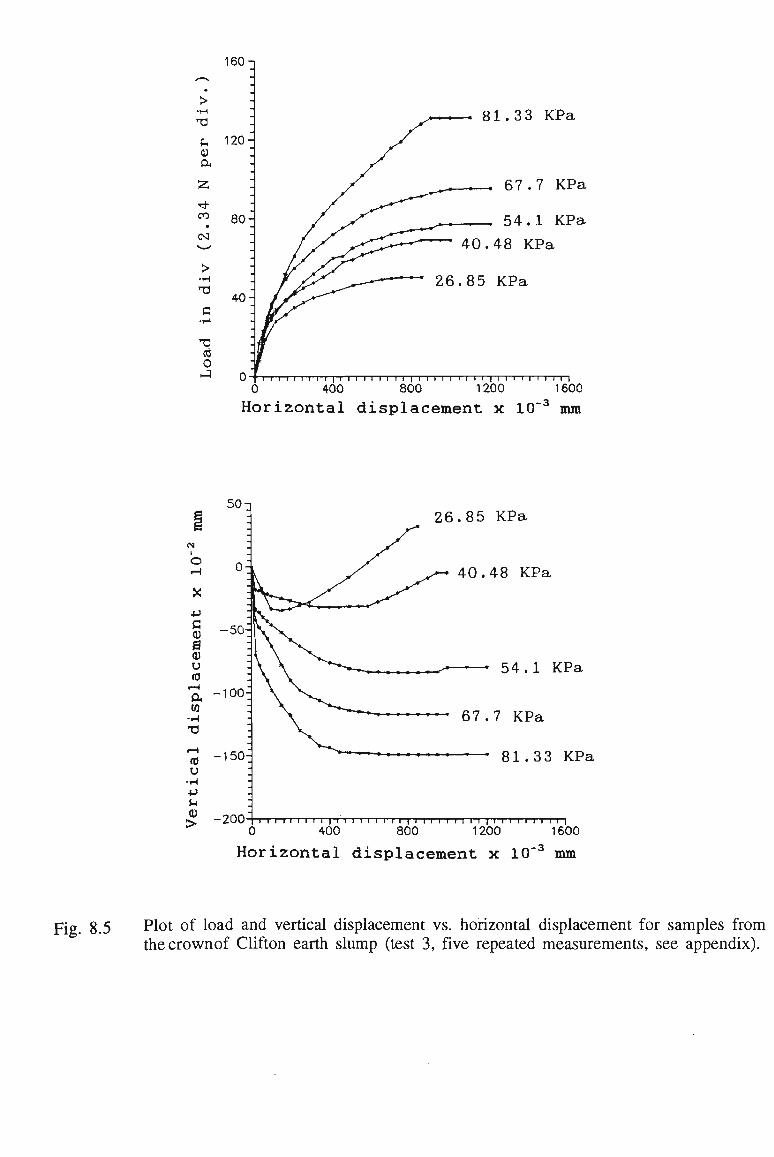
160
> •H
CD
a
00
> •H
C •i-i
cd 0
120
80-
40-
~ — 81.33 KPa
-__ 67.7 KPa
. . • 54.1 KPa * 40.48 KPa
26.85 KPa
i i 1 1 i i i i 1 1 i i 1 1 i i 1 1 i i i i
0 400 800 i i i l i i i i i i i i i i
1200 1600
Horizontal displacement x 10 -3 mm
50-i
c CD
g u rd
. — i
a CO •H T3 (0 CJ •H +J l - i
OJ >
-50-
-100-
•150-
-200
26.85 KPa
40.48 KPa
^—*— 54 . 1 KPa
••••'•• 67.7 KPa
»••» + « » • » * » ••• 81.33 KPa
i 1 1 1 1 1 1 i i 1 1 1 1 1 1 i i 1 1 i i 1 1 i i 1 1 i i 1 1 i i 1 1 i i 1 1 i
i 400 800 1200 1600
Horizontal displacement x 10~3 mm
Fig. 8.5 Plot of load and vertical displacement vs. horizontal displacement for samples from thecrownof Clifton earth slump (test 3, five repeated measurements, see appendix).
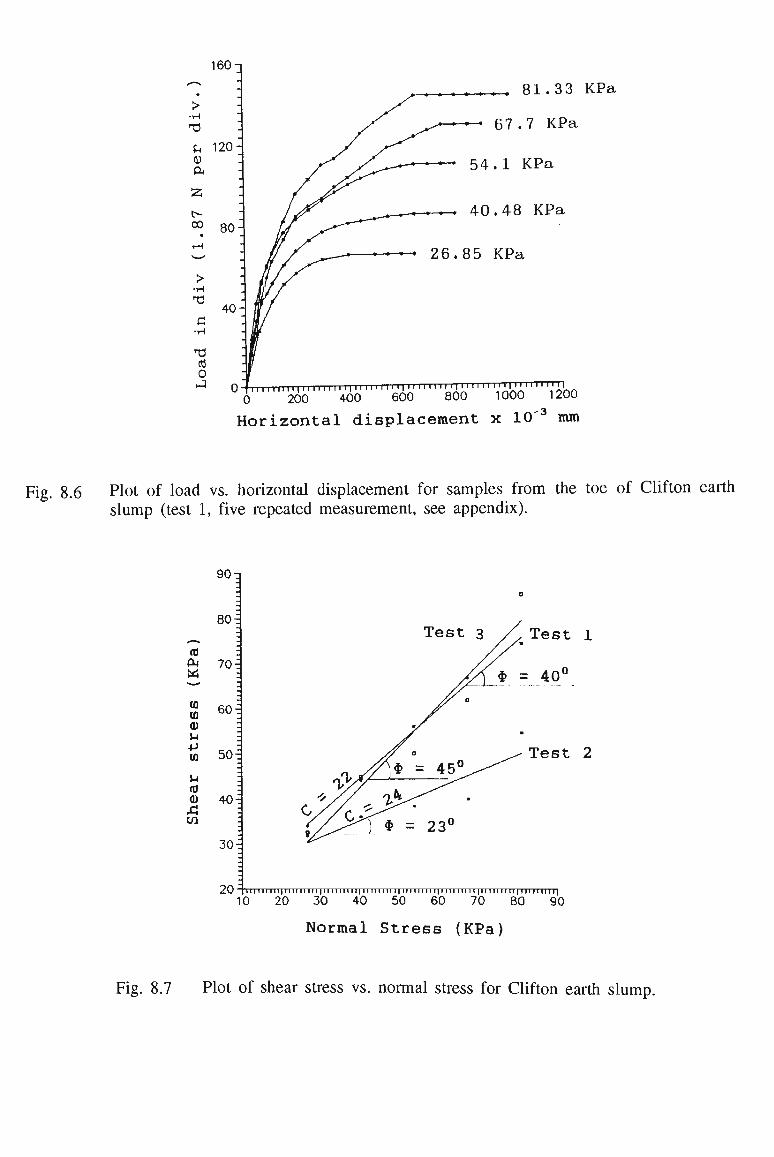
160
> •H
PI CJJ ft
t> CO
120-
C •H
cfl 0
81.33 KPa
~— 67.7 KPa
» » • » 54.1 KPa
40.48 KPa
• 26.85 KPa
0 fiii 111 n 1111111111111111 " 11111111111111 11 i|i II 111 i I'M
0 200 400 600 800 1000 1200
Horizontal displacement x 10"3 mm
Fig. 8.6 Plot of load vs. horizontal displacement for samples from the toe of Clifton earth slump (test 1, five repeated measurement, see appendix).
90
80 r
30-
to ft: ix, "—'
(0 to CD u CO
u (0 CD £ in
70-
60 i
50 -.
40-c 9.
Test 2
2 0 "| III III I ll| 11IIII III |ll II III ll| II III l l l l | III III II l| I III III II |ll III 11 ll| III II l l | | |
10 20 30 40 50 60 70 80 90
Normal Stress (KPa)
Fig. 8.7 Plot of shear stress vs. normal stress for Clifton earth slump.
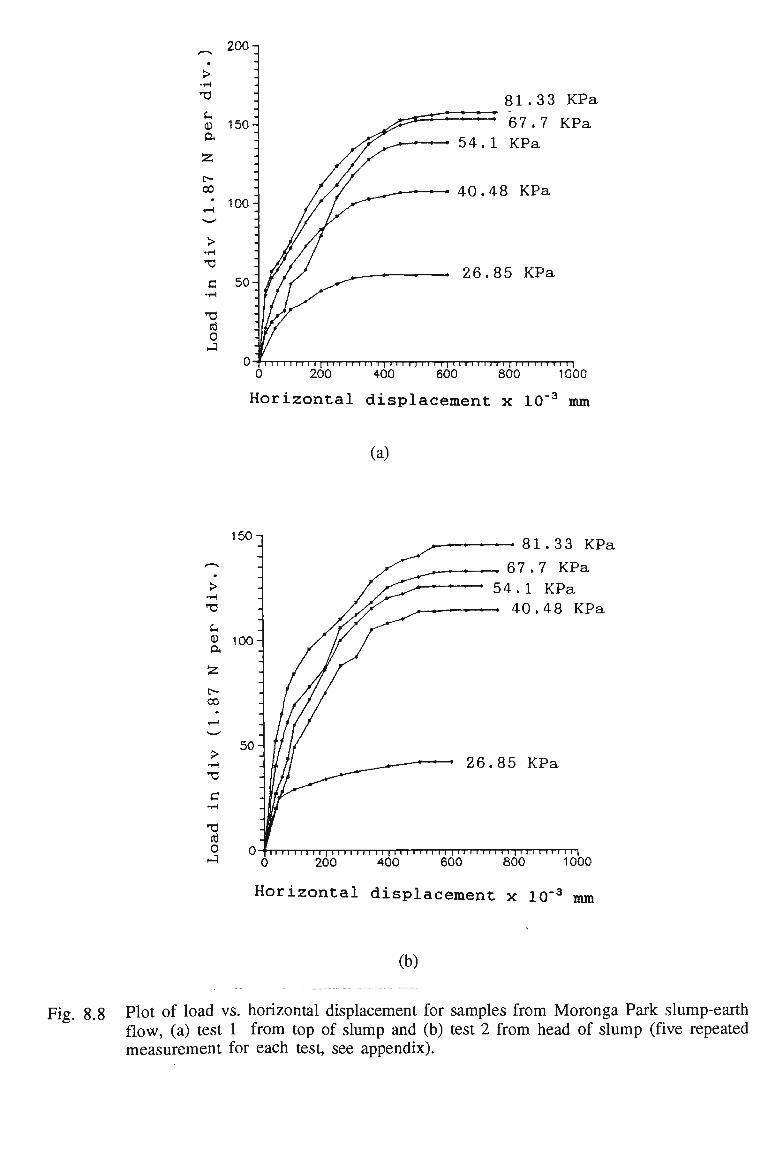
200 -i
81.33 KPa 67.7 KPa
• 54.1 KPa
—- 40.48 KPa
. 26.85 KPa
0 f 111 11111 11 111 11111 1111111111 11 111 11 11111 111 11111 11 0 200 400 600 800 1000
Horizontal displacement x 10"3 mm
(a)
150-1 81.33 KPa
.67.7 KPa 54.1 KPa 40.48 KPa
o
— — 26.85 KPa
0 f 11 11 111 11111 11 11111 1111111 M i 111 11 11111 11111 111111 0 200 400 600 800 1000
Horizontal displacement x 10"3 mm
(b)
Fig. 8.8 Plot of load vs. horizontal displacement for samples from Moronga Park slump-earth flow, (a) test 1 from top of slump and (b) test 2 from head of slump (five repeated measurement for each test, see appendix).
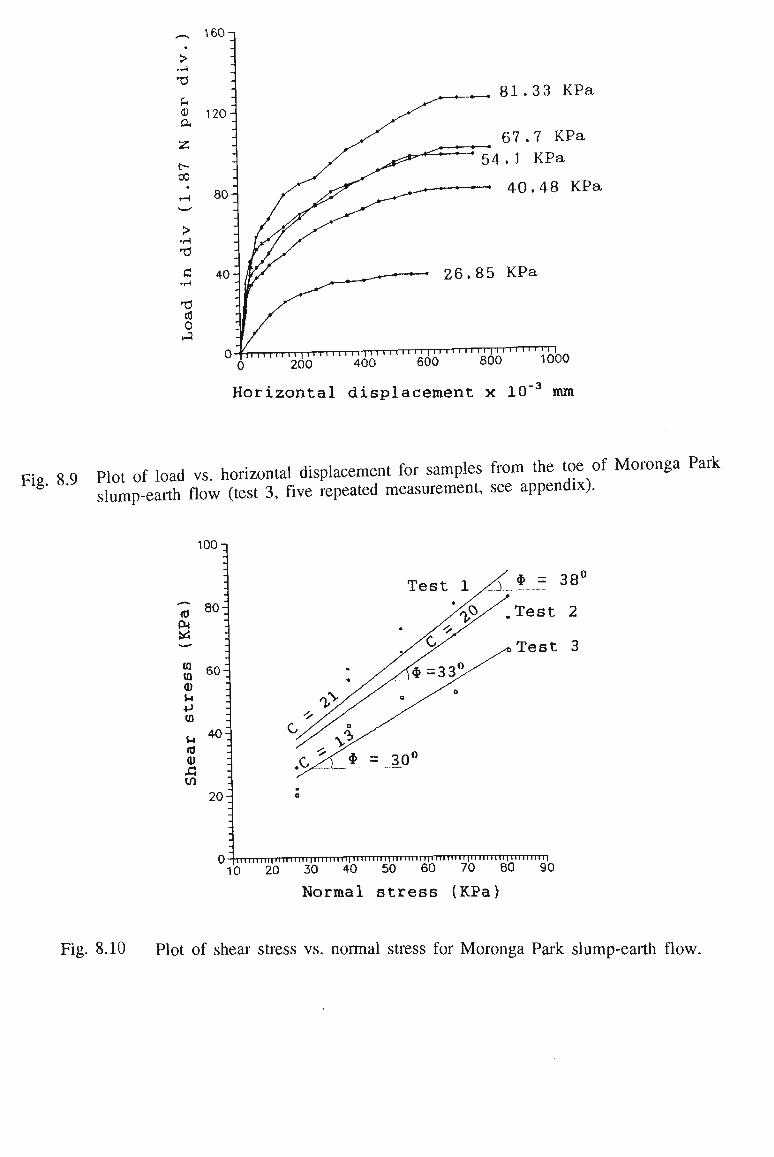
160-i
, , t 81.33 KPa
**S=Z=S 67.7 KPa
54.1 KPa
——- 40.48 KPa
26.85 KPa
in II |ti I I I H I I I I I H n'11 in 11 m II M I II u i n
200 400 600 800 1000
-3 Horizontal displacement x 10" mm
8 9 Plot of load vs. horizontal displacement for samples from the toe of Moronga Park ' slump-earth flow (test 3, five repeated measurement, see appendix).
100
ft)
ft
CO to CD U +J CO
u <0 CD
cn
80
60-
40
20-
0 - ii i in i m i i n 11 n i in 11 II 11II11 II i m i l II "ii u ip i II in 111" in 11 II I "i n I N 11
10 20 30 40 50 60 70 80 90 Normal stress (KPa)
Fig. 8.10 Plot of shear stress vs. normal stress for Moronga Park slump-earth flow.
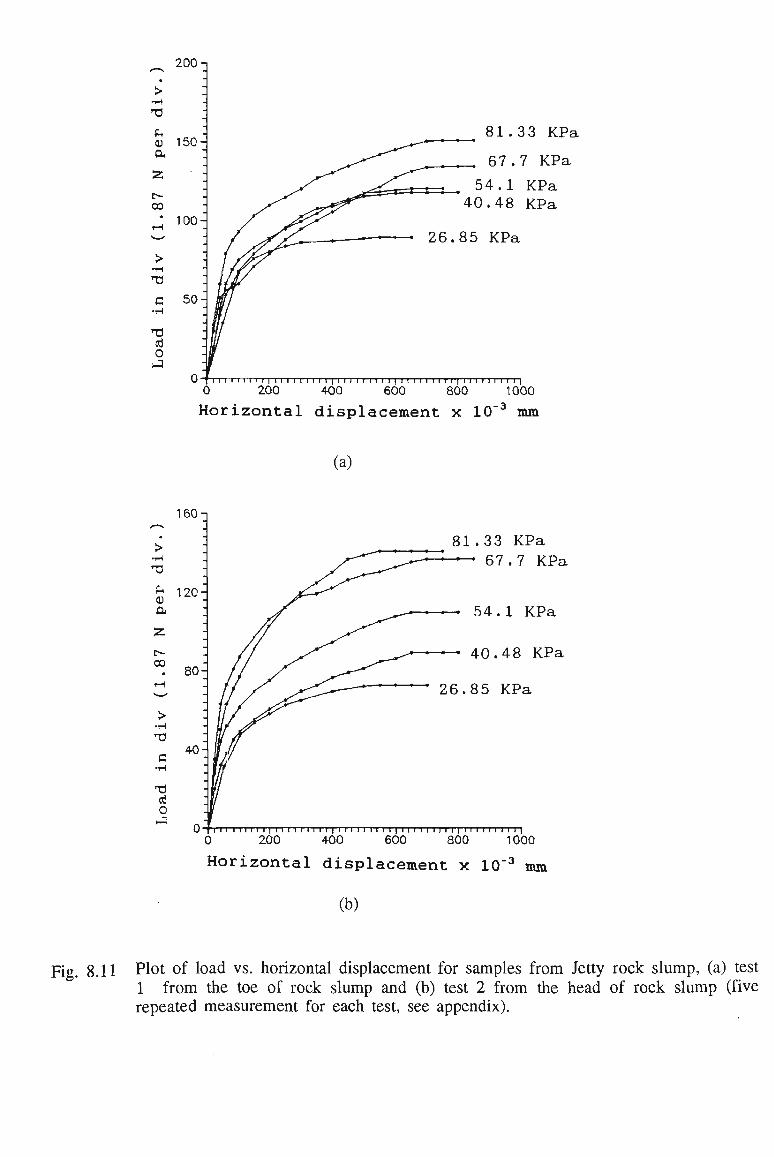
200-,
>
13
PH
CD ft
oo
T3
C •H
T3 cd 0
150
100
50-
81.3 3 KPa
67.7 KPa
54.1 KPa 40.48 KPa
26.85 KPa
0 f 1111111111111111 M 111 n 11 1111111111111111111111111 0 200 400 600 800 1000
Horizontal displacement x 10"3 mm
(a)
160
81.33 KPa - — 67.7 KPa
•54.1 KPa
«—~ 40.48 KPa
* 26.85 KPa
111111111111111 M 1111111111111111111111111111111111 0 200 400 600 800 1000
Horizontal displacement x 10"3 mm
(b)
Fig. 8.11 Plot of load vs. horizontal displacement for samples from Jetty rock slump, (a) test 1 from the toe of rock slump and (b) test 2 from the head of rock slump (five repeated measurement for each test, see appendix).
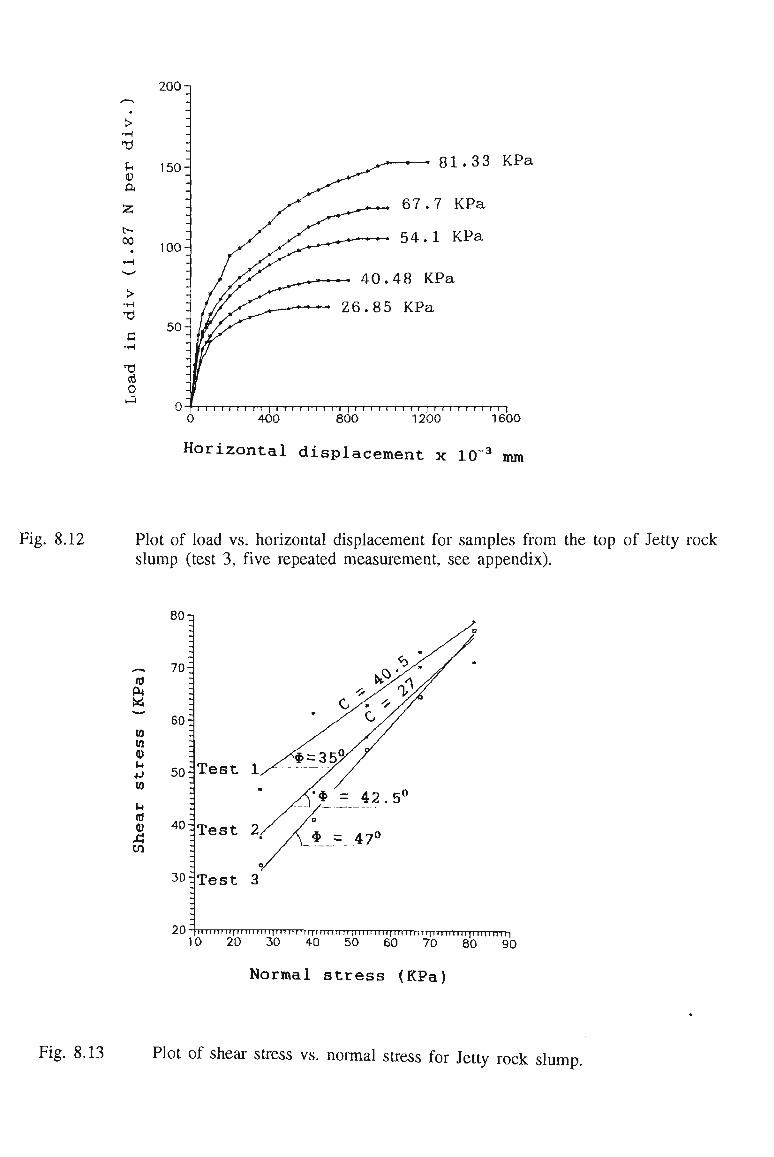
200
•H
CD ft
00
> •H
0
150
100-
50-
— 81.33 KPa
67.7 KPa
*—~ 54 . 1 KPa
-«-. 40.48 KPa
*— 26.85 KPa
0 f i i i i i i i i i i i i i i i i i i i i i i i i i i i i i i i i i i i i i i i i 0 400 800 1200 1600
Horizontal displacement x 10"3
mm
Fig. 8.12 Plot of load vs. horizontal displacement for samples from the top of Jetty rock slump (test 3, five repeated measurement, see appendix).
8 0 zi
~ 70 (0 ft
CO CO CD
u CO
u to CD
60:
50:
40:
30:
20
Test 1
II M nni[ II M i in ip u i m II |i m IIMI |i i in ini| l i m n u p II in in |i iiiiinri
10 20 30 40 50 60 70 80 90
Normal stress (KPa)
Fig. 8.13 Plot of shear stress vs. normal stress for Jetty rock slump.
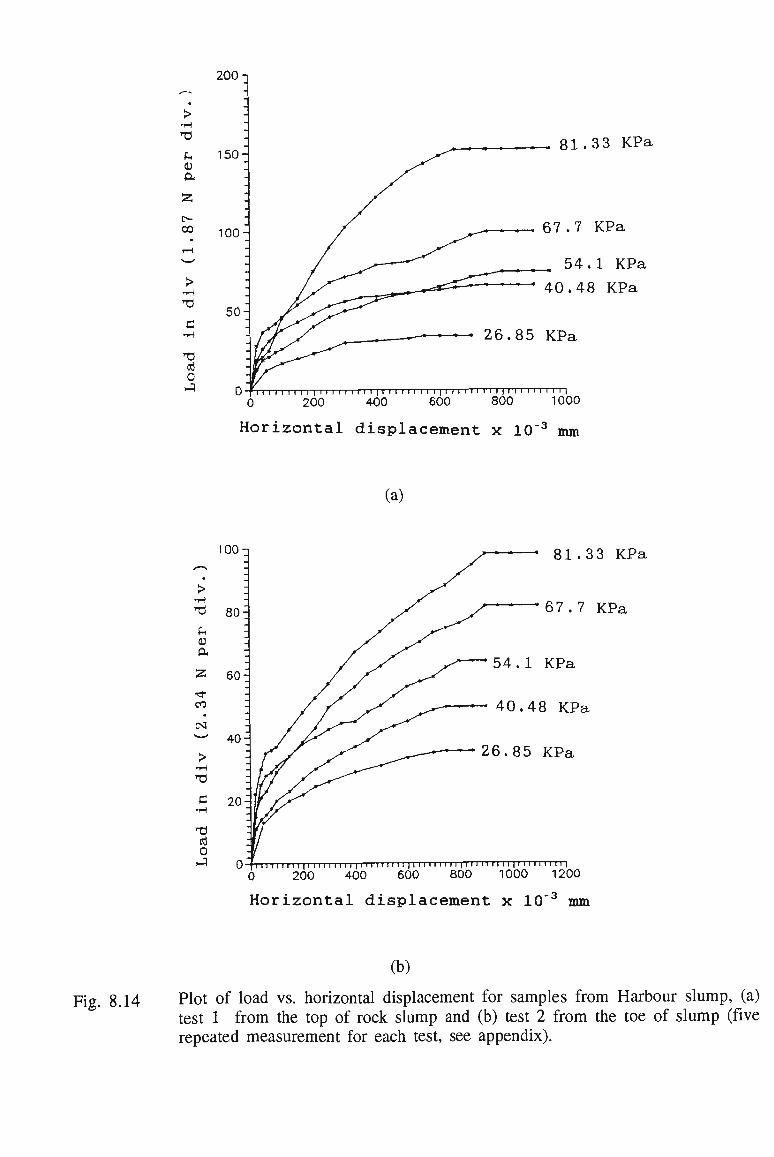
200
cd 0
81.33 KPa
*—•—*—* 67*7 KPa
+ •» • * 54.1 KPa
' " ' ' 40.48 KPa
« « « - 26.85 KPa
0 - f I I I I I I I I I | I I I I I I I I I | I I I I I I I I I | I I M I I I I I | I I I I I I I I I I
0 200 400 600 800 1000
Horizontal displacement x 10"3 mm
(a)
too i
> •H
(H
ft
rt CO
IN
T3
C •H
cd 0 iJ
81.33 KPa
* 67.7 KPa
54.1 KPa
~ 40.48 KPa
0 f I I I I I I I I I | I I I M I I I I | I I I I I I I I I | I I I I I I I I I I I N I I I I I I | I I I I I I I I I |
0 200 400 600 800 1000 1200
Horizontal displacement x 10"3 mm
(b)
Fig. 8.14 Plot of load vs. horizontal displacement for samples from Harbour slump, (a) test 1 from the top of rock slump and (b) test 2 from the toe of slump (five repeated measurement for each test, see appendix).
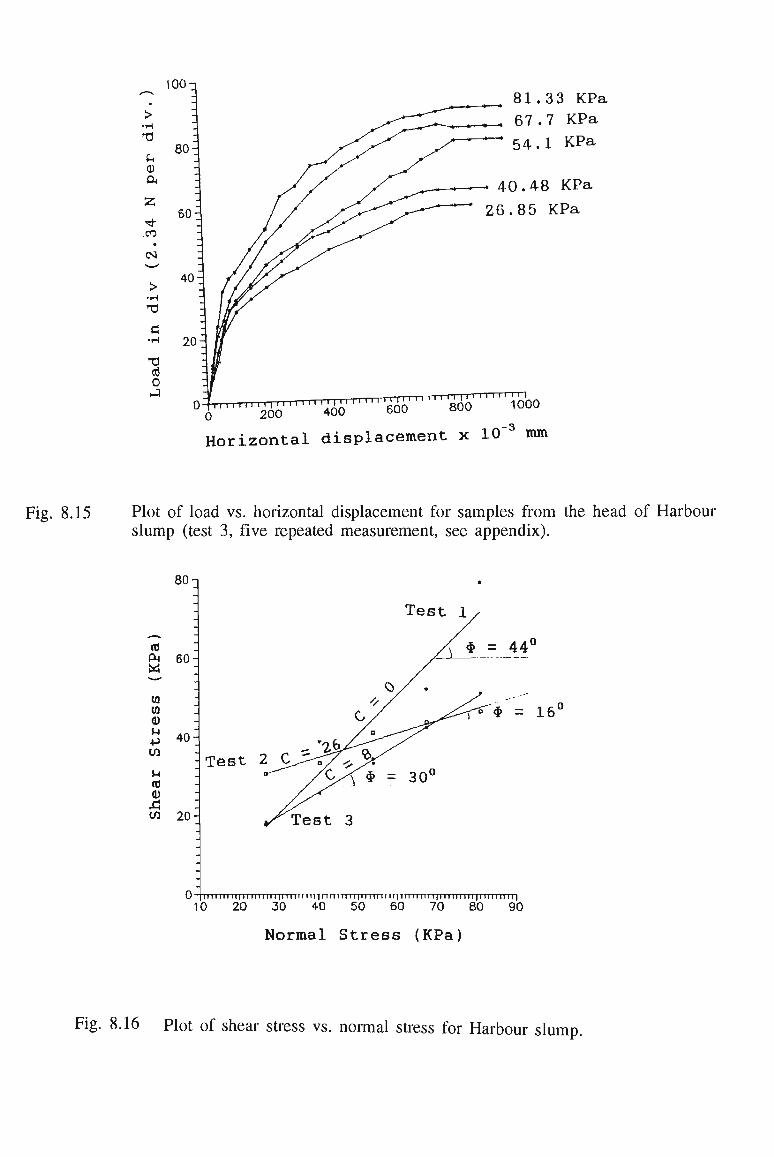
81.33 KPa .67.7 KPa —— 54.I KPa
40.48 KPa 26.85 KPa
rHn M"i Mi" •••"•• !• RnnT
0 200 400 '•""
i 1 1 1 1 1 1 1 i 1 1 ' •' '' I
600 800 1000
Horizontal displacement x 1 0 " mm
Plot of load vs. horizontal displacement for samples from the head of Harbour slump (test 3, five repeated measurement, see appendix).
80
cd ft bi
CO CO CD u 4-> cn u to CD A cn
RO
40
20
: Test 2 C ^
Test 3
$ = 16'
0 IIIIIIII ill n nun Mi n in in inn m II [ii in H n| mi nn ip n nun pin in n |
10 20 30 40 50 60 70 80 90
Normal Stress (KPa)
8.16 Plot of shear stress vs. normal stress for Harbour slump.
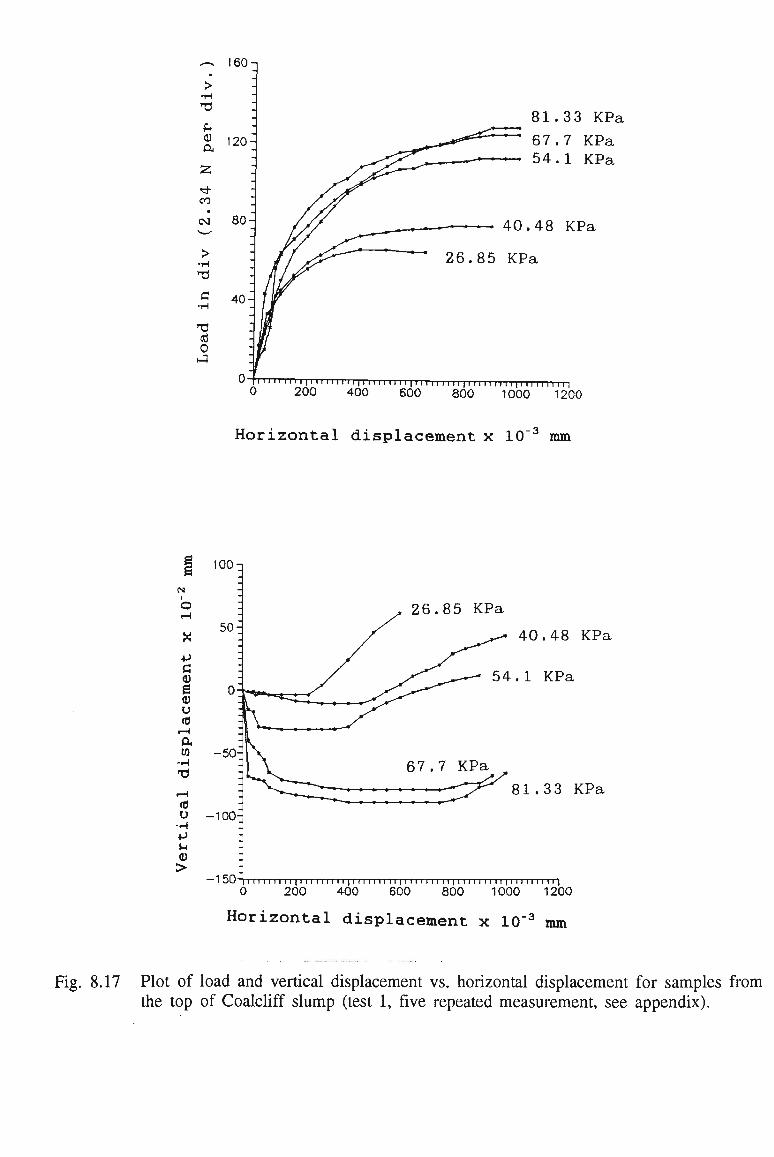
<-v I6O-1
>
OJ
ft
co
(N
> •H
T3
C •H
tj cd 0
120-
81.33 KPa
67.7 KPa 54.1 KPa
— 40.48 KPa
26.85 KPa
1 " 'I M I I 11 I I M I I II |l II II II II 11 I I I I n n 11 u u u | | 11 | | n n u !
) 200 400 600 800 1000 1200
Horizontal displacement x 10"3 mm
lOO-i
4J
C CD S CD CJ to -H ft CO •H
•a CJ •H
-U U CD >
-50-
-100-
26.85 KPa
40.48 KPa
54.1 KPa
67.7 KPa • - ^ 3 ^ 8 1 . 3 3 KPa
—150'1111111111111111111111111111111111111111111111111111111111111
0 200 400 600 800 1000 1200
Horizontal displacement x 10"3 mm
Fig. 8.17 Plot of load and vertical displacement vs. horizontal displacement for samples from
the top of Coalcliff slump (test 1, five repeated measurement, see appendix).
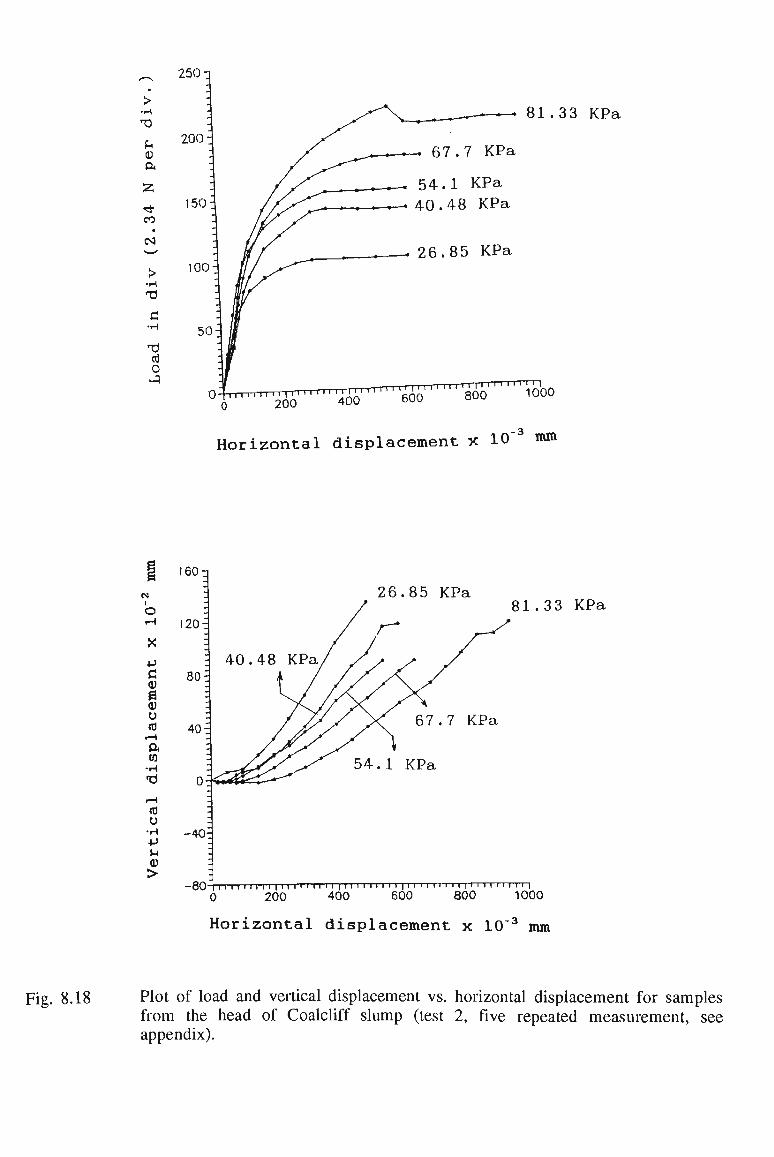
> •H
cu ft
co
CM
> •H
C
T3 cd 0
250 q
200-
150
100
* 81.33 KPa
TTTTT'II I I I I I i rr\
° W - ^ ~ ^ ^ 1000
- 3
Horizontal displacement x 1°' ^
*J
c CD & CD CJ (0
i—I
ft CO •H
•a to CJ •H 4J
CD >
I6O-3
120:
26.85 KPa 81.33 KPa
- 8 0 - 11 1 1 1 1 1 1 1 i 1 1111111 'i 1 1 1 1 1 111 1 1 1 1 1 1 1 ' 11 1 1 1 ' ' ' i i' i 11 i
0 200 400 600 800 1000
Horizontal displacement x 10"3 mm
Fig. 8.18 Plot of load and vertical displacement vs. horizontal displacement for samples from the head of Coalcliff slump (test 2, five repeated measurement, see appendix).
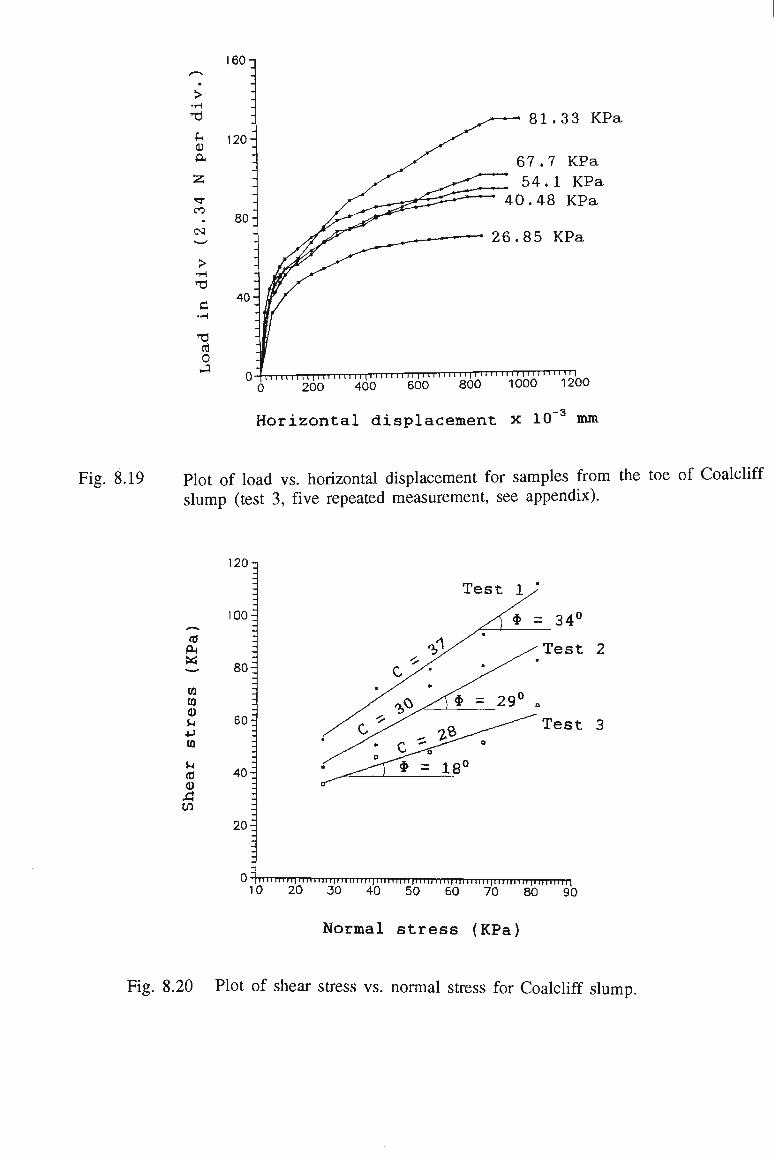
160-1
> •H
0) ft
CO
CN
>
C
cd 0
120-
81.33 KPa
67.7 KPa 54.1 KPa 40.48 KPa
80-
40-
26.85 KPa
0 tiniinu1iiiiiiiiUi'niiiii|iinniii|iiiiiiiii|MMiMii|
0 200 400 600 800 1000 1200
-3
Horizontal displacement x 10 mm
Fig. 8.19 Plot of load vs. horizontal displacement for samples from the toe of Coalcliff slump (test 3, five repeated measurement, see appendix).
CO CO CD U *J
CO
u (0 CD
A C/J
120-n
100
10 ft
ZL 805
60
40
20:
Test 2
Test 3
0 1 1 1 ' 111 • i < 1 1 1 1 1 1 1 1 » 1 1 1 1 1 1 1 1 1 1 1 1 1 1 1 1 1 1 1 1 J 1 1 1 1 1 ] 1 1 1 1 1 1 r 1 1 1 1 1 1 1 1 1 1 1 1 1 r~i J 1 1 1 1 1 1 1 1 1 1 1 1
10 20 30 40 50 60 70 80 90
Normal stress (KPa)
Fig. 8.20 Plot of shear stress vs. normal stress for Coalcliff slump.
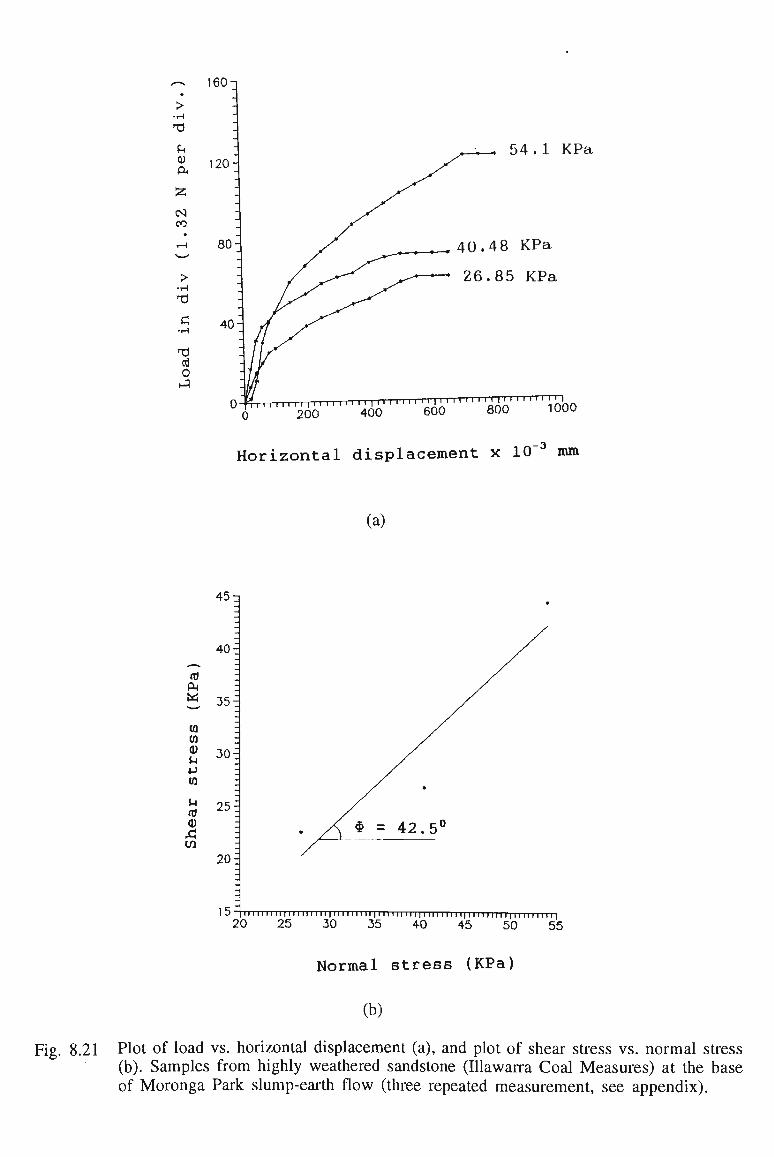
160-1
>
u CD ft
CO
> •H
Tl C •H
cd 0
54.1 KPa
, t T 40.48 KPa
~- 26.85 KPa
0 "ft II • I I I I I I I " I H I I •! • I M i l l I I I I I I ' ' " • • I
0 200 400 600 800 10UU
Horizontal displacement x 10"' mm
(a)
45 ->
40
to ft « " CO CO CD
u <J CO
u (0 CD A cn
35
30
25
20:
15 |ni m i n|i11niin|nn111n 11 inn iii|i in M i n i m u m i| inn inn
20 25 30 35 40 45 50 55
Normal stress (KPa)
(b)
Fig. 8.21 Plot of load vs. horizontal displacement (a), and plot of shear stress vs. normal stress (b). Samples from highly weathered sandstone (niawarra Coal Measures) at the base of Moronga Park slump-earth flow (three repeated measurement, see appendix).

cd CJ
X in 00
• CO N
cd a it 00 <* o jt-
cd CX * f-H
f ID
«nn Z.0T x ^usateoBTdsTp I E D T U S A .
u C CO
g CO
u CO
l-t
& tn •H T3 (0
c 0 LM •H IJ
0 ac
c u E-o o 8 -a «J
C/3 TO c/a
•a —
cd co E ° p fe C u c u o
cd
t
| e o§^ 3 ^
> .3 c/3 Q. > •a g
cd ^ CO c
— u •O -2 i-X* cd «-» ra ^-» co
O C .
?.§§ ° J- J5
- 2 M
CL ^5 > CL
CN CN
oo"
&b
Si xl <u CO c/3 O .
c3 -£ «» S o u > <- CO
*—> c CO
E P
B u
I ° -O Q. c
S3 P U 1)
P-S E c/> w dj
^ co 3
ico e C/3
11111111111111111
o o o a oo co
1111111111111111
o o * CN
C (U g <D U (!) l-H
a m (0
v c 0 N •H 14 0 ss
o -in (0
."1 C.
cn
w
ro g tj
0
z
| I I I I I I I I I | I I I I I I I I I | I I I I I I I I I | I I I I I I I I I | I I I I I I I I I | I I I I I 1 I I I | C N
m o in o in o in *i- *t- n ro CN CN —
(•ATP asd N ZC'T) Afp ux p^oq (BdJl) SS9J5S JESI^S

X 0)
c
03
to
60
50
40
30
20
10
7
4 CL-ML
I l l l I I X l . i l I l l I I I I I I I
10
i ' i i i i i i I I I
4 0 5 0 6 0
Liquid limit wL
i i i i l I I I I I
80 90 10
Fig. 8.23 Plasticity chart showing plasticity index (Ip) versus liquid limit ( W L ) for the matrices of the Illawarra talus (between Clifton and Coalcliff). C L = inorganic clays of low to medium plasticity. M L = inorganic silts and very fine sands with slight plasticity.
Sample localities are: I. Selnei 2. Manglerud 3. Asrum 4. Labrador S. Ottawa 6, 7. Sandnes B. Little Belt 9. Bear paw 10. Pierre II. Pepper 12. Cucharacha 13-IS. Vaiont 19. Walton W o o d 20, 21. Guildford 22-24. Acherfield 25, 26. Weald 27-28. Manglea 29. Wraysbury 30. London 31, 32. Gault 33. Chalk 34-36. Keuper marl 37. Liu 38—40. Appalachian colluvium 39. Upper Coal Measures
04 OS 0 6
Residual strength, tt_
Fig. 8.24 Plasticity index plotted against residual strength coefficient (after Voight, 1973).

(T)Kenney(l9S9]
(7)'skempton-Gibson-BJerrum'ln Bjerrum and Simonl (I960)
(?) Hole (1942)
(7) Brooker and Ireland (I96S)
©Mitchell (1965)
0Voljht(l973)
(7) Soil alone-peak values (<r„ = 0 l-OMkg/cm2)
(?) Soil alone— peak values (tr„ = 3 S leg/cm *)
(V) Soil alone—minimum attained values (limited displacement)
MO) Soil-polished rock Interface
ICanji (1970,' 1972)
K 40
Plasclclty index. I
0 Bishop cfa(.(l97f) .j A Townsend and Gilbert (1973)
fj. values* n Tulinov and Molokov (1971) o Kan|l (1970, 1972), soil-polished rock
Fig. 8.25 Drained shear angle plotted against plasticity index. Figure shows the test results in the form of curves obtained for peak strength under low and medium stress levels (after Kanji, 1974).
40° CJn = 100-200 k N / m
2
a.
30
20 -
10"
-~ ->«.43.
« • *
1 1
i 1
1
CO
-
— ~
_ "I 1 1 1 1 1
48* 50
69
36- Happisburgh till —
r'38* / London clay mixtures
4l 50 ^ / ' «• N ^ r — 51
40 • \Y
20 »N s 52 .^ s . Sand-benlonitz
\ N mixtures 33. 46 \ -3" /
9 • . 11 12 » / "••* \ • „ v / 15^- JS 3 2.29 ^ " . . y
" 5'V^?",A 32. - ^
I i i ! i i i i i i t . i 1 i i t t i t i M 1 i i t i i i i i i 1 i i i i r i t i i
05
0.4
0.3
0.2
0.1
20 40 SO B0 100 Plasticity index . I - (7.)
Fig. 8.26 Natural soils: residual friction angle against plasticity index (after Lupini et al., 1981).
CJn = 100-200 kN/m2
40 s
Sf so'
20'
S 10 cn ed
or
39.
40<
i 7.* ,,14,. 9 26 ."
. 3\6.1 16 •
* 5 " a\ 2'.27
1"'' •'" I ' " '" " ' I ' " 11 1111
20 40 60 80
XL H 0.6
0.5
0.4
0.3
0.2
0.1
100
Clay fraction ( 7. <2 /um ]
Fig. 8.27 Natural soil: residual friction angle against clay fraction (after Lupini et al., 1981).

• • • J — 1
6
w
a.
26
24
22:
201
18
16:
14-7
1 2 1 1 1 1 1 i 1 1 1 1 i 1 1 1 1 1 1 1 i i | 1 1 1 1 1 1 1 1 1 1 1 r i i 1 1 i 1 1 1 1 1 1 1 1 1 i I I |
24 28 32 36 40 44
Liquid limit ( W L ) %
Fig. 8.28 Relationship between the liquid limit and plastic limit for Illawarra talus.
22
20
+J
c a.) +J
c o o +J
w o 5
18--~ -
16:
; 14: --"
12:
10 In II in HI 11 in in MI n in i n II in in i nn HI n HI in mil MI II in in II in i n i II 24 26 28 30 32 34 36 38 40
Liquid limit ( W L ) %
Fig. 8.29 Plot showing increasing moisture content with increasing liquid limit ( W L ) for Illawarra talus.
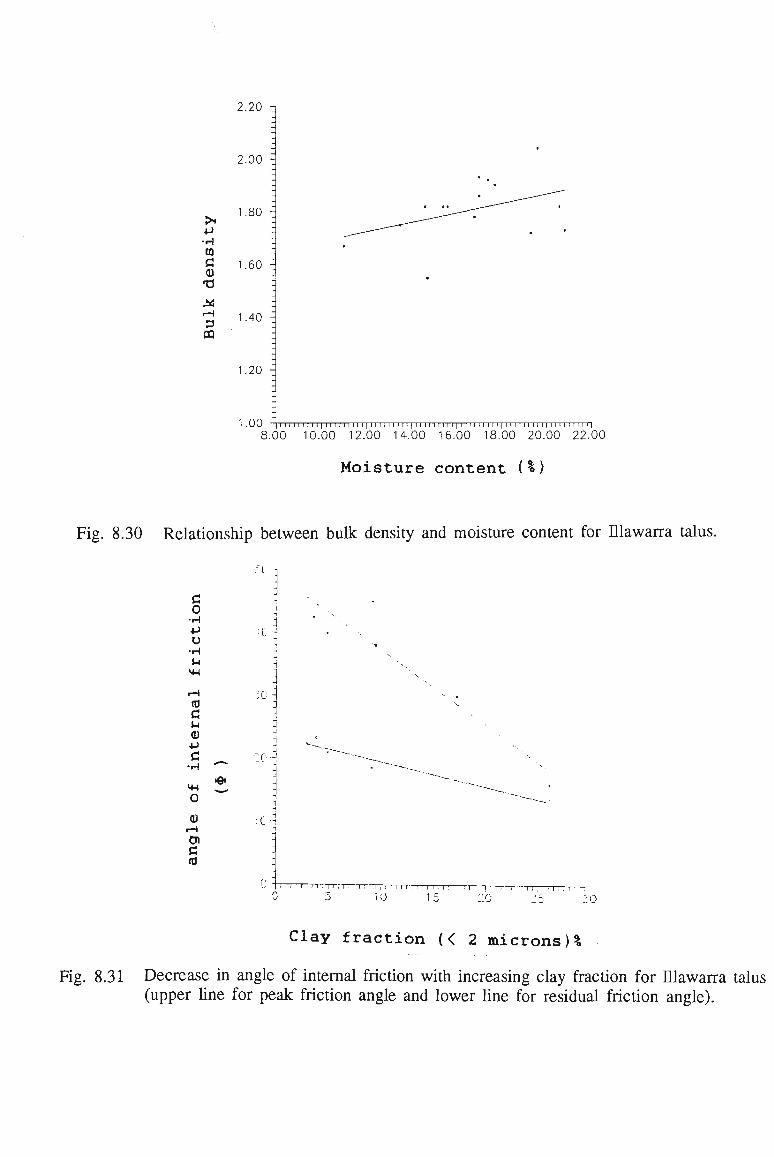
2.20
2.00
4-1 •H to fl CD
.80 -
1.60
3 1.40 -
1.20 -
1.00 11 11 111 i I i M 11 II i i'| 'i n H I ITI ] 11 i "nil 11 11 11111 i i \'\~\ rn rn 1v\ vrrvvnTT"|
8.00 10.00 12.00 14.00 16.00 18.00 20.00 22.00
Moisture content (%)
Fig. 8.30 Relationship between bulk density and moisture content for Illawarra talus.
rc. i
fl
o •H 4->
u •H >-i
4-1 It fl U ID 4J fl •H
4-1 0 cn r — I
01 fl to
.,- H
• 11111111
10 . I . I I , I I i I i T — T T i
15, "'h
Clay fraction (< 2 microns)%
Fig. 8.31 Decrease in angle of internal friction with increasing clay fraction for niawarra talus (upper line for peak friction angle and lower line for residual friction angle).
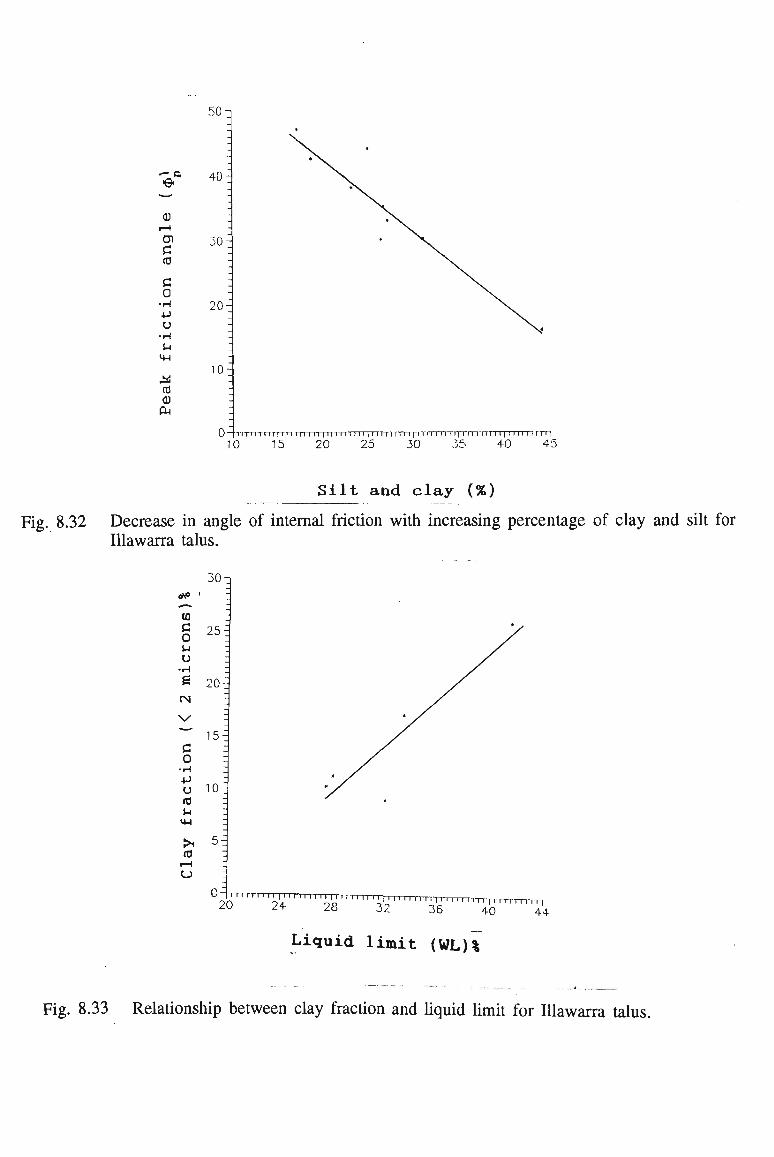
— G
rH
01 fl CO
fl 0 •rH 4J U •H l-l 4-1 tO <D
50
40-
30
2.0-
10
TTTTTTTTI | I I I I I I I I I | 11 I I I I I I I | I ITTTITTTTTTTTTTlTTrrrriTTI I I | I I I I I F TTT]
10 15 20 25 30 35 40 45
Silt and clay (%)
Fig. 8.32 Decrease in angle of internal friction with increasing percentage of clay and silt for Illawarra talus.
CO fl
o l-l
u •H
e CN
30
25
15 C o •H 4-J
U 10 rO
u cd
0-T
20 ""^''^ST'""^
Liquid limit (WL)%
Fig. 8.33 Relationship between clay fraction and liquid limit for Illawarra talus.

* •
Stanwell Park
•; •;;••../ \ \ll I / Region C
'"•". •.•.'/
Coalcliff.
Site 5
•< j Region B
Jetty Pauit
C cd CD 0
o u •H ti-l
0 cd £JJ
3 0 01
Legend
500 m
HawkesburySandstone Narrabeen Group Illawarra Coal Measures
Fig. 8.34 The study area site plan.
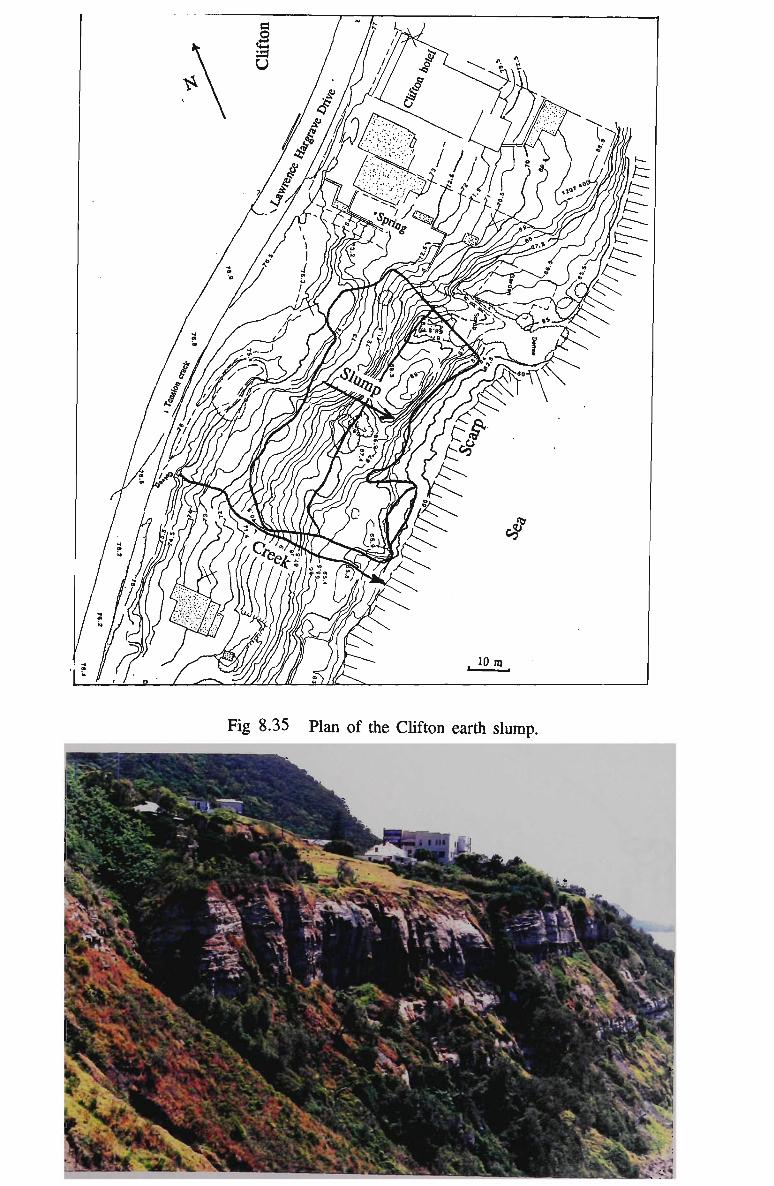
Fig 8.35 Plan of the Clifton earth slump.
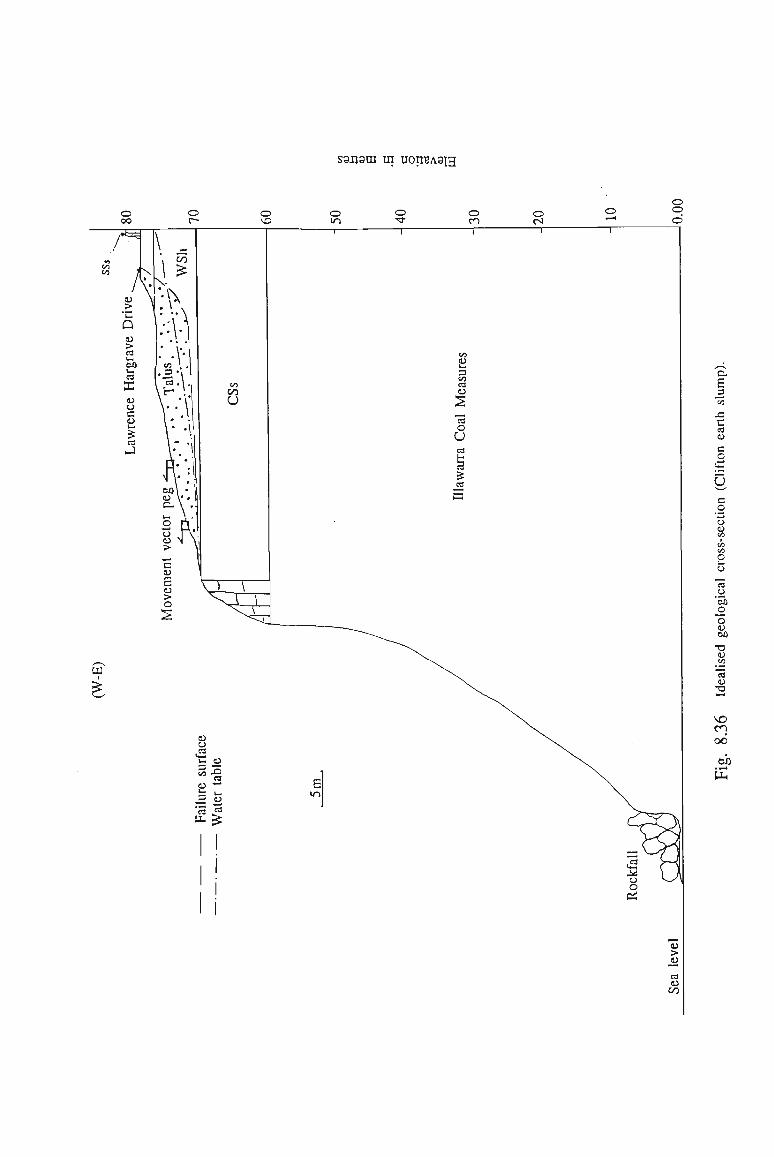
sansai in UOHEASIH
© oo
© r-
© V£3
O
m o o
—r-o CN
o © ©
CD 3
s
o U
03
ttJ
u rt Cw 1— 3
OJ
3
n tlj
CJ X! S3 *-•
C3
£
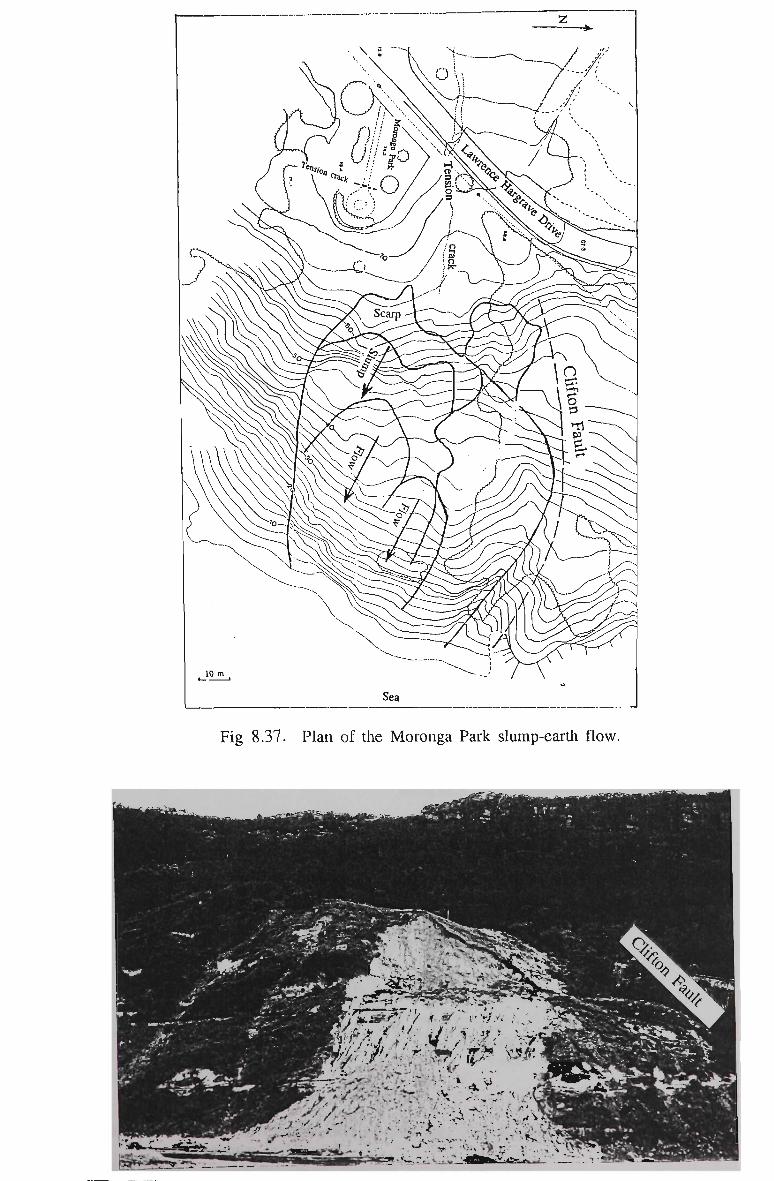
Fig 8.37. Plan of the Moronga Park slump-earth flow.
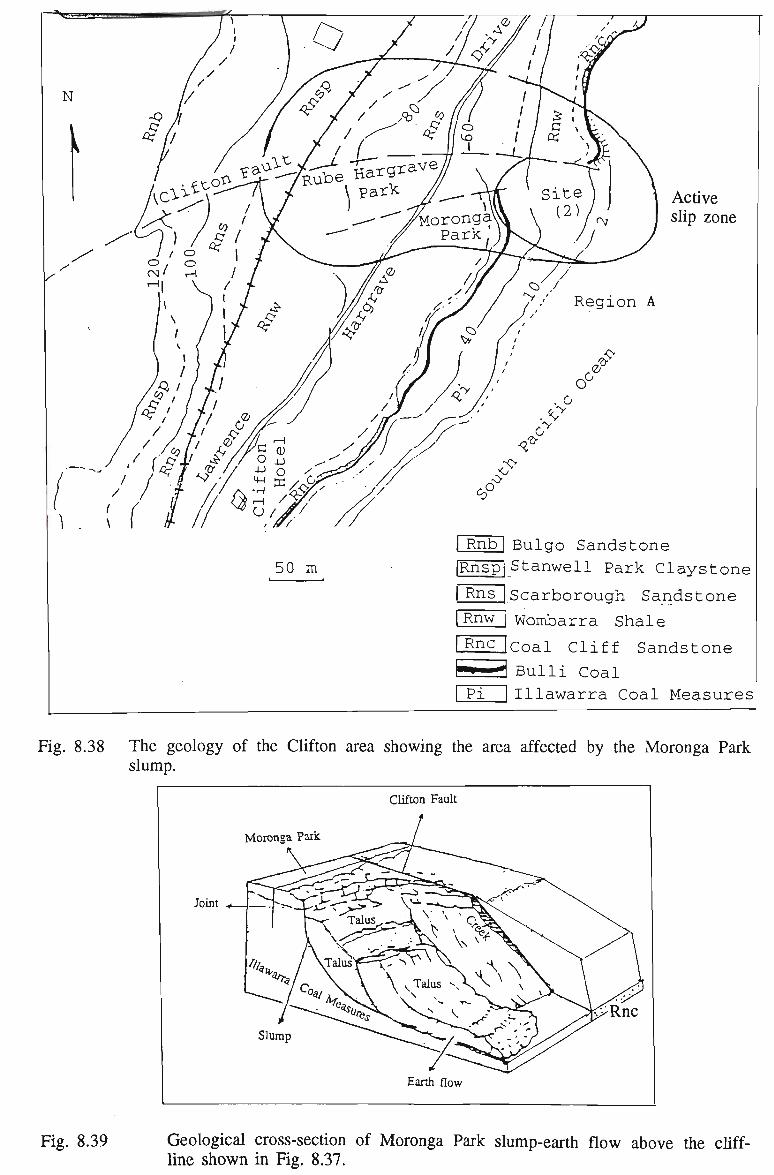
I Rnb 1 Bulgo Sandstone
IRnspj Stanwell Park Claystone
I Rns | Scarborough Sandstone
Wombarra Shale
Coal Cliff Sandstone
Bulli Coal
Pi IIllawarra Coal Measures
Fig. 8.38 The geology of the Clifton area showing the area affected by the Moronga Park slump.
Clifton Fault
Moronga Park
Joint
Earth flow
Fig. 8.39 Geological cross-section of Moronga Park slump-earth flow above the cliff-line shown in Fig. 8.37.
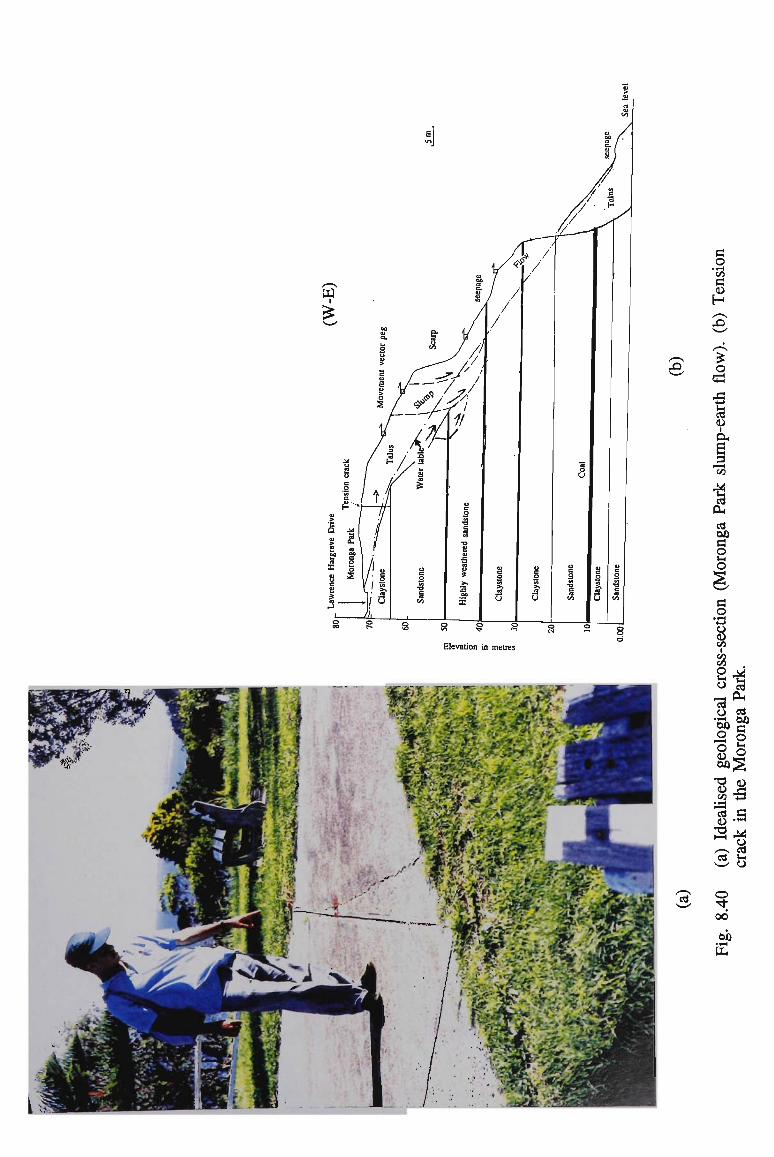
I
£>
Elevation in metres
«i
a o •a c CD
H o
a •5 & V OJ
a •a «« 00 CJ
2 o a o
CO I
</> f/>
2 •* o £ o cd
"O cU CD CO r^ ert Hi r-H ^•v.
C*t
O t OO
60 •<-i
UH
-S e •-*. ^ o CTj Ui O

(a)
(b)
Fig. 8.41 (a) PI*"1 °f southern amphitheatre complex landslide (Graben A), (b) Aerial photograph of the southern amphitheatre, this section of Lawrence Hargrave Drive (c) has a history of the slippage, rockfall and mudslip.

(W-E) Water - filled joint
Rockfall /1J_^£ j i
jj Perched water
L Talus //—-
Toppling SPC
AA-A~\ I— Natural drainage Ft~T~l~\— I~7"
Road ^ 7 /
SSs ,
200
160
-120
-80
WSh 'Talusry_ Failure surface
Sea level *? irr^-^ Bulli Coal
:CSsr7T-rv:
40
0.00
Fig. 8.42 Generalised section through southern amphitheatre.

20 m Sea
Fig. 8.43 Plan of northern amphitheatre complex landslide (Graben B).
(W-E)
Water - filled stress relief joint
ess . ' Natural drainage
Rockfall
Natural drainage
Road uau^ i s-^—yXj^. il'ii^H>? re
Talus Slump //^T?^-~=^ - / WSh
Sea level -Potential failure surface
' , . > • : J i . ».- f
,-. . :{ •: ... .v;. •^CSs^
£•90
60
30
CO
CD
s a o
•a > CD
U
0.00
Fig. 8.44 Generalised section through northern amphitheatre.
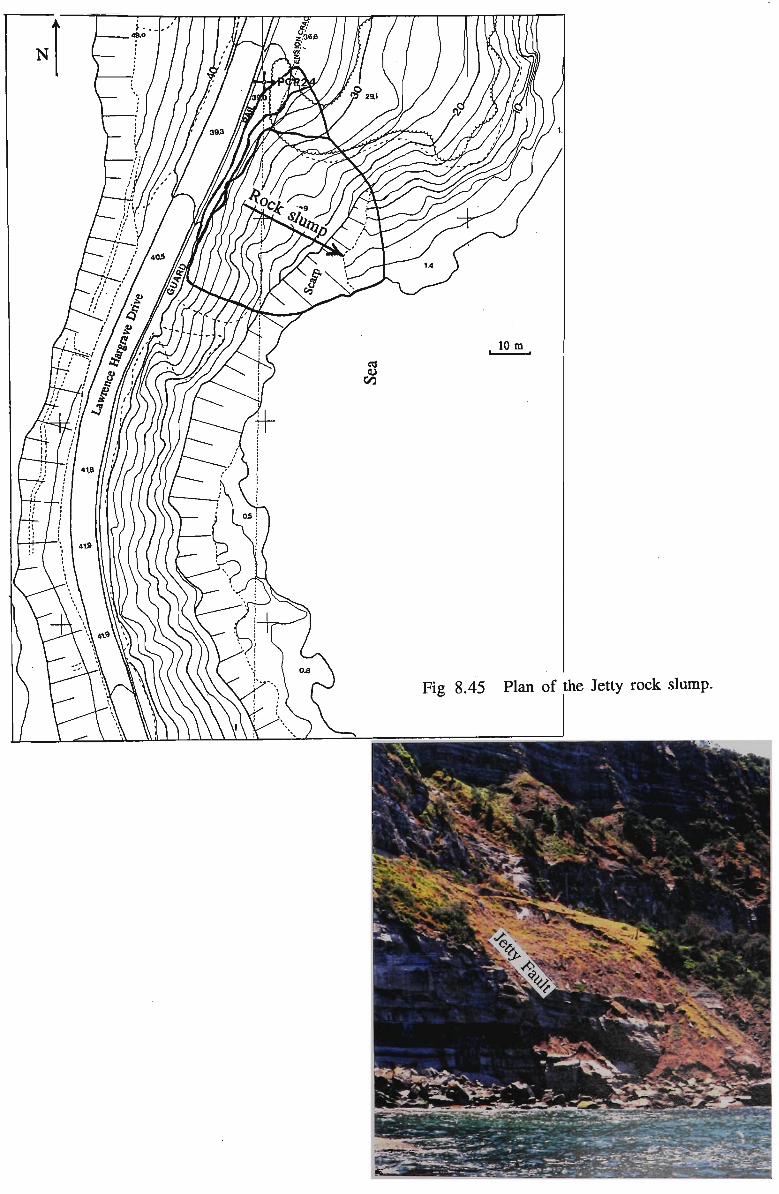
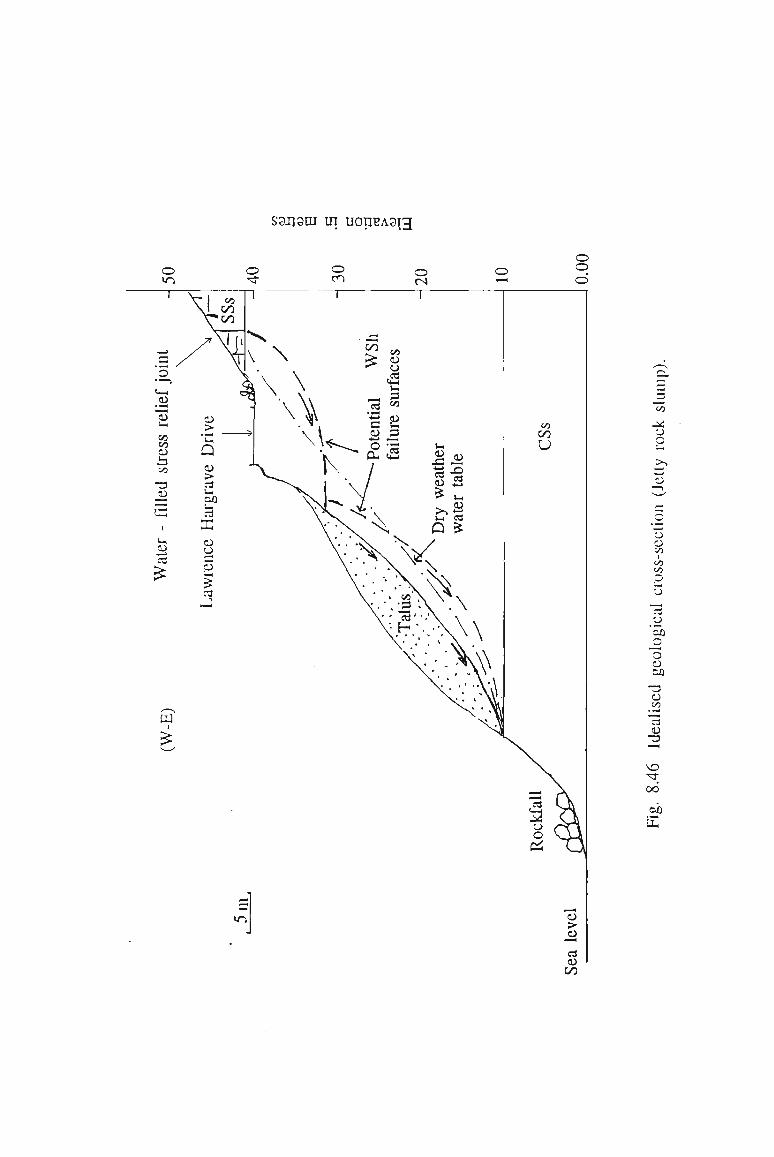
saijsai tn uon^A3'[3
o o CN
o o o
CD 1-1
CO CO CD h CO
73 CD
£-1
1-1
CD c3
=5
CD
> Q CD
> Uj
SO
J3 B OJ u — < I — <
-1
W
m
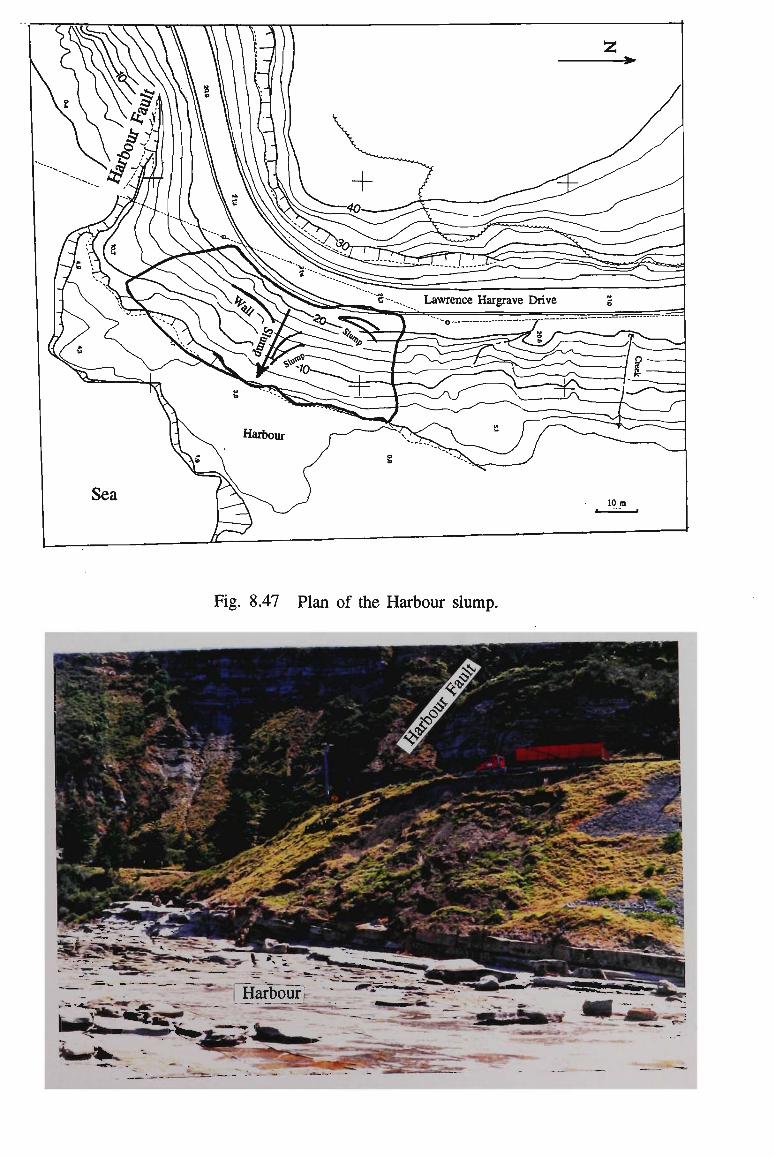
Fig. 8.47 Plan of the Harbour slump.
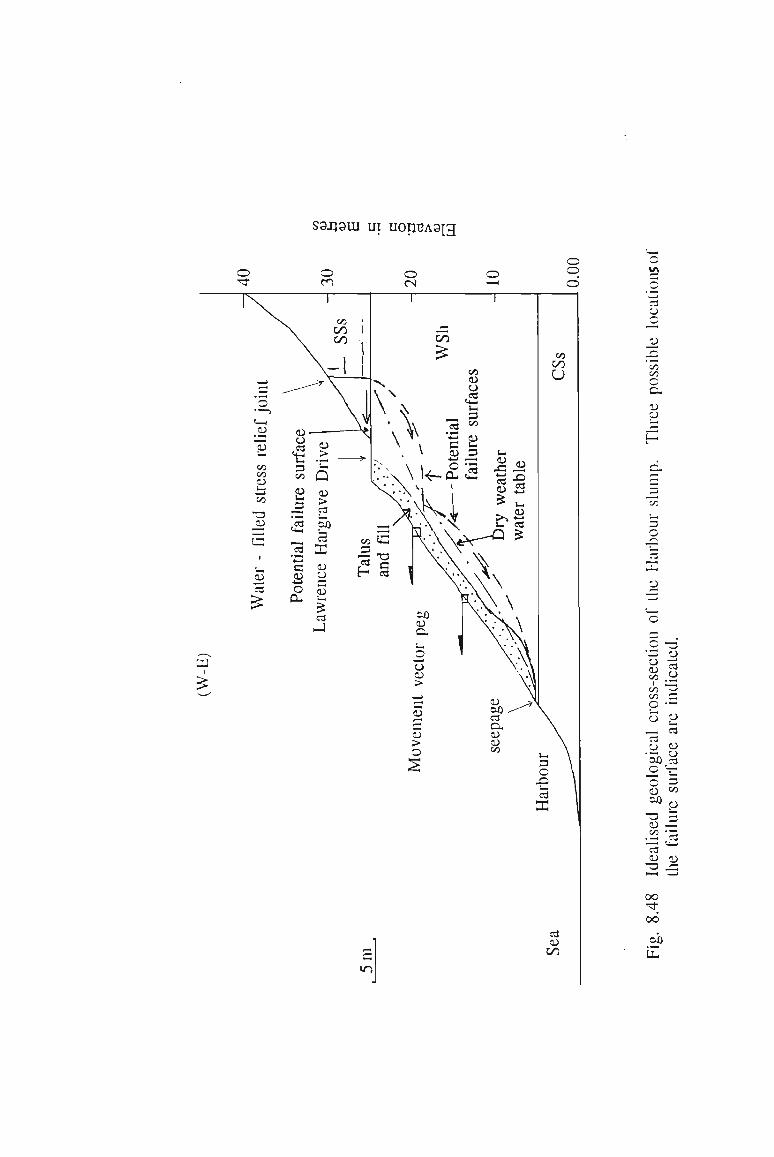
S3IJ9UI UI U0pTJA3J3
y>
71 CJ
CD
CO CO
C
a u CJ
cd
c3 (D C/3
o '""! o CD CO CO CO O •)
rt O
DA) O
n CJ Si)
T3 e; CO
cd CD -a 1—1
oo • *
oc OX) UJ
TJ CD cd
o -a ,-J
u cd
CD r > cd
" ^ — I
3 CO CO -i
CTi •—,
1)
—'
m
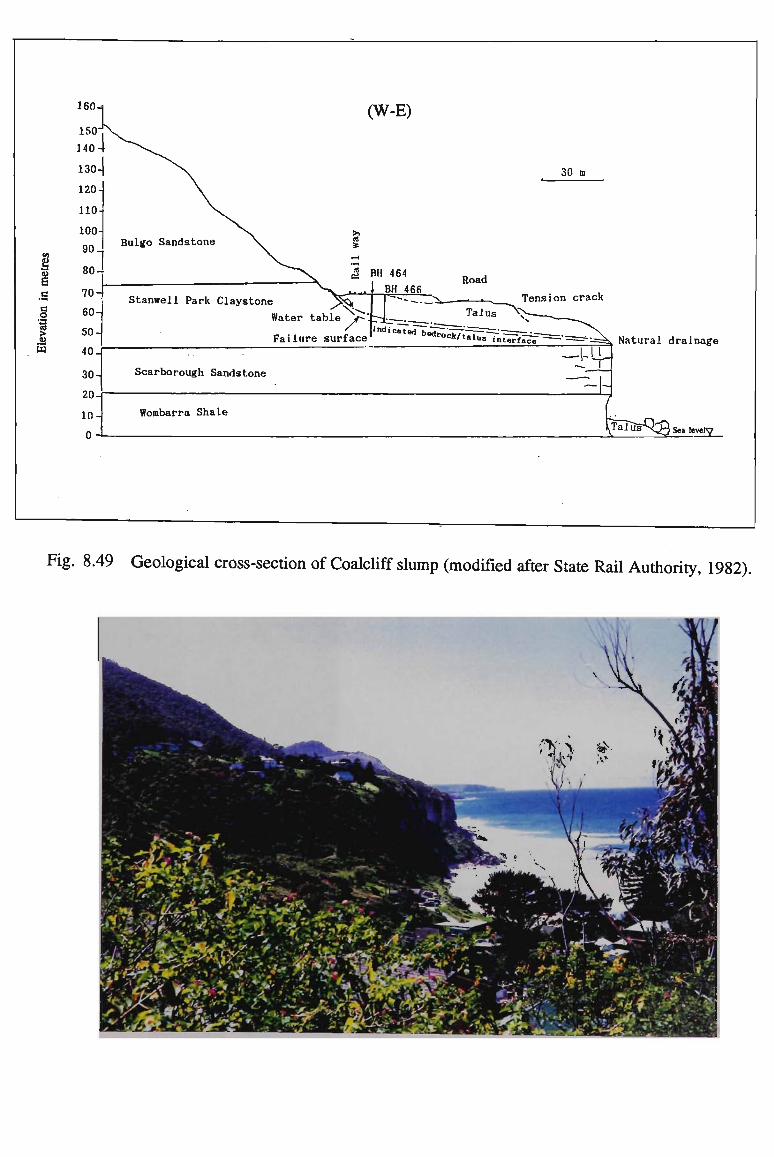
s
e o •a
s
I6O-1
150J
140 -
130-
120-
110-
100-
90-
80-
70-
60-
50-
40-
30-
20-
10-
n-
I (W-E)
Bulgo Sandstone \ g
— V «
*~\ .r-J-Stanwell Park Claystone ^5^,
Water table j> ".
Failure surface
BH 464
BH 466
Indicated befe
•-
Scarborough Sandstone
Wombarra Shale
30 HJ
Road
..... Tens i on t-.rack Ta 1 us \ ^ - _ _ _ _ ^
-A ~\-
Natural drainage
^TusVQ^SealevelV
Fig. 8.49 Geological cross-section of Coalcliff slump (modified after State Rail Authority, 1982).
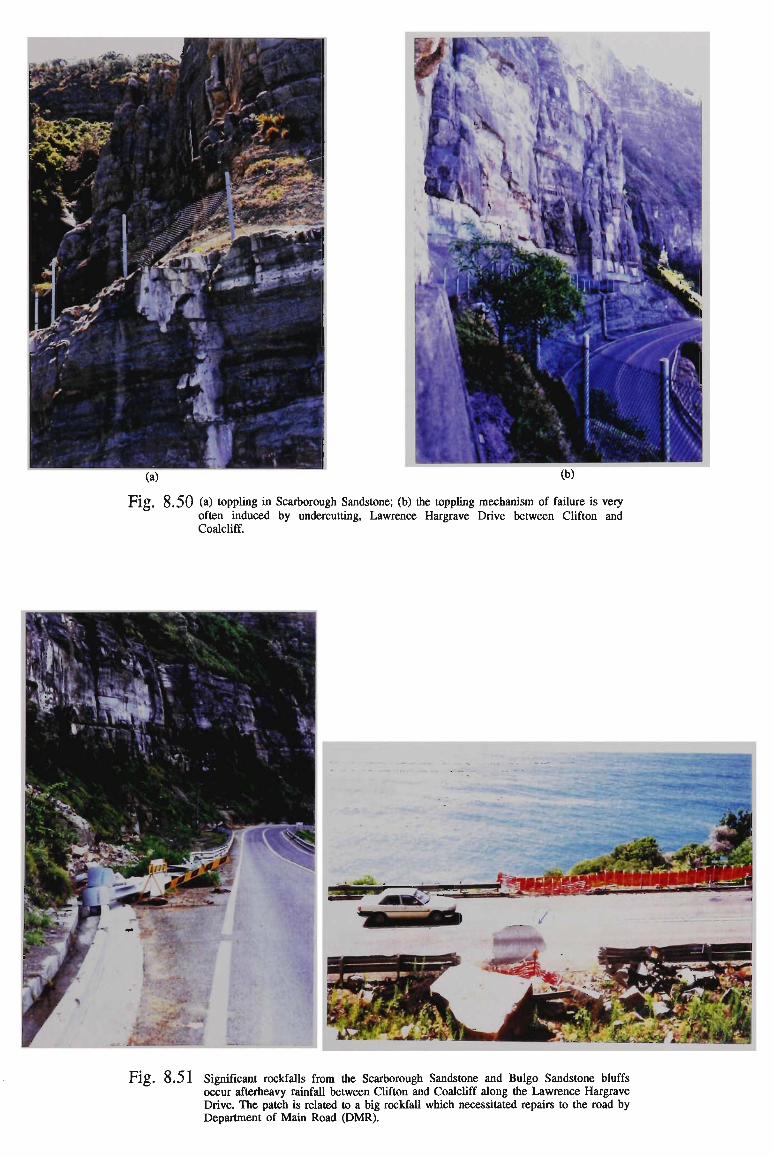
Fig. 8 . 5 0 (a) toppling in Scarborough Sandstone; (b) the toppling mechanism of failure is very often induced by undercutting, Lawrence Hargrave Drive between Clifton and Coalcliff.
Fig. 8.51 Significant rockfalls from the Scarborough Sandstone and Bulgo Sandstone bluffs occur afterheavy rainfall between Clifton and Coalcliff along the Lawrence Hargrave Drive. The patch is related to a big rockfall which necessitated repairs to the road by Department of Main Road ( D M R ) .
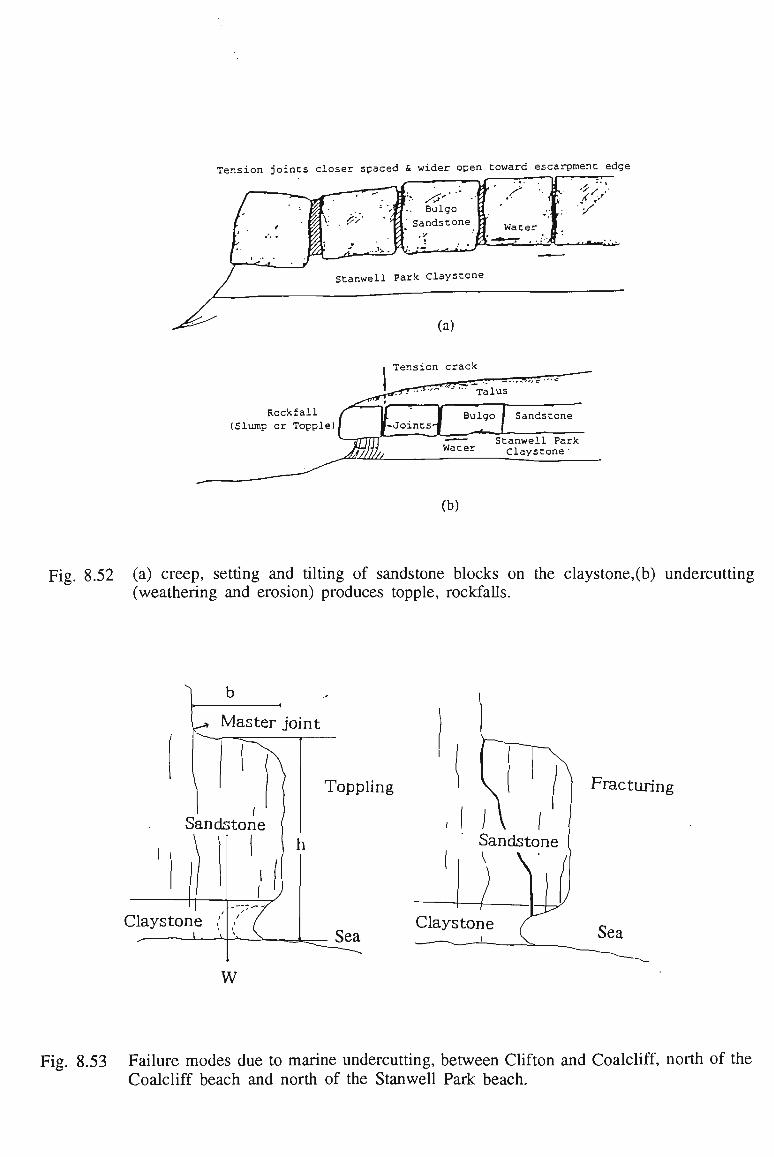
Tension joints closer spaced £ wider open toward escarpment: edge
Bulgo Sandstone
/ •
Water
Stanwell Park Claystone
(a)
Tension crack »•' J...J»-,i"
' Talus
Rockfall (Slump or Topple)
\ ! If Bulgo I •-Joints'! |
Sandstone
Water Stanwell Park Claystone"
(b)
Fig. 8.52 (a) creep, setting and tilting of sandstone blocks on the claystone,(b) undercutting (weathering and erosion) produces topple, rockfalls.
Toppling Fracturing
W
Fig. 8.53 Failure modes due to marine undercutting, between Clifton and Coalcliff, north of the Coalcliff beach and north of the Stanwell Park beach.
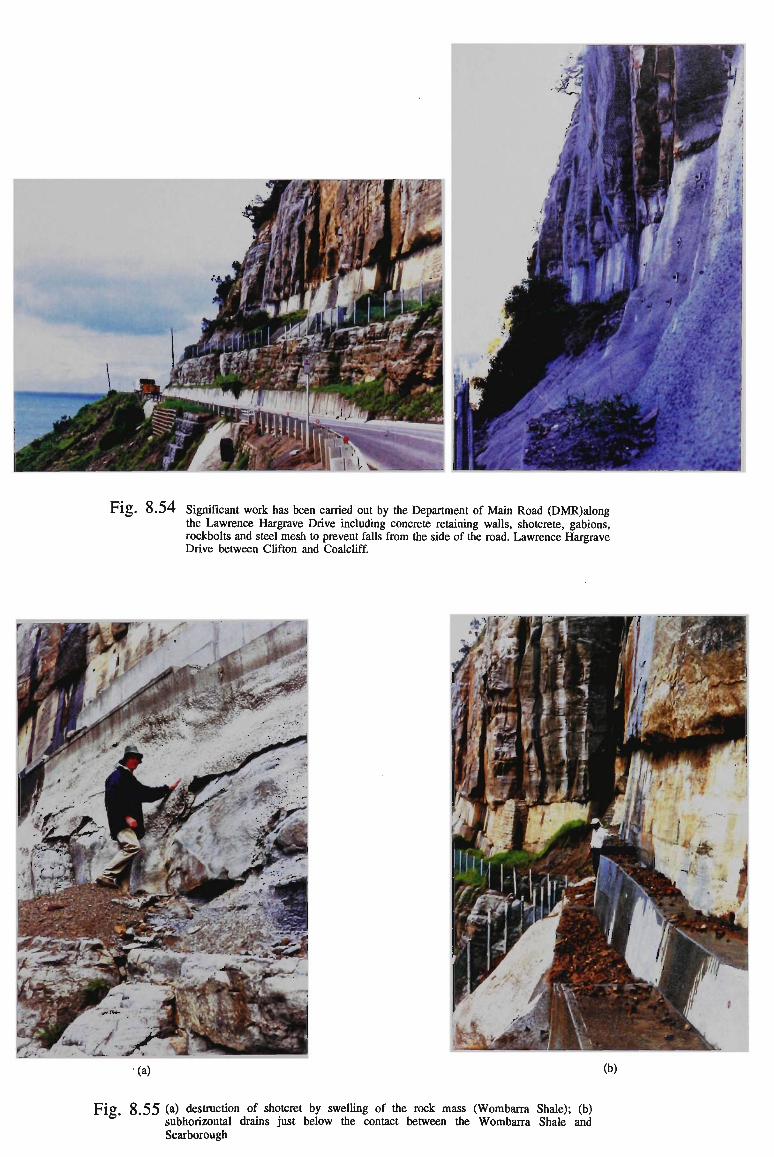
F i g . 8 . 5 4 Significant work has been carried out by the Department of Main Road (DMR)along the Lawrence Hargrave Drive including concrete retaining walls, shotcrete, gabions, rockbolts and steel mesh to prevent falls from the side of the road. Lawrence Hargrave Drive between Clifton and Coalcliff.
(b)
F i g . 8 . 5 5 (a) destruction of shotcret by swelling of the rock mass (Wombarra Shale); (b) subhorizontal drains just below the contact between the Wombarra Shale and Scarborough

TABLES TO CHAPTERS 1-3
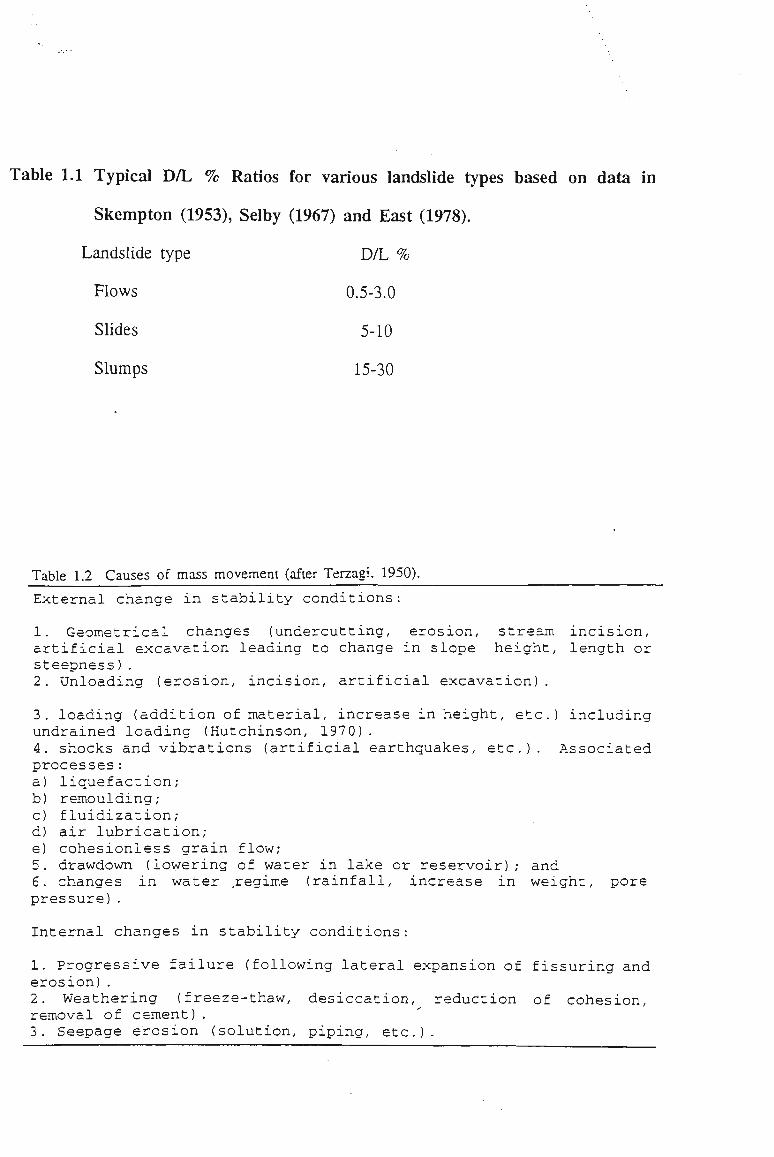
Table 1.1 Typical D/L % Ratios for various landslide types based on data in
Skempton (1953), Selby (1967) and East (1978).
Landslide type D/L %
Flows 0.5-3.0
Slides 5-10
Slumps 15-30
Table 1.2 Causes of mass movement (after Terzagi, 1950).
External change in stability conditions:
1. Geometrical changes (undercutting, erosion, stream incision, artificial excavation leading to change in slope height, length or steepness). 2. Unloading (erosion, incision, artificial excavation).
3. loading (addition of material, increase in height, etc.) including undrained loading (Hutchinson, 1970). 4. shocks and vibrations (artificial earthquakes, etc.). Associated processes: a) liquefaction; b) remoulding; c) fluidization; d) air lubrication; e) cohesionless grain flow; 5. drawdown (lowering of water in lake or reservoir); and 6. changes in water .regime (rainfall, increase in weight, pore pressure). Internal changes in stability conditions:
1. Progressive failure (following lateral expansion of fissuring and erosion). 2. Weathering (freeze-thaw, desiccation, reduction of cohesion, removal of cement). 3. Seepage erosion (solution, piping, etc.).
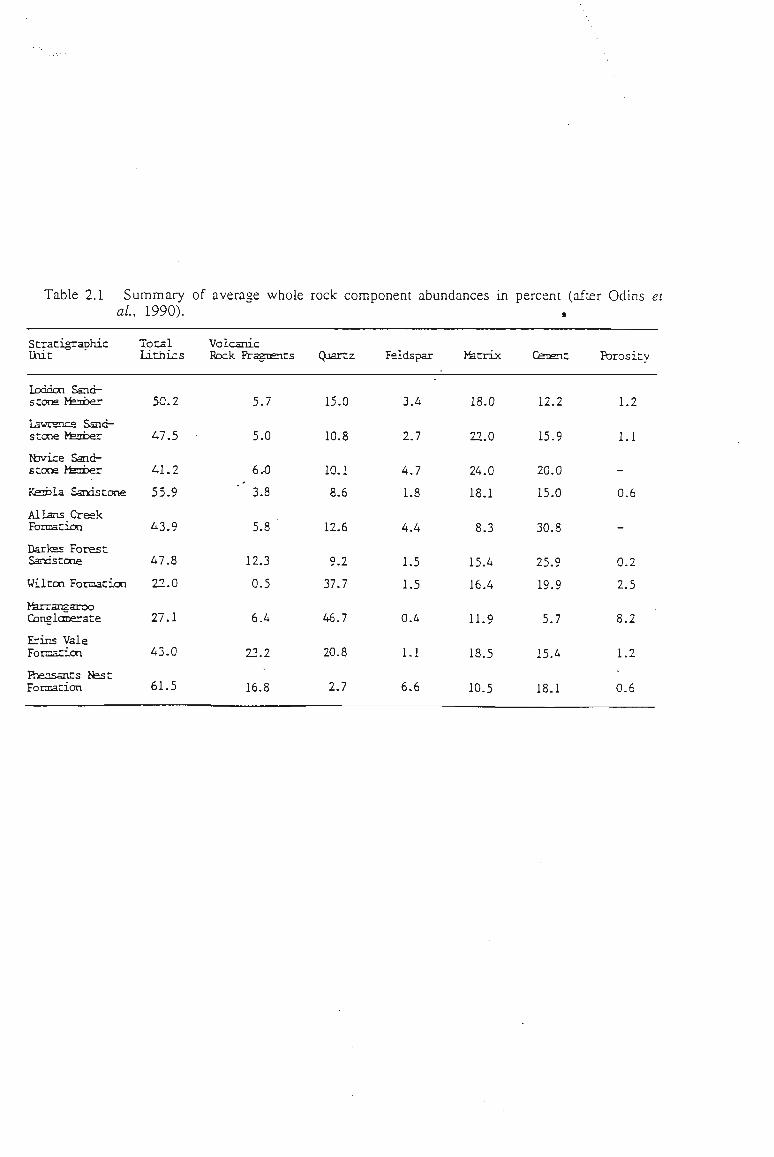
Table 2.1 Summary of averase whole rock component abundances in percent (after Odins et
al, 1990).
Stratigraphic Total Volcanic Unix Lichics Pock Fragments Quartz Feldspar Matrix Cerent: Porosity
Loddon Sandstone Msaber
Lawrence Sandstone Msafaer
Nrvice Sandstone Member
Kenhla Sandstone
AllansCreek Formation
Darkes Forest Sandstone
Wilton Formation
Marrangaroo Conglomerate
Erins Vale Formation
Pheasants Ifest Formation
50.2
47.5
41.2
55.9
43.9
47.8
22.0
27.1
43.0
61.5
5.7
5.0
6v0
3.8
5.8
12.3
0.5
6.4
23.2
16.8
15.0
10.8
10.1
8.6
12.6
9.2
37.7
46.7
20.8
2.7
3.A
2.7
4.7
1.8
4.4
1.5
1.5
0.4
1.1
6.6
18.0
22.0
24.0
18.1
8.3
15.4
16.4
11.9
18.5
10.5
12.2
15.9
20.0
15.0
30.8
25.9
19.9
5.7
15.4
18.1
1.2
1.1
-
0.6
-
0.2
2.5
8.2
1.2
0.6
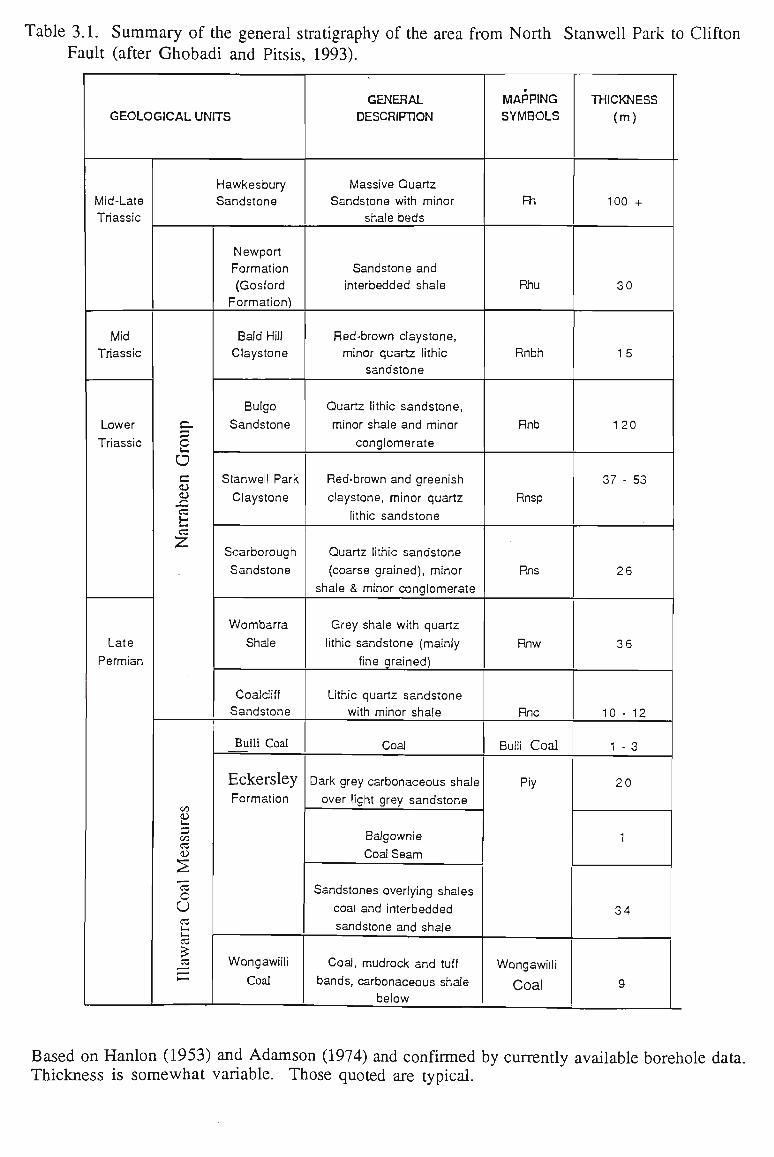
Table 3.1. Summary of the general stratigraphy of the area from North Stanwell Park to Clifton Fault (after Ghobadi and Pitsis, 1993).
GEOLOGICAL UNITS
Mid-Late Triassic
Mid Triassic
Lower
Triassic
Late
Permian
Hawkesbury Sandstone
C
u c 0) CD -C C3 fc
C/3
<D •— a; cc <D
C3
C
u •— u.
£ C3
Newport Formation (Gosford
Formation)
Bald Hill Claystone
Bulgo
Sandstone
Stanwell Park
Claystone
Scarborough
Sandstone
Wombarra
Shale
Coalcliff Sandstone
Bulli Coal
Eckersley Formation
Wongawilli
Coal
GENERAL DESCRIPTION
Massive Quartz Sandstone with minor
shale beds
Sandstone and interbedded shale
Red-brown claystone, minor quartz lithic
sandstone
Quartz lithic sandstone,
minor shale and minor
conglomerate
Red-brown and greenish
claystone, minor quartz
lithic sandstone
Quartz lithic sandstone
(coarse grained), minor
shale & minor conglomerate
Grey shale with quartz
lithic sandstone (mainly
fine grained)
Lithic quartz sandstone with minor shale
Coal
Dark grey carbonaceous shale
over light grey sandstone
Balgownie
Coal Seam
Sandstones overlying shales
coal and interbedded
sandstone and shale
Coal, mudrock and tuff
bands, carbonaceous shale below
MAPPING S Y M B O L S
Rh
Rhu
Rnbh
Rnb
Rnsp
Rns
Rnw
Rnc
Bulli Coal
Piy
Wongawilli
Coal
THICKNESS (m)
100 +
30
15
120
37 - 53
26
36
10 - 12
1 - 3
20
1
34
9
Based on Hanlon (1953) and Adamson (1974) and confirmed by currently available borehole data. Thickness is somewhat variable. Those quoted are typical.

TABLES TO CHAPTER 4
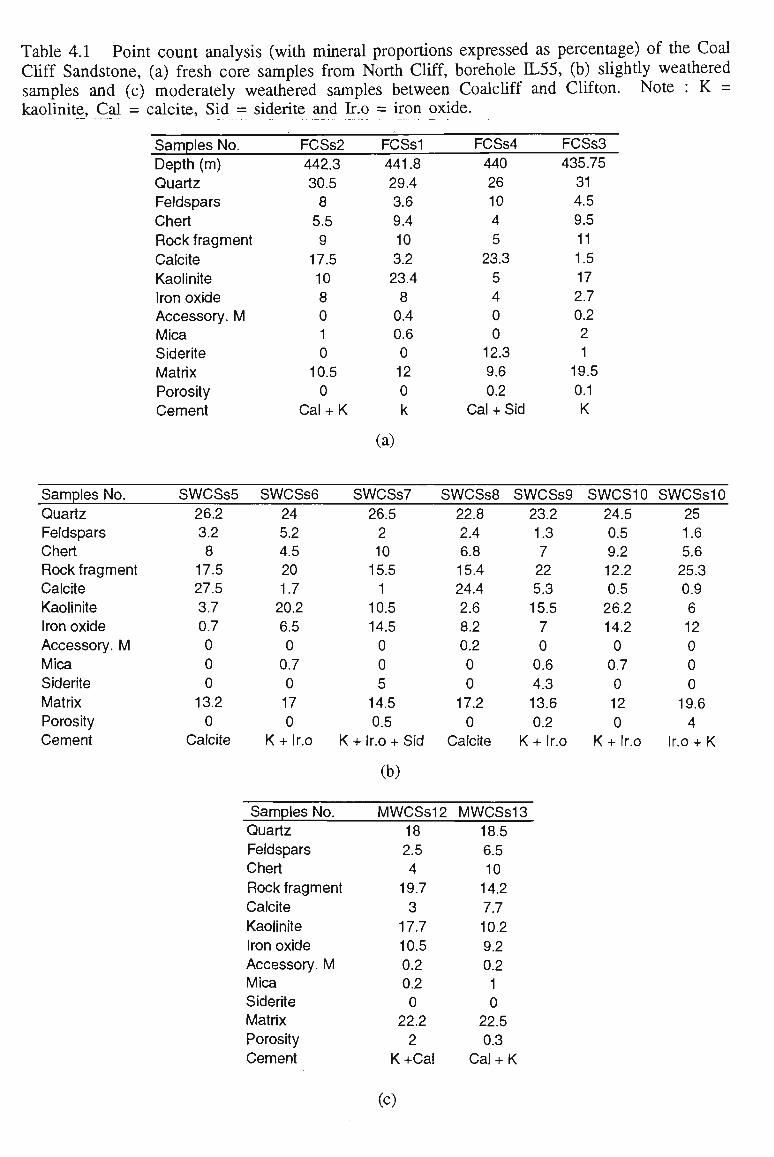
Table 4.1 Point count analysis (with mineral proportions expressed as percentage) of the Coal
Cliff Sandstone, (a) fresh core samples from North Cliff, borehole IL55, (b) slightly weathered samples and (c) moderately weathered samples between Coalcliff and Clifton. Note : K =
kaolinite, Cal = calcite, Sid = siderite and Ir.o = iron oxide.
Samples No. Depth (m) Quartz Feldspars
Chert Rock fragment
Calcite Kaolinite Iron oxide Accessory. M Mica Siderite Matrix Porosity Cement
FCSs2 442.3 30.5 8 5.5 9
17.5
10 8 0 1 0
10.5 0
Cal + K
FCSsI 441.8 29.4 3.6 9.4 10 3.2 23.4 8 0.4 0.6 0 12 0 k
FCSs4 440 26 10 4 5
23.3
5 4 0 0
12.3 9.6 0.2
Cal + Sid
FCSs3 435.75
31 4.5 9.5 11 1.5 17 2.7 0.2 2 1
19.5 0.1 K
(a)
Samples No. Quartz Feldspars Chert Rock fragment Calcite Kaolinite Iron oxide Accessory. M Mica Siderite Matrix Porosity Cement
SWCSs5 26.2 3.2 8
17.5 27.5 3.7 0.7 0 0 0
13.2 0
Calcite
SWCSs6 24 5.2 4.5 20 1.7 20.2 6.5 0 0.7 0 17 0
K + Ir.o
SWCSs7 26.5 2 10 15.5 1
10.5 14.5 0 0 5
14.5 0.5
K + Ir.o + Sid
SWCSs8 22.8 2.4 6.8 15.4 24.4 2.6 8.2 0.2 0 0
17.2 0
Calcite
SWCSs9
23.2
1.3 7 22 5.3 15.5 7 0 0.6 4.3 13.6
0.2 K + Ir.o
SWCS10 24.5 0.5 9.2 12.2 0.5 26.2 14.2 0 0.7 0 12 0
K + Ir.o
SWCSsI 25 1.6 5.6 25.3 0.9 6 12 0 0 0
19.6 4
Ir.o + K
(b)
Samples No. Quartz Feldspars Chert Rock fragment Calcite Kaolinite Iron oxide Accessory. M Mica Siderite Matrix Porosity Cement
MWCSS12 18 2.5 4
19.7 3
17.7 10.5 0.2 0.2 0
22.2 2
K +Cal
MWCSsI 18.5 6.5 10 14.2
7.7 10.2 9.2 0.2 1 0
22.5 0.3
Cal + K
(c)
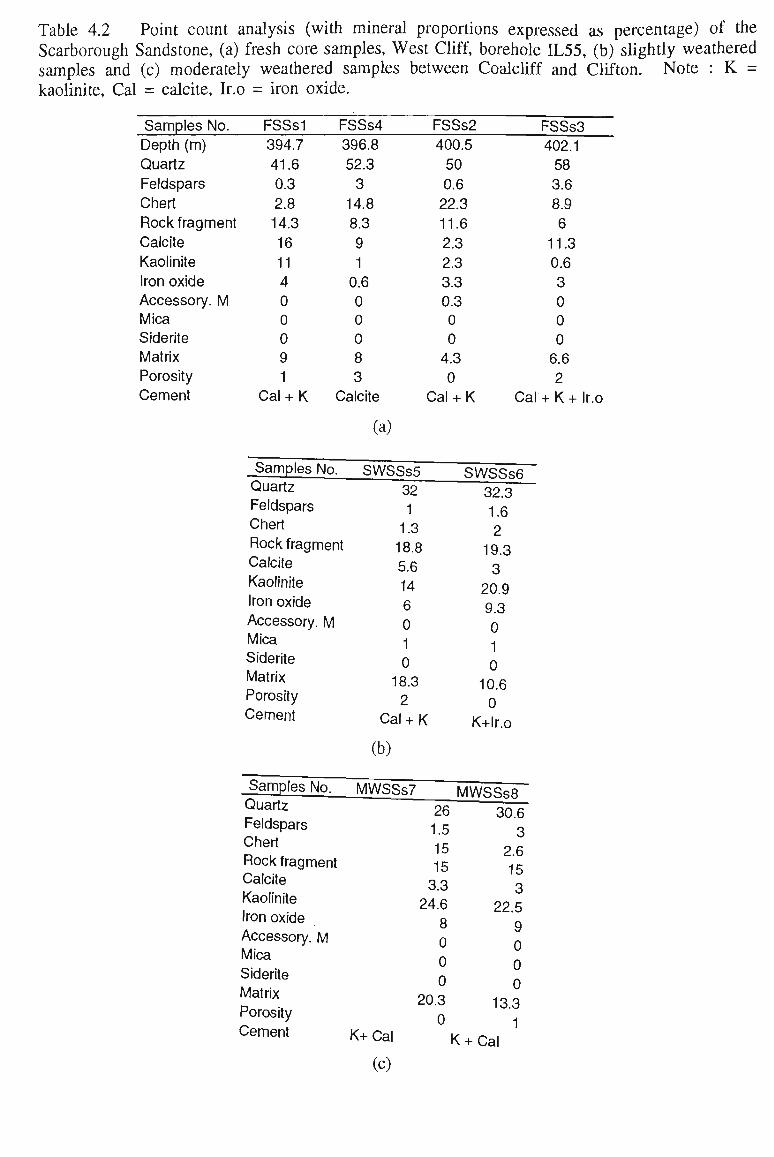
Table 4.2 Point count analysis (with mineral proportions expressed as percentage) of the Scarborough Sandstone, (a) fresh core samples, West Cliff, borehole IL55, (b) slightly weathered samples and (c) moderately weathered samples between Coalcliff and Clifton. Note : K = kaolinite, Cal = calcite, Ir.o = iron oxide.
Samples No.
Depth (m) Quartz
Feldspars Chert
FSSsI
394.7
41.6
0.3 2.8
Rock fragment 14.3 Calcite
Kaolinite
Iron oxide Accessory. M Mica Siderite Matrix Porosity Cement
16 11 4 0 0 0 9 1
Cal + K (
Samples No. Quartz
Feldspars Chert
FSSs4
396.8
52.3
3 14.8 8.3 9 1 0.6 0 0 0 8 3
Calcite
(a)
FSSs2 400.5
50 0.6 22.3
11.6
2.3 2.3 3.3 0.3 0 0 4.3 0
Cal + K Cal
SWSSs5 SWSRfifi
Rock fragment Calcite
Kaolinite Iron oxide
Accessory. M Mica
Siderite Matrix Porosity Cement
Samples No. Quartz Feldspars Chert
Rock fragment Calcite Kaolinite
Iron oxide Accessory. M Mica
Siderite Matrix
Porosity
Cement
-
32 1 1.3 18.8 5.6 14 6 0 1 0 18.3 2
32.3 1.6 2
19.3 3
20.9
9.3 0 i 1
o 10.6 n
Cal + K K+lr.o
(b)
MWSSs? M W R s X
K+Cal
(c)
26 1.5 15 15 3.3
24.6 8 0 o o
20.3 0 K +
30.6 3
2.6 15 1 <~?
3
22.5
9 n
0 0
13.3
1 Cal
FSSs3 402.1 58 3.6 8.9 6
11.3 0.6 3 0 0 0 6.6 2
+ K + Ir.o
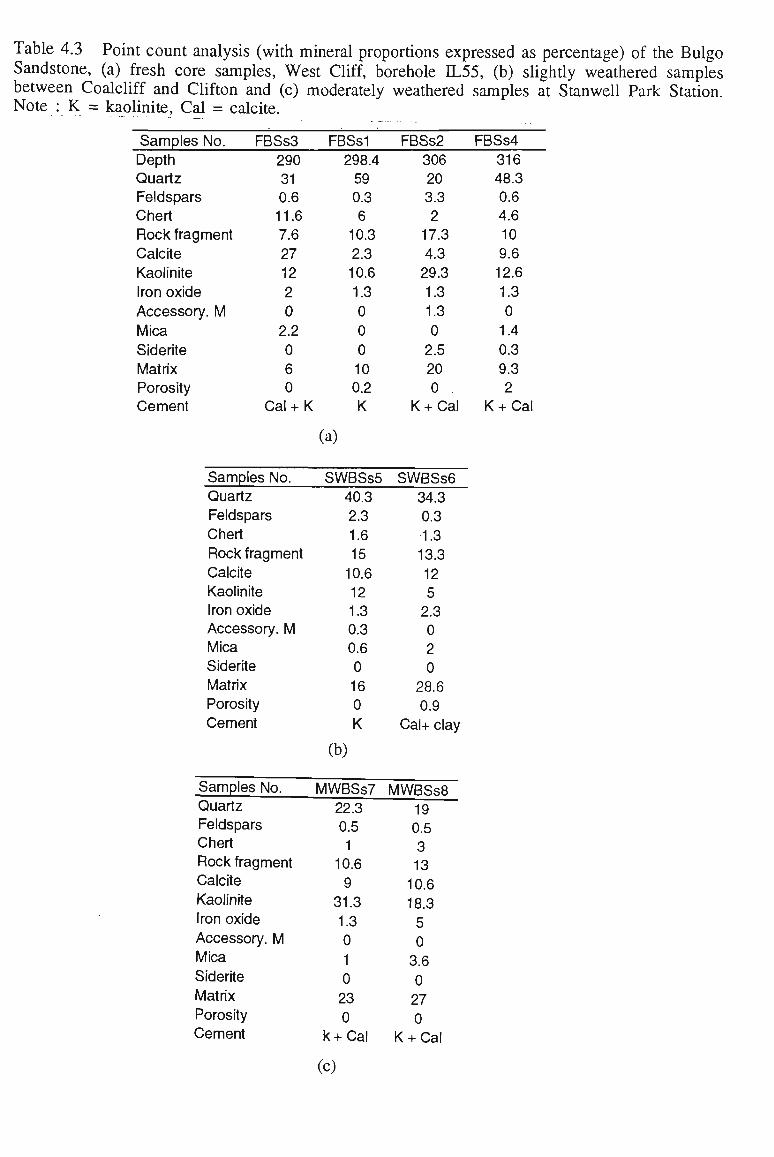
Table 4.3 Point count analysis (with mineral proportions expressed as percentage) of the Bulgo
Sandstone, (a) fresh core samples, West Cliff, borehole IL55, (b) slightly weathered samples between Coalcliff and Clifton and (c) moderately weathered samples at Stanwell Park Station. Note : K = kaolinite, Cal = calcite.
Samples No. Depth Quartz Feldspars Chert Rock fragment Calcite Kaolinite Iron oxide
Accessory. M
Mica Siderite Matrix Porosity Cement
FBSs3 290 31 0.6 11.6 7.6 27 12 2 0 2.2 0 6 0
Cal + K
FBSsI 298.4 59 0.3 6
10.3 2.3 10.6
1.3 0 0 0 10 0.2 K
FBSS2 306 20 3.3 2
17.3
4.3 29.3
1.3 1.3 0 2.5 20 0
K + Cal
FBSs4 316 48.3 0.6 4.6 10 9.6 12.6
1.3 0 1.4 0.3 9.3 2
K+Cal
(a)
Samples No. Quartz Feldspars Chert
Rock fragment Calcite Kaolinite Iron oxide Accessory. M Mica Siderite Matrix Porosity
Cement
SWBSs5 40.3 2.3 1.6 15 10.6 12 1.3 0.3 0.6 0 16 0 K
SWBSs6 34.3 0.3 •1.3 13.3
12 5 2.3 0 2 0
28.6 0.9
Cal+ clay
(b)
Samples No. Quartz Feldspars Chert Rock fragment Calcite Kaolinite Iron oxide Accessory. M Mica
Siderite Matrix Porosity Cement
MWBSs7 22.3 0.5 1
10.6 9
31.3 1.3 0 1
0 23 0
k + Cal
MWBSs8 19 0.5 3 13
10.6 18.3 5 0 3.6
0 27 0
K + Cal
(c)
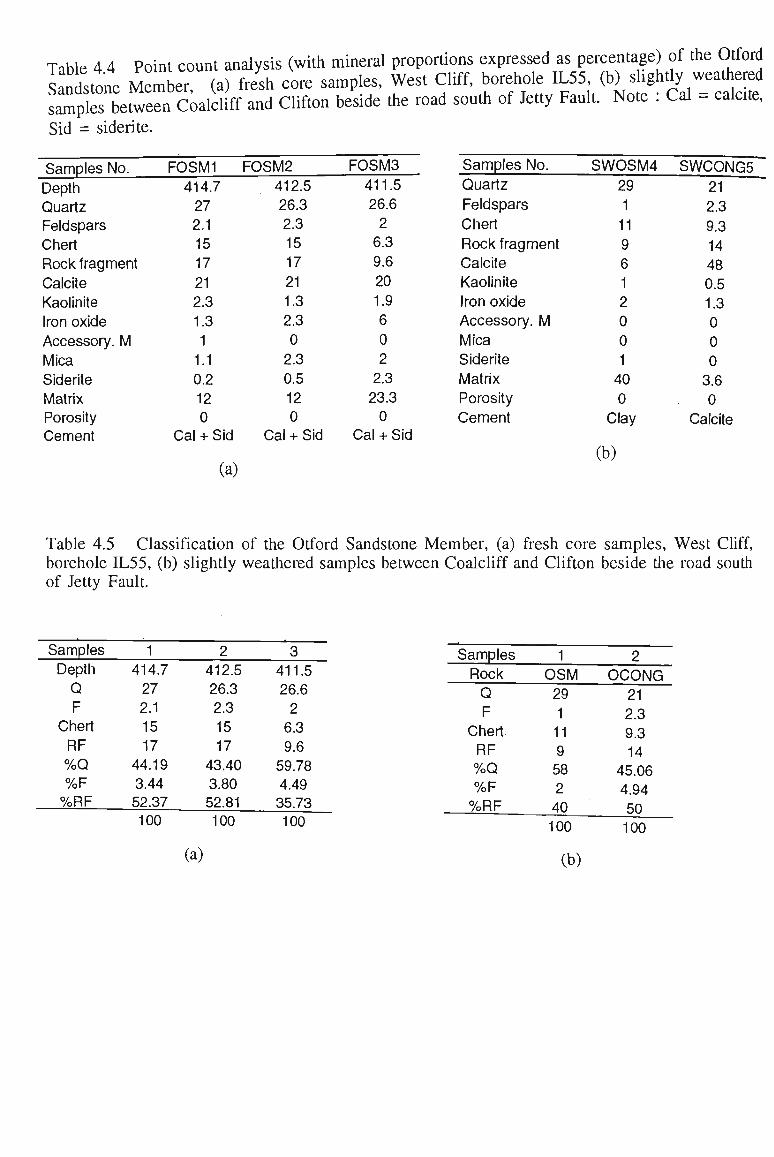
Table 4 4 Point count analysis (with mineral proportions expressed as percentage) of the Otford
L L o n e Member, (a) fresh core samples, West Cliff, borehole ^ \ % ^ % ^ ^ samples between Coalcliff and Clifton beside the road south of Jetty Fault. Note . Cal - calcite,
Sid = siderite.
Samples No.
Depth Quartz Feldspars
Chert Rock fragment
Calcite Kaolinite Iron oxide
Accessory. M
Mica Siderite
Matrix Porosity Cement
FOSM1 414.7 27 2.1 15 17 21 2.3 1.3 1 1.1 0.2 12 0
Cal + Sid
FOSM2
412.5 26.3
2.3 15 17 21 1.3 2.3 0 2.3 0.5 12 0
Cal + Sid
FOSM3
411.5 26.6
2 6.3 9.6 20 1.9 6 0 2 2.3 23.3
0 Cal + Sid
Samples No.
Quartz
Feldspars
Chert
Rock fragment Calcite Kaolinite Iron oxide
Accessory. M Mica
Siderite
Matrix Porosity
Cement
SWOSM4 29 1 11 9 6 1 2 0 0 1 40 0
Clay
SWCONG5 21 2.3 9.3 14 48 0.5 1.3 0 0 0 3.6 0
Calcite
(a) (b)
Table 4.5 Classification of the Otford Sandstone Member, (a) fresh core samples, West Cliff, borehole IL55, (b) slightly weathered samples between Coalcliff and Clifton beside the road south of Jetty Fault.
Samples Depth
Q F
Chert
RF %Q %F %RF
1 414.7 27 2.1 15 17
44.19 3.44 52.37
2 412.5 26.3 2.3 15 17
43.40 3.80 52.81
3 411.5 26.6 2 6.3 9.6
59.78 4.49 35.73
100 100 100
Samples
Rock Q F
Chert RF %Q %F %RF
1 OSM 29 1 11 9 58 2 40
2 OCONG 21 2.3 9.3 14
45.06 4.94 50
100 100
(a) (b)

Table 4.6 Classification of the Coal Cliff Sandstone, (a) fresh core samples, North Cliff, borehole IL55, (b) slightly weathered samples and (c) moderately weathered samples between Coalcliff and Clifton.
Samples
Depth
Q F
Chert
RF %Q %F %RF
1 442 29.4
3.6 9.4 10 56.1
6.87
37
2 442 30.5
8 5.5 9
57.5
15.1
27.4
3 436 31 4.5 9.5 11 55.4
8.04
36.6
4 440 26 10 4 5 58 22 20
100 100 100 100
(a)
Samples
Q F
Chert
RF %Q %F %RF
1 26.2
3.2 8
17.5
47.7
5.83
46.4
2 24 5.2 4.5 20 44.7
9.68
45.6
3 26.5
2 10 15.5
49.1
3.7 47.2
4 23 2.4 6.8 15 48 5.1 47
5 23.6
1.3 7 22 43.8
2.41
53.8
6 24.5
0.5 9.2 12.2
52.8
1.08
46.1
7 25 1.6 5.6 25.3
43.5
2.78
53.7
100 100 100 100 100 100 100
(b)
Samples
Q F Chert
RF %Q %F %RF
1 18 2.5 4
19.7
40.7
5.66
53.6
100
2 18.5
6.5 10
14.2
37.6
13.2
49.2
100
(c)

Table 4.7 Classification of the Scarborough Sandstone, (a) fresh core samples West Cliff, borehole IL55, (b) slightly weathered samples and (c) moderately weathered samples between
Coalcliff and Clifton.
Samples
Depth
Q F
Chert
RF %Q %F %RF
1 394.7
41.6
0.3 2.8 14.3
70.51
0.51
28.98
2 400.5
50 0.6 22.3
11.6
59.17
0.71
40.12
3 402.1
58 3.6 8.9 6
75.82
4.71
19.48
4 396.8
52.3
3 14.8
8.3 66.71
3.83
29.46
100 100 100 100
(a)
Samples
Q F
Chert
RF %Q %F %RF
1 32 1 1.3 18.8
60.26
1.88
37.85
2 32.3
1.6 2
19.3
58.51
2.90
38.59
100
(b)
100
Samples
Q F
Chert
RF %Q %F %RF
1 26 1.3 1.5 15
59.36
2.97
37.67
2 30.6
3 2.6 15
59.77
5.86
34.38
100
(c)
100
Table 4.8 Classification of the Bulgo Sandstone, (a) fresh core samples, North Cliff, borehole IL55, (b) slightly weathered samples between Coalcliff and Clifton and (c) moderately weathered
samples at Stanwell Park Station.
Samples
Samples 1 Depth
Q F
Chert
RF %Q %F %RF
298.4
59 0.3 6
10.3
78.04
0.40
21.56
100
305.5
20 3.3 2
17.3
46.95
7.75
45.31
100
289.6
31 0.6 11.6
7.6 61.02
1.18
37.80
100
316 48.3
0.6 4.6 10
76.06
0.94
22.99
100
Q F
Chert
RF %Q %F %RF
40.3
2.3 1.6 15
68.07
3.89
28.04
100
34.3
0.3 1.3 13.3
69.72
0.61
29.67
100
(a)
Samples Q F
Chert
RF %Q %F %RF
22.3
0.5 1
10.6
64.83
1.45
33.72
100
19 0.5 3 13
53.52
1.41
45.07
100
(b) (c)
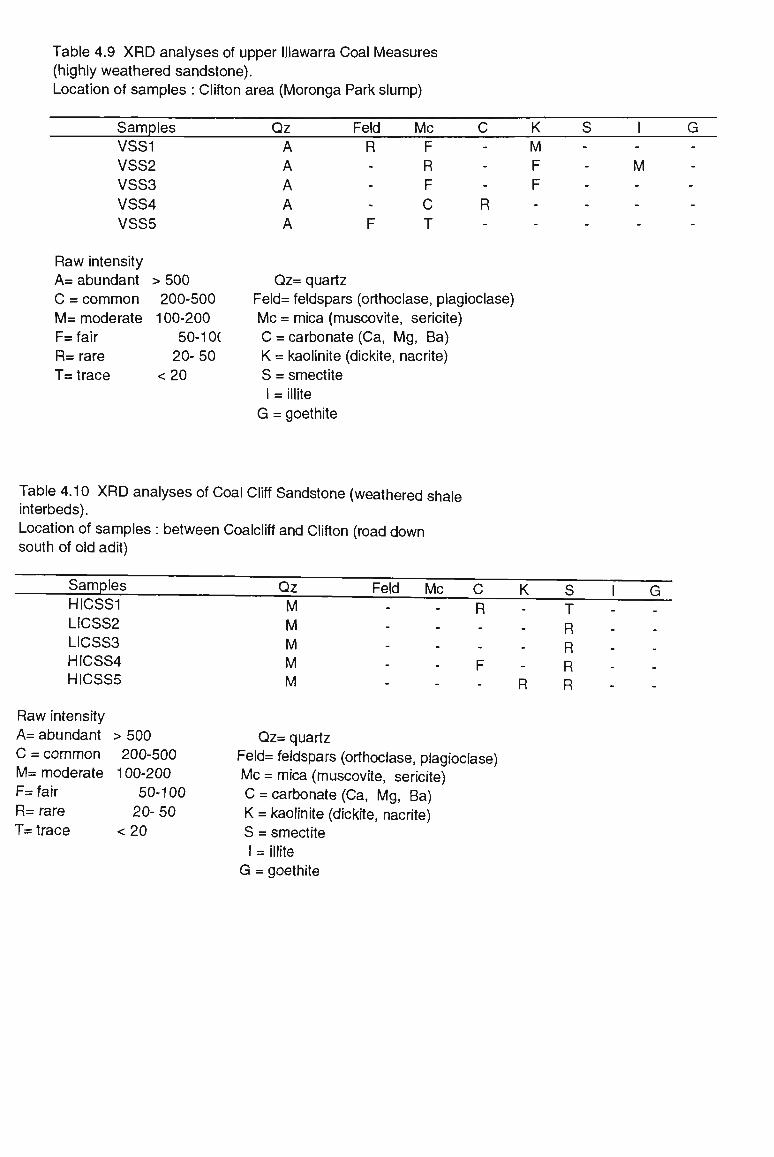
Table 4.9 X R D analyses of upper Illawarra Coal Measures (highly weathered sandstone). Location of samples : Clifton area (Moronga Park slump)
Samples Qz Feld Mc K VSS1 VSS2 VSS3 VSS4 VSS5
Raw intensity A= abundant > C = common
500 200-500
M = moderate 100-200 F= fair R= rare
50-10( 20-50
T= trace < 20
A R A A A A F
Qz= quartz
F R F C R T
Feld= feldspars (orthoclase, plagioclase)
Mc C K S I:
G:
; = mica (muscovite = carbonate (Ca, I
J, sericite) % Ba)
= kaolinite (dickite, nacrite) = smectite = illite = goethite
M F F
M
Table 4.10 X R D analyses of Coal Cliff Sandstone (weathered shale interbeds). Location of samples : between Coalcliff and Clifton (road down south of old adit)
Samples HICSS1 LICSS2 LICSS3 HICSS4 HICSS5
Raw intensity A= abundant C = common M = moderate F= fair R= rare T= trace
>500 200-500 100-200
50-100 20-50
< 2 0
Qz Feld Mc C K G R M
M M M M
Qz= quartz Feld= feldspars (orthoclase, plagioclase) Mc = mica (muscovite, sericite) C = carbonate (Ca, Mg, Ba) K = kaolinite (dickite, nacrite) S = smectite I = illite
R
T R R R R
G = goethite
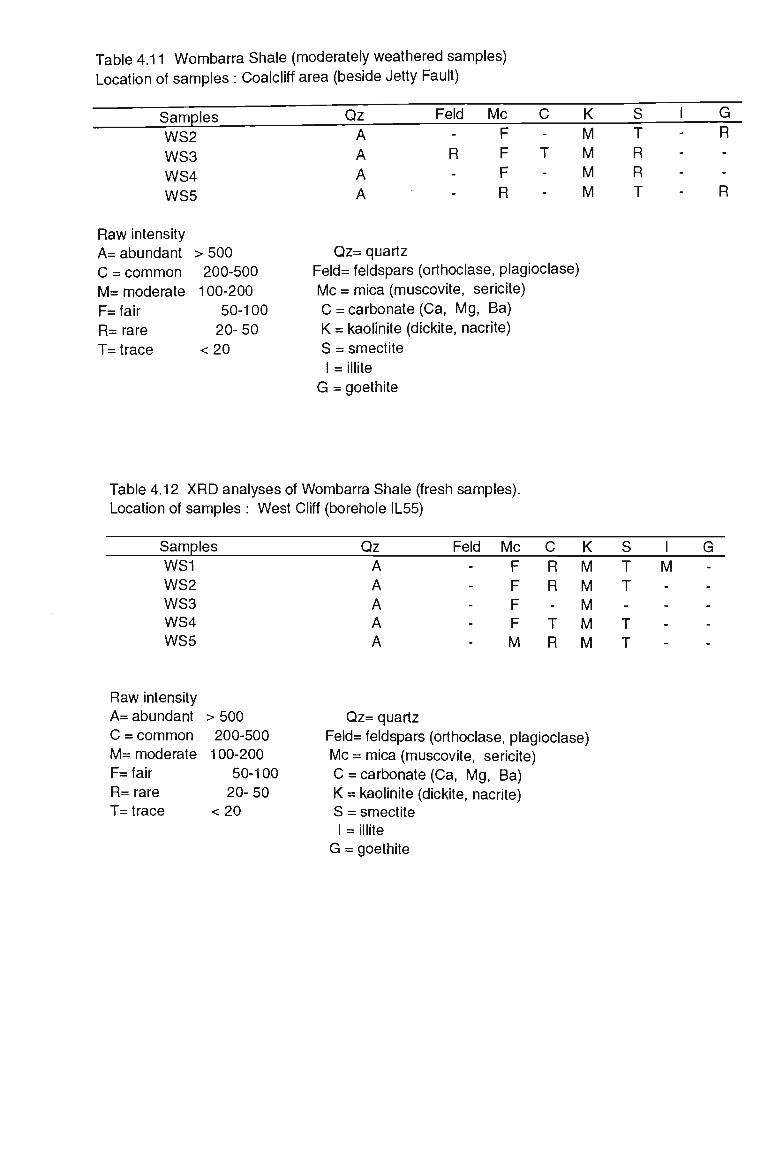
Table 4.11 Wombarra Shale (moderately weathered samples) Location of samples : Coalcliff area (beside Jetty Fault)
Samples WS2 WS3 WS4 WS5
Raw intensity A= abundant > 500 C = common 200-500 M = moderate 100-200 F= fair 50-100 R= rare 20- 50 T= trace < 20
Qz Feld Mc C A F A R F T A F A - R -
Qz= quartz Feld Mc C = K = S = l =
G =
K M M M M
l= feldspars (orthoclase, plagioclase) = mica (muscovite, sericite) = carbonate (Ca, Mg, Ba) = kaolinite (dickite, nacrite) = smectite
: illite = goethite
S T R R T
I G
R -
•
R
Table 4.12 X R D analyses of Wombarra Shale (fresh samples). Location of samples : West Cliff (borehole IL55)
Samples Qz Feld Mc K WS1 WS2 WS3 WS4 WS5
Raw intensity A= abundant C = common M = moderate F= fair R= rare T= trace
>500 200-500 100-200
50-100 20-50
<20
F F F F M
R R -
T R
M M M M M
T T -
T T
A A A A A
Qz= quartz Feld= feldspars (orthoclase, plagioclase) Mc = mica (muscovite, sericite) C = carbonate (Ca, Mg, Ba) K = kaolinite (dickite, nacrite) S = smectite I = illite
M
G = goethite

Table 4.13 XRD analyses of Wombarra Shale (moderately weathered samples) Location of samples : between Coalcliff and Clifton (north of Jetty Fault).
Samples WSHJ1 WSHJ2 WSHJ3 WSHJ4 WSHJ5
Raw intensity A= abundant > 500 C = common 200-500 M= moderate 100-200 F= fair 50-100 R= rare 20- 50 T= trace < 20
Qz M M C F M
Qz= quartz Feld= feldspars
Feld M c C K
R R
.
F T
(orthoclase, plagioclase) Mc = mica (muscovite, sericite) C = carbonate (Ca, Mg, Ba) K = kaolinite (dickite, nacrite) S = smectite I = illite
G = goethite
S I G
R T T
R R R
Table 4.14 XRD analyses of Wombarra Shale (moderately weathered samples) Location of samples : between Wombarra and Coledale
Samples Qz Feld Mc K WSHWC1 WSHWC2 WSHWC3 WSHWC4 WSHWC5
Raw intensity A= abundant C = common M= moderate F= fair R= rare T= trace
>500 200-500 100-200
50-100 20-50
<20
M . . . M . . . M . . . F - - R R - - R
Qz= quartz
-
R R R R
Feld= feldspars (orthoclase, plagioclase) Mc = mica (muscovite, sericite) C = carbonate (Ca, Mg, Ba) K = kaolinite (dickite, nacrite) S = smectite I = illite
F R R R R
G = goethite
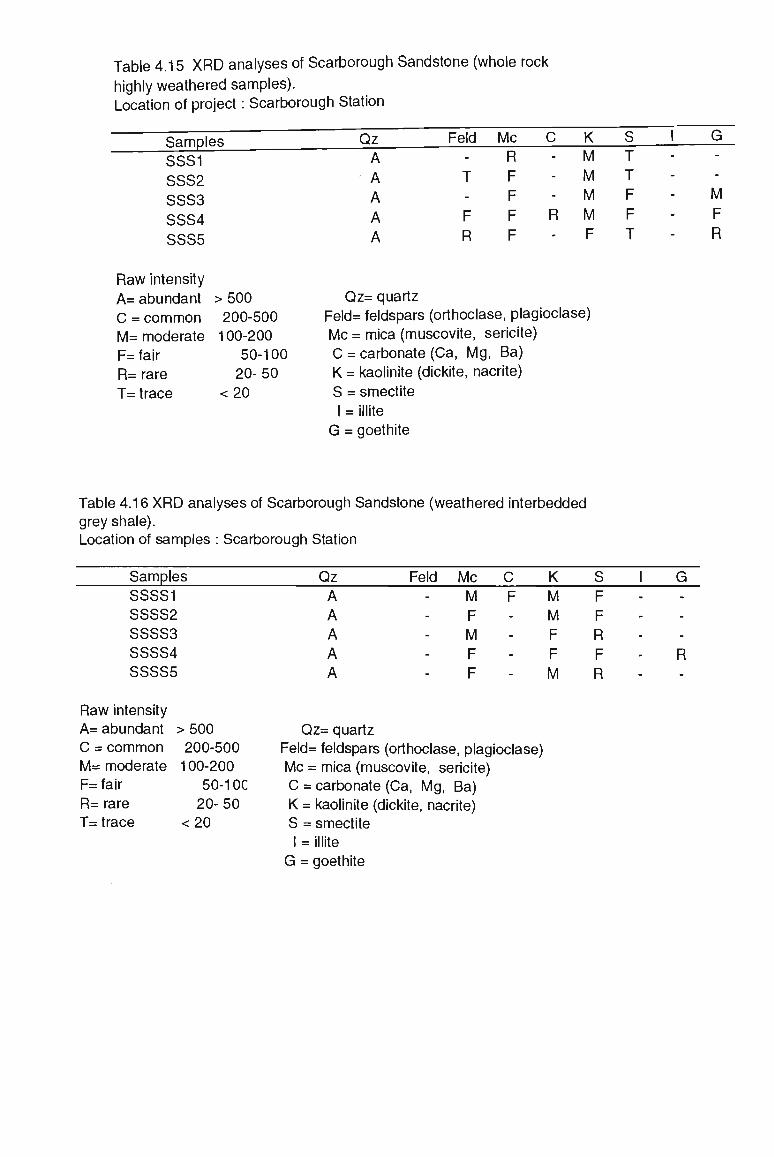
Table 4.15 X R D analyses of Scarborough Sandstone (whole rock
highly weathered samples). Location of project: Scarborough Station
Samples SSS1 SSS2 SSS3 SSS4 SSS5
Raw intensity A= abundant C = common M= moderate F= fair R= rare T= trace
>500 200-500 100-200
50-100 20-50
<20
Qz A A A A A
Qz= quartz
Feld Mc C = K = S =
Feld -
T -
F R
Mc C R F F F R F
K M
M M M F
= feldspars (orthoclase, plagioclase) = mica (muscovite, sericite)
= carbonate (C a, Mg, Ba) = kaolinite (dickite, nacrite)
= smectite
CO \-
T F F T
G -
-
M F R
I = illite G = goethite
Table 4.16 X R D analyses of Scarborough Sandstone (weathered interbedded grey shale). Location of samples : Scarborough Station
Samples Qz Feld M c K SSSS1 SSSS2 SSSS3 SSSS4 SSSS5
Raw intensity A= abundant > C = common M= moderate " F= fair R= rare T= trace
•500 200-500 100-200
50-10C 20-50
<20
A A A A A
Qz= quartz Feld MC: C = K = S = l =
M F M F - M M - F F - F F - M
= feldspars (orthoclase, plagioclase) = mica (muscovite, sericite) = carbonate (Ca, Mg, Ba) kaolinite (dickite, nacrite) = smectite illite
F F R F R
R
G = goethite
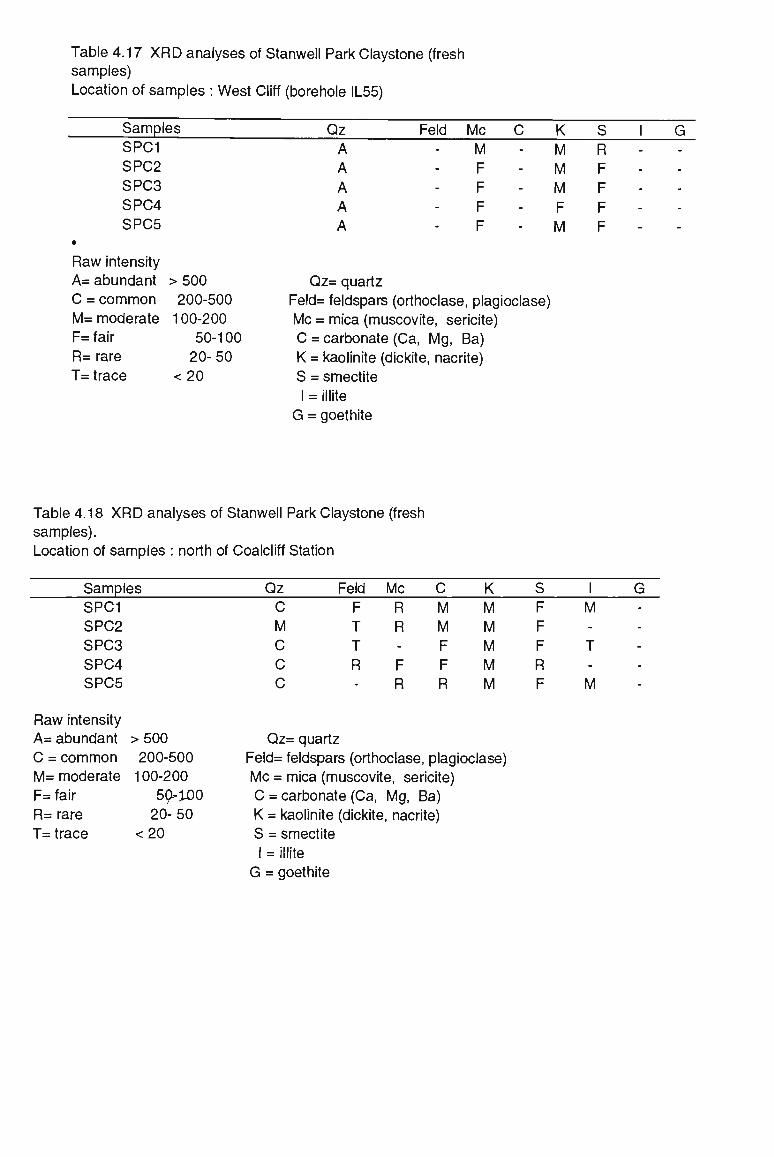
Table 4.17 XRD analyses of Stanwell Park Claystone (fresh samples) Location of samples : West Cliff (borehole IL55)
Samples SPC1 SPC2 SPC3 SPC4 SPC5
Raw intensity A= abundant > 500 C = common 200-500 M= moderate 100-200 F= fair 50-100 R= rare 20- 50 T= trace < 20
Qz A A A A A
Qz= quartz Feld= feldspars
Feld -
-
-
-
-
Mc C K M M F - M F - M F - F F - M
(orthoclase, plagioclase) M c = mica (muscovite, sericite) C = carbonate (Ca, Mg, Ba) K = kaolinite (dickite, nacrite) S = smectite I = illite
G = goethite
S I R F F F F
G .
.
.
.
-
Table 4.18 XRD analyses of Stanwell Park Claystone (fresh samples). Location of samples : north of Coalcliff Station
Samples Qz Feld Mc K SPC1 SPC2 SPC3 SPC4 SPC5
C M C C C
F T T R
•
R R -
F R
M M F F R
M M M M M
F F F R F
M -
T -
M
Raw intensity A= abundant C = common M= moderate F= fair R= rare T= trace
> 500 Qz= quartz 200-500 Feld= feldspars (orthoclase, plagioclase) 100-200 Mc = mica (muscovite, sericite)
50-100 C = carbonate (Ca, Mg, Ba) 20- 50 K = kaolinite (dickite, nacrite)
< 20 S = smectite I = illite
G = goethite
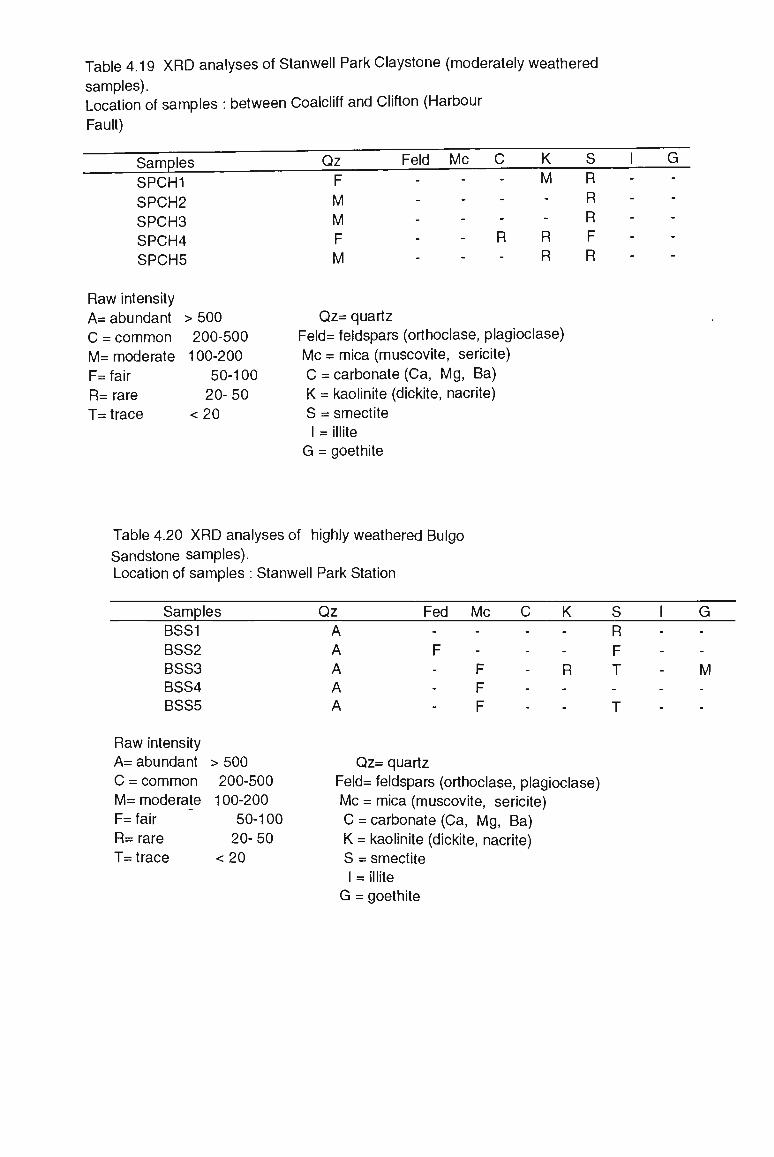
Table 4.19 X R D analyses of Stanwell Park Claystone (moderately weathered
samples). Location of samples : between Coalcliff and Clifton (Harbour Fault)
Samples SPCH1
SPCH2 SPCH3 SPCH4
SPCH5
Raw intensity
A= C: M= F= R= T=
abundant >
= common = moderate "
fair : rare trace
•500 200-500
100-200 50-100
20-50 <20
Qz Feld Mc K F M M F M
R
M -
-
R R
H R R F R
Qz= quartz Feld= feldspars (orthoclase, plagioclase) M c = mica (muscovite, sericite) C = carbonate (Ca, Mg, Ba) K = kaolinite (dickite, nacrite) S = smectite I = illite
G = goethite
Table 4.20 X R D analyses of highly weathered Bulgo Sandstone samples). Location of samples : Stanwell Park Station
Samples Qz Fed Mc K BSS1
BSS2 BSS3 BSS4 BSS5
Raw intensity A= abundant C = common M= moderate
F= fair R= rare T= trace
>500 200-500 100-200
50-100 20-50
<20
A A F A - F A - F A - F
Qz= quartz
-
-
R -
-
Feld= feldspars (orthoclase, plagioclase) Mc = mica (muscovite, sericite) C = carbonate (Ca, Mg, Ba) K = kaolinite (dickite, nacrite) S = smectite I = illite
R F T M
G = goethite

Table 4 21 X R D analvses of weathered grey shale interbedded in Bulgo Sandstone.
Location of samples : Stanwell Park Station
Samples S1BSS S2BSS S3BSS S4BSS S5BSS
Raw intensity A= abundant C = common M= moderate F= fair R= rare T= trace
>500 200-500 100-200
50-100 20-50
<20
Qz Feld Mc K A F A - C -A R - -A - M -A F
F F F M M
Qz= quartz Feld= feldspars (orthoclase, plagioclase) Mc = mica (muscovite, sericite) C = carbonate (Ca, Mg, Ba) K = kaolinite (dickite, nacrite) S = smectite I = illite
G = goethite
F R T F
M
Table 4.22 X R D analyses of fill Location of samples: Coalcliff area (beside Harbour Fault)
Samples Qz Feld M c K H1 H2 H3 H4 H5 H6 H7 H8 H9 H10
Raw intensity A= abundant C = common M= moderate F= fair R= rare T= trace
•
>500 200-500 100-200
50-100 20-50
<20
(
A A A A A A A A A A
3z= quartz
-
-
T -
-
T -
-
-
-
F F R F F R R F R F
M F M
M R M
M M M
T M M M
Feld= feldspars (orthoclase, plagioclase) Mc = mica (muscovite, sericite) C = carbonate (Ca, Mg, Ba) K = kaolinite (dickite, nacrite) S = smectite l = = illite
M
M M T M M
G = goethite
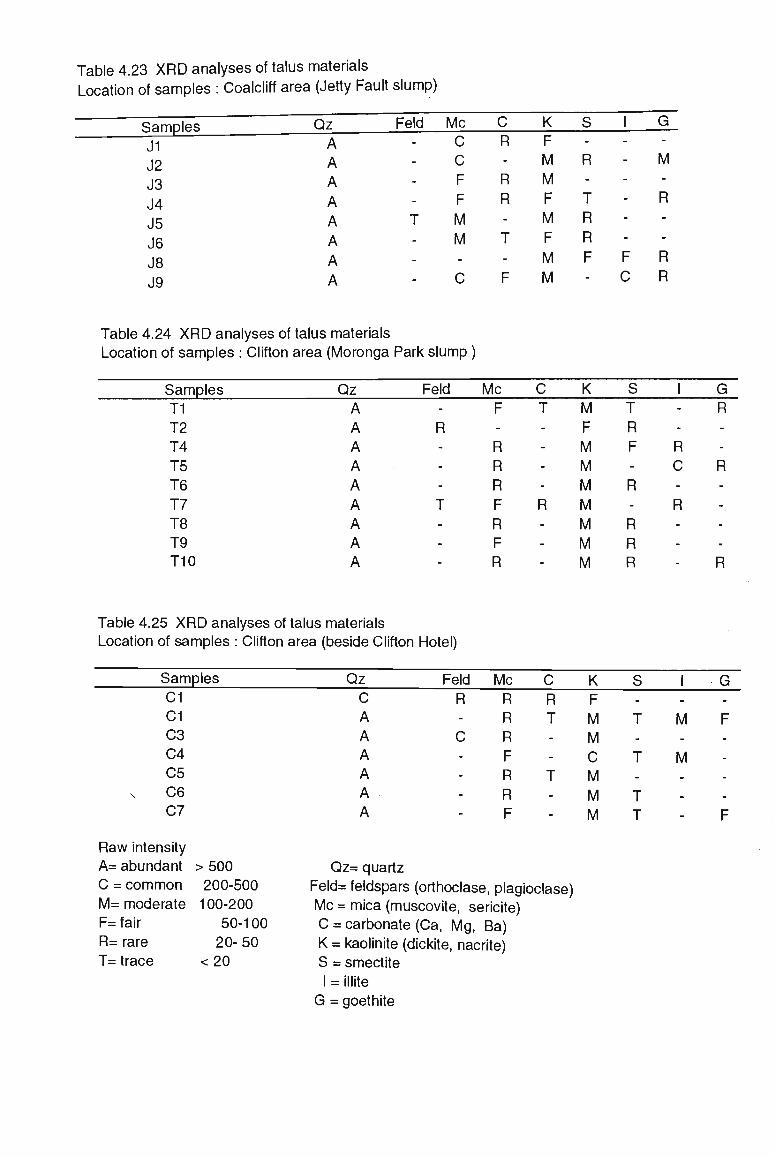
Table 4.23 X R D analyses of talus materials Location of samples : Coalcliff area (Jetty Fault slump)
Samples J1 J2 J3 J4 J5 J6 J8 J9
Qz A A A A A A A A
Feld -
-
-
-
T -
-
-
Mc C C F F M M -
C
C R -
R R -
T -
F
K F M M F M F M M
S -
R -
T R R F -
I -
-
-
-
-
-
F C
G -
M -
R -
-
R R
Table 4.24 X R D analyses of talus materials Location of samples : Clifton area (Moronga Park slump)
Samples Qz Feld Mc K G T1 T2 T4 T5 T6 T7 T8 T9 T10
A A A A A A A A A
R F -
R R R F R F R
T -
-
-
-
R -
-
-
M F M M M M M M M
T R F -
R -
R R R
-
-
R C -
R -
-
.
R
R
R
Table 4.25 X R D analyses of talus materials Location of samples : Clifton area (beside Clifton Hotel)
Samples
C1 C1 C3 C4 C5 C6 C7
Raw intensity A= abundant C = common M = moderate F= fair R= rare T= trace
>500 200-500 100-200
50-100 20-50
<20
Qz Feld Mc K C A A A A A A
Qz= quartz Feld= feldspars (orthoclase, plagioclase) Mc = mica (muscovite, sericite) C = carbonate (Ca, Mg, Ba) K = kaolinite (dickite, nacrite) S = smectite I = illite
G R -
C -
-
-
-
R R R F R R F
R T -
-
T -
-
F M M C M M M
-
T -
T -
T T
-
M -
M -
-
.
-
F -
-
-
-
F
G = goethite

TABLES TO CHAPTERS 5-6

Table 5.1
Formation
CSs CSs WSh SSs SPC BSs Bowman
Main joint orientation foi area.
005° 015°-0250°
015° 015° 025° 025° 005°bc
• lower Narrab ieen urou
Main Joint Orientation
035° 045°
035°
045°
065°
050°
055°ac
115°
105° 105° 105°ac
p in the nc
135° 145°
135°
)rtnern i
165° 165°
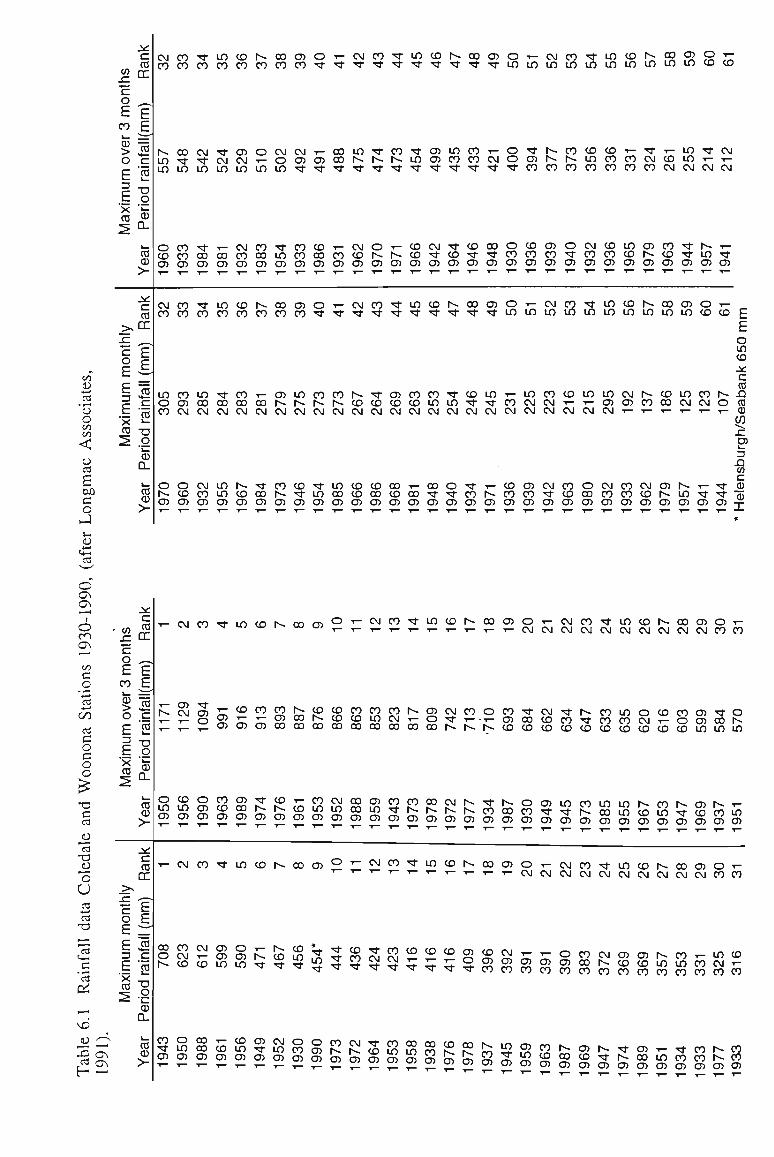
00
£ cd
o o in 00
< o cd
£ oo c o !-D c£ cd
CO
xz c o
E CO
CD
> o E 3
E X CO
s
>> xz c o
E E E 'x CO 2
c CO
cc
E E ^" ra
"c 'co
o "i_ CD D_ k_
CO CD
CO
cc "E E, "co c 'to
TO O CD
i_
CO CD
>
CM CO
r lO m
o CD OT
CM CO
LO O CO
o h-OT
co CO
CO ••cf in
CO CO CJ)
CO CO
CO CT) CM
O CD CT
rf CO
CM "Cf LO
Tf CO CT
"cf CO
in CO OJ
CM CO CT
in CO
-cf CM in
,_ CO CT
in CO
• > *
00 CM
in in CT
CD CO
CT CM in
CM CO CT
CO CO
CO 00 CM
r--CD CT
h-co
o
Ho
CO CO CT
r-CO
,_ 00 CM
-cf 00 CT
00 CO
CM o in
-cr in CT
00 CO
CT h-CM
CO r-CT
CT CO
CM CT "Cf
CO CO CT
CT CO
in r-CM
CD -cf
CT
O "tf
T-
CT "Jf
CO 00 CT
O "d"
CO h-CM
"* in CT
5
00 00 •<a-
T— CO CT
5
CO r CM
in 00 CT
CM "cf
in h-"Cf
CM CO CT
CM -cr
f-CO CM
CO CO CT
CO • " *
•sf h-•sr
o r--CT
CO -5t
-a-CO CM
CO 00 CT
Tt "5f
CO N 'Cf
1_ h-CT
Tf "*
CT CO CM
CO CD CT
in •t
• * •
m "*
CO CO CT
m rf
CO CO CM
I — 00 CT
CD "d"
CT CT •sr
CM "Cf
CT
CD "fr
CO m CM
CO "tf CT
•>-Tf
in CO Tf
-cf CD CT
r--"d-
"Cf
m CM
o "Cf CT
00 "cf
CO CO "Cf
CD "Cf
CT
00 "d"
CD Tf CM
"Cf CO CT
CT • < *
y-
CM "Cf
00 "Cf
CT
CT "d"
in "t CM
T_ i-CT
O in
o o "Cf
O CO OT
O in
,_ CO CM
CO CO CT
i— in
"* CT CO
CD CO CT
in
in CM CM
CT CO CT
CM in
r«-r» co
CT CO CT
CM in
co CM CM
CM "Cf
CT
CO in
CO h~ CO
o • < *
CT
CO in
CO T— CM
CO CD CT
«cf in
CO in CO
CM CO CT
"d" in
in T-
CM
O 00 CT
in m
CD CO CO
CO CO CT
in in
in CT CM
CM CO CT
CD in
r-
co CO
in CD CT
CO m
CM CT ,_
co CO CT
r--in
• *
CM CO
CT r«-CT
r--m
h-CO ,~
CM CO CT
CO in
T-
co CM
CO CO CT
00 in
CO 00 1~
CT h-CT
CT O T-
in co co
in •* CM in i- i-CM CM CM
"3- r-- -r-•* in "cf
CT CT CT
CT O T-
in co co
w n s CM CM O
1^ T- "d" in -t "cf OT CT OT •
i
o 10 CO X. c CO A CO CD
CO x: D3 k-
3 n co c 0) CD
I O Os
as i
o CO
as C
.2 ed
*-> cd C O
c o o c cd U cd
-a o
U cd cd T3
15 Ci-l
C cd
cU
c ca cc
co xz c
o E CO CD "m
o g E '2 E Q
Ic? co CD
>
-5 as .«* as
c CO
cc
if o E E ^ E «
1 I CD
race CO
T - w n t i o i D s c o r r i O-i-CMCO"cfincor^COCTOT-CMCO'cfincOh-COCTO'i-u ' T - T - i - i - r - T - i - T - i - T - C M C M W C N W C M W C \ I C M W n n
CO r ^ C M C T r r ^ ^ ^ ^ ^ ^ ^ ^ C O f ^ O T C M ! ^ ^ S C T T - - i - C T C O h - C O C O i n C M i - O r f . „. „ _ „ , _ T— T— ^ r o o ) c > o o c o f f l o o c o c o c o o o c o s s s ( D i D ( 0 ( D ( o c D c o < o i o c D i n i n i n
O CO 1- CT
" d-CMTfh-COinOCDCOCT"S-0 OOCOCOTfCOCOCM-i-OCTCOr«-
3 S 2 2 f f l S r s f f i W w r o i n T f s s s s m o n ^ ^ N m w c o i o S c Q f < J i n CTCTCTCTCTCTCTCTCTCTCTCTCTCTCTCTCTCTCTCT
C N l C O " t l O C O S O O r o ° ^ W n ^ w c O l s - C O C O O ' r - W P j ' > f l O C D S C O O j O ' -' ^ , - 1 - 1 - 1 - T ~ - r - T - - ^ " - C M C M C M C M C M C M C M C M C M C M C O C 0
C O C O C M C T O t — r - C O t + T t O C M i - C T C T h - C O i n S T t r^cocoinm"d-^-"cf!$4
S S + ^ - n n S S S ^ c s c n c o N C D c o i n u j n c M r ^f"cf^^^f"cf"cfcOC0COCOCOCOCOCOCOC0C0C0C0C0
CTCTCTCTCTCTCTC2CTCTc||c|c|gg^

TABLES TO CHAPTER 7
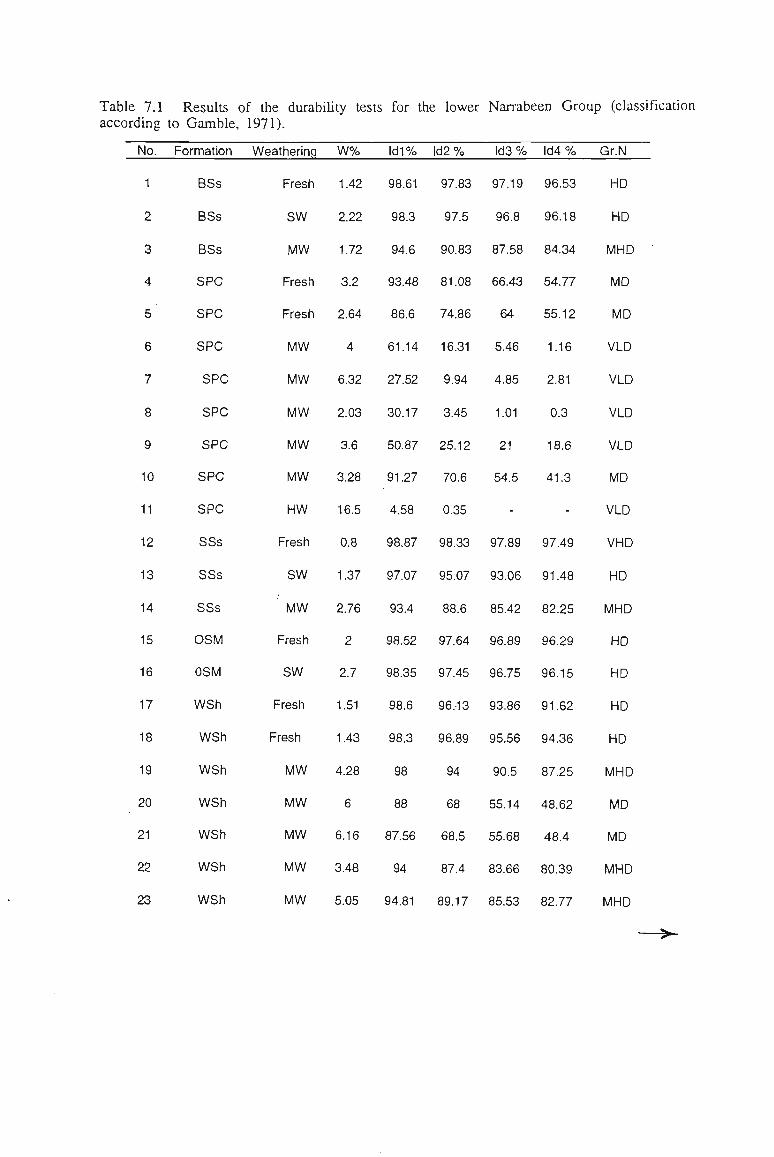
Table 7.1 Results of the durability tests for the lower Narrabeen Group (classification according to Gamble, 1971).
No.
1
2
3
4
5
6
7
8
9
10
11
12
13
14
15
16
17
18
19
20
21
22
23
Formation
BSs
BSs
BSs
SPC
SPC
SPC
SPC
SPC
SPC
SPC
SPC
SSs
SSs
SSs
OSM
OSM
WSh
WSh
WSh
WSh
WSh
WSh
WSh
Weathering
Fresh
SW
MW
Fresh
Fresh
MW
MW
MW
MW
MW
HW
Fresh
SW
MW
Fresh
SW
Fresh
Fresh
MW
MW
MW
MW
MW
W %
1.42
2.22
1.72
3.2
2.64
4
6.32
2.03
3.6
3.28
16.5
0.8
1.37
2.76
2
2.7
1.51
1.43
4.28
6
6.16
3.48
5.05
Id1%
98.61
98.3
94.6
93.48
86.6
61.14
27.52
30.17
50.87
91.27
4.58
98.87
97.07
93.4
98.52
98.35
98.6
98.3
98
88
87.56
94
94.81
Id2 %
97.83
97.5
90.83
81.08
74.86
16.31
9.94
3.45
25.12
70.6
0.35
98.33
95.07
88.6
97.64
97.45
96.-13
96.89
94
68
68.5
87.4
89.17
Id3 %
97.19
96.8
87.58
66.43
64
5.46
4.85
1.01
21
54.5
-
97.89
93.06
85.42
96.89
96.75
93.86
95.56
90.5
55.14
55.68
83.66
85.53
Id4 %
96.53
96.18
84.34
54.77
55.12
1.16
2.81
0.3
18.6
41.3
-
97.49
91.48
82.25
96.29
96.15
91.62
94.36
87.25
48.62
48.4
80.39
82.77
Gr.N
HD
HD
MHD
MD
MD
VLD
VLD
VLD
VLD
MD
VLD
VHD
HD
MHD
HD
HD
HD
HD
MHD
MD
MD
MHD
MHD
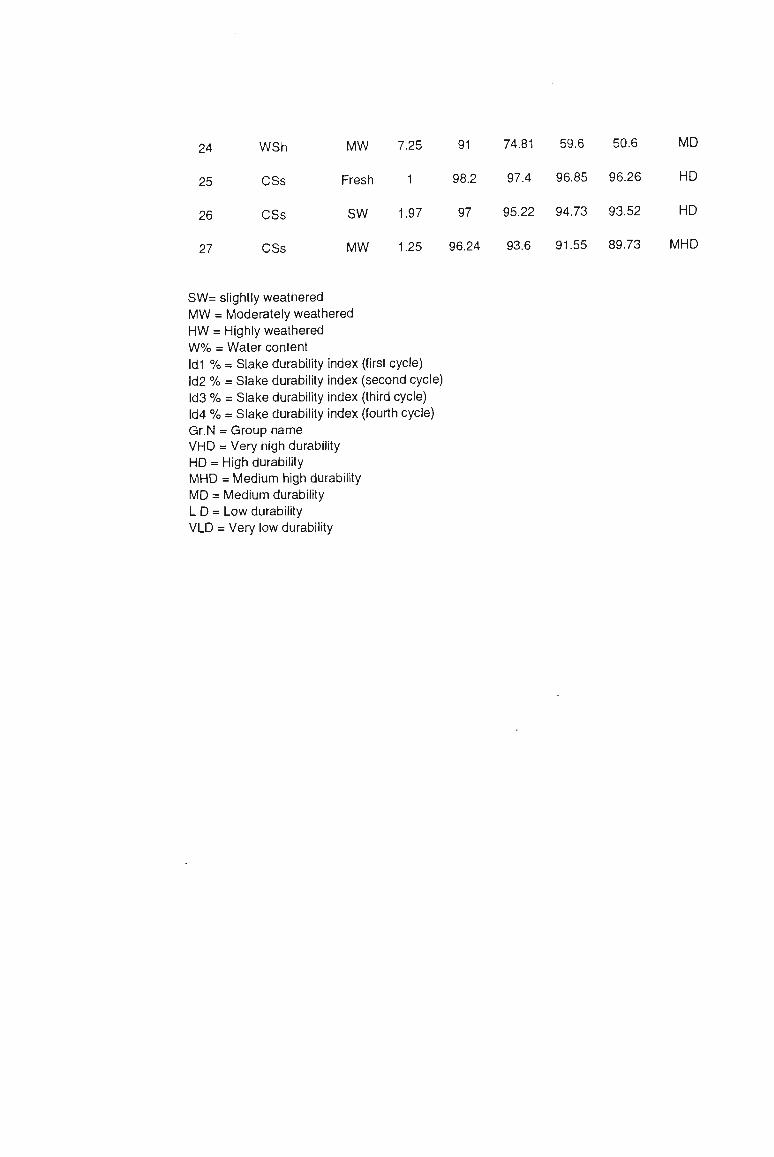
24
25
26
WSh
CSs
CSs
MW
Fresh
SW
7.25
1
1.97
91
98.2
97
74.81 59.6 50.6 M D
97.4 96.85 96.26 HD
95.22 94.73 93.52 HD
27 CSs MW 1.25 96.24 93.6 91.55 89.73 MHD
S W = slightly weathered M W = Moderately weathered H W = Highly weathered W % = Water content Id1 % = Slake durability index (first cycle) Id2 % = Slake durability index (second cycle) Id3 % = Slake durability index (third cycle) Id4 % = Slake durability index (fourth cycle) Gr.N = Group name V H D = Very high durability H D = High durability M H D = Medium high durability M D = Medium durability L D = Low durability VLD = Very low durability
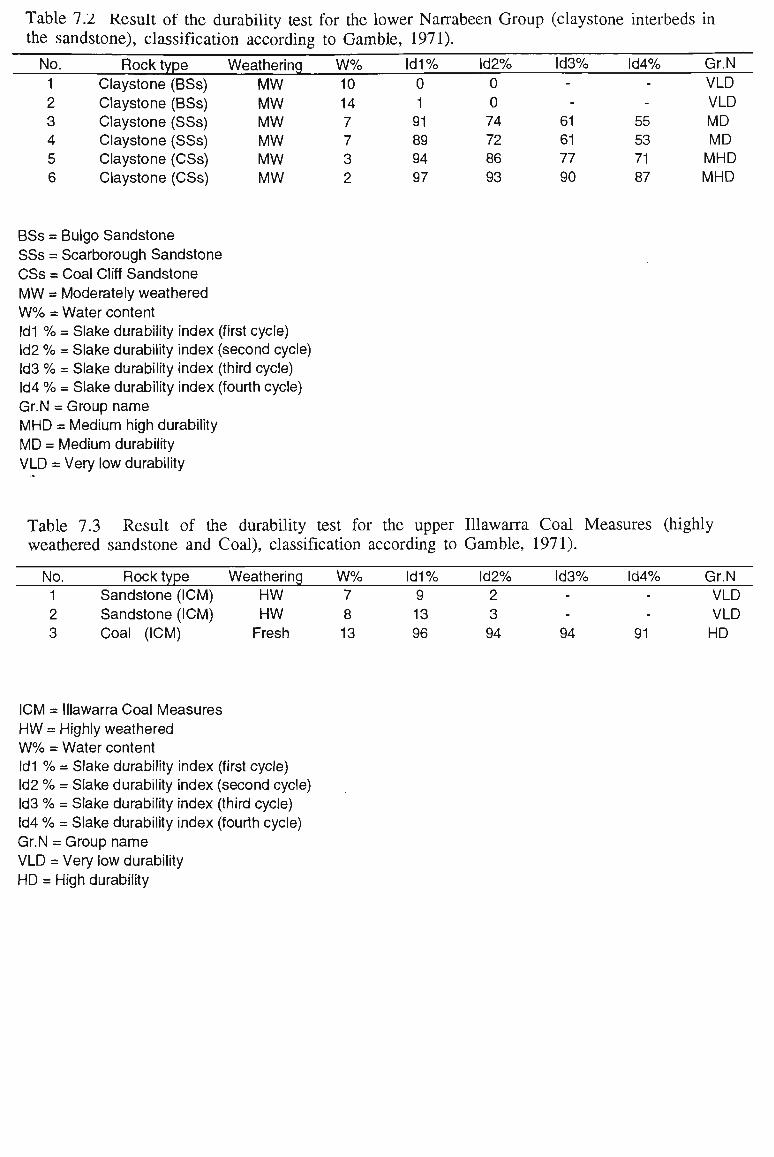
Table 7.2 Result of the durability test for the lower Narrabeen Group (claystone interbeds in the sandstone), classification according to Gamble, 1971).
No. 1 2 3 4 5 6
Rock type Claystone (BSs) Claystone (BSs) Claystone (SSs) Claystone (SSs) Claystone (CSs) Claystone (CSs)
Weathering
MW MW MW MW MW MW
W % 10 14 7 7 3 2
Id1%
0 1 91 89 94 97
Id2%
0 0 74 72 86 93
Id3% -
-
61 61 77 90
Id4% -
-
55 53 71 87
Gr.N
VLD VLD MD MD MHD MHD
BSs = Bulgo Sandstone SSs = Scarborough Sandstone CSs = Coal Cliff Sandstone M W = Moderately weathered W % = Water content Id1 % = Slake durability index (first cycle) Id2 % = Slake durability index (second cycle) Id3 % = Slake durability index (third cycle) Id4 % = Slake durability index (fourth cycle) Gr.N = Group name M H D = Medium high durability M D = Medium durability VLD = Very low durability
Table 7.3 Result of the durability test for the upper Illawarra Coal Measures (highly weathered sandstone and Coal), classification according to Gamble, 1971).
No. Rock type Weathering W% Id1% ld2% Id3% Id4% Gr.N 1 Sandstone (ICM) H W 7 9 2 - - VLD 2 Sandstone (ICM) H W 8 13 3 - - VLD 3 Coal (ICM) Fresh 13 96 94 94 91 H D
ICM = Illawarra Coal Measures H W = Highly weathered W % = Water content Id1 % = Slake durability index (first cycle) Id2 % = Slake durability index (second cycle) Id3 % = Slake durability index (third cycle) Id4 % = Slake durability index (fourth cycle) Gr.N = Group name VLD = Very low durability HD = High durability
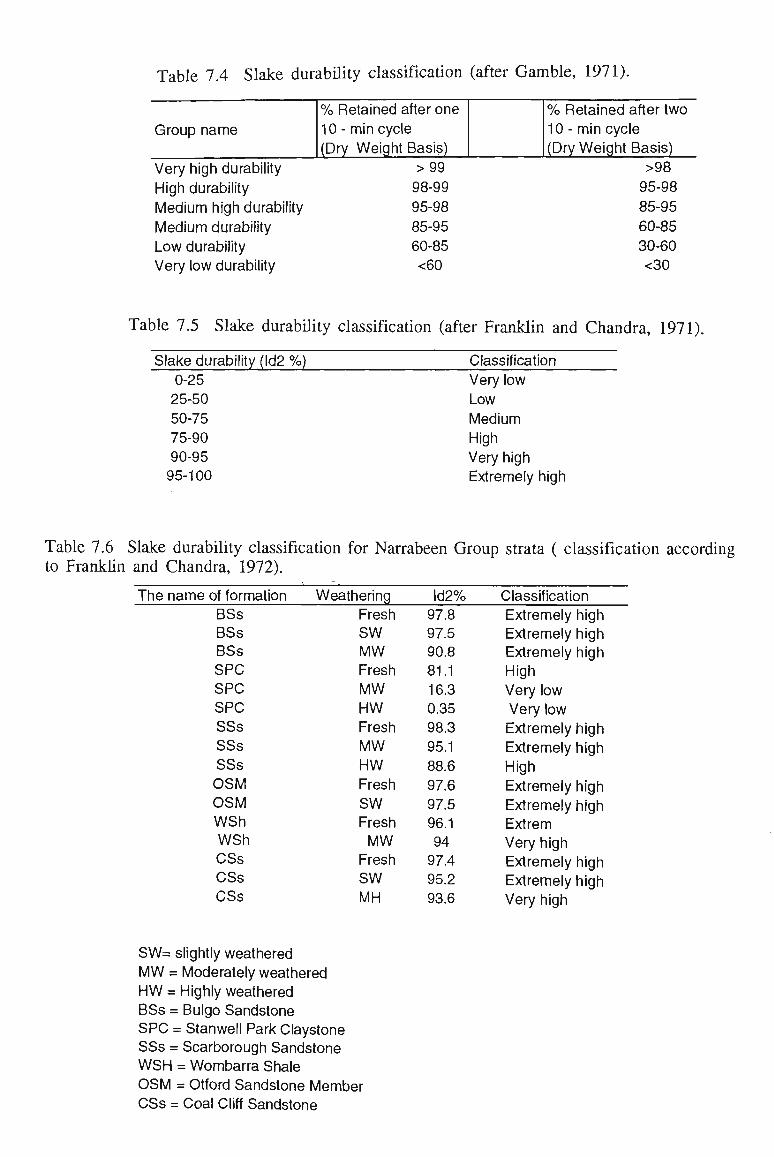
Table 7.4 Slake durability classification (after Gamble, 1971).
Group name
% Retained after one
10 - min cycle (Dry Weight Basis)
Very high durability > 99
High durability 98-99
Medium high durability 95-98
Medium durability 85-95
Low durability 60-85 Very low durability <60
% Retained after two
10 - min cycle (Dry Weight Basis)
>98 95-98
85-95
60-85
30-60
<30
Table 7.5 Slake durability classification (after Franklin and Chandra, 1971)
Slake durability (Id2 % ) Classification
0-25 Very low 25-50 Low
50-75 Medium 75-90 High 90-95 Very high 95-100 Extremely high
Table 7.6 Slake durability classification for Narrabeen Group strata ( classification according to Franklin and Chandra, 1972).
The name of formation BSs BSs BSs SPC SPC SPC SSs SSs SSs
OSM OSM WSh WSh CSs CSs CSs
Weathering Fresh
SW MW Fresh MW HW Fresh
MW HW Fresh
SW Fresh
MW Fresh SW MH
Id2% 97.8 97.5 90.8 81.1 16.3 0.35 98.3 95.1 88.6 97.6
97.5 96.1 94 97.4 95.2 93.6
Classification Extremely high Extremely high Extremely high High Very low Very low Extremely high Extremely high High
Extremely high
Extremely high Extrem Very high Extremely high Extremely high Very high
S W = slightly weathered
M W = Moderately weathered H W = Highly weathered BSs = Bulgo Sandstone SPC = Stanwell Park Claystone SSs = Scarborough Sandstone W S H = Wombarra Shale O S M = Otford Sandstone Member CSs = Coal Cliff Sandstone

o
-a a o CJ
C eU o a. C/i
—J
C
a o a. 00 Ui
CU D. C/3
-a c C
5/5
OS
H
C
as CO
•o TO 3
E
OT a)
5
C\J
>• T3 T3 3
E >j
B IE Q-l E o o l_ CD co
jo c CD
E OJ CO
D5|
CO
CQ
•a CD
2 o CD CD •a CD
o CO
t 3 CO
CD"
E CC CO CD XZ
>^ CD D3| « CD
a co XZ
c .2 o CD CD TO
E 3 CD o
OT C CD
E OJ|
> C CO
E CD >. O i _
OT CD TJ >^ ©
OJ
E o o o > •
CD
cn ra CD Q.
cF x: ^o c o re o 'L.
B "53 "O SZ OJ
I
c g '•co
CT
B c CO TO
re o ui
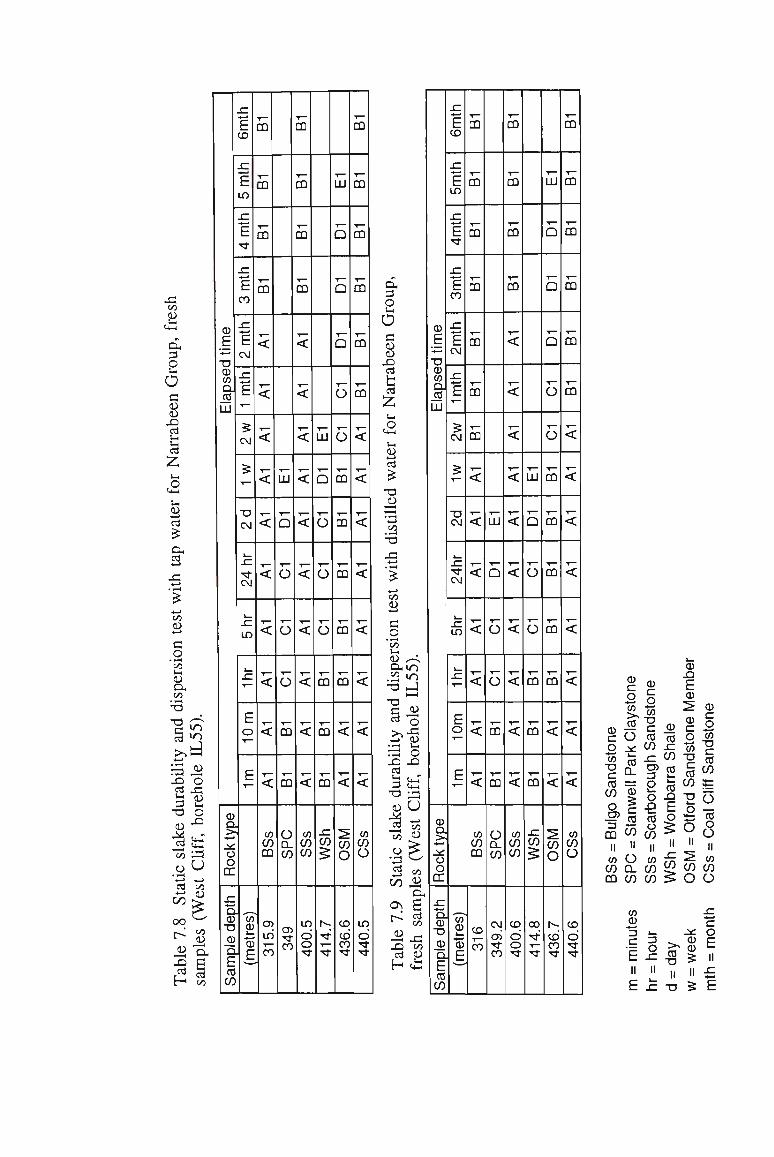
OO
& <4-H
d, 3 O
o c U CU XJ
a s-i
u
o CU —>
CL, cd
c/j CU -t—»
a o
•»—« c/5 S-l CU
ex co
• r-i
"O
XJ o
g x 3 S TJ O
•a •S5-3
•l-J -rJ cd oo " <U 00
OO
l>
-° S cd H
H
CO CU
00
CD
E • * - '
TJ CD
OT Q. rn UI
a) Q > y o o cc
sz Q CU
•a CD
u
E cc CO
sz +-*
b CO
JZ
E CO
SZ
E -cf
SZ
E CO
c E CM
SZ
E • ^
5 OJ
5
TJ CM
v. JL. ft CM
t—
(— LO
XZ
E o 'T—
E
UJ
CD
CD • E
Y ^
m
-,— m
1— rn
CD
,_ <
<
.,_ <
<
<
•j—
<
y—
<
<
<
<
CO C/J CD
O) lO T —
co
,_ UI
,_ Q
T —
O
T ~
O
o
CD
CD
o n CO
m ft m
T"'
m
T—
CQ
T—
m
• ^ -
CD
T—
<
<
<
^ <
K
T —
<
T "
<
<
<
<
CO C/J CO
lO
o o ft
UI
_ Q
,_
o
• ^
O
T -
O
CD
CO
CD
XZ UJ £
r-~ ft T—
ft
T —
UI
T ~
Q
T"~
Q
T -
Q
O
_
O
CD
„_ CQ
• ^
CD
T"""
CD
CD
<
<
^ CO O
CO
CO co ft
T~~
CQ
— CD
T —
CQ
T —
CD
T —
CD
m
T—
<
<
,_ <
^ <
X ~
<
<
<
<
OT C/J o
in
o ft ft
s f
OH
3 O I—I
O c CU CU
X 03
tl cd
z l-l
a S-i CU
Cd
-a cu
c/3 .rH
-a x
00 CU r->
a o • rH 00 V H
CU s< CJHITJ
.S3 «r> TJ J
I—I
TJ g O cd *Q •TV CO •rH V H
r3 o X X fa <+-? 3 C+H
•a ^ =2 oo Crt M
® r-X oo cd JU
H £
CD
b H—
TJ CD
OT a.
UI
CD uJ
o rr sz a. CD "O
CD Q.
E cc CO
sz +—'
b CD
SZ •+-*
b LO
.c *—* b ft
X ^ b CO
x
b CM
SZ
fc
CM
5
Tl CM
i—
x: ft CM
lO
sz
E o T_
E
OT CD i_
CD
F
T—
CQ
T —
m
y^
m
Y^
CQ
m
CQ
,_ CQ
<
^ <
1 —
<
<
<
<
<
OT C/J CQ
CO
m
^. UI
v— Q
1 —
o
o
CD
CD
O n CO
CM Ol ft C)
^ CD
T ~
ro
y~
T ~
CO
<
<
<
<
<
T —
<
<
<
<
T -
<
CO C/J CO
CO
o o ft
1
t—
UI
,_ Q
x~
o
o
CD
CD
CQ
SZ
UJ £
00 ft • ^
T ~
UI
~^~ Q
T~"
Q
D
O
,_
o T—
CD
CD
Y —
CD
CD
CO
<
<
^ CO O
r-CO CO ft
• ^ —
CO
T ~
CO
T ~
CO
~ CO
CQ
T —
CO
,_ <
<
T_ <
y—
<
<
<
<
<
CO C/J O
CO
o ft ft
CD C
o OT
CO
O JX W co
E CL CO =
CO g
?! m CO II II
OT O CO Q_ CO CO CO
CD X
CD C
o "co TJ cz CO CO sz cn
2 o •P m o ro II OT ro CO
E CD
CD CD C CO o
co T; 2 co co « X TJ fc O O 5= :5 O n H
ft ^ w CO ^ o
CD
c
o OT U c m CO 3= n CO o O II CO CO O
OT
3 c
3 ^ CD
O 2T CD
c
o E
SZ TJ 5 E
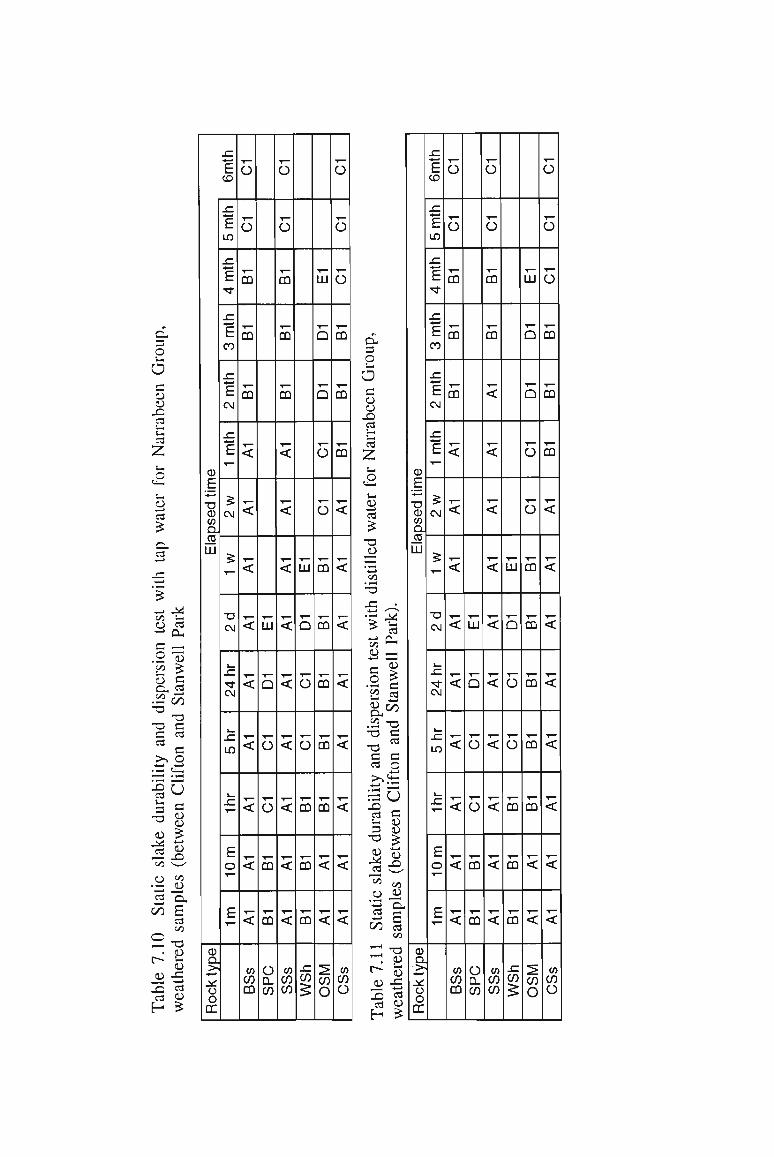
0
E TJ 0 OT a CO UI
0 a. '>< Y O o CC
sz +^
b CO
sz
E LO
XZ
E ft
sz
E CO
x
E CM
XZ
E 1—
5 CM
•s T—
TJ CM
i_ J_
ft CM
L_
r lO
T—
E o "i—
E
y—
o
^— o
• ^ -
CO
T—
CO
^ CO
^ <
,_ <
T—
<
T—
<
T —
<
— <
<
T—
<
T -
<
CO CO CO
UI
T "
Q
~ o
o
CQ
CO
o 0_ CO
T -
O
— o
— CO
T—
CO
T—
<
y—
<
,_ <
!— <
<
T—
<
— <
<
<
<
OT CO CO
T ™
UI
Q
— O
T""
O
T— CO
CO
CO
X UJ £
1—
UI
— D
• ^
Q
^ o
.,_
o
T—
CO
CO
• ^
CO
T"~
CO
CD
<
<
^ CO O
~ o
•^ o
— o
^ CO
^ CO
x— CO
T—
<
^ <
T —
<
y—
<
IT"
<
<
<
<
CO UJ
o
0
E TJ CD OT riJ CO UI
0 Q. > H
y O O
rr
XZ *- b CO
X
E LO
SZ
E ft
X
E CO
X
E CM
SZ
E T—
<: CM
•s T—
TJ CM
,_ J_ ft CM
i_
f-LO
X
E o T—
E
— CJ
t—
O
^ CQ
T —
CQ
— m
T—
<
1 —
<
-<
T ™
<
T—
<
T "
<
<
<
T -
<
OT CO CO
UI
T—
Q
~ O
O
CQ
CO
CJ a. CO
1
— CJ
-r-
O
T—
CO
T ™
CO
— CO
T—
<
T_ <
T—
<
<
•1—
<
^™
<
<
<
<
CO CO CO
• ^
UI
D
• ^
o
~ o
CO
T™
CO
CO
X UJ <:
^ UI
— a
— Q
— O
1_
o
T—
CQ
CO
• CQ
T""
CO
CO
T—
<
<
^ CO O
-O
T—
o
— o
^ CO
^ CO
•^ CO
•r_ <
1—
<
<
T—
<
T"~*
<
T "
<
<
T—
<
CO UJ
o
CL,
o a a cu X 71 *-M
cd Z • o 0—1
•_.
CU cd £ CL cd
r-
=5 — c/> fl
r-O C/3
a) CL 00
TJ
TJ C cd
>, • wm
XZ cd n TJ
UU
3 00
C) *1-*
cd 00
rj
r ii X cd H
r * — •
cd CL, _ QJ
£ E oo TJ E cd
C o C^H .v-*
u c tu tu £ <u X "—' V)
fl) CL E' cd 00
TJ CU OJ X cd CU *
CL 3 O
a a ro flj X cd u-cd
z '— o '—. -H
1) — cd £ TJ CU
|_4
—• C/3 • i-H
T3 •13 - « — i
£ r_, 00 CU
c n •rH
00
OJ CL 00
TJ TJ a cd
• * — i
X cd 3 TJ eu M cd 00
o — J
cd C/J
^
r> ii X cd H
,
M cd OH
, flj
r? B Tl 00
TJ E m B O
U B 1) aj r? *-* CU X oo <u
n, Fi cd 00
TJ
flj X cd tu r5
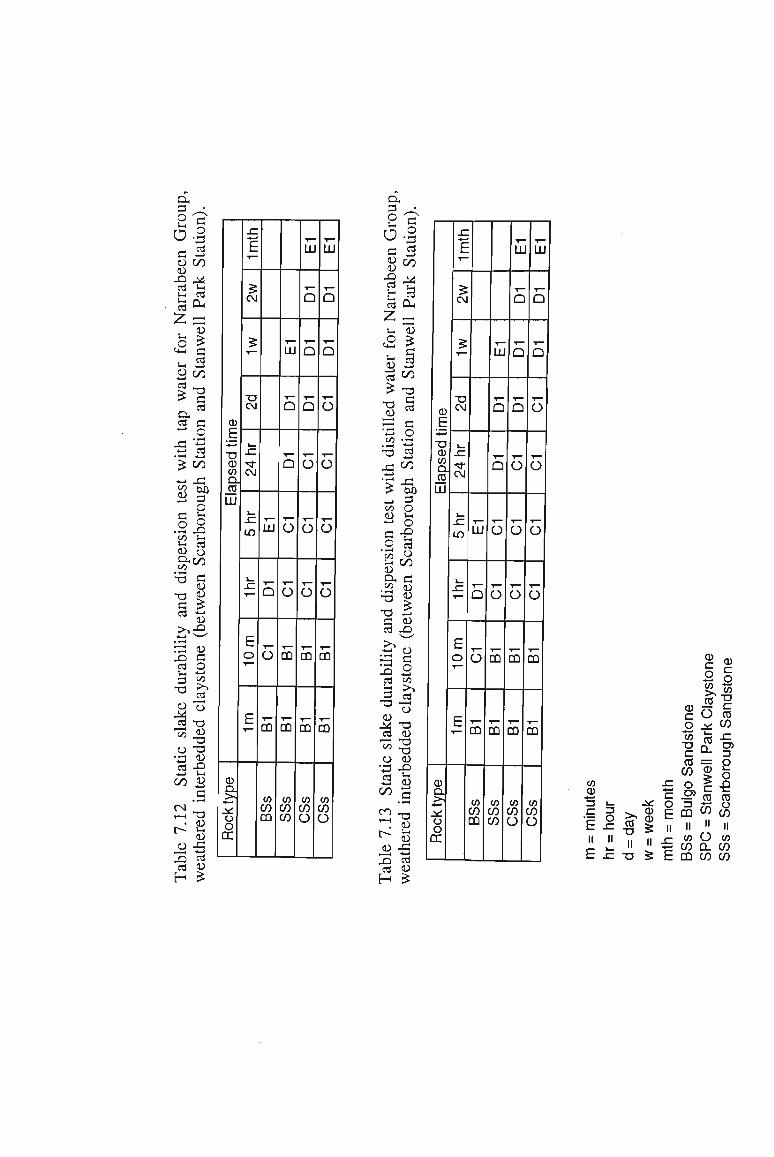
CL
E 2 tU 00 tu cd H u, cd cd&<
ZrE . <u o * <+H E . cd rH ._>
B oo «J _ H
* E3
CL* cd E - O *-> cd '^ OO <-» X
B 2 .2r§ CO rH
tu n TJ E
CU TJ g
S > CU -rH
•rH
rE <u x E cd o UH *->
!U *cj •a TJ
O "O • X flj
00 M
i—I T J • flj
c- <-< flj
o -g X cd cd JJ
H £
0
b • r -
Tl 0 OT torn UI
0
n >• V
O O CC
XZ •• i
E 1—
^ CM
5i
Tl CM
t_
-1_ ft CM
i_
r to
L.
E o
F
— UI
Q
O
CO
OT UJ CQ
UI
Q
•7—
Q
~ O
o
T—
CO
T—
CO
co CO CO
T—
UI
_ Q
Q
Q
T—
O
T ~
o
T —
O
CO
CO
OT CO o
T""
UI
,_ Q
r Q
O
T -
O
— O
o
CQ
CQ
CO CO O
CL 3
p
d E
O X ,—1 jrf
X cd
r ^
cd OH
L- flj
a * tu cd
TJ OJ
00
TJ
oo TJ
X
E O
•rH
cd 00
"5 -^ > DO _> 3 C/3 O flj LH
--> o
= -£ •2 «3 $ r% j j ^
•S3 aj
TJ g TJ £ C OJ cd X & OJ
-5 2 cd co E >> TJ <—>
O OJ r^ TJ 1 3 flj o flJ '•3 -g £3 S3
oo CO
a
5J l^ cu r5rj -S X cd
AS
0
£ TJ 0
n CO Ml
0 Q. 5-. V o o cc
X "*~*
E
-? CM
5?
Tl CM
i—
X ft CM
i—
f-
lO
i—
E o
F
y~
UI
Q
O
CO
co CO CO
UI
Q
y-
Q
Y"~'
O
O
T—
CQ
T—
CD
co CO CO
U
Q
Q
Q
1_ O
~ o
o
CO
T™
CO
OT CO C)
— UI
1—
Q
Q
o
7—
o
~ o
T —
o
CO
CO
OT CO o
CO 0 3 E
h II E
k_
3
n X II
X
>« CO
II TJ
.*: 0 0 15 II S
X E n E li f
b
0 r o CO TJ C CO CO
o OJ n CO II OT UJ CO
tone
one
Clays
andst
^ CO
If = o
anwe
arbor
?Jt CJ w CO II II O co 0. CO CO CO
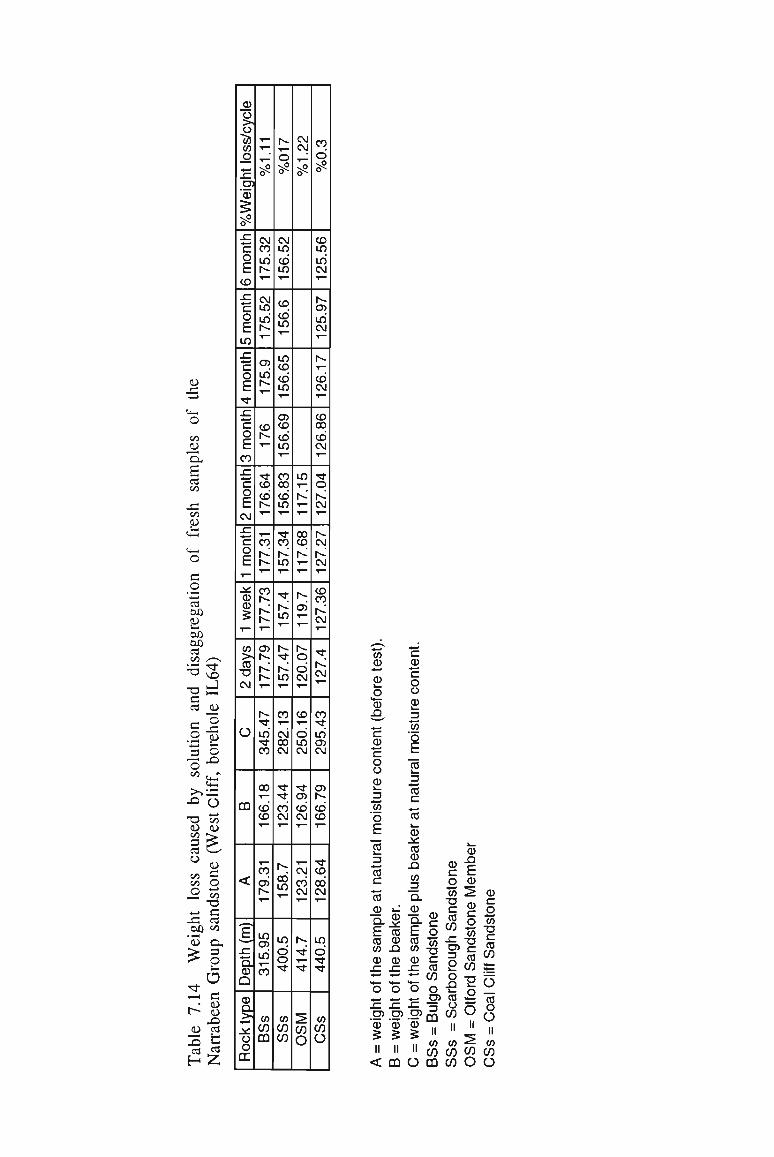
tu
00 _flj
CL
E cd oo 00
OJ
E O
cd DO tu DO DO cd C/J TJ
TJ E cd
E O
3 O 00
>* X
TJ tu 00 3 cd o
c/l C/3 O
.—» X oo -*—< <U
£ *tf
* [--
OJ X cd
•—v,
ft
rJ
CU o X flj
c X
f~ ' — 1
;E
o . irf
C/J CU
E tu E O H-H
00 TJ E cd C/3
CL 3 O "_M
a E fl) CU X cd
b cd
HZ
0 o > . o "55 CO
o X OJ 0 %
X
c
o E CO X
c o
E m X c
o E ft X c o
E CO X
"E o
E OJ X
o
E XL
0 0
5 CO > CO TJ CM
O
CO
<
sz
"5. 0 Q 0 a > XL O
o rr
i o^
CM CO in
CM m in i^
o> in r--
co
ft co CO
co 1^
co r-«
T™
cn r^
ft in ft CO
CO
CO CO
CO
oS
m O) in CO
CO CO CO
o
CM in CO in
CO CD in
in CO CO in
O) CO CO lO
CO CO CD in
ft CO
in
ft N-'
m
ft i^ in
co
CM
CO CM
ft ft CO OJ
in
in o o ft
CO CO CO
CM OJ T—
m
CO CD
T—
O o CM
CD
d lO CM
ft O) CD CM
CM CO CM
ft
ft
CO
O
CO
d
CD in in CM
OJ in OJ
CD CM
CD CO CO CM
ft o
CM
CM N-' OJ
CO CO
OJ
ft N-' CM
CO ft LO OJ CM
O)
d CO T—
ft co
d CM
LO d ft ft
CO CO
O
OT CD
0 O 0 X * • • • * '
, •
E 0 C o o 0 3 OT o E _ 2 3
c
0 n) Q.
F ro co 0 X
o -t .
X OJ 0 5 ll
i_ 0 XL CO 0 X 0 s-Hr-
o 4^ X OJ CD •5
II
E 0
o CJ 0 -1
OT O
E 0
3 0 E 0
0 V 0 0 X 3 Q. 0 Q.
E 0 W 0 X Mr-
o r.
X gj 0 5 ll
0 E O
TJ C
CO
o OJ 3
m II CO CO
0 E O CO T3 r 0 CO
X 3
2 o X
0 O CO II
OT CO
0 X
E 0
2 0 c o To T) E 0 CO
n ^-
o II -> UJ
0 E o (0 TJ
0 CO 3=
o rn o O
n OT CO
< DO O CO CO O O

Table 7.15 Point load strength classification for Narrabeen Group (fresh core samples, West Cliff, borehole IL55), according to Franklin and Chandra, 1972).
Depth From 298.37 339.77 396.79 411.9 427.3 435.38
To 330.96 351.83 402.11 414.7 436.6 443.42
Formation
BSs SPC SSs OSM WSh CSs
Mean 4.35 0.919 4.37
2.78 1.69 4.07
Diametral Range
3.63-5.64 0.61-1.2
3.60-5.76 1.24-3.68
0.71-2.89 1.95-5.00
ls(50) Strength
VH M-H VH H-VH M-H H-VH
Mean 7.25 3.71
7.16 4.09
4.4 5.53
Axial ls(50) Range
5.96-8.41
2.68-4.62 5.29-8.79
3.28-4.87 3.27-5.19 4.98-6.57
Strength
VH H-VH VH VH VH VH
Anisotropy la(50) 1.66 4.04
1.51 1.47 2.6 1.36
Table 7.16 Point load strength classification for Narrabeen Group (irregular samples, between Clifton and Coalcliff), according to Franklin and Chandra, 1972).
Fomation
BSs BSs SPC SSs SSs OSM
OCONG WSh CSs CSs
Weathering
MW HW MW MW HW MW MW MW MW HW
ls(50) Range 1.45-3.8 0.41-0.9
0.23-0.92 1.42-4.56 0.58-2.1 0.61-2.23 3.55-5.93 0.4-1.98
1.51-3.43 0.41-1.64
Mean
2.4 0.65 0.5 2.38 1.22 1.67 4.28 0.89 2.36 0.99
Strength
H-VH
M L-M H-VH M-H M-H VH M-H H-VH M-H
BSs = Bulgo Sandstone SPC = Stanwell Park Claystone SSs = Scarborough Sandstone WSh = Wombarra Shale O S M = Otford Sandstone Member O C O N G - Otford Conglomerate Member M W = Moderately weathered H W = Highly weathered
VH = Very high strength H-VH = High to very high strength M-H = Medium to high strength M = Medium strength L-M = Low to medium strength
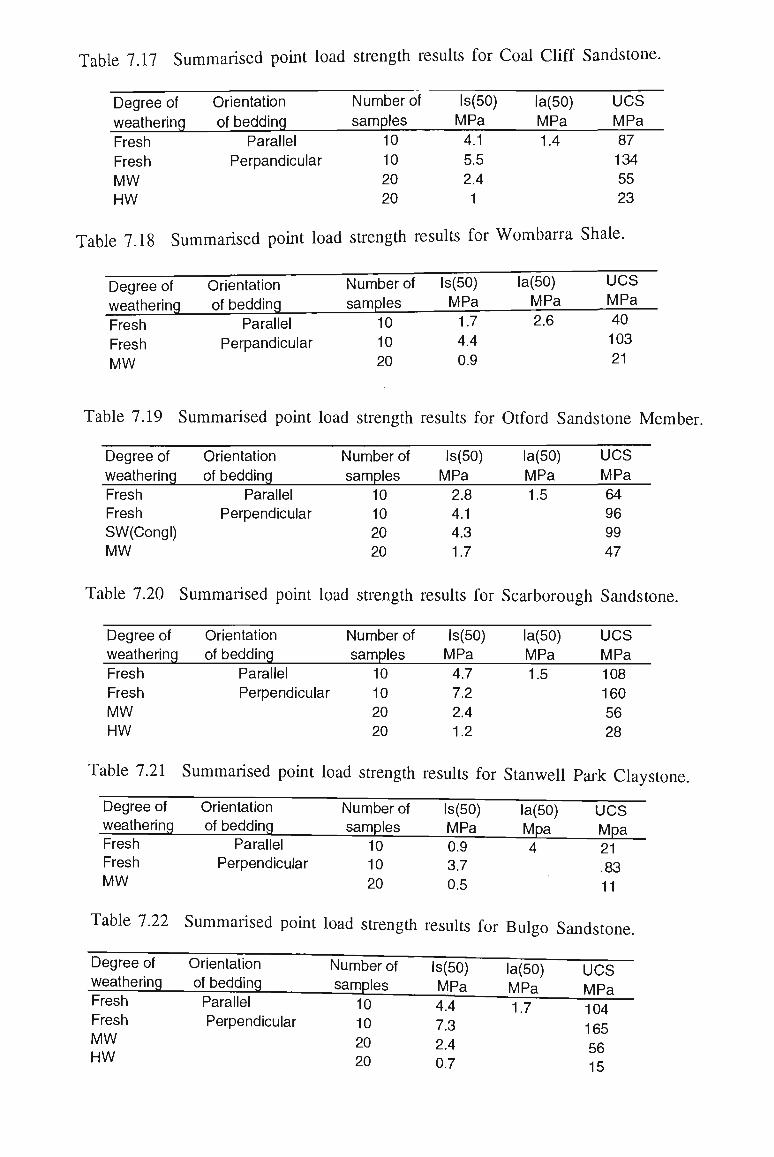
Table 7.17 Summarised point load strength results for Coal Cliff Sandstone.
Degree of
weathering
Fresh
Fresh
MW HW
Orientation
of bedding
Number of
samples ls(50) MPa
la(50) MPa
UCS
MPa
Parallel Perpandicular
10
10
20 20
4.1
5.5
2.4 1
1.4 87 134
55 23
Table 7.18 Summarised point load strength results for Wombarra Shale.
Degree of weathering
Fresh
Fresh
MW
Orientation of bedding
Number of
samples
ls(50)
MPa
la(50)
MPa
UCS MPa
Parallel
Perpandicular
10 10 20
1.7 4.4
0.9
2.6 40
103
21
Table 7.19 Summarised point load strength results for Otford Sandstone Member.
Degree of
weathering Fresh Fresh SW(Congl)
MW
Orientation
of bedding Parallel
Perpendicular
Number of
samples 10 10 20 20
ls(50)
MPa
2.8 4.1 4.3 1.7
la(50)
MPa 1.5
UCS
MPa 64 96 99 47
Table 7.20 Summarised point load strength results for Scarborough Sandstone.
Degree of weathering
Orientation of bedding
Number of samples
ls(50) MPa
la(50) MPa
UCS MPa
Fresh Fresh
MW HW
Parallel Perpendicular
10 10 20 20
4.7 7.2 2.4 1.2
1.5 108 160 56
28
Table 7.21 Summarised point load strength results for Stanwell Park Claystone.
Degree of weathering
Orientation of bedding
Fresh Fresh
MW
Parallel Perpendicular
Number of samples
ls(50) MPa
10 10 20
la(50) Mpa
0.9 3.7 0.5
U C S Mpa 21 ,83 11
Table 7.22 Summarised point load strength results for Bulgo Sandstone.
Degree of Orientation weathering of bedding Fresh Parallel
Fresh Perpendicular
MW HW
Number of
samples ls(50) MPa
la(50) MPa
UCS MPa
10 10 20 20
4.4 7.3 2.4 0.7
1.7 104 165 56 15
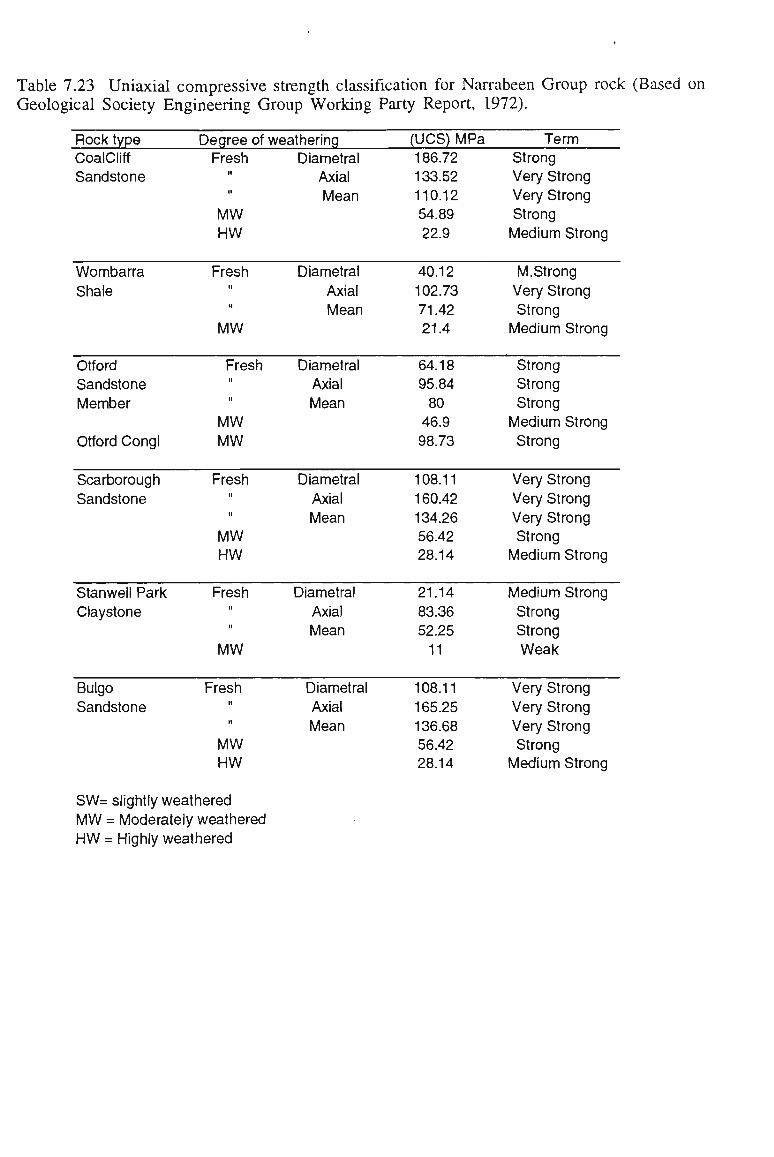
Table 7.23 Uniaxial compressive strength classification for Narrabeen Group rock (Based on Geological Society Engineering Group Working Party Report, 1972).
Rock type CoalCliff Sandstone
Wombarra
Shale
Otford Sandstone Member
Otford Congl
Scarborough Sandstone
Stanwell Park Claystone
Bulgo Sandstone
Degree of Fresh
n
II
MW HW
Fresh n
II
MW
Fresh n
u
MW MW
Fresh n
n
MW HW
Fresh n
II
MW
Fresh n
II
MW HW
S W = slightly weathered M W = Moderately weathered H W = Highly weathered
weathering Diametral
Axial Mean
Diametral
Axial Mean
Diametral Axial Mean
Diametral Axial Mean
Diametral Axial Mean
Diametral Axial Mean
(UCS) MPa 186.72 133.52 110.12 54.89 22.9
40.12 102.73 71.42 21.4
64.18 95.84 80 46.9 98.73
108.11 160.42 134.26 56.42 28.14
21.14 83.36 52.25 11
108.11 165.25 136.68 56.42 28.14
Term Strong Very Strong Very Strong Strong
Medium Strong
M. Strong
Very Strong Strong
Medium Strong
Strong Strong Strong
Medium Strong Strong
Very Strong Very Strong Very Strong Strong
Medium Strong
Medium Strong Strong Strong Weak
Very Strong Very Strong Very Strong Strong
Medium Strong

Table 7.24 Engineering geological study of fresh samples from the lower Narrabeen Group in West Cliff borehole IL55.
No. of samples
FCSsI FCSs2 FCSs3 FCSs4 FOSM1
FOSM2
FOSM3
FSSsI
FSSs2 FSSs3
FSSs4
FBSsI FBSs2 FBSs3 FBSs4
Depth (m)
441.8 442.3 435.75 440 414.7
412.5
411.5
394.7
400.5
402.1
396.8
298.4
305.5 289.6 316
Formation
CSs CSs CSs CSs OSM OSM OSM SSs SSs SSs SSs BSs BSs BSs BSs
%Quartz 29.4 30.5 31 26 27 26.3
26.6
41.6
50 58 52.3
59 33 31 48
UCS (MPa)
121.7 122.7 128.7 115.3 105.4
88.6
89 154.4 148.7
169.3
169.6
172.8
148.5 133.5 152.7
ls(50)
5.1 5.4 5.7 5.1 4.6 3.7 3.72
7.09 6.56
7.46
7.47
7.61 6.54 5.7 6.52
Table 7.25 Engineering geological study of slightly weathered sandstone samples from the lower Narrabeen Group between Clifton and Stanwell Park.
No. of samples SWCSs5 SWCSs6 SWCSs7 SWCSs8 SWCSs9 SWCSS10 SWCSs11 SWOSM4 SWSSsI SWSSs2 SWBSsI SWBSs2
Rock type CSs CSs CSs CSs CSs CSs CSs OSM SSs SSs BSs BSs
% Quartz 26.2 24 26.5
22.8
23.2
24.5 24 29 32 32.3 40.3 34.3
UCS (MPa) 65.1
52.9
59.67
49.1
51.3 61.4 60.3 44.2 77.9 79.5 79.6 67.2
ls(50) 2.82
2.25
2.55
2.07
2.18
2.67 2.54 1.93 3.4 3.42 3.53 2.94
Table 7.26 Engineering geological study of moderately weathered sandstone samples from the lower Narrabeen Group between Clifton and Stanwell Park.
No. of samples Rock type MWCSs12 CSs MWCSs13 CSs MWSSsI SSs MWSSs2 SSs MWBSsI BSs MWBSs2 BSs
% Quartz 18 18.5 26 30.6 22.3 19
UCS (MPa) 24.4
31.4 30.7 34.1 24.9 18.54
ls(50)
1.05 1.38 1.34 1.47 1.09 0.81
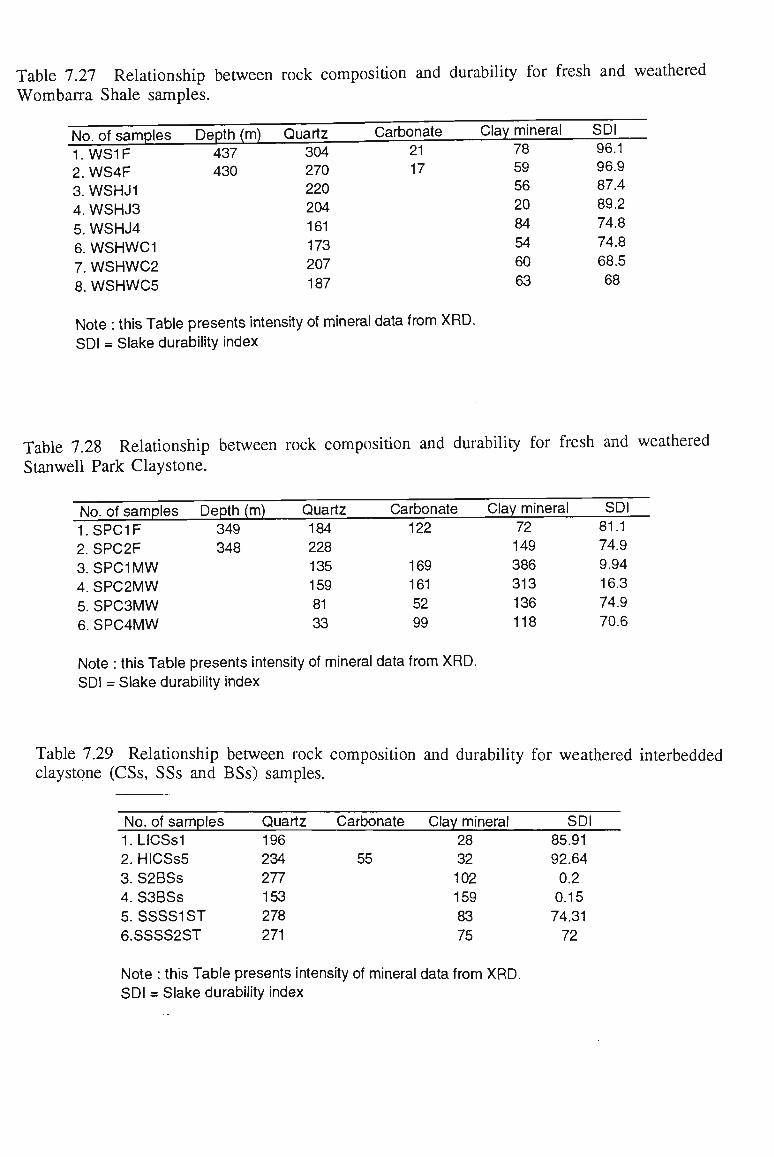
Table 7.27 Relationship between rock composition and durability for fresh and weathered
Wombarra Shale samples.
No. of samples 1. WS1F 2. WS4F 3. WSHJ1 4. WSHJ3 5. WSHJ4 6. WSHWC1 7. WSHWC2 8. WSHWC5
Depth (m) 437 430
Quartz 304 270 220 204 161 173 207 187
Carbonate 21 17
Clay mineral
78 59 56 20 84 54 60 63
SDI 96.1 96.9 87.4 89.2 74.8 74.8 68.5
68
Note : this Table presents intensity of mineral data from XRD. SDI = Slake durability index
Table 7.28 Relationship between rock composition and durability for fresh and weathered
Stanwell Park Claystone.
No. of samples Depth (m) Quartz Carbonate Clay mineral SDI 1.SPC1F 349 184 122 72 81.1 2. SPC2F 348 228 149 74.9 3. S P C 1 M W 135 169 386 9.94 4. S P C 2 M W 159 161 313 16.3 5. S P C 3 M W 81 52 136 74.9 6. S P C 4 M W 33 99 118 70.6
Note : this Table presents intensity of mineral data from XRD. SDI = Slake durability index
Table 7.29 Relationship between rock composition and durability for weathered interbedded claystone (CSs, SSs and BSs) samples.
No. of samples 1.LICSs1 2. HICSs5 3. S2BSs 4. S3BSs 5. SSSS1ST 6.SSSS2ST
Quartz 196 234 277 153 278 271
Carbonate
55
Clay mineral 28 32 102 159 83 75
SDI 85.91 92.64
0.2 0.15
74.31
72
Note : this Table presents intensity of mineral data from XRD. SDI = Slake durability index

TABLES TO CHAPTER 8
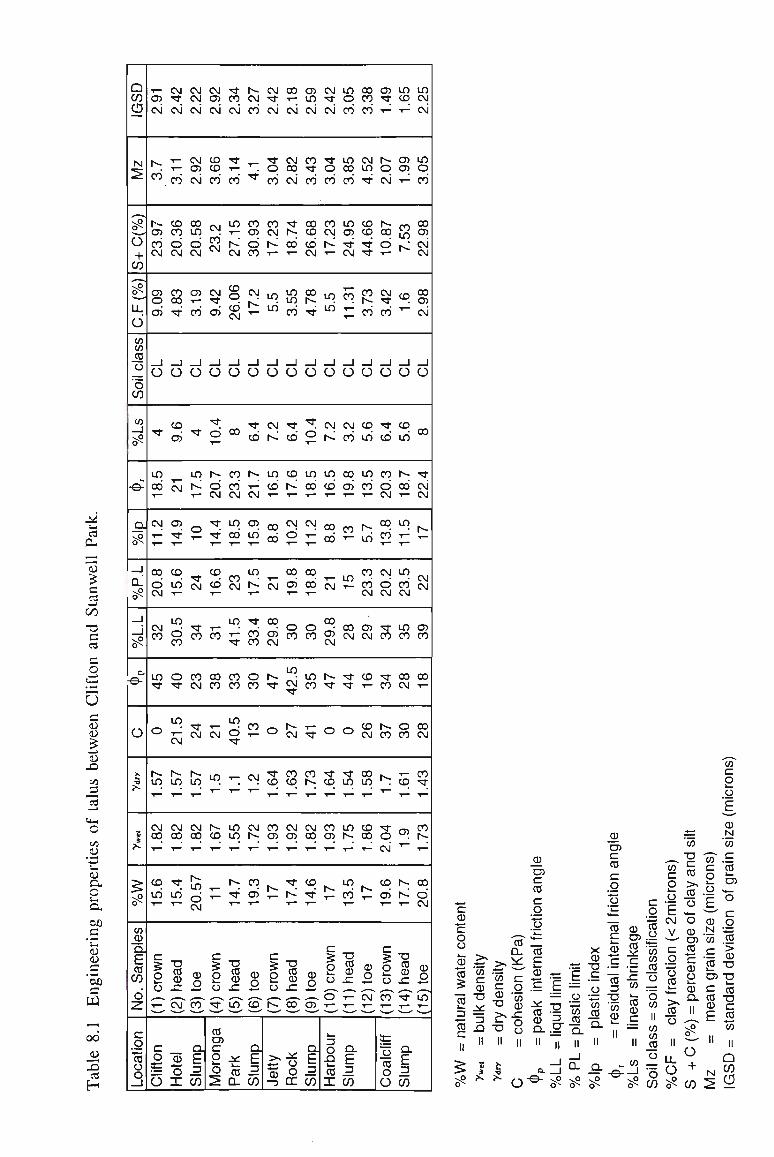
71 CL,
CU
r-
c/j
TJ E cd
u OJ
u cu
x CO 3
CrH
o CO flj
CU
a, o DO _E «—I
flj U E
»•—I
DO E
a 00
r3n
3 a H
Q UJ CJ
N
-5
^
u + CO .—. ^ u_
6 CO CO 0
o o CO
CO _J •-5
-e-
QJ 9
_J
CL o^
_l _ I --P 0s-
a.
-e-
o
?» .4 r»
¥ ?-
S. o*
CO 0 n E 0 CO 6 -£
c .o 0
o n _I
O) CM
r». C'j
h-CJJ CO CM
OJ
o CJ)
_l
o
ft
in
CO 'r"
CM T—
~^~
CO o CM
CM CO
in ft
o
r-m
CM 00
CO LO
r. 5
2 o
c o
O
CM ft C\J
1—
CO
CO CO o CM
CO 00 ft
_J O
CO d
CM
O)
ft 11
CO LO ,~
m
co
o ft
LO
CM
r in
CM oo
"flirt
TJ 0 0 XZ
CM
0
O X
CM CM CM
CM cn CM
00 m o CM
OJ
CO
_J O
ft
m r--'r~
o
ft CM
ft CO
CO CM
ft CM
r-m
CM CO
m o
0
o
co
a, E 3 (Si
CM OJ CM
CO CD CO
CM
C'j CM
CM ft OJ
_l O
ft
o
r-~ o CM
ft ft "*"
CO CO T~
T™ CO
00 CO
CM
in
—
r CO
E 5
2 o ft
0 OJ c 2 o JL
ft CO CM
ft
CO
in 1—
r CM
CD O CD
l
O
UJ
CO
co CM
LO
00 T—
CJ CM
in
ft
CO 00
LO
b ft
'. T—
m m
i .
ft
TJ 0 0 SZ
in
XL L-0 a.
r--CM CO
^ . ft
CO OJ o CO
CM
_i O
ft CO
h-T —
CM
CJ)
ui 1—
m r--T_
ft
C'j
ro
o co
co
CM
CM r-
CO
OJ
0
o CD
a b 3 UJ
CM ft CM
ft O CO
CO CM t-T -
m m
_i O
CM h-
m CO ,—
00 00
CM
m
CM
1^ ft
o
ft CD
CO OJ
N.
E 5
2 CJ
1^
OJ ~3
00 T -
CM
CM 00 CM
ft 1^ 00 T—
LO LO CO
_l
o
ft CO
CO
t»-T~
CM
cj "r~
00 O) 1—
o CO
in
C*J ft
CM
CO CO
CM O)
ft t
u 0 0 XZ
CO
XL O
O CL
O) LO CM
CO ft co
00 CO CD CM
00
ft
_i O
ft
o
LO
00 *"
CM y—
"'""
00 00 "l—
o CO
in CO
ft
co i^
CM 00
CD
ft
0
o
a>
a E 3 CO
CM ft CM
ft O CO
CO CM h-T—
LO LO
_l O
CM 1^
LO
CD ,—
00 m
CM
m UJ CM
r-~ ft
o
ft CO
CO OJ
h>. T—
E 5 o o - o
1_
-1 o S2
0
I
in o CO
in 00 CO
m OJ ft CM
CO ,_
_i O
CM CO
00
O) ,_
m
UJ
00 CM
ft ft
o
ft LO
1~
in h-
LO CO
u 0 0 XL , s ^
a E 3 CO
00 CO CO
CM LO ft
CD CO ft ft
CO t-co
_J
o
CO LO
m CO T—
r-m
co co CM
OJ CM
CO "r~
CO CM
00 LO
CD 00
[v.
0
o ^ , CM
OJ ft 1_
1 o CM
h-00 o T-
CM ft CO
_l O
ft CD
CO
O CM
00
CO 1—
CM O CM
ft CO
<tf CO
1"-.
co
h-T~~
ff o CM
CD OJ
c -5
2 o ro
a= CJ 0 O
o
in m CO CM T- CM
CD in O) o i- CO
LO °i
"^ CM
co 52 . O) *" CM
_l _l
o o
^ ^ in ^
Is* 'Ct 00 CM T- CM
^ IV.
T—
^ rv, -rl CM
\V. CM CM
m OJ CO CO
CO CO CM -i-
O CO CO CM
T- CO CO ft ^ T—
°> £ T— •
|v- 00
|v- o
TJ
ll ^^ e ft LO
Q. E 3 CO
E 0 E O CJ h _
0 0
5 2 3 0 E
0 OJ E 0 E
o .a 0 ^ a. 0
« >>^ E CO -ti CD H - L_ r-E CO C -S •= t •£
0 E o .£ E — 0 •J2 0 ~ = " •-
0 OJ E 0 E
o o
0
c o
CO
TJ E 0
0
% | "i ~ = o % = ^ o n TJ '-n n
8 S.f-S Q-0
n
0 E k _
0
.£ 0 3 TJ CO 0 II
0 OJ
E
CO h _
0 0 E
TT CJ
O i2
E ^ CM O V 0 —* DJ E 0 .2 E •K 0
co c
2 CJ
£ 0 N 'co E 0
2 OJ
E ° v-' E 0 O N "H=
CO .0 iS E
o
6s-
co CO 0 CJ
Q- o. -w, ~
O ff^ tf> J> o CO
0 E i: 0
0 II
O +
S- CO
0 TJ O) TJ
5 « 0 TJ 0 C
E iS CO
II
N
II
CO CD
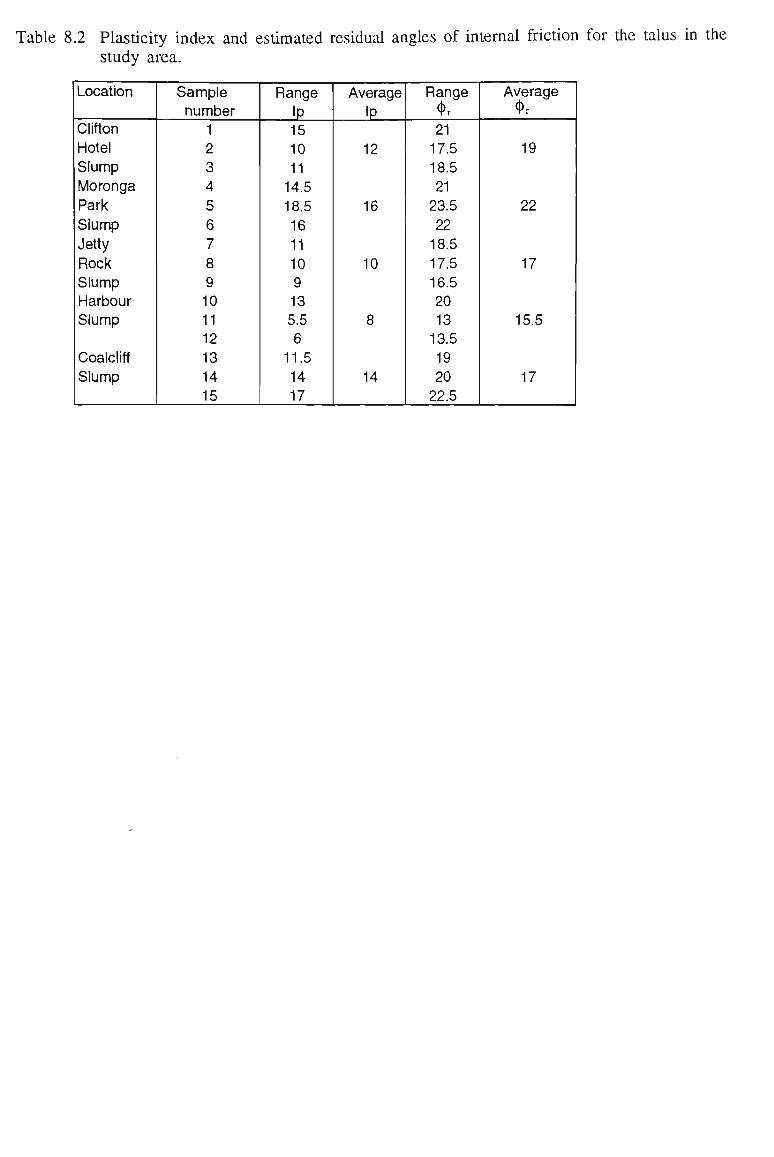
Table 8.2 Plasticity index and estimated residual angles of internal friction for the talus in the study area.
Location
Clifton Hotel Slump Moronga
Park
Slump
Jetty Rock Slump Harbour Slump
Coalcliff Slump
Sample number
1 2 3 4 5 6 7 8 9 10 11 12 13 14 15
Range
Ip 15 10 11 14.5 18.5 16 11 10 9 13 5.5 6
11.5 14 17
Average
IP
12
16
10
8
14
Range <J>r
21 17.5 18.5
21 23.5
22 18.5
17.5 16.5
20 13 13.5 19 20 22.5
Average $r
19
22
17
15.5
17
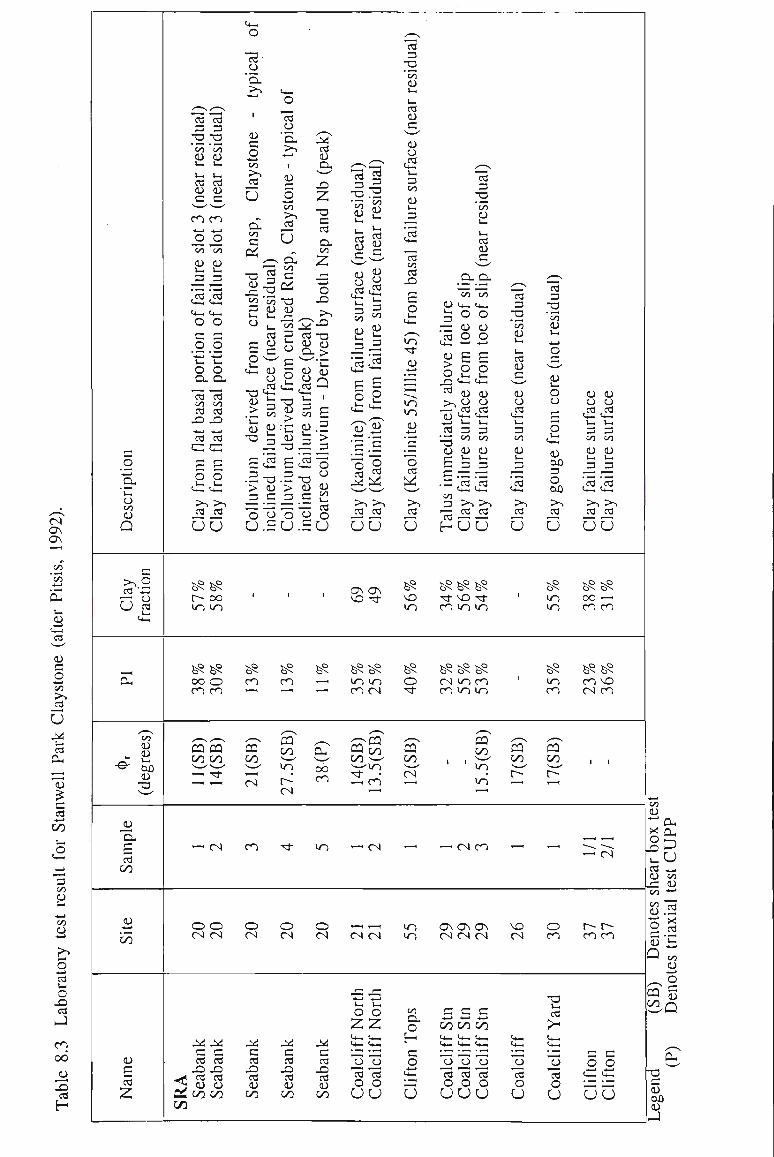
5 •»—i
I—i
o C/3
CU Q
r-«
cd "13
r ° ci:
Eu
^ ^ co aj
/-H" rr •©" DO
CU T3,
"ex E c5 00
OJ
bo
OJ £ cd
2
esidual)
esidual)
rn rn
cd c3 <U cu E E cn cn •4—» -.—1
_2 -2 co on OJ 4J rn l_
rE -^
O O E E .2.2 " — "H—»
Ui 1—
o o a. ex 13 13 C/J C/J cd cd X -O
cd cd
E E 5 5 •— I—
< — C-H
> - . > • >
cd cd
uu
*£*£ t-- oo LO in
*&!£ oo o cn cn
**~\s~^s
CQ CQ W W W f t ^
r-H CN)
o o CN CM
XL XI E E cd cd -O X
«d< cd cd ^ cj u CS oo oo
tone -
typical of
typical of
eak)
co i D H
U o 2
CL -2 rt CO r •,
E ^ O-^ ^ a- ^ TJ ^ E XZ
r E T . ^ O o '55 TJ -°
5 2. <y >> cd 3 cd T J
c aJ h u <u
E c ° ex > r-N •. y \lZZy *^
2 p c c: <U E U CU
O g CJ X ,cd ci: ,cd u
TJ ^T- <+-•
aj s, TJ E,
> 2 « S E o P - C <u.2 TJ b OJ \ZL > E £ Ec2o E _ 3 _ O .—, TJ •— TJ _ > <u > aj u JE .£ J2 .E 2 o o o o o U.SU.SU
1 1 1
68 S& ^ cn cn ~
^_^
^ 03 -> CQ oo CU CO w w s—' *n ob CN t^ ^
CN
cn ft m
o o o CN CN CN
XL Xi XL E E E cd cd cd X XJ XJ cd cd cd
cu cU cu oo 00 00
IH ^
c3 «<
E ^ ,
C« iS
3 3
C \zz rE-E
E E
'E .E
^1 XL r^ >> >1 cd cd
U U
ON O N NO ft
^ ^ m m cn CN
^^ ^CQ cQoo 00 w -^m "* ^ —< cn r—<
<—' CN
1 r-1
CN CN
XZ XZ *H r-J U rn o o Z Z <H— >H_,
XI E H O JJ cd 13 o o U U
cd 3 TJ "v\ CU r,
u. cd aj E aj
o c2 -r
3 in aj
3
d—<
^—, cd CO
cd X E o /-^ in ft AJ
• r r
t in in AJ
r—
cd
w >. cd
U
^ NO m
c^ O ft
y-s
CQ 00 ^—' CN r—<
*—t
in in
CO
ex o H E O d • H
u
^—^ 13 3 TJ 'co OJ r, -H cd flj E
co c O <+_ «+_ ^ O O : E <U <U cd o o 1*5 *-» H-J
u E E n ° ° D u u d u o > y y X/,cd ,cd i. 1- u, Cd 3 3 "X CJ "J TJ CU <U flj r- V- r-
c 3 a .3 'cd 'c3
cX cX CO
3 >» >^ ~zz cd cd
H U U
^ ^ i ^ ft NO ft cn in in
^ ^ ^ CN in cn cn in in
^ ^
CQ 00
1 1 s"^/
in in r—H
-^ CN cn
ON ON ON CN CN CN
E E E 00 00 00 tt- U-. <H_ <*r <H_ <*H
' — * *""' *— o o o cd cd cd O O O
U U U
13 3 TJ 'co flj r, r, cd OJ
OJ a
3 CO
CU
3
'cd X >-! cd
U
1
1
x—s,
CQ 00 s—y
t> r-*
, 1
NO CN
C*r ' *~'
_o cd
o U
^ 3 TJ 'co OJ rH
H—»
o
O u r-
o
u op —'
o C3JQ
>, cd
U
^ in in
^ in cn
s~-\
CQ 00 v*— [> T-^
» — <
o cn
TJ cd >-i*. <H-H *—
o Id o U
(U OJ o CJ ,cd ,cd Cr- C*r l_ 1—
3 3 CO CO
CU OJ
3 _3
'c3 "c3 Cr- C+-.
>. >. cd cd
U U
^ i ^ 0 O r-H
cn cn
^ ^ cn NO CN cn
i i
t
-. . r^ CN
r- r-cn cn
E E O O <X X *- *-
U U
4—i
£ • ^
><
o X rn cd aj
co CO
£ • o E aj
Q / v
CQ 00 • .
TJ E flj
oxi rJ
CL, CL
P U *H in flj
cd
co OJ
O S3 Q
0H

APPENDIX TO CHAPTER 7
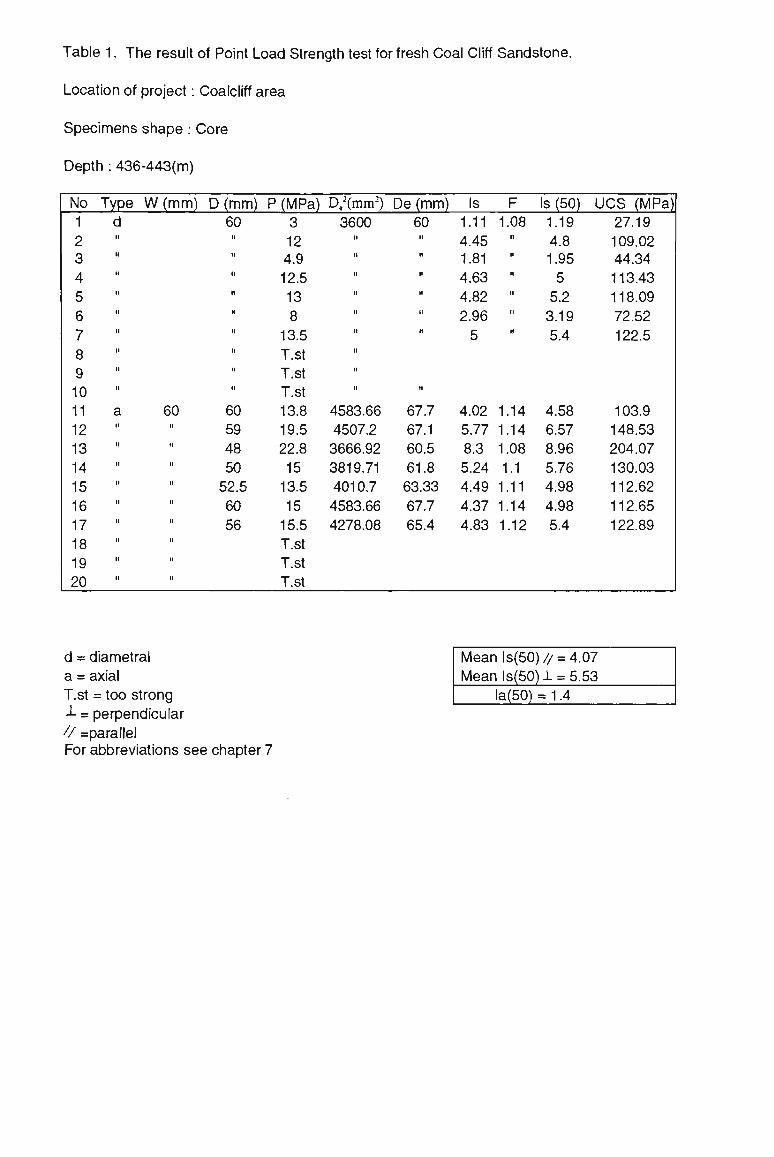
Table 1. The result of Point Load Strength test for fresh Coal Cliff Sandstone.
Location of project: Coalcliff area
Specimens shape: Core
Depth : 436-443(m)
No 1 2 3 4 5 6 7 8 9 10 11 12 13 14 15 16 17 18 19 20
Type W (mm) D (mm) d M
II
it
n
ft
II
u
II
II
60
a 60 60 u l
n (
u
n
n
u
u
u I
it 1
59 48 50 52.5 60 56
P (MPa) 3 12 4.9 12.5 13 8
13.5 T.st T.st T.st 13.8 19.5
22.8 15 13.5 15 15.5
T.st T.st T.st
De2(mnr) De (mm)
3600
4583.66 4507.2 3666.92 3819.71 4010.7 4583.66 4278.08
60 ll
ll
ll
ll
ll
II
ll
67.7 67.1 60.5 61.8 63.33 67.7 65.4
Is 1.11
4.45 1.81 4.63
4.82 2.96 5
4.02 5.77 8.3 5.24 4.49 4.37 4.83
F 1.08
it
ll
ll
ll
ll
ll
1.14 1.14 1.08 1.1 1.11 1.14
1.12
Is (50) 1.19 4.8 1.95 5 5.2 3.19
5.4
4.58 6.57 8.96 5.76 4.98 4.98 5.4
U C S (MPa) 27.19
109.02 44.34 113.43 118.09 72.52 122.5
103.9 148.53 204.07 130.03 112.62 112.65 122.89
d = diametral a = axial T.st = too strong -L = perpendicular // =parallel For abbreviations see chapter 7
Mean ls(50) // = 4.07 Mean ls(50) 1 = 5.53
la(50) = 1.4
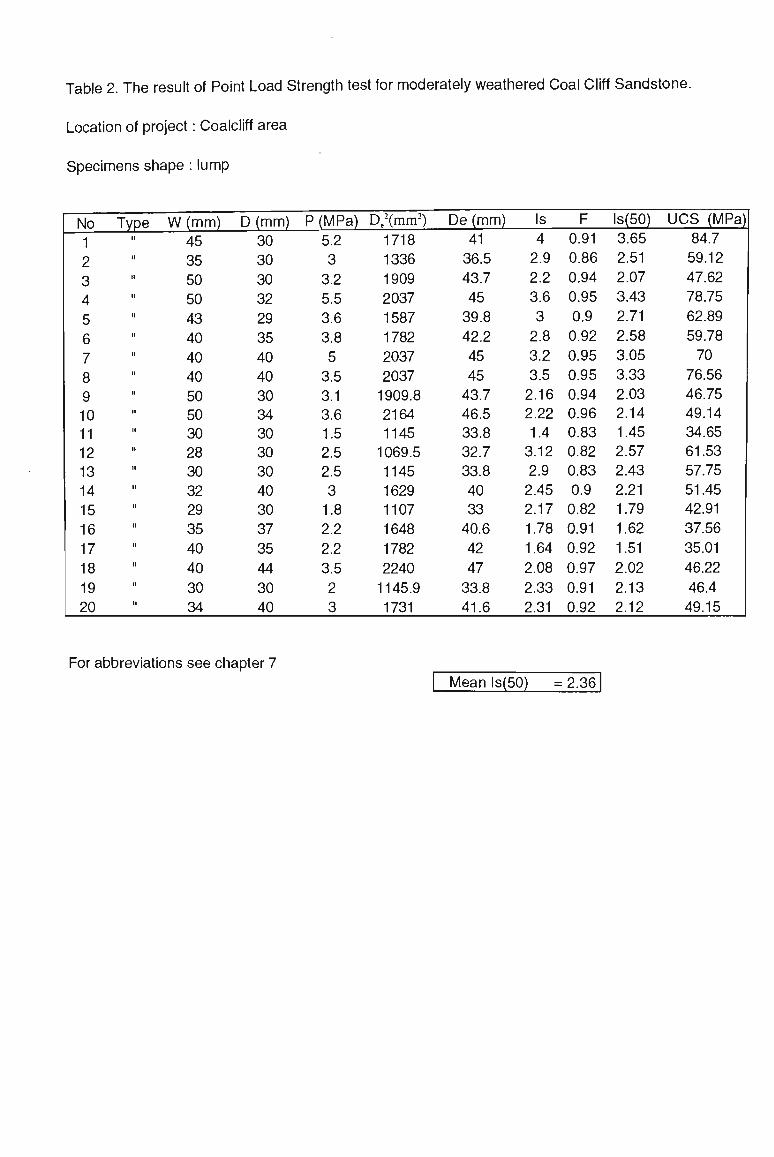
Table 2. The result of Point Load Strength test for moderately weathered Coal Cliff Sandstone.
Location of project: Coalcliff area
Specimens shape: lump
No Type W (mm)
1 2 3 4 5 6 7 8 9 10 11 12 13 14 15 16 17 18 19 20
45 35 50 50 43 40 40 40 50 50 30 28 30 32 29 35 40 40 30 34
D (mm) 30 30 30 32 29 35 40 40 30 34 30 30 30 40 30 37 35 44 30 40
P (MPa) 5.2 3 3.2 5.5 3.6 3.8 5 3.5 3.1 3.6 1.5 2.5 2.5 3 1.8 2.2 2.2 3.5 2 3
De2(mnr)
1718
1336
1909
2037
1587
1782
2037
2037 1909.8 2164 1145 1069.5 1145 1629 1107
1648
1782
2240
1145.9 1731
De (mm)
41 36.5
43.7
45 39.8
42.2
45 45 43.7 46.5 33.8 32.7 33.8 40 33 40.6
42 47 33.8
41.6
Is 4 2.9 2.2 3.6 3 2.8 3.2 3.5 2.16 2.22 1.4 3.12 2.9 2.45 2.17
1.78
1.64
2.08
2.33
2.31
F 0.91 0.86
0.94
0.95
0.9 0.92
0.95
0.95
0.94 0.96 0.83 0.82 0.83
0.9 0.82
0.91
0.92
0.97
0.91
0.92
ls(50) 3.65
2.51
2.07
3.43
2.71
2.58
3.05
3.33
2.03 2.14 1.45 2.57
2.43 2.21 1.79
1.62
1.51
2.02
2.13
2.12
U C S (MPa) 84.7
59.12
47.62
78.75
62.89
59.78 70
76.56 46.75 49.14 34.65 61.53
57.75 51.45 42.91
37.56
35.01
46.22
46.4 49.15
For abbreviations see chapter 7 Mean ls(50) = 2.36
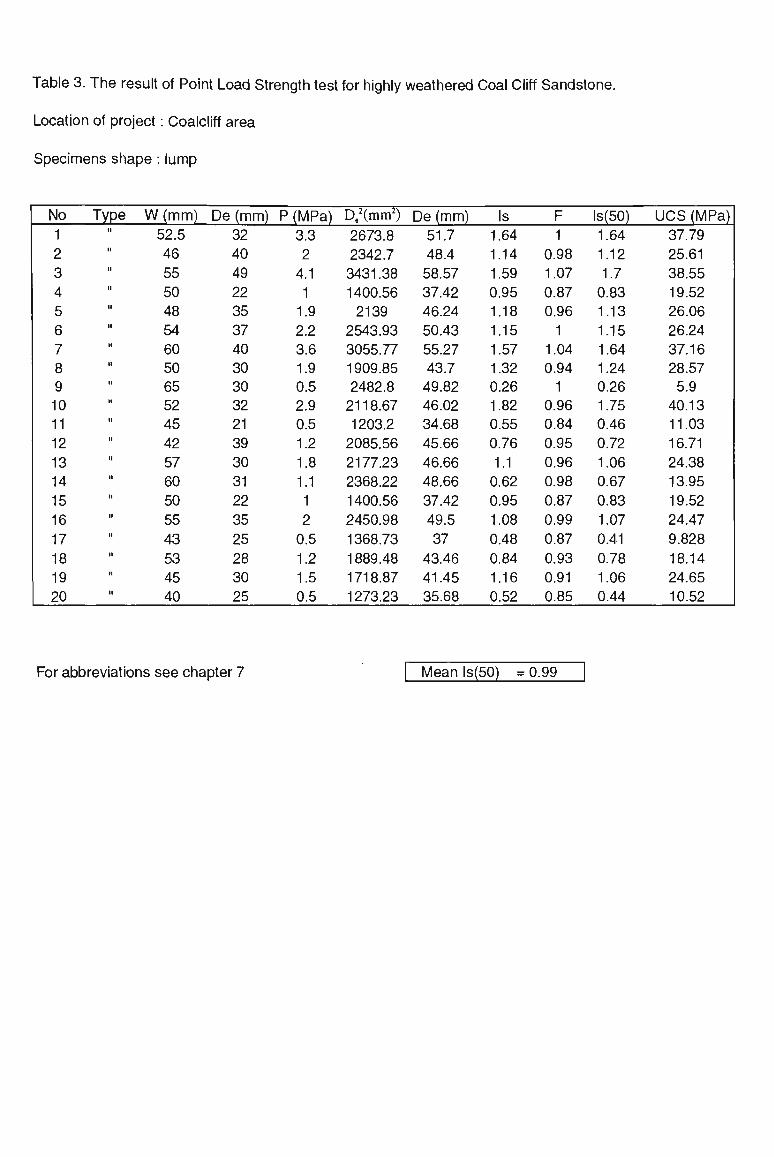
Table 3. The result of Point Load Strength test for highly weathered Coal Cliff Sandstone.
Location of project: Coalcliff area
Specimens shape : lump
No 1 2 3 4 5 6 7 8 9 10 11 12 13 14 15 16 17 18 19 20
Type u
li
ll
n
ll
ll
II
II
u
n
n
M
II
II
II
II
II
II
II
II
W(mm) 52.5
46 55 50 48 54 60 50 65 52 45 42 57 60 50 55 43 53 45 40
De (mm)
32 40 49 22 35 37 40 30 30 32 21 39 30 31 22 35 25 28 30 25
P (MPa)
3.3 2 4.1 1 1.9 2.2 3.6 1.9 0.5 2.9 0.5 1.2 1.8 1.1 1 2 0.5 1.2 1.5 0.5
De2(mm2)
2673.8
2342.7
3431.38
1400.56
2139
2543.93
3055.77
1909.85
2482.8
2118.67
1203.2
2085.56
2177.23
2368.22
1400.56
2450.98
1368.73
1889.48
1718.87
1273.23
De (mm)
51.7
48.4
58.57
37.42
46.24
50.43
55.27
43.7
49.82
46.02
34.68
45.66
46.66
48.66
37.42
49.5
37 43.46
41.45
35.68
Is 1.64
1.14
1.59
0.95
1.18
1.15
1.57
1.32
0.26
1.82
0.55
0.76
1.1 0.62
0.95
1.08
0.48
0.84
1.16
0.52
F 1
0.98
1.07
0.87
0.96
1 1.04
0.94
1 0.96
0.84
0.95
0.96
0.98
0.87
0.99
0.87
0.93
0.91
0.85
ls(50)
1.64 1.12 1.7 0.83 1.13 1.15 1.64 1.24 0.26 1.75 0.46 0.72 1.06 0.67 0.83 1.07
0.41 0.78 1.06 0.44
UC S (MPa)
37.79
25.61
38.55
19.52
26.06
26.24
37.16
28.57
5.9 40.13
11.03
16.71
24.38
13.95
19.52
24.47
9.828
18.14
24.65
10.52
For abbreviations see chapter 7 Mean ls(50) = 0.99
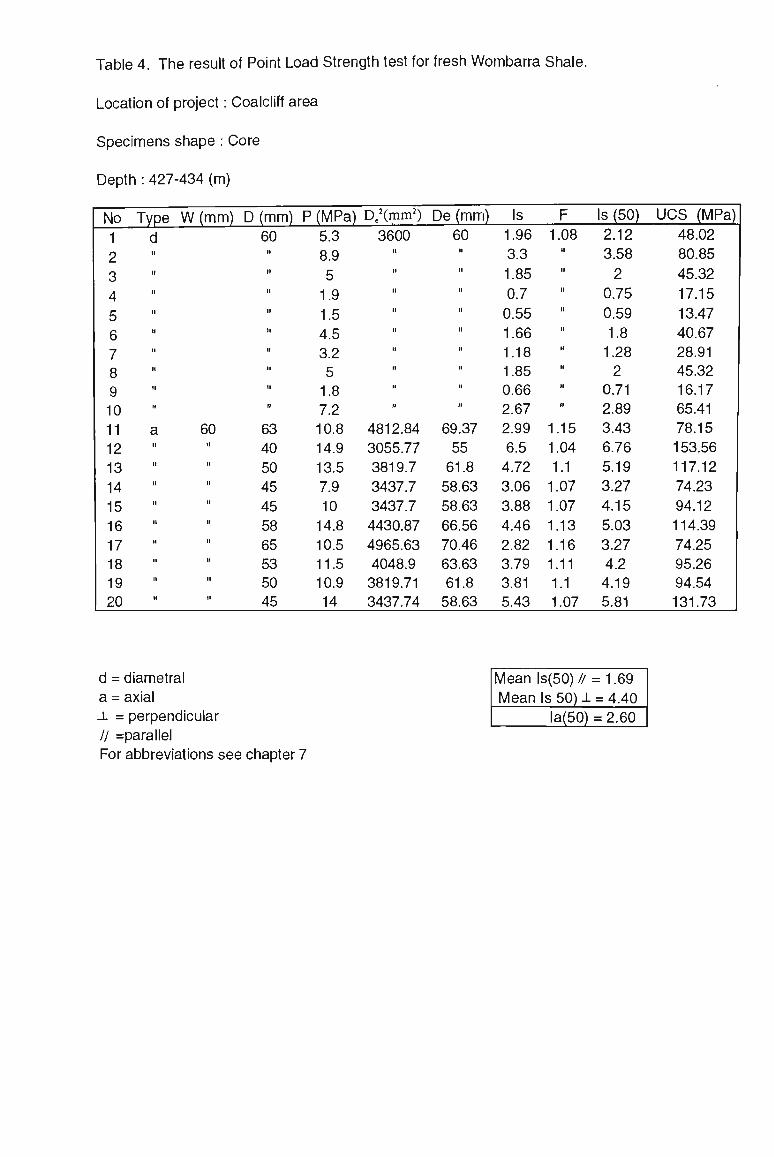
Table 4. The result of Point Load Strength test for fresh Wombarra Shale.
Location of project: Coalcliff area
Specimens shape : Core
Depth : 427-434 (m)
No Type W (mm) D (mm) P (MPa) D.2(mm2) De (mm) Is
1
2
3
4
5 6 7 8 9 10
11 12 13
14 15
16 17 18 19 20
Is (50) UCS (MPa)
60
60 63 40 50
45
45
58 65 53 50 45
5.3 8.9
5
1.9
1.5 4.5 3.2 5 1.8 7.2 10.8 14.9
13.5
7.9 10
14.8
10.5 11.5 10.9 14
3600 60
4812.84
3055.77 3819.7
3437.7
3437.7
4430.87
4965.63 4048.9 3819.71 3437.74
69.37 55
61.8
58.63 58.63
66.56
70.46 63.63 61.8 58.63
1.96
3.3 1.85
0.7 0.55
1.66 1.18 1.85 0.66 2.67
2.99
6.5 4.72
3.06
3.88
4.46
2.82 3.79 3.81 5.43
1.08 ll
ll
ll
ll
II
ll
ll
ll
ll
1.15 1.04
1.1 1.07
1.07
1.13 1.16 1.11 1.1 1.07
2.12 3.58
2 0.75
0.59
1.8 1.28 2
0.71 2.89 3.43
6.76
5.19
3.27
4.15
5.03
3.27 4.2 4.19 5.81
48.02 80.85
45.32
17.15
13.47
40.67 28.91 45.32 16.17 65.41 78.15
153.56
117.12
74.23
94.12
114.39
74.25 95.26 94.54 131.73
d = diametral a = axial J- = perpendicular // =parallel For abbreviations see chapter 7
Mean ls(50) // = 1.69
Mean Is 50) J. = 4.40
la(50) = 2.60
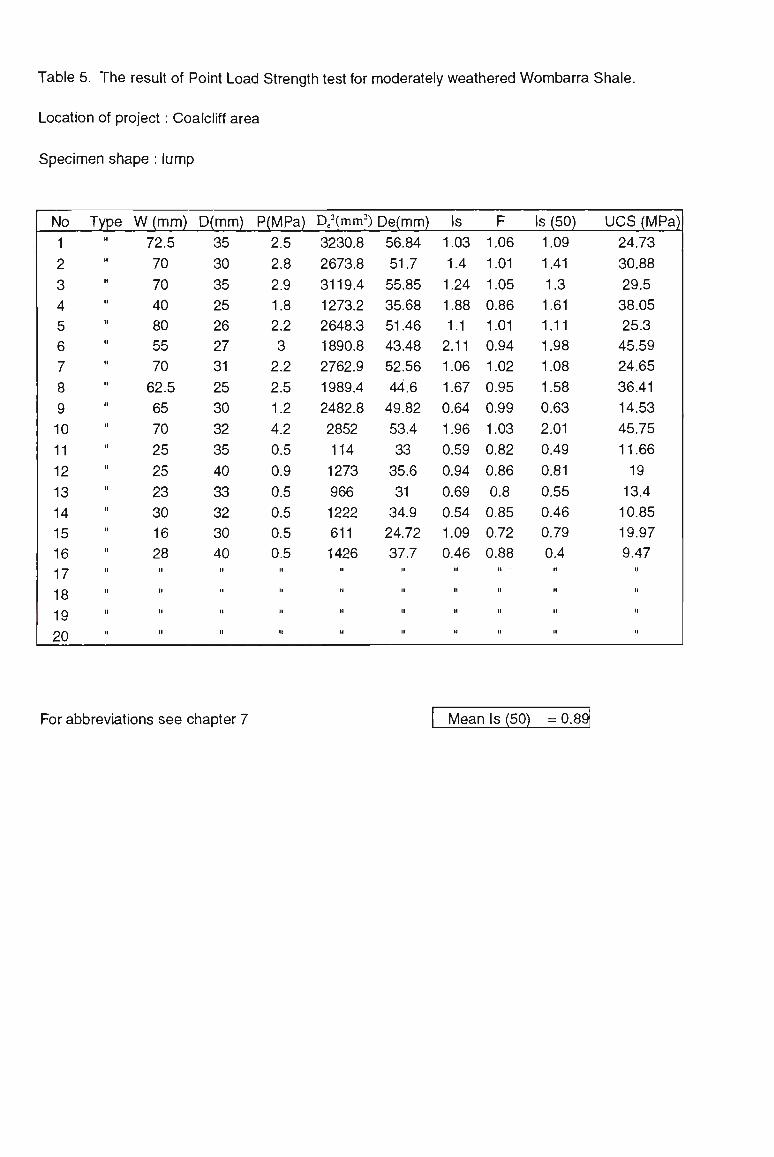
Table 5. The result of Point Load Strength test for moderately weathered Wombarra Shale.
Location of project: Coalcliff area
Specimen shape: lump
No 1 2 3 4 5 6 7 8 9 10 11 12 13 14 15 16 17 18 19 20
Type W (mm)
72.5 70 70 40 80 55 70 62.5 65 70 25 25 23 30 16 28
it ll
ll ll
ll li
ll n
D(mm)
35 30 35 25 26 27 31 25 30 32 35 40 33 32 30 40 II
II
II
II
P(MPa)
2.5 2.8 2.9 1.8 2.2 3 2.2 2.5 1.2 4.2 0.5 0.9 0.5 0.5 0.5 0.5
ll
u
il
N
D>ra!)
3230.8
2673.8
3119.4
1273.2
2648.3
1890.8
2762.9
1989.4
2482.8
2852
114 1273
966 1222
611 1426
ll
ll
ll
u
De(mm)
56.84
51.7
55.85
35.68
51.46
43.48
52.56
44.6
49.82
53.4
33 35.6
31 34.9
24.72
37.7 il
ll
II
n
Is 1.03
1.4 1.24
1.88
1.1 2.11
1.06
1.67
0.64
1.96
0.59
0.94
0.69
0.54
1.09
0.46 II
it
ll
II
F 1.06
1.01
1.05
0.86
1.01
0.94
1.02
0.95
0.99
1.03
0.82
0.86
0.8 0.85
0.72
0.88 n
it
n
it
Is (50)
1.09
1.41
1.3 1.61
1.11
1.98
1.08
1.58
0.63
2.01
0.49
0.81
0.55
0.46
0.79
0.4 it
n
ll
n
UCS (MPa)
24.73
30.88
29.5
38.05
25.3
45.59
24.65
36.41
14.53
45.75
11.66
19 13.4
10.85
19.97
9.47 it
it
it
it
For abbreviations see chapter 7 Mean Is (50) = 0.89J
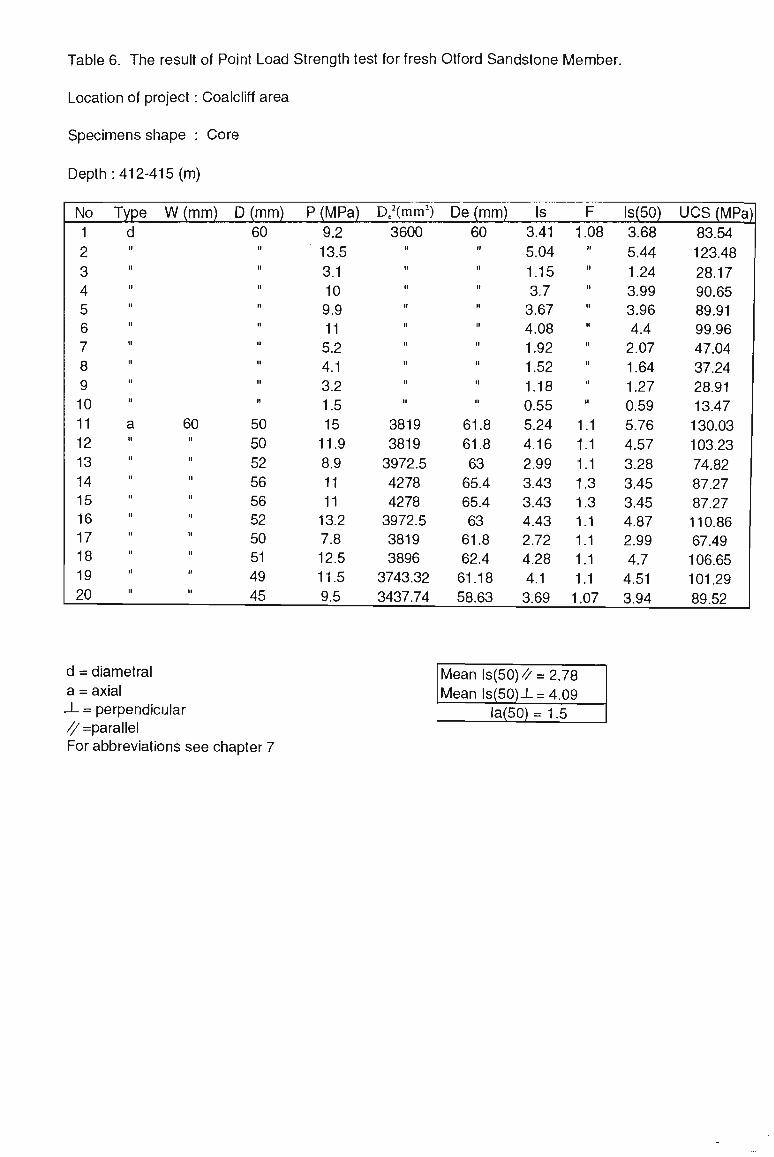
Table 6. The result of Point Load Strength
Location of project: Coalcliff area
Specimens shape : Core
Depth: 412-415 (m)
No Type W ( m m ) D (mm) P (MPa) 1 d 2 3 4 5 6 7 8 9 10 11 a
12 13 14 15 16 17 18 19 20
60 ll
ll
ll
ll
li
It
ll
ll
It
60 ll
ll
u
n
it
it
n
it
tl
50 50 52 56 56 52 50 51 49 45
9.2 13.5
3.1 10 9.9 11 5.2 4.1 3.2 1.5 15 11.9
8.9 11 11 13.2
7.8 12.5
11.5
9.5
d = diametral a = axial J- = perpendicular // =parallel For abbreviations see chapter 7
for fresh Otford Sandstone Member.
De2(mnr) De (mm) Is F ls(50) U C S (MPa) 3600
u
II
u
n
II
n
n
n
II
3819
3819
3972.5
4278
4278
3972.5
3819
3896
3743.32
3437.74
60 it
ll
ll
li
ll
ll
ll
ll
li
61.8
61.8
63 65.4
65.4
63 61.8
62.4
61.18
58.63
3.41
5.04
1.15
3.7 3.67
4.08
1.92
1.52
1.18
0.55
5.24
4.16
2.99
3.43
3.43
4.43
2.72
4.28
4.1 3.69
1.08 ft
ll
ll
II
ll
ll
ll
ll
ll
1.1 1.1 1.1 1.3 1.3 1.1 1.1 1.1 1.1 1.07
3.68
5.44
1.24
3.99
3.96
4.4 2.07
1.64
1.27
0.59
5.76
4.57
3.28
3.45
3.45
4.87
2.99
4.7 4.51
3.94
83.54
123.48
28.17
90.65
89.91
99.96
47.04
37.24
28.91
13.47
130.03
103.23
74.82
87.27
87.27
110.86
67.49
106.65
101.29
89.52
Mean ls(50)^ = 2.78 Mean ls(50)-L= 4,09
la(50) = 1.5

Table 7. The result of Point Load Strength test for
Location of project: Coalcliff area
Specimens shape: lump
No Type W (mm) D (mm) P (MPa) De2(mm2)
1 2 3 4 5 6 7 8 9 10 11 12 13 14 15 16 17 18 19 20
60 76 55 66 65 55 60 55 73 63 40 35 35 40 35 44 37 40 40 35
35 30 40 40 36 35 37 40 40 25 35 35 25 40 45 38 30 40 34 30
3.2 3.5 4.2 3.9 4.8 3.8 4 3.8 12.2 2.6 1.6 1.9 1.8 1 2.6 3.6 1.8 2 8.5 2.2
2673.8 2902.98 2801.12 3361.35 2979.38 2450.98 2826.59
2801.12 3717.85 2005.35 1782.5
1559.7 1114 2037 2005 2128 1413.9 2037 1731 1336.9
For abbreviations see chapter 7
weathered Otford Sandstone Member.
De(mm) Is F ls(50) UCS (MPa) 51.7 53.87 52.92 57.97 54.58 49.5 53.16
52.92 60.97 44.78
42 39 33 45 44.7 46 37.5 45 41.6 36.5
1.59 1.61 2
1.54 2.15 2.07 1.88 1.81 4.38 1.73 1.19
1.62
2.15 0.65 1.73 2.25 1.7 1.31
6.55 2.19
1.01
1.01 1.02 1.06 1.04 0.99 1.02
1.02 1.09 0.95
0.92 0.89
0.82 0.95 0.95 0.96 0.87 0.95 0.92 0.92
1.61
1.66 2.04 1.63 2.23 2.04 1.91 1.84 4.77 1.64 1.1 1.44
1.78 0.61 1.64 2.16 1.49 1.24 6.02 2.01
36.64
37.71 46.52 37.18 50.63 46.91 43.8
42.1 108.05 37.77 25.4
33.73
42.51 14.21 37.75 49.61 34.95 28.65
139.38 44.64
Mean ls(50) = 1.67
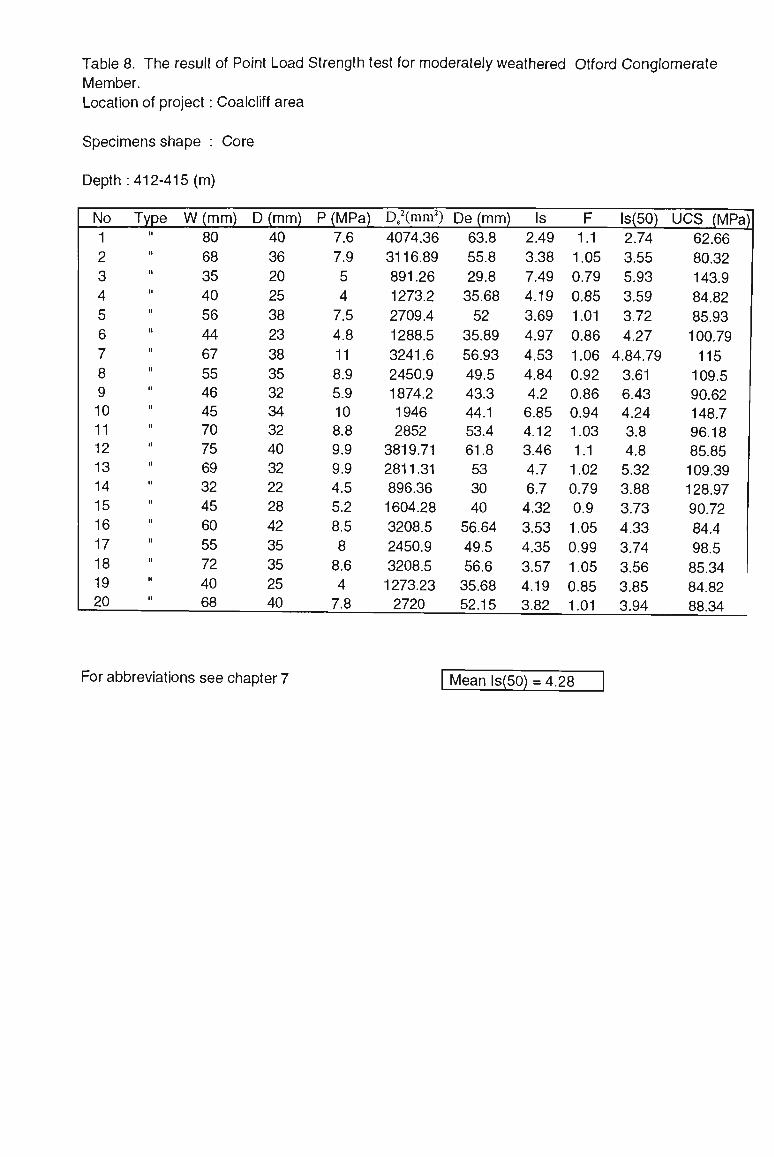
Table 8. The result of Point Load Strength test for moderately weathered Otford Conglomerate
Member.
Location of project: Coalcliff area
Specimens shape : Core
Depth : 412-415 (m)
No Type W (mm)
1 2 3 4 5 6 7 8 9 10 11 12 13 14 15 16 17 18 19 20
80 68 35 40 56 44 67 55 46 45 70 75 69 32 45 60 55 72 40 68
D(mm)
40 36 20 25 38 23 38 35 32 34 32 40 32 22 28 42 35 35 25 40
P (MPa)
7.6 7.9 5 4 7.5 4.8 11 8.9 5.9 10 8.8 9.9 9.9 4.5 5.2 8.5 8 8.6 4 7.8
De2(mm2)
4074.36
3116.89
891.26
1273.2
2709.4
1288.5
3241.6 2450.9 1874.2 1946 2852
3819.71 2811.31 896.36 1604.28
3208.5
2450.9
3208.5 1273.23 2720
De (mm)
63.8
55.8
29.8
35.68
52 35.89
56.93
49.5 43.3 44.1 53.4 61.8
53 30 40
56.64
49.5
56.6 35.68 52.15
Is 2.49
3.38
7.49
4.19
3.69
4.97
4.53 4.84 4.2 6.85 4.12 3.46
4.7 6.7 4.32
3.53
4.35
3.57 4.19 3.82
F 1.1 1.05
0.79
0.85
1.01
0.86
1.06
0.92 0.86 0.94 1.03 1.1 1.02 0.79
0.9 1.05
0.99
1.05
0.85 1.01
ls(50)
2.74
3.55
5.93
3.59
3.72
4.27
4.84.79 3.61 6.43 4.24 3.8 4.8 5.32 3.88
3.73
4.33
3.74
3.56
3.85 3.94
UCS (MPa) 62.66
80.32
143.9 84.82
85.93
100.79
115 109.5 90.62 148.7 96.18 85.85 109.39 128.97
90.72
84.4
98.5
85.34
84.82 88.34
For abbreviations see chapter 7 Mean ls(50) = 4.28

Table 9 . The result of Point Load Strength test for fresh Scarborough Sandstone.
Location of project: Coalcliff area
Specimens shape : Core
Depth : 397-402 (m)
No Type W (mm) D (mm) 1 d 60 2 3 4 5 6 7 8 9 10 11 < 12 13 14 15 16 17 18 19 20
i
i
l
l
1
i
l
l
l
1
l
i
l
l
i
i
i ti
a 60 52
46 50 47 48 49 50 47 47 42
P (MPa)
8.9 14.9
16 13.5
12 9 12 12 8.4 10 13 18.2
18.5
18.2
16.8
13 15.9
13 14.5
10
De2(mnr)
3600
3972.5
2760
3000
2820
2880
2940
3000
2820
2820
2520
De (mm)
60 n
n
il
li
ll
n
n
n
it
63.02
52.53
54.77
53.1
53.66
54.22
54.77
53.1
53.1
50.19
Is 3.3 5.52
5.93
5 4.45
3.33
5.34
4.45
3.11
3.7 4.37
8.8 8.2 8.6 7.79
5.9 7.07
6.15
6.86
5.29
F 1.08
n
ll
ll
ll
ll
ll
II
ll
tt
1.1 1.02
1.04
1.02
1.03
1.03
1.04
1.02
1.02
1
Is (50)
3.56
5.96
6.41
5.4 4.8 3.6 5.76
4.8 3.36
4 4.8 8.98
8.52
8.79
8.02
6.07
7.36
6.27
6.99
5.29
UCS(MPa)
80.85
135.24
145.28
122.5
109.02
81.58
130.83
109.02
76.19
90.65
109.37
204.09
193.39
186.34
182.21
138.58
166.74
143.24
159.78
120.52
d = diametral a = axial _L = perpendicular /^parallel For abbreviations see chapter 7
Mean ls(50)^ = 4.37 Mean ls(50)i-= 7.16
la (50) = 1.5

Table 10. The result of Point Load Strength test for moderately weathered Scarborough Sandstone.
Location of project: Coalcliff area
Specimen shape : lump
No Type W (mm) 1 2 3 4 5 6 7 8 9 10 11 12 13 14 15 16 17 18 19 20
60 50 60 60 70 60 60 60 45 65 36 33 40 40 50 40 60 50 45 45
D(mm) P(MPa) 30 33 40 40 50 40 60 50 45 35 35 43 40 35 40 35 30 35 45 40
8 7 6 7 5 4.5 7 10 7 6 3 2.5 2.4 3.2 3 2 3 3.4 3.5 2.5
De2(mra2)
2291.8
1650
3055
3055
4456.3
3055.7 4583.6 3819.7 2678.3 2896.6 1604.2 1806.7 2037 1782.5 2546.4
1782.5 2291.8 2228.1
2578.3 2291.8
De (mm)
47.87 40.62
55.27
55.27
66.75
55.27
67.7 61.8 50.7 53.8 40 42.5 45 42.2 50.4
42.2 47.87 47.2 50.7 47.8
Is 4.66 5.66
2.62
3.06
1.49
1.96
2.03 3.49 3.49 2.76 2.49
1.84 1.57 2.39
1.57
1.49 1.74 2.03 1.81
1.45
F 0.98
0.91 1.04
1.04
1.13
1.04
1.14 1.1 1.01 1.03 0.9 0.92 0.95
0.92 1
0.92 0.98
0.97 1 0.97
ls(50)
4.56
5.15
2.74
3.2 1.69
2.05
2.32 3.84 3.49 2.86 2.25 1.7 1.49
2.21 1.57
1.38
1.7 1.97 1.81
1.42
UCS (MPa)
104.04
119.46
62.01
72.43
38.26
46.38
52.46 86.59 79.82 64.61 51.82
39.6 34.33 51.1
35.82
31.86
38.93 45.18 41.39 32.42
For abbreviations see chapter 7 Mean ls(50) = 2.38
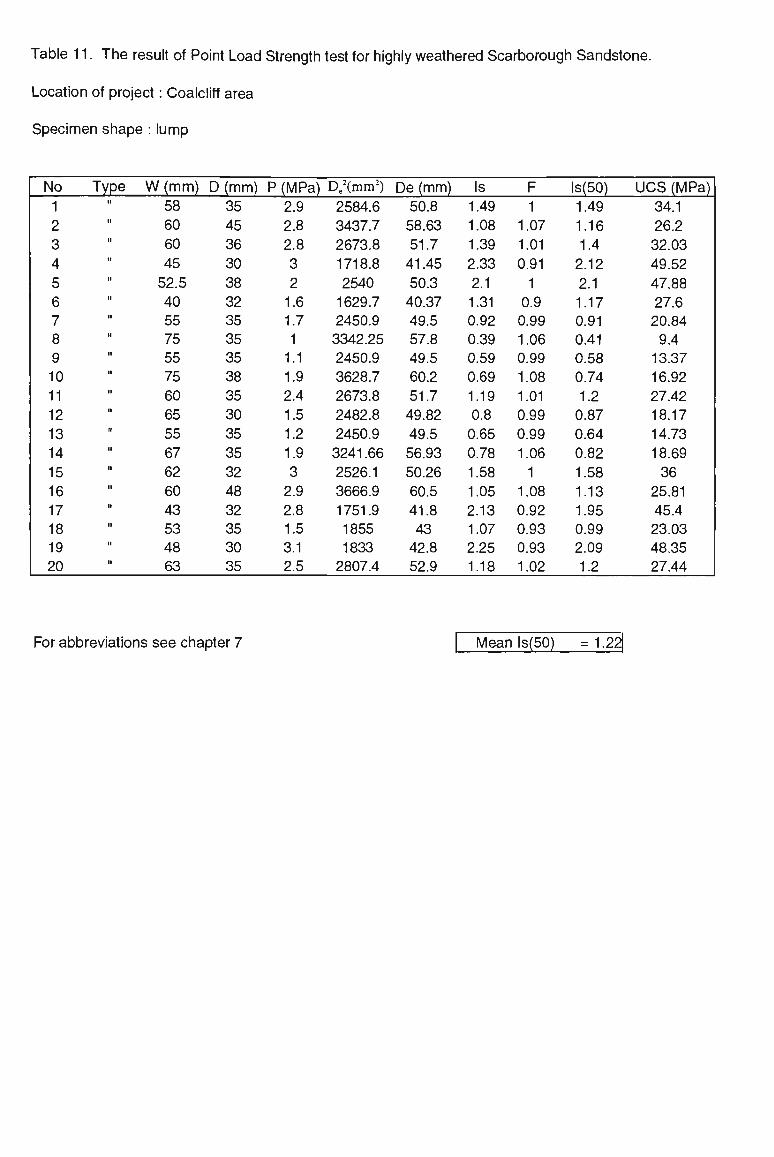
Table 11. The result of Point Load Strength test for highly weathered Scarborough Sandstone.
Location of project: Coalcliff area
Specimen shape: lump
No 1 2 3 4 5 6 7 8 9 10 11 12 13 14 15 16 17 18 19 20
Type u
,, n
M
H
II
II
II
II
II
II
II
If
II
" II
II
II
II
"
W(mm) 58 60 60 45 52.5
40 55 75 55 75 60 65 55 67 62 60 43 53 48 63
D(mm)
35 45 36 30 38 32 35 35 35 38 35 30 35 35 32 48 32 35 30 35
P (MPa)
2.9 2.8 2.8 3 2 1.6 1.7 1 1.1 1.9 2.4 1.5 1.2 1.9 3 2.9 2.8 1.5 3.1 2.5
De2(mm2)
2584.6
3437.7
2673.8
1718.8
2540
1629.7
2450.9
3342.25
2450.9
3628.7
2673.8
2482.8
2450.9
3241.66
2526.1
3666.9
1751.9
1855
1833
2807.4
De (mm)
50.8
58.63
51.7
41.45
50.3
40.37
49.5
57.8
49.5
60.2
51.7
49.82
49.5
56.93
50.26
60.5
41.8
43 42.8
52.9
Is 1.49
1.08
1.39
2.33
2.1 1.31
0.92
0.39
0.59
0.69
1.19
0.8 0.65
0.78
1.58
1.05
2.13
1.07
2.25
1.18
F 1
1.07
1.01
0.91
1 0.9 0.99
1.06
0.99
1.08
1.01
0.99
0.99
1.06
1 1.08
0.92
0.93
0.93
1.02
ls(50)
1.49
1.16
1.4 2.12
2.1 1.17
0.91
0.41
0.58
0.74
1.2 0.87
0.64
0.82
1.58
1.13
1.95
0.99
2.09
1.2
UCS (MPa)
34.1
26.2
32.03
49.52
47.88
27.6
20.84
9.4 13.37
16.92
27.42
18.17
14.73
18.69
36 25.81
45.4
23.03
48.35
27.44
For abbreviations see chapter 7 Meanls(50) =1.22
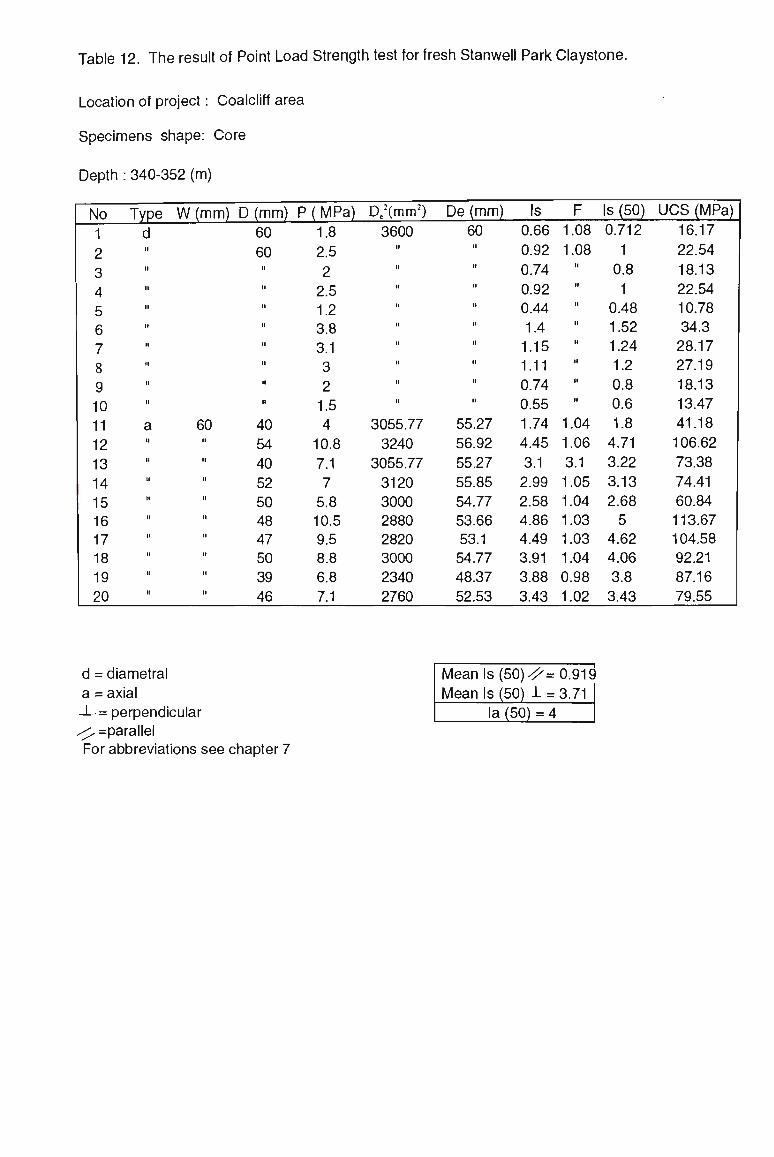
Table 12. The result of Point Load Strength test for fresh Stanwell Park Claystone.
Location of project: Coalcliff area
Specimens shape: Core
Depth : 340-352 (m)
No 1 2 3 4 5 6 7 8 9 10 11 12 13 14 15 16 17 18 19 20
Type
d n
II
II
it
n
n
n
n
it
a II
II
n
II
n
n
n
II
n
d = diametral a = a
J-=F
W(mm)
60
xial >erpendicular
D(mm) 60 60
40 54 40 52 50 48 47 50 39 46
P (MPa) 1.8 2.5 2 2.5 1.2 3.8 3.1 3 2 1.5 4
10.8
7.1 7 5.8 10.5 9.5 8.8 6.8 7.1
De2(mm2)
3600
3055.77
3240
3055.77
3120 3000 2880 2820 3000 2340
2760
De (mm)
60 ll
ll
n
n
II
II
il
n
li
55.27
56.92
55.27
55.85 54.77 53.66 53.1 54.77
48.37 52.53
Is 0.66
0.92
0.74
0.92 0.44 1.4 1.15 1.11
0.74 0.55 1.74
4.45
3.1 2.99 2.58 4.86 4.49 3.91
3.88
3.43
Meanls(50)<^=
Mean Is (50) 1 = la (50) = 4
F 1.08
1.08 ll
II
n
II
it
it
n
n
1.04 1.06
3.1 1.05
1.04 1.03 1.03 1.04
0.98
1.02
0.91S
3.71
Is (50)
0.712
1 0.8 1
0.48 1.52 1.24 1.2 0.8 0.6 1.8 4.71
3.22
3.13 2.68 5
4.62 4.06
3.8 3.43
U C S (MPa)
16.17
22.54
18.13
22.54 10.78 34.3 28.17 27.19
18.13 13.47
41.18
106.62
73.38
74.41
60.84 113.67 104.58 92.21 87.16
79.55
^ =parallel For abbreviations see chapter 7
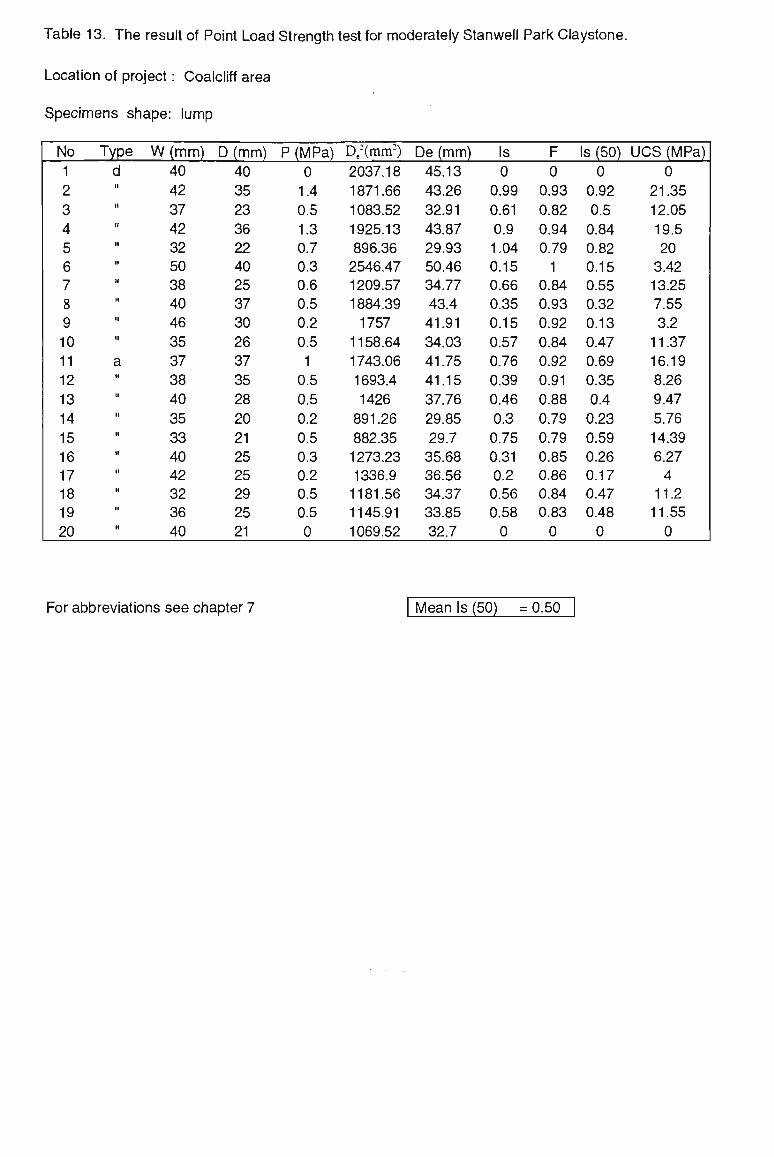
Table 13. The result of Point Load Strength test for moderately Stanwell Park Claystone.
Location of project: Coalcliff area
Specimens shape: lump
No 1 2 3 4 5 6 7 8 9 10 11 12 13 14 15 16 17 18 19 20
Type d
i
i
1
t
t
i
t
i
1
i
a i
' i
i
i
t
i
i
II
W(mm) 40 42 37 42 32 50 38 40 46 35 37 38 40 35 33 40 42 32 36 40
D (mm) 40 35 23 36 22 40 25 37 30 26 37 35 28 20 21 25 25 29 25 21
P (MPa)
0 1.4 0.5 1.3 0.7 0.3 0.6 0.5 0.2 0.5 1 0.5 0.5 0.2 0.5 0.3 0.2 0.5 0.5 0
D;(mm2)
2037.18
1871.66
1083.52
1925.13
896.36
2546.47
1209.57
1884.39
1757
1158.64
1743.06
1693.4
1426
891.26
882.35
1273.23
1336.9
1181.56
1145.91
1069.52
De (mm)
45.13
43.26
32.91
43.87
29.93
50.46
34.77
43.4
41.91
34.03
41.75
41.15
37.76
29.85
29.7
35.68
36.56
34.37
33.85
32.7
Is 0
0.99
0.61
0.9 1.04
0.15
0.66
0.35
0.15
0.57
0.76
0.39
0.46
0.3 0.75
0.31
0.2 0.56
0.58
0
F 0
0.93
0.82
0.94
0.79
1 0.84
0.93
0.92
0.84
0.92
0.91
0.88
0.79
0.79
0.85
0.86
0.84
0.83
0
Is (50) UCS (MPa)
0 0.92
0.5 0.84
0.82
0.15
0.55
0.32
0.13
0.47
0.69
0.35
0.4 0.23
0.59
0.26
0.17
0.47
0.48
0
0 21.35
12.05
19.5
20 3.42
13.25
7.55
3.2 11.37
16.19
8.26
9.47
5.76
14.39
6.27
4 11.2
11.55
0
For abbreviations see chapter 7 Mean Is (50) = 0.50
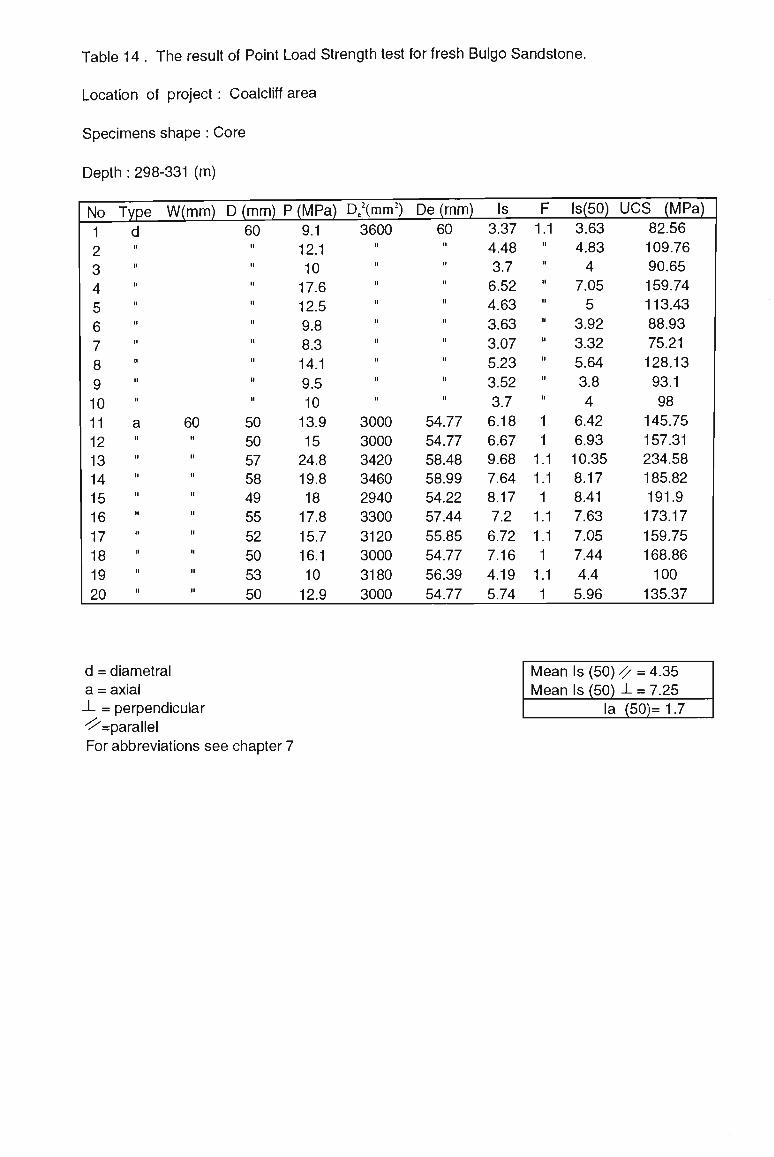
Table 14 . The result of Point Load Strength test for fresh Bulgo Sandstone.
Location of project: Coalcliff area
Specimens shape : Core
Depth : 298-331 (m)
No Type W(mm) D (mm) P (MPa) De2(mm2) De (mm)
1 d 60 9.1 3600 60
Is F ls(50) UCS (MPa)
2 3 4 5 6 7 8 9
10 11 12 13 14 15 16
17 18
19
20
60 50 50 57 58 49 55
52 50
53
50
12.1 10 17.6 12.5
9.8 8.3
14.1 9.5
10 13.9 15 24.8 19.8 18 17.8
15.7 16.1
10
12.9
3000 3000 3420 3460 2940 3300
3120 3000
3180
3000
54.77 54.77 58.48 58.99 54.22 57.44
55.85 54.77
56.39
54.77
3.37 4.48 3.7 6.52 4.63
3.63 3.07
5.23
3.52 3.7 6.18 6.67 9.68 7.64 8.17 7.2 6.72 7.16
4.19
5.74
1.1 n
ll
ll
ll
It
ll
ll
ll
it
1 1 1.1 1.1 1 1.1 1.1 1 1.1 1
3.63 4.83 4
7.05 5
3.92 3.32
5.64 3.8 4
6.42 6.93 10.35 8.17 8.41 7.63
7.05 7.44
4.4 5.96
82.56 109.76 90.65 159.74 113.43
88.93 75.21
128.13
93.1
98 145.75 157.31 234.58 185.82 191.9 173.17
159.75 168.86
100 135.37
d = diametral a = axial -L = perpendicular ' parallel For abbreviations see chapter 7
Mean Is (50) // = 4.35 Mean Is (50) -L = 7.25
la (50)= 1.7
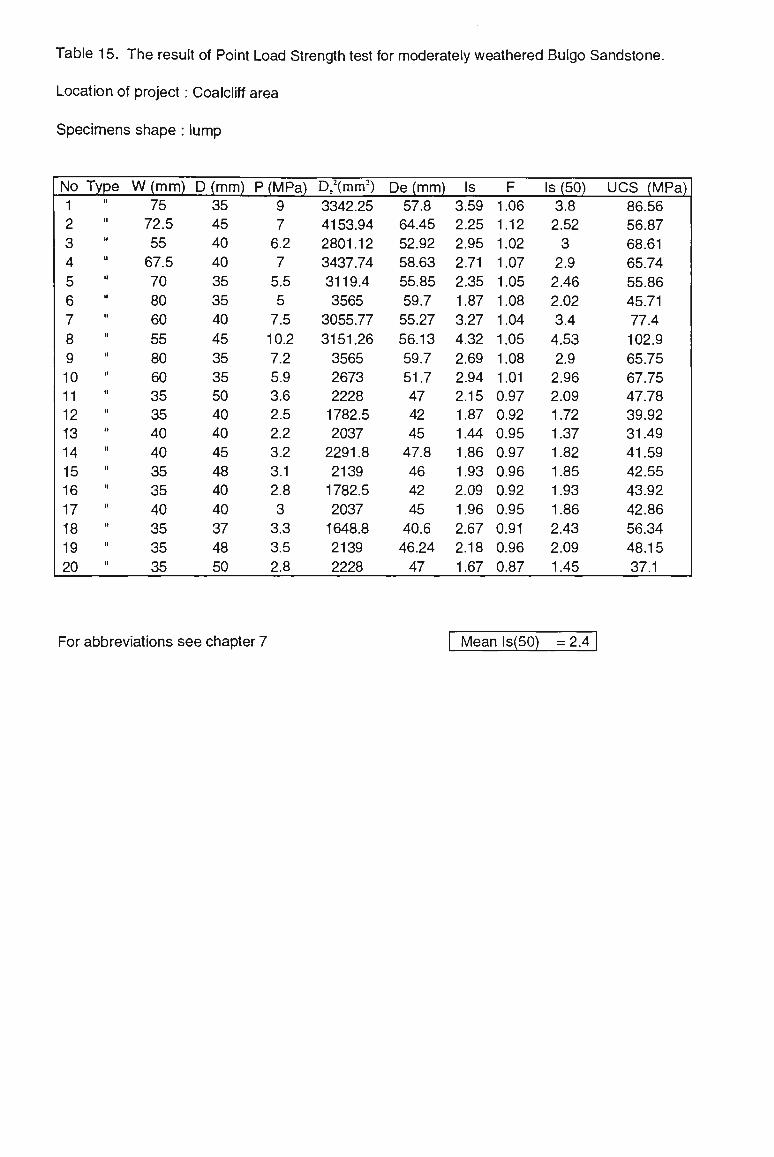
Table 15. The result of Point Load Strength test for moderately weathered Bulgo Sandstone.
Location of project: Coalcliff area
Specimens shape : lump
No 1 2 3 4 5 6 7 8 9 10 11 12 13 14 15 16 17 18 19 20
Type tl
it
li
n
II
n
n
u
n
it
n
it
u
n
n
n
II
» u
II
W (mrr
75 72.5
55 67.5
70 80 60 55 80 60 35 35 40 40 35 35 40 35 35 35
) D (mm) 35 45 40 40 35 35 40 45 35 35 50 40 40 45 48 40 40 37 48 50
P (MPa) 9 7 6.2 7 5.5 5 7.5 10.2
7.2 5.9 3.6 2.5 2.2 3.2 3.1 2.8 3 3.3 3.5 2.8
De2(mm2)
3342.25
4153.94
2801.12
3437.74
3119.4
3565
3055.77
3151.26
3565
2673
2228
1782.5
2037
2291.8
2139
1782.5
2037
1648.8
2139
2228
De (mm)
57.8
64.45
52.92
58.63
55.85
59.7
55.27
56.13
59.7
51.7
47 42 45 47.8
46 42 45 40.6
46.24
47
Is 3.59
2.25
2.95
2.71
2.35
1.87
3.27
4.32
2.69
2.94
2.15
1.87
1.44
1.86
1.93
2.09
1.96
2.67
2.18
1.67
F 1.06
1.12
1.02
1.07
1.05
1.08
1.04
1.05
1.08
1.01
0.97
0.92
0.95
0.97
0.96
0.92
0.95
0.91
0.96
0.87
Is (50)
3.8 2.52
3 2.9 2.46
2.02
3.4 4.53
2.9 2.96
2.09
1.72
1.37
1.82 1.85 1.93 1.86 2.43 2.09
1.45
UCS (MPa) 86.56 56.87 68.61 65.74 55.86 45.71 77.4
102.9 65.75 67.75 47.78 39.92 31.49 41.59 42.55 43.92 42.86 56.34 48.15
37.1
For abbreviations see chapter 7 Mean ls(50) = 2.4

Table 16. The result of Point Load Strength test for highly weathered Bulgo Sandstone.
Location of project: Coalcliff area
Specimens shape : lump
No Type W (mm)
1 2 3 4 5 6 7 8 9 10 11 12 13 14 15 16 17 18 19 20
40 40 60 60 60 50 30 58 65 40 50 60 60 70 60 70 40 50 65 60
D (mm)
25 30 40 30 40 40 30 36 40 30 32 50 35 40 40 45 30 38 30 50
P (MPa)
0.1 0.1 1.6 1.2 1.9 1.8 0.1 1.9 2.3 0.5 0.1 1.4 1.8 2.6 1.2 3.4 1.2 1 2.5 1
De (mm)
1273.23
1527.88 3055.77
2291.83
3055.77
2546.47
1145.91
2658.52 3310.42 1527.88 2037.18 3819.71
2673.8 3565.07
3055.7
4010.7
1527.88 2419.15
2482.8 3819.71
De2(mm2)
35.68
39 55.27
47.87
55.27
50.46
33.85
51.56 57.53 39 45.1 61.8
51.7 59.7
55.27 63.33
39.08
49.18
49.82 61.8
Is 0.1 0.08
0.7 0.7 0.83
0.94
0.1 0.95 0.92 0.43 0.06 0.49
0.89 0.97
0.52
1.13
1.04
0.55
1.34 0.34
F 0.85
0.89
1,04 0.98
1.04
1 0.83
1.01 1.06 0.89 0.95 1.1 1.01 1.08
1.04
1.1 0.89
0.99
0.99 1.1
Is (50)
0.08
0.07
0.72
0.68
0.86
0.94
0.08
0.95 0.97 0.38 0.05 0.53
0.9 1.05
0.54 1.24
0.93 0.54
1.32 0.37
U C S (MPa) 2.02
1.66 16.57
15.6
19.64
21.46
2 21.87 22.14 8.95 1.3
12.15
20.51 23.71
12.3 28.34
21.67 12.43 30.44 8.43
For abbreviations see chapter 7 Mean ls(50) = 0.65

APPENDIX TO CHAPTER 8
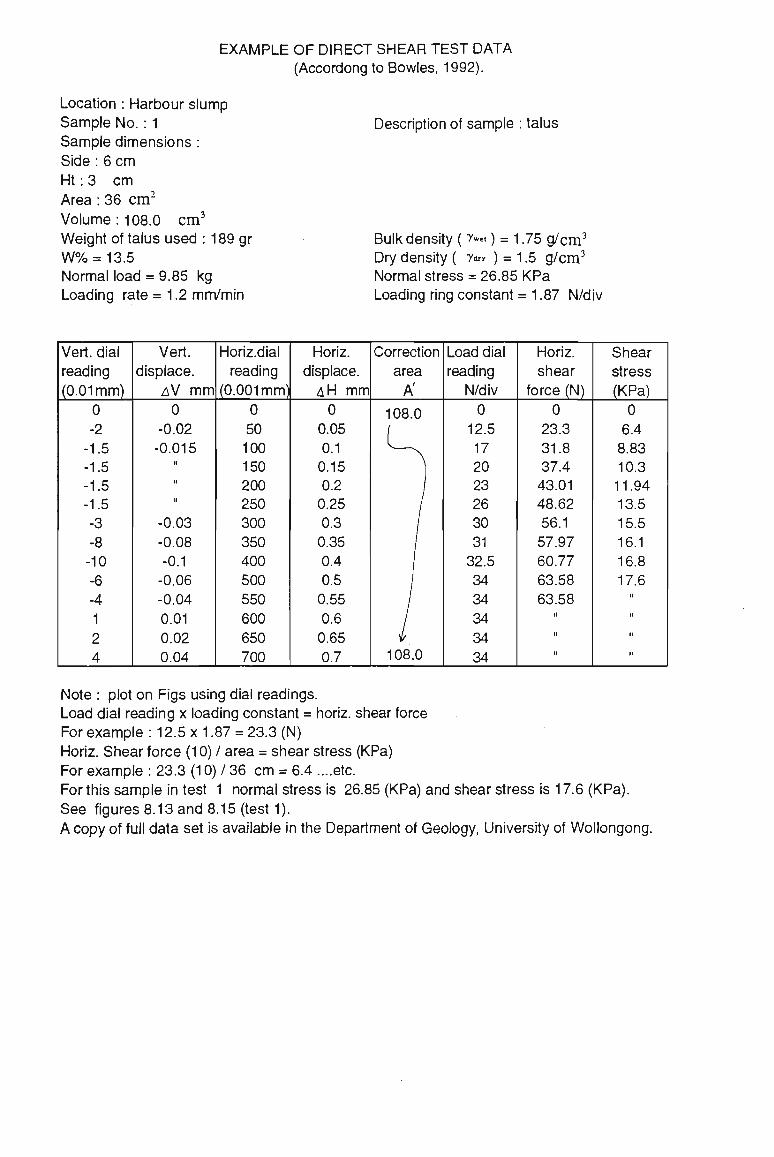
EXAMPLE OF DIRECT SHEAR TEST DATA (Accordong to Bowles, 1992).
Location : Harbour slump Sample No.: 1 Sample dimensions : Side: 6 cm Ht: 3 cm Area: 36 cm2
Volume: 108.0 cm3
Weight of talus used : 189 gr W % = 13.5 Normal load = 9.85 kg Loading rate = 1.2 mm/min
Description of sample : talus
Bulk density ( i w ) = 1.75 g/cm3
Dry density ( y^ ) = 1.5 g/cm3
Normal stress = 26.85 KPa Loading ring constant = 1.87 N/div
Vert, dial reading (0.01mm)
0 -2 -1.5 -1.5 -1.5 -1.5 -3 -8 -10 -6 -4 1 2 4
Vert. displace.
AV mm 0
-0.02 -0.015
n
II
if
-0.03 -0.08 -0.1 -0.06 -0.04
0.01
0.02 0.04
Horiz.dial reading
(0.001mm)
0 50 100 150 200 250 300 350 400 500 550 600 650 700
Horiz. displace. AH m m
0 0.05 0.1 0.15 0.2 0.25 0.3 0.35 0.4 0.5 0.55
0.6 0.65 0.7
Correction area
A'
108.0 [ ^ — x
] /
/
/
/
J I /
/
I 108.0
Load dial reading
N/div
0 12.5 17 20 23 26 30 31 32.5 34 34 34 34 34
Horiz. shear
force (N)
0 23.3 31.8 37.4 43.01 48.62 56.1 57.97 60.77 63.58 63.58
ll
ll
II
Shear stress (KPa)
0 6.4 8.83 10.3 11.94 13.5 15.5 16.1 16.8 17.6
n
n
n
ll
Note : plot on Figs using dial readings. Load dial reading x loading constant = horiz. shear force For example : 12.5 x 1.87 = 23.3 (N) Horiz. Shear force (10) / area = shear stress (KPa) For example : 23.3 (10) /36 cm = 6.4 ....etc. For this sample in test 1 normal stress is 26.85 (KPa) and shear stress is 17.6 (KPa). See figures 8.13 and 8.15 (test 1). A copy of full data set is available in the Department of Geology, University of Wollongong.

APPENDDC - SAMPLE LOCATIONS
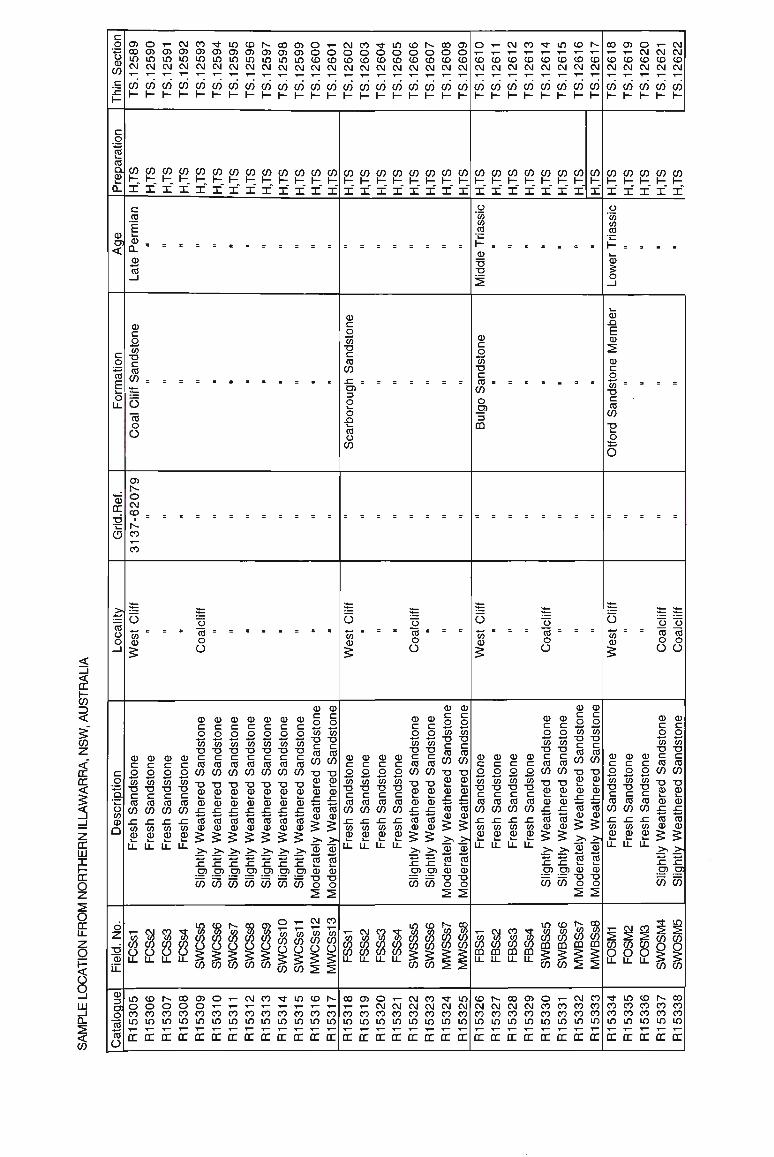
e»oi-cMcoTtincoi^coo)Oi-000)0)0)0)0)00)0)0)0)00 w v n i n m i n i n m w i n m w c o c o CMCMCMCMCMCMCMCMCMCMCMCMCVI COCOCOCOCOCOCOCOCOCOCOCOCO l-l-l-l-HI-l-l-HI-l-HI-
CMco'd-incoi^oocjj o o o o o o o o cocococococococo CMCMCMCMCMCMCMCM COCOCOCOCOCOCOCO l - l - H I - l - h - H H
O T - W C O ^ W C O S
cocococococococo C M C M C M C M C M C M C M C M
CO CO CO CO CO CO CO CO H H I- H H I- h-
00 CJ) O i- CM i- T - CM CM CM CO CO CO CO CO CM CM CM CM CM
CO CO CO CO CO I— 1— I— I— I—
C O C O C O C O C O C O C O C O C O C O C O C O C O
x* x* i x" x" x" x" x" x" x" x" x" x cocococococococo x" x" x" x" x" x" x" x"
CO CO CO CO CO CO CO I— j— J— I j— I— I
x" x" x x" x" x" x"
CO CO CO CO CO
x" x" x" x" x"
CO
E CD
a. 2 to
CD
c
ca
E n LL
co Tl c m CO
— u CO o o
CD C
o 4—'
CO TJ
c CO
CO SZ : CJ) O
o X> i_
CO
o CO
CD
c o to TJ
c CO .
CO
o O) CQ
CD
c o to TJ
c CO
CO TJ
o CJ)
O CM CO
I (-•
CO
co
CO D <
CO
CC
1 X LU
X
o z o X
3 a Q-< CO
> s o
co o <fl O CD
o CO
o O
O o CO = =
o O
o cfl = = o O
O o CO o O
o CO o O
CD CD CD
c c c o o o CO TJ c CO CO
CO TJ C7 Cfl CO
CO TJ r. CO CO
CO TJ c CO CO
CO CO CO CD CD CD i— * — l _
LL LL LL
0) 0) CD CD CD CD c c c cz c c o o o o o o CO CO CO CO CO CO T3 T3 TJ TJ -D T3 c c c c c c co co co co co co CO CO CO CO CO CO "D TJ T3 T3 T3 TJ CO CD CO 0) CD CD i— i — i — i — i — »—
CD CD CD CI) CO CD r r i: r r r *-* ••—' t— •*—• - ^ *-<
co co co co co co CD CD <D CO CD CO
CD 1= O (0 TJ c CO CO TJ CD CD -C - • — •
CO CD
5 55 55 5 Z >%>,>,>,>,>, -C sz j= .c -C .c D) Ol Ol D) O Ol Ui Ui (Ji Ui Ui (Ii
>.
sz CJ) CO
CD CD
c c CO CO
CO CO TJ TJ CD CD i— i _ CO CD
+-. *—>
CO CO
5 5 >< > CD CO
*_ i—
CD CD
O O
CD CD CD
c c c o o o *-. * - . • * - .
CO CO CO TJ TJ TJ C C C CO CO CO
Ui Ui Ui X XL X CO CO CO CD CD CD
CD C o CO TJ 1_ CO CO TJ CD
CD c n CO TJ 1-CO CO TJ CD
CD c O CO TJ c
m CO TJ CD CD XL
CD c o CO TJ
c CO TJ CD k— CD XL
CO CD C C o o
CD CD C C o o
LL LL
SZ SZ CO CO
tS tS CD CD CO CO •-> •-> CD CD S >
55 >,> >< ^ B B x: xr g) g) CO CO
CD C
o * CO TJ
CD CD
5 O O O CO CO " CO CO "
TJ TJ C C CO CO
CO CO
CO CO
CO
CO J= XL CO CO CD CD
TJ CD i_
CD XL CO CD
LL LL LL LL
CO CO CD CD
55 £ $• >. >i ^•^B B ^ f= « cfl
CD CD
c c
2 2 to CO TJ TJ c c CO CO
CO CO sz sz sz CO CO CO CD CD CD 1 — » — 1 —
U_ LL. Li-
CD CO TJ TJ
o o
SZ SZ O) O)
co co CO CD TJ TJ O O
CO CD
c c
2 2 to o) TJ TJ
c c CO CO
CO CO TJ TJ CO Q] i— i _
CD CD SZ sz +—. •*—I
Cfl Cfl CD CD
55 >> > SZ O) O) CO CO ft $ .. . w
K K K K I CO CO CO CO CO g; g
O i- CM CO
CO co co co
cB cB co co O O O O
5 5 5 5
in co r*» oo
rr\ m m rr> BE? SET —* •*»
CO CO
CQ CO CQ CQ LL
Ui Ui Ui
p p p
CO CO
II CO CO
i n c oNOfflOi-wntiocoN O O O O O T — 1— T-T— 1— T-T-1— cococococococococococococo l o i o u i i o i n i o i o i a i o m i o m m
O O O J O - ^ C M C O ^ W I - T - C M C M C M C M C M C M
cocococococococo m m m m m m m i n
! O N c o o ) O r - c \ i n C M C M C M C M C O C O C O C O
c o c o c o c o c o c o c o c o i n i o i n i a n i n i o m
* m co s oo co co co co co co co co co co in w in m m x x x x x x x x x x x x x X X X X X X X X x x x x x x x x X X X X X

g UJ
8 CD
o
CD C
o CO TJ c Cfl = CO O O)
CO
CD c o CO TJ
c CO CO sz = = O) 3 o k_
o XJ k—
CO o CO
0) c o 10 TJ
c CO CO x: CD "J O k-
o n cfl o C/J
CO
CO
co
CD
— I
X CO-
<
2 < X X
I X LU
X p
p X LL Q
X X
o
I LU _]
0.
2
CO
•21°-co D)
c o
o to CD
CO
D) 3 O = k-
o XJ
CO x: CD 3 O i_
o X) 1—
cfl o CO
CO CD C C O O
l_
Q
CJ 10 ID CJ
10 TJ r CO CO TJ CI) CD SZ CO CD
Cfl TJ c cfl CO TJ CD CD x: cfl CD
cn TJ r. CO CO TJ OJ CD .r. CO CD
0)
c o —— CO TJ
c CO
CO CO
CD CD
CO CD
5 5 5 5 5
CD cfl IT CO ^ L_
CD r cfl ID
CD CO c CO n cn u. CD .c: CO a)
CD CO r co TJ 0) k-
Cl) r CO CD
5 55 >. CD
ca
>* CI) CO
>> CD CO
CD CD CD CD CD C C C C C
O O O O O
a) CO
sz Ui sz CO CD
0) _CD CO CO
x: sz Ui Ui sz sz CO (0 CD CD
aj a) CO CO
sz sz
ui cn X sz CO CO CD CD
>> >. X X u> gj
X I
sz sz g> g X X
CO CD TJ TJ O O
2 2
LL LL LL LL LL
CD CD CD CD CL CZ CZ CL O O O O 4-» 4-* *— 4-<
CO CO CO CO TJ TJ TJ TJ C C C C CO CO Cfl CO
CO CO CO CO x: x: x: x: co co to co CO CD CD CD k_ k. k_ k-
LL LL LL LL
CO CO CO CO CO TJ TJ TJ TJ TJ C C C C C Cfl CO CO CO CO
CO CO CO CO CO
CD 0) C C O O 4-» 4-1
CO CO TJ TJ C C CO CO
co co c c
CD CD
c c O O 4W 4— 10 CO TJ TJ
c c co ca CO Cfl c c
TJ TJ CD CD L_ k_
CD CD XL X CO ffl CD CD
55 >* >> x: x: g> o) X X
TJ TJ CD CD
CD CD
Cfl CO CD CD
55 x: x: at ra X X
ca ca XL SZ
Ui Ui TJ TJ CD CD k- \—
CO CD
x: x: 4-< 4-<
co ca CD CD
5 5
2 .3? ca ca X X Ui Ui TJ TJ CD CD k_ k—
CD CD X X 4-* 4-<
CO CO CD CD
5 5 T- CM co •* in
m cn Ui m m u> cn Ui cn Ui > > > > >
CM co •* in
cn Ui cn cn
5 5 5 5 CO CO co cS co5
5 5 5 5 5
O T- CM CO • * • *
O) co •* •* CO CO CO CO CO
m in in in in X X X X X
m co
co co co co m in m w X X X X
CO O) O T- CM <* •* m m w co co co co co in m in m m X X X X X
co •* m co c~. in m m in in co co co co co m m m in in X X X X X
OO O) o i-
m in co CD
co co co co in m in m X X X X X
n ^ in ID s CO CO CO CO CO
co co co co co in m m in m X X X X X

CO D <
X
1 X LU
i p o X LL
z p 8 LU _l Q-
I
CO
a. CD
CD
a <
a
CD CI
o to >< «
ca
x
c ca
55
o>
o CM CD
I
r--co co
o CC o CO O CD
CD C
o
s. 2 O CO
X "CD
c ca CO
CO
o ca o O
CD C
g to TJ C CO :
CO o D) 3 CQ
co CO O a) 3 CQ
3 O XJ k-
CO
I CD TJ
co CD CQ
CD CD
c c
2 2
II
CD CD
c c o o CO CO
CD CD C C
o o >r >> >?
o CO CD
a
o o o o x: x: co co CD CD i _ i _ —
LL LL LL
CO CO CD CD
2 2 O O x: xi co co CD CD
CO CD CD CZ CZ CL O O O
ttfi CO cO CO
o o o xi xi x: co co co CO CD CD
CD CD
c c
2 2 to to TJ TJ C C CO CO
co co
TJ CD k-CD XI CO CD
TJ CD CD x: CO CD
CO CO
c c
2 2 to to TJ TJ
c c CO CO
CO CO TJ TJ CO CO
CO
sz CD
LL LL LL LL LL 5 5 >< >-X sz g) g) X X
co ca CD CD
55 >, >. X sz 2> 2> X X
CD Cfl c CO TJ CD CD C Cfl CD
CD CO x: CO TJ CD k_ CD fT CO CD
CD Cfl x: CO TJ CD CD .C CO CD
ID Cfl XI CO TJ CD CD r. CO CD
<D CO SZ cn TJ W L_
CD r CO CD
L L L L L L L L L L L L L L L L L L L L
55555
Ui Ui Ui Ui Ui ui ui ui cn U)
T- CM co •* in CO CO CO CO CO
Ui Ui Ui Ui Ui CQ CQ CO CQ CQ
CM CO
co co $ cn cn cn cn Lu C Q CQ CQ CQ ^ CM CO «* •<"• CO . >* in
co co co co
i - C M C o - * m c o i ^ c o o ) ~
X X X X I X X X X
CD 3
a o 2 to O
OO O) O i- CM IO CO N N N co co co co co m m m m m
n •* m co N |^ t 1^ N N co co co co co m m m in m
oo o> O T- CM N S 00 CO CO co co co co co in in in in m
n t in ID s 00 CO 00 00 00
co co co co co in in co in m
c o o o T - C M c o T t w c o r * -C O C O O ) 0 ) O ) O > O ) O ) 0 ) 0 )
cocococococococococo inLninmininminmin X X X X X X X X X X X X X X X X X X X X x x x x x x x x x x

-_l
X
\7i
<
CO
x" X
I X LU
X
o z 2 o X o
LU I
X
2
S5
CD k_
< p p
E 3 co 4^ 3 CO
5*
CD -J
Q.
E 3 co - k-
CO
X : CO D)
c o
CD • * — •
O
I c o O CD
g co CD CQ
0 3 CJ)
g CO +-<
CO
O
c o c o c o c o c o c o c o c o 3 3 3 ^ 3 3 3 3 CO CO CO CO CO CO CO CO
r- I - r— r- I— I— I—
T - C M C O T t W C O C O O )
OO CJ) O) O) CO CO
CM CO
o o Tl" T* inininininininm
XXXXXXXX
10 CO CO CO CO 3 3 3 3 3 .CO CO CO CO CO
I- h- \~ h- I-
' - W ^ W C O S C O O )
l-l-l-l-l-l-l-H
C D t " ~ 0 0 0 ) O T - C M C O T t O O O O - ^ - ^ - ^ - T - T -^ • ^ t T j - T j - T l - T j - T t T l - T t
i n i n m m i n i n i o i n m
xxxxxxxxx
j- CM co TI- in co h» O O O O O O O
in co i-» oo CD o i-t" T- T- T- T- ftl W Tf Tf Tf Tf Tf Tl" Tt
in m in m m m m
X X X X X X xl
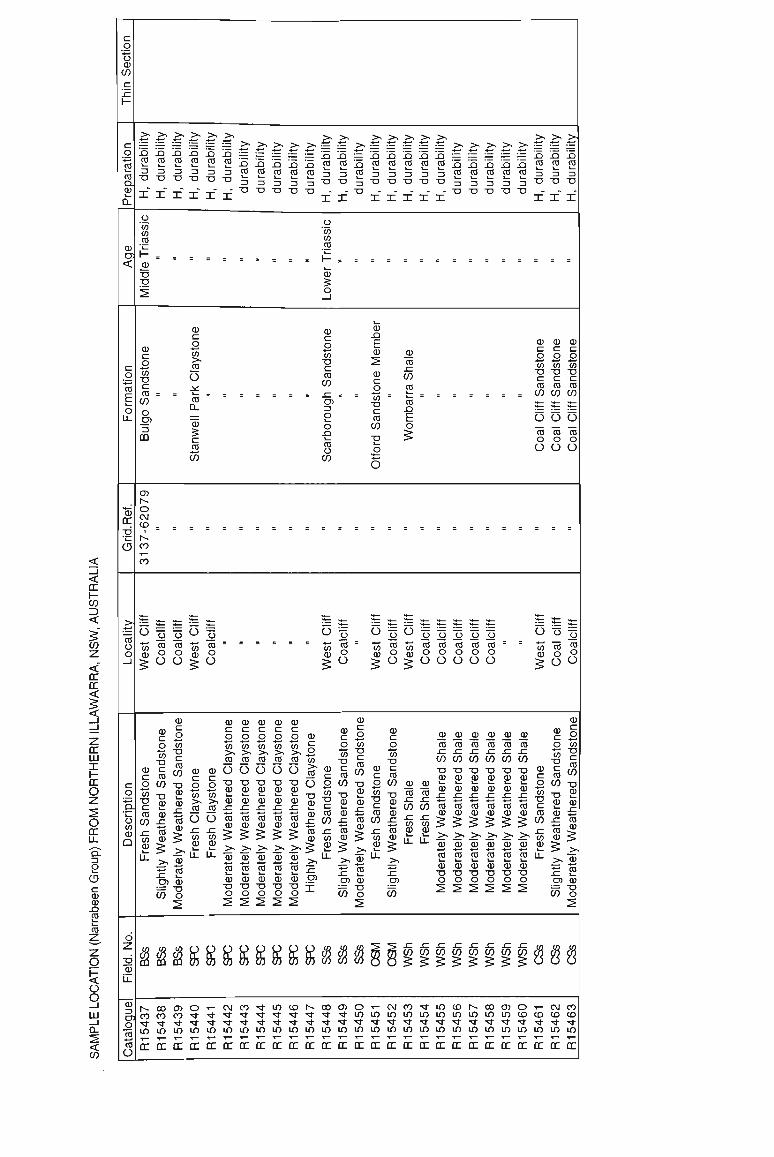
CO Q CD
CD CJ)
= = = = = j=>->.>,>,>,|=^>,^£^^|g>,>,>,>,>,^ = = ««rt«*S = = = --4j'i.-bbiibb = = - = ibbii
S s s S S S - Q x j j o i J B S r t - Q S S S S S ' j Q S x j x j x s S S S 3 3 3 3 3 3 C O c O c f l C O C 0 3 3 C 0 3 3 3 ^ 3 C O C O C O C O C 0 ^ 3 ^ T J T J T 3 T J T J T J ^ ^ - - - - g - g - - g - g - g - g ^ - - - - - - g - a t j T " T " T x _" T- O t) O O T) - - TJ TJ TJ TJ TJ TJ _- _- -
x x x x x x X X X X X I X X X X Cfl
en cfl
CD
o
co TJ c CO : CO o D) 3 CQ
CD CL
o
t 2 O cfl X "CD
CL
2 co
c
o +.
Ifl TJ
c CO CO o X) cfl o CO
CD X)
E CD CD C o
a) ca x: CO cfl
r i S E co o o
Q) CD CD CL CL CL
2 2 to to CO TJ TJ _
CI c _ CO CO CO
Ui Ui Ui O O O
cfl CO CO
o o o O O O
CD
< X h-co < CO
z <
X
X
<
5 X LU X H X
o z 2 P X
Q. 3
2 a c CD CD
i CO
Z < O
3 UJ _l
X
I CO
o^o co o o
> O O
o ca o O
CJ o C j 0 0 o o o u u 12 Z~L 12 12 t n C O " 5 n C 0 c 0 C O C 0 C 0 =
m O m O O O O O
> o > o o o o o
O o o
to "cfl g CD O O
5 o o
CD
k^ 4^ O CO
TJ CO
CO TJ
a) c o 4—* CO
>> cfl
CD CD
c c
o o 4^ 4^
<o co >> >> cfl CO
CD CD
c c
2 2 to to CO CO
CO CD C D O O O O O
g co CO -.-. TJ d CO CO
TJ TJ CD CD
TJ TJ CD CD
i-« k— E « ^-
0) HI ? ? u r * H
CO CO »- k_ u . k_ k_ CO CD CD CD CD
to O O CD co •> -s;
a> 5 £ £ 5
£ £ CJ) CD = TJ CO o
£ £ LL LL 11/ W W M/ W ^
4^ 4^ 4^ 4^ 4^ «^* 2 to i_
CD TJ O
CO Cfl CD CD
5 5 >* >?
2 2 to to i_ k_
CD CD TJ TJ O O
CO CO CD CD
5 5 2 2 ca to k_ k_
CD CD TJ TJ O O
CO
c
o
w
s? co
2 c O 2 •O TJ
£ I x.C^ 4^
co x: CD Cfl
CD
CD
c
o 4^ Cfl
TJ c ca CO TJ CD
CD
c
o 4^ Cfl
TJ c
_ ca CO CO
CD C
o
to TJ CL CO CO CD
0) 0) 0) cfl CO cfl x: x: x: Ui Ui Ui
2 2 co ca x: jr CO CO
Hz CO CD
>< >> > >> >> 5 £ 5 C D C D C D C D C D ^ L L ^
CD
5 to >, £
ft to
J= CO cfl CD
TJ 0) CD r CO CD
TJ CI) CD r Cfl CD
TJ CI) a) r 10 CI)
TJ CI) CD 1-Cfl 0)
TJ CD a) C Cfl a>
5 5 5 5 5 LL Tn
>• 2 >
g>
X 2 2 2 2
gj CD CO o
x: O) CO
CD CD CD *—. *—> - 4 — •
CO CO CO CD CD aj TJ TJ TJ O O O
2 2 2
CO CD -J—" -•—'
CO CO k_ k_
CD CO TJ TJ O O
2 CO x: CO TJ 0)
£ o CO c CD cfl
5 w - x: •£T Cfl CD CD *-. i —
CO LL CD TJ O
CD CL o CO TJ
c 01 CO TJ CD 0) r 4^
CO CD
O IT, TJ CI CO CO TJ CD
a) XI CO CD
5 > ^1
>>s x 2 CJ) ID — TJ CO o
CD 3 a o co
iUUUWHi CO CO CO CO co co co co gg
C M C O T l - m C O I ^ - O O O J O i - C M C O T l - l O C O r ^ O O C D O T - C M C O T t T j - T j - T j - T t T j - T j - T t k O i n i o i n k n i n i n k O i o i n c o c o c o c o Tj-Tt-Tt-^TtTfTl-Tl-Tl-Tt-TfTt-Tl-Tt-Tl-Tl-TtTl-Tl-Tl-Tl-Tt
m i n i n i n i n m i n i n i n i n i n i n L n i n i n i n i n i n i n i n m i n m m i n i n i n
S 00 CO o CO CO CO Tt TJ" TJ" Tt Tf
x x x x x x x x x x x x x x x x x x x x x x x x x x x

< X h-co Zi <
5 CO
z < X X
I X LU X h-X
p p X LL
Cfl
cfl CD XI 10
o Q _j
LU
< CO
c o
TS CD CO c XI
1-
c
o to k_
co a 5T i _
X
CD
cn <
c
_g to E k.
o X
X TJ " i —
CD
to o o _l
c o a, *k_
o cn CD Q
a Z TJ CD LL
Q> 3 D) o cfl
o
4^ 10 CD 1-Cfl CO X Ui
>> >• >i k- k_ k-CO CO CO
c c c co CD a) CO CO cfl 3 3 3
a o a
CO 3 cfl = = \-
O)
o CM CD . .
CO
CO
2 o X c g
o " CD TJ "cn CD CO
CO 3 CO = "
H
i "s § O CD o
o x
CM CO •* CM CM CM T* Tf Tf
m m m X X X
to
|2 cfl " " CD XI
co
>. >> > k- k_ 1—
cfl Cfl CO c c c k. k- k_
CD CD a) co co a 3 3 3
P P P
CO 3 cfl = =
0)
o CM CD . . •
CO
CO
Q.
E 3 CO X k_
CO
X = = CO CJ)
c o o 2
CO 3
lis o i i-
LO CO N-CM CM CM Tl" TJ" Tf m in w X X X
to CD
h-CO " CD
x:
co
4^ CO CD h-CO CD XI CO
k. W k_ k- k- l~
CO Cfl CO CO CO CO c c c c c c k. k_ I— k_ k_ k-
Ct) CO CD CD CD CD CO CO CO CO CO CO 3 3 3 3 3 3
a p a a a a
CO 3 CO = =
1-
O)
o CM CO . .
co
CO
CL
E 3 CO Jki
o = = o X >.
"5
CO 3
1 « g 2 2 |2 O x ^
00 0) o CM CM CO Tf Tfr Tt
m m in X X X
CO 3 CO = = h-
O)
o CM CD . .
i
1^ CO CO
a.
£ 3 CO k_ .
3 " " O XJ cfl X
co 3 CO = =
H
1 « g glf I2
T- CM CO CO CO CO Tf Tf Tt in in in X X X
4^ CO CD
1-CO CD XI CO
k_ l_ k_
cfl cc cfl c c c I— 1 — 1_
2 2 2 CO CO CO 3 3 3
O O P
CO 3 CO = =
CJ> (-~ o CM CO . . 1
CO
CO
D.
E 3 CO
o CO
o O
CO 3 "CO = "
h-
1 « g ° 2 £ o I " Tf LO CD CO CO CO TI- TJ- rain in in
xxx

< X h-Cfl =) < CO
z < X X <
5 < z X LU X h-X
o z 2
o X
CD
c g to TJ
c cfl CO Q. 3 O CD
CD CD XJ CO
CO TJ CD XJ k_
2 c CD C
o
I 2 o < O O _j
LU _l
X
i CO
XJ XJ . CO CO -k_ k .
3 3 TJ TJ
0) O)
<
g "io to co
CD
o
c CO
CD
X CD 4—' CO
CD
CD C
o to TJ C CO :
CO o gj 3 CD
CD
c o to TJ
c CO
CO XI : CJ) 3 O k.
o XJ k_
CO
o CO
CD
c g TJ C Cfl
CO
o to o O
CD 2 J CJ)
g CO
to O
TJ TJ TJ CO CD CD i— »— k_
CO CO CD
2 2 2 cfl cfl cfl CO CD 0)
TJ TJ TJ CD CD CD k- k_ k_
0) CD CD
x r r CO CO CO CD CO CO 5 5 5 5 55
CD CD CD 4^ 4^ 4^ Cfl Cfl Cfl k- k- k-
eo co co TJ TJ TJ
o o o
CD CD CD 4^ 4^ •-
cfl CO cfl k . L . k_
CD CD CD TJ TJ TJ O O O
8888
^ in ID N co o) CO CD CD CO CO CO TJ" Tf TJ" TJ" Tf TJ
m m m in m m X X X X X X
< X h-co <
5 CO
z < X X < z X LU X X
o o X X to"
£ 3 CO CD CO O
O CO L_ L_
CO
I CD CJ. Q . 3
<
o o _l UJ _l
x 2 < CO
CD
c c o o o O O O
CD CD
c c
2 2 to to TJ TJ
c c CO CO _
CO CO cfl TJ TJ g
£ £ ® « M
2 2 c CO CO iL CO CO
5 5 >. >. x: xi
g> g) X X
CO CO
c c
2 2 to to TJ TJ C C CO CO
CO CO O i- CM N N- N Tf TJ- TJ
in in m XXX
< _l < X h-co zo <
5 CO
z < X X <
5 *. _i
z X LU X f-X o z 2 O X X Q. 3 O
CD c CD 0) XJ CO
CO Z k_
CD 3 O
Z u < O CT _l
LU _l X 2 < CO
§ r *-• Q . CD Q
r o CO CO Q CI) X
m rr <
g 4-" CO
E L> X
t5 X TJ
CD
> • " ^
UJ
o n _J
c o *-t
g o (O CI) Q
r Z •c a X
a c r
cc C
X) CO T- CM O) 00 i- CO TJ-O T- CM CD CO n in o co Tt n n •* ^ ^ • • • i •
^ S O) CO 00 co r- r- ; co oo 0) CD CM m 0) CO O) TJ- CO CM CO CO TJ-
co CD h-TJ CO o = = = = _l 4^
c o Q-.2 .2 c CO CO CO CO CO ~ .co co E .*- ™ ir I- = I- = 2 Q> k_ X
v % 2
1 ! z CD CD S S a) O O S: 2 to to B o
2 co ? J |
« 5 co w I CO ;= x: t CO co 2 c3> co M-
X 3 XJ — S)= 2 E O - ' CD o O _
2 5 -a > cc m c i- > o
2 S o CO CO O)
is. o CM CO . . . -• is. co i—
CO
O to CD 5
CD a, CO CD CL CL CL CL
g 0 o a) g CO to CO CO CO TJ >, TJ XI TJ C CO C CO 5 CO o CO - CO XI XL SZ CD XI CO S <" LL "> CD P CD "" CD LL X LL X
c%cl&uiu} B ft » 5 o
co Tt in CD h-t rs. i^ is. r«» iv. TJ" TJ" Tf Tf Tl-m m m in in
{ X X X X X

GLOSSARY
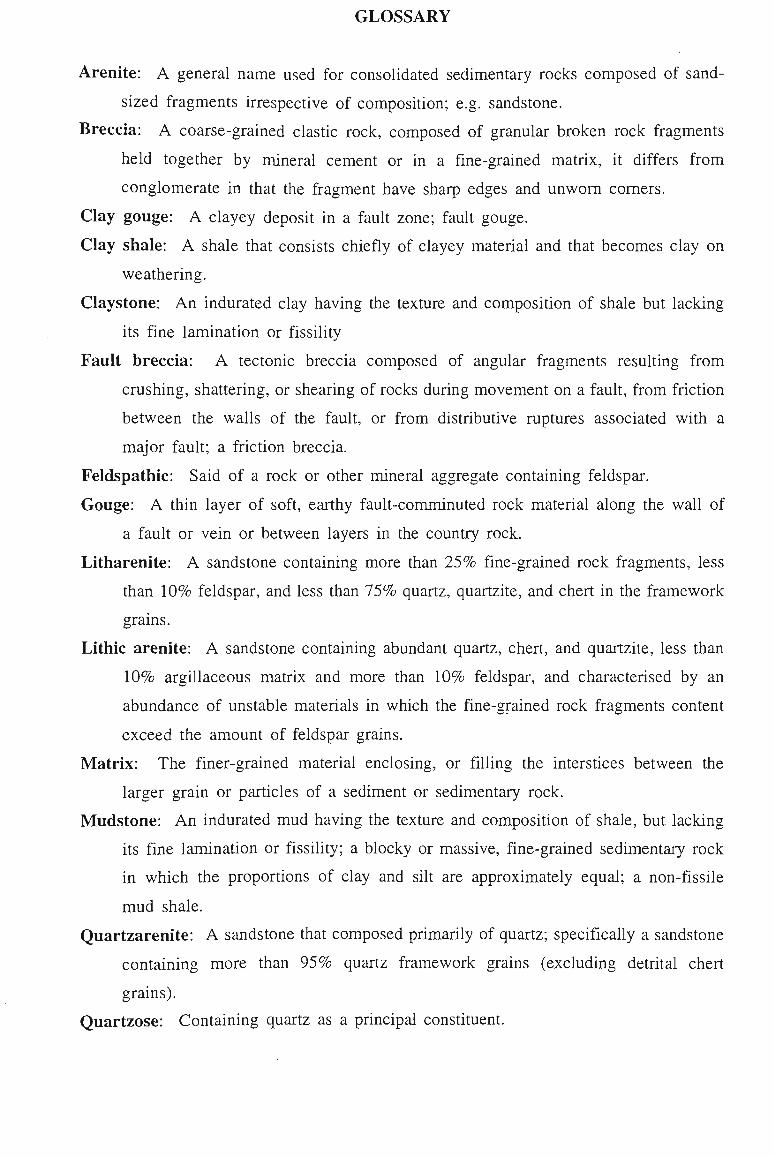
GLOSSARY
Arenite: A general name used for consolidated sedimentary rocks composed of sand-
sized fragments irrespective of composition; e.g. sandstone.
Breccia: A coarse-grained clastic rock, composed of granular broken rock fragments
held together by mineral cement or in a fine-grained matrix, it differs from
conglomerate in that the fragment have sharp edges and unworn corners.
Clay gouge: A clayey deposit in a fault zone; fault gouge.
Clay shale: A shale that consists chiefly of clayey material and that becomes clay on
weathering.
Claystone: A n indurated clay having the texture and composition of shale but lacking
its fine lamination or fissility
Fault breccia: A tectonic breccia composed of angular fragments resulting from
crushing, shattering, or shearing of rocks during movement on a fault, from friction
between the walls of the fault, or from distributive ruptures associated with a
major fault; a friction breccia.
Feldspathic: Said of a rock or other mineral aggregate containing feldspar.
Gouge: A thin layer of soft, earthy fault-comminuted rock material along the wall of
a fault or vein or between layers in the country rock.
Litharenite: A sandstone containing more than 2 5 % fine-grained rock fragments, less
than 1 0 % feldspar, and less than 7 5 % quartz, quartzite, and chert in the framework
grains.
Lithic arenite: A sandstone containing abundant quartz, chert, and quartzite, less than
1 0 % argillaceous matrix and more than 1 0 % feldspar, and characterised by an
abundance of unstable materials in which the fine-grained rock fragments content
exceed the amount of feldspar grains.
Matrix: The finer-grained material enclosing, or filling the interstices between the
larger grain or particles of a sediment or sedimentary rock.
Mudstone: A n indurated m u d having the texture and composition of shale, but lacking
its fine lamination or fissility; a blocky or massive, fine-grained sedimentary rock
in which the proportions of clay and silt are approximately equal; a non-fissile
m u d shale.
Quartzarenite: A sandstone that composed primarily of quartz; specifically a sandstone
containing more than 9 5 % quartz framework grains (excluding detrital chert
grains).
Quartzose: Containing quartz as a principal constituent.
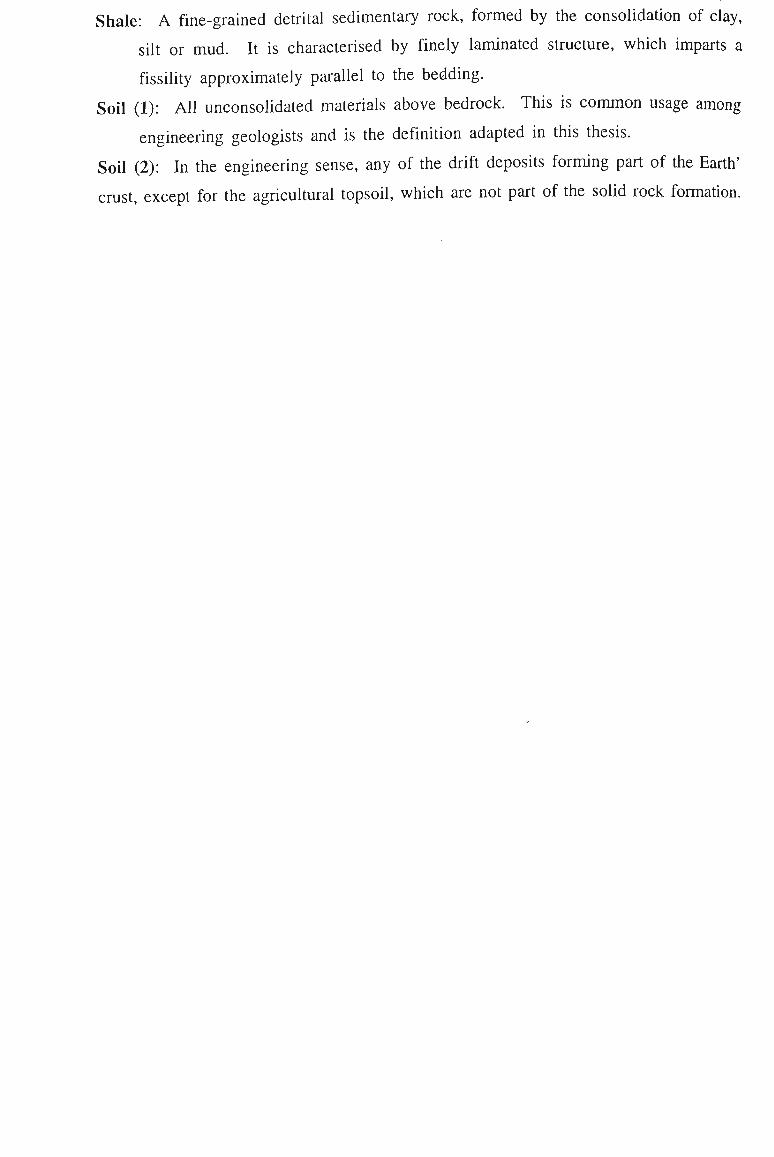
Shale: A fine-grained detrital sedimentary rock, formed by the consolidation of clay,
silt or mud. It is characterised by finely laminated structure, which imparts a
fissility approximately parallel to the bedding.
Soil (1): All unconsolidated materials above bedrock. This is c o m m o n usage among
engineering geologists and is the definition adapted in this thesis.
Soil (2): In the engineering sense, any of the drift deposits forming part of the Earth'
crust, except for the agricultural topsoil, which are not part of the solid rock formation.