energy and exergy analyses of a gasoline engine
TRANSCRIPT
INTERNATIONAL JOURNAL OF ENERGY RESEARCHInt. J. Energy Res. (in press)Published online in Wiley InterScience(www.interscience.wiley.com) DOI: 10.1002/er.1246
Energy and exergy analyses of a gasoline engine
C. Sayin1, M. Hosoz2,*,y, M. Canakci2 and I. Kilicaslan2
1Department of Mechanical Education, Marmara University, Istanbul, 34722, Turkey2Department of Mechanical Education, Kocaeli University, Kocaeli, 41380, Turkey
SUMMARY
This study presents comparative energy and exergy analyses of a four-cylinder, four-stroke spark-ignitionengine using gasoline fuels of three different research octane numbers (RONs), namely 91, 93 and 95.3.Each fuel test was performed by varying the engine speed between 1200 and 2400 rpm while keeping theengine torque at 20 and 40Nm. Then, using the steady-state data along with energy and exergy ratebalance equations, various performance parameters of the engine were evaluated for each fuel case. It wasfound that the gasoline of 91-RON, the design octane rating of the test engine, yielded better energetic andexergetic performance, while the exergetic performance parameters were slightly lower than thecorresponding energetic ones. Furthermore, this study revealed that the combustion was the mostimportant contributor to the system inefficiency, and almost all performance parameters increased withincreasing engine speed. Copyright # 2006 John Wiley & Sons, Ltd.
KEY WORDS: gasoline engine; octane number; energy analysis; exergy analysis
1. INTRODUCTION
The performance, fuel consumption and exhaust emissions of internal combustion (IC) engineshave been improved considerably since the introduction of these engines in the 19th century.These improvements have been brought about by not only advancing the engine design but alsoemploying fuels with better properties. Because combustion is strongly affected by the fuelproperties, both the engine performance and exhaust emissions vary as functions of them. Onthe other hand, the quality of gasoline, the main fuel for gasoline engines, is usually indicated bythe research octane number (RON). The RON of a gasoline is a measure of its resistance todetonation. The engine design and compression ratio are the main factors determining the RON
*Correspondence to: M. Hosoz, Department of Mechanical Education, Kocaeli University, Umuttepe-Izmit, 41380,Kocaeli, Turkey.yE-mail: [email protected]
Contract/grant sponsor: TOFAS Automotive Plant and Turkish Petroleum Refinery Corporation (TUPRAS)
Received 13 April 2006Revised 22 June 2006
Accepted 28 June 2006Copyright # 2006 John Wiley & Sons, Ltd.

of gasoline required by an engine. Besides them, the weather and driving conditions as well asmechanical conditions of the engine can influence the required RON.
The effects of RON on the engine performance and/or exhaust emissions have been recentlyinvestigated by many researchers (Batmaz et al., 1997; Sudsanguan and Chanchaowna, 1999;Sakaguchi, 2000). On the other hand, the effect of RON on detonation has also been studied(Korkmaz, 1996; Bayraktar, 1997; Twu and Coon, 1998; Mogi et al., 1998). Abdulghani (2002)found that as the octane number of the fuel increases the CO and HC emissions decrease but theNOx emission increases.
It can be seen from the literature survey that there are only a few studies investigating theeffect of higher octane rating on the gasoline engines with carburettor fuel system. Therefore, inthe current study, the effect of higher-octane gasoline on the performance and exhaust emissionswas studied using the carburettor gasoline engine. Furthermore, the studies in the openliterature usually determined various performance parameters of the engine from the perspectiveof the first law of thermodynamics. However, the first law is inadequate for evaluating somefeatures of energy resource utilization (Moran, 1989; Moran and Shapiro, 2000). Thethermodynamic details of the operation of a thermal system can be understood better byperforming not only an energy analysis but also an exergy analysis of the system. The exergyanalysis reveals the locations, causes and magnitudes of energy resource waste in the system.
The exergy analysis, also known as second law or availability analysis, of IC engines has beenstudied by many investigators. Patterson and Van Wylen (1963) studied a thermodynamic cyclesimulation which determined availability for the compression and expansion strokes in a sparkignition engine. Flynn et al. (1984) evaluated low-heat-rejection engine concepts in a dieselengine using second law analysis. Primus and Flynn (1986) showed the benefits of using thesecond law to determine various energy losses in a diesel engine. Van Gerpen and Shapiro (1990)investigated the second law analysis of diesel engine combustion. Alkidas (1998) performedenergy and exergy analyses of a diesel engine using experimental data. Lipkea and DeJoode(1998) studied comparative energetic and exergetic performances of two direct injection dieselengines. Alasfour (1997) performed an exergy analysis of a spark ignition engine to evaluate theuse of a butanol–gasoline blend as fuel. Caton (2000) reviewed over two dozen previous studieson the exergetic performance of IC engines. Canakci and Hosoz (2006) presented a comparativeenergy and exergy analyses of a four-cylinder turbocharged diesel engine fuelled with variousbiodiesels and No. 2 diesel fuel.
In this study, energy and exergy analyses of a four-cylinder, four-stroke gasoline engine areinvestigated. The test engine was powered with gasoline fuels of 91, 93 and 95.3-RONs, andoperated in a steady state. The tests for each fuel type were conducted by varying the enginespeed and torque. Using the experimental data, the reaction equations, the energy rate balanceand the exergy rate balance for the engine were determined. Consequently, various energetic andexergetic performance parameters of the engine were evaluated for each RON case andcompared with each others.
2. EXPERIMENTAL SET-UP AND TESTING PROCEDURE
The tests were performed on a four-cylinder, four-stroke Fiat DKS 1.6 L spark-ignition engine,which originally requires 91-RON gasoline. The schematic layout of the experimental apparatusis shown in Figure 1, and details of the engine specifications are shown in Table I. The engine
C. SAYIN ET AL.
Copyright # 2006 John Wiley & Sons, Ltd. Int. J. Energy Res. (in press)
DOI: 10.1002/er
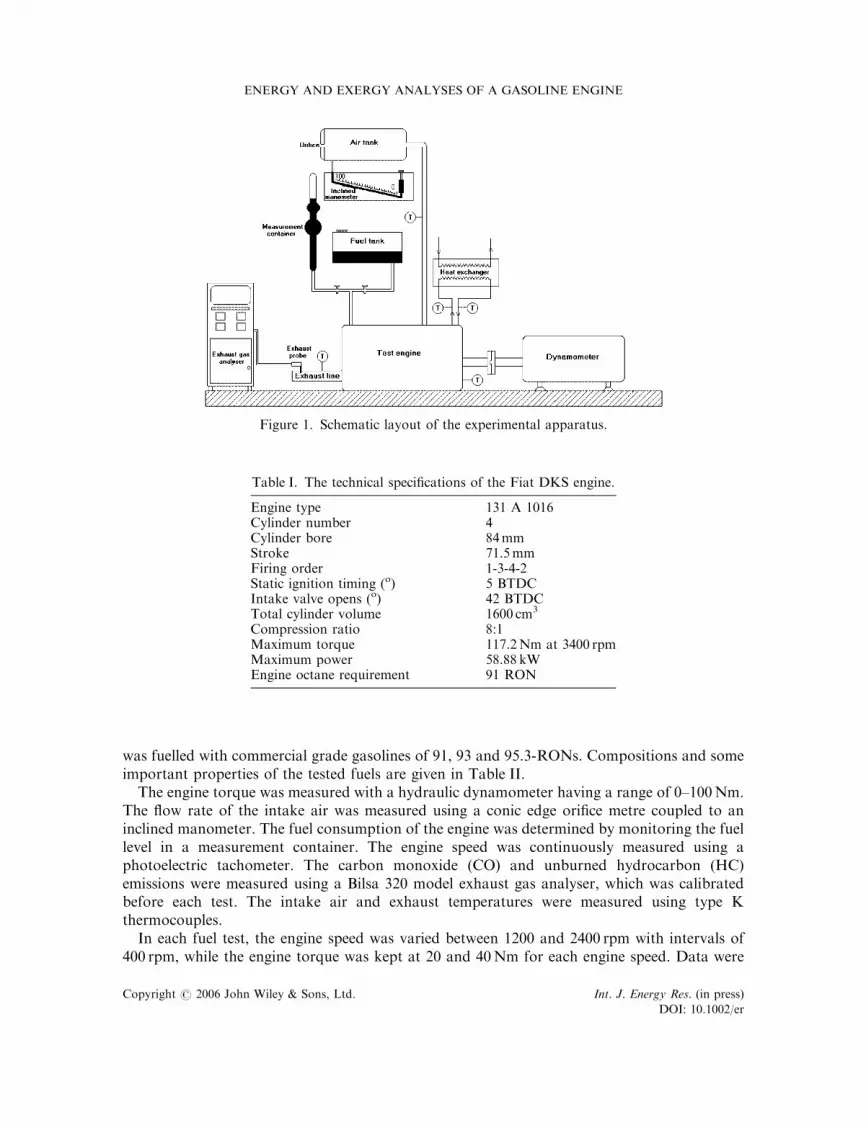
was fuelled with commercial grade gasolines of 91, 93 and 95.3-RONs. Compositions and someimportant properties of the tested fuels are given in Table II.
The engine torque was measured with a hydraulic dynamometer having a range of 0–100Nm.The flow rate of the intake air was measured using a conic edge orifice metre coupled to aninclined manometer. The fuel consumption of the engine was determined by monitoring the fuellevel in a measurement container. The engine speed was continuously measured using aphotoelectric tachometer. The carbon monoxide (CO) and unburned hydrocarbon (HC)emissions were measured using a Bilsa 320 model exhaust gas analyser, which was calibratedbefore each test. The intake air and exhaust temperatures were measured using type Kthermocouples.
In each fuel test, the engine speed was varied between 1200 and 2400 rpm with intervals of400 rpm, while the engine torque was kept at 20 and 40Nm for each engine speed. Data were
Figure 1. Schematic layout of the experimental apparatus.
Table I. The technical specifications of the Fiat DKS engine.
Engine type 131 A 1016Cylinder number 4Cylinder bore 84mmStroke 71.5mmFiring order 1-3-4-2Static ignition timing (o) 5 BTDCIntake valve opens (o) 42 BTDCTotal cylinder volume 1600 cm3
Compression ratio 8:1Maximum torque 117.2Nm at 3400 rpmMaximum power 58.88 kWEngine octane requirement 91 RON
ENERGY AND EXERGY ANALYSES OF A GASOLINE ENGINE
Copyright # 2006 John Wiley & Sons, Ltd. Int. J. Energy Res. (in press)
DOI: 10.1002/er
collected to analyse the performance of the engine after achieving the steady-state operation.Each test run was repeated three times and the results of the three repetitions were averaged.Before experiments, the engine was adjusted to its recommended catalogue values. Furtherdetails of the experimental set-up and testing procedure can be found in Sayin et al. (2005).
3. DETERMINING THE REACTION EQUATIONS
Energy and exergy analyses of the test engine for each test operation can be performed afterdetermining the reaction equation for the considered operation. For this purpose, it is necessaryto make some simplifying assumptions. Accordingly, it is assumed that there is no water vapourin the combustion air, and the air contains 21% oxygen and 79% nitrogen on a molar basis.Moreover, it is also assumed that the nitrogen in the air cannot undergo chemical reactions toform NO and NO2. After these assumptions, the general form of the reaction equation is
CxHy þ aðO2 þ 3:76N2Þ ! bO2 þ cCOþ dCO2 þ eCxHy þ fN2 þ gH2O ð1Þ
In all test operations, the fuel chemical formulas, fuel and air flow rates and the flow rates ofthe exhausted CO and HC are known. Thus, by applying conservation of mass principle to thecarbon, hydrogen, oxygen and nitrogen, the unknown coefficients in Equation (1) can easily bedetermined. The energy and exergy analyses of the engine are performed using these coefficients.
4. ENERGY ANALYSIS
With the purpose of simplifying the first law calculations, the following assumptions were made:
* The engine runs at a steady state.* The combustion air and exhaust gas each forms ideal gas mixtures.* Potential and kinetic energy effects of the combustion air, fuel stream and exhaust gas are
ignored.
After these assumptions, the energy rate balance on a per mole of fuel basis for a controlvolume consisting of the entire engine including the dynamometer can be written as
’Qcv
’nF�
’W cv
’nF¼ %hP � %hR ¼
XP
noutð%h0f þ D%hÞout �XR
ninð%h0f þ D%hÞin ð2Þ
Table II. Some properties of the fuels used in the tests (TUPRAS, 1996).
Research octane number 91 93 95.3
Typical formula C6.93H14.58 C6.95H14.80 C6.97H14.02
Average molecular weight (kg kmol�1) 97.926 98.388 97.842Lower heating value (kJ kg�1) 43 932 43 642 43 961Specific exergy (kJ kg�1) 47 045 46 752 47 011(calculated from Equation (10))
C. SAYIN ET AL.
Copyright # 2006 John Wiley & Sons, Ltd. Int. J. Energy Res. (in press)
DOI: 10.1002/er

where ’nF is the molar flow rate of the fuel, and %hP and %hR represent, respectively, the enthalpiesof the products and reactants per mole of fuel. On the right side, out and in denote outgoingproducts and incoming fuel and air streams, while the coefficients nout and nin are the coefficientsof the reaction equation, whose values were calculated before. Finally, %h0f is enthalpy offormation and D%h represent enthalpy change owing to a change of state at constantcomposition.
For a considered reactant or product at temperature T, the enthalpy change term in Equation(2) can be evaluated from
D%h ¼ %hðTÞ � %hðTref Þ ð3Þ
The tables in Moran and Shapiro (2000), and Szargut et al. (1998) can be used to get theformation enthalpies and enthalpy changes for the air and combustion products. Then, theformation enthalpies of the tested fuels can be determined from the general reaction equationfor the complete combustion with the theoretical amount of air given below:
CxHy þ aðO2 þ 3:76N2Þ ! bCO2 þ cH2Oþ dN2 ð4Þ
The values of the unknown coefficients a, b, c and d in Equation (4) can be determined byapplying the conservation of mass principle to each element with the use of the fuel chemicalformulas given in Table II. Then, the enthalpy of combustion for each fuel, which is also termedas the lower heating value, can be determined from
%h0RP ¼ LHV ¼ bð%h0f ÞCO2þ cð%h0f ÞH2OðgÞ þ dð%h0f ÞN2
� ð%h0f ÞF � að%h0f ÞO2� 3:76að%h0f ÞN2
ð5Þ
where the subscript F stands for fuel and g indicates that the water in the products is a vapour.Formation enthalpies of O2 and N2 are equal to zero. Then, taking the lower heating value ofthe considered fuel from Table II, formation enthalpy of each fuel can be determined fromEquation (5). These enthalpies for gasoline fuels of 91, 93 and 95.3-RONs were calculated as�187876, �230583 and �136730 kJ kmol�1, respectively.
The heat flow rate to the control volume can be determined by inserting the values for thefuel molar flow rate, brake power, enthalpy terms and the coefficients of the reaction intoEquation (2).
The energy input accompanying the combustion air can be ignored since the combustion air isvery close to the standard reference state, defined by Tref ¼ 258C and Pref ¼ 1 atm: Thus, theenergy loss due to the exhaust gas, i.e. exhaust loss, can be evaluated from
’Qex ¼ ’nFjLHVj � ’W cv � j ’Qcvj ð6Þ
The brake thermal efficiency (BTE), which is defined as the ratio of the power output to thefuel energy input, indicates the first law performance of the engine, i.e.:
BTE ¼’W cv
’nFjLHVjð7Þ
The results of the heat flow rate to the control volume, exhaust loss and BTE calculations arepresented in Section 6.
ENERGY AND EXERGY ANALYSES OF A GASOLINE ENGINE
Copyright # 2006 John Wiley & Sons, Ltd. Int. J. Energy Res. (in press)
DOI: 10.1002/er
5. EXERGY ANALYSIS
Exergy is the maximum theoretical work which can be obtained when a system of interestinteracts with a reference environment to equilibrium (Dincer, 2000). The order of exergydestructions and losses in the processes and components of a thermal system can be revealed bythe exergy analysis of the system. The results of exergy analysis can be used for pinpointing theprocesses in a thermal system on which further studies must be concentrated for better energysource utilization.
In this study, the exergy calculations were performed in relation to the reference environmenthaving a temperature (T0) of 298.15K and a pressure (P0) of 1 atm. Moreover, it is supposedthat the reference environment consists of an ideal gas mixture with the following compositionon a molar basis: N2, 75.67%; O2, 20.35%; CO2, 0.03%; H2O, 3.12%; other, 0.83%.
The specific flow exergy of a fluid stream can be found by summing thermomechanical andchemical exergies, i.e.:
%e ¼ %e th þ %e ch ð8Þ
The thermomechanical exergy can be defined as
%eth ¼ %h� %h0 � T0ð%s� %s0Þ ð9Þ
where %h and %s signify the specific enthalpy and entropy of the fluid, respectively, whereas %h0 and
%s0 stand for the corresponding values of these properties when the fluid comes to equilibriumwith the reference environment.
The specific chemical exergies of liquid fuels on a unit mass basis can be determined fromKotas (1995)
echF ¼ 1:0401þ 0:1728h
cþ 0:0432
o
cþ 0:2169
s
c1� 2:0628
h
c
� �� �jLHVj ð10Þ
where h, c, o and s are the mass fractions of H, C, O and S, respectively. In this study, thechemical exergies of the fuels were calculated using Equation (10) and Table II.
The exhaust gas can be assumed as a mixture of ideal gases. Then, the thermomechanicalexergy of the exhaust gas at the temperature T and pressure p, and containing n components canbe obtained from
%eth ¼Xni¼1
ai %hiðTÞ � %hiðT0Þ � T0 %s 0ðTÞ � %s 0ðT0Þ � %R lnp
p0
� �� �ð11Þ
where ai is the molar amount of the component i, %s0 is the absolute entropy at the standardpressure and %R is the universal gas constant.
The chemical exergy of the exhaust gas is
%e ch ¼ %RT0
Xni¼1
ai lnyi
yei
� �ð12Þ
where yi is the molar ratio of the ith component in the exhaust gas and yei is the molar ratio ofthe ith component in the reference environment.
Both thermomechanical and chemical exergies of the combustion air can be ignored since theintake air was very close to the reference state in the all test operations. Likewise, because itsproperties were almost equal to those in the reference conditions, the thermomechanical exergy
C. SAYIN ET AL.
Copyright # 2006 John Wiley & Sons, Ltd. Int. J. Energy Res. (in press)
DOI: 10.1002/er

of the fuel can also be ignored. Considering the coefficients in the reaction equation, the specificflow exergy of the exhaust gas per mole of fuel can be evaluated by summing the results ofEquations (11) and (12).
The exergy rate balance for the engine operating at a steady state can be expressed as
0 ¼Xj
ð1� T0=TjÞ ’Qcv � ’W cv þ ’nF %eF � ’nF %eex � ’Ed ð13Þ
where %eF and %eex are specific exergies of the fuel and exhaust gas, respectively, and Tj isthe absolute temperature of the boundary section from where the heat is rejected. The termð1� T0=TjÞ ’Qcv indicates the rate of exergy transfer accompanying heat. The term ’nF %eF accountsfor the rate of exergy entering the control volume accompanying the fuel stream, while ’nF %eexdescribes the exergy leaving the control volume accompanying the exhaust gas. Finally, the term’Ed signifies the rate of exergy destroyed in the control volume owing to irreversibility.In this study, calculations of the rate of exergy transfer accompanying heat is based on the
assumption that ’Qcv is transferred from the control volume boundary having the sametemperature as the engine coolant leaving the engine block. Then, inserting the values for therate of exergy transfer accompanying heat, the rates of exergy accompanying fluid streams andbrake power into Equation (13), the rate of exergy destroyed in the engine can be evaluated.
Finally, the exergetic efficiency of the engine is given by the ratio of the power output to thefuel exergy input, i.e.:
e ¼’W cv
’nF %eFð14Þ
The results of the exergy calculations are presented in the next section.
6. RESULTS AND DISCUSSION
The fuel energies ð’nFLHVÞ entering the engine are indicated in Figure 2. For any selectedcombination of engine speed and torque, the energy provided by the gasoline fuel to obtain thesame output power decreases with decreasing octane rating. When a fuel with an octane ratinghigher than required by the engine is used, this causes a longer ignition delay and a shorterflame. Consequently, this phenomenon reduces the maximum pressure and output power. Inother words, a higher amount of fuel energy is required to produce a certain output power.Therefore, the operations with 91-RON gasoline, the design octane rating of the test engine,required the lowest fuel energy. Furthermore, increasing engine speed and torque causes anincrease in the fuel consumption, thus raising the fuel energy entering the engine.
The BTEs of the engine are shown in Figure 3. Because the power output for a selectedcombination of engine speed and torque is constant, the BTE for the selected combination is afunction of only the fuel energy. In this study, the fuel energy entering the engine increased withincreasing octane rating. Therefore, the BTE decreased with increasing octane rating. If thenecessary adjustment such as ignition timing was made on the engine in accordance with theincreasing octane number, higher efficiencies could be obtained. However, such an adjustmentwas not made. Furthermore, the BTE first increased with increasing engine speed, and thentended to decrease. Starting at the maximum BTE value, increasing or decreasing speed atconstant torque causes a decrease in the engine volumetric efficiency, thereby decreasing the
ENERGY AND EXERGY ANALYSES OF A GASOLINE ENGINE
Copyright # 2006 John Wiley & Sons, Ltd. Int. J. Energy Res. (in press)
DOI: 10.1002/er

BTE. Volumetric efficiency is a measure of the rate of combustion air. As the volumetricefficiency decreases, fuel flow rate will decrease for a constant F/A ratio, thus resulting in adecrease in the power output of the engine. The main reason of the increase in BTE with theengine speed at low speeds is the decreased amount of fuel supply to the engine. However,increased mechanical frictions dominate this positive effect after a certain speed, and BTE startsto decrease.
The heat flow rates from the control volume are shown in Figure 4. The operations using fuelswith higher octane ratings result in higher rates of heat flow from the control volume. Becausethe use of higher octane rating gasoline yields lower CO and unburned HC concentrations in theexhaust gas, enthalpy of combustion products becomes lower, i.e. absolute value of negative hp
1200 1400 1600 1800 2000 2200 2400
20
25
30
35
40
45
50
55
20
25
30
35
40
45
50
5591-RON, 20 Nm91-RON, 40 Nm93-RON, 20 Nm93-RON, 40 Nm 95.3-RON, 20 Nm 95.3-RON, 40 Nm
Fue
l ene
rgy
(kW
)
Engine speed (rpm)
Figure 2. Fuel energies entering the engine as functions of engine speed and torque.
1200 1400 1600 1800 2000 2200 240010
12
14
16
18
20
22
24
10
12
14
16
18
20
22
24
91-RON, 20 Nm91-RON, 40 Nm93-RON, 20 Nm93-RON, 40 Nm 95.3-RON, 20 Nm 95.3-RON, 40 Nm
BT
E (
%)
Engine speed (rpm)
Figure 3. Brake thermal efficiencies as functions of engine speed and torque.
C. SAYIN ET AL.
Copyright # 2006 John Wiley & Sons, Ltd. Int. J. Energy Res. (in press)
DOI: 10.1002/er

increases. Therefore, a higher rate of total energy in the forms of heat and work is transferredfrom the control volume in the operations with higher octane ratings. Because the engine poweroutput is the same for a selected combination of engine speed and torque, a higher heat flow rateto the control volume occurs in the operations with higher octane rating. The heat flow increaseswith increasing engine speed and torque due to the increased fuel energy entering the engine.Although the heat flow rate from the engine can be reduced by insulating the walls of thecombustion chamber, this causes an increase in the temperature of the exhaust gas, thusincreasing the energy loss due to the exhaust gas (Parlak et al., 2005).
The energy losses due to the exhaust gas as functions of engine speed and torque are indicatedin Figure 5. This loss is simply the difference between the fuel energy input and the sum of heat
1200 1400 1600 1800 2000 2200 240015
20
25
30
35
40
15
20
25
30
35
40 91-RON, 20 Nm 91-RON, 40 Nm 93-RON, 20 Nm 93-RON, 40 Nm 95.3-RON, 20 Nm 95.3-RON, 40 Nm
Hea
t flo
w r
ate
(kJ/
s)
Engine speed (rpm)
Figure 4. Heat flow rate from the control volume as functions of engine speed and torque.
1200 1400 1600 1800 2000 2200 24002.0
2.5
3.0
3.5
4.0
2.0
2.5
3.0
3.5
4.0 91-RON, 20 Nm 91-RON, 40 Nm 93-RON, 20 Nm 93-RON, 40 Nm 95.3-RON, 20 Nm 95.3-RON, 40 Nm
Exh
aust
loss
(kW
)
Engine speed (rpm)
Figure 5. Energy losses due to the exhaust gas as functions of engine speed and torque.
ENERGY AND EXERGY ANALYSES OF A GASOLINE ENGINE
Copyright # 2006 John Wiley & Sons, Ltd. Int. J. Energy Res. (in press)
DOI: 10.1002/er

and work transfers from the control volume. Because work transfer is the same for a selectedengine speed and torque combination, the exhaust loss is a function of only the differencebetween fuel energy input and the heat flow rate from the control volume. Since fuel energyinput increases faster than the heat flow rate with increasing octane rating, operations with high-octane fuels cause increased exhaust losses. It can be noted that, in the experimental study theexhaust temperature was measured on the external surface of the exhaust manifold. Therefore,the measured temperature was lower than real exhaust gas temperature. Consequently, thecalculated exhaust losses were lower than real values. Therefore, according to Equation (2), heatflow rates presented in Figure 4 also contains some amount of exhaust loss originating from themeasurement of exhaust temperature on the external surface of the manifold.
The fuel exergy inputs ð’nF %eFÞ to the engine for the three fuel cases as functions of engine speedand torque are reported in Figure 6. The curves in this figure are comparable to the fuel energyinput curves given in Figure 2 because the fuel specific exergy is linked to the lower heating valueto some extent. However, the fuel exergy inputs are 6.9–7.1% higher than the corresponding fuelenergy inputs.
The exergetic efficiencies of the test engine as functions of engine speed and torque are shownin Figure 7. The exergetic efficiencies of the engine also follow similar trends with the BTEsgiven in Figure 3. However, the exergetic efficiencies are 6.5–6.7% lower than the correspondingBTEs because a higher amount of fuel exergy compared to the fuel energy is supplied to theengine. Since the exergetic efficiency takes into account not only the first but also the second lawof thermodynamics, it provides a better measure of the performance for a thermal system.
The exergy losses accompanying heat flow rate from the engine as function of engine speedand torque are indicated in Figure 8. Since this loss is proportional to the heat flow rate from theengine, the curves given here are analogous to those given in Figure 4. The higher thetemperature of the engine surface from where the heat is rejected, the higher the exergy lossaccompanying it is. Alkidas (1998) reported that both the exergy loss accompanying heat lossand the rate of exergy destroyed by the combustion could be decreased by insulating thecombustion chamber walls of the engine.
1200 1400 1600 1800 2000 2200 240020
25
30
35
40
45
50
55
60
20
25
30
35
40
45
50
55
6091-RON, 20 Nm91-RON, 40 Nm93-RON, 20 Nm93-RON, 40 Nm 95.3-RON, 20 Nm 95.3-RON, 40 Nm
Fue
l exe
rgy
(kW
)
Engine speed (rpm)
Figure 6. Fuel exergies entering the engine as functions of engine speed and torque.
C. SAYIN ET AL.
Copyright # 2006 John Wiley & Sons, Ltd. Int. J. Energy Res. (in press)
DOI: 10.1002/er

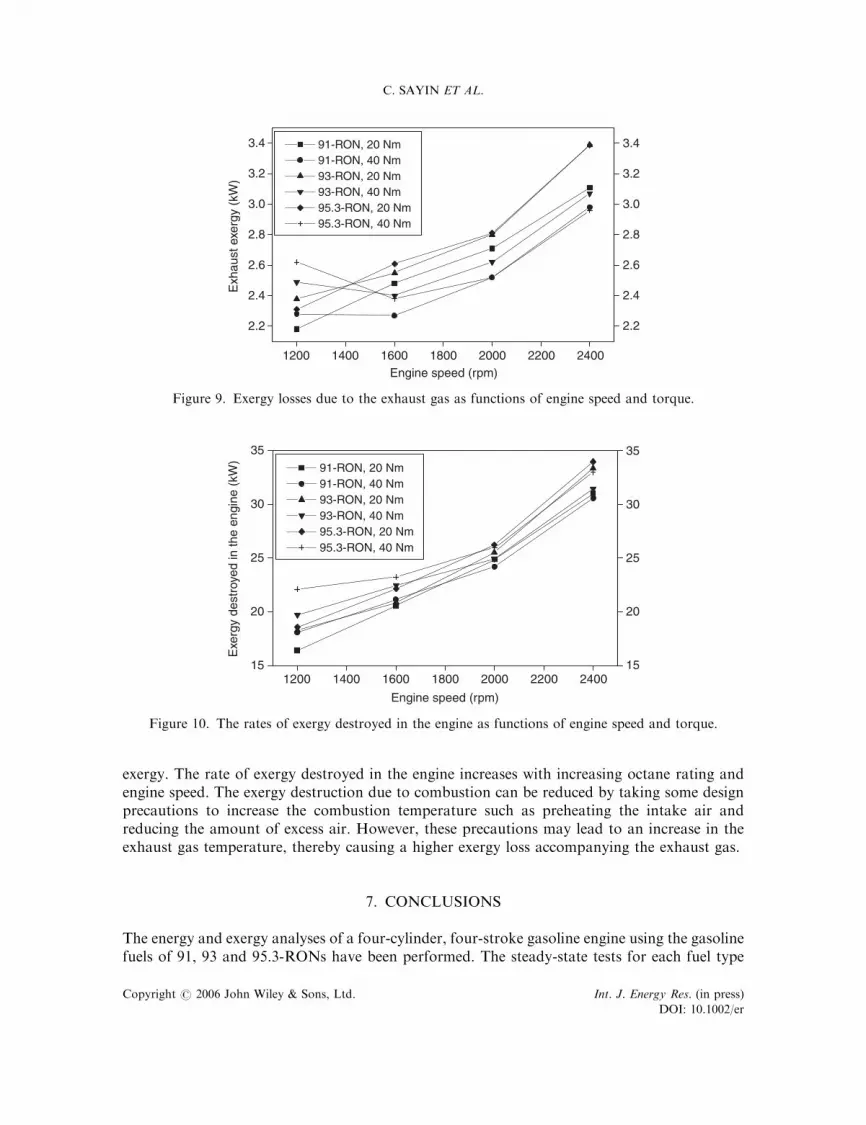
The exergy losses due to the exhaust gas as functions of engine speed and torque are reportedin Figure 9. It is seen that the curves in this figure follow similar trends with exhaust energy losscurves in Figure 5, although exhaust exergy loss is slightly lower than energy loss. This exergyloss can be decreased by reducing the exhaust gas temperature and the concentrations of COand unburned HC in the exhaust gas.
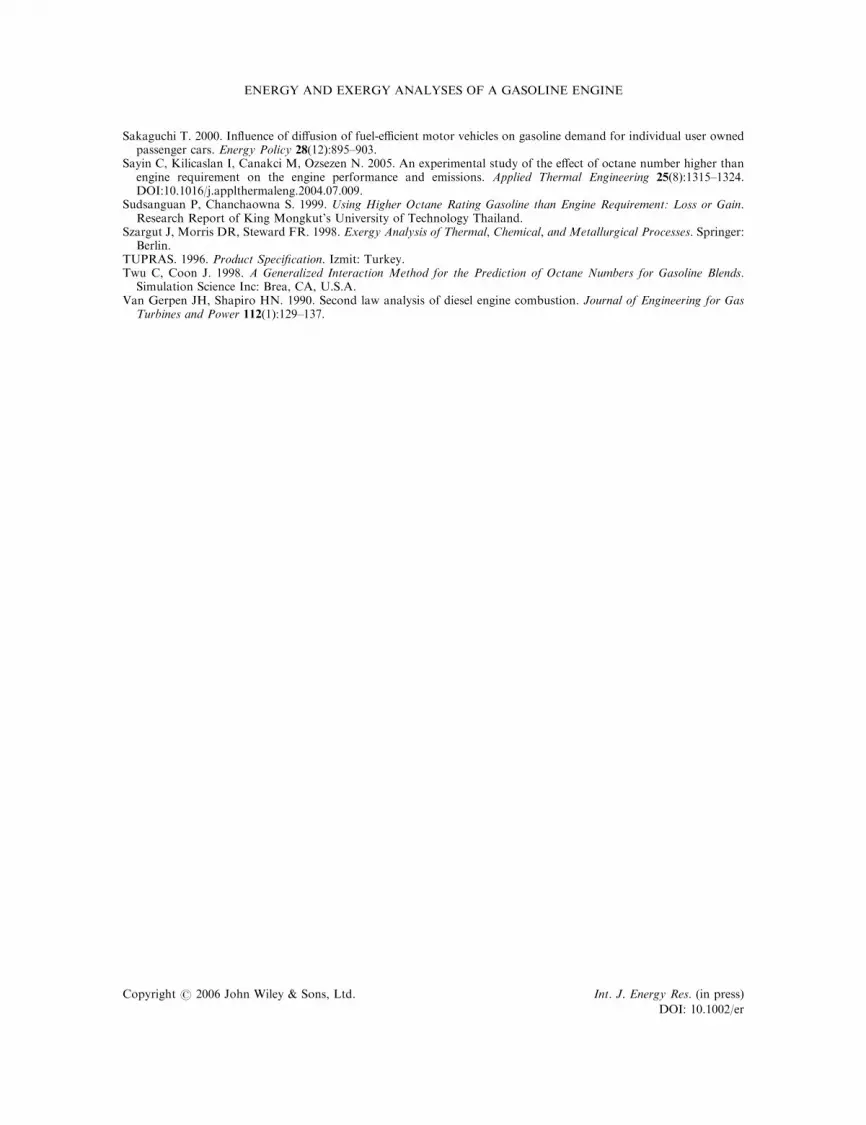
The rates of exergy destroyed within the engine as functions of engine speed and torque areindicated in Figure 10. Exergy is not conserved, and the irreversible processes in the engine, suchas combustion, heat transfer, mixing, friction, etc., destroy a significant fraction of the fuel
1200 1400 1600 1800 2000 2200 2400
10
12
14
16
18
20
22
10
12
14
16
18
20
22
91-RON, 20 Nm 91-RON, 40 Nm 93-RON, 20 Nm 93-RON, 40 Nm 95.3-RON, 20 Nm 95.3-RON, 40 Nm
Exe
rget
ic e
ffici
ency
(%
)
Engine speed (rpm)
Figure 7. Exergetic efficiencies as functions of engine speed and torque.
1200 1400 1600 1800 2000 2200 24001
2
3
4
5
6
7
1
2
3
4
5
6
7
91-RON, 20 Nm 91-RON, 40 Nm 93-RON, 20 Nm 93-RON, 40 Nm 95.3-RON, 20 Nm 95.3-RON, 40 NmE
xerg
y lo
ss d
ue to
hea
t flo
w r
ate
(kW
)
Engine speed (rpm)
Figure 8. Exergy losses accompanying heat flow rate from the control volume asfunctions of engine speed and torque.
ENERGY AND EXERGY ANALYSES OF A GASOLINE ENGINE
Copyright # 2006 John Wiley & Sons, Ltd. Int. J. Energy Res. (in press)
DOI: 10.1002/er
exergy. The rate of exergy destroyed in the engine increases with increasing octane rating andengine speed. The exergy destruction due to combustion can be reduced by taking some designprecautions to increase the combustion temperature such as preheating the intake air andreducing the amount of excess air. However, these precautions may lead to an increase in theexhaust gas temperature, thereby causing a higher exergy loss accompanying the exhaust gas.
7. CONCLUSIONS
The energy and exergy analyses of a four-cylinder, four-stroke gasoline engine using the gasolinefuels of 91, 93 and 95.3-RONs have been performed. The steady-state tests for each fuel type
1200 1400 1600 1800 2000 2200 2400
2.2
2.4
2.6
2.8
3.0
3.2
3.4
2.2
2.4
2.6
2.8
3.0
3.2
3.4 91-RON, 20 Nm91-RON, 40 Nm93-RON, 20 Nm93-RON, 40 Nm95.3-RON, 20 Nm95.3-RON, 40 Nm
Exh
aust
exe
rgy
(kW
)
Engine speed (rpm)
Figure 9. Exergy losses due to the exhaust gas as functions of engine speed and torque.
1200 1400 1600 1800 2000 2200 240015
20
25
30
35
15
20
25
30
35 91-RON, 20 Nm 91-RON, 40 Nm 93-RON, 20 Nm 93-RON, 40 Nm 95.3-RON, 20 Nm 95.3-RON, 40 Nm
Exe
rgy
dest
roye
d in
the
engi
ne (
kW)
Engine speed (rpm)
Figure 10. The rates of exergy destroyed in the engine as functions of engine speed and torque.
C. SAYIN ET AL.
Copyright # 2006 John Wiley & Sons, Ltd. Int. J. Energy Res. (in press)
DOI: 10.1002/er

were conducted by varying the engine speed and torque. Afterwards, the reaction equation, theenergy rate balance and the exergy rate balance for each test operation were determined usingexperimental data. Finally, various energetic and exergetic performance parameters of theengine were evaluated and compared with each others. Considering the results of energy andexergy analyses, it is possible to draw following conclusions:
* The engine operates less energy-efficiently when a fuel with an octane rating higher thedesign rating is used.
* Similarly, operations with high octane ratings lead to lower exergetic efficiency, usually ahigher exhaust exergy loss and a higher exergy loss due to heat loss.
* Because high engine speeds cause a more homogenous mixture and a boosted turbulence inthe combustion chamber, almost all energetic and exergetic performance parametersincrease with increasing engine speed.
* The system inefficiency is mainly caused by the exergy destruction due to the irreversibleprocesses such as combustion. The exergy losses due to the exhaust gas and heat flow fromthe control volume are other contributors to inefficiency.
NOMENCLATURE
ai =molar amount of component iBTE =brake thermal efficiency
%e =specific molar exergy (kJ kmol�1)’Ed =rate of exergy destruction (kW)%h =specific molar enthalpy (kJ kmol�1)%h0f =enthalpy of formation (kJ kmol�1)%h0RP =enthalpy of combustion (kJ kmol�1)%h0 =specific molar enthalpy at reference environment (kJ kmol�1)jLHVj =lower heating value (kJ kmol�1)n =coefficients in the reaction equation
’nF =molar flow rate of the fuel (kmol s�1)P =pressure (kPa)p0 =environmental pressure (kPa)’Qcv =heat flow rate to the control volume (kJ s�1)’Qex =energy loss due to the exhaust gas (kW)%R =universal gas constant (kJ kmol�1K�1)
%s =specific molar entropy (kJ kmol�1K�1)
%s0 =specific molar entropy at reference environment (kJ kmol�1K�1)T =temperature (K)T0 =environmental temperature (K)’W cv =power obtained from the control volume (kW)yi =molar ratio of the ith componentyei =molar ratio of the ith component in the reference environment
Greek symbols
e =exergetic efficiency
ENERGY AND EXERGY ANALYSES OF A GASOLINE ENGINE
Copyright # 2006 John Wiley & Sons, Ltd. Int. J. Energy Res. (in press)
DOI: 10.1002/er

Subscripts
ex =exhaustin =incoming reactantsout =outgoing productsP =productR =reactantref =reference
Superscripts
ch =chemicalth =thermal
ACKNOWLEDGEMENTS
The authors would like to thank TOFAS Automotive Plant and Turkish Petroleum Refinery Corporation(TUPRAS) for supporting this project.
REFERENCES
Abdulghani AA. 2002. Effects of octane number on exhaust emissions of a spark ignition engine. International Journal ofEnergy Research 26(4):279–285. DOI:10.1002/er.783.
Alasfour FN. 1997. Butanol}a single cylinder engine study: availability analysis. Applied Thermal Engineering17(6):537–549.
Alkidas AC. 1998. The application of availability and energy balances to a diesel engine. Journal of Engineering for GasTurbines and Power 110(3):462–469.
Batmaz I, Balci M, Salman S, Erdiller B. 1997. Experimental analysis of fuel economy and exhaust emissions at petrolengine vehicles. First Automotive Technology Congress, Adana, Turkey, 20–30 May.
Bayraktar H. 1997. Theoretical investigation of the effect of gasoline-ethanol blends on spark-ignition enginecombustion and cycles. Ph.D. Thesis, Karadeniz Technical University, Trabzon, Turkey.
Canakci M, Hosoz M. 2006. Energy and exergy analyses of a diesel engine fuelled with various biodiesels. EnergySources, Part B, in press. DOI: 10.1080/15567240500400796.
Caton JA. 2000. A review of investigations using the second law of thermodynamics to study internal-combustionengines. SAE Paper, No. 2000-01-1081.
Dincer I. 2000. Thermodynamics, exergy and environmental impact. Energy Sources 22(8):723–732. DOI:10.1080/00908310050120272.
Flynn PF, Hoag KL, Kamel MM, Primus RJ. 1984. A new perspective on diesel engine evaluation based on second lawanalysis. SAE Paper, No. 840032.
Korkmaz I. 1996. A study on the performance and emission characteristics of gasoline and methanol fuelled spark-ignition engines. Ph.D. Thesis, Istanbul Technical University, Istanbul, Turkey.
Kotas TJ. 1995. The Exergy Method of Thermal Plant Analysis. Krieger Publishing Company: Malabar, FL.Lipkea WH, DeJoode AD. 1998. A comparison of the performance of two direct injection diesel engines from a second
law perspective. SAE Paper, No. 890824.Mogi K, Katsushi H, Arisawa K, Kobayashi H. 1998. Analysis and avoidance of pre-ignition in S.I. gasoline engines.
JSAE Review 19(1):9–14.Moran MJ. 1989. Availability Analysis. ASME Press: New York.Moran MJ, Shapiro HN. 2000. Fundamentals of Engineering Thermodynamics. Wiley: New York.Parlak A, Yasar H, Eldogan O. 2005. The effect of thermal barrier coating on a turbo-charged diesel engine performance
and exergy potential of the exhaust gas. Energy Conversion and Management 46(3):489–499. DOI:10.1016/j.enconman.2004.03.006.
Patterson D, Van Wylen G. 1963. A digital computer simulation for spark-ignited engine cycles. SAE Paper, No. 630076.Primus RJ, Flynn PF. 1986. The assessment of losses in diesel engines using second law analysis. In Computer-Aided
Engineering of Energy Systems, Vol. 3, Gupta G (ed.), Advanced Energy Systems. ASME: New York, 61–68.
C. SAYIN ET AL.
Copyright # 2006 John Wiley & Sons, Ltd. Int. J. Energy Res. (in press)
DOI: 10.1002/er
Sakaguchi T. 2000. Influence of diffusion of fuel-efficient motor vehicles on gasoline demand for individual user ownedpassenger cars. Energy Policy 28(12):895–903.
Sayin C, Kilicaslan I, Canakci M, Ozsezen N. 2005. An experimental study of the effect of octane number higher thanengine requirement on the engine performance and emissions. Applied Thermal Engineering 25(8):1315–1324.DOI:10.1016/j.applthermaleng.2004.07.009.
Sudsanguan P, Chanchaowna S. 1999. Using Higher Octane Rating Gasoline than Engine Requirement: Loss or Gain.Research Report of King Mongkut’s University of Technology Thailand.
Szargut J, Morris DR, Steward FR. 1998. Exergy Analysis of Thermal, Chemical, and Metallurgical Processes. Springer:Berlin.
TUPRAS. 1996. Product Specification. Izmit: Turkey.Twu C, Coon J. 1998. A Generalized Interaction Method for the Prediction of Octane Numbers for Gasoline Blends.
Simulation Science Inc: Brea, CA, U.S.A.Van Gerpen JH, Shapiro HN. 1990. Second law analysis of diesel engine combustion. Journal of Engineering for Gas
Turbines and Power 112(1):129–137.
ENERGY AND EXERGY ANALYSES OF A GASOLINE ENGINE
Copyright # 2006 John Wiley & Sons, Ltd. Int. J. Energy Res. (in press)
DOI: 10.1002/er