study of mixture formation and early flame development in a research gdi (gasoline direct injection)...
TRANSCRIPT
lable at ScienceDirect
Energy xxx (2014) 1e9
Contents lists avai
Energy
journal homepage: www.elsevier .com/locate/energy
Study of mixture formation and early flame development in a researchGDI (gasoline direct injection) engine through numerical simulationand UV-digital imaging
M. Costa, L. Marchitto, S.S. Merola*, U. SorgeCNR e Istituto Motori, Via G. Marconi 4, 80125 Napoli, Italy
a r t i c l e i n f o
Article history:Received 12 December 2013Received in revised form27 March 2014Accepted 30 April 2014Available online xxx
Keywords:Multidimensional engine modelGasoline direct injectionOptical diagnosticsFlame visualization
* Corresponding author.E-mail address: [email protected] (S. Merola).
http://dx.doi.org/10.1016/j.energy.2014.04.1140360-5442/© 2014 Elsevier Ltd. All rights reserved.
Please cite this article in press as: Costa M,injection) engine through numerical simula
a b s t r a c t
The analysis of the mixture formation and early combustion processes in a slightly lean burn gasolinedirect injection (GDI) engine is performed by using experimental and numerical techniques. UVevisiblenatural emission digital imaging is applied in the optically accessible combustion chamber of a researchengine. This is equipped with the four-valve head and the same injection system of a commercialturbocharged engine. Optical accessibility is obtained through a quartz window placed on the pistonhead. Numerical simulations are performed by means of a 3D model developed within the AVL FireTM
environment, which exploits an in-house developed sub-model for simulating the spray dynamics. Testsare carried out using commercial gasoline. The cyclic variability of the engine is first analysed in order toproperly define a reference average pressure cycle to be used for the validation of the numerical model.This last is then proved as being highly predictive as the start of injection is moved in the working cycle.The main effects of the injection and ignition timing on the characteristic flame development angles,namely on the flame initiation and propagation, are analysed. Flame initiation is visualised bothnumerically and experimentally.
© 2014 Elsevier Ltd. All rights reserved.
1. Introduction
Future law regulations on the exhaust emissions of internalcombustion engines and the worldwide concern about a morerational exploitation of the available fossil fuels resources are todaystrongly affecting the research and development strategies withinthe automotive sector. Besides searching for alternative solutions totraditional spark ignition (SI) and diesel engines, updating currenttechnologies is being pursued, through a series of measures aimedat both reducing their environmental impact and increasing theirenergy efficiency. Understanding and controlling the combustionprocess in an internal combustion engine is the first step to achievethese important tasks.
The prevailing approach that has been followed in recent yearsto improve SI engines lies in the use of gasoline direct injection(GDI). In engines with port fuel injection (PFI), mixture formation isrealized into the intake port by means of moderately low pressureinjectors. This technology provides a really poor control over the
et al., Study of mixture formation and UV-digital imaging,
airefuel mixture entering the cylinder, besides presenting prob-lems in transitory regimes, especially due to the wall wetting ofcold surfaces causing high unburned hydrocarbons emissions [1,2].The realisation of mixture formation directly into the combustionchamber allows overcoming these problems, since the injectionstrategy may be flexibly adapted from time to time to the specificengine load [3,4]. At high load, a stoichiometric or rich mixture isformed through an early injection. At moderate loads, as duringcruising situations when little acceleration is required, the GDIengine can instead operate under a lean combustion mode. In thiscase, the fuelmay be injected in the latter stages of the compressionstroke prior to ignition. This allows creating the so-called mixturestratification, with a stoichiometric ratio near the spark plug andincreasingly leaner zones towards the cylinder walls. The effectiveair-to-fuel ratio may be very lean resulting in significant fuel sav-ings. Leaner gases in correspondence of the walls also have morefavourable thermodynamic properties that reduce the heat losses.Controlling the engine power output by only varying the amount offuel and the injection strategy, without throttling the intake valve,also allows reducing the associated pressure losses. Amore detaileddescription of the optimal operation of a modern GDI engine isgiven in Fig. 1, as taken from Ref. [3].
tion and early flame development in a research GDI (gasoline directEnergy (2014), http://dx.doi.org/10.1016/j.energy.2014.04.114

Fig. 1. GDI engine operating conditions [3].
Table 1Characteristic of the engine under study.
Bore � Stroke 79 � 81.3 mmConnecting rod length 143 mmCylinders 1Compression ratio 10.6IVO 3� BTDCIVC 36� ABDCEVO 27� BBDCEVC 0� ATDCFuel system d.i. 100 bar
M. Costa et al. / Energy xxx (2014) 1e92
Stoichiometric charge GDI gasoline engines (often supple-mented with turbocharging or supercharging or both) are alreadyavailable in production engines from several automotive companiesworldwide (GM Ecotec, VW, Toyota), due to their well assessedadvantages of fun-to-drive performance, fuel economy, reduced HCemissions, while taking advantage of the same highly effectivecatalytic after-treatment systems employed in PFI engines. Theavailability of increasingly enhanced ignition systems and of moreeffective NOx lean converters, together with the need to move to-wards diluted or lean combustion modes for higher energy effi-ciency, is opening the way to further investigating the operationwith non stoichiometric, but lean or ultra-lean mixtures [5].
Extending the flammability limits of a lean mixture is to bepursued by properly synchronising injection and spark ignitionwithin the engine working cycle. Studying the interdependencybetween ignition and injection, therefore, is of fundamentalimportance for the future development of SI engines, to reachcombustion stability and completeness, hence for the best engineperformance over the whole working map [5,6].
Stratified charge operation is very sensitive to the timing ofinjection and the mixture formation mode [7]. Three kinds ofconfiguration for spray vaporization are available [8]. In the so-called wall-guided mode the gasoline spray is directed towardsthe piston, which exhibits a properly shaped “nose” deflecting themixture cloud in the vicinity of the spark plug. In the air-guidedmode the mixture richer region is brought towards the ignitionlocation by the tumble motion of the air entering from the intakeducts. Finally, in the jet-guided or spray-guided mode, typically thespacing between the injector and the spark is smaller, with the fuelspray injected close to the ignition location.
Stratified lean operation in a spray-guided configuration isconsidered in the papers by Park et al. [9] and Costa et al. [10].Present work aims at studying a slightly lean combustion of aresearch engine with a wall-guided mixture formation geometry,under different injection strategies and ignition times. The work isbased on the use advanced experimental and numerical techniquesfor the comprehension of the crossed effects of ignition and in-jection on the flame initiation and development.
Coordinated experiments (preferably through optical diagnostics)andmodelling (as 3D time dependent computational fluid dynamics,CFD) play today a direct and increasingly important role in thedevelopment of sustainable energy systems, in particular of internalcombustionengines [11]. A surveyon thematterwasmade in2007byDrake and Haworth [12]. The reader interested in a quite recent re-viewof publishedworks on sprayand combustion characterization ininternal combustion engines using optical techniques may refer to
Please cite this article in press as: Costa M, et al., Study of mixture formainjection) engine through numerical simulation and UV-digital imaging,
Refs. [13,14]. CFD fundamentals for applications to internal combus-tion engines are found in the book by Ramos [15].
Present work constitutes a further example showing how asynergic experimental and numerical approach to a complexproblem may be useful for fulfilling the lacks of each single specifictechnique and individuating, even by parametric analyses, theoptimal control strategy of a GDI engine.
This study starts with an experimental characterization of theengine devoted to collect both in-cylinder pressure data and im-ages of the in-chamber combustion development. The collectedinformation is employed for the validation of a properly formulated3D CFD model for the simulation of the whole engine cycle. Due tothe expected high cyclic variability, properly averaged pressurecycles are taken as reference for the code validation. Baseline in-jection strategies are analysed in conjunction with the choice ofspark timing. The thermodynamic analysis and the flame devel-opment investigations are performed, according to the approachesfollowed in Refs. [16,17].
2. The experimental set-up
The engine used for this study is a single cylinder research GDIoptical engine (79mm� 81.3mm). It is equippedwith the head of afour cylinder in-line engine. The optical engine has the samegeometrical characteristics of the commercial one. Further detailson the engine are reported in Table 1. The head has four valves and acentrally located spark plug. Mixture formation occurs in a wall-guidedmode. A six-hole injector manufactured byMagneti-Marelli,0.140 mm of holes diameter and solenoid actuation, is mountedbetween the two intake valves.
An experimental characterisation of the gasoline spray, asdelivered by the considered injector, was preliminary made both atthemass flow rate test bench and in an optically accessible vessel tocollect necessary data for the assessment of a 3D sub-model able tosimulate the issuing spray dynamics. The followed methodology isanalogous to the one described in Ref. [18].
The measurements on the engine are performed at 2000 rpm,WOT and 100 bar fuel injection pressure. Intake air temperature isin the range 300e310 K. Cooling and lubricant fluid temperaturevalues are maintained within 320e340 K by a thermal monitoringand conditioning system. A quartz pressure transducer is flush-installed in the region between intake-exhaust valves at the sideof the spark plug. Engine is fuelled by commercial gasoline.
Injection start is initially set at 300� crank angle before top deadcentre (BTDC); the duration of injection is fixed in order to reachthe value of the relative air-to-fuel ratio l ¼ 1.1 ± 1%, as measuredon 200 consecutive engine cycles by an exhaust gas oxygen sensor.Start of spark (SOS) is initially fixed at 10� BTDC. This reference caseis used in the phase of validation of the developed numericalmodel. Successive engine analyses are realised by varying the startof injection and the start of spark. The limit value of the exploredrange of start of injection (SOI) is 150� BTDC, that corresponds to acrank angle within the closed valves period at the beginning of thecompression stroke. Late injection is not considered because the
tion and early flame development in a research GDI (gasoline directEnergy (2014), http://dx.doi.org/10.1016/j.energy.2014.04.114
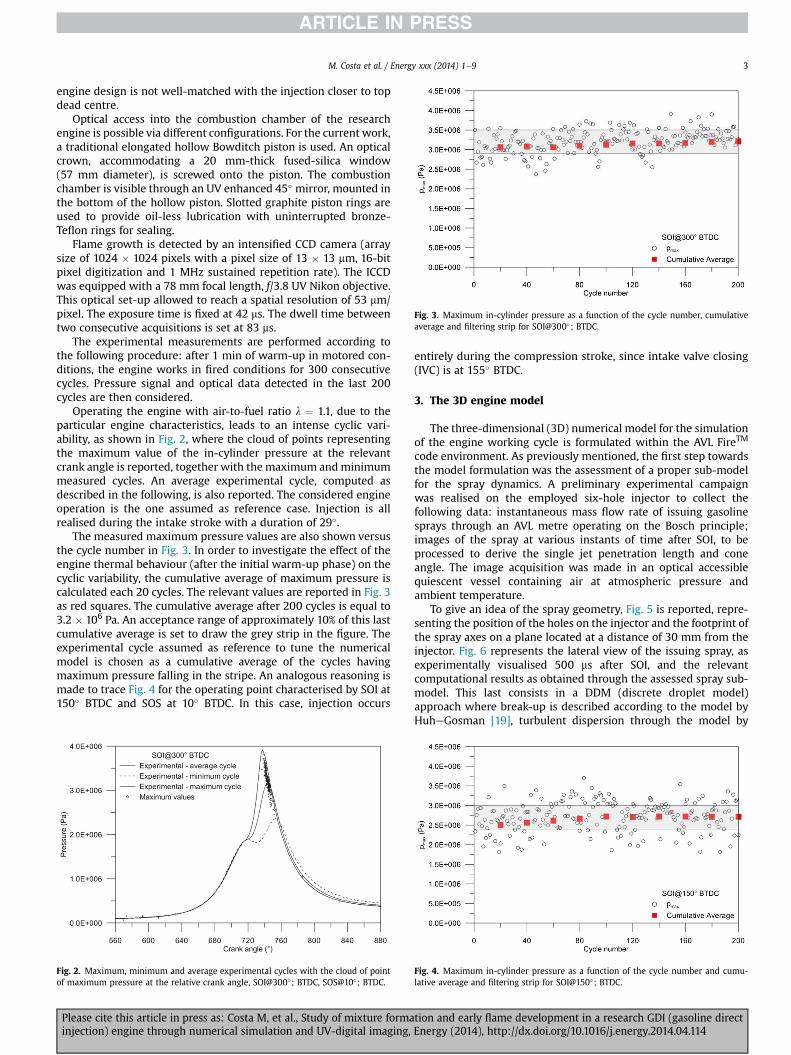
Fig. 3. Maximum in-cylinder pressure as a function of the cycle number, cumulativeaverage and filtering strip for SOI@300�; BTDC.
M. Costa et al. / Energy xxx (2014) 1e9 3
engine design is not well-matched with the injection closer to topdead centre.
Optical access into the combustion chamber of the researchengine is possible via different configurations. For the current work,a traditional elongated hollow Bowditch piston is used. An opticalcrown, accommodating a 20 mm-thick fused-silica window(57 mm diameter), is screwed onto the piston. The combustionchamber is visible through an UV enhanced 45� mirror, mounted inthe bottom of the hollow piston. Slotted graphite piston rings areused to provide oil-less lubrication with uninterrupted bronze-Teflon rings for sealing.
Flame growth is detected by an intensified CCD camera (arraysize of 1024 � 1024 pixels with a pixel size of 13 � 13 mm, 16-bitpixel digitization and 1 MHz sustained repetition rate). The ICCDwas equipped with a 78 mm focal length, f/3.8 UV Nikon objective.This optical set-up allowed to reach a spatial resolution of 53 mm/pixel. The exposure time is fixed at 42 ms. The dwell time betweentwo consecutive acquisitions is set at 83 ms.
The experimental measurements are performed according tothe following procedure: after 1 min of warm-up in motored con-ditions, the engine works in fired conditions for 300 consecutivecycles. Pressure signal and optical data detected in the last 200cycles are then considered.
Operating the engine with air-to-fuel ratio l ¼ 1.1, due to theparticular engine characteristics, leads to an intense cyclic vari-ability, as shown in Fig. 2, where the cloud of points representingthe maximum value of the in-cylinder pressure at the relevantcrank angle is reported, together with the maximum andminimummeasured cycles. An average experimental cycle, computed asdescribed in the following, is also reported. The considered engineoperation is the one assumed as reference case. Injection is allrealised during the intake stroke with a duration of 29�.
The measured maximum pressure values are also shown versusthe cycle number in Fig. 3. In order to investigate the effect of theengine thermal behaviour (after the initial warm-up phase) on thecyclic variability, the cumulative average of maximum pressure iscalculated each 20 cycles. The relevant values are reported in Fig. 3as red squares. The cumulative average after 200 cycles is equal to3.2 � 106 Pa. An acceptance range of approximately 10% of this lastcumulative average is set to draw the grey strip in the figure. Theexperimental cycle assumed as reference to tune the numericalmodel is chosen as a cumulative average of the cycles havingmaximum pressure falling in the stripe. An analogous reasoning ismade to trace Fig. 4 for the operating point characterised by SOI at150� BTDC and SOS at 10� BTDC. In this case, injection occurs
Fig. 2. Maximum, minimum and average experimental cycles with the cloud of pointof maximum pressure at the relative crank angle, SOI@300�; BTDC, SOS@10�; BTDC.
Please cite this article in press as: Costa M, et al., Study of mixture formainjection) engine through numerical simulation and UV-digital imaging,
entirely during the compression stroke, since intake valve closing(IVC) is at 155� BTDC.
3. The 3D engine model
The three-dimensional (3D) numerical model for the simulationof the engine working cycle is formulated within the AVL FireTM
code environment. As previously mentioned, the first step towardsthe model formulation was the assessment of a proper sub-modelfor the spray dynamics. A preliminary experimental campaignwas realised on the employed six-hole injector to collect thefollowing data: instantaneous mass flow rate of issuing gasolinesprays through an AVL metre operating on the Bosch principle;images of the spray at various instants of time after SOI, to beprocessed to derive the single jet penetration length and coneangle. The image acquisition was made in an optical accessiblequiescent vessel containing air at atmospheric pressure andambient temperature.
To give an idea of the spray geometry, Fig. 5 is reported, repre-senting the position of the holes on the injector and the footprint ofthe spray axes on a plane located at a distance of 30 mm from theinjector. Fig. 6 represents the lateral view of the issuing spray, asexperimentally visualised 500 ms after SOI, and the relevantcomputational results as obtained through the assessed spray sub-model. This last consists in a DDM (discrete droplet model)approach where break-up is described according to the model byHuheGosman [19], turbulent dispersion through the model by
Fig. 4. Maximum in-cylinder pressure as a function of the cycle number and cumu-lative average and filtering strip for SOI@150�; BTDC.
tion and early flame development in a research GDI (gasoline directEnergy (2014), http://dx.doi.org/10.1016/j.energy.2014.04.114

Fig. 5. Holes distribution and spray footprint on a plane located at 30 mm from theinjector Magneti-Marelli six-hole.
Fig. 7. Computational grid employed in the phase of valves overlap (here 10� BTDC).
M. Costa et al. / Energy xxx (2014) 1e94
O'Rourke and Bracco [20], coalescence through the model by Nor-din [21], and evaporation through the model by Dukowicz [22]. Agood portability of the spray sub-model is achieved by adopting aprobability distribution (lognormal distribution) for the initial sizeof droplets at the nozzle exit section, having as expected value atheoretical diameter accounting for physical quantities as therelative velocity between the liquid phase and the surrounding gas.Tuning of the break-up model and choice of the optimal variance ofthe initial size distribution is made at different injection pressuresby solving a proper optimization problem. Further details of theprocedure can be found in Costa et al. [18].
The discretization of the engine computational domain, made ofthe cylinder and the intake and exhaust ducts, is made through thepre-processing software included in the AVL FireTM graphical userinterface (GUI), namely the Fame Engine Plus module (FEP). Thisallows realising a semi-automatic moving mesh generation. Theuser can control the cell size of the grid at each crank angle by localthickening nodes where particular geometric conformations of theouter surfaces are present, or where intense gradients of thethermo-fluid variables are expected. In order to maintain thecomputational time within reasonable limits, the various gridzones are considered active only in physical domains of interest.When the intake and exhaust valves are closed, the grid is built onlyin the cylinder, while the intake and exhaust ducts are addedgeometrically and numerically solved only at the crank angles forwhich these zones are actually put into contact with the cylinder bythe valves opening. Since there is symmetry of the domain withrespect to the plane passing through the axis of the spark plug, only
Fig. 6. Spray visualization 500 ms after SOI: experimental (left) and numerical (right).
Please cite this article in press as: Costa M, et al., Study of mixture formainjection) engine through numerical simulation and UV-digital imaging,
half computational domain is considered. Fig. 7 represents one ofthe grids used for the range of valves overlap, particularly at thecrank angle of 350�. In the assumed reference frame, the top deadcentre (TDC) is at 360�. The combustion TDC is at 720�. Table 2 givesan idea of the size and conformation of the grid of Fig. 7.
The pressure signals to be used as boundary conditions at thecomputational domain inlet and outlet are obtained from experi-mental measurements effected in the intake and exhaust ducts at adistance from the relevant valve corresponding to the boundariesposition. The calculation is started 10� before the exhaust valveopening (EVO) with initial conditions for the burnt mixture alsoobtained from experimental measurements. A preliminary analysisof the engine motored cycle, with proper boundary and initialconditions serves to the assessment of the trapped mass of air, aswell as to the definition of the actual compression ratio, accountingfor the blow-by effects. Thewhole engine cycle is simulated and thecycle repeatability of computations verified.
Gasoline droplets impingement on the piston or cylinder walls isconsidered according to the model by MundoeSommerfeld [23].Combustion is simulated through the Extended Coherent FlameletModel e 3 Zone (ECFM-3Z) [24], NO formation is simulated asfollowing the mechanism proposed by Zeldovich et al. [25]. TheECFM-3Z model is properly tuned to well catch the in-cylinderpressure curve by acting on the initial flame surface density andthe flame stretch factor.
4. Results and discussion
The comparison between the experimentally measured and thenumerically computed pressure cycles at 2000 rpm, SOS at 10�
BTDC and SOI at 300� BTDC, l ¼ 1.1 is reported in Fig. 8. The fourstrokes of the engine cycle are well reproduced. The combustionphase is in good agreement.
The good accuracy of the 3D engine model in predicting theengine behaviour is maintained if SOI is moved at 150� BTDC, asshown in Fig. 9. A lower peak pressure is observed in this case,although the air-to-fuel ratio and intake conditions are fixed.
The different engine behaviour can be ascribed just to the dif-ferences in the mixture formation process deriving by the choice ofthe crank angle of SOI. Indeed, the global air-to-fuel ratio at sparkignition coincides in the two cases. Fig. 10 represents the calculated
Table 2Characteristic data of the computational grid of Fig. 7.
Tetrahedrical cells 4232Hexahedrical cells 2,277,309Piramidal cells 22,686Prismatic cells 34,605Total cell number 288,832
tion and early flame development in a research GDI (gasoline directEnergy (2014), http://dx.doi.org/10.1016/j.energy.2014.04.114

Fig. 8. Comparison between the numerically computed and the experimentallymeasured in-cylinder pressure cycle for SOI@300�; BTDC.
Fig. 10. Computed mass of evaporated gasoline for SOI@300�; and SOI@150�; BTDC.
M. Costa et al. / Energy xxx (2014) 1e9 5
evaporated gasoline mass as a function of the crank angle after SOI(ASOI). In both the situations the in-chamber conditions make forthe gasoline evaporation to last about 120� and to be practicallycomplete at spark timing. The evaporation for the injection occur-ring during the intake stroke is initially faster due to the increasedtransport properties consequent the intake mass flow. The influ-ence of the in-chamber pressure and temperature then becomeshigher, and the evaporation faster for SOI at 150� BTDC.
Although characterised by the same global air-to-fuel ratio, themixtures relevant to SOI at 300� BTDC and SOI at 150� BTDC exhibitdifferent local properties. Injecting during the intake stroke allowsrealising a homogeneous charge at spark timing, while injectingduring compression does not give enough time to reach a uniformdistribution of the mixture equivalence ratio within the combus-tion chamber prior to ignition. This is demonstrated by Fig. 11,which represents the in-chamber mixture equivalence ratio on aplane passing through the spark plug at the instant of SOS for thetwo considered cases. The almost uniform distribution of the gas-oline vapour is well visible on the top of the figure, whereas a sort ofslight stratification is visible in the bottom. It is evident that thisstratification does not give the expected advantages for the com-bustion development, possibly due to the kind of the chambergeometry and the mixture formation mode, here being of the kindwall-guided.
Combustion starts more promptly in the case of SOI at 150�
BTDC, as demonstrated by the computed rate of heat release ofFig. 12, but it is less effective to produce work.
Fig. 9. Comparison between the numerically computed and the experimentallymeasured in-cylinder pressure cycle for SOI@150�; BTDC.
Please cite this article in press as: Costa M, et al., Study of mixture formainjection) engine through numerical simulation and UV-digital imaging,
The in-cylinder peak pressure remains low due to the incom-plete combustion consequent a non optimal synchronization be-tween mixture formation and spark ignition. This reasoning isconfirmed by the increased production of CO emissions shown inFig. 13, and the consequent reduction of CO2, shown in Fig. 14relevant to an injection entirely realised during compression.
The numerically reproduced mixture formation process isshown at different crank angles after SOI (ASOI) in Fig.15. The figureshows the air flow velocity on a plane passing through the axis ofone of the intake valves, as well as the spray droplets position anddiameter. The interaction between the air flow entering the cylin-der from the intake duct and the spray droplets is well visible. Thejets compounding the spray are directed towards the piston headwith the isolated jet, issuing from the hole visible on the bottom ofFig. 5, positioned towards the chamber head. The early injection,realised within a crank angle interval of 29� entirely during theintake stroke, gives droplets enough time to break-up and evapo-rate within the combustion chamber. The spray impingement onthe piston head is also evident, during injection, at 15� ASOI forSOI@300�; BTDC. In this case the spray is strongly influenced by theintake flow motion, due to the high velocities involved.
The agreement between the numerical and the experimentaldata results good also in local terms, namely as regards the in-chamber flame propagation and even if the spark timing ischanged as shown in the following.
The comparison between the numerically evaluated flame sur-face density, drawn on two orthogonal planes passing through thespark plug, and the optically collected images is reported in Fig. 16at six different instants of time after SOS (ASOS). The case of SOI at300� BTDC is analysed for different SOS: 10� BTDC (top) and 15�
BTDC (bottom). After the similar propagation during the initialphase, the flame evolves more rapidly for earlier spark timing.
The 3D engine model is able to follow the evolution of the flamefront from the early stages of combustion until the arrival at thechamber walls. In particular, the flame kernel dislocation from thecentre due to the spark plug positionmeasured at 5� ASOS is clearlyreproduced.Moreover, the flame front shape asymmetry, due to theflow motion in the combustion chamber, is well modelled.
The numerical code is enough predictive to allow the simulationof the flame growth until the optical limit (20� ASOS) is reached.
The advance of SOS produces an increase of work, but only untila limit value, beyond which the phenomenon called arrestedphasing occurs, as shown in Fig. 17, where the numerical andexperimental values of the pressure integral over volume in theclosed valves period are plotted as a function of the SOS itself, forboth SOIs. The lower performance relevant to the retarded injection
tion and early flame development in a research GDI (gasoline directEnergy (2014), http://dx.doi.org/10.1016/j.energy.2014.04.114
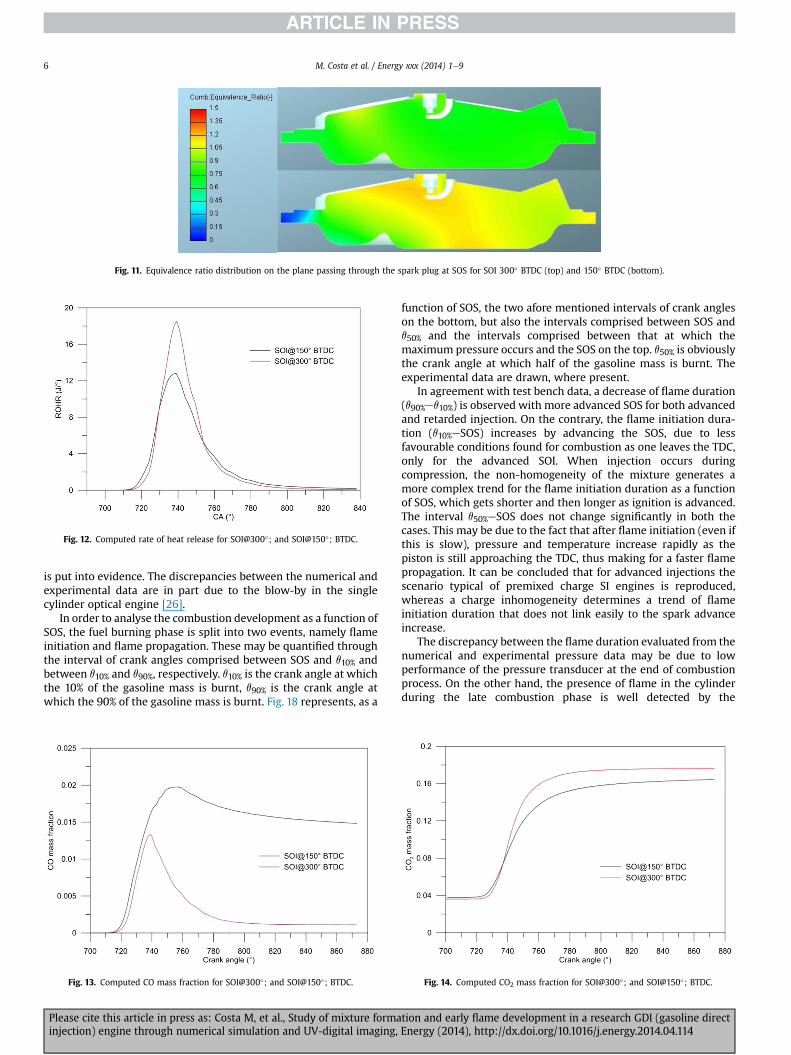
Fig. 11. Equivalence ratio distribution on the plane passing through the spark plug at SOS for SOI 300� BTDC (top) and 150� BTDC (bottom).
Fig. 12. Computed rate of heat release for SOI@300�; and SOI@150�; BTDC.
M. Costa et al. / Energy xxx (2014) 1e96
is put into evidence. The discrepancies between the numerical andexperimental data are in part due to the blow-by in the singlecylinder optical engine [26].
In order to analyse the combustion development as a function ofSOS, the fuel burning phase is split into two events, namely flameinitiation and flame propagation. These may be quantified throughthe interval of crank angles comprised between SOS and q10% andbetween q10% and q90%, respectively. q10% is the crank angle at whichthe 10% of the gasoline mass is burnt, q90% is the crank angle atwhich the 90% of the gasoline mass is burnt. Fig. 18 represents, as a
Fig. 13. Computed CO mass fraction for SOI@300�; and SOI@150�; BTDC.
Please cite this article in press as: Costa M, et al., Study of mixture formainjection) engine through numerical simulation and UV-digital imaging,
function of SOS, the two afore mentioned intervals of crank angleson the bottom, but also the intervals comprised between SOS andq50% and the intervals comprised between that at which themaximum pressure occurs and the SOS on the top. q50% is obviouslythe crank angle at which half of the gasoline mass is burnt. Theexperimental data are drawn, where present.
In agreement with test bench data, a decrease of flame duration(q90%eq10%) is observed with more advanced SOS for both advancedand retarded injection. On the contrary, the flame initiation dura-tion (q10%eSOS) increases by advancing the SOS, due to lessfavourable conditions found for combustion as one leaves the TDC,only for the advanced SOI. When injection occurs duringcompression, the non-homogeneity of the mixture generates amore complex trend for the flame initiation duration as a functionof SOS, which gets shorter and then longer as ignition is advanced.The interval q50%eSOS does not change significantly in both thecases. This may be due to the fact that after flame initiation (even ifthis is slow), pressure and temperature increase rapidly as thepiston is still approaching the TDC, thus making for a faster flamepropagation. It can be concluded that for advanced injections thescenario typical of premixed charge SI engines is reproduced,whereas a charge inhomogeneity determines a trend of flameinitiation duration that does not link easily to the spark advanceincrease.
The discrepancy between the flame duration evaluated from thenumerical and experimental pressure data may be due to lowperformance of the pressure transducer at the end of combustionprocess. On the other hand, the presence of flame in the cylinderduring the late combustion phase is well detected by the
Fig. 14. Computed CO2 mass fraction for SOI@300�; and SOI@150�; BTDC.
tion and early flame development in a research GDI (gasoline directEnergy (2014), http://dx.doi.org/10.1016/j.energy.2014.04.114
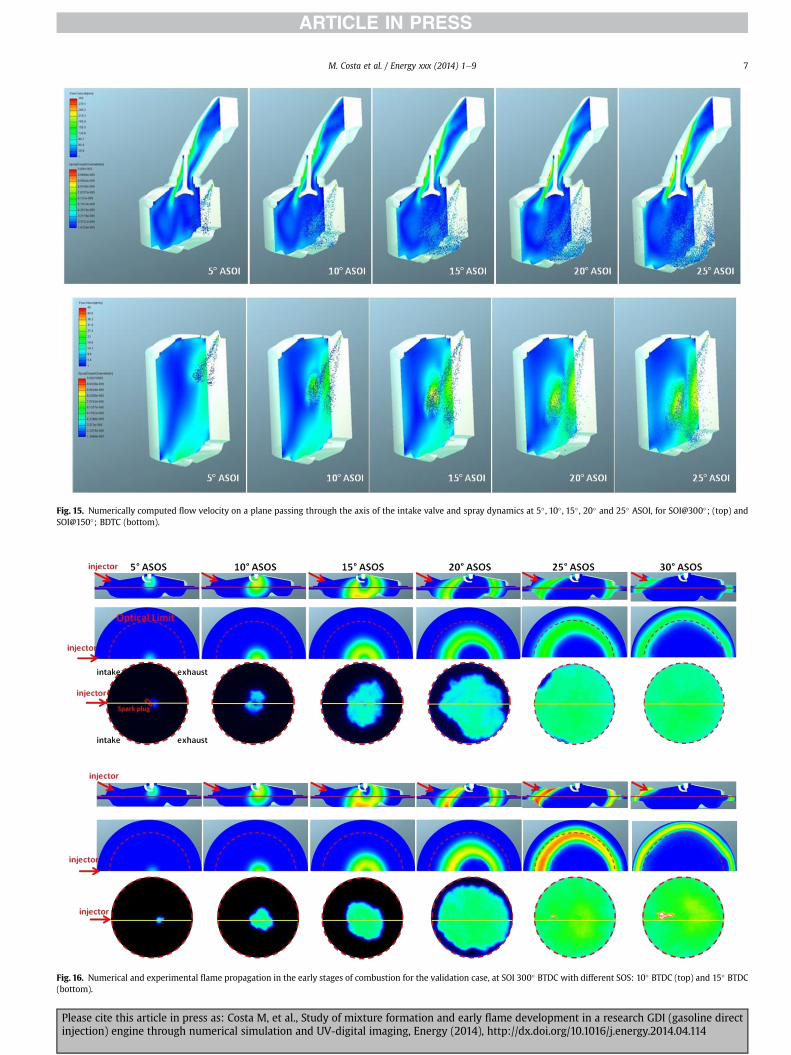
Fig. 15. Numerically computed flow velocity on a plane passing through the axis of the intake valve and spray dynamics at 5� , 10� , 15� , 20� and 25� ASOI, for SOI@300�; (top) andSOI@150�; BDTC (bottom).
Fig. 16. Numerical and experimental flame propagation in the early stages of combustion for the validation case, at SOI 300� BTDC with different SOS: 10� BTDC (top) and 15� BTDC(bottom).
M. Costa et al. / Energy xxx (2014) 1e9 7
Please cite this article in press as: Costa M, et al., Study of mixture formation and early flame development in a research GDI (gasoline directinjection) engine through numerical simulation and UV-digital imaging, Energy (2014), http://dx.doi.org/10.1016/j.energy.2014.04.114
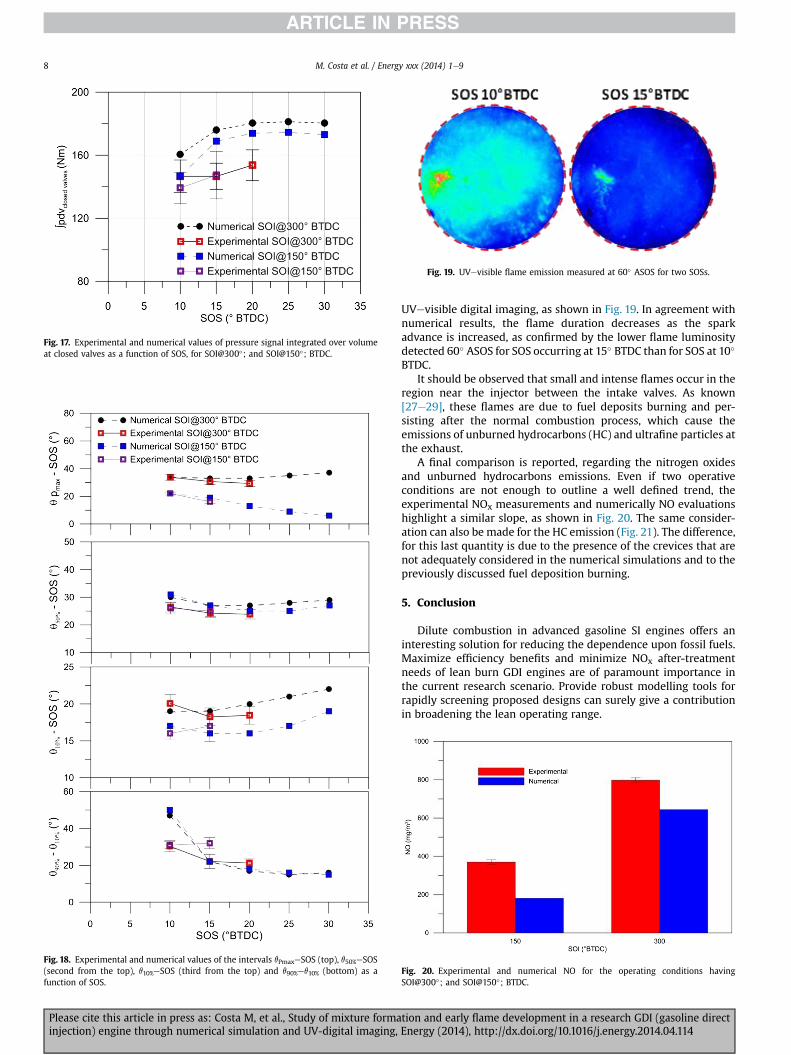
Fig. 17. Experimental and numerical values of pressure signal integrated over volumeat closed valves as a function of SOS, for SOI@300�; and SOI@150�; BTDC.
Fig. 18. Experimental and numerical values of the intervals qPmaxeSOS (top), q50%eSOS(second from the top), q10%eSOS (third from the top) and q90%eq10% (bottom) as afunction of SOS.
Fig. 19. UVevisible flame emission measured at 60� ASOS for two SOSs.
M. Costa et al. / Energy xxx (2014) 1e98
Please cite this article in press as: Costa M, et al., Study of mixture formainjection) engine through numerical simulation and UV-digital imaging,
UVevisible digital imaging, as shown in Fig. 19. In agreement withnumerical results, the flame duration decreases as the sparkadvance is increased, as confirmed by the lower flame luminositydetected 60� ASOS for SOS occurring at 15� BTDC than for SOS at 10�
BTDC.It should be observed that small and intense flames occur in the
region near the injector between the intake valves. As known[27e29], these flames are due to fuel deposits burning and per-sisting after the normal combustion process, which cause theemissions of unburned hydrocarbons (HC) and ultrafine particles atthe exhaust.
A final comparison is reported, regarding the nitrogen oxidesand unburned hydrocarbons emissions. Even if two operativeconditions are not enough to outline a well defined trend, theexperimental NOx measurements and numerically NO evaluationshighlight a similar slope, as shown in Fig. 20. The same consider-ation can also be made for the HC emission (Fig. 21). The difference,for this last quantity is due to the presence of the crevices that arenot adequately considered in the numerical simulations and to thepreviously discussed fuel deposition burning.
5. Conclusion
Dilute combustion in advanced gasoline SI engines offers aninteresting solution for reducing the dependence upon fossil fuels.Maximize efficiency benefits and minimize NOx after-treatmentneeds of lean burn GDI engines are of paramount importance inthe current research scenario. Provide robust modelling tools forrapidly screening proposed designs can surely give a contributionin broadening the lean operating range.
Fig. 20. Experimental and numerical NO for the operating conditions havingSOI@300�; and SOI@150�; BTDC.
tion and early flame development in a research GDI (gasoline directEnergy (2014), http://dx.doi.org/10.1016/j.energy.2014.04.114

Fig. 21. Experimental and numerical HC for the operating conditions havingSOI@300�; and SOI@150�; BTDC.
M. Costa et al. / Energy xxx (2014) 1e9 9
Present paper exploits information derived from both test benchand optical diagnostics characterizations of a GDI research engineto assess a 3D numerical model for the simulation of the thermo-fluidynamic in-cylinder process.
A single cylinder optical accessible engine is used for the ex-periments. Tests are carried out under slight lean burn conditionsusing commercial gasoline.
A 3D engine model is developed within the AVL FireTM envi-ronment, which uses an in-house developed sub-model for thespray dynamics.
The experimentally measured and the numerically computedpressure results prove being in good agreement as the start of in-jection and the spark timing are varied.
The model quite well reproduces the experimental combustiondevelopment in terms of flame initiation and combustion duration.
Moreover the spatial evolution of the flame in the early com-bustion stages is accurately simulated in the validation case.
It is shown that the piston head geometry and the kind ofmixture formationmode,wall-guided, make for the engine to betterbehave under advanced injection strategies for a more completeand stable lean combustion.
Nomenclature
ASOI after start of injectionASOS after start of sparkATDC after top dead centreBTDC before top dead centreCFD computational fluid dynamicsDDM discrete droplet modelECFM-3Z extended coherent flamelet model e 3 zonesEVC exhaust valve closingEVO exhaust valve openingGDI gasoline direct injectionGUI graphical user interfaceIVC intake valve closingIVO intake valve openingPFI port fuel injectionSI spark ignitionSOI start of injectionSOS start of sparkTDC top dead centreUV ultra violetWOT wide open throttle
Please cite this article in press as: Costa M, et al., Study of mixture formainjection) engine through numerical simulation and UV-digital imaging,
References
[1] Drake MC, Fansler TD, Solomon AS, Szekely JG. Piston fuel films as a source ofsmoke and hydrocarbon emissions from a wall-controlled spark-igniteddirect-injection engine; 2003. SAE paper n. 2003-01-0547.
[2] Merola SS, Sementa P, Tornatore C, Vaglieco BM. Effect of the fuel injectionstrategy on the combustion process in a PFI boosted spark-ignition engine.Energy 2010;35(2):1094e100.
[3] Alkidas AC. Combustion advancements in gasoline engines. Energy ConversManag 2007;48:2751e61.
[4] Taylor AMKP. Science review of internal combustion engines. Energy Policy2008;36(12):4657e67.
[5] Ando H, Arcoumanis C. Flow and combustion in reciprocating engines. In:Mixture preparation and combustion in four-stroke direct-injection gaso-line engines. Springer experimental fluid mechanics; 2009. pp. 1e35[chapter 3].
[6] Li T, Nishida K, Zhang Y, Hiroyasu H. Effect of split injection on stratifiedcharge formation of direct injection spark ignition engines. Int J Engine Res2007;8:205e18.
[7] Najjar YSH. Comparison of performance of a greener direct-injection strati-fied-charge (DISC) engine with a spark-ignition engine using a simplifiedmodel. Energy 2011;36:4136e243.
[8] Stan C. Direct injection systems for spark-ignition and compression-ignitionengines. SAE Publication; 2000.
[9] Park C, Kim S, Kim H, Moriyoshi Y. Stratified lean combustion characteristics ofa spray-guided combustion system in a gasoline direct injection engine. En-ergy 2012;41:401e7.
[10] Costa M, Sorge U, Allocca L. Increasing energy efficiency of a gasoline directinjection engine through optimal synchronization of single or double injec-tion strategies. Energy Convers Manag 2012;60:77e86.
[11] Olabi AG. Developments in sustainable energy and environmental protection.Simul Model Pract Theory 2011;19(4):1139e42.
[12] Drake MC, Haworth DC. Advanced gasoline engine development using opticaldiagnostic and numerical modeling. Proc Combust Inst 2007;31:99e124.
[13] Soid SN, Zainal ZA. Spray and combustion characterization for internal com-bustion engines using optical measuring techniques e a review. Energy2011;36:724e41.
[14] Williams B, Ewart P, Wang X, Stone R, Ma H, Walmsley H, et al. Quantitativeplanar laser-induced fluorescence imaging of multi-component fuel/air mix-ing in a firing gasoline-direct-injection engine: effects of residual exhaust gason quantitative PLIF. Combust Flame 2010;157(10):1866e78.
[15] Ramos JI. Internal combustion engine modelling. New York: HemispherePublishing Corporation; 1989.
[16] Wiseman MW. Spark ignition engine combustion process analysis [PhDthesis]. University of Nottingham; 1990.
[17] Aleiferis PG, Serras-Pereira J, Richardson D. Characterisation of flame devel-opment with ethanol, butanol, iso-octane, gasoline and methane in a direct-injection spark-ignition engine. Fuel 2013;109:256e78.
[18] Costa M, Sorge U, Allocca L. CFD optimization for GDI spray model tuning andenhancement of engine performance. Adv Eng Softw 2012;49:43e53.
[19] Huh KY, Gosman AD. International conference on multiphase flows, aphenomenological model of diesel spray atomisation, Tsukuba, Japan; 1991.
[20] O'Rourke PJ, Bracco FV. Modeling of drop interactions in thick sprays and acomparison with experiments. London: Institution of Mechanical Engineers(IMECHE); 1980.
[21] Nordin WH. Complex modeling of diesel spray combustion [PhD thesis].Chalmers University of Technology; 2001.
[22] Dukowicz JK. Quasi-steady droplet change in the presence of convection [LosAlamos report LA7997-MS]; 1979. Informal report Los Alamos ScientificLaboratory.
[23] Mundo C, Sommerfeld M, Tropea MC. Experimental studies of the depositionand splashing of small liquid droplets impinging on a flat surface; 1994.ICLASS-94 Rouen, France.
[24] Colin O, Benkenida A, Angelberger C. 3D modeling of mixing, ignition andcombustion phenomena in highly stratified gasoline engines. Oil Gas SciTechnol e Rev IFP Energies Nouvelles 2003;58:47e62.
[25] Zeldovich YB, Sadovnikov PY, Frank-Kamenetskii DA. Oxidation of nitrogen incombustion [M. Shelef, Trans.]. Moscow-Leningrad: Academy of Sciences ofUSSR, Institute of Chemical Physics; 1947.
[26] Irimescu A, Tornatore C, Marchitto L, Merola SS. Compression ratio and blow-by rates estimation based on motored pressure trace analysis for an opticalspark ignition engine. Appl Therm Eng 2013;61(2):101e9.
[27] Drake MC, Fansler TD, Solomon A, Szekely AG. Piston fuel films as a source ofsmoke and hydrocarbon emissions from a wall-controlled spark-igniteddirect-injection engine; 2003. SAE technical paper 2003-01-0547.
[28] Volker Sick V, Drake MC, Fansler TD. High-speed imaging for direct-injectiongasoline engine research and development. Exp Fluids 2010;49(4):937e47.
[29] Velji A, et al. Investigations of the formation and oxidation of soot insidea direct injection spark ignition engine using advanced laser-techniques;2010. SAE technical paper n. 2010-01-0352.
tion and early flame development in a research GDI (gasoline directEnergy (2014), http://dx.doi.org/10.1016/j.energy.2014.04.114