an experimental study of negative valve overlap injection effects and their impact on combustion in...
TRANSCRIPT

Fuel 117 (2014) 236–250
Contents lists available at ScienceDirect
Fuel
journal homepage: www.elsevier .com/locate / fuel
An experimental study of negative valve overlap injection effectsand their impact on combustion in a gasoline HCCI engine
0016-2361/$ - see front matter � 2013 Elsevier Ltd. All rights reserved.http://dx.doi.org/10.1016/j.fuel.2013.09.079
⇑ Tel.: +48 81 5384261; fax: +48 81 5384258.E-mail address: [email protected]
Jacek Hunicz ⇑Institute of Transport, Combustion Engines and Ecology, Lublin University of Technology, Nadbystrzycka 36, 20-618 Lublin, Poland
h i g h l i g h t s
� A simple intake port gas sampling method and FTIR analyzer were employed to measure NVO mixture composition.� Early NVO injection resulted in in-cylinder fuel reforming.� Quantitative analysis of fuel reforming intensity was performed.� Combustion of reforming products alternated the composition of unburned HC.
a r t i c l e i n f o
Article history:Received 6 July 2012Received in revised form 22 September2013Accepted 24 September 2013Available online 8 October 2013
Keywords:HCCIGasolineDirect injectionNegative valve overlapFuel reforming
a b s t r a c t
This study pertains to negative valve overlap (NVO) phenomena and subsequent combustion of gasolinein a direct injection homogeneous charge compression ignition (HCCI) engine. Experiments were per-formed at variable valvetrain settings, which resulted in NVO crank angle (CA) values ranging from157� to 182�. Fuel was injected directly into the cylinder in a single dose applied during the NVO period,and injection timings were varied from the early stage of exhaust compression to the later stage ofexhaust expansion. During the experiments, air excess ratio values were varied from a stoichiometricmixture to lean mixtures, limited by misfires occurrence. A Fourier transform infrared analytical systemand simple gas sampling method from the intake port were applied in order to analyze changes in fuelcomposition resulting from the reforming process during the NVO period. As a result of reforming, whichtook place after fuel injection during exhaust compression, up to 10.2% of fuel carbon was converted intoCO carbon. Auto-ignition promoting species were also identified in considerable quantities, where fuelconversion into acetylene was 26.5 g, ethylene – 133.7 g and formaldehyde – 13.5 g per kilogram of fuel.Certain quantities of other light unsaturated hydrocarbons and methane were identified in the fuel aswell. Furthermore, reforming products were present in the exhaust gases, where the fractional composi-tion of unburned hydrocarbons was correlated with the composition of reformed fuel after NVO. Also, theinfluence of both NVO injection timing and air excess ratio on combustion was studied. It was found thatretard of fuel injection during exhaust compression advanced combustion timing, while retard of fuelinjection during exhaust expansion retarded combustion due to thermal NVO effects. The examinationof combustion timings at a variable air excess ratio and two injection strategies: early and late NVO injec-tions, showed the effect of mixture strength and NVO thermochemistry on the main event. At late NVOinjection, applied 20 �CA after top dead center (TDC), the combustion timing was retarded both for thestoichiometric and lean mixtures, due to the mixture strength itself, while for early NVO injection,applied 40 �CA before TDC, the thermal effects of NVO played a dominant role in combustion control.However, the presence of reforming products in the mixture increased the heat release rate.
� 2013 Elsevier Ltd. All rights reserved.
1. Introduction
The main advantage of homogeneous charge compression igni-tion (HCCI) combustion systems, versus spark ignition and dieselengines, is that their use allows for substantial reduction of cylin-
der-out NOX emissions. Additionally, the fast heat release rate andachieving a close-to-ideal Otto cycle lead to their increased ther-mal efficiency in comparison to spark ignition engines.
In order to obtain auto-ignition of gasoline, it is necessary tointroduce high amounts of energy into the in-cylinder load. Thefirst attempt at HCCI combustion in a 2-stroke engine was reportedby Onishi et al. [1]. The high amount of residuals in a 2-stroke en-gine sufficiently increased the in-cylinder temperature to obtainauto-ignition. In the case of 4-stroke engines, HCCI combustion

Nomenclature
ðAFÞstoi; ðFAÞstoi stoichiometric air to fuel and fuel to air ratios
CA crank angleCAI controlled auto-ignitionCO carbon monoxideEGR exhaust gas re-circulationEVC exhaust valve closingEVO exhaust valve openingFTIR Fourier transform infraredHC hydrocarbonsHCCI homogeneous charge compression ignitionIMEP indicated mean effective pressureIVC intake valve closingIVO intake valve openingk air excess ratio
m massM molecular weightMFB mass fraction burnedNOX nitrogen oxidesNVO negative valve overlapRON research octane numberSOC start of combustionSOI start of injectionTDC piston top dead centerx mass fraction~x mole fractiony atomic ratio of hydrogen to carbon in the unburned
hydrocarbons
J. Hunicz / Fuel 117 (2014) 236–250 237
can be achieved in a number of ways. In early experiments on thiscombustion system, intake air preheating was widely used, often incombination with elevated compression ratios. The first results fora 4-stroke gasoline engine with intake air preheating were re-ported by Najt and Foster [2]. However, this technique is not appli-cable in production automotive engines. The most production-wisefeasible solution for introducing additional energy into the cylinderfluid is internal exhaust gas re-circulation (EGR) utilizing negativevalve overlap (NVO) [3].
The NVO technique allows auto-ignition of high octane numberfuels (gasoline like) at compression ratios typical of spark ignitionengines and without air preheating [4–6]. In order to trap a suffi-cient amount of exhaust in the cylinder, an exhaust valve is closedbefore top dead center (TDC) in the exhaust stroke. The trappedresiduals are then compressed and expanded after TDC. In orderto avoid excessive backflows into the intake port, the opening ofan intake valve is retarded. This technique is also referred to ascontrolled auto-ignition (CAI) [4].
An additional advantage of exhaust gas trapping is the fact thathigh temperature of the re-compressed exhaust and the presenceof water allow for fuel decomposition, a process known as reform-ing. Reforming of gasoline improves auto-ignition properties [7]and increases the heating value [8]. The process of gasoline com-bustion with the average molecular formula C7.25H12.85 can be pre-sented as follows:
C7:25H12:85 þ 10:46ðO2 þ 3:76N2Þ ���!7:25CO2 þ 6:43H2Oþ 39:33N2; ð1Þ
where the heat of the reaction is 4.187 GJ per kmole of fuel(41.86 MJ/kg). A fuel reforming reaction utilizing its own stoichiom-etric exhaust will be as follows:
C7:25H12:85 þ 0:53ð7:25CO2 þ 6:43H2Oþ 39:33N2Þ ���!11:09COþ 9:83H2 þ 20:85N2: ð2Þ
Fuel reforming is a highly endothermic reaction, it therefore in-creases the heating value of the mixture with the use of exhaustthermal energy. The combustion of the reformed mixture is ex-pressed by the following equation:
11:09COþ 9:83H2 þ 20:85N2 þ 10:46ðO2 þ 3:76N2Þ���!1:53ð7:25CO2 þ 6:43H2Oþ 39:33N2Þ; ð3Þ
and the heat of reaction is 5.519 GJ per kmole of fuel used(55.18 MJ/kg). Thus, the utilization of the exhaust thermal energyfor fuel reforming would increase the heating value by 32%, sub-stantially improving engine efficiency [8].
In-cylinder fuel reforming can be achieved via injection of fuelinto re-compressed exhaust during the NVO period. However, fuelreforming with the use of exhaust containing a certain amount ofoxygen can result in partial fuel oxidation, thus the NVO processesare exothermic rather than endothermic. As a result, it is likely thatthe process will be disadvantageous from the point of view of en-gine thermal efficiency.
Urushihara et al. [9] applied early NVO injection in order to ob-tain stable engine operation at highly diluted mixtures. They foundthat injection of the whole fuel during exhaust compression ad-vances auto-ignition, however, accompanying deterioration of en-gine thermal efficiency was noted. The improvement of thermalefficiency was obtained via split fuel injection and reduction ofthe amount of reformed fuel. Recently, a lot of effort was put intooptimizing fuel injection strategies in order to obtain the simulta-neous reduction of fuel consumption and exhaust emissions [7,10–13], including also research by the author of this study [14].
Fuel vaporization, reforming and possible oxidation during theNVO period strongly influence the in-cylinder temperature andthe amount of intake air. The oxidation of unburned hydrocarbonsand CO during NVO can affect the in-cylinder temperature as well[15]. Thus, the NVO thermodynamics determines the compressiontemperature histories during the main event and controls auto-ignition timing [16]. In order to isolate the chemical effects ofreforming and thermal effects of the NVO thermodynamics onthe subsequent combustion, it is necessary to analyze species for-mation during NVO. Tsolakis et al. [17] reported results obtainedwith the use of external catalytic reformers. Apart from CO andhydrogen, methane was also identified as a reforming product.
Arning et al. [18] utilized a direct sampling technique in orderto extract from the cylinder a mixture of exhaust and gasoline in-jected during the NVO period. Split fuel injection was applied to as-sess the effects of NVO injection timing and the amount of fuelinjected on the reforming process and combustion timing. Themixture was sampled from the cylinder at the end of the compres-sion stroke and the skip-firing technique was applied in order toexclude the effect of the second injection. With the use of gas chro-matography, the authors differentiated between light (C4 or light-er) and heavy (C5 and heavier) hydrocarbons, concluding thatneither the injection timing during NVO nor the mass of fuel in-jected affected the composition of hydrocarbons. The variationsin auto-ignition timings at variable injection strategies were attrib-uted solely to the heat release during the NVO period.
Koopmans et al. [19] also underlined the impact of NVO heat re-lease on combustion timing. Based on a modeling study, they con-cluded that the thermal effects of NVO phenomena play a majorrole in terms of auto-ignition timing control via injection timing

Table 1Single cylinder research engine specifications.
Displacement 498.5 cm3
Bore 84 mmStroke 90 mmCompression ratio 11.7No of valves 2Intake cam profile 9.4 mm, 235 �CAIntake valve lift 2.4. . .9.4 mmExhaust cam profile 9.2 mm, 235 �CAExhaust valve lift 2.2. . .9.2 mmFuel injector Solenoid actuated swirl-typeFuel-rail pressure 11 MPa max.
238 J. Hunicz / Fuel 117 (2014) 236–250
and the quantity of fuel injected during NVO; this observation,however, was limited to lean mixtures and large fuel doses only.For richer mixtures (air excess ratios k < 1.2) and small amountsof fuel injected during NVO, it was hypothesized that intermediateproducts of NVO phenomena played an important role in promot-ing auto-ignition.
Waldman and Aroonsrisopon et al. [20,21] performed an exper-imental and computational study into the effects of gasoline NVOinjection. On the basis of experimental investigations, they wereable to observe that both fuel reforming and heat release tookplace during the NVO period after fuel injection during exhaustcompression [20]. However, the thermal and chemical effects onthe subsequent combustion were dependent on the fuel share in-jected during NVO. It was found that for small quantities of fuel,heat release during NVO was the sole factor determining combus-tion timing. For large quantities of fuel injected in a single doseduring exhaust compression, the authors hypothesized that thethermal effect would be reduced in favor of the chemical effectof fuel decomposition. The amount of heat released during theNVO period was independent of the quantity of fuel injected inthe early stage of NVO, as it was limited by oxygen availability.Nevertheless, increasing the mass of fuel injected during exhaustcompression resulted in an auto-ignition advance due to the chem-ical effect. The computations of species formation during the NVOperiod showed that after fuel injection, CO was produced, howeverit was primarily a result of fuel oxidation [21]. Fuel reforming ledto a substantial increase in ethylene, propene and formaldehydecontent in the exhaust-fuel mixture. Hydrogen, even if producedvia fuel reforming, was consumed by the NVO heat release.
Fitzgerald and Steeper [22] performed a computational analysisof chemical reactions during NVO. The engine geometry was simi-lar to the one used in this study. Under lean mixture conditions andat small quantities of fuel injected during NVO, the calculations re-vealed that over 40% of fuel carbon was converted into CO. The de-grees of fuel carbon conversion into methane, lighter unsaturatedhydrocarbons as well as aldehydes carbon did not exceed 5%. Theauthors emphasized the importance of heat release during NVOand its effect on combustion phasing. However, they also observedthat fuel injection at the late stage of exhaust re-compression re-sulted in a decrease in the intake valve closing (IVC) temperature,while auto-ignition advance occurred. This observation was attrib-uted to chemical rather than thermal effects of NVO phenomena.The continuation of the research by Puranam and Steeper [23]led the authors to emphasize the role of even small quantities ofacetylene in promoting auto-ignition.
Recently, Yu et al. [24] utilized the in-cylinder gas samplingmethod and Fourier transform infrared (FTIR) analytical systemin order to detect reacting species in reformed fuel after NVO injec-tion. The comparison of hydrocarbons composition at the end ofcompression stroke for two cases: the whole fuel injected into in-take manifold and half of the fuel injected directly during the NVOperiod, showed that the amount of light hydrocarbons (includingunburned and partially oxidized hydrocarbons) increased by 70%as a result of NVO fuel injection. On the basis of a chemical kineticsimulation, the authors identified the species which promote, re-tard or are neutral towards auto-ignition. The identified auto-igni-tion promoting compounds included ethane, ethylene, acetylene,formaldehyde and methanol, of which acetylene was the mosteffective. Acetaldehyde, propene and methane were identified asneutral compounds, while 1,3-butadiene exhibited auto-ignitionretarding properties.
The present study was aimed at an experimental analysis ofNVO phenomena in terms of thermodynamic processes as well asthe chemical conversion of gasoline. The experiments were per-formed on a single cylinder engine described in the next section.The thermal phenomena occurring during the NVO period were
analyzed on the basis of in-cylinder pressure measurements. Thechemical composition of the working fluid was measured bothafter the main combustion (exhaust composition) and after NVO,via sampling of the working fluid from the intake port. The pro-posed simple sampling method enabled the identification of fuelconversion resulting from NVO thermochemistry without usingsophisticated in-cylinder sampling systems and influencing ther-modynamic compression ratio of the engine, as is the case withextracting gas from the cylinder. The identified NVO thermody-namic processes and changes in fuel composition were referencedto the main event combustion. Furthermore, the impact of fuelmodifications via the reforming process on exhaust hydrocarbonscompositions was demonstrated.
2. Experimental apparatus and method
2.1. Research engine
The examinations were performed using a single cylinder re-search engine coupled to a direct current dynamometer. The en-gine was equipped with a fully variable valvetrain mechanism.All valvetrain parameters could be changed independently for theintake and exhaust valves during engine operation. Variable valvelift was achieved with the use of a hydraulic device, described indetail in Ref. [25]. The research engine had a bowl-shaped combus-tion chamber located in the engine head. The piston face was pro-truding on its perimeter and approached the cylinder head closelyat TDC, which generated some amount of squish. The main engineparameters are specified in Table 1.
A solenoid swirl-type injector was used for fuel metering. Theangle of the main fuel stream cone was 67�. The injector was posi-tioned tangentially to the swirl generated by the shape of the in-take port and inclined by 38� in relation to the cylinder axis. Thedesign of the combustion chamber was described in detail in Ref.[14].
2.2. Data acquisition and analysis of combustion process
The engine test bench was equipped with all necessary mea-surement and control instruments. Fuel consumption was mea-sured using a fuel balance with the measurement period of 30 s.Intake air flow was measured with a thermal mass flow meter.The engine was also equipped with a set of pressure and tempera-ture transducers in order to control the thermodynamic conditionsof all media; intake, exhaust, cooling liquid, etc.
In-cylinder pressure was measured with the use of a miniaturepressure transducer installed directly in the engine head. Pressureand other crank angle (CA) based parameters were recorded with aconstant angular resolution of 0.1 �CA for 100 consecutive cycles.In-cylinder temperature was calculated with the use of the idealgas equation of state, as an average value for the whole volumeof the combustion chamber. The presented curves of in-cylinder

J. Hunicz / Fuel 117 (2014) 236–250 239
pressure and temperature are the ensemble average of 100 cycles.The net heat release rate was calculated according to the first lawof thermodynamics, where the specific heat ratio at each point(crank angle) was calculated on the basis of the in-cylinder tem-perature and the instantaneous mixture composition. Crank anglesat 5% mass fraction burned (MFB) and 95% MFB were obtainedfrom the cumulative heat release curves. The above combustiontiming parameters were calculated for each cycle separately andthen averaged.
The composition of exhaust gas was measured with the FTIRmulti-compound analytical system. Air excess ratio (k) was calcu-lated with the use of a carbon balance equation for ‘‘wet’’ exhaustanalysis [26]:
k ¼ FA
� �stoi
Mair
Mfuel
1þ ~xHC � 0:5~xCO þ 0:5~xH2O
~xHC þ ~xCO þ ~xCO2
� 0:5y� �
; ð4Þ
where Mair is the average molecular weight of air, Mfuel is the molec-ular weight of fuel per single atom of carbon, ðFAÞstoi is the stoichiom-etric fuel to air ratio by mass, ~xi is the mole fraction of ithcompound, where the HC content is expressed as C1 and y is theatomic ratio of hydrogen to carbon in the unburned hydrocarbons.
The mass of trapped residuals was calculated using the ideal gasequation of state based on the volume, pressure and temperaturevalues at the exhaust valve closing (EVC) event. In order to avoiderrors in the measured pressure signal due to vibrations at EVC,the pressure at the end of the exhaust was calculated with theuse of a recompression model. Part of the in-cylinder pressuretrace from EVC to TDC was approximated by the polytropic for-mula and then the EVC pressure was calculated from the obtainedrecompression pressure function. The exhaust temperature wasprovided by a thermocouple located in the exhaust port close tothe valve. This approach is commonly used for the estimation ofthe exhaust mass trapped in the cylinder and the obtained datacorresponds with that from direct measurement methods [27].The internal EGR rate was expressed as a ratio of trapped residualsmass to the whole in-cylinder mass, including fuel.
2.3. Analysis of fuel reforming
The assessment of changes in fuel structure as a result of NVOthermochemistry was performed by means of FTIR analysis ofthe exhaust-fuel mixture after the NVO period. Extracting theNVO exhaust-fuel mixture without the necessity of in-cylindergas sampling was possible due to backflow phenomena. A gas sam-pling probe, similar to the one used typically for exhaust sampling,was placed in the intake port close to the valve and the valvetrainwas set in order to achieve a high backflow rate before the IVCevent. Thus, the mixture of retained residuals and injected fuelwas present in the intake duct until the next intake valve opening(IVO) event. The mixture from the intake port was sampled contin-uously during engine operation.
In order to analyze the composition of the NVO exhaust-fuelmixture extracted from the intake port, it is necessary to assessthe air dilution ratio of the mixture. However, due to periodic back-flows and imperfect mixing of the backflow gas with fresh air inthe intake duct, the dilution of the NVO exhaust-fuel mixture isuncontrollable. Moreover, the dilution ratio is difficult to evaluate.Standard methods utilized for the estimation of the EGR rate (e.g.on the basis of the exhaust and intake CO2 content) are not appli-cable, as CO2 as well as other analyzed species can be consumed orproduced during the NVO period. Thus, in order to minimize the ef-fect of the dilution ratio on the identified fuel conversion degreeinto specific species, all concentrations were referenced to themass of fuel using a procedure analogous to that ordinarily usedfor exhaust gas analysis.
The apparent air excess ratio of the intake port sample was cal-culated using the carbon balance (Eq. (4)). The dilution ratio of theNVO exhaust-fuel mixture by air, using air excess ratios of the in-take port sample and the exhaust sample, can be expressed by thefollowing formula:
mair;intake
mNVO¼ kintake
ðFAÞstoi þ EGR � kexhaust: ð5Þ
It should be noted that the compositions of the intake port sam-ples differ from typical exhaust samples. Provided that no oxida-tion during the NVO period takes place and main eventcombustion is complete, the hydrocarbons content in the NVO ex-haust-fuel mixture would be equal to the mass of fuel injected. Thedilution of the NVO exhaust-fuel mixture by the intake air providesHC concentrations in the intake sample comparable with thosetypical of exhaust gases, however, it substantially reduces CO2
and H2O concentrations when compared to exhaust gas composi-tion. In the case of exhaust gas, quantities of CO2 and H2O intro-duced with intake air are usually negligible, while for the intakeport sample these components constitute substantial fractions inthe analyzed gas. For the dilution ratio estimated on the basis ofthe carbon balance (Eq. (4)), the presence of CO2 affects accuracyto a high extent, while the H2O effect is negligible. Also, the assess-ment of the dilution ratio can be biased due to the presence of hea-vier hydrocarbons, not identified with the FTIR analytical system,as shown in Appendix A.
In order to minimize the effect of the CO2 content in the ambi-ent air, the CO2 portion originating from the intake air was sub-tracted from the measured concentration in the intake portbased on the apparent dilution ratio. Afterwards, the actual intakeport sample k was calculated from the carbon balance, where themeasured CO2 content was replaced with the value originating so-lely from the exhaust-fuel mixture.
Based on the actual k value, the mole fraction of oxygen, notmeasured with the FTIR analytical system, was calculated usingthe oxygen balance equation [26]:
~xO2 ¼ 0:2095kAF
� �stoi
Mfuel
Mair~xHC þ ~xCO þ ~xCO2
� �
� 0:5 ~xCO þ ~xNO þ ~xH2Oð Þ � ~xCO2 � ~xNO2: ð6Þ
The nitrogen content was assumed to constitute the remainingfraction in the analyzed gases. Afterwards, mole fractions wereconverted into the mass basis. Concentrations of individual com-pounds by mass, related to the mass of fuel in the mixture, werethen calculated using the following equation:
mi
mfuel¼ xi 1þ k
AF
� �stoi
� �; ð7Þ
where xi is the mass fraction of the ith component. However, theconcentrations of species identified in the intake port sample withthe above approach also included main event combustion products,introduced with trapped residuals. Thus, in order to isolate speciesoriginating solely from fuel injected during the NVO period, the ex-haust species present in the trapped residuals were subtracted withthe use of the following formula:
mi
mfuel
� �fuel
¼ 11� EGR
mi
mfuel
� �intake
� EGRmi
mfuel
� �exhaust
� �; ð8Þ
where fuel conversion degrees into species for the exhaust samplewere calculated using the same procedure as for the intake sample.
2.4. Experimental conditions and procedure
The engine was fuelled with commercial gasoline 95 RON froma single batch. The experiments were conducted at one crankshaft

Fig. 1. EGR rate with respect to air excess ratio at variable NVO and two mixtureformation strategies.
240 J. Hunicz / Fuel 117 (2014) 236–250
rotational speed of 1500 rev/min. The cooling liquid temperatureat the engine outlet was kept constant at 87 �C ± 1. The enginewas naturally aspirated and the intake air was heated up by awater jacket around the intake pipe. The average intake tempera-ture was maintained at a level of about 40 �C. The engine was oper-ated in the NVO mode with reduced valve lifts, which resulted ininternal EGR. The applied valvetrain settings are presented in Ta-ble 2. As demonstrated by earlier research, the EGR rate is con-trolled mainly by exhaust valve timing, while intake valve timingaffects SOC to a considerable extent [25]. Advancing as well asretarding the intake valve timing delays auto-ignition. Exhaustvalve timings applied in the present experiments covered theapplicable range of EGR rates. Intake valve timings were tuned inorder to provide the earliest possible auto-ignition.
In the present experiments, the technique using a single fuelinjection was selected and fuel rail pressure was set to 96 bar. Itis obvious that the application of split fuel injection, where themass fraction of fuel injected during the NVO period is reduced,provides a better fuel economy than single NVO injection[7,9,11], however, this selection was based on the stoichiometryof fuel reforming. Theoretically, the reforming of gasoline requires53% of its own stoichiometric exhaust (Eq. (2)). At internal EGRrates applied during the experiments, the introduction of thewhole fuel dose during the NVO period provided exhaust-fuel com-position in the appropriate range for reforming the entire quantityof fuel injected.
Two sets of experiments were performed with a start of injec-tion (SOI) timing sweep and air excess ratio (k) sweep.
In the first set of experiments (SOI timing sweep), the mainevent k, obtained from exhaust composition, was kept at a constantlevel of 1.1 and controlled via the amount of fuel injected. Aslightly lean mixture was selected for this experiment as, accordingto the literature, the presence of oxygen in the exhaust gas inten-sifies the fuel reforming process [8]. Also, at k = 1.1, the EGR ratewas the least affected by injection timing, thus the reforming stoi-chiometry (exhaust-fuel mixture strength) was almost constant.The start of injection was varied during the NVO period from theearly stage of exhaust compression to the later stage of exhaustexpansion.
On the basis of the identified chemical fuel modifications andcombustion course analysis for variable SOI, two characteristicSOI timings: 40 �CA before TDC during NVO (early NVO injection)and 20 �CA after TDC (late NVO injection), were selected for theexperiments with k sweeps. The application of injection beforeTDC resulted in fuel reforming. Fuel injection after NVO did not re-sult in chemical modifications of the fuel, however, it enabled thecreation of a homogeneous charge. Moreover, these two character-istic injection timings provided local minima in terms of 5% MFB,thus enabling the application of leaner mixtures before occurrenceof misfire. Also, the most stable operation expressed by the coeffi-cient of variation in the indicated mean effective pressure (IMEP)was achieved for these two injection timings. For each valvetrainsetting, specified in Table 2, the main event k was varied via fuelquantity, from a stoichiometric mixture to the misfire limit.
Table 2Valvetrain settings (0 �CA at NVO TDC).
NVO (�CA) 157 165 173 182IVO (�CA) 83 85 87 89IVC (�CA) 213 215 217 219EVO (�CA) 527 521 515 508EVC (�CA) 646 640 634 627
Intake valve lift (mm) 3.6Exhaust valve lift (mm) 2.9
It should be noted that the k effect on the engine load was moresignificant than the one resulting solely from the air excess ratio,due to the impact of the variable EGR rate. Fig. 1 shows the EGRrates for k sweep experiments. Given that the entire in-cylindermass during the main event for all experiments varied in a narrowrange from 375 mg to 395 mg, it can be seen from Fig. 1 that theintake fresh air was replaced by EGR in relation to air excess, mix-ture formation strategy and valve timings. Obviously, for the set k,the amount of chemical energy introduced with fuel was deter-mined by volumetric efficiency.
The applicable k values were dependent on both the NVO crankangle and the mixture formation strategy. The maximum k valuefor late NVO injection was 1.28 and it was obtained at NVO of173 �CA. The EGR rate varied between 49% and 54% (Fig. 1a) andthe mass of injected fuel was varied within the range of 12.7 mgand 9.1 mg per engine cycle. Early NVO injection enabled theextension of the applicable k to the value of 1.36 which was, how-ever, obtained at NVO of 157 �CA. At early NVO injection and underthe lean mixture regime, volumetric efficiency was reduced due tothe heat release during NVO and the resulting increase in temper-ature. Additionally, as some fuel energy was consumed duringNVO, the amount of heat released during the main combustionwas reduced as well, affecting the exhaust temperature. Thus, botheffects increased the EGR rate and made the relation of EGR to kprogressive, as shown in Fig. 1b. Under the same conditions(NVO angle = 173 �CA and k = 1.28), the EGR rate for late NVOinjection was 54%, as compared to 64% for early NVO injection.For the two analyzed cases, the fuel dilution ratio, expressed asthe mass of fuel injected divided by the mass of fresh air and themass of trapped residuals, was 41 and 54 accordingly. As a result,
Fig. 2. IMEP with respect to the fuel dilution ratio for two injection strategies forthe whole range of applied air excess ratio and valvetrain settings.

J. Hunicz / Fuel 117 (2014) 236–250 241
low load range of engine operation was expanded via early NVOinjection. The minimal achieved engine load expressed by IMEPwas at the level of 0.14 MPa, not attainable with late NVO injection,as shown in Fig. 2.
3. Results and discussion
3.1. Injection timing effect on fuel reforming
In order to assess the changes in the chemical structure of fueldue to reforming, a FTIR analysis of exhaust-fuel composition afterNVO was performed in accordance with the procedure described inSection 2.3. In this experiment, the main event air excess ratio, de-rived from exhaust analysis, was maintained constant (k = 1.1) andvalvetrain settings were set to NVO of 182 �CA, which entailed ahigh backflow rate, making it possible to extract samples fromthe intake port. Fuel was injected at variable SOI angles duringthe NVO period.
To provide more insight into the applied measurement and cal-culation procedure, a detailed analysis of one set of measurementdata is presented below. The mass of fuel, injected at 60 �CA beforeTDC in the NVO period, was 11.3 mg. The EGR rate was 0.5 at themass of the retained residuals of 190 mg. The calculated mass frac-tion of oxygen in the exhaust gas was 1.77%, thus the mass oftrapped oxygen was 3.4 mg, resulting in the NVO k value of 0.088.
The apparent k value for the intake port sample was 67.2 andthe apparent dilution ratio was 110. However, those values wereunderestimated due to the CO2 content in the ambient air (Appen-dix A). The mole fraction of CO2 sampled from the intake port was1364 ppm, while the usual fraction in the ambient air is approx.400 ppm. On the basis of the apparent dilution ratio, the fractionof CO2 originating from the ambient air was subtracted. Thus, thecalculated mole fraction of CO2 in the exhaust-fuel mixture dilutedby air would amount to 968 ppm. The CO2 background was mini-mized by replacing its measured concentration with a calculatedone. As a result, the actual NVO mixture dilution ratio was 135and the actual intake port sample k was 82.6. Due to the high molefraction of water in the ambient air, H2O was omitted in theanalyses.
In order to analyze fuel conversion into particular species, molefractions were converted to mass fractions, and the content of eachcompound was related to the mass of fuel. The composition of theexhaust port sample as well as the apparent and actual composi-tions of the intake port sample on the mass basis are shown inFig. 3. The calculated amount of CO2 in the exhaust-fuel mixture
Fig. 3. Gas composition by mass of exhaust port sample and apparent and actual intcompound in kilograms per 1 kg of fuel. Additionally, fractions of carbon containing spe
was 1.816 kg per kilogram of fuel, while in the exhaust gas itwas 3.246 kg/kg. Then, the portion of CO2 introduced with trappedresiduals was subtracted from the intake sample quantity and theobtained fuel conversion degree was related to the mass of fuel in-jected during NVO, according to Eq. (8). As a result, CO2 was foundto be produced during the NVO period in a quantity of 384 g perkilogram of fuel injected. This balance suggests that HC oxidationtook place during NVO or CO produced by fuel reforming was sub-sequently oxidized. It can be seen from the above analysis that thefuel conversion rate into CO2 is an order of magnitude lower thanthe concentration in the exhaust port sample. Thus, CO2 balancingis highly biased by its content in the ambient air and the accuracyof the dilution assessment and EGR rate calculation.
The assessments of fuel conversion into HC species and CO areless affected by the species introduced with trapped residuals andobviously neutral to ambient air. The high dilution ratio of the NVOexhaust-fuel mixture resulted in the 678 ppm mole fraction of HC(expressed as C1) in the intake port sample, while the unburned HCfraction in the exhaust port gas sample was 2508 ppm. At the sametime, the hydrocarbons and oxygenated HC in the NVO exhaust-fuel mixture comprised 468 g per kilogram of fuel, while the un-burned HC in the exhaust gas comprised 26 g. The CO content inthe intake port sample was 113 g per kilogram of fuel, while inthe exhaust gas it was 19 g. The above proportions show that theHC species and CO identified in the intake port sample originatemainly from the fuel injected during the NVO period. Nevertheless,when calculating the conversion of fuel into CO and HC, theamounts introduced by trapped residuals were subtracted in orderto provide values solely originating from fuel. The degree of fuelconversion into HC and oxygenated HC species amounted to911 g per kilogram of fuel. It should be noted that the presentedvalue is almost twice as high as the quantity in the exhaust-fuelmixture, as it is related solely to the mass of fuel injected duringNVO according to Eq. (8). CO was produced during the NVO periodin a quantity of 206 g/kg. The conversion degree of fuel carbon intospecies carbon was 110%, which is plausible if CO was produced asa result of reforming. However, if the sampled mixture includesunidentified hydrocarbons, the calculated conversion degrees areoverestimated, as shown in Appendix A.
According to Eq. (2), the reforming of fuel should produce a highcontent of free hydrogen from both the fuel and water present inthe exhaust gas. Unfortunately, the used measurement systemdid not allow for hydrogen identification. Also, the calculations ofhydrogen balance would be biased by the water content in theambient air. Nevertheless, the analysis of hydrogen mass share inmeasured hydrocarbons and oxygenated hydrocarbons indicated
ake port samples; NVO = 182 �CA, SOI = �60 �CA. Numbers show content of eachcies are shown.

242 J. Hunicz / Fuel 117 (2014) 236–250
that hydrogen comprised 97% of fuel hydrogen. It suggests that acertain quantity of hydrogen could be produced as a result of thefuel reforming process. By comparison, for late NVO injection, thewhole fuel hydrogen was identified in the analyzed species.
Fig. 4 presents the degree of fuel conversion into CO, formalde-hyde and hydrocarbons on the mass basis for variable SOI timing.When fuel was injected early during exhaust compression (thecase analyzed in detail above), fuel carbon conversion degree intoCO carbon was 10.2% (206 g CO per kilogram of fuel). By contrast,late NVO fuel injection resulted in a conversion degree lower by anorder of magnitude. As CO is one of the main reforming products, itcould be treated as an indicator of reforming. However, for a leanermixture or for split fuel injection, the increase in CO content canalso result from partial fuel oxidation due to a higher NVO air ex-cess ratio. Also, CO is likely to be consumed for CO2 production.
As a result of early NVO injection, the fuel conversion degreeinto methane comprised up to 78.3 g per kilogram of fuel, as shownin Fig. 4b. The conversion into acetylene, which is a recognizedauto-ignition promoting compound, increased by up to 26.5 g/kg.Considerable fuel conversion degrees into other, lighter unsatu-rated hydrocarbons were also identified, specifically ethylene(133.7 g/kg) and propene (70.8 g/kg). Formaldehyde, which is aproduct of reactions taking place prior to auto-ignition [28] wasalso present in a quantity of 13.5 g per kilogram of fuel (Fig. 4a).It should be noted that the content of methane, light unsaturatedhydrocarbons and oxygenated hydrocarbons was negligible for lateNVO injection. They collectively comprised 44 g per kilogram offuel. The ethane content (not presented in Fig. 4) was approx.13 g per kilogram of fuel and was independent of injection timing.Acetaldehyde was produced as a result of early NVO injection in aquantity of 33.7 g per kilogram of fuel, while for late injection itcomprised 19.7 g/kg.
Fig. 4. Degrees of fuel conversion into CO, formaldehyde and hydrocarbons afterthe NVO period with respect to the start of injection timing; NVO = 182 �CA, airexcess ratio calculated on the basis of exhaust gas composition – k = 1.1.
The obtained proportions between quantities of different HCspecies agree with the results of measurements performed by Yuet al. [24] using similar engine geometry, however, the results ofthe present study show the concentrations to be several timeshigher. For instance, Yu et al. identified 156 ppm C2H2 in the air-ex-haust mixture on the volume basis during the compression stroke.According to the present study, the achieved fuel conversion intoC2H2 would provide concentrations of approx. 840 ppm. It shouldbe noted that said authors injected only 3.7 mg of fuel into the cyl-inder during the NVO period, thus fuel conversions into species areat a similar level.
The increase in lighter HC content as a result of early NVO injec-tion versus late NVO injection was associated with the loss of hea-vier HC concentrations (Fig. 4c). The isopentane and n-pentanequantities dropped significantly, while the reduction of aromaticsreported in the literature [8] (represented by toluene in FTIR mea-surements) was observed only in a limited range of about 20%.
3.2. Injection timing and air excess ratio effects on NVOthermodynamics
Reforming is an endothermic chemical reaction, which meansthat an increase in the NVO work input is expected due to thereduction of expansion work versus compression work. Contrarily,the presence of oxygen in internally re-circulated exhaust can re-sult in heat release during the NVO period, thus less NVO work in-put would be observed.
Fig. 5 shows the NVO indicated work for all the applied valve-train settings and the k sweep experiment. The discrepancies inNVO work between measurement series result directly from en-gine mechanics, i.e. the variable NVO displaced volume. However,the variations of NVO work with k and injection timings reveal theimpact of NVO thermodynamics. For late NVO fuel injection, theindicated work was less negative with leaner mixtures (Fig. 5a),which could be associated with the decreased temperature andthe resulting lower heat transfer. Also, lesser engine fuelling re-quired less energy for fuel vaporization. In the case of the earlyinjection strategy, the NVO work input was strongly influencedby mixture strength, as shown in Fig. 5b. The leaner the mixture,the more heat was produced during the NVO period, resulting inan increase in the NVO work. However, the NVO work input forthe stoichiometric mixture and early injection was higher thanfor late injection. Endothermic reactions after fuel injection re-sulted in a reduction of expansion work versus compression energydemand. In this case, due to the lack or limited amount of oxygen,
Fig. 5. NVO indicated work with respect to air excess ratio at variable NVO and twomixture formation strategies.

Fig. 6. Calculated in-cylinder temperature during NVO at variable start of injectiontiming; NVO = 182 �CA, air excess ratio calculated on the basis of exhaustcomposition – k = 1.1.
Fig. 8. Crank angle at 5% MFB and 95% MFB with respect to SOI timing at variableNVO; k = 1.1.
Fig. 9. In-cylinder pressure for variable air excess ratio and two mixture formationstrategies; NVO = 173 �CA.
J. Hunicz / Fuel 117 (2014) 236–250 243
heat could not be produced, as it was observed under the lean mix-ture conditions.
To provide more insight into the NVO thermodynamics, Fig. 6presents the temperature curves during NVO for SOI timing sweep,whereas Fig. 7 presents the temperatures for k sweep. In order toachieve accurate in-cylinder temperature estimates with the useof the gas equation of state, in-cylinder mass and the gas constantwere varied in relation to the instantaneous fuel introduction intothe cylinder. It can be seen from Fig. 6a that for fuel injection afterTDC the temperature curves are not modified by injection timing toa high extent, however, a temperature drop due to heat consump-tion by fuel vaporization is clearly visible. In the case of fuel injec-tion before TDC, a substantial reduction of peak temperatures canbe observed (Fig. 6b). The peak in-cylinder temperature for SOI atTDC was 1110 K, while the fuel injection at 60 �CA before TDC re-sulted in reducing the peak temperature to 931 K. Theoretically,the change in the gas temperature due to fuel injection and vapor-ization can be calculated using enthalpy of vaporization and en-thalpy balance of the exhaust-fuel mixture [29]. The injection of11.3 mg of fuel into 190 mg of exhaust at a temperature of 850 Kshould result in a drop in residuals temperature by 17 K, due solelyto the enthalpy of vaporization. The further drop in temperature,resulting from mixing gases of different temperatures and differentthermodynamic properties, would amount to 41 K. The much high-er temperature differences observed between early and late injec-tion cases suggest that endothermic reactions took place. However,the end of expansion temperatures show that heat release took
Fig. 7. Calculated in-cylinder temperature during NVO at variable air excess ratioand two mixture formation strategies; NVO = 173 �CA.
place as well, which compensated for the heat consumption ofphase change and fuel reforming.
An analysis of temperature histories for the two selected fuelinjection strategies, early and late NVO injection at k sweep, re-veals relationships between the heat transfer, cooling effects ofreforming and the heating effects of heat release. In the case of lateNVO injection, a change of mixture strength from stoichiometric tok = 1.28 resulted in a decrease in the EVC temperature from 790 Kto 712 K, as shown in Fig. 7a. However, the IVO temperature wasindependent of air excess ratio and remained constant. This phe-
Fig. 10. Calculated in-cylinder temperature for variable air excess ratio and twomixture formation strategies; NVO = 173 �CA.

244 J. Hunicz / Fuel 117 (2014) 236–250
nomenon can be attributed to the impact of variable heat transferduring NVO and energy transfer to the fuel for the phase change.Using the Hohenberg equation to calculate NVO heat transfer, theobtained values varied from 21 J for a stoichiometric mixture to18 J for a lean mixture. Those values correlate with the measure-ment results which show that the NVO work changed from �17 Jto �13.5 J respectively. The changes in the NVO heat transfer re-sulted from a decrease in the start of re-compression temperature.At the same time, the thermal effect of heat exchange was drop-ping due to an increase in the mass of trapped residuals, whichgrew from 186 mg to 206 mg. Moreover, the energy consumptionfor fuel vaporization, which dropped from 4.3 J to 3.1 J, played aconsiderable role in the NVO energy balance.
For early NVO injection, the start of re-compression tempera-tures unexpectedly dropped with an increase in the air excess ratio(Fig. 7b). The exhaust temperature was determined by the air ex-cess ratio itself and the EGR rate, which was affected by air excess,as shown earlier in Fig. 1. Moreover, part of fuel chemical energywas consumed during the NVO period. It is evidenced by the indi-cated work of the NVO period, which increased due to heat releasefrom �19.8 J for a stoichiometric mixture to �3.7 J at k = 1.28(Fig. 5b). Therefore, less heat was released during the main eventcombustion, resulting in a drop in the end of combustion temper-ature, as shown in Fig. 10b. Consequently, the increase in air excessled to a drop in the exhaust temperature that was larger than thatresulting exclusively from the changes in fuel dilution by air andre-circulated exhaust. As a result of NVO thermochemistry, thetemperature at the IVO event was kept at a constant level andindependent of the EVC temperature. Heat release after early fuelinjection compensated for the exhaust temperature drop. Theamount of heat released was limited only by oxygen availability,which in the analyzed case varied from a negligible value for thestoichiometric mixture to 6.5 mg for k = 1.28. Such amount of oxy-gen would be enough for the complete combustion of 1.9 mg offuel injected and the introduction into the NVO process of heatat the level of 85 J, obviously with very low thermal efficiency.
3.3. Injection timing effect on combustion
Combustion timings, expressed as 5% and 95% MFB crank an-gles, for variable SOI and the two extreme NVO crank angles areshown in Fig. 8. For early NVO injection, the retard of SOI in therange from �60 �CA to �40 �CA resulted in an advance of 5%MFB. It can be seen from Fig. 6b that 5% MFB was correlated withthe IVO temperature. Within this SOI range, the IVC temperatureincreased by 10 K for both NVO crank angles. The presented resultsevidence that combustion advance is likely due to thermal ratherthan chemical effects. It should be noted that Fitzgerald and Stee-per [22] identified a drop in the IVO temperature where fuel wasinjected in the later stage of exhaust compression, attributing com-bustion advance to the chemical effect of NVO reactions. However,in the present experiments, the piston impingement by the fuelstream occurred for SOI later than �40 �CA. It is plausible thatwithout piston impingement, more available gaseous fuel wouldbe reformed, thus decreasing the IVO temperature.
The increase in the IVO temperature for SOI timing from�60 �CA to �40 �CA resulted in decreased volumetric efficiency.IMEP was reduced from 0.271 MPa to 0.263 MPa for NVO of 182,and from 0.325 MPa to 0.308 MPa for NVO of 157 �CA, accordingly.The observed changes in IMEP originated from lesser fuelling aswell as a deterioration of thermal efficiency. Early injection re-duced the compression work in comparison to later injection dueto the pressure decrease resulting from fuel vaporization andreforming. The analysis of the energy balance of the engine cyclerevealed that the deterioration of efficiency resulted solely froman increase in the NVO work input with SOI retard.
As mentioned earlier, for SOI between �30 �CA and 10 �CA, pis-ton impingement by the fuel stream was identified. This phenom-enon was clearly evidenced by an increase in unburned HCemissions. Thus, this range of SOI timing is not applicable withthe present combustion system geometry and injector type.
For late NVO injection, the retard of SOI from 20 �CA to 50 �CAresulted in a retard of 5% MFB. In this case, the NVO expansiontemperature (Fig. 6a) cannot account for this behavior. However,it is likely that not all fuel was vaporized before the IVO event, thusthe cooling effect of mixture formation would further reduce thein-cylinder temperature during the intake process. Also, a decreasein the IVC temperature by 5 K was noted.
It can be seen from Fig. 8 that the EGR rate resulting from NVOcrank angle has little effect on 5% MFB. At the same time, the in-creased amount of re-circulated exhaust significantly influencescombustion duration.
3.4. Air excess ratio and injection timing effects on combustion
Fig. 9 shows the in-cylinder pressure during the main event fora variable air excess ratio and for two injection strategies. It can beseen that compression pressure histories are the same for all ap-plied conditions. However, with early NVO injection and underlean mixture conditions the expansion pressure was lower thanfor late NVO injection, which resulted in a drop in the indicatedwork. For a stoichiometric mixture, IMEP was 0.29 MPa for bothinjection strategies, while at k = 1.28, IMEP was 0.19 MPa for lateNVO injection and 0.14 MPa for early NVO injection. The decreasein IMEP for early NVO injection versus late NVO injection resultedfrom lesser fuelling (a decrease in volumetric efficiency) and fromthe consumption of a certain portion of the fuel chemical energyduring the NVO period. The differences in the amounts of energyintroduced into the working fluid are clearly evidenced by a dropin the expansion temperature, as shown in Fig. 10. Also, the highamount of heat released during NVO under lean mixture condi-tions reduced the engine thermal efficiency. The indicated specificfuel consumption for late NVO injection was 347 g/(kW h), whilefor early NVO injection it was as high as 366 g/(kW h).
The in-cylinder pressure traces, shown in Fig. 9, indicate that forlate NVO injection the increase in k delays the combustion timing,while for early NVO injection the opposite effect can be observed.As seen in Fig. 10, the auto-ignition temperature was not signifi-cantly influenced by the mixture formation strategy. The averageSOC temperature was 778 K for early injection and 784 K for lateinjection. Almost equal SOC temperatures for the two mixture for-mation strategies suggest that factors determining auto-ignitiontiming are associated with thermal rather than chemical effectsof early fuel injection. These results correlate with experimentsperformed by Koopmans et al. [19], who related variations in com-bustion timing solely to the compression temperature histories.However, small changes in SOC temperature cannot be reliablyidentified on the basis of experimental measurements, and de-tailed chemical modeling is needed to analyze the role of activespecies in auto-ignition promoting. Simulations performed by Yuet al. [24] showed that under identical temperature conditions,the presence of fuel reforming products advanced auto-ignitionby 2 �CA.
It is plausible that the existence of auto-ignition promoting spe-cies created as a result of fuel reforming could enhance low tem-perature reactions prior to high temperature heat release [22]. Inorder to provide more insight into the combustion process, appar-ent net heat release curves were presented in Fig. 11. However,small quantities of heat released before the main combustion eventcould not be observed on the ensemble averaged curves of 100analyzed cycles. Due to the variability of SOC, small peaks wouldbe filtered, making identification impossible. Thus, in order to

Fig. 11. Apparent net heat release rate for variable air excess ratio and two mixtureformation strategies; NVO = 173 �CA.
J. Hunicz / Fuel 117 (2014) 236–250 245
identify low temperature heat release, the curves for only a singleengine cycle at each engine operating point were presented inFig. 11. The analyzed cycles were selected under the criterion ofIMEP and 5% MFB equal to average values obtained for the wholedata series. In other words, the most representative cycles wereused for combustion course analysis at each engine operating con-dition. The examination of Fig. 11b provides no evidence for lowtemperature reactions. However, differences in combustion for lateand early NVO injections can be observed. In the case of late NVOinjection (Fig. 11a), increasing the air excess ratio from k = 1.05 to1.28 delays SOC and reduces the heat release rate. For early NVOinjection, a change of k from 1.05 to 1.28 only slightly affectedthe SOC angle (Fig. 11b). Lesser engine fuelling resulted in lowerpeak values of the heat release rate, while the rate of heat releaseat the early stage of combustion was the same. Based on the calcu-lated SOC temperature and the analysis of heat release rate, it canbe concluded that the presence of auto-ignition promoting speciesdoes not significantly affect SOC temperature, but it acceleratesheat release.
In order to show the effects of the air excess ratio, injection tim-ing and NVO crank angle on combustion phasing, Fig. 12 presents
Fig. 12. Crank angle at 5% MFB and 95% MFB with respect to air excess ratio atvariable NVO and two mixture formation strategies.
5% MFB and 95% MFB for all engine operating conditions. For lateNVO injection, the earliest 5% MFB was observed for a slightly leanmixture, where both increasing and decreasing the air excess had adelaying effect (Fig. 12a). Also, the combustion duration was ex-tended with leaner mixtures. For early NVO injection strategy,the effect of the air excess ratio on 5% MFB became much morecomplex. With larger NVO, the leaner the mixture applied, themore advanced 5% MFB was observed (Fig. 12b). In the case ofsmaller NVO, the advancing effect of early injection and the retard-ing effect of the air excess ratio balanced each other out. It shouldbe noted that for early NVO injection the temperature at IVC in-creased linearly from 445 K at k = 1 to 470 K for lean mixtures, withonly a slight effect of the NVO angle. It is obvious that the increasein the IVC temperature is a result of exhaust enthalpy, where withthe increasing mass of trapped residuals, the temperature at IVOwas constant due to heat release during NVO, as shown inFig. 7b. Generally, two phenomena can be observed in terms ofmixture strength effect on combustion timing: the air excess ratiodelaying effect and the thermal effect of NVO heat release, with thelatter becoming stronger with increasing oxygen availability dur-ing the NVO period. It should be noted that the variations of 5%MFB result to a considerable extent from a high rate of heat releaseat the early stage of combustion, as shown in Fig. 11b. For leanermixtures, the amounts of total heat released are smaller, thus, atthe same rate, 5% MFB appears earlier. As a result, the air excess ra-tio effect on SOC is lesser than the observed trends of 5% MFB.
The NVO phenomena play an important role from the point ofview of cycle-to-cycle variability. Fig. 13 presents the relationshipbetween NVO work and crank angle at 5% MFB for 100 consecutiveengine cycles and different air excess ratios. It can be seen that forstoichiometric and slightly lean mixtures (average values), the in-crease in the NVO work input progressively retards 5% MFB. It isplausible that late auto-ignition cycles appear after rich mixturecycles that produce exhaust with a very limited amount of oxygen.Thus, the temperature drop resulting from endothermic reactionsafter fuel injection is not compensated by heat release duringNVO. Additionally, in the range of near-stoichiometric mixtures,a decrease in k retards auto-ignition. For the moderate mixture(k = 1.2), the lowest cycle-to-cycle variability of 5% MFB was ob-served. This is likely due to the balance between heat consumptionby endothermic reactions and the NVO heat release. For the leanmixture, where cyclic variability increases, the correlation between5% MFB and NVO work could be attributed to the auto-ignitionadvancing effect of NVO heat release. Sen et al. [30] found thatthe relations between NVO phenomena and combustion course re-veal a complex deterministic character. The variability of NVO heatrelease results not only from the amount of available oxygen, butalso from the imperfect and variable mixing of the injected fuelwith the retained residuals [31].
Fig. 13. Crank angle at 5% MFB with respect to NVO indicated work of the previouscycle at variable air excess ratio; NVO = 173 �CA, early NVO injection.

Fig. 15. Indicated specific NOX emissions with respect to IMEP for two mixtureformation strategies.
246 J. Hunicz / Fuel 117 (2014) 236–250
3.5. Air excess ratio and injection timing effects on exhaust emissions
Emissions of regulated toxic compounds, expressed as indicatedspecific values for two mixture formation strategies under condi-tions of variable k and variable NVO crank angle, are shown inFig. 14. For stoichiometric and slightly lean mixtures, the CO emis-sions are practically independent of NVO crank angle and mixtureformation strategy. They are determined by mixture strength,though. For leaner mixtures, the CO emissions increase more sig-nificantly for early NVO injection when compared to late NVOinjection. This is a straightforward consequence of the higher fueldilution by re-circulated exhaust at early NVO injection resultingin a drop in the combustion temperature. Also, the increase in spe-cific fuel consumption at low loads plays an important role here.
The emissions of unburned hydrocarbons are determined byboth the air excess ratio and NVO crank angle. The presented rela-tionships are similar for both mixture formation strategies. The in-crease in terms of HC emissions in the range of lean mixtures is aresult of fuel dilution and temperature drop. For a constant IMEP,the HC emissions were not affected by the air excess ratio. How-ever, early injection resulted in a reduction of HC content. At IMEPof 0.25 MPa, the HC emissions were approx. 11 g/(kW h) and 8 g/(kW h) for late and early NVO injections respectively. Due to signif-icant changes in the fuel chemical composition, it was expectedthat the unburned HC fractional composition would change aswell, which will be discussed later in this section.
The NOX emission curves versus air excess ratio, as shown inFig. 14, are similar to those observed for spark ignition engines.However, the maximum values are several times lower and theemissions drop more significantly at leaner mixtures. It is associ-ated with the effect of the air excess ratio itself as well as withthe increasing EGR rate. For the same IMEP value, early injectionincreases NOX emissions by 0.5 g/(kW h) in the range of higherloads. In general, NOX emissions increase by an order of magnitudefor every 0.1 MPa of IMEP, as shown in Fig. 15. The problem ofexcessive NOX content at high loads can be resolved via the appli-cation of leaner mixtures. It is achieved by applying a boost [32,33],however an increase in terms of unburned HC emissions was re-ported [34].
Considering the fact that reforming provides substantial fuelmodifications and it is affected by both the amount of the retained
Fig. 14. Indicated specific emissions of CO, unburned HC and NOX with respect
residuals and air excess ratio, particular attention should be paid tothe fractional composition of unburned HC. Fig. 16 shows the emis-sions of selected HC species with respect to all testing conditions.In order to enable a comparison between the presented valuesand the fuel conversion resulting from reforming, the emissionsare expressed as the mass of each compound in relation to the fuelmass. The comparison of lighter and heavier hydrocarbons emis-sions trends for early and late NVO injection strategies shows thatchanges in fuel composition resulting from reforming are reflectedin the unburned HC structure.
Among different hydrocarbons, excessive methane emissionscan pose a challenge in the light of future emission standardsdue to low CH4 conversion efficiency of catalytic converters at typ-ically low exhaust temperatures of HCCI engines [35]. Fig. 16shows that early NVO injection resulted in a substantial increasein the methane content compared to late NVO injection. For lateNVO injection, the emissions of CH4 varied within the range of0.23–0.81 g per kilogram of fuel and comprised approx. between1% and 2% of the total hydrocarbons on the mass basis. The highestshare of CH4 in total HC was observed for the stoichiometric mix-ture and was decreasing with k value up to k = 1.05. For leaner mix-tures, a slight increase was noted. For early NVO injection, the CH4
emissions varied from 0.7 to 1.8 g per kilogram of fuel for k approx.1.05, and increased substantially when k was increased. Also, theemissions were higher for larger NVO crank angles, where less fuel
to air excess ratio at variable NVO and two mixture formation strategies.

Fig. 16. Specific exhaust emissions of hydrocarbons with respect to air excess ratio at variable NVO and two mixture formation strategies.
J. Hunicz / Fuel 117 (2014) 236–250 247
was injected into larger quantities of retained residuals at the samek. The CH4 content in the total unburned HC varied from 4% for theslightly lean mixture and NVO = 157 �CA to 11% for k = 1.2 andNVO = 182 �CA. For the last conditions, the emission was ashigh as 3.1 g per kilogram of fuel, which resulted in the indicatedspecific value of 1.14 g/(kW h). It should be noted that theexhaust temperature under the lean mixture conditions was be-tween 600 K and 680 K, while the methane light-off (50% conver-sion) temperature in a 3-way catalytic converter is approx. 800 K[36]. Thus, the cylinder-out CH4 emissions can be treated as tail-pipe emissions for engines equipped with 3-way catalyticconverters.
For late NVO injection, the emissions of acetylene were withinthe range of 0.35–0.75 g per kilogram of fuel, where the contentin unburned hydrocarbons decreased approx. from 2% for the stoi-chiometric mixture to 1% for the lean mixture, regardless of the ap-plied NVO crank angles. The emissions of ethylene were correlatedwith the total HC emissions and comprised from 4% to 5% of totalhydrocarbons. For early NVO injection, the effects of NVO crank an-gle and mixture strength on the emissions of acetylene and ethyl-ene were the same as in the case of CH4. The quantities of bothcompounds were clearly correlated with the CH4 quantities, wherethe emissions of C2H2 corresponded to 55% and the emissions ofC2H4 to 180% of CH4 emissions, respectively.
The emissions of propene and 1,3-butadiene, not shown inFig. 16, were independent of the air excess ratio, however, earlyNVO injection increased the emissions of both compounds. TheC3H6 content varied within the range from 0.9 g per kilogram of
fuel for late NVO injection to 1.5 g per kilogram of fuel for earlyNVO injection, while the content of C4H6 varied from 0.3 to 0.6,respectively. The emissions of oxygenated hydrocarbons (HCHOand CH3CHO) were independent of the mixture formation strategy,however, the formaldehyde content rose from 0.75 to 1.5 g perkilogram of fuel with increasing the air excess ratio, while the con-tent of acetaldehyde varied approx. from 1 to 2 g per kilogram offuel, respectively.
The emissions of heavier HC, i.e. pentane (sum of n-pentane andisopentane) and toluene, which represented all aromatics in FTIRmeasurements, changed contrarily to lighter HC. For late NVOinjection, the emissions were correlated with the total HC emis-sions and comprised in total HC from 50% to 55% for C5H12 andfrom 33% to 36% for aromatics. For early NVO injection, the emis-sions of heavier hydrocarbons remained constant throughout var-iable air excess ratios as well as variable NVO crank angles.
4. Conclusions
A gasoline HCCI engine with a fully variable valvetrain and di-rect fuel injection was used for the analysis of NVO phenomenaand their impact on the subsequent combustion. The investigationwas carried out for a single fuel injection, applied during the NVOperiod. A simple gas sampling method and FTIR analytical systemwere employed to assess changes in fuel composition resultingfrom reforming. The findings of this study can be summarized asfollows:
248 J. Hunicz / Fuel 117 (2014) 236–250
1. Fuel injection at the early stage of NVO (during exhaust com-pression) enabled fuel reforming. As a result, a substantial por-tion of fuel was converted into carbon monoxide, methane andlighter (C4 and less) unsaturated hydrocarbons as well as oxy-genated hydrocarbons, where the conversion degree of fuel car-bon into species carbon exceeded 46%. NVO reactions resultedin the conversion of 1 kg of fuel into the following quantitiesof species: CO – 206 g, methane – 78.3 g, acetylene – 26.5 g, eth-ylene – 133.7 g, propene – 70.8 g, formaldehyde – 13.5 g. Forlate NVO injection (during exhaust expansion), the concentra-tions of the above species were negligible, with the fuel carbonconversion into species carbon amounting to 4.6%.
2. NVO endothermic reactions resulted in a significant drop in thein-cylinder temperature, much greater than that resulting fromthe energy demand for fuel phase change. However, when oxy-gen was available during the NVO period, the endothermic reac-tions and energy consumption for fuel vaporization werecompensated by heat release. Moreover, for variable air excessratio and accompanying differences in the exhaust valve closingtemperature, NVO heat release provided constant temperatureat intake vale opening event.
3. NVO reforming reactions and the presence of reforming prod-ucts did not influence auto-ignition temperature to a significantextent. However, early NVO injection at lean mixtures advanced5% mass fraction burned when compared to late NVO injectiondue to the thermal effects of NVO heat release. Nevertheless,the presence of auto-ignition promoting species increased therate of heat release.
4. Changes in the fractional structure of fuel hydrocarbons thatresulted from early NVO injection were reflected in the compo-sition of unburned hydrocarbons in the exhaust gases. Amongdifferent compounds, excessive methane emissions can pose achallenge in the light of future emission standards. At lateNVO injection, methane comprised between 1% and 2% of totalunburned hydrocarbons by mass, while at early NVO injection,under lean mixture conditions, the methane content increasedup to 11%.
Acknowledgements
The research was supported by the Polish National Science Cen-ter under Grant No. 2012/05/B/ST8/00077. The assistance of Dr.Grzegorz Koszalka from Lublin University of Technology with thefinal editing of the paper is also gratefully acknowledged.
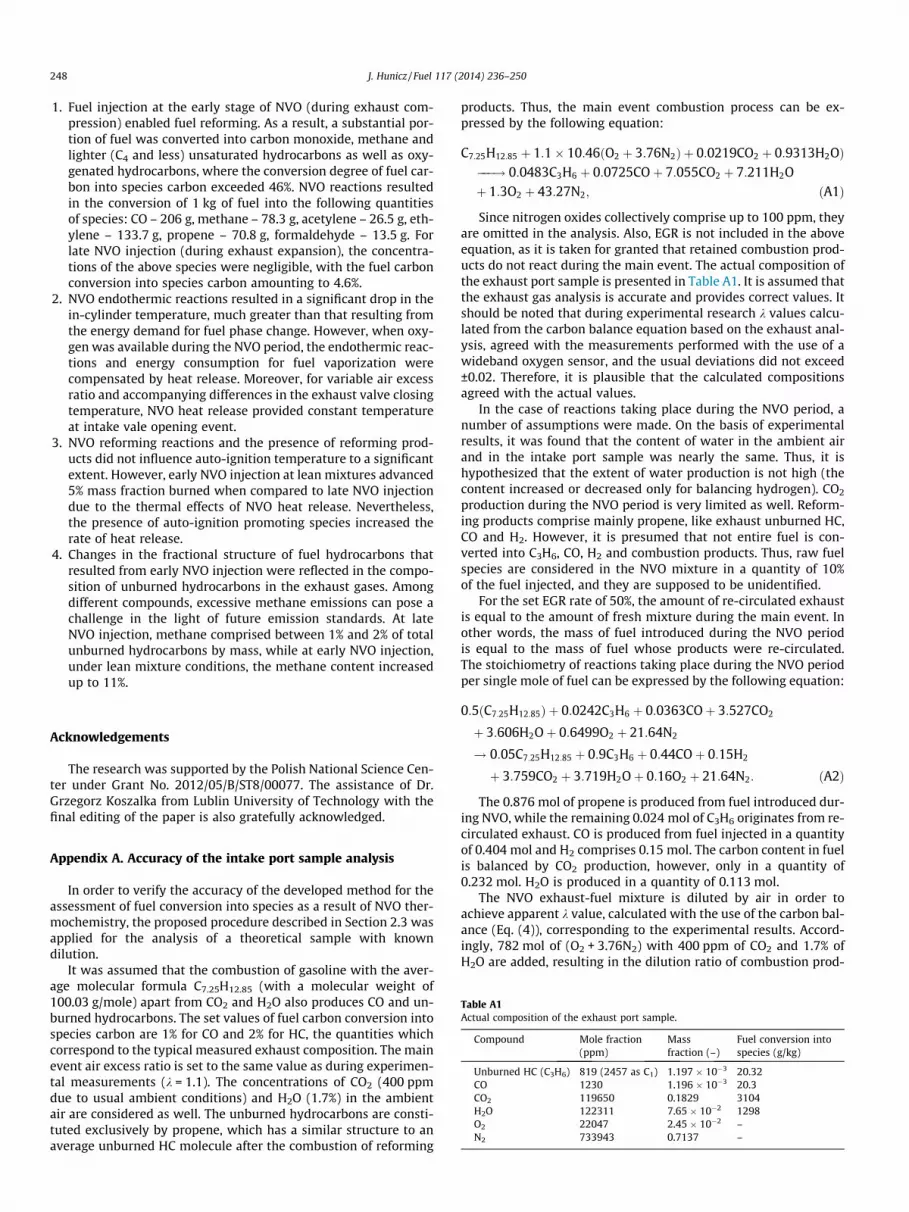
Table A1Actual composition of the exhaust port sample.
Compound Mole fraction(ppm)
Massfraction (–)
Fuel conversion intospecies (g/kg)
Unburned HC (C3H6) 819 (2457 as C1) 1.197 � 10�3 20.32CO 1230 1.196 � 10�3 20.3CO2 119650 0.1829 3104H2O 122311 7.65 � 10�2 1298O2 22047 2.45 � 10�2 –N2 733943 0.7137 –
Appendix A. Accuracy of the intake port sample analysis
In order to verify the accuracy of the developed method for theassessment of fuel conversion into species as a result of NVO ther-mochemistry, the proposed procedure described in Section 2.3 wasapplied for the analysis of a theoretical sample with knowndilution.
It was assumed that the combustion of gasoline with the aver-age molecular formula C7.25H12.85 (with a molecular weight of100.03 g/mole) apart from CO2 and H2O also produces CO and un-burned hydrocarbons. The set values of fuel carbon conversion intospecies carbon are 1% for CO and 2% for HC, the quantities whichcorrespond to the typical measured exhaust composition. The mainevent air excess ratio is set to the same value as during experimen-tal measurements (k = 1.1). The concentrations of CO2 (400 ppmdue to usual ambient conditions) and H2O (1.7%) in the ambientair are considered as well. The unburned hydrocarbons are consti-tuted exclusively by propene, which has a similar structure to anaverage unburned HC molecule after the combustion of reforming
products. Thus, the main event combustion process can be ex-pressed by the following equation:
C7:25H12:85 þ 1:1� 10:46ðO2 þ 3:76N2Þ þ 0:0219CO2 þ 0:9313H2OÞ���! 0:0483C3H6 þ 0:0725COþ 7:055CO2 þ 7:211H2Oþ 1:3O2 þ 43:27N2; ðA1Þ
Since nitrogen oxides collectively comprise up to 100 ppm, theyare omitted in the analysis. Also, EGR is not included in the aboveequation, as it is taken for granted that retained combustion prod-ucts do not react during the main event. The actual composition ofthe exhaust port sample is presented in Table A1. It is assumed thatthe exhaust gas analysis is accurate and provides correct values. Itshould be noted that during experimental research k values calcu-lated from the carbon balance equation based on the exhaust anal-ysis, agreed with the measurements performed with the use of awideband oxygen sensor, and the usual deviations did not exceed±0.02. Therefore, it is plausible that the calculated compositionsagreed with the actual values.
In the case of reactions taking place during the NVO period, anumber of assumptions were made. On the basis of experimentalresults, it was found that the content of water in the ambient airand in the intake port sample was nearly the same. Thus, it ishypothesized that the extent of water production is not high (thecontent increased or decreased only for balancing hydrogen). CO2
production during the NVO period is very limited as well. Reform-ing products comprise mainly propene, like exhaust unburned HC,CO and H2. However, it is presumed that not entire fuel is con-verted into C3H6, CO, H2 and combustion products. Thus, raw fuelspecies are considered in the NVO mixture in a quantity of 10%of the fuel injected, and they are supposed to be unidentified.
For the set EGR rate of 50%, the amount of re-circulated exhaustis equal to the amount of fresh mixture during the main event. Inother words, the mass of fuel introduced during the NVO periodis equal to the mass of fuel whose products were re-circulated.The stoichiometry of reactions taking place during the NVO periodper single mole of fuel can be expressed by the following equation:
0:5ðC7:25H12:85Þ þ 0:0242C3H6 þ 0:0363COþ 3:527CO2
þ 3:606H2Oþ 0:6499O2 þ 21:64N2
! 0:05C7:25H12:85 þ 0:9C3H6 þ 0:44COþ 0:15H2
þ 3:759CO2 þ 3:719H2Oþ 0:16O2 þ 21:64N2: ðA2Þ
The 0.876 mol of propene is produced from fuel introduced dur-ing NVO, while the remaining 0.024 mol of C3H6 originates from re-circulated exhaust. CO is produced from fuel injected in a quantityof 0.404 mol and H2 comprises 0.15 mol. The carbon content in fuelis balanced by CO2 production, however, only in a quantity of0.232 mol. H2O is produced in a quantity of 0.113 mol.
The NVO exhaust-fuel mixture is diluted by air in order toachieve apparent k value, calculated with the use of the carbon bal-ance (Eq. (4)), corresponding to the experimental results. Accord-ingly, 782 mol of (O2 + 3.76N2) with 400 ppm of CO2 and 1.7% ofH2O are added, resulting in the dilution ratio of combustion prod-

Table A2Actual composition of the intake port sample.
Compound Mole fraction(ppm)
Massfraction (–)
Fuel conversion intospecies (g/kg)
Raw fuel (C7.25H12.85) 13 (95 as C1) 4.569 � 10�5 50C3H6 236 (707 as C1) 3.46 � 10�4 378.6CO 115 1.126 � 10�4 123.2H2 39 2.762 � 10�6 3.02CO2 1374 2.11 � 10�3 2309H2O 17549 1.102 � 10�2 12064O2 204867 0.2287 –N2 775807 0.7577 –
Table A3Comparison of the actual and estimated degrees of fuel conversion into species.
Compound Fuel conversion into species(g/kg)
Estimation error (%)
Actual Estimated
Raw fuel (C7.25H12.85) 100 –C3H6 736.9 792 7.48CO 226.1 244.1 7.93H2 6.05 – –CO2 203.5 435.7 114H2O 40.9 24586 –
Fig. A1. Estimation error of fuel conversion into species with respect to fraction ofunidentified hydrocarbons.
Table B1Measured mole fractions of the exhaust port sample.
SOI(�CA)
CH4
(ppm)C2H2
(ppm)C2H4
(ppm)C2H6
(ppm)C3H6
(ppm)C4H6
(ppm)i-C5H12
(ppm)n-C5H12
(ppm)
�60 179.2 56.6 199.7 17.7 66.6 19.6 42.4 111.1�40 163.2 57.1 186.2 17.5 59 19 42.6 120.2�20 101.9 43.2 113.6 48.7 44.9 12.3 96.5 355.1
0 83.4 37.5 97.2 54.2 37.6 9.3 109.1 39420 36.4 23.8 71.8 40.2 32.8 7.2 125.5 260.540 39.3 24 75.7 43 37.3 9.7 132 277.360 39.1 23.8 77.7 45.3 37.7 8.8 134.9 276
Table B2Measured mole fractions of the intake port sample.
SOI(�CA)
CH4
(ppm)C2H2
(ppm)C2H4
(ppm)C2H6(ppm) C3H6
(ppm)C4H6
(ppm)i-C5H12
(ppm)n-C5H12
(ppm)
�60 58.5 12.3 57.3 4.4 20.2 5.8 12.1 29.8�40 57.7 13.1 56.7 4.9 17.2 4.6 14.5 35.9�20 15.7 3.5 14.7 6.6 3.8 0.5 36 68.1
0 7.8 1.5 5.8 6.7 0.6 0 37.6 71.720 5.6 1 2.8 6.3 1.2 0.8 36 73.240 4.7 0.3 1.5 6.3 0 0 34 72.460 4.7 0.5 0.9 6.1 1.3 0 32.7 76.4
J. Hunicz / Fuel 117 (2014) 236–250 249
ucts and fuel by air of 120 on the mass basis. The intake port sam-ple per single mole of fuel, received by the gas analyzer can be ex-pressed as follows:
0:05C7:25H12:85 þ 0:9C3H6 þ 0:44COþ 0:15H2 þ 5:248CO2
þ 67H2Oþ 782:2O2 þ 2962N2:
The actual composition of the intake port sample expressed bythe above formula is summarized in Table A2.
An analysis of the intake port sample is based on the presump-tion that raw fuel hydrocarbons are not identified with a FTIR gasanalyzer and O2, H2 and N2 concentrations are unknown. Consider-ing the above, the apparent air excess ratio of the intake port sam-ple is calculated from the carbon balance (Eq. (4)), where:Mair = 28.96 g/mole, Mfuel = 13.796 g/mole (calculated as C1), y = 2and ðFAÞstoi ¼ 0:06964. Thus, the apparent k value amounts to 67.
If the portion of CO2 introduced with the ambient air is sub-tracted from the actual CO2 content based on the apparent dilutionratio, the corrected content of CO2 in the sample is 982 ppm andthe actual k value for the intake port sample amounts to 81.6.The oxygen content in the intake port sample is calculated onthe basis of the k value, according to the oxygen balance (Eq.(6)). Nitrogen is assumed to constitute the remaining fraction.
As the EGR rate amounts to 50%, the calculated degree of fuelconversion into species is related to 50% of fuel mass injected dur-ing NVO and to 50% of the mass of fuel consumed during the mainevent. Thus, the mass of species per kilogram of fuel injected dur-ing NVO is calculated from Eq. (8). Table A3 presents the compar-ison of the actual and apparent degrees of fuel conversion intospecies. The actual values are calculated according to the reactionstoichiometry and they do not include species introduced with theambient air nor re-circulated exhaust, while the apparent fuel con-version degrees are calculated according to the above procedure.The estimation error is expressed as
Apparent value� Actual valueActual value
100%: ðA3Þ
The above analysis shows that fuel conversion into species thatare not present in the ambient air can be estimated with accept-able accuracy. Any errors concerning apparent fuel conversion intoCO and C3H6 result from overestimated k value for the intake port
C6H5CH3
(ppm)HCHO(ppm)
CH3CHO(ppm)
CO(ppm)
CO2
(ppm)H2O(ppm)
NO(ppm)
NO2
(ppm)
135.2 57.6 48.3 1124.7 120085 124302 70 4134.8 51.4 41.8 1091.4 121683 126420 88.1 4.9258.8 52.8 52.1 2391.9 117679 122305 42.5 6.4275.7 54.9 56.9 2056.1 116801 121701 42.2 7.1159.5 52.7 50.3 851 121724 125667 82.8 7.4170.7 55.1 55.7 895.2 119831 124457 64.2 7.7170.1 55.9 55 892.1 119567 123361 56.8 6.6
C6H5CH3
(ppm)HCHO(ppm)
CH3CHO(ppm)
CO(ppm)
CO2
(ppm)H2O(ppm)
NO(ppm)
NO2
(ppm)
34.8 5.7 9.3 94.4 1364 16464 0.9 037.3 3.9 7.5 86.4 1569 16757.6 1.2 043.8 1.3 6.4 35.7 1579.8 16524.1 1.3 043 1 6.9 23.8 1489.7 16584 0.8 0.144.3 0.8 7 15.9 1507.4 16633.3 1.1 043.7 0.7 5.8 11.8 1389.1 16424.9 1.2 045.5 0.7 6.2 17.4 1305.8 16326.3 0.9 0.1

250 J. Hunicz / Fuel 117 (2014) 236–250
sample due to the presence of unidentified hydrocarbons andhydrogen. If all hydrocarbon species are identified, the estimationerrors of C3H6, CO and CO2 concentrations amount to 2.1%, 2.3%and 29.5% respectively. It should be noted that without CO2 com-pensation in the intake sample, the apparent conversion degreesof fuel into C3H6 and CO would be underestimated by approx.�13%. Fig. A1 shows the estimation error introduced by unidenti-fied hydrocarbons with and without CO2 compensation. For thecalculation purposes, 40% fuel conversion degree into C3H6 was set.
Appendix B. Experimental data for the assessment of fuelconversion during NVO (experimental conditions as inSection 3.1)
See Tables B1 and B2.
References
[1] Onishi S, Jo SH, Shoda K, Jo PD, Kato S. Active thermo-atmosphere combustion(ATAC) – a new combustion process for internal combustion engines. SAETechnical Paper 790501; 1979.
[2] Najt PM, Foster DE. Compression-ignited homogeneous charge combustion.SAE Technical Paper 830264; 1983.
[3] Yao M, Zheng Z, Liu H. Progress and recent trends in homogeneous chargecompression ignition (HCCI) engines. Prog Energy Combust Sci2009;35:398–437.
[4] Lavy J, Dabadie JCh, Angelberger Ch, Duret P, Willand J, Juretzka A, et al.Innovative ultra-low NOX controlled auto-ignition combustion process forgasoline engines: the 4-SPACE project. SAE Technical Paper 2000-01-1837;2000.
[5] Zhao H, Li J, Ma T, Ladommatos N. Performance and analysis of a 4-strokemulti-cylinder gasoline engine with CAI combustion. SAE Technical Paper2002-01-0420; 2002.
[6] Yap D, Karlovsky J, Megaritis A, Wyszynski ML, Xu H. An investigation intopropane homogeneous charge compression ignition (HCCI) engine operationwith residual gas trapping. Fuel 2005;84:2372–9.
[7] Guohong T, Zhi W, Jianxin W, Shijin S, Xinliang A. HCCI combustion control byinjection strategy with negative valve overlap in a GDI engine. SAE TechnicalPaper 2006-01-0415; 2006.
[8] Jamal Y, Wagner T, Wyszynski ML. Exhaust gas reforming of gasoline atmoderate temperatures. Int J Hydrogen Energy 1996;21:507–19.
[9] Urushihara T, Hiraya K, Kakuhou A, Itoh T. Expansion of HCCI operating regionby the combination of direct fuel injection, negative valve overlap and internalfuel reformation. SAE Technical Paper 2003-01-0749; 2003.
[10] Canakci M, Reitz RD. Experimental optimization of a direct injectionhomogeneous charge compression ignition gasoline engine using splitinjections with fully automated microgenetic algorithms. Int J Engine Res2003;4:47–60.
[11] Shi Y, Reitz RD. Optimization of a heavy-duty compression-ignition enginefueled with diesel and gasoline-like fuels. Fuel 2010;89:3416–30.
[12] Lee CH, Lee KH. An experimental study of the combustion characteristics inSCCI and CAI based on direct-injection gasoline engine. Exp Thermal Fluid Sci2007;31:1121–32.
[13] Standing R, Kalian N, Ma T, Zhao H, et al. Effects of injection timing and valvetimings on CAI operation in a multi-cylinder DI gasoline engine SAE TechnicalPaper 2005-01-0132; 2005.
[14] Hunicz J, Kordos P. An experimental study of fuel injection strategies in CAIgasoline engine. Exp Thermal Fluid Sci 2011;35:243–52.
[15] Koopmans L, Backlund O, Denbratt I. Cycle to cycle variations: theirtemperature and unburned hydrocarbons from a camless gasolinecompression ignition engine. SAE Technical Paper 2002-01-0110; 2002.
[16] Cao L, Zhao H, Jiang X, Kalian N. Investigation into the effect of injection timingon stoichiometric and lean CAI operations in a 4-stroke GDI engine. SAETechnical Paper 2006-01-0417; 2006.
[17] Tsolakis A, Megaritis A, Yap D. Application of exhaust gas fuel reforming indiesel and homogeneous charge compression ignition (HCCI) engines fuelledwith biofuels. Energy 2008;33:462–70.
[18] Arning J, Ramsander T, Collings N. Analysis of in-cylinder hydrocarbons in amulti-cylinder gasoline HCCI engine using gas chromatography. SAE Int JEngines 2010;2:141–9.
[19] Koopmans L, Ogink R, Denbratt I. Direct gasoline injection in the negative valveoverlap of a homogeneous charge compression ignition engine. SAE TechnicalPaper 2003-01-1854; 2003.
[20] Waldman J, Nitz D, Aroonsrisopon T, Foster DE. Experimental investigationinto the effects of direct fuel injection during the negative valve overlap periodin a gasoline fueled HCCI engine. SAE Technical Paper 2007-01-0219; 2007.
[21] Aroonsrisopon T, Nitz D, Waldman J, Foster DE, Lida M. A computationalanalysis of direct fuel injection during the negative valve overlap in an iso-octane fueled HCCI engine. SAE Technical Paper 2007-01-0227; 2007.
[22] Fitzgerald RP, Steeper RR. Thermal and chemical effects of NVO fuel injectionon HCCI combustion. SAE Int J Engines 2010;3:46–64.
[23] Puranam SV, Steeper RR. The effect of acetylene on iso-octane combustion inan HCCI engine with NVO. SAE Int J Engines 2012;5:1551–60.
[24] Yu W, Xie H, Chen T, Li L, et al. Effects of active species in residual gas on auto-ignition in a HCCI gasoline engine. SAE Technical Paper 2012-01-1115; 2012.
[25] Hunicz J, Kordos P. Experimental study of the gasoline engine operated inspark ignition and controlled auto-ignition combustion modes. SAE TechnicalPaper 2009-01-2667; 2009.
[26] Heywood J. Internal combustion engine fundamentals. New York: McGraw-Hill Book Company; 1988.
[27] Wildman C, Scaringe RJ, Cheng WK. On the maximum pressure rise rate inboosted HCCI operation. SAE Technical Paper 2009-01-2727; 2009.
[28] Brackmann C, Nygren J, Bai X, Li Z, Bladh H, Axelsson B, et al. Laser-inducedfluorescence of formaldehyde in combustion using third harmonic Nd:YAGlaser excitation. Spectrochim Acta Part A 2003;59:3347–56.
[29] Anderson W, Yang J, Brehob DD, Vallance JK, Whiteaker RM. Understandingthe thermodynamics of direct injection spark ignition (DISI) combustionsystem: an analytical and experimental investigation. SAE Technical Paper962018; 1996.
[30] Sen AK, Litak G, Edwards KD, Finney CEA, Daw CS, Wagner RM. Characteristicsof cyclic heat release variability in the transition from spark ignition to HCCI ina gasoline engine. Appl Energy 2011;88:1649–55.
[31] Rothamer DA, Snyder JA, Hanson RK, Steeper RR, Fitzgerald RP. Simultaneousimaging of exhaust gas residuals and temperature during HCCI combustion.Proc Combust Inst 2009;32:2869–76.
[32] Gaynor JA, Fleck R, Kee RJ, Kenny RG, Cathcart G. A study of efficiency andemissions for a 4-Stroke SI and a CAI engine with EEGR and light boost. SAETechnical Paper 2006-32-0042; 2006.
[33] Kulzer A, Lejsek D, Nier T. A thermodynamic study on boosted HCCI:motivation, analysis and potential. SAE Int J Engines 2010;3:733–49.
[34] Canakci M. Combustion characteristics of a DI-HCCI gasoline engine running atdifferent boost pressures. Fuel 2012;96:546–55.
[35] Hasan AO, Leung P, Tsolakis A, Golunski SE, Xu HM, Wyszynski ML, et al. Effectof composite after treatment catalyst on alkane, alkene and monocyclicaromatic emissions from an HCCI/SI gasoline engine. Fuel 2011;90:1457–64.
[36] Dubien C, Schweich D, Mabilon G, Martin B, Prigent M. Three-way catalyticconverter modelling: fast- and slow-oxidizing hydrocarbons, inhibitingspecies, and steam-reforming reaction. Chem Eng Sci 1998;53:471–81.