in-cylinder fuel and lubricant effects on gasoline engine
TRANSCRIPT
In-Cylinder Fuel and Lubricant Effects on Gasoline EngineFriction
:.~Oliver Mark Edward Smith
(MEng)
Submitted in accordance with the requirements for the degree of
Doctor of Philosophy
The University of LeedsSchool of Mechanical Engineering
March 2007
The candidate confirms that the work submitted is his own and that appropriatecredit has been given where reference has been made to the work of others.
This copy has been supplied on the understanding that it is copyright material andthat no quotation from the thesis may be published without proper
acknowledgement.

11
For Sarah
111
Acknowledgements
I wish to express my sincere gratitude to Prof. Martin Priest for his dedicatedcontribution to the supervision of this project, his knowledgeable counsel providedan invaluable resource throughout the research. I feel very fortunate to have beenguided by such a gifted individual and can only hope that our time working togetherhas imparted some of his vast tribological knowledge to me.
I would like to thank the Engineering and Physical Science Research Council andShell Global Solutions (UK) for sponsoring this research, the latter also forproviding technical assistance. In particular, Dr Ian Taylor (Shell) for his help andadvice throughout the project. It is also necessary to note the invaluable contributionof Dr Richard Price, Dr Alex Cantlay, Dr Nigel Tait and Dr Catherine Boyd and Dr
Hugues Renondeau to the success of this research.
I am particularly grateful to several colleagues at the University of Leeds for theircontribution to this study. Prof. Dick Coy for the time he spent with me discussingall aspects of the project and Prof. Malcolm Fox whose enthusiasm and skill ofdisseminating his knowledge of complex chemistry is quite unique. I wish also to
acknowle?ge the valuable guidance and friendship of Dr Dave Barrell whose inputwas significant throughout my work.
Technical staff at the University of Leeds contributed greatly to this study. Mr PaulBanks and Mr Keith Norris are both worthy of particular note as they providedessential practical help throughout the experiments which populate this thesis.
Throughout my academic career I have been supported by my parents whom I wishto acknowledge for both their financial backing and unfaltering belief in me, withoutwhich this study would not have been possible.
Oliver Smith March 2007
IV
Abstract
The purpose of the research reported in this thesis was to investigate theviability and quantify the potential gains of improving fuel economy of the gasolineengine through strategic application of additives.
An increased awareness of the link between greenhouse gas emissions andglobal warming means that there is a desire to reduce carbon dioxide emissions fromtransportation. There is therefore a growing emphasis on improving the fueleconomy performance of vehicles. The addition of friction modifier additives to thefuel is one way to achieve this.
Using bespoke in-cylinder sampling techniques, an understanding of theoperation of the piston assembly, a system responsible for much of the power loss inthe internal combustion engine, is developed. Validation is given to the hypothesisthat fuel economy gains can be achieved through the application of friction modifier
administered to the engine via the gasoline. Results show gasoline administeredfriction modifier additive can accumulate in the piston assembly lubricant at levels77 times greater than the initial fuel treatment level.
The performance of a large number of friction modifier additives wereuniquely screened in a novel bench-top test which simulated the arduous in-cylinderconditions found in a firing gasoline engine. The test generated vast amounts of
information which led to high performance formulations capable of reducing thefriction coefficient in both the boundary and mixed lubrication regimes by around50% when compared with the result for the base oil alone. Surface analysistechniques were also employed 0!l engineering surfaces coated with friction modifieradditives and add to the knowledge of their mechanism of action.
Finally a series of engine tests were conducted which prove the effectiveness
of friction modifier administered to the engine via the gasoline. A fuel economyimprovement of approximately 2% was seen where friction modifier gasoline wasemployed. Application of successful technology such as this is shown to correspondto the projected saving of around 502 million litres of gasoline and 388,000 tonnesof carbon (C02) per year in the UK alone.
v
Contents
Acknowledgements iii
Abstract iv
Contents v
Figures ix
Tables xiv
Abbreviations xvi
Notation xviii
1. Introduction 1
1.1. Engine Friction and Lubrication 4
1.2. Engine Lubricants and Forinulation 7
1.3. Lubricant Formulations for Fuel Economy 11
1.4. Friction Modifiers 13
1.5. Gasoline and Gasoline Additives 18
1.6. Fuel and Lubricant Interactions 21
1.7. Other Attempts at Increasing Fuel Economy 25
1.8. Overall Strategy of the Project 28
1.9. Summary 28
2. In-Cylinder Lubricant Sampling 30
2.1. The Ricardo Hydra Gasoline Engine 30
2.2. Top Ring Zone Sampling 32
2.2.1. Top Ring Zone Sampling Tests 33
2.3. Three Point Lubricant Sampling From The Cylinder Wall (TPS) 34
2.3.1. Development and Problems with the TPS System 37
2.4. Three Point Sampling Tests 38
2.4.1. Cold-Start Engine Tests 38
2.4.2. Steady-State Tests 39
2.5. Post Test Lubricant Analysis 40
2.5.1. Fuel Dilution Measurement by Gas Chromatography 41
2.5.2 ..
2.5.3.
Potassium Concentration Testing by ICP-AES Analysis .41
Dynamic Viscosity Measurement 41
VI
2.6. Top Ring Zone Sampling Results and Analysis 43
2.7. Three Point Sampling Results and Analysis '" 47
2.7.1. Cold-Start TPS Results and Analysis 47
2.7.2. Steady-State TPS Results and Analysis 49
2.8. Discussion 52
2.8.1. TRZ Sampling Discussion 52
2.8.2. Three Point Sampling Discussion 54
2.9. Summary 56
3. Tribometer Investigation of Environmentally Friendly FrictionModifier Additives 59
3.1. The Cameron Plint TE-77 Machine and Test Specimens 60
3.1.1. Data Capture System 61
3.1.2. Reciprocator Rig Components 62
3.2. Organic Friction Modifiers Under Investigation 64
3.3. Reciprocator Machine Tests 66
3.3.1. Additive Screening Test.. 66
3.3.2. Additive Package Formulation and Blending Test 69
3.3.3. Additive Concentration Tests 69
3.3.4. Piston Ring Type Test.. 70
3.3.5. Film Creation Tests 71
3.4. Test Lubricant Formulations : 72
3.5. Post Test Specimen Analysis 73
3.5.1. Fourier Transform InfraRed Microscopy (FTIR) 73
3.6. Reciprocator Results Analysis 74
3.6.1. Additive Screening Tests Results Analysis 74
3.6.2. Additive Package Formulation and Blending Resultsand Analysis 82
3.6.3. Additive Concentration Investigation Results andAnalysis 83
3.6.4. Piston Ring Type Tests Results and Analysis 84
3.6.5. Film Creation FTIR Microscopy Results and Analysis 87
3.7. Reciprocator Machine Tests Discussion 94
3.7.1. Additive Screening Tests Discussion 94
vu
3.7.2. Additive Concentration Tests Discussion 98
3.7.3. Piston Ring Material Friction Discussion 100
3.8. Film Creation FTIR Microscopy Discussion 101
3.9. Summary 103
4. Mini Traction Machine Investigation of Novel Friction ModifierAdditives 105
4.1. The Mini Traction Machine and Test Specimens 105
4.1.1. Mini Traction Machine Components 106
4.2. Post Test Specimen Analyses 107
4.2.1. Optical Microscopy 109
4.2.2. Form Talysurf Contacting Profilometer Measurement 109
4.2.3. Scanning Electron Microscopy and Energy DispersiveX-ray Technique (SEM / EDX) 110
4.2.4. X-ray Photon Spectroscopy (XPS) 111
4.2.5. Fourier Transform InfraRed Microscopy (FTIR) 111
4.3. Mini Traction Machine Test.. 112
4.4. Test Lubricant Formulations 114
4.5. MTM Friction Coefficient Measurement Results and Analysis 115
4.6. Optical Microscopy Results and Analysis 119
4.7. Profilometry Results and Analysis 121
4.8. SEM / EDX Results and Analysis 123
4.9. XPS Results and Analysis 125
4.10. FTIR Microscopy Results and Analysis 128
4.11. Discussion 131
4.12. Summary 137
5. Novel Fuel Formulation Engine Tests 140
5.1. Engine Testing 140
5.1.1. Test Fluids 141
5.1.2. Running-In 142
5.1.3. Engine Performance Testing 142
5.2. Engine Friction Testing 145
5.2.1. .
5.2.2.
Standard Engine Friction Test Methodology 148
Modified Engine Friction Test Methodology 150
Vlll
5.3. Post Test Lubricant Analysis 150
5.3.1. Fourier Transform InfraRed Microscopy (FTIR) 150
5.3.2. Fuel Dilution Measurement by Gas Chromatography 151
5.4. Engine Performance Tests Results and Analysis 151
5.5. Engine Friction Tests Results and Analysis 156
5.6. Lubricant Analysis Results and Analysis 161
5.7. Discussion 162
5.7.1. Engine Performance Tests Discussion 162
5.7.2. Engine Friction Tests Discussion 164
5.8. Summary 166
6. Discussion 168
6.1. Key Project Findings 168
6.1.1. The Success of FM Gasoline 178
6.2. The Global Impact Of The Research 180
7. Conclusions & Recommendations for Future Work 183
7.1. Conclusions 183
7.2. Recommendations for Future Work 186
7.2.1. Further Work 187
7.2.2. Future Research 187
References 189
Appendix 209
AI: Determination of Normal Force Present At the Cylinder Liner /Piston Ring Interface: 209
A2: Shell XHVI-8.2 Datasheet.. 211
A3: Shell XHVI-4TMDatasheet 212
A4: Gasoline Specifications 213
A5: TPS System Manufacturing Information 214
IX
Figures
Figure 1-1 Global Information Flows Governing Legislation 2
Figure 1-2 Automotive Lubricant Legislation (Bardasz 2005) 3
Figure 1-3 Typical Fuel Energy Distribution in an Internal CombustionEngine. After (Taylor 1998) 5
Figure 1-4 Typical Four-Stroke Gasoline Engine Cylinder Layout and PistonAssembly. After (Priest 1996; Subaru 2006) 5
Figure 1-5 Modified Stribeck Diagram (Priest 2000) 7
Figure 1-6 Sulphated Ash Blockage in Catalyst (Bardasz 2005) 10
Figure 1-7 Fatty Acid Formation on Ideal Surfaces 14
Figure 1-8 Breakdown or Transition Temperature of Fatty Acids on SteelSurfaces (Bowden and Tabor 1950) 15
Figure 1-9 Measured Boundary Coefficient of Friction of Fatty Acids(Castle and Bovington 2003) 17
Figure 1-10 Measured Boundary Coefficient of Friction Modifiers(Castle and Bovington 2003) 17
Figure 1-11 Patenting of Different Types of Fuel Additives Between 1981 and2000: 1) detergents; 2) depressants and wax dispersants; 3)antioxidants, metal deactivators, stabilisers; 4) ignition modifier;5) combustion modifiers; 6) other. (Danilov 2001) 21
Figure 1-12 Image of Fuel Dilution in the Cylinder Liner Oil Film.After (Kim, Yoon et al. 2003) 24
Figure 1-13 'Gel-Like' Sludge Formation in Engine Sump as a Result ofIncompatibility Between Lubricant and Fuel Additive (Thiel andHayden 200 1b) 25
Figure 2-1 The Ricardo Hydra Research Engine 31
Figure 2-2 Top Ring Zone Sampling Apparatus 32
Figure 2-3 CAD Image of Three Point Sampling System 35
Figure 2-4 Three Point Sampling System: (a) TDC Reversal, (b) BDCReversal 35
Figure 2-5 Flow Diagram of Three Point Sampling System 36
Figure 2-6 Photograph ofTPS Liner, Sampling Pipe Attachment and CarbonDeposit 38
Figure 2-7 Bohlin CV120HR Dynamic Viscometer 42
x
Figure 2-8 Sump Sample Viscosity Analysis Repeatability 43
Figure 2-9 Top Ring Zone Fuel Dilution Variation with Engine Condition 44
Figure 2-10 Variation of Potassium Concentration with Varying Engine Load .44
Figure 2-11 Variation of Potassium Concentration with Varying Engine Speed 45
Figure 2-12 Variation of Potassium Concentration with Varying LambdaRatio ...........................................................•......................................... 46
Figure 2-13 Variation of TRZ Potassium Concentration with Varying FuelPotassium Concentration 46
Figure 2-14 Variation of Potassium Concentration with Different Boiling PointFuels 46
Figure 2-15 Cold-Start Sump Lubricant Sample Fuel Dilution and DynamicViscosity Variation with Time 47
Figure 2-16 Fuel Dilution in Both TPS and Sump Samples for Fuel Ab 48
Figure 2-17 Fuel Dilution in Both TPS and Sump Samples for Fuel Ba 49
Figure 2-18 Top Sample Fuel Dilution (a) and Potassium Concentration (b)with Varying Engine Condition 50
Figure 2-19 Middle Sample Fuel Dilution (a) and Potassium Concentration(b) with Varying Engine Condition 50
Figure 2-20 Bottom Sample Fuel Dilution (a) and Potassium Concentration(b) with Varying Engine Condition 50
Figure 2-21 Dynamic Viscosity Variation with Engine Speed and SampleLocation for Half Load Condition 51
Figure 2-22 Dynamic Viscosity Variation with Engine Speed and SampleLocation for Full Load Condition 51
Figure 2-23 Photograph of Samples Taken From the Bottom, Middle andLocations on the Cylinder Liner 52
Figure 3-1 Plint TE-77 High Friction Reciprocator Tribometer 60
Figure 3-2 Schematic Representation of Loaded Piston Ring Section onCylinder Liner Specimen in TE-77 61
Figure 3-3 Schematic Representation of Reciprocator Setup 66
Figure 3-4 Photograph of Chrome Coated and Molybdenum Coated PistonRings 70
Figure 3-5 Additive Screening Test Coefficient of Friction Results 76
Figure 3-6 Reduction in Coefficient of Friction 77
Figure 3-7 Performance Related to Saturation of Chemical Bonds 77
Figure 3-8 Pure Base Oil Instantaneous Friction and Contact PotentialMeasurement 78
xi
Figure 3-9 Fatty Acid Instantaneous Friction and Contact PotentialMeasurement 79
Figure 3-10 Amide Instantaneous Friction and Contact Potential Measurement 80
Figure 3-11 Triglyceride and Ester Instantaneous Friction and ContactPotential Measurement 81
Figure 3-12 Additive Blending Results 82
Figure 3-13 Additive Concentration Effects 83
Figure 3-14 Piston Ring Material Coefficient of Friction Results 85
Figure 3-15 Instantaneous Friction and Contact Potential Results (Mo Ring) 86
Figure 3-16 Film Conductivity Test Conducted on Stearic Acid 87
Figure 3-17 FTIR Analysis of Chrome Ring (a) and Cylinder Liner (b) Runwith Linoleic Acid 88
Figure 3-18 FTIR Analysis of Chrome Ring (a) and Cylinder Liner (b) Runwith Erucylamide 88
Figure 3-19 FTIR Analysis of Chrome Ring (a) and Cylinder Liner (b) Runwith EruLin 89
Figure 3-20 FTIR Analysis of Cylinder Liner at the End of Stroke PositionRun with EruLin 89
Figure 3-21 FTIR Analysis of Molybdenum Ring (a) and Cylinder Liner (b)Run with Linoleic Acid 89
Figure 3-22 Optical Image (a) and FTIR Line Scan (b) of Cylinder LinerSpecimen Run with Erucylamide 90
Figure 3-23 Wire Grid Projection ofFTIR Scan on Cylinder Liner SpecimenRun with Erucylamide 90
Figure 3-24 Individual FTIR Spectra at 400, 4500 and 8400 microns onCylinder Liner Specimen Run with Erucylamide 91
Figure 3-25 1560 cm-! Absorbance Variation on Cylinder Liner SpecimenRun with Erucylamide 91
Figure 3-26 1640 cm" Presence (top) and Absorbance Variation 1645 ern"(bottom) on Cylinder Liner Specimen Run with Erucylamide 92
Figure 3-27 Optical Image (a) and FTIR Line Scan of Cylinder LinerSpecimen Run with Linoleic Acid 93
Figure 3-28 Wire Grid Projection ofFTIR Scan on Cylinder Liner SpecimenRun with Linoleic Acid 93
Figure 3-29 Individual FTIR Spectra at 1200,4800 and 7800 microns onCylinder Liner Specimen Run with Linoleic Acid 94
Figure 3-30 Influence of Molecular Orientation on Additive Performance 95
xu
Figure 3-31 Hypothesised Formation of Additive Films 98
Figure 4-1 PCS Mini Traction Machine 106
Figure 4-2 Specimen Surfaces and Analytical Techniques. After (Renondeau2005) : 108
Figure 4-3 1:1 Scale Plan View ofMTM Disc Specimen DetailingProfilometer Path 109
Figure 4-4 Typical MTM Test Result 113
Figure 4-5 BASE: XHVI-8.2TM 115
Figure 4-6 LIN: 2 wt% Linoleic Acid in XHVI-8.2TM 116
Figure 4-7 ERU: 2 wt% Erucylamide in XHVI-8.2TM 117
Figure 4-8 ERULIN: 1 wt% Erucylamide + 1 wt% Linoleic Acid in XHVI-8.2TM 117
Figure 4-9 Averaged Friction Coefficient Data for Run 1 (0 mins) 118
Figure 4-1 0 Averaged Friction Coefficient Data for Run 4 (30 mins) 119
Figure 4-11 BASE Post Test Disc Surface 119
Figure 4-12 LIN Post Test Disc Surfaces - a) First Test, b) Repeat.. 120
Figure 4-13 ERU Post Test Disc Surfaces - a) First Test, b) Repeat 120
Figure 4-14 ERULIN Post Test Disc Surfaces - a) First Test, b) Repeat.. 121
Figure 4-15 BASE Post Test Disc Surface Profilometry Measurement.. 122
Figure 4-16 LIN Post Test Disc Surface Profilometry Measurement 122
Figure 4-17 ERU Post Test Disc Surface Profilometry Measurement.. 122
Figure 4-18 ERULIN Post Test Disc Surface Profilometry Measurement 122
Figure 4-19 ERULIN Post Test Ball Surface SEM / EDX Analysis 124
Figure 4-20 ERULIN Post Test Disc Surface SEM / EDX Analysis 124
Figure 4-21 BASE Post Test Disc Surface XPS Analysis On Wear Track 126
Figure 4-22 BASE Post Test Disc Surface XPS Analysis OffWear Track 126
Figure 4-23 BASE Post Test Ball FTIR Analysis 129
Figure 4-24 LIN Post Test FTIR Analysis on a) Ball and b) Disc Specimen 129
Figure 4-25 ERU Post Test Specimen FTIR Analysis on a) Ball and b) DiscSpecimen 130
Figure 4-26 ERULIN Post Test Specimen FTIR Analysis 131
Figure 5-1 Engine Dynamometer Calibration ; 143
Xlll
Figure 5-2 Inspection of Components After Sixth Engine Test: a) CylinderBore, b) Piston Crown, c) Valves, d) Piston and ConnectingRod 145
Figure 5-3 Piston Assembly Friction Measurement Apparatus 146
Figure 5-4 Connecting Rod Calibration Graph 148
Figure 5-5 Engine Torque Measurement for Test 1 152
Figure 5-6 Near Surface TDC Cylinder Liner Temperature for Test 1 153
Figure 5-7 Lambda Sensor Position Response for Test 1 153
Figure 5-8 Engine Torque Measurement for Test 3 154
Figure 5-9 Near-surface TDC Cylinder Liner Temperature for Test 3 155
Figure 5-10 Lambda Sensor Position Response for Test 3 155
Figure 5-11 Piston Assembly Friction Measurement and Key Engine Events:Test 1 157
Figure 5-12 Piston Assembly Friction Around End of Stroke: Test 1 158
Figure 5-13 Piston Assembly Friction Power Loss: Test 1 158
Figure 5-14 Piston Assembly Friction Measurement and Key Engine Events:Test 2 159
Figure 5-15 Piston Assembly Friction Around End of Stroke: Test 2 160
Figure 5-16 Piston Assembly Friction Power Loss: Test 2 160
Figure 5-17 Piston Friction Power Loss: Test 2 161
Figure 6-1 Comparison of Results Presented by Castle and Bovington (2003)and Those Presented in Chapter 3 172
Figure 6-2 Comparison of Boundary Friction Coefficient for TE77 and MTMTests 175
Figure 6-3 Comparison of End-of-Stroke Reversal Between a) TE-77 and b)Engine Tests 177
Figure 6-4 Gasoline Consumption in the UK and Calculated Saving MadeThrough Implementation of Friction Modified Gasoline. After(DIT 2006) 181
XIV
Tables
Table 1-1 Typical Engine Lubricant Additives. After (Priest 2006) 9
Table 1-2 Main Classes of Gasoline Additive in use from 1926 -1971.After (Robinson 1977) 19
Table 2-1 Fuels Blends Used In Investigation 33
Table 2-2 Top Ring Zone Sampling Eng3ine Testing Matrix 34
Table 2-3 Cold-Start Engine Test Parameters 39
Table 2-4 Steady State Engine Test Parameters 40
Table 2-5 Steady State Engine Test Matrix 40
Table 2-6 Calculated Error Associated with TPS Viscosity Measurement.. 43
Table 3-1 Cylinder Liner Specimen Specification 63
Table 3-2 Running-In Conditions for Piston Ring and Cylinder LinerSpecimens 63
Table 3-3 Organic Friction Modifiers Under Investigation 65
Table 3-4 Additive Screening Test Conditions 67
Table 3-5 Coefficient of Friction Comparison 83
Table 4-1 Specification of Ricardo Hydra Cylinder Liner and Bespoke MTMDisc Specimen 107
Table 4-2 Portfolio of Surface Analysis Techniques Employed on MTMSpecimens 109
Table 4-3 Test Lubricant Formulations and Dynamic Viscosity at 100°C 114
Table 4-4 Wear Area Measurements 123
Table 4-5 Average Atomic % Over Information Depth 127
Table 4-6 Binding Energy Spectra 128
Table 5-1 Fuels Used in Engine Tests 141
Table 5-2 Running-in Procedure 142
Table 5-3 Engine Performance Test Conditions 143
Table 5-4 Engine Flushing Procedure 144
Table 5-5 Standard Engine Friction Test Conditions 148
Table 5-6 Friction Data Capture Procedure 149
Table 5-7 Sump Lubricant Sample Fuel and Linoleic Acid Concentration 162
xv
Table 6-1 Comparison of Sump Fuel Dilution Findings 170
Table 6-2 Comparison of Test Conditions for Additive Screening Tests 172
Table 6-3 Comparison of Key Test Parameters in TE-77 and MTM Tests 174
AAAE
ABDC
AFR
AISI
ASTM
ATDC
BBC
BBDC
BC
BDC
BHNBP
BTDC
CAD
CHON
Dff
EDX
FM
FTIR
GC
GM
GNP
HB
HBP
HFRR
ICP-AES
XVI
Abbreviations
Acetic Acid Alkyl Esters
After Bottom Dead Centre
Air / Fuel Ratio
American Iron and Steel Institute
American Society for Testing and Materials
After Top Dead Centre
British Broadcasting Corporation
Before Bottom Dead Centre
Before Christ
Bottom Dead Centre
Brinell Hardness Number
British Petroleum
Before Top Dead Centre
Computer Aided Design
Carbon, Hydrogen, Oxygen and/or Nitrogen
Department for Transport
Energy Dispersive X-Ray (Spectroscopy)
Friction Modifier
Fourier Transform Infrared (Spectroscopy)
Gas Chromatography
General Motors
Gross National Product
Brinell Hardness
High Boiling Point
High Frequency Reciprocator Rig
Inductively Coupled Plasma Atomic Emission Spectrophotometry
ICP-MS
ILSAC
IMEP
IR
MoDTC
MP
MTM
NOCH
OEM
PC
PCI
PTFE
RMS
RPM
RON
SAE
SBP
SEM
SRR
TDC
TPS
TRZ
UK
ULG
UNECE
XHVI
XPS
XVll
Inductively Coupled Plasma Mass Spectrometry
International Lubricants Standardisation Committee
Instantaneous Mean Effective Pressure
Infrared
Molybdenum Dithiocarbamate
Melting Point
Mini Traction Machine
Nitrogen, Oxygen, Carbon, Hydrogen
Original Equipment Manufacturer
Personal Computer
Peripheral Component Interconnect
Polytetraflouroethylene
Root Mean Square
Revolutions Per Minute
Research Octane Number
Society of Automotive Engineers
Special Boiling Point
Scanning Electron Microscopy
Slide / Roll Ratio
Top Dead Centre
Three Point Sampling
Top Ring Zone
United Kingdom
Unleaded Gasoline
United Nations Economic Commission for Europe
Extra High Viscosity Index
X-Ray Photoelectron Spectroscopy
XVlll
Notation
Ap Cross Section Area of Piston
ao Piston Assembly Acceleration
f Friction Force
FSTG Forces Measured by Connecting Rod Strain Gauge
Fe Forces Acting Along the Connecting Rod Axis
g Gravity
mp Piston Assembly Mass
TJJ Dynamic Viscosity of Fuel
TJo Dynamic Viscosity of Oil
TJm Dynamic Viscosity of Mixture
PI Cylinder Pressure
P2 Crankcase Pressure
xJ Proportion of Fuel in Mixture
Xo Proportion of Oil in Mixture
U 1 Velocity of Specimen 1
U2 Velocity of Specimen 2
A Equivalence Ratio
fjJ Crankshaft Attitude Angle
1
1. Introduction
The demand for oil products continues to rise on a global scale. The worldwide dependence on oil causes the consumption of over 82 million barrels per day,which equates to 13,036 million litres combusted each day (B.P. 2005). Given thequantity of the planet's remaining proved reserves, at this rate of consumption thereis only enough oil to sustain 40 years of oil fuelled activity. The reciprocatinginternal combustion engine in its many forms contributes a significant proportion tothe consumption of oil resources and is said by some to be crucial to the economicsuccess of all nations of the world and to the quality of life of their citizens (Priest1996). In the UK, our modem lifestyles ensure we encounter a vast array of internalcombustion engine powered systems on a daily basis. Cars, motorcycles, taxis, vans,buses, coaches, trains, planes, tractors and boats, to mention but a few, are the hub of
modem living, all relying on the reciprocating internal combustion engine whoseefficient and reliable nature makes it the unsung hero of the 21 st century.
The road transport industry consumes a vast amount of oil products In
comparison to its counterpart transport systems of railway, water and aviation. Thisis primarily due to the success of the 'Private and Light Goods', or 'Private MotorVehicle', whose numbers rose to approximately 30 million in the UK in 2005 (DIT2006). The number of households in possession of a motor vehicle also rises everyyear. In 2005 it is reported that 75% of the population of the British Isles owned aprivate motor vehicle, with 32% of that amount owning two or more. Although thepublic's appetite for gasoline powered vehicles has decreased over recent years inpreference of the more efficient diesel powered vehicle, gasoline powered vehiclesstill represents 72% of the market.
Despite the evolution of what is now a deeply embedded culture of dependenceon oil products, inhabitants of the world are more environmentally aware than everbefore. An increased awareness of the link between greenhouse gas emissions and
global warming means that there is a desire to reduce carbon dioxide emissions fromtransportation. Carbon dioxide is the most important greenhouse gas and isestimated to account for about two thirds of man made global warming. Althoughcarbon dioxide is less influential on global warming than many other greenhousegases, it is present in our atmosphere in vastly greater quantities. Domestic transportsystems alone contribute over 43 million tonnes of carbon as a result of carbondioxide emissions in the British isles each year (DIT 2006). However, the burning
of hydrocarbon fuels causes the emission of several other gases whose release istightly regulated for the reasons given below (DIT 2006).
2
• Carbon monoxide is emitted as a result of the incomplete combustionof hydrocarbon fuels and is thought to be one of the most directly toxicsubstances, interfering with the respiratory system bio-chemistry of thebody and affecting the central nervous and cardiovascular systems.
• Nitrogen oxides are also formed in the combustion of carbon fuels, likecarbon monoxide they harm the respiratory system and reduce lungfunction. Their presence also contributes to the formation of ozone, asecondary pollutant which contributes to global warming.
• Benzene, a well known human carcinogen, and butadiene, a suspectedhuman carcinogen are also emitted when burning carbon fuels.
• Sulphur dioxide, an acid gas, is also emitted in the burning ofhydrocarbon fuels and can affect both health and vegetation. Itsdamaging effects on the environment have caused it to be recognised bythe United Nations Economic Commission for Europe (UNECE),leading to stringent legislation detailing acceptable emission levels.
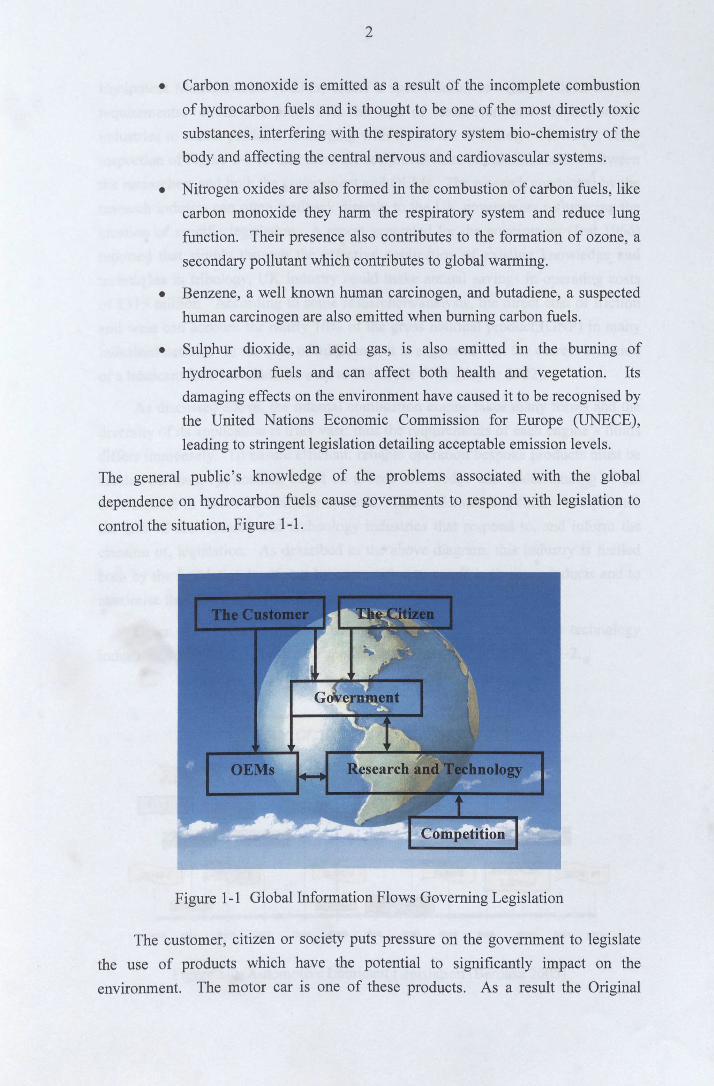
The general public's knowledge of the problems associated with the globaldependence on hydrocarbon fuels cause governments to respond with legislation to
control the situation, Figure 1-1.
Figure 1-1 Global Information Flows Governing Legislation
The customer, citizen or society puts pressure on the government to legislatethe use of products which have the potential to significantly impact on theenvironment. The motor car is one of these products. As a result the Original
3
Equipment Manufacturers (OEMs) create a specification of vehicle which fits the
requirements. From this point it is the task of researchers and the technologyindustries to create products in keeping with the needs of society. However, closeinspection of Figure 1-1 reveals there are reciprocal lines of communication betweenthe researchers and both the government and OEMs. The research conducted by theresearch industry can often feedback directly to the UK government influencing thecreation of specific legislation. A report generated for the government (Jost 1966)reported that simply through the effective application of existing knowledge andtechniques in tribology, UK industry could make annual savings in operating costsof £515 million. According to some researchers/analysts, the direct cost of frictionand wear can account for nearly 10% of the gross national product (GNP) in manyindustrial nations. In the case of lubricants, it is suggested that the correct selectionof a lubricant for a job could save up to 1% of the GNP (Taylor 2002).
As discussed above, the internal combustion engine takes many forms and thediversity of its application is truly vast; thus the requirements of each engine's fluids
differs immensely. To ensure efficient, reliable operation bespoke products must becreated for each application, based on a deep knowledge and understanding of theenvironment in which the machine operates. This understanding further complicatesthe task of the research and technology industries that respond to, and inform thecreation of, legislation. As described in the above diagram, this industry is fuelledboth by the legislation itself, but by competition to create both new products and to
maximise the efficiency of existing products.
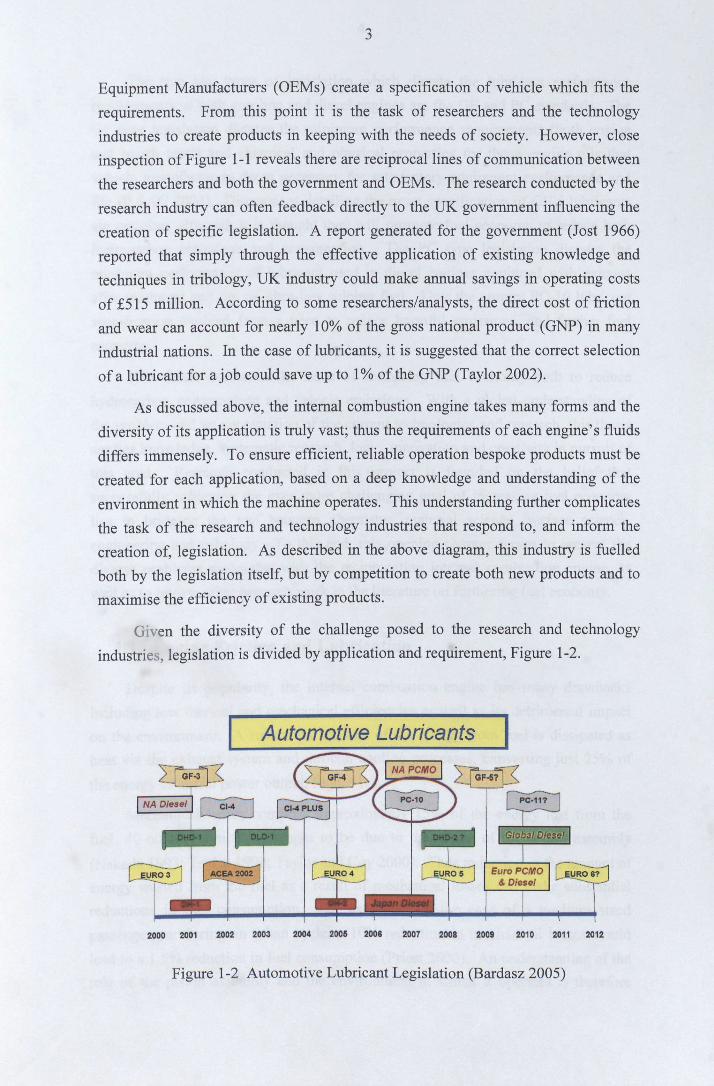
Given the diversity of the challenge posed to the research and technologyindustries, legislation is divided by application and requirement, Figure 1-2.
Automotive Lubricants
2000 2001 2002 2003 2004 2005 2006 2007 2008 2009 2010 2011 2012
Figure 1-2 Automotive Lubricant Legislation (Bardasz 2005)
4
The two key types of legislation which dictate the lubricant performancerequirements of both gasoline and diesel engines are the GF and PC standards. TheGF type legislation dictates the minimum performance requirements (both engineand bench tests) and chemical and physical properties for those engine oils that
vehicle manufacturers deem necessary for satisfactory equipment performance andlife (lLSAC 2004). Discussions detailing the exact specification of GF-5 lubricantsare ongoing, although it is thought they will promote fuel economy to reduce bothhydrocarbon emissions and consumption. The PC type legislation dictates theminimum performance of lubricant used in diesel engines equipped with exhaust
after treatment and run on ultra-low sulphur fuel. Thus the current PC-l 0 lubricantspecification evolved from a need to reduce harmful emissions, and further fuel
economy.
This thesis addresses the issue of furthering fuel economy both to reducehydrocarbon consumption and vehicle emissions. With a global understanding ofthe problem and an appreciation of the current technologies and research, this thesis
applies knowledge, systematic research, logic, innovation and creativity in pursuit ofthis goal. Research conducted in this project is founded on the belief that
successfully achieving the ever more challenging goal of increasing fuel economylies in bridging the gap between chemistry, material science, surface science,engineering and tribology. To this end, this opening chapter serves to present thediverse' problems associated with the reciprocating internal combustion engine, aswell as to review other research work in the literature on furthering fuel economy.
1.1. Engine Friction and Lubrication
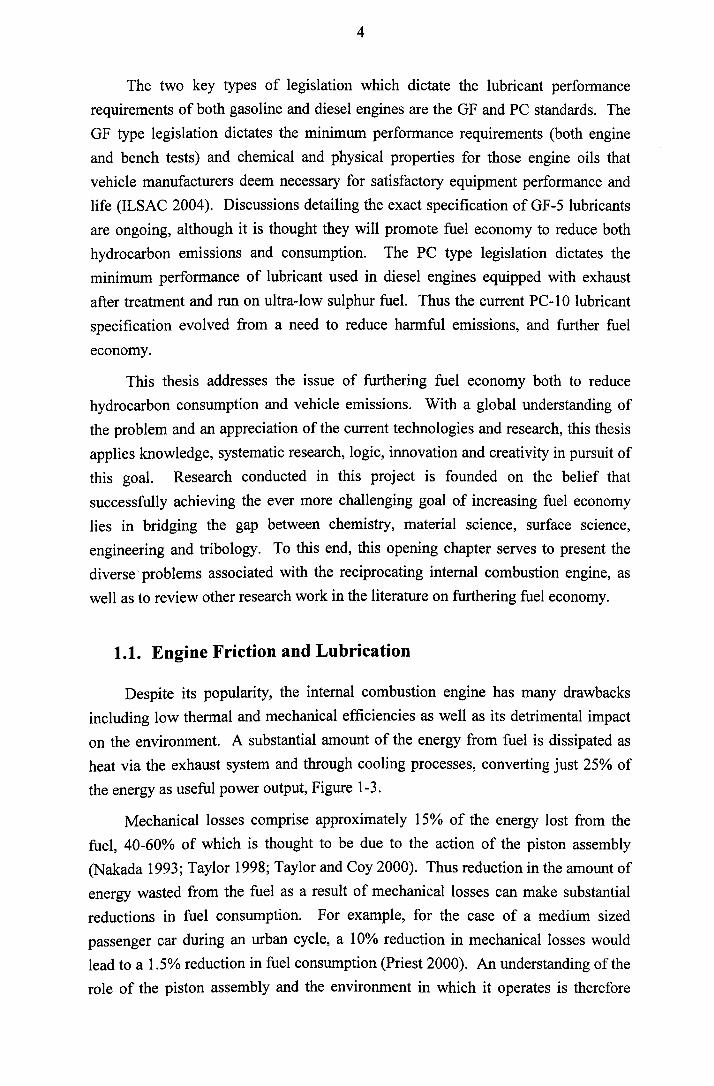
Despite its popularity, the internal combustion engine has many drawbacksincluding low thermal and mechanical efficiencies as well as its detrimental impacton the environment. A substantial amount of the energy from fuel is dissipated asheat via the exhaust system and through cooling processes, converting just 25% ofthe energy as useful power output, Figure 1-3.
Mechanical losses comprise approximately 15% of the energy lost from thefuel, 40-60% of which is thought to be due to the action of the piston assembly(Nakada 1993; Taylor 1998; Taylor and Coy 2000). Thus reduction in the amount ofenergy wasted from the fuel as a result of mechanical losses can make substantial
reductions in fuel consumption. For example, for the case of a medium sizedpassenger car during an urban cycle, a 10% reduction in mechanical losses wouldlead to a 1.5% reduction in fuel consumption (Priest 2000). An understanding of therole of the piston assembly and the environment in which it operates is therefore
5
essential when identifying the system as one for friction reduction as a result ofimproved tribology.
Figure 1-3 Typical Fuel Energy Distribution in an Internal Combustion Engine.
After (Taylor 1998).
Second Compression Ring
ValvesTop Compression Ring
Piston
Oil Control Ring __ -+-_. ConnectingRod
Crankshaft
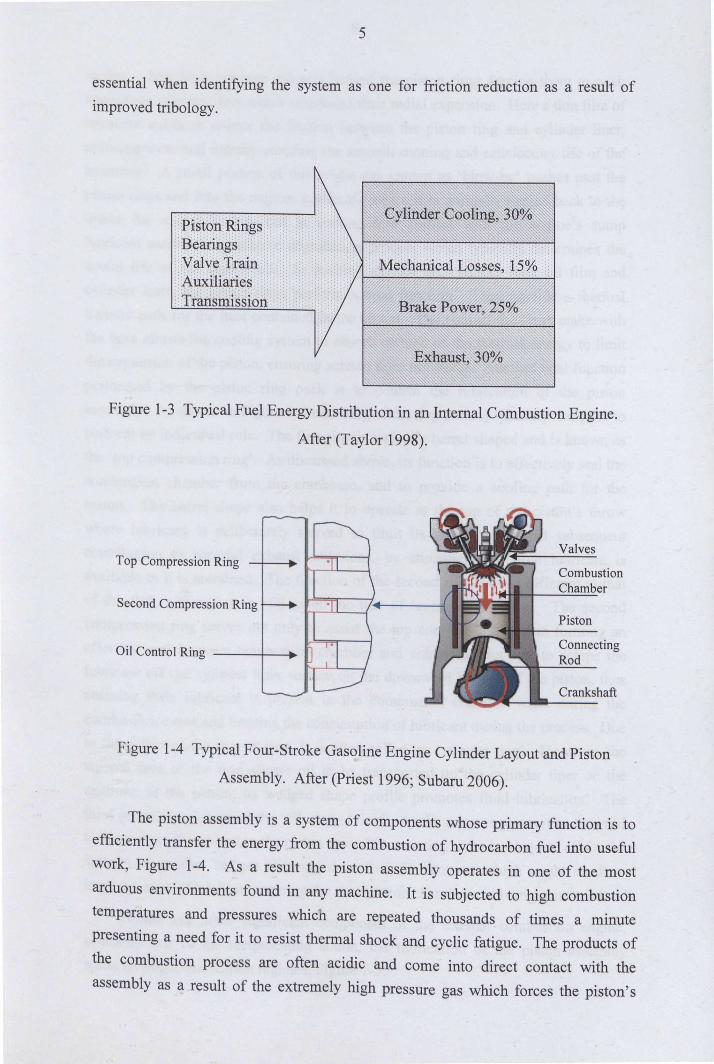
Figure 1-4 Typical Four-Stroke Gasoline Engine Cylinder Layout and Piston
Assembly. After (Priest 1996; Subaru 2006).
The piston assembly is a system of components whose primary function is toefficiently transfer the energy from the combustion of hydrocarbon fuel into usefulwork, Figure 1-4. As a result the piston assembly operates in one of the mostarduous environments found in any machine. It is subjected to high combustiontemperatures and pressures which are repeated thousands of times a minutepresenting a need for it to resist thermal shock and cyclic fatigue. The products of
the combustion process are often acidic and come into direct contact with theassembly as a result of the extremely high pressure gas which forces the piston's
6
motion. This high pressure gas acts behind the piston rings forcing them to pushagainst the cylinder liner which constrains their radial expansion. Here a thin film oflubricant exists to reduce the friction between the piston ring and cylinder liner,reducing wear and thereby ensuring the smooth running and satisfactory life of theassembly. A small portion of this acidic gas known as 'blow-by' pushes past thepiston rings and into the engines crankcase where it is normally vented back to theintake for re-combustion, but in coming into contact with the engine's sumplubricant assists the oxidative degradation process which typically determines theuseful life of the engine oil. In pushing against the cylinder liner oil film andcylinder liner, the piston rings perform a vital function. They provide a thermaltransfer path for the heat contained in the piston. The contact the rings make withthe bore allows the cooling system to absorb enough of the thermal energy to limitthe expansion of the piston, ensuring seizure does not occur. Another vital functionperformed by the piston ring pack is to control the lubrication of the pistonassembly. As shown in Figure 1-4 each ring in the ring pack is specially designed toperform an individual role. The first ring is typically barrel shaped and is known asthe 'top compression ring'. As discussed above, its function is to effectively seal thecombustion chamber from the crankcase, and to provide a cooling path for thepiston. The barrel shape also helps it to operate at the top of the piston's throwwhere lubricant is deliberately starved to limit its consumption and subsequentcontribution to harmful exhaust emissions, by ensuring what little lubricant isavailable to it is entrained. The function of the second ring is quite different to thatof the first, although it is still given the title of 'compression ring'. The secondcompression ring serves not only to assist the top compression ring in forming aneffective seal between combustion chamber and crankcase, but acts to scrape thelubricant off the cylinder liner surface on the downward strokes of the piston, thusensuring little lubricant is present in the combustion chamber walls during thecombustion event and limiting the consumption of lubricant during the process. Due'to the action of the second ring, it is often called the 'scraper ring'. However, thetapered face of the ring allows oil to be transported up the cylinder liner on theupstroke of the piston; its wedged shape profile promotes fluid lubrication. Thethird piston ring is termed the 'oil control ring'. As the name suggests it is designedto control the flow of oil to the piston assembly, ensuring there is adequate oil for thesystems operation, but not allowing excessive oil transport which might result inlarge amounts of lubricant entering the combustion chamber and being consumed.
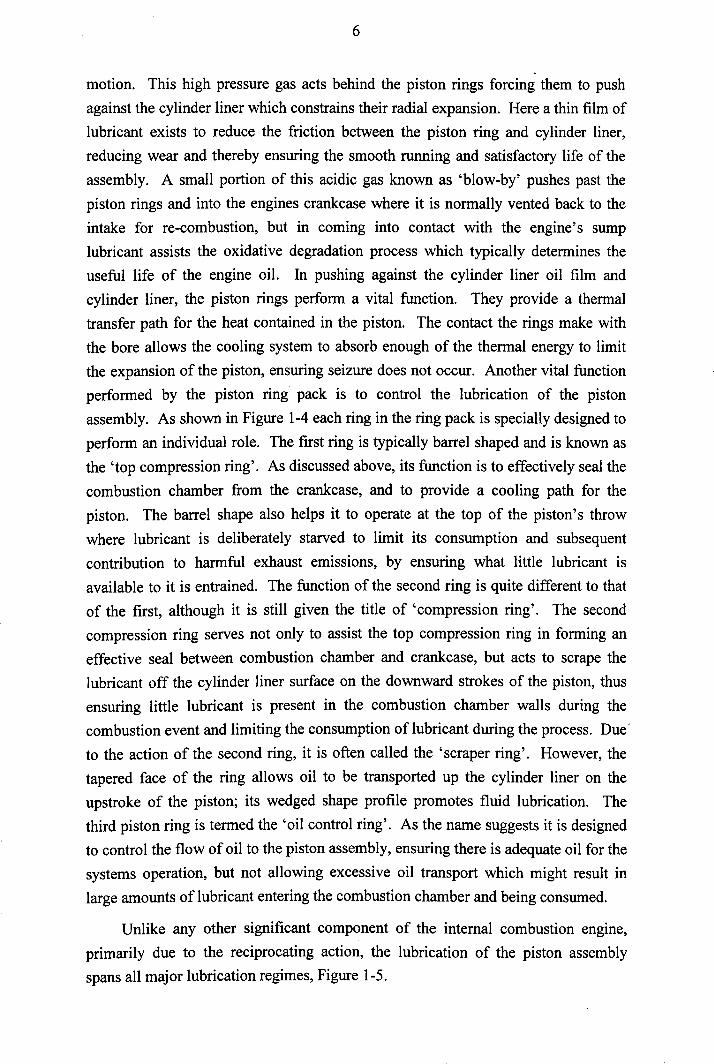
Unlike any other significant component of the internal combustion engine,primarily due to the reciprocating action, the lubrication of the piston assemblyspans all major lubrication regimes, Figure 1-5.
7
When the piston assembly is at both the top and bottom of the cylinder, at theends of its stroke, the velocity of the piston is low enough to allow the assembly toenter the boundary lubrication regime. In this regime the surfaces are in normalcontact and thus the bulk properties of the lubricant are no longer of importance, andlubrication relies on chemical and physical action of thin molecular films. At a
certain point in the stroke of the piston, shortly after top of bottom dead centre,velocity increases enough to allow the entrainment of some lubricant. At this pointthere is both asperity interaction and some fluid lubrication, thus this type oflubrication is known as 'mixed'. With velocity increased further, the piston entersthe elastohydrodynamic regime. In this regime fluid film lubrication dominates andsurfaces are separated, but a more concentrated mechanism where elastic
deformation of the surfaces occurs as a result of the effect of pressure on viscosity.Around the mid-stroke of the piston, the velocities are high enough to ensure fullfluid film lubrication in which the surfaces are completely separated and thedynamic viscosity of the fluid becomes the most important property. Traditionally itis in this regime that the piston assembly spends most of its time. It is therefore theenergy required to shear the fluid under hydrodynamic conditions that dominates the
level of resistance to motion, and consequently the friction of the piston assembly'S
motion, during this regime.
BOUNDARY
COlfflClOlTOf
FRICTIONI~I
1IXWt."SlOHYOROOYlW1ltAll
HYOIIOOYIWIC
10 15
,.,. INch ... ,.Iio IU • ." .. 1;'. fill IlIicIuIul.... h •• roughnaa IU... ,
Figure 1-5 Modified Stribeck Diagram (Priest 2000)
1.2. Engine Lubricants and Formulation
The main role of the lubricant is to minimise friction and wear in the contactbetween piston rings and cylinder liner. However, increasingly stringent legislation
8
is calling for lubricants to overcome a series of conflicting requirements. Lubricantsshould increase fuel economy, reduce emissions, increase engine durability and haveextended drain intervals, perhaps even stay in service for the life of the vehicle.They key trends over the past few years have primarily been driven by the need forimproved fuel economy, although the need for improved oxidation stability,handling of contaminants and compatibility with other systems has played a part. Todate, increases in fuel economy have primarily been achieved through the loweringof the bulk viscosity of the engine oil. In most typical engines the dominatinglubrication regime during piston assembly operation is hydrodynamic, thus the lowerviscosity fluid requires less energy to shear it reducing the contribution of this
lubrication regime to the total friction. However, as the viscosity is reduced, thepoint in the cycle where hydrodynamic passes into the elastohydrodynamic,elastohydrodynamic into mixed, and mixed into the boundary lubrication regimeoccurs earlier allowing these regimes to have a more dominant effect on the overallfriction of the system (Taylor, Brown et al. 1994). Essentially, where low viscositylubricant is used, the piston assembly spends a greater amount of time in lubrication
regimes where metal-to-metal contact occurs having serious implications for frictionand wear. Once in these contact regimes the bulk properties of the lubricant becomeless important, and it is the task of the lubricant additive package to control frictionand wear thus making the choice of a lower viscosity lubricant valid.
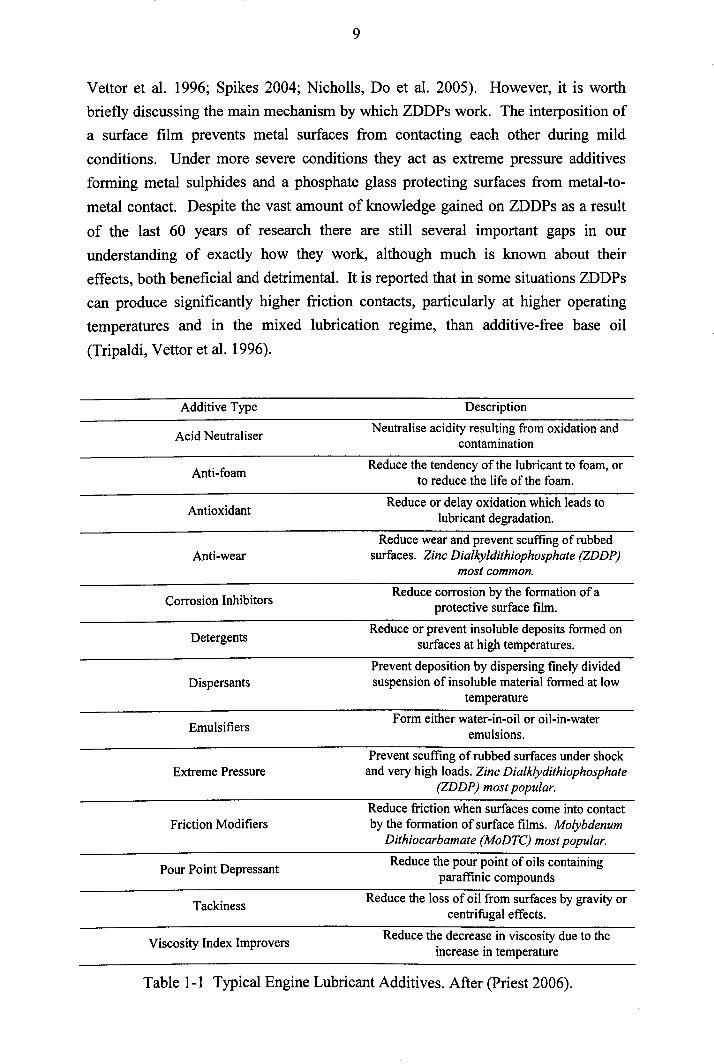
Approximately 5% - 25% of a typical engine lubricant is made up of additives(Taylor 2002; Moreton 2005). Additives are chemicals added to a lubricant toperform specific functions or achieve levels of performance not possible with thebase oil alone. The basic types of lubricant additive are presented in Table 1-1.
To permit the use of a lubricant with low viscosity, a lubricant must have anadditive package strong in anti-wear, extreme pressure and friction modifieradditives. From inspection of the above table it is clear that the preferred anti-wearand extreme pressure additives are zinc dialklydithophosphates (ZDDPs). ZDDPsare arguably the most successful lubricant additives ever invented. They are still in
use today, and have been for approximately 60 years, despite attempts from additivecompanies to replace them. Their remarkable anti-wear, antioxidant and corrosioninhibiting properties coupled with their cost-effectiveness continues to ensure theirplace in the automotive additive market. This triple purpose additive has inspiredvast amounts of research into its action since the day it was first introduced, makinga review of the history, or mechanisms of action, of ZDDPs impractical in thisthesis. However, a number of good reviews discussing both the history and thecurrent state of knowledge on ZDDPs have been written and it is recommended thatthe interested reader refers to these for in-depth information on the subject (Tripaldi,
9
Vettor et al. 1996; Spikes 2004; Nicholls, Do et al. 2005). However, it is worthbriefly discussing the main mechanism by which ZDDPs work. The interposition ofa surface film prevents metal surfaces from contacting each other during mildconditions. Under more severe conditions they act as extreme pressure additivesforming metal sulphides and a phosphate glass protecting surfaces from metal-to-
metal contact. Despite the vast amount of knowledge gained on ZDDPs as a result
of the last 60 years of research there are still several important gaps in ourunderstanding of exactly how they work, although much is known about theireffects, both beneficial and detrimental. It is reported that in some situations ZDDPscan produce significantly higher friction contacts, particularly at higher operatingtemperatures and in the mixed lubrication regime, than additive-free base oil
(Tripaldi, Vettor et al. 1996).
Additive Type Description
Acid NeutraliserNeutralise acidity resulting from oxidation and
contamination
Anti-foamReduce the tendency of the lubricant to foam, or
to reduce the life of the foam.
AntioxidantReduce or delay oxidation which leads to
lubricant degradation.
Anti-wearReduce wear and prevent scuffing of rubbed
surfaces. Zinc Dialkyldithiophosphate (ZDDP)most common.
Corrosion InhibitorsReduce corrosion by the formation of a
protective surface film.
DetergentsReduce or prevent insoluble deposits formed on
surfaces at high temperatures.
DispersantsPrevent deposition by dispersing finely dividedsuspension of insoluble material formed at low
temperature
EmulsifiersForm either water-in-oil or oil-in-water
emulsions.
Extreme PressurePrevent scuffing of rubbed surfaces under shockand very high loads. Zinc Dialklydithiophosphate
(ZDDP) most popular.
Friction ModifiersReduce friction when surfaces come into contactby the formation of surface films. Molybdenum
Dithiocarbamate (MoDTC) most popular.
Pour Point Depressant Reduce the pour point of oils containingparaffinic compounds
Tackiness Reduce the loss of oil from surfaces by gravity orcentrifugal effects.
Viscosity Index Improvers Reduce the decrease in viscosity due to theincrease in temperature
Table 1-1 Typical Engine Lubricant Additives. After (Priest 2006).
10
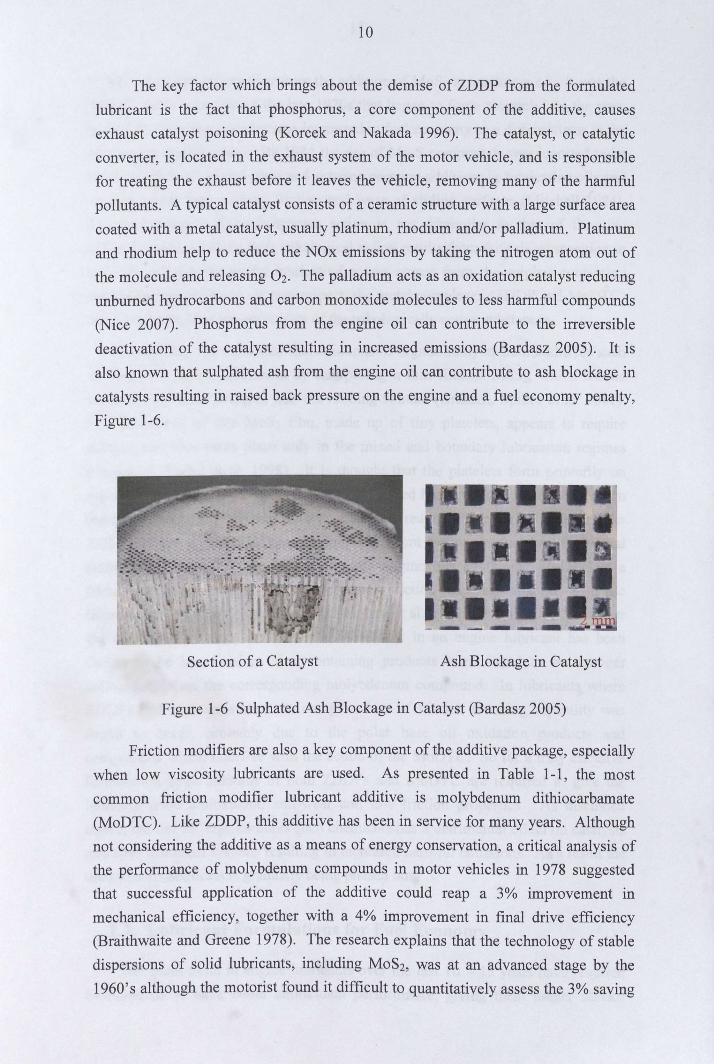
The key factor which brings about the demise of ZDDP from the formulatedlubricant is the fact that phosphorus, a core component of the additive, causesexhaust catalyst poisoning (Korcek and Nakada 1996). The catalyst, or catalyticconverter, is located in the exhaust system of the motor vehicle, and is responsiblefor treating the exhaust before it leaves the vehicle, removing many of the harmfulpollutants. A typical catalyst consists of a ceramic structure with a large surface areacoated with a metal catalyst, usually platinum, rhodium and/or palladium. Platinumand rhodium help to reduce the NOx emissions by taking the nitrogen atom out ofthe molecule and releasing O2. The palladium acts as an oxidation catalyst reducingunburned hydrocarbons and carbon monoxide molecules to less harmful compounds(Nice 2007). Phosphorus from the engine oil can contribute to the irreversibledeactivation of the catalyst resulting in increased emissions (Bardasz 2005). It isalso known that sulphated ash from the engine oil can contribute to ash blockage incatalysts resulting in raised back pressure on the engine and a fuel economy penalty,
Figure 1-6.
Section of a Catalyst Ash Blockage in Catalyst
Figure 1-6 Sulphated Ash Blockage in Catalyst (Bardasz 2005)
Friction modifiers are also a key component of the additive package, especiallywhen low viscosity lubricants are used. As presented in Table 1-1, the mostcommon friction modifier lubricant additive is molybdenum dithiocarbamate(MoDTC). Like ZDDP, this additive has been in service for many years. Althoughnot considering the additive as a means of energy conservation, a critical analysis ofthe performance of molybdenum compounds in motor vehicles in 1978 suggestedthat successful application of the additive could reap a 3% improvement inmechanical efficiency, together with a 4% improvement in final drive efficiency(Braithwaite and Greene 1978). The research explains that the technology of stabledispersions of solid lubricants, including MoS2, was at an advanced stage by the1960's although the motorist found it difficult to quantitatively assess the 3% saving
11
in fuel consumption resulting from the addition of MOS2to crankcase oil. It was the'energy crisis' situation of the late 1970s that began to force research into the area,as vehicle manufacturers became interested in fuel economy as a differentiator in theautomotive market place. By 1984 the use of Mo-S compounds was reported to be'well established' as anti-wear and extreme pressure additives in lubricating oils andgreases where they reduced friction and wear of sliding surfaces (Mitchell 1984).The molybdenum dithiophosphates action is not dissimilar to that of the zincdithiophosphates, where their tribological action results from their decomposition inthe bulk oil; the successful lubricating action comes from the sulphur containingdecomposition products. In that respect, the metal complexes (ZDDP and MoDTC)can be thought of as the precursors of the tribologically active substances.
Essentially the main way that solutions of organo-molybdenum additives suchas MoDTCs reduce friction is by interposing a thin film of MoS2, which has aninherent low shear strength, into the rubbing contact (Graham, Spikes et al. 2001).
The generation of this MOS2 film, made up of tiny platelets, appears to requirerubbing and thus takes place only in the mixed and boundary lubrication regimes(Grossiard, Varlot et al. 1998). It is thought that the platelets form primarily onasperity peaks and thus support most of the applied load in the boundary lubricationregime, consequently having a large effect on reducing friction. However, likeZDDP, the use of MoDTC in engine lubricant is not without its drawbacks. Severalauthors have reported that fully formulated engine oils containing MoDTC as afriction reducing additive gradually lose their friction reducing capability with use(Korcek, Jensen et al. 2000; Yamada, Ishimaru et al. 2000; Jensen 2005). Howeverthe combined presence of ZDDPs and MoDTC in an engine lubricant has beenshown to be beneficial as zinc containing products were found to be strongerantioxidants than the corresponding molybdenum compound. In lubricants whereZDDPs had been consumed the complete loss of friction reducing capability wasfound to occur, probably due to the polar base oil oxidation products andcomponents which interfere with the action of the MoDTC. So for a truly effectiveformulation large amounts of both ZDDPs and MoDTC are required to give thelubricant good antioxidant, anti-wear and low friction properties. As discussedabove, the use of large amounts such chemicals has a detrimental effect on catalystsand after treatment systems resulting in increased harmful emissions. As a result theuse of such chemicals is gradually being phased out.
1.3. Lubricant Formulations for Fuel Economy
The main trend in engine lubricants over the last 10 - 15 years have required
formulations to have better antioxidant performance, giving them longer service
12
lives, better dispersant - detergent performance to help maintain cleanliness andefficiency of engines, have better compatibility with after treatment devices and togive a vehicle improved fuel economy performance (Taylor, Mainwaring et al.2005). There is a direct correlation between furthering fuel economy and reducinghydrocarbon consumption and the emission of C02. For this reason the literature isheavily populated by OEMs reporting the energy savings they have made throughsuccessfully employing low viscosity lubricants with heavy additive packages, albeitwith some interesting side effects. In the early 1990's, for example, a study reportedsignificant energy savings by employing low viscosity engine oils in urban runningconditions, resulting in limited fuel consumption and reduced C02 emissions(Manni, Gommellini et al. 1995). However, the paper also reports an importantconsequence of running low viscosity oil in a vehicle equipped with standardelectronic engine configuration unit; an increase hydrocarbon and carbon monoxideemissions, primarily due to the inherent increased volatility of low viscosityhydrocarbon base stocks.
Studies conducted in the late 1990's, when fuel economy was becoming asignificant issue to the automotive industry, report significant fuel economyimprovements through the application of low viscosity lubricants equipped withMoDTC friction modifiers, but also begin to investigate other organic frictionmodifier species (Hoshino, Kawai et al. 1998; Tseregounis, Mcmillan et al. 1998).
No real difference was seen in the performance of the two types of friction modifier(organic and Mo), which were both tested to perform equally well, again excelling inthe urban driving cycle tests. In the early 2000's, work conducted by the same
authors shows the experimental technique was accurate enough to begin todifferentiate between organic and Mo based friction modifiers, and research suggeststhat the Mo-type friction modifiers were about 0.5% more effective than their purelyorganic counterparts (Tseregounis and McMillan 2001).
A set of experiments conducted in 2004 tested an SAE 5W30 and a SAE OW20
without friction modifier against each other (Mufti 2004). Tests were conducted ona research engine equipped with Instantaneous Mean Effective Pressure (IMEP)equipment, presented later in this thesis, which permits the direct measurement ofpiston assembly friction during firing engine conditions. The measured data showedthe benefit of a high viscosity lubricant on piston assembly friction at hightemperatures, and the opposite effect at low temperatures. This piece of research
stresses the need for friction modifiers where low viscosity base oils are employed,particularly at high temperatures or in engines with high power densities, wherelubrication conditions are significantly influenced by metal-to-metal contact.
13
There are many ways in which fuel efficiency and emission control of theinternal combustion engine can be achieved. Lubricant technology has been, and is,one of the most powerful tools currently available and is continually used to meetconflicting requirements dictated by engine technology, emission control and thecustomer. One of these conflicting requirements is to further fuel economy, but tophase out the two most powerful and efficient additives which are currentlyresponsible for the fuel economy gains we have seen in the past 10 - 15 years,ZDDP and MoDTC. It has been said by leading researchers that some of therequirements challenging the automotive industry are often demanding,contradictory, and that others cannot be met without a "breakthrough" (Korcek,Sorab et al. 2000). The authors stress that there were many tribological issues to besolved to successfully meet future emission and fuel economy requirements and thatthere was an urgent need for extensive systematic lubrication research to meet futuretechnological challenges and competitive pressures. The need for alternative frictionmodifiers whose action does not affect other important vehicle systems manifestsitself as one of these challenges. In this chapter, indeed this thesis, systematic,scientifically guided, creative and innovative research into viable friction modifieralternatives to replace MoDTC is presented.
1.4. Friction Modifiers
The success of MoDTC, or MOS2, has overshadowed the knowledge of anyother friction modifier for many years, and has been the focus of most recentlypublished literature. However, friction modifiers or 'boundary lubricants' have beenthe subject oftribological study for many years. Work conducted in the 1940's byBowden and Tabor (1950) presents an extensive and systematic approach to the
investigation into boundary lubricants. It was recognised that boundary lubrication.was of great importance in engineering practice, as it governed the behaviour ofmost sliding mechanisms and determined whether serious wear or seizure wouldtake place. Early experiments were conducted with a homologous series ofparaffins, alcohols and fatty acids. Itwas shown that a small trace of a fatty acid to amineral oil could bring about a considerable reduction in the friction and wear of a
contact.
The term 'fatty acids', as used in the context of this thesis, relates to acidswhich have their origins in land and marine animal fats, vegetable seed oils andorganic synthesis (Pryde 1985). The term was originally applied to the saturatedmonobasic carboxylic acids and long-chain acids which were scientifically identifiedas early as 1818, although evidence suggests that they were used by the early
Egyptians as early as 3200 B.C. as food stuffs. It is not thought that they were used
14
for lubrication until 1400 B.C. where they were employed to lubricate Egyptianchariots. They have been known to be used in a variety of applications includingarts, technology and medicine, although they are most well known for their use insoaps. Fatty acid based soaps were made by the Phoenicians as early as 600 B.C.and the ingredient remains key in the manufacture of soaps today, albeit in a more
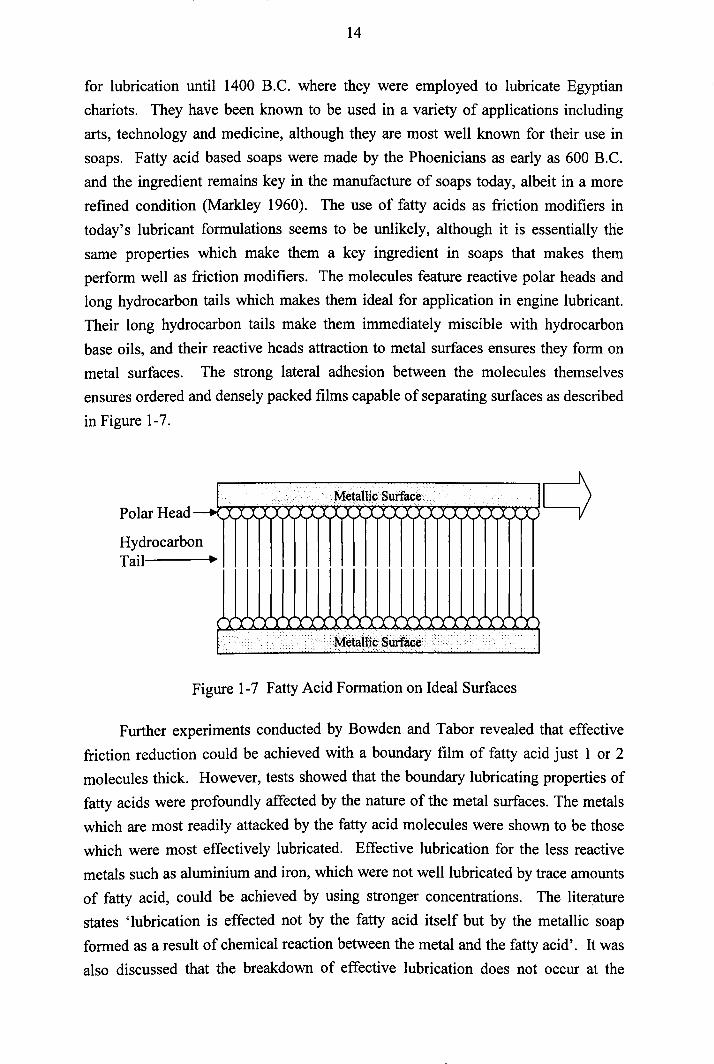
refined condition (Markley 1960). The use of fatty acids as friction modifiers intoday's lubricant formulations seems to be unlikely, although it is essentially thesame properties which make them a key ingredient in soaps that makes themperform well as friction modifiers. The molecules feature reactive polar heads andlong hydrocarbon tails which makes them ideal for application in engine lubricant.Their long hydrocarbon tails make them immediately miscible with hydrocarbonbase oils, and their reactive heads attraction to metal surfaces ensures they form onmetal surfaces. The strong lateral adhesion between the molecules themselvesensures ordered and densely packed films capable of separating surfaces as described
in Figure 1-7.
, .,.......... MetallicSutface IrlXXIIIIIIIIIIIIIIIIIIXXXXXX)L__(Polar Head
HydrocarbonTail _..
CIIIIIXXXXXXXXXXXXXXXXXXXXX)•.'•••.••..•••...•..·<,M:~t<tHic$Qrt~¢<··· .......1
Figure 1-7 Fatty Acid Formation on Ideal Surfaces
Further experiments conducted by Bowden and Tabor revealed that effective
friction reduction could be achieved with a boundary film of fatty acid just I or 2molecules thick. However, tests showed that the boundary lubricating properties offatty acids were profoundly affected by the nature of the metal surfaces. The metalswhich are most readily attacked by the fatty acid molecules were shown to be thosewhich were most effectively lubricated. Effective lubrication for the less reactivemetals such as aluminium and iron, which were not well lubricated by trace amountsof fatty acid, could be achieved by using stronger concentrations. The literaturestates 'lubrication is effected not by the fatty acid itself but by the metallic soapformed as a result of chemical reaction between the metal and the fatty acid'. It wasalso discussed that the breakdown of effective lubrication does not occur at the
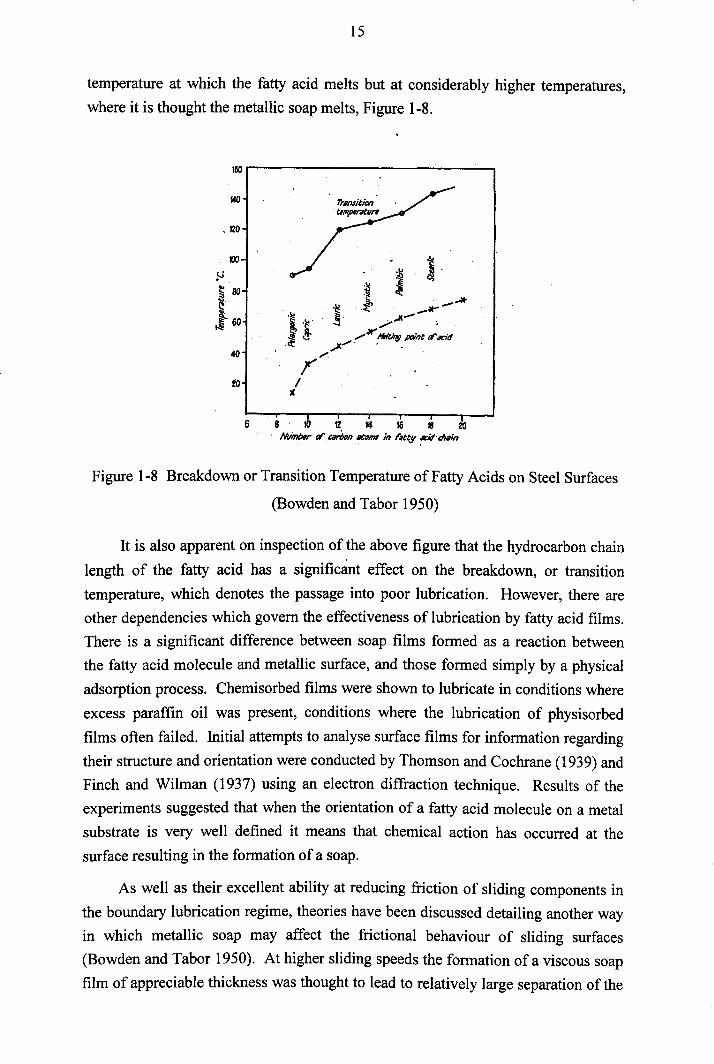
15
temperature at which the fatty acid melts but at considerably higher temperatures,where it is thought the metallic soap melts, Figure 1-8.
160
MO
.120
XX)
~~ 80
~.t 60
40
to
6 8 U" ffi ~ ~"Nuin6er DI'~n atmM in fatt,y ~"efI8;n
Figure 1-8 Breakdown or Transition Temperature of Fatty Acids on Steel Surfaces
(Bowden and Tabor 1950)
It is also apparent on inspection of the above figure that the hydrocarbon chain
length of the fatty acid has a significant effect on the breakdown, or transitiontemperature, which denotes the passage into poor lubrication. However, there areother dependencies which govern the effectiveness of lubrication by fatty acid films.There is a significant difference between soap films formed as a reaction betweenthe fatty acid molecule and metallic surface, and those formed simply by a physicaladsorption process. Chemisorbed films were shown to lubricate in conditions where
excess paraffin oil was present, conditions where the lubrication of physisorbed
films often failed. Initial attempts to analyse surface films for information regardingtheir structure and orientation were conducted by Thomson and Cochrane (1939) andFinch and Wilman (1937) using an electron diffraction technique. Results of theexperiments suggested that when the orientation of a fatty acid molecule on a metalsubstrate is very well defined it means that chemical action has occurred at thesurface resulting in the formation of a soap.
As well as their excellent ability at reducing friction of sliding components inthe boundary lubrication regime, theories have been discussed detailing another wayin which metallic soap may affect the frictional behaviour of sliding surfaces(Bowden and Tabor 1950). At higher sliding speeds the formation of a viscous soapfilm of appreciable thickness was thought to lead to relatively large separation of the
16
surfaces even at speeds well below those at which hydrodynamic lubrication mightbe expected to begin. Research conducted in 1951 also touches on this subjectconcluding that tests indicate that the rheological properties of the lubricants may
have considerable influence on the frictional behaviour, and that the chemical natureof the lubricant may only be important in so far as it governs the rheologicalproperties of any products of reaction with the surface (Barwell and Milne 1951).
The need to find friction modifier additives which conform to the CHON orNOCH philosophy, which states they must only consist of carbon, hydrogen, oxygenand nitrogen, has generated some recent publications detailing investigation into
fatty acids as automotive friction modifiers. The need for a replacement to MoDTChas formed the basis for much recent research which begins to tackle the same
problems considered by Bowden and Tabor in the 1950's. Work conducted at theend of the 1990s began to investigate the nature of the surfactant-solid bond andinvestigated thick-film and thin-film or monolayer lubrication by fatty acids(Anghel, Bovington et al. 1999). The relatively modem techniques of ultrathin-film
interferometry were used to assess the contribution of surfactant type friction
modifiers to film formation in high-pressure rolling, and rolling-sliding lubricatedcontacts. Results showed films up to 50-70 nm thick can be formed in slow speedcontacts, suggesting the presence of a highly viscous surface layer on the rollingsurfaces. Research concluded that these films were removed under conditions of
high speed, ultimately concluding that additives which form thick boundary filmscan playa role in reducing friction in the intermediate speed range.
Research conducted in 2002 attempted to directly tackle the issues of filmformation surrounding a commercial copper carboxylate additive. Tests conductedunder rolling conditions showed the deposition of a thick (-70nm) highly viscoussoap-like film on the rubbing tracks. It is reported that an interesting feature of thefilm was that it could be dislodged from the surfaces by high shear stress conditions,and would take time to reform. However, the paper also notes that some simple fatty
acid additives were shown to form only mono layers under rolling conditions, andthat only when a chemical reaction with the surface producing a soap occurs can athick film be generated (Spikes 2002).
A commercially orientated piece of research published in 2003 evaluated awide range of fatty acids, glycerol based molecules, amides and amines as well as
MoDTC under elastohydrodynamic and boundary lubrication regime conditions(Castle and Bovington 2003). The work conducted in this study gives further
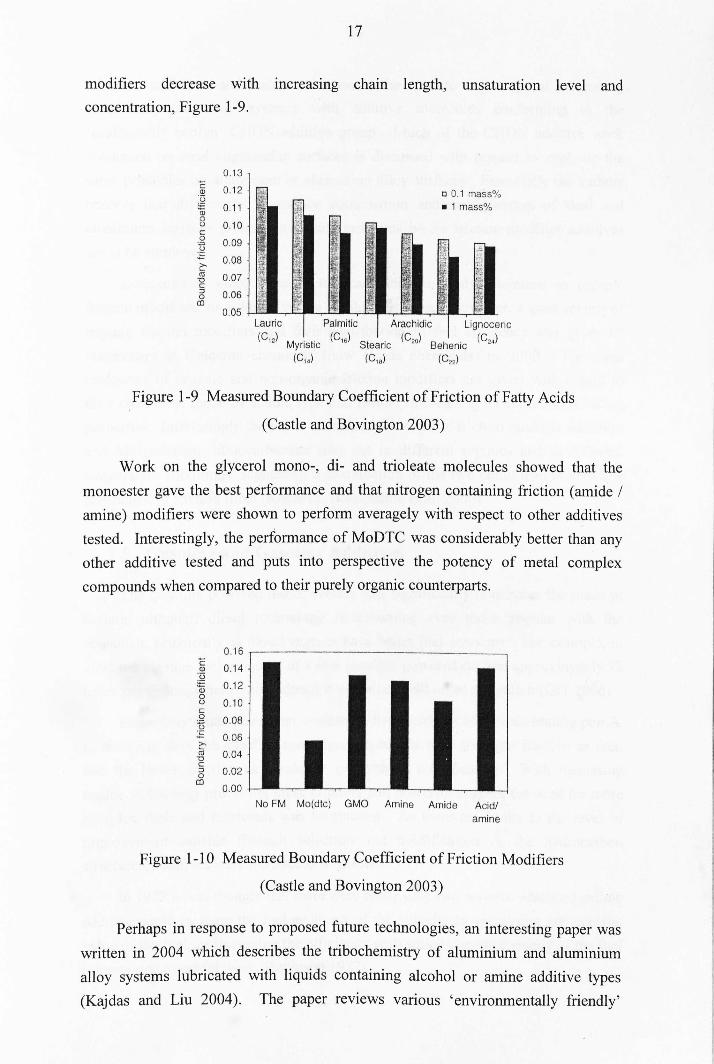
foundation to the early work conducted by Bowden and Tabor, but goes further tocharacterise the critical performance issues of the molecules. Findings show thatmeasured boundary coefficients of friction measured with fatty acid friction
17
modifiers decrease with increasing chain length, unsaturation level andconcentration, Figure 1-9.
0.13C 0.12Q)
~ 0.11ID00 0.10c0 0.09.."0:E 0.08eOl 0.07uc:::J 0.060rn
0.05Lauric Palmitic(C,,)
Myristic(C,6)
(C14)
00.1 mass%.1 mass%
Arachidic Lignoceric
Stearic (C,o) Behenic (C'4)
(C,.) (C2,)
Figure 1-9 Measured Boundary Coefficient of Friction of Fatty Acids
(Castle and Bovington 2003)
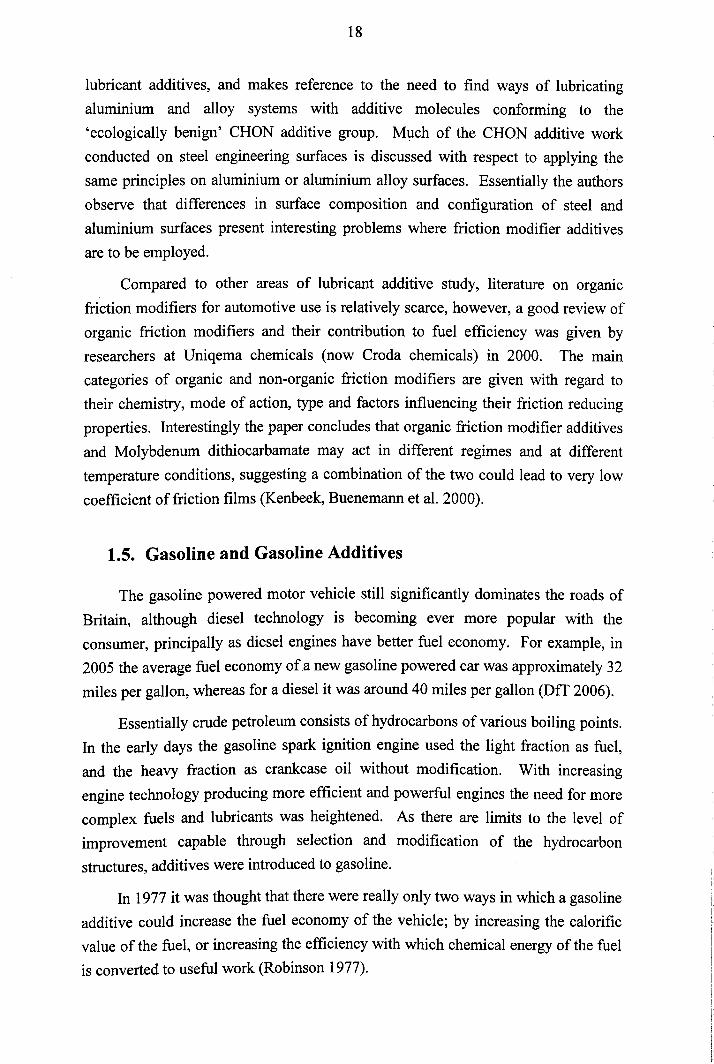
Work on the glycerol mono-, di- and trioleate molecules showed that themonoester gave the best performance and that nitrogen containing friction (amide /amine) modifiers were shown to perform averagely with respect to other additivestested. Interestingly, the performance of MoDTC was considerably better than anyother additive tested and puts into perspective the potency of metal complexcompounds when compared to their purely organic counterparts.
0.16C 0.14Q)
'0
~ 0..120
0.100
cQ 0.080E 0.06e-Ol 0.04uc:::J 0.020Cl)
0.00
No FM Mo(dtc) GMO Amine Amide Acid/amine
Figure 1-10 Measured Boundary Coefficient of Friction Modifiers
(Castle and Bovington 2003)
Perhaps in response to proposed future technologies, an interesting paper waswritten in 2004 which describes the tribochemistry of aluminium and aluminiumalloy systems lubricated with liquids containing alcohol or amine additive types(Kajdas and Liu 2004). The paper reviews various 'environmentally friendly'
18
lubricant additives, and makes reference to the need to find ways of lubricatingaluminium and alloy systems with additive molecules conforming to the'ecologically benign' CHON additive group. Much of the CHON additive workconducted on steel engineering surfaces is discussed with respect to applying thesame principles on aluminium or aluminium alloy surfaces. Essentially the authorsobserve that differences in surface composition and configuration of steel andaluminium surfaces present interesting problems where friction modifier additivesare to be employed.
Compared to other areas of lubricant additive study, literature on organicfriction modifiers for automotive use is relatively scarce, however, a good review of
organic friction modifiers and their contribution to fuel efficiency was given byresearchers at Uniqema chemicals (now Croda chemicals) in 2000. The maincategories of organic and non-organic friction modifiers are given with regard totheir chemistry, mode of action, type and factors influencing their friction reducingproperties. Interestingly the paper concludes that organic friction modifier additivesand Molybdenum dithiocarbamate may act in different regimes and at differenttemperature conditions, suggesting a combination of the two could lead to very lowcoefficient of friction films (Kenbeek, Buenemann et al. 2000).
1.5. Gasoline and Gasoline Additives
The gasoline powered motor vehicle still significantly dominates the roads of
Britain, although diesel technology is becoming ever more popular with theconsumer, principally as diesel engines have better fuel economy. For example, in2005 the average fuel economy ofa new gasoline powered car was approximately 32miles per gallon, whereas for a diesel it was around 40 miles per gallon (DIT 2006).
Essentially crude petroleum consists of hydrocarbons of various boiling points.In the early days the gasoline spark ignition engine used the light fraction as fuel,and the heavy fraction as crankcase oil without modification. With increasingengine technology producing more efficient and powerful engines the need for morecomplex fuels and lubricants was heightened. As there are limits to the level ofimprovement capable through selection and modification of the hydrocarbonstructures, additives were introduced to gasoline.
In 1977 it was thought that there were really only two ways in which a gasoline
additive could increase the fuel economy of the vehicle; by increasing the calorificvalue of the fuel, or increasing the efficiency with which chemical energy of the fuelis converted to useful work (Robinson 1977).
19
Inlet SystemCleanliness
1956
Function Compound
Improve Tetraethyl Leadcombustion
Prevent oxidation Alkyl phenol
in storage
Resist carburettor Isopropyl alcoholicing
Control Tritolyl phosphatecombustion
chamber deposits
Control inlet Alkyl aminedeposits phosphate
Control inlet Polyisobutenedeposits amine with mineral
oil carrier.
Additive Type Date
Anti-knock 1926
Anti-oxidant 1930
Anti-icing 1952
Ignition control 1954
Inlet SystemCleanliness II
1971
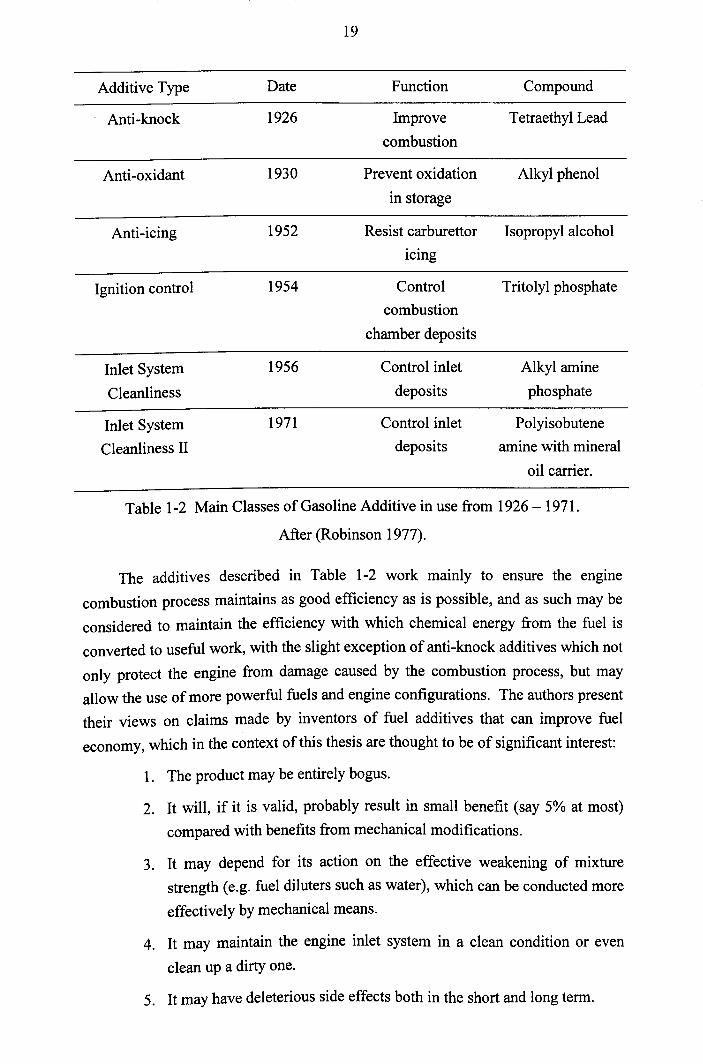
Table 1-2 Main Classes of Gasoline Additive in use from 1926 -1971.After (Robinson 1977).
The additives described in Table 1-2 work mainly to ensure the engine
combustion process maintains as good efficiency as is possible, and as such may beconsidered to maintain the efficiency with which chemical energy from the fuel isconverted to useful work, with the slight exception of anti-knock additives which not
only protect the engine from damage caused by the combustion process, but mayallow the use of more powerful fuels and engine configurations. The authors presenttheir views on claims made by inventors of fuel additives that can improve fueleconomy, which in the context of this thesis are thought to be of significant interest:
1. The product may be entirely bogus.
2. It will, if it is valid, probably result in small benefit (say 5% at most)compared with benefits from mechanical modifications.
3. It may depend for its action on the effective weakening of mixturestrength (e.g. fuel diluters such as water), which can be conducted moreeffectively by mechanical means.
4. It may maintain the engine inlet system in a clean condition or even
clean up a dirty one.
5. Itmay have deleterious side effects both in the short and long term.
20
6. It may really be a power-enhancing additive such as methanol.
7. It may be claimed to give 'smoother combustion', but such flame-controlling additives are most unlikely to be found for spark ignitionengines.
8. It might indeed give a real benefit by some as yet poorly realised andunderstood mechanism.
By 1986 it was recognised that gasoline additives needed to be formulated withcompletely ashless components to prevent catalyst poisoning (Tupa and Dorer1986). In the paper it is reported that additives were used in both gasoline and dieselfuels to assure satisfactory performance in engines, protect against contamination
during transport and to maintain the quality of the product until used by the end user.Additives were therefore mainly used by refineries as an economical and convenientway of achieving performance goals and a flexible, rapid way of controlling productquality, although performance additives were also on the market and includeddetergents, dispersants, fluidiser oils, anti-icers, combustion modifiers and flow
improvers. Around 1986 OEMs began to switch from carburettor to injector inletdesigns, which focused much of the work in the area on engine cleanliness, firstly tocontrol injector deposits, and secondly to prevent valve deposits (Gibbs 1990). By1990, the report estimates that 40% of the gasolines on the market contained somelevel of deposit control additive and that most of the rest still had carburettor Iinjector detergents. However, as much as 10% of the gasolines on the marketcontained ineffective additive treatment, or no additive treatment at all.Interestingly, at this point the additives were injected at the distribution terminals,directly into the delivery tankers for delivery to service stations. By injecting
directly into the tankers specific customer needs could be accounted for catering forthe need to differentiate between regular and premium fuels. Gibbs went on toconclude that if an oil company decided to make a top-quality gasoline, the path was
clear:
"Today's additive technology can improve the performance of any gasoline
tremendously. Given the right commitment, careful selection of the right additivesand the right follow through, the end result will be a superb product." (Gibbs 1990)
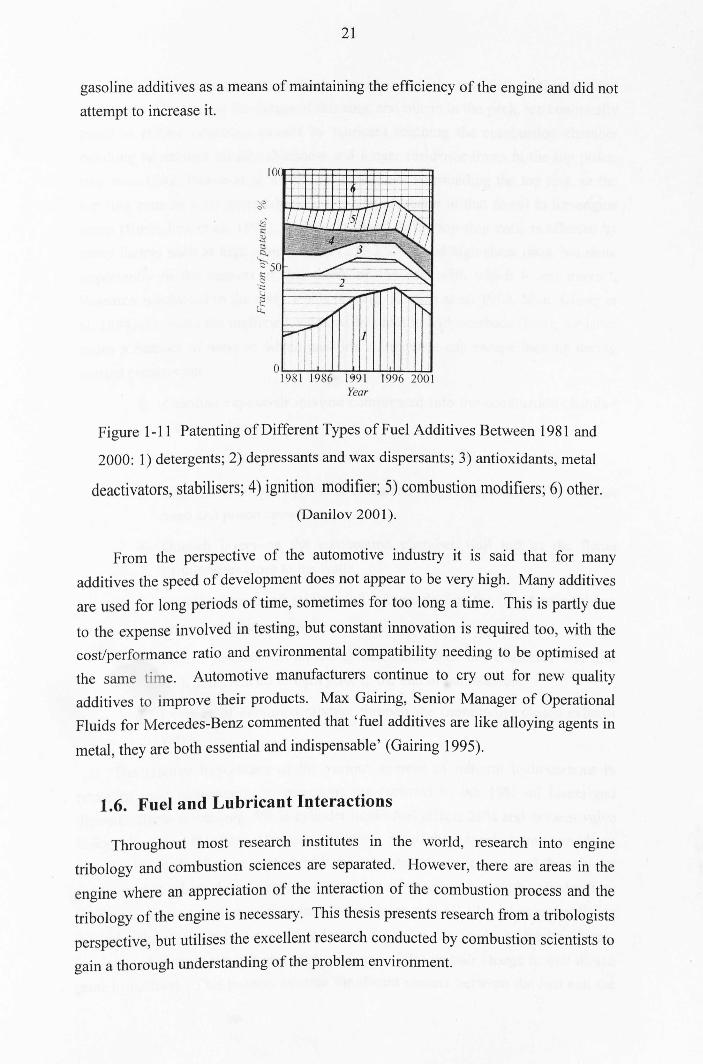
A review of the evolution and use of fuel additives (Danilov 2001) charts thepatenting of different types of fuel additive between 1981 - 2000, Figure 1-11.
The category labelled 'other' on Figure 1-11 refer to additives such as anti-
foamers and additives which reduce losses in evaporation of gasoline. It is clearfrom the figure that gasoline additive research up to 2000 was strongly focused on
21
gasoline additives as a means of maintaining the efficiency of the engine and did not
attempt to increase it.
Year
Figure 1-11 Patenting of Different Types of Fuel Additives Between 1981 and
2000: 1) detergents; 2) depressants and wax dispersants; 3) antioxidants, metal
deactivators, stabilisers; 4) ignition modifier; 5) combustion modifiers; 6) other.(Danilov 2001).
From the perspective of the automotive industry it is said that for manyadditives the speed of development does not appear to be very high. Many additivesare used for long periods of time, sometimes for too long a time. This is partly due
to the expense involved in testing, but constant innovation is required too, with thecost/performance ratio and environmental compatibility needing to be optimised atthe same time. Automotive manufacturers continue to cry out for new qualityadditives to improve their products. Max Gairing, Senior Manager of OperationalFluids for Mercedes-Benz commented that 'fuel additives are like alloying agents in
metal, they are both essential arid indispensable' (Gairing 1995).
1.6. Fuel and Lubricant Interactions
Throughout most research institutes in the world, research into enginetribology and combustion sciences are separated. However, there are areas in the
engine where an appreciation of the interaction of the combustion process and the
tribology of the engine is necessary. This thesis presents research from a tribologists
perspective, but utilises the excellent research conducted by combustion scientists togain a thorough understanding of the problem environment.
22
The top compression ring acts as a seal between the combustion chamber andcrankcase. Changes in the design of this ring, and others in the pack, are continuallymade to reduce emissions caused by lubricant reaching the combustion chamberresulting in reduced oil-film thickness and longer residence times in the top pistonring zone (Fox, Picken et al. 1997). The lubricant surrounding the top ring, or thetop ring zone as it is commonly called, is very different to that found in the enginesump (Bush, Fox et al. 1991). Lubricant found in the top ring zone is affected bymany factors such as high temperatures (200-220°C) and high shear rates, but moreimportantly in the context of this thesis by the fuel with which it can interact.Research conducted in the early 1990s (Cheng, Hamrin et al. 1993; Shin, Cheng etal. 1994) discusses the inefficiency caused by unburnt hydrocarbons (fuel), the latterstates a number of ways in which gasoline compounds can escape burning during
normal combustion.
1. Gasoline vapour-air mixture compressed into the combustion chamber
crevice volumes.
2. Gasoline compounds absorbed in oil layers on the cylinder liner.
3. Gasoline adsorbed by, and/or contained within, deposits on the cylinder
head and piston crown.
4. Quench layers on the combustion chamber wall left as the flame
extinguishes close to the walls.
5. Gasoline vapour-air mixture left unburned when the flame extinguishes
prior to reaching the walls.
6. Liquid gasoline within the cylinder that does not evaporate and mixwith sufficient air to burn prior to the end of combustion.
7. Leakage of unburned mixture through the (nominally) closed exhaust
valve.
The relative importance of the various sources of unburnt hydrocarbons interms of their contribution to emissions are reported to be: 38% oil layers anddeposits, flame quenching, 5% in cylinder liquid fuel effects 20% and exhaust valveleakage less than 7% (Shin, Cheng et al. 1994). All of these mechanisms provide anopportunity for the fuel to interact with the top ring zone lubricant, and the primarysource is that which directly relates the mixing of gasoline fuel with cylinder linerlubricant. The adsorption of fuel into the cylinder wall oil film takes place during
the induction stroke, where tumble and swirl dynamics designed into intake systemsensure conditions in the cylinder are turbulent and the fuel-air charge is well mixedprior to ignition. This process ensures significant contact between the fuel and the
23
cylinder liner oil film. When the combustion event occurs the fuel present in the oilfilm does not burn. After combustion, since the mass fraction of fuel in thecombustion chamber will have dropped to zero, and the temperature risen, the fuel inthe film will begin to diffuse out into the combustion chamber. Some researchreports that increasing engine speed may increase the oil-film thickness sufficientlyfor there to be an increase in the amount of fuel desorbed from the oil film, but thatat the highest engine speeds this may not be true due to the lack of time available forthe diffusion to occur, thus resulting in significant concentrations of unburnt fuel inthe cylinder liner oil-film (Thompson, Radcliffe et al. 1997).
Several studies have been conducted to extract lubricant from directly behindthe top ring, in the top ring zone, to investigate the phenomenon of fuel dilution inthe cylinder liner oil film. The technique of top ring zone sampling during firingengine conditions plays a significant part in this thesis and is discussed in detail inthe following chapter. A study conducted by PSAIPeugeotiCitroen in 1996 lookedat the effects of gasoline boiling point on individual fuel hydrocarbon speciesabsorbed in the oil and found that they increase exponentially with boiling point.The study concludes that the rate of hydrocarbon build-up in the oil film is initiallyfaster that the accumulation of fuel in the sump, but lower final concentrations arereached and the ratio of fuel to lubricant can be directly correlated with the boilingpoint of the fuel species (Frottier, Heywood et al. 1996).
Research conducted in 1997 by the Massachusetts Institute of Technology
investigated the presence of liquid fuel in the cylinder of a firing port-injectedgasoline engine during start-up, where the injected fuel is enriched to provide asignificantly large amount of vaporised fuel, so that smooth starting is achieved.Again the study reports that a large portion of the excess fuel does not vaporise andenters the cylinder as liquid. The fuel is then stored in various places in the cylinder,such as in the oil layers, where it survives the combustion event unburned (Meyerand Heywood 1997). The study discusses that 'wall wetting', the process in whichfuel directly interacts with the walls, is extremely dependent on valve timing wherean indirect injection system is used. In regions which are more exposed to the spraypath of the injector, more significant wall wetting occurs. This theory was furtherinvestigated by researchers at Wayne State University who used colour imagecapturing techniques to visually assess cylinder liner wall wetting as a function ofengine speed, injection timing and injector type, again during the engine start upprocess (Kim, Yoon et al. 2003). One of the images captured in the research showsthe extent of the fuel 'footprint' caused through the impingement of fuel droplets on
the cylinder liner oil film, Figure 1-12.
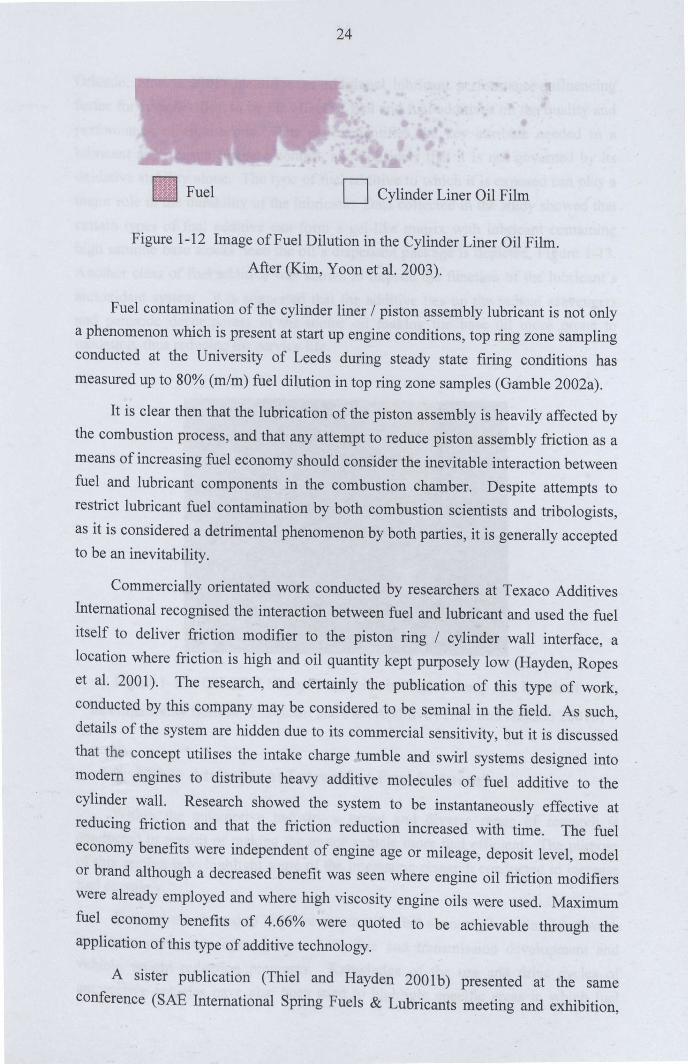
24
Fuel D Cylinder Liner Oil Film
Figure 1-12 Image of Fuel Dilution in the Cylinder Liner Oil Film.
After (Kim, Yoon et al. 2003).
Fuel contamination of the cylinder liner I piston assembly lubricant is not onlya phenomenon which is present at start up engine conditions, top ring zone samplingconducted at the University of Leeds during steady state firing conditions hasmeasured up to 80% (m/m) fuel dilution in top ring zone samples (Gamble 2002a).
It is clear then that the lubrication of the piston assembly is heavily affected bythe combustion process, and that any attempt to reduce piston assembly friction as ameans of increasing fuel economy should consider the inevitable interaction betweenfuel and lubricant components in the combustion chamber. Despite attempts torestrict lubricant fuel contamination by both combustion scientists and tribologists,
as it is considered a detrimental phenomenon by both parties, it is generally acceptedto be an inevitability.
Commercially orientated work conducted by researchers at Texaco AdditivesInternational recognised the interaction between fuel and lubricant and used the fuelitself to deliver friction modifier to the piston ring I cylinder wall interface, alocation where friction is high and oil quantity kept purposely low (Hayden, Ropeset al. 2001). The research, and certainly the publication of this type of work,
conducted by this company may be considered to be seminal in the field. As such,details of the system are hidden due to its commercial sensitivity; but it is discussedthat the concept utilises the intake charge tumble and swirl systems designed intomodern engines to distribute heavy additive molecules of fuel additive to thecylinder wall. Research showed the system to be instantaneously effective atreducing friction and that the friction reduction increased with time. The fuel
economy benefits were independent of engine age or mileage, deposit level, modelor brand although a decreased benefit was seen where engine oil friction modifierswere already employed and where high viscosity engine oils were used. Maximumfuel economy benefits of 4.66% were quoted to be achievable through theapplication of this type of additive technology.
A sister publication (Thiel and Hayden 200 1b) presented at the sameconference (SAE International Spring Fuels & Lubricants meeting and exhibition,
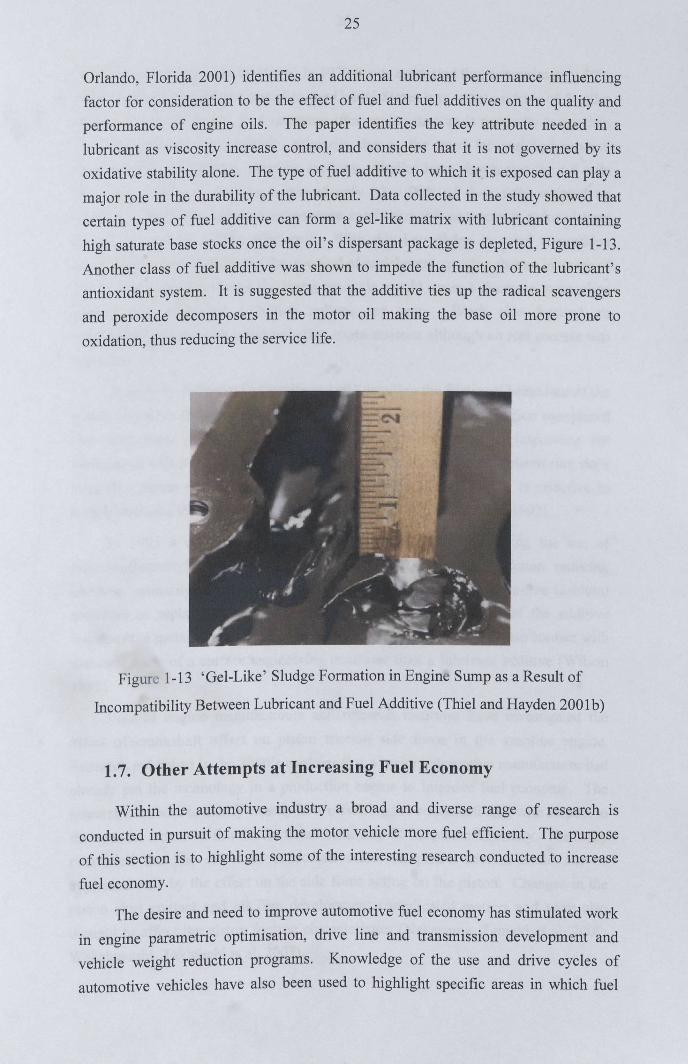
25
Orlando, Florida 2001) identifies an additional lubricant performance influencingfactor for consideration to be the effect of fuel and fuel additives on the quality andperformance of engine oils. The paper identifies the key attribute needed in alubricant as viscosity increase control, and considers that it is not governed by itsoxidative stability alone. The type of fuel additive to which it is exposed can playamajor role in the durability of the lubricant. Data collected in the study showed thatcertain types of fuel additive can form a gel-like matrix with lubricant containinghigh saturate base stocks once the oil's dispersant package is depleted, Figure 1-13.Another class of fuel additive was shown to impede the function of the lubricant'santioxidant system. It is suggested that the additive ties up the radical scavengersand peroxide decomposers in the motor oil making the base oil more prone to
oxidation, thus reducing the service life.
Figure 1-13 'Gel-Like' Sludge Formation in Engine Sump as a Result of
Incompatibility Between Lubricant and Fuel Additive (Thiel and Hayden 2001 b)
1.7. Other Attempts at Increasing Fuel Economy
Within the automotive industry a broad and diverse range of research is
conducted in pursuit of making the motor vehicle more fuel efficient. The purposeof this section is to highlight some of the interesting research conducted to increase
fuel economy.
The desire and need to improve automotive fuel economy has stimulated workin engine parametric optimisation, drive line and transmission development andvehicle weight reduction programs. Knowledge of the use and drive cycles ofautomotive vehicles have also been used to highlight specific areas in which fuel
26
consumption savings can be made. In 1979 it was estimated that approximately 30%of the automotive fuel consumed in the United States was spent on trips of 5 milesor less (Marshall 1979). Fuel economy after engine start up is markedly lower thanthe fully warmed up condition, primarily due to the need for enriched mixtureconditions as discussed in previous sections. Studies have shown that for a 5 miletrip from cold start, vehicles achieved only 80 - 90% of their fully warmed upeconomy. With low ambient temperature conditions this economy is reduced evenfurther to just 60 - 70% efficiency. With this knowledge in mind researchersinvestigated ways of reducing the duration of enrichment, quoting that an increase of5% in fuel economy during the warm up cycle would cause a decrease in gasolineconsumption of about 1 billion gallons per year. Work also focused onreformulating fuels with better volatility characteristics although no real success was
reported.
A study by Fukuoka University in 1992 detailing the frictional behaviour of the
piston assembly through both numerical and experimental investigation recognisedthat decreasing piston ring friction was an important way of improving themechanical efficiency of the engine. They broadly state that for a piston ring pack
with five piston rings, as a means of reducing the friction loss it is effective tosimply decrease the number of piston rings (Wakuri, Hamatake et al. 1992).
In 1995 a number of publications were released documenting the use ofpolytetrafluorethylene (PTFE), packaged as 'Slick 50', as a friction reducingadditive, primarily in response to the need for zinc and phosphorus-free (ashless)additives to replace ZDDPs and MoDTC. The paper claims that the additivemodifies the metallurgy of the engine surfaces with which it comes into contact withmakes it more of a surface engineering treatment than a lubricant additive (Wilson
1995).
Various engine manufacturers and research institutes have investigated theeffect of crankshaft offset on piston friction side force in the gasoline engine.Research published in the 2000's explains that a major automotive manufacturer hadalready put the technology in a production engine to improve fuel economy. Theresearch set about to clarify exactly how offsetting the crankshaft axis with respect tothe cylinder axis modifies the frictional behaviour of the piston assembly. The studyconcluded that the effect of crankshaft offset on piston friction could not beexplained only by the effect on the side force acting on the piston. Changes in thepiston skirt contact and oil film development complicated matters and were alsothought to affect the piston friction characteristics (Nakayama, Tamaki et al. 2000;
Wakabayashi, Takiguchi et al. 2003).
27
Of course energy savings can also be made through improving other importantareas of the engine. A study by Ford discusses attempts to reduce frictional losses indirect-acting mechanical bucket tappet type valvetrains, an area which typicallycontributes 6 - 10% of the total frictional loss in an engine, through use of modifiedsurface finish, surface texture and coatings. The research observed that surfacefinish and surface texture could reduce frictional losses, but that engine oilformulation also plays a significant role (Gangopadhyay, Soltis et al. 2004).
An extremely novel approach to reducing piston assembly friction by theNissan motor company was published in 2005. The bores of the cylinder block areusually machined prior to assembly with the cylinder head. However, this results inbore distortion when the cylinder block is assembled with the cylinder head due tothe load applied by the head bolts and the surface pressure of the head gasket. Thisbore distortion influences the effectiveness of the seal between the piston assemblyand cylinder liner walls, requiring an increase in bore thickness and addition ofmanufacturing ribs to obtain greater cylinder block rigidity which leads to anincrease in weight. A novel manufacturing process was used to machine the boreswhen fitted with a dummy cylinder head ensuring bore circularity with weightsavings, the latter inherently forcing greater vehicle economy. The greater boreconformity allows the piston ring index (total ring tangential load / bore diameter) tobe reduced by 50%. This has the knock-on effect of reducing friction byapproximately 6.6%, resulting in a fuel economy improvement of 1.3% (Matsuo,
Kiga et al. 2005).
At a seminar of the European Parliament which took place early in 2006, anumber of innovations that could help bring down emissions were discussed (BBC
News and Mulvey 2006). Among them were:
• Better streamlining - including dashboard displays to take the place of
wing mirrors.
• lights on the dashboard to indicate the best moment to change gear.
• making cars lighter, for example by modifying the seat structures.
Changes to engines could include:
• A device to stop the engine when the car comes to halt and start it againwith a press on the accelerator.
• More hybrid cars, which run partly on electricity.
• Further moves towards efficient diesel engines.
• reducing the top speed of cars, to bring it nearer to the maximum speedthey are likely to be driven at on European roads.
28
1.8. Overall Strategy of the Project
This thesis describes a seminal piece of research which bridges the gapbetween chemistry, surface science, materials science, engineering and tribology asit is believed that this multidisciplined approach is essential when tackling vastlycomplex problems such as furthering the fuel economy of the gasoline engine. Inconcert with an appreciation of all sciences underpinning the operation of thegasoline engine, logic, creativity and innovation were employed to both create and
achieve the key objectives outlined below.
• Experimentally assess fuel dilution in the piston assembly lubricationsystem of a firing gasoline engine operating under varying engine
conditions.
• Quantitatively investigate the mechanism through which gasolinefriction modifier can be administered to the piston assembly lubricationsystem of a firing gasoline engine.
• Develop a bench-top test to screen the performance of environmentallyfriendly friction modifiers under in-cylinder boundary lubricationconditions, generating information about the capability of gasolineadministered CHON friction modifiers to reduce piston assemblyfriction and aiding the development of bespoke formulations for further
investigation.
• Investigate the mechanism of friction reduction brought about by theuse of CHON friction modifiers through application of a number of
sophisticated surface analysis techniques.
• To develop refined technologies to assess the ability and mechanism ofaction of gasoline containing friction modifier to reduce piston
assembly friction in a firing gasoline engine.
Due to the seminal nature of this project, each of the above objectives were
considered as guidelines for investigation and were expanded upon during the
natural evolution of the research.
1.9. Summary
In this chapter, discussion identified the need for improvement in the fueleconomy of the motor vehicle, whose popularity and dependence on hydrocarbonfuels causes damage to the world we live in. An overview of the process through
which legislation is created to govern the development of the motor vehicle its fuels
29
and lubricants is given. Attention focussed on the mechanical losses associated withthe operation of the gasoline engine, detailing the evolution of the fuel efficientlubricant and its constituent additive components. Problems with current additiveswhich make possible current fuel economy savings and have a massive dominance inthe marketplace were discussed, and the need for their replacement identified.Organic replacements for the metal based additive MoDTC responsible for frictionreduction in most fully formulated lubricants were reviewed.
The gasoline powered vehicle and gasoline additive technology over the last 30
years was discussed detailing the dominance of detergent systems to maintain engineefficiency. Research was reviewed presenting the interaction of gasoline fuel andengine lubricant in the combustion chamber leading to the proposition of this thesiswhich investigates in-cylinder fuel and lubricant effects to reduce gasoline engine
friction.
30
2. In-Cylinder Lubricant Sampling
In Chapter 1 it was stated that fuel entering the engine lubricant can have asignificant effect on the operational behaviour of the piston assembly. It is this fueldilution in the cylinder liner lubricant that forms the foundation to the hypothesis
suggesting friction modifier can be administered to the piston assembly/cylinder
liner interface via the fuel.
A series of engine tests was developed to further investigate the lubricationenvironment of the piston assembly. This portfolio designed as a set of 'scoutingtests', whose purpose was to broadly investigate piston assembly lubricationconditions with varying engine condition. Specific tests were designed to investigateboth the lubricant which acts directly at the Top Ring Zone (TRZ), as well as thelubricant down the cylinder liner wall. Of specific interest were the levels of fuel
dilution found in lubricant extracted from these locations and the potential additiveconcentrations which may accumulate in these areas, achieved through doping theengine fuel with an appropriate marker.
2.1. The Ricardo Hydra Gasoline Engine
A Ricardo Hydra gasoline engine housed at the Institute of Tribology EngineTribology Research Laboratory, The University of Leeds, was used in this research,Figure 2-1. The engine is manufactured by Ricardo Consulting Engineers Ltd in theUK, and is available in a variety of configurations. The chosen engine has a singlecylinder naturally aspirated configuration, with 2 valves per cylinder and indirectgasoline injection. The bore/stroke arrangement of the engine is 86 x 86 (bore(mm)x stroke(mm)), based directly on a General Motors 2.0 Litre, 4 cylinder productionengine which was first available on the market in 1988. There are several featureswhich made the Hydra engine ideal for this research:
• The engine has a separate control module in place of the typical EngineControl Unit (ECU), with individual control of engine speed, ignitiontiming and fuel injection, thus permitting the simulation of numerousengine conditions with ease.
• The engine incorporates a split sump design which separates the
lubrication of the valve train and crankcase. This is consideredadvantageous as it allows the two systems to decoupled.
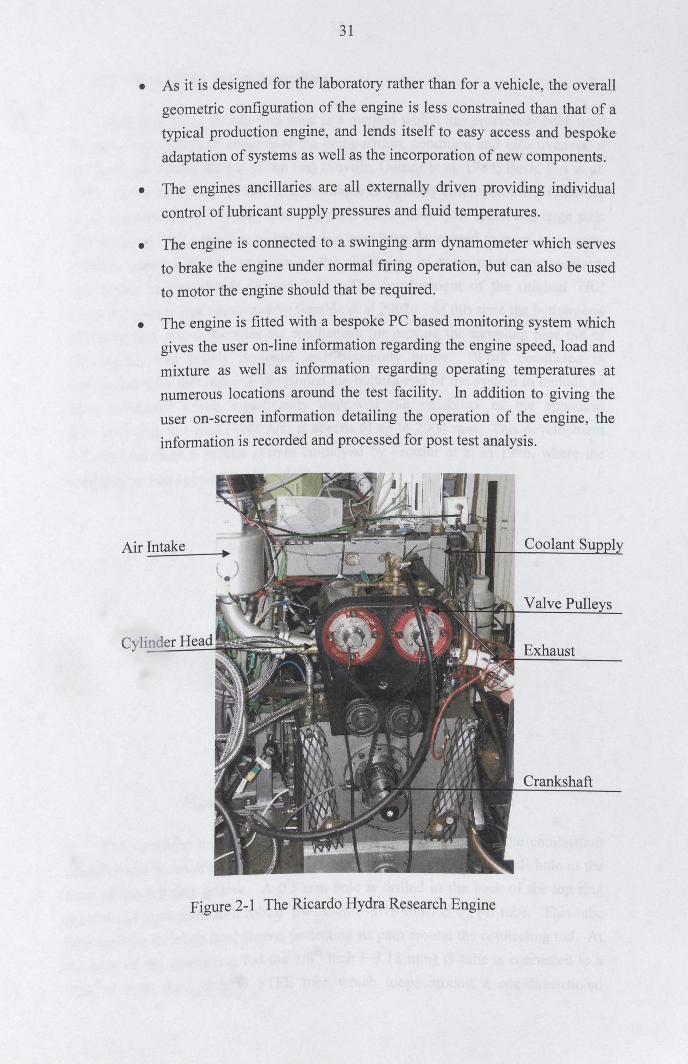
31
• As it is designed for the laboratory rather than for a vehicle, the overallgeometric configuration of the engine is less constrained than that of atypical production engine, and lends itself to easy access and bespokeadaptation of systems as well as the incorporation of new components.
• The engines ancillaries are all externally driven providing individualcontrol of lubricant supply pressures and fluid temperatures.
• The engine is connected to a swinging arm dynamometer which servesto brake the engine under normal firing operation, but can also be usedto motor the engine should that be required.
• The engine is fitted with a bespoke PC based monitoring system whichgives the user on-line information regarding the engine speed, load andmixture as well as information regarding operating temperatures atnumerous locations around the test facility. In addition to giving theuser on-screen information detailing the operation of the engine, theinformation is recorded and processed for post test analysis.
Air Intake
Crankshaft
Cylinder Head
Figure 2-1 The Ricardo Hydra Research Engine
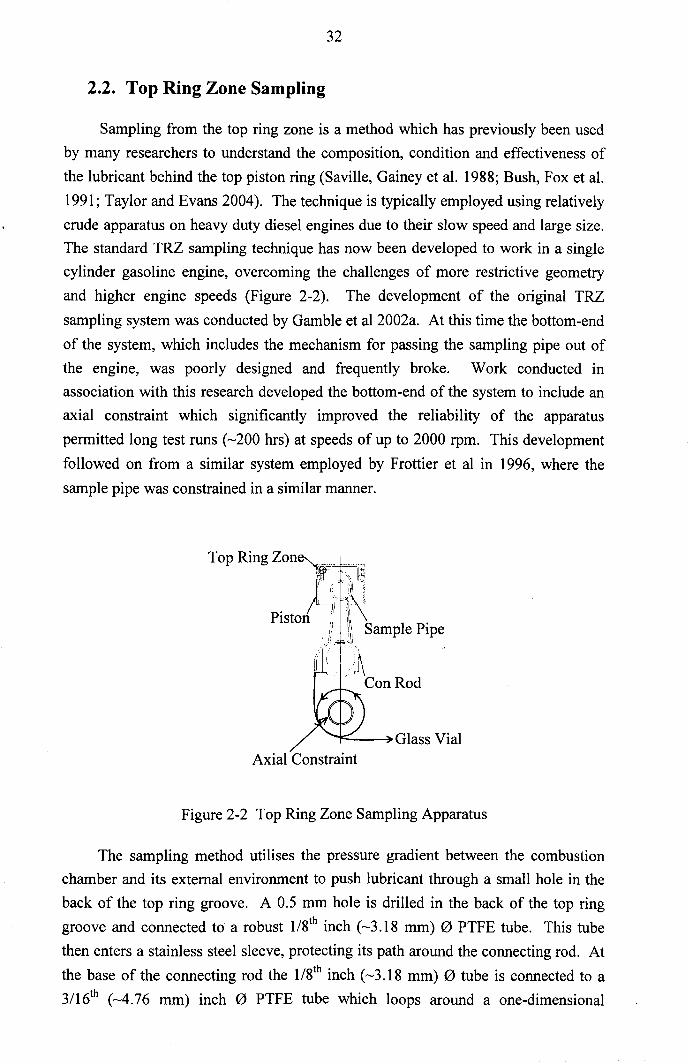
32
2.2. Top Ring Zone Sampling
Sampling from the top ring zone is a method which has previously been usedby many researchers to understand the composition, condition and effectiveness ofthe lubricant behind the top piston ring (Saville, Gainey et al. 1988; Bush, Fox et al.
1991; Taylor and Evans 2004). The technique is typically employed using relativelycrude apparatus on heavy duty diesel engines due to their slow speed and large size.The standard TRZ sampling technique has now been developed to work in a singlecylinder gasoline engine, overcoming the challenges of more restrictive geometryand higher engine speeds (Figure 2-2). The development of the original TRZ
sampling system was conducted by Gamble et al 2002a. At this time the bottom-end
of the system, which includes the mechanism for passing the sampling pipe out ofthe engine, was poorly designed and frequently broke. Work conducted inassociation with this research developed the bottom-end of the system to include anaxial constraint which significantly improved the reliability of the apparatuspermitted long test runs (~200 hrs) at speeds of up to 2000 rpm. This development
followed on from a similar system employed by Frottier et al in 1996, where the
sample pipe was constrained in a similar manner.
Axial Constraint
Figure 2-2 Top Ring Zone Sampling Apparatus
The sampling method utilises the pressure gradient between the combustionchamber and its external environment to push lubricant through a small hole in theback of the top ring groove. A 0.5 mm hole is drilled in the back of the top ringgroove and connected to a robust 1/8th inch (~3.l8 mm) (0 PTFE tube. This tube
then enters a stainless steel sleeve, protecting its path around the connecting rod. At
the base of the connecting rod the 1/8th inch (~3.18 mm) (0 tube is connected to a3116th (~4.76 mm) inch (0 PTFE tube which loops around a one-dimensional
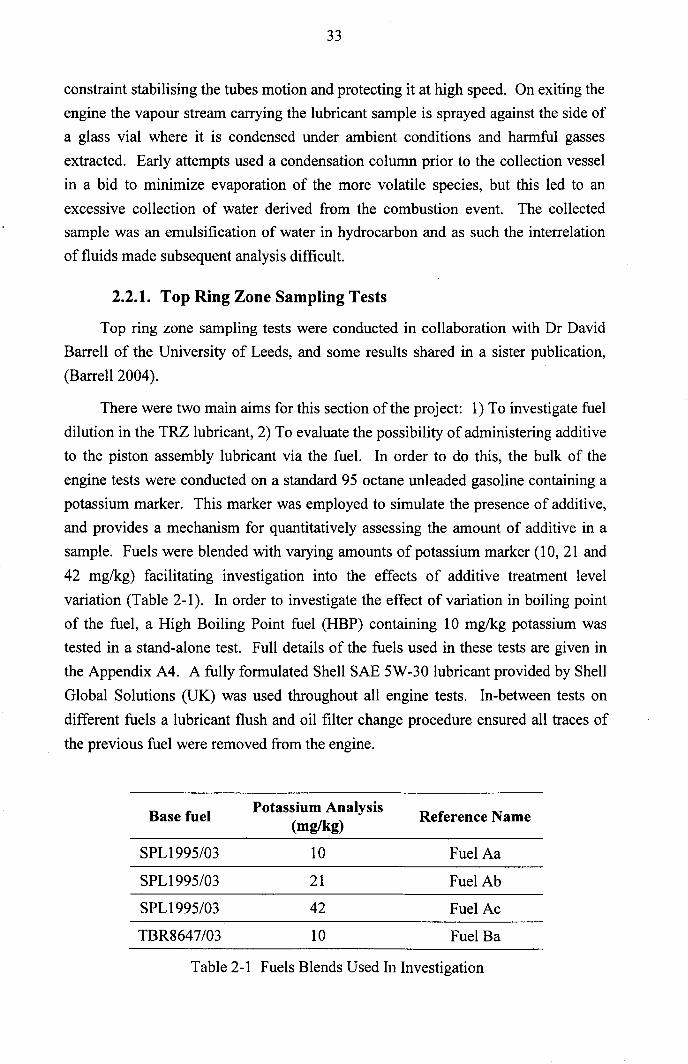
33
constraint stabilising the tubes motion and protecting it at high speed. On exiting theengine the vapour stream carrying the lubricant sample is sprayed against the side ofa glass vial where it is condensed under ambient conditions and harmful gassesextracted. Early attempts used a condensation column prior to the collection vesselin a bid to minimize evaporation of the more volatile species, but this led to anexcessive collection of water derived from the combustion event. The collectedsample was an emulsification of water in hydrocarbon and as such the interrelation
of fluids made subsequent analysis difficult.
2.2.1. Top Ring Zone Sampling Tests
Top ring zone sampling tests were conducted in collaboration with Dr DavidBarrell of the University of Leeds, and some results shared in a sister publication,
(Barrell 2004).
There were two main aims for this section of the project: 1) To investigate fueldilution in the TRZ lubricant, 2) To evaluate the possibility of administering additiveto the piston assembly lubricant via the fuel. In order to do this, the bulk of the
engine tests were conducted on a standard 95 octane unleaded gasoline containing apotassium marker. This marker was employed to simulate the presence of additive,and provides a mechanism for quantitatively assessing the amount of additive in asample. Fuels were blended with varying amounts of potassium marker (10,21 and
42 mg/kg) facilitating investigation into the effects of additive treatment levelvariation (Table 2-1). In order to investigate the effect of variation in boiling pointof the fuel, a High Boiling Point fuel (HBP) containing 10 mg/kg potassium wastested in a stand-alone test. Full details of the fuels used in these tests are given inthe Appendix A4. A fully formulated Shell SAE 5W-30 lubricant provided by ShellGlobal Solutions (UK) was used throughout all engine tests. In-between tests on
different fuels a lubricant flush and oil filter change procedure ensured all traces of
the previous fuel were removed from the engine.
Base fuel Potassium Analysis Reference Name(mg/kg)
SPLI995/03 10 Fuel Aa
SPLI995/03 21 Fuel Ab
SPLI995/03 42 Fuel Ac
TBR8647/03 10 Fuel Ba
Table 2-1 Fuels Blends Used In Investigation
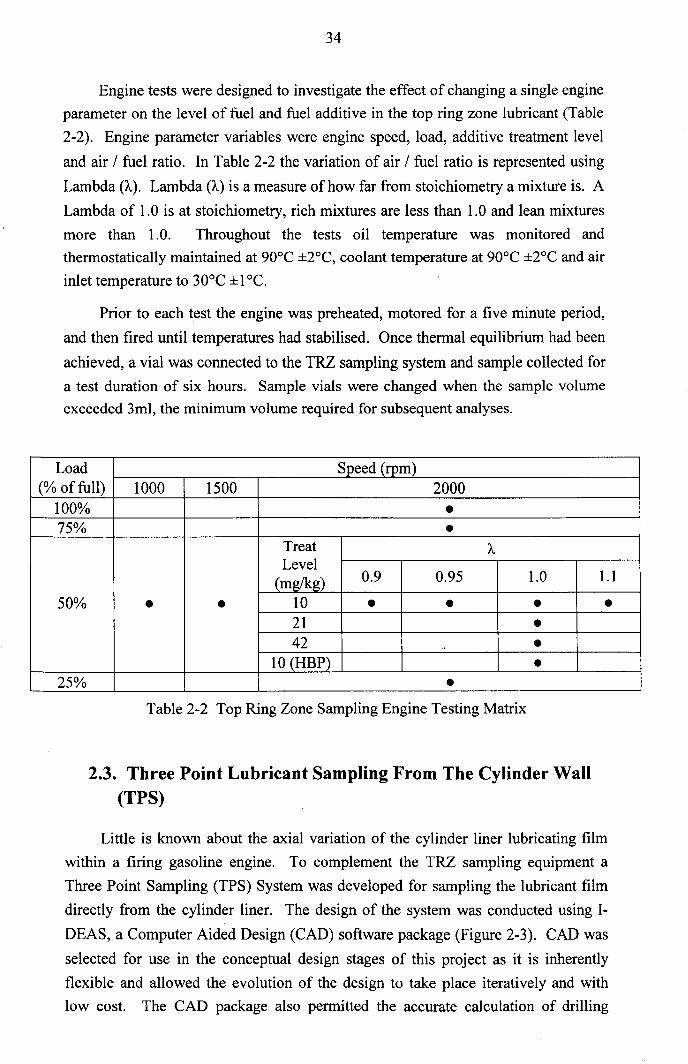
34
Engine tests were designed to investigate the effect of changing a single engineparameter on the level of fuel and fuel additive in the top ring zone lubricant (Table2-2). Engine parameter variables were engine speed, load, additive treatment level
and air / fuel ratio. In Table 2-2 the variation of air / fuel ratio is represented using
Lambda (A). Lambda (A) is a measure of how far from stoichiometry a mixture is. A
Lambda of 1.0 is at stoichiometry, rich mixtures are less than 1.0 and lean mixturesmore than 1.0. Throughout the tests oil temperature was monitored andthermostatically maintained at 90°C ±2°C, coolant temperature at 90°C ±2°C and airinlet temperature to 30°C ± 1"C.
Prior to each test the engine was preheated, motored for a five minute period,
and then fired until temperatures had stabilised. Once thermal equilibrium had been
achieved, a vial was connected to the TRZ sampling system and sample collected fora test duration of six hours. Sample vials were changed when the sample volumeexceeded 3ml, the minimum volume required for subsequent analyses.
Load Speed (rpm)(% of full) 1000 1500 2000
100% •75% •
Treat ALevel
(mg/kg) 0.9 0.95 1.0 1.1
50% • • 10 • • • •21 •42 .' •
10 (HBP) •25% •
Table 2-2 Top Ring Zone Sampling Engine Testing Matrix
2.3. Three Point Lubricant Sampling From The Cylinder Wall(TPS)
Little is known about the axial variation of the cylinder liner lubricating filmwithin a firing gasoline engine. To complement the TRZ sampling equipment aThree Point Sampling (TPS) System was developed for sampling the lubricant filmdirectly from the cylinder liner. The design of the system was conducted using I-
DEAS, a Computer Aided Design (CAD) software package (Figure 2-3). CAD was
selected for use in the conceptual design stages of this project as it is inherentlyflexible and allowed the evolution of the design to take place iteratively and withlow cost. The CAD package also permitted the accurate calculation of drilling
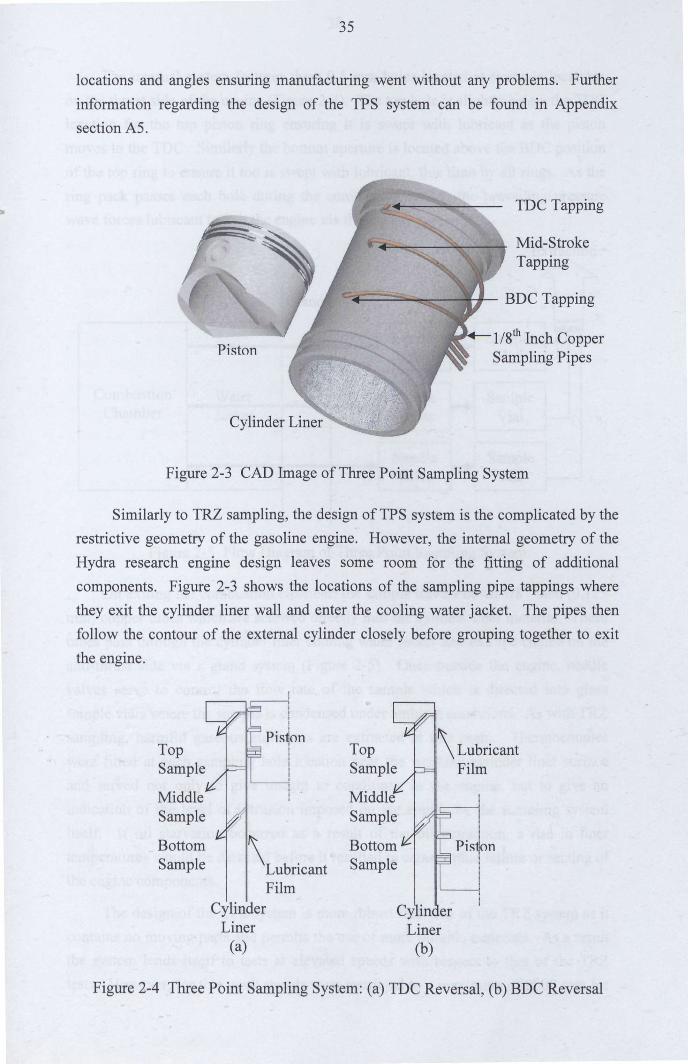
35
locations and angles ensuring manufacturing went without any problems. Furtherinformation regarding the design of the TPS system can be found in Appendix
section A5.
TDC Tapping
~""'=-:---__::"k----.:-t- Mid -StrokeTapping
l/Sth Inch CopperSampling Pipes
Figure 2-3 CAD Image of Three Point Sampling System
Similarly to TRZ sampling, the design ofTPS system is the complicated by therestrictive geometry of the gasoline engine. However, the internal geometry of theHydra research engine design leaves some room for the fitting of additionalcomponents. Figure 2-3 shows the locations of the sampling pipe tappings wherethey exit the cylinder liner wall and enter the cooling water jacket. The pipes thenfollow the contour of the external cylinder closely before grouping together to exitthe engine.
TopSample
MiddleSample
BottomSample \Lubricant
FilmCylinderLinerCa)
BottomSample
Cb)Figure 2-4 Three Point Sampling System: (a) TDC Reversal, (b) BDC Reversal
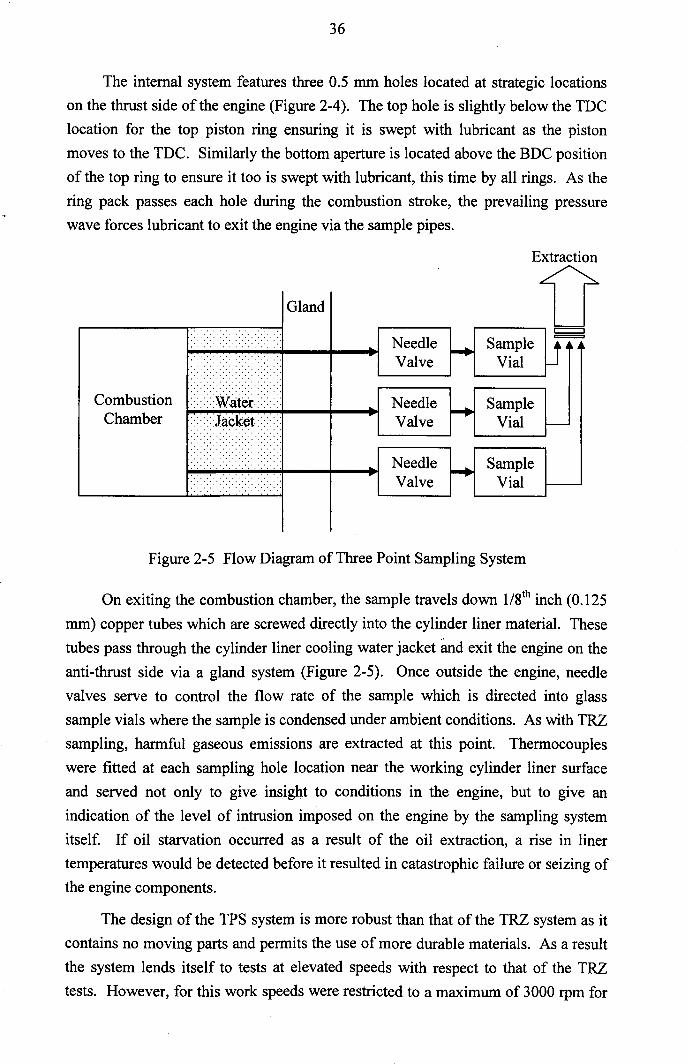
36
The internal system features three 0.5 mm holes located at strategic locationson the thrust side of the engine (Figure 2-4). The top hole is slightly below the TDClocation for the top piston ring ensuring it is swept with lubricant as the pistonmoves to the TDC. Similarly the bottom aperture is located above the BDC positionof the top ring to ensure it too is swept with lubricant, this time by all rings. As thering pack passes each hole during the combustion stroke, the prevailing pressurewave forces lubricant to exit the engine via the sample pipes.
Extraction
Gland DI====:J
Needle Sample =~ lJValve Vial
Needle~
SampleValve Vial t--
Needle~
SampleValve Vial r--
CombustionChamber
::::::::Watet::::::::::Jacket:::
Figure 2-5 Flow Diagram of Three Point Sampling System
On exiting the combustion chamber, the sample travels down 1/8th inch (0.125
mm) copper tubes which are screwed directly into the cylinder liner material. Thesetubes pass through the cylinder liner cooling water jacket and exit the engine on theanti-thrust side via a gland system (Figure 2-5). Once outside the engine, needle
valves serve to control the flow rate of the sample which is directed into glasssample vials where the sample is condensed under ambient conditions. As with TRZsampling, harmful gaseous emissions are extracted at this point. Thermocoupleswere fitted at each sampling hole location near the working cylinder liner surface
and served not only to give insight to conditions in the engine, but to give anindication of the level of intrusion imposed on the engine by the sampling system
itself. If oil starvation occurred as a result of the oil extraction, a rise in linertemperatures would be detected before it resulted in catastrophic failure or seizing ofthe engine components.
The design of the TPS system is more robust than that of the TRZ system as it
contains no moving parts and permits the use of more durable materials. As a resultthe system lends itself to tests at elevated speeds with respect to that of the TRZtests. However, for this work speeds were restricted to a maximum of 3000 rpm for
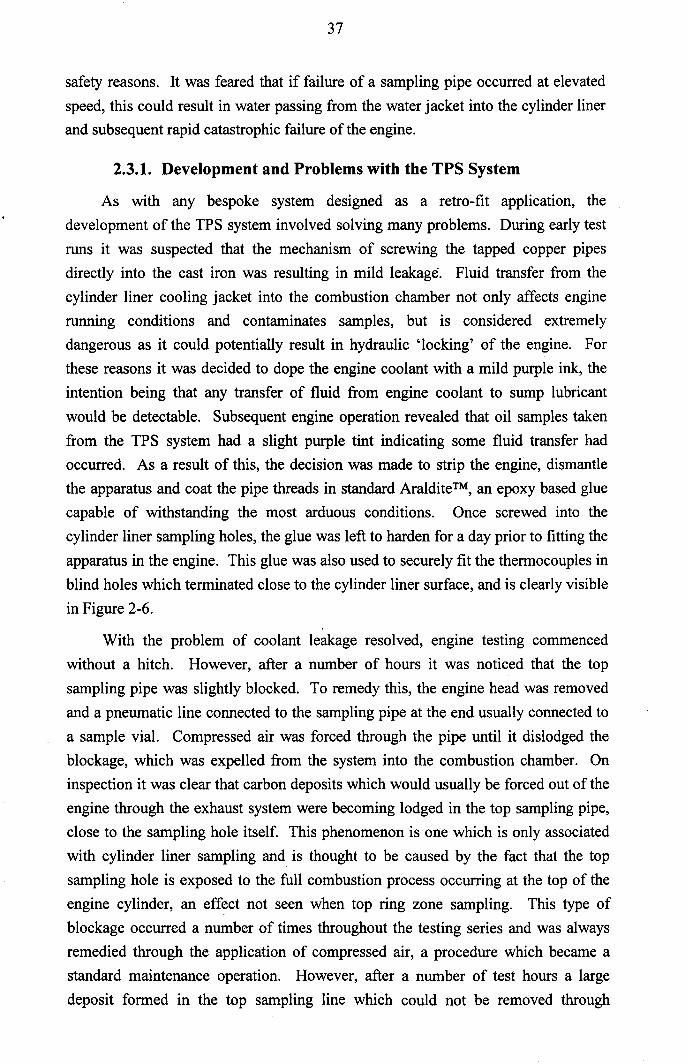
37
safety reasons. It was feared that if failure of a sampling pipe occurred at elevatedspeed, this could result in water passing from the water jacket into the cylinder linerand subsequent rapid catastrophic failure of the engine.
2.3.1. Development and Problems with the TPS System
As with any bespoke system designed as a retro-fit application, thedevelopment of the TPS system involved solving many problems. During early testruns it was suspected that the mechanism of screwing the tapped copper pipesdirectly into the cast iron was resulting in mild leakage. Fluid transfer from the
cylinder liner cooling jacket into the combustion chamber not only affects enginerunning conditions and contaminates samples, but is considered extremelydangerous as it could potentially result in hydraulic 'locking' of the engine. Forthese reasons it was decided to dope the engine coolant with a mild purple ink, theintention being that any transfer of fluid from engine coolant to sump lubricant
would be detectable. Subsequent engine operation revealed that oil samples takenfrom the TPS system had a slight purple tint indicating some fluid transfer hadoccurred. As a result of this, the decision was made to strip the engine, dismantlethe apparatus and coat the pipe threads in standard Araldite™, an epoxy based gluecapable of withstanding the most arduous conditions. Once screwed into thecylinder liner sampling holes, the glue was left to harden for a day prior to fitting the
apparatus in the engine. This glue was also used to securely fit the thermocouples inblind holes which terminated close to the cylinder liner surface, and is clearly visible
in Figure 2-6.
With the problem of coolant leakage resolved, engine testing commencedwithout a hitch. However, after a number of hours it was noticed that the top
sampling pipe was slightly blocked. To remedy this, the engine head was removedand a pneumatic line connected to the sampling pipe at the end usually connected to
a sample vial. Compressed air was forced through the pipe until it dislodged theblockage, which was expelled from the system into the combustion chamber. Oninspection it was clear that carbon deposits which would usually be forced out of theengine through the exhaust system were becoming lodged in the top sampling pipe,close to the sampling hole itself. This phenomenon is one which is only associatedwith cylinder liner sampling and is thought to be caused by the fact that the topsampling hole is exposed to the full combustion process occurring at the top of theengine cylinder, an effect not seen when top ring zone sampling. This type ofblockage occurred a number of times throughout the testing series and was alwaysremedied through the application of compressed air, a procedure which became astandard maintenance operation. However, after a number of test hours a large
deposit formed in the top sampling line which could not be removed through
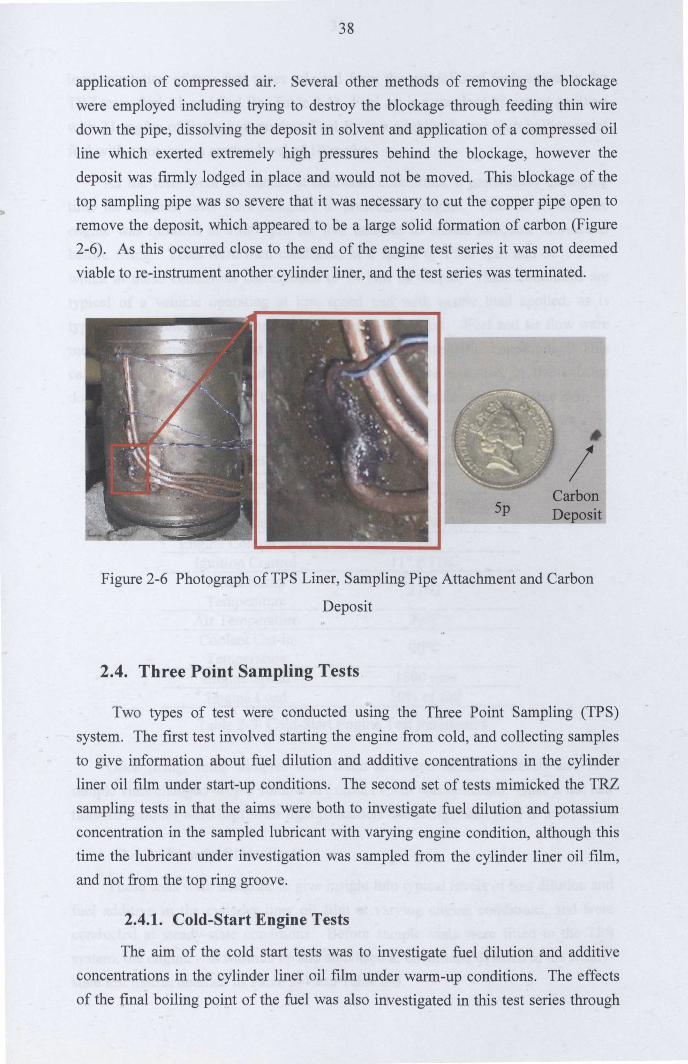
38
application of compressed air. Several other methods of removing the blockagewere employed including trying to destroy the blockage through feeding thin wiredown the pipe, dissolving the deposit in solvent and application of a compressed oilline which exerted extremely high pressures behind the blockage, however thedeposit was firmly lodged in place and would not be moved. This blockage of thetop sampling pipe was so severe that it was necessary to cut the copper pipe open toremove the deposit, which appeared to be a large solid formation of carbon (Figure2-6). As this occurred close to the end of the engine test series it was not deemedviable to re-instrument another cylinder liner, and the test series was terminated .
•I5p Deposit
Carbon
Figure 2-6 Photograph of TPS Liner, Sampling Pipe Attachment and Carbon
Deposit
2.4. Three Point Sampling Tests
Two types of test were conducted using the Three Point Sampling (TPS)system. The first test involved starting the engine from cold, and collecting samples
to give information about fuel dilution and additive concentrations in the cylinderliner oil film under start-up conditions. The second set of tests mimicked the TRZ
sampling tests in that the aims were both to investigate fuel dilution and potassiumconcentration in the sampled lubricant with varying engine condition, although thistime the lubricant under investigation was sampled from the cylinder liner oil film,and not from the top ring groove.
2.4.1. Cold-Start Engine Tests
The aim of the cold start tests was to investigate fuel dilution and additiveconcentrations in the cylinder liner oil film under warm-up conditions. The effects
of the final boiling point of the fuel was also investigated in this test series through
39
implementation of two fuel types selected from the portfolio of fuels tested in theTRZ tests, fuel Ab and fuel Ba (Table 2-1). Fuel Ab is a standard 95 octane gasolinewith 21 mg/kg of Potassium marker, Fuel Ba is a slightly denser high boiling pointfuel with a potassium marker level of 10 mg/kg.
As the tests were conducted at cold-start conditions, a particularly damagingtime for engines, tests were designed to protect the engine. Prior to testing, theengine was motored at 1500 rpm for five minutes to ensure adequate lubricationbefore firing. Tests were then conducted at a speed of. 1500 rpm and 50% load,which at these conditions corresponds to 14 Nm of torque. These conditions aretypical of a vehicle operating at low speed and with gentle load applied, as istypically recommended for engines in the warm-up period. Fuel and air flow weremeasured independently and adjusted to run stoichiometric conditions. Thiscalculation was further validated by a lambda sensor mounted in the exhaustdownpipe. Further details on the engine test conditions are detailed in Table 2-3.
Parameter ConditionTest Duration 4 Hrs
Fuel Standard (Ab) or HBP (Ba)Lubricant Shell5W-30
Engine Compression 9:1Ignition ControlInitial SumpTemperature
Air TemperatureCoolant Cut-inTemperatureEngine Speed 1500 rpmEngine Load 50% of full
Table 2-3 Cold-Start Engine Test Parameters
Once firing, sump samples were taken at fifteen minute intervals and TPS
sample vials changed once a volume in excess of 3ml was collected. Once a test hadfinished samples were kept in air tight containers and refrigerated prior to analyses.
2.4.2. Steady-State Tests
These tests were designed to give insight into typical levels of fuel dilution andfuel additive in the cylinder liner oil film at varying engine conditions, and wereconducted at steady-state conditions. Before sample vials were fitted to the TPSsystem, the engine was warmed up and stabilised at conditions detailed in the steady-state test matrix detailed in Table 2-4 and Table 2-5.
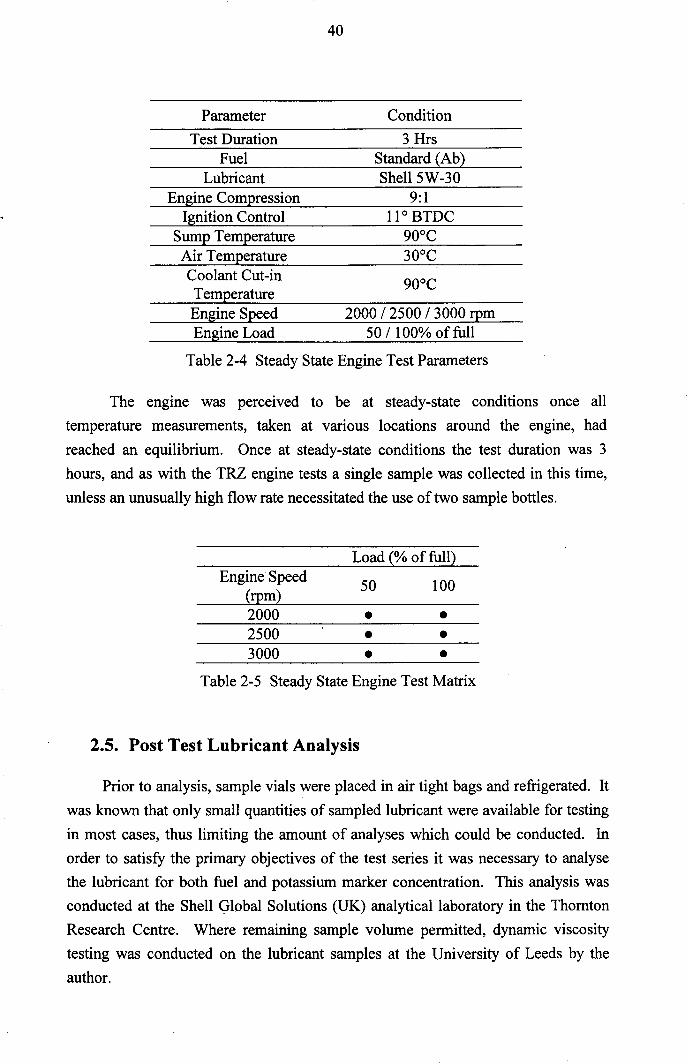
40
Parameter ConditionTest Duration 3 Hrs
Fuel Standard (Ab)Lubricant Shell5W-30
Engine Compression 9:1Ignition Control
Sump TemperatureAir TemperatureCoolant Cut-inTemperatureEngine Speed 2000 / 2500 / 3000 rpmEngine Load 50 / 100% of full
Table 2-4 Steady State Engine Test Parameters
The engine was perceived to be at steady-state conditions once all
temperature measurements, taken at various locations around the engine, hadreached an equilibrium. Once at steady-state conditions the test duration was 3hours, and as with the TRZ engine tests a single sample was collected in this time,
unless an unusually high flow rate necessitated the use of two sample bottles.
Load (% of full)Engine Speed 50 100(rpm)
2000 • •2500 • •3000 • •
Table 2-5 Steady State Engine Test Matrix
2.5. Post Test Lubricant Analysis
Prior to analysis, sample vials were placed in air tight bags and refrigerated. It
was known that only small quantities of sampled lubricant were available for testingin most cases, thus limiting the amount of analyses which could be conducted. Inorder to satisfy the primary objectives of the test series it was necessary to analysethe lubricant for both fuel and potassium marker concentration. This analysis wasconducted at the Shell Global Solutions (UK) analytical laboratory in the ThorntonResearch Centre. Where remaining sample volume permitted, dynamic viscositytesting was conducted on the lubricant samples at the University of Leeds by the
author.
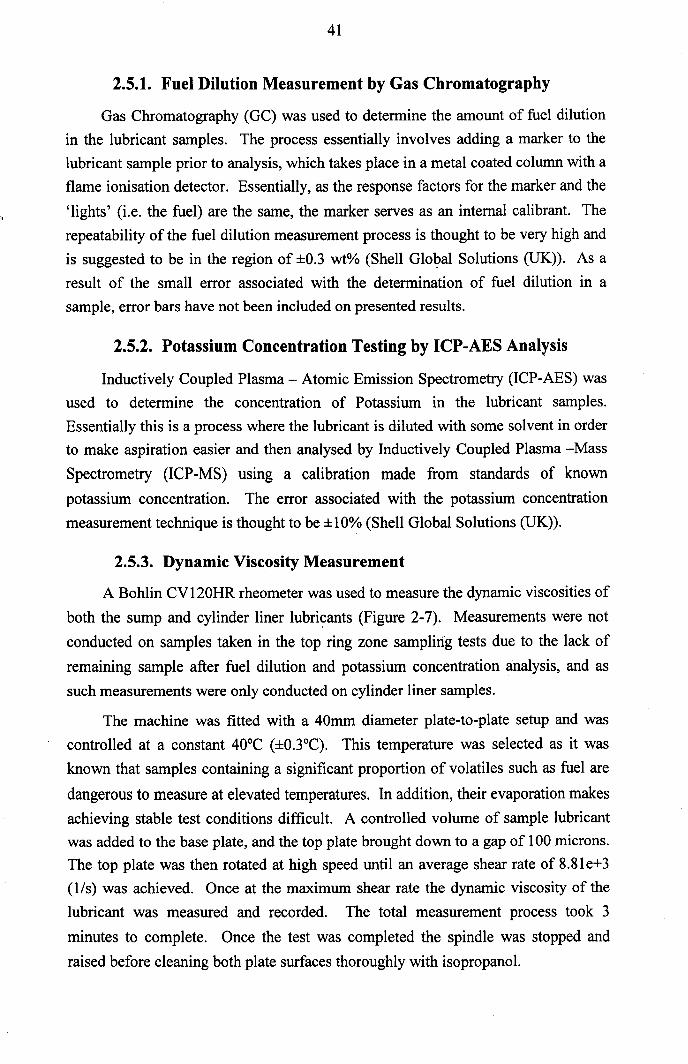
41
2.5.1. Fuel Dilution Measurement by Gas Chromatography
Gas Chromatography (GC) was used to determine the amount of fuel dilutionin the lubricant samples. The process essentially involves adding a marker to thelubricant sample prior to analysis, which takes place in a metal coated column with aflame ionisation detector. Essentially, as the response factors for the marker and the
'lights' (Le. the fuel) are the same, the marker serves as an internal calibrant. Therepeatability of the fuel dilution measurement process is thought to be very high andis suggested to be in the region of ±0.3 wt% (Shell Global Solutions (UK». As aresult of the small error associated with the determination of fuel dilution in asample, error bars have not been included on presented results.
2.5.2. Potassium Concentration Testing by ICP-AES Analysis
Inductively Coupled Plasma - Atomic Emission Spectrometry (ICP-AES) wasused to determine the concentration of Potassium in the lubricant samples.Essentially this is a process where the lubricant is diluted with some solvent in orderto make aspiration easier and then analysed by Inductively Coupled Plasma -Mass
Spectrometry (ICP-MS) using a calibration made from standards of known
potassium concentration. The error associated with the potassium concentrationmeasurement technique is thought to be ±10% (Shell Global Solutions (UK».
2.5.3. Dynamic Viscosity Measurement
A Bohlin CV120HR rheometer was used to measure the dynamic viscosities of
both the sump and cylinder liner lubricants (Figure 2-7). Measurements were not
conducted on samples taken in the top ring zone sampling tests due to the lack of
remaining sample after fuel dilution and potassium concentration analysis, and as
such measurements were only conducted on cylinder liner samples.
The machine was fitted with a 40mm diameter plate-to-plate setup and was
controlled at a constant 40°C (±O.3°C). This temperature was selected as it wasknown that samples containing a significant proportion of volatiles such as fuel are
dangerous to measure at elevated temperatures. In addition, their evaporation makesachieving stable test conditions difficult. A controlled volume of sample lubricantwas added to the base plate, and the top plate brought down to a gap of 100 microns.The top plate was then rotated at high speed until an average shear rate of 8.8le+3(l/s) was achieved. Once at the maximum shear rate the dynamic viscosity of the
lubricant was measured and recorded. The total measurement process took 3
minutes to complete. Once the test was completed the spindle was stopped and
raised before cleaning both plate surfaces thoroughly with isopropanol.
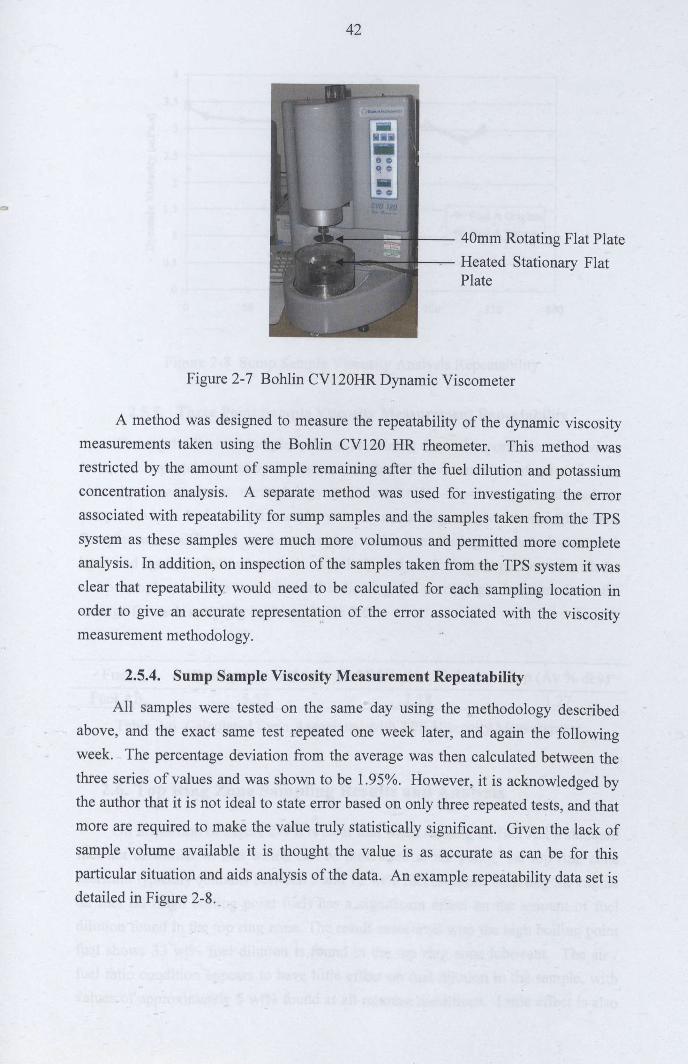
42
~::'!-I __ -- 40mm Rotating Flat Plate
Heated Stationary FlatPlate
Figure 2-7 Bohlin CV120HR Dynamic Viscometer
A method was designed to measure the repeatability of the dynamic viscositymeasurements taken using the Bohlin CV120 HR rheometer. This method wasrestricted by the amount of sample remaining after the fuel dilution and potassiumconcentration analysis. A separate method was used for investigating the errorassociated with repeatability for sump samples and the samples taken from the TPSsystem as these samples were much more volumous and permitted more completeanalysis. In addition, on inspection of the samples taken from the TPS system it was
clear that repeatability would need to be calculated for each sampling location inorder to give an accurate representat}on of the error associated with the viscositymeasurement methodology.
2.5.4. Sump Sample Viscosity Measurement Repeatability
All samples were tested on the same day using the methodology describedabove, and the exact same test repeated one week later, and again the followingweek. The percentage deviation from the average was then calculated between thethree series of values and was shown to be 1.95%. However, it is acknowledged bythe author that it is not ideal to state error based on only three repeated tests, and thatmore are required to make the value truly statistically significant. Given the lack ofsample volume available it is thought the value is as accurate as can be for thisparticular situation and aids analysis of the data. An example repeatability data set isdetailed in Figure 2-8 ..
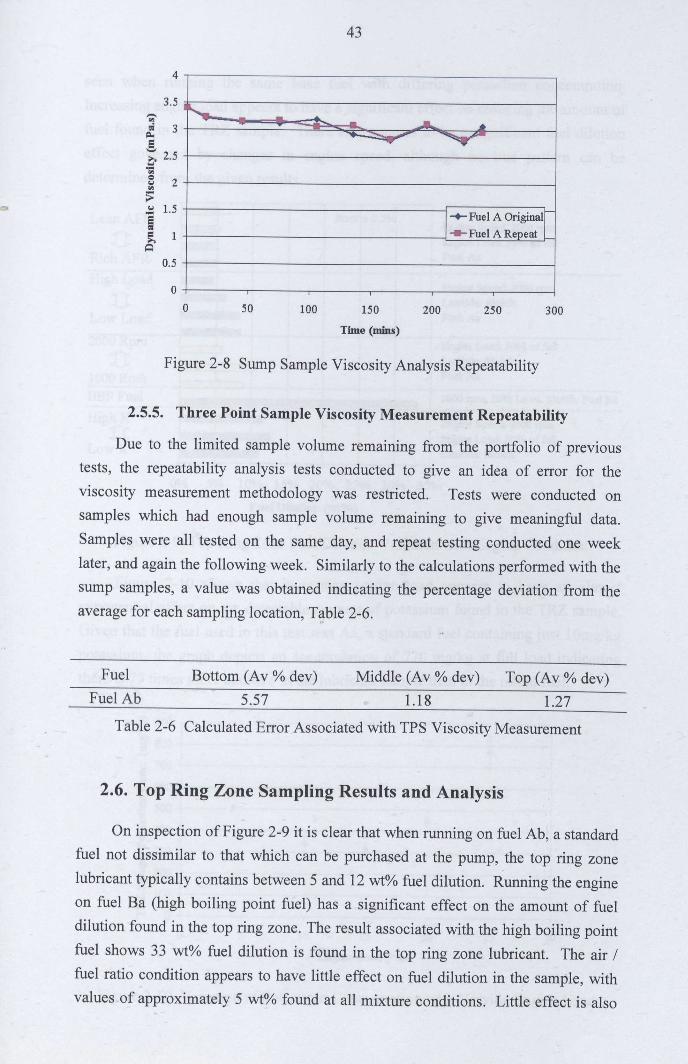
43
4
~ --- .... - .--.. •-- ~............
I-+- Fuel A Origina1[-II- Fuel A Repeat
3.5
0.5
oo 50 100 150
Time (mins)
200 250 300
Figure 2-8 Sump Sample Viscosity Analysis Repeatability
2.5.5. Three Point Sample Viscosity Measurement Repeatability
Due to the limited sample volume remaining from the portfolio of previoustests, the repeatability analysis tests conducted to give an idea of error for theviscosity measurement methodology was restricted. Tests were conducted onsamples which had enough sample volume remaining to give meaningful data.
Samples were all tested on the same day, and repeat testing conducted one weeklater, and again the following week. Similarly to the calculations performed with thesump samples, a value was obtained indicating the percentage deviation from theaverage for each sampling location, Table 2-6.
Fuel Bottom (Av % dev) Middle (Av % dev) Top (Av % dev)Fuel Ab 5.57 1.18 1.27
Table 2-6 Calculated Error Associated with TPS Viscosity Measurement
2.6. Top Ring Zone Sampling Results and Analysis
On inspection of Figure 2-9 it is clear that when running on fuel Ab, a standardfuel not dissimilar to that which can be purchased at the pump, the top ring zone
lubricant typically contains between 5 and 12 wt% fuel dilution. Running the engineon fuel Ba (high boiling point fuel) has a significant effect on the amount of fuel
dilution found in the top ring zone. The result associated with the high boiling pointfuel shows 33 wt% fuel dilution is found in the top ring zone lubricant. The air Ifuel ratio condition appears to have little effect on fuel dilution in the sample, withvalues of approximately 5 wt% found at all mixture conditions. Little effect is also
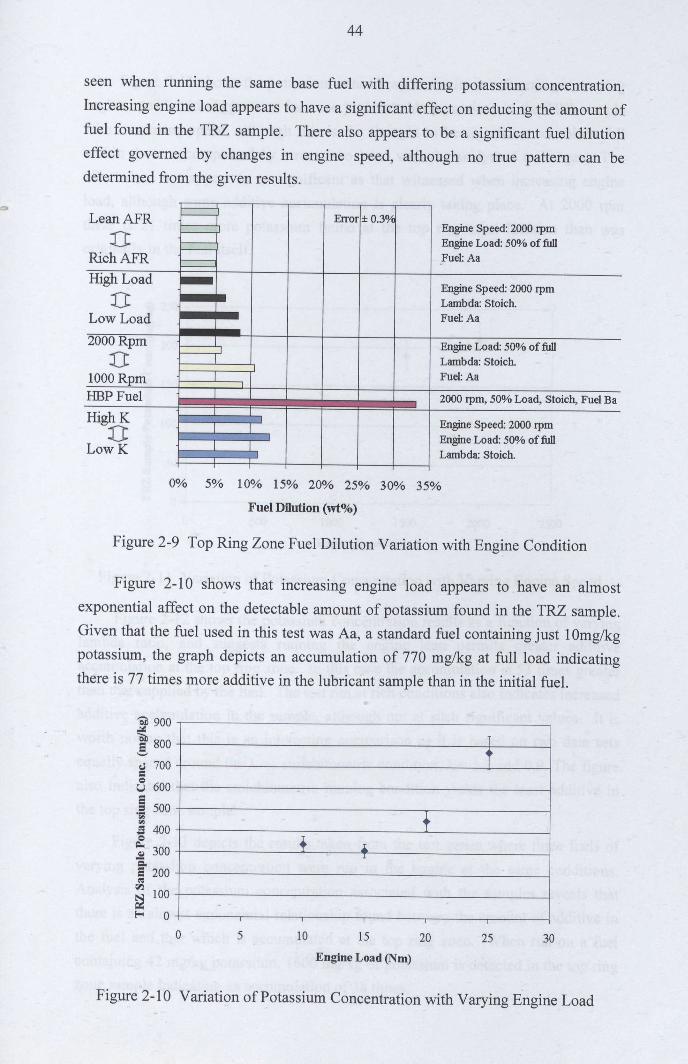
44
seen when running the same base fuel with differing potassium concentration.Increasing engine load appears to have a significant effect on reducing the amount offuel found in the TRZ sample. There also appears to be a significant fuel dilutioneffect governed by changes in engine speed, although no true pattern can bedetermined from the given results.
t-----
LeanAFR I-----; Error ±0.3%f---- Engine Speed: 2000 rpm
D r-- Engine Load: 50% offullRichAFR
j-------Fuel: Aa
High Load - Engine Speed: 2000 rpmD Lambda: Stoich.
Low Load Fuel: Aa
2000Rpm Engine Load: 50% of full
D Lambda: Stoich.1000 Rpm Fuel: Aa
HBP Fuel I 2000 rpm, 50% Load, Stoich, Fuel Ba
HighK Engine Speed: 2000 rpmI IDI Engine Load: 50% offull
LowK Lambda: Stoich.
0% 5% 10% 15% 20% 25% 30% 35%
Fuel Dilution (wt%)
Figure 2-9 Top Ring Zone Fuel Dilution Variation with Engine Condition
Figure 2-10 shows that increasing engine load appears to have an almostexponential affect on the detectable amount of potassium found in the TRZ sample ..Given that the fuel used in this test was Aa, a standard fuel containing just 10mg/kgpotassium, the graph depicts an accumulation of 770 mg/kg at full load indicatingthere is 77 times more additive in the lubricant sample than in the initial fuel.
'6ll 900..::.:~ 800'-'
Tr
t, _."
.-
cJ 700=8 600S.~ 500.,~ 400~..S! 300
S' 200~rJ'l 100~f-o 0
o 5 10 15
Engine Load (Nm)
20 25 30
Figure 2-10 Variation of Potassium Concentration with Varying Engine Load
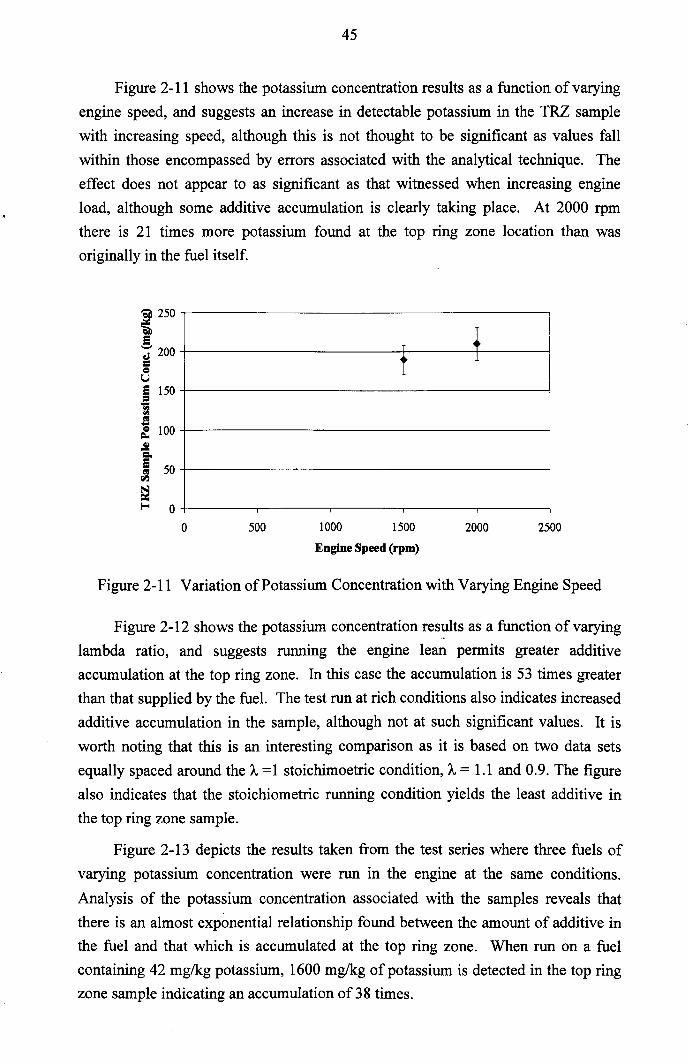
45
Figure 2-11 shows the potassium concentration results as a function of varyingengine speed, and suggests an increase in detectable potassium in the TRZ sample
with increasing speed, although this is not thought to be significant as values fallwithin those encompassed by errors associated with the analytical technique. Theeffect does not appear to as significant as that witnessed when increasing engineload, although some additive accumulation is clearly taking place. At 2000 rpmthere is 21 times more potassium found at the top ring zone location than wasoriginally in the fuel itself.
~ 250~ •e T'-'200~ t 10U
§ 150';:J
'"~ 100.!!=-e 50~~~~ 0
0 500 1000 1500 2000 2500Engine Speed (rpm)
Figure 2-11 Variation of Potassium Concentration with Varying Engine Speed
Figure 2-12 shows the potassium concentration results as a function of varyinglambda ratio, and suggests running the engine lean permits greater additiveaccumulation at the top ring zone. In this case the accumulation is 53 times greaterthan that supplied by the fuel. The test run at rich conditions also indicates increasedadditive accumulation in the sample, although not at such significant values. It is
worth noting that this is an interesting comparison as it is based on two data setsequally spaced around the A =1 stoichimoetric condition, A = 1.1 and 0.9. The figure
also indicates that the stoichiometric running condition yields the least additive inthe top ring zone sample.
Figure 2-13 depicts the results taken from the test series where three fuels of
varying potassium concentration were run in the engine at the same conditions.
Analysis of the potassium concentration associated with the samples reveals thatthere is an almost exponential relationship found between the amount of additive inthe fuel and that which is accumulated at the top ring zone. When run on a fuelcontaining 42 mg/kg potassium, 1600 mg/kg of potassium is detected in the top ringzone sample indicating an accumulation of 38 times.
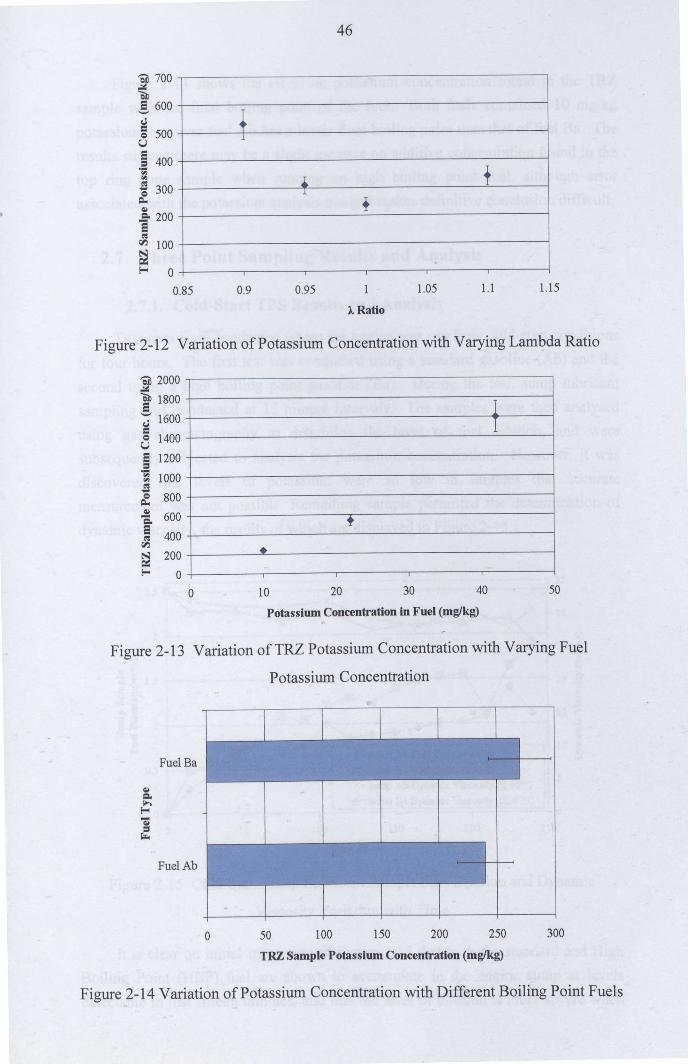
'liD 700~1ill,§, 600~Q 500u§ 400
OF;;
'"~ 300~Q,l= 200S~rI:l 100~E-< 0
0.85
46
t1
• +1
+
0.9 0.95 l.05 1.1 1.15
lRatio
Figure 2-12 Variation of Potassium Concentration with Varying Lambda Ratio
'liD 2000i 1800~ 1600=8 1400§ 1200"S 1000~~ 800-a 600~ 400rI:l
~ 200E-< 0
II
t
•o 10 20 30 40 50
Potassium Concentration in Fuel (mglkg)
Figure 2-13 Variation of TRZ Potassium Concentration with Varying Fuel
Potassium Concentration
FuelBa
Q,lCl.~
E-<Ql,
FuelAb
o 50 100 150 200 250 300
TRZ Sample Potassium Concentration (mglkg)
Figure 2-14 Variation of Potassium Concentration with Different Boiling Point Fuels
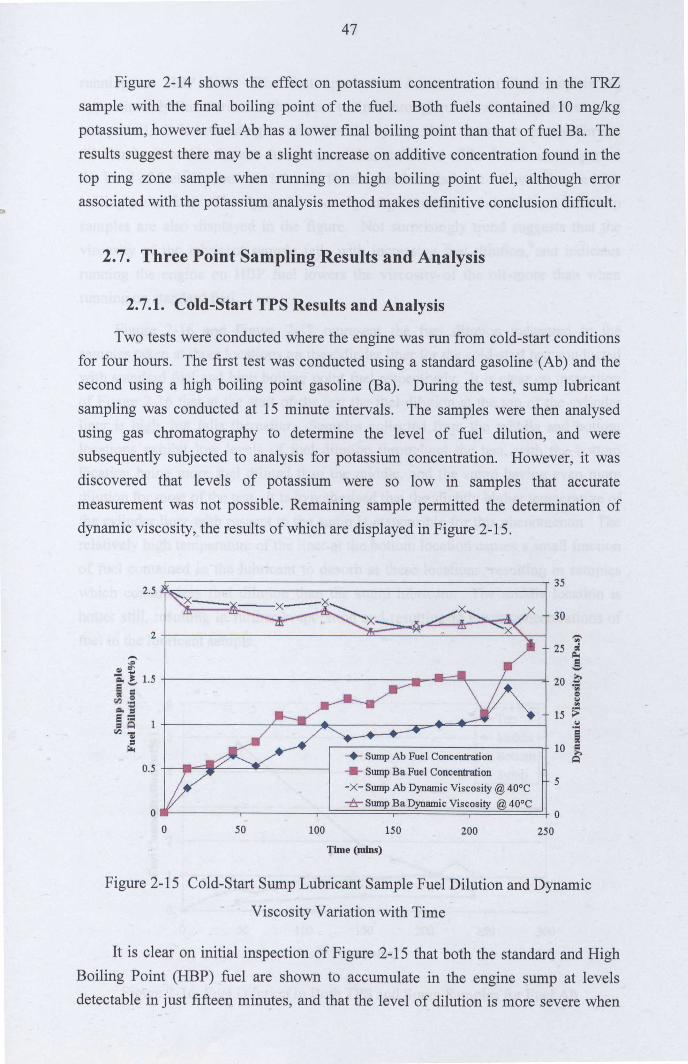
47
'"
Figure 2-14 shows the effect on potassium concentration found in the TRZsample with the fmal boiling point of the fuel. Both fuels contained 10 mg/kgpotassium, however fuel Ab has a lower final boiling point than that of fuel Ba. Theresults suggest there may be a slight increase on additive concentration found in thetop ring zone sample when running on high boiling point fuel, although errorassociated with the potassium analysis method makes definitive conclusion difficult.
2.7. Three Point Sampling Results and Analysis
2.7.1. Cold-Start TPS Results and Analysis
Two tests were conducted where the engine was run from cold-start conditionsfor four hours. The first test was conducted using a standard gasoline (Ab) and thesecond using a high boiling point gasoline (Ba). During the test, sump lubricant
sampling was conducted at 15 minute intervals. The samples were then analysedusing gas chromatography to determine the level of fuel dilution, and weresubsequently subjected to analysis for potassium concentration. However, it wasdiscovered that levels of potassium were so low in samples that accuratemeasurement was not possible. Remaining sample permitted the determination ofdynamic viscosity, the results of which are displayed in Figure 2-15.
30
'";i'
25:~ g
.;.! 1.5 +--------------~p__I-=='_"'\_-_+--_,{_ 20;£; 0= ~r;I} = ~=- :I 15 ~S is 1 ..~~ ir: 10 ~+ Sump Ab Fuel Concentration ~
___ Sump Ba Fuel Concentration
-x- Sump Ab Dynamic Viscosity @40°C
-tr- Sump Ba Dynamic Viscosity @ 40°C0~----,----~======~========~~====40
o
5
50 100 150 200 250Time (mJns)
Figure 2-15 Cold-Start Sump Lubricant Sample Fuel Dilution and Dynamic
Viscosity Variation with Time
It is clear on initial inspection of Figure 2-15 that both the standard and HighBoiling Point (HBP) fuel are shown to accumulate in the engine sump at levelsdetectable in just fifteen minutes, and that the level of dilution is more severe when
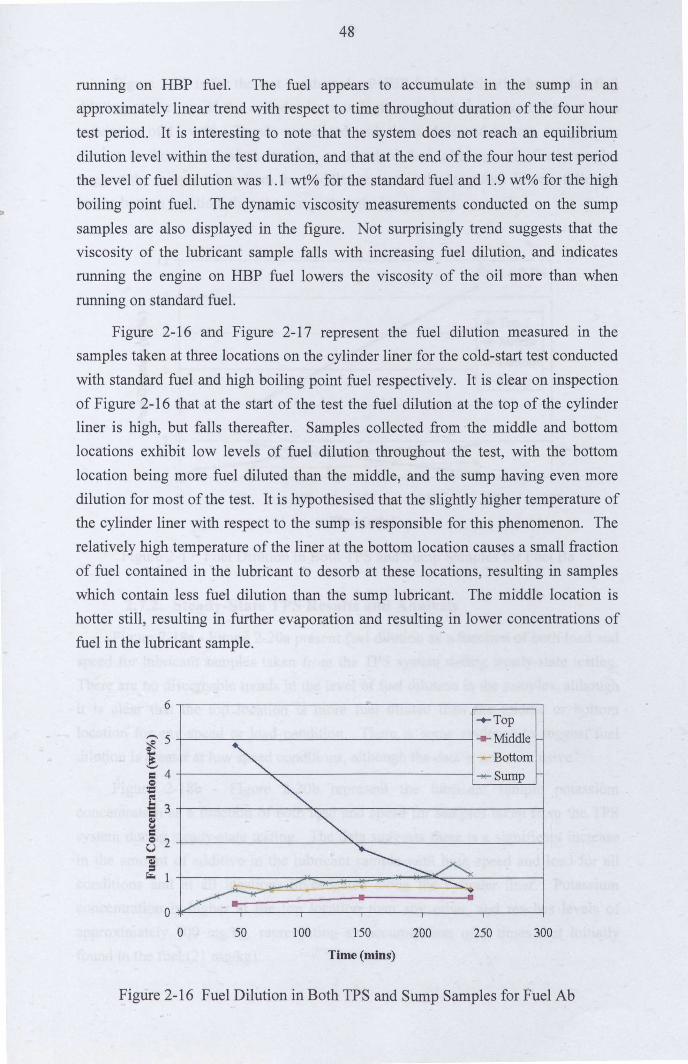
48
rwming on HBP fuel. The fuel appears to accumulate in the sump in anapproximately linear trend with respect to time throughout duration of the four hour
test period. It is interesting to note that the system does not reach an equilibriumdilution level within the test duration, and that at the end of the four hour test periodthe level of fuel dilution was 1.1 wt% for the standard fuel and 1.9 wt% for the high
boiling point fuel. The dynamic viscosity measurements conducted on the sump
samples are also displayed in the figure. Not surprisingly trend suggests that theviscosity of the lubricant sample falls with increasing fuel dilution, and indicatesrwming the engine on HBP fuel lowers the viscosity of the oil more than when
rwming on standard fuel.
Figure 2-16 and Figure 2-17 represent the fuel dilution measured in thesamples taken at three locations on the cylinder liner for the cold-start test conducted
with standard fuel and high boiling point fuel respectively. It is clear on inspectionof Figure 2-16 that at the start of the test the fuel dilution at the top of the cylinderliner is high, but falls thereafter. Samples collected from the middle and bottomlocations exhibit low levels of fuel dilution throughout the test, with the bottom
location being more fuel diluted than the middle, and the sump having even moredilution for most of the test. It is hypothesised that the slightly higher temperature ofthe cylinder liner with respect to the sump is responsible for this phenomenon. Therelatively high temperature of the liner at the bottom location causes a small fractionof fuel contained in the lubricant to desorb at these locations, resulting in sampleswhich contain less fuel dilution than the sump lubricant. The middle location ishotter still, resulting in further evaporation and resulting in lower concentrations offuel in the lubricant sample.
6-+-Top
;R5 ... Middle
! --Bottom
= 4 --Sumpe;::~~ 3~y
=e 2U";=I';,
00 50 100 150 200 250 300
Time (mins)
Figure 2-16 Fuel Dilution in Both TPS and Sump Samples for Fuel Ab
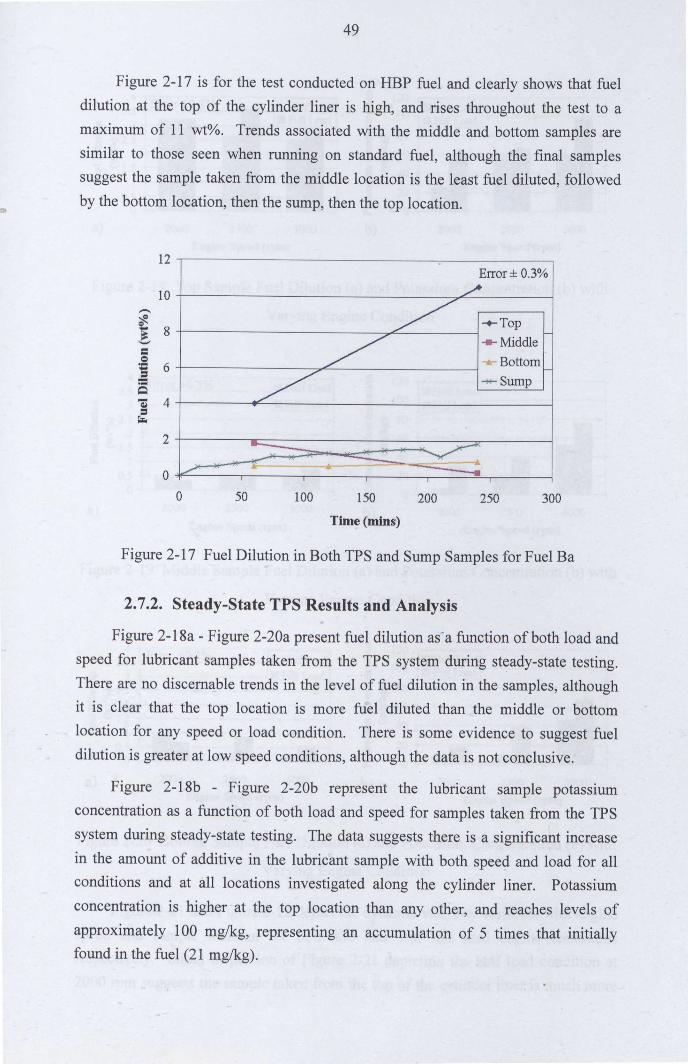
49
Figure 2-17 is for the test conducted on HBP fuel and clearly shows that fueldilution at the top of the cylinder liner is high, and rises throughout the test to amaximum of 11 wt%. Trends associated with the middle and bottom samples aresimilar to those seen when running on standard fuel, although the final samplessuggest the sample taken from the middle location is the least fuel diluted, followedby the bottom location, then the sump, then the top location.
12
10,-.,';fe.
t 8
=0=::::: 6===~- 4Ql=~2
00
Error± 0.3%
50 100 150Time (mlns)
200 250 300
Figure 2-17 Fuel Dilution in Both TPS and Sump Samples for Fuel Ba
2.7.2. Steady-State TPS Results and Analysis
Figure 2-18a - Figure 2-20a present fuel dilution asa function of both load andspeed for lubricant samples taken from the TPS system during steady-state testing.There are no discernable trends in the level of fuel dilution in the samples, althoughit is clear that the top location is more fuel diluted than the middle or bottomlocation for any speed or load condition. There is some evidence to suggest fueldilution is greater at low speed conditions, although the data is not conclusive.
Figure 2-18b - Figure 2-20b represent the lubricant sample potassiumconcentration as a function of both load and speed for samples taken from the TPSsystem during steady-state testing. The data suggests there is a significant increase
in the amount of additive in the lubricant sample with both speed and load for allconditions and at all locations investigated along the cylinder liner. Potassiumconcentration is higher at the top location than any other, and reaches levels of
approximately 100 mg/kg, representing an accumulation of 5 times that initiallyfound in the fuel (21 mg/kg).
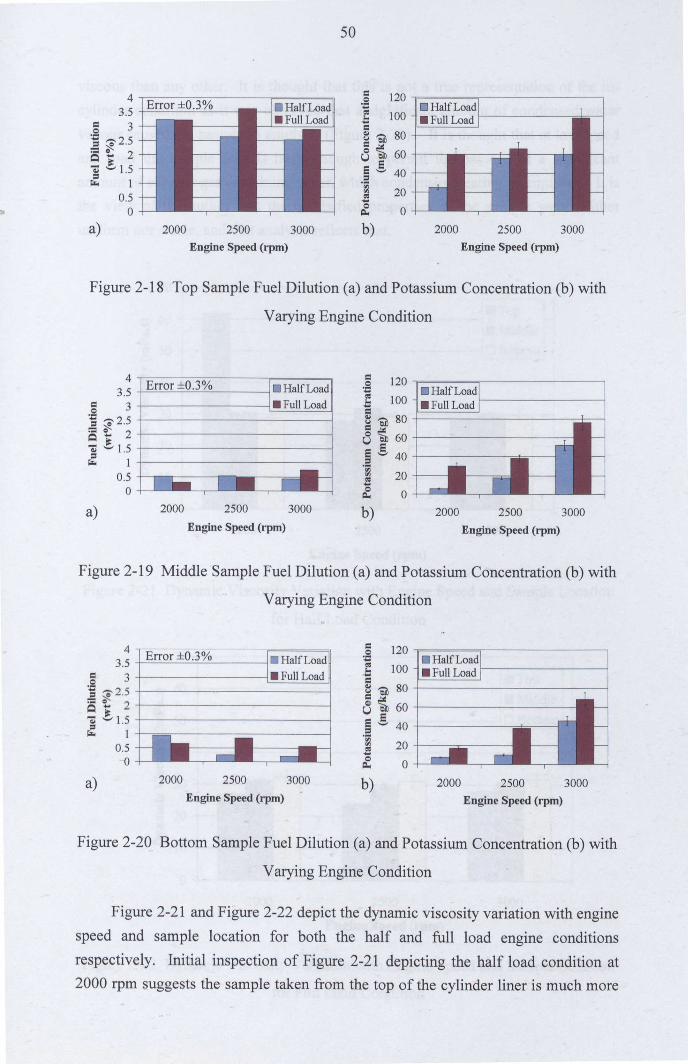
50
4 = 120.§ DHalfLoad3.5 0: 100= .FuIILoad= 3 =.S ~ ';D 80:;,,;,2.5::= ~ 2 ~ ~ 60~ ... U 5OlC1.5 .~ '-'40=f;I;c 1 '"'" 200.5 0:...
0 0" 0 g.,
a) 2000 2500 3000 b) 2000 2500 3000Engine Speed (rpm) Engine Speed (rpm)
Figure 2-18 Top Sample Fuel Dilution (a) and Potassium Concentration (b) with
Varying Engine Condition
4 = 12003.5 '.J: DHalfLoad0: 100= 3 = .FuIILoad
0 ='.J: ~ ';D 80= ,,;,2.5::= ~ 2 ~ ~ 60~ ...OlC1.5 U 5
~ '-'40=f;I;c 1 .~0.5 0: 20...0 0g., 0a) 2000 2500 3000 b) 2000 2500 3000
Engine Speed (rpm) Engine Speed (rpm)
Figure 2-19 Middle Sample Fuel Dilution (a) and Potassium Concentration (b) with
Varying Engine Condition
4Tr~~~~0-'------~====~13.5+-=c:..:....c.. __ -'--'---'---- -----j
.~ 3 I---------------j~:!:!!.!_~~:;";'2.5+----------------------1(S~ 2+----------------------1Ol C 1.5 +----------------------1:=
f;I;c 1 +-~._------==~-------1
~ 120~======~------------_,0: 100t::=~ ';D 80T---------------------~§ ~ 60 +----------U 5.~ '-'40 +-----~ 20 -t----==------.s~ 0o
0.5
a) 2000 2500 3000 b) 2000 2500 3000Engine Speed (rpm) Engine Speed (rpm)
Figure 2-20 Bottom Sample Fuel Dilution (a) and Potassium Concentration (b) with
Varying Engine Condition
Figure 2-21 and Figure 2-22 depict the dynamic viscosity variation with enginespeed and sample location for both the half and full load engine conditions
respectively. Initial inspection of Figure 2-21 depicting the half load condition at2000 rpm suggests the sample taken from the top of the cylinder liner is much more
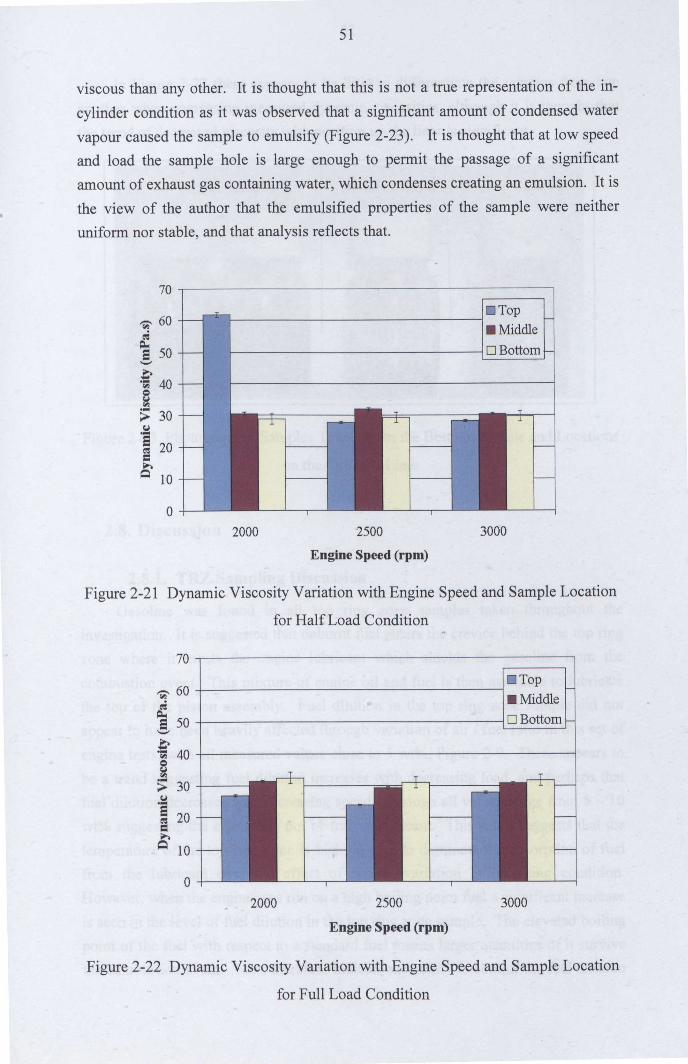
51
viscous than any other. It is thought that this is not a true representation of the in-
cylinder condition as it was observed that a significant amount of condensed watervapour caused the sample to emulsify (Figure 2-23). It is thought that at low speedand load the sample hole is large enough to permit the passage of a significant
amount of exhaust gas containing water, which condenses creating an emulsion. It isthe view of the author that the emulsified properties of the sample were neitheruniform nor stable, and that analysis reflects that.
70,-----------------------------------------
";;'60eo$
~ 50'-'
€ 40e~;; 30(01's~ 20c~Q 10
1- DTop• MiddleDBottom
o -I--_.L-_
2000 2500
Engine Speed (rpm)
3000
Figure 2-21 Dynamic. Viscosity Variation with Engine Speed and Sample Location
for Half Load Condition
70,-----------------------------------------,DTop";;'60+-----------------~
eo$ • Middle~ 50 DBottom'-'
€ 40+-----------------------~;; 30 -+-----(01
's 20~~ 10
o -+-----'---
2000 2500
Engine Speed (rpm)
3000
Figure 2-22 Dynamic Viscosity Variation with Engine Speed and Sample Location
for Full Load Condition
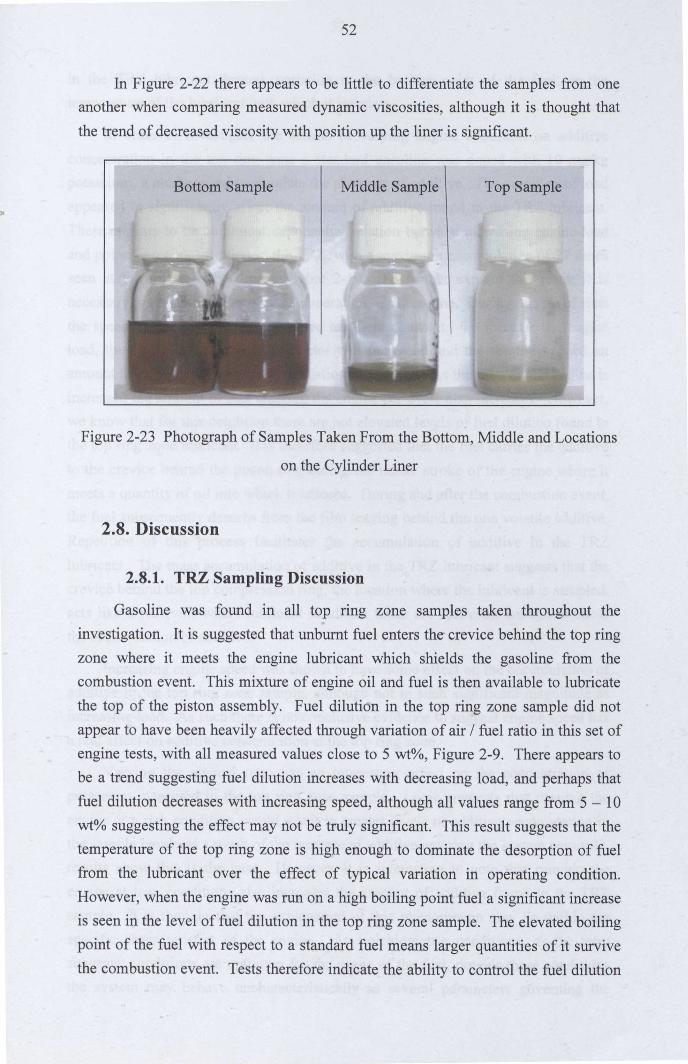
52
In Figure 2-22 there appears to be little to differentiate the samples from oneanother when comparing measured dynamic viscosities, although it is thought that
the trend of decreased viscosity with position up the liner is significant.
Bottom Sample Top SampleMiddle Sample
Figure 2-23 Photograph of Samples Taken From the Bottom, Middle and Locations
on the Cylinder Liner
2.8. Discussion
2.8.1. TRZ Sampling Discussion
Gasoline was found in all top ring zone samples taken throughout the
investigation. It is suggested that unburnt fuel enters the"crevice behind the top ringzone where it meets the engine lubricant which shields the gasoline from thecombustion event. This mixture of engine oil and fuel is then available to lubricatethe top of the piston assembly. Fuel dilution in the top ring zone sample did not
appear to have been heavily affected through variation of air / fuel ratio in this set ofengine tests, with all measured values close to 5 wt%, Figure 2-9. There appears tobe a trend suggesting fuel dilution increases with decreasing load, and perhaps that
fuel dilution decreases with increasing speed, although all values range from 5 - 10wt% suggesting the effect may not be truly significant. This result suggests that thetemperature of the top ring zone is high enough to dominate the desorption of fuelfrom the lubricant over the effect of typical variation in operating condition.However, when the engine was run on a high boiling point fuel a significant increaseis seen in the level of fuel dilution in the top ring zone sample. The elevated boilingpoint of the fuel with respect to a standard fuel means larger quantities of it survivethe combustion event. Tests therefore indicate the ability to control the fuel dilution
53
in the TRZ lubricant through variation in the boiling point of the fuel, or thetemperature of the lubricant with which it interacts.
In order to investigate the effects of varying engine condition on additiveconcentration in the top ring zone a standard gasoline was doped with 10 mg/kgpotassium, a marker used to simulate the presence of additive. The variation of load
appeared to significantly affect the amount of additive found in the TRZ lubricant.There appears to be an almost exponential relation between increasing engine loadand potassium concentration in the TRZ, with a maximum accumulation of 77 timesseen at the full load condition, Figure 2-10. To further explain this result it isnecessary to understand the principle operation of the engine. During this set of teststhe speed of the engine was controlled and held constant. To increase the engine
load, the bandwidth of the fuel injector was increased and the throttle opened anamount to allow stoichiometric combustion conditions. As the load on the engine isincreased the amount of fuel entering the engine per cycle also increases. However,we know that for this condition there are not elevated levels of fuel dilution found inthe top ring zone lubricant. It is therefore suggested that the fuel carries the additiveto the crevice behind the piston ring during the intake stroke of the engine where it
meets a quantity of oil into which it adsorbs. During and after the combustion event,the fuel subsequently desorbs from the film leaving behind the non volatile additive.
Repetition of this process facilitates the accumulation of additive in the TRZlubricant. The mass accumulation of additive in the TRZ lubricant suggests that thecrevice behind the top compression ring, the location where the lubricant is sampled,
acts like a reservoir where lubricant re~idence times are sufficient enough to allowthe accumulation of additive.
Increasing engine speed was shown to have some effect on the accumulation ofadditive in the top ring zone sample, although not in such significant magnitude asincreasing load. As such there is no conclusive evidence to suggest engine speed hasa real affect on additive concentration at the top ring zone.
Varying the air/fuel ratio has an interesting affect on the concentration ofpotassium measured in the top ring zone sample. Logic suggests that running theengine at a rich condition would result in greater levels of additive accumulation inthe sample purely as a result of the increase of additive entering the system per cycle,results show this is the case. However, it is interesting to note that running theengine at lean conditions also increases the amount of additive found in the TRZsample. It is thought that the explanation of this phenomenon may lie within the
specific characteristics of the engine. At stoichiometric conditions, as the term
suggests, conditions are optimum for the usage of the fuel, outside these conditionsthe system may behave uncharacteristically as several parameters governing the
54
engines operation become affected. This could possibly result in different mixingconditions in the cylinder effecting fuel/lubricant interaction.
To investigate effects associated with variation of additive treatment level,fuels with varying concentrations of potassium were run in the engine underidentical operating conditions. Prior to being tested in the engine, the potassiumtreatment level in each fuel was measured and shown to be 10mg/kg, 21 mg/kg and42 mg/kg. The corresponding levels of potassium concentration found in the topring zone samples appeared to reflect an approximate exponential trend, where aninitial treatment level of 42 mg/kg results in 1600 mg/kg potassium at the TRZ,Figure 2-13. This result is not too surprising as it essentially suggests applyingmoreadditive to a system results in more accumulation in the top ring zone. This resulthighlights the need to test fuels with treatment levels over 42 mg/kg to investigatethe optimum treatment level.
Tests conducted with standard and high boiling point fuel reveal that theboiling point of the fuel has little effect on the accumulation of additive at the topring zone, Figure 2-14. Results suggest the volatility of the fuel is not a significantfactor in the administration of additive to the top ring zone, and that far moresignificant and influential factors are engine load and fuel treatment level.
2.8.2. Three Point Sampling Discussion
Analysis of the data taken from the cold-start tests suggests that as soon as theengine is fired, fuel accumulates in the engine sump in reasonably large quantities.It is thought the passage of the fuel from the combustipn chamber is facilitatedthrough one of two main mechanisms. The first suggests the fuel is transported tothe sump lubricant in vapour phase by the combustion gasses which blow-by thepiston rings under firing conditions. The second hypothesises that the fuel absorbsinto the cylinder liner lubricant on injection into the cylinder, and is protected fromthe combustion event by the lubricant. During the subsequent exhaust and intakestrokes the local temperatures and pressures promote the desorbtion from thecylinder liner lubricant where it then exits the engine as unburnt hydrocarbon, orremains on the crankcase side of the systemmanifesting itself as sump fuel dilution.Tests conducted with high boiling point fuel indicate that the fuel dilution in thesump is heavily dependent on the boiling point of the fuel, thus highlighting in-cylinder temperatures as a critical influence on sump dilution. Dynamic viscosityresults taken from the sump lubricant reflect the influence of fuel dilution almostexactly, and enforce the point that fuel dilution significantly effects the sumplubricant viscosity, Figure 2-15.
55
All samples taken from the Three Point Sampling showed presence of fuel inthe cylinder liner lubricant, and highlight the excessive dilution of the top location,particularly when running on high boiling point fuel. It is interesting to note that thetop location fuel dilution falls with time when running on standard gasoline, butcontinues to rise when running on high boiling point gasoline, suggesting the boilingpoint of the fuel is again a truly significant factor influencing the lubricationcondition of the engine.
Steady-state sampling tests do not show any significant trends in fuel dilutionwith varying engine condition, although it is interesting to note that the top cylinderliner lubricant is approximately four times more diluted by fuel than any otherlocation on the liner. The reason for this high level of fuel dilution at the topcylinder liner location follows logic, as it is this lubricant which directly interactswith the fuel once the fuel injector opens. Interestingly the middle and bottom liner
locations exhibited similar fuel dilutions suggesting the local situation below the top
location has stabilised. It is suggested that it is this lubricant which is transported tothe sump with little further desorbtion, as the levels of fuel dilution in the enginesump are typically not dissimilar.
Potassium concentrations measured in the steady-state tests revealed someinteresting results. It is clear that additive concentration increases with both speed
and load. The mechanism for this accumulation is not thought to be dissimilar tothat discussed in the top ring zone sampling section where it is hypothesised thatmost of the fuel carrying the additive marker desorbs from the lubricant film leavingbehind the non-volatile additive. However, accumulation levels of just 5 times wereseen at the top liner location, as opposed to 77 times measured in the sample taken
from the top ring groove, Figure 2-18b. This result suggests that the lubrication ofthe cylinder liner is a much more dynamic system than that of the top ring zone, andperhaps highlights two categories of lubricant residence times, one associated
directly with the piston assembly lubrication, and one the cylinder liner.
Dynamic viscosity testing of the samples taken from the TPS tests were
inconclusive, and highlighted the difficulty of viscosity measurement of samplescontaining volatile constituents. However, at the full load condition it is seen thatthe lubricant is less viscous than that at any position lower down the liner. Thisresult is thought to be a direct result of fuel dilution which acts to lower the viscosityof the cylinder liner lubricant at the top location.
Overall the TPS tests highlight the power of the sampling system,demonstrating the ability of the system to give information which permits theunderstanding of how the piston assembly is lubricated, and more importantly howthis lubrication can be controlled. Tests conducted with potassium marker indicate
56
the effectiveness of simulating fuel administered additive to the cylinder liner
lubricant, and again permits the' beginning of an understanding of how the
lubrication of the piston assembly system can be influenced through strategicapplication of an additive package.
2.9. Summary
A portfolio of engine tests was conducted whose purpose was to extractlubricant from strategic locations around the piston assembly / cylinder linerinterface. Analysis of these lubricant samples gives us information detailing thelubricating conditions at the piston assembly / cylinder liner interface, and providesus with knowledge which can be utilised to both influence and improve the
operation of the piston assembly. On consideration of all the analysis and discussion
detailed in this chapter, the following summary can be made.
• Top ring zone sampling is an effective method of extracting pistonassembly lubricant directly from the back of the top ring grove of afiring engine. A top ring zone sampling system was developed in thiswork, and as such manifests itself as one of the most advanced systems
in existence in terms of both engine speed and durability.
• Lubricant sample extracted from the TRZ was shown to be diluted withsignificant amounts of fuel at all engine conditions tested. Typicalamounts of fuel dilution range from 5 - 12 wt%. Increasing loadappears to increase the fuel dilution within the top ring zone, whereasincreasing speed appears to decrease it. However, the final boiling
point of the fuel appears to be the most significant influence on the
amount of fuel found in the top ring zone and was shown to increase
TRZ lubricant fuel dilution to approximately 33 wt%.
• Doping gasoline with a potassium marker is an effective way ofsimulating the presence of additive, providing a means of quantification
of additive concentration in analysed lubricant samples.
• Additive concentration was increased in the top ring zone throughincreasing engine speed and operating with high boiling point fuel,although most significant influencing factors appear to be engine loadand additive treat level. When run at the full load condition, lubricant
sampled from the top ring groove contained 77 times more additivethan the original treatment level of the fuel, showing significant
accumulation occurs.
57
• A novel prece of equipment was developed which permitted thesampling of cylinder liner lubricant at three locations simultaneouslyunder fired conditions for a range of speeds and loads. The equipmentwas shown to be capable of sampling at conditions of 3000 rpm andfull load, and it is thought that greater speeds would not cause a
problem, although they were not investigated in this work.
• Analysis of sump samples taken in a cold-start test revealed measurableamounts of fuel dilution within 15 minutes. Data collected also revealsthat the final boiling point of the fuel is a significant factor influencingthe level of fuel dilution in the sump, with high boiling point fuelscausing greater dilution.
• Research leads the hypothesis that the transport of fuel to the enginesump lubricant takes place by one of two mechanisms; 1) fuel passesthe piston rings in the blow-by gasses in a vapour phase, 2) fuel adsorbsinto the cylinder liner lubricant, which is returned to the sump in aliquid phase through the dynamic action of the piston ring / cylinderliner interface.
• Cylinder liner lubricant fuel dilution does not appear to be heavily
influenced through changes in engine speed or load. However testsrevealed that the lubricant at the top of the cylinder liner has a greateramount of fuel dilution than either the middle of bottom position.Typical measurements suggest 4 times more fuel dilution at the toplocation than any other.
• A concentration of potassium was measured in the samples taken fromthe three locations on the cylinder liner wall, and was shown to increasewith both engine speed and load. At the 3000 rpm and full load the toplocation on the cylinder liner wall was shown to contain a concentrationof potassium additive 5 times greater than that which was originally inthe fuel suggesting some accumulation occurs.
• Results suggest that the lubrication of the cylinder liner is a much moredynamic system than that of the top ring zone, and perhaps serves tohighlight two categories of lubricant residence times, one associateddirectly with lubrication of the piston assembly, and one the cylinderliner.
• The development of novel lubricant sampling systems permits thebeginning of an understanding as to how the piston assembly islubricated in detail, and more importantly how this lubrication can be
58
controlled. Strategic test design utilising gasoline doped withpotassium marker has indicated the effectiveness of simulating fueladministered additive to the cylinder liner lubricant and strengthens thefoundation of understanding underpinning the potential effect ofstrategic application of gasoline additive package.
59
3. Tribometer Investigation of Environmentally Friendly FrictionModifier Additives
In this chapter a series of tests which were conducted on a Plint TE-77 HighFrequency Reciprocator Tribometer are described. The machine provides an ideal
opportunity to simulate the arduous conditions at the top ring zone of a firing engine,the area where boundary friction modifiers are most necessary. However, unlike aninvestigation into engine sump lubricants containing friction modifier, it isextremely difficult and dangerous to mimic gasoline with friction modifiers using abench-top tribometer due to the inherent flammability. As a result the developmentof a standardised test with operating conditions selected to simulate the situation in a
repeatable and safe manner is presented.
Additives under investigation all conformed to the CHON philosophy,consisting only of carbon, hydrogen, oxygen and nitrogen. This type of additive is
considered more desirable than the organo-metallic lubricant friction modifieradditives. Tests were developed to allow the comparison of different friction
modifier additives under the same test conditions, allowing the performance of eachadditive to be screened and suggesting which might be the most beneficial in the
engine environment. Through careful interpretation of the data taken from themachine it is possible to characterise an additives performance in terms of the speedof reaction, the extent of friction reduction, the extent of film formation, the tenacityof film formation as well as information about the mechanism which leads to frictionreduction. Test results were used to select families, or species, of molecule whichwould be most effective at friction modification in the engine environment.
Through analysis of trends in friction reduction with respect to the chemical family
from which the friction modifier additive comes, it is possible to hypothesisechemicals capable of even greater friction reduction. Information gained from theportfolio of tests detailed above allow hypotheses to be formed, pre-empting thecreation of test lubricant formulations which utilise synergistic additive effects tocreate ever more effective friction modifier films. Tests were also conducted to
investigate the critical concentration of additive required to induce friction modifiedcontact performance and the effect of changes in piston ring coating and surfaceroughness on additive behaviour.
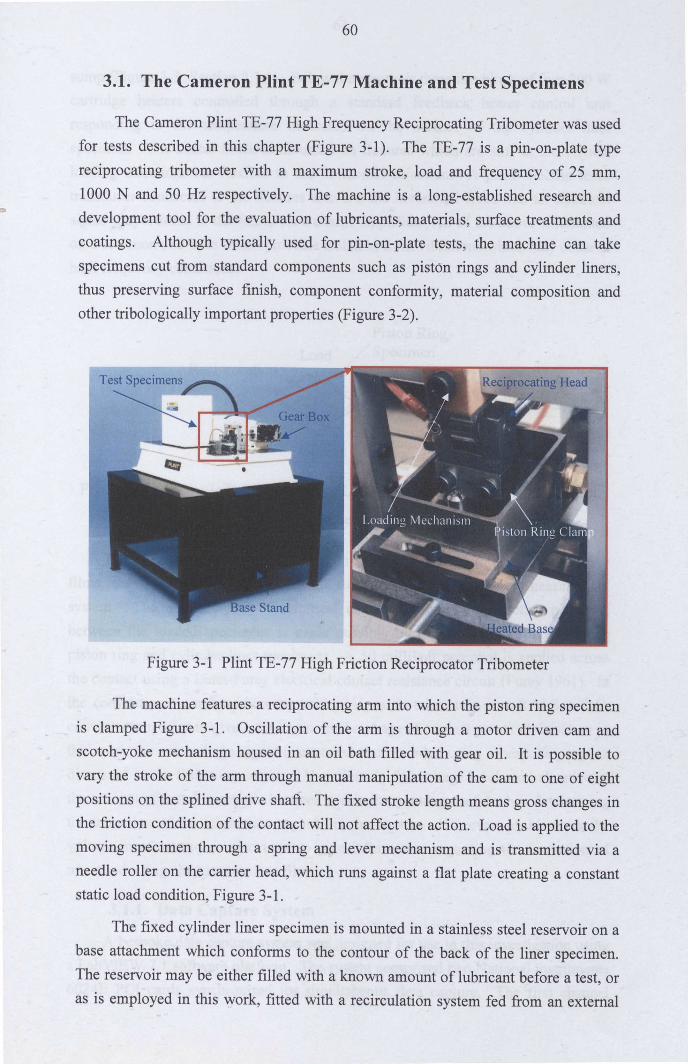
60
3.1. The Cameron Plint TE-77 Machine and Test Specimens
The Cameron Plint TE-77 High Frequency Reciprocating Tribometer was usedfor tests described in this chapter (Figure 3-1). The TE-77 is a pin-on-plate type
reciprocating tribometer with a maximum stroke, load and frequency of 25 mm,1000 N and 50 Hz respectively. The machine is a long-established research anddevelopment tool for the evaluation of lubricants, materials, surface treatments and
coatings. Although typically used for pin-on-plate tests, the machine can takespecimens cut from standard components such as piston rings and cylinder liners,thus preserving surface finish, component conformity, material composition andother tribologically important properties (Figure 3-2).
Figure 3-1 Plint TE-77 High Friction Reciprocator Tribometer
The machine features a reciprocating aim into which the piston ring specimenis clamped Figure 3-1. Oscillation of the arm is through a motor driven cam andscotch-yoke mechanism housed in an oil bath filled with gear oil. It is possible tovary the stroke of the arm through manual manipulation of the cam to one of eightpositions on the splined drive shaft. The fixed stroke length means gross changes inthe friction condition of the contact will not affect the action. Load is applied to themoving specimen through a spring and lever mechanism and is transmitted via aneedle roller on the carrier head, which runs against a flat plate creating a constantstatic load condition, Figure 3-1.
The fixed cylinder liner specimen is mounted in a stainless steel reservoir on abase attachment which conforms to the contour of the back of the liner specimen.The reservoir may be either filled with a known amount of lubricant before a test, oras is employed in this work, fitted with a recirculation system fed from an external
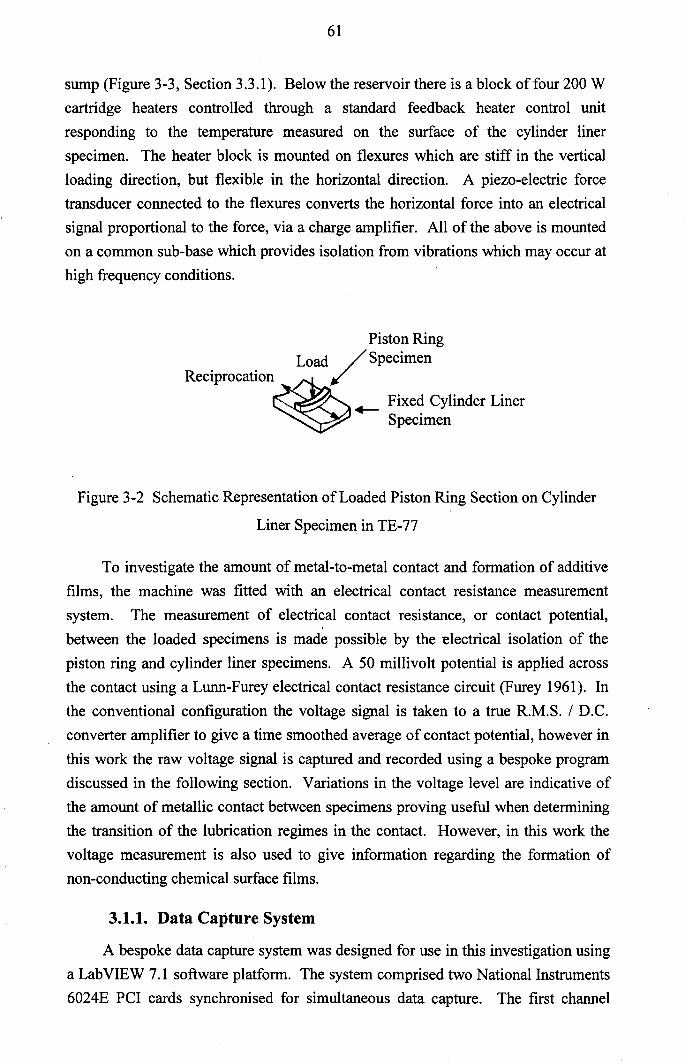
61
sump (Figure 3-3, Section 3.3.1). Below the reservoir there is a block of four 200 Wcartridge heaters controlled through a standard feedback heater control unitresponding to the temperature measured on the surface of the cylinder linerspecimen. The heater block is mounted on flexures which are stiff in the verticalloading direction, but flexible in the horizontal direction. A piezo-electric forcetransducer connected to the flexures converts the horizontal force into an electricalsignal proportional to the force, via a charge amplifier. All of the above is mounted
on a common sub-base which provides isolation from vibrations which may occur athigh frequency conditions.
Piston RingLoad/ Specimen
Reciprocation~+- Fixed Cylinder Liner
Specimen
Figure 3-2 Schematic Representation of Loaded Piston Ring Section on Cylinder
Liner Specimen in TE-77
To investigate the amount of metal-to-metal contact and formation of additivefilms, the machine was fitted with an electrical contact resistance measurementsystem. The measurement of electrical contact resistance, or contact potential,
between the loaded specimens is made possible by the electrical isolation of thepiston ring and cylinder liner specimens. A 50 millivolt potential is applied acrossthe contact using a Lunn-Furey electrical contact resistance circuit (Furey 1961). Inthe conventional configuration the voltage signal is taken to a true R.M.S. / D.C.converter amplifier to give a time smoothed average of contact potential, however in
this work the raw voltage signal is captured and recorded using a bespoke programdiscussed in the following section. Variations in the voltage level are indicative ofthe amount of metallic contact between specimens proving useful when determiningthe transition of the lubrication regimes in the contact. However, in this work thevoltage measurement is also used to give information regarding the formation ofnon-conducting chemical surface films.
3.1.1. Data Capture System
A bespoke data capture system was designed for use in this investigation usinga LabVIEW 7.1 software platform. The system comprised two National Instruments6024E PCI cards synchronised for simultaneous data capture. The first channel
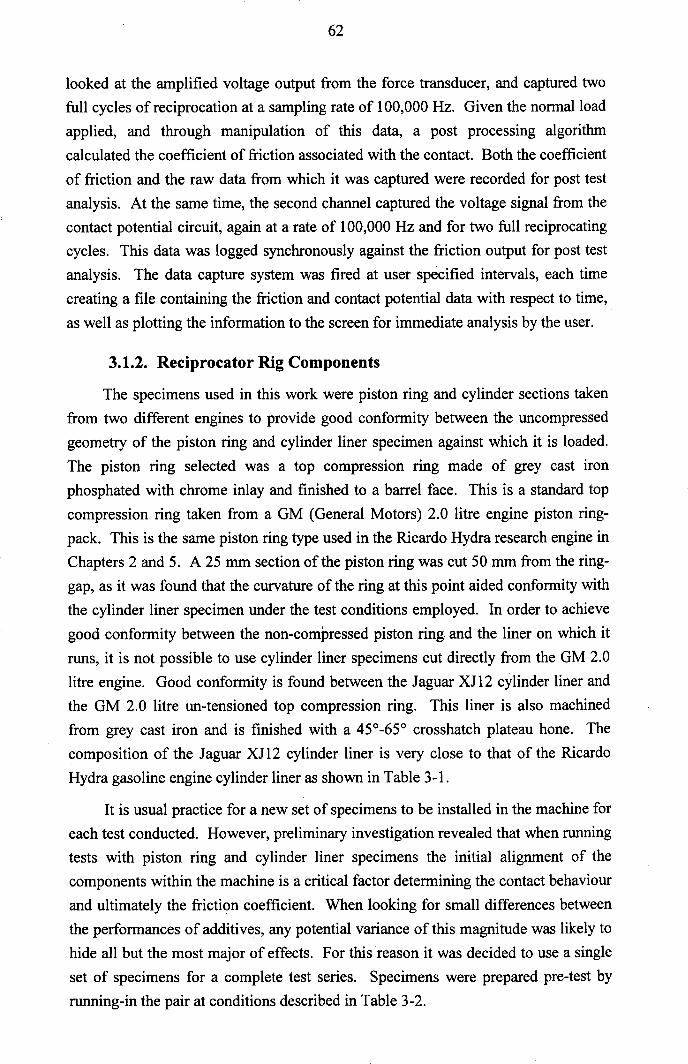
62
looked at the amplified voltage output from the force transducer, and captured twofull cycles of reciprocation at a sampling rate of 100,000 Hz. Given the normal loadapplied, and through manipulation of this data, a post processing algorithm
calculated the coefficient of friction associated with the contact. Both the coefficientof friction and the raw data from which it was captured were recorded for post testanalysis. At the same time, the second channel captured the voltage signal from thecontact potential circuit, again at a rate of 100,000 Hz and for two full reciprocatingcycles. This data was logged synchronously against the friction output for post testanalysis. The data capture system was fired at user specified intervals, each timecreating a file containing the friction and contact potential data with respect to time,
as well as plotting the information to the screen for immediate analysis by the user.
3.1.2. Reciprocator Rig Components
The specimens used in this work were piston ring and cylinder sections takenfrom two different engines to provide good conformity between the uncompressedgeometry of the piston ring and cylinder liner specimen against which it is loaded.The piston ring selected was a top compression ring made of grey cast ironphosphated with chrome inlay and finished to a barrel face. This is a standard topcompression ring taken from a GM (General Motors) 2.0 litre engine piston ring-pack. This is the same piston ring type used in the Ricardo Hydra research engine inChapters 2 and 5. A 25 mm section of the piston ring was cut 50 mm from the ring-gap, as it was found that the curvature of the ring at this point aided conformity withthe cylinder liner specimen under the test conditions employed. In order to achieve
good conformity between the non-compressed piston ring. and the liner on which itruns, it is not possible to use cylinder liner specimens cut directly from the GM 2.0litre engine. Good conformity is found between the Jaguar XJ12 cylinder liner andthe GM 2.0 litre un-tensioned top compression ring. This liner is also machinedfrom grey cast iron and is finished with a 45°-65° crosshatch plateau hone. Thecomposition of the Jaguar XJ12 cylinder liner is very close to that of the RicardoHydra gasoline engine cylinder liner as shown in Table 3-1.
It is usual practice for a new set of specimens to be installed in the machine foreach test conducted. However, preliminary investigation revealed that when runningtests with piston ring and cylinder liner specimens the initial alignment of thecomponents within the machine is a critical factor determining the contact behaviour
and ultimately the friction coefficient. When looking for small differences betweenthe performances of additives, any potential variance of this magnitude was likely tohide all but the most major of effects. For this reason it was decided to use a singleset of specimens for a complete test series. Specimens were prepared pre-test byrunning-in the pair at conditions described in Table 3-2.
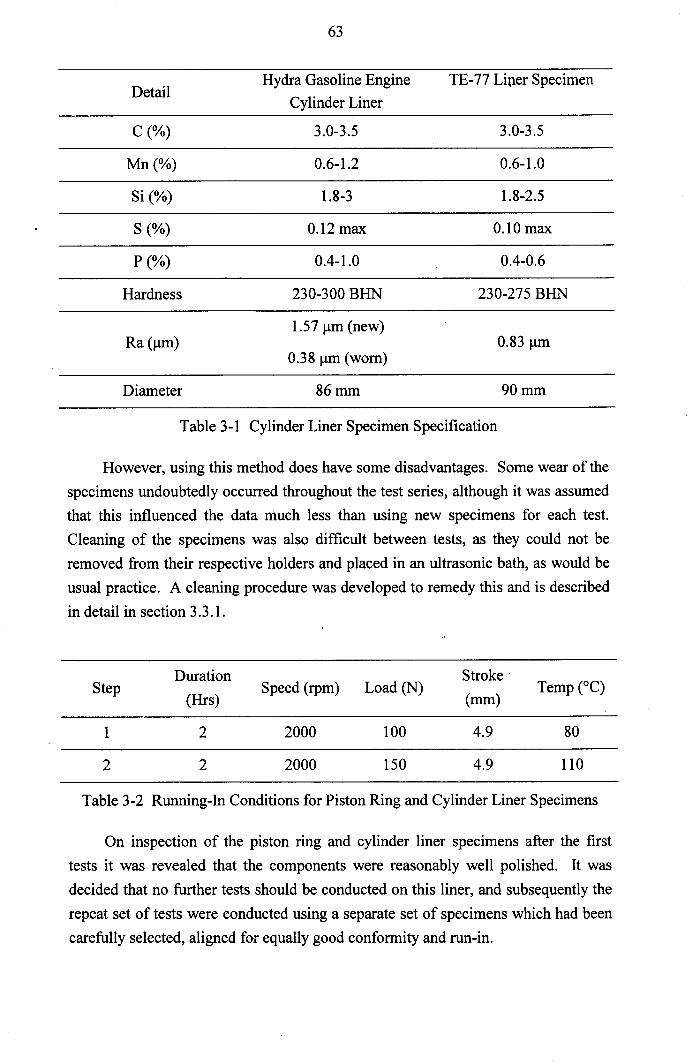
63
DetailHydra Gasoline Engine TE-77 Liner Specimen
Cylinder Liner
C(%) 3.0-3.5 3.0-3.5
Mn(%) 0.6-1.2 0.6-1.0
Si (%) 1.8-3 1.8-2.5
S (%) 0.12 max 0.10 max
P (%) 0.4-1.0 0.4-0.6
Hardness 230-300 BHN 230-275 BHN
1.57 urn (new)Ra Ium) 0.83 urn
0.38 urn (worn)
Diameter 86mm 90mm
Table 3-1 Cylinder Liner Specimen Specification
However, using this method does have some disadvantages. Some wear of thespecimens undoubtedly occurred throughout the test series, although it was assumedthat this influenced the data much less than using new specimens for each test.Cleaning of the specimens was also difficult between tests, as they could not beremoved from their respective holders and placed in an ultrasonic bath, as would beusual practice. A cleaning procedure was developed to remedy this and is described
in detail in section 3.3.1.
Duration StrokeStep
(Hrs)Speed (rpm) Load (N)
(mm)Temp CC)
1 2 2000 100 4.9 80
2 2 2000 150 4.9 110
Table 3-2 Running-In Conditions for Piston Ring and Cylinder Liner Specimens
On inspection of the piston ring and cylinder liner specimens after the first
tests it was revealed that the components were reasonably well polished. It wasdecided that no further tests should be conducted on this liner, and subsequently the
repeat set of tests were conducted using a separate set of specimens which had beencarefully selected, aligned for equally good conformity and run-in.
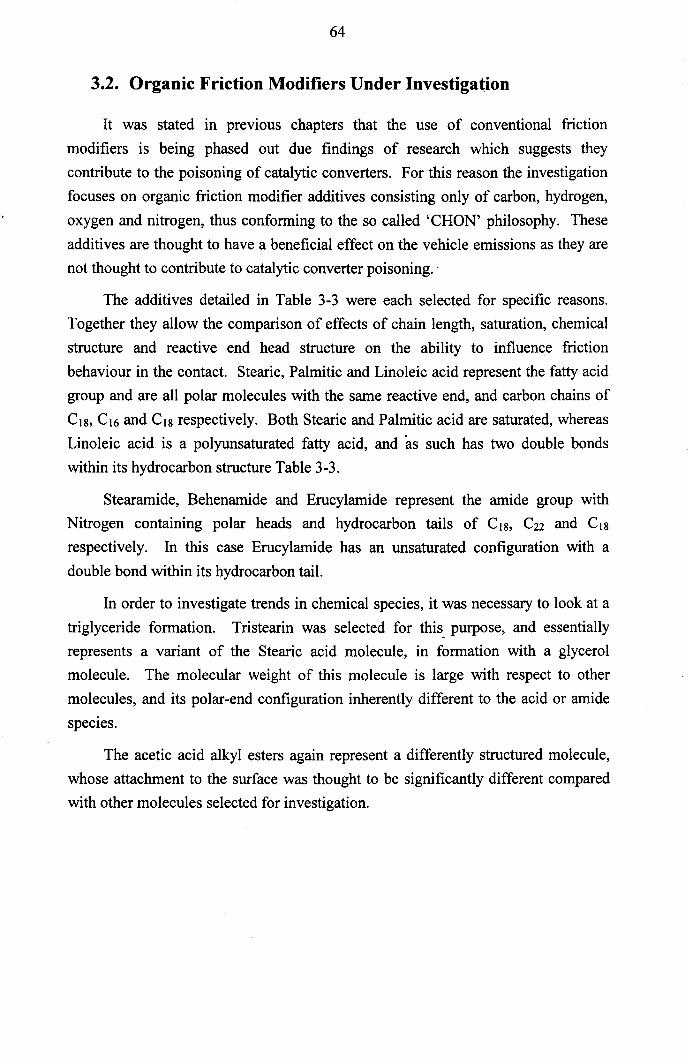
64
3.2. Organic Friction Modifiers Under Investigation
It was stated in previous chapters that the use of conventional frictionmodifiers is being phased out due findings of research which suggests theycontribute to the poisoning of catalytic converters. For this reason the investigationfocuses on organic friction modifier additives consisting only of carbon, hydrogen,
oxygen and nitrogen, thus conforming to the so called 'CHON' philosophy. Theseadditives are thought to have a beneficial effect on the vehicle emissions as they arenot thought to contribute to catalytic converter poisoning .:
The additives detailed in Table 3-3 were each selected for specific reasons.Together they allow the comparison of effects of chain length, saturation, chemicalstructure and reactive end head structure on the ability to influence frictionbehaviour in the contact. Stearic, Palmitic and Linoleic acid represent the fatty acidgroup and are all polar molecules with the same reactive end, and carbon chains of
CIS, CI6 and CIS respectively. Both Stearic and Palmitic acid are saturated, whereasLinoleic acid is a polyunsaturated fatty acid, and as such has two double bondswithin its hydrocarbon structure Table 3-3.
Stearamide, Behenamide and Erucylamide represent the amide group withNitrogen containing polar heads and hydrocarbon tails of CIS, C22 and CISrespectively. In this case Erucylamide has an unsaturated configuration with adouble bond within its hydrocarbon tail.
In order to investigate trends in chemical species, it was necessary to look at atriglyceride formation. Tristearin was selected for this. purpose, and essentiallyrepresents a variant of the Stearic acid molecule, in formation with a glycerolmolecule. The molecular weight of this molecule is large with respect to othermolecules, and its polar-end configuration inherently different to the acid or amidespecies.
The acetic acid alkyl esters again represent a differently structured molecule,whose attachment to the surface was thought to be significantly different comparedwith other molecules selected for investigation.
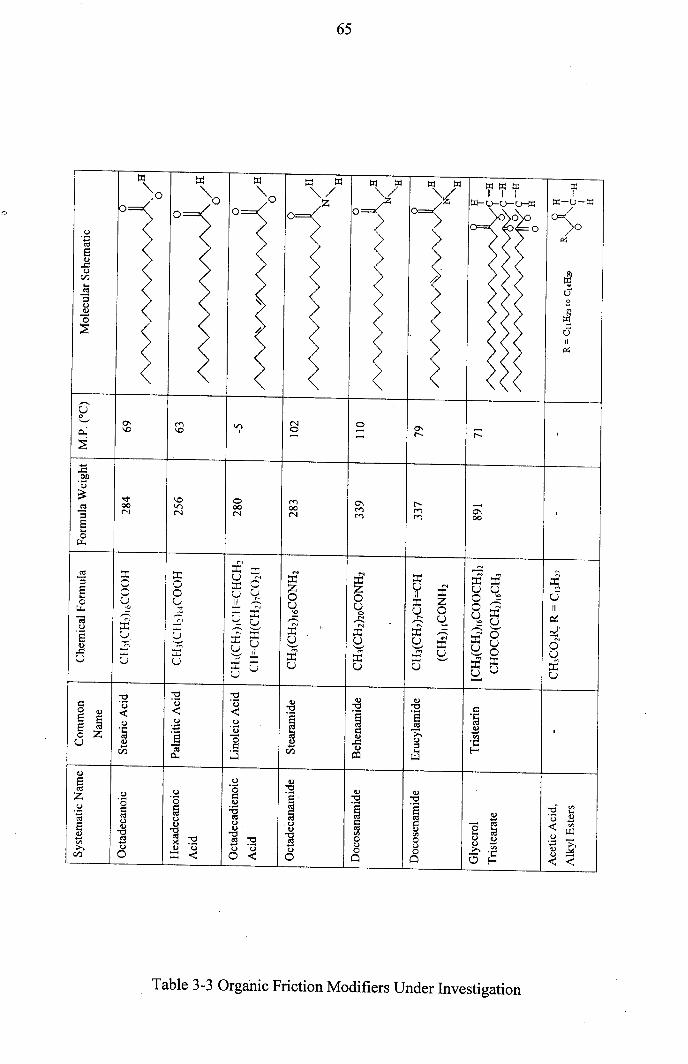
65
'<t00N
o00N
C")00N
::r:oou-o
::r:oou...
:£'v
<1)
E0:1ZU.~E.B~
CZl
<.)
o~
jo
o--
<1)
"00,ogCl
-r--
-0\00
Table 3-3 Organic Friction Modifiers Under Investigation
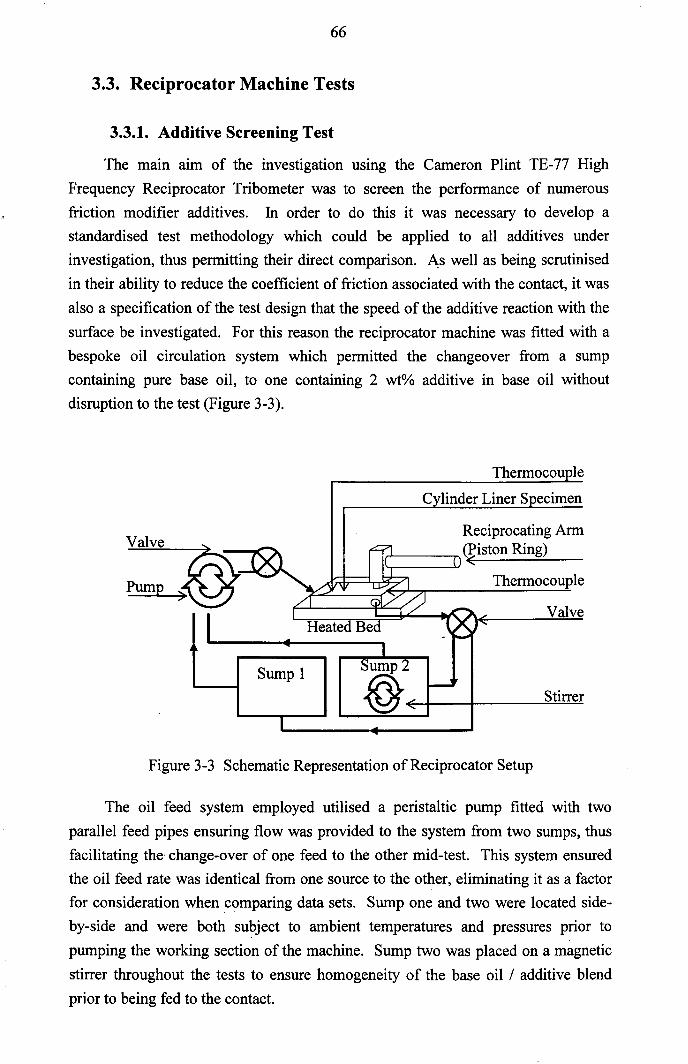
66
3.3. Reciprocator Machine Tests
3.3.1. Additive Screening Test
The main aim of the investigation usmg the Cameron Plint TE-77 High
Frequency Reciprocator Tribometer was to screen the performance of numerousfriction modifier additives. In order to do this it was necessary to develop astandardised test methodology which could be applied to all additives underinvestigation, thus permitting their direct comparison. As well as being scrutinisedin their ability to reduce the coefficient of friction associated with the contact, it was
also a specification of the test design that the speed of the additive reaction with thesurface be investigated. For this reason the reciprocator machine was fitted with abespoke oil circulation system which permitted the changeover from a sumpcontaining pure base oil, to one containing 2 wt% additive in base oil withoutdisruption to the test (Figure 3-3).
Thermocouple
ValveReciprocating Arm
,rI-__ --r.(Piston Ring)
C linder Liner S ecimen
Thermocouple
Valve
Pump
Sump 1Stirrer
Figure 3-3 Schematic Representation of Reciprocator Setup
The oil feed system employed utilised a peristaltic pump fitted with two
parallel feed pipes ensuring flow was provided to the system from two sumps, thusfacilitating the change-over of one feed to the other mid-test. This system ensuredthe oil feed rate was identical from one source to the other, eliminating it as a factorfor consideration when comparing data sets. Sump one and two were located side-by-side and were both subject to ambient temperatures and pressures prior topumping the working section of the machine. Sump two was placed on a magnetic
stirrer throughout the tests to ensure homogeneity of the base oil/additive blendprior to being fed to the contact.
67
Lubricant enters the system on the left hand side of the contact through anozzle directing the flow over the cylinder liner surface. Once it has passed through
the contact, the lubricant is extracted from the lubricant reservoir and returned to thesump by a second peristaltic pump running at a scavenging pace.
The machine was run at the conditions detailed in Table 3-4, which wereselected to simulate the conditions found at the TDC reversal point within a firinggasoline engine.
Parameter Condition
Stroke Length 5mm
Drive Motor Speed 2000 rpm
Load ISON
Liner Specimen Surface Temperature
Oil Pump Flow Rate 1 Llhr
Table 3-4 Additive Screening Test Conditions
• The pump flow rate was set at I litrelhr, and practically manifested
itself as a drip feed. This speed was selected as one litre of each
additive blend was created for use in the screening tests, thus givingeach molecule of additive a chance to pass through the contact once.However, due to mixing' in the sump it is accepted that this wasprobably not the case. Should passing through the contact deteriorateor destroy additive molecules, having one litre of lubricant ensured
there would always be active molecules entering the contact.
• A stroke of S mm was selected to ensure the system operatedpredominately in the boundary lubrication regime for the chosenconditions, the shorter stroke not allowing the system to enter themixed or hydrodynamic lubrication regimes. A short stroke also
ensures greater alignment between specimens throughout the cycle,
limiting harsh vibrations which are often experienced with long strokelengths.
• A drive motor speed of 2000 rpm, corresponding to a reciprocatingfrequency of 33.3 Hz was selected for the tests. Given the stroke length
of 5 mm, this practically manifests itself as an average speed of 0.33mls. This speed was primarily selected to ensure the contact stayed in
68
the boundary lubrication regime, but was also selected as preliminarytests revealed the speed was ideal for minimising noise in this particularsystem.
• Thermocouples mounted on the surface of the cylinder liner were used
to ensure the surface temperature of the cylinder liner was maintainedat 110°C. This temperature was selected as it is typical of the TDCcylinder liner temperature measured in fired engine tests presented inother chapters of this thesis.
• A normal load of 150 N was applied to the reciprocating arm. Thisload was used to simulate a 'worst case scenario' at the top ring zone,
where data taken from the Ricardo Hydra engine at full load and 2000
rpm suggests a peak combustion cylinder pressure of approximately 4.0MPa. This pressure corresponds to a testing load of approximately 150N given the contact geometries of the specimens. The workingsdetailing the calculation of required force are included in theAppendices, section AI.
To achieve the secondary aim of the research; to investigate the speed of
reaction of the additives and to investigate the additives films tenacity, a series of
parametric tests were conducted on the additives, ensuring data resolution was givenin areas where it was deemed necessary. The following details the additivescreening test procedure developed as a result of parametric testing:
The machine was stabilised at the given running conditions prior to activation
of the data recorder. Once stabilised, the machine was lim for thirty minutes withlubricant feed supplied from sump 1 containing pure XHVI-4TM (Shell) base oil.Data captures were then taken at ten minute intervals. Without disruption to therunning of the machine, the lubricant supply was then switched to feed from sump 2,containing 2 wt% friction modifier in XHVI-4TM (Shell). Simultaneously datacapture resolution was increased to one per minute for a ten minute period. At thispoint the lubricant leaving the working area was pumped to waste for five minutes
before being reconnected to the feed sump. This was done to ensure cross
contamination of the feed sump was minimal. The data capture interval was thenreverted back to 10 minutes until the additive had been in the system for 1 hr. Atthis point the lubricant feed was switched back to that of sump 1, and data resolutionrefined to one data capture per minute for the next 10 minutes. After this period, and
still running on pure base oil, the data capture interval was set at 10 minutes until a
total test time of 2 hours 10 minutes had been reached.
69
Following the completion of a test, the machine was allowed to cool beforeisopropanol was flushed through the system for 1 minute. The machine was then runat the given conditions for a thirty minute period on pure XHVI-4TM (Shell), with
lubricant exiting the working area going to waste. Due to heavy contamination ofthe sump 2 feed line, this was changed prior to each test with a new additive.
3.3.2. Additive Package Formulation and Blending Test
Guided from the results of the preceding additive screening tests, a set of testswas conducted to investigate the effects of additive package formulation andblending. In the conventional sense, lubricant additive package formulation isconsidered to be the creation of an additive package which caters to all the
requirements of the lubricant specification, and would typically contain a variety of
chemicals each with a separate purpose and function. However, in this work, thespecification of the lubricant formulation is solely to provide the most effectivefriction modifier performance, and as such the additive package need only consist offriction modifier. This work pushes the boundary of additive package formulation asit conjects the hypothesis that an additive package should not only consist of a single
chemical whose purpose it is to reduce friction, for example, but may contain a
number of carefully selected chemicals chosen to perform together on the same task,each with an exceptional performance in the area in which they might act. Forexample, the combination of an additive with capability of reducing end-of-strokefriction with one which can reduce mid-stroke friction would lead to even lowerfriction operation.
A test was conducted to investigate the potential performance benefit of
blending high performance friction modifier additives in a formulation which gives aperformance in excess of that achievable through any of the constituent additives ontheir own. The test structure and operating conditions were the same as thosedescribed in section 3.3.1, Additive Screening Tests, the difference being that sumptwo contained a blend of additives rather than a single additive in XHVI-4TM(Shell).
3.3.3. Additive Concentration Tests
A set of tests was conducted to investigate the effects of additive concentrationon friction in the piston ring / cylinder liner contact. These tests were conductedusing Linoleic Acid as it is the only additive under investigation which is liquid atambient temperatures and facilitates easy and completely homogeneous blending.Concentrations of 0.25%, 0.5%, 1%, 2% and 4% Linoleic acid in XHVI-4TM(Shell)
were investigated. The test structure and conditions were as described in 3.3.1,whereby a baseline coefficient of friction was recorded for 30 minutes beforeadditive was introduced to the contact at a given concentration for 1 hour. After one
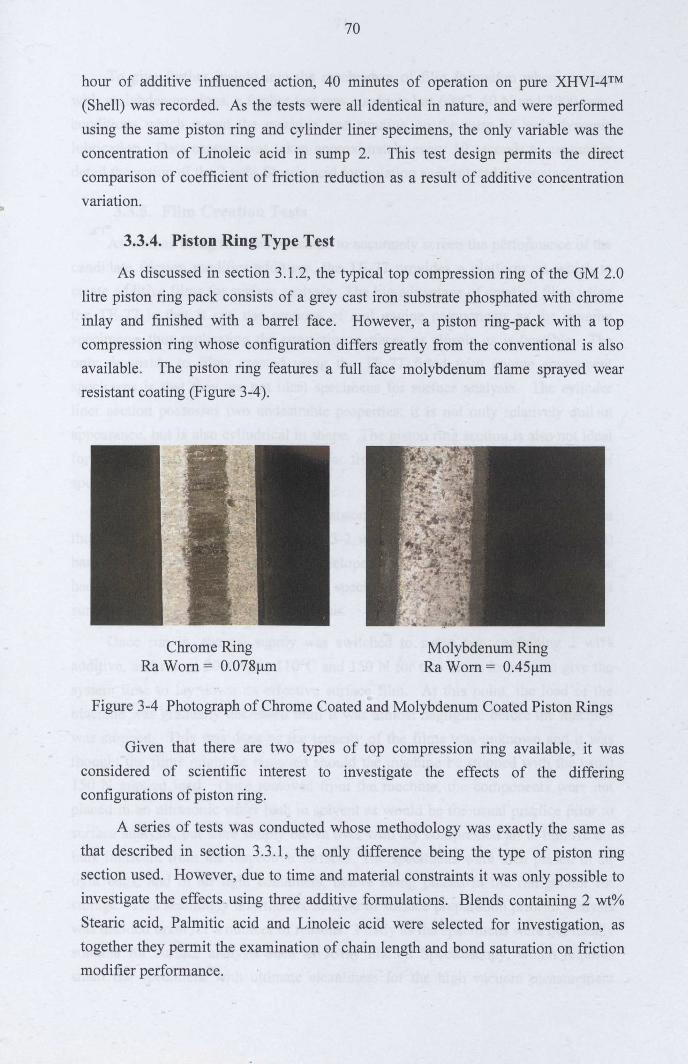
70
hour of additive influenced action, 40 minutes of operation on pure XHVI-4TM(Shell) was recorded. As the tests were all identical in nature, and were performedusing the same piston ring and cylinder liner specimens, the only variable was theconcentration of Linoleic acid in sump 2. This test design permits the directcomparison of coefficient of friction reduction as a result of additive concentrationvariation.
3.3.4. Piston Ring Type Test
As discussed in section 3.1.2, the typical top compression ring of the GM 2.0litre piston ring pack consists of a grey cast iron substrate phosphated with chromeinlay and finished with a barrel face. However, a piston ring-pack with a topcompression ring whose configuration differs greatly from the conventional is alsoavailable. The piston ring features a full face molybdenum flame sprayed wearresistant coating (Figure 3-4).
Chrome RingRa Worn = 0.0781-lm
Molybdenum RingRa Worn = 0.451-lm
Figure 3-4 Photograph of Chrome Coated and Molybdenum Coated Piston Rings
Given that there are two types of top compression ring available, it wasconsidered of scientific interest to investigate the effects of the differingconfigurations of piston ring.
A series of tests was conducted whose methodology was exactly the same asthat described in section 3.3.1, the only difference being the type of piston ringsection used. However, due to time and material constraints it was only possible toinvestigate the effects. using three additive formulations. Blends containing 2 wt%
Stearic acid, Palmitic acid and Linoleic acid were selected for investigation, astogether they permit the examination of chain length and bond saturation on frictionmodifier performance.
71
To give further insight into the mechanism of film formation when runningwith molybdenum rings, a further test was conducted at 60oe, 40 N and 2000 rpm,conditions which meant the machine was running on the cusp of hydrodynamiclubrication. Data capture was taken approximately every 10 seconds to capture indetail the action of the 2 wt% Stearic acid formulation as it entered the contact.
3.3.5. Film Creation Tests
As well as being the ideal machine to accurately screen the performance of thecandidate friction modifier additives, the TE- 77 provides a platform on which tocreate additive films for surface analysis. The big advantage of creating films using
the TE- 77 is that it can use sections of real engine components as the runningspecimens, thus replicating the contacting surfaces as closely as is possible. Theonly downside to films created using the TE-77 fitted with engine componentspecimens is that they are not ideal specimens for surface analysis. The cylinder
liner section possesses two undesirable properties; it is not only relatively dull inappearance, but is also cylindrical in shape. The piston ring section is also not idealfor surface analysis. Inherently it is far from being flat, a valuable property of
specimens for surface analysis.
The machine was fitted with new piston ring and cylinder liner specimens andthe run-in procedure detailed in Table 3-2 was conducted with XHVI-4TM (Shell)base lubricant. This procedure was developed to ensure a suitable running surface'
had been created on the cylinder liner specimen to permit both the formation of
surface films and their subsequent analysis.
Once run in, the oil supply was switched to sump two containing 2 wt%additive, and run at 2000 rpm, 1100e and 150 N for two hours in order to give thesystem time to lay down an effective surface film. At this point, the load of themachine was gradually decreased until it was almost negligible before the machinewas stopped. This was done as the tenacity of the films was unknown and it wasthought the films might be removed should the machine be stopped with the usual
150 N applied load. Once removed from the machine, the components were notplaced in an ultrasonic water bath in solvent as would be the usual practice prior tosurface analysis, but were simply blown over with dry compressed air to remove thebulk lubricant from the respective surfaces. The specimens were then placed in airtight bags, and in air tight containers, before being placed in the refrigerator forstorage. This seemingly unorthodox method of surface preparation prior to analysiswas decided upon for a number of reasons. Firstly as the specimens were not ideallysuitable for surface analysis such as X-ray Photon Spectroscopy, which requiressmall flat specimens with ultimate cleanliness for the high vacuum measurement
72
environment, it was decided that the specimens would be ideal candidates forFourier Transform Infrared (FTIR) microscopy, a surface analysis techniquepresented in more detail in section 3.5.1. This type of microscopy is non-intrusiveand is capable of showing areas on the surface where additive films form, be theychemically or physically adsorbed. As it was not known if the films manifestedthemselves in the physically adsorbed form, it was believed that vigorous cleaningmethods might remove them entirely from the surface. Simply blowing the surfaceswith dry compressed air seemed a reasonable method for removing excess lubricant,whilst leaving any surface films intact.
Tests were conducted using three formulations, Linoleic Acid, Erucylamideand a blend of the two. The test involving Linoleic acid was repeated with a
molybdenum coated piston ring instead of a chrome coated section.
3.4. Test Lubricant Formulations
In order to truly simulate the conditions at the top ring zone of a firing engine,it is essential that the lubricant found in this area be mimicked as closely as possible.It is was shown in Chapter 2 that a great deal of fuel dilution is present in the top
ring zone lubricant, a fact which underlies the potential success of gasolinecontaining friction modifier. It is hypothesised that the repeated firing of the fuelinjector would continually supply fresh friction modifier to the top ring zone, whereit mixes with the cylinder liner lubricant and reacts with the cylinder liner and pistonring surfaces. Ideally, bench-top tribometer tests would have been conducted ongasoline doped lubricant samples, but this was not feasible as it is extremely
dangerous to interject volatile substances such as gasoline into contacts withelevated temperatures. Even if the test temperature was lowered, local contacttemperatures could have reached a high enough level to cause ignition. However, itis not acceptable to simply ignore the presence of fuel in the lubricant sample, as itserves to reduce the bulk viscosity of the lubricant, thus changing the contactmechanics. It was for this reason that XHVI-4TM (Shell) was selected as the bulk
lubricant for this investigation. This is a low viscosity base lubricant, and may beconsidered to act like a typical SAE 5W-30 engine lubricant with approximately
30% fuel dilution. This figure was based on a calculation using the blending lawpresented by Prausnitz as detailed below (Reid, Prausnitz et al. 1977).
(Equation 3.1)
It was decided to dope the lubricant with 2 wt% friction modifier additive in
each blend. This high treat level was selected for the following reasons:
73
The friction modifiers under investigation were selected for their ability toform films on metal surfaces with which they come into contact. If a lowconcentration of additive were used in the tests, it is conceivable that all additivemight react on metal surfaces other than those of the contact under investigation.This would not be a problem in the engine environment as the repeated firing of the
injector would constantly administer new additive to the surface. In addition,preliminary investigation revealed that some of the additives which are solid at roomtemperature can partially fall out of suspension once blended in base oil, thus havinga suitably high concentration of additive ensured the contact remained saturated withadditive throughout the test. The blending procedure for additives which are solid at
room temperature involved heating the solution of base oil and additive to a
temperature in excess of that of the additive melting point whilst continually stirringthe mixture.
3.5. Post Test Specimen Analysis
On completion of the film creation tests, section 3.3.5, the cylinder liner and
piston ring specimens were blown over with dry compressed air and stored in air
tight bags in a refrigerator prior to surface analysis.
3.5.1. Fourier Transform InfraRed Microscopy (FTIR)
When exposed to an infrared beam, chemical bonds absorb infrared energy atspecific frequencies (or wavelengths). The spectral locations of the infrared
absorptions can be used to ascertain information regarding the chemical compounds
within a molecule. During microscopy mode, a beam of infrared is focused on areflective specimen, where the surface film of the specimen absorbs a portion of theenergy. The energy reflected by the specimen is then recorded by a sensitivedetector capable of detailing the wave numbers at which specific absorptionsoccurred. The infrared energy is low compared to optical, and for example X-ray,
frequencies and hence the penetration of the beam is such that only the first few
microns of the specimen surface are analysed by the machine, making the techniqueideal for looking at thin organic surface films (O'Connor, Sexton et al. 2003).
As discussed earlier, the dull cylindrical nature of the cylinder liner specimensand the highly curved nature of the piston ring surfaces make them far from ideal forsurface analysis, however, FTIR analysis of the surfaces was conducted on the
specimens both on and away from the worn area. Measurements were conducted at
the centre of the wear track area on both piston ring and liner specimens. The FTIRanalysis was conducted by the author at the University of Leeds using a NicoletFTIR Microscope with a relatively large 500 micron square spot size. 60 scans of
74
the surface were taken at a given point from which an average was taken, thusfiltering out any noise and sharpening the peak definition.
In addition to the FTIR analyses conducted at the University of Leeds, a set ofspecimens was selected for in-depth FTIR analysis which took place at Perkin Elmer(UK). In this case analysis was conducted using a Spotlight 200 series FTIRautomated microscope spectrometer system, which was set to perform scans along aline which encapsulated data from both the worn and unworn regions. The spatialresolution of the system was set at 100 microns, with a spectral resolution of 8 cm",
and spot size of 1001lm2• 25 scans were conducted at each site and were used tocreate an average.
3.6. Reciprocator Results Analysis
3.6.1. Additive Screening Tests Results Analysis
Figure 3-5 displays the coefficient of friction results from the additivescreening tests. On inspection of Figure 3-5 it is immediately apparent that theadditives perform in a number of different ways. Repeatability tests conductedrevealed the screening tests were highly repeatable, allowing the tests to be analysed
to a high degree of resolution. The accuracy of the tests was revealed to be high
enough to give significant meaning to the finest detail of the characteristic shapesassociated with different additives action. A calculation based on repeatability testssuggests the error associated with repeatability of the tests is 2%.
In each test it is clear where the oil supply was switched to one containingfriction modifier additive, as there is an appreciable drop in measured coefficient offriction. The resolution of the data capture at this point, and for the proceeding tenminutes, is such that the shape of the curve at this point gives a good indication as tothe development of the additive film. After this period, where the samplingresolution returns to 1 data capture every ten minutes, knowledge can be gainedregarding the stability and time related formation of films. At the 90 minute mark,where the oil supply was switched back to that of pure XHVI-4TM (Shell), the
sampling resolution returns to 1 per minute for the proceeding 10 minutes, allowinginformation to be gained regarding the removal of the formed film, or conversely the
tenacity.
It is clear that the performance of the Acid additives is similar; all acidadditives exhibiting a relatively slow formation stabilising after approximately 10minutes. The formation curve associated with the Linoleic acid suggests filmformation takes longer than with saturated acid molecules, but allows the contact to
75
have lower friction operation. The removal of acid films appears to be rapid in allcases, with a return to near the baseline coefficient of friction in a matter of minutes.Again the polyunsaturated molecule, Linoleic acid, differentiates itself from thesaturated molecules with a visible spike in coefficient of friction once fresh additive
was removed from the contact. After this spike there is notable instability in thecoefficient of friction value.
All amide additives appear to perform similarly. Their characteristictransitions are almost the exact mirror image of that of .the acid molecules. Theirformation on the surface is extremely rapid taking approximately one minute to form
what appears to be a stable film. As is the case with the acid tests, the unsaturatedmolecule differentiates itself from the performance of the saturated molecules withan extended additive film formation period, leading to ultimately lower frictionoperation. On switching from additive doped lubricant to running on pure XHVI-4™ (Shell) the additive films are removed more slowly than they formed, and aswith the acid films, the coefficient of friction does not quite return to that of the
original baseline.
The performance of Tristearin and the Acetic Acid Alkyl Esters are similarwith both additives showing poor frictional performance but appear to form quitetenacious films which are not easily removed simply by reverting to pure XHVI-4TM(Shell) lubrication.
Figure 3-6 details the performance of the additives based on a calculationconsidering the reduction of coefficient of friction between the measurement at 30
minutes, and that taken at 90 minutes. Looking at the fatty acid additiveperformance, it is clear that the unsaturated molecule, Linoleic acid, performs betterthan the saturated molecules with a 53% reduction in coefficient of friction.
Typically the performance of the amides was poor when compared with that ofthe acid group with the exception of the unsaturated variant Erucylamide, whosemaximum reduction in coefficient of friction was 48%. When looking at the
response of Stearamide and Behenamide it appears Behenamide performs mostcompetently at reducing friction, reducing the coefficient of friction by 36% asopposed to 30%.
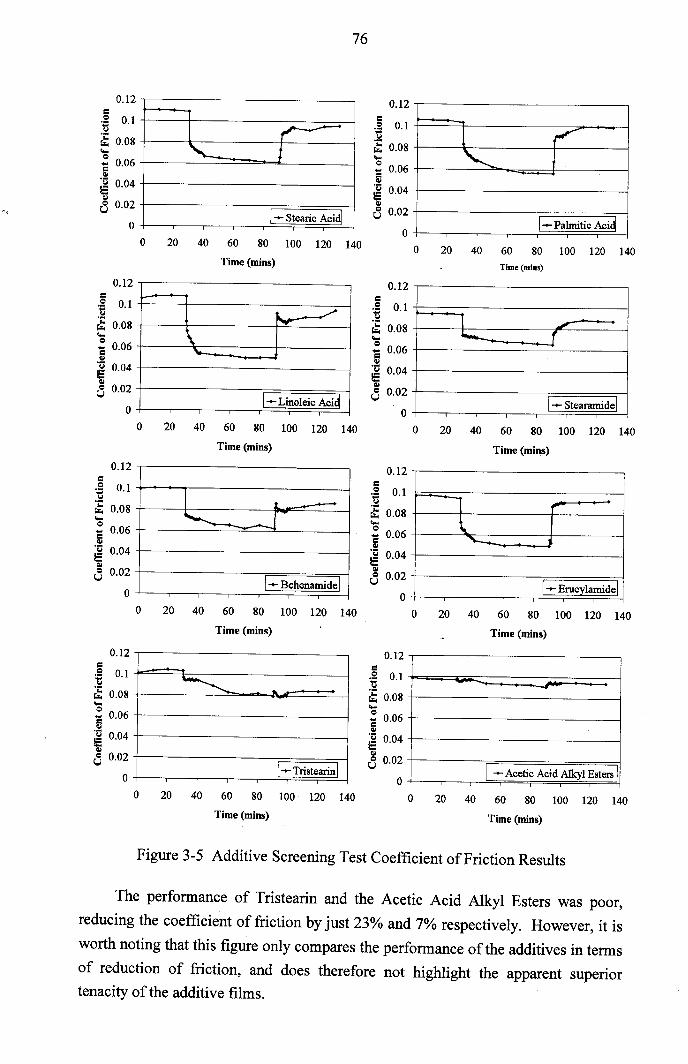
=~ 0.1
~ 0.08...ei 0.06
~ 0.04..8 0.02
oo
=~ 0.1
~ 0.08...ei 0.06
~ 0.04..8 0.02
o
=.€ 0.1
~ 0.08...o= 0.06..~ 0.04..8 0.02
o
=~ 0.1
~ 0.08...ei 0.06
~ 0.04..8 0.02
o
0.12I
1 r ....t
I .....Stearic Aci~
76
=.S 0.1tl~ 0.08...:: 0.066i~ 0.04..8 0.02
o
=~ 0.1
~ 0.08...ei 0.06
~0.D4..8 0.02
o
=~ 0.1
~ 0.08...ei 0.06
~ 0.04..8 0.02
o
=~ 0.1
~ 0.08...e= 0.06..~ 0.04..8 0.02
o
0.12
1
"1-Palmitic Aci~
20 40 60 80 100 120 140 o 20 40 60 80 100 120 140Time (mins)
0.12
I~~
\~
I ..... Linoleic Aci~
Time (mins)
0.12
I .".'-- 1
I .....Stearamidel
o 20 40 60 80 100 120 140
Time (mins)
0.12
I t -'--- J
I .....Behenamidel
o 20 40 60 80 100 120 140
Time (mins)
0.12
1L'--
I.....Erucylamidel
o 20 40 60 80 100 120 140
Time (mins)
0.12
+-;to.
1-Tristearinl
o 20 40 60 80 100 120 140
Time (mins)
0.12
....
I .....Acetic Acid Alkyl Esters Io w ~ ~ ~ 100 UO 1~
Time (mins)o 20 40 60 80 100 120 140
Time (mins)
Figure 3-5 Additive Screening Test Coefficient of Friction Results
The performance of Tristearin and the Acetic Acid Alkyl Esters was poor,reducing the coefficient of friction by just 23% and 7% respectively. However, it is
worth noting that this figure only compares the performance of the additives in termsof reduction of friction, and does therefore not highlight the apparent superiortenacity of the additive films.
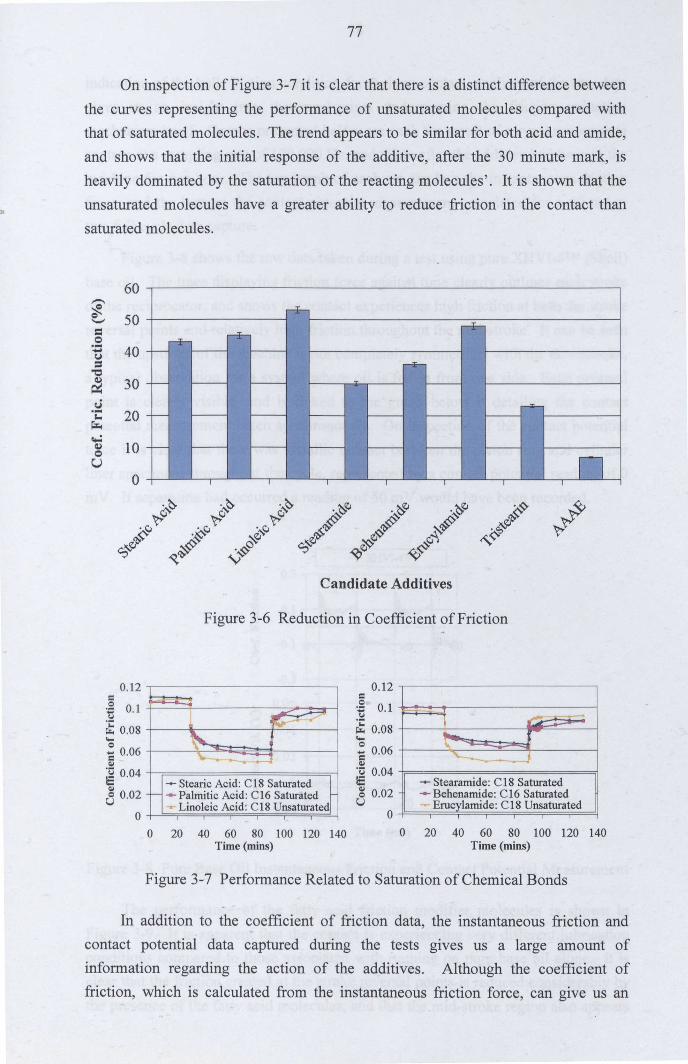
77
On inspection of Figure 3-7 it is clear that there is a distinct difference betweenthe curves representing the performance of unsaturated molecules compared withthat of saturated molecules. The trend appears to be similar for both acid and amide,and shows that the initial response of the additive, after the 30 minute mark, isheavily dominated by the saturation of the reacting molecules'. It is shown that theunsaturated molecules have a greater ability to reduce friction in the contact thansaturated molecules.
Candidate Additives
Figure 3-6 Reduction in Coefficient of Friction
0.12
r;:::::-~ ,"\.-.._ -;-:;
......Stearic Acid: C18 SaturatedI- -- Palmitic Acid: C16 Saturated
.....Linoleic Acid: C18 Unsaturated
=;§ 0.1tj
~ 0.08....eii 0.06~ 0.04Qlc5 0.02
o
0.12
- -"--
..__ -- -......Stearamide: C18 Saturated-- Behenarnide: C16 Saturated~ Erucylarnide: C18 Unsaturated
=;§ 0.1<oJ
~ 0.08....eC 0.06Ql
.~ 0.04IE~ 0.02u
oo
20 40 60 80 100 120 140 0Time (mins)
20 40 60 80 100 120 140Time (mins)
Figure 3-7 Performance Related to Saturation of Chemical Bonds
In addition to the coefficient of friction data, the instantaneous friction andcontact potential data captured during the tests gives us a large amount ofinformation regarding the action of the additives. Although the coefficient offriction, which is calculated from the instantaneous friction force, can give us an
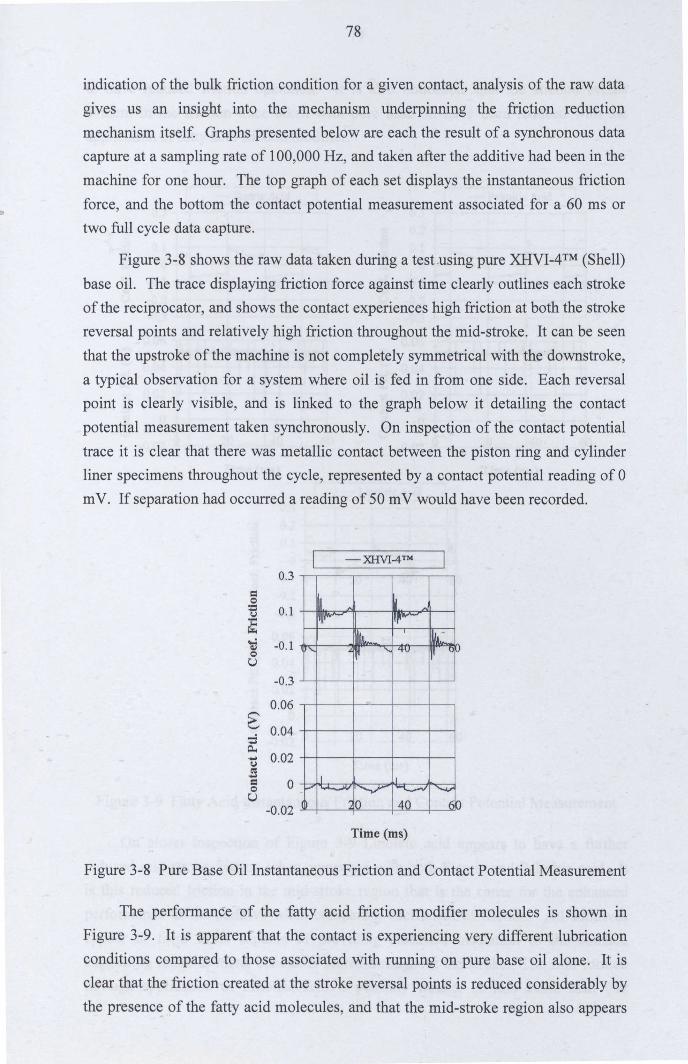
78
indication of the bulk friction condition for a given contact, analysis of the raw data
gives us an insight into the mechanism underpinning the friction reductionmechanism itself. Graphs presented below are each the result of a synchronous datacapture at a sampling rate of 100,000 Hz, and taken after the additive had been in the
machine for one hour. The top graph of each set displays the instantaneous frictionforce, and the bottom the contact potential measurement associated for a 60 ms ortwo full cycle data capture.
Figure 3-8 shows the raw data taken during a test.using pure XHVI-4TM(Shell)
base oil. The trace displaying friction force against time clearly outlines each strokeof the reciprocator, and shows the contact experiences high friction at both the strokereversal points and relatively high friction throughout the mid-stroke. It can be seen
that the upstroke of the machine is not completely symmetrical with the downstroke,a typical observation for a system where oil is fed in from one side. Each reversalpoint is clearly visible, and is linked to the graph below it detailing the contactpotential measurement taken synchronously. On inspection of the contact potential
trace it is clear that there was metallic contact between the piston ring and cylinderliner specimens throughout the cycle, represented by a contact potential reading of 0mV. If separation had occurred a reading of 50 mV would have been recorded.
-XHVI_4™
0.3
=0;:J 0.1c.J1:r;...... -0.1II.>0U
-0.3
0.06
~ 0.04;i0..... 0.02fj.s= 00U
-0.02
b M.~il"""' I'~OV-
~~ L~ '- <tv I' vU
_I .1.1-"'" ~ ~ . ..,___...,., ...........
':0 40 6b
Time (ms)
Figure 3-8 Pure Base Oil Instantaneous Friction and Contact Potential Measurement
The performance of the fatty acid friction modifier molecules is shown inFigure 3-9. It is apparent that the contact is experiencing very different lubricationconditions compared to those associated with running on pure base oil alone. It isclear that the friction created at the stroke reversal points is reduced considerably bythe presence of the fatty acid molecules, and that the mid-stroke region also appears
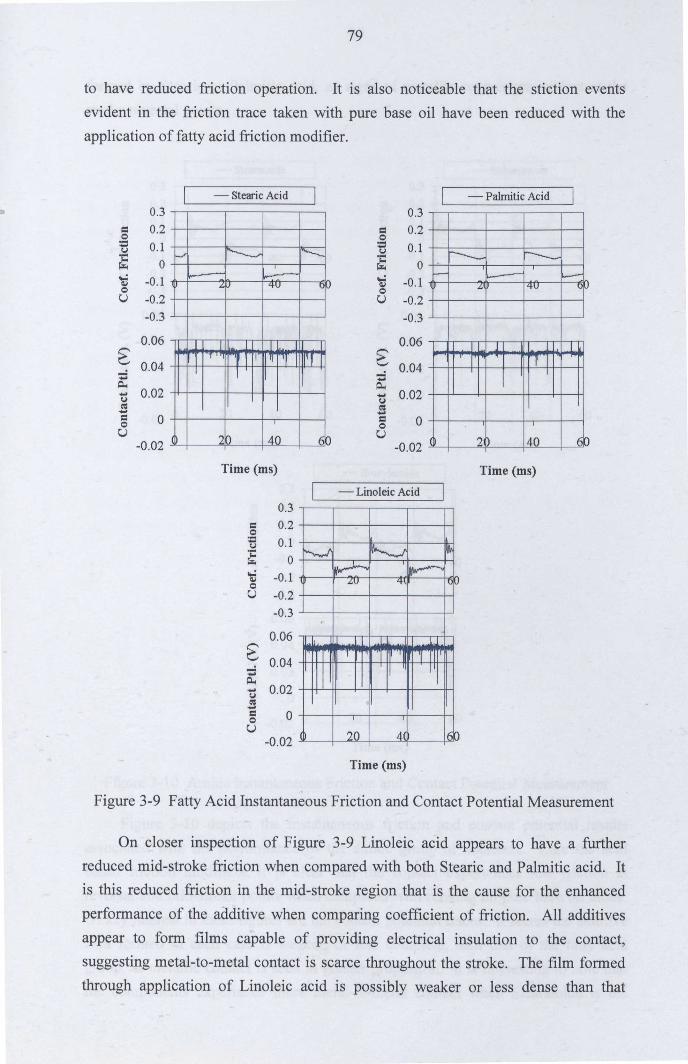
79
to have reduced friction operation. It is also noticeable that the stiction eventsevident in the friction trace taken with pure base oil have been reduced with theapplication of fatty acid friction modifier.
- Stearic Acid0.3
= 0.20;I 0.1(oJ
'C 0r;:......: -0.1Cl)
0U -0.2
-0.30.06
~ 0.04;~... 0.02(oJ~...:= 00u
-0.02
t-' r---- ".....__,~ ~'<1-' <tv ('IJ
1 L .1 I J 1'r 'r I [I II _'l I'llI [
'Jb 40 6bTime (ms)
0.3= 0.20;I 0.1(oJ·c 0r;:......: -0.1Cl)
0U -0.2
-0.30.06
~ 0.04...~..... 0.02u~.....:= 00U
-0.02
Time (ms)
- Palmitic Acid0.3
= 0.20;I 0.1.::... 0r;:......: -0.1Cl)
0U -0.2
-0.30.06
~ 0.04;~... 0.02uS:= 00U
-0.02
- Linoleic Acid
r---- r--.-t-- ~ [I--
,t, I<tv <I-'
I 1. 1 1J 11,
2D 40 _f0
h--! ~ ~i~ ~
.:;V 4\ fJ
0'
J ,1I , 'II 'I II'
I
20 4 60
Time (ms)
Figure 3-9 Fatty Acid Instantaneous Friction and Contact Potential Measurement
On closer inspection of Figure 3-9 Linoleic acid appears to have a furtherreduced mid-stroke friction when compared with both Stearic and Palmitic acid. Itis this reduced friction in the mid-stroke region that is the cause for the enhanced
performance of the additive when comparing coefficient of friction. All additivesappear to form films capable of providing electrical insulation to the contact,suggesting metal-to-metal contact is scarce throughout the stroke. The film formedthrough application of Linoleic acid is possibly weaker or less dense than that
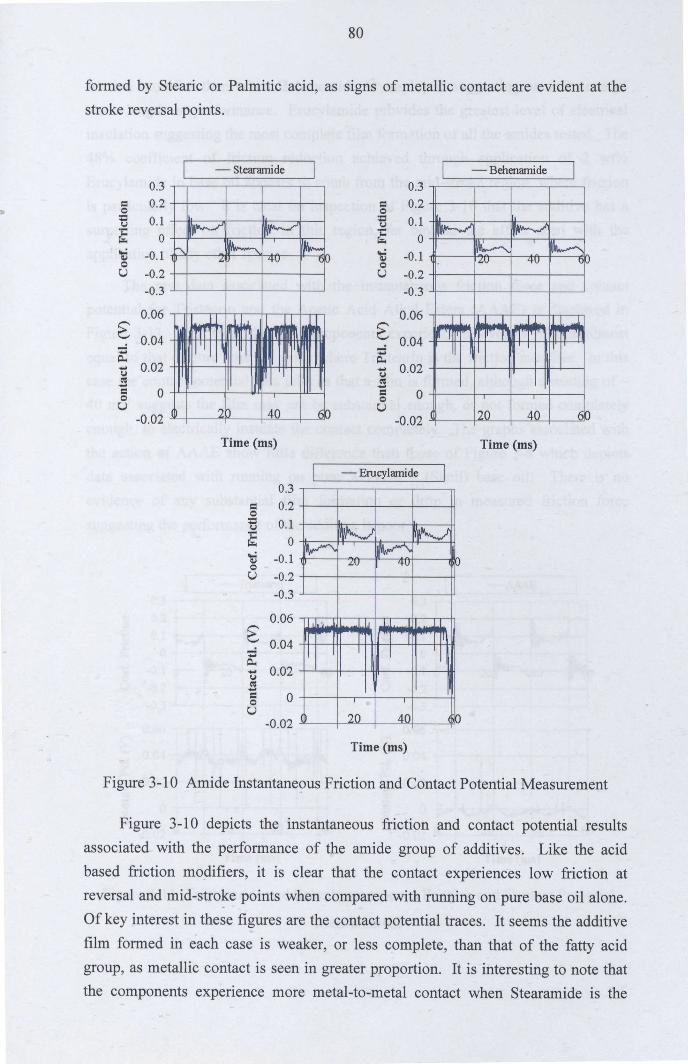
80
formed by Stearic or Palmitic acid, as signs of metallic contact are evident at thestroke reversal points.
- Steararnide0.3
Cl 0.20
== 0.1'-I·c 0~....: -0.1~0U -0.2
-0.3
0.06
~ 0.04-...~... 0.02'-I~...Cl 00u
-0.02
~ ~b ~ ~~,I. <tv
...L~ 11\mf '!J1
11'1 I
"b 40 cb
Time (ms)
0.3Cl 0.20
== 0.1.~... 0~et -0.10U -0.2
-0.3
0.06
~ 0.04~~... 0.02!j
~Cl 00u
-0.02
- Behenamide0.3
Cl 0.20
== 0.1'-I;::
0~et -0.10U -0.2
-0.3
0.06
~ 0.04-...~... 0.02!j
~Cl 00u
-0.02
~ ~~ ~r.<.v <tv l'~
M~~I~.....I.. .....I..i
~ rlrr I "1 I'II II I II
120 40 60Time (ms)
- Erucylamide
~ ~~ ~
.<.v <tv ~
" l.i .1 .1 1I T r .[
I I
( 20 40 0
Time (ms)
Figure 3-10 Amide Instantaneous Friction and Contact Potential Measurement
Figure 3-10 depicts the instantaneous friction and contact potential resultsassociated with the performance of the amide group of additives. Like the acidbased friction modifiers, it is clear that the contact experiences low friction atreversal and mid-stroke points when compared with running on pure base oil alone.Of key interest in these figures are the contact potential traces. It seems the additive
film formed in each case is weaker, or less complete, than that of the fatty acidgroup, as metallic contact is seen in greater proportion. It is interesting to note thatthe components experience more metal-to-metal contact when Stearamide is the
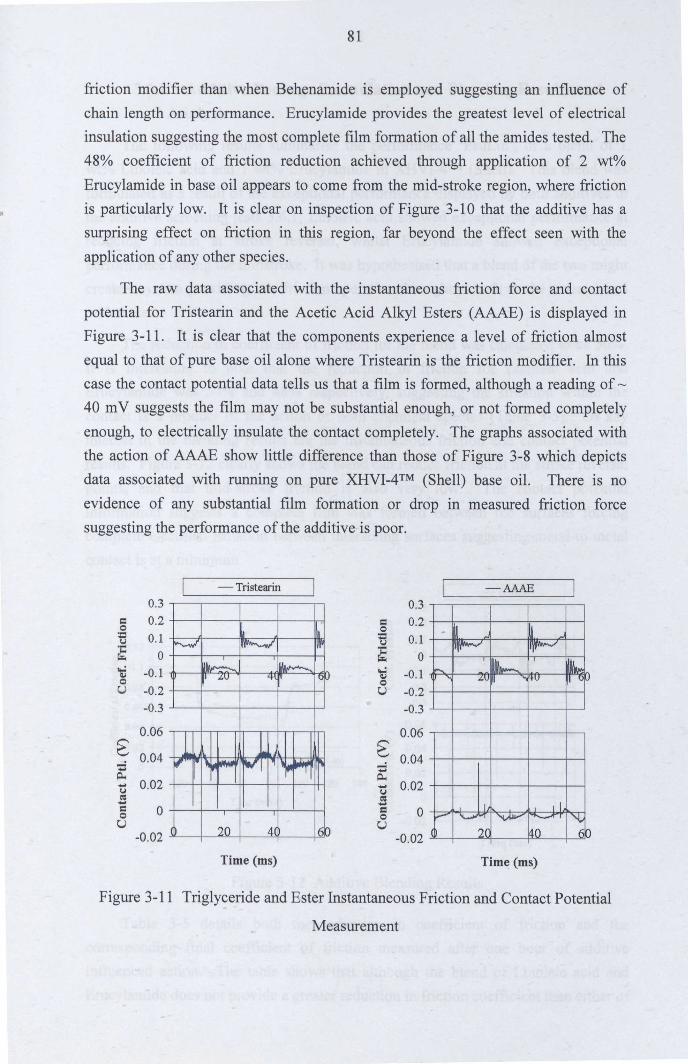
81
friction modifier than when Behenamide is employed suggesting an influence ofchain length on performance. Erucylamide provides the greatest level of electrical
insulation suggesting the most complete film formation of all the amides tested. The48% coefficient of friction reduction achieved through application of 2 wt%
Erucylamide in base oil appears to come from the mid-stroke region, where frictionis particularly low. It is clear on inspection of Figure 3-10 that the additive has asurprising effect on friction in this region, far beyond the effect seen with the
application of any other species.
The raw data associated with the instantaneous friction force and contactpotential for Tristearin and the Acetic Acid Alkyl Esters (AAAE) is displayed inFigure 3-11. It is clear that the components experience a level of friction almostequal to that of pure base oil alone where Tristearin is the friction modifier. In thiscase the contact potential data tells us that a film is formed, although a reading of ~
40 mV suggests the film may not be substantial enough, or not formed completelyenough, to electrically insulate the contact completely. The graphs associated withthe action of AAAE show little difference than those of Figure 3-8 which depictsdata associated with running on pure XHVI-4TM (Shell) base oil. There is no
evidence of any substantial film formation or drop in measured friction forcesuggesting the performance of the additive is poor.
- Tristearin0.3
= 0.20:Q 0.1.~...
0r;.;.
et -0.10U -0.2
-0.3
0.06
~ 0.04::~... 0.02u('is...= 00U
-0.02
II lA~ I~ I~!
~ ~,t.v '+\1' Icv
1./" [-
.,,,~~
( 20 41 lEO
Time (ms)
-AAAE0.3
= 0.20:Q 0.1u
~ 0
et -0.10U -0.2
-0.3
0.06
~ 0.04::~.... 0.02uS= 00u
-0.02
" U~,~ I~
..... I~ ~,t.vl1 rv II <Jr-'
1 _LLr- ..._.. ~ .._ "J,.,( 2C 40 6b
Time (ms)
Figure 3-11 Triglyceride and Ester Instantaneous Friction and Contact Potential
Measurement
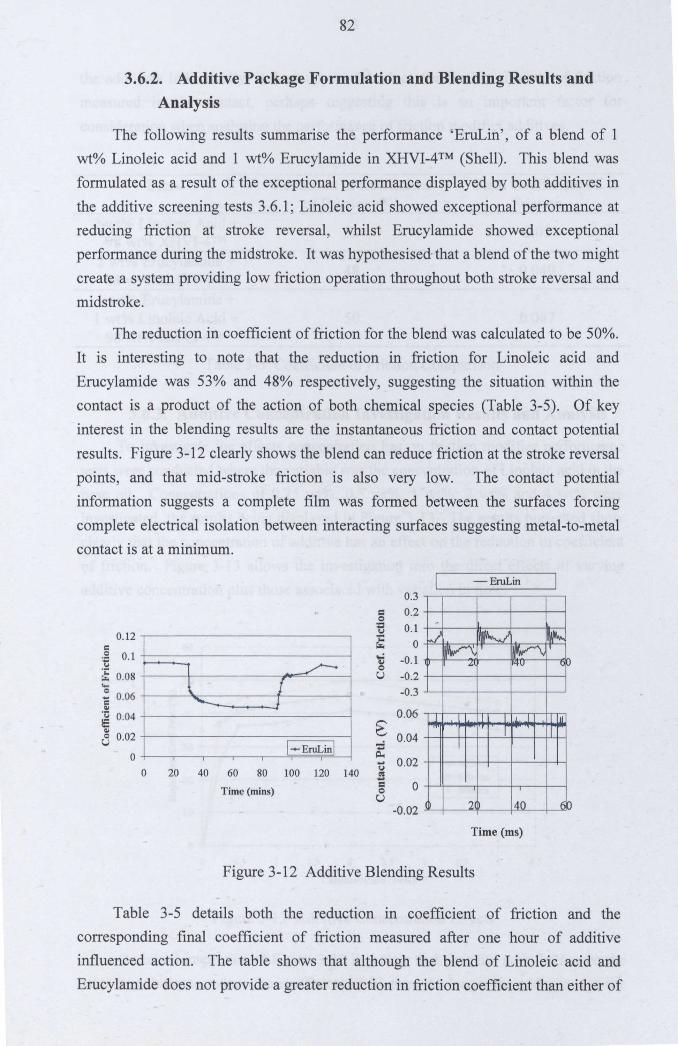
82
3.6.2. Additive Package Formulation and Blending Results andAnalysis
The following results summarise the performance 'EruLin', of a blend of 1wt% Linoleic acid and 1 wt% Erucylamide in XHVI-4TM (Shell). This blend wasformulated as a result of the exceptional performance displayed by both additives in
the additive screening tests 3.6.1; Linoleic acid showed exceptional performance atreducing friction at stroke reversal, whilst Erucylamide showed exceptionalperformance during the midstroke. It was hypothesised' that a blend of the two mightcreate a system providing low friction operation throughout both stroke reversal and
midstroke.
The reduction in coefficient of friction for the blend was calculated to be 50%.
It is interesting to note that the reduction in friction for Linoleic acid andErucylamide was 53% and 48% respectively, suggesting the situation within thecontact is a product of the action of both chemical species (Table 3-5). Of keyinterest in the blending results are the instantaneous friction and contact potential
results. Figure 3-12 clearly shows the blend can reduce friction at the stroke reversalpoints, and that mid-stroke friction is also very low. The contact potential
information suggests a complete film was formed between the surfaces forcingcomplete electrical isolation between interacting surfaces suggesting metal-to-metalcontact is at a minimum.
0.12
~1l f....._
J
I--EruLinl
c.!: 0.1t:i~ 0.08....QC 0.06'"~ 0.04
'"a 0.02
oo 20 40 60 80 100 120 140
Time (mins)
-EruLin0.3
Cl 0.20:c 0.1u
~ 0~ -0.10U -0.2
-0.3
0.06
~ 0.04.:~.... 0.02u('is....= 00o
-0.02
"
J ~ I~V\ I~
.4\ t<tv V
r r rI
21 140 6b
Time (ms)
Figure 3-12 Additive Blending Results
Table 3-5 details both the reduction in coefficient of friction and thecorresponding final coefficient of friction measured after one hour of additiveinfluenced action. The table shows that although the blend of Linoleic acid andErucylamide does not provide a greater reduction in friction coefficient than either of
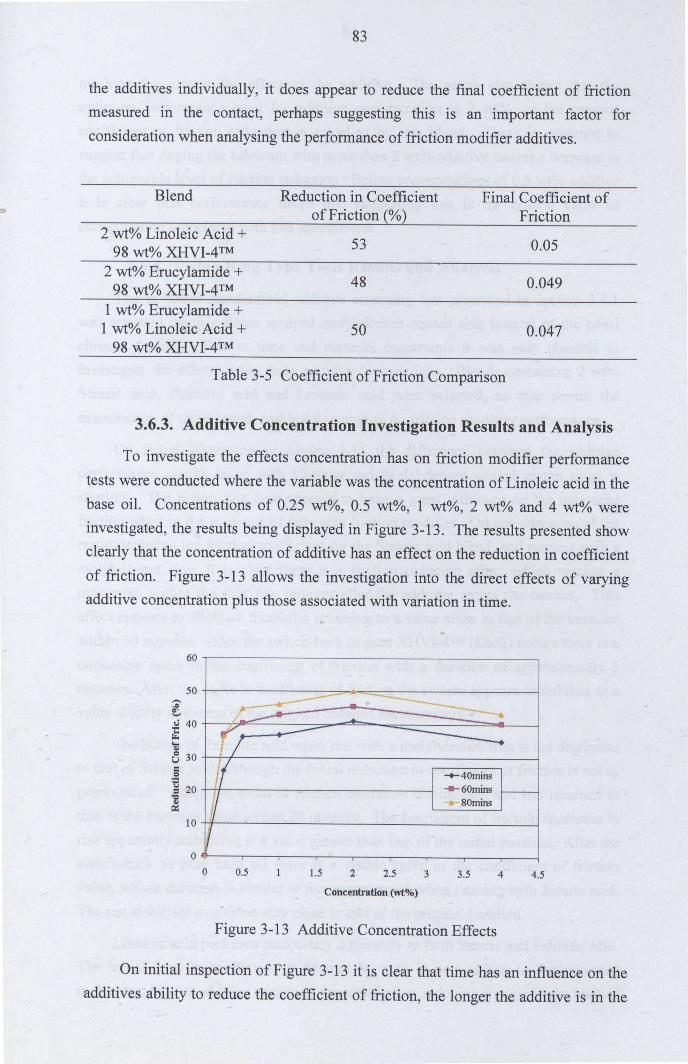
83
the additives individually, it does appear to reduce the final coefficient of frictionmeasured in the contact, perhaps suggesting this is an important factor for
consideration when analysing the performance of friction modifier additives.
Blend Reduction in Coefficient Final Coefficient of'" of Friction (%) Friction
2 wt% Linoleic Acid +53 0.0598 wt% XHVI-4TM
2 wt% Erucylamide +48 0.04998 wt% XHVI-4TM
1wt% Erucylamide +1 wt% Linoleic Acid + 50 0.04798 wt% XHVI-4TM
Table 3-5 Coefficient of Friction Comparison
3.6.3. Additive Concentration Investigation Results and Analysis
To investigate the effects concentration has on friction modifier performance
tests were conducted where the variable was the concentration of Linoleic acid in thebase oil. Concentrations of 0.25 wt%, 0.5 wt%, 1 wt%, 2 wt% and 4 wt% wereinvestigated, the results being displayed in Figure 3-13. The results presented show
clearly that the concentration of additive has an effect on the reduction in coefficientof friction. Figure 3-13 allows the investigation into the direct effects of varyingadditive concentration plus those associated with variation in time.
60
--- ----__-- -r:::-- - -~......
(/ -- ---- ....I( -+-40mins
---60mins i----i r 80mins
If
50
I'-'.::l 40~...8 30
is~ 20
~10
oo 0.5 1.5 2 2.5 3 3.5 4 4.5
Concentration (wt%)
Figure 3-13 Additive Concentration Effects
On initial inspection of Figure 3-13 it is clear that time has an influence on theadditives ability to reduce the coefficient of friction, the longer the additive is in the
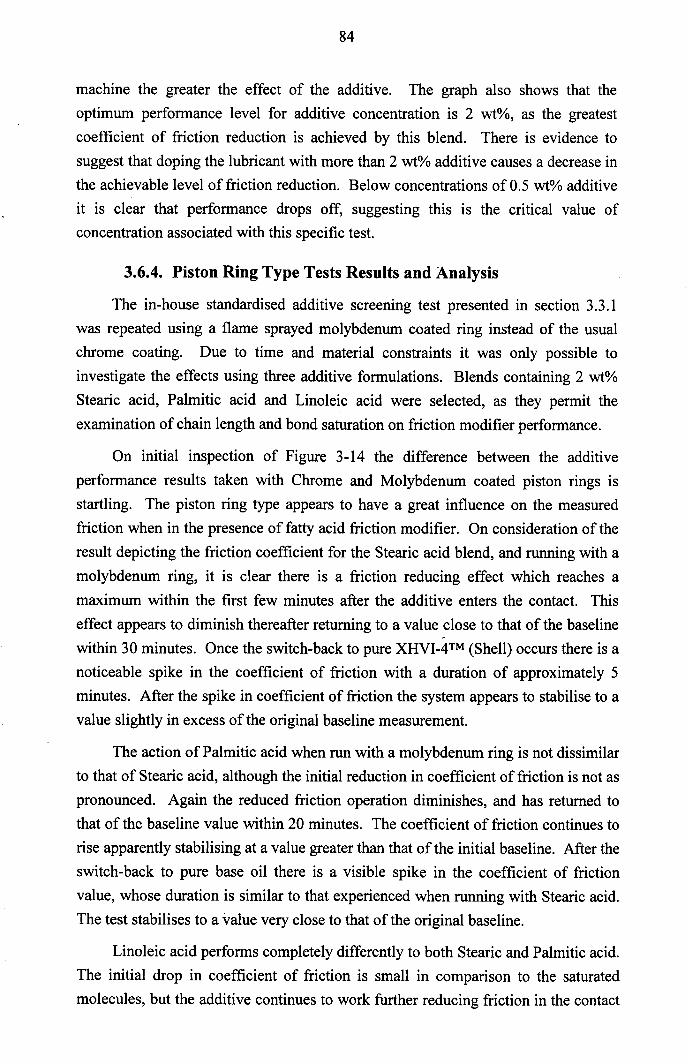
84
machine the greater the effect of the additive. The graph also shows that theoptimum performance level for additive concentration is 2 wt%, as the greatestcoefficient of friction reduction is achieved by this blend. There is evidence tosuggest that doping the lubricant with more than 2 wt% additive causes a decrease inthe achievable level of friction reduction. Below concentrations of 0.5 wt% additiveit is clear that performance drops off, suggesting this is the critical value ofconcentration associated with this specific test.
3.6.4. Piston Ring Type Tests Results and Analysis
The in-house standardised additive screening test presented in section 3.3.1was repeated using a flame sprayed molybdenum coated ring instead of the usualchrome coating. Due to time and material constraints it was only possible toinvestigate the effects using three additive formulations. Blends containing 2 wt%Stearic acid, Palmitic acid and Linoleic acid were selected, as they permit the
examination of chain length and bond saturation on friction modifier performance.
On initial inspection of Figure 3-14 the difference between the additiveperformance results taken with Chrome and Molybdenum coated piston rings isstartling. The piston ring type appears to have a great influence on the measuredfriction when in the presence of fatty acid friction modifier. On consideration of theresult depicting the friction coefficient for the Stearic acid blend, and running with amolybdenum ring, it is clear there is a friction reducing effect which reaches a
maximum within the first few minutes after the additive enters the contact. Thiseffect appears to diminish thereafter returning to a value close to that of the baseline
""
within 30 minutes. Once the switch-back to pure XHVI-4TM (Shell) occurs there is anoticeable spike in the coefficient of friction with a duration of approximately 5minutes. After the spike in coefficient of friction the system appears to stabilise to avalue slightly in excess of the original baseline measurement.
The action of Palmitic acid when run with a molybdenum ring is not dissimilarto that of Stearic acid, although the initial reduction in coefficient of friction is not aspronounced. Again the reduced friction operation diminishes, and has returned tothat of the baseline value within 20 minutes. The coefficient of friction continues torise apparently stabilising at a value greater than that of the initial baseline. After theswitch-back to pure base oil there is a visible spike in the coefficient of friction
value, whose duration is similar to that experienced when running with Stearic acid.The test stabilises to a value very close to that of the original baseline.
Linoleic acid performs completely differently to both Stearic and Palmitic acid.The initial drop in coefficient of friction is small in comparison to the saturatedmolecules, but the additive continues to work further reducing friction in the contact
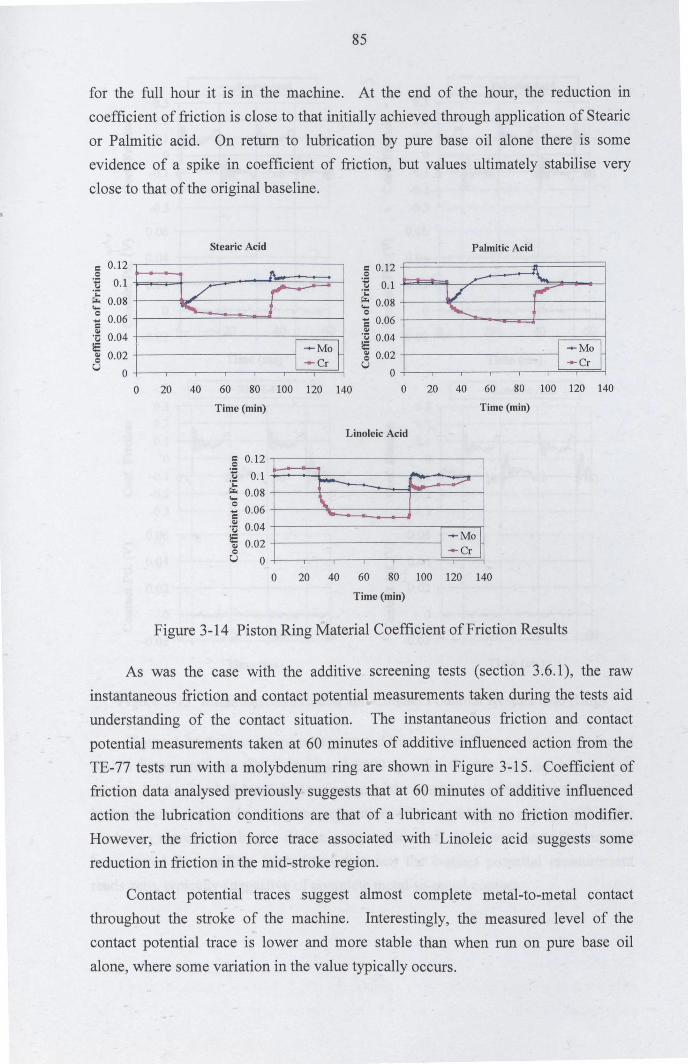
85
for the full hour it is in the machine. At the end of the hour, the reduction incoefficient of friction is close to that initially achieved through application of Stearicor Palmitic acid. On return to lubrication by pure base oil alone there is someevidence of a spike in coefficient of friction, but values ultimately stabilise very
close to that of the original baseline.
Stearic Acid Palmitic Acid
=: 0.12et 0.1.;:r.. 0.08'-~ 0.06=:.~ 0.04E~ 0,02U 0
~
1/ r.....
<, i
I --Mo ~I -er
§ 0.12] 0.1
~ 0.08e-= 0.06QI'13004E .~ 0.02U
-1\,_»:
1/ 7'--- +
I --Mo ~I ...... er
oo 20 40 60 80 100 120 140
Time (min)
o 20 40 60 80 100 120 140
Time (min)
Linoleic Acid
§ 0.12
:~ 0.1loo
~ 0.08e-= 0.06,~ 0.04EQI 0.02oU 0
r-- ~ ..:;:::;:-"--\.I +-MoI ...... er
o 20 40 60 80 100 120 140
Time (min)
Figure 3-14 Piston Ring Material Coefficient of Friction Results
As was the case with the additive screening tests (section 3.6.1), the raw
instantaneous friction and contact potential measurements taken during the tests aidunderstanding of the contact situation. The instantaneous friction and contactpotential measurements taken at 60 minutes of additive influenced action from theTE-77 tests run with a molybdenum ring are shown in Figure 3-15. Coefficient offriction data analysed previously suggests that at 60 minutes of additive influencedaction the lubrication conditions are that of a lubricant with no friction modifier.However, the friction force trace associated with Linoleic acid suggests somereduction in friction in the mid-stroke region.
Contact potential traces suggest almost complete metal-to-metal contactthroughout the stroke of the machine. Interestingly, the measured level of thecontact potential trace is lower and more stable than when run on pure base oil
alone, where some variation in the value typically occurs.
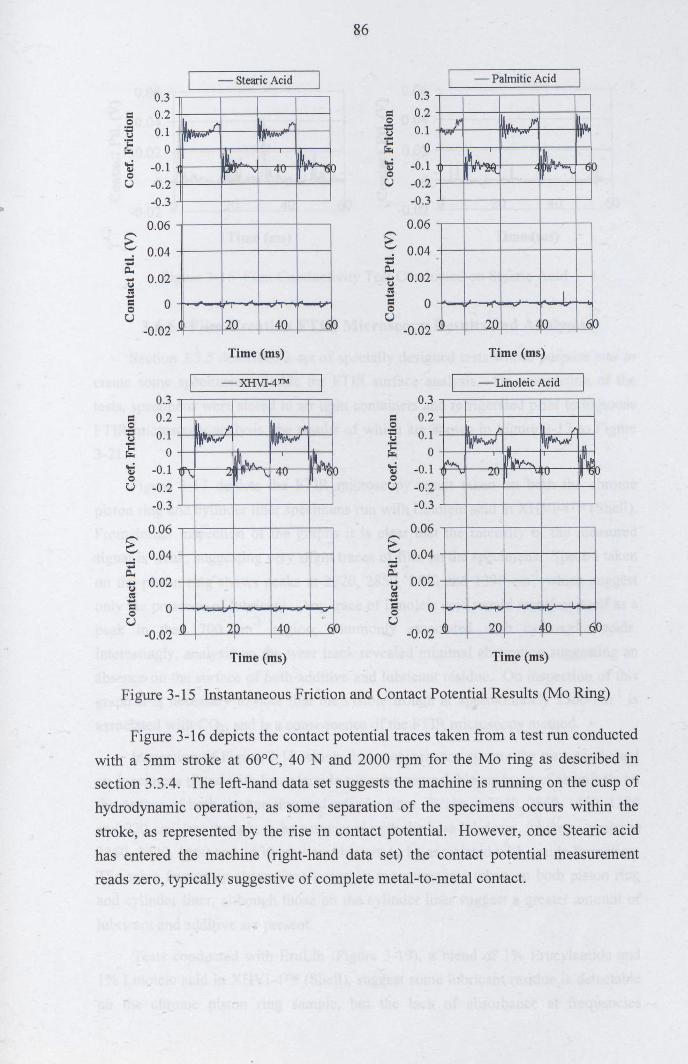
0.3
= 0.20= 0.1.~.. 0r.o.'t -0.10U -0.2
-0.3
0.06
~ 0.04-....~.... 0.02~~....c 00u-0.02
0.3
= 0.20;:I 0.1f.J;:: 0r;:..
't -0.10U -0.2
-0.3
0.06
~ 0.04;i~.... 0.02~~....c 00u
-0.02
- Stearic Acid
~. J' ~. rrr",- ~~i""""
~K~. I~.I..rr 4V .V' -~rc'
"V ........
20 40 IiO
Time (ms)
-XHVI_4TM
k I' ~ r"
I'~''''''''''''' ~
~"" .!~.i\ ~" \ 4V ~ "'(jrc'
I...... -:'')0 40 60
Time (ms)
86
0.3c 0.20:= 0.1f.J
~ 0't -0.10U -0.2
-0.3
0.06
~ 0.04-....~.... 0.02~~....c 00u-0.02
0.3
= 0.20= 0.1f.J
~ 0....: -0.1<II0U -0.2
-0.3
0.06
~ 0.04;i~.... 0.02~~....c 00u
-0.02
- Palmitic Acid
r ~'11 r 11,1.111" ,'_ 1111'
il~'" 1M",~Flr~ V1l 'i.. U
I~( 20 ~!O 6b
Time (ms)
- Linoleic Acid
II /" h 11
~ U 11~11t
~ I!I\~ i~zu ~I ~V " clJ
I'"'" ......
'7.0 ~o fib
Time (ms)
Figure 3-15 Instantaneous Friction and Contact Potential Results (Mo Ring)
Figure 3-16 depicts the contact potential traces taken from a test run conductedwith a 5mm stroke at 60°C, 40 N and 2000 rpm for the Mo ring as described insection 3.3.4. The left-hand data set suggests the machine is running on the cusp ofhydrodynamic operation, as some separation of the specimens occurs within the
stroke, as represented by the rise in contact potential. However, once Stearic acidhas entered the machine (right-hand data set) the contact potential measurementreads zero, typically suggestive of complete metal-to-metal contact.
87
0.06 0.06
€ 0.04 € 0.04_.: -...... ......~ ~...... 0.02 ...... 0.02u u~ ~...... ......= 0 = 00 0U U
-0.02 -0.02
Time (ms)
Ii .1 I ~ Lt-",. "V -."
D 20 40 6b
Time (ms)
Figure 3-16 Film Conductivity Test Conducted on Stearic Acid
3.6.5. Film Creation FTIR Microscopy Results and Analysis
Section 3.3.5 described a set of specially designed tests whose purpose was tocreate some specimens suitable for FTIR surface analysis. On completion of thetests, specimens were stored in air tight containers and refrigerated prior to in-houseFTIR microscopy analysis, the results of which are shown in Figure 3-17 to Figure
3-21.
Figure 3-17 depicts the FTIR microscopy result taken on both the chromepiston ring and cylinder liner specimens run with Linoleic acid in XHVI-4TM(Shell).
From initial inspection of the graphs it is clear that the intensity of the measuredsignal is weak, suggesting very slight traces of film on the specimens. Spectra takenon the piston ring shows peaks at 2920, 2850, 1470 and 1390 cm-l which suggestonly the presence of lubricant. AnJ: trace of Linoleic acid would manifest itself as apeak in the 1700 cm-l region, commonly associated with carboxylic acids.Interestingly, analysis on the wear track revealed minimal absorption suggesting an
absence on the surface of both additive and lubricant residue. On inspection of thisgraph it is necessary to note that the visible trough at approximately 2360 cm-l isassociated with CO2, and is a consequence of the FTIR microscopy method.
Inspection of Figure 3-18 which shows absorbance spectra for tests conductedon specimens tested with Erucylamide suggests appreciable amounts of chemicals onthe surface of both chrome ring and cylinder liner. Peaks at 2940,2860, 1460, 1380and 720 cm-l are thought to be associated with the base lubricant, where as peaks at
3360, 3200, 1660 and 1630 cm-l are thought to be associated with amide formation.The same frequency absorptions occur on measurements taken on both piston ringand cylinder liner, although those on the cylinder liner suggest a greater amount oflubricant and additive are present.
Tests conducted with EruLin (Figure 3-19), a blend of 1% Erucylamide and1% Linoleic acid in XHVI-4TM (Shell), suggest some lubricant residue is detectable
on the chrome piston ring sample, but the lack of absorbance at frequencies
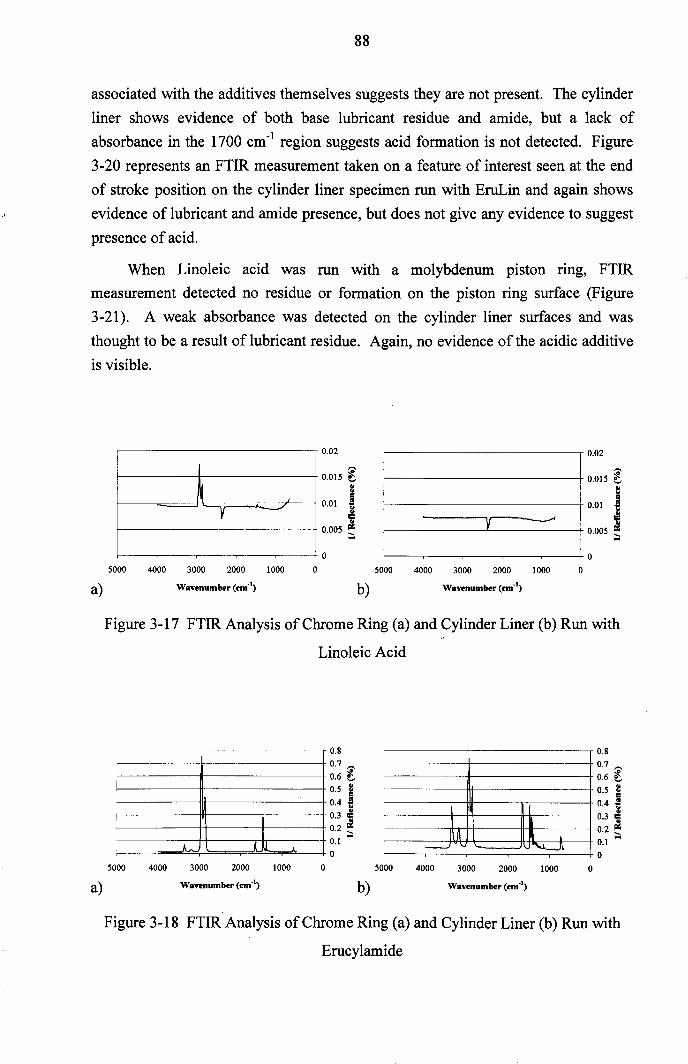
88
associated with the additives themselves suggests they are not present. The cylinderliner shows evidence of both base lubricant residue and amide, but a lack ofabsorbance in the 1700 cm" region suggests acid formation is not detected. Figure3-20 represents an FTIR measurement taken on a feature of interest seen at the endof stroke position on the cylinder liner specimen run with EruLin and again shows
evidence of lubricant and amide presence, but does not give any evidence to suggestpresence of acid.
When Linoleic acid was run with a molybdenum piston ring, FTIRmeasurement detected no residue or formation on the piston ring surface (Figure
3-21). A weak absorbance was detected on the cylinder liner surfaces and wasthought to be a result of lubricant residue. Again, no evidence of the acidic additiveis visible.
v
0.02
'i'0.015 ~
e0.01 i
~0.005 _...o
5000 4000 3000 2000 1000 o
a) Wavenumber (em")
--------------,. 0.02
f:------------+ 0.DI5 '-'
--------------+ 0.01 i~,...-------..,!_-----+ 0.005 ;:;
r---~-~--~-~----+O5000 4000 3000 2000 1000 o
b) Wavenumber (cm-')
Figure 3-17 FTIR Analysis of Chrome Ring (a) and Cylinder Liner (b) Run with
Linoleic Acid
i
II
A. iN..
0.8
0.7 '"'0.6 ~0.5 ~0.4 ~
0.3 i0.2 :::.0.1o
5000 4000 3000 2000 1000 o
a) Wavenumber (em")
lIn ~ •---' v '-L...J\.
0.8
0.7 '"'0.6 t0.5 ~
0.4 i0.3 ~0.2 _...0.1o
5000 4000 3000 2000 1000 o
b) Wavenumber (em")
Figure 3-18 FTIR Analysis of Chrome Ring (a) and Cylinder Liner (b) Run with
Erucylamide
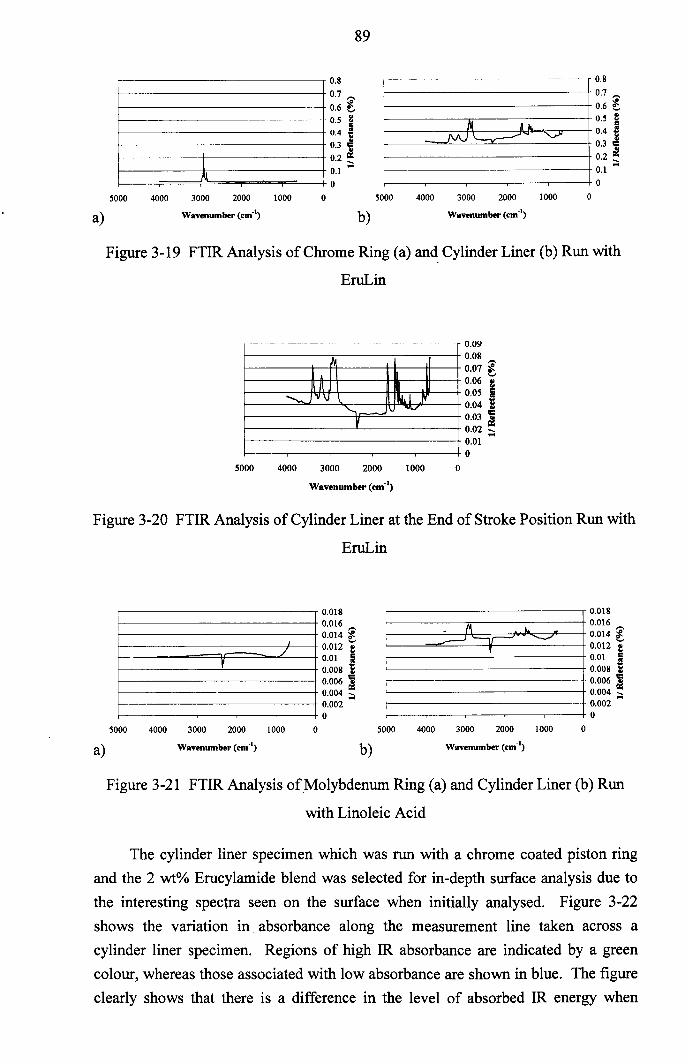
IIII
0.8
0.7 '"'0.6 t0.5 ~0.4 il0.3 'il0.2 ~0.1 ...
o5000 4000 3000 2000 1000 o
a) Wavenumber (em")
89
i--
II N A II.I JVV _,- <;»
0.8
0.7 '"'0.6 t0.5 ~0.4 il0.3 ~0.2 _...0.1o
5000 4000 3000 2000 1000 o
b) Wavenumber (em")
Figure 3-19 FTIR Analysis of Chrome Ring (a) an~ Cylinder Liner (b) Run with
EruLin
----- ~-
~I
IIII • .I<, 'Y\I 1r.t..1 J(
'-,,.._.... -\or
V
0.090.080.07 ~0.06 i0.05 Iii0.04 1l
I;:0.03 ~0.02 ;:;0.01
5000 4000 3000 2000
Wavenumber (em")
o1000 o
Figure 3-20 FTIR Analysis of Cylinder Liner at the End of Stroke Position Run with
EruLin
r--------------,0'0181--------------+ 0.0161--------------+ 0.014 ?I-----------~/i---+ 0.012 if----===v=:r=~-L---+0.01 Iii1--------'-------+ 0.008 il1--------------+ 0.006 ~1---------------+ 0.004 ;:;1--------------+ 0.002I---~-~r__-~-~---+O
5000 4000 3000 2000 1000 o
a) Wavenumber (em')
_. 1"\ .~____.;---v- ---r
I
0.Ql80.0160.014 ?0.012 i0.01 Iii0.008 il0.006 ~0.004 ;:;0.002
5000 4000 3000 2000 1000
oo
b) Wavenumber (cm")
Figure 3-21 FTIR Analysis of Molybdenum Ring (a) and Cylinder Liner (b) Run
with Linoleic Acid
The cylinder liner specimen which was run with a chrome coated piston ringand the 2 wt% Erucylamide blend was selected for in-depth surface analysis due to
the interesting spectra seen on the surface when initially analysed. Figure 3-22shows the variation in absorbance along the measurement line taken across acylinder liner specimen. Regions of high IR absorbance are indicated by a greencolour, whereas those associated with low absorbance are shown in blue. The figureclearly shows that there is a difference in the level of absorbed IR energy when
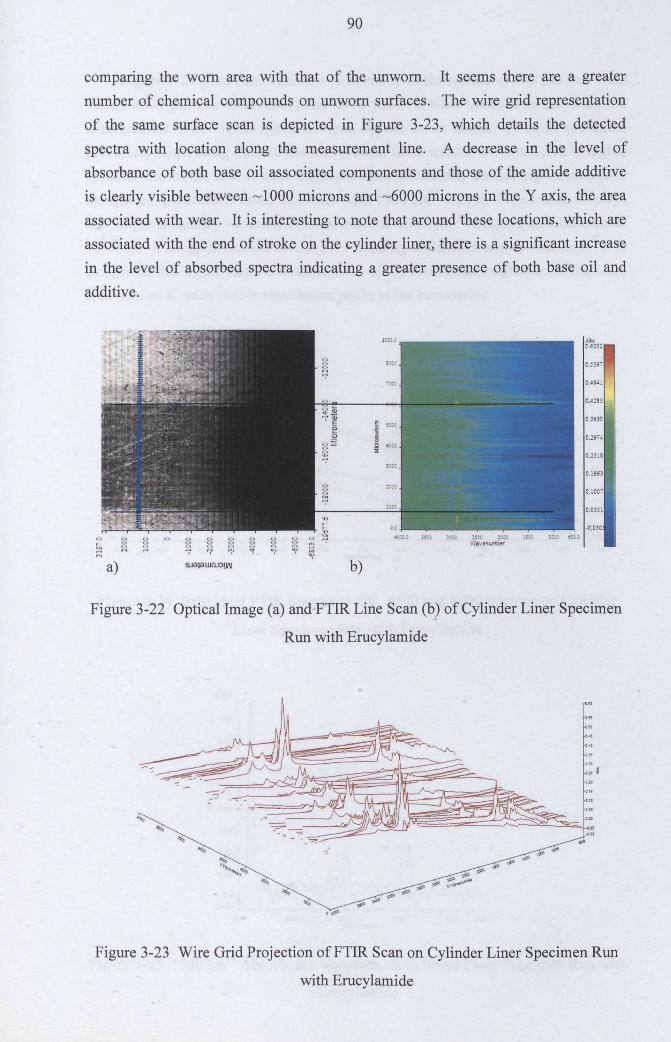
90
comparing the worn area with that of the unworn. It seems there are a greaternumber of chemical compounds on unworn surfaces. The wire grid representationof the same surface scan is depicted in Figure 3-23, which details the detectedspectra with location along the measurement line. A decrease in the level ofabsorbance of both base oil associated components and those of the amide additiveis clearly visible between ~ 1000 microns and ~6000 microns in the Y axis, the area
associated with wear. It is interesting to note that around these locations, which areassociated with the end of stroke on the cylinder liner, there is a significant increasein the level of absorbed spectra indicating a greater presence of both base oil and
additive.
a) SJQI3 UIOJOIL'j
Figure 3-22 Optical Image (a) and FTIR Line Scan (b) of Cylinder Liner Specimen
Run with Erucylamide
Figure 3-23 Wire Grid Projection ofFTIR Scan on Cylinder Liner Specimen Run
with Erucylamide
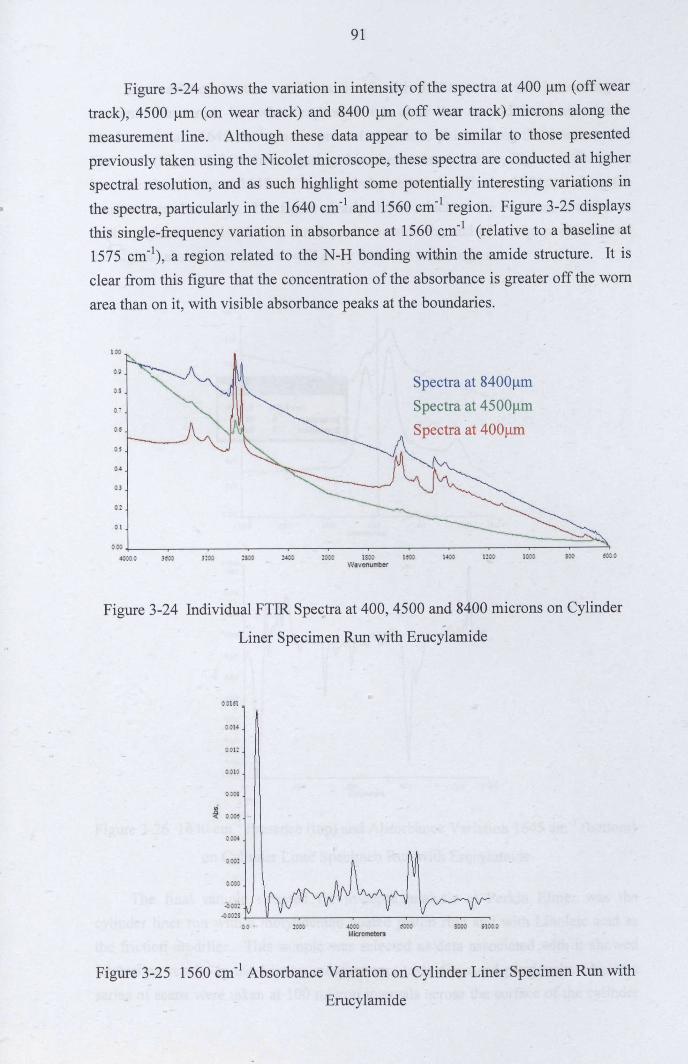
91
Figure 3-24 shows the variation in intensity of the spectra at 400 urn (off weartrack), 4500 urn (on wear track) and 8400 urn (off wear track) microns along themeasurement line. Although these data appear to be similar to those presentedpreviously taken using the Nicolet microscope, these spectra are conducted at higherspectral resolution, and as such highlight some potentially interesting variations inthe spectra, particularly in the 1640 cm-I and 1560 cm-I region. Figure 3-25 displaysthis single-frequency variation in absorbance at 1560 cm-I (relative to a baseline at1575 cm"), a region related to the N-H bonding within the amide structure. It isclear from this figure that the concentration of the absorbance is greater off the worn
area than on it, with visible absorbance peaks at the boundaries.
100
09
01
Spectra at 8400!-lmSpectra at 4500!-lmSpectra at 400!-lm
os
c s
03
01
01
xoo IS!)j isoeWavenumber
1400
Figure 3-24 Individual FTIR Spectra at 400, 4500 and 8400 microns on Cylinder.,
Liner Specimen Run with Erucylamide
01~1
0014
OOU
0010
000;
~ Ol~~
0004
0001
0000
:0001-ccers
00 1000 4000 ~"OMicrometers
Figure 3-25 1560 cm-I Absorbance Variation on Cylinder Liner Specimen Run with
Erucylamide
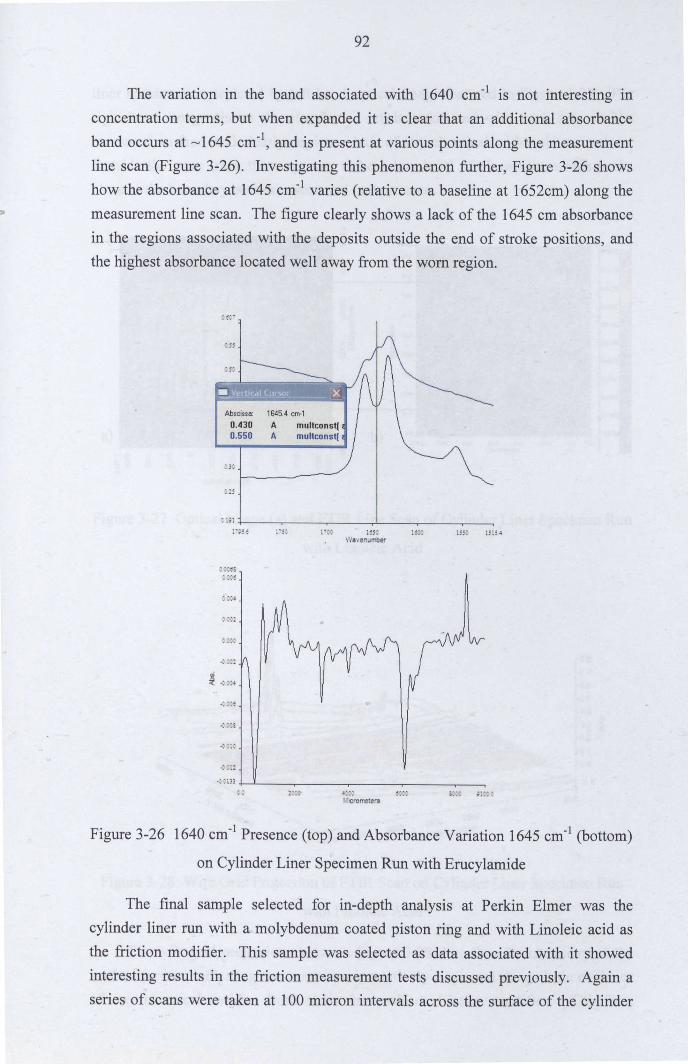
92
The variation in the band associated with 1640 cm" is not interesting inconcentration terms, but when expanded it is clear that an additional absorbance
band occurs at ~ 1645 cm", and is present at various points along the measurementline scan (Figure 3-26). Investigating this phenomenon further, Figure 3-26 showshow the absorbance at 1645 cm" varies (relative to a baseline at 1652cm) along the
measurement line scan. The figure clearly shows a lack of the 1645 cm absorbancein the regions associated with the deposits outside the end of stroke positions, andthe highest absorbance located well away from the worn region.
r ist +---~--~---.1--~--~_t -;~,.; 1-~ Cl 1:5.J
V!avenumter15S{ 15154
Micrometers
Figure 3-26 1640 cm" Presence (top) and Absorbance Variation 1645 cm-1 (bottom)
on Cylinder Liner Specimen Run with Erucylamide
The final sample selected for in-depth analysis at Perkin Elmer was thecylinder liner run with a molybdenum coated piston ring and with Linoleic acid asthe friction modifier. This sample was selected as data associated with it showedinteresting results in the friction measurement tests discussed previously. Again aseries of scans were taken at 100 micron intervals across the surface of the cylinder
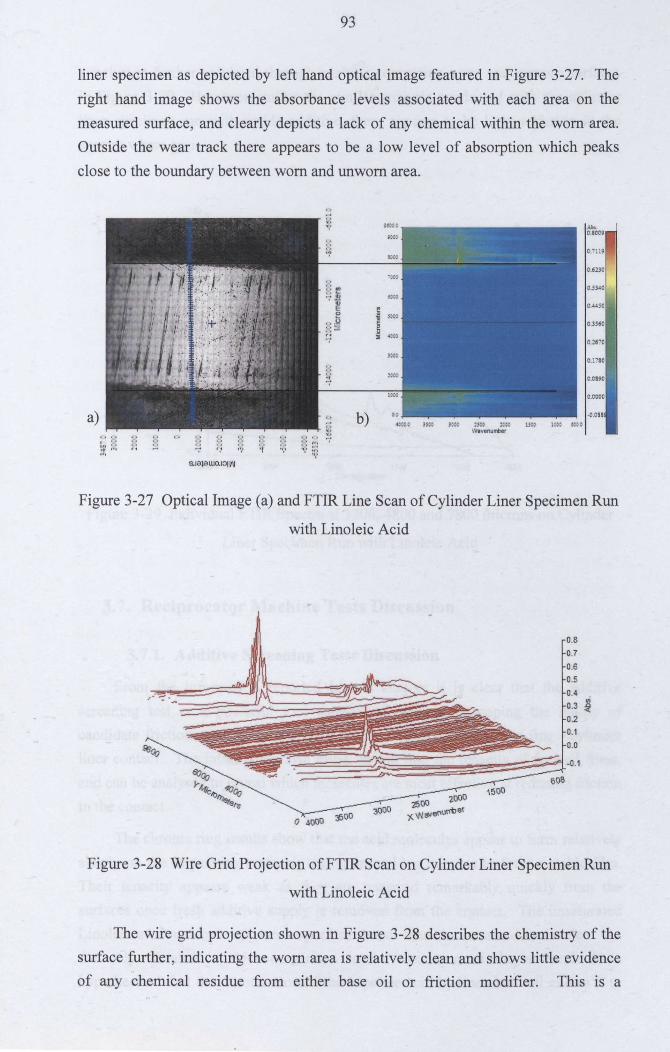
93
liner specimen as depicted by left hand optical image featured in Figure 3-27. The
right hand image shows the absorbance levels associated with each area on themeasured surface, and clearly depicts a lack of any chemical within the worn area.Outside the wear track there appears to be a low level of absorption which peaks
close to the boundary between worn and unworn area.
a)
G..laj9 UI(lIOIl~
Figure 3-27 Optical Image (a) and FTIR Line Scan of Cylinder Liner Specimen Run
with Linoleic Acid
0.8
0.7
0.6
Figure 3-28 Wire Grid Projection ofFTIR Scan on Cylinder Liner Specimen Run
with Linoleic Acid
The wire grid projection shown in Figure 3-28 describes the chemistry of thesurface further, indicating the worn area is relatively clean and shows little evidenceof any chemical residue from either base oil or friction modifier. This is a
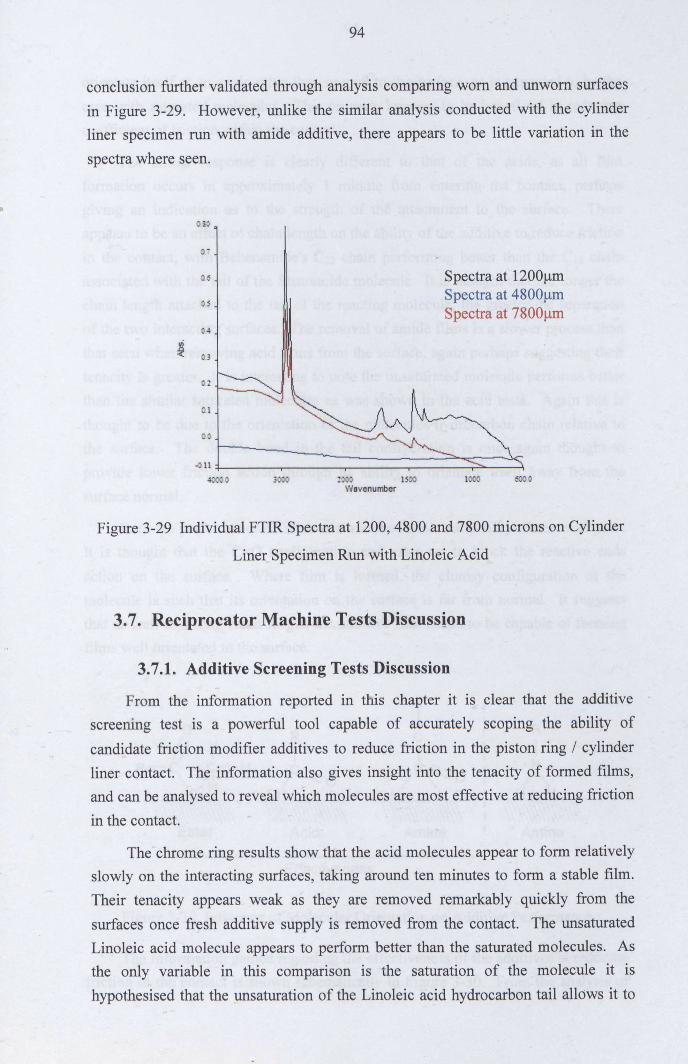
94
conclusion further validated through analysis comparing worn and unworn surfacesin Figure 3-29. However, unlike the similar analysis conducted with the cylinderliner specimen run with amide additive, there appears to be little variation in the
spectra where seen.
o S~
Oi
os Spectra at 1200llm
05Spectra at 4800llmSpectra at 7800llm
04<Ii~ 03
:,~3 1;03Wavenumber
Figure 3-29 Individual FTIR Spectra at 1200,4800 and 7800 microns on Cylinder
Liner Specimen Run with Linoleic Acid
3.7. Reciprocator Machine Tests Discussion
3.7.1. Additive Screening Tests Discussion
From the information reported in this chapter it IS clear that the additivescreening test is a powerful tool capable of accurately scoping the ability of
candidate friction modifier additives to reduce friction in the piston ring / cylinderliner contact. The information also gives insight into the tenacity of formed films,and can be analysed to reveal which molecules are most effective at reducing friction
in the contact.
The chrome ring results show that the acid molecules appear to form relativelyslowly on the interacting surfaces, taking around ten minutes to form a stable film.
Their tenacity appears weak as they are removed remarkably quickly from the
surfaces once fresh additive supply is removed from the contact. The unsaturatedLinoleic acid molecule appears to perform better than the saturated molecules. Asthe only variable in this comparison is the saturation of the molecule it is
hypothesised that the unsaturation of the Linoleic acid hydrocarbon tail allows it to
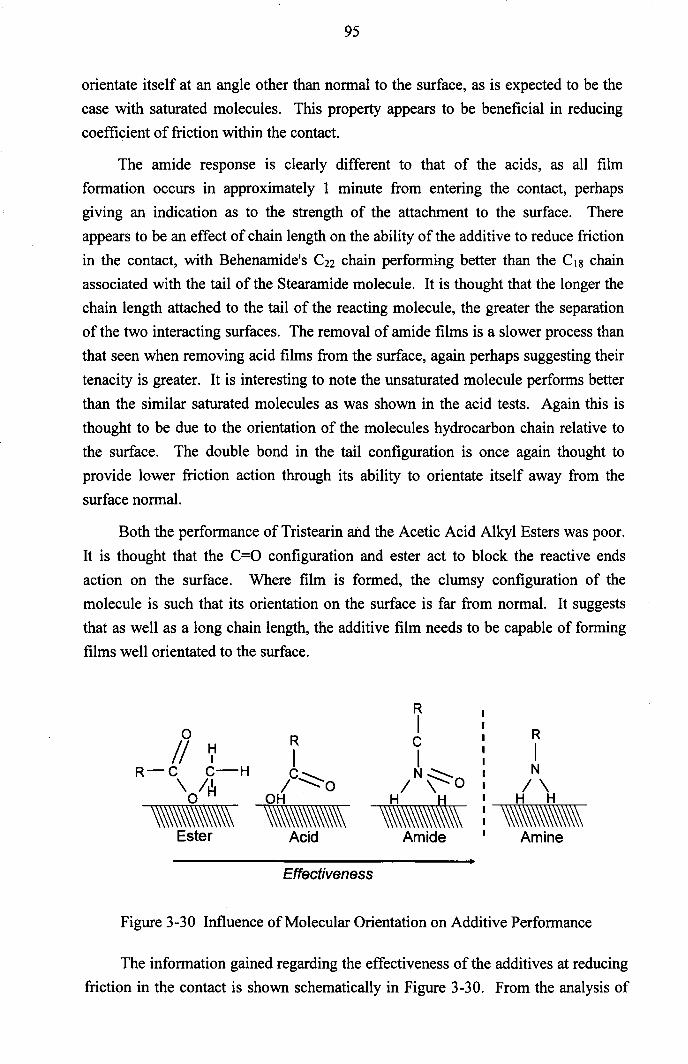
95
orientate itself at an angle other than normal to the surface, as is expected to be thecase with saturated molecules. This property appears to be beneficial in reducingcoefficient of friction within the contact.
The amide response is clearly different to that of the acids, as all filmformation occurs in approximately 1 minute from entering the contact, perhapsgiving an indication as to the strength of the attachment to the surface. Thereappears to be an effect of chain length on the ability of the additive to reduce friction
in the contact, with Behenamide's C22 chain performing better than the Cl8 chainassociated with the tail of the Stearamide molecule. It is thought that the longer thechain length attached to the tail of the reacting molecule, the greater the separationof the two interacting surfaces. The removal of amide films is a slower process than
that seen when removing acid films from the surface, again perhaps suggesting theirtenacity is greater. It is interesting to note the unsaturated molecule performs betterthan the similar saturated molecules as was shown in the acid tests. Again this is
thought to be due to the orientation of the molecules hydrocarbon chain relative tothe surface. The double bond in the tail configuration is once again thought toprovide lower friction action through its ability to orientate itself away from thesurface normal.
Both the performance of Tristearin and the Acetic Acid Alkyl Esters was poor.It is thought that the C=O configuration and ester act to block the reactive endsaction on the surface. Where film is formed, the clumsy configuration of themolecule is such that its orientation on the surface is far from normal. It suggeststhat as well as a long chain length, the additive film needs to be capable of formingfilms well orientated to the surface.
oII ~
R-C C-H\ lAo
RIN
1\~
Ester~'\
Acid~
Amine
Effectiveness
Figure 3-30 Influence of Molecular Orientation on Additive Performance
The information gained regarding the effectiveness of the additives at reducingfriction in the contact is shown schematically in Figure 3-30. From the analysis of
96
Ester, Acid and Amide films it is possible to hypothesise that a more effectivemolecular compound might be that of an amine, although this theory remainsuntested. The hypothesis that an amine molecule would be more effective at frictionreduction than that of ester, acid and amide stems from the culmination of resultssuggesting that the presence of a strong polar head (NH2) and lack of C=O featuremay be beneficial. In fact, on consideration of all information gained from thepreceding results it is possible to hypothesise the 'ultimate' friction modifieradditive as one whose species is amine, has a long chain length (C22or greater), andwhose hydrocarbon tail is polyunsaturated. However, preceding chapters have toldus that additive which is administered to the engine via the fuel will find its way intothe sump lubricant. Given this knowledge it is necessary to acknowledge that havingpolyunsaturated, or indeed unsaturated, molecules in an engine's ·lubricant isundesirable as they are prone to cross linking, and as such would be likely to formsludge, degrading the performance of the oil. However, it is also necessary to notethat should the molecules employed be saturated, there should be no degrading effecton the engine lubricant, and their performance is thought to be only marginallypoorer than their unsaturated equivalents.
Direct analysis of the raw data taken from the TE-77 gives another dimensionto the investigation into 'CHON' friction modifiers through giving informationrelating to the action, or mechanism of friction reduction of the additives.Consideration of the instantaneous friction force and contact potential data has beenanalysed to give this information.
The acid, amide and triglyceride families appear to all form surface filmscapable of reducing the friction of the sliding contact between piston ring andcylinder liner. Although the ester formation appears to have some friction reducingproperties it is the only additive whose contact potential data suggests it didn't forman appreciable surface film. Fatty acid molecules seem to form surface films whichalmost completely isolate the interacting surfaces from one another, a quality notshared by the other chemical species under investigation. It is hypothesised that themolecules form dense surface films with poor electrical conductivity in a wellorientated manner, essentially interposing a molecular sheet between the slidingpiston ring and liner. Of the fatty acid molecules under investigation it appears thefilms formed by the application of Linoleic acid, the polyunsaturated variant ofStearic acid, are slightly weaker as signs of contact are evident at stroke reversal.This may be the result of the orientation of the additive to the surface, which is likelyto be away from the normal due to the unsaturated nature of its hydrocarbon tail.However, it is also hypothesised that it is this non-normality with the surface thatleads to lower friction sliding in the mid-stroke region.
97
The formation of amide films is not unlike that of acid films, although there aresubtle differences which set them apart. Typically the films formed through
application of amide appear to be less complete than those formed throughapplication of acid based friction modifier. In general, the amide film formation isincomplete in that there appears to be a lack of film at the stroke reversal points.However, it is acknowledged that it may also be possible that the film coverage iscomplete, but arduous conditions at the reversal points cause local film removal.
This is a theory which requires further investigation to validate. It is interesting to
note that there is a large difference between the Stearamide (CIS) and Behenamide(C22) contact potential data, again suggesting that longer hydrocarbon tails formmore successful friction modifier films. The action of the Erucylamide molecule isof key interest, as it gives extremely low friction action at the mid-stroke, and greatercontact insulation than other amide additives. It is hypothesised that this exceptionalperformance as a friction modifier comes from the combination of what seem to be
two desirable properties, a long chain length and unsaturation.
It is no surprise that the films formed through application of triglyceride andester molecules look to be poor, as the previous analysis of the resulting coefficientsof friction showed the two species to be the weakest performing friction modifieradditives. Although the contact potential measurement associated with the action ofTristearin looks to be quite complete, the low value of electrical insulation perhaps
suggests a very thin, or incomplete, film is formed. Coupled with the instantaneous
friction data, it is clear that any film formed has little effect on the frictional
characteristics of the contact.
Of key importance in this chapter is the understanding that acid based frictionmodifier additives appear to form complete surface films, even at stroke reversalpoints, and that amide films form potentially lower friction films in the mid-stroke,
but are not effective at stroke reversal locations. It was on consideration of these
facts that the blend of 1 wt% Linoleic acid and 1 wt% Erucylamide, termed EruLinin this research, was conceived. It was thought that the two species couldcomplement each other by achieving a lower coefficient of friction for the contactthan either of the additives on their own.
It was hoped that the combination of an unsaturated acid and amide would lead
to lower friction sliding for the components in the test as it appears both additives
work in different ways. It was thought that the amide would dominate the film
formation due to its rapid reaction characteristic, only leaving exposed metal at thestroke reversal points where it is either incapable of forming, or is easily removed.At these sites of exposed metal it was thought that acid film formation would occurcompleting the interposed layer and fully separating interacting surfaces (Figure
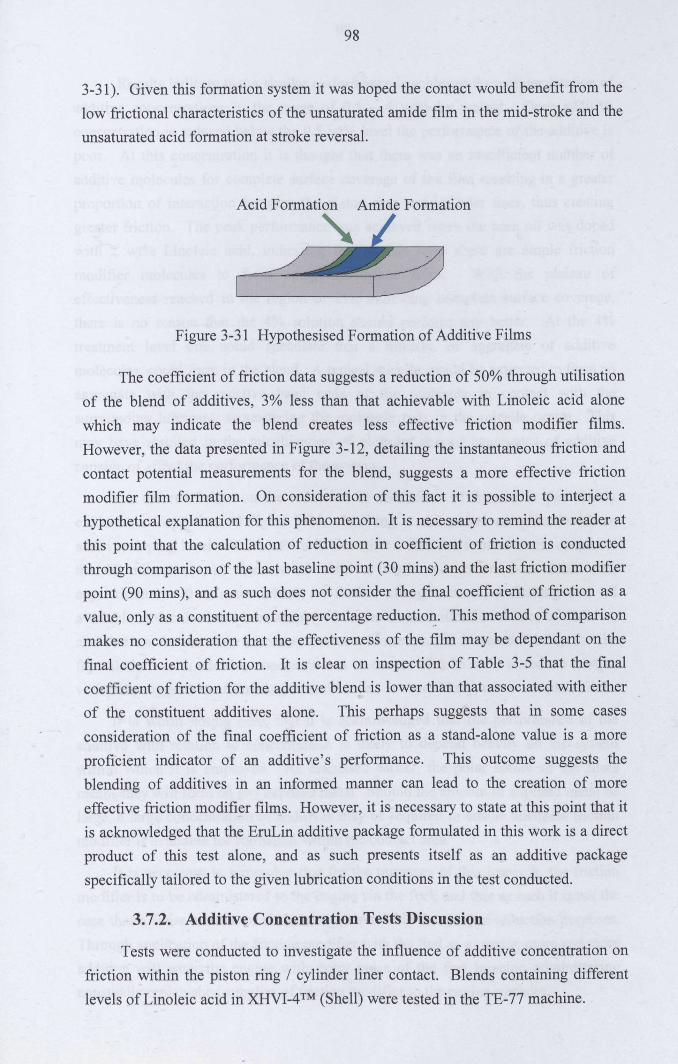
98
3-31). Given this formation system it was hoped the contact would benefit from thelow frictional characteristics of the unsaturated amide film in the mid-stroke and theunsaturated acid formation at stroke reversal.
Amide Formation
Figure 3-31 Hypothesised Formation of Additive Films
The coefficient of friction data suggests a reduction of 50% through utilisationof the blend of additives, 3% less than that achievable with Linoleic acid alone
which may indicate the blend creates less effective friction modifier films.However, the data presented in Figure 3-12, detailing the instantaneous friction andcontact potential measurements for the blend, suggests a more effective frictionmodifier film formation. On consideration of this fact it is possible to interject ahypothetical explanation for this phenomenon. It is necessary to remind the reader atthis point that the calculation of reduction in coefficient of friction is conductedthrough comparison of the last baseline point (30 mins) and the last friction modifierpoint (90 mins), and as such does not consider the final coefficient of friction as a
value, only as a constituent of the percentage reduction. This method of comparisonmakes no consideration that the effectiveness of the film may be dependant on thefinal coefficient of friction. It is clear on inspection of Table 3-5 that the finalcoefficient of friction for the additive blend is lower than that associated with eitherof the constituent additives alone. This perhaps suggests that in some cases
consideration of the final coefficient of friction as a stand-alone value is a moreproficient indicator of an additive's performance. This outcome suggests theblending of additives in an informed manner can lead to the creation of moreeffective friction modifier films. However, it is necessary to state at this point that itis acknowledged that the EruLin additive package formulated in this work is a directproduct of this test alone, and as such presents itself as an additive package
specifically tailored to the given lubrication conditions in the test conducted.
3.7.2. Additive Concentration Tests Discussion
Tests were conducted to investigate the influence of additive concentration onfriction within the piston ring / cylinder liner contact. Blends containing different
levels of Linoleic acid in XHVI-4TM (Shell) were tested in the TE-77 machine.
99
Results indicate that a similar performance is achieved through application ofadditive concentrations in the range of 0.5 - 4 wt% by weight. Once additiveconcentration is reduced below the 0.5 wt% level the performance of the additive ispoor. At this concentration it is thought that there was an insufficient number ofadditive molecules for complete surface coverage of the film resulting in a greaterproportion of interaction between the piston ring and cylinder liner, thus creatinggreater friction. The peak performance was achieved when the base oil was dopedwith 2 wt% Linoleic acid, indicating that at this level there are ample frictionmodifier molecules to form complete surface films. With the plateau ofeffectiveness reached in the region of 2%, indicating complete surface coverage,there is no reason that the 4% solution should perform any better. At the 4%treatment level one could speculate that a micelle, or aggregate of additivemolecules, could form in the blend. A typical micelle would be expected to form anaggregate with the reactive head ends of the molecule in contact with thesurrounding lubricant, sequestering the molecule tails in the micelle centre. This
may have resulted in the micellization of globular shaped aggregates of additivecapable of affect the performance of the system.
The effect of time on the reduction of coefficient of friction is also clearlyevident on inspection of Figure 3-13. Looking at the points associated with an
additive doping level of 0.25 wt% it is clear that a film has formed in the contact atthe 40 minute (or 10 minutes of additive) mark and continues to form untilapproximately 60 minutes where no further change occurs, indicating that allavailable molecules have been employed on the surface after 20 minutes of additive,and that no further film formation occurs. However, the increased ability for theformulations with additive concentrations in excess of 0.25 wt% to reduce frictionwith time suggests the formation of multi-layer, or more likely, more complete films.
It is worth noting here, that it is acknowledged that the performance of theadditive with relation to concentration is likely to depend heavily on the systemwithin which it is employed. As discussed earlier, the polar nature of the filmsmeans they will form on any exposed metal. Should the amount of exposed metal belarge, a large concentration of additives may be required to ensure adequate frictionmodifier is available for formation within the contact area.
It is necessary to remember that for the purposes of this research, the frictionmodifier is to be administered to the engine via the fuel, and that as such it is not thecase that a finite amount of molecules are available for friction reduction purposes.Through application of the friction modifier with the fuel as a carrier, more and moreadditive will enter the engine with every pulse of the fuel injector, administeringconstantly replenished supplies of friction modifier to the engine surfaces.
100
3.7.3. Piston Ring Material Friction Discussion
The in-house standardised additive screening test was conducted with amolybdenum coated piston ring running against cast iron liner. Tests were
conducted using blends containing 2 wt% Stearic acid, Palmitic acid and Linoleicacid in XHVI-4TM (Shell).
The results displayed in this section clearly highlight the influence piston ringselection has on the ability of the additives to reduce friction in the contact, andcause us to ask many questions.
It is evident that Stearic acid performed better than Palmitic acid when
considering the initial reduction in coefficient of friction, this is perhaps due to the
slightly longer chain length associated with the Stearic acid molecule. Theperformance of the polyunsaturated molecule, Linoleic acid, is of considerableinterest. The action of the molecule is clearly very different to that of its saturatedvariant, Stearic acid. It seems film formation is slow, but effective, as it continues toreduce friction within the contact throughout its duration in the machine.
Interestingly it seems the tests conducted with the molybdenum coated piston ring
are more likely to return to the baseline coefficient of friction than tests conductedwith the chrome coated ring.
The result recorded in Figure 3-16 depicting the instantaneous friction forceand contact potential data is of real interest when trying to understand the differencebetween the action of the additives when employed with a chrome ring, and those
seen when running on a molybdenum ring. The zero contact potential measured
after 60 seconds when running with Stearic acid and molybdenum ring tells ussomething has happened in the system which makes the contact better at conductingelectricity.
The chrome and molybdenum coated rings have extremely different surfacefinishes, molybdenum being considerably rougher than that of chrome. As such it is
possible that the effects seen are caused by the rough abrasive nature of the flame
sprayed molybdenum ring. The chrome and molybdenum rings also offer surfaceswith different compositions to the reactive additive, which could possibly influencethe type of reaction taking place between additive molecule and metal substrate.
To fully investigate the reasons for the dramatic difference in the resultsassociated with tests conducted with a chrome piston ring section and those
conducted with a molybdenum ring a great deal of specially designed further testing
is required. Variation in the surface roughness and surface composition need to beconsidered in isolation to decouple the two possible influences. As such, and withinthe bounds of this investigation, the results obtained to date serve merely to highlight
101
an interesting phenomenon, whose explanation lies outside the scope of the currentresearch project. However, this is an area which has been highlighted for further
work, and is detailed in Conclusions & Recommendations for Future Work later onin this thesis.
3.S. Film Creation FTIR Microscopy Discussion
The relatively weak signals measured through FTIR analysis on the componentsurfaces make conclusive discussion difficult. However, some qualitative discussion
is made possible through analysis of the data as a whole.
Analysis of samples subject to operation with Linoleic acid revealed that both
piston ring and cylinder liner surfaces had next to no chemical presence, and thateven residue from the base oil was scarce. This is a surprising result as thepreparation of the surfaces prior to analysis only consisted of flowing over drycompressed air. As this type of surface 'cleaning' is relatively non-intrusive it
would be expected that some lubricant residue be present on the surface whereanalysed.
Tests conducted with Erucylamide reveal a completely different story, showingidentifiable spectra known to be associated with both the base oil and amideadditive. Their presence is detected on both piston ring and cylinder liner surfacessuggesting residue remained on both interacting surfaces.
The test conducted with a blend of both Erucylamide and Linoleic acidexhibited a relatively intermediate strength absorbance spectra on the cylinder liner,and weak absorbance on the chrome ring suggesting residue is present in greaterquantities on the cylinder liner surface. This is not surprising as the surface of thecylinder liner is engineered to retain lubricant. The presence of identifiable spectrain the EruLin test is thought to be solely due to the amide additive as no peaksassociated with carboxylic acid was seen. It is worth noting at this point that the
melting points of the additives are likely to have a pronounced effect on the strengthof signal obtained, as Linoleic acid is liquid at room temperature and Erucylamide issolid. It is thought that cleaning with compressed air is more likely to remove liquidparticles than solid, which may have formed an attachment to the surface.
Although the spectra obtained from the FTIR analysis of the component
surfaces indicated the presence of amide additive on surfaces subject toErucylamide, the strength and resolution of the signal obtained make any judgementof the chemical state of surface films impossible. However, the presence of filmsinvestigated through FTIR analyses is an interesting observation in its own right.
102
Samples sent to Perkin Elmer for in-depth surface analysis revealed someinteresting information. It is clear that the concentrations of additive on and off the
wear track differ. On the cylinder liner specimen run with Erucylamide the reducedconcentration of film on the wear track is thought to be a direct result of film
removal or thinning by the piston ring. The highest concentration of additivemeasured outside the end stroke regions indicates amide removed from the contactby the reciprocating piston ring probably forms at the boundaries of its operation. Ofkey interest is the variation in spectra taken at different points on the surface, whichsuggests not only variation in intensity, but variation in the spectra themselves.
These spectral variations could be related to variations in the chemical structureacross the surface. The variation from 1650 ern" to 1645 ern" appears significant asits intensity on the surface falls at the stroke boundaries. It is at these locations the1560 cm-! absorbance is elevated suggesting some chemical state change as a resultof surface condition. This phenomenon might explain the lack of effective amidefilms seen at stroke reversal points as measured through contact potential methods,and discussed in earlier sections.
In-depth analysis on the cylinder liner subject to Linoleic acid and run with a
molybdenum ring again gives greater resolution as to the action of the additive itself.It is clear that in the working section of the cylinder liner specimen there is a lack ofany chemical residue, however, outside this area weak concentrations of residue areseen. There may be several reasons for this, the first and most likely being that theworn surface is less capable of trapping lubricant residue due to its polished nature,and that outside the area some lubricant residue is ingrained in the rough liner hone.
It is important to note that detectable spectra obtained do not indicate the presence ofcarboxylic acid, and looks to only be a result of the base oil absorbance. As with thecylinder liner subjected to Erucylamide, the full surface scan depicts greater intensityfilms at the boundaries of the working area suggesting additive removed by thereciprocating ring reforms at these locations.
Ultimately the analysis leads us to believe that the molybdenum ring / Linoleicacid system is more straightforward than that of the chrome ring / Erucylamidesystem, where there is some evidence of attachment or chemical state variation.
It is acknowledged by the author that the FTIR analysis of the cylinder linersurfaces leaves many questions unanswered with regards to the formation andmechanism of friction reduction of the additives under investigation, questions
which are looked to be answered in following chapters. As such this section servesto summarise analyses which were performed to scope the films responsible forfriction reduction in order to guide further, more focused and specifically designedinvestigation.
103
3.9. Summary
This chapter contains a description of a tribometer based investigation into theperformance of novel organic friction modifiers. A bespoke apparatus configurationwas used to both screen candidate additives performance and investigate themechanisms underpinning their action as friction modifiers. In addition somesurface analysis was conducted on selected specimens used in the tests. Based onconsideration of all the information presented in the preceding chapter, the followingsummary can be made.
• The best performing friction modifier additive was shown to beLinoleic acid, which reduced friction in the cylinder liner / piston ringcontact 53%.
• Evidence suggests that additives with long hydrocarbon tails are betterthan those with short tails at reducing friction in the contact.
• Evidence suggests that polyunsaturated molecules reduce friction moreeffectively than saturated molecules.
• The performance of triglyceride and ester molecules is thought to bepoor due to configuration of their molecules which hinders effectivefilm formation.
• Research conducted allows the hypothesis that the most effectivefriction modifier for the specific contact investigated would be a long,polyunsaturated amine molecule.
• Acid based friction modifiers appear to form complete surface films,and can form films in conditions where amide based friction modifierscannot.
• It is thought that films formed through application of amide basedfriction modifier can reduce friction in the mid-stroke region of the
reciprocator stroke more effectively than fatty acid friction modifier.
• Research conducted supports the hypothesis that it is possible toemploy two chemicals in an additive package, whose purpose is united,
to reduce friction in the contact. Through blending of friction modifierchemicals, more effective friction modifier films can be formed.
• Analysis of the effects of additive concentration revealed that for thechemical tested (Linoleic acid), and in the specific test described
previously, the additive concentration for optimum friction reduction is
104
2 wt%. Below 0.5 wt% the performance of the friction modifier was
shown to be poor.
• The material and surface topography of the piston ring section has agreat influence on the performance of the friction modifier additives.Tests conducted in this chapter reveal more effective frictionmodification with a chrome coated piston ring rather than a flamesprayed molybdenum piston ring.
• FTIR analysis of the specimen surfaces show traces of lubricantresidue. No evidence of fatty acid friction modifier was detected,
although the presence of amide was shown to exist where it was
employed.
• Large deposits of unreacted additive were seen at the boundaries ofstroke reversal, and there was some evidence to suggest a change in the
chemical state of the amide additive at these points.
• There was no conclusive evidence of chemisorbed additive films onspecimen surfaces, although the presence of surface chemistry detected
through FTIR analysis suggests surface films exist.
105
4. Mini Traction Machine Investigation of Novel Friction ModifierAdditives
In Chapter 3, a set of experiments was conducted using a high frequencyreciprocating tribometer to screen the performance of prospective novel frictionmodifier additives in the boundary lubrication regime. These tests simulated thearduous conditions of the 1st compression ring in the ring zone of a firing engine.Having selected the additives most effective at reducing boundary friction, andquantified the benefits achievable through chemical compound synergism, it wasdeemed necessary to investigate the performance across the full spectrum oflubrication regimes that occurs in the normal operation of the piston assembly. Thepiston assembly passes through the boundary, mixed, elastohydrodynamic and fluidfilm lubrication regimes with every stroke, and that the proportion of the enginecycle spent under the boundary lubrication regime is small. In addition, as thevelocity of the piston assembly tends towards zero when entering the boundarylubrication regime at the top and bottom dead centres, the overall impact on energysaved through implementation of a friction modifier at these locations is limited. Afriction modifier whose capability extends to reducing friction in the mixedlubrication regime would be much more beneficial to energy conservation.
In this chapter, a series of experiments used a PCS Mini Traction Machine forthree main reasons. First, the data from the machine when operating in the boundaryregime might provide a basis for a trend comparison of data taken using the PlintTE-77 High Frequency Reciprocator Tribometer. Second, investigating theperformance of the additive across the mixed lubrication regime is necessary whenhypothesising its effectiveness in the engine environment. Third, the machineprovides the perfect opportunity to create some additive films on samples suitablefor more sophisticated surface analysis than the piston ring and cylinder linersamples in Chapter 3.
4.1. The Mini Traction Machine and Test Specimens
The PCS Mini Traction Machine (MTM) was used to investigate novel frictionmodifier additives, Figure 4-1. The MTM is a highly sophisticated ball on disc,computer controlled tribometer whose method of precision traction measurementprovides fully automated mapping of lubricants and other fluids. The MTMmachine simulates lubrication regimes in non conformal contacts such as thosefound in cams, valve trains and gears, for example. During a typical test, an 18mm
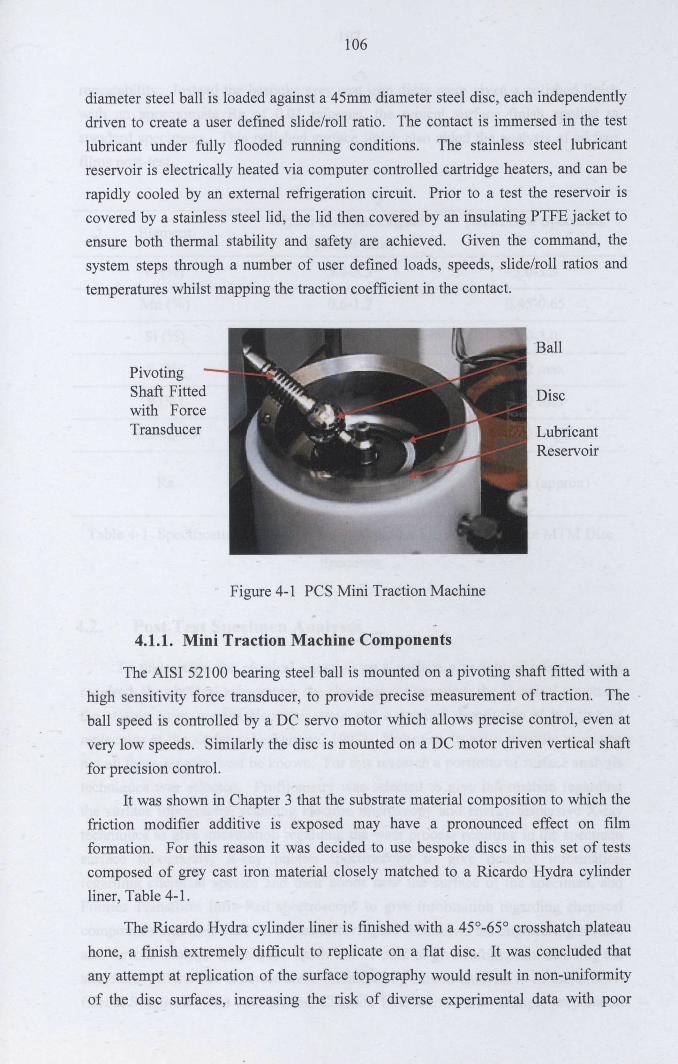
106
diameter steel ball is loaded against a 45mm diameter steel disc, each independentlydriven to create a user defined slide/roll ratio. The contact is immersed in the testlubricant under fully flooded running conditions. The stainless steel lubricantreservoir is electrically heated via computer controlled cartridge heaters, and can berapidly cooled by an external refrigeration circuit. Prior to a test the reservoir iscovered by a stainless steel lid, the lid then covered by an insulating PTFE jacket toensure both thermal stability and safety are achieved. Given the command, thesystem steps through a number of user defined loads, speeds, slide/roll ratios and
temperatures whilst mapping the traction coefficient in the contact.
PivotingShaft Fittedwith ForceTransducer
Ball
Disc
LubricantReservoir
Figure 4-1 PCS Mini Traction Machine
4.1.1. Mini Traction Machine Components
The AISI 52100 bearing steel ball is mounted on a pivoting shaft fitted with ahigh sensitivity force transducer, to provide precise measurement of traction. Theball speed is controlled by a DC servo motor which allows precise control, even atvery low speeds. Similarly the disc is mounted on a DC motor driven vertical shaft
for precision control.
It was shown in Chapter 3 that the substrate material composition to which thefriction modifier additive is exposed may have a pronounced effect on filmformation. For this reason it was decided to use bespoke discs in this set of testscomposed of grey cast iron material closely matched to a Ricardo Hydra cylinder
liner, Table 4-1.
The Ricardo Hydra cylinder liner is finished with a 45°-65° crosshatch plateauhone, a finish extremely difficult to replicate on a flat disc. It was concluded that
any attempt at replication of the surface topography would result in non-uniformityof the disc surfaces, increasing the risk of diverse experimental data with poor
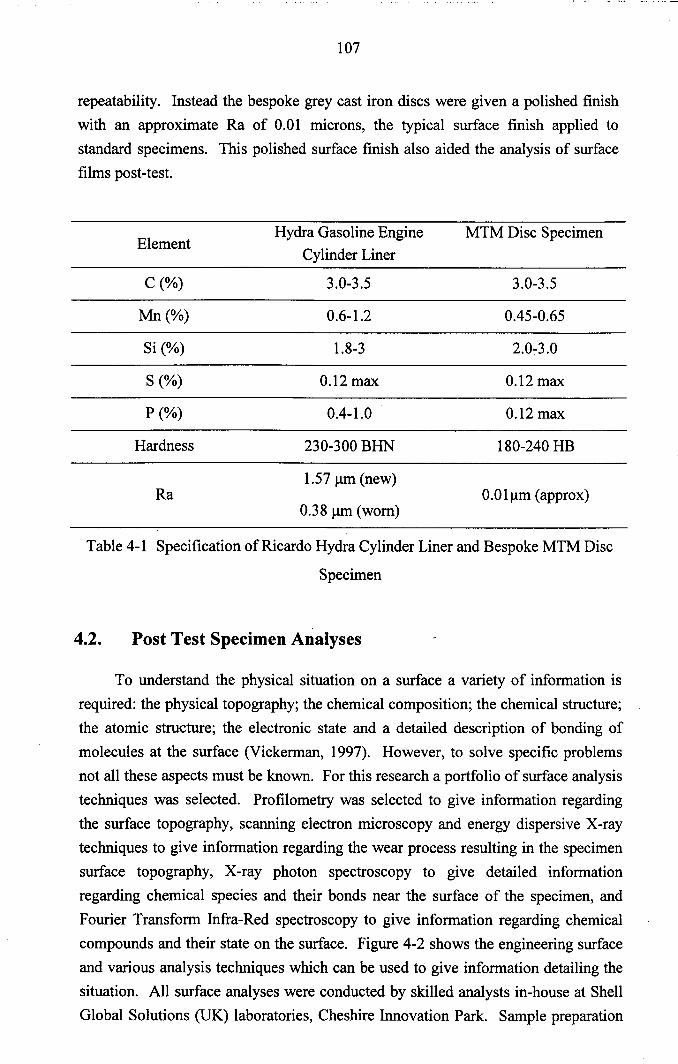
107
repeatability. Instead the bespoke grey cast iron discs were given a polished finishwith an approximate Ra of 0.01 microns, the typical surface finish applied tostandard specimens. This polished surface finish also aided the analysis of surfacefilms post-test.
ElementHydra Gasoline Engine MTM Disc Specimen
Cylinder Liner
C(%) 3.0-3.5 3.0-3.5
Mn(%) 0.6-1.2 0.45-0.65
Si (%) 1.8-3 2.0:-3.0
S (%) 0.12 max 0.12 max
P(%) 0.4-1.0 0.12 max
Hardness 230-300 BHN 180-240 HB
1.57 11m(new)Ra O.Olllm (approx)
0.38 11m(worn)
Table 4-1 Specification of Ricardo Hydra Cylinder Liner and Bespoke MTM Disc
Specimen
4.2. Post Test Specimen Analyses
To understand the physical situation on a surface a variety of information isrequired: the physical topography; the chemical composition; the chemical structure;the atomic structure; the electronic state and a detailed description of bonding ofmolecules at the surface (Vickerman, 1997). However, to solve specific problemsnot all these aspects must be known. For this research a portfolio of surface analysistechniques was selected. Profilometry was selected to give information regardingthe surface topography, scanning electron microscopy and energy dispersive X-raytechniques to give information regarding the wear process resulting in the specimensurface topography, X-ray photon spectroscopy to give detailed informationregarding chemical species and their bonds near the surface of the specimen, and
Fourier Transform Infra-Red spectroscopy to give information regarding chemicalcompounds and their state on the surface. Figure 4-2 shows the engineering surfaceand various analysis techniques which can be used to give information detailing thesituation. All surface analyses were conducted by skilled analysts in-house at ShellGlobal Solutions (UK) laboratories, Cheshire Innovation Park. Sample preparation
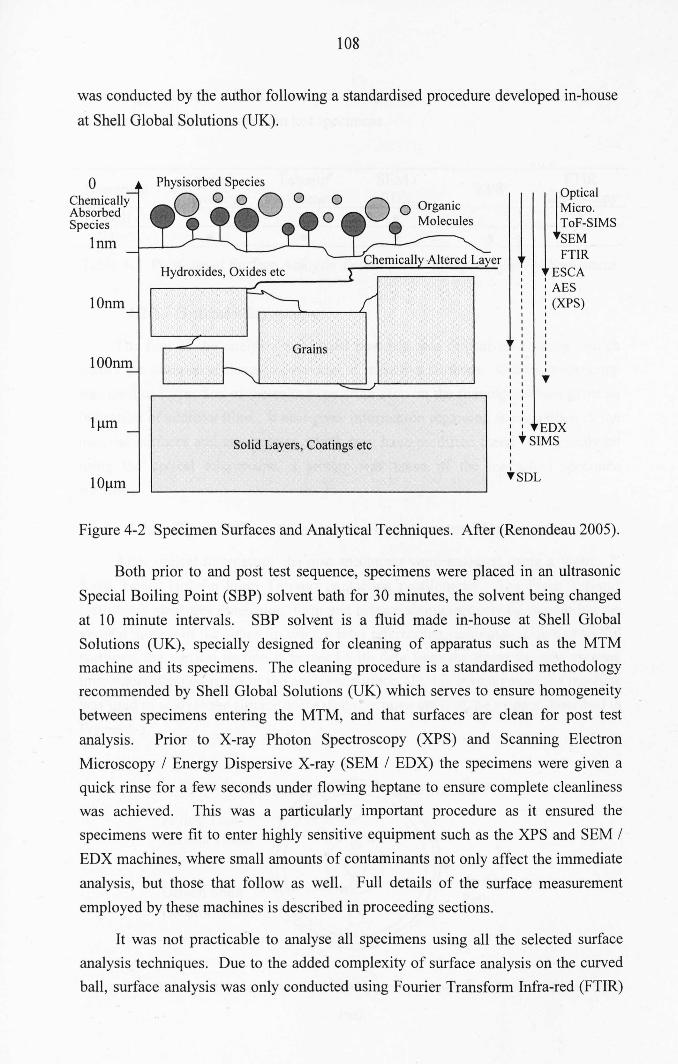
108
was conducted by the author following a standardised procedure developed in-house
at Shell Global Solutions (UK).
0 rPti"'lChemically
1Absorbed Micro.Species ToF-SIMS
lnm SEMFTIR
ESCAAES
l Onm (XPS)
Solid Layers, Coatings etc" EDX.' "-SIMS,,"-SDL
Figure 4-2 Specimen Surfaces and Analytical Techniques. After (Renondeau 2005).
Both prior to and post test sequence, specimens were placed in an ultrasonic
Special Boiling Point (SBP) solvent bath for 30 minutes, the solvent being changed
at 10 minute intervals. SBP solvent is a fluid made in-house at Shell GlobalSolutions (UK), specially designed for cleaning of apparatus such as the MTMmachine and its specimens. The cleaning procedure is a standardised methodologyrecommended by Shell Global Solutions (UK) which serves to ensure homogeneity
between specimens entering the MTM, and that surfaces are clean for post test
analysis. Prior to X-ray Photon Spectroscopy (XPS) and Scanning ElectronMicroscopy I Energy Dispersive X-ray (SEM I EDX) the specimens were given aquick rinse for a few seconds under flowing heptane to ensure complete cleanlinesswas achieved. This was a particularly important procedure as it ensured thespecimens were fit to enter highly sensitive equipment such as the XPS and SEM IEDX machines, where small amounts of contaminants not only affect the immediate
analysis, but those that follow as well. Full details of the surface measurement
employed by these machines is described in proceeding sections.
It was not practicable to analyse all specimens using all the selected surfaceanalysis techniques. Due to the added complexity of surface analysis on the curvedball, surface analysis was only conducted using Fourier Transform Infra-red (FTIR)
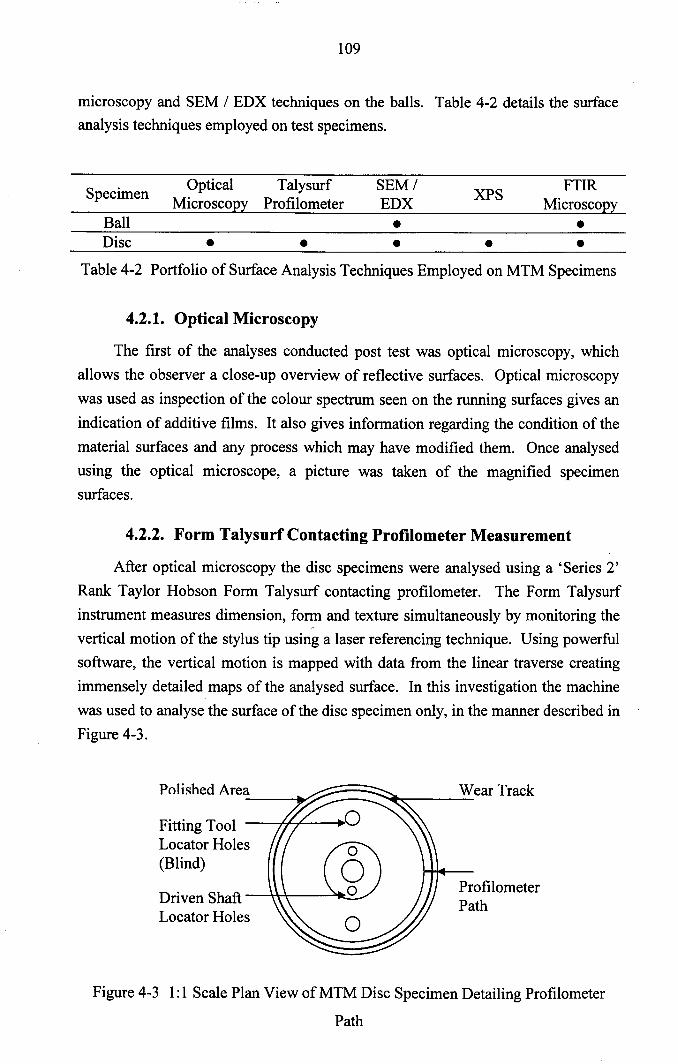
109
microscopy and SEM I EDX techniques on the balls. Table 4-2 details the surfaceanalysis techniques employed on test specimens.
Specimen Optical Talysurf SEMIXPS
FTIRMicroscopy Profilometer EDX Microsc02~
Ball • •Disc • • • • •
Table 4-2 Portfolio of Surface Analysis Techniques Employed on MTM Specimens
4.2.1. Optical Microscopy
The first of the analyses conducted post test was optical microscopy, whichallows the observer a close-up overview of reflective surfaces. Optical microscopywas used as inspection of the colour spectrum seen on the running surfaces gives an
indication of additive films. It also gives information regarding the condition of thematerial surfaces and any process which may have modified them. Once analysedusing the optical microscope, a picture was taken of the magnified specimensurfaces.
4.2.2. Form Talysurf Contacting Profilometer Measurement
After optical microscopy the disc specimens were analysed using a 'Series 2'Rank Taylor Hobson Form Talysurf contacting profilometer. The Form Talysurfinstrument measures dimension, form and texture simultaneously by monitoring thevertical motion of the stylus tip using a laser referencing technique. Using powerfulsoftware, the vertical motion is mapped with data from the linear traverse creatingimmensely detailed maps of the analysed surface. In this investigation the machinewas used to analyse the surface of the disc specimen only, in the manner described inFigure 4-3.
Fitting ToolLocator Holes(Blind)
Driven Shaft -""",\+~-__...~Locator Holes
ProfilometerPath
Figure 4-3 1:1 Scale Plan View of MTM Disc Specimen Detailing Profilometer
Path
110
The machine was used to give an indication of the w~ar profile and surfaceroughness of the disc, as well as information on the deposition of dense additiveagglomerates on the surface. In early experiments a series of traces were takenaround the wear track on the disc specimen. Analysis of these traces revealed thatthe wear track was very similar at all locations on the disc. For this reason, for lattertests a single profile trace was taken across the wear track of each disc specimen inas described in Figure 4-3.
4.2.3. Scanning Electron Microscopy and Energy Dispersive X-rayTechnique (SEM / EDX)
Both the disc and ball specimens were analysed using the SEMlEDXtechnique. The SEM analysis method uses a focussed high energy electron beamwhich scans back and forth across the specimen surface. The highly energeticelectrons strike the sample where various reactions can occur. The two principalforms of measurement take place using the so called 'secondary electrons' or'backscattered electrons'. The term 'secondary electron' refers to the ionization of aspecimen atom, caused by the passing of the high energy incident electron beam"near" to the atom. The beam passes near enough to a specimen atom to impartsome of its energy to the specimen's lower energy electron, causing a deviation inthe path of the incident electron beam. Each incident electron can produce severalsecondary electrons. The production of secondary electrons is very topographicallyrelated, as the energy carried by them is only sufficient to cause them to leave thesurface of the specimen should they be very close.to it (~<1Onm). The term'backscattered electrons' refers to the occurrence of a direct collision between theincident electron and an atom within the specimen which is nearly normal to theincident path. This causes the incident electron to be scattered backwards 180degrees. Before the beam moves to its next dwell-point an electron detectormeasures the number of interactions between the incident electron beam and thespecimen. This information is then converted into a small electrical signal which isamplified and converted into an image of the scanned surface (O'Connor, Sexton etal. 2003).
A spatial resolution of approximately 20 microns was used in the SEM andpermitted scanning of the wear track in isolation, for comparison with a scan of theunworn specimen surface.
After SEM had been conducted on the specimens the Energy Dispersive X-raytechnique was used. The basic premise behind the operation of EDX relies on theknocking off of electrons through interaction with the high energy electron beam. Aposition vacated by the removal of an inner shell electron is filled by a higher energy
111
electron from the outer shell. For this to be possible the transferring outer electron
must give up some of its energy by emitting an X-ray. The atom of every elementreleases X-rays with unique amounts of energy during the transferral process whichestablishes the identity of the atom from which it came. The EDX technique is notas surface orientated as the SEM measurement, as the X-rays are typically generatedin a region in a region approximately 2 microns below the surface, although depth isobviously dependent on beam energy. The technique gives elemental analysis of the
specimen substrate. For this investigation, the measurement was again carried outon two separate areas both inside and outside the specimen wear tracks (Vickerman1997).
4.2.4. X-ray Photon Spectroscopy (XPS)
X-ray Photon Spectroscopy is based on a phenomenon first outlined byEinstein in 1905, the photoelectric effect, where a photon beam is focused on thespecimen undergoing analysis, resulting in the excitation of photoelectrons. TheXPS technique is highly surface specific due to the short range of photoelectrons thatare excited from the solid (Figure 4-2). The energy of the photoelectrons leaving thesample is measured to create a spectrum with a series of photoelectron peaks. Thebinding energy of the peaks are characteristic of each element. The composition ofthe specimen surface can be determined through analysis of the peak areas. The
shape of each peak and the binding energy are slightly altered by the chemical stateof the emitting atom, hence XPS can provide chemical bonding information. Thus,for the purpose of this investigation; the technique is ideal as it detects carbon andoxygen present in a typical oxidised metal surface and fatty acid surface film, but thechemical bonding information differentiates the two. The technique is sensitive toall elements except hydrogen and helium, suggesting the detection of thin fatty acid
or amide films is possible (Vickerman 1997; O'Connor, Sexton et al. 2003).
XPS measurements are conducted in an Ultra High Vacuum (UHV) (10-9mbar)
condition to ensure atmospheric gas molecules are minimised and surfacedegradation is minute. Some geometric constraint is placed on components suitable
for analysis. For the Machine used in this investigation the aperture for specimens isapproximately SOmm in diameter, making analysis of the 4Smm diameter MTM discspecimen difficult, but possible. For the measurements conducted on the MTM discspecimens the spot-size of the beam was lrnm in diameter.
4.2.5. Fourier Transform InfraRed Microscopy (FTIR)
The operation of the FTIR microscopy has been previously discussed In
Section 3.S.1. In this investigation, both the ball and disc specimens were highlyreflective which aids the measurement technique by keeping the reflected portion of
112
infrared energy as high as possible. The analyses employed on the specimens bearssimilarity with the SEMlEDX analysis, where measurements were made both on thewear track and away from it for comparative purposes. However, using thistechnique the beam 'spot' can be focussed down to a few microns, permitting thedirect analysis of areas of interest such as the border between wear track and unwornsurface.
4.3. Mini Traction Machine Test
Bearing in mind the three main aims of the MTM investigation; to gauge theperformance of the friction modifier additives in the boundary regime, to investigatethe performance of the friction modifier additives in the mixed regime and to create
surface films for post test surface analysis, a bespoke program was developed.Guided by a series of initial tests and surface analyses the following operatingconditions were selected.
• A lubricant reservoir temperature of 125°e, to simulate the mostarduous lubricant condition as guided by the ASTM D 6837 SequenceVI-B engine test, a test designed to measure the effects of automotiveengine oils on the fuel economy of passenger cars.
• The ball was loaded onto the disc with a force of 2N, corresponding toa maximum Hertzian contact pressure of 0.5GPa. This light load wasselected for two reasons. Firstly, the grey cast iron disc is relativelysoft in comparison with a standard AISI 52100 specimen, and woreheavily at higher load conditions in preliminary tests. Secondly, it wasthought that a too heavy load might be detrimental to additive film
formation, and might simply remove film from the surfaces leaving
little for subsequent surface analysis.
• A Slide Roll Ratio (SRR) of 100% was selected for the tests. It is notideal to run the machine at pure sliding conditions, as is the case at thepiston assembly / cylinder liner interaction, as this may result in littlesurface film for surface analysis and high wear. Therefore a
compromise was made and it was decided to run at what is consideredto be an arduous condition in the MTM of 100% SRR. The Slide RollRatio is defined in this study by equation 6-1. For each measurementtaken both the standard SRR (ball moving faster than disc) and thereciprocal SRR (disc moving faster than ball) were taken and averaged
before a final traction coefficient was recorded.

PAGE1551 G1
ORIGI AL
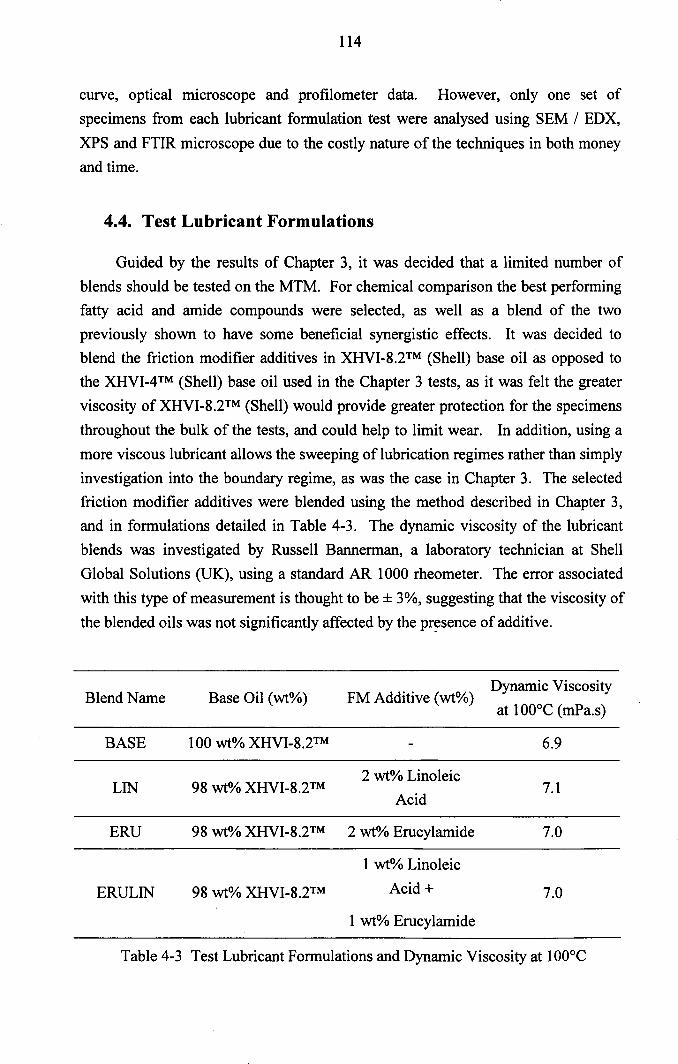
114
curve, optical microscope and profilometer data. However, only one set of
specimens from each lubricant formulation test were analysed using SEM / EDX,
XPS and FTIR microscope due to the costly nature of the techniques in both moneyand time.
4.4. Test Lubricant Formulations
Guided by the results of Chapter 3, it was decided that a limited number ofblends should be tested on the MTM. For chemical comparison the best performingfatty acid and amide compounds were selected, as well as a blend of the twopreviously shown to have some beneficial synergistic effects. It was decided toblend the friction modifier additives in XHVI-8.2TM (Shell) base oil as opposed tothe XHVI-4TM (Shell) base oil used in the Chapter 3 tests, as it was felt the greater
viscosity of XHVI-8.2TM (Shell) would provide greater protection for the specimens
throughout the bulk of the tests, and could help to limit wear. In addition, using a
more viscous lubricant allows the sweeping of lubrication regimes rather than simplyinvestigation into the boundary regime, as was the case in Chapter 3. The selectedfriction modifier additives were blended using the method described in Chapter 3,and in formulations detailed in Table 4-3. The dynamic viscosity of the lubricantblends was investigated by Russell Bannerman, a laboratory technician at ShellGlobal Solutions (UK), using a standard AR 1000 rheometer. The error associated
with this type of measurement is thought to be ± 3%, suggesting that the viscosity of
the blended oils was not significantly affected by the pr~sence of additive.
Blend Name Base Oil (wt%) FM Additive (wt%)Dynamic Viscosity
at 100°C (mPa.s)
BASE 100 wt% XHVI-8.2TM 6.9
2 wt% LinoleicLIN 98 wt% XHVI-8.2TM 7.1
Acid
ERU 98 wt% XHVI-8.2TM 2 wt% Erucylamide 7.0
1 wt% Linoleic
ERULIN 98 wt% XHVI-8.2TM Acid+ 7.0
1 wt% Erucylamide
Table 4-3 Test Lubricant Formulations and Dynamic Viscosity at 100°C
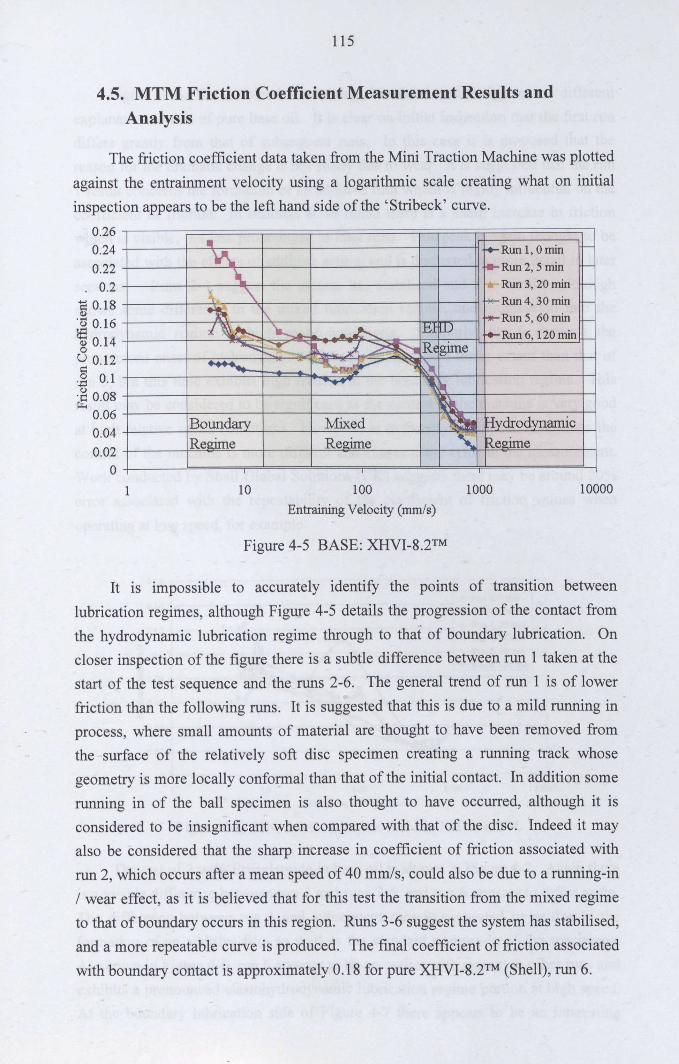
115
4.5. MTM Friction Coefficient Measurement Results andAnalysis
The friction coefficient data taken from the Mini Traction Machine was plotted
against the entrainment velocity using a logarithmic scale creating what on initial
inspection appears to be the left hand side of the 'Stribeck' curve.
0.260.240.22
. 0.2"S 0.18Q)
'Cj 016!fl'Q) 0.14oU 0.12-=:.i: 0.1urE 0.08
0.060.040.02
o
• .......Run 1, 0 min -v,"'- ..... Run2,5min -
Run 3, 20 min -')( "-" "*"' Run 4,30 min -
~ ~ -- Run 5, 60 min -,~ 'a. .....~ El ill r.- Run 6, 120 min e-~ ,,:::r_ io: :L~ R~glIDe.......... ~r-'~ ~......... ,~
~Boundarv Mixed .~ HydrodynamicReaime Regime "' Regime
1 10 100
Entraining Velocity (mm/s)
1000 10000
Figure 4-5 BASE: XHVI-8.2TM
It is impossible to accurately identify the points of transition between
lubrication regimes, although Figure 4-5 details the progression of the contact fromthe hydrodynamic lubrication regime through to that of boundary lubrication. Oncloser inspection of the figure there is a subtle difference between run 1 taken at thestart of the test sequence and the runs 2-6. The general trend of run 1 is of lower
friction than the following runs. It is suggested that this is due to a mild running inprocess, where small amounts of material are thought to have been removed fromthe surface of the relatively soft disc specimen creating a running track whosegeometry is more locally conformal than that of the initial contact. In addition somerunning in of the ball specimen is also thought to have occurred, although it isconsidered to be insignificant when compared with that of the disc. Indeed it mayalso be considered that the sharp increase in coefficient of friction associated with
run 2, which occurs after a mean speed of 40 mm/s, could also be due to a running-in/ wear effect, as it is believed that for this test the transition from the mixed regimeto that of boundary occurs in this region. Runs 3-6 suggest the system has stabilised,and a more repeatable curve is produced. The final coefficient of friction associated
with boundary contact is approximately 0.18 for pure XHVI-8.2TM (Shell), run 6.
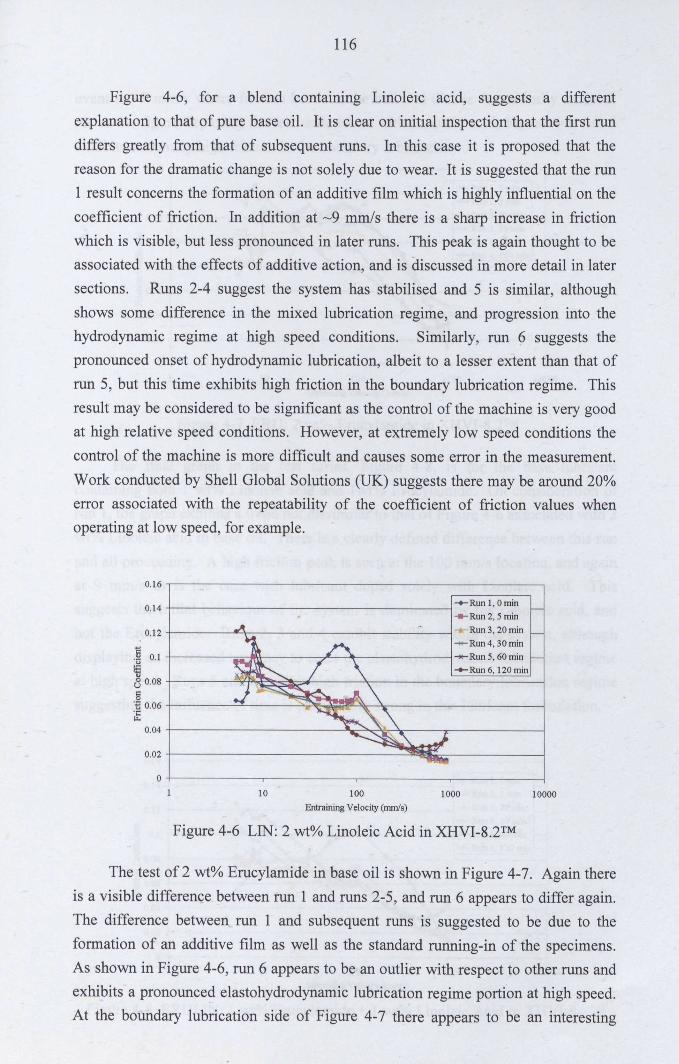
116
Figure 4-6, for a blend containing Linoleic acid, suggests a different
explanation to that of pure base oil. It is clear on initial inspection that the first rundiffers greatly from that of subsequent runs. In this case it is proposed that thereason for the dramatic change is not solely due to wear. It is suggested that the run1 result concerns the formation of an additive film which is highly influential on the
coefficient of friction. In addition at ~9 mmls there is a sharp increase in frictionwhich is visible, but less pronounced in later runs. This peak is again thought to beassociated with the effects of additive action, and is discussed in more detail in latersections. Runs 2-4 suggest the system has stabilised and 5 is similar, althoughshows some difference in the mixed lubrication regime, and progression into thehydrodynamic regime at high speed conditions. Similarly, run 6 suggests thepronounced onset of hydrodynamic lubrication, albeit to a lesser extent than that ofrun 5, but this time exhibits high friction in the boundary lubrication regime. Thisresult may be considered to be significant as the control of the machine is very goodat high relative speed conditions. However, at extremely low speed conditions the
control of the machine is more difficult and causes some error in the measurement.
Work conducted by Shell Global Solutions (UK) suggests there may be around 20%error associated with the repeatability of the coefficient of friction values whenoperating at low speed, for example.
0.16,-------------------------,
0.14+- -+-Run1,0min
--- Run2,5min0.12 Run3,20min
.......Run4,30min
.~ 0.1+------;..-il!\\---~,;c-~-----____j _,._Run5, 60min
~ ......Run6, 120min
8 0.08+--:-----'~~~~~--~-----=====~§ -I----~[_-~~~~~~~--------~'B 0.06J:
0.04+----------~;__"'o<~-_T--_r_----__i
O+------,-----.-----~----__i10 100
EntrainingVelocity(mrn/s)1000 10000
Figure 4-6 LIN: 2 wt% Linoleic Acid in XHVI-8.2TM
The test of2 wt% Erucylamide in base oil is shown in Figure 4-7. Again thereis a visible difference between run 1 and runs 2-5, and run 6 appears to differ again.The difference between run 1 and subsequent runs is suggested to be due to theformation of an additive film as well as the standard running-in of the specimens.As shown in Figure 4-6, run 6 appears to be an outlier with respect to other runs andexhibits a pronounced elastohydrodynamic lubrication regime portion at high speed.At the boundary lubrication side of Figure 4-7 there appears to be an interesting
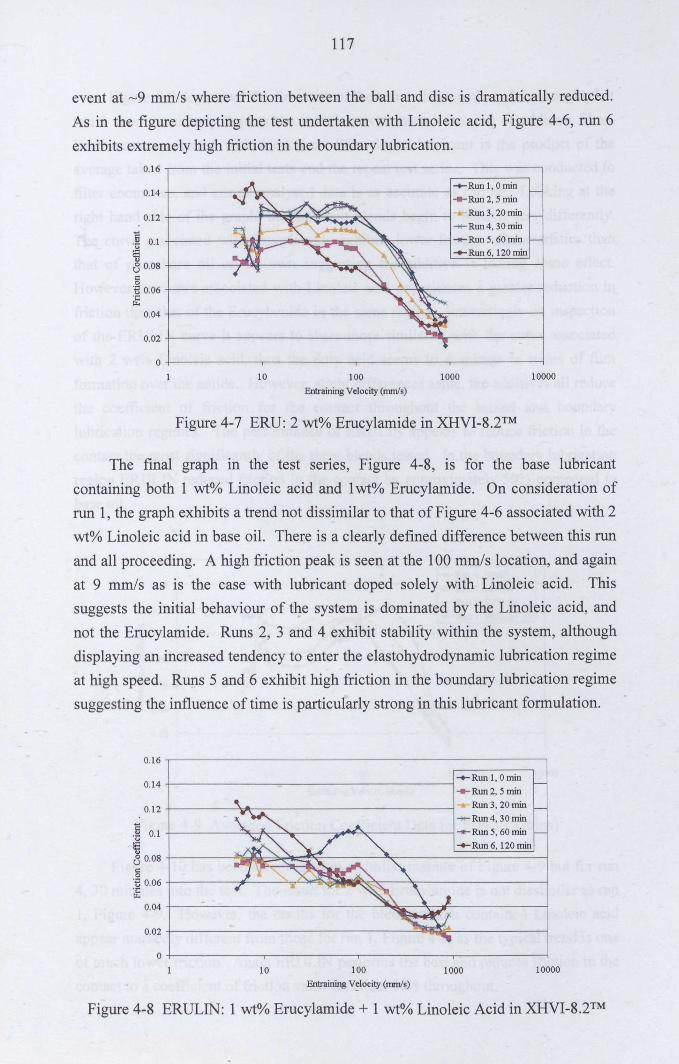
117
event at ~9 mmls where friction between the ball and disc is dramatically reduced.
As in the figure depicting the test undertaken with Linoleic acid, Figure 4-6, run 6
exhibits extremely high friction in the boundary lubrication.0.16,_-----------------------,
O+------,-----~-----,_----~10 100
EntrainingVelocity(rrunls)
1000 10000
Figure 4-7 ERU: 2 wt% Erucylamide in XHVI-8.2TM
The final graph in the test series, Figure 4-8, is for the base lubricantcontaining both 1 wt% Linoleic acid and 1wt% Erucylamide. On consideration ofrun 1, the graph exhibits a trend not dissimilar to that of Figure 4-6 associated with 2wt% Linoleic acid in base oil. There is a clearly defined difference between this run
and all proceeding. A high friction peak is seen at the 100 mmls location, and againat 9 mmls as is the case with lubricant doped solely with Linoleic acid. Thissuggests the initial behaviour of the system is dominated by the Linoleic acid, andnot the Erucylamide. Runs 2, 3 and 4 exhibit stability within the system, althoughdisplaying an increased tendency to enter the elastohydrodynamic lubrication regimeat high speed. Runs 5 and 6 exhibit high friction in the boundary lubrication regimesuggesting the influence of time is particularly strong in this lubricant formulation.
0.16.-------------------------------,
0.14+- ---,,--- .....Run1.Omin.... Run Z,5min
0.12+- ~_----------- .......Run3.20min-- Run4.30min
,Wi 0.1 -lI<-Run5.60min
~ t ~~~~~~~:;~-J~~-~=.....==~=n=6.=1=20=m=in~80.08
s'B 0.06+----~--~v~~~~~~~._------___1·c~
0.04 +--..:...._----------~=_~___J~-------1
O+-----~-----~-----~----~10 100
EntrainingV"locity(mm1s)
1000 10000
Figure 4-8 ERULIN: 1 wt% Erucylamide + 1 wt% Linoleic Acid in XHVI-8.2TM
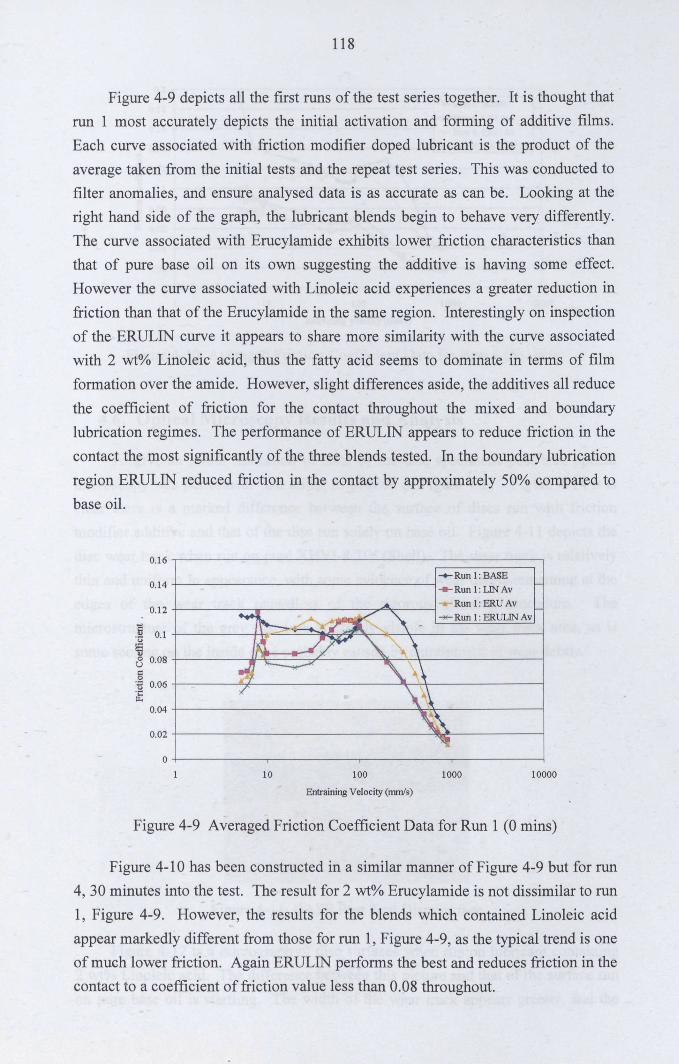
118
Figure 4-9 depicts all the first runs of the test series together. It is thought thatrun 1 most accurately depicts the initial activation and forming of additive films.
Each curve associated with friction modifier doped lubricant is the product of theaverage taken from the initial tests and the repeat test series. This was conducted tofilter anomalies, and ensure analysed data is as accurate as can be. Looking at theright hand side of the graph, the lubricant blends begin to behave very differently.The curve associated with Erucylamide exhibits lower friction characteristics thanthat of pure base oil on its own suggesting the additive is having some effect.However the curve associated with Linoleic acid experiences a greater reduction infriction than that of the Erucylamide in the same region. Interestingly on inspectionof the ERULIN curve it appears to share more similarity with the curve associatedwith 2 wt% Linoleic acid, thus the fatty acid seems to dominate in terms of film
formation over the amide. However, slight differences aside, the additives all reducethe coefficient of friction for the contact throughout the mixed and boundarylubrication regimes. The performance of ERULIN appears to reduce friction in the
contact the most significantly of the three blends tested. In the boundary lubricationregion ERULIN reduced friction in the contact by approximately 50% compared tobase oil.
0.16..,-------------------------,
-+-Run1:BASE0.14+----------------j ......Run1:LIN Av
Run1:ERUAv0.12+-------...-----------;;>""""------1
__ Run1:ERUUN Av
.~ 0.1+-----++.r=-~=.q..,,;"iF'T----___\-------_i~8 0.08+----_JJ~==~:.c::----_:~~~------__jc:o·B 0.06+------'¥----------'\---'r-\-------_i~
O+------,-----,-----,-----~10 100
EntrainingVelocity(mm/s)
1000 10000
Figure 4-9 Averaged Friction Coefficient Data for Run 1 (0 mins)
Figure 4-10 has been constructed in a similar manner of Figure 4-9 but for run4,30 minutes into the test. The result for 2 wt% Erucylamide is not dissimilar to run1, Figure 4-9. However, the results for the blends which contained Linoleic acidappear markedly different from those for run 1, Figure 4-9, as the typical trend is oneof much lower friction. Again ERULIN performs the best and reduces friction in thecontact to a coefficient of friction value less than 0.08 throughout.
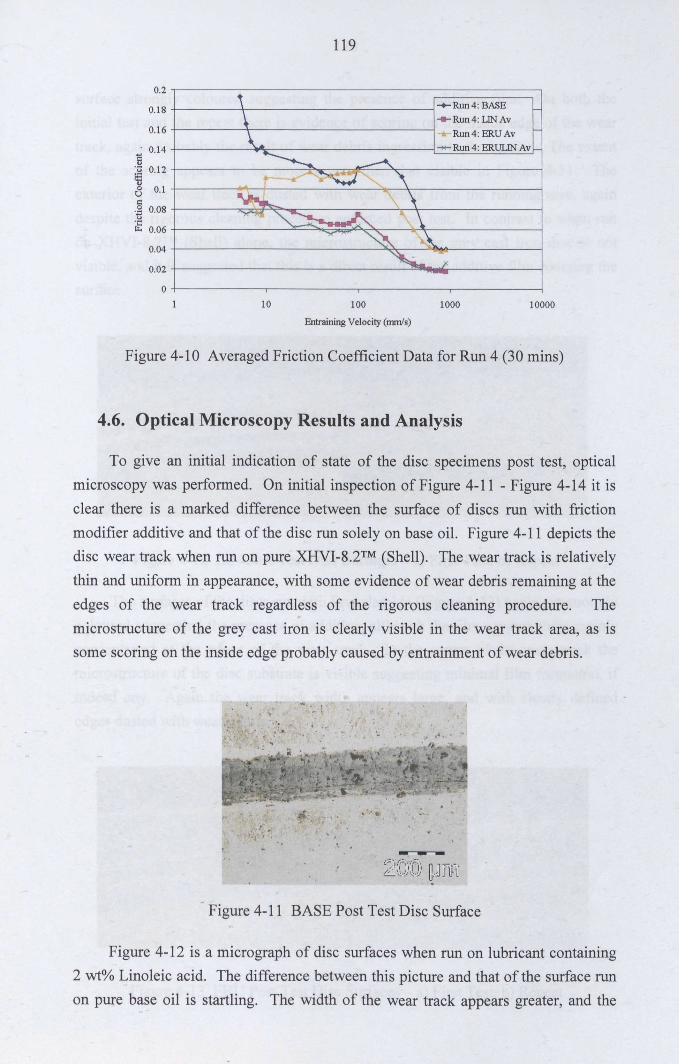
119
0.2 -,----------------------_
0.18+-----+-------------I-+- Run4:BASE--Run4:LINAv
0.16+------\-------------1 Run4:ERUAv
. 0.14 -ee--Runq: ERULINAv
"5·u 0.12 +---------~~=~-~-------______IEl"8 0.1+---~~~-------~~~------~c:._g 0.08 +-----">C:i<x3F~__---_=_------\------______I
& 0.06+-------_:~~~=~~--""'\__-----______j0.04+---------------"'~---'Jo.f~----______I
0.Q2 +-----------------"'" ...........----______1
0+------.-----,------.----------1
10 100
EntrainingVelocity(mm/s)
1000 10000
Figure 4-10 Averaged Friction Coefficient Data for Run 4 (30 mins)
4.6. Optical Microscopy Results and Analysis
To give an initial indication of state of the disc specimens post test, opticalmicroscopy was performed. On initial inspection of Figure 4-11 - Figure 4-14 it isclear there is a marked difference between the surface of discs run with frictionmodifier additive and that of the disc run solely on base oil. Figure 4-11 depicts thedisc wear track when run on pure XHVI-8.2TM (Shell). The wear track is relatively
thin and uniform in appearance, with some evidence of wear debris remaining at theedges of the wear track regardless of the rigorous cleaning procedure. Themicrostructure of the grey cast iron is clearly visible in the wear track area, as issome scoring on the inside edge probably caused by entrainment of wear debris .
.... '. ;. ~,• >.
_ 2Ii:., .... ~ .... " ...~~, . - .. -
Figure 4-11 BASE Post Test Disc Surface
Figure 4-12 is a micrograph of disc surfaces when run on lubricant containing2 wt% Linoleic acid. The difference between this picture and that of the surface run
on pure base oil is startling. The width of the wear track appears greater, and the
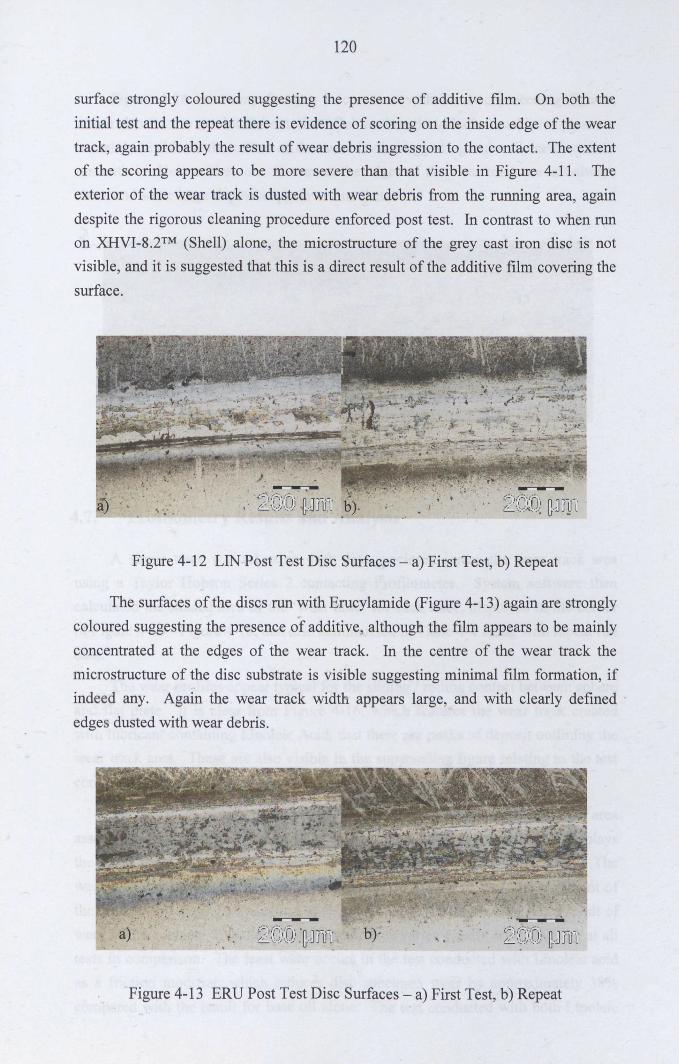
120
surface strongly coloured suggesting the presence of additive film. On both the
initial test and the repeat there is evidence of scoring on the inside edge of the weartrack, again probably the result of wear debris ingression to the contact. The extentof the scoring appears to be more severe than that visible in Figure 4-11. The
exterior of the wear track is dusted with wear debris from the running area, againdespite the rigorous cleaning procedure enforced post test. In contrast to when runon XHVI-8.2TM (Shell) alone, the microstructure of the grey cast iron disc is notvisible, and it is suggested that this is a direct result of the additive film covering thesurface.
Figure 4-12 LIN Post Test Disc Surfaces - a) First Test, b) Repeat
The surfaces of the discs run with Erucylamide (Figure 4-13) again are strongly
coloured suggesting the presence of additive, although the film appears to be mainlyconcentrated at the edges of the wear track. In the centre of the wear track themicrostructure of the disc substrate is visible suggesting minimal film formation, ifindeed any. Again the wear track width appears large, and with clearly definededges dusted with wear debris.
... .
Figure 4-13 ERU Post Test Disc Surfaces - a) First Test, b) Repeat
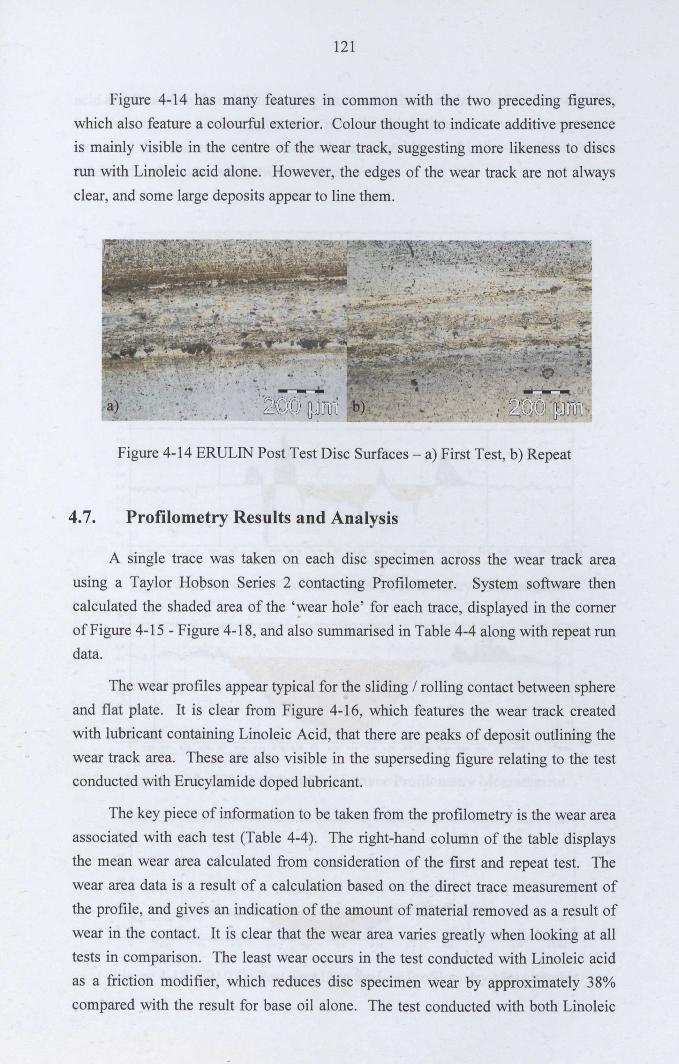
121
Figure 4-14 has many features in common with the two preceding figures,which also feature a colourful exterior. Colour thought to indicate additive presenceis mainly visible in the centre of the wear track, suggesting more likeness to discs
run with Linoleic acid alone. However, the edges of the wear track are not alwaysclear, and some large deposits appear to line them.
Figure 4-14 ERULIN Post Test Disc Surfaces - a) First Test, b) Repeat
4.7. Profilometry Results and Analysis
A single trace was taken on each disc specimen across the wear track area
using a Taylor Hobson Series 2 contacting Profilometer. System software thencalculated the shaded area of the 'wear hole' for each trace, displayed in the cornerof Figure 4-15 - Figure 4-18, and also summarised in Table 4-4 along with repeat rundata.
The wear profiles appear typical for the sliding / rolling contact between sphereand flat plate. It is clear from Figure 4-16, which features the wear track createdwith lubricant containing Linoleic Acid, that there are peaks of deposit outlining thewear track area. These are also visible in the superseding figure relating to the testconducted with Erucylamide doped lubricant.
The key piece of information to be taken from the profilometry is the wear areaassociated with each test (Table 4-4). The right-hand column of the table displaysthe mean wear area calculated from consideration of the first and repeat test. The
wear area data is a result of a calculation based on the direct trace measurement ofthe profile, and gives an indication of the amount of material removed as a result ofwear in the contact. It is clear that the wear area varies greatly when looking at alltests in comparison. The least wear occurs in the test conducted with Linoleic acidas a friction modifier, which reduces disc specimen wear by approximately 38%compared with the result for base oil alone. The test conducted with both Linoleic
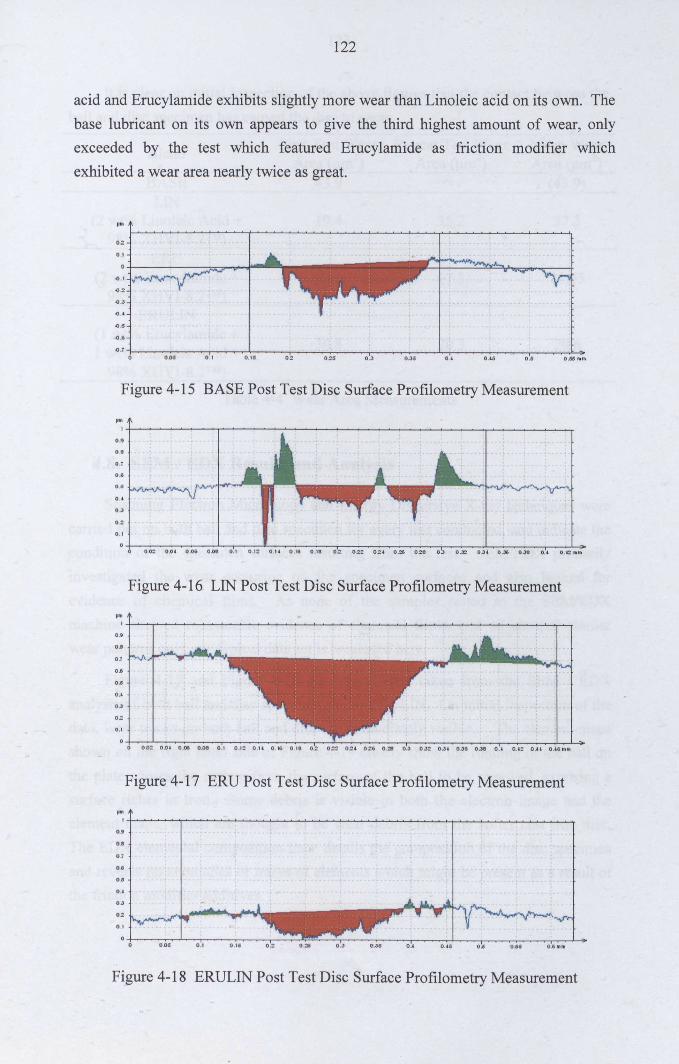
122
acid and Erucylamide exhibits slightly more wear than Linoleic acid on its own. Thebase lubricant on its own appears to give the third highest amount of wear, onlyexceeded by the test which featured Erucylamide as friction modifier whichexhibited a wear area nearly twice as great.
,Oh
o .s
c.e
.0.1i---OD~.-~:r-~--.-,IO.I~5--,-----O~-. --,---~~o~.>-. --'-0'-. --0~.'5---'----0"' .ss--i>'mm
Figure 4-15 BASE Post Test Disc Surface Profilometry Measurement
'"'+----~~--,------~-------~---------------.-------~I0._0 .e
0.1'
0.6
0.6
0.'0.>
0.0
0.1
0.0::: 0.04 0.06 c.oe I O.I~ 0,'4 D.WS 0.18 O.JC O.H 0.3& 0.38
Figure 4-16 LIN Post Test Disc Surface Profilometry Measurement
,OhI~~~-----~~--~----~------~----~---~--~~----~~,0._O.O.i'
0.'o~
o~
0.1
Figure 4-17 ERU Post Test Disc Surface Profilometry Measurement
'"'+------,~~~~~~----~--~~--~~~~~~--~~~~----;0.'o.0.7
O.o.
0.1
Figure 4-18 ERULIN Post Test Disc Surface Profilometry Measurement
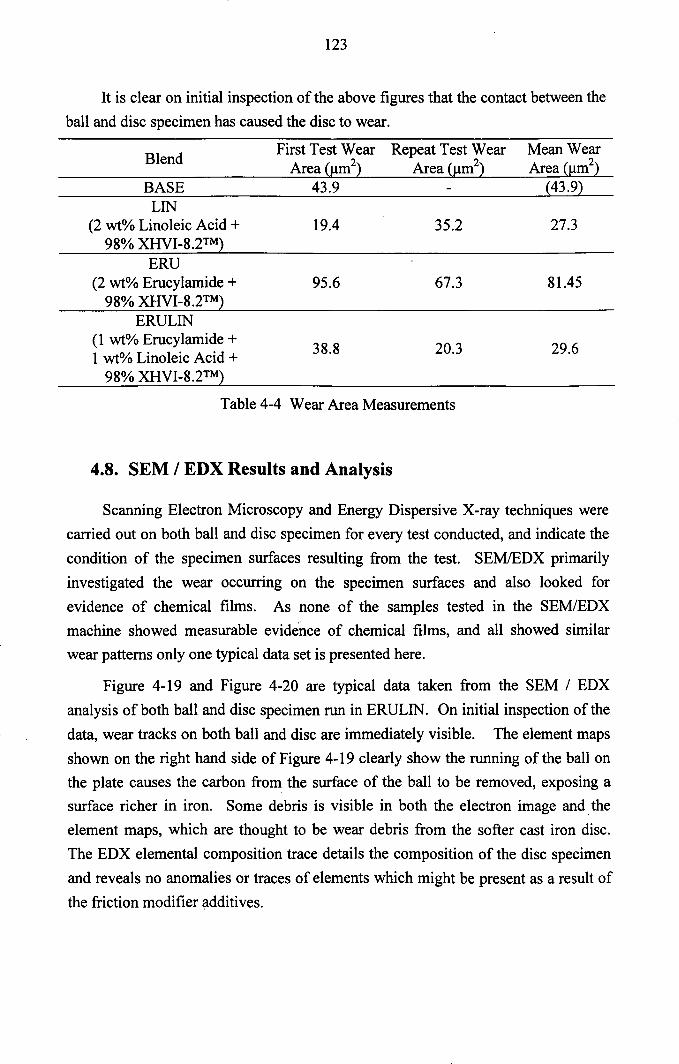
123
It is clear on initial inspection of the above figures that the contact between the
ball and disc specimen has caused the disc to wear.
Blend First Test Wear Repeat Test Wear Mean WearArea (J,lm2) Area (Jlm2) Area (J,lm2)
BASE 43.9 (43.9)LIN
(2 wt% Linoleic Acid + 19.4 35.2 27.398% XHVI-8.2TM)
ERU(2 wt% Erucylamide + 95.6 67.3 81.4598% XHVI-8.2TM)
ERULIN(1 wt% Erucylamide +
38.8 20.3 29.61 wt% Linoleic Acid +98% XHVI-8.2TM)
Table 4-4 Wear Area Measurements
4.8. SEM / EDX Results and Analysis
Scanning Electron Microscopy and Energy Dispersive X-ray techniques were
carried out on both ball and disc specimen for every test conducted, and indicate thecondition of the specimen surfaces resulting from the test. SEMlEDX primarily
investigated the wear occurring on the specimen surfaces and also looked for
evidence of chemical films. As none of the samples tested in the SEM/EDXmachine showed measurable evidence of chemical films, and all showed similarwear patterns only one typical data set is presented here.
Figure 4-19 and Figure 4-20 are typical data taken from the SEM I EDX
analysis of both ball and disc specimen run in ERULIN. On initial inspection of the
data, wear tracks on both ball and disc are immediately visible. The element mapsshown on the right hand side of Figure 4-19 clearly show the running of the ball onthe plate causes the carbon from the surface of the ball to be removed, exposing asurface richer in iron. Some debris is visible in both the electron image and theelement maps, which are thought to be wear debris from the softer cast iron disc.The EDX elemental composition trace details the composition of the disc specimen
and reveals no anomalies or traces of elements which might be present as a result ofthe friction modifier additives.
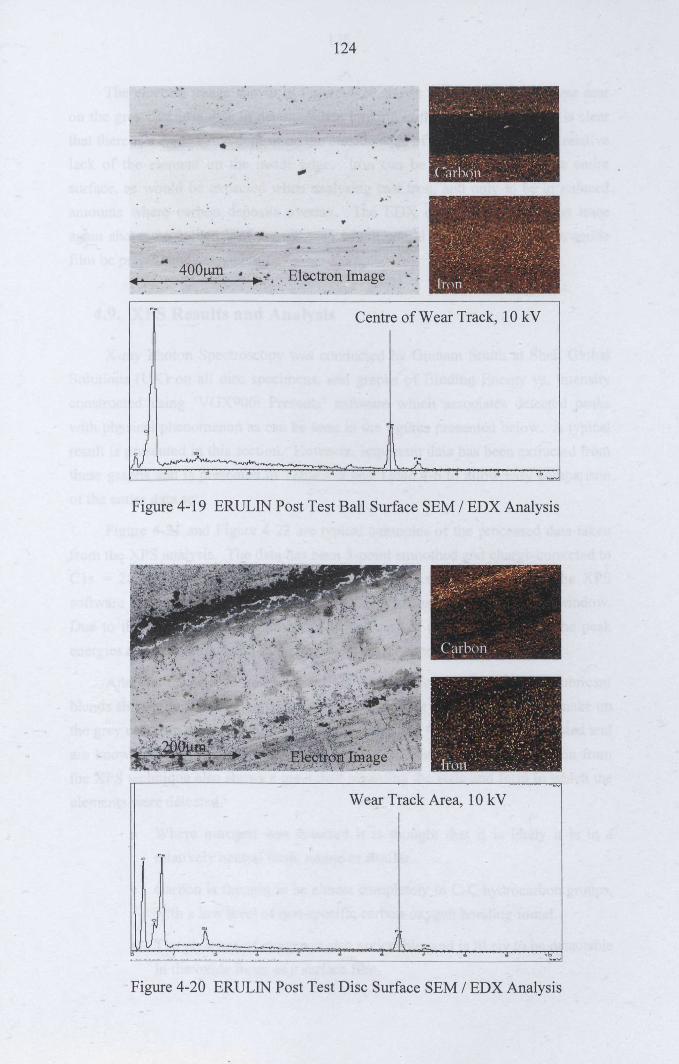
124
,.
.... .~.
~ ~ .
...... -'-r---,-,. ~,...,.O_O--,l-!illo:..,.. ......:.___,.-1....::.,••. ,:Electron Image.:.
-~ i .
"-
Centre of Wear Track, 10 kV
c
lJ A )_l., _h~~, 3 . . . 7 . 0 '0 ._v
Figure 4-19 ERUUN Post Test Ball Surface SEM / EDX Analysis
.
Wear Track Area, 10 kV
.... _... .... ' ... . . .Figure 4-20 ERUUN Post Test Disc Surface SEM / EDX Analysis
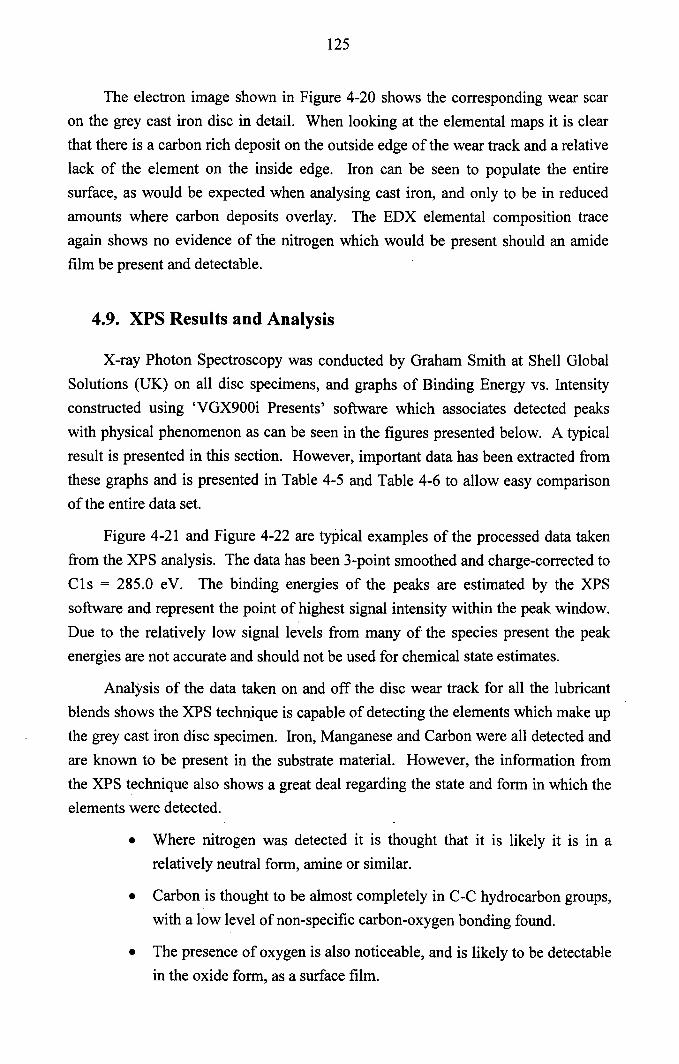
125
The electron image shown in Figure 4-20 shows the corresponding wear scaron the grey cast iron disc in detail. When looking at the elemental maps it is clearthat there is a carbon rich deposit on the outside edge of the wear track and a relativelack of the element on the inside edge. Iron can be seen to populate the entiresurface, as would be expected when analysing cast iron, and only to be in reducedamounts where carbon deposits overlay. The EDX elemental composition traceagain shows no evidence of the nitrogen which would be present should an amidefilm be present and detectable.
4.9. XPS Results and Analysis
X-ray Photon Spectroscopy was conducted by Graham Smith at Shell GlobalSolutions (UK) on all disc specimens, and graphs of Binding Energy vs. Intensityconstructed using 'VGX900i Presents' software which associates detected peaks
with physical phenomenon as can be seen in the figures presented below. A typicalresult is presented in this section. However, important data has been extracted fromthese graphs and is presented in Table 4-5 and Table 4-6 to allow easy comparisonof the entire data set.
Figure 4-21 and Figure 4-22 are typical examples of the processed data takenfrom the XPS analysis. The data has been 3-point smoothed and charge-corrected to
CIs = 285.0 eV. The binding energies of the peaks are estimated by the XPSsoftware and represent the point of highest signal intensity within the peak window.
Due to the relatively low signal levels from many of the species present the peakenergies are not accurate and should not be used for chemical state estimates.
Analysis of the data taken on and off the disc wear track for all the lubricantblends shows the XPS technique is capable of detecting the elements which make upthe grey cast iron disc specimen. Iron, Manganese and Carbon were all detected andare known to be present in the substrate material. However, the information fromthe XPS technique also shows a great deal regarding the state and form in which theelements were detected.
• Where nitrogen was detected it is thought that it is likely it is in arelatively neutral form, amine or similar.
• Carbon is thought to be almost completely in C-C hydrocarbon groups,
with a low level of non-specific carbon-oxygen bonding found.
• The presence of oxygen is also noticeable, and is likely to be detectablein the oxide form, as a surface film.
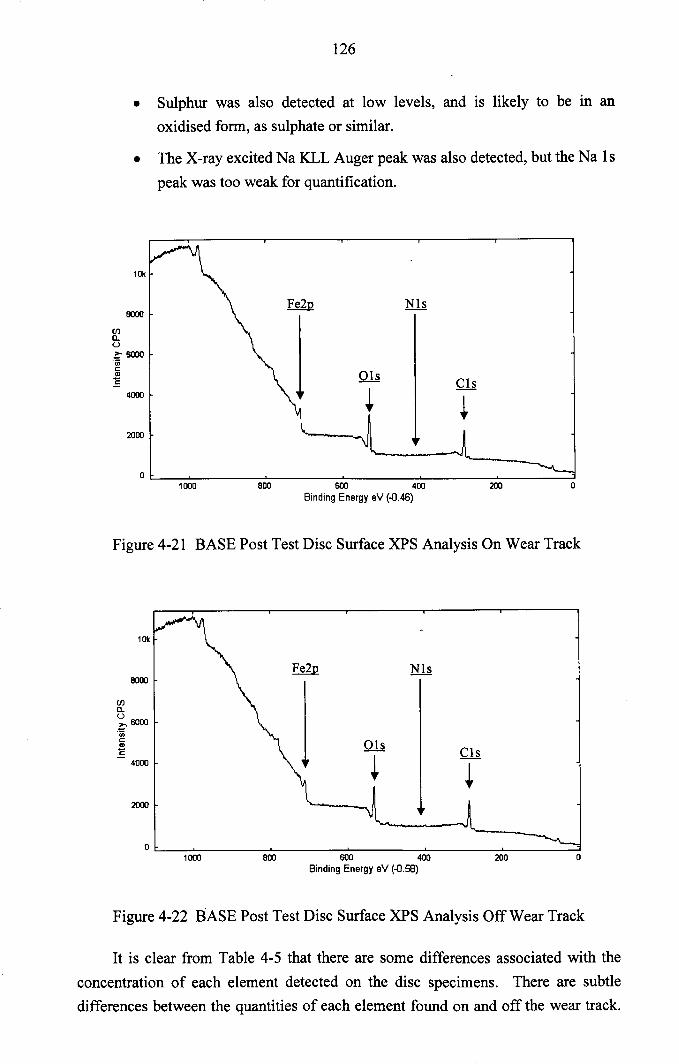
126
• Sulphur was also detected at low levels, and is likely to be in an
oxidised form, as sulphate or similar.
• The X-ray excited Na KLL Auger peak was also detected, but the Na Is
peak was too weak for quantification.
2000
8000
C/ln,U
:~' SOOOc:.,"E
4000
1000 800 SOO 400Binding Energy eV (.0.46)
200 o
Figure 4-21 BASE Post Test Disc Surface XPS Analysis On Wear Track
2000
8000
C/ln,U>- SOOO.t:enc:Cl>"E
4000
1000 800 SOO 400Binding Energy eV (.0.58)
200 o
Figure 4-22 BASE Post Test Disc Surface XPS Analysis Off Wear Track
It is clear from Table 4-5 that there are some differences associated with the
concentration of each element detected on the disc specimens. There are subtledifferences between the quantities of each element found on and off the wear track.
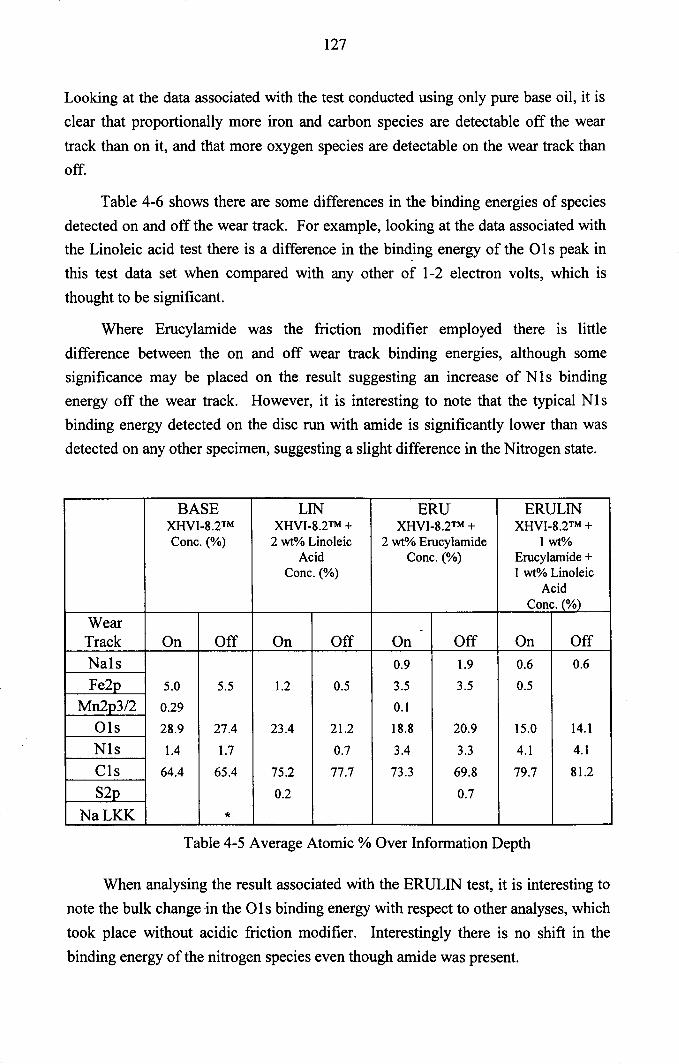
127
Looking at the data associated with the test conducted using only pure base oil, it is
clear that proportionally more iron and carbon species are detectable off the wear
track than on it, and that more oxygen species are detectable on the wear track thanoff.
Table 4-6 shows there are some differences in the binding energies of speciesdetected on and off the wear track. For example, looking at the data associated withthe Linoleic acid test there is a difference in the binding energy of the 01 s peak inthis test data set when compared with any other of 1-2 electron volts, which is
thought to be significant.
Where Erucylamide was the friction modifier employed there is littledifference between the on and off wear track binding energies, although somesignificance may be placed on the. result suggesting an increase of NI s bindingenergy off the wear track. However, it is interesting to note that the typical Nlsbinding energy detected on the disc run with amide is significantly lower than wasdetected on any other specimen, suggesting a slight difference in the Nitrogen state.
BASE LIN ERU ERULINXHVI-8.2TM XHVI-8.2TM + XHVI-8.2TM + XHVI-8.2TM +Cone. (%) 2 ~Io Linoleic 2 ~Io Erueylamide 1 wt%
Acid Cone. (%) Erueylamide +Cone. (%) 1 wt% Linoleic
AcidCone. (%)
Wear -Track On Off On Off On Off On OffNals 0.9 1.9 0.6 0.6
Fe2p 5.0 5.5 1.2 0.5 3.5 3.5 0.5
Mn2p3/2 0.29 0.1
01s 28.9 27.4 23.4 21.2 18.8 20.9 15.0 14.1
Nls 1.4 1.7 0.7 3.4 3.3 4.1 4.1
CIs 64.4 65.4 75.2 77.7 73.3 69.8 79.7 81.2
S2p 0.2 0.7
NaLKK *Table 4-5 Average Atomic %Over Information Depth
When analysing the result associated with the ERULIN test, it is interesting tonote the bulk change in the 0 I s binding energy with respect to other analyses, which
took place without acidic friction modifier. Interestingly there is no shift in thebinding energy of the nitrogen species even though amide was present.
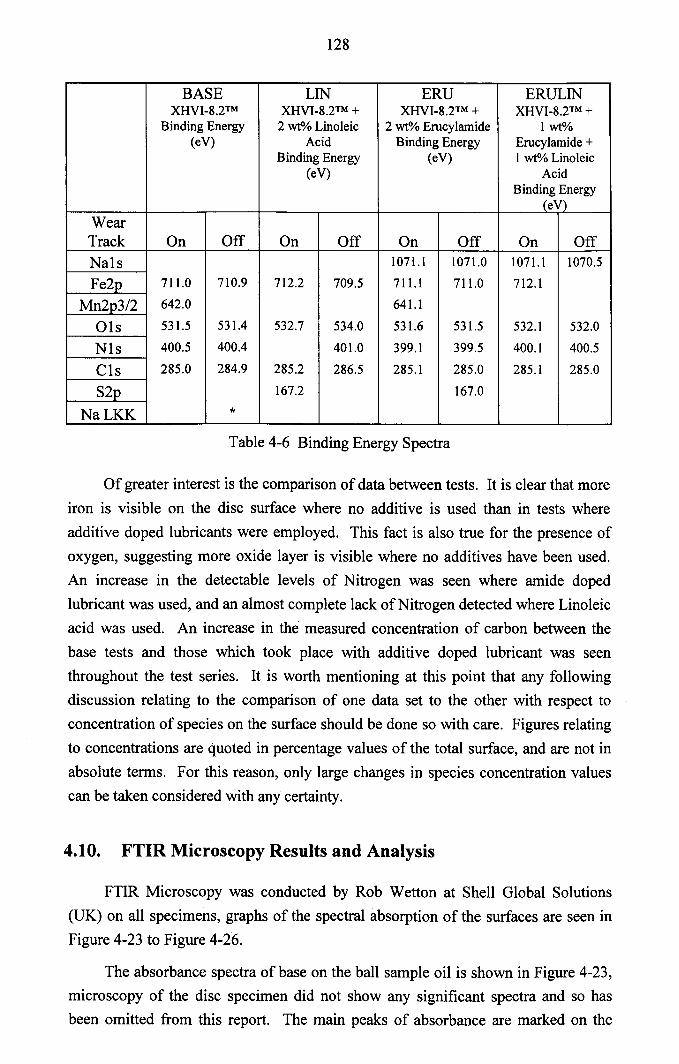
128
BASE LIN ERU ERULINXHVI-8.2TM XHVI-8.2TM + XHVI-8.2TM + XHVI-8.2TM +
Binding Energy 2 wt"10Linoleic 2 wt"10Erucylamide 1 wt%(eV) Acid Binding Energy Erucylamide +
Binding Energy (eV) 1 wt% Linoleic(eV) Acid
Binding Energy(eV)
WearTrack On Off On Off On Off On OffNals 1071.1 1071.0 1071.1 1070.5
Fe2p 711.0 710.9 712.2 709.5 711.1 711.0 712.1
Mn2p3/2 642.0 641.1
Ois 531.5 531.4 532.7 534.0 531.6 531.5 532.1 532.0
Nis 400.5 400.4 401.0 399.1 399.5 400.1 400.5
CIs 285.0 284.9 285.2 286.5 285.1 285.0 285.1 285.0
S2p 167.2 167.0
NaLKK *
Table 4-6 Binding Energy Spectra
Of greater interest is the comparison of data between tests. It is clear that more
iron is visible on the disc surface where no additive is used than in tests whereadditive doped lubricants were employed. This fact is also true for the presence ofoxygen, suggesting more oxide layer is visible where no additives have been used.An increase in the detectable levels of Nitrogen was seen where amide doped
lubricant was used, and an almost complete lack of Nitrogen detected where Linoleicacid was used. An increase in the measured concentration of carbon between thebase tests and those which took place with additive doped lubricant was seenthroughout the test series. It is worth mentioning at this point that any followingdiscussion relating to the comparison of one data set to the other with respect toconcentration of species on the surface should be done so with care. Figures relatingto concentrations are quoted in percentage values of the total surface, and are not in
absolute terms. For this reason, only large changes in species concentration valuescan be taken considered with any certainty.
4.10. FTIR Microscopy Results and Analysis
FTIR Microscopy was conducted by Rob Wetton at Shell Global Solutions(UK) on all specimens, graphs of the spectral absorption of the surfaces are seen inFigure 4-23 to Figure 4-26.
The absorbance spectra of base on the ball sample oil is shown in Figure 4-23,microscopy of the disc specimen did not show any significant spectra and so hasbeen omitted from this report. The main peaks of absorbance are marked on the
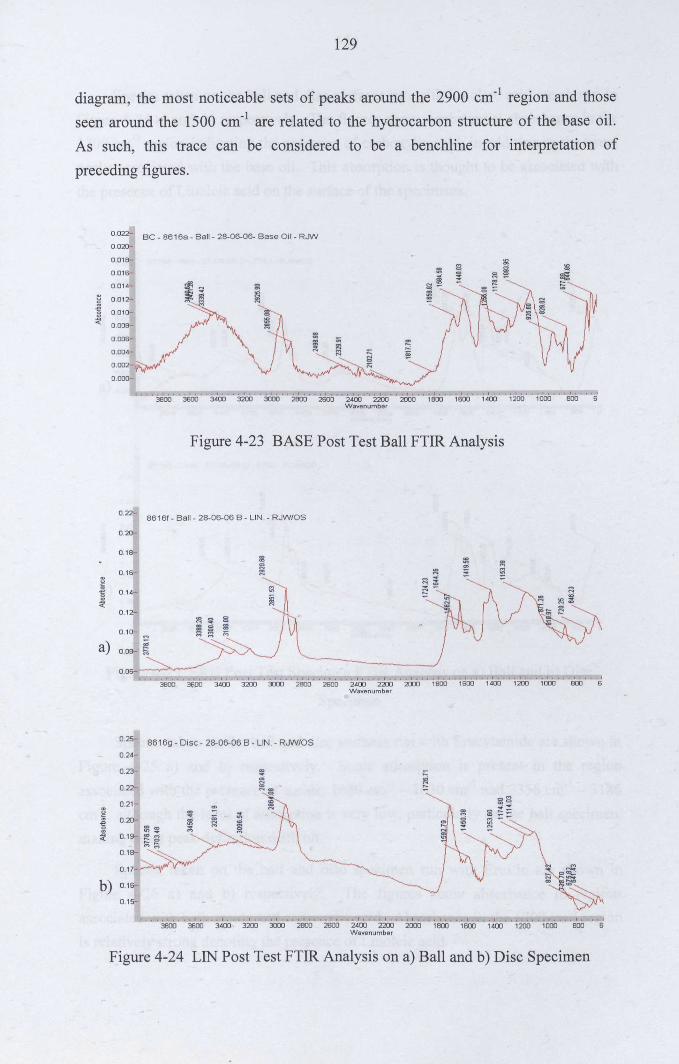
129
diagram, the most noticeable sets of peaks around the 2900 cm-1 region and thoseseen around the 1500 cm-1 are related to the hydrocarbon structure of the base oil.
As such, this trace can be considered to be a benchline for interpretation of
preceding figures.
0.022-
0.020-
0.018-
0.01&-
0.014-
0.012-
0.010-
0.008-
o.oos-0.004-
0.002-
BC - 8616a - Ball - 28-06-06- Base Oi I - RJW
0.000-
J.,., I •• ,. I •• ,. 1 •• ,." ••• I."., .,. I ••• , I ••• ,I. ,., ,.". I" •• L,." I". ,I •••• I., •• 13800 3600 3400 3200 3000 2800 2600 2400 2200 2000 1800 1600 1400 1200 1000 800 6
Wavenumber
Figure 4-23 BASE Post Test Ball FTIR Analysis
0.22-86161 - Bali - 28-06-06 B - LIN. - RJW/OS
0.20-
0.18-!8
0.1&- fil-El 0.14- !ri
~ ~0.12-
0.10-
) ;ea 0.08- ~
0.06-I ~ ••• I •• , • I I •• , l, , •• I •• , • .1 ... , • , , ••• , •••• I • , •• I, ., I • , • , I • , •• I , ••• I , , •• , • , , • , , •• , I • , , , I
3800 3600 3400 3200 3000 2800 2600 2400 2200 2000 1800 1600 1400 1200 1aDO 800 6Wavenumber
0.25-8616g - Disc - 28-06-06 B - LIN. - R.NV/OS
0.24-
0.23-
0.22- ~Q),-'"~ 0.211- ~~
0.20-~~
0.18-
b) 0.1&-
0.1S-
'3800' '3s00' '~oo' ~3200' '30l00' I 2800' . 2600' . 2~OO' • 2200' . 2000' , 1800' 'isloo' '1400'" 1200' '1000' , 'soO' , 'sWavenumber
Figure 4-24 LIN Post Test FTIR Analysis on a) Ball and b) Disc Specimen
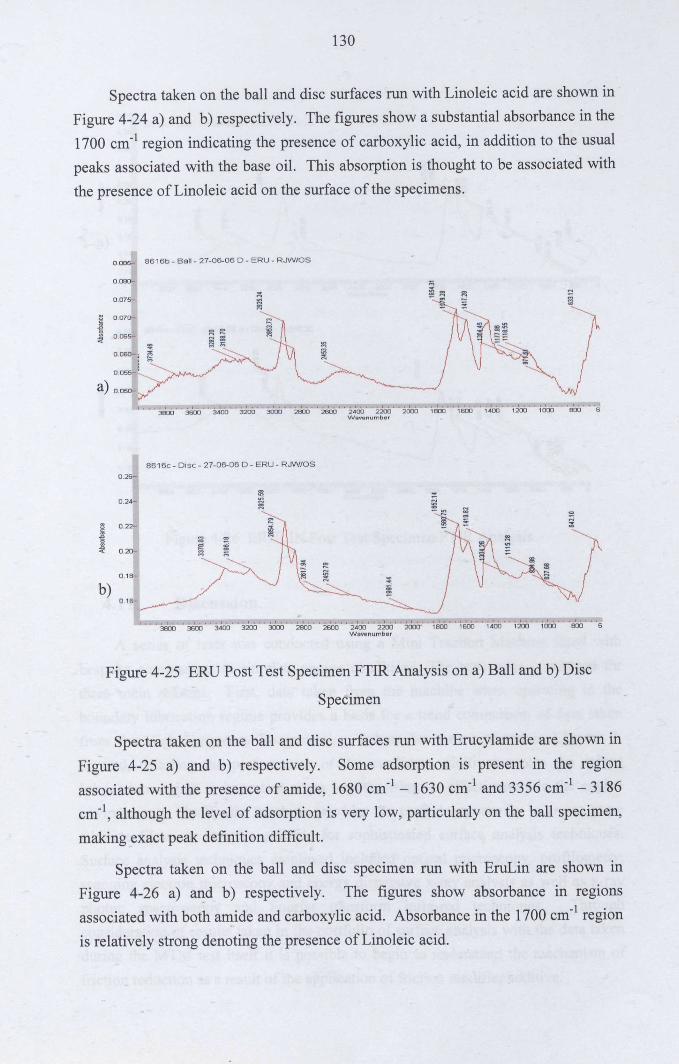
130
Spectra taken on the ball and disc surfaces run with Linoleic acid are shown inFigure 4-24 a) and b) respectively. The figures show a substantial absorbance in the1700 cm" region indicating the presence of carboxylic acid, in addition to the usualpeaks associated with the base oil. This absorption is thought to be associated with
the presence of Linoleic acid on the surface of the specimens.
0,085- 8616b - Ball _27-06-06 D - ERU - RJW/OS
0.080-
g 0.070:-
I 0.065'--
0.075'
;O.060-~ ~
a) 0.050-
1,.,""" I.", I •••• I •• , ,I" •• I ••• ,1 •••• '.". I, .... I, • ._. I" •• I ••• , I., •• 1.".1.,., I.,., r3800 3600 3400 3200 3000 2800 2600 2400 2200 2000 1800 1600 1400 1200 1000 BOO 6
Wavenumber
8616e - Di se - 27-06-06 D - ERU - RJW/OS
0.26-
0.24
1i 0.22-
.e~ 0.20-
0.18-
b)
I. , ':3800~' :3600" 3~OO' . 32ob" 3000" 2800' . 2600" 2400' '2200' '2000." 1800' '1600' '1400' '1200" 1000" 'soO' "~vvavenurnber
Figure 4-25 ERU Post Test Specimen FTIR Analysis on a) Ball and b) Disc
Specimen
Spectra taken on the ball and disc surfaces run with Erucylamide are shown in
Figure 4-25 a) and b) respectively. Some adsorption is present in the regionassociated with the presence of amide, 1680 cm-1 - 1630 cm-1 and 3356 cm-1 - 3186
cm", although the level of adsorption is very low, particularly on the ball specimen,
making exact peak definition difficult.
Spectra taken on the ball and disc specimen run with EruLin are shown inFigure 4-26 a) and b) respectively. The figures show absorbance in regionsassociated with both amide and carboxylic acid. Absorbance in the 1700 cm-1 region
is relatively strong denoting the presence of Linoleic acid.
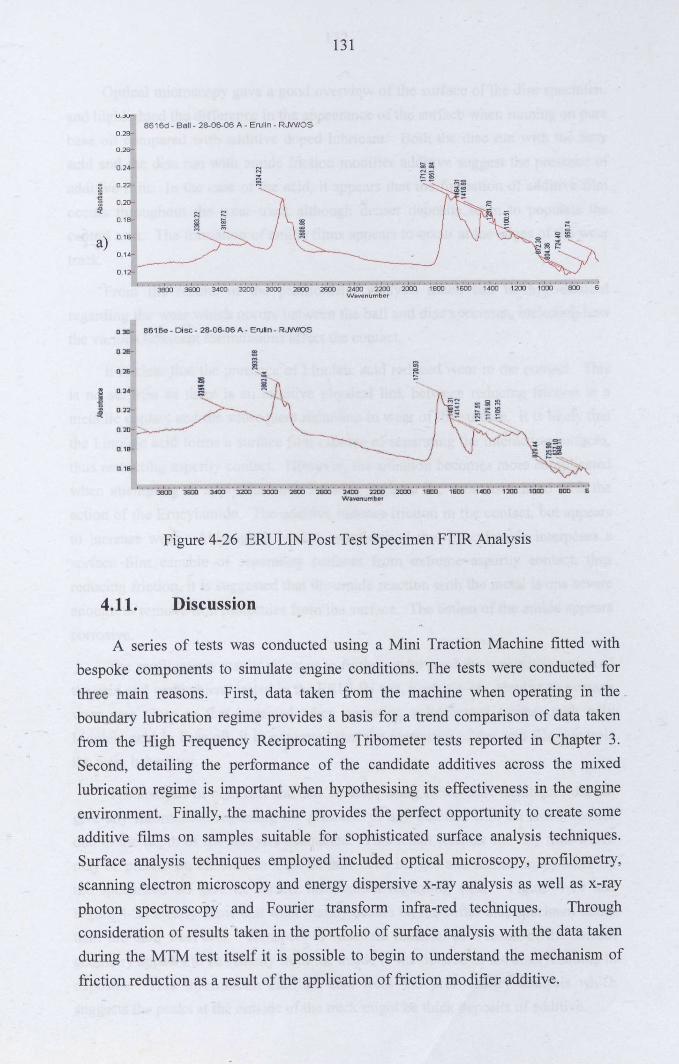
131
8616d - Ball- 28-06-06 A - Erulin - RJW/OS0.2B--
0.26-
0.24-
0.22>- ~0.20-
0.19-
a) 0.16-
0.14-
0.12-
3800 I • 3600' , 3400' '3200' , 3000' . 2800 I • 2600' . 2400' '2200' ~2000' , 1800' . 1600' ;400" 1200' , 1000' , '8'00' , 6vvavanumber
D 3D 8616e - Disc - 28-06-05 A - Erulln - RJIII'IOS
1"'m":3300 '~oo"m~'3:DJ '2SoJ '26oJ"i4cD'~2~cD~'2ocD"iDnD' i600' 14oo''';20D' iDDo' • I •• ,,'BCD s
W.a..-enumber
Figure 4-26 ERUUN Post Test Specimen FTIR Analysis
4.11. Discussion
A series of tests was conducted using a Mini Traction Machine fitted withbespoke components to simulate engine conditions. The tests were conducted for
three main reasons. First, data taken from the machine when operating in the
boundary lubrication regime provides a basis for a trend comparison of data takenfrom the High Frequency Reciprocating Tribometer tests reported in Chapter 3.Second, detailing the performance of the candidate additives across the mixed
lubrication regime is important when hypothesising its effectiveness in the engineenvironment. Finally, the machine provides the perfect opportunity to create someadditive films on samples suitable for sophisticated surface analysis techniques.Surface analysis techniques employed included optical microscopy, profilometry,scanning electron microscopy and energy dispersive x-ray analysis as well as x-rayphoton spectroscopy and Fourier transform infra-red techniques. Throughconsideration of results taken in the portfolio of surface analysis with the data takenduring the MTM test itself it is possible to begin to understand the mechanism of
friction reduction as a result of the application of friction modifier additive.
132
Optical microscopy gave a good overview of the surface of the disc specimen,and highlighted the difference in the appearance of the surface when running on purebase oil compared with additive doped lubricant. Both the disc run with the fattyacid and the disc run with amide friction modifier additive suggest the presence ofadditive film. In the case of the acid, it appears that the formation of additive filmoccurs throughout the wear track although denser deposits seem to populate thecentral area. The formation of amide films appears to occur at the edges of the weartrack.
From the results of the profilometry analysis much can be hypothesisedregarding the wear which occurs between the ball and disc specimen, including howthe various lubricant formulations affect the contact.
It is clear that the presence of Linoleic acid reduced wear in the contact. Thisis no surprise as there is an intuitive physical link between reducing friction in a
metallic contact and the subsequent reduction in wear of the surface. It is likely that
the Linoleic acid forms a surface film capable of separating the interacting surfaces,
thus restricting asperity contact. However, the situation becomes more complicatedwhen attempting to apply the same intuitive logic to the wear associated with theaction of the Erucylamide. The additive reduces friction in the contact, but appearsto increase wear. Although it is also hypothesised that Erucylamide interposes asurface film capable of separating surfaces from extreme asperity contact, thus
reducing friction, it is suggested that the amide reaction with the metal is one severe
enough to remove iron molecules frOJ11the surface. The action of the amide appears
corrosive.
The profilometry results allow us to further understand the synergistic action ofthe acid and amide blend tested in the ERULIN test, Figure 4-18. Having an averagewear area close to that expected when operating a lubricated contact with only
Linoleic acid in base oil, it is suggested that the formation of the acid film controls
the wear behaviour.
The analysis of both ball and disc surfaces using SEMlEDX techniques did notgive any information regarding the presence of any additive film on either surfacedue to the depth of the analysis conducted. This result tells us that any film whichmay be present on the surface must be thin. The images and surface maps taken on
the specimens do give us further information regarding wear. Figure 4-19 and
Figure 4-20 clearly show that wear mainly occurs on the softer disc specimen ratherthan the hard steel ball. Transport of substrate material as a result of the contactgeometry appears to be radially from the inside to the outside of the disc, resulting indeposits. This information clarifies data from the profilometry analysis whichsuggests the peaks at the outside of the track might be thick deposits of additive.
133
The XPS data tell us a great deal about the situation 3 - 10nm below thesurface of the specimen. This is the exact location in which thin organic frictionmodifier films might form, and as such the data taken from the XPS techniquecarries a lot of weight in investigations such as this. However, interpretation of thedata taken from the XPS analysis is a skilful art, greatly guided by knowledge andexperience. As such, the views discussed in the following paragraphs are the viewsand thoughts of the author and are by no means definitive.
The reduced detectable iron (Fe2p) concentration found on discs where frictionmodifier additive was used suggests the immediate surface of the specimen iscovered with molecules consisting of elements other than iron. This effect isparticularly pronounced where Linoleic acid was the friction modifier used in the
lubricant, suggesting its formation is in thicker films, or that its surface coverage ismore complete than that of the amide additive. Given the hydrocarbon chain length
of both the acid and the amide is greater than the depth of the XPS analysis, should afilm exist in a relatively normal fashion to the surface, theoretically it wouldcompletely isolate the metal substrate from analysis. Where both acid and amide arepresent, the amount of Fe2p detected reflects more the situation where only acid wasused, and suggests film formation is dominated by acid.
Analysis of the 01s concentrations suggests that more is detected on thespecimen tested with base oil alone than where additive is present. The 01speakprobably manifests itself as an oxide layer in the case of the detection associated onthe disc for base oil only, but subtle changes in the binding energy associated withthe peak where acid additive was used may suggest some molecular form change.This theory is further validated when looking at the binding energy associated with
the 01s peak detected where amide additive was used. The binding energy is almostexactly what would be expected when no oxygen containing additive was used.Interestingly where both acid and amide are present the binding energies againsuggest that the acid formation dominates, as a slight but significant change is seen.However, the synergistic effect of the additives appears to reduce the amount of
detectable 01s on the surface. As noted before, the concentrations represent a
proportion of the species present on the total surface, and as such it is not generallyplausible to compare between test series, however, in this case the lack of oxygen
combined with the increase of Cis detection suggests bulk comparison is of interest.It may be the case that a thicker or more densely coherent film is formed where bothadditives are available to react with the surface.
Inspection of the data associated with the NI s peaks suggests the presence ofnitrogen on the surface of the disc substrate in all cases, except for on the wear track
of the disc run with Linoleic acid. The presence of nitrogen is detectable at trace
134
levels in the test where only pure XHVI-8.2TM (Shell) was used, which lacked amide
or nitrogen based species. This suggests there may have been some contamination in
the test caused by the presence of amide left behind in the lubricant reservoir from
previous tests. Where Linoleic acid was used as a friction modifier the presence ofNI s was minute, suggesting either no contamination was present in the test, or thelong chain acid molecule masked its detection through the interposition of its longhydrocarbon chain. Interestingly, where Erucylamide was the friction modifier a
greater concentration of Nls is detectable on the surface, which when combined with
a slight shift in the binding energy may suggest the detected nitrogen was in a
different form. Where both amide and acid are present a high concentration of Nlsis recorded suggesting the detection of the amide additive film. In addition thepresence of Na in both tests conducted with the amide suggests some impurity in theErucylamide stock. This is not unexpected as in the process through whichErucylamide is created, saponification, sodium hydroxide is often used as a catalyst
which can result in trace amounts ofNa.
It is clear from inspection of the data that there are some differences betweenanalyses conducted on and off the wear track. However, these differences do notappear to be as substantial when comparing between data sets. It is worth notingagain at this point that comparison between data sets is one which should beconducted with care as the measured concentration of each species is dependent on
its peers also present on the area of surface under analysis, the totals of which sum to100%. In addition, the surface topography of the wear track area differs greatly from
that outside. Given the friction modifier additives are.polar species, both the amountand state of the surface available for reaction is likely to be of great importance. Atypical trend suggests the increased presence of hydrocarbon film outside the weartrack. However, data relating to the Erucylamide measurement suggests the inverse
of this relationship. This could of course be the product of the change in the
proportion of 01s species measured at the same time, or equally the reciprocal could
be the case. Generally then, it is possible to hypothesise the conclusion that thefilms do not necessarily manifest themselves as 'tribofilms', films that form as aresult of contact mechanics, but as independent surface films.
It was stated earlier that the CIs detection was almost completely associated
with C-C hydrocarbon groups, with a low level of non-specific C-O bonding found
(section 4.9). Given this information, it is possible that a lot of the measured signalwas due to adsorbed test fluid residue, especially outside the wear track. However,analysis of the detected concentrations reveals there was more CIs detected onspecimens tested with friction modifier than that tested without. The surface depthunder analysis is likely to consist of the hydrocarbon tails of the polar acid
135
molecules, thus increasing the intensity of the CIs peak measurement. Presence ofCIs is particularly pronounced where acid based friction modifier was used,suggesting there may be a greater quantity of C-C bonds on the specimen surface.This hypothesis corroborates the suggestion made earlier that Linoleic acid frictionmodifier forms either in thicker films, or more probably, films with more completesurface coverage than those formed by the amide. Interestingly, the disc subjected toboth acid and amide exhibits the greatest proportion of CIs which may suggest thethickest, or most dense, hydrocarbon film is formed as a result of the synergisticrelationship between the species.
It is worth noting at this point that the analyses conducted provides noevidence for the presence of robust chemically bonded surface films. However,qualitative analysis guides the hypothesis stating that organic friction modifiers dointeract with the metallic specimen surfaces resulting in the creation of low frictioncontacts.
FTIR analysis of the ball and disc specimens shows the technique is capable ofdetecting and determining between the films formed on the samples run withdifferent additive chemistries. However, it is difficult to identify specificcompounds, since the spectra are complex and not very well resolved.
Detectable levels of additive chemistry on the surfaces of both ball and discconfirm the findings of the XPS analysis which suggested some friction modifierfilm is attached to the surface disc specimens, but go further to show some frictionmodifier presence on the ball specimens. However,_the resolution of the recordedspectra is not high enough to determine the state of the attachment on either ball ordisc specimen.
Where acid and amide are run separately, results suggest that the carboxylicacid, Linoleic acid, surface film might be more complete than that of the amide,Erucylamide. Relatively high levels of adsorption in the carbonyl region were seenwhere Linoleic acid was used compared with trace adsorptions seen in the amideregion, where Erucylamide was used. Ball and disc specimens run with EruLinshow a reasonably strong presence of carboxylic acid, Linoleic acid, and weakpresence of Erucylamide. When similar FTIR analyses were conducted on cylinderliner specimens run in the TE-77 reciprocator in section 3.6.5, the reverse of thisfinding was seen. Where Erucylamide was used, a strong adsorption in the regionassociated with amide formation was clearly detectable on both piston ring andcylinder liner specimen. Where Linoleic acid was used there was little evidence inthe absorbance spectra to suggest the presence of carboxylic acid. Where EruLinwas tested in the TE-77, evidence of amide formation was seen with no evidence ofcarboxylic acid formation at all. It is hypothesised that the discontinuity between
136
FTIR analyses conducted in section 3.6.5 and section 4.10 is a result of manyfactors, the most important and influential of which are listed below:
• The specimens were subjected to different test conditions. In the TE-77tests the conditions were particularly arduous and operation was always
in the boundary lubrication regime, under pure sliding. In the MTMtests the conditions cycled between elastohydrodynamic, mixed and theboundary lubrication regime, in both sliding and rolling.
• The temperatures were conducted at different temperatures. In the TE-77 tests the liner surface temperature was controlled at 110°C. In the
MTM tests the temperature was controlled at 125°C.
• The base oil used in each test was different. In the TE- 77 tests wereconducted with XHVI-4™. In the MTM the tests were conducted witha more viscous XHVI-S.2TMbase oil.
• The surface roughnesses of the specimen surfaces were considerablydifferent. In the TE- 77 machine the cylinder liner specimen is finished
with a cross-hatch hone giving an Ra of approximately 0.S3Ilm. Thedisc specimen was finished to an Ra of approximately O.Olllm, topermit surface analysis.
The information provided through surface analysis of test specimens describesboth the composition of the surface films, and gives an indication as to their size, butdoes not describe the way in which they form, or under what conditions they are
stable, or even effective. To further understand the friction modifier films and their
ability to reduce friction in the contact it is necessary to analyse the coefficient of
friction data taken from the MTM tests themselves.
It is clear from all previous results that lubricant containing Erucylamide isthought to act as a friction modifier in a distinctly different manner from that ofLinoleic acid. The acid is thought to form thick films in the mixed regime which
have the capability to reduce friction when compared to that of base oil alone, but
Erucylamide appears to create films which are more difficult to shear down to a filmof lower shear strength, films which maintain dominance over the frictionalcharacteristics of the contact well into the low speed region. However, again at lowspeeds promoting boundary lubrication a marked decrease in friction coefficientindicates the reduction of the thick film to that of a thin solid-like film with lowershear strength. The data suggests more tenacious films are formed in metal/amide
contacts than in metal/fatty acid contacts, as this thinning process occurs under more
arduous conditions where amide is used. In addition, there appears to be little timerelated effect associated with the formation of amide films. Between the first run,
137
and any proceeding, little changes. This may indicate the recurring formation andremoval of films on the surface, as opposed to the acid films formation whichappears to be one in which a monolayer attaches to the surface, and allows furtherlayers to build on top.
The synergistic action of the amide and the acid suggests, from a frictionalcharacteristic point of view, that the combination of chemical compounds leads tolower friction in the contact throughout the test. The acid dominates initial filmformation on the metal surfaces resulting in low friction in the mixed lubricationregime, and well into that of the boundary. At low speeds the amide film takesadvantage of the weak attachment of the acid, and subsequent partial removal fromthe surface, by forming on the clean metal surface. This partial film is not detachedas a result of the increasingly arduous conditions. With time it seems that the acidfilms continual formation serves to create ever thicker films with even lower shearstrengths resulting in further reduced friction in the contact. In fact the growth ofthese films appears to promote the onset of elastohydrodynamiclhydrodynamicbehaviour in the contact, indicated by the rise in coefficient of friction displayed inthe high speed region. In contrast to the acid, the amide exhibits little time relatedbehaviour, although some evidence suggests it too promotes the transition from themixed lubrication regime to that of the boundary. The blend of the two additivesappears to have beneficial synergistic effects resulting in the lowest frictionoperation throughout the complete curve. Final coefficients of friction are slightlyelevated compared with those measured in run 1, and are perhaps a result ofmodifications to the surface caused by slight wear of the samples.
4.12. Summary
In this chapter a set of Mini Traction Machine tests are reported, whosepurpose was to both investigate the performance of novel organic friction modifiersover the mixed and boundary regime, and to create some specimens on whichsurface films suitable for detailed surface analysis have been formed. The chapterdescribes the results, analysis and interpreted meaning of the various surface analysisresults. This chapter is of great significance in the investigation of novel organiccompounds for use as gasoline friction modifiers as a substantial amount has beenlearnt through the detailed analysis of the portfolio of data. On consideration of alldata presented in this chapter, the following summary can be made.
• The results of the MTM tests suggest the addition of the organicfriction modifiers to base oil can reduce boundary friction by more thanhalf. The most effective boundary friction modifier was ERULIN, a
138
lubricant blend containing both 1 wt% Linoleic acid and 1 wt%Erucylamide. A typical value of boundary friction coefficient measuredin this test was 0.08 for ERULIN.
• Both acid and amide friction modifiers exhibited some frictionreduction capability in the mixed lubrication regime, the formerappearing the most effective. When combined in a lubricant blend, theacid appears to dominate film formation over the amide in the mixed
regime.
• When operating in the mixed lubrication regime, both acid and amideare thought to form thick films on the metal substrate surfaces which
serve to act like a viscous film. The frictional characteristics of thefilms are believed to be dominated by the shearing of layers of additive
molecules between themselves.
• In pure boundary lubrication conditions, the VISCOUS films whichdominate the contact in the mixed lubrication regime are thinned downto a thin solid-like film of low shear strength. Thick films created by
amide layers appear more difficult to thin down than those created byacids, as they maintain dominance over the frictional characteristics ofthe contact well into the region where pure boundary lubrication should
dominate.
• In contrast to the acid film, the amide additive exhibits little timerelated effects in film formation. This possibly suggests the recurring
formation and removal of films on the surface, as opposed to the acidfilm formation which appears to be one in which a monolayer attaches
to the surface, and further layers build on top.
• When both acid and amide are employed in the lubricant blend, theamide appears to be capable of complementing the action of the acid byallowing the acid to dominate film formation over the conditions at
which it excels at reducing boundary friction, and by assisting mfriction reduction at conditions where acid films can be removed.
• The presence of fatty acid in a lubricant appears to reduce wear on therunning surfaces, whereas the presence of amide appears to increasewear of the surfaces. It is hypothesised that the amide reaction with thesubstrate metal is one severe enough to remove iron molecules from the
surface. The action of the amide friction modifier appears corrosive.
139
• Where both Linoleic acid and Erucylamide are present, the wear profileresults suggest the Linoleic acid has had a dominant effect over the
amide as the wear remains low.
• XPS analysis of the disc surfaces proved inconclusive, but highlightedthe presence of relatively neutral N species and C-O bonding which isthought to be evidence of amide and acid films respectively. Given thelevel of cleaning the specimens were subject to prior to the XPSanalysis, it seems wrong to suggest these films were merely physicallyattached to the surface, yet there is no evidence to suggest the presence
of dense or robust chemical films.
• Films formed by Erucylamide and Linoleic acid do not necessarily form'tribofilms', which are films formed as a result of contact mechanics,
but form as independent surface films.
• Where both amide and acid were present in the lubricant formulationqualitative analysis of surface concentrations and species binding
energies detected by XPS analysis suggests the acid formationdominates the film.
140
5. Novel Fuel Formulation Engine Tests
Previous chapters have described the investigation into the hypothesis statingengine friction can be reduced through the application of gasoline administeredfriction modifiers. Chapter 2 described lubricant sampling tests which not onlyvalidated the hypothesis that additive molecules can be administered to both thepiston top ring groove and the cylinder liner oil film via gasoline, but that thelubrication system at these locations permits additive accumulation. Chapter 3 gaveexplanation of the results of novel additive screening tests conducted on theCameron Plint TE-77 bench-top trlbometer, where tests were conducted in theboundary lubrication regime to simulate the arduous lubrication condition at the topdead centre location. Analysis of data allowed the additives to be categorised interms of performance characteristics, identifying those thought to be most effectivein the engine environment. Chapter 4 described the testing of additives using theMini Traction Machine, scoping the performance of selected high performingadditives in the elastohydrodynamic, mixed and boundary lubrication regimes.Following on from the findings of these chapters, this chapter describes a series ofengine tests where the effects of gasoline doped with friction modifier additive aretested in a firing engine. Engine tests conducted fall into two distinct categories.First, a series of scouting tests were conducted where engine performance wasanalysed when running on standard or FM gasoline. Second, a series of tests wereconducted where piston assembly friction was measured directly using theInstantaneous Mean Effective Pressure (lMEP) method when running on standard orFriction Modified (FM) gasoline, allowing the determination of areas within thepiston cycle where the novel friction modifiers perform best.
5.1. Engine Testing
The Ricardo Hydra gasoline engine presented in Chapter 2 was used for allengine tests described in this chapter.
Having seen the promising effects of the novel friction modifier additives inthe bench-top tribometer, it was necessary to assess their performance in an engine.Although the effects of the novel friction modifier additives were quite dramatic inthe tribometer tests, their impact in the engine were expected to be less. For thisreason engine tests were structured accordingly. The first set of tests served to scoutthe performance of the FM gasoline and were designed to look for an increase in thedynamometer measured brake torque when the fuel supply was switched from
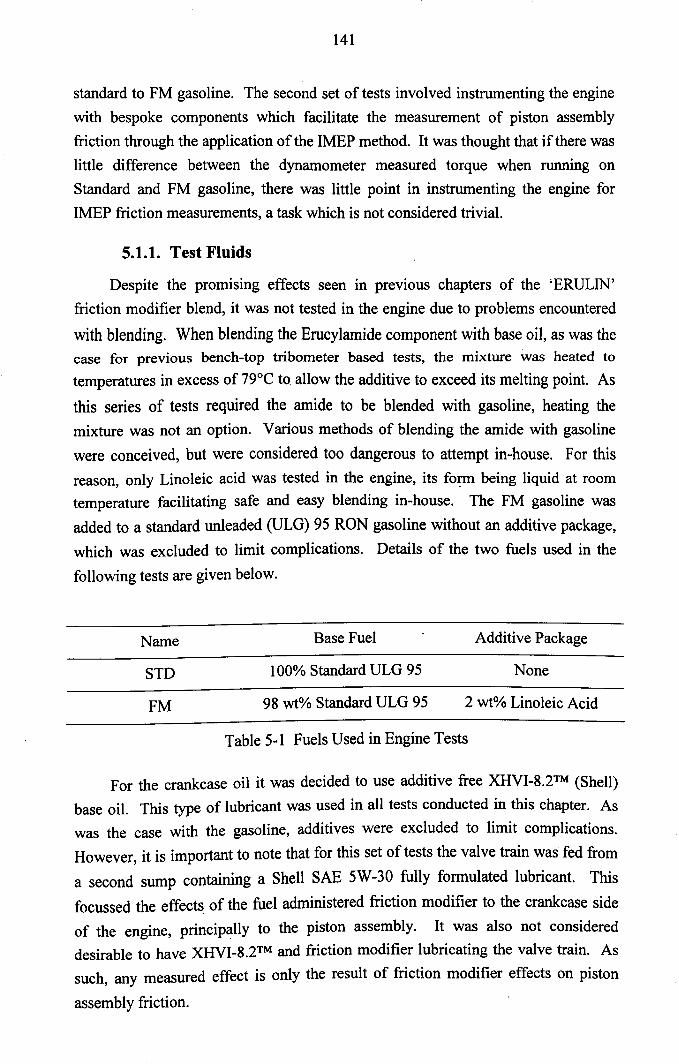
141
standard to FM gasoline. The second set of tests involved instrumenting the engine
with bespoke components which facilitate the measurement of piston assemblyfriction through the application of the IMEP method. It was thought that if there waslittle difference between the dynamometer measured torque when running onStandard and FM gasoline, there was little point in instrumenting the engine forIMEP friction measurements, a task which is not considered trivial.
5.1.1. Test Fluids
Despite the promising effects seen in previous chapters of the 'ERULIN'friction modifier blend, it was not tested in the engine due to problems encountered
with blending. When blending the Erucylamide component with base oil, as was thecase for previous bench-top tribometer based tests, the mixture was heated totemperatures in excess of 79°C to. allow the additive to exceed its melting point. As
this series of tests required the amide to be blended with gasoline, heating themixture was not an option. Various methods of blending the amide with gasoline
were conceived, but were considered too dangerous to attempt in-house. For thisreason, only Linoleic acid was tested in the engine, its form being liquid at roomtemperature facilitating safe and easy blending in-house. The FM gasoline was
added to a standard unleaded (ULG) 95 RON gasoline without an additive package,
which was excluded to limit complications. Details of the two fuels used in the
following tests are given below.
Name Base Fuel Additive Package
STD 100% Standard ULG 95 None
FM 98 wt% Standard ULG 95 2 wt% Linoleic Acid
Table 5-1 Fuels Used in Engine Tests
For the crankcase oil it was decided to use additive free XHVI-8.2TM (Shell)base oil. This type of lubricant was used in all tests conducted in this chapter. Aswas the case with the gasoline, additives were excluded to limit complications.
However, it is important to note that for this set of tests the valve train was fed from
a second sump containing a Shell SAE 5W-30 fully formulated lubricant. This
focussed the effects of the fuel administered friction modifier to the crankcase sideof the engine, principally to the piston assembly. It was also not considereddesirable to have XHVI-8.2TM and friction modifier lubricating the valve train. Assuch, any measured effect is only the result of friction modifier effects on piston
assembly friction.
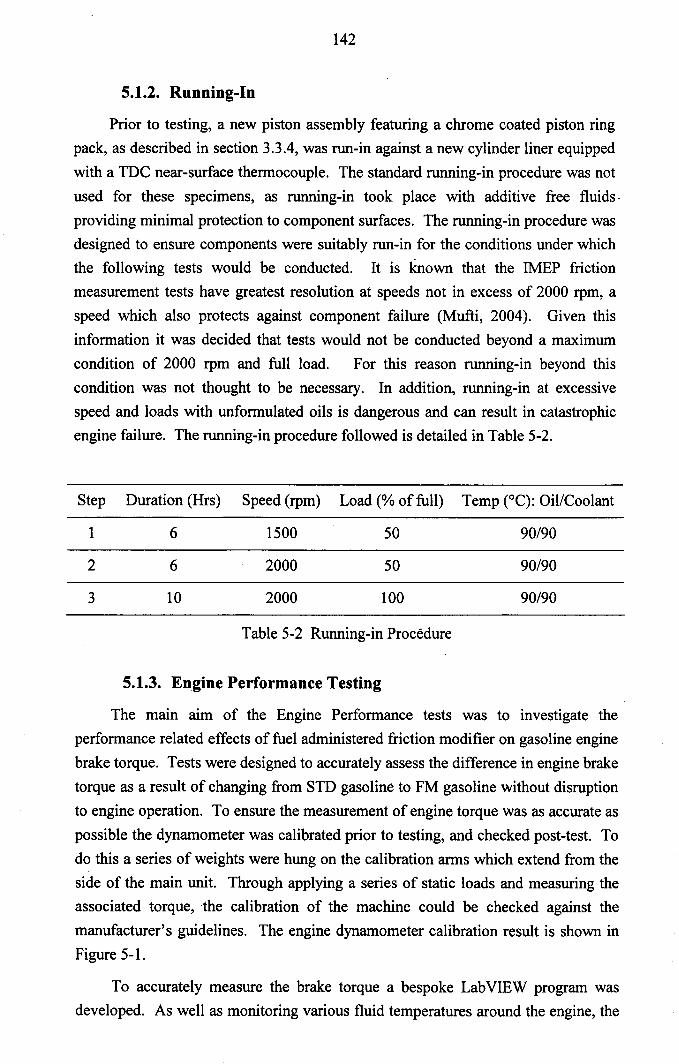
142
5.1.2. Running-In
Prior to testing, a new piston assembly featuring a chrome coated piston ringpack, as described in section 3.3.4, was run-in against a new cylinder liner equippedwith a TDC near-surface thermocouple. The standard running-in procedure was notused for these specimens, as running-in took place with additive free fluids·providing minimal protection to component surfaces. The running-in procedure wasdesigned to ensure components were suitably run-in for the conditions under whichthe following tests would be conducted. It is known that the IMEP frictionmeasurement tests have greatest resolution at speeds not in excess of 2000 rpm, aspeed which also protects against component failure (Mufti, 2004). Given thisinformation it was decided that tests would not be conducted beyond a maximumcondition of 2000 rpm and full load. For this reason running-in beyond thiscondition was not thought to be necessary. In addition, running-in at excessivespeed and loads with unformulated oils is dangerous and can result in catastrophicengine failure. The running-in procedure followed is detailed in Table 5-2.
Step Duration (Hrs) Speed (rpm) Load (% of full) Temp (QC):Oil/Coolant
1 6 1500 50 90/90
2 6 2000 50 90/90
3 10 2000 100 90/90
Table 5-2 Running-in Procedure
5.1.3. Engine Performance Testing
The main aim of the Engine Performance tests was to investigate theperformance related effects of fuel administered friction modifier on gasoline enginebrake torque. Tests were designed to accurately assess the difference in engine braketorque as a result of changing from STD gasoline to FM gasoline without disruptionto engine operation. To ensure the measurement of engine torque was as accurate aspossible the dynamometer was calibrated prior to testing, and checked post-test. Todo this a series of weights were hung on the calibration arms which extend from theside of the main unit. Through applying a series of static loads and measuring theassociated torque, the calibration of the machine could be checked against themanufacturer's guidelines. The engine dynamometer calibration result is shown inFigure 5-1.
To accurately measure the brake torque a bespoke LabVIEW program wasdeveloped. As well as monitoring various fluid temperatures around the engine, the
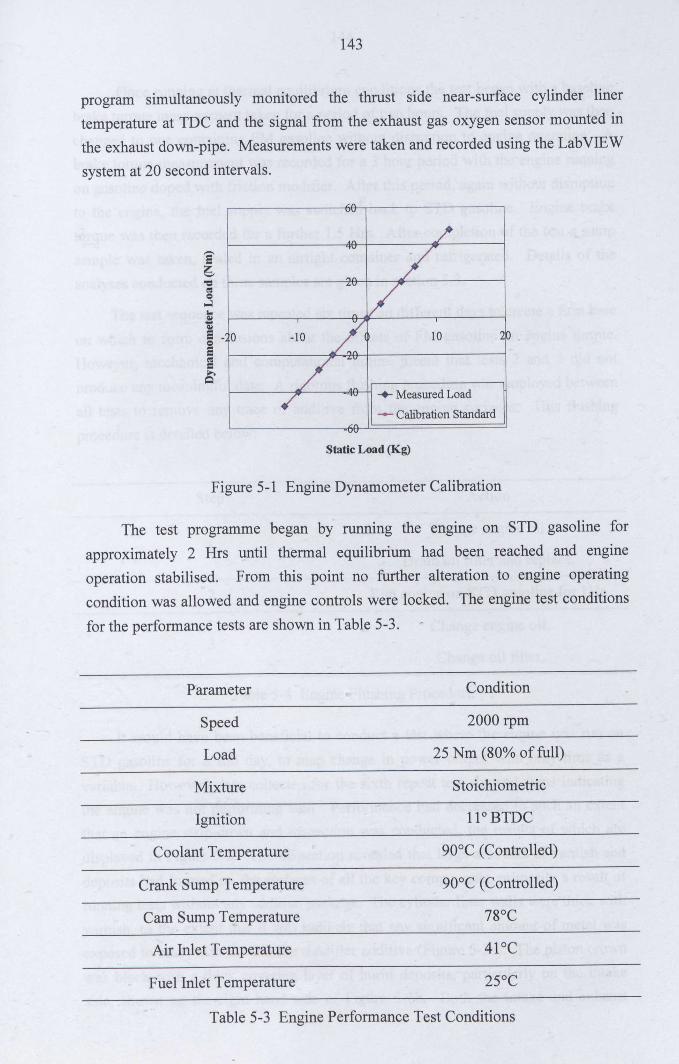
143
program simultaneously monitored the thrust side near-surface cylinder linertemperature at TDC and the signal from the exhaust gas oxygen sensor mounted inthe exhaust down-pipe. Measurements were taken and recorded using the LabVIEW
system at 20 second intervals.
~
./,.,,, /..v V"
0 -10 Z< 10 2~
/- .. v
<t, -+- Measured Load/ TV
-- Calibration Standard..."-vv
Static Load (Kg)
Figure 5-1 Engine Dynamometer Calibration
The test programme began by running the engine on STD gasoline forapproximately 2 Hrs until thermal equilibrium had been reached and engineoperation stabilised. From this point no further alteration to engine operatingcondition was allowed and engine controls were locked. The engine test conditions
for the performance tests are shown in Table 5-3.
Parameter Condition
Speed 2000 rpm
Load 25 Nm (80% of full)
Mixture Stoichiometric
Ignition 11° BTDC
Coolant Temperature 90°C (Controlled)
Crank Sump Temperature 90°C (Controlled)
Cam Sump Temperature 78°C
Air Inlet Temperature 41°C
Fuel Inlet Temperature 25°C
Table 5-3 Engine Performance Test Conditions
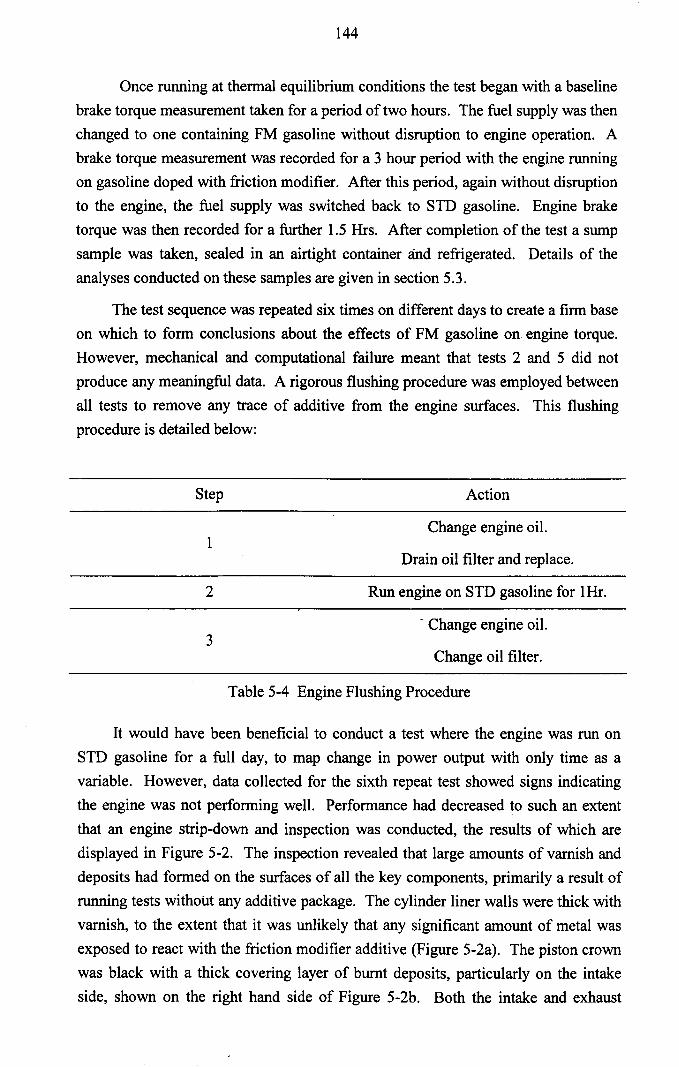
144
Once running at thermal equilibrium conditions the test began with a baselinebrake torque measurement taken for a period of two hours. The fuel supply was thenchanged to one containing FM gasoline without disruption to engine operation. Abrake torque measurement was recorded for a 3 hour period with the engine runningon gasoline doped with friction modifier. After this period, again without disruptionto the engine, the fuel supply was switched back to STD gasoline. Engine braketorque was then recorded for a further 1.5 Hrs. After completion of the test a sump
sample was taken, sealed in an airtight container and refrigerated. Details of theanalyses conducted on these samples are given in section 5.3.
The test sequence was repeated six times on different days to create a firm baseon which to form conclusions about the effects of FM gasoline on engine torque.However, mechanical and computational failure meant that tests 2 and 5 did notproduce any meaningful data. A rigorous flushing procedure was employed betweenall tests to remove any trace of additive from the engine surfaces. This flushingprocedure is detailed below:
Step Action
1Change engine oil.
Drain oil filter and replace.
2 Run engine on STD gasoline for 1Hr.
- Change engine oil.3
Change oil filter.
Table 5-4 Engine Flushing Procedure
It would have been beneficial to conduct a test where the engine was run onSTD gasoline for a full day, to map change in power output with only time as avariable. However, data collected for the sixth repeat test showed signs indicatingthe engine was not performing well. Performance had decreased to such an extentthat an engine strip-down and inspection was conducted, the results of which aredisplayed in Figure 5-2. The inspection revealed that large amounts of varnish anddeposits had formed on the surfaces of all the key components, primarily a result ofrunning tests without any additive package. The cylinder liner walls were thick with
varnish, to the extent that it was unlikely that any significant amount of metal wasexposed to react with the friction modifier additive (Figure 5-2a). The piston crownwas black with a thick covering layer of burnt deposits, particularly on the intakeside, shown on the right hand side of Figure 5-2b. Both the intake and exhaust
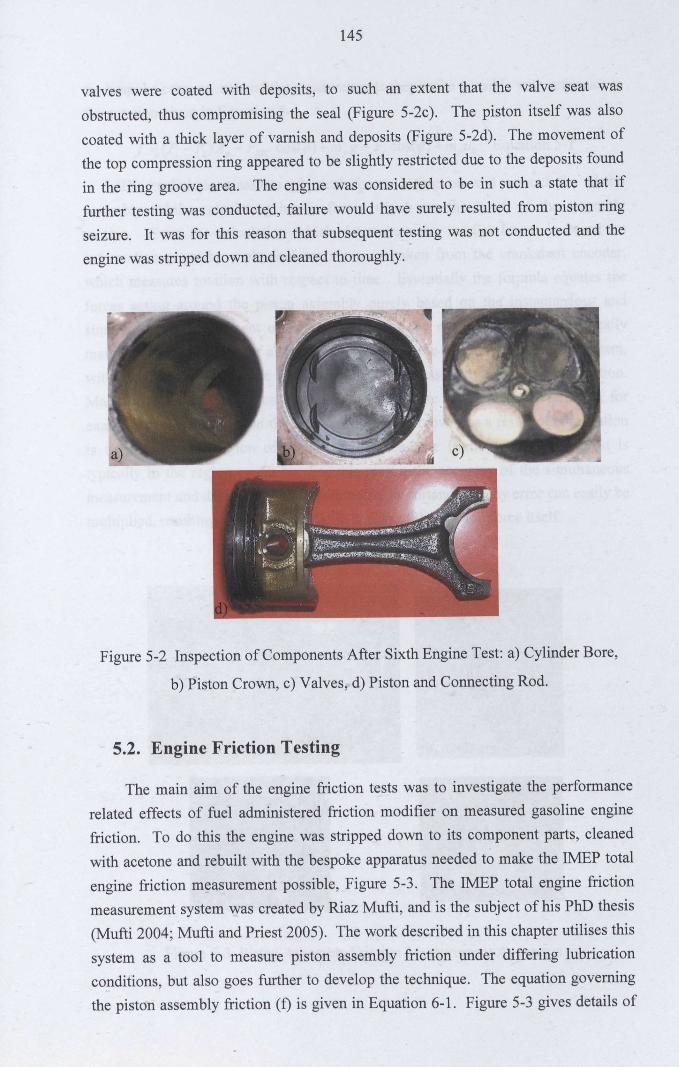
145
valves were coated with deposits, to such an extent that the valve seat was
obstructed, thus compromising the seal (Figure 5-2c). The piston itself was alsocoated with a thick layer of varnish and deposits (Figure 5-2d). The movement ofthe top compression ring appeared to be slightly restricted due to the deposits foundin the ring groove area. The engine was considered to be in such a state that iffurther testing was conducted, failure would have surely resulted from piston ringseizure. It was for this reason that subsequent testing was not conducted and the
engine was stripped down and cleaned thoroughly.
Figure 5-2 Inspection of Components After Sixth Engine Test: a) Cylinder Bore,
b) Piston Crown, c) Valves, d) Piston and Connecting Rod.
5.2. Engine Friction Testing
The main aim of the engine friction tests was to investigate the performance
related effects of fuel administered friction modifier on measured gasoline enginefriction. To do this the engine was stripped down to its component parts, cleanedwith acetone and rebuilt with the bespoke apparatus needed to make the IMEP total
engine friction measurement possible, Figure 5-3. The IMEP total engine frictionmeasurement system was created by Riaz Mufti, and is the subject of his PhD thesis(Mufti 2004; Mufti and Priest 2005). The work described in this chapter utilises thissystem as a tool to measure piston assembly friction under differing lubricationconditions, but also goes further to develop the technique. The equation governingthe piston assembly friction (t) is given in Equation 6-1. Figure 5-3 gives details of
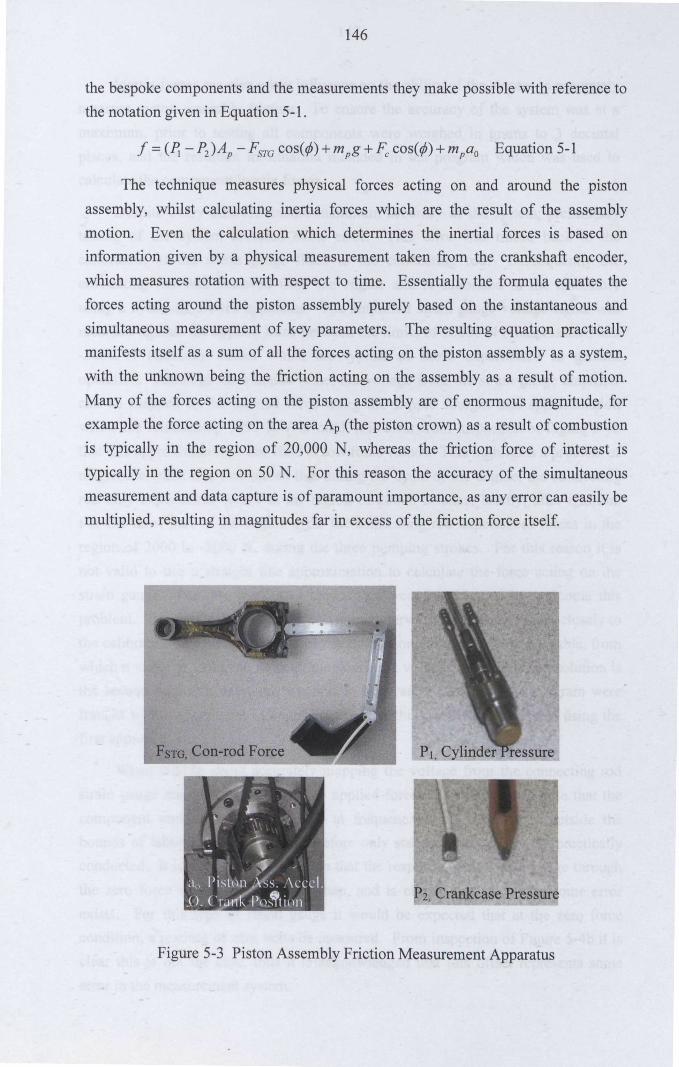
146
the bespoke components and the measurements they make possible with reference tothe notation given in Equation 5-1.
The technique measures physical forces acting on and around the pistonassembly, whilst calculating inertia forces which are the result of the assemblymotion. Even the calculation which determines the inertial forces is based oninformation given by a physical measurement taken from the crankshaft encoder,which measures rotation with respect to time. Essentially the formula equates theforces acting around the piston assembly purely based on the instantaneous andsimultaneous measurement of key parameters. The resulting equation practicallymanifests itself as a sum of all the forces acting on the piston assembly as a system,
with the unknown being the friction acting on the assembly as a result of motion.Many of the forces acting on the piston assembly are of enormous magnitude, forexample the force acting on the area Ap (the piston crown) as a result of combustion
is typically in the region of 20,000 N, whereas the friction force of interest is
typically in the region on 50 N. For this reason the accuracy of the simultaneousmeasurement and data capture is of paramount importance, as any error can easily bemultiplied, resulting in magnitudes far in excess of the friction force itself.
P2, Crankcase
Figure 5-3 Piston Assembly Friction Measurement Apparatus
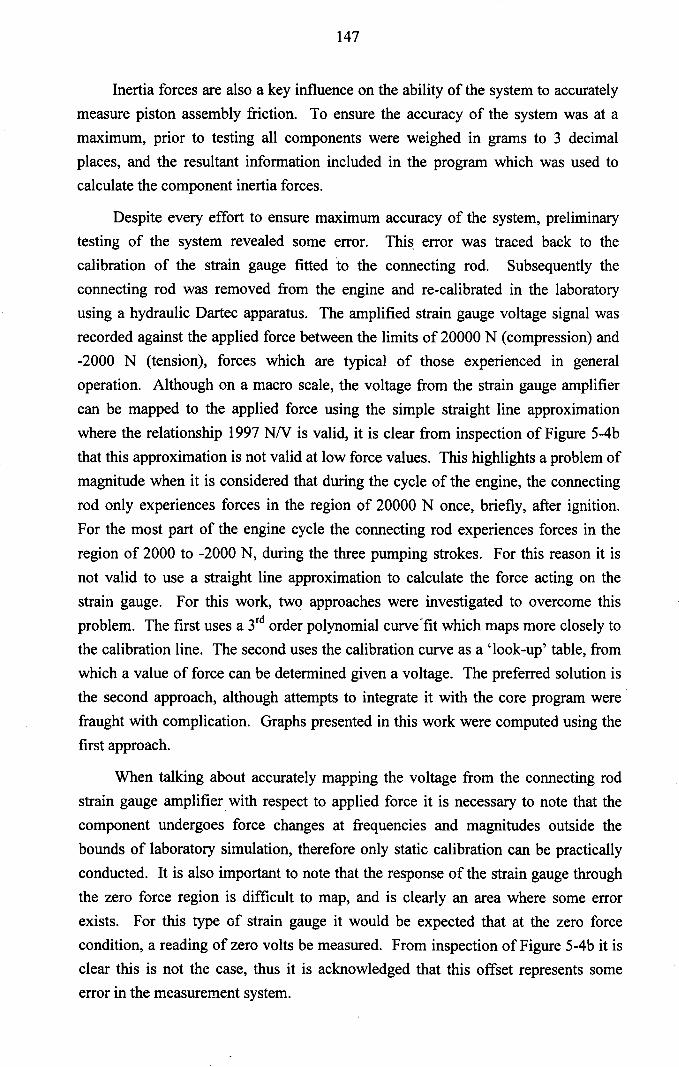
147
Inertia forces are also a key influence on the ability of the system to accuratelymeasure piston assembly friction. To ensure the accuracy of the system was at amaximum, prior to testing all components were weighed in grams to 3 decimalplaces, and the resultant information included in the program which was used tocalculate the component inertia forces.
Despite every effort to ensure maximum accuracy of the system, preliminarytesting of the system revealed some error. This error was traced back to thecalibration of the strain gauge fitted 'to the connecting rod. Subsequently theconnecting rod was removed from the engine and re-calibrated in the laboratoryusing a hydraulic Dartec apparatus. The amplified strain gauge voltage signal wasrecorded against the applied force between the limits of 20000 N (compression) and-2000 N (tension), forces which are typical of those experienced in generaloperation. Although on a macro scale, the voltage from the strain gauge amplifiercan be mapped to the applied force using the simple straight line approximationwhere the relationship 1997NN is valid, it is clear from inspection of Figure 5-4bthat this approximation is not valid at low force values. This highlights a problem ofmagnitude when it is considered that during the cycle of the engine, the connectingrod only experiences forces in the region of 20000 N once, briefly, after ignition.For the most part of the engine cycle the connecting rod experiences forces in theregion of 2000 to -2000 N, during the three pumping strokes. For this reason it isnot valid to use a straight line approximation to calculate the force acting on thestrain gauge. For this work, two approaches were investigated to overcome thisproblem. The first uses a 3rd order polynomial curvefit which maps more closely tothe calibration line. The second uses the calibration curve as a 'look-up' table, fromwhich a value of force can be determined given a voltage. The preferred solution isthe second approach, although attempts to integrate it with the core program were .fraught with complication. Graphs presented in this work were computed using thefirst approach.
When talking about accurately mapping the voltage from the connecting rodstrain gauge amplifier with respect to applied force it is necessary to note that thecomponent undergoes force changes at frequencies and magnitudes outside thebounds of laboratory simulation, therefore only static calibration can be practicallyconducted. It is also important to note that the response of the strain gauge throughthe zero force region is difficult to map, and is clearly an area where some errorexists. For this type of strain gauge it would be expected that at the zero forcecondition, a reading of zero volts be measured. From inspection of Figure 5-4b it isclear this is not the case, thus it is acknowledged that this offset represents someerror in the measurement system.
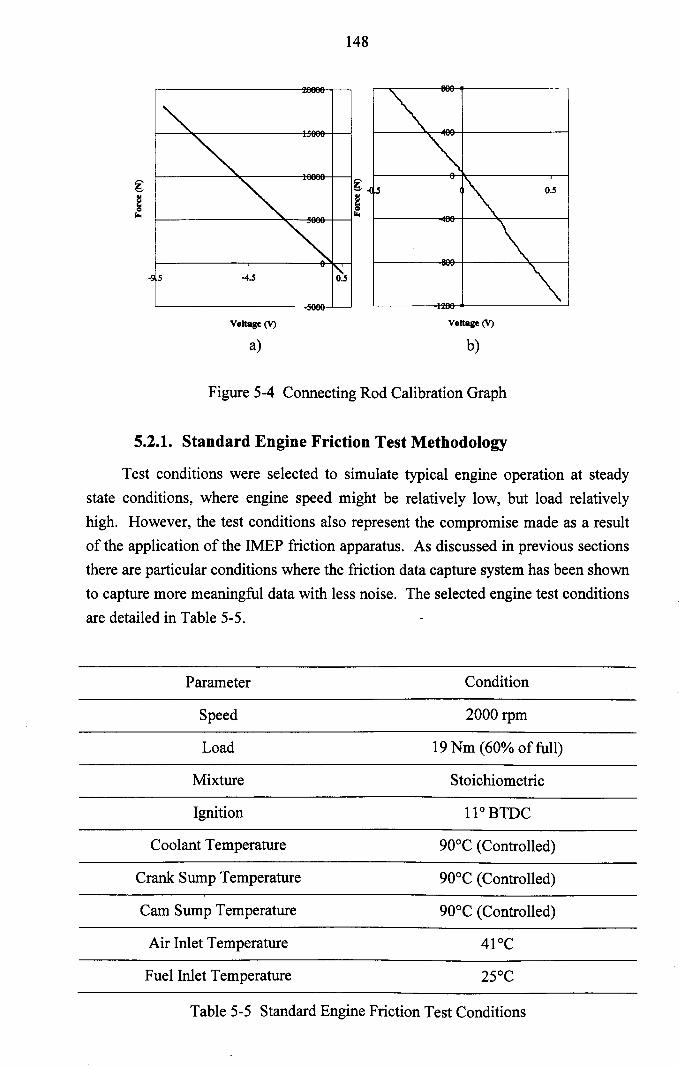
148
s O.S
Voltage (V)
a)
Voltage (V)
b)
Figure 5-4 Connecting Rod Calibration Graph
5.2.1. Standard Engine Friction Test Methodology
Test conditions were selected to simulate typical engine operation at steady
state conditions, where engine speed might be relatively low, but load relativelyhigh. However, the test conditions also represent the compromise made as a resultof the application of the !MEP friction apparatus. As discussed in previous sectionsthere are particular conditions where the friction data capture system has been shownto capture more meaningful data with less noise. The selected engine test conditions
are detailed in Table 5-5.
Parameter Condition
Speed 2000 rpm
Load 19 Nm (60% of full)
Mixture Stoichiometric
Ignition 11°BTDC
Coolant Temperature 90°C (Controlled)
Crank Sump Temperature 90°C (Controlled)
Cam Sump Temperature 90°C (Controlled)
Air Inlet Temperature 41°C
Fuel Inlet Temperature 25°C
Table 5-5 Standard Engine Friction Test Conditions
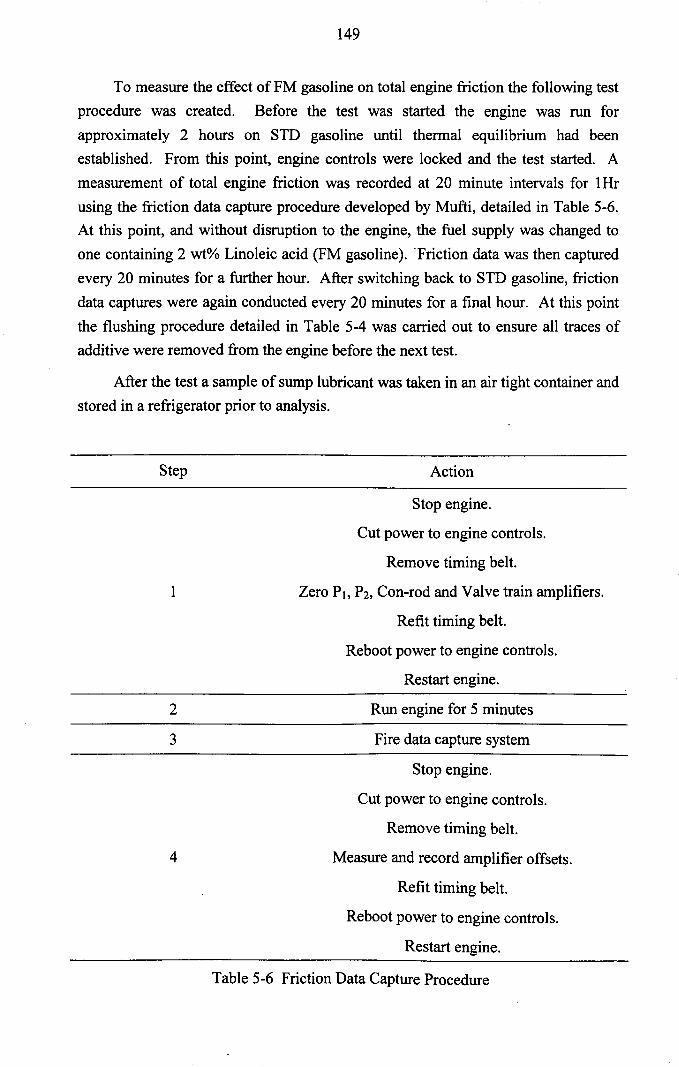
149
To measure the effect ofFM gasoline on total engine friction the following testprocedure was created. Before the test was started the engine was run forapproximately 2 hours on STD gasoline until thermal equilibrium had beenestablished. From this point, engine controls were locked and the test started. Ameasurement of total engine friction was recorded at 20 minute intervals for 1Hrusing the friction data capture procedure developed by Mufti, detailed in Table 5-6.At this point, and without disruption to the engine, the fuel supply was changed toone containing 2 wt% Linoleic acid (FM gasoline). 'Friction data was then capturedevery 20 minutes for a further hour. After switching back to STD gasoline, friction
data captures were again conducted every 20 minutes for a final hour. At this point
the flushing procedure detailed in Table 5-4 was carried out to ensure all traces ofadditive were removed from the engine before the next test.
After the test a sample of sump lubricant was taken in an air tight container andstored in a refrigerator prior to analysis.
Step Action
1
Stop engine.
Cut power to engine controls.
Remove timing belt.
Zero PI. P2, Con-rod and Valve train amplifiers.
Refit timing belt.
Reboot power to engine controls.
Restart engine.
2 Run engine for 5 minutes
3 Fire data capture system
4
Stop engine.
Cut power to engine controls.
Remove timing belt.
Measure and record amplifier offsets.
Refit timing belt.
Reboot power to engine controls.
Restart engine.
Table 5-6 Friction Data Capture Procedure
150
5.2.2. Modified Engine Friction Test Methodology
As with the standard engine friction tests, the aim of the modified enginefriction tests was to investigate the performance related effects of fuel administeredfriction modifier on measured gasoline engine friction. However, modification ofthe test procedure not only allowed the test series to act as a repeat for the first testseries, but also served to give resolution to the time related action of the FM gasolineand allowed the evaluation of the friction data capture procedure detailed in Table
5-6. Like the standard test methodology the test began by warming the engine up tothermal equilibrium, a process which took approximately 2 hours. At this pointsteps 1, 2 and 3 of Table 5-6 were conducted. It was thought that the measurementof the amplifier offsets (step 4, Table 5-6) was intrusive and disturbed the operationof the engine to a greater extent than the drift it attempted to correct, for this reason
it was not conducted. Friction data captures were recorded every 10 minutes whenrunning on STD gasoline for a 30 minute period. At the 30 minute mark the fuelsupply was switched to one containing FM gasoline without disruption to the engine.From this point friction data captures were taken every 2 minutes for the next 30minutes, followed by 30 minutes where friction data was captured at ten minuteintervals. The fuel supply was then switched back to STD gasoline and friction datacaptured every 10 minutes for a 30 minute period. It is important to note that theengine was not stopped at any point in the test, thus removing the instability
associated with rebooting power to the engine controls. In addition, the exclusion ofstep 4 from the friction data capture procedure allows the firing of the system at 2minute intervals, a feat not possible when adhering to the standard friction datacapture procedure which requires much time to complete.
Tests were conducted at the conditions detailed in Table 5-5, although for this.test series engine load was reduced to 16.5 Nm (50% of full), a load which givesgreater resolution to the friction data through reducing noise associated with the highload condition.
5.3. Post Test Lubricant Analysis
As noted previously, sump samples were collected after each test and stored in
air tight containers in a refrigerated environment to preserve them prior to analysis.
5.3.1. Fourier Transform InfraRed Microscopy (FTIR)
The science underpinning the analysis of chemical bonds through applicationof the FTIR technique is described in detail in Chapter 3, section 3.5.1. However, in
Chapter 3 the technique was applied with a microscope attachment, where the
151
infrared beam was focused on the surface of a reflective specimen, and the reflectedportion analysed for information regarding the chemical bonds. For the analysis offluid samples such as engine lubricant the system is used in pure absorbance mode,
where a small film of lubricant is sandwiched between two KBr discs through whichthe infrared beam passes. The energy absorbed through the interaction between thebeam and the sample is measured by a sensitive detector capable of detailing thewave numbers at which specific absorption occurred.
Before analysing the engine sump lubricant samples, a model formulation of 2wt% Linoleic acid in XHVI-8.2TM (Shell) was analysed to give a reference spectrum
for a known quantity of additive in fresh sump lubricant. Subsequent analysis ofsump samples was then compared with the reference spectrum giving anapproximation to the level of Linoleic acid contamination in the sample. Theseanalyses were conducted at Shell Global Solutions (UK) Analytical Laboratories byRob Wetton.
5.3.2. Fuel Dilution Measurement by Gas Chromatography
Gas Chromatography (GC) analysis was conducted on sump samples at ShellGlobal Solutions (UK) Analytical Laboratories for fuel dilution. The process isdescribed in detail is Chapter 3, section 2.5.1.
5.4. Engine Performance Tests Results and Analysis
Six identical tests were conducted to measure the effect on engine torque as aresult of switching from STD to FM gasoline. As discussed in section 5.1.3 tests 2and 5 did not produce any useful data as a result of mechanical and computationalfailure respectively. As a result of this, results presented in this section are those oftest 1 and 3. Test 6 showed similar results to that of test 1 and 3, although with
some noise in the data as a result of the poor cleanliness of the engine components asdiscussed in section 5.1.3. For this reason, and for concision, test 6 data has beenomitted from this section.
The result taken for the first test is shown in Figure 5-5. On first inspection ofthe figure it is clear that changing the fuel supply from STD gasoline to FM gasolinehas a measurable effect on the output torque of the engine. Although the raw trace
showing engine torque variation with time shows some fluctuation in reading, themoving average trace shown in black clarifies the situation. The difference in outputtorque between phase 1 and phase 2 is approximately +1.8%. Interestingly, thiseffect is not reversed when switching back from FM gasoline to STD (Phase 2 - 3),
although it was noted that some air was entrained into the fuel feed circuit during the
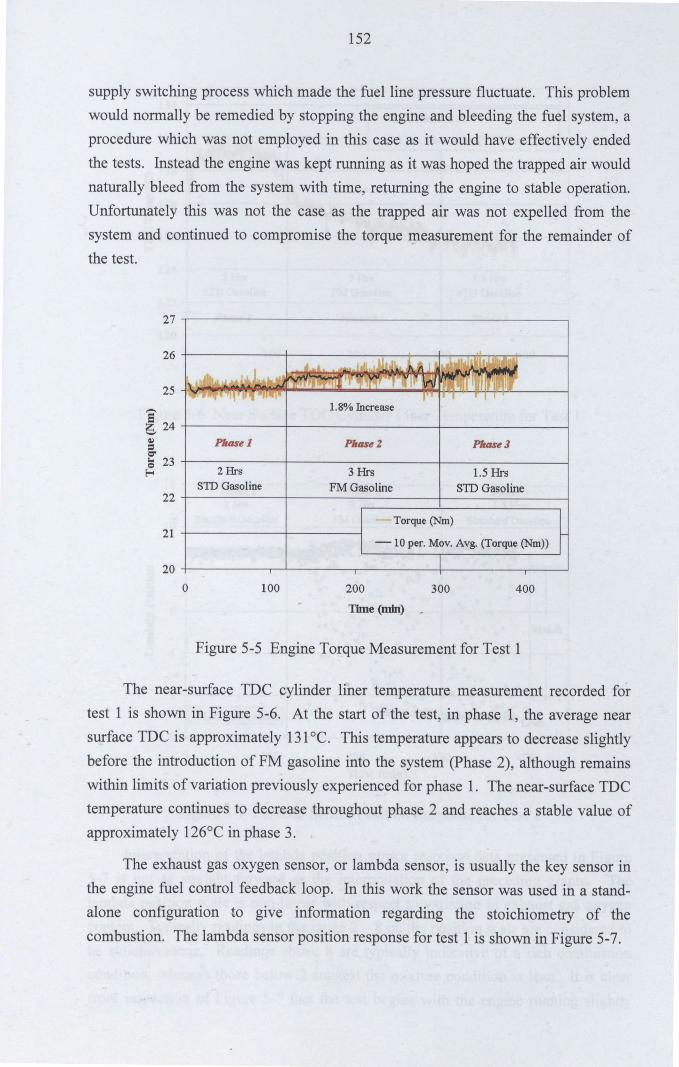
152
supply switching process which made the fuel line pressure fluctuate. This problemwould normally be remedied by stopping the engine and bleeding the fuel system, aprocedure which was not employed in this case as it would have effectively endedthe tests. Instead the engine was kept running as it was hoped the trapped air wouldnaturally bleed from the system with time, returning the engine to stable operation.Unfortunately this was not the case as the trapped air was not expelled from thesystem and continued to compromise the torque measurement for the remainder ofthe test.
27
26
25,-..
~ 24'-"~ Phase I=='.. 23Q
E-< 2 HrsSTD Gasoline
22
21
20
0 100
1.8% Increase
1.5 HrsSID Gasoline
Phase2 PhaseJ
3 HrsFMGasoline
Torque (Nm)
- 10 per. Mov. Avg. (Torque (Nm)
200 300 400
TIme (min) ..
Figure 5-5 Engine Torque Measurement for Test 1
The near-surface TDC cylinder liner temperature measurement recorded fortest 1 is shown in Figure 5-6. At the start of the test, in phase 1, the average near
surface TDC is approximately 131°C. This temperature appears to decrease slightlybefore the introduction of FM gasoline into the system (phase 2), although remainswithin limits of variation previously experienced for phase 1. The near-surface TDCtemperature continues to decrease throughout phase 2 and reaches a stable value ofapproximately 126°C in phase 3.
The exhaust gas oxygen sensor, or lambda sensor, is usually the key sensor inthe engine fuel control feedback loop. In this work the sensor was used in a stand-
alone configuration to give information regarding the stoichiometry of thecombustion. The lambda sensor position response for test 1 is shown in Figure 5-7.
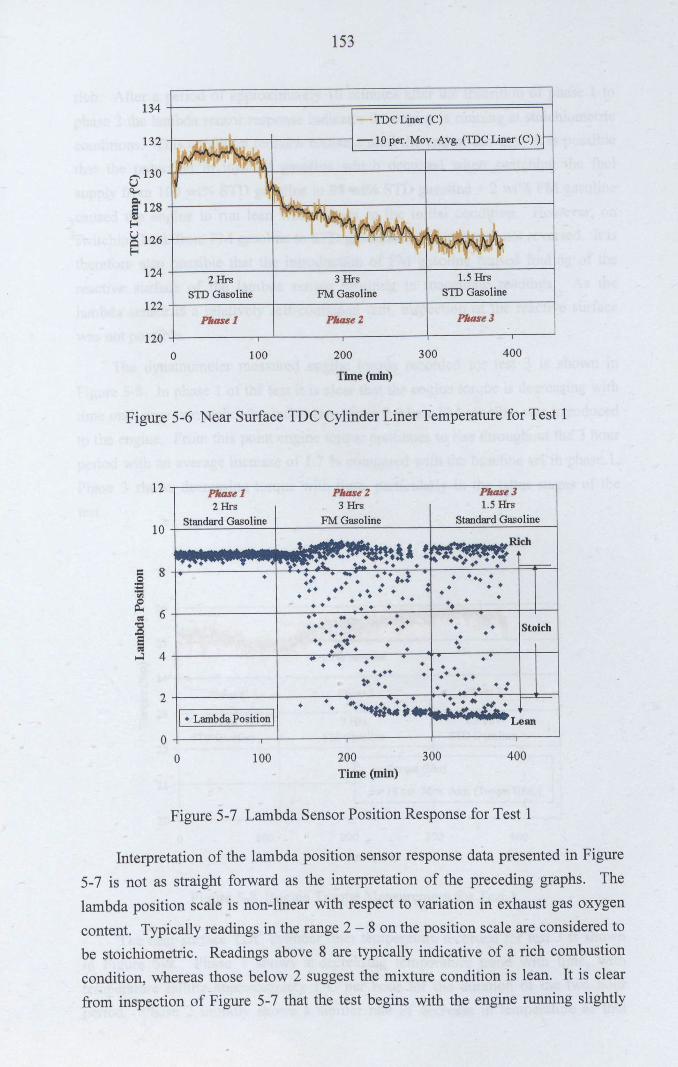
134
132
0'130Q...,
Q.128~E-<g 126E-<
124
122
1200
153
- IDeLiner (e)
+--.-::-r:c-+.---l-------1-10 per. Mov. Avg. (IDeLiner (e))
2 HrsSIDGasoline
3 HrsFM Gasoline
1.5 HrsSIDGasoline
PillISe 1 PillISe 2 PhllSe3
100 200Time (min)
300 400
Figure 5-6 Near Surface TDC Cylinder Liner Temperature for Test 1
12
10
= 8Q
E'"~ 6~:8El~....:l 4
2
0
PhllSe 1 PhllSe2 PhllSe32Hrs 3 Hrs 1.5 Hrs
Standard Gasoline FMGasoline Standard Gasoline
t .... MO Rich..~·..;~l' !~ ....~-..~..~. T .~.~..:( ~.... • •• • f--r--
• •• ..... ... \ • + ••••• •• • ••• ~•• .+ .. • • • •• •• •• • •• • •• • • • • ••• .. • •••• • • • •• •• • • Stoich•• • •. ~.. •• •..~.. • •... •• •• •• •••• • •• .+ •••
t· •• • • • ••• ~ ..
+. • ....J.~. •t--L-..-
• • ...·...;;;-..;.1I • Lambda Position I ~ ... ~ :'".Lean
o 100 200Time (min)
300 400
Figure 5-7 Lambda Sensor Position Response for Test 1
Interpretation of the lambda position sensor response data presented in Figure
5-7 is not as straight forward as the interpretation of the preceding graphs. The
lambda position scale is non-linear with respect to variation in exhaust gas oxygencontent. Typically readings in the range 2 - 8 on the position scale are considered to
be stoichiometric. Readings above 8 are typically indicative of a rich combustion
condition, whereas those below 2 suggest the mixture condition is lean. It is clearfrom inspection of Figure 5-7 that the test begins with the engine running slightly
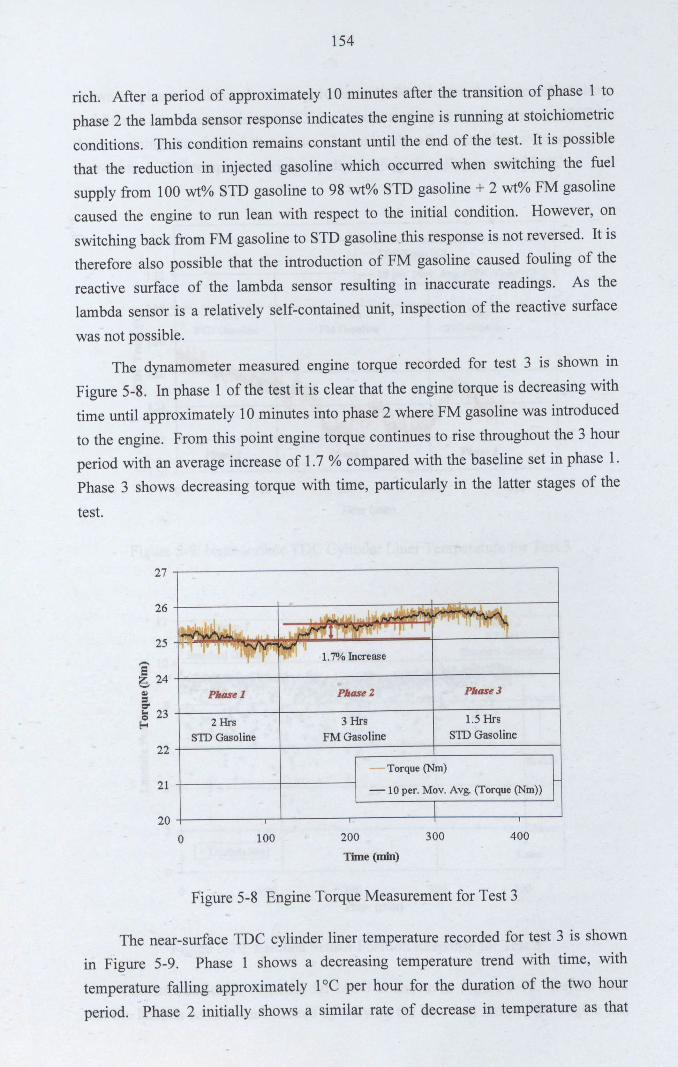
154
rich. After a period of approximately 10 minutes after the transition of phase 1 to
phase 2 the lambda sensor response indicates the engine is running at stoichiometricconditions. This condition remains constant until the end of the test. It is possiblethat the reduction in injected gasoline which occurred when switching the fuelsupply from 100 wt% STD gasoline to 98 wt% STD gasoline + 2 wt% FM gasolinecaused the engine to run lean with respect to the initial condition. However, on
switching back from FM gasoline to STD gasolinethis response is not reversed. It istherefore also possible that the introduction of FM gasoline caused fouling of the
reactive surface of the lambda sensor resulting in inaccurate readings. As thelambda sensor is a relatively self-contained unit, inspection of the reactive surface
was not possible.
The dynamometer measured engine torque recorded for test 3 is shown in
Figure 5-8. In phase 1 of the test it is clearthat the engine torque is decreasing withtime until approximately 10 minutes into phase 2 where FM gasoline was introducedto the engine. From this point engine torque continues to rise throughout the 3 hourperiod with an average increase of 1.7 % compared with the baseline set in phase 1.Phase 3 shows decreasing torque with time, particularly in the latter stages of the
test.
27
26
25,-..
~ 24~ Phase L=C'.. 23ClE-o 2Hrs
STD Gasoline22
21
200 100
PhQSe3
3 HrsFMGasoline
1.5 HrsSID Gasoline
-Torque (Nm)
- 10 per. Mov. Avg. (Torque (Nm))
200Time (min)
300 400
Figure 5-8 Engine Torque Measurement for Test 3
The near-surface TDC cylinder liner temperature recorded for test 3 is shownin Figure 5-9. Phase 1 shows a decreasing temperature trend with time, with
temperature falling approximately 1"C per hour for the duration of the two hourperiod. Phase 2 initially shows a similar rate of decrease in temperature as that
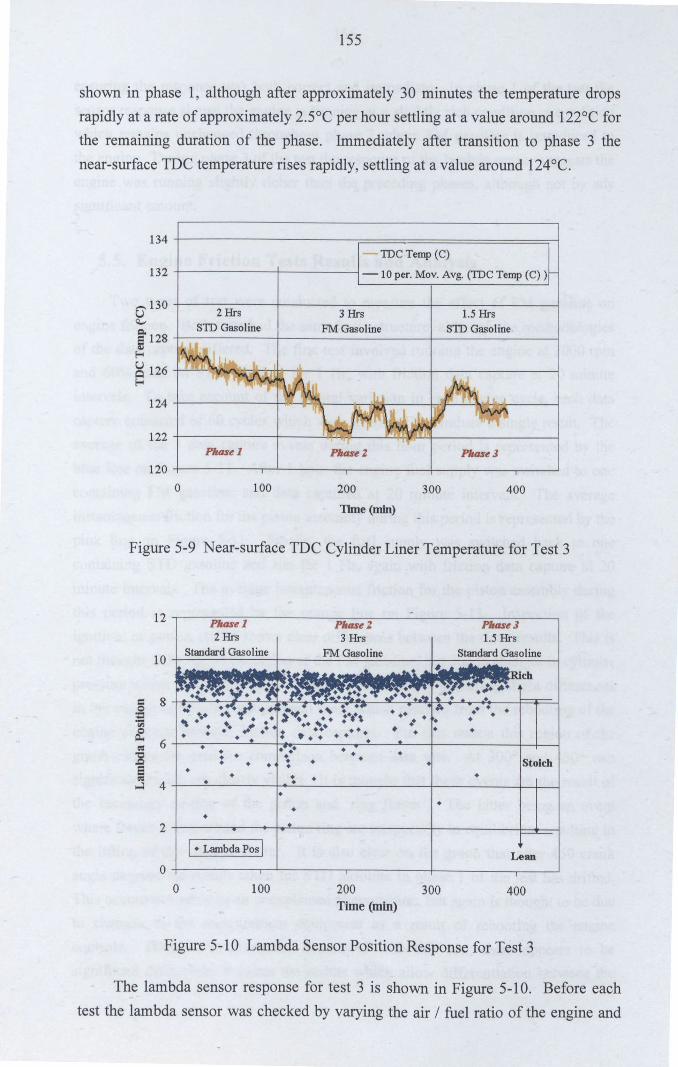
155
shown in phase 1, although after approximately 30 minutes the temperature dropsrapidly at a rate of approximately 2.5°C per hour settling at a value around 122°C forthe remaining duration of the phase. Immediately after transition to phase 3 thenear-surface TDC temperature rises rapidly, settling at a value around 124°C.
134IDCTemp (C)
132 -10 per. Mov. Avg. (IDC Temp (C) )
C130 2 Hrs 3 Hrs 1.5 HrsQ".,
SID Gasoline FM Gasoline SID Gasoline~ 128f-<~ 126f-<
124
122Phase l Phase Z Phase]
1200 100 200 300 400
TIme (min)
Figure 5-9 Near-surface TDC Cylinder Liner Temperature for Test 3
12 Phase 1 PhaseZ Phase]2Hrs 3 Hrs 1.5 Hrs
10Rich
= 8 •Q • • •= • •• •'" • • •~ •~ 6 • •:8 • • • •• • Stoich• • • • •!3 • •~ • • •...:l 4 • •
• •••2 •I • Lambda Pos I Lean
00 100 200 300 400
Time (min)
Figure 5-10 Lambda Sensor Position Response for Test 3
The lambda sensor response for test 3 is shown in Figure 5-10. Before eachtest the lambda sensor was checked by varying the air I fuel ratio of the engine and
156
ensuring the response was both correct and immediate. In phase 1 of the test thesensor response shows the engine is running at a slightly rich condition, a conditionwhich remains unchanged throughout phase 2 where FM gasoline is introduced tothe engine. During phase 3 of the test the response of the lambda sensor suggests theengine was running slightly richer than the preceding phases, although not by anysignificant amount.
5.5. Engine Friction Tests Results and Analysis
Two types of test were conducted to measure the effect of FM gasoline onengine friction. Both tests had the same basic structure, although the methodologiesof the data capture differed. The first test involved running the engine at 2000 rpmand 60% load on STD gasoline for 1 Hr, with friction data capture at 20 minuteintervals. To take account of the natural variation in each engine cycle, each datacapture consisted of 60 cycles which were averaged to produce a single result. Theaverage of the 3 data capture events during this hour period is represented by theblue line on Figure 5-11. After 1 hour the engine fuel supply was switched to onecontaining FM gasoline, and data captured at 20 minute intervals. The averageinstantaneous friction for the piston assembly during this period is represented by thepink line on Figure 5-11. Finally, the fuel supply was switched back to onecontaining STD gasoline and run for 1 Hr, again with friction data capture at 20minute intervals. The average instantaneous friction for the piston assembly duringthis period is represented by the orange line on Figure 5-11. Inspection of theignition, or power, stroke shows clear differences between the three results. This isnot thought to be due to the action of the FM gasoline, but due to changes in cylinderpressure which occurred both as a result of the naturally occurring slight differencesin the engine operation condition and those which resulted from the rebooting of theengine controls between friction data captures. For this reason this region of thegraph cannot be used for comparison between data sets. At 3000 and 4500 twosignificant events are clearly visible. It is thought that these events are the result ofthe secondary motion of the piston and 'ring flutter'. The latter being an eventwhere forces acting around the piston ring are temporarily in equilibrium resulting inthe lifting of the ring, or flutter. It is also clear on the graph that after 450 crankangle degrees the results taken for STD gasoline in phase 1 of the test has drifted.This occurrence remains an unexplained phenomenon, but again is thought to be dueto changes to the measurement equipment as a result of rebooting the enginecontrols. Despite the anomalies associated with this test, there appears to besignificant differences between the results which allow differentiation between the
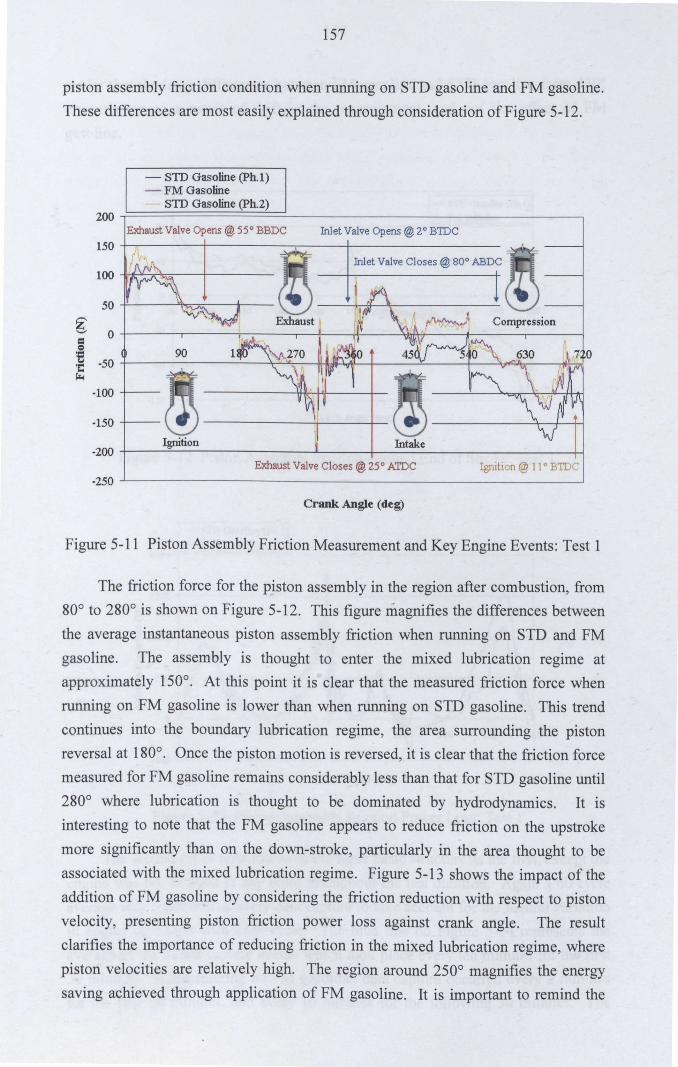
157
piston assembly friction condition when running on STD gasoline and FM gasoline.These differences are most easily explained through consideration of Figure 5-12.
- STD Gasoline (ph. I)- FM Gasoline
STD Gasoline (ph.2)200~================~-------------------------------,
100\50
\~g I
= 0e~ -50'C~
-100
-150
-200
-250
Exhaust Valve Opens @55°BBDC Inlet Valve Opens @ 2° BIDC
Compression
Exhaust Valve Closes @ 250 AIDC Ignition @ 110 BIDe
Crank Angle (deg)
Figure 5-11 Piston Assembly Friction Measurement and Key Engine Events: Test 1
The friction force for the piston assembly in the region after combustion, from80° to 280° is shown on Figure 5-12. This figure magnifies the differences betweenthe average instantaneous piston assembly friction when running on STD and FMgasoline. The assembly is thought to enter the mixed lubrication regime atapproximately 150°. At this point it is clear that the measured friction force whenrunning on FM gasoline is lower than when running on STD gasoline. This trendcontinues into the boundary lubrication regime, the area surrounding the pistonreversal at 180°. Once the piston motion is reversed, it is clear that the friction forcemeasured for FM gasoline remains considerably less than that for STD gasoline until280° where lubrication is thought to be dominated by hydrodynamics. It isinteresting to note that the FM gasoline appears to reduce friction on the upstrokemore significantly than on the down-stroke, particularly in the area thought to be
associated with the mixed lubrication regime. Figure 5-13 shows the impact of theaddition of FM gasoline by considering the friction reduction with respect to pistonvelocity, presenting piston friction power loss against crank angle. The resultclarifies the importance of reducing friction in the mixed lubrication regime, wherepiston velocities are relatively high. The region around 250° magnifies the energy
saving achieved through application of FM gasoline. It is important to remind the
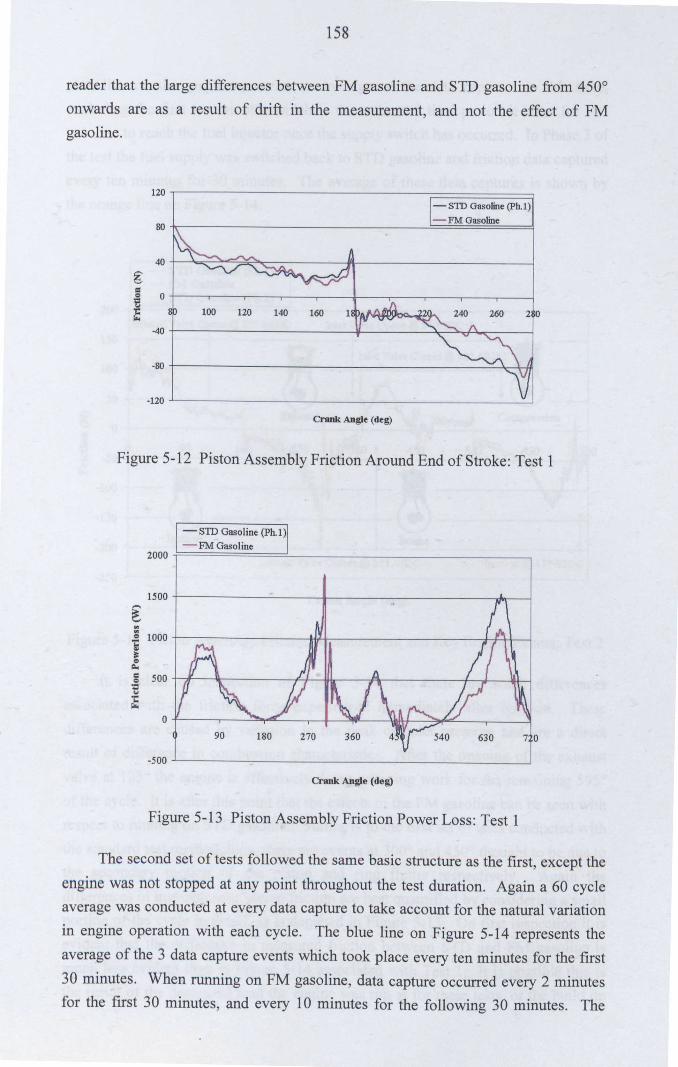
158
reader that the large differences between FM gasoline and STD gasoline from 4500
onwards are as a result of drift in the measurement, and not the effect of FMgasoline.
120
so
40g== 0:gt:r..
-40
-so
-120Crank Angle (d~g)
- STD Gasoline (ph. I)- FM Gasoline
Figure 5-12 Piston Assembly Friction Around End of Stroke: Test 1
-sm Gasoline (Ph. I)- FM Gasoline
2000,'======:=:::!.--------- -,
1500+-----_...::...._--t----------.......,}>,,--j
-500-'------..,,--------- ~
Crank Angle (deg)
Figure 5-13 Piston Assembly Friction Power Loss: Test 1
The second set of tests followed the same basic structure as the first, except the
engine was not stopped at any point throughout the test duration. Again a 60 cycleaverage was conducted at every data capture to take account for the natural variationin engine operation with each cycle. The blue line on Figure 5-14 represents theaverage of the 3 data capture events which took place every ten minutes for the first
30 minutes. When running on FM gasoline, data capture occurred every 2 minutesfor the first 30 minutes, and every 10 minutes for the following 30 minutes. The
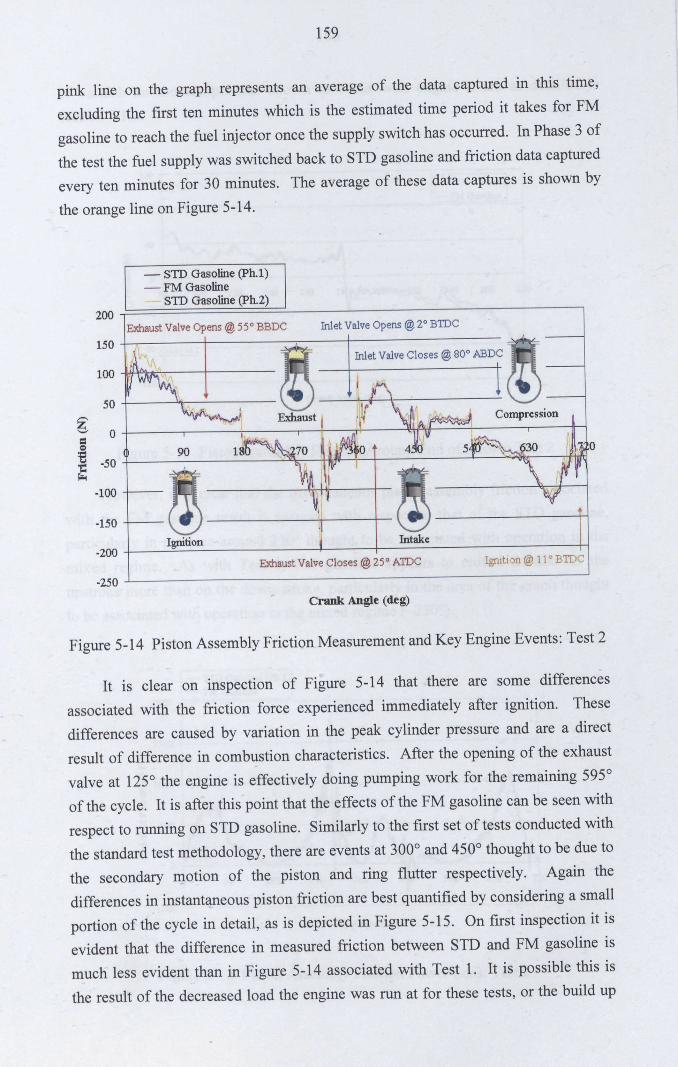
159
pink line on the graph represents an average of the data captured in this time,excluding the first ten minutes which is the estimated time period it takes for FM
gasoline to reach the fuel injector once the supply switch has occurred. In Phase 3 ofthe test the fuel supply was switched back to STD gasoline and friction data capturedevery ten minutes for 30 minutes. The average of these data captures is shown by
the orange line on Figure 5-14.
- STD Gasoline (ph.1)- FM Gasoline
STD Gasoline (ph.2)200~================~-------------------------------'
Exhaust Valve Opens @ 55° BBDC Inlet Valve Opens @ 2.0BIDC
50g 0=e~ -50'C~
-100
-150-4--Ignition-200+-__----=:~---------+---_+_------------+-1Intake
Exhaust Valve Closes @2.5° AIDC Ignition @ 110 BIDC
-250~-------------------------~Crank AngIe (deg)
Figure 5-14 Piston Assembly Friction Measurement and Key Engine Events: Test 2
It is clear on inspection of Figure 5-14 that there are some differences
associated with the friction force experienced immediately after ignition. Thesedifferences are caused by variation in the peak cylinder pressure and are a directresult of difference in combustion characteristics. After the opening of the exhaustvalve at 1250 the engine is effectively doing pumping work for the remaining 5950
of the cycle. It is after this point that the effects of the FM gasoline can be seen withrespect to running on STD gasoline. Similarly to the first set of tests conducted with
the standard test methodology, there are events at 3000 and 4500 thought to be due tothe secondary motion of the piston and ring flutter respectively. Again thedifferences in instantaneous piston friction are best quantified by considering a smallportion of the cycle in detail, as is depicted in Figure 5-15. On first inspection it isevident that the difference in measured friction between STD and FM gasoline ismuch less evident than in Figure 5-14 associated with Test 1. It is possible this isthe result of the decreased load the engine was run at for these tests, or the build up
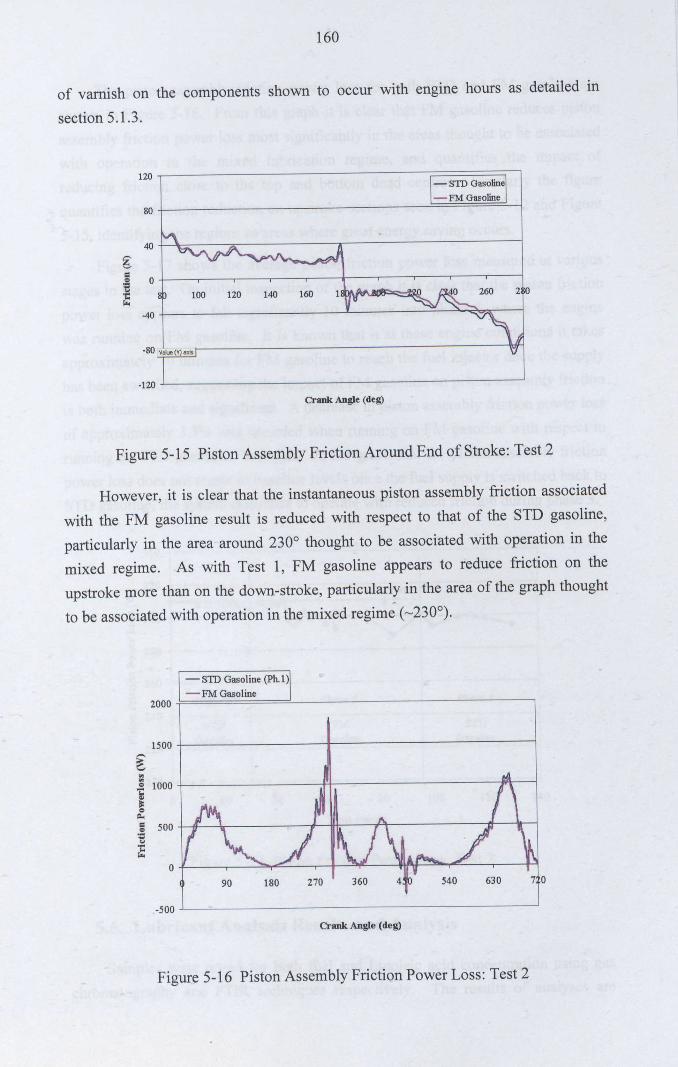
160
of varnish on the components shown to occur with engine hours as detailed in
section 5.1.3.
120- STD Gasoline- FM Gasoline
80
40
g== 0'E.r::'" ·40
.120..1.------------------------'
Crank Angle (deg)
Figure 5-15 Piston Assembly Friction Around End of Stroke: Test 2
However, it is clear that the instantaneous piston assembly friction associated
with the FM gasoline result is reduced with respect to that of the STD gasoline,particularly in the area around 230° thought to be associated with operation in themixed regime. As with Test 1, FM gasoline appears to reduce friction on theupstroke more than on the down-stroke, particularly in the area of the graph thought
to be associated with operation in the mixed regime (~2300).
-sm Gasoline (Ph. i)- FM Gasoline
2000-,'====~~=::=!----------------,
1500+- ~------------l
_500..L---------------------_J
Crank Angle (deg)
Figure 5-16 Piston Assembly Friction Power Loss: Test 2
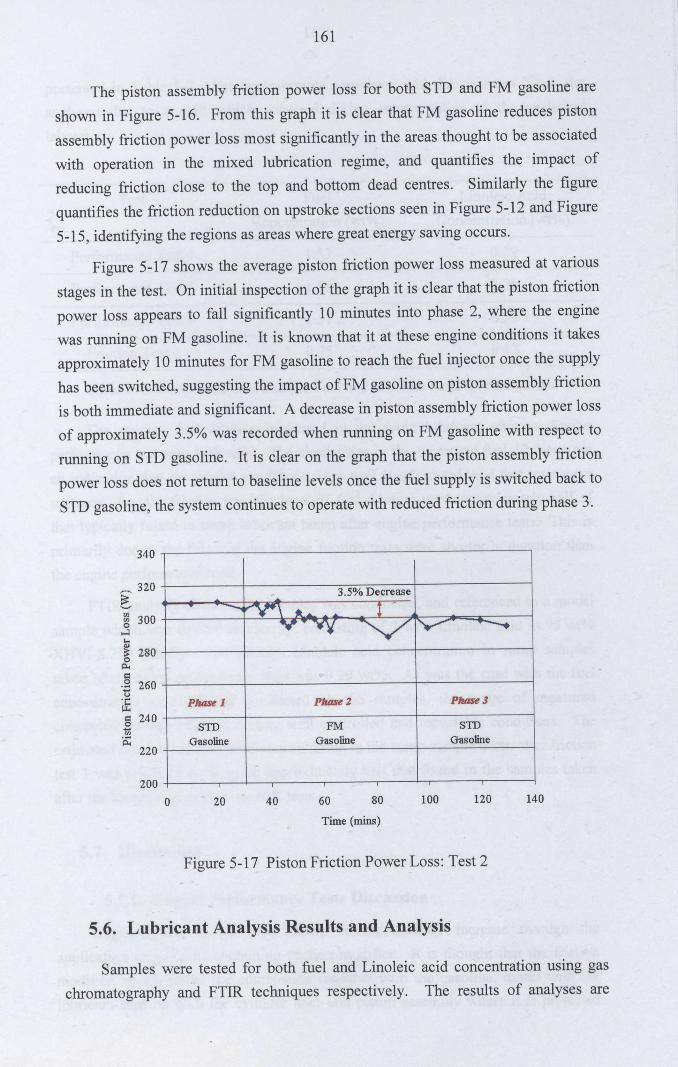
161
The piston assembly friction power loss for both STD and FM gasoline are
shown in Figure 5-16. From this graph it is clear that FM gasoline reduces piston
assembly friction power loss most significantly in the areas thought to be associatedwith operation in the mixed lubrication regime, and quantifies the impact ofreducing friction close to the top and bottom dead centres. Similarly the figure
quantifies the friction reduction on upstroke sections seen in Figure 5-12 and Figure
5-15, identifying the regions as areas where great energy saving occurs.
Figure 5-17 shows the average piston friction power loss measured at various
stages in the test. On initial inspection of the graph it is clear that the piston frictionpower loss appears to fall significantly 10 minutes into phase 2, where the enginewas running on FM gasoline. It is known that it at these engine conditions it takesapproximately 10 minutes for FM gasoline to reach the fuel injector once the supplyhas been switched, suggesting the impact ofFM gasoline on piston assembly frictionis both immediate and significant. A decrease in piston assembly friction power loss
of approximately 3.5% was recorded when running on FM gasoline with respect torunning on STD gasoline. It is clear on the graph that the piston assembly friction
power loss does not return to baseline levels once the fuel supply is switched back toSTD gasoline, the system continues to operate with reduced friction during phase 3.
340
~ 320~'" 300'"0....:I...~ 2800Po.s::.~ 260o
&s:: 240£'"p;
220
3.5% Decrease......."'V\ ..... T ..
VT~ ~
Plulse 1 PIulse2 Plulse 3
STD FM STDGasoline Gasoline Gasoline
200o 20 40 60 80 100 120 140
Time (mins)
Figure 5-17 Piston Friction Power Loss: Test 2
5.6. Lubricant Analysis Results and Analysis
Samples were tested for both fuel and Linoleic acid concentration using gaschromatography and FTIR techniques respectively. The results of analyses are
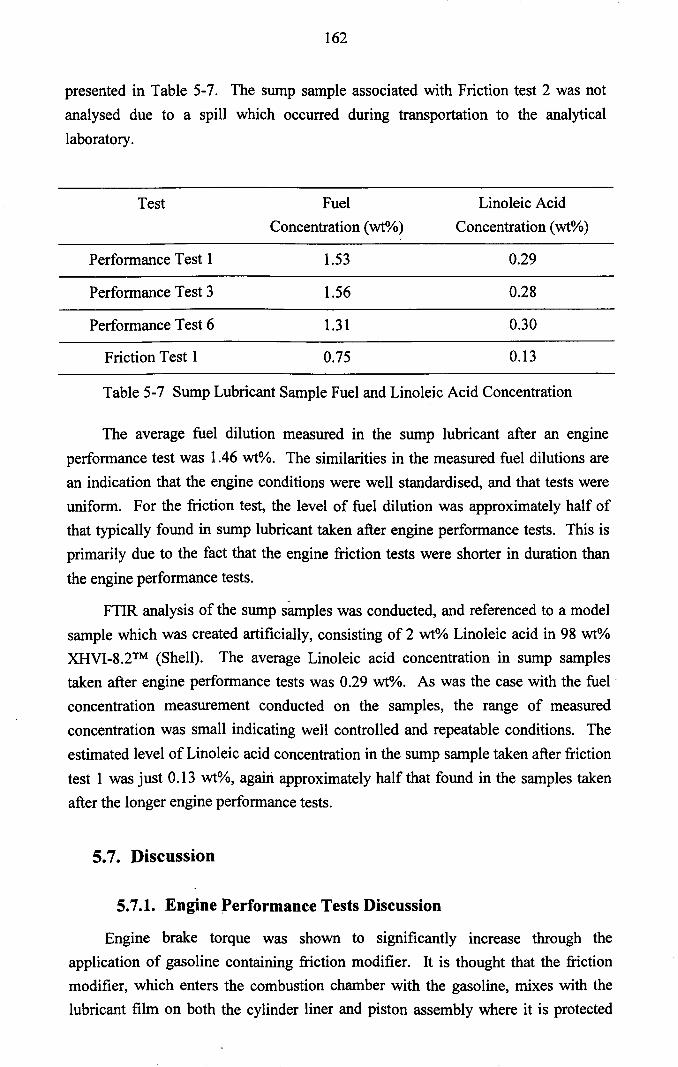
162
presented in Table 5-7. The sump sample associated with Friction test 2 was notanalysed due to a spill which occurred during transportation to the analyticallaboratory.
Test FuelConcentration (wt%)
Linoleic AcidConcentration (wt%)
Performance Test 1 1.53 0.29
Performance Test 3 1.56 0.28
Performance Test 6 1.31 0.30
Friction Test 1 0.75 0.13
Table 5-7 Sump Lubricant Sample Fuel and Linoleic Acid Concentration
The average fuel dilution measured in the sump lubricant after an engineperformance test was 1.46 wt%. The similarities in the measured fuel dilutions arean indication that the engine conditions were well standardised, and that tests wereuniform. For the friction test, the level of fuel dilution was approximately half ofthat typically found in sump lubricant taken after engine performance tests. This isprimarily due to the fact that the engine friction tests were shorter in duration thanthe engine performance tests.
FTIR analysis of the sump samples was conducted, and referenced to a modelsample which was created artificially, consisting of 2 wt% Linoleic acid in 98 wt%XHVI-8.2TM(Shell). The average Linoleic acid concentration in sump samplestaken after engine performance tests was 0.29 wt%. As was the case with the fuelconcentration measurement conducted on the samples, the range of measuredconcentration was small indicating well controlled and repeatable conditions. Theestimated level of Linoleic acid concentration in the sump sample taken after frictiontest 1 was just 0.13 wt%, again approximately half that found in the samples takenafter the longer engine performance tests.
5.7. Discussion
5.7.1. Engine Performance Tests Discussion
Engine brake torque was shown to significantly mcrease through theapplication of gasoline containing friction modifier. It is thought that the frictionmodifier, which enters the combustion chamber with the gasoline, mixes with thelubricant film on both the cylinder liner and piston assembly where it is protected
163
from the combustion event. The additive film then acts to reduce the coefficient offriction in the contact allowing more of the energy supplied to the system by the fuelto be converted into useful work. It was shown in previous chapters that the tenacity
of the fatty acid molecule is relatively weak, suggesting additive films are probably
readily removed from the surface by the scraping action of the piston rings.However, as additive is administered to the surfaces with every opening of the fuelinjector supplies of additive are constantly being replenished, resulting in effectivecontinual modification of the contact condition. It is hypothesised that the systemmay be operating under what is known as 'Forced Equilibrium' conditions.Although additive molecules are removed from the surface by the scraping action of
the piston rings, fresh supplies of additive are always available to form where metalis exposed thus maintaining an effective surface film.
Typical results showed an approximate 2% increase in brake torque whenrunning on FM gasoline with respect to STD gasoline. However, this effect is notreversed when switching from FM gasoline to STD gasoline, although Figure 5-8
shows some indication that there is a reduction in torque with time. It is possible
that had the test run for longer engine torque may have returned to the benchline
value established at the start of the test. There are two main hypotheses whichexplain this phenomenon. The first recognises that the tenacity of the films were
shown to be weak in the arduous conditions simulated by bench-top tribometer tests,and conjects that conditions in the engine might be less difficult resulting in theincreased tenacity of the additive films. The second is based on the knowledgegained as a result of the lubricant sampling tests which were presented earlier in this
thesis where additive was shown to accumulate in both the top ring groove andcylinder liner oil film in considerable quantities. This lead to the hypothesis stating.that although FM gasoline was no longer being applied to the system, a significantexcess of accumulated active additive in the lubricant continued to maintain an
effective friction modifier film for a period of time. The third hypothesis is againbased on findings from the lubricant sampling tests which identified two main
transport mechanisms of gasoline to the sump lubricant; liquid and vapour phasetransport. This hypothesis acknowledges that although the bulk of the gasolineadministered friction modifier was probably burnt and exited the engine via theexhaust, a significant quantity of additive is likely to be transported to the sumplubricant by the two mechanisms discussed above. Once in the engine lubricant theFM additive is available to reduce friction in a manner more typical of a fullyformulated engine oil containing an FM additive. However, results presented inTable 5-7 show a typical 0.3 wt% concentration of Linoleic acid in the sump
lubricant, a quantity not thought to be large enough to have a significant effect onengine friction.
164
Two other interesting effects were recorded during the engine performancetests, a reduction in near-surface cylinder liner temperature and variation in exhaustgas oxygen concentration. When running on FM gasoline the near-surface cylinderliner temperature was typically 2 °C less than when run on STD gasoline. Thisresult is particularly interesting when given context by the exhaust gas oxygensensor reading for the same test. Typically the engine was thought to run at a leanermixture condition when operating on FM gasoline, a result of the fuel supplycontaining 2 wt% less gasoline. It is widely understood that running an engine atlean conditions will increase exhaust gas temperature, in turn raising thetemperatures of components associated with the combustion chamber. It is possiblethat the reduction in near-surface cylinder liner temperature measured when FMgasoline was applied to the system is a direct result of reducing engine friction.
However, it is the view of the author that the increase in component temperaturecaused by leaning the combustion mixture would far outweigh any temperaturereduction caused by reduced friction in the contact. However, it is equally possible
that at the start of the test the engine was running rich enough to absorb the leaningof the mixture caused through the switching of the fuel supply to FM gasoline,
remaining predominantly rich and allowing the reduction in near-surface temperatureto be a significant measurable quantity.
5.7.2. Engine Friction Tests Discussion
Following a similar structure to the engine performance tests, the engine wasequipped with apparatus allowing the measurement of piston assembly friction under
firing conditions. The first set of engine tests were conducted using a standardisedmethodology which involved rebooting the power to the test cell after every datacapture. Although this procedure is thought to have created some variation in theoperation of the engine, the effects of running the engine on FM gasoline were still
clearly measurable. Results taken from the test showed reduced friction operation ofthe piston assembly when operating in both the boundary and mixed lubricationregimes. This is consistent with bench-top tribometer test results presented in earlierchapters suggest Linoleic acid to be effective in both lubrication regimes. The piston
assembly friction measurement highlights an interesting effect where the frictionmeasured when operating in the mixed lubrication regime during the upstroke was
reduced to a greater extent than on the equivalent down-stroke. The hypotheticalexplanation for this is that the napier scraper faced profile of the second compressionring is well separated from the liner surface by the additive film on the upstroke dueto its wedge shape, but less effectively separated on the down-stroke where itsdesign ensures an aggressive scraping action. Essentially the additive film is capableof reducing the contact friction between cylinder liner and both first and second
165
piston rings on the upstroke, but is less effective at reducing the second compressionring friction on the down-stroke, thus friction reduction in this area is mainlyassociated with the action of the top compression ring.
Calculation of piston assembly friction power loss reveals the areas of theengine cycle where the FM additive enhances energy savings most. Although withFM gasoline friction is shown to be lowered around the piston reversal points, orend-stroke, the low velocity in these regions means energy saving is low. In themixed regime, where piston speeds are relatively high, the greatest energy saving isachieved.
Analysis of the sump lubricant sample taken on completion of the test showedit to contain 0.75 wt% gasoline and 0.13 wt% Linoleic acid. This is approximatelyhalf the concentration measured in samples taken after the engine performance tests,and is thought to be a result of the difference in the duration of the tests. During theengine performance tests the FM additive was injected into the engine for 3 hours,whereas for the engine friction tests it was only injected for 1 hour. This level ofLinoleic acid contamination in the sump lubricant is not thought to be high enoughto significantly affect engine friction.
The second set of piston assembly friction measurement tests were conductedat similar conditions to the first, although at 50% load instead of 60%. To eliminateengine operation variation as a result of cutting power to the test cells, a procedureconducted to measure the amplifier drifts, the test methodology was changedallowing the engine to run undisturbed from the start of the test to the finish. Thismethodology allowed the determination of the speed of reaction of the FM additiveas a result of the increased test resolution. Data captured during these testshighlights the effectiveness of the method as many of the effects resulting fromvariation in engine condition as a result of the amplifier drift measurementmethodology were eliminated. As with the first test, results highlight theeffectiveness of Linoleic acid at reducing piston assembly friction in both theboundary and mixed lubrication regimes, as well as the enhanced ability of theadditive to reduce friction on the piston upstrokes. However, the effects of theadditive appear to be reduced when compared with those measured in test 1. Thereare two hypotheses which can explain this phenomenon. The first suggests thereduced engine load condition used in test 2 results in less arduous asperity contact,thus the need for FM additive is reduced. The second hypothesises that the enginesurfaces were coated in a varnish formed due to the lack of detergent in either thelubricant or fuel. The varnish reduces the number of sights onto which the additivecan form, thus reducing the effective impact of the friction modifier.
166
Consideration of friction reduction with respect to piston velocity, or pistonassembly friction power loss, shows us that the FM gasoline saves a great deal ofenergy through reducing friction where operation is in the mixed lubrication regime,
although it is clear on inspection of Figure 5-16 that energy saving occurs throughmost of the engine cycle when FM additive is used.
The modified test methodology allowed data capture to occur at more frequent
intervals, permitting the determination of the speed of reaction of the FM gasoline.Figure 5-17 shows the average piston assembly friction power loss for each datacapture conducted throughout the test. From inspection of this figure it isimmediately apparent that friction power loss is reduced approximately 10 minutesafter switching the fuel supply from STD gasoline to FM gasoline, showing theimpact of FM gasoline on friction power loss to be both immediate and significant.As discussed earlier, it is estimated that it took 10 minutes for the FM gasoline to
reach the fuel injector once the fuel supply had been switched from STD gasoline.There was a 3.5% decrease in average friction power loss through the application ofFM gasoline with respect to STD gasoline, an effect which did not reverse onceswitchback to STD gasoline was initiated. The possible reasons why the frictionpower loss did not return to the benchline value measured at the start of the test were
discussed earlier.
5.8. Summary
In this chapter a series of engine tests were described where the effects ofgasoline doped with friction modifier additive were tested. Preliminary engine testswere conducted to 'scout' the effects of gasoline containing friction modifieradditive. These tests measured the effect on dynamometer engine brake torque as a
result of switching from standard gasoline to gasoline containing friction modifier.
A second series of tests were conducted which used the Instantaneous MeanEffective Pressure method to directly measure changes in piston assembly friction asa result of switching from standard gasoline to gasoline containing friction modifier.On consideration of all results, analysis and discussion presented in this chapter, thefollowing summary can be made.
• Engine output torque was shown to increase approximately 2% throughapplication of gasoline containing Linoleic acid friction modifier at 2wt%.
• Friction modifier additive is thought to accumulate in the lubricant filmon both piston assembly and cylinder liner and continues to effect the
167
piston assembly lubrication after the supply of gasoline containingfriction modifier has been removed.
• The additive system is thought to operate in forced equilibriumconditions, where additive molecules removed from the surface areimmediately replaced by surrounding molecules maintaining aneffective surface film.
• Near-surface cylinder liner temperature was shown to reduceapproximately 2°C with the application of gasoline containing frictionmodifier, although varying engine condition makes it impossible tosuggest this effect was due solely to friction reduction in the contactbetween piston assembly and cylinder liner.
• When run on gasoline containing friction modifier, the engine sumplubricant was shown to contain measurable amounts of frictionmodifier. Friction modifier additive is thought to be transported to theengine sump via both vapour phase and liquid transport mechanisms.
• Gasoline containing friction modifier was shown to considerablyreduce piston assembly friction through modification of the lubricationconditions in both the boundary and mixed lubrication regimes.
• Appreciable energy savings were shown to result through application ofgasoline containing friction modifier, principally as a result of thereduced friction in the mixed lubrication regime.
• The effect of gasoline containing friction modifier was shown to bemost pronounced on the piston upstroke, where the action of theadditive is thought to influence the lubrication condition of the secondcompression ring in addition to that of the top compression ring.
• Gasoline containing friction modifier was shown to have an immediateand significant effect on reducing engine friction after entering theengme.
• The findings of the engine tests presented in this chapter are consistentwith bench-top tribometer tests and show fatty acid friction modifier tobe effective at reducing the friction of the piston assembly.
168
6. Discussion
This thesis is presented in a rigid structure where each chapter represents astand-alone section of work. It is the purpose of this chapter to discuss the researchproject in its entirety, drawing together the findings from all chapters andinterpreting the conclusions with respect to each other. Only in considering allresults presented in this thesis as a linked data set can an evaluation of the impact intotality of friction modified gasoline be made.
In this chapter the key findings of the research project are discussed, wherepossible with reference to the research of others as detailed in Chapter 1, and withreference to the objectives outlined in the same chapter. The interpretation of resultswhich are seminal in this field of research is also conducted, with a view to buildingup a more knowledgeable picture of the way in which environmentally friendlyfriction modifier additives can work in automotive applications. Finally the impactof this type of research is discussed with respect to the motorist, society and theworld.
6.1. Key Project Findings
It was stated in Chapter 1.that the presence of fuel in the piston assembly /cylinder liner lubricant film is a widely observed occurrence, although previousresearch gives little quantification of the phenomenon. In Chapter 2 a series of in-cylinder lubricant sampling tests were presented which scoped the possibility ofadministering friction modifier directly to the piston assembly and cylinder linerwalls, whilst giving information detailing fuel contamination in the lubricant. Testswere conducted to extract lubricant from the top ring groove of the piston duringfiring engine conditions. Using standard gasoline and running at varying engineconditions the typical level of fuel dilution found in the lubricant samples extractedfrom the top ring groove ranged from 5 - 11wt%. This work contrasts with that ofGamble (2002a) where a similar set of tests were conducted on the same engine andshow fuel dilution to range between 10 - 80 vol%. However, work conducted byKim et al (2003) explains that fuel contamination in the cylinder liner oil film isheavily influenced by valve timing, injector timing and engine speed, factors whichmay explain experimental differences. Tests conducted in this research project didnot investigate the impact of varying valve or injector timing, but did investigate theimpact of varying engine speed on fuel contamination in the piston assemblylubricant, showing it to have some effect.
169
The final boiling point of the gasoline was shown to be a significant factorinfluencing the level of fuel contamination in the piston assembly lubricant, as wasalso found by Frottier et al (1996). Research conducted in this project showed 33
wt% fuel in the top ring zone sample when the engine was run on high boiling pointfuel.
The tests also served to investigate the possibility of administering friction
modifier to the piston assembly lubricant using gasoline. In the top ring groove,additive was shown to accumulate in proportions up to 77 times greater than the
initial treatment level of the fuel. Lubricant extracted from the top of the cylinderliner was shown to contain large amounts of additive; up to a level 5 times greaterthan the initial treatment level of the fuel. The amount of additive administered to
the cylinder liner oil film was shown to decrease towards the bottom of the cylinder
liner as expected, although it was still found in significant proportions.
Tests conducted from cold start engine conditions looked at the influence ofthe final boiling point of the gasoline on fuel dilution in the cylinder liner and sumplubricant (Section 2.7.1). Results of the experiments showed a significant increasein the level of sump fuel dilution when running on high boiling point gasoline withrespect to tests conducted on standard gasoline. The level of fuel found in the sump
after running on high boiling point fuel for four hours appeared to stabilise at around
1.7 wt%, whereas the level of fuel found in the test run on standard gasolineappeared to stabilise at around 1.1 wt%. It is interesting to compare these findingswith those of other researchers who have investigated sump fuel dilution. Asdiscussed in Chapter 1, Thompson (1997) developed a numerical model to simulatethe transport and accumulation of fuel in the lubricant sump, the conditions of which
are shown in Table 6-1 and are presented alongside the conditions of similar tests
conducted by Murakami and Aihara (1991) and the author of this thesis.Interestingly, Thompson's numerical approximation to sump fuel dilution predictedan equilibrium concentration of around 1.9 wt%, whilst Murakami and Aiharameasured 1.7 wt% fuel dilution in the sump under equilibrium conditions. Theauthor of this thesis suggests that the accumulation of fuel in engine sump lubricant
is governed by much more complex mechanisms than those which can be defined
through use of the parameters described in Table 6-1, although evidence suggeststhat models based on the parameters can approximate to experimental findings.Research reported in Chapter 2 of this thesis concludes that the transport of fuel tothe engine sump is thought to take place by one of two mechanisms; 1) fuel passesthe piston rings in the blow-by gasses in a vapour phase, 2) fuel adsorbs into the
cylinder liner lubricant, which is returned to the sump in a liquid phase through the
dynamic action of the piston ring / cylinder liner interface.
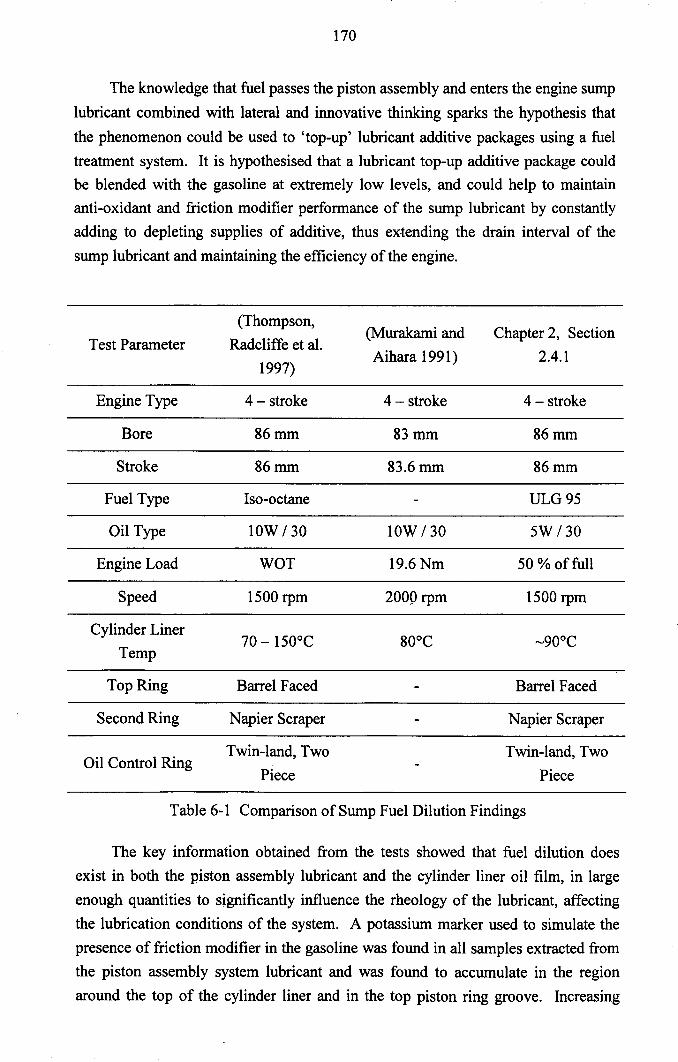
170
The knowledge that fuel passes the piston assembly and enters the engine sump
lubricant combined with lateral and innovative thinking sparks the hypothesis that
the phenomenon could be used to 'top-up' lubricant additive packages using a fueltreatment system. It is hypothesised that a lubricant top-up additive package couldbe blended with the gasoline at extremely low levels, and could help to maintainanti-oxidant and friction modifier performance of the sump lubricant by constantlyadding to depleting supplies of additive, thus extending the drain interval of the
sump lubricant and maintaining the efficiency of the engine.
Test Parameter(Thompson,
Radcliffe et al.1997)
(Murakami andAihara 1991)
Chapter 2, Section2.4.1
Engine Type 4 - stroke 4 - stroke 4 - stroke
Bore 86mm 83mm 86mm
Stroke 86mm 83.6mm 86mm
Fuel Type Iso-octane ULG95
Oil Type IOW / 30 IOW / 30 5W /30
Engine Load WOT 19.6Nm 50 % of full
Speed 1500 rpm 200P rpm 1500 rpm
Cylinder LinerTemp
70 -150°C
Top Ring Barrel Faced Barrel Faced
Second Ring Napier Scraper Napier Scraper
Oil Control RingTwin-land, Two
PieceTwin-land, Two
Piece
Table 6-1 Comparison of Sump Fuel Dilution Findings
The key information obtained from the tests showed that fuel dilution doesexist in both the piston assembly lubricant and the cylinder liner oil film, in largeenough quantities to significantly influence the rheology of the lubricant, affecting
the lubrication conditions of the system. A potassium marker used to simulate thepresence of friction modifier in the gasoline was found in all samples extracted fromthe piston assembly system lubricant and was found to accumulate in the regionaround the top of the cylinder liner and in the top piston ring groove. Increasing
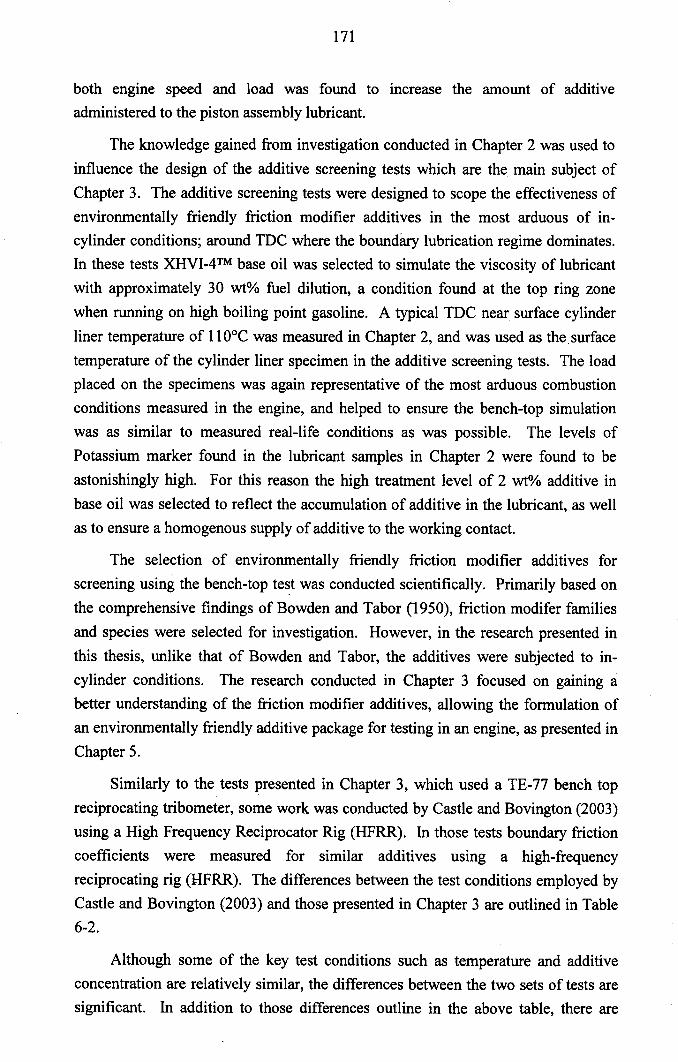
171
both engme speed and load was found to mcrease the amount of additiveadministered to the piston assembly lubricant.
The knowledge gained from investigation conducted in Chapter 2 was used to
influence the design of the additive screening tests which are the main subject ofChapter 3. The additive screening tests were designed to scope the effectiveness ofenvironmentally friendly friction modifier additives in the most arduous of in-cylinder conditions; around TDC where the boundary lubrication regime dominates.In these tests XHVI-4TM base oil was selected to simulate the viscosity of lubricantwith approximately 30 wt% fuel dilution, a condition found at the top ring zone
when running on high boiling point gasoline. A typical TDC near surface cylinder
liner temperature of 11DoCwas measured in Chapter 2, and was used as the. surfacetemperature of the cylinder liner specimen in the additive screening tests. The loadplaced on the specimens was again representative of the most arduous combustionconditions measured in the engine, and helped to ensure the bench-top simulationwas as similar to measured real-life conditions as was possible. The levels ofPotassium marker found in the lubricant samples in Chapter 2 were found to be
astonishingly high. For this reason the high treatment level of 2 wt% additive inbase oil was selected to reflect the accumulation of additive in the lubricant, as wellas to ensure a homogenous supply of additive to the working contact.
The selection of environmentally friendly friction modifier additives forscreening using the bench-top test was conducted scientifically. Primarily based onthe comprehensive findings of Bowden and Tabor (1950), friction modifer families
and species were selected for investigation. However, in the research presented in
this thesis, unlike that of Bowden and Tabor, the additives were subjected to in-cylinder conditions. The research conducted in Chapter 3 focused on gaining abetter understanding of the friction modifier additives, allowing the formulation ofan environmentally friendly additive package for testing in an engine, as presented inChapter 5.
Similarly to the tests presented in Chapter 3, which used a TE-77 bench topreciprocating tribometer, some work was conducted by Castle and Bovington (2003)using a High Frequency Reciprocator Rig (HFRR). In those tests boundary frictioncoefficients were measured for similar additives using a high-frequencyreciprocating rig (HFRR). The differences between the test conditions employed byCastle and Bovington (2003) and those presented in Chapter 3 are outlined in Table6-2.
Although some of the key test conditions such as temperature and additiveconcentration are relatively similar, the differences between the two sets of tests aresignificant. In addition to those differences outline in the above table, there are
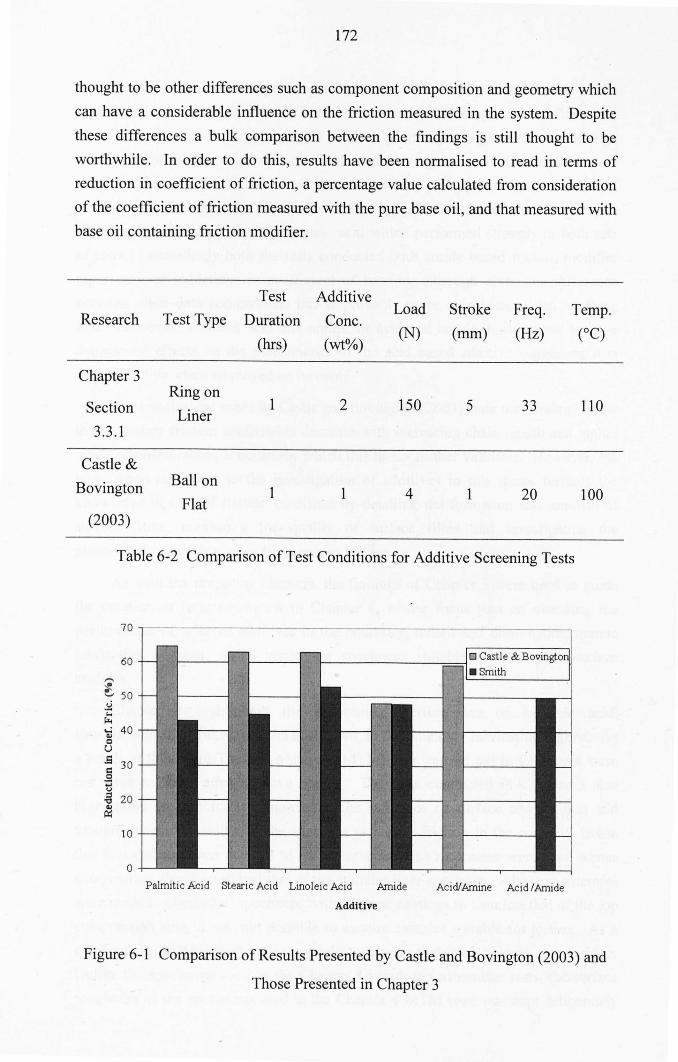
172
thought to be other differences such as component composition and geometry which
can have a considerable influence on the friction measured in the system. Despitethese differences a bulk comparison between the findings is still thought to beworthwhile. In order to do this, results have been normalised to read in terms ofreduction in coefficient of friction, a percentage value calculated from considerationof the coefficient of friction measured with the pure base oil, and that measured withbase oil containing friction modifier.
Test AdditiveLoad Stroke Freq. Temp.Research Test Type Duration Cone,
(hrs) (wt%)(N) (mm) (Hz) (QC)
Chapter 3Ring on
1 2 150 5 33 110Section Liner3.3.1
Castle &
Bovington Ball on1 1 4 1 20 100Flat
(2003)
Table 6-2 Comparison of Test Conditions for Additive Screening Tests
,......'i!.~ 50.~'"'~'oj 40eU
.~ 30
.Stj.g 20'"~
60
10
oPalmitic Acid Stearic Acid Linoleic Acid Amide
Additive
Acid/Amine Acid/Amide
Figure 6-1 Comparison of Results Presented by Castle and Bovington (2003) and
Those Presented in Chapter 3
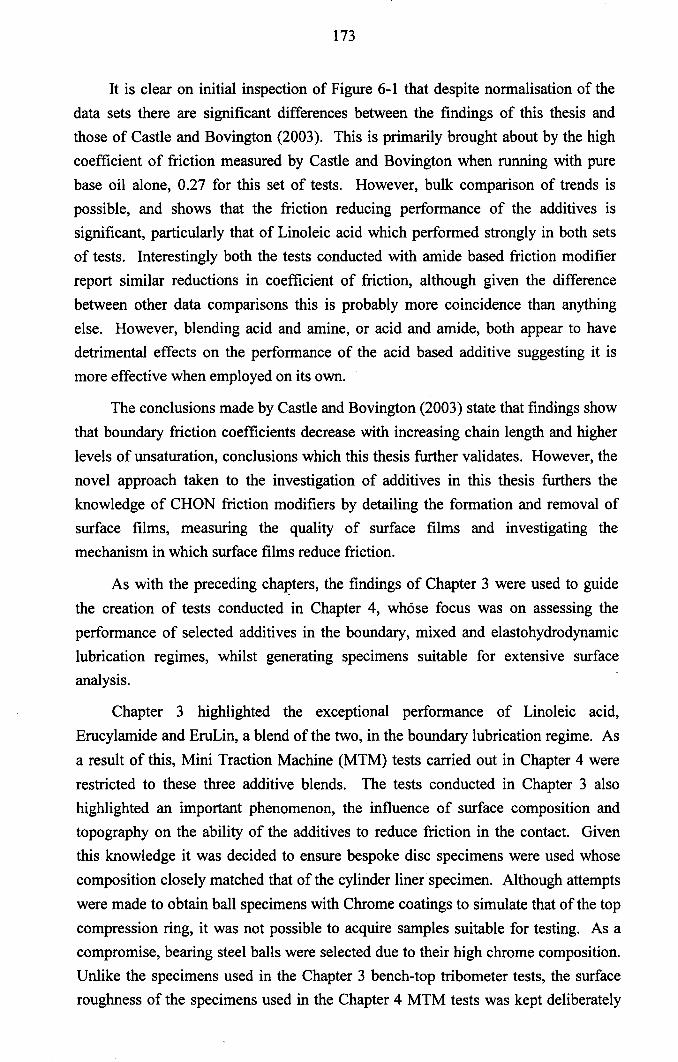
173
It is clear on initial inspection of Figure 6-1 that despite normalisation of thedata sets there are significant differences between the findings of this thesis andthose of Castle and Bovington (2003). This is primarily brought about by the highcoefficient of friction measured by Castle and Bovington when running with purebase oil alone, 0.27 for this set of tests. However, bulk comparison of trends ispossible, and shows that the friction reducing performance of the additives issignificant, particularly that of Linoleic acid which performed strongly in both setsof tests. Interestingly both the tests conducted with amide based friction modifierreport similar reductions in coefficient of friction, although given the differencebetween other data comparisons this is probably more coincidence than anythingelse. However, blending acid and amine, or acid and amide, both appear to havedetrimental effects on the performance of the acid based additive suggesting it ismore effective when employed on its own.
The conclusions made by Castle and Bovington (2003) state that findings showthat boundary friction coefficients decrease with increasing chain length and higherlevels of unsaturation, conclusions which this thesis further validates. However, thenovel approach taken to the investigation of additives in this thesis furthers theknowledge of CHON friction modifiers by detailing the formation and removal ofsurface films, measuring the quality of surface films and investigating themechanism in which surface films reduce friction.
As with the preceding cha}?ters,the findings of Chapter 3 were used to guidethe creation of tests conducted in Chapter 4, whose focus was on assessing theperformance of selected additives in the boundary, mixed and elastohydrodynamiclubrication regimes, whilst generating specimens suitable for extensive surfaceanalysis.
Chapter 3 highlighted the exceptional performance of Linoleic acid,Erucylamide and EruLin, a blend of the two, in the boundary lubrication regime. Asa result of this, Mini Traction Machine (MTM) tests carried out in Chapter 4 wererestricted to these three additive blends. The tests conducted in Chapter 3 alsohighlighted an important phenomenon, the influence of surface composition andtopography on the ability of the additives to reduce friction in the contact. Giventhis knowledge it was decided to ensure bespoke disc specimens were used whosecomposition closely matched that of the cylinder liner specimen. Although attemptswere made to obtain ball specimens with Chrome coatings to simulate that of the topcompression ring, it was not possible to acquire samples suitable for testing. As acompromise, bearing steel balls were selected due to their high chrome composition.Unlike the specimens used in the Chapter 3 bench-top tribometer tests, the surfaceroughness of the specimens used in the Chapter 4 MTM tests was kept deliberately
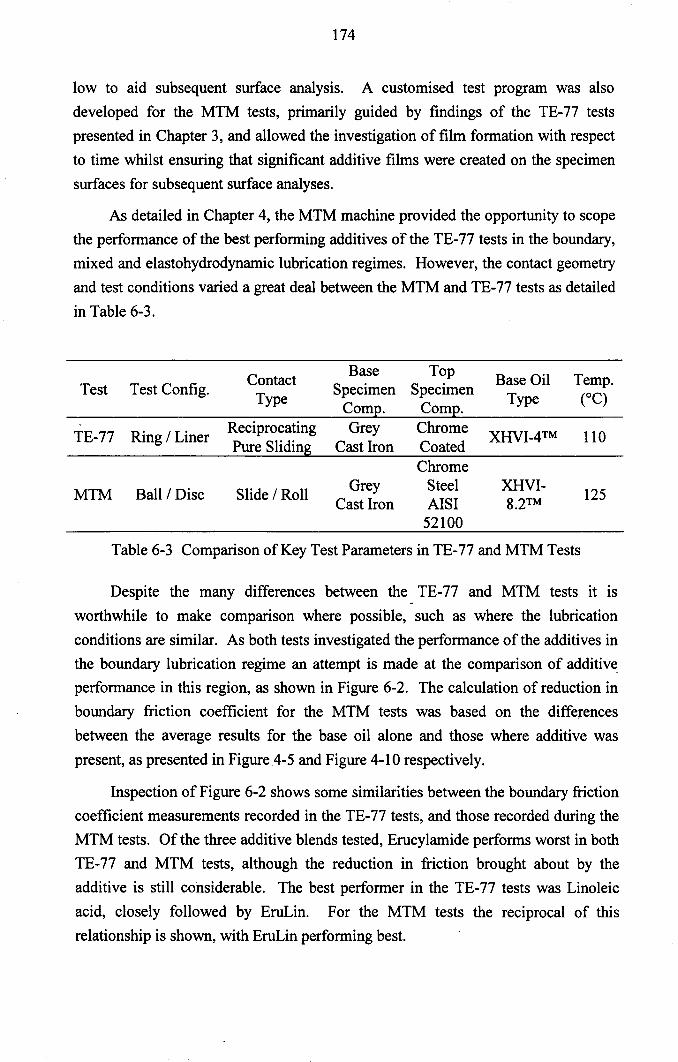
174
low to aid subsequent surface analysis. A customised test program was alsodeveloped for the MTM tests, primarily guided by findings of the TE-77 testspresented in Chapter 3, and allowed the investigation of film formation with respect
to time whilst ensuring that significant additive films were created on the specimensurfaces for subsequent surface analyses.
As detailed in Chapter 4, the MTM machine provided the opportunity to scopethe performance of the best performing additives of the TE-77 tests in the boundary,mixed and elastohydrodynamic lubrication regimes. However, the contact geometry
and test conditions varied a great deal between the MTM and TE- 77 tests as detailed
in Table 6-3.
Test Test Config. Contact Base Top Base Oil Temp.Type Specimen Specimen Type (OC)
Compo CompoReciprocating Grey Chrome XHVI-4TM 110Pure Sliding Cast Iron Coated
Chrome
Slide / Roll Grey Steel XHVI- 125Cast Iron AISI 8.2TM52100
TE- 77 Ring / Liner
MTM Ball / Disc
Table 6-3 Comparison of Key Test Parameters in TE-77 and MTM Tests
Despite the many differences between the TE-77 and MTM tests it IS
worthwhile to make comparison where possible, such as where the lubrication
conditions are similar. As both tests investigated the performance of the additives inthe boundary lubrication regime an attempt is made at the comparison of additiveperformance in this region, as shown in Figure 6-2. The calculation of reduction inboundary friction coefficient for the MTM tests was based on the differences
between the average results for the base oil alone and those where additive waspresent, as presented in Figure 4-5 and Figure 4-10 respectively.
Inspection of Figure 6-2 shows some similarities between the boundary frictioncoefficient measurements recorded in the TE- 77 tests, and those recorded during theMTM tests. Of the three additive blends tested, Erucylamide performs worst in both
TE- 77 and MTM tests, although the reduction in friction brought about by theadditive is still considerable. The best performer in the TE-77 tests was Linoleic
acid, closely followed by EruLin. For the MTM tests the reciprocal of thisrelationship is shown, with EruLin performing best.
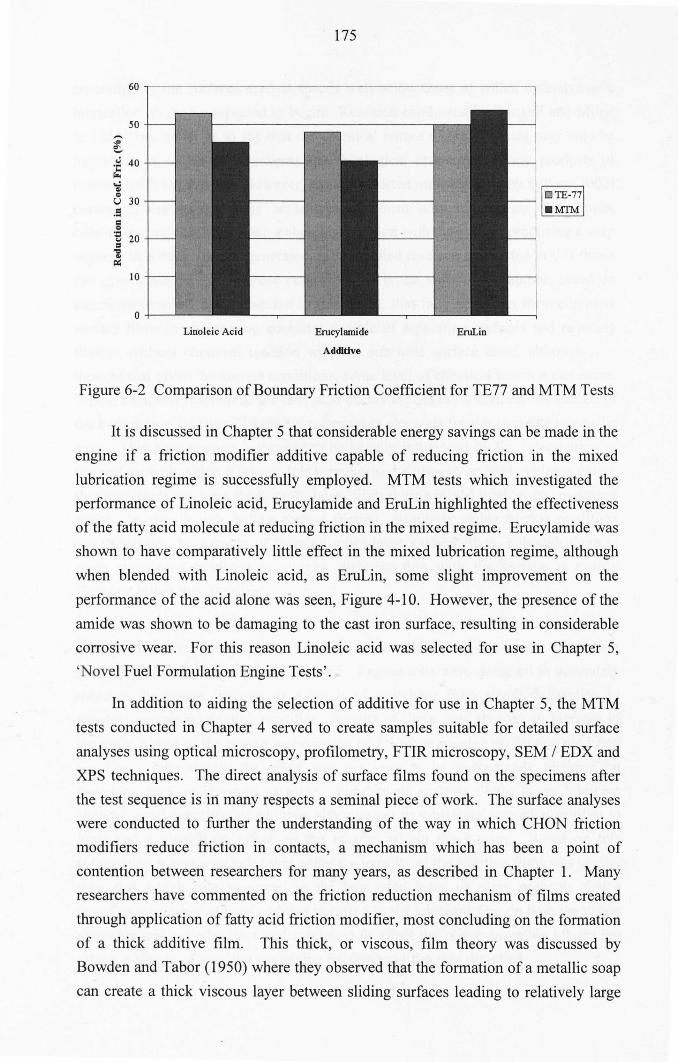
175
~.~ 40f;o.
'oi..U 30
50
.9=..~ 20=~~
10
Linoleic Acid Erucylamide
Additive
EruLin
Figure 6-2 Comparison of Boundary Friction Coefficient for TE77 and MTM Tests
It is discussed in Chapter 5 that considerable energy savings can be made in theengine if a friction modifier additive capable of reducing friction in the mixed
lubrication regime is successfully employed. MTM tests which investigated theperformance of Linoleic acid, Erucylamide and EruLin highlighted the effectivenessof the fatty acid molecule at reducing friction in the mixed regime. Erucylamide wasshown to have comparatively little effect in the mixed lubrication regime, although
when blended with Linoleic acid, as EruLin, some slight improvement on the
performance of the acid alone was seen, Figure 4-10. However, the presence of the
amide was shown to be damaging to the cast iron surface, resulting in considerablecorrosive wear. For this reason Linoleic acid was selected for use in Chapter 5,'Novel Fuel Formulation Engine Tests'.
In addition to aiding the selection of additive for use in Chapter 5, the MTM
tests conducted in Chapter 4 served to create samples suitable for detailed surfaceanalyses using optical microscopy, profilometry, FTIR microscopy, SEM / EDX andXPS techniques. The direct analysis of surface films found on the specimens after
the test sequence is in many respects a seminal piece of work. The surface analyseswere conducted to further the understanding of the way in which CHON frictionmodifiers reduce friction in contacts, a mechanism which has been a point of
contention between researchers for many years, as described in Chapter 1. Manyresearchers have commented on the friction reduction mechanism of films createdthrough application of fatty acid friction modifier, most concluding on the formationof a thick additive film. This thick, or viscous, film theory was discussed byBowden and Tabor (1950) where they observed that the formation of a metallic soap
can create a thick viscous layer between sliding surfaces leading to relatively large
176
separation of the surfaces even at speeds well below those at which hydrodynamiclubrication might be expected to begin. Research conducted by Barwell and Milne
in 1951 goes as far as to say that the chemical nature of the lubricant may only be
important in so far as it governs the rheological properties of any products ofreaction with the surface. However, work conducted more recently by Spikes (2002)comments that simple fatty acids typically form only mono layers under mostconditions, and that only when a chemical reaction with the surface producing a soap
occurs can a thick film be generated. The detailed research conducted in this thesis
can give some context to these comments. It is the view of the author, based onexamination of all data presented in this thesis, that fatty acids can form completesurface films in engineering contacts, capable of separating surfaces and reducingfriction without chemical reaction with the substrate surface itself, although it isthought that given the correct conditions, some level of chemical reaction can occur.Where chemical reaction of the fatty acid occurs it does not transform the surface ofthe bounding solid (like ZDDP) but rather takes elements from it to create a metallic
soap. This phenomenon is thought to be heavily influenced by the composition of
the surface with which it reacts. It is hypothesised, although no hard evidence exists,that fatty acids can form thick, multi-layer, films during mixed lubrication conditionswhich can significantly reduce contact friction. Similarly amide friction modifiersare thought to be capable of forming multi-layer surface films, although there is
more substantial evidence to suggest their reaction with the surface is mostlychemical rather than physical.
Given the exceptional performance of Linoleic acid in both TE-77 (Chapter 3)
and MTM tests (Chapter 4) the friction modifier additive was chosen for testing in aset of engine tests described in Chapter 5. Engine tests were designed to accuratelymeasure the power increase as a result of switching from standard gasoline togasoline containing friction modifier. Results of these tests showed an increase in
the brake power of the engine in the region of 2% when running on friction modifiedgasoline. Interestingly the effect was not seen to be immediately reversed on
switching back to standard gasoline. Subsequent analysis of the sump lubricantshowed small quantities of additive, although not in substantial enough quantities tohave had a significant effect on the friction within the system. Based on thisinformation it was concluded that either the tenacity of the additive films was greaterthan that which was measured in the bench-top tests, or more probably that a
significant accumulation of additive occurred in the lubricant film on both the piston
assembly and cylinder liner and continued to effect the piston assembly lubricationafter the supply of gasoline containing friction modifier was removed.
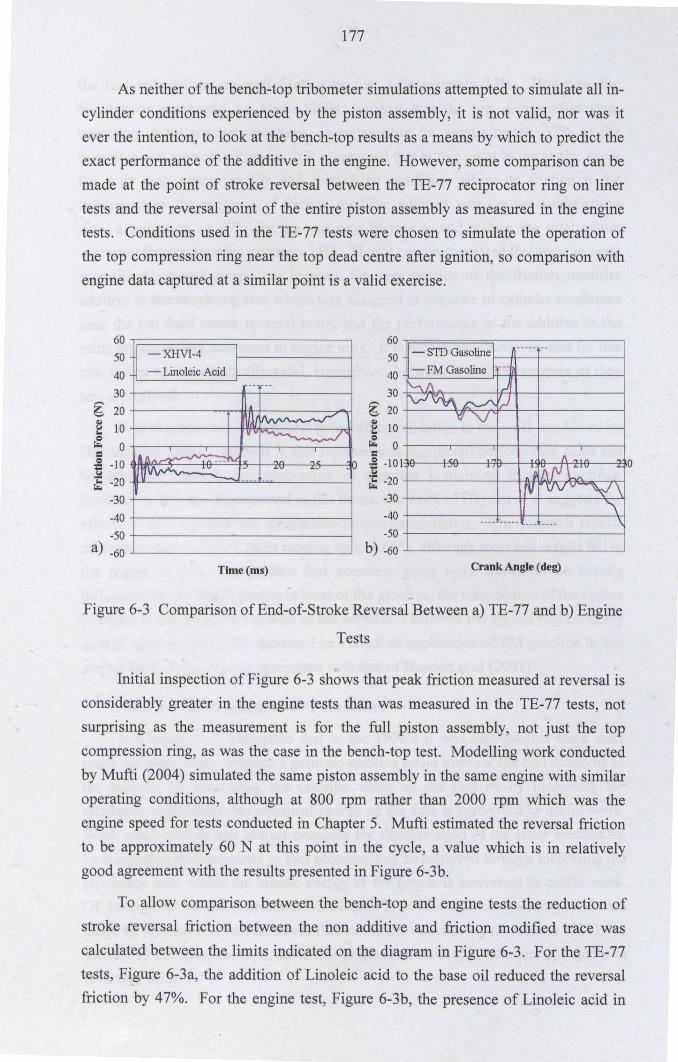
177
As neither of the bench-top tribometer simulations attempted to simulate all in-cylinder conditions experienced by the piston assembly, it is not valid, nor was itever the intention, to look at the bench-top results as a means by which to predict theexact performance of the additive in the engine. However, some comparison can bemade at the point of stroke reversal between the TE-77 reciprocator ring on linertests and the reversal point of the entire piston assembly as measured in the enginetests. Conditions used in the TE-77 tests were chosen to simulate the operation ofthe top compression ring near the top dead centre after ignition, so comparison withengine data captured at a similar point is a valid exercise.
60
50
40
30
~ 20
~ 10e
r,,;. 0=~ -10~ -20
-30
-40
-50a) -60
-XHVI-4 l- Linoleic Acid I
-- ---
I.
Vl ll\,v'''-_ .rv ~ ./
AI\. ,r'¥" ___tv'lA 'Iem~ . ~v ~J--- ---- ---
Time (ms)
60
50
4030
~ 20
~ 10e
r,,;. 0=~ -101
~ -20-30-40
-50b) -60
- STD Gasoline l ----- --
- FM Gasoline l---"-'.fJ. r'
rv-'~~ f1:'YlV
.l1.!1Lli .!1. . .~1b..f'l1:v -.fY vvv--y\
~---- ----- --- ---- \
o
Crank Angle (deg)
Figure 6-3 Comparison of End- of-Stroke Reversal Between a) TE-77 and b) Engine
Tests
Initial inspection of Figure 6-3 shows that peak friction measured at reversal is
considerably greater in the engine tests than was measured in the TE-77 tests, notsurprising as the measurement is for the full piston assembly, not just the topcompression ring, as was the case in the bench-top test. Modelling work conductedby Mufti (2004) simulated the same piston assembly in the same engine with similaroperating conditions, although at 800 rpm rather than 2000 rpm which was theengine speed for tests conducted in Chapter 5. Mufti estimated the reversal frictionto be approximately 60 N at this point in the cycle, a value which is in relativelygood agreement with the results presented in Figure 6-3b.
To allow comparison between the bench-top and engine tests the reduction ofstroke reversal friction between the non additive and friction modified trace wascalculated between the limits indicated on the diagram in Figure 6-3. For the TE-77tests, Figure 6-3a, the addition of Linoleic acid to the base oil reduced the reversalfriction by 47%. For the engine test, Figure 6-3b, the presence of Linoleic acid in
178
the fuel reduced the reversal friction by just approximately 13%. However, thesimulations conducted by Mufti (2004) suggest that the top compression ring,operating under similar conditions, is responsible for approximately 32% of theoverall piston assembly friction. If it is assumed that at this point in the engine cyclethe only ring whose profile and lubrication condition allow its friction to beinfluenced by the presence of friction modifier additive was the top compressionring, a reduction of 47% for the top ring friction would reduce the total pistonassembly friction by approximately 15%. Thus it can be suggested that there is somescientifically based correlation between the performance of the friction modifieradditive in the bench-top test, which was designed to simulate in-cylinder conditions
near the top dead centre reversal point, and the performance of the additive in thesame region as was measured in engine tests. It is recognised, however, that for thisconclusion to be statistically valid, comparison between a greater numbers of datasets is required.
Results presented in Chapter 5 give further validation to the work conducted by
Hayden et al (2001), where it is also reported that significant performance gains canbe achieved through the application of gasoline containing friction modifier.Similarly to the results presented in this thesis, the work of Hayden et al suggests the
effects of FM gasoline are measurable almost immediately. The research reportsachievable fuel economy gains ranging up to 4.66%, although most test results fell inthe region of 2%. Achievable fuel economy gains were shown to be heavily
influenced by the initial treatment level of the gasoline, the temperature of the enginein which it was employed as well as the vehicle. Therefore the typical fuel economygain of approximately 2% measured as a result of application of FM gasoline in thisproject looks to be in good agreement with that of Hayden et al (2001).
6.1.1. The Success of FM Gasoline
In Chapter 1 it was stated that in the 1970's it was thought that there were
really only two ways in which a gasoline additive could increase the fuel economy ofthe vehicle; by increasing the calorific value of the fuel or by increasing theefficiency with which the chemical energy of the fuel is converted to useful work.Work conducted in this project broadens the interpretation of the latter mechanism
by suggesting that increases in fuel economy can be achieved through increasing theefficiency with which the kinetic energy of the piston is converted to useful work.Of the eight listed views presented in Chapter 1, Section 1.5, commenting on claims
made by inventors of fuel additives that can improve economy (Robinson 1977), thesuccess of FM gasoline reported in this project relates best to numbers 2, 5 and 8 asreviewed below:
179
2. It will, if it is valid, probably result in small benefit (say 5% at most)compared with benefits from mechanical modifications.
5. It may have deleterious side effects both in the short and long term.
8. It might indeed give a real benefit by some as yet poorly realized andunderstood mechanism.
The first of the viewpoints presented above is, in the view of the author,extremely naive as a 5%, or 2% (as is the case in this study), increase in vehicle fueleconomy is a substantial saving when considered with a global perspective, asfurther explained in the following section.
Point 5 above states there may be deleterious side effects associated with theapplication of the gasoline additive, as was the case in this study. In Chapter 5,section 5.1.3, it was stated that the use of FM gasoline might have contributed todeposits on, and the fouling of, engine components. However, as tests wereconducted in absence of both fuel and lubricant additive package, both of whichwould usually contain a detergent, it is possible to suggest that this fouling may notbe a significant factor. Another deleterious effect of the implementation of Linoleicacid as a gasoline friction modifier is the fact that it is an unsaturated molecule. Aswas discussed in Chapter 3, section 3.7.1, having polyunsaturated, or indeedunsaturated, molecules in the sump lubricant is undesirable as they are prone to crosslinking, and as such would be likely to form sludge degrading the performance of theoil. However, it is also necessary to note that should the molecules employed besaturated, there should be no degrading effect on the engine lubricant, and theirperformance is thought to be only marginally poorer than their unsaturatedequivalents.
Point 8 shown above states that fuel economy benefits can sometimes beachieved through poorly realised and understood mechanisms. This thesis presents avast quantity of research on environmentally friendly or 'CHON' friction modifiersand the mechanism through which they can reduce engine friction and increase fueleconomy. This thesis adds greatly to the understanding of CHON friction modifiersand presents tests which realise the capabilities of such technologies. However,work is still needed to be done in the area to completely understand the complexworkings of organic friction modifiers, much of which is listed in the final chapter ofthis thesis.
180
6.2. The Global Impact Of The Research
It was stated in Chapter 1 that the driving force behind the need for research
into technologies which increase vehicle fuel economy was the recognition ofsociety that the world needs to use its resources more efficiently. As well asreducing the rate of consumption of limited oil reserves, a reduction in emissionscreated through the burning of hydrocarbon products is also needed. In response tothe needs of society, this project focussed on the development of a technology whichhas the power to reduce the gasoline consumption of the motor vehicle, which
inherently slows the rate of consumption of hydrocarbon based fuels andconsequently reduces the amount of vehicle emissions, but also acts to maintain theefficiency of the catalytic converter, a device essential to controlling exhaustemissions.
On completion of this research project it is not enough to simply state that
gasoline administered friction modifier can work to both reduce gasolineconsumption and limit exhaust emissions, it is necessary to relate the success of
technologies such as CHON FM gasoline to the potential global impact of suchproducts. This section assesses the impact of successful fuel economy savingtechnologies based on the findings of this research project and statistics which detailthe way in which we function as a society in the UK.
Figure 6-4 presents the gasoline consumption in the UK over the past ten years.
Each year since 1996 the consumption of gasoline in the UK has decreased; this is as
a result of many factors such as advances in vehicle design, engine design,combustion technology as well as advances in fuel and lubricant technology.However, it is thought that the most influential factor has been the consumer'schoice of diesel powered vehicles, which gain popularity every year.
To assess the impact on gasoline consumption in the UK as a result ofsuccessful implementation of FM gasoline, a number of assumptions need to be
made. If it is considered that during 2005 there were no further advances in vehicletechnologies, and the amount of gasoline and diesel powered vehicles remainedconstant, the gasoline consumption saving in the UK in 2006 achievable solely as aresult of successful implementation of FM gasoline would be as represented by thefinal data point (red triangle) shown on Figure 6-4.
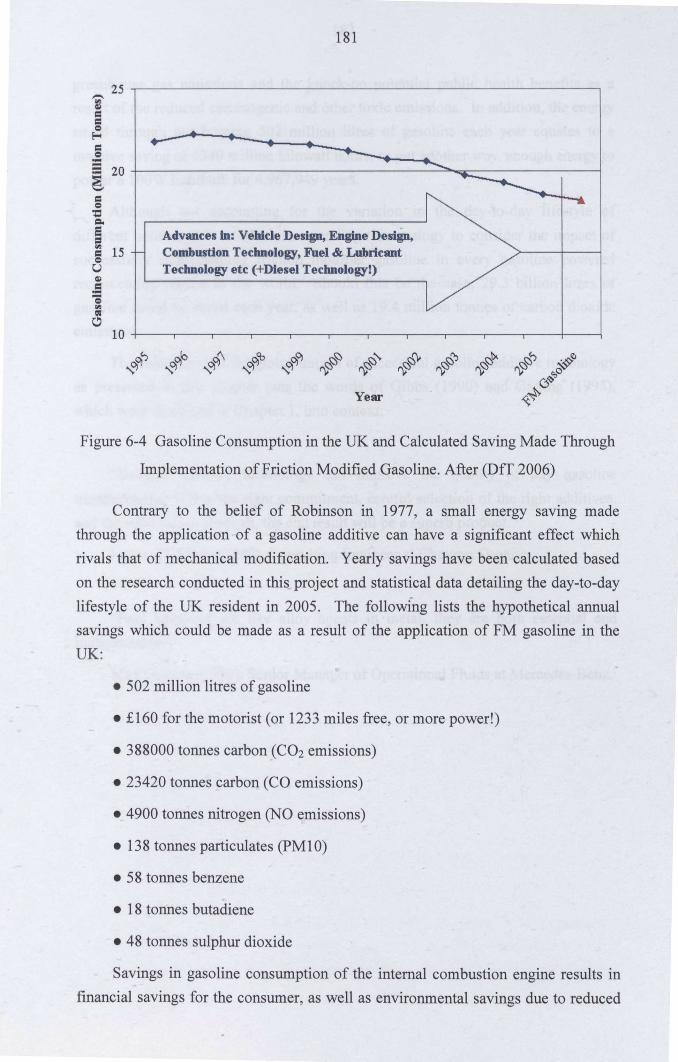
181
25-'"QI==<:.I~=<:.I...-= 206=<:.I;:!=-=='" 15=<:.IUQI.5-<:.I'"~c
10
1')'",,OJ
Advances in: Vehicle Design, Engine Design,Combustion Technology, Fuel & LubricantTechnology etc (+Diesel Technology!)
Year
Figure 6-4 Gasoline Consumption in the UK and Calculated Saving Made Through
Implementation of Friction Modified Gasoline. After (DIT 2006)
Contrary to the belief of Robinson in 1977, a small energy saving madethrough the application of a gasoline additive can have a significant effect whichrivals that of mechanical modification. Yearly savings have been calculated basedon the research conducted in this project and statistical data detailing the day-to-day
lifestyle of the UK resident in 2005. The following lists the hypothetical annualsavings which could be made as a result of the application of FM gasoline in theUK:
• 502 million litres of gasoline
• £160 for the motorist (or 1233 miles free, or more power!)
• 388000 tonnes carbon (C02 emissions)
.23420 tonnes carbon (CO emissions)
.4900 tonnes nitrogen (NO emissions)
• 138 tonnes particulates (PMI0)
• 58 tonnes benzene
• 18 tonnes butadiene
• 48 tonnes sulphur dioxide
Savings in gasoline consumption of the internal combustion engine results in
financial savings for the consumer, as well as environmental savings due to reduced
182
greenhouse gas emissions and the knock-on potential public health benefits as aresult of the reduced carcinogenic and other toxic emissions. In addition, the energysaved through not burning 502 million litres of gasoline each year equates to amassive saving of 4340 million kilowatt hours, or put another way, enough energy topower a 100W lightbulb for 4,967,949 years.
Although not accounting for the variation m the day-to-day lifestyle ofdifferent nations, it is worthwhile extending this analogy to consider the impact ofsuccessfully implementing friction modifier gasoline in every gasoline poweredreciprocating engine in the world. Should this be the case, 29.3 billion litres of
gasoline could be saved each year, as well as 19.4 million tonnes of carbon dioxideemissions.
The calculation of the global impact of successful gasoline additive technologyas presented in this chapter puts the words of Gibbs (1990) and Gairing (1995),which were discussed in Chapter 1, into context;
"Today's additive technology can improve the quality of any gasoline
tremendously. Given the right commitment, careful selection of the right additives,and the right follow through, the end result will be a superb product."
Lewis M. Gibbs (1990), Consulting Engineer at Chevron Oronite.
"Fuel additives are like alloy agents in metal, they are both essential andindispensable. "
Max Gairing (1995), Senior Manager of Operational Fluids at Mercedes-Benz ..
183
7. Conclusions & Recommendations for Future Work
The purpose of this chapter is to present the final conclusions of the workdescribed in this thesis, drawing together all points of discussion and summary.Conclusions presented consider all areas of research conducted in this thesis, andhave been organised into a priority sequence, most important first.
Recommendations for future work are also made based on the findings of thisthesis, detailing areas which are thought to be essential for further investigation.
The need for technologies capable of increasing the fuel economy of the motorvehicle is becoming desperate, the health of the planet in which we live, indeed ourchildren's world, relies heavily on the advances made through research. Researchsuch as that presented in this thesis is essential to the progress of technologies
capable of significantly reducing hydrocarbon consumption and exhaust emissions
which harm our environment.
The originality of this thesis comes from the approach taken when tackling themain aim; furthering the fuel economy of the gasoline engine. At every step of theway, scientific knowledge disseminated from the research of others was consideredlogically and laterally forming a sound base from which innovation could be used tofurther understanding.
7.1. Conclusions
• The hypothetical impact of research which increases fuel economy;such as is presented in this thesis, was illustrated by calculationsdetailing the effects as seen by both the motorist and society in general.Based on the research conducted in this project and statistical data
detailing the day-to-day lifestyle of the UK resident in 2005, thefollowing key yearly savings were calculated:
o 502 million litres of gasoline
o £160 for the motorist (or 1233 miles free, or more power)
o 388,000 tonnes of carbon (from C02)
• In-cylinder lubricant sampling techniques were both created anddeveloped to gain a better understanding of the phenomenon of fuelcontamination in the piston assembly lubricant, and provided a means
184
by which to assess the possibility of administering friction modifier tothe piston assembly lubricant via gasoline.
• Experiments undertaken at a range of engine operating conditionsshowed fuel dilution to be a prevalent phenomenon in both the top ringzone and cylinder liner oil film. Typical fuel dilutions in the top ring
zone ranged from 5 - 11 wt%, whereas those of the cylinder linerranged from 0.2 - 3.6 wt%. However, the final boiling point of the fuelwas shown to be the most significant factor influencing the fuel dilution
of the piston assembly lubricant. The measured levels of dilution wereshown to be significant enough to affect the viscosity. of the lubricant,heavily influencing the lubrication of the piston assembly.
• Research leads to the conclusion that the transport of fuel from thecombustion chamber to the engine sump takes place via one of twomechanisms; 1) fuel passes the piston rings in the blow-by gases in avapour phase, 2) fuel adsorbs into the cylinder liner lubricant, which isreturned to the sump in a liquid phase through the natural action of the
piston assembly. These mechanisms were also shown to transport
gasoline additive to the sump, fathering the hypothesis that the systemcould be used to 'top-up' the sump lubricant additive package withfresh supplies of chemicals, extending the drain interval of the oil.
• Two categories of lubricant residence times have been hypothesised,
one associated directly with the lubrication of the piston assembly, and
one the cylinder liner. The residence time for the piston assembly isthought to be considerably longer than that of the cylinder liner,_allowing the accumulation of large amounts of additive administeredvia the gasoline. Accumulation of additive also takes place in thecylinder liner oil film, although in smaller quantities.
• A bench-top test was developed to rapidly screen the performance of
environmentally friendly gasoline friction modifiers under arduous in-
cylinder boundary lubrication conditions using sections of enginecomponents in a TE-77 tribometer. The test proved capable ofgenerating a vast amount of information relating to the films created bythe candidate friction modifiers, including their formation and removal
as well as the mechanism of their action.
• Results of the TE-77 bench-top screening te~ts showed fatty acids to beeffective friction modifier additives capable of successful operation inarduous boundary lubrication conditions. The findings suggest that the
185
friction reducing performance of fatty acid molecules increases withincreasing hydrocarbon chain length and unsaturation level. Linoleicacid was shown to perform best and was found to be capable ofreducing the boundary friction coefficient by 53%.
• Tests showed some evidence to support the hypothesis that thecombination of two carefully selected friction modifier additives in anadditive package can lead to the creation of more effective frictionmodifier films, capable of reducing the boundary friction coefficientfurther than that achievable by either of the additives on their own.
• Given that piston rings experience multiple lubrication regimes in eachengine cycle, a series of tests were conducted using a Mini TractionMachine (MTM) which tested the effectiveness of selected frictionmodifier additives in multiple lubrication regimes. The tests alsoallowed investigation into the effects of friction modifiers on specimenwear. The presence of Linoleic acid in base oil was shown to reducespecimen wear during MTM tests by approximately 38% whencompared with the result for the base oil alone. The presence of amidefriction modifier was shown to increase specimen wear byapproximately 85% compared to the base oil result, as such its action isthought to be corrosive.
• In tests conducted -in a Mini Traction Machine, Linoleic acid wasshown to significantly reduce the coefficient of friction in both themixed and boundary lubrication regimes, as much as 45% in the latterwhen compared with the result for base oil alone. The combination ofLinoleic acid and Erucylamide was shown to be the best performingadditive blend in these tests and reduced the boundary frictioncoefficient by approximately 54%.
• Surface analyses conducted on specimens operated in lubricationsystems containing fatty acid and/or amide friction modifiers showedevidence of film formation. Given the arduous specimen cleaningprocedure employed prior to XPS analyses, it seems wrong to suggestthe detected surface films were merely physically attached to thesurface, yet hard evidence was not found to suggest the presence ofdense or robust chemical films.
• Based on the findings of this research it is thought that fatty acids canform complete surface films in engineering contacts, capable ofseparating surfaces and reducing friction without chemical reaction
186
with the substrate surface itself, although it is thought that given thecorrect conditions, some level of chemical reaction can occur. Wherechemical reaction of the fatty acid occurs it does not transform thesurface of the bounding solid (like ZDDP) but rather takes elementsfrom it to create a metallic soap. This phenomenon is thought to beheavily influenced by the composition of the surface with which itreacts. A monolayer of complete and-densely packed film of fatty acidis thought to be capable of effectively reducing contact friction whereconditions are arduous. Multi-layer films of fatty acid molecules arethought to form where lubricating conditions allow and may act like aviscous layer between sliding surfaces.
• Gasoline containing friction modifier was shown to immediately reducepiston assembly friction through modification of the lubricationconditions in both the boundary and mixed lubrication regimes, Theeffects of gasoline administered friction modifier were not shown to beimmediately reversible with the supply removed, suggestingaccumulation of the friction modifier species in the piston assemblylubrication system continues to reduce friction.
• Engine power was shown to increase by approximately 2% through theapplication of gasoline administered Linoleic acid friction modifier.Tests conducted in a single-cylinder firing gasoline engine using aninstantaneous mean effective pressure total friction measurementsystem showed piston assembly friction was significantly reduced as aresult of the gasoline administered friction modifier.
7.2. Recommendations for Future Work
The following are areas identified for either further work or future research, theformer detailing small increments to this study which were not possible due to timeconstraints, the latter detailing new areas of research guided by the findings of thisresearch project.
Despite advances in technologies which are less dependant on hydrocarbonfuels, the hydrocarbon powered vehicle is likely to be around for many years tocome. It is not therefore an exaggeration to suggest that the future of the planetdepends on advances in motor vehicle technology. Future work on technologieswhich can further the fuel economy of the motor vehicle is therefore essential.
187
7.2.1. Further Work
• Work should be conducted to test the performance of the Three PointSampling (TPS) system at speeds in excess of 3000 rpm at full load.The system may provide a unique opportunity to gain understanding ofthe piston assembly lubrication of a gasoline engine at high speedconditions, something not thought to have been achieved before.
• The Three Point Sampling (TPS) system should be developed toinclude a bespoke mechanism for clearing, or resisting the creation of,deposits in the sampling pipes. This would lead to greater efficiency ofthe system.
• The additive screening test developed in this thesis should beconducted on a long chain (C22 or greater) polyunsaturated aminefriction modifier. Once sourced, the hypothesis made in this thesis thatfilms formed by this chemical would result in exceptionally lowcoefficients of sliding friction could be tested.
• Tests should be conducted to investigate the interesting effects seenwhen performing additive screening tests using molybdenum flamesprayed coated piston rings. It is thought that effects seen may havebeen as a result of either the coating material itself or the roughtopography of the ring. These variables need decoupling in order tofurther understand the interesting phenomena.
• The high speed dynamic mapping of the response of the strain gaugeequipped connecting rod as it passes through the zero-load state shouldbe conducted. Information taken from this test could then beincorporated in the post processing program to map the measuredvoltage with the true force experienced by the connecting rod, thusincreasing the accuracy of the system.
7.2.2. Future Research
• Due to the continual increase in the popularity of the diesel poweredvehicle it is suggested further work be conducted to assess theeffectiveness and impact of diesel containing friction modifier onengine friction.
• A laboratory technique should be developed to allow the accuratequantification of friction modifier concentration in lubricant samplesextracted during in-cylinder sampling firing tests. This would allow in-cylinder lubricant sampling tests to be conducted when firing with
188
friction modified gasoline as opposed to a marker simulating friction
modifier.
• Further research is needed to understand the nature of the films formedthrough the application of fatty acid friction modifiers. Thedevelopment and application of in-depth surface analysis conducted onengineering surfaces extracted from real systems should help to explain
the exact mechanism of friction reduction as brought about by fatty acidfilms.
• Investigate the performance of fatty acid friction modifiers outsidemodel conditions, in systems containing fully formulated fuels andlubricants. Information gathered from these tests would give further
quantification to the impact of the addition of fatty acid to an additivepackage in terms of friction reduction, engine cleanliness and sumplubricant contamination and degradation.
• Contact potential measurements taken between an electrically isolatedtop compression ring and the cylinder liner during firing engineconditions would allow the direct investigation into the effects of in-situ friction modifier film formation on the lubrication condition of the
top compression ring, thus aiding the development of successfuladditive packages.
• Development of an in-situ method to analyse the formation of organicfriction modifier films on cylinder liner and piston ring surfaces in theengine, perhaps using FTIR techniques, would give invaluableinformation about film formation under firing conditions.
• The combustion related effects of gasoline containing friction modifierare thought to be of interest. Large treatment levels of friction modifierwere used in this research and were thought to have some effect on thecombustion characteristics of the engine. Investigation into theseeffects should help further assessment of the impact of the technologyand help to identify the level of friction modifier necessary for friction
reduction, whilst not significantly deteriorating combustion.
• Direct measurement of exhaust emissions when running on frictionmodified gasoline is thought to be necessary in order to fully assess thetrue environmental impact of the technology.
189
References
(ATC), T.T.C. o. P.A.M. i. E. (1993). "Lubricant Additives and The Environment."
Anghel, V., C. Bovington, et al. (1999). "Thick-Boundary-Film Formation by
Friction Modifier Additives." Lubrication Science U(4): 313-335.
Aruna, M. A. and M. F. Fox (2004). "Differentiation of Lubricant Degradation in thePiston Ring Groove and Crown Land by Multivariate Data Analysis." Proceedings ofthe Institute of Mechanical Engineers 218(J): 1503-1511.
B.P. (2005). "Statistical Review of World Energy." B.P. Online (www.bp.com).
Bailey, G. (2003). Refinery Fuel Additives. Additives 2005, Octel.
Bair, S. and F. Qureshi (2003). "The High Pressure Rheology of Polymer-OilSolutions." Tribology Intemational36: 637-645.
Bardasz, E. A. (2005). Future Engine Fluids Technologies: Durable, Fuel-Efficient,and Emissions-Friendly. 11th Diesel Engine Emissions Reduction Conference,
Chicago, III.
Barnes, A. M., K. D. Bartle, et al. (2001). "A Review of Zinc
Dialklydithiophosphates (ZDDPS): Characterisation and Role in the LubricatingOil." Tribology Intemational34: 398-395.
Barrell, D. 1. W. (2004). "Top Ring Zone Lubricant Sampling and Engine Friction
Project" Shell Internal
Barrell, D. 1. W., M. Priest, et al. (2004). "Experimental Simulation of Impact andSliding Wear in the Top Piston Ring Groove of a Gasoline Engine." Proceedings ofthe Institute of Mechanical Engineers 218(J): 173-183.
Barwell, F. T. and B. A. Milne (1951). "The Lubrication of Rough Steel Surfaces by
a Series of Metallic Soaps." British Journal of Applied Physics 2: 44-48.
Batt, R. J., J. A. McMillan, et al. (1996). "Lubricity Additives - Performance andNo-Harm Effects in Low Sulfur Fuels." SAE 961943.
190
BBC News and S. Mulvey (2006). "EU car C02 Fight Only Beginning."www.bbc.co.uk/news.
Beltzer, M. and S. Jahanmir (1988). "Effect of Additive Molecular Structure onFriction." Lubrication Science 1(1): 3-26.
Blau, P. J. (2005). "On the Nature of Running-in." Tribology International38: 1007-1012.
Bowden, F. P. and D. Tabor (1950). The Friction and Lubrication of Solids. Oxford,Oxford University Press.
Bowden, F. P. and D. Tabor (1964). The Friction and Lubrication of Solids. Oxford,Oxford University Press.
Braithwaite, E. R. and A. B. Greene (1978). "A Critical Analysis of the Performanceof Molybdenum Compounds in Motor Vehicles." Wear 46: 405-432.
Burnett, P. J. (1992). "Relationship Between Oil Consumption, Deposit Formationand Piston Ring Motion for Single Cylinder Diesel Engines." SAE 920089.
Burnett, P. J. (1993). "Characterisation of the Ring Pack Lubricant and itsEnvironment." Shell Internal.
Burnett, P. J. (1993). "Characterisation of the nng pack lubricant and its-environment. "
Bush, G. P., M. F. Fox, et al. (1991). "Composition of Lubricating Oil in the UpperRing Zone of an Internal Combustion Engine." Tribology International 24(4): 231-233.
Castle, R. C. and C. H. Bovington (2003). "The Behaviour of Friction ModifiersUnder Boundary and Mixed EHD Conditions." Lubrication Science 15(3): 253-263.
Cheng, W. K., D. Hamrin, et al. (1993). "An Overview of Hydrocarbon EmissionsMechanisms in Spark-Ignition Engines." SAE 932708.
191
Chibber, V. K., R. B. Chaudhary, et a1. (2006). "Anti Wear and Anti Friction
Characteristics of Tribochemical Films of Alkyl Octa-decanoates and their
Derivatives." Lubrication Science 18: 63-76.
Clarke, D. G., I. Sherrington, et a1. (1991). Simultaneous Measurement of Piston /Piston Ring Friction and Oil Film Thickness in an I C Engine.
Colgan, T. and J. C. Bell (1989). "A Predictive Model for Wear In AutomotiveValve Train Systems." SAE 892145.
Cook, S. (2003). Fuel Borne Catalysts (FBC) for Diesel Particulate Filter (DPF)Regeneration. OCTEL, OCTEL.
Costello, M. T. and I. I. Riff (2005). "Study of Hydroforming Lubricants with
Overbased Sulfonates and Friction Modifiers." Tribology Letters 20(3-4): 201-208.
Coy, R. C. (1991). "Engine Lubrication - Art or Science." Tribology Series 18(LeedsLyon 17): 407-417.
Dai, W., E. Newman, et a1. (1996). "Predictions of In-Cylinder Tumble Flow andCombustion in SI Engines with a Quasi-Dimensional Mode1." SAE 961962.
Dallas, T. and K. Dasgupta (2004). "Light at the End of the Tunnel: RecentAnalytical Applications of Liquid-Core Waveguides." Trends in AnalyticalChemistry 23(5): 1-8.
Danilov, A. M. (2001). "Fuel Additives: Evolution and Use In 1996-2000." A
Review: Chemistry and Technology of Fuels and Oils 37(6): 444-455.
Das, S., T. Perry, et a1. (2006). "Effect of Surface Etching on the Lubricated SlidingWear of an Eutectic Aluminium - Silicon Alloy." Tribology Letters 21(3): 193-204.
Davis, F. A. and T. S. Eyre (1990). "The Effect of Friction Modifier on Piston Ringand Cylinder Bore Friction and Wear." Tribology International 23(3).
De Barros Bouchet, M. I., J. M. Martin, et a1. (2005). "Mechanisms of MoS2Formation by MoDTC in Presence of ZnDTP: Effect of Oxidative Degradation."Wear 258: 1643-1650.
192
De Barros Bouchet, M. 1., J. M. Martin, et al. (2005). "Boundary LubricationMechanisms of Carbon Coatings by MoDTC and ZDDP Additives." Tribology
International 38: 257-264.
De Barros Bouchet, M. 1., 1. Raoult, et al. (2003). "Friction Reduction by MetalSulfides in Boundary Lubrication Studied by XPS and XANES Analyses." Wear
254: 863-870.
Dearlove, J. and W. K. Cheng (1995). "Simultaneous Piston Ring Friction and OilFilm Thickness Measurements in a Reciprocating Test." SAE 952470.
Devaprakasam, D., O. P. Khatri, et al. (2005). "Boundary Lubrication Additives forAluminium: A Journey from Nano to Macrotribology." Tribology International 38:
1022-1034.
Devlin, M. T., W. Y. Lam, et al. (1998). "Critical Oil Physical Properties that
Control the Fuel Economy Performance of General Motors Vehicles." SAE 982503.
DfT (2006). "Transport Statistics Great Britain."
Dohner, B. R. and M. A. Wilk (1995). "Formulating for ILSAC GF-2 - Part 2:Obtaining Fuel Economy Enhancement From a Motor Oil in a Modem Low Friction
Engine." SAE 95343.
Dowson, D. (1996). Friction Modelling for Internal Combustion Engines, Institute of
Tribology: 301-318.
Dowson, D. (1999). "The Role of the Interface and Surface Layers in the Thin Film
and Boundary Regime." Tribology Series 36: 611-619.
Dunaevsky, V. and B. Vick (2004). "Friction Temperature of the Piston Rings withConsideration of the Cylinder Wall Thickness." SAE 2004-01-0612.
Duveneck, G. L., M. A. Bopp, et al. (2001). "Evanescent-Field-Induced Two-PhotonFlourescence: Exitation of Macroscopic Areas of Planar Waveguides." Applied
Physics B 73: 869-871.
193
Fansier, T. D., D. T. French, et al. (1995). "Fuel Distribution in a Firing DirectInjection Spark-Ignition Engine Using Laser-Induced Fluorescence Imaging." SAE
950110.
Finch, G. 1. and H. Wilman (1937). "Study of Surface Structure by ElectronDiffraction." Ergebn. exakt. Naturwiss 16: 353-436.
Floch, A., J. V. Frank, et al. (1995). "Comparison of the Effects of Intake-GeneratedSwirl and Tumble on Turbulence Characteristics in a 4-Valve Engine." SAE 952457.
Fox, M. F., D. J. Picken, et al. (1997). "Paramagnetic Species in IIC Engine Top
Ring Zone Lubricant Samples." Tribology IntemationaI30(6): 417-422.
Frewing, J. J. (1944). "The Heat of Adsorption of Long-Chain Compounds and their
Effect on Boundary Lubrication." Proceedings of the Royal Society of London.Series A, Mathematical and Physical Sciences 182(990): 270-285.
Frolund, K., J. Schramm, et al. (1997). "An Investigation of the Cylinder Wall Oil
Film Development During Warm-Up of an SI Engine Using Laser InducedFlourescence." SAE 971699.
Frottier, V., J. B. Heywood, et al. (1996). "Measurement of Gasoline Absorptioninto Engine Lubricating Oil." SAE 961229.
Fujita, H. and H. Spikes (2004). "The Formation of Zinc Dithiophosphate Antiwear.Films." Proceedings of the Institute of Mechanical Engineers 218(J): 265-277.
Furey, M. J. (1961). "Metallic Contact and Friction Between Sliding Surfaces."ASLE Transactions 4: 1-11.
Gacoin, E., C. Fretigny, et al. (2006). "Measurement of the Mechanical Properties ofThin Films Mechanically Confined within Contacts." Tribology Letters 21(3): 245-252.
Gairing, M. (1995). "Mercedez-Benz views on Fuel and Lubricant Additives."Industrial Lubrication and Tribology 47(3): 3.
Gamble, R. J. (2002a). The Influence of Lubrication Degradation on Piston
Assembly Tribology. Mechanical Engineering. Leeds, The University of Leeds: 241.
194
Gamble, R. J. (2002b). "Detailed Analysis of Oil Transport in the Piston Assembly
ofa Gasoline Engine." Tribology Letters 14(2): 147-156.
Gangopadhyay, A. K., E. Soltis, et al. (2004). "Valvetrain Friction and Wear:Influence of Surface Engineering and Lubricants." Proceedings of the Institute ofMechanical Engineers 218(J): 147-156.
Gangopadhyay, A. K., J. Sorab, et al. (1996). "Prediction of ASTM Sequence VI andVIA Fuel Economy Based on Laboratory Bench Tests." SAE 961140.
Gibbs, L. M. (1990). "Understanding Gasoline Additives." Automotive Engineering98(1): 43-48.
Glidewell, 1. and S. Korcek (1998). "Piston Ring / Cylinder Bore Friction UnderFlooded and Starved Lubrication Using Fresh and Aged Engine Oils." SAE 982659.
Graham, J., H. Spikes, et al. (2001). "The Friction Reducing Properties ofMolybdenum Dialklydithiocarbamate Additives: Part II - Durability of FrictionReducing Capability." Tribology Transactions 44(4): 637-647.
Graham, J., H. Spikes, et al. (2001). "The Friction Reducing Properties of
Molybdenum Dialkyldithiocarbamate Additives: Part I - Factors Influencing FrictionReduction." Tribology Transactions 44(4): 626-636.
Grandin, H. M., B. Stadler, et al. (2006). "Waveguide Excitation FlourescenceMicroscopy: A New Tool for Sensing and Imaging at the Biointerface." Biosensorsand Bioelectronics 21: 1476-1482.
Greenhill, E. B. (1949). "The Adsorption of Long Chain Polar Compounds fromSolution on Metal Surfaces." Trans. Farad. Soc. 45: 625-635.
Gresham, R. M. (2003). Solid Film Lubricants -Unique Products For UniqueLubrication. Tribology and Lubrication Technology: 28-31.
grossiard, C., J. M. Martin, et al. (2000). "Tribochemical Interactions BetweenZnDTP, MoDTC and Calcium Borate." Tribology Letters 8: 203-212.
Grossiard, C., K. Varlot, et al. (1998). "MoS2 Single Sheet Lubrication byMolybdenum Dithiocarbamate." Tribology International 31(12): 737-743.
195
Gunsel, S. (1999). "The Elastohydrodynamic Friction and Film Forming Propertiesof Lubricant Base Oils." Tribology Transactions 42(3): 559-569.
Haluska, P. and L. Guzzella (1998). "Control Orientated Modeling of MixtureFormation Phenomena in Multi-Port Injection SI Gasoline Engines." SAE 980628.
Haury, E. J. (1996). "A Fleet Test Evaluation of-the Effect of a Unique GasolineAdditive on Vehicle Acceleration." SAE 962007.
Hayden, T. E., C. A. Ropes, et al. (2001). "The Performance of a Gasoline FrictionModifier Fuel Additive." SAE 2001-01-1961.
Hoshino, K., H. Kawai, et al. (1998). "Fuel Efficiency of SAE 5W-20 FrictionModified Gasoline Engine Oil." SAE 982506.
Hsu, S. M. and R. S. Gates (2005). "Boundary Lubricating Films: Formation andLubrication Mechanism." Tribology International38: 305-312.
ILSAC (2004). "ILSAC GF-4 Standard for Passenger Car Engine Oils."www.ilma.orglresources/ilsac finalstdOI1404.pdf.
Jang, H. (1998). "The Effect of Solid Lubricants 01} Friction Characteristics." SAE982235.
Jenkin, R. J., E. H. James, et al. (1996). "Thermal Boundary Layer Modelling in'Motored' Spark Ignition Engines." SAE 961965.
Jensen, R. (2005). "Extending the Retention of Friction-Reducing Capability inLow-Phosphorus Engine Oils." Lubrication Science 17(2): 147-162.
Jost, P. (1966). "Lubrication (Tribology) Education and Research." HMSO.
Kaiser, E., W. Seigl, et al. (1994). "Time-Resolved Measurement of Speciated
Hydrocarbon Emissions During Cold Start ofa Spark-Ignited Engine." SAE 940963.
Kajdas, C. (1993). Engine Oil Additives: a General Overview.
Kajdas, C., M. J. Furey, et al. (2002). "Triboemission as a Basic Part of theBoundary Friction Regime: A Review." Lubrication Science 14(2): 223-254.
196
Kajdas, C. and K. Liu (2004). "Tribochemistry of Aluminium and Aluminium Alloy
Systems Lubricated with Liquids Containing Alcohol or Amine Additive Types andSome Other Lubricants - A Review." Lubrication Science 16(3): 267-292.
Kano, M. (2006). "Super Low Friction of DLC Applied to Engine Cam FollowerLubricated With Ester Containing Oil." Tribology IntemationaI39(12): 1682-1685.
Kasrai, M., N. Cutler, et al. (1998). "The Chemistry of Antiwear Films Generated bythe Combination of ZDDP and MoDTC Examined by X-ray AdsorptionSpectroscopy." Tribology Transactions 41(1): 69-77.
Kenbeek, D., T. Buenemann, et al. (2000). "Review of Organic Friction Modifiers -Contribution to Fuel Efficiency?" SAE 2000-01-1792.
Kikuchi, T., S. Ito, et al. (2003). "Piston Friction Analysis Using a Direct-Injection
Single Cylinder Gasoline Engine." JSAE Review 24: 53-58.
Kikuchi, T., S. Ito, et al. (2003). "Piston Friction Analysus Using a Direct -Injection
Single Cylinder Gasoline Engine." JSAE Review 24: 53-58.
Kim, H., S. Yoon, et al. (2003). "Correlating Port Fuel Injection to Wetted FuelFootprints on Combustion Chamber Walls and UBHC in Engine Start Processes."SAE 2003-01-3240.
Korcek, S., R. Jensen, et al. (1999). "Fuel Efficient Engine Oils, AdditiveInteractions, Boundary Friction and Wear." Lubrication at the Frontier.
Korcek, S., R. K. Jensen, et al. (2000). "Interactions Leading to Formation of LowFriction Films in Systems Containing Molybdenum Dialkyldithiocarbamate and ZincDialkyldithiophosphate Additives." Thinning Films and Tribological Interfaces: 399-407.
Korcek, S. and M. Nakada (1996). "Engine Oil Performance Requirements and
Reformulation for "Future Gasoline Engines and Systems." SAE 961146.
Korcek, S., J. Sorab, et al. (2000). "Automotive Lubricants for the Next Millenium."Industrial Lubrication and Tribology 52(5): 209-220.
197
Kovacs, A. (1995). "Visualisation of Fuel-Lubricant Interaction on the Cylinder
Surface in the Combustion Chamber of SI Engines." Lubrication Science 7(2): 149-162.
Leach, B., H. Zhao, et al. "Two-Phase Fuel Distribution in an Air Asisted DIGasoline Engine."
Liu, K., Y. B. Xie, et al. (1998). "A comprehencive study of the friciton and dynamicmotion of the piston assembly." Proceedings of the Institute of MechanicalEngineers 212(J): 221-226.
Lundgren, S. M., K. Persson, et al. (2006). "Adsorption of Fatty Acids from Alkane.Solution Studied with Quartz Crystal Microbalance." Tribology Letters 22(1): 15-20.
Ma, M.-T. (1997). "Analysis of lubrication and friction for a complete piston-ring
pack with an improved oil availability model. Part 1: circumferential uniform film."Proceedings of the Institute of Mechanical Engineers 211(J): 1-15.
Ma, M.-T., I. Sherrington, et al. (1997). "Analysis of lubrication and friction for a
complete piston-ring pack with improved oil availability model. Part II:Circumferentially variable film." Proceedings of the Institute of MechanicalEngineers 211(J): 17-27.
Manni, M., C. Gommellini, et al. (1995). "Effect of Physical Characteristics ofLubricating Oils on Emissions, Fuel Economu and Oil Consumption in a Light DutyDiesel Engine." SAE 952552.
Mansouri, S. H. and V. W. Wong (2004). "Effects of Piston Design Parameters onPiston Secondary motion and Skirt-Liner Friction." SAE 2004-01-2911.
Markley, K. S. (1960). Fatty Acids: Their Chemistry, Properties, Production andUses, Interscience New York.
Markley, K. S. (1967). Fatty Acids: Thier Chemistry, Properties, Production andUses, Interscience New York.
Marshall, W. F. (1979). "Potential for Improving Short-Trip Fuel Economy by FuelFormulation." SAE 790655.
198
Matsuo, K., S. Kiga, et al. (2005). "Reduction of Piston System Friction by Applyinga Bore Circularity Machining Technique to the Cylinder Block." SAE 2005-01-1656.
McCurry, 1. D. and B. D. Quimby (2003). "Two-Dimensional Gas Chromatography
Analysis of Components in Fuel and Fuel Additives Using a Simplified HeartCutting GC System." Journal of Chromatographic Science 41: 524-527.
McGeehan, J. A. (1978). "A Literature Review of the Effects of Piston and RingFriction and Lubricating Oil Viscosity on Fuel Economy." SAE 780673.
Metcalf, M. and J. Reid (1996). Fortran 90/95 Explained. Oxford, Oxford UniversityPress.
Meyer, R. and J. B. Heywood (1997). "Liquid Fuel Transport Mechanisms into theCylinder of a Firing Port-Injected SI Engine During Start Up." SAE 970865.
Miklozic, K. T., J. Graham, et al. (2001). "Chemical and Physical Analysis ofReaction Films Formed by Molybdenum Dialkl-Dithiocarbamate Friction ModifierAdditive Using Raman and Atomic Force Microscopy." Tribology Letters 11(2): 71-81.
Minfray, C., J. M. Martin, et al. (2003). "The Role of Mechanical and ChemicalProcesses in Anti-Wear Properties ofZDDP Tribofilms."
Mitchell, P. C. H. (1984). "Oil-Soluble Mo-S Compounds As Lubricant Additives."Wear 100: 281-300.
Monaghan, M. L. (1989). "Putting Friction in its Place." Proceedings of the Institute
of Mechanical Engineers C3751KNI.
Moreton, D. (2005). "Opportunities for Chemists in the Automotive AdditiveIndustry." Lubrizol Internal Presentation.
Morina, A., J. H. Green, et al. (2003). "Surface and Tribological Characteristics of
Tribofilms Formed in the Boundary Lubrication Regime with Application to InternalCombustion Engines." Tribology Letters 15(4): 443-452.
Mufti, R. (2004). Total and Component Friction in a Motored and Fired Engine.Mechanical Engineering. Leeds, The University of Leeds. PhD: 300.
199
Mufti, R. and M. Priest (2005). "Experimental Evaluation of Piston AssemblyFriction Under Motored and Fired Conditions in a Gasoline Engine." Jour.
Tribology, ASME 127(4): 826-836.
Mufti, R., M. Priest, et al. (2004). Experimental and Theoretical Study ofInstantaneous Piston Assembly Friction in a Gasoline Engine. 2002 ASME/STLE
International Joint Tribology Conference, California.
Murakami, Y. and H. Aihara (1991). "Analysis of Mechanism IntermixingCombustion Products in Engine Oil (Quantity and Composition of UnburedGasolinein Engine Oil and Crankcase Gas)." Jap. Soc. Mech. Engrs Int. J(Ser. II,34(4)): 548-556.
Nakada, M. (1993). "Trends in Engine Technology and Tribology." Tribology
International 27(1): 3-8.
Nakashima, K., S. Ishihara, et al. (1995). "Influence of Piston Ring Gaps onLubricating Oil Flow Into The Combustion Chamber." SAE 952546.
Nakayama, K., S. Tamaki, et al. (2000). "The Effect of Crankshaft Offset on Piston
Friction Force in a Gasoline Engine." SAE 2000-01-0922.
Nice, K. (2007). "How Stuff Works." www.auto.howstuffworks.com.
Nicholls, M. A., T. Do, et al. (2005). "Review of the Lubrication of MetallicSurfaces by Zinc Dialkyl-Dithiophosphates." Tribology International38: 15-39.
Noorman, M. T., D. Assanis, et al. (2000). "Overview of Techniques for MeasuringFriction Using Bench Tests and Fire Engines." SAE 2000-01-1780.
Norris, M. G. and S. Hochgreb (1994). "Novel Experiment on In-CylinderDesorption of Fuel from the Oil Layer." SAE 941963.
O'Connor, D. J., B: A. Sexton, et al. (2003). Surface Analysis Methods in MaterialsScience, Springer.
OCTEL (2003). Octel Refinery Specialties. Octel.
OCTEL (2003). Performance Specialties. OCTEL.
200
Oncins, G., J. Torrent-Burgues, et al. (2006). "Lateral Force Microscopy Study of
Langmuid-Blodgett Films of a Macrocyclic Compound." Tribology Letters 21(3):175-184.
Paul, A. J. (2005). Organic and Molecular Imaging by ToF-SIMS - At The CuttingEdge. Spectroscopy Europe. 17: 25-27.
Perfiliev, V., A. Moshokovith, et al. (2006). "A New Way to Feed Nanoparticles toFriction Interfaces." Tribology Letters 21(2): 89-93.
Ping, W. D., S. Korcek, et al. (1996). "Comparison of the Lubricity of Gasoline andDiesel Fuels." SAE 962010.
Plint (1970). "TE-77 Handbook."
Priest, M. (1996). The Wear and Lubrication of Piston Rings. The Deparment ofMechanical Engineering. Leeds, The University of Leeds. PhD.
Priest, M. (2000). "Automobile Engine Tribology - Approaching the Surface." Wear
241 (2000): 193-203.
Priest, M. (2000). "Factors Influencing Boundary Friction and Wear of PistonRings." Thinning Films and Tribological Interfaces: 409-416.
Priest, M. (2006). "Lubricants and Lubrication." Unit 3 MECH 3280, Principles ()fTrihology.
Pryde, E. H. (1985). Fatty Acids, The American Oil Chemists' Society.
Randolph, A. L. (1990). "Methods of Processing Cylinder-Pressure TransducerSignals to Maximise Data Accuracy." SAE 900170.
Reid, J. (2003). Introduction to Associated Octel + Performance Additives. FuelAdditives, Octel.
Reid, R. C., J. M. Prausnitz, et al. (1977). The Properties of Gases and Liquids. NewYork, McGraw-Hill.
Renondeau, H. (2005). "Science et Surface S. A."
201
Richard, G. P. (1982). "Lubricant Properties in the Diesel Piston Ring Zone." 9th
Leeds-Lyon Symposium on Tribology, Boddington Hall, The University of Leeds,
England. Butterworths.
Robinson, I. C. H. (1977), 'The Effect of Gasoline Additives on Fuel Additive FuelEconomy', Fuel Economy of the Gasoline Engine, Blackmore, D. R, Thomas, A. ed.McMillan Press, Chapter 5, 77-88
Ruijun, Z., L. Shenghua, et al. (2006). "Tribochemical Interactions of Piston Ring
Coated with Molybdenum Dithiocarbomate Friction Modifier." Journal of MaterialsScience 41(7): 1911-1915.
Russ, S., E. W. Kaiser, et al. (1995). "Effect of Cylinder Head and Engine BlockTemperature on HC Emissions From a Single Cylinder Spark Ignition Engine." SAE
952536.
Ryk, G. and I. Etison (2005). "Testing Piston Rings with Partial Laser SurfaceTexturing for Friction Reduction." Wear 261(7-8): 792-796.
Sanda, S., M. Murakami, et al. (1997). "Analysis of Lubrication of a Piston Ring
Package - Effect of Oil Starvation on Oil Film Thickness." JSME International
Journal Series B, 40(3): 478-486.
Sarin, R., D. K. Tuli, et al. (1994). "Additive-Additive Interactions; Search forSynergistic FM-EP-AW Composition." WEAR 174: 93-102.
Saville, S. B., F. D. Gainey, et al. (1988). "A Study of Lubricant Condition in thePiston Ring Zone of Single-Cylinder Diesel Engines Under Typical Operating
Conditions." SAE 881586.
Schramm, J. and S. C. Sorenson (1991). "Solubility of Gasoline Components inDifferent Lubricants for Combustion Engines Determined by Gas-Liquid PartitionChromatography." journal of Chromatography 538: 241-248.
Schulz, C. and V. Sick (2005). "Tracer-LIF Diagnostics: Quantitative Measurement
of Fuel Concentration, Temperature and Fuel/Air Ratio in Practical Combustion
Systems." Progress in Energy and Combustion Science 31: 75-121.
202
Shaub, H., J. Pandosh, et al. (1994). "Engine Durability, Emissions and FuelEconomy Studies with Special Boundary Lubricant Chemistry." SAE 941983.
Shin, Y., W. K. Cheng, et al. (1994). "Liquid Gasoline Behaviour in the EngineCylinder of a SI Engine." SAE 941872.
Skippon, S. M. and Y. Tagaki (1996). "IUDS Measurement of the Evaporation ofFuel Droplets During the Intake and Compression Strokes in a Firing Lean BurnEngine." SAE 960830.
Smith, G. (2002). "Intimate Contact." Shell Internal.
Smith, G. C. (1994). Surface Analysis by Electron Spectroscopy: Measurement andInterpretation, Plenum Press, New York.
Smith, o. M. Priest, et al (2006). "Simulated Fuel Dilution and Friction-ModifierEffects on Piston Ring Friction." Proceedings of the Institute of MechanicalEngineers 220(J), 3 :181-189.
Sorab, J., S. Korcek, et al. (1998). "Friction Reduction in Lubricated Components
Through Engine Oil Formulation." SAE 982640.
Spikes, H. (1971). Physical and Chemical Adsorption in Boundary Lubrication.Mechanical Engineering. London, Imperial College. PhD.
Spikes, H. (1999). "Thin Films In Elastohydrodynamic Lubrication: The
Contribution of Experiment." Proceedings of the Institute of Mechanical Engineers213(J): 335-352.
Spikes, H. (2002). "Film-Forming Additives - Direct and Indirect Ways to Reduce
Friction." Lubrication Science 14(2): 147-167.
Spikes, H. (2004). "The History and Mechanisms of ZDDP." Tribology Letters17(3): 469-489.
Spikes, H. and A. V. Olver (2003). "Basics of Mixed Lubrication." LubricationScience 16(1): 3-28.
203
Srivastava, R., C. Bao, et al. (1996). "Planar-Surf ace-Waveguide Evanescent-Wave
Chemical Sensors." Sensors and Actuators 51: 165-171.
Subaru (2006) ... www.drivesubaru.com ...
Sunqing, Q., D. Junxiu, et al. (1999). "Tribological Properties of CeF3 Nanoparticlesas Additives in Lubricating Oils." Wear 230: 35-38.
Swindal, J. C., D. P. Dragonetti, et al. (1995). "In-Cylinder Charge HomogeneityDuring Cold-Start Studied With Flourescent Tracers Simulating Different Fuel
Distillation Temperatures." SAE 950106.
Swindal, J. C., P. A. Furman, et al. (1997). "Fuel Distillation Effects on theOutgassing from a Simulated Crevice in a SI Engine Measured by PLanar Laser-
Induced Flourescence." SAE 970825.
Tan, Y., W. Huang, et al. (2002). "Molecular Orbital Indexes Criteria For Friction
Modifiers In Boundary Lubrication." Tribology International35: 381-384.
Taylor, C. M. (1998). "Automobile Engine Tribology - Design Considerations forEfficiency and Durability." WEAR 221 (1998) 1-8.
Taylor, I. (2002). Car Lubricants: Fact and Friction. Physics World: 39-43.
Taylor, R. I. (1994). "Lubricants and Lubrication - Validation of a piston ring-packlubrication model that includes realistic lubricant rheology." Tribology Series
30(21st Leeds Lyon Symposium): 345-354.
Taylor, R. I. (1997). "Engine Friction: The Influence of Lubricant Rheology."
Proceedings of the Institute of Mechanical Engineers 211(1): 235-246.
Taylor, R. I. (1997). Engine Friction: the influence of lubricant rheology (2). FifthCEC International Symposium on the Performance Evaluation of Automotive Fuels
and Lubricants, Goteborg, Sweden.
Taylor, R. I. (1998). "The Inclusion of Lubricant Shear Thinning in the ShortBearing Approximation." Proceedings of the Institute of Mechanical Engineers213(Part J): 35-46.
204
Taylor, R. I. (1999). "Engine Friction Lubricant Sensitivities: A Comparison of
Modem Diesel and Gasoline Engines." Shell Internal.
Taylor, R. I. (2000). "Heavy Duty Diesel Fuel Economy: Lubricant Sensitivities."SAE 2000-01-2056.
Taylor, R. I. (2002). The Development of Fuel -Economy Lubricants. Fuels and
Lubes Asia Conference and Exhibition, Singapore.
Taylor, R. I. (2002). "Lubrication, Tribology and Motorsport." 2002~01-3355 SAE.
Taylor, R. I., M. A. Brown, et al. (1995). "Validation of a Piston Ring-Pack
Lubrication Model that Includes Realistic Lubricant Rheology." Lubricants and
Lubrication 30.
Taylor, R. I., M. A. Brown, et al. (1994). "The Influence of Lubricant Rheology onFriction in the Piston Ring-Pack." SAE 941981.
Taylor, R. I. and R. C. Coy (2000). "Improved Fuel Effeciency by Lubricant Design:a Review." Proceedings of the Institute of Mechanical Engineers 214(J): 1-15.
Taylor, R. I. and P. G. Evans (2004). "In-situ Piston Measurement." Proceedings ofthe Institute of Mechanical Engineers 218(J): 185-200.
Taylor, R. I., T. Kitahara, et al. (1995). Piston Assembly Friction and Wear: The
Influence of Lubricant Viscometry. Proceedings of the International Tribology
Conference, Yokahama.
Taylor, R. I., R. Mainwaring, et al. (2005). "Engine Lubricant Trends Since 1990."Proceedings of the Institute of Mechanical Engineers 219(J): 331-345.
Taylor, R. I., N. R. Nagatomi, et al. (2000). "A Screener Test for the Fuel Economy
Potential of Engine Lubricants." Shell Internal.
Theil, Y. (2001a). Friction Modifier Delivered to Engine Oil Via Fuel: Predictingand monitoring a Performance Favourable Effect. Asia Fuels and LubricantsConference.
205
Thiel, Y. C. and T. E. Hayden (2001b). "The Fuel Additive / Lubricant Interactions:Compatibility Assesments in Field Studies and Laboratory Tests." SAE 2001-01-
1962.
Thompson, A. (1996). The Tribological Performance of Piston Ring Packs Designedfor Low Emissions. Mechanical Engineering. Leeds, The University of Leeds: 218.
Thompson, A., C. D. Radcliffe, et al. (1997). "The Influence of Piston RingTribology on the Diffusion of Fuel Through Oil Films." Proceedings of the Institute
of Mechanical Engineers 211(J): 223-233.
Thompson, G. P. and W. Cochrane (1939). Theory and Practice of Electron
Diffraction, Macmillan.
Thompson, M. (1990). "The Use of Top Ring Zone Sampling and Analysis to
Investigate Oil Consumption Mechanisms." IMechE c394/041.
Thring, R. H. (1992). "Engine Friction Modelling." SAE 920482.
Tian, T., V. Wong, et al. (1998). "Modeling the Dynamics and Lubrication of Three
Piece Oil Control Rings in Internal Combustion Engines." SAE 982657.
Transportation, U. S. D. o. (2004). Summary of Fuel Economy Performance. J.
Finnerman. Washington DC.
Tripaldi, G., V. Vettor, et al. (1996). "Friction Behaviou of ZDDP Films in the
Mixed, Boundary / EHD Regime." SAE 962036.
Truhan, J. J., J. Qu, et al. (2005). "A Rig Test to Measure Friction and Wear ofHeavy Duty Diesel Engine Piston Rings and Cylinder Liners Using Realistic
Lubricants." Tribology International38: 211-218.
Tseregounis, S. 1. and M. L. McMillan (2001). "Fuel Economy Gains with Modem
Technology, SAE 5W-20 Engine Oils in a GM Engine as Measured in the EPA FTP
Test." SAE 2001-01-1900.
Tseregounis, S. 1., M. L. Mcmillan, et al. (1998). "Engine Oil Effects on FuelEconomy in GM Vehicles - Separation of Viscosity and Friction Modifier Effects."
SAE 982502.
206
Tung, S. C. and H. Gao (2003). "Tribological Characteristics and Surface Interaction
Between Piston Ring Coatings and a Blend of Energy-Conserving Oils and EthanolFuels." Wear 255: 1276-1285.
Tung, S. C. and S. I. Tseregounis (2000). "An Investigation of Tribological
Characteristics of Energy-Conserving Engine OIls Using A REciprocating BenchTest." SAE 2000-01-1781.
Tupa, R. C. and C. J. Dorer (1986). "Gasoline and Diesel Fuel Additives forPerformancelDistribution Quality - II." SAE 861179.
Unnikrishnan, R., M. C. Jain, et al. (2002). "Additive-Additive Interaction: an XPS
Study of the Effect of ZDDP on the AWIEP Characteristics of Molybdenum Based
Additives." Wear 252: 240-249.
Vettor, V., G. Tripaldi, et al. (2003). "Mo-Compounds Efficiency and Interactionswith Engine Oil Additives." SAE 2003-01-1955.
Vickerman, J. C. (1997). Surface Analysis - The Principle Techniques, John Wileyand Sons, Chichester.
Vipper, A. B., W. Bartz, et al. (1995). "Antifriction Action of Lubricant Additives."Lubrication Science 7(3): 247-259.
Vipper, A. B., O. P. Parenago, et al. (1999). "Tribological Performance of
Molybdenum and Zinc Dithiocarbamates and Dithiophosphates." LubricationScience 11(2): 187-196.
Wain, K. S., J. M. Perez, et al. (2005). "Alternative and Low Sulfur Fuel Options:Boundary Lubrication Performance and Potential Problems." Tribology International38: 313-319.
Wakabayashi, R., M. Takiguchi, et al. (2003). "The Effects of Crank Ratio and
Crankshaft Offset on Piston Friction Losses." SAE 2003-01-0983.
Wakuri, Y., T. Hamatake, et al. (1992). "Piston Ring Friction in Internal CombustionEngines." Tribology International 25(5): 299-308.
207
Wakuri, Y., M. Soejima, et al. (1995). "Studies on Friction Characteristics ofReciprocating Engines." SAE 952471.
Wanli, Y., Y. Chen, et al. (2004). "Simulation of Non-Steady Multidimensional HeatTransfer Within Piston / Cylinder Liner Sliding Couple of Internal CombustionEngine." SAE 2004-01-0599.
Wedler, G. (1970). Chemisorption: An Experimental Approach, The Butterworth
Group.
Wei, D. P., H. Spikes, et al. (1999). "The Lubricity of Gasoline." Tribology
Transactions 42(4): 813-823.
Wilk, M. A. and M. S. Newkirk (1998). "Toward Improved Fuel Economy inPassenger Car Motor Oils: An Investigation into the Influence of Detergent System
and Friction Modifier as Measured by the EPA Federal Test Procedure and HighwayFuel Economy Test Cycles." SAE 982505.
Willcock, M. (1996). Recent Developments in Piston Assemblies.
Williams, J. A. (1994). Engineering Tribology, Oxford University Press.
Wilson, B. (1995). "Slick 50- A Proven PTFE-Based Boundary Lubricant ForEngines." Industrial Lubrication and Tribology 47(4): 6-8.
Winborn, L. D. and P. J. Shayler (2001). "Fuel Losses to the Crankcase andHydrocarbon Return with Recirculated Oil and Ventilation Flow." Proceedings of
the Institute of Mechanical Engineers 215(10): 1117-1130.
Yamada, Y., M. Ishimaru, et al. (2000). "Retention of Friction Reducing
Performance of MoDTC-Containing Fuel Efficient Gasoline Engine Oils DuringUse." SAE 2000-01-2053.
Yamada, Y., M.' Ishimaru, et al. (2001). "Retention of Friction ReducingPerformance of MoDTC-Containing Fuel Efficient Gasoline Engine Oils DuringUse." SAE 2001-01-2053.
Yamaguchi, E. S., S. H. Roby, et al. (2005). "Time-Dependent Film Formation from
ZnDTPs and Nonphosphorus Antiwear Agents." Tribology Transactions 48: 57-68.
208
Zaslavskii, Y. S., R. N. Zaslavskii, et al. (1973). "Possible Future Developments inthe use of Substances Forming Friction Polymers." UDC 665: 716-719.
Zhou, Q., M. C. Lai, et al. (1995). "The Spray Characteristics of Automotive Port
Fuel Injection - A Critical Review." SAE 950506.
Zhou, Q., I. Shilling, et al. (2003). "Prediction of total engine friction power lossfrom detailed component models." Tribological Research and Designs for
Engineering Systems: 761-766.
Zughyer, J. R., F. C. Zhao, et al. (2000). "A Visualization Study of Liquid FuelDistribution and Combustion Inside a Port-Injected Gasoline Engine Under DifferentStart Conditions." SAE 2000-01-0242.
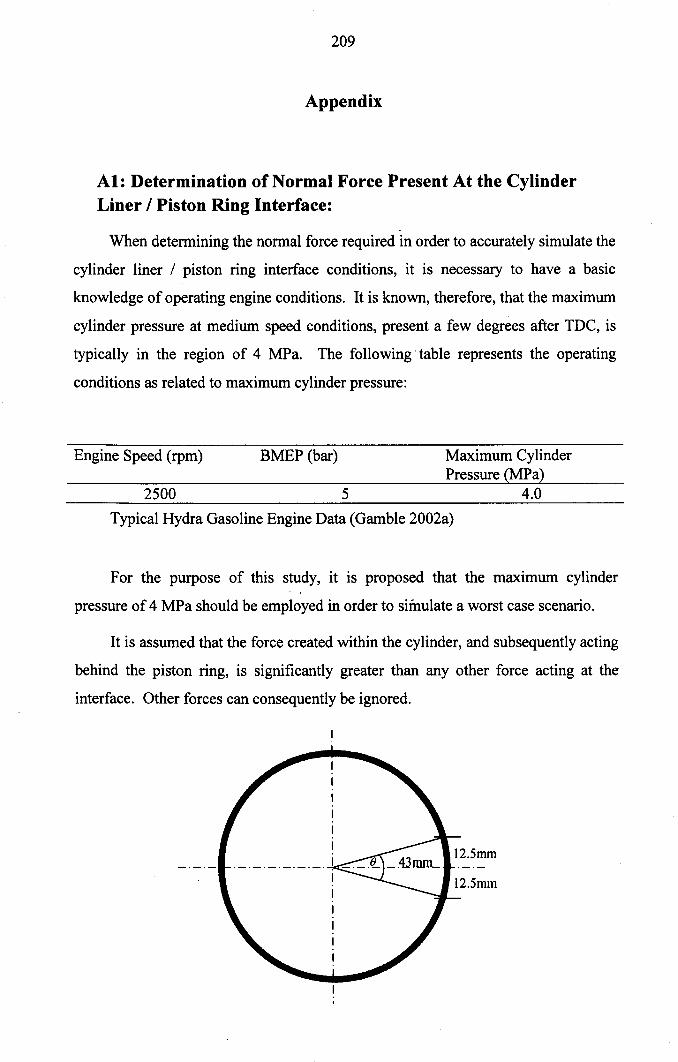
209
Appendix
AI: Determination of Normal Force Present At the CylinderLiner / Piston Ring Interface:
When determining the normal force required in order to accurately simulate the
cylinder liner / piston ring interface conditions, it is necessary to have a basic
knowledge of operating engine conditions. It is known, therefore, that the maximum
cylinder pressure at medium speed conditions, present a few degrees after TDC, is
typically in the region of 4 MPa. The following table represents the operating
conditions as related to maximum cylinder pressure:
Engine Speed (rpm) BMEP (bar) Maximum CylinderPressure (MPa)
2500 5 4.0
Typical Hydra Gasoline Engine Data (Gamble 2002a)
For the purpose of this study, it is proposed that the maximum cylinder
pressure of 4 MPa should be employed in order to simulate a worst case scenario.
It is assumed that the force created within the cylinder, and subsequently acting
behind the piston ring, is significantly greater than any other force acting at the
interface. Other forces can consequently be ignored.
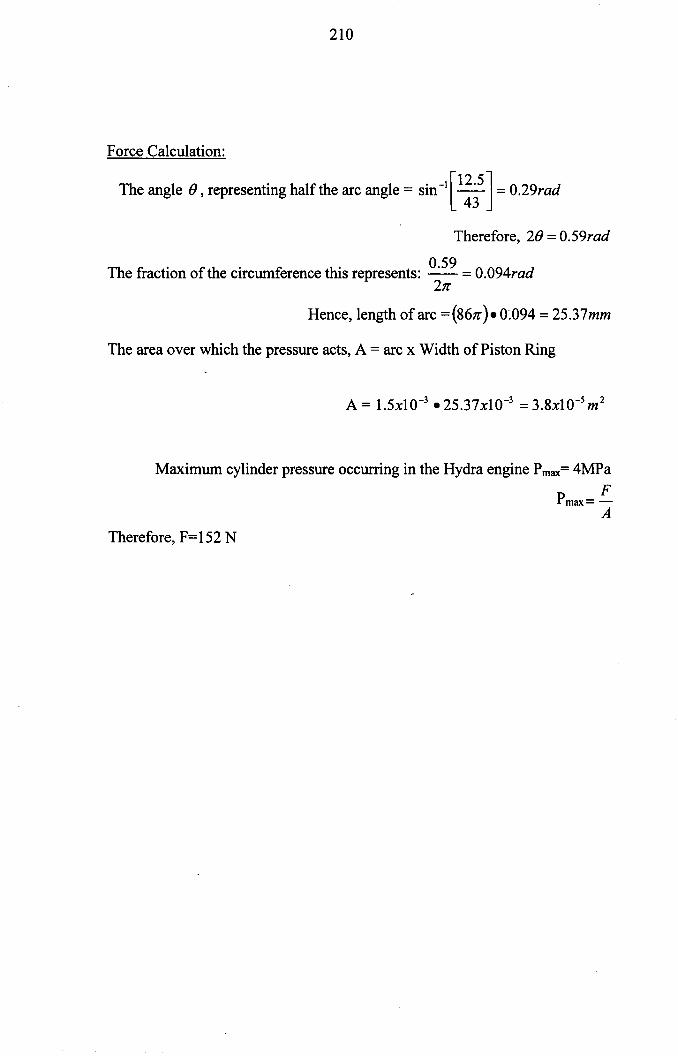
210
Force Calculation:
The angle (), representing half the arc angle = sin-l[1~;5] = 0.29rad
Therefore, 20 = 0.59rad
The fraction of the circumference this represents: 0.59 = 0.094rad21!
Hence, length of arc =(86Jr). 0.094 = 25.37mm
The area over which the pressure acts, A = arc x Width of Piston Ring
Maximum cylinder pressure occurring in the Hydra engine Pmax=4MPaFPmax=-A
Therefore, F=152 N
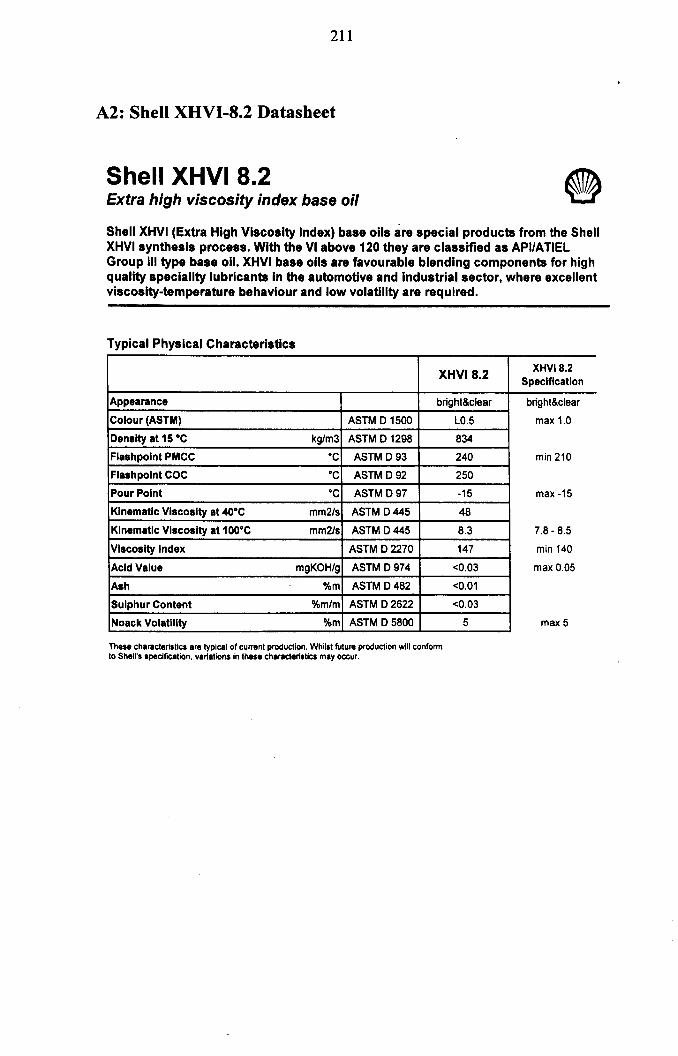
211
A2: Shell XHVI-S.2 Datasheet
Shell XHVI 8.2Extra high viscosity index base oil
Shell XHVI (Extra High Viscosity Index) base oils are special products from the ShellXHVlsynthesis process. With the VI above 120 they are classified as API/ATIELGroup III type base oil. XHVI base oils are favourable blending components for highquality speciality lubricants In the automotive and Industrial sector, where excellentviscosity-temperature behaviour and low volatility are required.
Typical Physical Characteristics
XHVIS.2 XHVIB.2Specification
Appearance brighl&clear brighl&clear
Colour (ASTM) ASTM 0 1500 LO.5 max 1.0
Density at 15°C kg/m3 ASTM 0 1298 834
Flashpolnt PMCC ·C ASTM 0 93 240 min 210
Flaahpolnt coe ·C ASTM 092 250
Pour Point ·C ASTM 097 -15 max -15
Kinematic Viscosity at 40°C mm2ls ASTM 0445 48
Kinematic Viscosity at 1000e mm2ls ASTM 0445 8.3 7.8 - 8.5
Viscosity Index ASTM 02270 147 min 140
Acid Value mgKOH/g ASTM 0974 <0.03 max 0.05
Ash %m ASTM 0482 <0.01
Sulphur Content %m/m ASTM 02622 <0.03
Noack Volatility %m ASTM 05800 5 max 5
These characteristics are typlCiI of current production. Whilst future production will conformto Sheil's speciflCltlon, variations In these charlcterl.ttcs may occur.
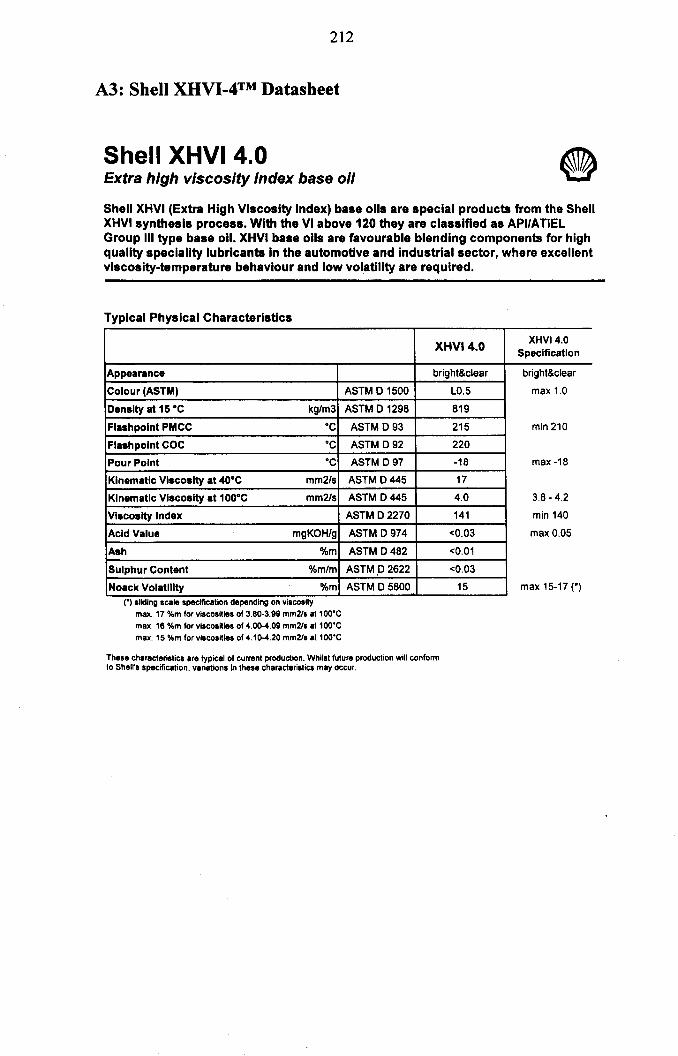
212
A3: Shell XHVI-4TM Datasheet
Shell XHVI 4.0Extra high viscosity index base oil
Shell XHVI (Extra High Viscosity Index) base oils are special products from the ShellXHVlsynthesls process. With the VI above 120 they are classified as API/ATIElGroup III type base 011. XHVI base oils are favourable blending components for highquality speciality lubricants in the automotive and industrial sector, where excellentviscosity-temperature behaviour and low volatility are required.
Typical Physical Characteristics
XHVI4.0 XHVI4.0Specification
Appearance bright&clear bright&clear
Colour (ASTM) ASTM 01500 LO.5 max 1.0
Density at 15 ·C kg/m3 ASTM 0 1298 819
Flashpolnt PMCC ·C ASTM 0 93 215 min 210
Flashpolnt COC ·C ASTM 092 220
Pour Point ·c ASTM 097 -18 max -18
Kinematic Viscosity at 40°C mm2/s ASTM 0445 17
Kinematic Viscosity at 100·C mm2ls ASTM 0445 4.0 3.8 - 4.2
Viscosity Index ASTM 0 2270 141 min 140
Acid Value mgKOH/g ASTM 0974 <0.03 max 0.05
Ash "10m ASTM 0482 <0.01
Sulphur Content "/om/m ASTM,D 2622 <0.03
Noack Volatility "/om ASTM 0 5800 15 max 15-17 (.)(0) sliding scale specificatIon depending on vISCOSity
max. 17 %m for viscosities of 3.80-3.99 mm2l1 a1100'Cmax. 16 %m for viscosities of 4.00-4.09 mm2l1 at 100'Cmax. 15 %m for viscosities of 4.10-4.20 mm2ls at 100'C
These characteristics are typicai of current production. Whilst future production will conformto Shell's specification. vlriations In these characteriltics may occur.
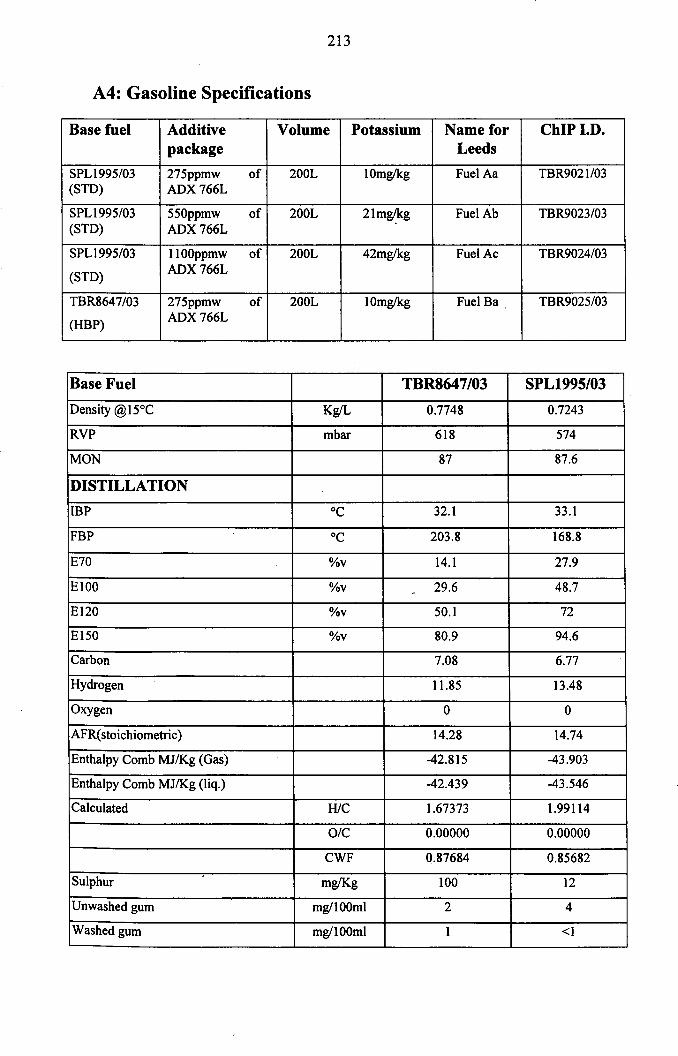
213
A4: Gasoline Specifications
Base fuel Additive Volume Potassium Name for ChIP I.D.package Leeds
SPLl995/03 275ppmw of 200L 10mg/kg Fuel Aa TBR9021103(STD) ADX766L
SPL1995/03 550ppmw of 200L 21mg/kg Fuel Ab TBR9023/03(STD) ADX766L
SPL1995/03 1100ppmw of 200L 42mg/kg Fuel Ac TBR9024/03
(STD) ADX766L
TBR8647/03 275ppmw of 200L 10mg/kg Fuel Ba TBR9025/03
(HBP) ADX766L
Base Fuel TBR8647/03 SPL1995/03
Density @15°C KgIL 0.7748 0.7243
RVP mbar 618 574
MON 87 87.6
DISTILLATION
IBP °C 32.1 33.1
FBP °C 203.8 168.8
E70 %v 14.1 27.9
EI00 %v _- 29.6 48.7
El20 %v 50.1 72
El50 %v 80.9 94.6
Carbon 7.08 6.77
Hydrogen 11.85 13.48
Oxygen 0 0
AFR(stoichiometric) 14.28 14.74
Enthalpy Comb MJ/Kg (Gas) -42.815 -43.903
Enthalpy Comb MJ/Kg (liq.) -42.439 -43.546
Calculated WC 1.67373 1.99114
O/C 0.00000 0.00000
CWF 0.87684 0.85682
Sulphur mglKg 100 12
Unwashed gum mg/l00ml 2 4
Washed gum mg/l00ml 1 <1
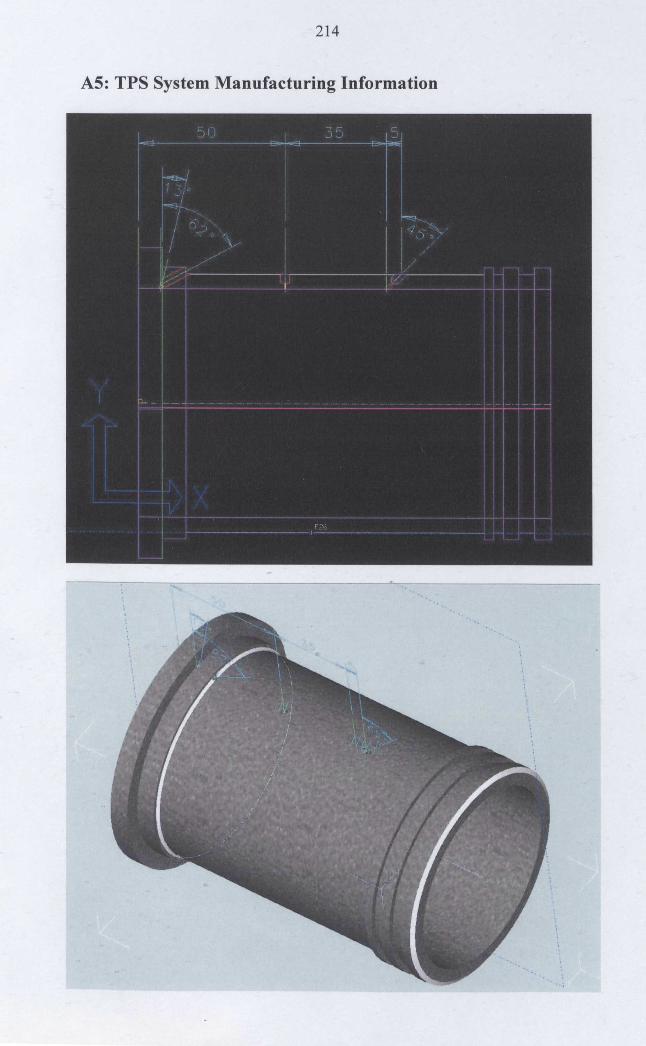
214
AS: TPS System Manufacturing Information