encapsulation of lead ions in sand-cement-clay mixture
TRANSCRIPT

Encapsulation of Lead Ions in
Sand-Cement-Clay Mixture
Reyad A. Shawabkeh Department of Chemical Engineering, Mutah University, Al-Karak, Jordan
e-mail: [email protected]
Bassam Z. Mahasneh Department of Civil Engineering, Mutah University, Al-Karak, Jordan
e-mail: [email protected]
ABSTRACT
This study was carried out to test the feasibility of a mixture of sand,
cement and clay for immobilizing lead ions from retention into water
resources. Various samples with different mass ratios of this mixture
were tested to determine their efficiency for holding lead. The
compressive test, cation exchange capacity, adsorption equilibrium, and
the leaching test were applied to each sample. The sample that proved
the high cation exchange capacity with 53.1 meq/100g and compressive
test with 11.05 kN/m2 is 25% sand, 50% cement and 25% clay. The
equilibrium data for Pb2+
removal using this sample showed a monolayer
of adsorption, which can be fitted using Redlich-Peterson adsorption
isotherm model with a regression coefficient of 0.995. The maximum
lead uptake obtained from the experimental data was 192 mg/g solid.
Introducing clay into this sample proved its sorption capacity while the
presence of sand and cement enhanced the resistant of this sample to
compressive test.
KEYWORDS: Encapsulation, Solidification, Stabilization, Sand,
Cement, Clay, Lead, Adsorption, Cation Exchange Capacity.

INTRODUCTION
Heavy metals contamination to water resources is of a major concern. The geochemical
mobility of these metals accompanied with their toxicity to human and animal paid the
attention toward finding suitable remediation technologies for these metals. One of the
powerful techniques is the precipitation of these toxicants as metal hydroxides [1,2].
However, this technique produces large amount of sludge with high concentration of
metals. Treatment of sludge can be achieved using different technologies. These include
stabilization [3,4], thickening [5], dewatering [6], drying and incineration [7,8], and
physical solidification or stabilization using either cementations or pozzolanic materials
[9]. One dominant method of metal and sludge disposal is the cement-based
solidification/stabilization process. This method offer a combined benefit of reducing the
volume of the sludge to be disposed and trapping the metal ions from leaching out to
water resources. Several researchers adopted this encapsulation technique toward
radioactive isotopes [10,11], organic matters [12,13] and heavy metal [14,15]. This
treatment involves mixing the metals of interest with binding reagent. The effectiveness
of this technique depends on the amount of these mixtures to uptake metals as well as
their resistance to permeability, leachability and hardness. Several additives such as
cement, limestone, fly ash, gypsum or phosphate mixture can bind heavy metals [10,16-
18]. These additives were added either to enhance the hardness of the grout mixture or
increase the resistibility to leaching. The effective binding agent, however, is the one that
combine the decrease in leachability of these metals in the solid matrix as well as
enhance the strength of this solid matrix to compressive load. In this paper, a mixture of
three components (sand, cement and clay) is used with different weight percentages as
matrix for holding of lead ions from solution.
EXPERIMENTAL METHODS
Materials
Clay and sand were brought from Al-Tafela area in the southern part of Jordan while
cement was manufactured by Jordan Cement Factories Company, Jordan. These materials
were combined, crushed, and sieved to a particles sizes less than 45 m. All chemical
were analytical grade reagents supplied by Sigma Chemical Company. The glassware
was Pyrex washed with diluted nitric acid, soap, and deionized water to minimize surface
adsorption of metals of interest.
Methods
Compressive strength test
Fifteen samples of sand, cement and clay with different mass ratios were mixed
thoroughly with sufficient amount of water. These samples were brought into polyvinyl
chloride (PVC) cylindrical molds to test their compressive strength. According to ASTM
C 109M-02 the specimens were allowed to cure for different period of times. Then these
specimens were caped with molten sulfur to smooth their faces and a constant rate of

loading was allowed until failure occurs. The compressive strength for the specimens was
determined by dividing the maximum load attained during the test by the cross sectional
area of the tested specimen.
Cation exchange capacity test
Cation exchange capacity (CEC) was determined using sodium acetate procedure
proposed by Environmental Protection Agency (EPA) according to SW-846 Method
9080. The technique involved treating 4 g of the sample under investigation with excess
amount of sodium acetate solution (1.0 N). Subsequently, the sample was rinsed several
times with isopropyl alcohol. Then ammonium acetate solution (1.0 N) was added to
replace the adsorbed sodium with ammonium ions. The concentration of displaced
sodium was then determined using SOLAAR S4 Atomic Absorption Spectrophotometer.
Adsorption isotherm
Equilibrium experiments were conducted by mixing different concentrations of lead
solutions (25–2000 mg/L) with 0.1 g of the composite material that having the highest
CEC and compressive strength. These solid-solution mixtures were placed in 250-ml
Erlenmeyer flasks and agitated in an isothermal shaker at constant temperature of
(22±1oC) for 24 hr. After the solutions get equilibrated, the concentration of lead was
analyzed using SOLAAR S4 atomic absorption spectrophotometer.
Table 1. Chemical Analysis of clay and cement used in this study
Component (wt%) Clay Cement
SiO2 58.86 21.2
Al2O3 17.11 5.5
Fe2O3 4.20 3.1
CaO 10.85 64.18
MgO 1.66 2.5
SO3 - 2.63
Na2O 2.83 0.18
K2O 2.30 0.71
TiO2 0.57 -
RESULTS AND DISCUSSIONS
The chemical composition of clay and cement is shown in Table 1. The analysis to these
materials revealed that they contain mainly silica, alumina and calcium oxide, which they
account for 89.57% of the total weight. Fifteen samples of concrete were prepared by
mixing sand, cement and clay at different compositions. Table 2 shows these percentages
were the particle size of each constituent was less than 45 (m. The cementation process

for these samples was conducted in a 500-ml beaker by perfect mixing 200 g of each
solid sample with distilled water until the mixture becomes paste. The water to solid ratio
was varied according to the percentage of cement and clay substitution in order to have a
fixed fluidity of all samples. Then, these samples were placed in cylinders (1 in. ID and 2
in. length) and allowed to solidify at room temperature (22±1oC) in a closed container for
two weeks. The container was kept at saturate humidity by spraying reasonable amount
of water in a fixed period of 4 h.
Table 2. Percentage of sand, cement and clay in the composite samples
Sample number Sand % Clay % Cement % Water (ml)
1 25 50 25 285
2 25 25 50 488
3 25 0 75 383
4 25 75 0 315
5 0 75 25 543
6 0 50 50 393
7 0 25 75 578
8 50 50 0 298
9 50 25 25 186
10 50 0 50 185
11 75 25 0 246
12 75 0 25 51
13 100 0 0 15
14 0 0 100 230
15 0 100 0 533
Compressive strength for different cured batches was tested at the end of each week
during the curing time. Figure 1 illustrates the values of compressive strength with the
sample number. The maximum compressive strength was for the sample that contains
25% sand, and 75% cement with a value of 12.83 kN/m2 obtained after two weeks of
curing. Moreover, the samples that containing pure cement or 25% sand, 25% clay and
50% cement showed also quite good compressive strength with values of 11.84 and 11.05
kN/m2, respectively, while the samples that containing no cement did not show any
resistant to compression. In all samples the increase in curing time proved a better
resistant to compression. This is due to the slow formation of cementation agent that is
produced as a result of reaction of lime with fine samples particles. This agent
crystallizes slowly into an interlocking matrix and increases the samples strength. Longer
curing period allows longer time for lime to react and form a strong skeleton structure
throughout the material binding the grains together [19].

Figure 1. Compressive strength for different compositions of sand-clay-cement mixture
obtained at different curing times
Figure 2 shows the variation of compressive strength with the percentage of clay added to
the samples free of sand. It is also seen as the curing time decrease the resistant to
compression is decreased. This trend is severely accentuated by the addition of clay to
these samples. This decrease in compression test with the addition of clay is attributed to
the fact that clay contains individual layers of colloidal particles. When these particles are
suspended in water, some of these interlayers absorb the positive ions that exist in the
specimen leading to expanding these layers. As a result this specimen becomes more
elastic as the ratio of clay to cement increase. This leads to less resistance to compression
with a value of 0.98kN/m2 when the sample contains pure clay.
On the other hand, when the specimen contains sand and cement only (Figure 3), the
increase in sand percentage from 0 to 100% yields a gradual decrease in the compression
test to reach 0 kN/m2 at 100% sand. It is worth to notice that a sluggish decrease in
compression test with the addition of the sand while a severe decrease with the addition
of clay to a sample contains only cement. This could be attributed to that fact that sand
contains hard spherical particles, which resist the compression more than that of clay.

Figure 2. Effect of variation of clay to cement ratio on the compressive strength for
samples free of sand
Figure 3. Effect of variation of sand to cement ratio on the compressive strength for
samples free of clay

The CEC was determined using the ammonium acetate method after washing several
times with alcohol. This CEC governs the extent of migration of lead from the clay-sand-
cement matrix. The higher CEC value of the mixture is the better one for retaining the
pollutants from leaching out into water resources. The maximum CEC was achieved for
the sample that contains 25% clay and 75% cement with a value of 62.8 meq/100g solid
(Figure 4).
Figure 4. Cation exchange capacity of samples containing different clay-sand-cement
ratios.
In addition, the samples that containing 50% clay and 50% cement, 100% clay, and 25%
clay, 25% sand and 50% cement show pretty good CEC values of 60.86, 57.98, 53.1
meq/100g, respectively. In the absence of cement, the increase in the ratio of sand to clay,
Figure 5, is associated with a decrease in the value of CEC till it reaches 1.6 meq/100g
for pure sand one. This is as a result of decreasing of the density of surface charge with
increasing the sand to clay ratio. On the other hand, when the ratio of sand to cement
increases from 0 to 25% in the absence of clay (Figure 6, region 1), the trend for CEC
value increase noticeably from 25 to 41.6 meq/100g and then decrease exponentially to a
value of 1.68 meq/100g when the specimen is pure sand (region 2).

Figure 5. Effect of variation of sand to clay ratio on the cation exchange capacity of the
mixture
This could be attributed to the increase in the void volume of the sample in the first
region, which enhances the permeability of the exchangeable ions on its surface.
However, this potential to ion exchange decreases with increasing the sand content.
Bearing in mind the fact that cement has better potential for ion exchange than that of
sand, as a result of the distribution of different metal oxides in its content, this potential
decreases as a result of decreasing the net surface charge of the whole sand-cement
sample in the second region. In the third case, when the ratio of clay to cement increases
in the sample that having no sand, Figure 7, the potential to ion exchange increases to a
maximum value of 62.86 meq/100g, then a slow decrease to a value of 57.98 meq/100g
when the sample contains pure clay. This could be ascribed to the change of pH value of
the clay-cement mixture after the successive addition of clay. As the pH of this mixture
increases to a value higher than that of the isoelectric point, the exchangeable capacity is
increased [20]. Pure cement sample contains 64.18% CaO which can be converted to
CaOH upon reaction with water.

Figure 6. Effect of variation of sand to cement ratio on the cation exchange capacity of
the mixture
Figure 7. Effect of variation of clay to cement ratio on the cation exchange capacity of
the mixture
The latter will raise the pH to a value greater than 12, which shift the condition of
exchanging sodium ions fare away from the zero point of charge (ZPC) for this mixture.
Unfortunately, the presence of calcium ions with sulfate ions in the pure cement sample
leads to formation of gypsum upon hydration, which blocks the microspores channels
inside this sample and consequently lowers the CEC value. The addition of 25% clay to
the specimen, however, will decrease the percentage of gypsum and plays a role of
enhancing the liquid limit and plasticity index. Thus more micro and macrospores will be
opened to improve more ion exchange on the active sites of the sample. Moreover, the
cement contains iron, magnesium and aluminum oxides besides the silica. When mixing
25% clay to 75% cement, the percentage of silica and alumina in the whole sample
becomes 30.6 and 8.4%, respectively. This is also increases the active exchangeable site
with increasing the silica and alumina content in the sample. Nevertheless, the more
increase of clay to cement ratio will decrease the total calcium oxide content and reduces
the pH to a closer value to the ZPC which leads to a sluggish reduction in the value of
CEC.
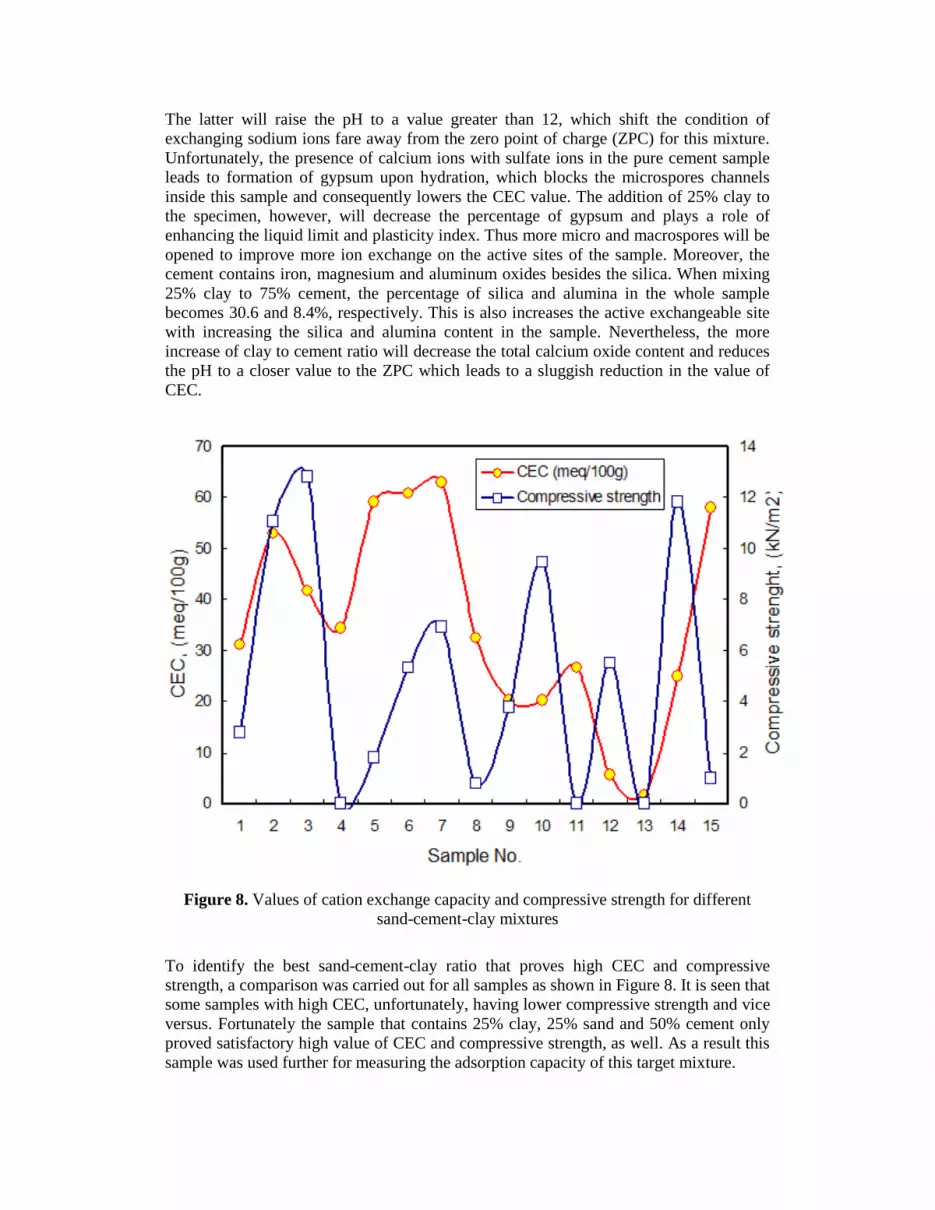
Figure 8. Values of cation exchange capacity and compressive strength for different
sand-cement-clay mixtures
To identify the best sand-cement-clay ratio that proves high CEC and compressive
strength, a comparison was carried out for all samples as shown in Figure 8. It is seen that
some samples with high CEC, unfortunately, having lower compressive strength and vice
versus. Fortunately the sample that contains 25% clay, 25% sand and 50% cement only
proved satisfactory high value of CEC and compressive strength, as well. As a result this
sample was used further for measuring the adsorption capacity of this target mixture.

Figure 9. Fitting equilibrium adsorption of lead on 25% sand, 50% cement and 25% clay
mixture
This sample was mixed with lead solution at different concentrations and allowed to
equilibrate over time. Figure 9 shows the adsorption isotherm curve for this sample. This
curve shows a maximum uptake of 192 mg Pb2+
/g solid and retains 8 mg/L in the solution
when the initial solution concentration of Pb2+
is 200 mg/L at pH value of 11.8. In this
trend it is expected that monolayer of adsorption is taken place between Pb2+
and the
actives sites on the solid matrix. To model these data, Freundlich and Redlich-Peterson
models were used. Freundlich model describes the coverage adsorbate on heterogeneous
surfaces of the solid mixture in which the heat of adsorption varies with surface coverage
as
Where Kf and n are constants and Kf is proportional to the enthalpy of the adsorption
according to:
The experimental data were fitted this model with correlation coefficient, r2=0.952 and
(error)2=810. The values Kf and n are 104.608 mg/g and 0.2672, respectively.

On the other hand, Redlich-Peterson model describes the monolayer coverage combined
with the features of Fruendlich adsorption isotherms as
Where Q, and are constants. This model gave a closer fit to the trend of experimental
data. The correlation coefficient, r2=0.952 and (error)
2=810. The values of Q, and
are 324.614, 1.772 and 0.963, respectively.
CONCLUSIONS
An effort was made to utilize a low cost adsorbent for retaining metal ions from leaching
out into water resources. This study analyzes the ability of a mixture of sand-cement-clay
mixture with mass percentages of 25% sand, 50% cement and 25% clay to encapsulate
metal ions from solution. This mass ratio proved a maximum adsorption capacity toward
lead with a high compressive strength. Clay played a role in increasing the adsorption
capacity toward lead, sand used to enhance the compressive strength while cement was
beneficial as a solidification agent to both clay and sand mixture. The advantage of
utilizing this solidification/stabilization mixture is the low cost of its raw material and a
relatively the safe treatment of this process.
REFERENCES
1. M. Matlock, B. Howerton and D. Atwood, Chemical precipitation of heavy
metals from acid mine drainage, Water Research, Volume 36, Issue 19,
November 2002, Pages 4757-4764.
2. D. Feng, C. Aldrich and H. Tan, Treatment of Acid Mine Water by Use of Heavy
Metal Precipitation and Ion Exchange, Minerals Engineering, Volume 13, Issue
6, June 2000, Pages 623-642.
3. M. Otero, L. F. Calvo, B. Estrada, A. I. García and A. Morán, Thermogravimetry
as a technique for establishing the stabilization progress of sludge from
wastewater treatment plants, Thermochimica Acta, Volume 389, Issues 1-2, 1
July 2002, Pages 121-132.
4. S. Summerfelt, P. Adler, D. Glenn and R. Kretschmann, Aquaculture sludge
removal and stabilization within created wetlands, Aquacultural Engineering,
Volume 19, Issue 2, January 1999, Pages 81-92.
5. Y. Watanabe and K. Tanaka, Innovative sludge handling through
pelletization/thickening, Water Research, Volume 33, Issue 15, October 1999,
Pages 3245-3252.
6. T. Sawai, M. Yamazaki, T. Shimokawa, M. Sekiguchi and T. Sawai,
Improvement of sedimentation and dewatering of municipal sludge by radiation,
International Journal of Radiation Applications and Instrumentation. Part C.
Radiation Physics and Chemistry, Volume 35, Issues 1-3, 1990, Pages 465-468.
7. L. Kuai, F. Doulami and W. Verstraete, Sludge treatment and reuse as soil
conditioner for small rural communities, Bioresource Technology, Volume 73,
Issue 3, July 2000, Pages 213-219.
8. J. Baeyens and F. Van Puyvelde, Fluidized bed incineration of sewage sludge: a
strategy for the design of the incinerator and the future for incinerator ash
utilization, Journal of Hazardous Materials, Volume 37, Issue 1, April 1994,
Pages 179-190.
9. S. Hong, G. Lim, B. Lee, B. Lee and J. Rho, Mechanical strength enhancement
of lower hydraulicity cementitious solid wastes using anhydrite and pozzolanic
materials, Cement and Concrete Research, Volume 29, Issue 2, February 1999,
Pages 215-221.
10. C. Coumes and S. Courtois, Cementation of a low-level radioactive waste of
complex chemistry: Investigation of the combined action of borate, chloride,
sulfate and phosphate on cement hydration using response surface methodology,
Cement and Concrete Research, Volume 33, Issue 3, March 2003, Pages 305-
316.
11. A. Osmanlioglu, Immobilization of radioactive waste by cementation with
purified kaolin clay, Waste Management, Volume 22, Issue 5, August 2002,
Pages 481-483.
12. S. Moya, G. Sukhorukov, M. Auch, E. Donath and H. Möhwald,
Microencapsulation of Organic Solvents in Polyelectrolyte Multilayer
Micrometer-Sized Shells, Journal of Colloid and Interface Science, Volume 216,
Issue 2, 15 August 1999, Pages 297-302.
13. M. Arocha, B. McCoy and A. Jackman, VOC immobilization in soil by
adsorption, absorption and encapsulation, Journal of Hazardous Materials,
Volume 51, Issues 1-3, November 1996, Pages 131-149.
14. C. Rha, S. Kang and C. Kim, Investigation of the stability of hardened slag paste
for the stabilization/solidification of wastes containing heavy metal ions, Journal
of Hazardous Materials, Volume 73, Issue 3, 28 April 2000, Pages 255-267.
15. D. Sun, X. Li, M. Brungs and D. Trimm, Encapsulation of heavy metals on spent
fluid catalytic cracking catalyst, Water Science and Technology, Volume 38,
Issues 4-5, 1998, Pages 211-217.
16. B. Silveira, A. Dantas, J. Blasques and R. Santos, Effectiveness of cement-based
systems for stabilization and solidification of spent pot liner inorganic fraction,
Journal of Hazardous Materials, Volume 98, Issues 1-3, 17 March 2003, Pages
183-190.
17. G. Buvaneswari and U. Varadaraju, Low leachability phosphate lattices for
fixation of select metal ions, Materials Research Bulletin, Volume 35, Issue 8, 1
June 2000, Pages 1313-1323.
18. A. Jang and I. Kim, Solidification and stabilization of Pb, Zn, Cd and Cu in
tailing wastes using cement and fly ash, Minerals Engineering, Volume 13,
Issues 14-15, December 2000, Pages 1659-1662.

19. J. Naji, The Use of Lime to Stabilize Granular Volcanic Ash Materials for Road
Construction, Journal of Science and Technology–Yemen, Volume 7 Number
2, 2002.
20. I. Smiciklas , S. Milonjic, P. Pfendt, S. Raicevic, The point of zero charge and
sorption of cadmium (II) and strontium (II) ions on synthetic hydroxyapatite,
Separation and Purification Technology, Volume 18, Issue 3, 1 May 2000, Pages
185-194.
© 2004 ejge