emerging conceptual understandings in gis investigations
TRANSCRIPT
Paper 4: Emerging conceptual understandings in GIS investigations
Authors: University of Illinois at Chicago: Susan Goldman
Josh Radinsky Rita Sacay Melissa Singer Sonia Oliva Francis Allende-Pellot Ivan Liceaga
Presenter: Susan Goldman Paper presented at the Annual Meeting of the American Educational Research Association, April 10, 2006, San Francisco, CA. Paper 4 of a 4-paper symposium: Teaching and Learning Middle-Grades Science with G.I.S.: Multiple research perspectives on learning with visual data
AERA06GIS_paper4.doc 3/29/2006 pg. 1 of 25
This paper focuses on what students learned from the 10-week Earth Structures and
Processes unit. More specifically, it focuses on the kinds of conceptual understandings students
acquired over the course of the unit. Key questions for this paper are
• What are appropriate ways to assess what students know and can do? (different kinds of
knowledge, different opportunities to learn, different outcomes)
• What are the affordances of different kinds of assessments for revealing what students
know and can do? (What do we, can we find out about from different assessment tasks?)
• What are the benefits and challenges of integrating information from multiple forms of
assessment?
Addressing these questions is a challenging and complex endeavor for two major reasons.
First, the unit introduced concepts in plate tectonics that are not typically taught at the middle
school level – in some cases, not until undergraduate earth science courses. Second, over the
course of the unit there were a variety of opportunities to learn the key concepts and a variety of
opportunities for students to make their thinking visible, making the assessment task complex.
We adopted a strategy for assessing learning that relies on a set of assessments for purposes
of triangulating on characterizations of students’ learning. We first elaborate on our rationale by
addressing the first two questions. Student learning is then examined and we conclude by
considering the benefits and challenges of this strategy.
Appropriate forms of assessment
The concepts in the unit are complex and interrelated, as described in Paper 1. The mini-
lessons and the materials provided students with declarative knowledge: definitions (e.g.,
elevation, crust) and accepted scientific explanations (e.g., earthquakes occur at plate boundaries,
ways in which plates move). The small group work with GIS gave students access to complex
AERA06GIS_paper4.doc 3/29/2006 pg. 2 of 25
datasets with which they could engage with the data in ways that scientists do. They had to apply
the declarative knowledge to solve a problem: identify the plate boundaries and the direction of
movement of the plates in the part of the world they were assigned to examine, and prepare a
presentation for the class that provided the evidence for the claims they made about the boundaries
and direction of movement. Students were asked to solve these problems not with schematic or
idealized data representations, but in the context of the complex, messy world of actual data – the
kind of data with which scientists deal.
The My World GIS environment and what Leimberer et al. refer to as the “Top 10”
instructional design (Paper 1; Radinsky, Mundt et al, 1999) make the complexity tractable for
students at the middle school level. This instructional strategy means that students focus intensely
on the subset of concepts that are relevant to their part of the world. Opportunities to learn
concepts relevant to other parts of the world come through mini-lessons and from active listening
during the group presentations and whole-class discussion. Thus, while all students have access to
a similar body of information, the fact that they focus in-depth on different geographic areas means
that they have opportunities to learn some things more deeply than others. As well, the teacher
circulates among the groups scaffolding the learning process in different ways depending on the
group.
Group work itself presents several challenges for the design of assessments. Group
discourse makes public the process of constructing knowledge, or at least part of that process. But
the discourse of the group may only incompletely or imperfectly reflect individuals’ thinking and
learning. Group members participate in different ways. Some may express their ideas regardless of
what others in the group think. Other group members may not say what they think because it might
not agree with what’s been said, they are not confident of their ideas, or they do not wish to
AERA06GIS_paper4.doc 3/29/2006 pg. 3 of 25
challenge. Although form of participation is likely to have important implications for learning,
there is little empirical evidence for how. For example, a “quiet” member may be quite actively
learning from the conversations of the other members of the group. Amount of participation does
not necessarily equal quality of participation, nor quality of learning.
Affordances of Assessments
Different forms of assessment have different affordances for eliciting knowledge from
students. These affordances are related to three important dimensions on which assessments can
differ: format of questions, the type of questions, and the situation in which questions are posed
(Goldman, 1985; Goldman & Durán, 1988; Goldman, Varma, & Sharp, 1999).
The format of questions places different task demands on students and these may interact
with the understanding that students can demonstrate. For example, multiple choice questions
require that students recognize the “best option” from among a set of options. However, there are
often complex linguistic and conceptual distinctions that students must understand for appropriate
“recognition.” Students with a dominant language different from the language of instruction
and/or the language of the assessment may be particularly disadvantaged on these kinds of tests.
Other forms of forced-choice questions (e.g., yes/no, true/false, fill-in-the-blank) that do not
require justification often reflect chance responding.
In contrast, free-response tasks (open-ended, essay, extended response questions) allow
students wide latitude in interpretation of the question and in how they answer, especially if
responses are written. However, they require students to retrieve and produce information, a
process thought to be more resource-demanding than recognition (Kintsch, 1974). For English
language learners, questions may be provided in students’ dominant language; likewise for
responses (cf. Goldman, Reyes, & Varnhagen, 1984). Whether responses to open-ended questions
AERA06GIS_paper4.doc 3/29/2006 pg. 4 of 25
over- or under-estimate what a student knows is difficult to predict. On the one hand, they do not
constrain the student to decide which of several alternatives is the most correct. On the other hand,
retrieving and producing the response may hamper students from demonstrating what they know.
Different kinds of questions also elicit different kinds of knowledge. For example,
questions may ask for different kinds of information about a concept or phenomenon. Questions
that ask what something is, how a process works, or to identify components of phenomena have a
high probability of eliciting declarative, descriptive information. This type of information often
reflects more fragmentary understanding than does explanatory information. Questions that ask
why a process works or that ask for justifications of answers (e.g., Why or Why not?) are more
likely to elicit students systemic understanding of phenomena. Knowledge that is organized in
terms of causal relations and mechanisms is more coherent and more closely resembles the way in
which domain experts organize their knowledge (cf. Chi, Glaser, & Farr, 1988).
Finally, the situation or context of the assessment often affects the knowledge students are
able to demonstrate. At one extreme, the same set of questions can be administered to a set of
students, with a specific and fixed time limit. Such a situation favors students who can quickly
retrieve information and formulate a response. Yet, such responding is not always indicative of
understanding. This form of assessment is frequently referred to as objective because everyone is
under the same constraints. Even if one accepts the use of the word objective and its connotations,
this is not synonymous with fair or appropriate assessment. On the other hand, open-ended
interviews in which a student interacts with an examiner may create a richer picture of what
students know, but in extreme cases this knowledge may be co-constructed with the examiner.
For some purposes (e.g., dynamic assessment) this is not a problem. But for purposes of
making judgment about what students have learned it is less than ideal. A better choice is a
AERA06GIS_paper4.doc 3/29/2006 pg. 5 of 25
structured interview in which a standard set of prompts and follow-up probe questions are used
more uniformly. Structured interviews allow the examiner to follow-up on students’ responses
without providing information to students, and potentially doing so differentially. This process
often yields rich information about what students know.
Group assessment situations such as the discourse of small groups or presentations
prepared and made by a group provide indirect indicators of what individual students know. For
small group discourse, fine-grained analyses over time can often lead to important insights into the
knowledge that is being constructed by the group as well as the knowledge “owned” by individuals
in the group (Radinsky, 2000; Enyedy, 2003).
Thus, the design of assessments of learning in complex conceptual and instructional
situations, such as this 10 week earth science unit, need to be sensitive to variations in learning
opportunities among students as well as to the learning objectives for all students. Decisions about
ways to assess what students know and can do need to draw on a set of assessments (or system of
assessments) that allows triangulation regarding student learning (Pellegrino, Chudowsky, &
Glaser, 2001). In the present context we focus on four kinds of assessments of learning: two are
individual assessments (post-unit structured interview and unit test), one samples the small group
discourse during the last week of instruction, and one draws on the student group presentations.
The Earth Structures Unit: Assessment Tasks and their Affordances
The enactments of the earth structures unit included two classrooms, both taught by Carlos
Rodriguez. In each classroom we focused on groups of three students each. In the present context
we discuss data on three of the assessment tasks derived from two of the groups (one from each
class) and for the fourth assessment task we include an additional, randomly selected group of five
students.
AERA06GIS_paper4.doc 3/29/2006 pg. 6 of 25
Assessment 1: Post-unit Structured Interview. This assessment was administered in a
one-on-one situation. A researcher who had observed the classroom during the course of the unit
individually interviewed the students. Questions and responses were oral and students selected the
language (English or Spanish) used during the interview. Interviews ranged from 30 to 45 minutes.
Students were asked a series of direct questions that probed their knowledge of basic map reading
and geography knowledge and their conceptions of earth structures. For the basic map reading and
geography knowledge they were show an unlabeled map of the world color-coded for elevation
and ocean depth. They were asked to name and point to anything on the map they recognized.
Subsequent probes asked them specifically for continents, oceans, and mountains. Questions about
earth structures asked a set of direct questions about oceans, mountains, earthquakes, volcanoes,
and plates. The questions about oceans focused on knowledge of formations in oceans related to
depth (e.g., Where is the ocean deep? Why is it deep there?). The questions about mountains,
earthquakes, and volcanoes asked students what they were, where they were located, how they
came to be, why they thought so, why they were in some places of the world but not in others, and
if there was any information they could check to see if their idea was accurate. They were asked
what they thought plate tectonics meant, what a plate was, and to point to where they thought a
plate might be on the map.
We intentionally did not ask any direct questions about the relations among the earth
structures, nor about plate movement as a causal mechanism underlying all of the earth structures.
Instead, the questions on the interview were intentionally designed to provide opportunities for
students to spontaneously show their understanding of the causal mechanisms. When present in the
interview data this is strong evidence that students understood the role of plate movement but we
cannot draw strong conclusions about absence based on the interview data. Thus, although students
AERA06GIS_paper4.doc 3/29/2006 pg. 7 of 25
were asked direct questions on the interview, they were only indirectly asked about issues of plate
movement, plate boundaries, and causal mechanisms. The present data set includes structured
interviews with 11 students. Two researchers independently watched the tape of the interview,
along with a typed transcript, and coded which concepts were present and where. Reliability on
decisions about presence of concepts was above 90%.
Assessment 2: Unit Test. The unit test was an individually administered paper and pencil
test. Students were asked to describe concepts, indicate the direction of plate movement for four
types of zones, and to look at three regions of the earth believed to be boundaries between plates.
(See Appendix A). They had to show the plate boundary, indicate the direction the plates were
moving, what kind of boundary it was, and why they thought that. Students chose between Spanish
or English versions of the test, and also wrote responses in their choice of language. The present
data set encompasses the unit tests of the six students in the two small groups. Two researchers
reached consensus on whether the responses indicated standard (i.e. accepted scientific
interpretation) identification of boundaries, labels, and plate movement as well as the evidence for
their response. Responses were scored as standard, partial, or non-standard.
Assessment 3: Student Group Final Presentation. Each of the two focal groups’
presentations involved describing where they thought the plate boundary for their region was and
the direction of plate movement. They were asked to provide the evidence on which they had
based their conclusions. In each group, one student took the role of presenter. However, the teacher
addressed questions to each individual member of the group. The presentation provides evidence
of what the group had constructed as a whole but because of the individual questions also provides
information about some aspects of the understanding of individual group members. Two
AERA06GIS_paper4.doc 3/29/2006 pg. 8 of 25
researchers reached consensus on whether the responses indicated standard, partial, non-standard,
or no evidence of the key ideas.
Assessment 4: Small Group Discourse. The small group discourse reflects co-constructed
understanding. However, it is possible to trace what different individuals brought to the discussion
and how persistent certain contributions were over time. For purposes of examining what was
learned by the end of the unit, the present data set includes analyses of any discourse on the last
two days of group work that included mention of any of the key concepts (the earth structures
questioned in the interview plus trenches and the four types of plate boundary zones) by any of the
students. Note that “mention” includes gestural mention because the small group discourse was
coded for information conveyed verbally as well as gesturally. Two independent researchers coded
the transcripts accompanied by video of them using the system described by Radinsky, et al.
(Paper 2 this symposium). Reliability for the codes used in this analysis (“key concept” and
“explanatory model”) was .82 and .92, respectively.
Results and Discussion
The four assessments afford different windows into students’ knowledge. They require that
students apply their knowledge in different ways. Nevertheless, concepts and principles that are
understood robustly might be expected to transcend the particular affordances of the individual
assessments. On the other hand, understandings that are in a more fragile or emergent state might
be evident only in assessment contexts that are close matches to the learning context. The closest
match would be when students are working within the GIS environment. However, in the present
work, the small group discourse comes the closest to the original context of learning in that we did
not assess students on their skills at manipulating the GIS environment itself.
AERA06GIS_paper4.doc 3/29/2006 pg. 9 of 25
We first discuss the picture of learning that emerges across the 11 students for whom we
had interview data. We then turn to patterns of data across the four assessments for the two focal
groups of students.
What did most students learn from the unit?
The interview data indicate that students learned several important concepts at earth
structures that they had not known beforehand. Although we did not have pre-unit interviews from
these students we do have pre-unit interview data from a second cohort of students in the same
school for comparison purposes.
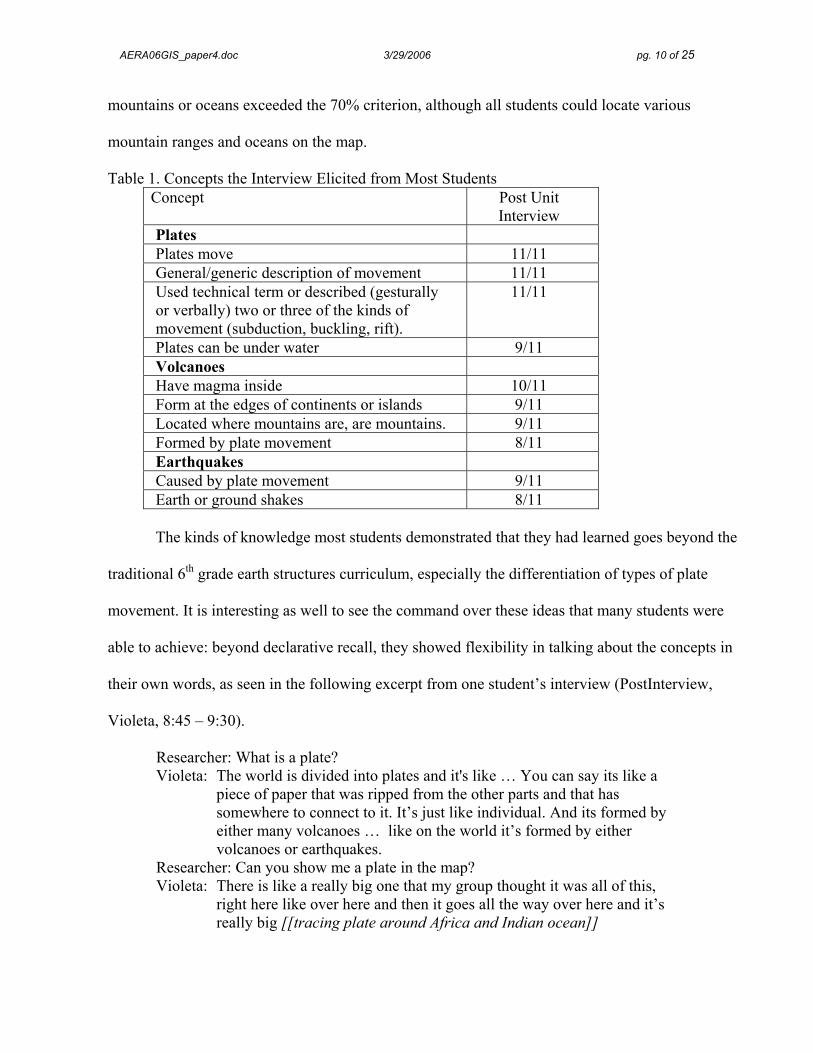
Table 1 lists the concepts for which 70% or more of the students (8 out of 11) provided
evidence of understanding during the structured interview. All students reported that plates move
and described that movement in general terms like connecting with, crashing into, or contacting
one another at plate boundaries. As well, all students were able to use two or three of the technical
terms for the zones created by different kinds of plate movement. There was however variation in
accuracy and completeness of the understanding of these terms as manifest in the interview.
Finally, 81% of the students talked about plates being underwater. Of note is that these concepts
about plates are infrequently reported by students in pre-unit interviews (in later enactments).
Sixth grade students generally come to the earth structures unit with greater knowledge of
volcanoes, earthquakes, and mountains than of plates. For example, pre-unit interview data from a
different group of students indicated that most students know that magma is inside volcanoes, that
they tend to be located in mountains, and that earthquakes make the ground shake. What most
students learned about volcanoes is that they often form at the edges of continents or islands and
that they are formed by plate movement. (See Table 1.) Thus, in general, most students made the
connection between plate movement and these two earth structures. Note that no information about
AERA06GIS_paper4.doc 3/29/2006 pg. 10 of 25
mountains or oceans exceeded the 70% criterion, although all students could locate various
mountain ranges and oceans on the map.
Table 1. Concepts the Interview Elicited from Most Students Concept Post Unit
Interview Plates Plates move 11/11 General/generic description of movement 11/11 Used technical term or described (gesturally or verbally) two or three of the kinds of movement (subduction, buckling, rift).
11/11
Plates can be under water 9/11 Volcanoes Have magma inside 10/11 Form at the edges of continents or islands 9/11 Located where mountains are, are mountains. 9/11 Formed by plate movement 8/11 Earthquakes Caused by plate movement 9/11 Earth or ground shakes 8/11
The kinds of knowledge most students demonstrated that they had learned goes beyond the
traditional 6th grade earth structures curriculum, especially the differentiation of types of plate
movement. It is interesting as well to see the command over these ideas that many students were
able to achieve: beyond declarative recall, they showed flexibility in talking about the concepts in
their own words, as seen in the following excerpt from one student’s interview (PostInterview,
Violeta, 8:45 – 9:30).
Researcher: What is a plate? Violeta: The world is divided into plates and it's like … You can say its like a
piece of paper that was ripped from the other parts and that has somewhere to connect to it. It’s just like individual. And its formed by either many volcanoes … like on the world it’s formed by either volcanoes or earthquakes.
Researcher: Can you show me a plate in the map? Violeta: There is like a really big one that my group thought it was all of this,
right here like over here and then it goes all the way over here and it’s really big [[tracing plate around Africa and Indian ocean]]
AERA06GIS_paper4.doc 3/29/2006 pg. 11 of 25
In this response, the student shows understanding of the way plates are individual yet connected
around the planet, and though it is not entirely clear what she means by “formed” in this context, it
is clear that she connects plates with volcanic and earthquake activity.
Beyond these understandings, her answer to the prompt “Can you show me a plate” is
impressive. The map she is looking at does not contain any earthquake or volcano data, so her
pointing out the plate location is from memory of the investigation. Furthermore it is impressive
that a 6th grader is comfortable answering this type of question by saying “my group thought,” and
repeating an interpretation developed by her group, rather than feeling that the only appropriate
answer would be to repeat facts learned from the teacher or a textbook. This suggests a sense of
agency in generating scientific knowledge, a sense that science knowledge is constructed rather
than given. This was a specific learning objective of the teacher: to develop students’ sense of
agency as scientific inquirers.
Knowledge at the boundaries: Emergent understandings
For the remainder of this paper we will turn from the body of solid knowledge
displayed by most students in this project, and examine the more complex concepts that were at the
boundaries of students’ understandings – e.g., distinctions among subduction, rift and buckling
zones, in terms of accepted explanatory models and associated multi-variable data patterns. It is
important to note that teachers of Earth Structures generally see this level of comprehension as
something their students will grapple with but are unlikely to master. For the teacher of this
enactment, his emphasis was on students developing the ability to coordinate evidence from data
with a coherent explanation developed by the students in their group. “Correct” identification of
the plate boundary zones was a focus of instruction, but not a primary learning objective. Students
were assessed highly if they communicated an explanation that was supported by data, even if the
AERA06GIS_paper4.doc 3/29/2006 pg. 12 of 25
explanation was on their own terms (“non-standard”) and different from the accepted scientific
one.
Although most students could tell us that plate movement caused volcanoes and earthquakes,
the more nuanced details and connections to different types of plate movement did not surface very
much in the interviews. We looked to the three other assessments, as well as at the interviews, for
evidence of whether students were developing understandings of some of the more complex
relationships among patterns of data, especially those involving multiple variables (e.g., presence of
earthquakes, absence of volcanoes, continental versus oceanic plates) and key ideas related to causal
mechanisms. Table 2 summarizes these key ideas.
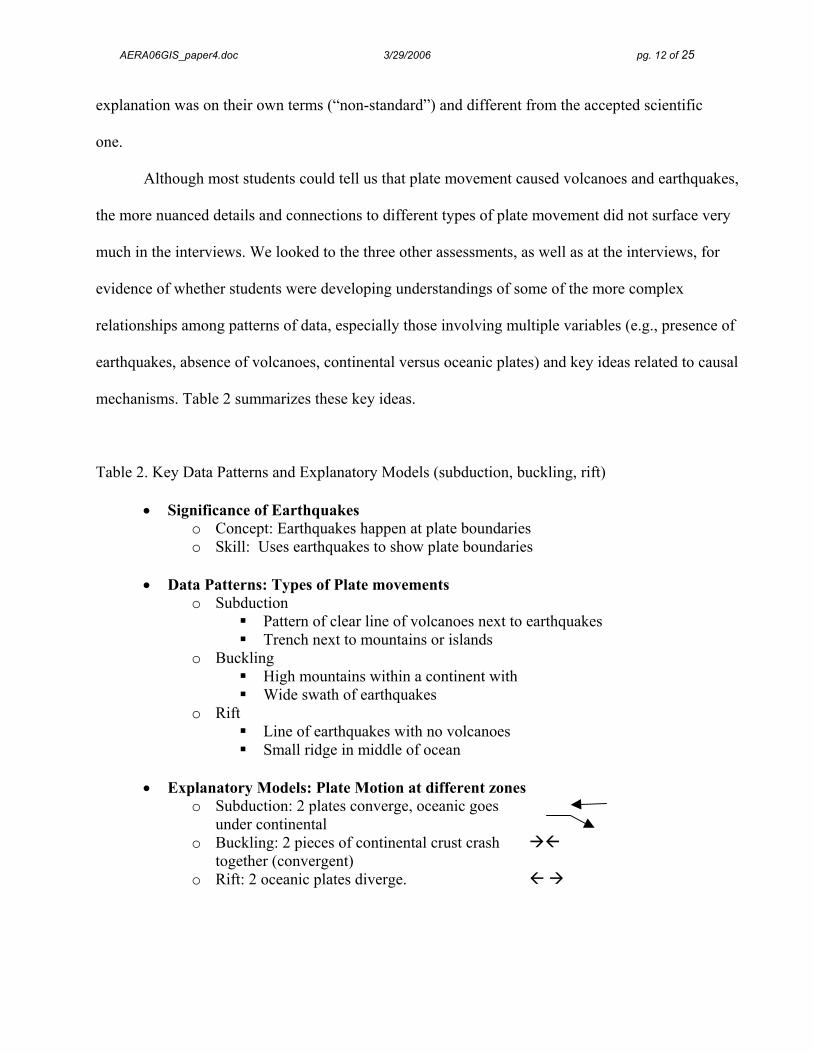
Table 2. Key Data Patterns and Explanatory Models (subduction, buckling, rift)
• Significance of Earthquakes o Concept: Earthquakes happen at plate boundaries o Skill: Uses earthquakes to show plate boundaries
• Data Patterns: Types of Plate movements o Subduction
Pattern of clear line of volcanoes next to earthquakes Trench next to mountains or islands
o Buckling High mountains within a continent with Wide swath of earthquakes
o Rift Line of earthquakes with no volcanoes Small ridge in middle of ocean
• Explanatory Models: Plate Motion at different zones
o Subduction: 2 plates converge, oceanic goes under continental
o Buckling: 2 pieces of continental crust crash together (convergent)
o Rift: 2 oceanic plates diverge.
AERA06GIS_paper4.doc 3/29/2006 pg. 13 of 25
We examined the four assessments to determine whether they provided evidence of these key
ideas. If present, we determined whether the information was standard (i.e., aligned with accepted
scientific interpretation), partial (i.e. incorporating aspects of the accepted scientific interpretation),
or non-standard (i.e., different from accepted scientific interpretation). We do not present here an
analysis of the internal coherence of students’ explanations independent of the accepted scientific
interpretation, though this would be a valuable and relevant extension of this analysis.
We conducted these analyses expecting that the different affordances of the assessments
would be reflected in the patterns of evidence obtained for each key idea. We focused on two groups
of students for these analyses. One group had the area of the earth around Japan, a subduction zone.
The other group had Italy through India and central Asia, an area where there is a lot of earthquake
activity. This is a buckling zone. Thus, an additional issue in these analyses was the degree to which
command of the big ideas was affected by the area on which the group focused.
Significance of Earthquakes. The big idea that earthquakes happen at plate boundaries was
presented as didactic information in the mini-lessons. The interviews provided clear evidence that
students’ “knew” this information in a declarative sense: when directly asked where earthquakes are
they could access the appropriate information. The other three assessment situations called on
students to use that information to locate plate boundaries and explain why they located the
boundary where they did. The pattern of evidence indicates that the three assessments provide a
relatively consistent picture of students’ understanding of this concept. However, as can be seen in
Table 3, the use of earthquakes to locate plate boundaries was also related to the region that the
groups studied: evidence regarding the ability to use earthquakes to find plate boundaries was more
prevalent in the Italy group than in the Japan group.
AERA06GIS_paper4.doc 3/29/2006 pg. 14 of 25
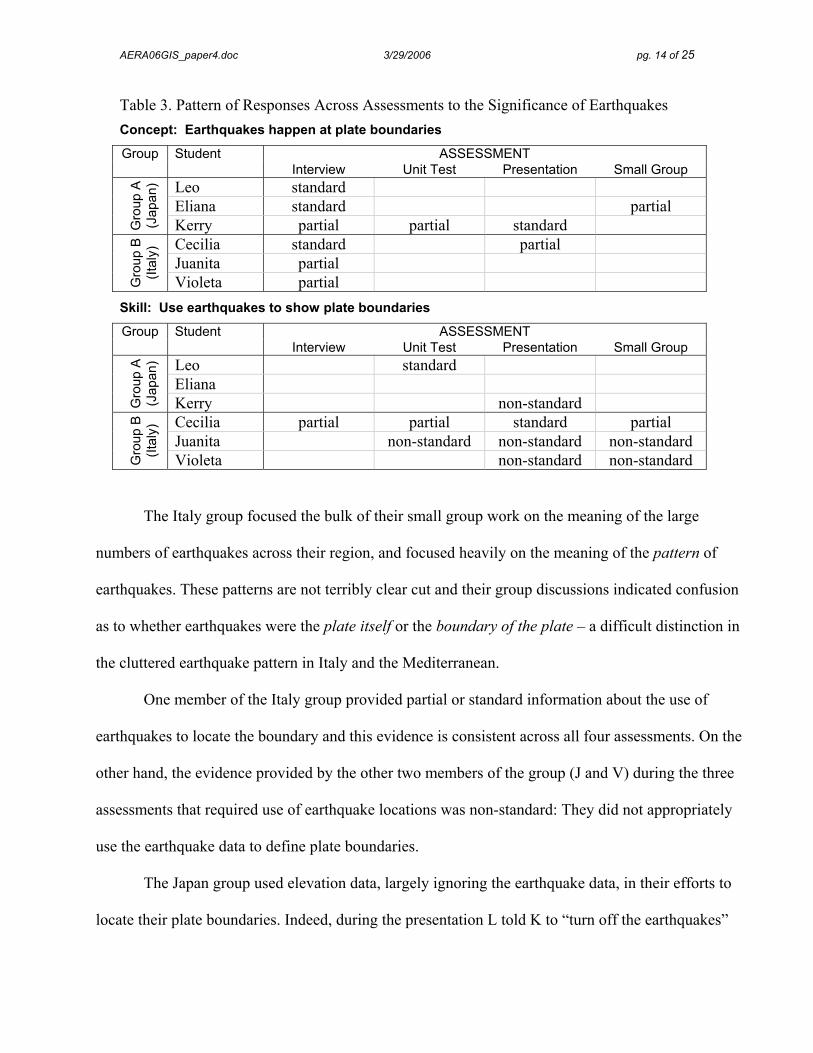
Table 3. Pattern of Responses Across Assessments to the Significance of Earthquakes Concept: Earthquakes happen at plate boundaries
ASSESSMENT Group Student Interview Unit Test Presentation Small Group
Leo standard Eliana standard partial
Gro
up A
(J
apan
)
Kerry partial partial standard Cecilia standard partial Juanita partial
Gro
up B
(It
aly)
Violeta partial Skill: Use earthquakes to show plate boundaries
ASSESSMENT Group Student Interview Unit Test Presentation Small Group
Leo standard Eliana
Gro
up A
(J
apan
)
Kerry non-standard Cecilia partial partial standard partial Juanita non-standard non-standard non-standard
Gro
up B
(It
aly)
Violeta non-standard non-standard
The Italy group focused the bulk of their small group work on the meaning of the large
numbers of earthquakes across their region, and focused heavily on the meaning of the pattern of
earthquakes. These patterns are not terribly clear cut and their group discussions indicated confusion
as to whether earthquakes were the plate itself or the boundary of the plate – a difficult distinction in
the cluttered earthquake pattern in Italy and the Mediterranean.
One member of the Italy group provided partial or standard information about the use of
earthquakes to locate the boundary and this evidence is consistent across all four assessments. On the
other hand, the evidence provided by the other two members of the group (J and V) during the three
assessments that required use of earthquake locations was non-standard: They did not appropriately
use the earthquake data to define plate boundaries.
The Japan group used elevation data, largely ignoring the earthquake data, in their efforts to
locate their plate boundaries. Indeed, during the presentation L told K to “turn off the earthquakes”
AERA06GIS_paper4.doc 3/29/2006 pg. 15 of 25
in the GIS software. The three students in the Japan group provided little evidence in any of the
assessments that they could use earthquakes to locate the plate boundaries. The one exception was
that L used them correctly in identifying the regions on the unit test. It is interesting that this group
was able to identify plate boundaries in the absence of showing evidence of the use of earthquake
data. They may not have shown evidence of using earthquakes due to the simplicity of the task in
their region of the Pacific (a clear line of earthquakes). In the absence of anything problematic about
locating the plate boundary in this region, evidence of mastery or lack thereof may simply not be
present in these data.
In brief, although students could state that earthquakes are located at plate boundaries,
evidence of their skill at using that knowledge to locate plate boundaries was limited. Our
confidence in this conclusion stems from the consistency with which the set of assessments indicates
the standard, partial, non-standard or absent evidence of this concept.
Data Patterns and Plate Movement: Knowledge of Three Types of Zones. The remaining
big ideas relate to using patterns of data on earthquakes, volcanoes, and elevation to distinguish
among three types of zones formed by different plate movements: subduction, buckling, and rift. We
organize the data around knowledge of each type of zone.
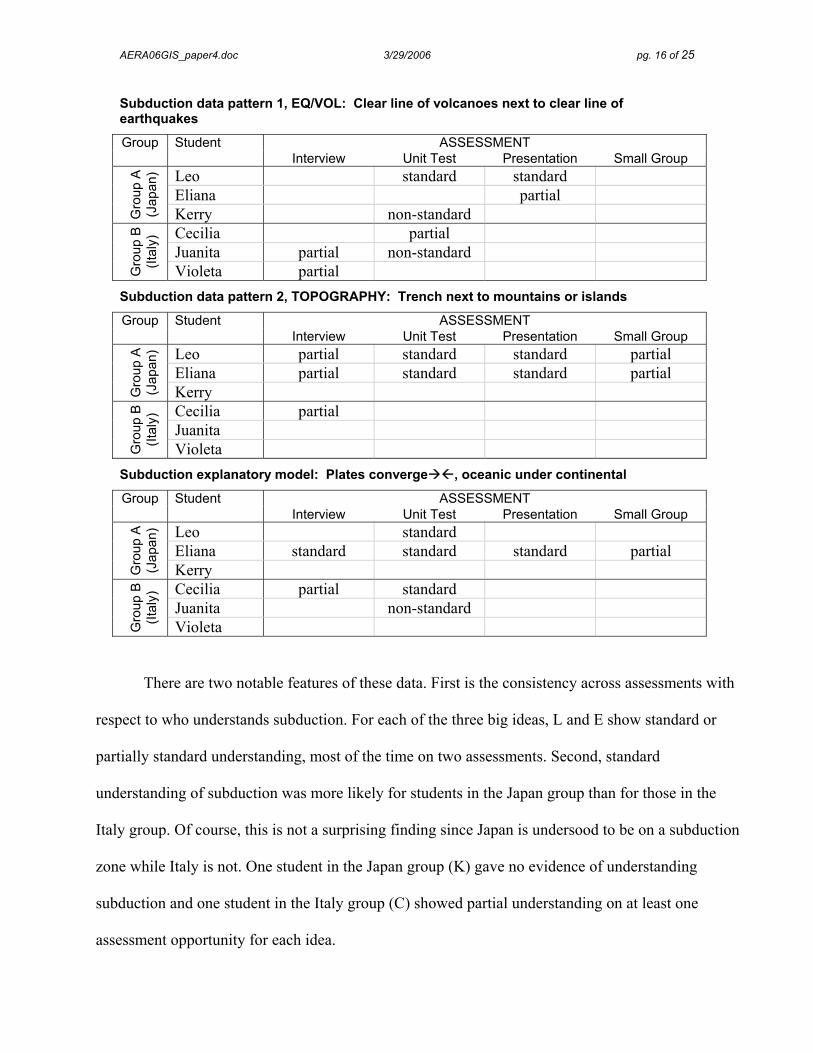
Subduction Zone. Table 4 provides the pattern of responding across the three big ideas
associated with subduction.
Table 4. Pattern of Responding on the Subduction Zone Big Ideas
AERA06GIS_paper4.doc 3/29/2006 pg. 16 of 25
Subduction data pattern 1, EQ/VOL: Clear line of volcanoes next to clear line of earthquakes
ASSESSMENT Group Student Interview Unit Test Presentation Small Group
Leo standard standard Eliana partial
Gro
up A
(J
apan
)
Kerry non-standard Cecilia partial Juanita partial non-standard
Gro
up B
(It
aly)
Violeta partial Subduction data pattern 2, TOPOGRAPHY: Trench next to mountains or islands
ASSESSMENT Group Student Interview Unit Test Presentation Small Group
Leo partial standard standard partial Eliana partial standard standard partial
Gro
up A
(J
apan
)
Kerry Cecilia partial Juanita
Gro
up B
(It
aly)
Violeta Subduction explanatory model: Plates converge , oceanic under continental
ASSESSMENT Group Student Interview Unit Test Presentation Small Group
Leo standard Eliana standard standard standard partial
Gro
up A
(J
apan
)
Kerry Cecilia partial standard Juanita non-standard
Gro
up B
(It
aly)
Violeta
There are two notable features of these data. First is the consistency across assessments with
respect to who understands subduction. For each of the three big ideas, L and E show standard or
partially standard understanding, most of the time on two assessments. Second, standard
understanding of subduction was more likely for students in the Japan group than for those in the
Italy group. Of course, this is not a surprising finding since Japan is undersood to be on a subduction
zone while Italy is not. One student in the Japan group (K) gave no evidence of understanding
subduction and one student in the Italy group (C) showed partial understanding on at least one
assessment opportunity for each idea.
AERA06GIS_paper4.doc 3/29/2006 pg. 17 of 25
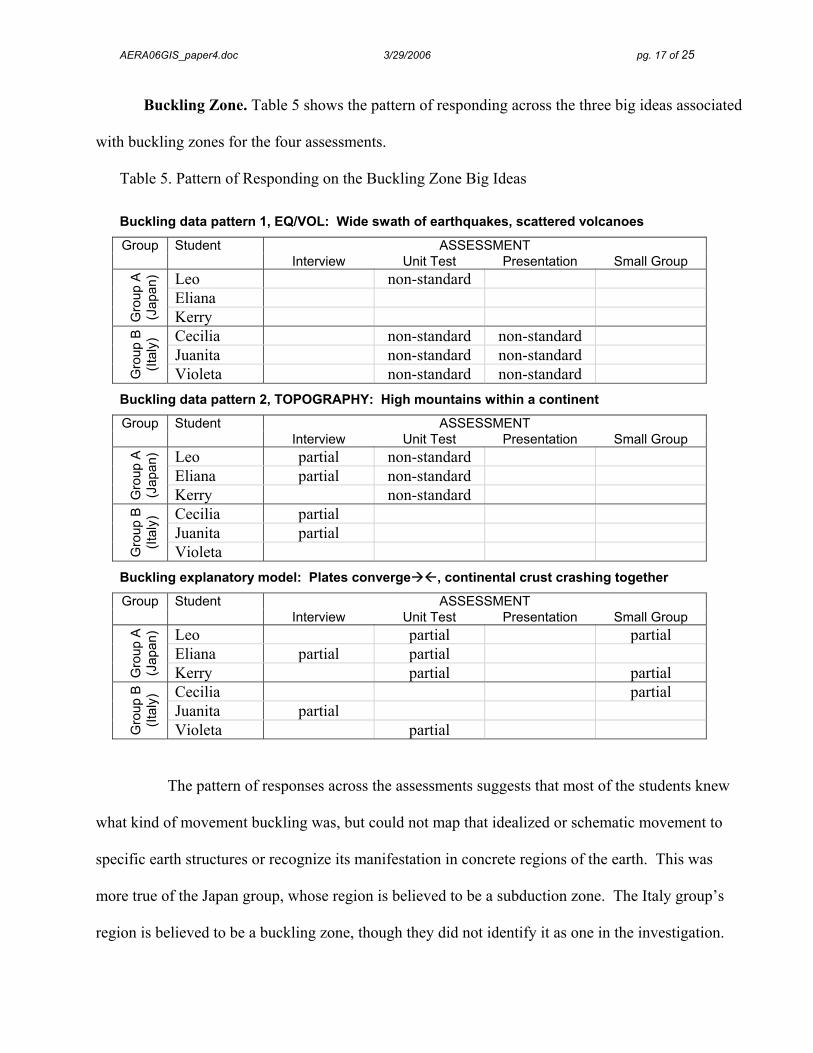
Buckling Zone. Table 5 shows the pattern of responding across the three big ideas associated
with buckling zones for the four assessments.
Table 5. Pattern of Responding on the Buckling Zone Big Ideas
Buckling data pattern 1, EQ/VOL: Wide swath of earthquakes, scattered volcanoes
ASSESSMENT Group Student Interview Unit Test Presentation Small Group
Leo non-standard Eliana
Gro
up A
(J
apan
)
Kerry Cecilia non-standard non-standard Juanita non-standard non-standard
Gro
up B
(It
aly)
Violeta non-standard non-standard Buckling data pattern 2, TOPOGRAPHY: High mountains within a continent
ASSESSMENT Group Student Interview Unit Test Presentation Small Group
Leo partial non-standard Eliana partial non-standard
Gro
up A
(J
apan
)
Kerry non-standard Cecilia partial Juanita partial
Gro
up B
(It
aly)
Violeta Buckling explanatory model: Plates converge , continental crust crashing together
ASSESSMENT Group Student Interview Unit Test Presentation Small Group
Leo partial partial Eliana partial partial
Gro
up A
(J
apan
)
Kerry partial partial Cecilia partial Juanita partial
Gro
up B
(It
aly)
Violeta partial
The pattern of responses across the assessments suggests that most of the students knew
what kind of movement buckling was, but could not map that idealized or schematic movement to
specific earth structures or recognize its manifestation in concrete regions of the earth. This was
more true of the Japan group, whose region is believed to be a subduction zone. The Italy group’s
region is believed to be a buckling zone, though they did not identify it as one in the investigation.
AERA06GIS_paper4.doc 3/29/2006 pg. 18 of 25
All of the students on at least one assessment showed partial understanding that buckling
involved convergence of two plates, though they were not specific about continental crust (see
bottom panel of Table 5.) Four of the six indicated during the interview that high mountains were
associated with buckling zones but none of the students understood the kind of earthquake pattern
that was associated with this zone. One might have expected that the Italy group would have
understood this, since scientists believe their area to be on a buckling zone. However, their
discussions in small group showed a high degree of confusion about what the earthquake patterns in
their region implied about the zone. Hence, it is not surprising that in their presentation and on the
Unit Test they provided evidence of a non-standard interpretation of the meaning of a scattered
earthquake pattern.
Rift Zone. Table 6 shows that none of these six students had a grasp of the data patterns
associated with rift zones. (See top two panels in Table 6.) In terms of the explanatory model of
direction of plate movement at rift zones, four of the students showed partial understanding on at
least one assessment. However, three of these students also provided evidence of a non-standard
understanding (on another assessment) of the plate movement associated with a rift zone.
Understanding of these concepts is clearly rather shaky for students in these two groups (neither of
which studied a rift zone).
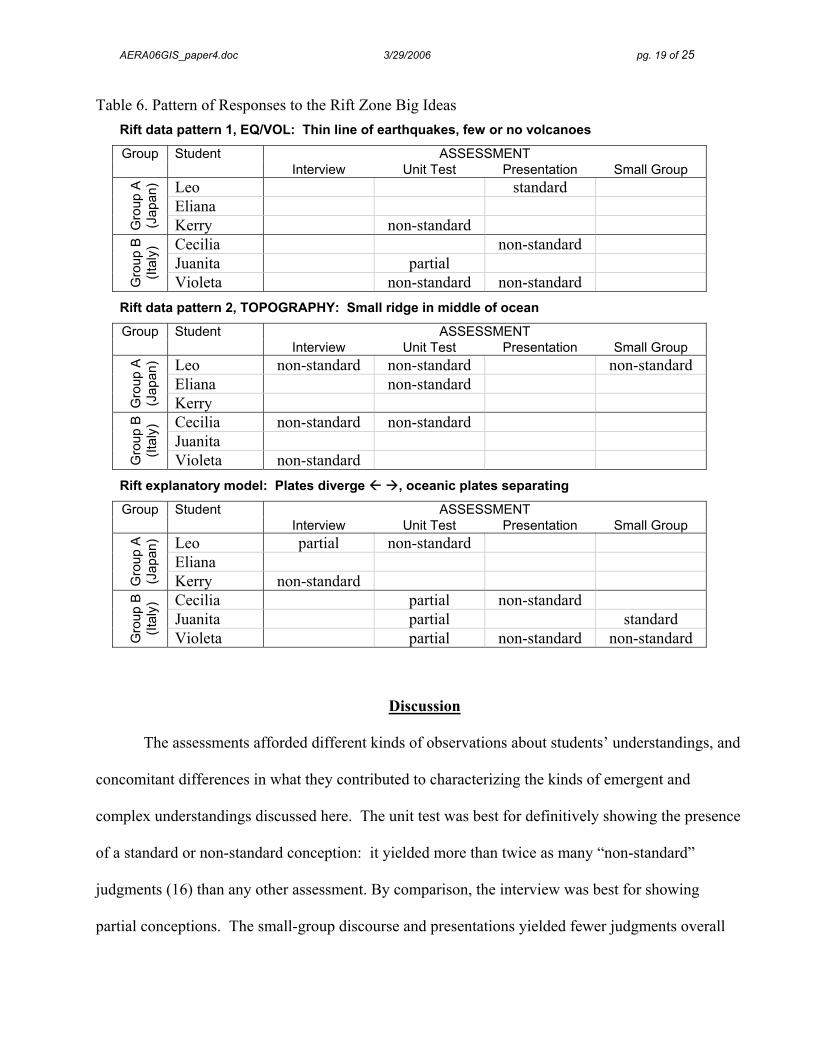
AERA06GIS_paper4.doc 3/29/2006 pg. 19 of 25
Table 6. Pattern of Responses to the Rift Zone Big Ideas Rift data pattern 1, EQ/VOL: Thin line of earthquakes, few or no volcanoes
ASSESSMENT Group Student Interview Unit Test Presentation Small Group
Leo standard Eliana
Gro
up A
(J
apan
)
Kerry non-standard Cecilia non-standard Juanita partial
Gro
up B
(It
aly)
Violeta non-standard non-standard Rift data pattern 2, TOPOGRAPHY: Small ridge in middle of ocean
ASSESSMENT Group Student Interview Unit Test Presentation Small Group
Leo non-standard non-standard non-standard Eliana non-standard
Gro
up A
(J
apan
)
Kerry Cecilia non-standard non-standard Juanita
Gro
up B
(It
aly)
Violeta non-standard Rift explanatory model: Plates diverge , oceanic plates separating
ASSESSMENT Group Student Interview Unit Test Presentation Small Group
Leo partial non-standard Eliana
Gro
up A
(J
apan
)
Kerry non-standard Cecilia partial non-standard Juanita partial standard
Gro
up B
(It
aly)
Violeta partial non-standard non-standard
Discussion
The assessments afforded different kinds of observations about students’ understandings, and
concomitant differences in what they contributed to characterizing the kinds of emergent and
complex understandings discussed here. The unit test was best for definitively showing the presence
of a standard or non-standard conception: it yielded more than twice as many “non-standard”
judgments (16) than any other assessment. By comparison, the interview was best for showing
partial conceptions. The small-group discourse and presentations yielded fewer judgments overall
AERA06GIS_paper4.doc 3/29/2006 pg. 20 of 25
than the test and the interview – not surprising, since the latter were designed precisely for individual
assessment purposes.
The four assessments were overall in agreement, in that there was no case in which one
assessment yielded a “standard” while another yielded a “non-standard” for a given student’s
understanding of a given concept. Often two assessments would yield a “partial” with a “standard,”
or a “partial” with a “non-standard,” suggesting that this concept was emergent for the student.
Where two or more assessments yielded the same judgment, we assume that this triangulation is
strong evidence supporting that judgment.
One clear result of this analysis is that the region studied by each group strongly mediated
their understandings of the more complex concepts related to plate movement. For example, the
Japan group showed stronger understanding overall of concepts related to subduction. The Italy
group did not identify their region as a buckling zone (a difficult pattern in this case), developing
their own non-standard explanation for the data pattern as a rift zone. Their confusion, resulting
from the confusing earthquake and topographic patterns in Europe, correlated with confusion about
concepts of rift and buckling, as well as difficulty with mapping plate boundaries using earthquakes.
Further analysis will reveal the extent to which these patterns of emergent understandings are
correlated with studying particular earth structures, or with particular social processes in the
classroom (e.g. cross-group discussion activities, or particular instruction in mini-lessons).
Another important follow-up to this analysis will be an in-depth look at the non-standard
explanations developed by students, either individually or in their groups. The data from these
enactments suggest that deep conceptual learning is occurring in many of these cases, and that
simple “correct / incorrect” judgments of their answers and explanations mask this learning and the
emergent character of the learning. Groups like the Italy group developed their interpretations after
AERA06GIS_paper4.doc 3/29/2006 pg. 21 of 25
many arguments supported by specific claims from data. In some cases the “standard” answers were
considered and discarded along the way; in other cases they were never considered.
We close with three hypotheses/conclusions regarding larger issues of science learning and
its assessment. First, the data on students’ conceptual understanding and the patterns across the
various assessments re-affirm the gap between declarative knowledge and the ability to use that
knowledge in authentic, appropriate contexts. The performance of these students reminds us of the
distance between idealized statements of scientific fact (e.g., earthquakes occur at plate boundaries)
and “seeing” that fact amidst the messy realty of the natural world. As scientists, we learn to extract
patterns from messy data to allow us to propose generalizations that can be subsequently tested. This
process is often hidden from students who learn science in the classroom and without access to the
messy data on which the science “facts” are based. The GIS environment affords students the
opportunity to set the facts in their real world contexts.
Second, trends in the learning data suggest that concepts tend to emerge first as isolated,
declarative information and that the relational mosaic that is manifest in patterns of data and
explanatory models comes later. These trends are consistent with diSessa’s notion that knowledge
emerges first “in pieces” and only subsequently becomes assembled into more meaningful “wholes”
(diSessa, 1988). Finally, the different affordances of the four forms of assessment that were explored
in this work confirm the importance of using systems of assessment for knowing what students know
(Pellegrino, et al., 2002). Each allowed a somewhat difference glimpse into what students
understood and how they understood it and could apply it. The system of assessments provided a
more nuanced view of students’ understanding than what would have been possible with only one or
two of these. We refer to these conclusions as hypotheses/conclusions because each warrants more
rigorous investigation and replication.
AERA06GIS_paper4.doc 3/29/2006 pg. 1 of 25
References
Chi, M. T. H., Glaser, R., & Farr, M. J. (1988). The nature of expertise. Hillsdale, N.J. : L. Erlbaum Associates.
diSessa, A. (1988). Knowledge in pieces. In G. Forman & P. B. Pufall (Eds.), Constructivism in the computer age (pp. 49-70). Hillsdale, NJ: Lawrence Erlbaum Associates.
Enyedy, N. (2003). Knowledge construction and collective practice: At the intersection of learning, talk, and social configurations in a computer-mediated mathematics classroom. The Journal of the Learning Sciences, 12(3) 361-408.
Goldman, S. R. (1985). Inferential reasoning in and about narrative texts. In A. Graesser & J. Black (Eds.), The psychology of questions (pp. 247-276). Hillsdale, NJ: Erlbaum.
Goldman, S. R., & Durán, R. P. (1988). Answering questions from oceanography texts: Learner, task and text characteristics. Discourse Processes, 11, 373-412.
Goldman, S. R., Reyes, M., & Varnhagen, C. K. (1984). Understanding fables in first and second languages. Journal of National Association for Bilingual Education (NABE), 3, 35-66.
Goldman, S. R., Varma, K. O., Sharp, D., & the Cognition and Technology Group at Vanderbilt. (1999). Children's understanding of complex stories: Issues of representation and assessment. In S. R. Goldman, A. C. Graesser, & P. van den Broek (Eds.), Narrative comprehension, causality, and coherence: Essays in honor of Tom Trabasso (pp. 135-160). Mahwah, NJ: Erlbaum.
Kintsch, W. (1974). The representation of meaning in memory. NY: Academic Press. Pellegrino, J. W., Chudowsky, N., & Glaser, R. (Eds.). (2001). Knowing what students
know: The science and design of educational assessment. Committee on the Foundations of Assessment, Board on Testing and Assessment, Center for Education, National Research Council. Washington , DC : National Academy Press.
Radinsky, J. (2000). Making sense of complex data: A framework for studying students' development of reflective inquiry dispositions. Learning Sciences. Unpublished doctoral dissertation, Northwestern University, Evanston IL: 349. http://www.uic.edu/educ/bctpi/radinskydocs/RadinskyDissertation.pdf
Radinsky, J., Loh, B., Mundt, J., Marshall, S., Gomez, L.M., Reiser, B.J., and D. C. Edelson. (1999). Problematizing complex datasets for students: Design principles for inquiry curriculum. Poster presented at the Annual Conference of the American Educational Researchers Association (AERA), April 19-23, 1999, Montreal, Canada. http://www.ls.sesp.nwu.edu/sible/papers/AERA99_Radinskyetal-SIBLE.pdf
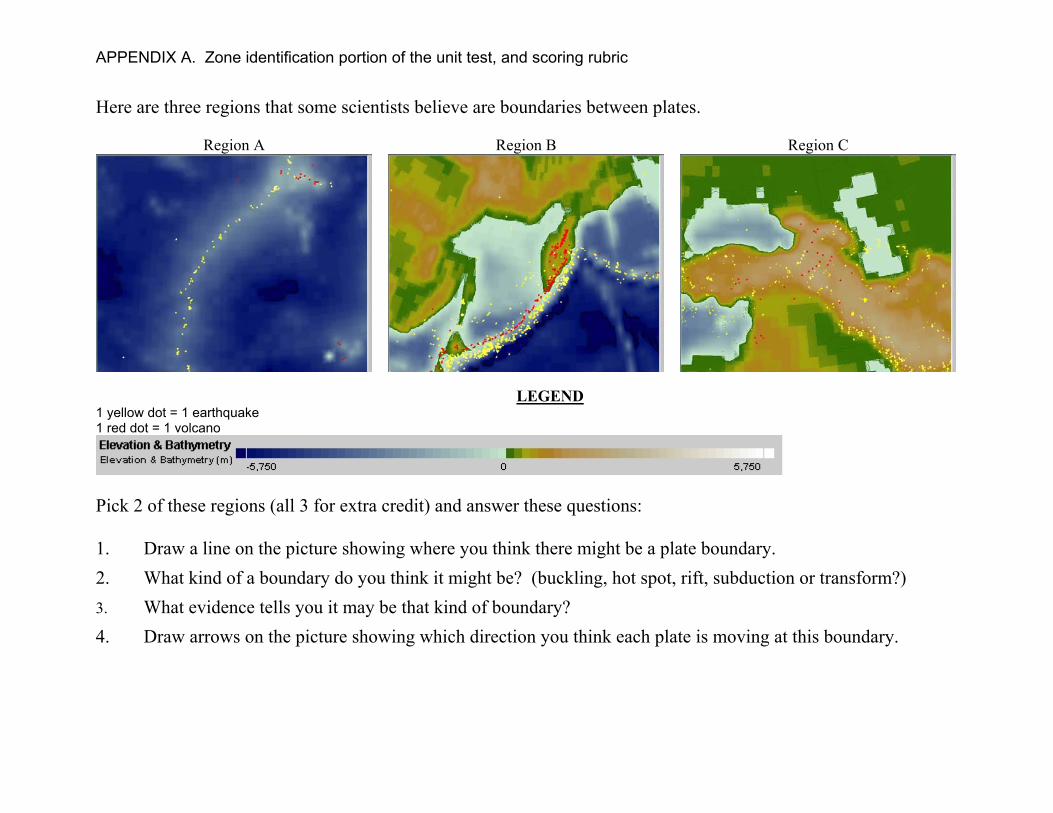
APPENDIX A. Zone identification portion of the unit test, and scoring rubric
Here are three regions that some scientists believe are boundaries between plates.
Region A Region B Region C
LEGEND
1 yellow dot = 1 earthquake 1 red dot = 1 volcano
Pick 2 of these regions (all 3 for extra credit) and answer these questions: 1. Draw a line on the picture showing where you think there might be a plate boundary. 2. What kind of a boundary do you think it might be? (buckling, hot spot, rift, subduction or transform?) 3. What evidence tells you it may be that kind of boundary?
4. Draw arrows on the picture showing which direction you think each plate is moving at this boundary.
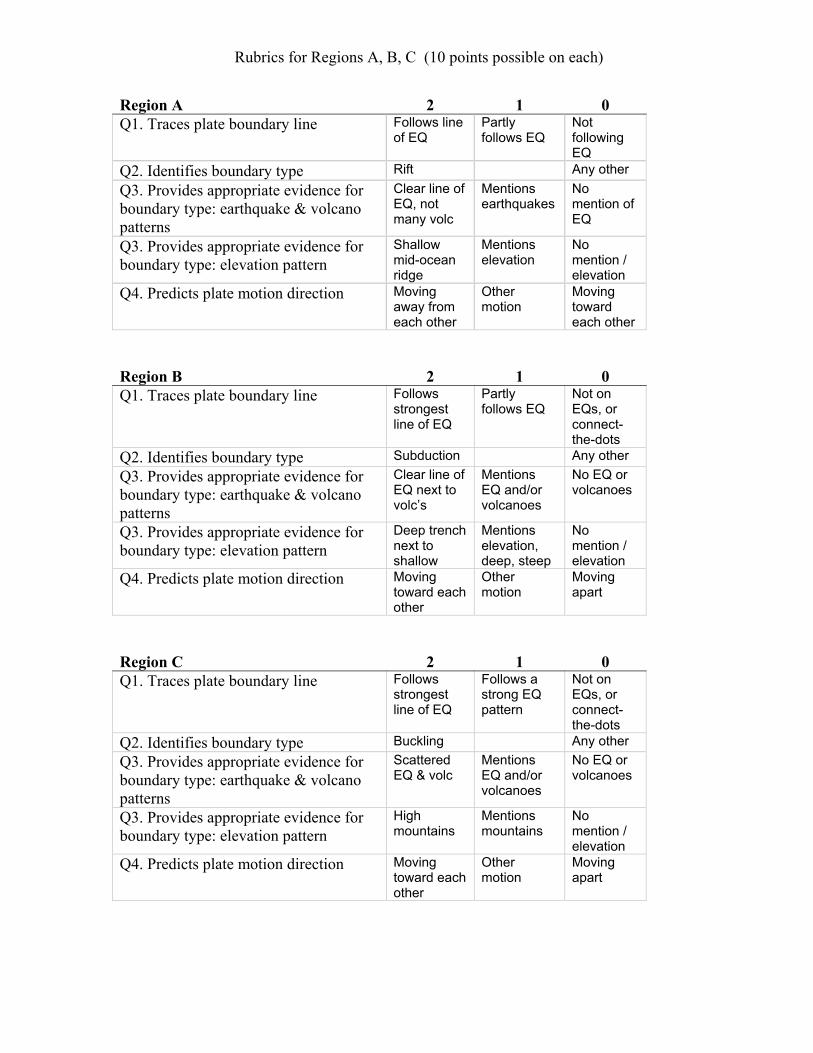
Rubrics for Regions A, B, C (10 points possible on each)
Region A 2 1 0 Q1. Traces plate boundary line Follows line
of EQ Partly follows EQ
Not following EQ
Q2. Identifies boundary type Rift Any other Q3. Provides appropriate evidence for boundary type: earthquake & volcano patterns
Clear line of EQ, not many volc
Mentions earthquakes
No mention of EQ
Q3. Provides appropriate evidence for boundary type: elevation pattern
Shallow mid-ocean ridge
Mentions elevation
No mention / elevation
Q4. Predicts plate motion direction Moving away from each other
Other motion
Moving toward each other
Region B 2 1 0 Q1. Traces plate boundary line Follows
strongest line of EQ
Partly follows EQ
Not on EQs, or connect-the-dots
Q2. Identifies boundary type Subduction Any other Q3. Provides appropriate evidence for boundary type: earthquake & volcano patterns
Clear line of EQ next to volc’s
Mentions EQ and/or volcanoes
No EQ or volcanoes
Q3. Provides appropriate evidence for boundary type: elevation pattern
Deep trench next to shallow
Mentions elevation, deep, steep
No mention / elevation
Q4. Predicts plate motion direction Moving toward each other
Other motion
Moving apart
Region C 2 1 0 Q1. Traces plate boundary line Follows
strongest line of EQ
Follows a strong EQ pattern
Not on EQs, or connect-the-dots
Q2. Identifies boundary type Buckling Any other Q3. Provides appropriate evidence for boundary type: earthquake & volcano patterns
Scattered EQ & volc
Mentions EQ and/or volcanoes
No EQ or volcanoes
Q3. Provides appropriate evidence for boundary type: elevation pattern
High mountains
Mentions mountains
No mention / elevation
Q4. Predicts plate motion direction Moving toward each other
Other motion
Moving apart