emerging 2011 proceedings - thinkmind.org
TRANSCRIPT

EMERGING 2011
The Third International Conference on Emerging Network Intelligence
ISBN: 978-1-61208-174-8
November 20-25, 2011
Lisbon, Portugal
IMMM 2011 Editors
Tulin Atmaca, IT/Telecom&Management SudParis, France
Michael D. Logothetis, University of Patras, Greece
Krishna Murthy, Global IT Solutions at Quintiles - Raleigh, USA
1 / 141

EMERGING 2011
Foreword
The Third International Conference on Emerging Network Intelligence [EMERGING 2011], held betweenNovember 20 and 25, 2011 in Lisbon, Portugal, constituted a stage to present and evaluate the advances inemerging solutions for next-generation architectures, devices, and communications protocols. Particular focus wasaimed at optimization, quality, discovery, protection, and user profile requirements supported by specialapproaches such as network coding, configurable protocols, context-aware optimization, ambient systems,anomaly discovery, and adaptive mechanisms.
Next-generation large distributed networks and systems require substantial reconsideration of exiting ‘defacto’ approaches and mechanisms to sustain an increasing demand on speed, scale, bandwidth, topology and flowchanges, user complex behavior, security threats, and service and user ubiquity. As a result, growing research andindustrial forces are focusing on new approaches for advanced communications considering new devices andprotocols, advanced discovery mechanisms, and programmability techniques to express, measure and control theservice quality, security, environmental and user requirements.
We take here the opportunity to warmly thank all the members of the EMERGING 2011 TechnicalProgram Committee, as well as the numerous reviewers. The creation of such a broad and high quality conferenceprogram would not have been possible without their involvement. We also kindly thank all the authors whodedicated much of their time and efforts to contribute to EMERGING 2011. We truly believe that, thanks to allthese efforts, the final conference program consisted of top quality contributions.
Also, this event could not have been a reality without the support of many individuals, organizations, andsponsors. We are grateful to the members of the EMERGING 2011 organizing committee for their help in handlingthe logistics and for their work to make this professional meeting a success.
We hope that EMERGING 2011 was a successful international forum for the exchange of ideas and resultsbetween academia and industry and for the promotion of progress in emerging network intelligence.
We are convinced that the participants found the event useful and communications very open. We alsohope the attendees enjoyed the historic charm of Lisbon, Portugal.
EMERGING 2011 Chairs:
Tadashi AraragiTulin AtmacaDavid CarreraRobert FosterNuno M. GarciaRaj JainMichael D. LogothetisKrishna MurthyDaniel ScheibliPhuoc Tran-Gia
2 / 141

EMERGING 2011
Committee
EMERGING Advisory Chairs
Raj Jain, Washington University in St. Louis, USAMichael D. Logothetis, University of Patras, GreeceTulin Atmaca, IT/Telecom&Management SudParis, FrancePhuoc Tran-Gia, University of Wuerzburg, GermanyNuno M. Garcia, Universidade Lusófonas de Humanidades e Tecnologias, Lisboa, Portugal
EMERGING 2011 Industry Liaison Chairs
Krishna Murthy, Global IT Solutions at Quintiles - Raleigh, USATadashi Araragi, Nippon Telegraph and Telephone Corporation – Kyoto, JapanRobert Foster, Edgemount Solutions - Plano, USA
EMERGING 2011 Research Chairs
David Carrera, Barcelona Supercomputing Center (BSC) / Universitat Politecnica de Catalunya (UPC), SpainDaniel Scheibli, SAP Research, Germany
EMERGING 2011 Technical Program Committee
Khalid Al-Begain, University of Glamorgan, UKArtur Andrzejak, University of Heidelberg, GermanyRichard Anthony, University of Greenwich, UKTadashi Araragi, Nippon Telegraph and Telephone Corporation - Kyoto, JapanTulin Atmaca, IT/Telecom&Management SudParis, FranceM. Ali Aydin, Istanbul University, TurkeyMagdy Bayoumi, University of Louisiana at Lafayette, USAAndreas Berl, University of Passau, GermanyRobert Bestak, Czech Technical University in Prague, Czech RepublicChristian Blum, Universitat Politècnica de Catalunya, Spain
Chih-Yung Chang (張志勇), Tamkang University, TaiwanDong Ho Cho, Korea Advanced Institute of Science and Technology (KAIST), Republic of KoreaAlberto Dainotti, University of Napoli "Federico II", ItalyCarl James Debono, University of Malt, MaltaRolf Drechsler, University of Bremen, GermanyJean-Michel Dricot, Université Libre de Bruxelles, BelgiumMohamed Eltoweissy, Virginia Tech, USAAnna Förster, University of Lugano, SwitzerlandNuno M. Garcia, Universidade Lusófonas de Humanidades e Tecnologias, Lisboa, PortugalKamini Garg, University of Applied Sciences Southern Switzerland - Lugano, SwitzerlandChristophe Guéret, Vrije Universiteit Amsterdam, The NetherlandsGo Hasegawa, Osaka University, JapanEva Hladka, Masaryk University & CESNET, Czech RepublicRaj Jain, Washington University in St. Louis, USAHenrik Karstoft, Aarhus School of Engineering, Denmark
3 / 141

Douglas Legge, University of Reading, UKMichael D. Logothetis, University of Patras, GreeceAhmed Mahdy, Texas A&M University-Corpus Christi, USAMoufida Maimour, Nancy University, CNRS, FranceJosemaria Malgosa Sanahuja, Polytechnic University of Cartagena, SpainZoubir Mammeri, IRIT - Toulouse, FranceAnna Medve, University of Pannonia, HungaryJuan Pedro Muñoz-Gea, Polytechnic University of Cartagena, SpainKrishna Murthy, Global IT Solutions at Quintiles - Raleigh, USATadashi Nakano, University of California, Irvine, USAEuthimios (Thimios) Panagos, Telcordia Applied Research - Piscataway, USAGianluca Reali, Università degli Studi di Perugia, Italy,Joel Rodrigues, Institute of Telecommunications / University of Beira Interior, PortugalDaniel Scheibli, SAP Research, GermanyDimitrios Serpanos, ISI/R. C. Athena and University of Patras, GreeceYutaka Takahashi, Kyoto University, JapanAntónio Teixeira, University of Aveiro, PortugalJim Tørresen, University of Oslo, Norway /Cornell University, USADavide Tosi, University of Insubria - Como, ItalyManuel Villen-Altamirano, Universidad Politécnica de Madrid, SpainWei Wei, Xi'an Jiaootong University, P.R. ChinaMaarten Wijnants, Hasselt University, BelgiumAlbert Y. Zomaya, The University of Sydney, Australia
4 / 141

Copyright Information
For your reference, this is the text governing the copyright release for material published by IARIA.
The copyright release is a transfer of publication rights, which allows IARIA and its partners to drive the
dissemination of the published material. This allows IARIA to give articles increased visibility via
distribution, inclusion in libraries, and arrangements for submission to indexes.
I, the undersigned, declare that the article is original, and that I represent the authors of this article in
the copyright release matters. If this work has been done as work-for-hire, I have obtained all necessary
clearances to execute a copyright release. I hereby irrevocably transfer exclusive copyright for this
material to IARIA. I give IARIA permission or reproduce the work in any media format such as, but not
limited to, print, digital, or electronic. I give IARIA permission to distribute the materials without
restriction to any institutions or individuals. I give IARIA permission to submit the work for inclusion in
article repositories as IARIA sees fit.
I, the undersigned, declare that to the best of my knowledge, the article is does not contain libelous or
otherwise unlawful contents or invading the right of privacy or infringing on a proprietary right.
Following the copyright release, any circulated version of the article must bear the copyright notice and
any header and footer information that IARIA applies to the published article.
IARIA grants royalty-free permission to the authors to disseminate the work, under the above
provisions, for any academic, commercial, or industrial use. IARIA grants royalty-free permission to any
individuals or institutions to make the article available electronically, online, or in print.
IARIA acknowledges that rights to any algorithm, process, procedure, apparatus, or articles of
manufacture remain with the authors and their employers.
I, the undersigned, understand that IARIA will not be liable, in contract, tort (including, without
limitation, negligence), pre-contract or other representations (other than fraudulent
misrepresentations) or otherwise in connection with the publication of my work.
Exception to the above is made for work-for-hire performed while employed by the government. In that
case, copyright to the material remains with the said government. The rightful owners (authors and
government entity) grant unlimited and unrestricted permission to IARIA, IARIA's contractors, and
IARIA's partners to further distribute the work.
5 / 141

Table of Contents
Model-Based Distributed On-line Safety MonitoringAmer Dheedan and Yiannis Papadopoulos
1
Distributed Service Discovery Architecture: A Bottom-Up Approach with Application Oriented NetworkingMohamed Saleem Haja Nazmudeen, Mohd Fadzil Hassan, and Vijanth Sagayan Asirvadam
8
The Interoperability Challenge for Autonomic ComputingRichard Anthony, Mariusz Pelc, and Haffiz Shuaib
13
An Alamouti Coding Scheme for Relay-Based Cooperative Communication SystemsYoungpo Lee, Youngje Kim, Sun Yong Kim, Gyu-In Jee, Jin-Mo Yang, and Seokho Yoon
20
Low Complexity Long PN Code Acquisition Scheme for Spread Spectrum SystemsJeehyeon Baek, Jonghun Park, Youngpo Lee, Sun Yong Kim, Gyu-In Jee, Jin-Mo Yang, and Seokho Yoon
25
Robust Integer Frequency Offset Estimation Scheme Based on Differentially Combined Correlator Outputs forDVB-T SystemsJong In Park, Hyung-Weon Cho, Youngpo Lee, Sun Yong Kim, Gyu-In Jee, Jin-Mo Yang, and Seokho Yoon
29
Investigating the Robustness of Detection vis-`a-vis the Detector Threshold in WSN with Fading MAC andDiffering Sensor SNRs – Optimal Sensor Gains vs. Uniform Sensor GainsMuralishankar Rangarao, H. N. Shankar, Manisha Sinha, and Aniketh Venkat
34
A New Telesupervision System Integrated in an Intelligent Networked Operating RoomMarcus Kony, Michael Czaplik, Marian Walter, Rolf Rossaint, and Steffen Leonhardt
39
Multi-Objective Optimization for Virtual Machine Migration on LANs for Opportunistic Grid InfrastructuresNathalia Garces, Nicolas Ortiz, David Mendez, and Yezid Donoso
45
Restoring CSCF by Leveraging Feature of Retransmission Mechanism in Session Initiation ProtocolTakeshi Usui, Yoshinori Kitatsuji, Hidetoshi Yokota, and Nozomu Nishinaga
50
Mobility Aware Routing for Multihomed Wireless Networks Under Interference ConstraintsPreetha Thulasiraman
57
Priority-based Packet Scheduling in Internet Protocol TelevisionMehmet Deniz Demirici and Abdul Halim Zaim
63
Optical CDMA Using Dual Encoding with Optical PowerShusaku Hata and Hiroyuki Yashima
68
1 / 2 6 / 141

A Comparison Study on Data Vortex Packet Switched Networks with Redundant Buffers and with Inter-cylinderPathsQimin Yang
73
Multicasting over OBS WDM NetworksPinar Kirci and Halim Zaim
79
Performance Study of Interconnected Metro Ring NetworksVan T. Nguyen, Tulin Atmaca, Glenda Gonzalez, and Joel Rodrigues
82
A MAC Layer Covert Channel in 802.11 NetworksRicardo Goncalves, Murali Tummala, and John McEachen
88
Design Time Reliability Predictions for Supporting Runtime Security Measuring and AdaptationAntti Evesti and Eila Ovaska
94
Incident Detection for Cloud EnvironmentsFrank Doelitzscher, Christoph Reich, Martin Knahl, and Nathan Clarke
100
Multipath Routing for Survivability of Complex Networks Under Cascading FailuresPreetha Thulasiraman
106
Association Control for Throughput Maximization and Energy Efficiency for Wireless LANsOyunchimeg Shagdar, Suhua Tang, Akio Hasegawa, Tatsuo Shibata, and Sadao Obana
112
Multipath Routing Management using Neural Networks-Based Traffic PredictionMelinda Barabas, Georgeta Boanea, and Virgil Dobrota
118
Blocking Performance of Multi-Rate OCDMA Passive Optical NetworksJohn Vardakas, Ioannis Moscholios, Michael Logothetis, and Vassilios Stylianakis
125
A Multimedia Capture System for Wildlife StudiesKim Steen, Henrik Karstoft, and Ole Green
131
Powered by TCPDF (www.tcpdf.org)
2 / 2 7 / 141
Model-Based Distributed On-line Safety Monitoring
Amer Dheedan, Yiannis Papadopoulos
Department of Computer Science
University of Hull
Hull, United Kingdom,
A.A.Aloqaili@2007. , [email protected]
Abstract— On-line safety monitoring, i.e. the tasks of fault
detection and diagnosis, alarm annunciation, and fault
controlling, is an essential task in the operational phase of
critical systems. Although current safety monitors deliver this
task to some extent, the problem of effective and timely safety
monitoring is still largely unresolved. In this paper, we propose
a Distributed On-line Safety Monitor (DOSM) that can achieve
a range of real-time safety monitoring tasks: fault detection
and diagnosis, alarm annunciation and control of hazardous
failures. The monitor consists of a Multi-agent Monitoring
System (MaMS) operating on a Distributed Monitoring Model
(DMM) that contains reference knowledge derived from off-
line safety assessments, and a number of Distributed Data
Structures (DDSs) that provide up-to-date sensory
measurements. Guided by the knowledge contained in the
DMM and real-time observations of the system provided by
the DSSs, agents are hierarchically deployed and work
collaboratively to integrate and deliver safety monitoring tasks,
both locally at the sub-system levels and globally overseeing
the overall behaviour of the system.
Keywords-Fault Detection and Diagnosis; Optimal Alarm
Annunciation; Fault Controlling; Multi-agent Monitoring System;
I. INTRODUCTION
Over the last 30 years, considerable work on model-based safety monitoring, has resulted in approaches that exploit knowledge about the normal operational behaviour and failure of a system. In the context of this work, models such as state-machines, goal trees, goal hierarchies and fault trees have been exploited and demonstrated their benefits as reference knowledge for system monitoring (for a comprehensive see [1]). Typically, these models incorporate deep knowledge of the target system and enable qualitative and quantitative (often probabilistic) reasoning about behavioural transitions, symptoms, causes and possible effects of faults [2, 3].
Recently, a centralised safety monitor [4] that exploits knowledge derived from the application of a semi-automated off-line safety assessment method and tool called Hierarchically Performed Hazard Origin and Propagation Studies (HiP-HOPS) [5] has been proposed. That knowledge is composed of two elements: (a) a hierarchy of state-machines describing the behaviour of the system, effectively capturing the normal and abnormal mode and state transitions of the system and its sub-systems; (b) a set of fault trees, which effectively represent diagnostic models that relate the symptoms of failure to ultimate root causes.
The motivation for that work has been the observation that, in the current industrial practice, vast amounts of knowledge derived in off-line safety assessments cease to be useful following the certification and deployment of a system. A key contribution of this work is that it brings this knowledge forward to the operational phase of a system and usefully exploits it for the purposes of on-line safety monitoring. The concept is potentially very useful. However, the monitor described in [4] is limited in its potential because it is monolithic and centralised, and therefore, has limited applicability in systems that have a distributed nature and incorporate large numbers of components that interact collaboratively in dynamic cooperative structures.
Recent work on Multi-agent Systems (MaS) shows that the distributed reasoning paradigm could cope with the nature of such systems. In [6], for example, a MaS has been exploited to increase the capacity of a diagnostic scheme of a large-scale system. MaS have also demonstrated prompt responses in detecting faults and diagnosing the underlying causes of failures in complex distributed chemical processes [7]. Despite these encouraging developments, serious operational hazards are still recorded in safety critical systems and disastrous failures do not seem out of the question. Accordingly, the problem of developing a robust on-line monitor is still debated mainly in terms of two aspects. One aspect concerns the type of knowledge that is required to inform the on-line reasoning of the monitor: should it be, for example, a set of rules defined by experts or should it be knowledge based on engineering models, and in the latter case, what kind of knowledge should such models contain [1, 8]? The second aspect of the problem arises from the increasingly distributed nature of modern systems and the inevitably complicated collaboration among their components. This aspect is concerned with overcoming the limitations of centralised and rigidly distributed monitors, and is, looking into employing intelligent monitoring agents as means for delivering flexible, timely, consistent and effective monitoring [1, 9].
In order to address the issues discussed above, this paper proposes a DOSM which combines the benefits of using knowledge derived in off-line safety assessments with the benefits of a collaborative distribution of MaS. The DOSM consists of a DDM derived from the HiP-HOPS safety assessment model, a MaMS incorporating a number of Belief-Desire-Intention (BDI) agents, and a set of DDSs. According to the architectural model of the target system, agents are hierarchically deployed as monitoring agents (MAGs) and each is provided with its portion of the DMM
1Copyright (c) IARIA, 2011. ISBN: 978-1-61208-174-8
EMERGING 2011 : The Third International Conference on Emerging Network Intelligence
8 / 141
and appropriate DSSs. By exploiting their portions of the DMM, MAGs reason on the operational parameters held by DDSs, to detect and assess the effects of deviations, diagnose the underlying causes of the detected deviations and automatically apply corresponding fault controlling measures. Moreover, in order to avoid alarm avalanches and latent alarms that may mislead the system operators [10, 11], MAGs are also able to optimise alarm annunciation by (a) suppressing unimportant and false alarms; (b) filtering spurious sensory measurements; (c) incorporating helpful alarm information, such as assessment of the operational conditions after the occurrence of the fault, guidance on controlling the occurred fault, and diagnostics of the underlying causes of failures.
Benefit of the proposed DOSM ranges from increasing the flexibility, composability and extensibility of on-line safety monitoring to ultimately developing an effective and cost-effective monitor for safety critical systems.
The rest of this paper is organised in the following sections: section two briefly describes the nature of modern critical systems and the requirements for representation of such systems for the purpose of safety monitoring. Section three presents the approach, and the role and architecture of the DOSM. To demonstrate the effectiveness of the delivered monitoring tasks, in section four, the DOSM is applied to an aircraft fuel system and some failure scenarios are discussed. Finally, section five draws a conclusion and proposes further work.
II. MODELLING SYSTEMS FOR MONITORING
Large scale and dynamic behaviour are two common aspects of modern critical systems, for example, modern transportation systems, manufacturing systems, chemical and power plants. While the large scale of these systems calls into question the ability of a monitor to deliver consistent monitoring over an architecture that may integrate thousands of components, dynamic behaviour mainly calls into question the ability of a monitor to distinguish between normal and abnormal operational conditions. More specifically, what is considered as normal in one mode or
phase of operation of the system may simply be abnormal in another mode. A typical example of a “phased mission” system is an aircraft system which delivers a trip mission through a number of phases, which include pre-flight, taxiing, take-off, climbing, cruising, approaching, and landing. Thorough knowledge about the architectural components and the dynamic behaviour in each phase is essential to achieve effective safety monitoring.
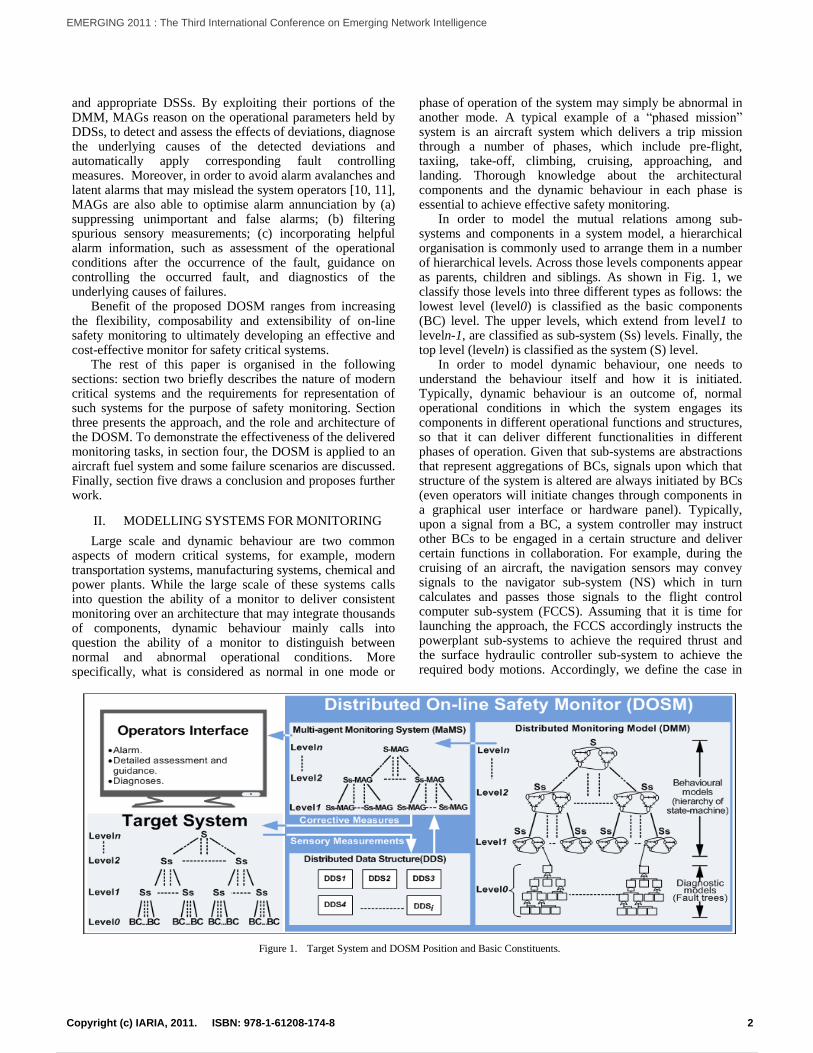
In order to model the mutual relations among sub-systems and components in a system model, a hierarchical organisation is commonly used to arrange them in a number of hierarchical levels. Across those levels components appear as parents, children and siblings. As shown in Fig. 1, we classify those levels into three different types as follows: the lowest level (level0) is classified as the basic components (BC) level. The upper levels, which extend from level1 to leveln-1, are classified as sub-system (Ss) levels. Finally, the top level (leveln) is classified as the system (S) level.
In order to model dynamic behaviour, one needs to understand the behaviour itself and how it is initiated. Typically, dynamic behaviour is an outcome of, normal operational conditions in which the system engages its components in different operational functions and structures, so that it can deliver different functionalities in different phases of operation. Given that sub-systems are abstractions that represent aggregations of BCs, signals upon which that structure of the system is altered are always initiated by BCs (even operators will initiate changes through components in a graphical user interface or hardware panel). Typically, upon a signal from a BC, a system controller may instruct other BCs to be engaged in a certain structure and deliver certain functions in collaboration. For example, during the cruising of an aircraft, the navigation sensors may convey signals to the navigator sub-system (NS) which in turn calculates and passes those signals to the flight control computer sub-system (FCCS). Assuming that it is time for launching the approach, the FCCS accordingly instructs the powerplant sub-systems to achieve the required thrust and the surface hydraulic controller sub-system to achieve the required body motions. Accordingly, we define the case in
Figure 1. Target System and DOSM Position and Basic Constituents.
2Copyright (c) IARIA, 2011. ISBN: 978-1-61208-174-8
EMERGING 2011 : The Third International Conference on Emerging Network Intelligence
9 / 141
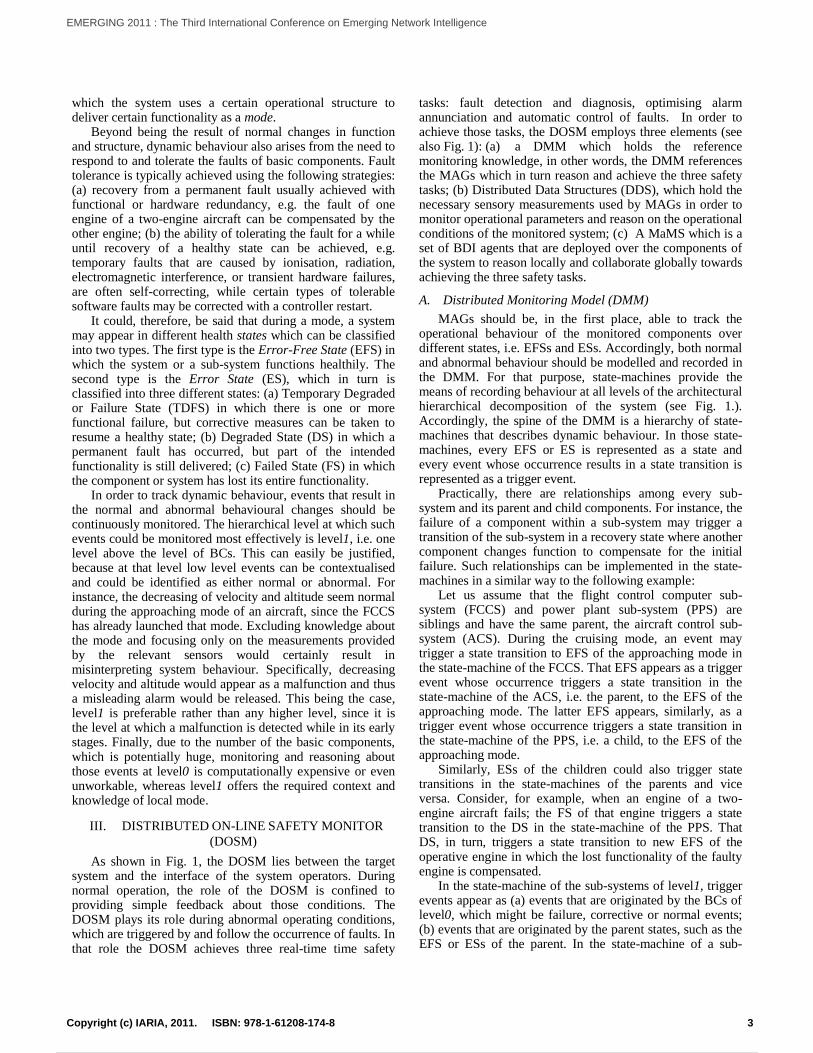
which the system uses a certain operational structure to deliver certain functionality as a mode.
Beyond being the result of normal changes in function and structure, dynamic behaviour also arises from the need to respond to and tolerate the faults of basic components. Fault tolerance is typically achieved using the following strategies: (a) recovery from a permanent fault usually achieved with functional or hardware redundancy, e.g. the fault of one engine of a two-engine aircraft can be compensated by the other engine; (b) the ability of tolerating the fault for a while until recovery of a healthy state can be achieved, e.g. temporary faults that are caused by ionisation, radiation, electromagnetic interference, or transient hardware failures, are often self-correcting, while certain types of tolerable software faults may be corrected with a controller restart.
It could, therefore, be said that during a mode, a system may appear in different health states which can be classified into two types. The first type is the Error-Free State (EFS) in which the system or a sub-system functions healthily. The second type is the Error State (ES), which in turn is classified into three different states: (a) Temporary Degraded or Failure State (TDFS) in which there is one or more functional failure, but corrective measures can be taken to resume a healthy state; (b) Degraded State (DS) in which a permanent fault has occurred, but part of the intended functionality is still delivered; (c) Failed State (FS) in which the component or system has lost its entire functionality.
In order to track dynamic behaviour, events that result in the normal and abnormal behavioural changes should be continuously monitored. The hierarchical level at which such events could be monitored most effectively is level1, i.e. one level above the level of BCs. This can easily be justified, because at that level low level events can be contextualised and could be identified as either normal or abnormal. For instance, the decreasing of velocity and altitude seem normal during the approaching mode of an aircraft, since the FCCS has already launched that mode. Excluding knowledge about the mode and focusing only on the measurements provided by the relevant sensors would certainly result in misinterpreting system behaviour. Specifically, decreasing velocity and altitude would appear as a malfunction and thus a misleading alarm would be released. This being the case, level1 is preferable rather than any higher level, since it is the level at which a malfunction is detected while in its early stages. Finally, due to the number of the basic components, which is potentially huge, monitoring and reasoning about those events at level0 is computationally expensive or even unworkable, whereas level1 offers the required context and knowledge of local mode.
III. DISTRIBUTED ON-LINE SAFETY MONITOR
(DOSM)
As shown in Fig. 1, the DOSM lies between the target system and the interface of the system operators. During normal operation, the role of the DOSM is confined to providing simple feedback about those conditions. The DOSM plays its role during abnormal operating conditions, which are triggered by and follow the occurrence of faults. In that role the DOSM achieves three real-time time safety
tasks: fault detection and diagnosis, optimising alarm annunciation and automatic control of faults. In order to achieve those tasks, the DOSM employs three elements (see also Fig. 1): (a) a DMM which holds the reference monitoring knowledge, in other words, the DMM references the MAGs which in turn reason and achieve the three safety tasks; (b) Distributed Data Structures (DDS), which hold the necessary sensory measurements used by MAGs in order to monitor operational parameters and reason on the operational conditions of the monitored system; (c) A MaMS which is a set of BDI agents that are deployed over the components of the system to reason locally and collaborate globally towards achieving the three safety tasks.
A. Distributed Monitoring Model (DMM)
MAGs should be, in the first place, able to track the operational behaviour of the monitored components over different states, i.e. EFSs and ESs. Accordingly, both normal and abnormal behaviour should be modelled and recorded in the DMM. For that purpose, state-machines provide the means of recording behaviour at all levels of the architectural hierarchical decomposition of the system (see Fig. 1.). Accordingly, the spine of the DMM is a hierarchy of state-machines that describes dynamic behaviour. In those state-machines, every EFS or ES is represented as a state and every event whose occurrence results in a state transition is represented as a trigger event.
Practically, there are relationships among every sub-system and its parent and child components. For instance, the failure of a component within a sub-system may trigger a transition of the sub-system in a recovery state where another component changes function to compensate for the initial failure. Such relationships can be implemented in the state-machines in a similar way to the following example:
Let us assume that the flight control computer sub-system (FCCS) and power plant sub-system (PPS) are siblings and have the same parent, the aircraft control sub-system (ACS). During the cruising mode, an event may trigger a state transition to EFS of the approaching mode in the state-machine of the FCCS. That EFS appears as a trigger event whose occurrence triggers a state transition in the state-machine of the ACS, i.e. the parent, to the EFS of the approaching mode. The latter EFS appears, similarly, as a trigger event whose occurrence triggers a state transition in the state-machine of the PPS, i.e. a child, to the EFS of the approaching mode.
Similarly, ESs of the children could also trigger state transitions in the state-machines of the parents and vice versa. Consider, for example, when an engine of a two-engine aircraft fails; the FS of that engine triggers a state transition to the DS in the state-machine of the PPS. That DS, in turn, triggers a state transition to new EFS of the operative engine in which the lost functionality of the faulty engine is compensated.
In the state-machine of the sub-systems of level1, trigger events appear as (a) events that are originated by the BCs of level0, which might be failure, corrective or normal events; (b) events that are originated by the parent states, such as the EFS or ESs of the parent. In the state-machine of a sub-
3Copyright (c) IARIA, 2011. ISBN: 978-1-61208-174-8
EMERGING 2011 : The Third International Conference on Emerging Network Intelligence
10 / 141
system of the levels extending from level2 to leveln-1, trigger events appear as EFSs and ESs of the parent and the children. Finally, in the state-machine of the system, i.e. leveln, trigger events appear as EFSs and ESs of the children.
Knowledge about the normal behaviour, i.e. EFS and normal events, of the system and its sub-systems can be obtained from design models, such as Data Flow Diagrams (DFD), Functional Flow Block Diagram (FFBD) and models in the Unified Model Language (UML) that model the system during the design life cycle. Knowledge about abnormal behaviour, i.e. ESs, abnormal events, assessment, guidance, and corrective measures, can be obtained by applying the Functional Failure Analysis (FFA) or HAZard and OPerability study (HAZOP) techniques on those models.
During the monitoring time, MAGs monitor only trigger events whose occurrence triggers transitions from the current state in the state-machine. As such, the computational load of the MAGs would be less and prompt responses to the occurrence of the events would be obtained.
In the state-machines of the sub-systems of level1, every failure event would be associated with (a) an alarm statement that would be quoted and provided to the operators upon the occurrence of the failure event; (b) corrective measures that can be applied to control the failure; (c) diagnosis, if the failure and the underlying cause are in a one-to-one relationship the cause would be associated, otherwise a diagnostic process should take place. Note, some corrective measures might be achievable only after diagnosing the underlying causes. In the state-machines of higher level sub-systems, normal and abnormal events are associated with a field of (a) assessment of the consequent operational conditions; (b) guidance on directing the hazards at that level. Knowledge of those fields can be obtained from the HAZOP.
A failure event and its underlying cause might not always be in a one-to-one relationship. Therefore, a diagnostic model that can relate failure events to their underlying cause is needed. The fault tree, a popular model used in safety assessments, can be used as a diagnostic model as it logically records the propagation paths and the associated symptoms of failure a long with underlying causes. In HiP-HOPS, fault trees are automatically constructed from the topology of a system and local failure logic specified at component level. This method can be applied to construct diagnostic fault trees for failure events that appear as trigger events in the state-machines of level1 sub-systems. Corrective measures could also be incorporated in the failure mode nodes of the fault tree.
As shown above, knowledge encoded in the DMM is obtained from the design models and by applying classical manual safety analysis techniques (FFA, HAZOP, FMEA, Fault Tree analysis) [12] or more modern semi-automatic safety analysis techniques (HiP-HOPS) [5]. Hence, it could be said that a safety assessment model could be useful to derive a DMM after (a) associating the abnormal events with the alarm, controlling and diagnosis knowledge; (b) augmenting the states of the state-machines by assessment and guidance fields and the diagnostic model with the required corrective measures; (c) formalising the trigger
events of the state-machine and the symptoms of the diagnostic model as monitoring expressions that could be evaluated computationally in real time. The deriving process would contribute essentially to providing the DOSM with thorough and consistent monitoring knowledge. Note that in this paper we adopt the HiP-HOPS as a safety assessment tool to produce the DMM.
B. Formal Monitoring Expressions and Distributed Data
Structure (DDS)
Low level events that monitor the physical process and trigger state transition in the state-machines at Level1, should be formalised as monitoring expressions that reference parameters of the physical process. Through evaluating those expressions, the occurrence of the corresponding trigger events or symptoms could be verified. In the formalisation process, an event or a symptom is expressed as a constraint. In its simple form, a constraint consists of three main parts: (a) the status of operational conditions which is either a state of a child or the parent or a sensory measurement defined by the identifier of the relevant sensor; (b) a relational operator – equality or inequality; (c) a threshold whose violation results in evaluating that expression with a true truth value, i.e. the relevant event or symptom occurs. Thresholds might appear as a numerical or Boolean value.
Simple constraints may suffice for simple monitoring tasks. In general, though, events may require more complicated forms of constraints to be evaluated. In turn, such constraints might require (a) the status of a parameter to be calculated over a number of sensory measurements; (b) two operational operators, when the threshold is a range of values rather than a single value; (c) a threshold that represents a sensory measurement or a calculation of more than one measurement. Moreover, the status of parameters and the threshold might be calculated to find the average of
the change of a quantity over an interval (t), i.e. differentiation, or the volumes from different sensory measurements at definite timings, i.e. integral calculus.
For the evaluation process of such monitoring expressions, we pre-declare a number of data structures that could hold satisfactory sensory measurements and the result of the calculation and the evaluation process. For every sub-system of level1, a DDS would be allocated to hold those structures; as shown in Fig. 1.For holding historical sensory measurements we use an updatable buffer of one-dimension array data structure that could hold two or more up-to-date
sensory measurements. Such a structure is updated every t by (a) inserting the current measurement, which is collected at the current time (T) from the relevant sensor; (b) shifting
out the earliest measurement, which is collected at T-2t in the past. As such, that structure holds two (or more)
measurements collected at current time T and T- t in past. Sensors may deliver spurious measurements because of
(a) their own transient failures; (b) mode changes, which might be followed by an interval of unsteady behaviour in which the monitored parameter may temporarily fluctuate outside normal thresholds. One way of filtering out such spurious sensory measurements is by evaluating the
4Copyright (c) IARIA, 2011. ISBN: 978-1-61208-174-8
EMERGING 2011 : The Third International Conference on Emerging Network Intelligence
11 / 141
monitoring expressions successively over a filtering interval and based on a number of measurements. The final result of that evaluation is obtained by making accumulative conjunctions among the successive evaluations. If the final result is s true truth value, this means that the delivered measurements remain the same over the filtering interval, which is a confirmation that a parameter is persistently out of threshold and a sign of a persistent anomaly present - as opposed to a spurious measurement or a transient anomaly. The filtering interval of every expression is defined by examining both the conditions that may result in spurious measurements and the time intervals at which the involved sensors are requested by the monitor.
A three-value technique: „True‟, „False‟, and „Unknown‟, is also employed to save evaluation time and produce earlier results in filtering spurious measurements and in the context of incomplete sensory data without violating the evaluation logic. Consider, for example, the following two expression forms:
Expression OR (Expression, t) (1)
Expression AND (Expression, t) (2)
Evaluating either of those expressions; (1) or (2), may
require waiting time equal to t, i.e. until evaluating
(Expression, t) part, regardless of the instant evaluation of the „Expression’ part of either of the expressions. Knowing that the disjunction of „True‟ with „Unknown‟ is „True‟ and the conjunction of „False‟ with „Unknown‟ is „False‟, both expressions; (1) and (2), can be evaluated instantly. Therefore, in cases in which the „Expression’ part of expression (1) is evaluated to „True‟ and the „Expression’ part of expression (2) is evaluated to False, both (1) and (2) could be evaluated instantly to „True‟ and „False‟, respectively.
C. Multi-agent Monitoring System (MaMS)
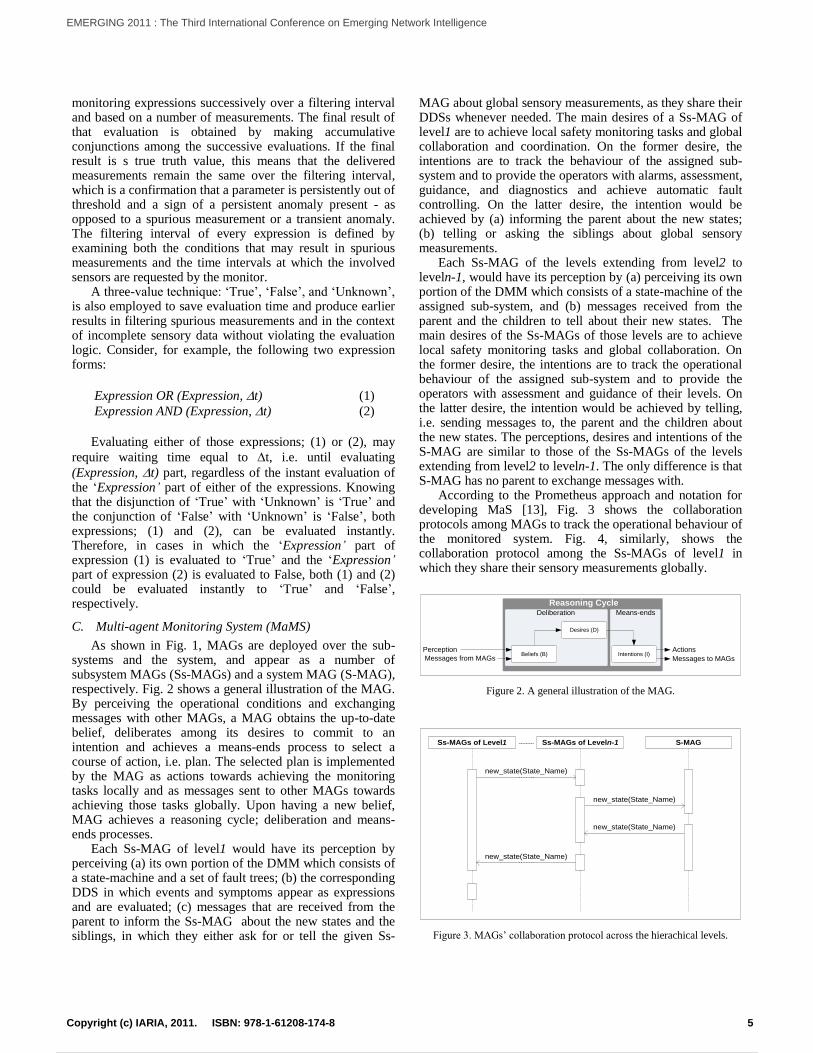
As shown in Fig. 1, MAGs are deployed over the sub-systems and the system, and appear as a number of subsystem MAGs (Ss-MAGs) and a system MAG (S-MAG), respectively. Fig. 2 shows a general illustration of the MAG. By perceiving the operational conditions and exchanging messages with other MAGs, a MAG obtains the up-to-date belief, deliberates among its desires to commit to an intention and achieves a means-ends process to select a course of action, i.e. plan. The selected plan is implemented by the MAG as actions towards achieving the monitoring tasks locally and as messages sent to other MAGs towards achieving those tasks globally. Upon having a new belief, MAG achieves a reasoning cycle; deliberation and means-ends processes.
Each Ss-MAG of level1 would have its perception by perceiving (a) its own portion of the DMM which consists of a state-machine and a set of fault trees; (b) the corresponding DDS in which events and symptoms appear as expressions and are evaluated; (c) messages that are received from the parent to inform the Ss-MAG about the new states and the siblings, in which they either ask for or tell the given Ss-
MAG about global sensory measurements, as they share their DDSs whenever needed. The main desires of a Ss-MAG of level1 are to achieve local safety monitoring tasks and global collaboration and coordination. On the former desire, the intentions are to track the behaviour of the assigned sub-system and to provide the operators with alarms, assessment, guidance, and diagnostics and achieve automatic fault controlling. On the latter desire, the intention would be achieved by (a) informing the parent about the new states; (b) telling or asking the siblings about global sensory measurements.
Each Ss-MAG of the levels extending from level2 to leveln-1, would have its perception by (a) perceiving its own portion of the DMM which consists of a state-machine of the assigned sub-system, and (b) messages received from the parent and the children to tell about their new states. The main desires of the Ss-MAGs of those levels are to achieve local safety monitoring tasks and global collaboration. On the former desire, the intentions are to track the operational behaviour of the assigned sub-system and to provide the operators with assessment and guidance of their levels. On the latter desire, the intention would be achieved by telling, i.e. sending messages to, the parent and the children about the new states. The perceptions, desires and intentions of the S-MAG are similar to those of the Ss-MAGs of the levels extending from level2 to leveln-1. The only difference is that S-MAG has no parent to exchange messages with.
According to the Prometheus approach and notation for developing MaS [13], Fig. 3 shows the collaboration protocols among MAGs to track the operational behaviour of the monitored system. Fig. 4, similarly, shows the collaboration protocol among the Ss-MAGs of level1 in which they share their sensory measurements globally.
Desires (D)
Beliefs (B) Intentions (I)Perception
Messages to MAGs
Actions
Messages from MAGs
Deliberation Means-ends
Reasoning Cycle
Figure 2. A general illustration of the MAG.
Ss-MAGs of Level1 Ss-MAGs of Leveln-1 S-MAG
new_state(State_Name)
new_state(State_Name)
new_state(State_Name)
new_state(State_Name)
Figure 3. MAGs‟ collaboration protocol across the hierachical levels.
5Copyright (c) IARIA, 2011. ISBN: 978-1-61208-174-8
EMERGING 2011 : The Third International Conference on Emerging Network Intelligence
12 / 141
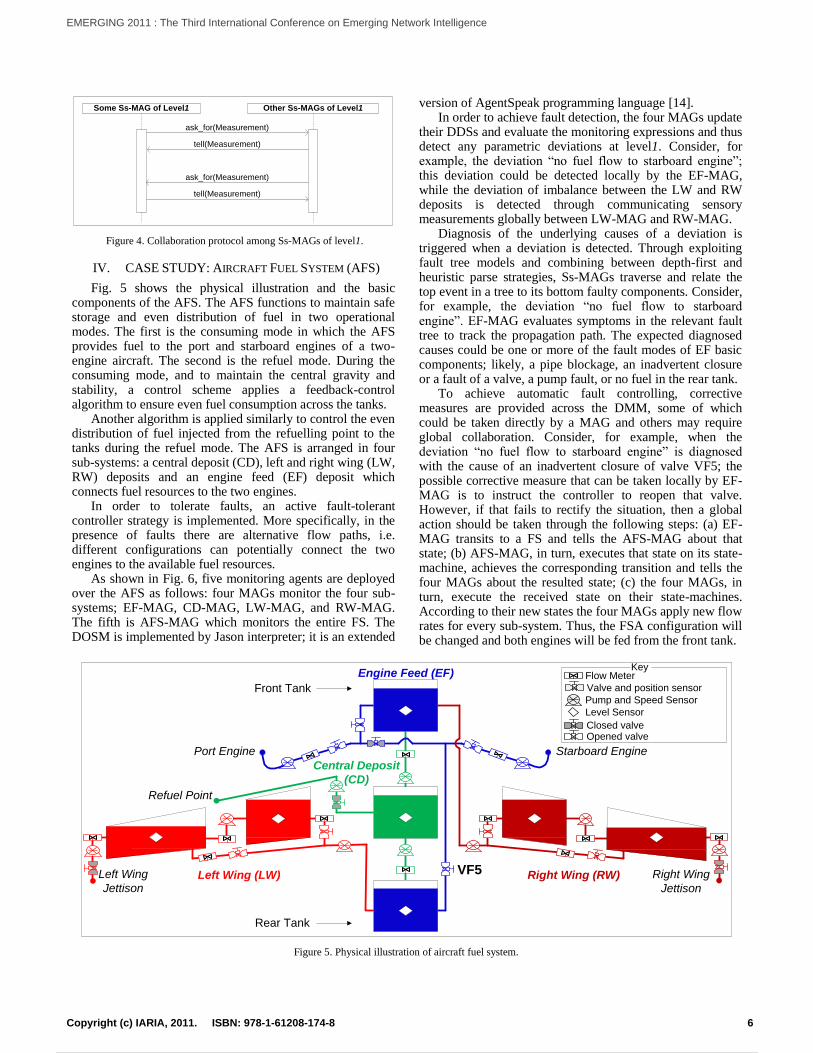
Some Ss-MAG of Level1 Other Ss-MAGs of Level1
ask_for(Measurement)
tell(Measurement)
tell(Measurement)
ask_for(Measurement)
Figure 4. Collaboration protocol among Ss-MAGs of level1.
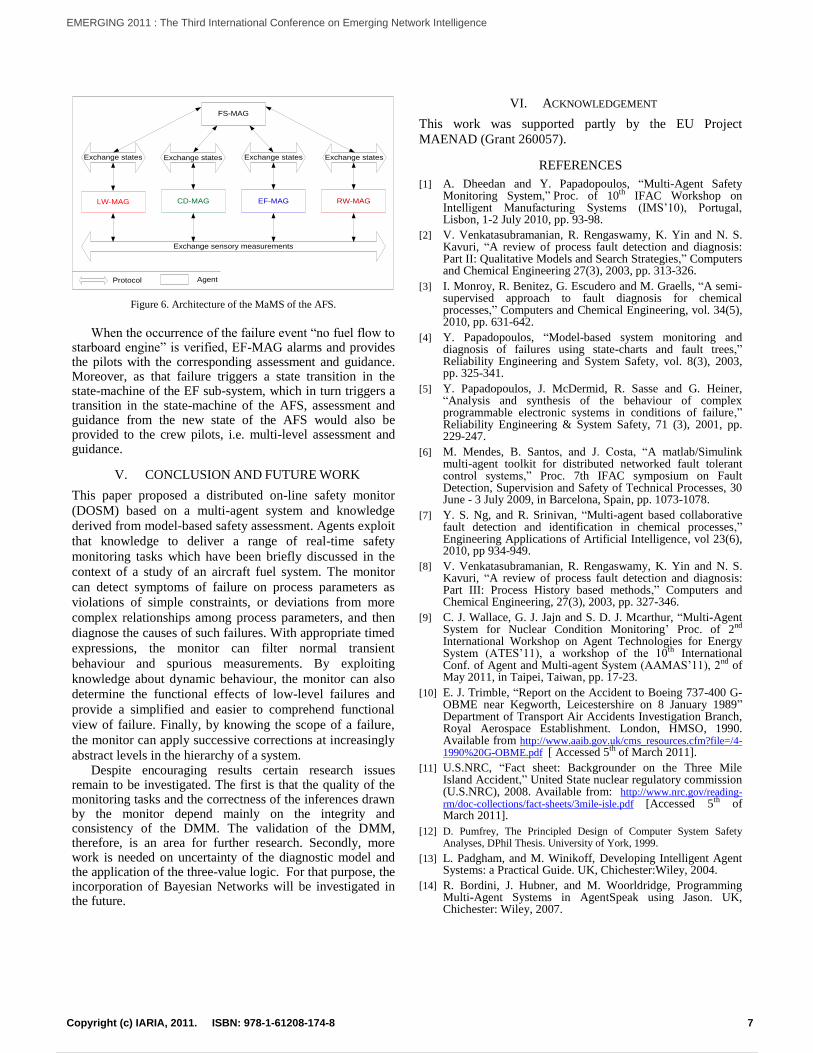
IV. CASE STUDY: AIRCRAFT FUEL SYSTEM (AFS)
Fig. 5 shows the physical illustration and the basic components of the AFS. The AFS functions to maintain safe storage and even distribution of fuel in two operational modes. The first is the consuming mode in which the AFS provides fuel to the port and starboard engines of a two-engine aircraft. The second is the refuel mode. During the consuming mode, and to maintain the central gravity and stability, a control scheme applies a feedback-control algorithm to ensure even fuel consumption across the tanks.
Another algorithm is applied similarly to control the even distribution of fuel injected from the refuelling point to the tanks during the refuel mode. The AFS is arranged in four sub-systems: a central deposit (CD), left and right wing (LW, RW) deposits and an engine feed (EF) deposit which connects fuel resources to the two engines.
In order to tolerate faults, an active fault-tolerant controller strategy is implemented. More specifically, in the presence of faults there are alternative flow paths, i.e. different configurations can potentially connect the two engines to the available fuel resources.
As shown in Fig. 6, five monitoring agents are deployed over the AFS as follows: four MAGs monitor the four sub-systems; EF-MAG, CD-MAG, LW-MAG, and RW-MAG. The fifth is AFS-MAG which monitors the entire FS. The DOSM is implemented by Jason interpreter; it is an extended
version of AgentSpeak programming language [14]. In order to achieve fault detection, the four MAGs update
their DDSs and evaluate the monitoring expressions and thus detect any parametric deviations at level1. Consider, for example, the deviation “no fuel flow to starboard engine”; this deviation could be detected locally by the EF-MAG, while the deviation of imbalance between the LW and RW deposits is detected through communicating sensory measurements globally between LW-MAG and RW-MAG.
Diagnosis of the underlying causes of a deviation is triggered when a deviation is detected. Through exploiting fault tree models and combining between depth-first and heuristic parse strategies, Ss-MAGs traverse and relate the top event in a tree to its bottom faulty components. Consider, for example, the deviation “no fuel flow to starboard engine”. EF-MAG evaluates symptoms in the relevant fault tree to track the propagation path. The expected diagnosed causes could be one or more of the fault modes of EF basic components; likely, a pipe blockage, an inadvertent closure or a fault of a valve, a pump fault, or no fuel in the rear tank.
To achieve automatic fault controlling, corrective measures are provided across the DMM, some of which could be taken directly by a MAG and others may require global collaboration. Consider, for example, when the deviation “no fuel flow to starboard engine” is diagnosed with the cause of an inadvertent closure of valve VF5; the possible corrective measure that can be taken locally by EF-MAG is to instruct the controller to reopen that valve. However, if that fails to rectify the situation, then a global action should be taken through the following steps: (a) EF-MAG transits to a FS and tells the AFS-MAG about that state; (b) AFS-MAG, in turn, executes that state on its state-machine, achieves the corresponding transition and tells the four MAGs about the resulted state; (c) the four MAGs, in turn, execute the received state on their state-machines. According to their new states the four MAGs apply new flow rates for every sub-system. Thus, the FSA configuration will be changed and both engines will be fed from the front tank.
Engine Feed (EF)
Right Wing (RW)
Starboard Engine Port Engine
Right Wing
Jettison
Refuel Point
Front Tank
Rear Tank
Left Wing
Jettison
Flow Meter
Valve and position sensor
Pump and Speed Sensor
Level Sensor
Key
Left Wing (LW)
Central Deposit
(CD)
Closed valve Opened valve
VF5
Figure 5. Physical illustration of aircraft fuel system.
6Copyright (c) IARIA, 2011. ISBN: 978-1-61208-174-8
EMERGING 2011 : The Third International Conference on Emerging Network Intelligence
13 / 141
FS-MAG
LW-MAG CD-MAG EF-MAG RW-MAG
Exchange sensory measurements
Exchange states Exchange states Exchange states
Protocol Agent
Exchange states
Figure 6. Architecture of the MaMS of the AFS.
When the occurrence of the failure event “no fuel flow to starboard engine” is verified, EF-MAG alarms and provides the pilots with the corresponding assessment and guidance. Moreover, as that failure triggers a state transition in the state-machine of the EF sub-system, which in turn triggers a transition in the state-machine of the AFS, assessment and guidance from the new state of the AFS would also be provided to the crew pilots, i.e. multi-level assessment and guidance.
V. CONCLUSION AND FUTURE WORK
This paper proposed a distributed on-line safety monitor
(DOSM) based on a multi-agent system and knowledge
derived from model-based safety assessment. Agents exploit
that knowledge to deliver a range of real-time safety
monitoring tasks which have been briefly discussed in the
context of a study of an aircraft fuel system. The monitor
can detect symptoms of failure on process parameters as
violations of simple constraints, or deviations from more
complex relationships among process parameters, and then
diagnose the causes of such failures. With appropriate timed
expressions, the monitor can filter normal transient
behaviour and spurious measurements. By exploiting
knowledge about dynamic behaviour, the monitor can also
determine the functional effects of low-level failures and
provide a simplified and easier to comprehend functional
view of failure. Finally, by knowing the scope of a failure,
the monitor can apply successive corrections at increasingly
abstract levels in the hierarchy of a system. Despite encouraging results certain research issues
remain to be investigated. The first is that the quality of the monitoring tasks and the correctness of the inferences drawn by the monitor depend mainly on the integrity and consistency of the DMM. The validation of the DMM, therefore, is an area for further research. Secondly, more work is needed on uncertainty of the diagnostic model and the application of the three-value logic. For that purpose, the incorporation of Bayesian Networks will be investigated in the future.
VI. ACKNOWLEDGEMENT
This work was supported partly by the EU Project
MAENAD (Grant 260057).
REFERENCES
[1] A. Dheedan and Y. Papadopoulos, “Multi-Agent Safety Monitoring System,” Proc. of 10th IFAC Workshop on Intelligent Manufacturing Systems (IMS‟10), Portugal, Lisbon, 1-2 July 2010, pp. 93-98.
[2] V. Venkatasubramanian, R. Rengaswamy, K. Yin and N. S. Kavuri, “A review of process fault detection and diagnosis: Part II: Qualitative Models and Search Strategies,” Computers and Chemical Engineering 27(3), 2003, pp. 313-326.
[3] I. Monroy, R. Benitez, G. Escudero and M. Graells, “A semi-supervised approach to fault diagnosis for chemical processes,” Computers and Chemical Engineering, vol. 34(5), 2010, pp. 631-642.
[4] Y. Papadopoulos, “Model-based system monitoring and diagnosis of failures using state-charts and fault trees,” Reliability Engineering and System Safety, vol. 8(3), 2003, pp. 325-341.
[5] Y. Papadopoulos, J. McDermid, R. Sasse and G. Heiner, “Analysis and synthesis of the behaviour of complex programmable electronic systems in conditions of failure,” Reliability Engineering & System Safety, 71 (3), 2001, pp. 229-247.
[6] M. Mendes, B. Santos, and J. Costa, “A matlab/Simulink multi-agent toolkit for distributed networked fault tolerant control systems,” Proc. 7th IFAC symposium on Fault Detection, Supervision and Safety of Technical Processes, 30 June - 3 July 2009, in Barcelona, Spain, pp. 1073-1078.
[7] Y. S. Ng, and R. Srinivan, “Multi-agent based collaborative fault detection and identification in chemical processes,” Engineering Applications of Artificial Intelligence, vol 23(6), 2010, pp 934-949.
[8] V. Venkatasubramanian, R. Rengaswamy, K. Yin and N. S. Kavuri, “A review of process fault detection and diagnosis: Part III: Process History based methods,” Computers and Chemical Engineering, 27(3), 2003, pp. 327-346.
[9] C. J. Wallace, G. J. Jajn and S. D. J. Mcarthur, “Multi-Agent System for Nuclear Condition Monitoring‟ Proc. of 2nd International Workshop on Agent Technologies for Energy System (ATES‟11), a workshop of the 10th International Conf. of Agent and Multi-agent System (AAMAS‟11), 2nd of May 2011, in Taipei, Taiwan, pp. 17-23.
[10] E. J. Trimble, “Report on the Accident to Boeing 737-400 G-OBME near Kegworth, Leicestershire on 8 January 1989” Department of Transport Air Accidents Investigation Branch, Royal Aerospace Establishment. London, HMSO, 1990. Available from http://www.aaib.gov.uk/cms_resources.cfm?file=/4-1990%20G-OBME.pdf [ Accessed 5th of March 2011].
[11] U.S.NRC, “Fact sheet: Backgrounder on the Three Mile Island Accident,” United State nuclear regulatory commission (U.S.NRC), 2008. Available from: http://www.nrc.gov/reading-rm/doc-collections/fact-sheets/3mile-isle.pdf [Accessed 5th of March 2011].
[12] D. Pumfrey, The Principled Design of Computer System Safety Analyses, DPhil Thesis. University of York, 1999.
[13] L. Padgham, and M. Winikoff, Developing Intelligent Agent Systems: a Practical Guide. UK, Chichester:Wiley, 2004.
[14] R. Bordini, J. Hubner, and M. Woorldridge, Programming Multi-Agent Systems in AgentSpeak using Jason. UK, Chichester: Wiley, 2007.
7Copyright (c) IARIA, 2011. ISBN: 978-1-61208-174-8
EMERGING 2011 : The Third International Conference on Emerging Network Intelligence
14 / 141
Distributed Service Discovery Architecture: A Bottom-Up Approach with Application Oriented
Networking
Haja M. Saleem* Computer and Information Sciences Universiti Teknologi PETRONAS
Perak, Malaysia *Dual Affiliation with Faculty of Information and
Communication Technology Universiti Tunku Abdul Rahman
Perak, Malaysia [email protected]
Mohd Fadzil Hassan1, Vijanth S. Asirvadam2 Computer and Information Sciences1, Fundamental and
Applied Science2 Universiti Teknologi PETRONAS
Perak, Malaysia mfadzil_hassan1, [email protected]
Abstract— Peer-to-Peer service discovery is the norms of today’s
Service Oriented Architecture. Efficiency and scalability of these
systems are adversely affected by the type of distributed
architecture, the query routing mechanism and the effective
usage of underlying network topology. Traditional query routing
mechanisms in distributed P2P systems function purely at the
overlay layer by isolating itself from the underlying IP layer that
degrades the performance due to large amount of inter-ISP
traffic and unbalanced utilization of underlay network links. In
this paper we address this problem by proposing novel
distributed service discovery architecture, which enhances
underlay awareness without the involvement of the overlay peers.
Our design starts from the underlay layer, which is built on top
of Application Oriented Networking (AON) backbone that
exploits message level routing. This feature is further leveraged
in the overlay layer with industry based classification of
published services, which complements the process of message
level routing. We present the conceptual design of our framework
and analyze its effectiveness. We argue that both performance
and scalability of the system are drastically improved by moving
down the overlay query routing mechanism to the IP layer.
Keywords-Web services; service discovery; AON; P2P; multicasting; clustering; SOA.
I. INTRODUCTION
In Service Oriented Architecture (SOA) the complexity of service composition increases proportionately with the increase in number of services. Efficient service discovery is one of the key aspects in automating the service composition process. Initially, SOA started with centralized service discovery. As more and more services are made available both from within and outside organizations, the centralized service discovery proved to be unsuccessful in terms of scalability and single point of failure [1], which paved the way for distributed approach.
Many approaches have been proposed earlier for the distributed service discovery which has its roots from Peer-to-
Peer (P2P) file sharing systems. Amongst various P2P approaches, only few are suitable to be implemented in the service discovery domain, as their target is file sharing applications, where file download efficiency is one of the major concerns. However this is not the case for the service discovery where other constrains such as range queries, service cost and multiple matches are taken into account. The current P2P systems have been mainly classified into three categories; unstructured, structured and hybrid. The main shortcoming of the unstructured systems is their scalability, whereas the structured systems are prone to complex administration and poor performances in dynamic environment [2]. On the other hand hybrid systems are focused towards key mapping mechanisms which are inclined towards the tightly controlled structured approach. In this paper our focus is towards unstructured systems which are widely deployed due to their flexibility with dynamic entry and exit options for the peers.
Currently, most of the query routing mechanisms are implemented in the overlay layer which result in IP-oblivious query forwarding. This leads to three major problems. First, it heavily increases the inter-ISP network traffic [3], which is expensive for the service providers. Second, the network links are not loaded in a balanced manner which ends up with poor performance and thirdly it introduces interlayer communication overhead. To alleviate these problems several contributions have been made in making the peers underlay aware while choosing their neighbors. However, these solutions just provide the network knowledge to the peers in the overlay and let the peers decide on their own [4]. Letting the peers aware of network related parameters may lead to privacy and security issues both for the peers and the ISPs.
To this end, our contribution in this paper focuses on enhancing underlay awareness without involving the overlay peers; and to implement IP layer multicasting with message
8Copyright (c) IARIA, 2011. ISBN: 978-1-61208-174-8
EMERGING 2011 : The Third International Conference on Emerging Network Intelligence
15 / 141
level intelligence. We argue that the performance can be drastically improved if the search mechanism is moved down to the underlay layer and seamlessly integrated with the Internet protocol (IP) layer.
We also argue that our architecture enhances the following characteristics of distributed service discovery, which are lacking in the current systems, 1. Non-involvement of peers in the locality aware query
forwarding that results in improved efficiency. 2. Increased peer privacy. 3. Increased response time with the elimination of interlayer
communication overhead. The rest of the paper is organized as follows. Section 2
discusses the related work, Section 3 demonstrates our design and analyzes the performance and Section 4 concludes the paper with future work.
II. RELATED WORK
Various approaches have been proposed and investigated towards improving the network layer awareness in query routing mechanisms.
TOPLUS [5] organizes peers into group of IP addresses and uses longest prefix match to determine the target node to forward the query. Here the peers use an API in the application layer to find the neighbor to forward the query. Their scope is not moving the routing decision functionality to the IP layer.
PIPPON [6] is closer to our effort in trying to match the overlay with the underlying network. The clustering mechanism in the overlay layer of PIPPON is based on network membership and proximity (latency). However, the similarity of the services provided is not taken into consideration in the cluster formation. Moreover, it ends up in a highly structured system with high administrative overhead.
The contribution made in [7] is a technique called biased neighbor selection. This technique works by selecting a certain number of neighboring peers within the same ISP and the remaining from different ISPs. This helps in reducing the inter-ISP traffic. This approach is well suited for file sharing systems like BitTorrent. However, the neighbors still functions at the overlay layer.
In [3], authors have discussed the problem space for the Application Layer Traffic Optimization (ALTO) working group, which is initiated by IETF. This approach allows the peer to choose the best target peer for file downloading by querying the ALTO service which has static topological information from the ISP. Here the ALTO service is provided as a complementary service to an existing DHT or a tracker service. The problem space here is the final downloading of the file and not the query search mechanism itself.
A framework that is used for conveying network layer information to the P2P applications has been proposed by P4P [4]. Peers make use of iTrackers and appTrackers to obtain the network information. The network information is used for the overlay query routing mechanism. However, the scope of the work is not in moving the query routing to the network layer which is the focus of our contribution.
Plethora [8] proposes a locality enhanced overlay network for semi-static peer to peer system. It is designed to have a two-level overlay that comprises a global overlay spanning all
nodes in the network, and a local overlay that is specific to the autonomous system (AS). This is highly structured and is not suitable for highly dynamic environments.
There has been substantial contribution made in clustering as well. One such recent contribution is [9]. Our contribution contrasts with this and all others in making network provider based clustering, which aids in reduction of number of super registries that needs to be handled by Application Oriented Networking (AON) multicasting.
Deploying message level intelligence in network layer multicasting and dealing with QoS requirements in the service discovery domain are discussed in [10-12]. In [13], authors have initiated the discussion of employing AON in the service discovery but have not given a concrete implementation model, which is where our contribution fits in. The increasing trends in deployment of AON in other areas of SOA are provided in [14].
III. ARCHITECTURE AND DESIGN
A. Design goals
The following goals are considered in our design. 1. Enhanced Security: To enhance the security of the
discovery system, network aware query routing is delegated to the underlying layer and is kept transparent to the overlay layer.
2. Reduced inter-ISP traffic: Another design focus is to let the query forwarding traffic enter the ISP domain only if it hosts the targeted service registry.
3. Minimized overlay process overhead: To eliminate the involvement of intermediate registries (peers) in query processing.
4. Interoperability: To integrate seamlessly with non-AON routers, if encountered, along the path of query forwarding.
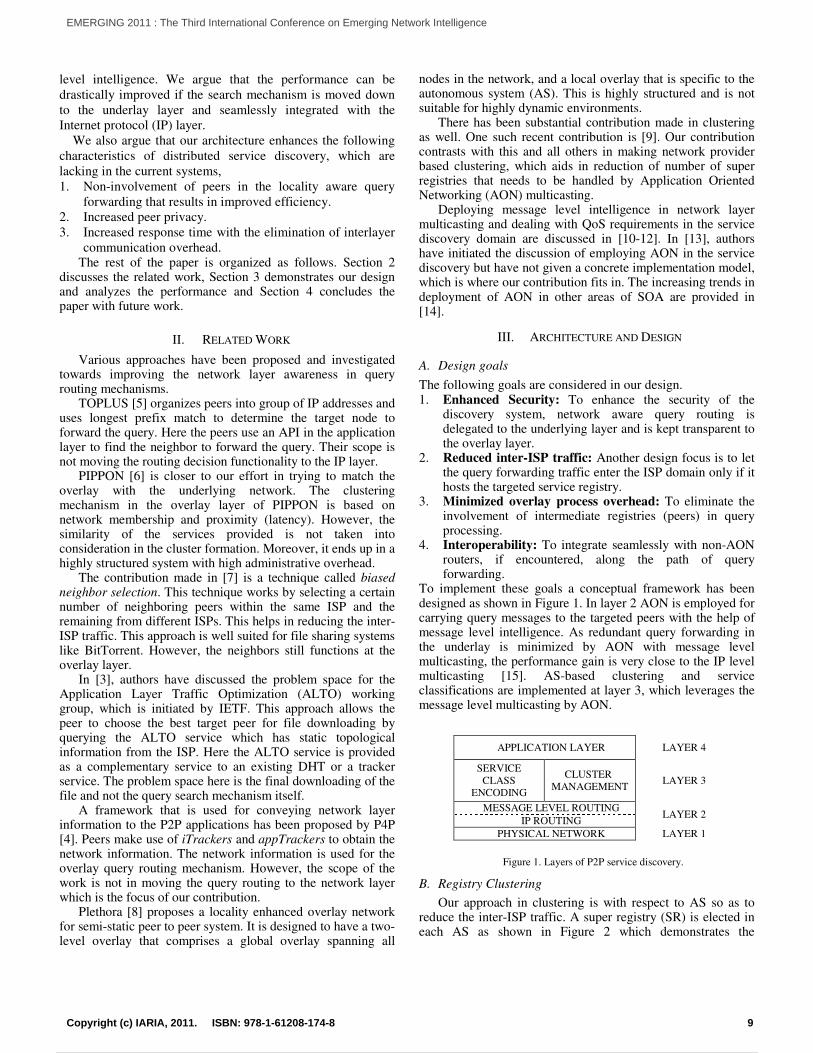
To implement these goals a conceptual framework has been designed as shown in Figure 1. In layer 2 AON is employed for carrying query messages to the targeted peers with the help of message level intelligence. As redundant query forwarding in the underlay is minimized by AON with message level multicasting, the performance gain is very close to the IP level multicasting [15]. AS-based clustering and service classifications are implemented at layer 3, which leverages the message level multicasting by AON.
APPLICATION LAYER LAYER 4
SERVICE CLASS
ENCODING
CLUSTER MANAGEMENT
LAYER 3
MESSAGE LEVEL ROUTING LAYER 2
IP ROUTING PHYSICAL NETWORK LAYER 1
Figure 1. Layers of P2P service discovery.
B. Registry Clustering
Our approach in clustering is with respect to AS so as to reduce the inter-ISP traffic. A super registry (SR) is elected in each AS as shown in Figure 2 which demonstrates the
9Copyright (c) IARIA, 2011. ISBN: 978-1-61208-174-8
EMERGING 2011 : The Third International Conference on Emerging Network Intelligence
16 / 141
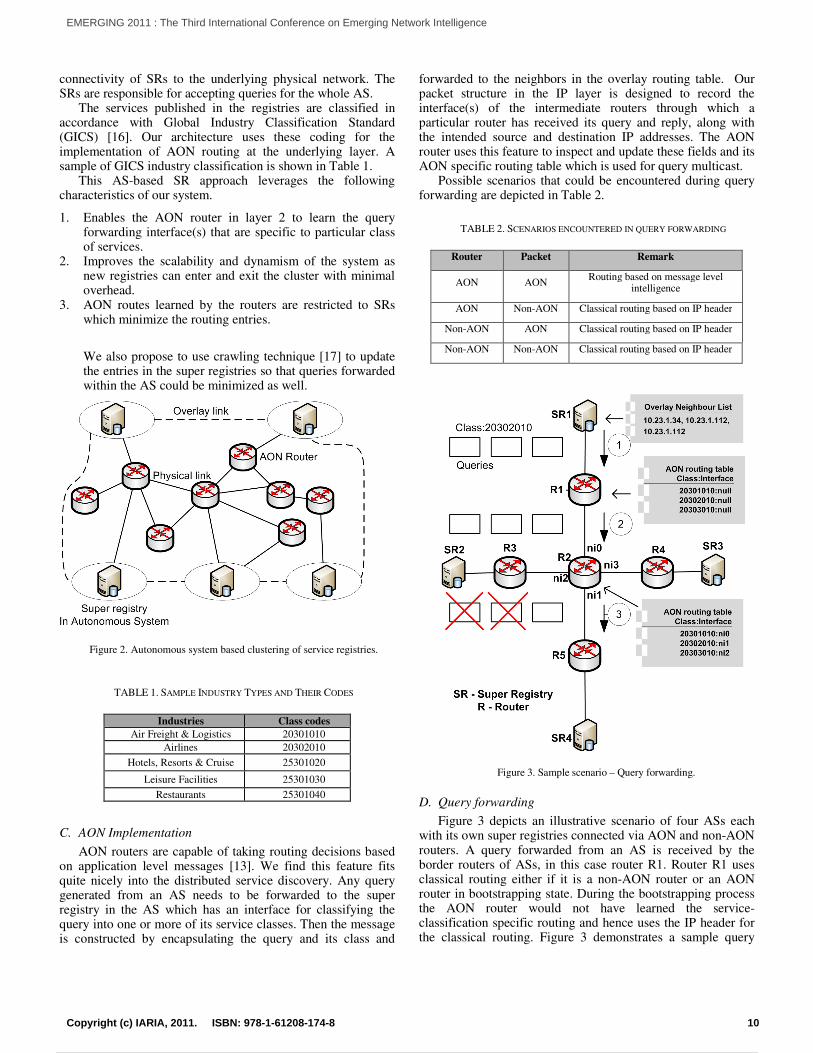
connectivity of SRs to the underlying physical network. The SRs are responsible for accepting queries for the whole AS.
The services published in the registries are classified in accordance with Global Industry Classification Standard (GICS) [16]. Our architecture uses these coding for the implementation of AON routing at the underlying layer. A sample of GICS industry classification is shown in Table 1.
This AS-based SR approach leverages the following characteristics of our system.
1. Enables the AON router in layer 2 to learn the query forwarding interface(s) that are specific to particular class of services.
2. Improves the scalability and dynamism of the system as new registries can enter and exit the cluster with minimal overhead.
3. AON routes learned by the routers are restricted to SRs which minimize the routing entries.
We also propose to use crawling technique [17] to update the entries in the super registries so that queries forwarded within the AS could be minimized as well.
Figure 2. Autonomous system based clustering of service registries.
TABLE 1. SAMPLE INDUSTRY TYPES AND THEIR CODES
Industries Class codes
Air Freight & Logistics 20301010 Airlines 20302010
Hotels, Resorts & Cruise 25301020
Leisure Facilities 25301030
Restaurants 25301040
C. AON Implementation
AON routers are capable of taking routing decisions based on application level messages [13]. We find this feature fits quite nicely into the distributed service discovery. Any query generated from an AS needs to be forwarded to the super registry in the AS which has an interface for classifying the query into one or more of its service classes. Then the message is constructed by encapsulating the query and its class and
forwarded to the neighbors in the overlay routing table. Our packet structure in the IP layer is designed to record the interface(s) of the intermediate routers through which a particular router has received its query and reply, along with the intended source and destination IP addresses. The AON router uses this feature to inspect and update these fields and its AON specific routing table which is used for query multicast.
Possible scenarios that could be encountered during query forwarding are depicted in Table 2.
TABLE 2. SCENARIOS ENCOUNTERED IN QUERY FORWARDING
Router Packet Remark
AON AON Routing based on message level
intelligence
AON Non-AON Classical routing based on IP header
Non-AON AON Classical routing based on IP header
Non-AON Non-AON Classical routing based on IP header
Figure 3. Sample scenario – Query forwarding.
D. Query forwarding
Figure 3 depicts an illustrative scenario of four ASs each with its own super registries connected via AON and non-AON routers. A query forwarded from an AS is received by the border routers of ASs, in this case router R1. Router R1 uses classical routing either if it is a non-AON router or an AON router in bootstrapping state. During the bootstrapping process the AON router would not have learned the service-classification specific routing and hence uses the IP header for the classical routing. Figure 3 demonstrates a sample query
10Copyright (c) IARIA, 2011. ISBN: 978-1-61208-174-8
EMERGING 2011 : The Third International Conference on Emerging Network Intelligence
17 / 141
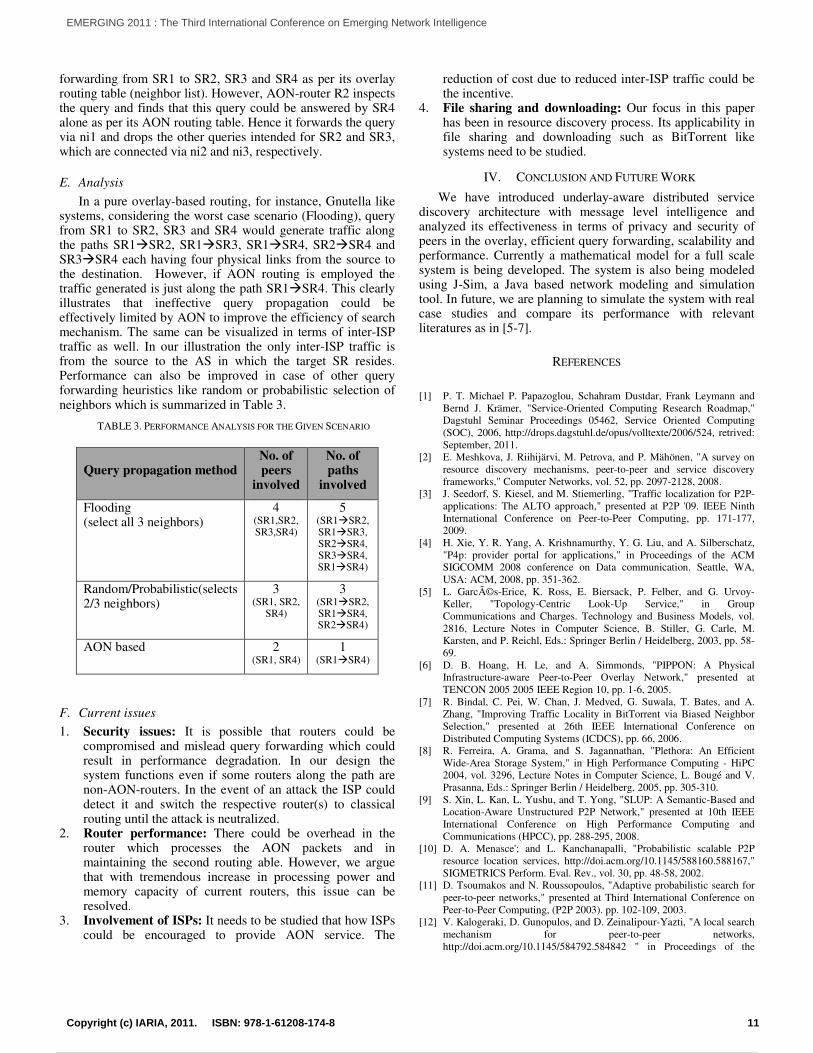
forwarding from SR1 to SR2, SR3 and SR4 as per its overlay routing table (neighbor list). However, AON-router R2 inspects the query and finds that this query could be answered by SR4 alone as per its AON routing table. Hence it forwards the query via ni1 and drops the other queries intended for SR2 and SR3, which are connected via ni2 and ni3, respectively.
E. Analysis
In a pure overlay-based routing, for instance, Gnutella like systems, considering the worst case scenario (Flooding), query from SR1 to SR2, SR3 and SR4 would generate traffic along the paths SR1SR2, SR1SR3, SR1SR4, SR2SR4 and SR3SR4 each having four physical links from the source to the destination. However, if AON routing is employed the traffic generated is just along the path SR1SR4. This clearly illustrates that ineffective query propagation could be effectively limited by AON to improve the efficiency of search mechanism. The same can be visualized in terms of inter-ISP traffic as well. In our illustration the only inter-ISP traffic is from the source to the AS in which the target SR resides. Performance can also be improved in case of other query forwarding heuristics like random or probabilistic selection of neighbors which is summarized in Table 3.
TABLE 3. PERFORMANCE ANALYSIS FOR THE GIVEN SCENARIO
Query propagation method No. of peers
involved
No. of paths
involved
Flooding (select all 3 neighbors)
4 (SR1,SR2, SR3,SR4)
5 (SR1SR2, SR1SR3, SR2SR4, SR3SR4, SR1SR4)
Random/Probabilistic(selects 2/3 neighbors)
3 (SR1, SR2,
SR4)
3 (SR1SR2, SR1SR4, SR2SR4)
AON based 2 (SR1, SR4)
1 (SR1SR4)
F. Current issues
1. Security issues: It is possible that routers could be compromised and mislead query forwarding which could result in performance degradation. In our design the system functions even if some routers along the path are non-AON-routers. In the event of an attack the ISP could detect it and switch the respective router(s) to classical routing until the attack is neutralized.
2. Router performance: There could be overhead in the router which processes the AON packets and in maintaining the second routing able. However, we argue that with tremendous increase in processing power and memory capacity of current routers, this issue can be resolved.
3. Involvement of ISPs: It needs to be studied that how ISPs could be encouraged to provide AON service. The
reduction of cost due to reduced inter-ISP traffic could be the incentive.
4. File sharing and downloading: Our focus in this paper has been in resource discovery process. Its applicability in file sharing and downloading such as BitTorrent like systems need to be studied.
IV. CONCLUSION AND FUTURE WORK
We have introduced underlay-aware distributed service discovery architecture with message level intelligence and analyzed its effectiveness in terms of privacy and security of peers in the overlay, efficient query forwarding, scalability and performance. Currently a mathematical model for a full scale system is being developed. The system is also being modeled using J-Sim, a Java based network modeling and simulation tool. In future, we are planning to simulate the system with real case studies and compare its performance with relevant literatures as in [5-7].
REFERENCES
[1] P. T. Michael P. Papazoglou, Schahram Dustdar, Frank Leymann and
Bernd J. Krämer, "Service-Oriented Computing Research Roadmap," Dagstuhl Seminar Proceedings 05462, Service Oriented Computing (SOC), 2006, http://drops.dagstuhl.de/opus/volltexte/2006/524, retrived: September, 2011.
[2] E. Meshkova, J. Riihijärvi, M. Petrova, and P. Mähönen, "A survey on resource discovery mechanisms, peer-to-peer and service discovery frameworks," Computer Networks, vol. 52, pp. 2097-2128, 2008.
[3] J. Seedorf, S. Kiesel, and M. Stiemerling, "Traffic localization for P2P-applications: The ALTO approach," presented at P2P '09. IEEE Ninth International Conference on Peer-to-Peer Computing, pp. 171-177, 2009.
[4] H. Xie, Y. R. Yang, A. Krishnamurthy, Y. G. Liu, and A. Silberschatz, "P4p: provider portal for applications," in Proceedings of the ACM SIGCOMM 2008 conference on Data communication. Seattle, WA, USA: ACM, 2008, pp. 351-362.
[5] L. Garcés-Erice, K. Ross, E. Biersack, P. Felber, and G. Urvoy-Keller, "Topology-Centric Look-Up Service," in Group Communications and Charges. Technology and Business Models, vol. 2816, Lecture Notes in Computer Science, B. Stiller, G. Carle, M. Karsten, and P. Reichl, Eds.: Springer Berlin / Heidelberg, 2003, pp. 58-69.
[6] D. B. Hoang, H. Le, and A. Simmonds, "PIPPON: A Physical Infrastructure-aware Peer-to-Peer Overlay Network," presented at TENCON 2005 2005 IEEE Region 10, pp. 1-6, 2005.
[7] R. Bindal, C. Pei, W. Chan, J. Medved, G. Suwala, T. Bates, and A. Zhang, "Improving Traffic Locality in BitTorrent via Biased Neighbor Selection," presented at 26th IEEE International Conference on Distributed Computing Systems (ICDCS), pp. 66, 2006.
[8] R. Ferreira, A. Grama, and S. Jagannathan, "Plethora: An Efficient Wide-Area Storage System," in High Performance Computing - HiPC 2004, vol. 3296, Lecture Notes in Computer Science, L. Bougé and V. Prasanna, Eds.: Springer Berlin / Heidelberg, 2005, pp. 305-310.
[9] S. Xin, L. Kan, L. Yushu, and T. Yong, "SLUP: A Semantic-Based and Location-Aware Unstructured P2P Network," presented at 10th IEEE International Conference on High Performance Computing and Communications (HPCC), pp. 288-295, 2008.
[10] D. A. Menasce'; and L. Kanchanapalli, "Probabilistic scalable P2P resource location services, http://doi.acm.org/10.1145/588160.588167," SIGMETRICS Perform. Eval. Rev., vol. 30, pp. 48-58, 2002.
[11] D. Tsoumakos and N. Roussopoulos, "Adaptive probabilistic search for peer-to-peer networks," presented at Third International Conference on Peer-to-Peer Computing, (P2P 2003). pp. 102-109, 2003.
[12] V. Kalogeraki, D. Gunopulos, and D. Zeinalipour-Yazti, "A local search mechanism for peer-to-peer networks, http://doi.acm.org/10.1145/584792.584842 " in Proceedings of the
11Copyright (c) IARIA, 2011. ISBN: 978-1-61208-174-8
EMERGING 2011 : The Third International Conference on Emerging Network Intelligence
18 / 141

eleventh international conference on Information and knowledge management McLean, Virginia, USA ACM, 2002 pp. 300-307
[13] I. I. o. T. Yu Cheng, U. o. T. Alberto Leon-Garcia, and U. o. C. Ian Foster, "Toward an Autonomic Service Management Framework: A Holistic Vision of SOA, AON, and Autonomic Computing," IEEE Communications Magazine, vol. 46, pp. 138-146, 2008.
[14] "http://soa.sys-con.com/node/155657", retrived: September, 2011. [15] X. Tian, Y. Cheng, K. Ren, and B. Liu, "Multicast with an Application-
Oriented Networking (AON) Approach," presented at IEEE International Conference on Communications, ICC '08, pp. 5646-5651, 2008.
[16] "http://www.mscibarra.com/products/indices/gics/", retrived: September, 2011.
[17] E. Al-Masri and Q. H. Mahmoud, "WSCE: A Crawler Engine for Large-Scale Discovery of Web Services," presented at IEEE International Conference on Web Services, ICWS 2007, pp. 1104-1111, 2007.
12Copyright (c) IARIA, 2011. ISBN: 978-1-61208-174-8
EMERGING 2011 : The Third International Conference on Emerging Network Intelligence
19 / 141
The Interoperability Challenge for Autonomic Computing
Richard John Anthony The University of Greenwich
Park Row, Greenwich
London SE10 9LS, UK
+44 (0) 208 331 8482
Mariusz Pelc The University of Greenwich
Park Row, Greenwich
London SE10 9LS, UK
+44 (0) 208 331 8588
Haffiz Shuaib The University of Greenwich
Park Row, Greenwich
London SE10 9LS, UK
+44 (0) 208 331 8588
Abstract - Interoperability is an emerging need for autonomic
computing systems, which stems from the very success of these
systems. Autonomic computing is increasingly popular; soon
autonomic control components will be commonplace, and
present in almost every large or complex application. This
inevitably leads to situations where multiple autonomic
components coexist and interact either directly or indirectly
within the same application or system. Problems can arise
when numerous independently designed autonomic components
interact. We advocate a service-based approach to
interoperability and present a set of requirements for such an
approach. We briefly present a universal interoperability
service which automatically discovers and manages potential
conflicts between manager components.
Keywords - Autonomic systems, Interoperability, Services
I. INTRODUCTION
Autonomic Computing (AC) is increasingly popular, and
has become a mainstream concept. Autonomic components
will soon be commonplace and it is inevitable that there will
be an increasing trend of co-existence amongst autonomic
managers. As there are currently no universal standards for
autonomic systems design, or for the provision of
interoperability amongst managers, there can be no
guarantees that separately-designed managers will operate
harmoniously together. Almost all systems use multi-vendor
software solutions and this implies that there will be a great
variety of potential manager components existing, even for
any one specific function of a system. For many systems,
autonomic management will arrive incrementally; as new
functionality is introduced, and through upgrades of non-
managed components to new managed versions. In some
cases the introduction of management capabilities will not
be obvious – third party developers may deliver components
with internal management that is not exposed at interfaces
to other components.
Any multi-manager scenario leads to potential conflicts.
Direct conflicts occur where Autonomic Managers (AMs)
attempt to manage the same explicit resource. Indirect
conflicts arise when AMs control different resources, but
the management effects of one have an undesirable impact
on the management function of the other. This latter type of
conflict is expected to be the most frequent and problematic,
as there are such a wide variety of unpredictable ways in
which such conflicts can occur. The effects of indirect
conflict will also be less obvious to detect and harder to
diagnose than the direct conflicts. The effects of conflicts
can vary widely, including e.g., a cancellation effect of
opposing managers, and serious performance or stability
problems. The problem is illustrated with an example:
consider a system with two AMs: a Power Manager (PM1)
which shuts down servers that have been idle for a short
time; and a Performance Manager (PM2) which attempts to
maintain a pool of idle servers to ensure high
responsiveness to high priority applications. Each service
was developed and evaluated in isolation and both
performed perfectly, however the respective vendors did not
envisage that they would co-exist. Bringing a shutdown
server back on line has a latency of several seconds, thus
PM1’s ‘locally correct’ behaviour defeats PM2’s
contribution. As each manager is unaware of the presence
and behaviour of the other, the problem can only be
resolved if an external agent (such as a human system
manager) can detect, diagnose, and identify a solution to the
problem.
The contributions of this paper include: firstly we
evaluate the nature and scope of the interoperability
challenge for autonomic systems and identify a set of
requirements for a universal solution (section III). We
present a work-in-progress service-based interoperability
service which enables exploration of these requirements
(section IV). Section V outlines a management description
language which is intended for use by developers to ensure
consistent description of AMs’ management capabilities.
Automatic detection of management conflicts is discussed
in section VI. The interoperability service is evaluated in
section VII and finally we conclude (section VIII).
II. BACKGROUND
A clear demonstration of the need for interoperability
mechanisms is provided in [1] where two independently-
developed autonomic managers were implemented. The first
dealt with application resource management, specifically
CPU usage optimization. The second, the power manager,
was responsible for modulating the operating frequency of
the CPU to ensure that the power cap was not exceeded. It
was shown that without a means to interact, both managers
throttled and sped up the CPU without recourse to one
another, thereby failing to achieve their intended
13Copyright (c) IARIA, 2011. ISBN: 978-1-61208-174-8
EMERGING 2011 : The Third International Conference on Emerging Network Intelligence
20 / 141
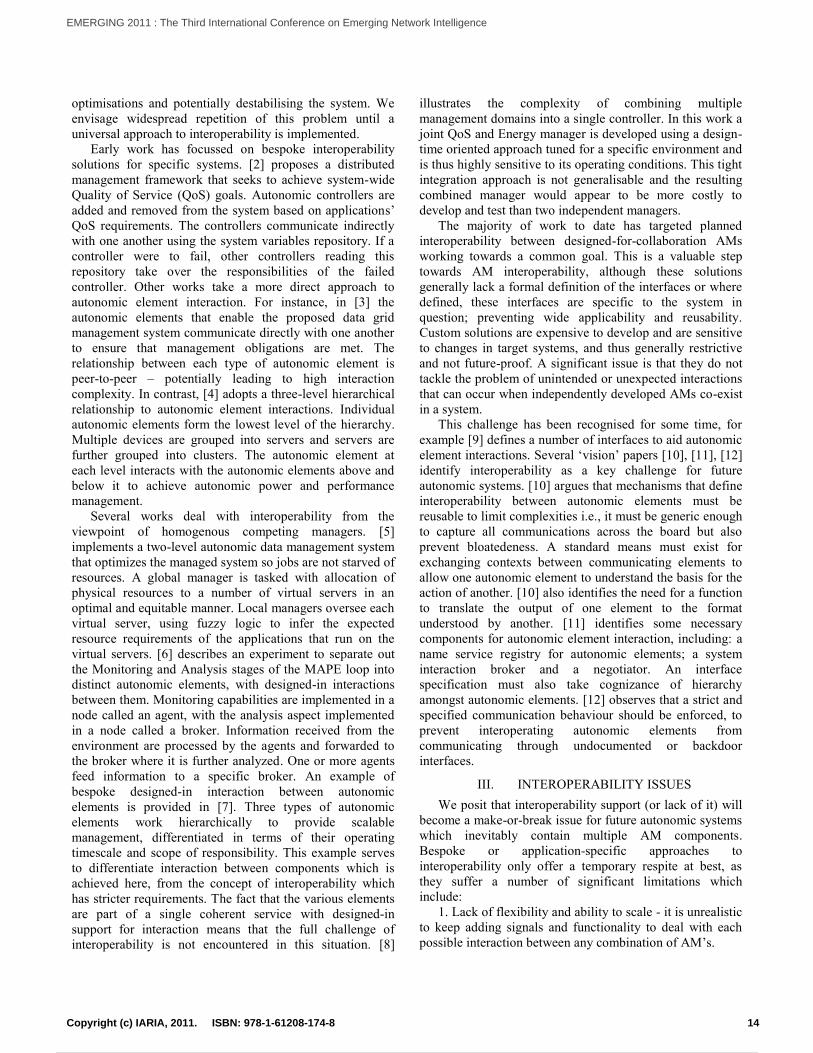
optimisations and potentially destabilising the system. We
envisage widespread repetition of this problem until a
universal approach to interoperability is implemented.
Early work has focussed on bespoke interoperability
solutions for specific systems. [2] proposes a distributed
management framework that seeks to achieve system-wide
Quality of Service (QoS) goals. Autonomic controllers are
added and removed from the system based on applications’
QoS requirements. The controllers communicate indirectly
with one another using the system variables repository. If a
controller were to fail, other controllers reading this
repository take over the responsibilities of the failed
controller. Other works take a more direct approach to
autonomic element interaction. For instance, in [3] the
autonomic elements that enable the proposed data grid
management system communicate directly with one another
to ensure that management obligations are met. The
relationship between each type of autonomic element is
peer-to-peer – potentially leading to high interaction
complexity. In contrast, [4] adopts a three-level hierarchical
relationship to autonomic element interactions. Individual
autonomic elements form the lowest level of the hierarchy.
Multiple devices are grouped into servers and servers are
further grouped into clusters. The autonomic element at
each level interacts with the autonomic elements above and
below it to achieve autonomic power and performance
management.
Several works deal with interoperability from the
viewpoint of homogenous competing managers. [5]
implements a two-level autonomic data management system
that optimizes the managed system so jobs are not starved of
resources. A global manager is tasked with allocation of
physical resources to a number of virtual servers in an
optimal and equitable manner. Local managers oversee each
virtual server, using fuzzy logic to infer the expected
resource requirements of the applications that run on the
virtual servers. [6] describes an experiment to separate out
the Monitoring and Analysis stages of the MAPE loop into
distinct autonomic elements, with designed-in interactions
between them. Monitoring capabilities are implemented in a
node called an agent, with the analysis aspect implemented
in a node called a broker. Information received from the
environment are processed by the agents and forwarded to
the broker where it is further analyzed. One or more agents
feed information to a specific broker. An example of
bespoke designed-in interaction between autonomic
elements is provided in [7]. Three types of autonomic
elements work hierarchically to provide scalable
management, differentiated in terms of their operating
timescale and scope of responsibility. This example serves
to differentiate interaction between components which is
achieved here, from the concept of interoperability which
has stricter requirements. The fact that the various elements
are part of a single coherent service with designed-in
support for interaction means that the full challenge of
interoperability is not encountered in this situation. [8]
illustrates the complexity of combining multiple
management domains into a single controller. In this work a
joint QoS and Energy manager is developed using a design-
time oriented approach tuned for a specific environment and
is thus highly sensitive to its operating conditions. This tight
integration approach is not generalisable and the resulting
combined manager would appear to be more costly to
develop and test than two independent managers.
The majority of work to date has targeted planned
interoperability between designed-for-collaboration AMs
working towards a common goal. This is a valuable step
towards AM interoperability, although these solutions
generally lack a formal definition of the interfaces or where
defined, these interfaces are specific to the system in
question; preventing wide applicability and reusability.
Custom solutions are expensive to develop and are sensitive
to changes in target systems, and thus generally restrictive
and not future-proof. A significant issue is that they do not
tackle the problem of unintended or unexpected interactions
that can occur when independently developed AMs co-exist
in a system.
This challenge has been recognised for some time, for
example [9] defines a number of interfaces to aid autonomic
element interactions. Several ‘vision’ papers [10], [11], [12]
identify interoperability as a key challenge for future
autonomic systems. [10] argues that mechanisms that define
interoperability between autonomic elements must be
reusable to limit complexities i.e., it must be generic enough
to capture all communications across the board but also
prevent bloatedeness. A standard means must exist for
exchanging contexts between communicating elements to
allow one autonomic element to understand the basis for the
action of another. [10] also identifies the need for a function
to translate the output of one element to the format
understood by another. [11] identifies some necessary
components for autonomic element interaction, including: a
name service registry for autonomic elements; a system
interaction broker and a negotiator. An interface
specification must also take cognizance of hierarchy
amongst autonomic elements. [12] observes that a strict and
specified communication behaviour should be enforced, to
prevent interoperating autonomic elements from
communicating through undocumented or backdoor
interfaces.
III. INTEROPERABILITY ISSUES
We posit that interoperability support (or lack of it) will
become a make-or-break issue for future autonomic systems
which inevitably contain multiple AM components.
Bespoke or application-specific approaches to
interoperability only offer a temporary respite at best, as
they suffer a number of significant limitations which
include:
1. Lack of flexibility and ability to scale - it is unrealistic
to keep adding signals and functionality to deal with each
possible interaction between any combination of AM’s.
14Copyright (c) IARIA, 2011. ISBN: 978-1-61208-174-8
EMERGING 2011 : The Third International Conference on Emerging Network Intelligence
21 / 141
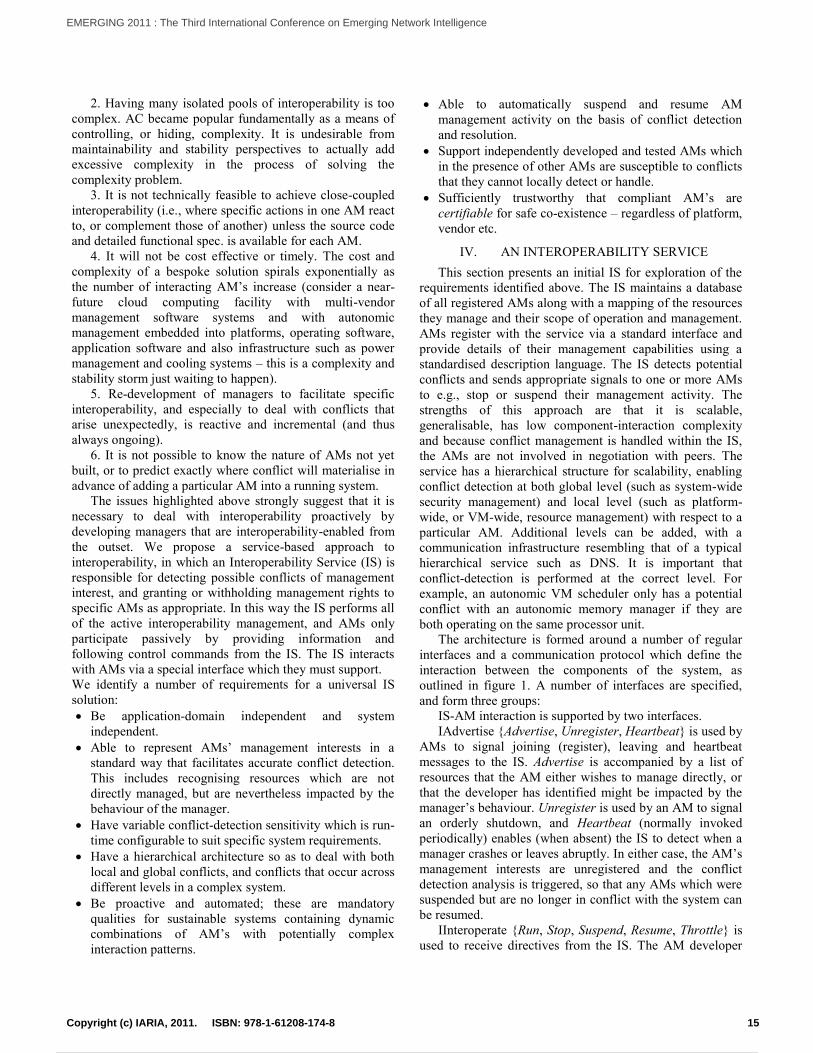
2. Having many isolated pools of interoperability is too
complex. AC became popular fundamentally as a means of
controlling, or hiding, complexity. It is undesirable from
maintainability and stability perspectives to actually add
excessive complexity in the process of solving the
complexity problem.
3. It is not technically feasible to achieve close-coupled
interoperability (i.e., where specific actions in one AM react
to, or complement those of another) unless the source code
and detailed functional spec. is available for each AM.
4. It will not be cost effective or timely. The cost and
complexity of a bespoke solution spirals exponentially as
the number of interacting AM’s increase (consider a near-
future cloud computing facility with multi-vendor
management software systems and with autonomic
management embedded into platforms, operating software,
application software and also infrastructure such as power
management and cooling systems – this is a complexity and
stability storm just waiting to happen).
5. Re-development of managers to facilitate specific
interoperability, and especially to deal with conflicts that
arise unexpectedly, is reactive and incremental (and thus
always ongoing).
6. It is not possible to know the nature of AMs not yet
built, or to predict exactly where conflict will materialise in
advance of adding a particular AM into a running system.
The issues highlighted above strongly suggest that it is
necessary to deal with interoperability proactively by
developing managers that are interoperability-enabled from
the outset. We propose a service-based approach to
interoperability, in which an Interoperability Service (IS) is
responsible for detecting possible conflicts of management
interest, and granting or withholding management rights to
specific AMs as appropriate. In this way the IS performs all
of the active interoperability management, and AMs only
participate passively by providing information and
following control commands from the IS. The IS interacts
with AMs via a special interface which they must support.
We identify a number of requirements for a universal IS
solution:
Be application-domain independent and system
independent.
Able to represent AMs’ management interests in a
standard way that facilitates accurate conflict detection.
This includes recognising resources which are not
directly managed, but are nevertheless impacted by the
behaviour of the manager.
Have variable conflict-detection sensitivity which is run-
time configurable to suit specific system requirements.
Have a hierarchical architecture so as to deal with both
local and global conflicts, and conflicts that occur across
different levels in a complex system.
Be proactive and automated; these are mandatory
qualities for sustainable systems containing dynamic
combinations of AM’s with potentially complex
interaction patterns.
Able to automatically suspend and resume AM
management activity on the basis of conflict detection
and resolution.
Support independently developed and tested AMs which
in the presence of other AMs are susceptible to conflicts
that they cannot locally detect or handle.
Sufficiently trustworthy that compliant AM’s are
certifiable for safe co-existence – regardless of platform,
vendor etc.
IV. AN INTEROPERABILITY SERVICE
This section presents an initial IS for exploration of the
requirements identified above. The IS maintains a database
of all registered AMs along with a mapping of the resources
they manage and their scope of operation and management.
AMs register with the service via a standard interface and
provide details of their management capabilities using a
standardised description language. The IS detects potential
conflicts and sends appropriate signals to one or more AMs
to e.g., stop or suspend their management activity. The
strengths of this approach are that it is scalable,
generalisable, has low component-interaction complexity
and because conflict management is handled within the IS,
the AMs are not involved in negotiation with peers. The
service has a hierarchical structure for scalability, enabling
conflict detection at both global level (such as system-wide
security management) and local level (such as platform-
wide, or VM-wide, resource management) with respect to a
particular AM. Additional levels can be added, with a
communication infrastructure resembling that of a typical
hierarchical service such as DNS. It is important that
conflict-detection is performed at the correct level. For
example, an autonomic VM scheduler only has a potential
conflict with an autonomic memory manager if they are
both operating on the same processor unit.
The architecture is formed around a number of regular
interfaces and a communication protocol which define the
interaction between the components of the system, as
outlined in figure 1. A number of interfaces are specified,
and form three groups:
IS-AM interaction is supported by two interfaces.
IAdvertise Advertise, Unregister, Heartbeat is used by
AMs to signal joining (register), leaving and heartbeat
messages to the IS. Advertise is accompanied by a list of
resources that the AM either wishes to manage directly, or
that the developer has identified might be impacted by the
manager’s behaviour. Unregister is used by an AM to signal
an orderly shutdown, and Heartbeat (normally invoked
periodically) enables (when absent) the IS to detect when a
manager crashes or leaves abruptly. In either case, the AM’s
management interests are unregistered and the conflict
detection analysis is triggered, so that any AMs which were
suspended but are no longer in conflict with the system can
be resumed.
IInteroperate Run, Stop, Suspend, Resume, Throttle is
used to receive directives from the IS. The AM developer
15Copyright (c) IARIA, 2011. ISBN: 978-1-61208-174-8
EMERGING 2011 : The Third International Conference on Emerging Network Intelligence
22 / 141
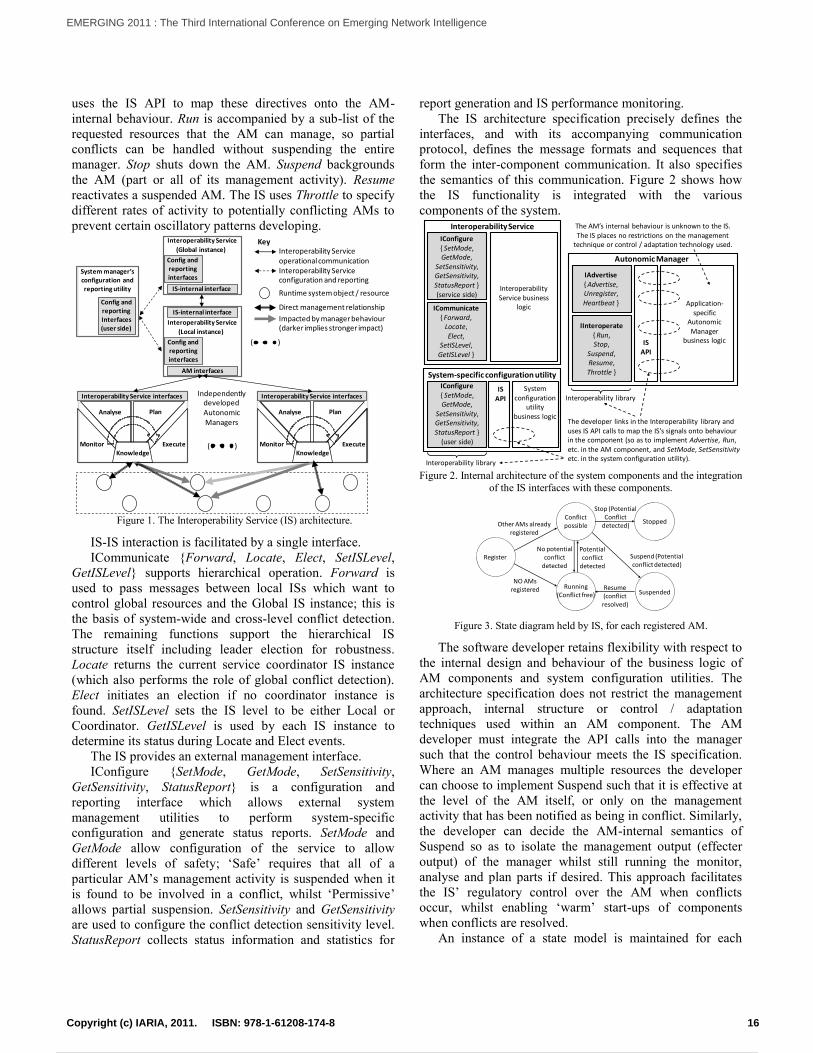
uses the IS API to map these directives onto the AM-
internal behaviour. Run is accompanied by a sub-list of the
requested resources that the AM can manage, so partial
conflicts can be handled without suspending the entire
manager. Stop shuts down the AM. Suspend backgrounds
the AM (part or all of its management activity). Resume
reactivates a suspended AM. The IS uses Throttle to specify
different rates of activity to potentially conflicting AMs to
prevent certain oscillatory patterns developing.
Figure 1. The Interoperability Service (IS) architecture.
IS-IS interaction is facilitated by a single interface.
ICommunicate Forward, Locate, Elect, SetISLevel,
GetISLevel supports hierarchical operation. Forward is
used to pass messages between local ISs which want to
control global resources and the Global IS instance; this is
the basis of system-wide and cross-level conflict detection.
The remaining functions support the hierarchical IS
structure itself including leader election for robustness.
Locate returns the current service coordinator IS instance
(which also performs the role of global conflict detection).
Elect initiates an election if no coordinator instance is
found. SetISLevel sets the IS level to be either Local or
Coordinator. GetISLevel is used by each IS instance to
determine its status during Locate and Elect events.
The IS provides an external management interface.
IConfigure SetMode, GetMode, SetSensitivity,
GetSensitivity, StatusReport is a configuration and
reporting interface which allows external system
management utilities to perform system-specific
configuration and generate status reports. SetMode and
GetMode allow configuration of the service to allow
different levels of safety; ‘Safe’ requires that all of a
particular AM’s management activity is suspended when it
is found to be involved in a conflict, whilst ‘Permissive’
allows partial suspension. SetSensitivity and GetSensitivity
are used to configure the conflict detection sensitivity level.
StatusReport collects status information and statistics for
report generation and IS performance monitoring.
The IS architecture specification precisely defines the
interfaces, and with its accompanying communication
protocol, defines the message formats and sequences that
form the inter-component communication. It also specifies
the semantics of this communication. Figure 2 shows how
the IS functionality is integrated with the various
components of the system.
Figure 2. Internal architecture of the system components and the integration
of the IS interfaces with these components.
Figure 3. State diagram held by IS, for each registered AM.
The software developer retains flexibility with respect to
the internal design and behaviour of the business logic of
AM components and system configuration utilities. The
architecture specification does not restrict the management
approach, internal structure or control / adaptation
techniques used within an AM component. The AM
developer must integrate the API calls into the manager
such that the control behaviour meets the IS specification.
Where an AM manages multiple resources the developer
can choose to implement Suspend such that it is effective at
the level of the AM itself, or only on the management
activity that has been notified as being in conflict. Similarly,
the developer can decide the AM-internal semantics of
Suspend so as to isolate the management output (effecter
output) of the manager whilst still running the monitor,
analyse and plan parts if desired. This approach facilitates
the IS’ regulatory control over the AM when conflicts
occur, whilst enabling ‘warm’ start-ups of components
when conflicts are resolved.
An instance of a state model is maintained for each
IndependentlydevelopedAutonomic Managers
KeyInteroperability Serviceoperational communicationInteroperability Serviceconfiguration and reporting
Runtime system object / resource
Direct management relationship
Impacted by manager behaviour (darker implies stronger impact)
( )
( )
Interoperability Service
(Global instance)
IS-internal interface
Config and reportinginterfaces
System manager’s configuration and reporting utility
Config and reportingInterfaces (user side)
Knowledge
Analyse Plan
Monitor Execute
Interoperability Service interfaces
Knowledge
Analyse Plan
Monitor Execute
Interoperability Service interfaces
Interoperability Service
(Local instance)
AM interfaces
Config and reportinginterfaces
IS-internal interface
The developer links in the Interoperability library and uses IS API calls to map the IS’s signals onto behaviour in the component (so as to implement Advertise, Run, etc. in the AM component, and SetMode, SetSensitivityetc. in the system configuration utility).
Interoperability library
Interoperability Service business
logic
Interoperability Service
IConfigure SetMode, GetMode,
SetSensitivity, GetSensitivity, StatusReport (service side)
ICommunicate Forward,
Locate, Elect,
SetISLevel, GetISLevel
The AM’s internal behaviour is unknown to the IS.The IS places no restrictions on the management
technique or control / adaptation technology used.
ISAPI
Application-specific
Autonomic Manager
business logic
Autonomic Manager
IAdvertise Advertise, Unregister, Heartbeat
IInteroperate Run, Stop,
Suspend, Resume, Throttle
Interoperability library
System configuration
utilitybusiness logic
ISAPI
IConfigure SetMode, GetMode,
SetSensitivity, GetSensitivity, StatusReport
(user side)
System-specific configuration utility
Register
Running(Conflict free)
Conflictpossible
Suspended
StoppedOther AMs alreadyregistered
NO AMsregistered
No potential conflict
detected
Stop (PotentialConflict
detected)
Suspend (Potentialconflict detected)
Resume(conflictresolved)
Potential conflict
detected
16Copyright (c) IARIA, 2011. ISBN: 978-1-61208-174-8
EMERGING 2011 : The Third International Conference on Emerging Network Intelligence
23 / 141
registered AM (see figure 3). The information held in these
models drives the IS’ conflict management behaviour and is
the basis on which AMs’ management rights are governed.
During AM registration, if no other AMs are registered the
new AM is granted management rights for the resources
requested and signalled that it can Run. If other AMs are
already registered, the IS evaluates whether or not there is a
possible conflict of interest, and if so signals the AM to
either Stop (in which case the AM must attempt re-
registration at a later time driven by some external event) or
Suspend (in which case the IS will signal the AM that it can
Resume, i.e., manage, once the conflict has been resolved).
V. MANAGEMENT DESCRIPTION LANGUAGE
We discuss the need for a standard description of AMs’
management interests, and briefly introduce our current
language which is extensible to accommodate
improvements in our understanding of ways actual and
potential conflicts arise.
The IS facilitates interoperability amongst (unknown in
advance) AMs which have been developed independently of
each other, and thus do not directly support interoperability
amongst themselves. The overall goal is to maximise the
management freedom of AMs whilst at the same time
ensuring that the system remains stable; requiring that the IS
must also:
Detect AMs and learn their characteristics (via
registration);
Identify potential conflict, determine the consequences
and the level of risk, and achieve a system-specific
balance when taking decisions to resolve conflicts by
suspending or stopping AMs’ management activities;
Automatically resume suspended AMs when conflicts
are resolved (e.g., when other AMs leave the system);
Enable cooperation between AMs. For example to share
learnt knowledge concerning system state, volatility etc.
To perform these functions, the IS needs certain
information detailing each AMs’ management domain and
specific resources of interest. This information must use a
standard language format, and a fixed vocabulary of key
terms so that automated searching for overlaps of interest
can be performed effectively. The information will be
provided at run time by the AM via the IS API (the
information is provided ultimately by the AM developer).
Conflicts can arise in several ways. Direct conflicts
occur where multiple AMs attempt to manage the same
resource or object. However conflicts can be indirect (and
less obvious) because a manager’s activity may impact
resources other than those directly managed. Categories of
this include cross-application conflicts, for example
increasing a specific application’s use of a particular
resource such as network bandwidth reduces the availability
of bandwidth available to other applications. Another
category of indirect conflicts are cross-resource conflicts,
for example increasing processor speed to maximise
throughput increases direct power usage and may also
increase power requirements for cooling systems (which
may have their own autonomic management systems). Some
system characteristics such as security policy, power usage,
server provisioning strategy etc. may be managed at both
the system-wide level, and locally at the level of individual
computing node or cluster. This can lead to conflicts
between global and local managers, resulting in parts of the
system being out-of step with global policy, and/or
inefficient behaviour. It will be difficult to identify every
possible case of indirect conflict with certainty, and the
extent of management impact in such cases is also highly
variable. Therefore the description information provided by
AMs must be sufficient to derive a similarity measure
between their management interests and effects. The
language needs to contain appropriate categories to express
areas of management concern in a structured way, i.e., from
high-level domain in which the manager operates down to
specific resources that are managed, and also to express
characteristics including the management scope (global or
local) and specificity (e.g., organisation specific, application
specific).
Given these requirements, the standard management
description should include (see figures 4 and 5 for an
example):
Category. Mandatory. The highest-level and most generic
descriptor used to identify the AM’s domain of interest.
Terms include: Power general, Performance general,
Security general, ...
Zone. Mandatory. A second level, more specific sub-
category enabling developers to differentiate between
specific management functions. Terms include: Power
system, Power platform, Power cooling ... Performance
system, Performance CPU, Performance disk, Scheduling,
VM management, ...
Impact. Mandatory. A numerical indicator Impact Factor
(IF), (where 0 < IF ≤ 1), is defined to express the strength of
the management influence. A directly controlled resource is
assigned the value 1. A value close to 0 indicates that the
particular AM has a weak influence on the resource whilst
values close to 1 indicate that the resource is closely
impacted by changes to one that is directly managed by the
AM; for example an AM directly controlling CPU speed (IF
= 1) has a strong indirect influence on VM performance (IF
≈ 0.8). Term: ImpactFactor(value)
Scope. Mandatory. Whether the manager has local or global
impact. Terms: Local, Global
Specificity. Optional. The extent of manager operation.
Terms include: System-wide, Application-wide, Platform-
wide, Process-wide, User-specific, ...
Trigger. Optional. Facilitates expression of temporal
aspects such as periodicity or operating timescale, as well as
specific events that invoke the management activity. Such
characteristics can potentially be used to detect
combinations of AMs at risk of causing of instability in the
form of oscillation or control divergence. Terms include:
17Copyright (c) IARIA, 2011. ISBN: 978-1-61208-174-8
EMERGING 2011 : The Third International Conference on Emerging Network Intelligence
24 / 141
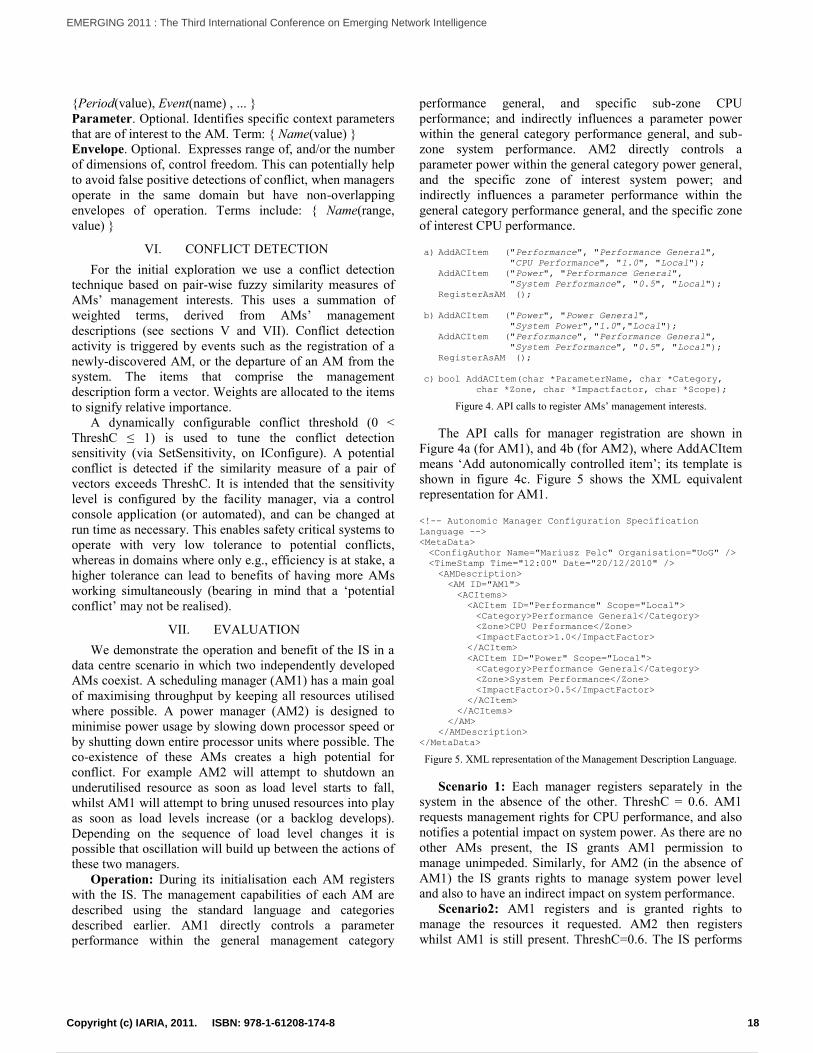
Period(value), Event(name) , ...
Parameter. Optional. Identifies specific context parameters
that are of interest to the AM. Term: Name(value)
Envelope. Optional. Expresses range of, and/or the number
of dimensions of, control freedom. This can potentially help
to avoid false positive detections of conflict, when managers
operate in the same domain but have non-overlapping
envelopes of operation. Terms include: Name(range,
value)
VI. CONFLICT DETECTION
For the initial exploration we use a conflict detection
technique based on pair-wise fuzzy similarity measures of
AMs’ management interests. This uses a summation of
weighted terms, derived from AMs’ management
descriptions (see sections V and VII). Conflict detection
activity is triggered by events such as the registration of a
newly-discovered AM, or the departure of an AM from the
system. The items that comprise the management
description form a vector. Weights are allocated to the items
to signify relative importance.
A dynamically configurable conflict threshold (0 <
ThreshC ≤ 1) is used to tune the conflict detection
sensitivity (via SetSensitivity, on IConfigure). A potential
conflict is detected if the similarity measure of a pair of
vectors exceeds ThreshC. It is intended that the sensitivity
level is configured by the facility manager, via a control
console application (or automated), and can be changed at
run time as necessary. This enables safety critical systems to
operate with very low tolerance to potential conflicts,
whereas in domains where only e.g., efficiency is at stake, a
higher tolerance can lead to benefits of having more AMs
working simultaneously (bearing in mind that a ‘potential
conflict’ may not be realised).
VII. EVALUATION
We demonstrate the operation and benefit of the IS in a
data centre scenario in which two independently developed
AMs coexist. A scheduling manager (AM1) has a main goal
of maximising throughput by keeping all resources utilised
where possible. A power manager (AM2) is designed to
minimise power usage by slowing down processor speed or
by shutting down entire processor units where possible. The
co-existence of these AMs creates a high potential for
conflict. For example AM2 will attempt to shutdown an
underutilised resource as soon as load level starts to fall,
whilst AM1 will attempt to bring unused resources into play
as soon as load levels increase (or a backlog develops).
Depending on the sequence of load level changes it is
possible that oscillation will build up between the actions of
these two managers.
Operation: During its initialisation each AM registers
with the IS. The management capabilities of each AM are
described using the standard language and categories
described earlier. AM1 directly controls a parameter
performance within the general management category
performance general, and specific sub-zone CPU
performance; and indirectly influences a parameter power
within the general category performance general, and sub-
zone system performance. AM2 directly controls a
parameter power within the general category power general,
and the specific zone of interest system power; and
indirectly influences a parameter performance within the
general category performance general, and the specific zone
of interest CPU performance.
a) AddACItem ("Performance", "Performance General",
"CPU Performance", "1.0", "Local");
AddACItem ("Power", "Performance General",
"System Performance", "0.5", "Local");
RegisterAsAM ();
b) AddACItem ("Power", "Power General",
"System Power","1.0","Local");
AddACItem ("Performance", "Performance General",
"System Performance", "0.5", "Local");
RegisterAsAM ();
c) bool AddACItem(char *ParameterName, char *Category, char *Zone, char *Impactfactor, char *Scope);
Figure 4. API calls to register AMs’ management interests.
The API calls for manager registration are shown in
Figure 4a (for AM1), and 4b (for AM2), where AddACItem
means ‘Add autonomically controlled item’; its template is
shown in figure 4c. Figure 5 shows the XML equivalent
representation for AM1.
<!-- Autonomic Manager Configuration Specification
Language -->
<MetaData>
<ConfigAuthor Name="Mariusz Pelc" Organisation="UoG" />
<TimeStamp Time="12:00" Date="20/12/2010" />
<AMDescription>
<AM ID="AM1">
<ACItems>
<ACItem ID="Performance" Scope="Local">
<Category>Performance General</Category>
<Zone>CPU Performance</Zone>
<ImpactFactor>1.0</ImpactFactor>
</ACItem>
<ACItem ID="Power" Scope="Local">
<Category>Performance General</Category>
<Zone>System Performance</Zone>
<ImpactFactor>0.5</ImpactFactor>
</ACItem>
</ACItems>
</AM>
</AMDescription>
</MetaData>
Figure 5. XML representation of the Management Description Language.
Scenario 1: Each manager registers separately in the
system in the absence of the other. ThreshC = 0.6. AM1
requests management rights for CPU performance, and also
notifies a potential impact on system power. As there are no
other AMs present, the IS grants AM1 permission to
manage unimpeded. Similarly, for AM2 (in the absence of
AM1) the IS grants rights to manage system power level
and also to have an indirect impact on system performance.
Scenario2: AM1 registers and is granted rights to
manage the resources it requested. AM2 then registers
whilst AM1 is still present. ThreshC=0.6. The IS performs
18Copyright (c) IARIA, 2011. ISBN: 978-1-61208-174-8
EMERGING 2011 : The Third International Conference on Emerging Network Intelligence
25 / 141
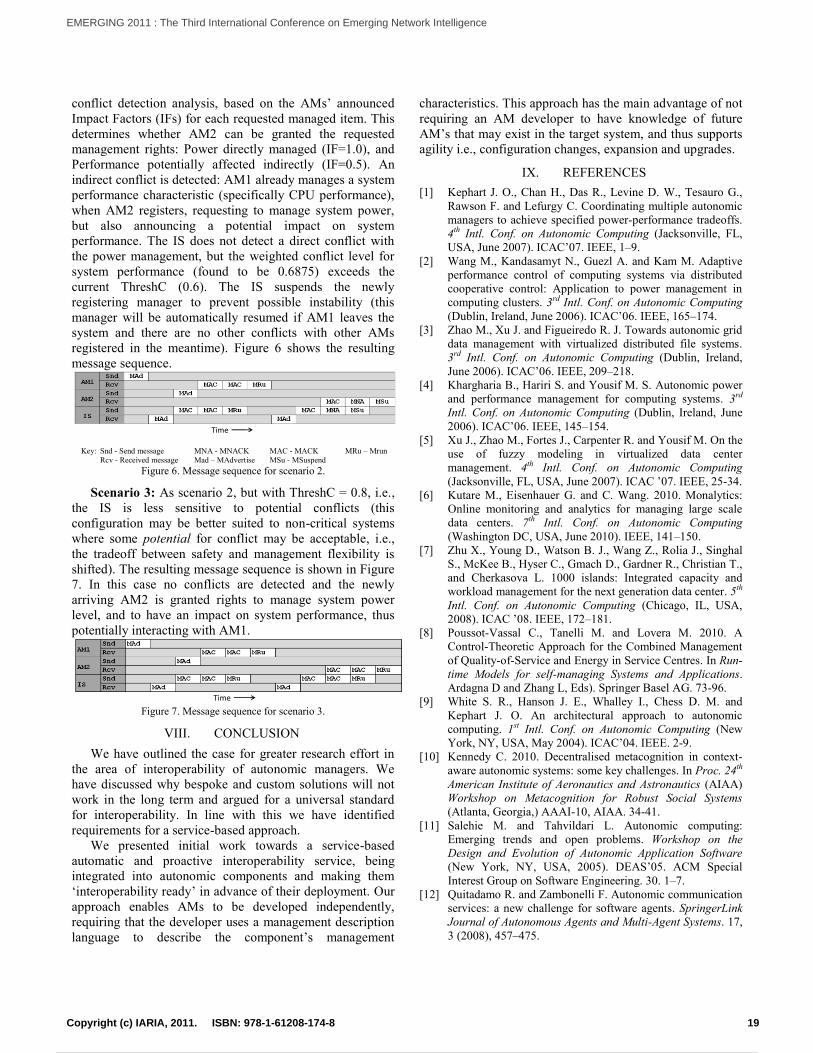
conflict detection analysis, based on the AMs’ announced
Impact Factors (IFs) for each requested managed item. This
determines whether AM2 can be granted the requested
management rights: Power directly managed (IF=1.0), and
Performance potentially affected indirectly (IF=0.5). An
indirect conflict is detected: AM1 already manages a system
performance characteristic (specifically CPU performance),
when AM2 registers, requesting to manage system power,
but also announcing a potential impact on system
performance. The IS does not detect a direct conflict with
the power management, but the weighted conflict level for
system performance (found to be 0.6875) exceeds the
current ThreshC (0.6). The IS suspends the newly
registering manager to prevent possible instability (this
manager will be automatically resumed if AM1 leaves the
system and there are no other conflicts with other AMs
registered in the meantime). Figure 6 shows the resulting
message sequence.
Key: Snd - Send message MNA - MNACK MAC - MACK MRu – Mrun
Rcv - Received message Mad – MAdvertise MSu - MSuspend
Figure 6. Message sequence for scenario 2.
Scenario 3: As scenario 2, but with ThreshC = 0.8, i.e.,
the IS is less sensitive to potential conflicts (this
configuration may be better suited to non-critical systems
where some potential for conflict may be acceptable, i.e.,
the tradeoff between safety and management flexibility is
shifted). The resulting message sequence is shown in Figure
7. In this case no conflicts are detected and the newly
arriving AM2 is granted rights to manage system power
level, and to have an impact on system performance, thus
potentially interacting with AM1.
Figure 7. Message sequence for scenario 3.
VIII. CONCLUSION
We have outlined the case for greater research effort in
the area of interoperability of autonomic managers. We
have discussed why bespoke and custom solutions will not
work in the long term and argued for a universal standard
for interoperability. In line with this we have identified
requirements for a service-based approach.
We presented initial work towards a service-based
automatic and proactive interoperability service, being
integrated into autonomic components and making them
‘interoperability ready’ in advance of their deployment. Our
approach enables AMs to be developed independently,
requiring that the developer uses a management description
language to describe the component’s management
characteristics. This approach has the main advantage of not
requiring an AM developer to have knowledge of future
AM’s that may exist in the target system, and thus supports
agility i.e., configuration changes, expansion and upgrades.
IX. REFERENCES
[1] Kephart J. O., Chan H., Das R., Levine D. W., Tesauro G.,
Rawson F. and Lefurgy C. Coordinating multiple autonomic
managers to achieve specified power-performance tradeoffs.
4th Intl. Conf. on Autonomic Computing (Jacksonville, FL,
USA, June 2007). ICAC’07. IEEE, 1–9.
[2] Wang M., Kandasamyt N., Guezl A. and Kam M. Adaptive
performance control of computing systems via distributed
cooperative control: Application to power management in
computing clusters. 3rd Intl. Conf. on Autonomic Computing
(Dublin, Ireland, June 2006). ICAC’06. IEEE, 165–174.
[3] Zhao M., Xu J. and Figueiredo R. J. Towards autonomic grid
data management with virtualized distributed file systems.
3rd Intl. Conf. on Autonomic Computing (Dublin, Ireland,
June 2006). ICAC’06. IEEE, 209–218.
[4] Khargharia B., Hariri S. and Yousif M. S. Autonomic power
and performance management for computing systems. 3rd
Intl. Conf. on Autonomic Computing (Dublin, Ireland, June
2006). ICAC’06. IEEE, 145–154.
[5] Xu J., Zhao M., Fortes J., Carpenter R. and Yousif M. On the
use of fuzzy modeling in virtualized data center
management. 4th Intl. Conf. on Autonomic Computing
(Jacksonville, FL, USA, June 2007). ICAC ’07. IEEE, 25-34.
[6] Kutare M., Eisenhauer G. and C. Wang. 2010. Monalytics:
Online monitoring and analytics for managing large scale
data centers. 7th Intl. Conf. on Autonomic Computing
(Washington DC, USA, June 2010). IEEE, 141–150.
[7] Zhu X., Young D., Watson B. J., Wang Z., Rolia J., Singhal
S., McKee B., Hyser C., Gmach D., Gardner R., Christian T.,
and Cherkasova L. 1000 islands: Integrated capacity and
workload management for the next generation data center. 5th
Intl. Conf. on Autonomic Computing (Chicago, IL, USA,
2008). ICAC ’08. IEEE, 172–181.
[8] Poussot-Vassal C., Tanelli M. and Lovera M. 2010. A
Control-Theoretic Approach for the Combined Management
of Quality-of-Service and Energy in Service Centres. In Run-
time Models for self-managing Systems and Applications.
Ardagna D and Zhang L, Eds). Springer Basel AG. 73-96.
[9] White S. R., Hanson J. E., Whalley I., Chess D. M. and
Kephart J. O. An architectural approach to autonomic
computing. 1st Intl. Conf. on Autonomic Computing (New
York, NY, USA, May 2004). ICAC’04. IEEE. 2-9.
[10] Kennedy C. 2010. Decentralised metacognition in context-
aware autonomic systems: some key challenges. In Proc. 24th
American Institute of Aeronautics and Astronautics (AIAA)
Workshop on Metacognition for Robust Social Systems
(Atlanta, Georgia,) AAAI-10, AIAA. 34-41.
[11] Salehie M. and Tahvildari L. Autonomic computing:
Emerging trends and open problems. Workshop on the
Design and Evolution of Autonomic Application Software
(New York, NY, USA, 2005). DEAS’05. ACM Special
Interest Group on Software Engineering. 30. 1–7.
[12] Quitadamo R. and Zambonelli F. Autonomic communication
services: a new challenge for software agents. SpringerLink
Journal of Autonomous Agents and Multi-Agent Systems. 17,
3 (2008), 457–475.
Time
Time
19Copyright (c) IARIA, 2011. ISBN: 978-1-61208-174-8
EMERGING 2011 : The Third International Conference on Emerging Network Intelligence
26 / 141
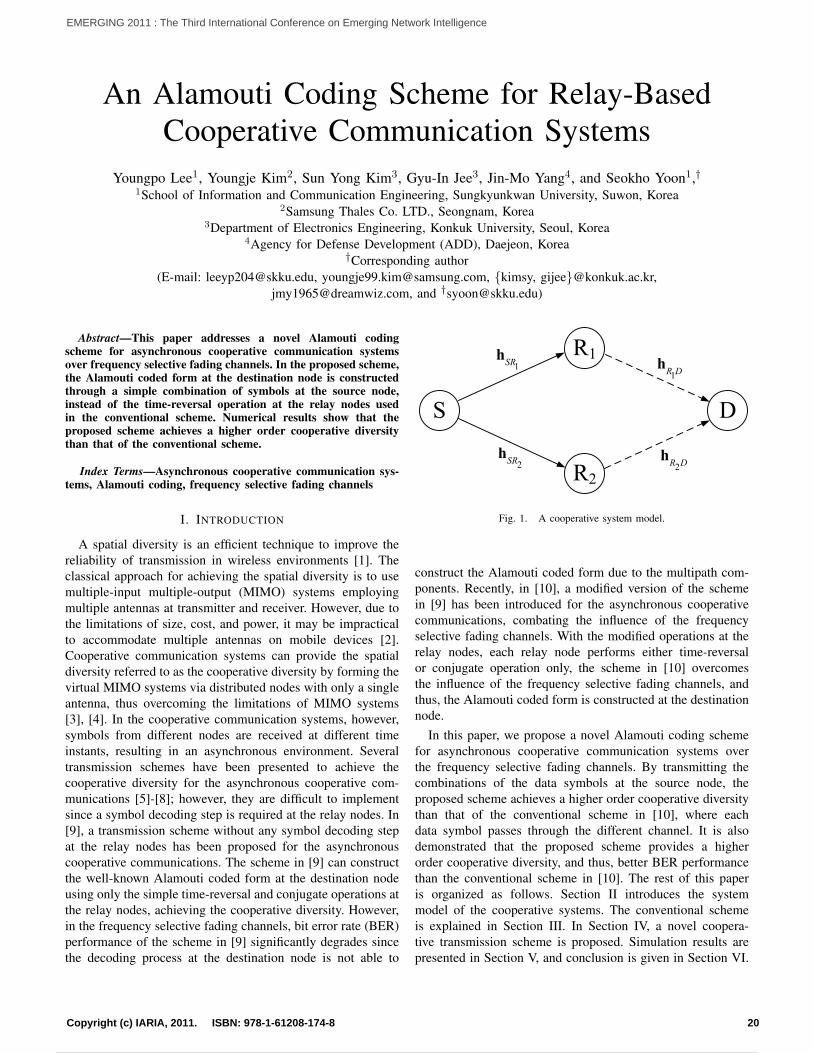
An Alamouti Coding Scheme for Relay-BasedCooperative Communication Systems
Youngpo Lee1, Youngje Kim2, Sun Yong Kim3, Gyu-In Jee3, Jin-Mo Yang4, and Seokho Yoon1,†1School of Information and Communication Engineering, Sungkyunkwan University, Suwon, Korea
2Samsung Thales Co. LTD., Seongnam, Korea3Department of Electronics Engineering, Konkuk University, Seoul, Korea
4Agency for Defense Development (ADD), Daejeon, Korea†Corresponding author
(E-mail: [email protected], [email protected], kimsy, [email protected],[email protected], and †[email protected])
Abstract—This paper addresses a novel Alamouti codingscheme for asynchronous cooperative communication systemsover frequency selective fading channels. In the proposed scheme,the Alamouti coded form at the destination node is constructedthrough a simple combination of symbols at the source node,instead of the time-reversal operation at the relay nodes usedin the conventional scheme. Numerical results show that theproposed scheme achieves a higher order cooperative diversitythan that of the conventional scheme.
Index Terms—Asynchronous cooperative communication sys-tems, Alamouti coding, frequency selective fading channels
I. INTRODUCTION
A spatial diversity is an efficient technique to improve thereliability of transmission in wireless environments [1]. Theclassical approach for achieving the spatial diversity is to usemultiple-input multiple-output (MIMO) systems employingmultiple antennas at transmitter and receiver. However, due tothe limitations of size, cost, and power, it may be impracticalto accommodate multiple antennas on mobile devices [2].Cooperative communication systems can provide the spatialdiversity referred to as the cooperative diversity by forming thevirtual MIMO systems via distributed nodes with only a singleantenna, thus overcoming the limitations of MIMO systems[3], [4]. In the cooperative communication systems, however,symbols from different nodes are received at different timeinstants, resulting in an asynchronous environment. Severaltransmission schemes have been presented to achieve thecooperative diversity for the asynchronous cooperative com-munications [5]-[8]; however, they are difficult to implementsince a symbol decoding step is required at the relay nodes. In[9], a transmission scheme without any symbol decoding stepat the relay nodes has been proposed for the asynchronouscooperative communications. The scheme in [9] can constructthe well-known Alamouti coded form at the destination nodeusing only the simple time-reversal and conjugate operations atthe relay nodes, achieving the cooperative diversity. However,in the frequency selective fading channels, bit error rate (BER)performance of the scheme in [9] significantly degrades sincethe decoding process at the destination node is not able to
1SRh
2SRh
1R Dh
2R Dh
Fig. 1. A cooperative system model.
construct the Alamouti coded form due to the multipath com-ponents. Recently, in [10], a modified version of the schemein [9] has been introduced for the asynchronous cooperativecommunications, combating the influence of the frequencyselective fading channels. With the modified operations at therelay nodes, each relay node performs either time-reversalor conjugate operation only, the scheme in [10] overcomesthe influence of the frequency selective fading channels, andthus, the Alamouti coded form is constructed at the destinationnode.
In this paper, we propose a novel Alamouti coding schemefor asynchronous cooperative communication systems overthe frequency selective fading channels. By transmitting thecombinations of the data symbols at the source node, theproposed scheme achieves a higher order cooperative diversitythan that of the conventional scheme in [10], where eachdata symbol passes through the different channel. It is alsodemonstrated that the proposed scheme provides a higherorder cooperative diversity, and thus, better BER performancethan the conventional scheme in [10]. The rest of this paperis organized as follows. Section II introduces the systemmodel of the cooperative systems. The conventional schemeis explained in Section III. In Section IV, a novel coopera-tive transmission scheme is proposed. Simulation results arepresented in Section V, and conclusion is given in Section VI.
20Copyright (c) IARIA, 2011. ISBN: 978-1-61208-174-8
EMERGING 2011 : The Third International Conference on Emerging Network Intelligence
27 / 141
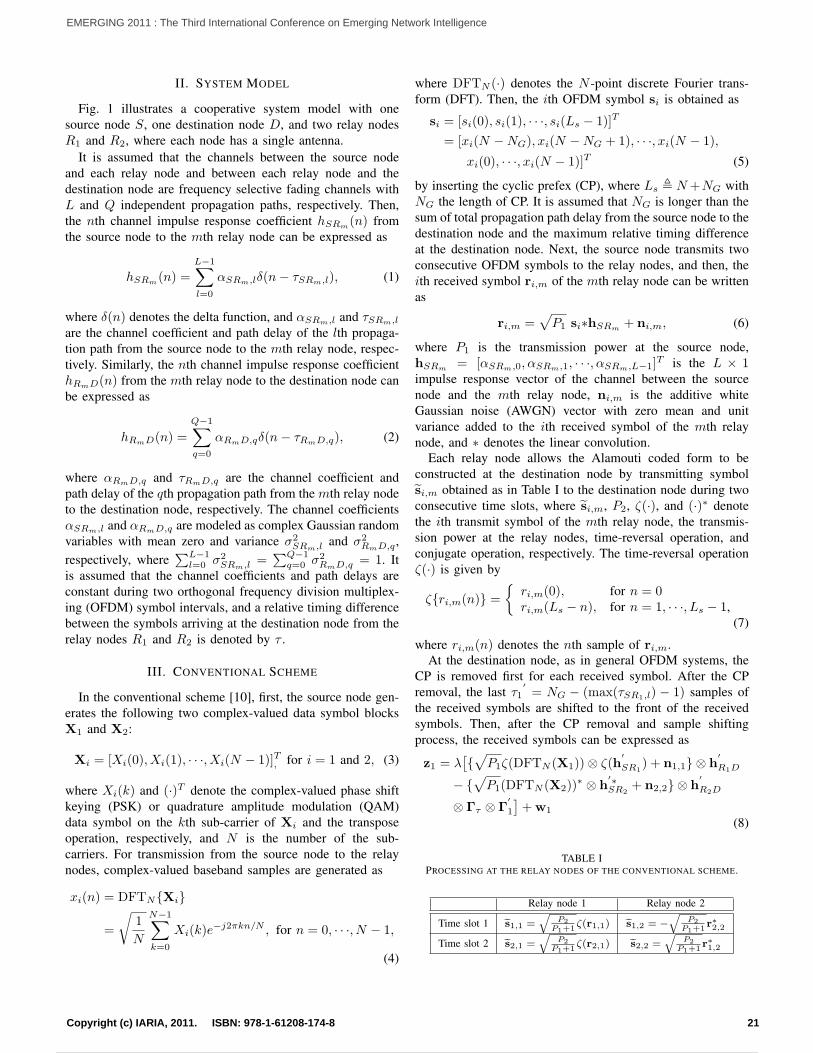
II. SYSTEM MODEL
Fig. 1 illustrates a cooperative system model with onesource node S, one destination node D, and two relay nodesR1 and R2, where each node has a single antenna.
It is assumed that the channels between the source nodeand each relay node and between each relay node and thedestination node are frequency selective fading channels withL and Q independent propagation paths, respectively. Then,the nth channel impulse response coefficient hSRm(n) fromthe source node to the mth relay node can be expressed as
hSRm(n) =L−1∑l=0
αSRm,lδ(n− τSRm,l), (1)
where δ(n) denotes the delta function, and αSRm,l and τSRm,l
are the channel coefficient and path delay of the lth propaga-tion path from the source node to the mth relay node, respec-tively. Similarly, the nth channel impulse response coefficienthRmD(n) from the mth relay node to the destination node canbe expressed as
hRmD(n) =
Q−1∑q=0
αRmD,qδ(n− τRmD,q), (2)
where αRmD,q and τRmD,q are the channel coefficient andpath delay of the qth propagation path from the mth relay nodeto the destination node, respectively. The channel coefficientsαSRm,l and αRmD,q are modeled as complex Gaussian randomvariables with mean zero and variance σ2
SRm,l and σ2RmD,q ,
respectively, where∑L−1
l=0 σ2SRm,l =
∑Q−1q=0 σ2
RmD,q = 1. Itis assumed that the channel coefficients and path delays areconstant during two orthogonal frequency division multiplex-ing (OFDM) symbol intervals, and a relative timing differencebetween the symbols arriving at the destination node from therelay nodes R1 and R2 is denoted by τ .
III. CONVENTIONAL SCHEME
In the conventional scheme [10], first, the source node gen-erates the following two complex-valued data symbol blocksX1 and X2:
Xi = [Xi(0), Xi(1), · · ·, Xi(N − 1)]T, for i = 1 and 2, (3)
where Xi(k) and (·)T denote the complex-valued phase shiftkeying (PSK) or quadrature amplitude modulation (QAM)data symbol on the kth sub-carrier of Xi and the transposeoperation, respectively, and N is the number of the sub-carriers. For transmission from the source node to the relaynodes, complex-valued baseband samples are generated as
xi(n) = DFTNXi
=
√1
N
N−1∑k=0
Xi(k)e−j2πkn/N , for n = 0, · · ·, N − 1,
(4)
where DFTN (·) denotes the N -point discrete Fourier trans-form (DFT). Then, the ith OFDM symbol si is obtained as
si = [si(0), si(1), · · ·, si(Ls − 1)]T
= [xi(N −NG), xi(N −NG + 1), · · ·, xi(N − 1),
xi(0), · · ·, xi(N − 1)]T (5)
by inserting the cyclic prefex (CP), where Ls , N+NG withNG the length of CP. It is assumed that NG is longer than thesum of total propagation path delay from the source node to thedestination node and the maximum relative timing differenceat the destination node. Next, the source node transmits twoconsecutive OFDM symbols to the relay nodes, and then, theith received symbol ri,m of the mth relay node can be writtenas
ri,m =√P1 si∗hSRm + ni,m, (6)
where P1 is the transmission power at the source node,hSRm = [αSRm,0, αSRm,1, · · ·, αSRm,L−1]
T is the L × 1impulse response vector of the channel between the sourcenode and the mth relay node, ni,m is the additive whiteGaussian noise (AWGN) vector with zero mean and unitvariance added to the ith received symbol of the mth relaynode, and ∗ denotes the linear convolution.
Each relay node allows the Alamouti coded form to beconstructed at the destination node by transmitting symbolsi,m obtained as in Table I to the destination node during twoconsecutive time slots, where si,m, P2, ζ(·), and (·)∗ denotethe ith transmit symbol of the mth relay node, the transmis-sion power at the relay nodes, time-reversal operation, andconjugate operation, respectively. The time-reversal operationζ(·) is given by
ζri,m(n) =
ri,m(0), for n = 0ri,m(Ls − n), for n = 1, · · ·, Ls − 1,
(7)
where ri,m(n) denotes the nth sample of ri,m.At the destination node, as in general OFDM systems, the
CP is removed first for each received symbol. After the CPremoval, the last τ1
′= NG − (max(τSR1,l) − 1) samples of
the received symbols are shifted to the front of the receivedsymbols. Then, after the CP removal and sample shiftingprocess, the received symbols can be expressed as
z1 = λ[√P1ζ(DFTN (X1))⊗ ζ(h
′
SR1) + n1,1 ⊗ h
′
R1D
− √
P1(DFTN (X2))∗ ⊗ h
′∗SR2
+ n2,2 ⊗ h′
R2D
⊗ Γτ ⊗ Γ′
1
]+w1
(8)
TABLE IPROCESSING AT THE RELAY NODES OF THE CONVENTIONAL SCHEME.
Relay node 1 Relay node 2
Time slot 1 s1,1 =√
P2P1+1
ζ(r1,1) s1,2 = −√
P2P1+1
r∗2,2
Time slot 2 s2,1 =√
P2P1+1
ζ(r2,1) s2,2 =√
P2P1+1
r∗1,2
21Copyright (c) IARIA, 2011. ISBN: 978-1-61208-174-8
EMERGING 2011 : The Third International Conference on Emerging Network Intelligence
28 / 141
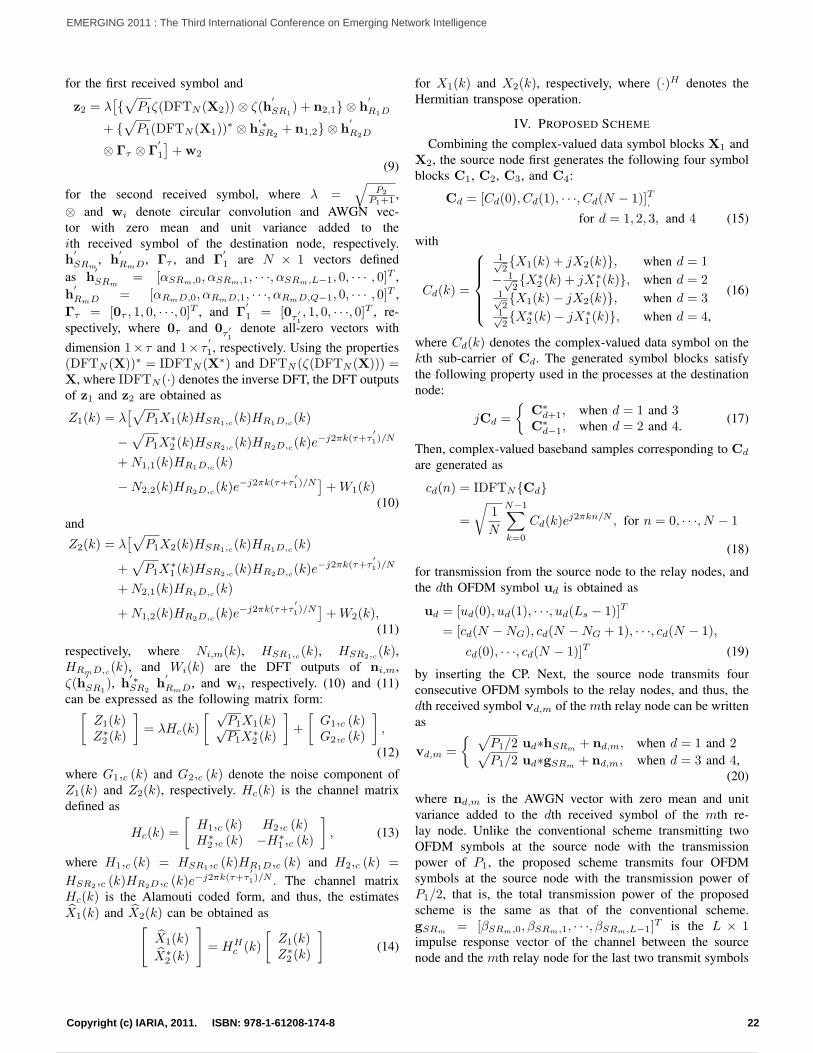
for the first received symbol and
z2 = λ[√P1ζ(DFTN (X2))⊗ ζ(h
′
SR1) + n2,1 ⊗ h
′
R1D
+ √P1(DFTN (X1))
∗ ⊗ h′∗SR2
+ n1,2 ⊗ h′
R2D
⊗ Γτ ⊗ Γ′
1
]+w2
(9)
for the second received symbol, where λ =√
P2
P1+1 ,⊗ and wi denote circular convolution and AWGN vec-tor with zero mean and unit variance added to theith received symbol of the destination node, respectively.h
′
SRm, h
′
RmD, Γτ , and Γ′
1 are N × 1 vectors definedas h
′
SRm= [αSRm,0, αSRm,1, · · ·, αSRm,L−1, 0, · · · , 0]T ,
h′
RmD = [αRmD,0, αRmD,1, · · ·, αRmD,Q−1, 0, · · · , 0]T ,Γτ = [0τ , 1, 0, · · ·, 0]T , and Γ
′
1 = [0τ′1, 1, 0, · · ·, 0]T , re-
spectively, where 0τ and 0τ′1
denote all-zero vectors withdimension 1× τ and 1× τ
′
1, respectively. Using the properties(DFTN (X))∗ = IDFTN (X∗) and DFTN (ζ(DFTN (X))) =X, where IDFTN (·) denotes the inverse DFT, the DFT outputsof z1 and z2 are obtained as
Z1(k) = λ[√
P1X1(k)HSR1,c(k)HR1D,c(k)
−√
P1X∗2 (k)HSR2,c(k)HR2D,c(k)e
−j2πk(τ+τ′1)/N
+N1,1(k)HR1D,c(k)
−N2,2(k)HR2D,c(k)e−j2πk(τ+τ
′1)/N
]+W1(k)
(10)
and
Z2(k) = λ[√
P1X2(k)HSR1,c(k)HR1D,c(k)
+√
P1X∗1 (k)HSR2,c(k)HR2D,c(k)e
−j2πk(τ+τ′1)/N
+N2,1(k)HR1D,c(k)
+N1,2(k)HR2D,c(k)e−j2πk(τ+τ
′1)/N
]+W2(k),
(11)
respectively, where Ni,m(k), HSR1,c(k), HSR2,c(k),HRmD,c(k), and Wi(k) are the DFT outputs of ni,m,ζ(h
′
SR1), h
′∗SR2
h′
RmD, and wi, respectively. (10) and (11)can be expressed as the following matrix form:[
Z1(k)Z∗2 (k)
]= λHc(k)
[ √P1X1(k)√P1X
∗2 (k)
]+
[G1,c (k)G2,c (k)
],
(12)
where G1,c (k) and G2,c (k) denote the noise component ofZ1(k) and Z2(k), respectively. Hc(k) is the channel matrixdefined as
Hc(k) =
[H1,c (k) H2,c (k)H∗
2 ,c (k) −H∗1 ,c (k)
], (13)
where H1,c (k) = HSR1 ,c (k)HR1D,c (k) and H2,c (k) =
HSR2 ,c (k)HR2D,c (k)e−j2πk(τ+τ
′1)/N . The channel matrix
Hc(k) is the Alamouti coded form, and thus, the estimatesX1(k) and X2(k) can be obtained as[
X1(k)
X∗2 (k)
]= HH
c (k)
[Z1(k)Z∗2 (k)
](14)
for X1(k) and X2(k), respectively, where (·)H denotes theHermitian transpose operation.
IV. PROPOSED SCHEME
Combining the complex-valued data symbol blocks X1 andX2, the source node first generates the following four symbolblocks C1, C2, C3, and C4:
Cd = [Cd(0), Cd(1), · · ·, Cd(N − 1)]T,
for d = 1, 2, 3, and 4 (15)
with
Cd(k) =
1√2X1(k) + jX2(k), when d = 1
− 1√2X∗
2 (k) + jX∗1 (k), when d = 2
1√2X1(k)− jX2(k), when d = 3
1√2X∗
2 (k)− jX∗1 (k), when d = 4,
(16)
where Cd(k) denotes the complex-valued data symbol on thekth sub-carrier of Cd. The generated symbol blocks satisfythe following property used in the processes at the destinationnode:
jCd =
C∗
d+1, when d = 1 and 3C∗
d−1, when d = 2 and 4. (17)
Then, complex-valued baseband samples corresponding to Cd
are generated as
cd(n) = IDFTNCd
=
√1
N
N−1∑k=0
Cd(k)ej2πkn/N , for n = 0, · · ·, N − 1
(18)
for transmission from the source node to the relay nodes, andthe dth OFDM symbol ud is obtained as
ud = [ud(0), ud(1), · · ·, ud(Ls − 1)]T
= [cd(N −NG), cd(N −NG + 1), · · ·, cd(N − 1),
cd(0), · · ·, cd(N − 1)]T (19)
by inserting the CP. Next, the source node transmits fourconsecutive OFDM symbols to the relay nodes, and thus, thedth received symbol vd,m of the mth relay node can be writtenas
vd,m =
√P1/2 ud∗hSRm + nd,m, when d = 1 and 2√P1/2 ud∗gSRm + nd,m, when d = 3 and 4,
(20)
where nd,m is the AWGN vector with zero mean and unitvariance added to the dth received symbol of the mth re-lay node. Unlike the conventional scheme transmitting twoOFDM symbols at the source node with the transmissionpower of P1, the proposed scheme transmits four OFDMsymbols at the source node with the transmission power ofP1/2, that is, the total transmission power of the proposedscheme is the same as that of the conventional scheme.gSRm = [βSRm,0, βSRm,1, · · ·, βSRm,L−1]
T is the L × 1impulse response vector of the channel between the sourcenode and the mth relay node for the last two transmit symbols
22Copyright (c) IARIA, 2011. ISBN: 978-1-61208-174-8
EMERGING 2011 : The Third International Conference on Emerging Network Intelligence
29 / 141
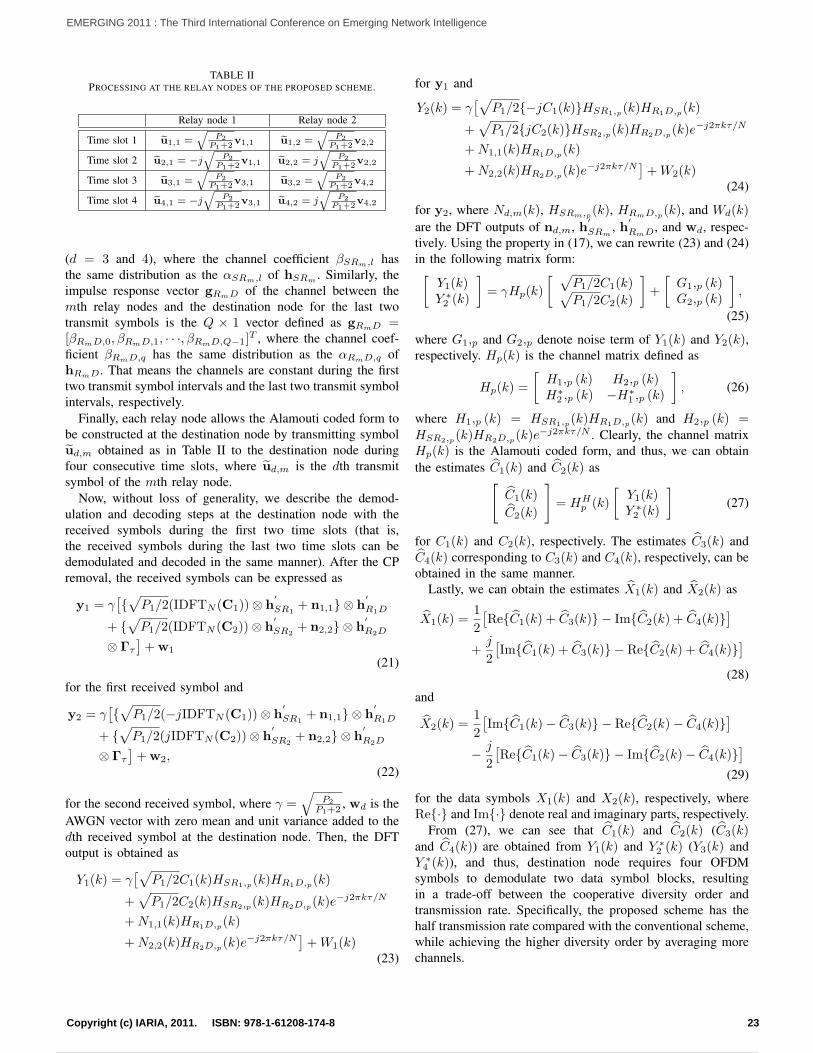
TABLE IIPROCESSING AT THE RELAY NODES OF THE PROPOSED SCHEME.
Relay node 1 Relay node 2
Time slot 1 u1,1 =√
P2P1+2
v1,1 u1,2 =√
P2P1+2
v2,2
Time slot 2 u2,1 = −j√
P2P1+2
v1,1 u2,2 = j√
P2P1+2
v2,2
Time slot 3 u3,1 =√
P2P1+2
v3,1 u3,2 =√
P2P1+2
v4,2
Time slot 4 u4,1 = −j√
P2P1+2
v3,1 u4,2 = j√
P2P1+2
v4,2
(d = 3 and 4), where the channel coefficient βSRm,l hasthe same distribution as the αSRm,l of hSRm . Similarly, theimpulse response vector gRmD of the channel between themth relay nodes and the destination node for the last twotransmit symbols is the Q × 1 vector defined as gRmD =[βRmD,0, βRmD,1, · · ·, βRmD,Q−1]
T , where the channel coef-ficient βRmD,q has the same distribution as the αRmD,q ofhRmD. That means the channels are constant during the firsttwo transmit symbol intervals and the last two transmit symbolintervals, respectively.
Finally, each relay node allows the Alamouti coded form tobe constructed at the destination node by transmitting symbolud,m obtained as in Table II to the destination node duringfour consecutive time slots, where ud,m is the dth transmitsymbol of the mth relay node.
Now, without loss of generality, we describe the demod-ulation and decoding steps at the destination node with thereceived symbols during the first two time slots (that is,the received symbols during the last two time slots can bedemodulated and decoded in the same manner). After the CPremoval, the received symbols can be expressed as
y1 = γ[√P1/2(IDFTN (C1))⊗ h
′
SR1+ n1,1 ⊗ h
′
R1D
+ √P1/2(IDFTN (C2))⊗ h
′
SR2+ n2,2 ⊗ h
′
R2D
⊗ Γτ
]+w1
(21)
for the first received symbol and
y2 = γ[√P1/2(−jIDFTN (C1))⊗ h
′
SR1+ n1,1 ⊗ h
′
R1D
+ √P1/2(jIDFTN (C2))⊗ h
′
SR2+ n2,2 ⊗ h
′
R2D
⊗ Γτ
]+w2,
(22)
for the second received symbol, where γ =√
P2
P1+2 , wd is theAWGN vector with zero mean and unit variance added to thedth received symbol at the destination node. Then, the DFToutput is obtained as
Y1(k) = γ[√
P1/2C1(k)HSR1,p(k)HR1D,p(k)
+√P1/2C2(k)HSR2,p(k)HR2D,p(k)e
−j2πkτ/N
+N1,1(k)HR1D,p(k)
+N2,2(k)HR2D,p(k)e−j2πkτ/N
]+W1(k)
(23)
for y1 and
Y2(k) = γ[√
P1/2−jC1(k)HSR1,p(k)HR1D,p(k)
+√P1/2jC2(k)HSR2,p(k)HR2D,p(k)e
−j2πkτ/N
+N1,1(k)HR1D,p(k)
+N2,2(k)HR2D,p(k)e−j2πkτ/N
]+W2(k)
(24)
for y2, where Nd,m(k), HSRm,p(k), HRmD,p(k), and Wd(k)
are the DFT outputs of nd,m, h′
SRm, h
′
RmD, and wd, respec-tively. Using the property in (17), we can rewrite (23) and (24)in the following matrix form:[
Y1(k)Y ∗2 (k)
]= γHp(k)
[ √P1/2C1(k)√P1/2C2(k)
]+
[G1,p (k)G2,p (k)
],
(25)
where G1,p and G2,p denote noise term of Y1(k) and Y2(k),respectively. Hp(k) is the channel matrix defined as
Hp(k) =
[H1,p (k) H2,p (k)H∗
2 ,p (k) −H∗1 ,p (k)
], (26)
where H1,p (k) = HSR1,p(k)HR1D,p(k) and H2,p (k) =HSR2,p(k)HR2D,p(k)e
−j2πkτ/N . Clearly, the channel matrixHp(k) is the Alamouti coded form, and thus, we can obtainthe estimates C1(k) and C2(k) as[
C1(k)
C2(k)
]= HH
p (k)
[Y1(k)Y ∗2 (k)
](27)
for C1(k) and C2(k), respectively. The estimates C3(k) andC4(k) corresponding to C3(k) and C4(k), respectively, can beobtained in the same manner.
Lastly, we can obtain the estimates X1(k) and X2(k) as
X1(k) =1
2
[ReC1(k) + C3(k) − ImC2(k) + C4(k)
]+
j
2
[ImC1(k) + C3(k) − ReC2(k) + C4(k)
](28)
and
X2(k) =1
2
[ImC1(k)− C3(k) − ReC2(k)− C4(k)
]− j
2
[ReC1(k)− C3(k) − ImC2(k)− C4(k)
](29)
for the data symbols X1(k) and X2(k), respectively, whereRe· and Im· denote real and imaginary parts, respectively.
From (27), we can see that C1(k) and C2(k) (C3(k)and C4(k)) are obtained from Y1(k) and Y ∗
2 (k) (Y3(k) andY ∗4 (k)), and thus, destination node requires four OFDM
symbols to demodulate two data symbol blocks, resultingin a trade-off between the cooperative diversity order andtransmission rate. Specifically, the proposed scheme has thehalf transmission rate compared with the conventional scheme,while achieving the higher diversity order by averaging morechannels.
23Copyright (c) IARIA, 2011. ISBN: 978-1-61208-174-8
EMERGING 2011 : The Third International Conference on Emerging Network Intelligence
30 / 141
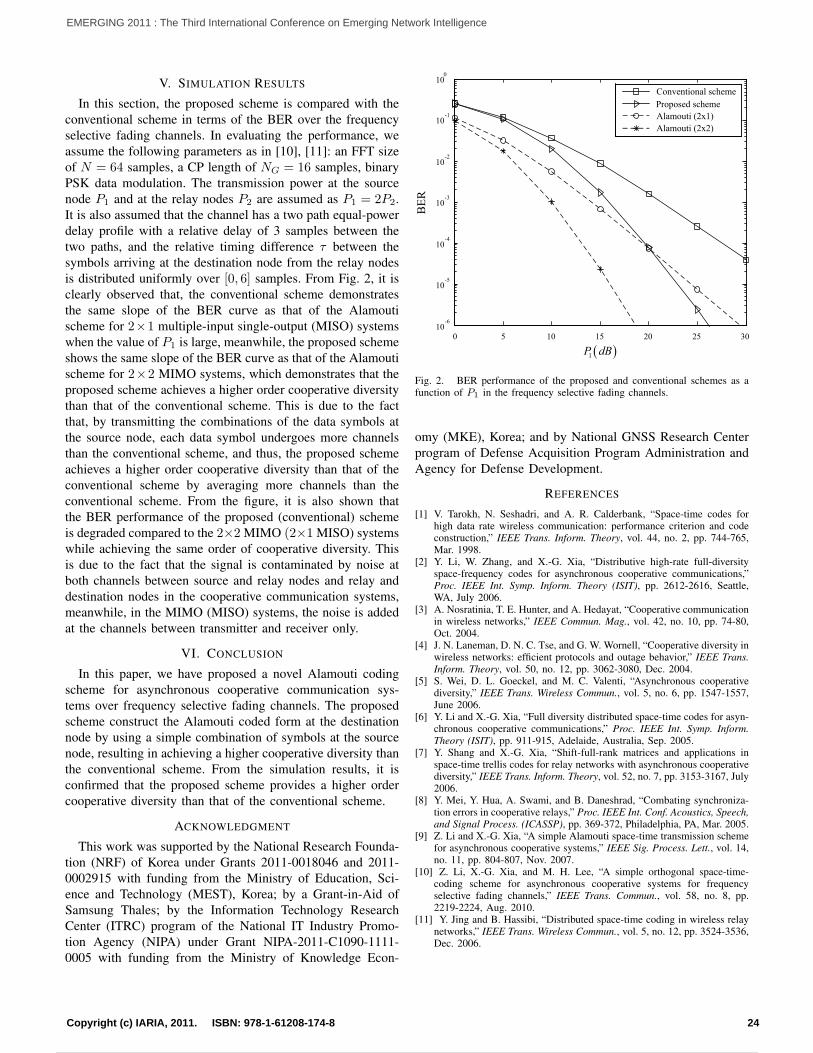
V. SIMULATION RESULTS
In this section, the proposed scheme is compared with theconventional scheme in terms of the BER over the frequencyselective fading channels. In evaluating the performance, weassume the following parameters as in [10], [11]: an FFT sizeof N = 64 samples, a CP length of NG = 16 samples, binaryPSK data modulation. The transmission power at the sourcenode P1 and at the relay nodes P2 are assumed as P1 = 2P2.It is also assumed that the channel has a two path equal-powerdelay profile with a relative delay of 3 samples between thetwo paths, and the relative timing difference τ between thesymbols arriving at the destination node from the relay nodesis distributed uniformly over [0, 6] samples. From Fig. 2, it isclearly observed that, the conventional scheme demonstratesthe same slope of the BER curve as that of the Alamoutischeme for 2×1 multiple-input single-output (MISO) systemswhen the value of P1 is large, meanwhile, the proposed schemeshows the same slope of the BER curve as that of the Alamoutischeme for 2×2 MIMO systems, which demonstrates that theproposed scheme achieves a higher order cooperative diversitythan that of the conventional scheme. This is due to the factthat, by transmitting the combinations of the data symbols atthe source node, each data symbol undergoes more channelsthan the conventional scheme, and thus, the proposed schemeachieves a higher order cooperative diversity than that of theconventional scheme by averaging more channels than theconventional scheme. From the figure, it is also shown thatthe BER performance of the proposed (conventional) schemeis degraded compared to the 2×2 MIMO (2×1 MISO) systemswhile achieving the same order of cooperative diversity. Thisis due to the fact that the signal is contaminated by noise atboth channels between source and relay nodes and relay anddestination nodes in the cooperative communication systems,meanwhile, in the MIMO (MISO) systems, the noise is addedat the channels between transmitter and receiver only.
VI. CONCLUSION
In this paper, we have proposed a novel Alamouti codingscheme for asynchronous cooperative communication sys-tems over frequency selective fading channels. The proposedscheme construct the Alamouti coded form at the destinationnode by using a simple combination of symbols at the sourcenode, resulting in achieving a higher cooperative diversity thanthe conventional scheme. From the simulation results, it isconfirmed that the proposed scheme provides a higher ordercooperative diversity than that of the conventional scheme.
ACKNOWLEDGMENT
This work was supported by the National Research Founda-tion (NRF) of Korea under Grants 2011-0018046 and 2011-0002915 with funding from the Ministry of Education, Sci-ence and Technology (MEST), Korea; by a Grant-in-Aid ofSamsung Thales; by the Information Technology ResearchCenter (ITRC) program of the National IT Industry Promo-tion Agency (NIPA) under Grant NIPA-2011-C1090-1111-0005 with funding from the Ministry of Knowledge Econ-
0 5 10 15 20 25 3010
-6
10-5
10-4
10-3
10-2
10-1
100
Conventional scheme
Proposed scheme
Alamouti (2x1)
Alamouti (2x2)
BE
R
!1P dB
Fig. 2. BER performance of the proposed and conventional schemes as afunction of P1 in the frequency selective fading channels.
omy (MKE), Korea; and by National GNSS Research Centerprogram of Defense Acquisition Program Administration andAgency for Defense Development.
REFERENCES
[1] V. Tarokh, N. Seshadri, and A. R. Calderbank, “Space-time codes forhigh data rate wireless communication: performance criterion and codeconstruction,” IEEE Trans. Inform. Theory, vol. 44, no. 2, pp. 744-765,Mar. 1998.
[2] Y. Li, W. Zhang, and X.-G. Xia, “Distributive high-rate full-diversityspace-frequency codes for asynchronous cooperative communications,”Proc. IEEE Int. Symp. Inform. Theory (ISIT), pp. 2612-2616, Seattle,WA, July 2006.
[3] A. Nosratinia, T. E. Hunter, and A. Hedayat, “Cooperative communicationin wireless networks,” IEEE Commun. Mag., vol. 42, no. 10, pp. 74-80,Oct. 2004.
[4] J. N. Laneman, D. N. C. Tse, and G. W. Wornell, “Cooperative diversity inwireless networks: efficient protocols and outage behavior,” IEEE Trans.Inform. Theory, vol. 50, no. 12, pp. 3062-3080, Dec. 2004.
[5] S. Wei, D. L. Goeckel, and M. C. Valenti, “Asynchronous cooperativediversity,” IEEE Trans. Wireless Commun., vol. 5, no. 6, pp. 1547-1557,June 2006.
[6] Y. Li and X.-G. Xia, “Full diversity distributed space-time codes for asyn-chronous cooperative communications,” Proc. IEEE Int. Symp. Inform.Theory (ISIT), pp. 911-915, Adelaide, Australia, Sep. 2005.
[7] Y. Shang and X.-G. Xia, “Shift-full-rank matrices and applications inspace-time trellis codes for relay networks with asynchronous cooperativediversity,” IEEE Trans. Inform. Theory, vol. 52, no. 7, pp. 3153-3167, July2006.
[8] Y. Mei, Y. Hua, A. Swami, and B. Daneshrad, “Combating synchroniza-tion errors in cooperative relays,” Proc. IEEE Int. Conf. Acoustics, Speech,and Signal Process. (ICASSP), pp. 369-372, Philadelphia, PA, Mar. 2005.
[9] Z. Li and X.-G. Xia, “A simple Alamouti space-time transmission schemefor asynchronous cooperative systems,” IEEE Sig. Process. Lett., vol. 14,no. 11, pp. 804-807, Nov. 2007.
[10] Z. Li, X.-G. Xia, and M. H. Lee, “A simple orthogonal space-time-coding scheme for asynchronous cooperative systems for frequencyselective fading channels,” IEEE Trans. Commun., vol. 58, no. 8, pp.2219-2224, Aug. 2010.
[11] Y. Jing and B. Hassibi, “Distributed space-time coding in wireless relaynetworks,” IEEE Trans. Wireless Commun., vol. 5, no. 12, pp. 3524-3536,Dec. 2006.
24Copyright (c) IARIA, 2011. ISBN: 978-1-61208-174-8
EMERGING 2011 : The Third International Conference on Emerging Network Intelligence
31 / 141
Low Complexity Long PN Code AcquisitionScheme for Spread Spectrum Systems
Jeehyeon Baek1, Jonghun Park2, Youngpo Lee1, Sun Yong Kim3, Gyu-In Jee3, Jin-Mo Yang4, and Seokho Yoon1,†1School of Information and Communication Engineering, Sungkyunkwan University, Suwon, Korea
2Samsung Thales Co. LTD., Seongnam, Korea3Department of Electronics Engineering, Konkuk University, Seoul, Korea
4Agency for Defense Development (ADD), Daejeon, Korea†Corresponding author
(Email: [email protected], [email protected], [email protected],kimsy, [email protected], [email protected], and †[email protected])
Abstract—In this paper, a low complexity long pseudo noise(PN) code acquisition scheme is proposed for spread spectrumsystems including global positioning system (GPS) and codedivision multiple access (CDMA) system. By using a phase-shift-network, the proposed scheme has less complexity thanthe conventional dual correlating sequential estimation scheme.From the analytic and numerical results, it is confirmed thatthe proposed scheme has the lower hardware complexity andthe same mean acquisition time performance compared with theconventional scheme.
Index Terms—acquisition, sequential estimation, phase-shift-network, PN code
I. INTRODUCTION
In spread spectrum (SS) receivers, the pseudo noise (PN)code synchronization is one of the most important tasks,which is generally carried out in two stages: code acquisitionand tracking [1]. In the code acquisition stage, the coarsealignment between the received and locally generated PNcodes is performed, and subsequently, in the code trackingstage, the fine alignment between the two codes is performed.
In recent SS-based mobile communication systems includ-ing global positioning system (GPS) and code division mul-tiple access (CDMA) system, a long PN code is essential toprovide reliable positioning service or user distinction [2], [3].However, acquisition of a long PN code leads to excessive ac-quisition time and hardware complexity for serial and parallelacquisition methods, respectively, which are typical acquisitionschemes in SS-based systems [4].
To deal with acquisition of a long PN code, several schemes[5]-[7] have been proposed. Ward proposed an interestingcode acquisition scheme based on sequential estimation ofthe received PN code [5], which is referred to as the tra-ditional sequential estimation (TSE) scheme in this paper.The TSE scheme has a shorter mean acquisition time (MAT)and a lower hardware complexity than the serial and parallelacquisition schemes, respectively; however, the TSE schemecannot achieve code acquisition when the PN code is inverteddue to data modulation. To overcome this drawback, Chiuand Lee proposed an improved sequential estimation (ISE)
scheme, which can achieve code acquisition regardless ofwhether the PN code is inverted or not by using an expandedprimitive polynomial [6]. By incorporating the TSE and ISEschemes, Koller and Belkerdid proposed a dual correlatingsequential estimation (DCSE) scheme, which can not onlyachieve acquisition for both inverted and non-inverted PNcodes, but also demodulate the SS signal [7], whose hardwarecomplexity is, however, inevitably high.
In this paper, thus, we propose a novel sequential estimationscheme for acquisition of a long PN code, which can achieveacquisition for both inverted and non-inverted PN codes andcan also demodulate data as in the DCSE scheme, yet withonly half the complexity of the DCSE scheme. We refer tothe proposed scheme as phase-shift-network-based differentialsequential estimation (PDSE) scheme since it employs adifferential operator and a phase-shift-network. The numericalresults demonstrate that the proposed scheme has a lower com-plexity regardless of the length of PN code while maintainingthe same level of code acquisition performance compared tothat of the conventional DCSE scheme.
This paper is organized as follows. Details of the systemmodel and proposed PDSE scheme are described in SectionII. The performance analysis and complexity comparison ofconventional and proposed schemes are delineated in detailin Section III. Section IV concludes this paper with a briefsummary.
II. PROPOSED SCHEME
Fig. 1 shows the structure of the PDSE receiver proposedin this paper. At the receiver, as in the conventional DCSEscheme, PDSE scheme requires n + 1 consecutive chips outof L (= 2n − 1) chips of PN sequence period for PNcode acquisition. The kth chip of the received signal can beexpressed as
rk =√PTcD(2sk − 1) + wk, for k = 0, 1, · · · , n, (1)
where P , Tc, and D are the power of the PN signal, durationof a PN chip, and modulated data taking a value in −1, 1with equal probability, respectively, sk ∈ 0, 1 is the kth chip
25Copyright (c) IARIA, 2011. ISBN: 978-1-61208-174-8
EMERGING 2011 : The Third International Conference on Emerging Network Intelligence
32 / 141
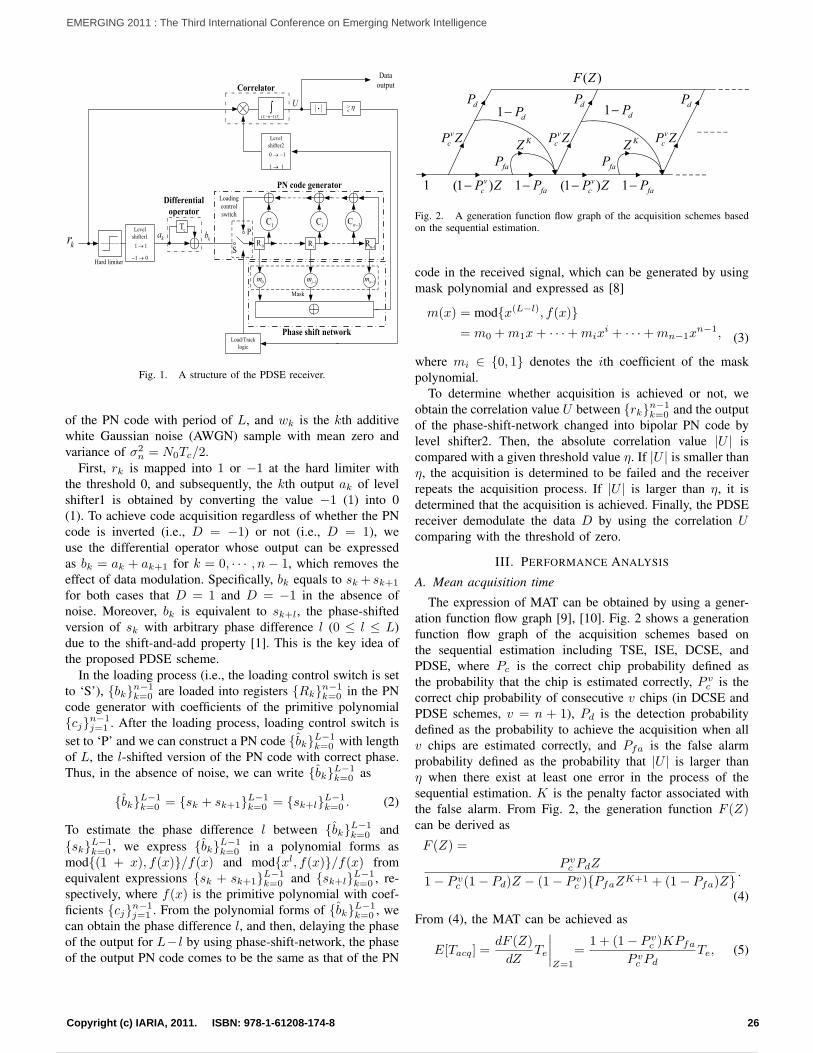
1C Ci 1C
n
0R Ri 1R
n
P
S
( 1)c
L n T !
"#$
U
Load/Track
logic
cT
0m 1im 1nm
Correlator
PN code generator
Mask
Phase shift network
ka
Differential
operator
kb
Level
shifter1
1 1
1 0
%
%
Level
shifter2
0 1
1 1
%
%
Loading
control
switch
Hard limiter
Data
output
kr
Fig. 1. A structure of the PDSE receiver.
of the PN code with period of L, and wk is the kth additivewhite Gaussian noise (AWGN) sample with mean zero andvariance of σ2
n = N0Tc/2.First, rk is mapped into 1 or −1 at the hard limiter with
the threshold 0, and subsequently, the kth output ak of levelshifter1 is obtained by converting the value −1 (1) into 0(1). To achieve code acquisition regardless of whether the PNcode is inverted (i.e., D = −1) or not (i.e., D = 1), weuse the differential operator whose output can be expressedas bk = ak + ak+1 for k = 0, · · · , n− 1, which removes theeffect of data modulation. Specifically, bk equals to sk + sk+1
for both cases that D = 1 and D = −1 in the absence ofnoise. Moreover, bk is equivalent to sk+l, the phase-shiftedversion of sk with arbitrary phase difference l (0 ≤ l ≤ L)due to the shift-and-add property [1]. This is the key idea ofthe proposed PDSE scheme.
In the loading process (i.e., the loading control switch is setto ‘S’), bkn−1
k=0 are loaded into registers Rkn−1k=0 in the PN
code generator with coefficients of the primitive polynomialcjn−1
j=1 . After the loading process, loading control switch isset to ‘P’ and we can construct a PN code bkL−1
k=0 with lengthof L, the l-shifted version of the PN code with correct phase.Thus, in the absence of noise, we can write bkL−1
k=0 as
bkL−1k=0 = sk + sk+1L−1
k=0 = sk+lL−1k=0 . (2)
To estimate the phase difference l between bkL−1k=0 and
skL−1k=0 , we express bkL−1
k=0 in a polynomial forms asmod(1 + x), f(x)/f(x) and modxl, f(x)/f(x) fromequivalent expressions sk + sk+1L−1
k=0 and sk+lL−1k=0 , re-
spectively, where f(x) is the primitive polynomial with coef-ficients cjn−1
j=1 . From the polynomial forms of bkL−1k=0 , we
can obtain the phase difference l, and then, delaying the phaseof the output for L− l by using phase-shift-network, the phaseof the output PN code comes to be the same as that of the PN
dP dP dP1 dP 1 dP
v
cP Zv
cP Zv
cP Z KZKZ
faP faP
1 faP 1 faP (1 )vcP Z (1 )vcP Z 1
( )F Z
Fig. 2. A generation function flow graph of the acquisition schemes basedon the sequential estimation.
code in the received signal, which can be generated by usingmask polynomial and expressed as [8]
m(x) = modx(L−l), f(x)= m0 +m1x+ · · ·+mix
i + · · ·+mn−1xn−1, (3)
where mi ∈ 0, 1 denotes the ith coefficient of the maskpolynomial.
To determine whether acquisition is achieved or not, weobtain the correlation value U between rkn−1
k=0 and the outputof the phase-shift-network changed into bipolar PN code bylevel shifter2. Then, the absolute correlation value |U | iscompared with a given threshold value η. If |U | is smaller thanη, the acquisition is determined to be failed and the receiverrepeats the acquisition process. If |U | is larger than η, it isdetermined that the acquisition is achieved. Finally, the PDSEreceiver demodulate the data D by using the correlation Ucomparing with the threshold of zero.
III. PERFORMANCE ANALYSIS
A. Mean acquisition time
The expression of MAT can be obtained by using a gener-ation function flow graph [9], [10]. Fig. 2 shows a generationfunction flow graph of the acquisition schemes based onthe sequential estimation including TSE, ISE, DCSE, andPDSE, where Pc is the correct chip probability defined asthe probability that the chip is estimated correctly, P v
c is thecorrect chip probability of consecutive v chips (in DCSE andPDSE schemes, v = n + 1), Pd is the detection probabilitydefined as the probability to achieve the acquisition when allv chips are estimated correctly, and Pfa is the false alarmprobability defined as the probability that |U | is larger thanη when there exist at least one error in the process of thesequential estimation. K is the penalty factor associated withthe false alarm. From Fig. 2, the generation function F (Z)can be derived as
F (Z) =
P vc PdZ
1− P vc (1− Pd)Z − (1− P v
c )PfaZK+1 + (1− Pfa)Z.
(4)
From (4), the MAT can be achieved as
E[Tacq] =dF (Z)
dZTe
∣∣∣∣Z=1
=1 + (1− P v
c )KPfa
P vc Pd
Te, (5)
26Copyright (c) IARIA, 2011. ISBN: 978-1-61208-174-8
EMERGING 2011 : The Third International Conference on Emerging Network Intelligence
33 / 141
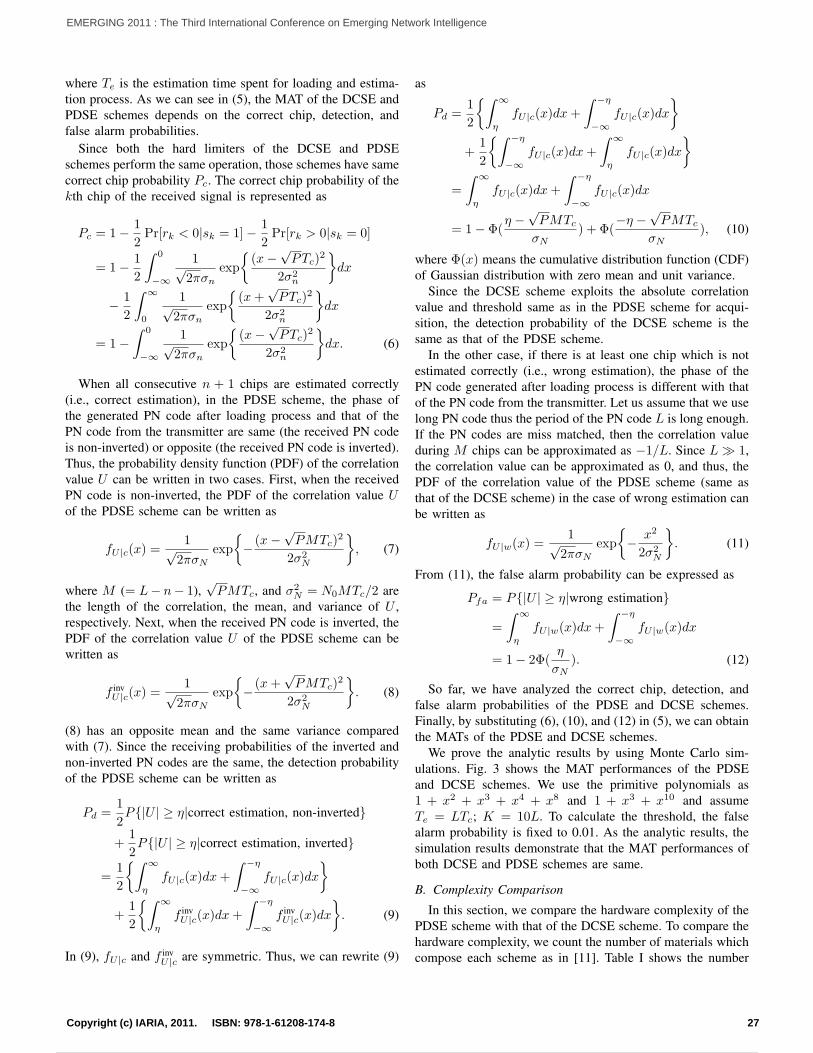
where Te is the estimation time spent for loading and estima-tion process. As we can see in (5), the MAT of the DCSE andPDSE schemes depends on the correct chip, detection, andfalse alarm probabilities.
Since both the hard limiters of the DCSE and PDSEschemes perform the same operation, those schemes have samecorrect chip probability Pc. The correct chip probability of thekth chip of the received signal is represented as
Pc = 1− 1
2Pr[rk < 0|sk = 1]− 1
2Pr[rk > 0|sk = 0]
= 1− 1
2
∫ 0
−∞
1√2πσn
exp
(x−
√PTc)
2
2σ2n
dx
− 1
2
∫ ∞
0
1√2πσn
exp
(x+
√PTc)
2
2σ2n
dx
= 1−∫ 0
−∞
1√2πσn
exp
(x−
√PTc)
2
2σ2n
dx. (6)
When all consecutive n + 1 chips are estimated correctly(i.e., correct estimation), in the PDSE scheme, the phase ofthe generated PN code after loading process and that of thePN code from the transmitter are same (the received PN codeis non-inverted) or opposite (the received PN code is inverted).Thus, the probability density function (PDF) of the correlationvalue U can be written in two cases. First, when the receivedPN code is non-inverted, the PDF of the correlation value Uof the PDSE scheme can be written as
fU |c(x) =1√
2πσN
exp
− (x−
√PMTc)
2
2σ2N
, (7)
where M (= L− n− 1),√PMTc, and σ2
N = N0MTc/2 arethe length of the correlation, the mean, and variance of U ,respectively. Next, when the received PN code is inverted, thePDF of the correlation value U of the PDSE scheme can bewritten as
f invU |c(x) =
1√2πσN
exp
− (x+
√PMTc)
2
2σ2N
. (8)
(8) has an opposite mean and the same variance comparedwith (7). Since the receiving probabilities of the inverted andnon-inverted PN codes are the same, the detection probabilityof the PDSE scheme can be written as
Pd =1
2P|U | ≥ η|correct estimation, non-inverted
+1
2P|U | ≥ η|correct estimation, inverted
=1
2
∫ ∞
η
fU |c(x)dx+
∫ −η
−∞fU |c(x)dx
+
1
2
∫ ∞
η
f invU |c(x)dx+
∫ −η
−∞f invU |c(x)dx
. (9)
In (9), fU |c and f invU |c are symmetric. Thus, we can rewrite (9)
as
Pd =1
2
∫ ∞
η
fU |c(x)dx+
∫ −η
−∞fU |c(x)dx
+
1
2
∫ −η
−∞fU |c(x)dx+
∫ ∞
η
fU |c(x)dx
=
∫ ∞
η
fU |c(x)dx+
∫ −η
−∞fU |c(x)dx
= 1− Φ(η −
√PMTc
σN) + Φ(
−η −√PMTc
σN), (10)
where Φ(x) means the cumulative distribution function (CDF)of Gaussian distribution with zero mean and unit variance.
Since the DCSE scheme exploits the absolute correlationvalue and threshold same as in the PDSE scheme for acqui-sition, the detection probability of the DCSE scheme is thesame as that of the PDSE scheme.
In the other case, if there is at least one chip which is notestimated correctly (i.e., wrong estimation), the phase of thePN code generated after loading process is different with thatof the PN code from the transmitter. Let us assume that we uselong PN code thus the period of the PN code L is long enough.If the PN codes are miss matched, then the correlation valueduring M chips can be approximated as −1/L. Since L ≫ 1,the correlation value can be approximated as 0, and thus, thePDF of the correlation value of the PDSE scheme (same asthat of the DCSE scheme) in the case of wrong estimation canbe written as
fU |w(x) =1√
2πσN
exp
− x2
2σ2N
. (11)
From (11), the false alarm probability can be expressed as
Pfa = P|U | ≥ η|wrong estimation
=
∫ ∞
η
fU |w(x)dx+
∫ −η
−∞fU |w(x)dx
= 1− 2Φ(η
σN). (12)
So far, we have analyzed the correct chip, detection, andfalse alarm probabilities of the PDSE and DCSE schemes.Finally, by substituting (6), (10), and (12) in (5), we can obtainthe MATs of the PDSE and DCSE schemes.
We prove the analytic results by using Monte Carlo sim-ulations. Fig. 3 shows the MAT performances of the PDSEand DCSE schemes. We use the primitive polynomials as1 + x2 + x3 + x4 + x8 and 1 + x3 + x10 and assumeTe = LTc; K = 10L. To calculate the threshold, the falsealarm probability is fixed to 0.01. As the analytic results, thesimulation results demonstrate that the MAT performances ofboth DCSE and PDSE schemes are same.
B. Complexity Comparison
In this section, we compare the hardware complexity of thePDSE scheme with that of the DCSE scheme. To compare thehardware complexity, we count the number of materials whichcompose each scheme as in [11]. Table I shows the number
27Copyright (c) IARIA, 2011. ISBN: 978-1-61208-174-8
EMERGING 2011 : The Third International Conference on Emerging Network Intelligence
34 / 141
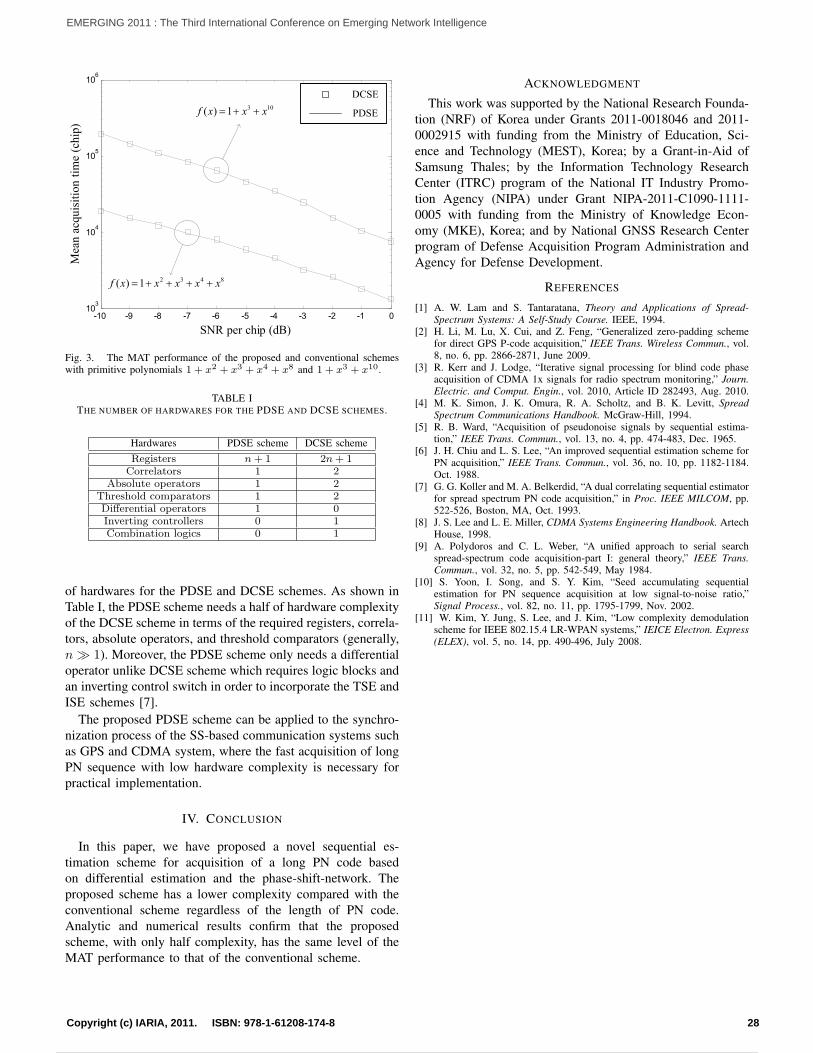
-10 -9 -8 -7 -6 -5 -4 -3 -2 -1 010
3
104
105
106
SNR per chip (dB)
Mea
n a
cqu
isit
ion
tim
e (c
hip
)
DCSE
PDSE
2 3 4 8( ) 1 ! ! ! !f x x x x x
3 10( ) 1 ! !f x x x
Fig. 3. The MAT performance of the proposed and conventional schemeswith primitive polynomials 1 + x2 + x3 + x4 + x8 and 1 + x3 + x10.
TABLE ITHE NUMBER OF HARDWARES FOR THE PDSE AND DCSE SCHEMES.
Hardwares PDSE scheme DCSE schemeRegisters n+ 1 2n+ 1Correlators 1 2
Absolute operators 1 2Threshold comparators 1 2Differential operators 1 0Inverting controllers 0 1Combination logics 0 1
of hardwares for the PDSE and DCSE schemes. As shown inTable I, the PDSE scheme needs a half of hardware complexityof the DCSE scheme in terms of the required registers, correla-tors, absolute operators, and threshold comparators (generally,n ≫ 1). Moreover, the PDSE scheme only needs a differentialoperator unlike DCSE scheme which requires logic blocks andan inverting control switch in order to incorporate the TSE andISE schemes [7].
The proposed PDSE scheme can be applied to the synchro-nization process of the SS-based communication systems suchas GPS and CDMA system, where the fast acquisition of longPN sequence with low hardware complexity is necessary forpractical implementation.
IV. CONCLUSION
In this paper, we have proposed a novel sequential es-timation scheme for acquisition of a long PN code basedon differential estimation and the phase-shift-network. Theproposed scheme has a lower complexity compared with theconventional scheme regardless of the length of PN code.Analytic and numerical results confirm that the proposedscheme, with only half complexity, has the same level of theMAT performance to that of the conventional scheme.
ACKNOWLEDGMENT
This work was supported by the National Research Founda-tion (NRF) of Korea under Grants 2011-0018046 and 2011-0002915 with funding from the Ministry of Education, Sci-ence and Technology (MEST), Korea; by a Grant-in-Aid ofSamsung Thales; by the Information Technology ResearchCenter (ITRC) program of the National IT Industry Promo-tion Agency (NIPA) under Grant NIPA-2011-C1090-1111-0005 with funding from the Ministry of Knowledge Econ-omy (MKE), Korea; and by National GNSS Research Centerprogram of Defense Acquisition Program Administration andAgency for Defense Development.
REFERENCES
[1] A. W. Lam and S. Tantaratana, Theory and Applications of Spread-Spectrum Systems: A Self-Study Course. IEEE, 1994.
[2] H. Li, M. Lu, X. Cui, and Z. Feng, “Generalized zero-padding schemefor direct GPS P-code acquisition,” IEEE Trans. Wireless Commun., vol.8, no. 6, pp. 2866-2871, June 2009.
[3] R. Kerr and J. Lodge, “Iterative signal processing for blind code phaseacquisition of CDMA 1x signals for radio spectrum monitoring,” Journ.Electric. and Comput. Engin., vol. 2010, Article ID 282493, Aug. 2010.
[4] M. K. Simon, J. K. Omura, R. A. Scholtz, and B. K. Levitt, SpreadSpectrum Communications Handbook. McGraw-Hill, 1994.
[5] R. B. Ward, “Acquisition of pseudonoise signals by sequential estima-tion,” IEEE Trans. Commun., vol. 13, no. 4, pp. 474-483, Dec. 1965.
[6] J. H. Chiu and L. S. Lee, “An improved sequential estimation scheme forPN acquisition,” IEEE Trans. Commun., vol. 36, no. 10, pp. 1182-1184.Oct. 1988.
[7] G. G. Koller and M. A. Belkerdid, “A dual correlating sequential estimatorfor spread spectrum PN code acquisition,” in Proc. IEEE MILCOM, pp.522-526, Boston, MA, Oct. 1993.
[8] J. S. Lee and L. E. Miller, CDMA Systems Engineering Handbook. ArtechHouse, 1998.
[9] A. Polydoros and C. L. Weber, “A unified approach to serial searchspread-spectrum code acquisition-part I: general theory,” IEEE Trans.Commun., vol. 32, no. 5, pp. 542-549, May 1984.
[10] S. Yoon, I. Song, and S. Y. Kim, “Seed accumulating sequentialestimation for PN sequence acquisition at low signal-to-noise ratio,”Signal Process., vol. 82, no. 11, pp. 1795-1799, Nov. 2002.
[11] W. Kim, Y. Jung, S. Lee, and J. Kim, “Low complexity demodulationscheme for IEEE 802.15.4 LR-WPAN systems,” IEICE Electron. Express(ELEX), vol. 5, no. 14, pp. 490-496, July 2008.
28Copyright (c) IARIA, 2011. ISBN: 978-1-61208-174-8
EMERGING 2011 : The Third International Conference on Emerging Network Intelligence
35 / 141
Robust Integer Frequency Offset Estimation SchemeBased on Differentially Combined Correlator
Outputs for DVB-T Systems
Jong In Park1, Hyung-Weon Cho2, Youngpo Lee1, Sun Yong Kim3, Gyu-In Jee3, Jin-Mo Yang4, and Seokho Yoon1,†1School of Information and Communication Engineering, Sungkyunkwan University, Suwon, Korea
2Samsung Thales Co. LTD., Seongnam, Korea3Department of Electronics Engineering, Konkuk University, Seoul, Korea
4Agency for Defense Development (ADD), Daejeon, Korea†Corresponding author
(E-mail: [email protected], [email protected], [email protected],kimsy, [email protected], [email protected], and †[email protected])
Abstract—A pilot-aided integer frequency offset (IFO) estima-tion scheme robust to the timing offset is proposed for orthogonalfrequency division multiplexing (OFDM)-based digital videobroadcasting-terrestrial (DVB-T) systems. The proposed schemefirst produces correlation values between each continual pilot(CP) and a predetermined scattered pilot (SP), and then, re-correlates the correlation values in order to reduce the influenceof the timing offset. Simulation results show that the proposedIFO estimation scheme is robust to the timing offset and hasbetter estimation performance than the conventional scheme.
Index Terms—DVB-T, estimation, IFO, OFDM, timing offset,emerging networks
I. INTRODUCTION
Due to its immunity to multipath fading and high spectral ef-ficiency, orthogonal frequency division multiplexing (OFDM)has been adopted as a modulation format in a wide variety ofemerging wireless systems such as digital video broadcasting-terrestrial (DVB-T), digital audio broadcasting (DAB), andwireless local area networks (WLANs) [1], [2]. Moreover, thenext generation telecommunication system including long termevolution (LTE) also employs OFDM as the physical layerimplementation. However, the OFDM is very sensitive to thefrequency offset (FO) caused by Doppler shift or oscillatorinstabilities, and thus, the FO estimation is one of the mostimportant technical issues in OFDM-based wireless systems[3], [4]. The FO normalized to the subcarrier spacing canbe divided into integer and fractional parts that bring on acyclic shift of the OFDM subcarrier indices and intercarrierinterference (ICI), respectively [5]. In this paper, we deal withthe integer FO (IFO) estimation for OFDM-based DVB-Tsystems.
Recently, several IFO estimation schemes [6], [7] havebeen proposed for OFDM-based DVB-T systems. [6] estimatesthe IFO by using the correlation between the received pilotsand reference pilots in the receiver; however, it exhibits poorperformance in the multipath channel. In [7], to alleviate the
influence of the multipath, the IFO is estimated based on thecorrelation between each continual pilot (CP) and its mostadjacent scattered pilot (SP) in the received OFDM symbol;however, the scheme assumes that the timing synchronizationis perfectly achieved before IFO estimation. In practical sys-tems, only coarse timing synchronization is performed beforeFO estimation, and fine timing synchronization is performedafter FO estimation [5]. Thus, the timing offset often remainsduring the IFO estimation step and affects the IFO estimationperformance.
In this paper, we propose a novel pilot-aided IFO estimationscheme robust to the influence of the timing offset for OFDM-based DVB-T systems. By producing the correlation valuesbetween each CP and predetermined SP and re-correlating thecorrelation values, the proposed scheme reduces the influenceof the timing offset on the IFO estimation. Simulation resultsshow that the proposed scheme has more robust and better es-timation performance compared with that of the conventionalscheme in [7]. The rest of this paper is organized as follows.Section II describes the OFDM-based DVB-T system model.In Section III, we present the conventional IFO estimationscheme, and a novel IFO estimation scheme robust to theinfluence of the timing offset is proposed in Section IV.Section V demonstrates the IFO estimation performance of thetwo schemes in the multipath channel. Section VI concludesthis paper.
II. SYSTEM MODEL
DVB-T systems operate in 2K or 8K mode, of which theformer is considered in this paper, where 1705 subcarriersamong a total of 2048 subcarriers are used to transmit data andpilots of 45 CPs and 142 or 143 SPs. The pilots are used forfrequency and timing synchronization and channel estimation,and have a value of either +4/3 or −4/3 depending on apseudo random binary sequence (PRBS). Fig. 1 describes thepilot arrangement in a DVB-T system with 2K mode, where
29Copyright (c) IARIA, 2011. ISBN: 978-1-61208-174-8
EMERGING 2011 : The Third International Conference on Emerging Network Intelligence
36 / 141
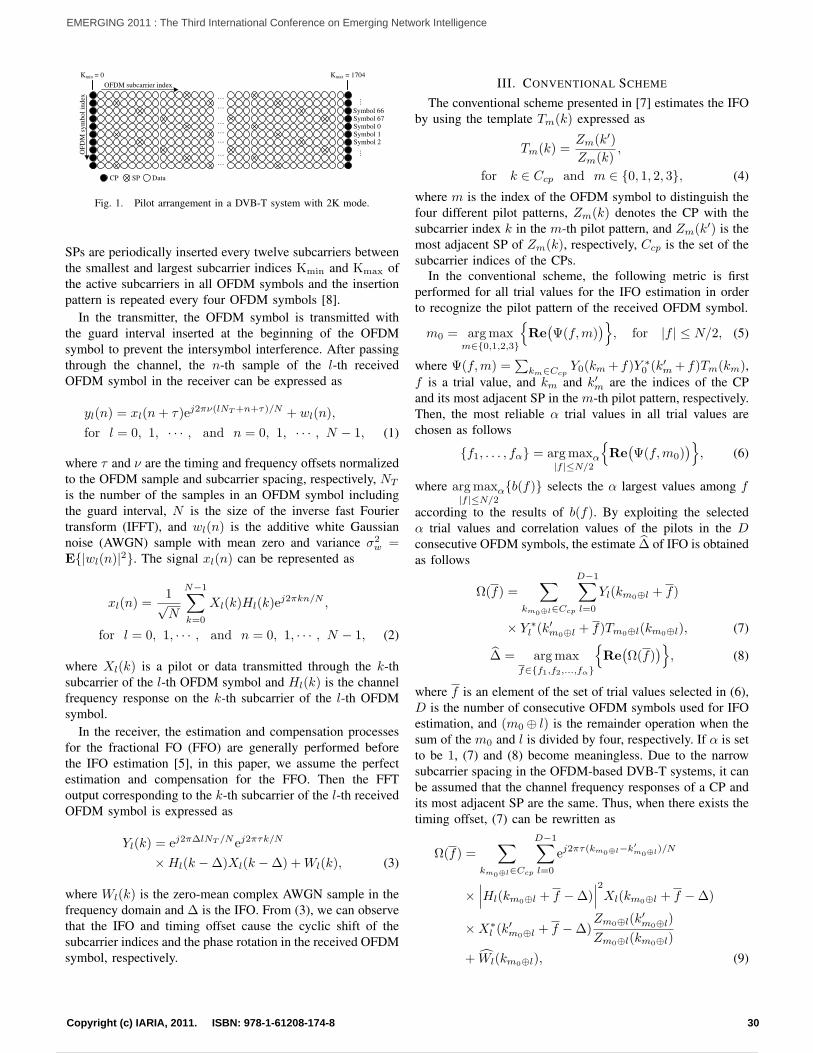
Symbol 67Symbol 0Symbol 1Symbol 2
Symbol 66
OFDM subcarrier indexO
FD
M s
ym
bol
index
CP SP Data
Kmin = 0 Kmax = 1704
Fig. 1. Pilot arrangement in a DVB-T system with 2K mode.
SPs are periodically inserted every twelve subcarriers betweenthe smallest and largest subcarrier indices Kmin and Kmax ofthe active subcarriers in all OFDM symbols and the insertionpattern is repeated every four OFDM symbols [8].
In the transmitter, the OFDM symbol is transmitted withthe guard interval inserted at the beginning of the OFDMsymbol to prevent the intersymbol interference. After passingthrough the channel, the n-th sample of the l-th receivedOFDM symbol in the receiver can be expressed as
yl(n) = xl(n+ τ)ej2πν(lNT+n+τ)/N + wl(n),
for l = 0, 1, · · · , and n = 0, 1, · · · , N − 1, (1)
where τ and ν are the timing and frequency offsets normalizedto the OFDM sample and subcarrier spacing, respectively, NT
is the number of the samples in an OFDM symbol includingthe guard interval, N is the size of the inverse fast Fouriertransform (IFFT), and wl(n) is the additive white Gaussiannoise (AWGN) sample with mean zero and variance σ2
w =E|wl(n)|2. The signal xl(n) can be represented as
xl(n) =1√N
N−1∑k=0
Xl(k)Hl(k)ej2πkn/N ,
for l = 0, 1, · · · , and n = 0, 1, · · · , N − 1, (2)
where Xl(k) is a pilot or data transmitted through the k-thsubcarrier of the l-th OFDM symbol and Hl(k) is the channelfrequency response on the k-th subcarrier of the l-th OFDMsymbol.
In the receiver, the estimation and compensation processesfor the fractional FO (FFO) are generally performed beforethe IFO estimation [5], in this paper, we assume the perfectestimation and compensation for the FFO. Then the FFToutput corresponding to the k-th subcarrier of the l-th receivedOFDM symbol is expressed as
Yl(k) = ej2π∆lNT /Nej2πτk/N
×Hl(k −∆)Xl(k −∆) +Wl(k), (3)
where Wl(k) is the zero-mean complex AWGN sample in thefrequency domain and ∆ is the IFO. From (3), we can observethat the IFO and timing offset cause the cyclic shift of thesubcarrier indices and the phase rotation in the received OFDMsymbol, respectively.
III. CONVENTIONAL SCHEME
The conventional scheme presented in [7] estimates the IFOby using the template Tm(k) expressed as
Tm(k) =Zm(k′)
Zm(k),
for k ∈ Ccp and m ∈ 0, 1, 2, 3, (4)
where m is the index of the OFDM symbol to distinguish thefour different pilot patterns, Zm(k) denotes the CP with thesubcarrier index k in the m-th pilot pattern, and Zm(k′) is themost adjacent SP of Zm(k), respectively, Ccp is the set of thesubcarrier indices of the CPs.
In the conventional scheme, the following metric is firstperformed for all trial values for the IFO estimation in orderto recognize the pilot pattern of the received OFDM symbol.
m0 = argmaxm∈0,1,2,3
Re
(Ψ(f,m)
), for |f | ≤ N/2, (5)
where Ψ(f,m) =∑
km∈CcpY0(km + f)Y ∗
0 (k′m + f)Tm(km),
f is a trial value, and km and k′m are the indices of the CPand its most adjacent SP in the m-th pilot pattern, respectively.Then, the most reliable α trial values in all trial values arechosen as follows
f1, . . . , fα = argmaxα|f |≤N/2
Re
(Ψ(f,m0)
), (6)
where argmaxα|f |≤N/2
b(f) selects the α largest values among f
according to the results of b(f). By exploiting the selectedα trial values and correlation values of the pilots in the Dconsecutive OFDM symbols, the estimate ∆ of IFO is obtainedas follows
Ω(f) =∑
km0⊕l∈Ccp
D−1∑l=0
Yl(km0⊕l + f)
× Y ∗l (k
′m0⊕l + f)Tm0⊕l(km0⊕l), (7)
∆ = argmaxf∈f1,f2,...,fα
Re
(Ω(f)
), (8)
where f is an element of the set of trial values selected in (6),D is the number of consecutive OFDM symbols used for IFOestimation, and (m0 ⊕ l) is the remainder operation when thesum of the m0 and l is divided by four, respectively. If α is setto be 1, (7) and (8) become meaningless. Due to the narrowsubcarrier spacing in the OFDM-based DVB-T systems, it canbe assumed that the channel frequency responses of a CP andits most adjacent SP are the same. Thus, when there exists thetiming offset, (7) can be rewritten as
Ω(f) =∑
km0⊕l∈Ccp
D−1∑l=0
ej2πτ(km0⊕l−k′m0⊕l)/N
×∣∣∣Hl(km0⊕l + f −∆)
∣∣∣2Xl(km0⊕l + f −∆)
×X∗l (k
′m0⊕l + f −∆)
Zm0⊕l(k′m0⊕l)
Zm0⊕l(km0⊕l)
+ Wl(km0⊕l), (9)
30Copyright (c) IARIA, 2011. ISBN: 978-1-61208-174-8
EMERGING 2011 : The Third International Conference on Emerging Network Intelligence
37 / 141
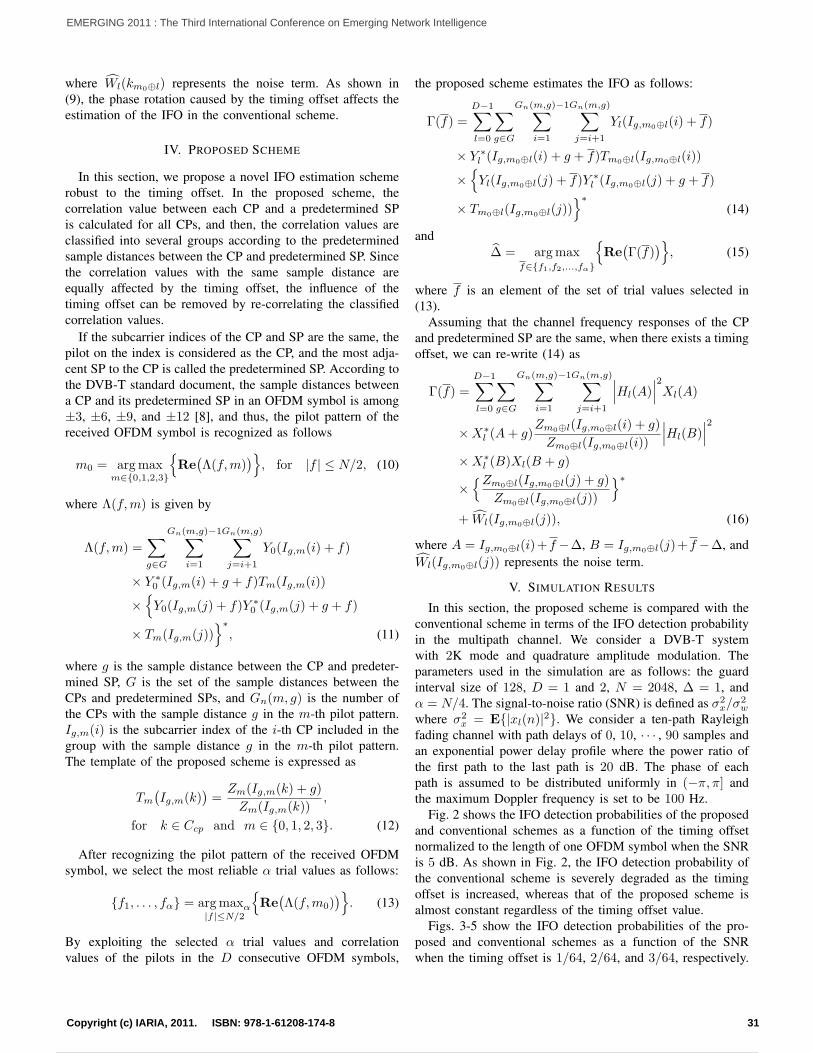
where Wl(km0⊕l) represents the noise term. As shown in(9), the phase rotation caused by the timing offset affects theestimation of the IFO in the conventional scheme.
IV. PROPOSED SCHEME
In this section, we propose a novel IFO estimation schemerobust to the timing offset. In the proposed scheme, thecorrelation value between each CP and a predetermined SPis calculated for all CPs, and then, the correlation values areclassified into several groups according to the predeterminedsample distances between the CP and predetermined SP. Sincethe correlation values with the same sample distance areequally affected by the timing offset, the influence of thetiming offset can be removed by re-correlating the classifiedcorrelation values.
If the subcarrier indices of the CP and SP are the same, thepilot on the index is considered as the CP, and the most adja-cent SP to the CP is called the predetermined SP. According tothe DVB-T standard document, the sample distances betweena CP and its predetermined SP in an OFDM symbol is among±3, ±6, ±9, and ±12 [8], and thus, the pilot pattern of thereceived OFDM symbol is recognized as follows
m0 = argmaxm∈0,1,2,3
Re
(Λ(f,m)
), for |f | ≤ N/2, (10)
where Λ(f,m) is given by
Λ(f,m) =∑g∈G
Gn(m,g)−1∑i=1
Gn(m,g)∑j=i+1
Y0(Ig,m(i) + f)
× Y ∗0 (Ig,m(i) + g + f)Tm(Ig,m(i))
×Y0(Ig,m(j) + f)Y ∗
0 (Ig,m(j) + g + f)
× Tm(Ig,m(j))∗
, (11)
where g is the sample distance between the CP and predeter-mined SP, G is the set of the sample distances between theCPs and predetermined SPs, and Gn(m, g) is the number ofthe CPs with the sample distance g in the m-th pilot pattern.Ig,m(i) is the subcarrier index of the i-th CP included in thegroup with the sample distance g in the m-th pilot pattern.The template of the proposed scheme is expressed as
Tm
(Ig,m(k)
)=
Zm(Ig,m(k) + g)
Zm(Ig,m(k)),
for k ∈ Ccp and m ∈ 0, 1, 2, 3. (12)
After recognizing the pilot pattern of the received OFDMsymbol, we select the most reliable α trial values as follows:
f1, . . . , fα = argmaxα|f |≤N/2
Re
(Λ(f,m0)
). (13)
By exploiting the selected α trial values and correlationvalues of the pilots in the D consecutive OFDM symbols,
the proposed scheme estimates the IFO as follows:
Γ(f) =
D−1∑l=0
∑g∈G
Gn(m,g)−1∑i=1
Gn(m,g)∑j=i+1
Yl(Ig,m0⊕l(i) + f)
× Y ∗l (Ig,m0⊕l(i) + g + f)Tm0⊕l(Ig,m0⊕l(i))
×Yl(Ig,m0⊕l(j) + f)Y ∗
l (Ig,m0⊕l(j) + g + f)
× Tm0⊕l(Ig,m0⊕l(j))∗
(14)
and∆ = argmax
f∈f1,f2,...,fα
Re
(Γ(f)
), (15)
where f is an element of the set of trial values selected in(13).
Assuming that the channel frequency responses of the CPand predetermined SP are the same, when there exists a timingoffset, we can re-write (14) as
Γ(f) =D−1∑l=0
∑g∈G
Gn(m,g)−1∑i=1
Gn(m,g)∑j=i+1
∣∣∣Hl(A)∣∣∣2Xl(A)
×X∗l (A+ g)
Zm0⊕l(Ig,m0⊕l(i) + g)
Zm0⊕l(Ig,m0⊕l(i))
∣∣∣Hl(B)∣∣∣2
×X∗l (B)Xl(B + g)
×Zm0⊕l(Ig,m0⊕l(j) + g)
Zm0⊕l(Ig,m0⊕l(j))
∗
+ Wl(Ig,m0⊕l(j)), (16)
where A = Ig,m0⊕l(i)+f −∆, B = Ig,m0⊕l(j)+f −∆, andWl(Ig,m0⊕l(j)) represents the noise term.
V. SIMULATION RESULTS
In this section, the proposed scheme is compared with theconventional scheme in terms of the IFO detection probabilityin the multipath channel. We consider a DVB-T systemwith 2K mode and quadrature amplitude modulation. Theparameters used in the simulation are as follows: the guardinterval size of 128, D = 1 and 2, N = 2048, ∆ = 1, andα = N/4. The signal-to-noise ratio (SNR) is defined as σ2
x/σ2w
where σ2x = E|xl(n)|2. We consider a ten-path Rayleigh
fading channel with path delays of 0, 10, · · · , 90 samples andan exponential power delay profile where the power ratio ofthe first path to the last path is 20 dB. The phase of eachpath is assumed to be distributed uniformly in (−π, π] andthe maximum Doppler frequency is set to be 100 Hz.
Fig. 2 shows the IFO detection probabilities of the proposedand conventional schemes as a function of the timing offsetnormalized to the length of one OFDM symbol when the SNRis 5 dB. As shown in Fig. 2, the IFO detection probability ofthe conventional scheme is severely degraded as the timingoffset is increased, whereas that of the proposed scheme isalmost constant regardless of the timing offset value.
Figs. 3-5 show the IFO detection probabilities of the pro-posed and conventional schemes as a function of the SNRwhen the timing offset is 1/64, 2/64, and 3/64, respectively.
31Copyright (c) IARIA, 2011. ISBN: 978-1-61208-174-8
EMERGING 2011 : The Third International Conference on Emerging Network Intelligence
38 / 141
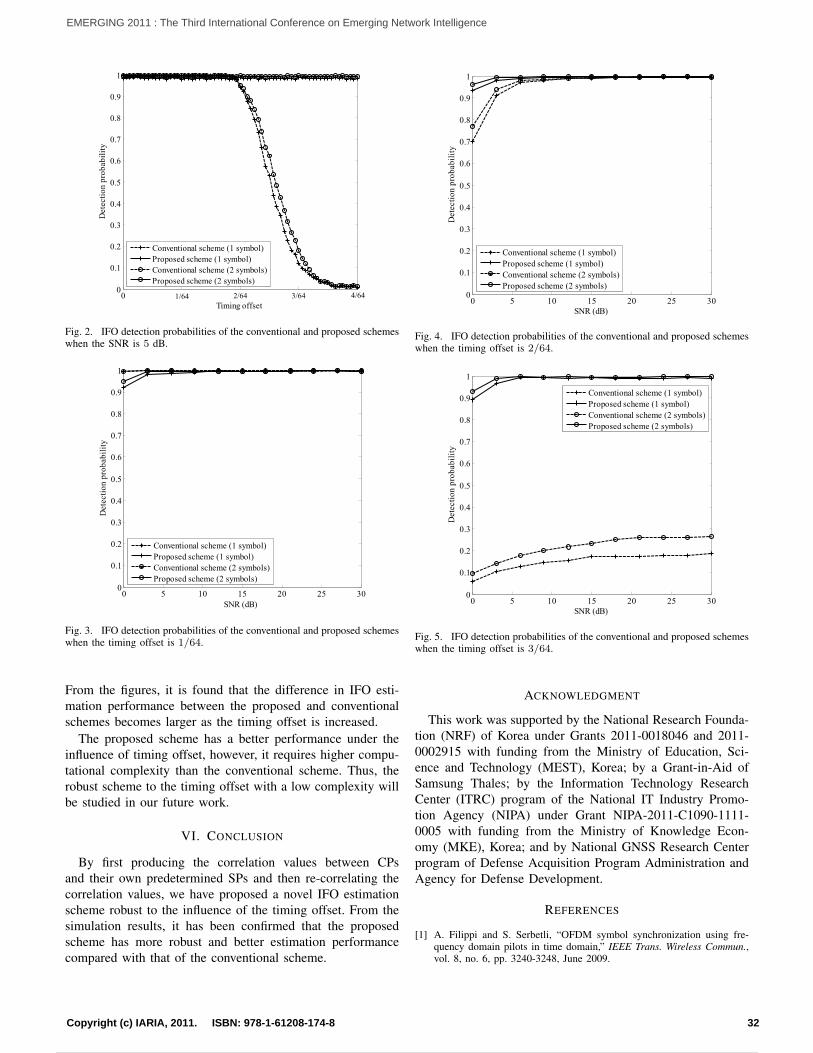
0 32 64 96 1280
0.1
0.2
0.3
0.4
0.5
0.6
0.7
0.8
0.9
1
Timing offset
Dete
cti
on
pro
bab
ilit
y
Conventional scheme (1 symbol)
Proposed scheme (1 symbol)
Conventional scheme (2 symbols)
Proposed scheme (2 symbols)
1/64 2/64 3/64 4/64
Fig. 2. IFO detection probabilities of the conventional and proposed schemeswhen the SNR is 5 dB.
0 5 10 15 20 25 300
0.1
0.2
0.3
0.4
0.5
0.6
0.7
0.8
0.9
1
SNR (dB)
Dete
cti
on
pro
bab
ilit
y
Conventional scheme (1 symbol)
Proposed scheme (1 symbol)
Conventional scheme (2 symbols)
Proposed scheme (2 symbols)
Fig. 3. IFO detection probabilities of the conventional and proposed schemeswhen the timing offset is 1/64.
From the figures, it is found that the difference in IFO esti-mation performance between the proposed and conventionalschemes becomes larger as the timing offset is increased.
The proposed scheme has a better performance under theinfluence of timing offset, however, it requires higher compu-tational complexity than the conventional scheme. Thus, therobust scheme to the timing offset with a low complexity willbe studied in our future work.
VI. CONCLUSION
By first producing the correlation values between CPsand their own predetermined SPs and then re-correlating thecorrelation values, we have proposed a novel IFO estimationscheme robust to the influence of the timing offset. From thesimulation results, it has been confirmed that the proposedscheme has more robust and better estimation performancecompared with that of the conventional scheme.
0 5 10 15 20 25 300
0.1
0.2
0.3
0.4
0.5
0.6
0.7
0.8
0.9
1
SNR (dB)
Dete
cti
on
pro
bab
ilit
y
Conventional scheme (1 symbol)
Proposed scheme (1 symbol)
Conventional scheme (2 symbols)
Proposed scheme (2 symbols)
Fig. 4. IFO detection probabilities of the conventional and proposed schemeswhen the timing offset is 2/64.
0 5 10 15 20 25 300
0.1
0.2
0.3
0.4
0.5
0.6
0.7
0.8
0.9
1
SNR (dB)
Dete
cti
on
pro
bab
ilit
y
Conventional scheme (1 symbol)
Proposed scheme (1 symbol)
Conventional scheme (2 symbols)
Proposed scheme (2 symbols)
Fig. 5. IFO detection probabilities of the conventional and proposed schemeswhen the timing offset is 3/64.
ACKNOWLEDGMENT
This work was supported by the National Research Founda-tion (NRF) of Korea under Grants 2011-0018046 and 2011-0002915 with funding from the Ministry of Education, Sci-ence and Technology (MEST), Korea; by a Grant-in-Aid ofSamsung Thales; by the Information Technology ResearchCenter (ITRC) program of the National IT Industry Promo-tion Agency (NIPA) under Grant NIPA-2011-C1090-1111-0005 with funding from the Ministry of Knowledge Econ-omy (MKE), Korea; and by National GNSS Research Centerprogram of Defense Acquisition Program Administration andAgency for Defense Development.
REFERENCES
[1] A. Filippi and S. Serbetli, “OFDM symbol synchronization using fre-quency domain pilots in time domain,” IEEE Trans. Wireless Commun.,vol. 8, no. 6, pp. 3240-3248, June 2009.
32Copyright (c) IARIA, 2011. ISBN: 978-1-61208-174-8
EMERGING 2011 : The Third International Conference on Emerging Network Intelligence
39 / 141
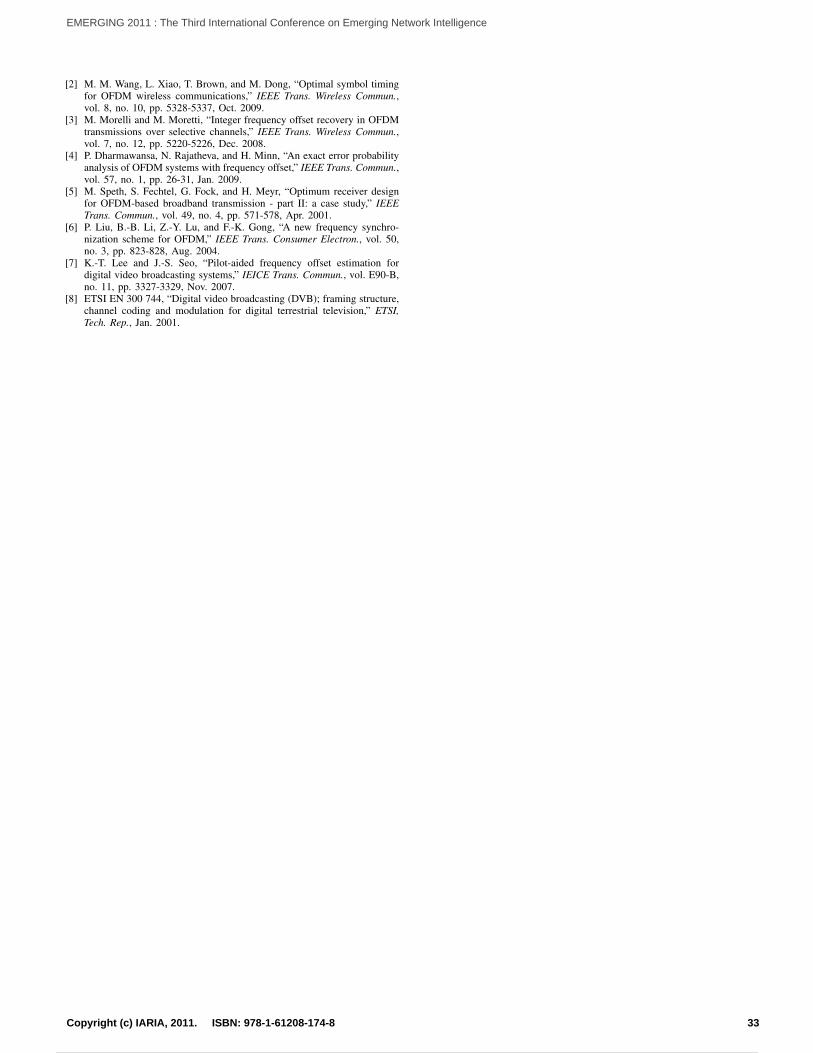
[2] M. M. Wang, L. Xiao, T. Brown, and M. Dong, “Optimal symbol timingfor OFDM wireless communications,” IEEE Trans. Wireless Commun.,vol. 8, no. 10, pp. 5328-5337, Oct. 2009.
[3] M. Morelli and M. Moretti, “Integer frequency offset recovery in OFDMtransmissions over selective channels,” IEEE Trans. Wireless Commun.,vol. 7, no. 12, pp. 5220-5226, Dec. 2008.
[4] P. Dharmawansa, N. Rajatheva, and H. Minn, “An exact error probabilityanalysis of OFDM systems with frequency offset,” IEEE Trans. Commun.,vol. 57, no. 1, pp. 26-31, Jan. 2009.
[5] M. Speth, S. Fechtel, G. Fock, and H. Meyr, “Optimum receiver designfor OFDM-based broadband transmission - part II: a case study,” IEEETrans. Commun., vol. 49, no. 4, pp. 571-578, Apr. 2001.
[6] P. Liu, B.-B. Li, Z.-Y. Lu, and F.-K. Gong, “A new frequency synchro-nization scheme for OFDM,” IEEE Trans. Consumer Electron., vol. 50,no. 3, pp. 823-828, Aug. 2004.
[7] K.-T. Lee and J.-S. Seo, “Pilot-aided frequency offset estimation fordigital video broadcasting systems,” IEICE Trans. Commun., vol. E90-B,no. 11, pp. 3327-3329, Nov. 2007.
[8] ETSI EN 300 744, “Digital video broadcasting (DVB); framing structure,channel coding and modulation for digital terrestrial television,” ETSI,Tech. Rep., Jan. 2001.
33Copyright (c) IARIA, 2011. ISBN: 978-1-61208-174-8
EMERGING 2011 : The Third International Conference on Emerging Network Intelligence
40 / 141
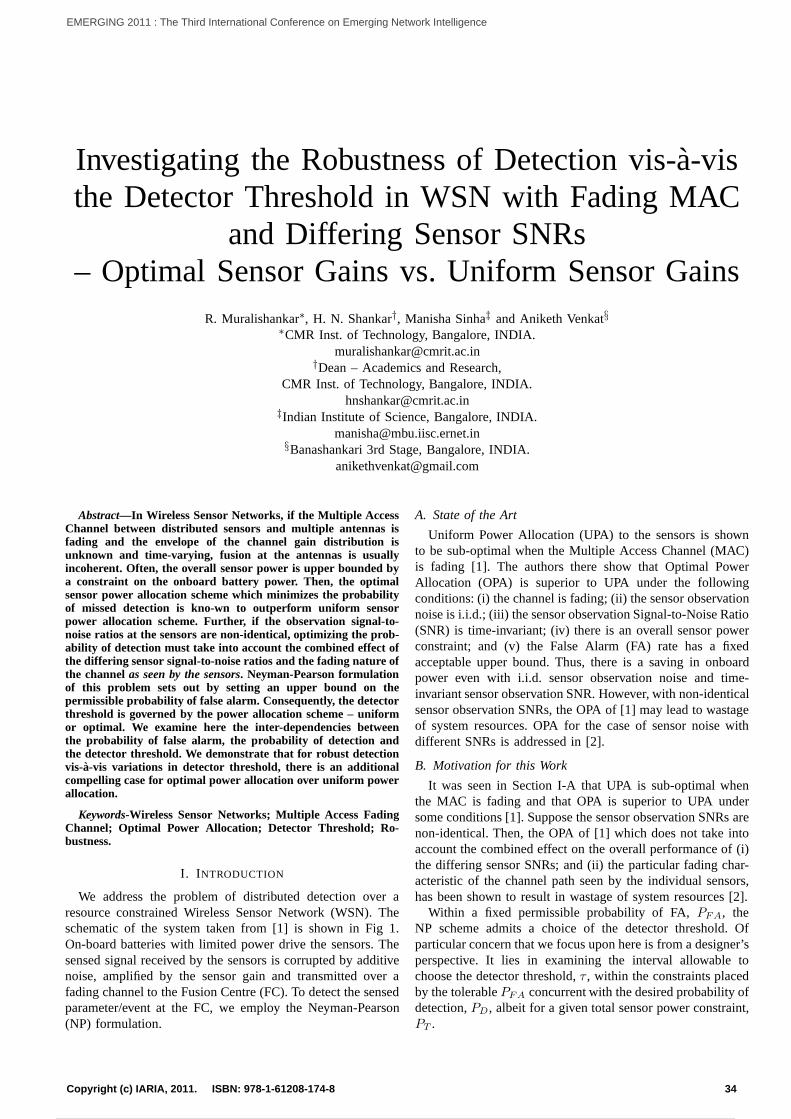
Investigating the Robustness of Detection vis-a-visthe Detector Threshold in WSN with Fading MAC
and Differing Sensor SNRs– Optimal Sensor Gains vs. Uniform Sensor Gains
R. Muralishankar∗, H. N. Shankar†, Manisha Sinha‡ and Aniketh Venkat§∗CMR Inst. of Technology, Bangalore, INDIA.
[email protected]†Dean – Academics and Research,
CMR Inst. of Technology, Bangalore, [email protected]
‡Indian Institute of Science, Bangalore, [email protected]
§Banashankari 3rd Stage, Bangalore, [email protected]
Abstract—In Wireless Sensor Networks, if the Multiple AccessChannel between distributed sensors and multiple antennasisfading and the envelope of the channel gain distribution isunknown and time-varying, fusion at the antennas is usuallyincoherent. Often, the overall sensor power is upper bounded bya constraint on the onboard battery power. Then, the optimalsensor power allocation scheme which minimizes the probabilityof missed detection is kno-wn to outperform uniform sensorpower allocation scheme. Further, if the observation signal-to-noise ratios at the sensors are non-identical, optimizing the prob-ability of detection must take into account the combined effect ofthe differing sensor signal-to-noise ratios and the fadingnature ofthe channelas seen by the sensors. Neyman-Pearson formulationof this problem sets out by setting an upper bound on thepermissible probability of false alarm. Consequently, thedetectorthreshold is governed by the power allocation scheme – uniformor optimal. We examine here the inter-dependencies betweenthe probability of false alarm, the probability of detection andthe detector threshold. We demonstrate that for robust detectionvis-a-vis variations in detector threshold, there is an additionalcompelling case for optimal power allocation over uniform powerallocation.
Keywords-Wireless Sensor Networks; Multiple Access FadingChannel; Optimal Power Allocation; Detector Threshold; Ro-bustness.
I. I NTRODUCTION
We address the problem of distributed detection over aresource constrained Wireless Sensor Network (WSN). Theschematic of the system taken from [1] is shown in Fig 1.On-board batteries with limited power drive the sensors. Thesensed signal received by the sensors is corrupted by additivenoise, amplified by the sensor gain and transmitted over afading channel to the Fusion Centre (FC). To detect the sensedparameter/event at the FC, we employ the Neyman-Pearson(NP) formulation.
A. State of the Art
Uniform Power Allocation (UPA) to the sensors is shownto be sub-optimal when the Multiple Access Channel (MAC)is fading [1]. The authors there show that Optimal PowerAllocation (OPA) is superior to UPA under the followingconditions: (i) the channel is fading; (ii) the sensor observationnoise is i.i.d.; (iii) the sensor observation Signal-to-Noise Ratio(SNR) is time-invariant; (iv) there is an overall sensor powerconstraint; and (v) the False Alarm (FA) rate has a fixedacceptable upper bound. Thus, there is a saving in onboardpower even with i.i.d. sensor observation noise and time-invariant sensor observation SNR. However, with non-identicalsensor observation SNRs, the OPA of [1] may lead to wastageof system resources. OPA for the case of sensor noise withdifferent SNRs is addressed in [2].
B. Motivation for this Work
It was seen in Section I-A that UPA is sub-optimal whenthe MAC is fading and that OPA is superior to UPA undersome conditions [1]. Suppose the sensor observation SNRs arenon-identical. Then, the OPA of [1] which does not take intoaccount the combined effect on the overall performance of (i)the differing sensor SNRs; and (ii) the particular fading char-acteristic of the channel path seen by the individual sensors,has been shown to result in wastage of system resources [2].
Within a fixed permissible probability of FA,PFA, theNP scheme admits a choice of the detector threshold. Ofparticular concern that we focus upon here is from a designer’sperspective. It lies in examining the interval allowable tochoose the detector threshold,τ , within the constraints placedby the tolerablePFA concurrent with the desired probability ofdetection,PD, albeit for a given total sensor power constraint,PT .
34Copyright (c) IARIA, 2011. ISBN: 978-1-61208-174-8
EMERGING 2011 : The Third International Conference on Emerging Network Intelligence
41 / 141

Moreover, asτ varies within the admissible interval ofτ , itis desired to study the nature of degradation of performance.In relation toPFA, the detector threshold,τ , impactsPD. Thenatural question that arises here is therefore the ’goodness’ ofthe choice ofτ for ’enhanced performance’. To answer thisquestion, we study the nature of inter-relationships betweenPFA, τ and PD. The comparison here is across OPA andUPA. Thus, equipped with a priori knowledge of the natureof impact ofτ on system performance, the user can chooseτto balance conflicting criteria, dictated by the demands of thespecific application.
The rest of the paper is organized as follows. Section IIdescribes the system model with the power constraint. Thedetection algorithm and its formulation comprise Section III.Power allocation schemes are discussed in Section IV.Simulation set up and results are presented and analyzed inSection V. Concluding remarks form Section VI.
II. SYSTEM DESCRIPTION ANDMODEL
To facilitate readability, we briefly describe the system setupon the lines of the formulation in [2].
A. The Sensor
The sensor network comprisesL sensors transmitting toN antennas overNL channels as in Fig. 1 [3]. The sensedparameter/event isΘ ∈ 0, θ. Let H0 and H1 be thehypotheses corresponding respectively toΘ = 0 andΘ = θ.Further, in terms of the priorsp0 andp1, let
Θ∆=
H0 : 0 w.p. p0;H1 : θ w.p. p1.
At the ℓth sensor, the additive noise,ηℓ, is characterized asηℓ ∼ CN (0, σℓ
2). Thus the sensor SNRs are not identical. Thegain of theℓth sensor isαℓ ∈ C. Then, the sensor output is
αℓ(Θ + ηℓ); ℓ = 1, 2, · · · , L.The constraint on the overall sensor power,PT , is given by
PT = E
[L∑
ℓ=1
| αℓ(Θ + nℓ) |2]
(1)
=
L∑
ℓ=1
| αℓ |2 (p1θ2 + σ2
ℓ )
= αH[p1θ
2IL +D(σ)]α, (2)
in matrix notations. Here,E[·] is the expectation operator;α, σ ∈ CL×1; xH is the Hermitian ofx; IL is the identitymatrix of sizeL; andD(u) ∈ Cm×m is the diagonal matrixwith the entries of the vectoru ∈ Cm×1 on the diagonal.
B. Multiple Access Channel (MAC)
The sensors feed into a multiple access fading channel. Therandom gain from theℓth sensor to thenth antenna ish(n, ℓ).
Sensor
α1
Sensor
α2
F
U
S
I
O
N
C
E
N
T
R
E
+
+
+
+
+
+
+
+
yi
y2
y1
yN
ΘΘ
ν1
ν2
νi
νN
η1
η2
ηj
ηL
h(i, j)Sensor
αj
Sensor
αL
Fig. 1. Schematic of the Setup
The channel gain matrix is thusH = [h(n, ℓ)] ∈ CN×L.
C. Antennas and the Fusion Center
There areN antennas at the receiving end. The additivenoise,vn ∼ CN (0, σv
2), at thenth antenna,n = 1, 2, · · · , N ,is taken to be i.i.d. For simplicity, we assume the antenna noiseto be of unit variance. The output of theN antennas receivedby the FC isy ∈ CN×1. Thus,
y = HαΘ+HD(α)η + v, (3)
whereη ∈ CL×1 andv ∈ CN×1. From the observed output,Θ ∈ 0, θ, at the FC, the problem is to detect the parameter,Θ ∈ 0, θ, emitted by the source and to analyze the systemperformance.
III. D ETECTION ALGORITHM
For detection, we assumey to be Gaussian. Thus,
H0 : y ∼ CN (0N ,R);
H1 : y ∼ CN (θHα,R). (4)
Here,0N is theN × 1 zero vector andR is theN × Ncovariance matrix of the received signal given by
R = HD(α)D(σ)D(α)HHH + IN . (5)
Define
δ∆= αHHHR−1Hα (6)
and
Q(x)∆= (1/
√2π)
∫∞
x
e−t2/2dt.
Then, the probability of false-alarm,PFA, becomes
35Copyright (c) IARIA, 2011. ISBN: 978-1-61208-174-8
EMERGING 2011 : The Third International Conference on Emerging Network Intelligence
42 / 141
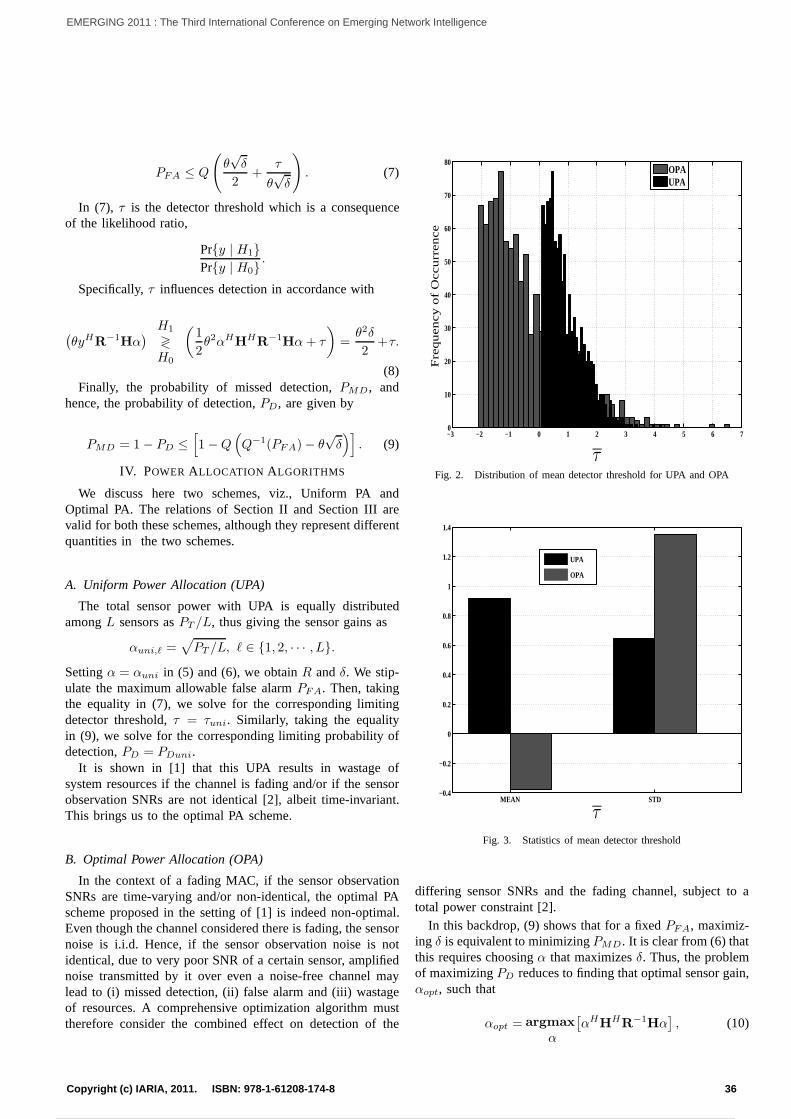
PFA ≤ Q
(θ√δ
2+
τ
θ√δ
). (7)
In (7), τ is the detector threshold which is a consequenceof the likelihood ratio,
Pry | H1Pry | H0
.
Specifically,τ influences detection in accordance with
(θyHR−1Hα
) H1
≷
H0
(1
2θ2αHHHR−1Hα+ τ
)=
θ2δ
2+τ.
(8)Finally, the probability of missed detection,PMD, and
hence, the probability of detection,PD, are given by
PMD = 1− PD ≤[1−Q
(Q−1(PFA)− θ
√δ)]
. (9)
IV. POWER ALLOCATION ALGORITHMS
We discuss here two schemes, viz., Uniform PA andOptimal PA. The relations of Section II and Section III arevalid for both these schemes, although they represent differentquantities in the two schemes.
A. Uniform Power Allocation (UPA)
The total sensor power with UPA is equally distributedamongL sensors asPT /L, thus giving the sensor gains as
αuni,ℓ =√PT /L, ℓ ∈ 1, 2, · · · , L.
Settingα = αuni in (5) and (6), we obtainR andδ. We stip-ulate the maximum allowable false alarmPFA. Then, takingthe equality in (7), we solve for the corresponding limitingdetector threshold,τ = τuni. Similarly, taking the equalityin (9), we solve for the corresponding limiting probabilityofdetection,PD = PDuni.
It is shown in [1] that this UPA results in wastage ofsystem resources if the channel is fading and/or if the sensorobservation SNRs are not identical [2], albeit time-invariant.This brings us to the optimal PA scheme.
B. Optimal Power Allocation (OPA)
In the context of a fading MAC, if the sensor observationSNRs are time-varying and/or non-identical, the optimal PAscheme proposed in the setting of [1] is indeed non-optimal.Even though the channel considered there is fading, the sensornoise is i.i.d. Hence, if the sensor observation noise is notidentical, due to very poor SNR of a certain sensor, amplifiednoise transmitted by it over even a noise-free channel maylead to (i) missed detection, (ii) false alarm and (iii) wastageof resources. A comprehensive optimization algorithm musttherefore consider the combined effect on detection of the
−3 −2 −1 0 1 2 3 4 5 6 70
10
20
30
40
50
60
70
80
τ
Fre
qu
en
cy o
f O
ccu
rre
nce
OPAUPA
Fig. 2. Distribution of mean detector threshold for UPA and OPA
MEAN STD−0.4
−0.2
0
0.2
0.4
0.6
0.8
1
1.2
1.4
τ
UPA
OPA
Fig. 3. Statistics of mean detector threshold
differing sensor SNRs and the fading channel, subject to atotal power constraint [2].
In this backdrop, (9) shows that for a fixedPFA, maximiz-ing δ is equivalent to minimizingPMD. It is clear from (6) thatthis requires choosingα that maximizesδ. Thus, the problemof maximizingPD reduces to finding that optimal sensor gain,αopt, such that
αopt = argmax
α
[αHHHR−1Hα
], (10)
36Copyright (c) IARIA, 2011. ISBN: 978-1-61208-174-8
EMERGING 2011 : The Third International Conference on Emerging Network Intelligence
43 / 141
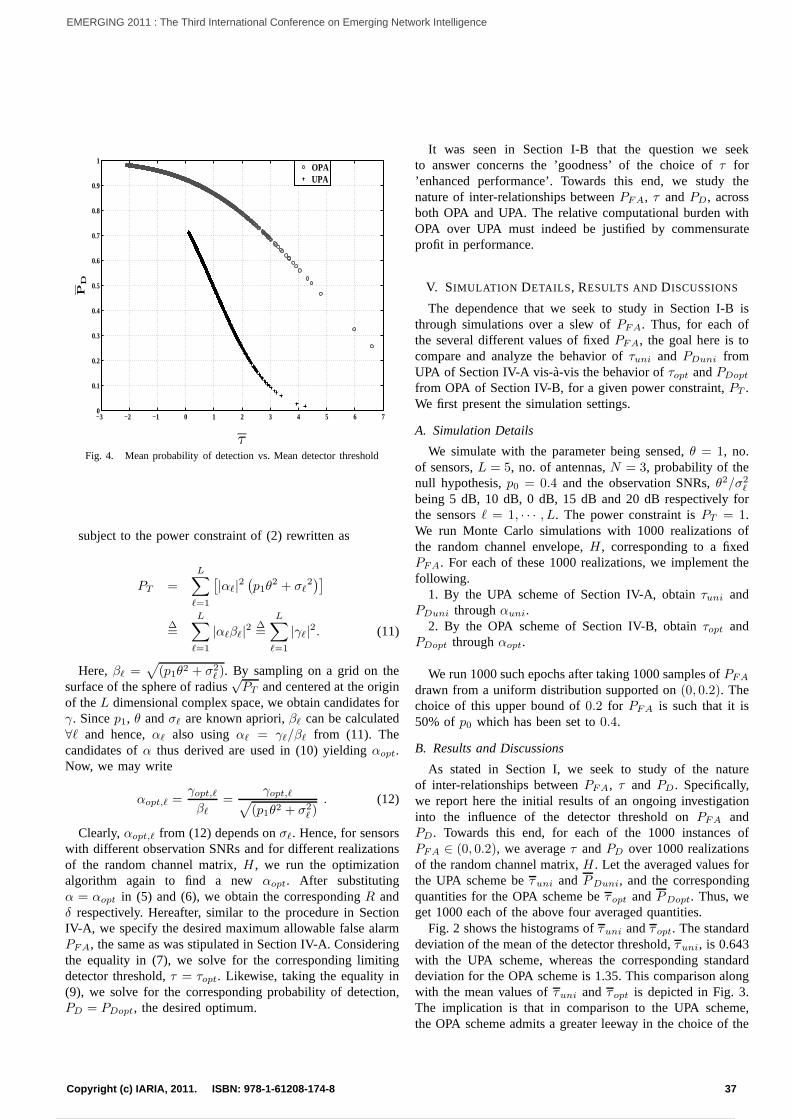
−3 −2 −1 0 1 2 3 4 5 6 70
0.1
0.2
0.3
0.4
0.5
0.6
0.7
0.8
0.9
1
τ
PD
OPAUPA
Fig. 4. Mean probability of detection vs. Mean detector threshold
subject to the power constraint of (2) rewritten as
PT =
L∑
ℓ=1
[|αℓ|2
(p1θ
2 + σℓ2)]
∆=
L∑
ℓ=1
|αℓβℓ|2 ∆=
L∑
ℓ=1
|γℓ|2. (11)
Here,βℓ =√(p1θ2 + σ2
ℓ ). By sampling on a grid on thesurface of the sphere of radius
√PT and centered at the origin
of theL dimensional complex space, we obtain candidates forγ. Sincep1, θ andσℓ are known apriori,βℓ can be calculated∀ℓ and hence,αℓ also usingαℓ = γℓ/βℓ from (11). Thecandidates ofα thus derived are used in (10) yieldingαopt.Now, we may write
αopt,ℓ =γopt,ℓβℓ
=γopt,ℓ√
(p1θ2 + σ2
ℓ ). (12)
Clearly,αopt,ℓ from (12) depends onσℓ. Hence, for sensorswith different observation SNRs and for different realizationsof the random channel matrix,H , we run the optimizationalgorithm again to find a newαopt. After substitutingα = αopt in (5) and (6), we obtain the correspondingR andδ respectively. Hereafter, similar to the procedure in SectionIV-A, we specify the desired maximum allowable false alarmPFA, the same as was stipulated in Section IV-A. Consideringthe equality in (7), we solve for the corresponding limitingdetector threshold,τ = τopt. Likewise, taking the equality in(9), we solve for the corresponding probability of detection,PD = PDopt, the desired optimum.
It was seen in Section I-B that the question we seekto answer concerns the ’goodness’ of the choice ofτ for’enhanced performance’. Towards this end, we study thenature of inter-relationships betweenPFA, τ andPD, acrossboth OPA and UPA. The relative computational burden withOPA over UPA must indeed be justified by commensurateprofit in performance.
V. SIMULATION DETAILS, RESULTS AND DISCUSSIONS
The dependence that we seek to study in Section I-B isthrough simulations over a slew ofPFA. Thus, for each ofthe several different values of fixedPFA, the goal here is tocompare and analyze the behavior ofτuni and PDuni fromUPA of Section IV-A vis-a-vis the behavior ofτopt andPDopt
from OPA of Section IV-B, for a given power constraint,PT .We first present the simulation settings.
A. Simulation Details
We simulate with the parameter being sensed,θ = 1, no.of sensors,L = 5, no. of antennas,N = 3, probability of thenull hypothesis,p0 = 0.4 and the observation SNRs,θ2/σ2
ℓ
being 5 dB, 10 dB, 0 dB, 15 dB and 20 dB respectively forthe sensorsℓ = 1, · · · , L. The power constraint isPT = 1.We run Monte Carlo simulations with 1000 realizations ofthe random channel envelope,H , corresponding to a fixedPFA. For each of these 1000 realizations, we implement thefollowing.
1. By the UPA scheme of Section IV-A, obtainτuni andPDuni throughαuni.
2. By the OPA scheme of Section IV-B, obtainτopt andPDopt throughαopt.
We run 1000 such epochs after taking 1000 samples ofPFA
drawn from a uniform distribution supported on(0, 0.2). Thechoice of this upper bound of0.2 for PFA is such that it is50% of p0 which has been set to0.4.
B. Results and Discussions
As stated in Section I, we seek to study of the natureof inter-relationships betweenPFA, τ and PD. Specifically,we report here the initial results of an ongoing investigationinto the influence of the detector threshold onPFA andPD. Towards this end, for each of the 1000 instances ofPFA ∈ (0, 0.2), we averageτ andPD over 1000 realizationsof the random channel matrix,H . Let the averaged values forthe UPA scheme beτuni andPDuni, and the correspondingquantities for the OPA scheme beτopt andPDopt. Thus, weget 1000 each of the above four averaged quantities.
Fig. 2 shows the histograms ofτuni andτopt. The standarddeviation of the mean of the detector threshold,τuni, is 0.643with the UPA scheme, whereas the corresponding standarddeviation for the OPA scheme is 1.35. This comparison alongwith the mean values ofτuni and τopt is depicted in Fig. 3.The implication is that in comparison to the UPA scheme,the OPA scheme admits a greater leeway in the choice of the
37Copyright (c) IARIA, 2011. ISBN: 978-1-61208-174-8
EMERGING 2011 : The Third International Conference on Emerging Network Intelligence
44 / 141
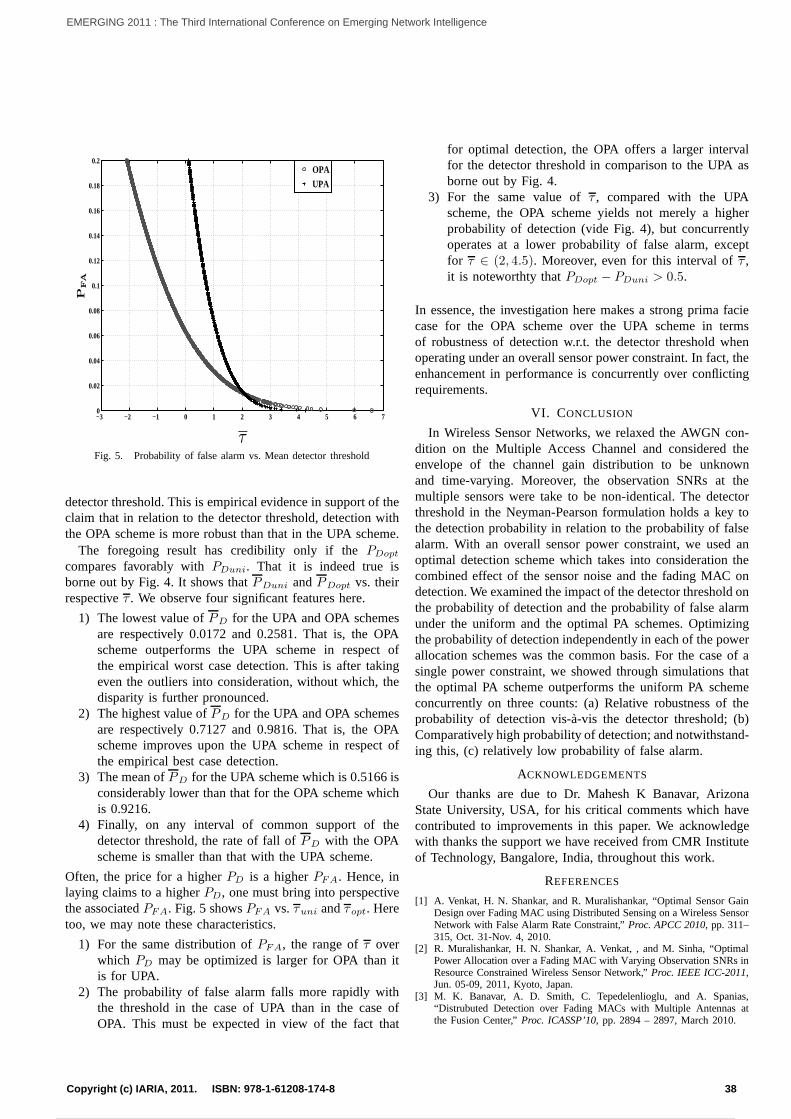
−3 −2 −1 0 1 2 3 4 5 6 70
0.02
0.04
0.06
0.08
0.1
0.12
0.14
0.16
0.18
0.2
τ
PFA
OPA
UPA
Fig. 5. Probability of false alarm vs. Mean detector threshold
detector threshold. This is empirical evidence in support of theclaim that in relation to the detector threshold, detectionwiththe OPA scheme is more robust than that in the UPA scheme.
The foregoing result has credibility only if thePDopt
compares favorably withPDuni. That it is indeed true isborne out by Fig. 4. It shows thatPDuni andPDopt vs. theirrespectiveτ . We observe four significant features here.
1) The lowest value ofPD for the UPA and OPA schemesare respectively 0.0172 and 0.2581. That is, the OPAscheme outperforms the UPA scheme in respect ofthe empirical worst case detection. This is after takingeven the outliers into consideration, without which, thedisparity is further pronounced.
2) The highest value ofPD for the UPA and OPA schemesare respectively 0.7127 and 0.9816. That is, the OPAscheme improves upon the UPA scheme in respect ofthe empirical best case detection.
3) The mean ofPD for the UPA scheme which is 0.5166 isconsiderably lower than that for the OPA scheme whichis 0.9216.
4) Finally, on any interval of common support of thedetector threshold, the rate of fall ofPD with the OPAscheme is smaller than that with the UPA scheme.
Often, the price for a higherPD is a higherPFA. Hence, inlaying claims to a higherPD, one must bring into perspectivethe associatedPFA. Fig. 5 showsPFA vs.τuni andτopt. Heretoo, we may note these characteristics.
1) For the same distribution ofPFA, the range ofτ overwhich PD may be optimized is larger for OPA than itis for UPA.
2) The probability of false alarm falls more rapidly withthe threshold in the case of UPA than in the case ofOPA. This must be expected in view of the fact that
for optimal detection, the OPA offers a larger intervalfor the detector threshold in comparison to the UPA asborne out by Fig. 4.
3) For the same value ofτ , compared with the UPAscheme, the OPA scheme yields not merely a higherprobability of detection (vide Fig. 4), but concurrentlyoperates at a lower probability of false alarm, exceptfor τ ∈ (2, 4.5). Moreover, even for this interval ofτ ,it is noteworthty thatPDopt − PDuni > 0.5.
In essence, the investigation here makes a strong prima faciecase for the OPA scheme over the UPA scheme in termsof robustness of detection w.r.t. the detector threshold whenoperating under an overall sensor power constraint. In fact, theenhancement in performance is concurrently over conflictingrequirements.
VI. CONCLUSION
In Wireless Sensor Networks, we relaxed the AWGN con-dition on the Multiple Access Channel and considered theenvelope of the channel gain distribution to be unknownand time-varying. Moreover, the observation SNRs at themultiple sensors were take to be non-identical. The detectorthreshold in the Neyman-Pearson formulation holds a key tothe detection probability in relation to the probability offalsealarm. With an overall sensor power constraint, we used anoptimal detection scheme which takes into consideration thecombined effect of the sensor noise and the fading MAC ondetection. We examined the impact of the detector thresholdonthe probability of detection and the probability of false alarmunder the uniform and the optimal PA schemes. Optimizingthe probability of detection independently in each of the powerallocation schemes was the common basis. For the case of asingle power constraint, we showed through simulations thatthe optimal PA scheme outperforms the uniform PA schemeconcurrently on three counts: (a) Relative robustness of theprobability of detection vis-a-vis the detector threshold; (b)Comparatively high probability of detection; and notwithstand-ing this, (c) relatively low probability of false alarm.
ACKNOWLEDGEMENTS
Our thanks are due to Dr. Mahesh K Banavar, ArizonaState University, USA, for his critical comments which havecontributed to improvements in this paper. We acknowledgewith thanks the support we have received from CMR Instituteof Technology, Bangalore, India, throughout this work.
REFERENCES
[1] A. Venkat, H. N. Shankar, and R. Muralishankar, “OptimalSensor GainDesign over Fading MAC using Distributed Sensing on a Wireless SensorNetwork with False Alarm Rate Constraint,”Proc. APCC 2010, pp. 311–315, Oct. 31-Nov. 4, 2010.
[2] R. Muralishankar, H. N. Shankar, A. Venkat, , and M. Sinha, “OptimalPower Allocation over a Fading MAC with Varying ObservationSNRs inResource Constrained Wireless Sensor Network,”Proc. IEEE ICC-2011,Jun. 05-09, 2011, Kyoto, Japan.
[3] M. K. Banavar, A. D. Smith, C. Tepedelenlioglu, and A. Spanias,“Distrubuted Detection over Fading MACs with Multiple Antennas atthe Fusion Center,”Proc. ICASSP’10, pp. 2894 – 2897, March 2010.
38Copyright (c) IARIA, 2011. ISBN: 978-1-61208-174-8
EMERGING 2011 : The Third International Conference on Emerging Network Intelligence
45 / 141
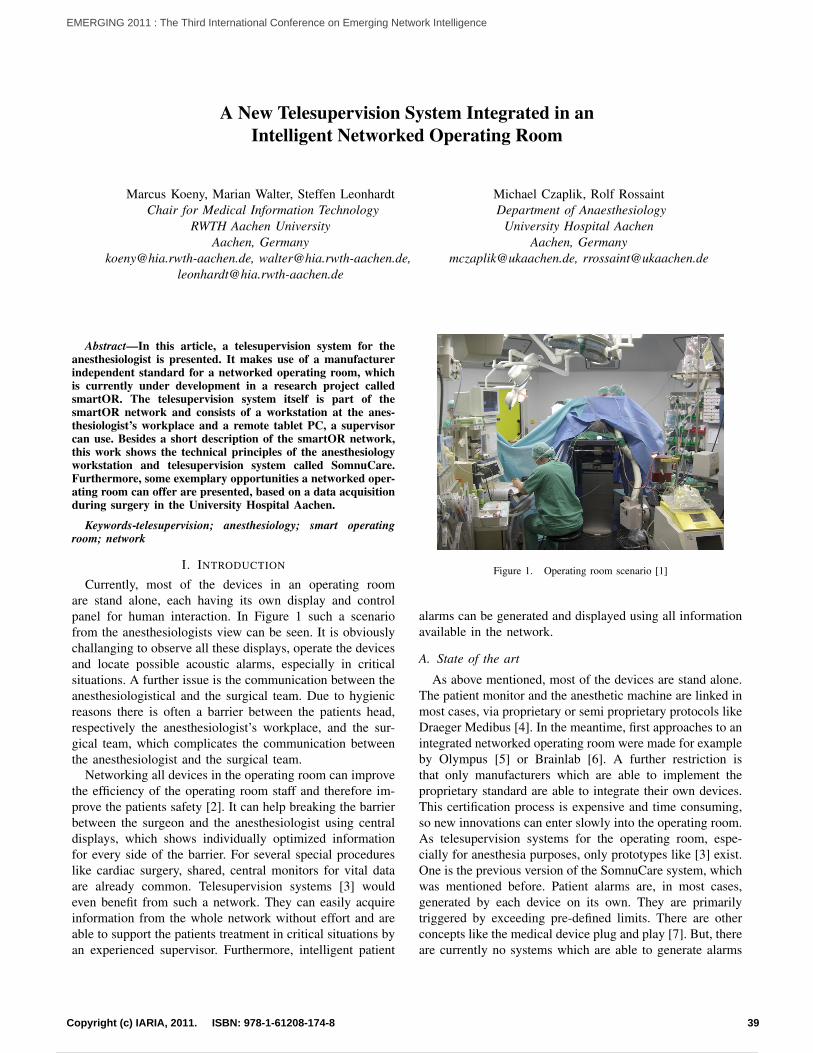
A New Telesupervision System Integrated in anIntelligent Networked Operating Room
Marcus Koeny, Marian Walter, Steffen LeonhardtChair for Medical Information Technology
RWTH Aachen UniversityAachen, Germany
[email protected], [email protected],[email protected]
Michael Czaplik, Rolf RossaintDepartment of Anaesthesiology
University Hospital AachenAachen, Germany
[email protected], [email protected]
Abstract—In this article, a telesupervision system for theanesthesiologist is presented. It makes use of a manufacturerindependent standard for a networked operating room, whichis currently under development in a research project calledsmartOR. The telesupervision system itself is part of thesmartOR network and consists of a workstation at the anes-thesiologist’s workplace and a remote tablet PC, a supervisorcan use. Besides a short description of the smartOR network,this work shows the technical principles of the anesthesiologyworkstation and telesupervision system called SomnuCare.Furthermore, some exemplary opportunities a networked oper-ating room can offer are presented, based on a data acquisitionduring surgery in the University Hospital Aachen.
Keywords-telesupervision; anesthesiology; smart operatingroom; network
I. INTRODUCTION
Currently, most of the devices in an operating roomare stand alone, each having its own display and controlpanel for human interaction. In Figure 1 such a scenariofrom the anesthesiologists view can be seen. It is obviouslychallanging to observe all these displays, operate the devicesand locate possible acoustic alarms, especially in criticalsituations. A further issue is the communication between theanesthesiologistical and the surgical team. Due to hygienicreasons there is often a barrier between the patients head,respectively the anesthesiologist’s workplace, and the sur-gical team, which complicates the communication betweenthe anesthesiologist and the surgical team.
Networking all devices in the operating room can improvethe efficiency of the operating room staff and therefore im-prove the patients safety [2]. It can help breaking the barrierbetween the surgeon and the anesthesiologist using centraldisplays, which shows individually optimized informationfor every side of the barrier. For several special procedureslike cardiac surgery, shared, central monitors for vital dataare already common. Telesupervision systems [3] wouldeven benefit from such a network. They can easily acquireinformation from the whole network without effort and areable to support the patients treatment in critical situations byan experienced supervisor. Furthermore, intelligent patient
Figure 1. Operating room scenario [1]
alarms can be generated and displayed using all informationavailable in the network.
A. State of the art
As above mentioned, most of the devices are stand alone.The patient monitor and the anesthetic machine are linked inmost cases, via proprietary or semi proprietary protocols likeDraeger Medibus [4]. In the meantime, first approaches to anintegrated networked operating room were made for exampleby Olympus [5] or Brainlab [6]. A further restriction isthat only manufacturers which are able to implement theproprietary standard are able to integrate their own devices.This certification process is expensive and time consuming,so new innovations can enter slowly into the operating room.As telesupervision systems for the operating room, espe-cially for anesthesia purposes, only prototypes like [3] exist.One is the previous version of the SomnuCare system, whichwas mentioned before. Patient alarms are, in most cases,generated by each device on its own. They are primarilytriggered by exceeding pre-defined limits. There are otherconcepts like the medical device plug and play [7]. But, thereare currently no systems which are able to generate alarms
39Copyright (c) IARIA, 2011. ISBN: 978-1-61208-174-8
EMERGING 2011 : The Third International Conference on Emerging Network Intelligence
46 / 141
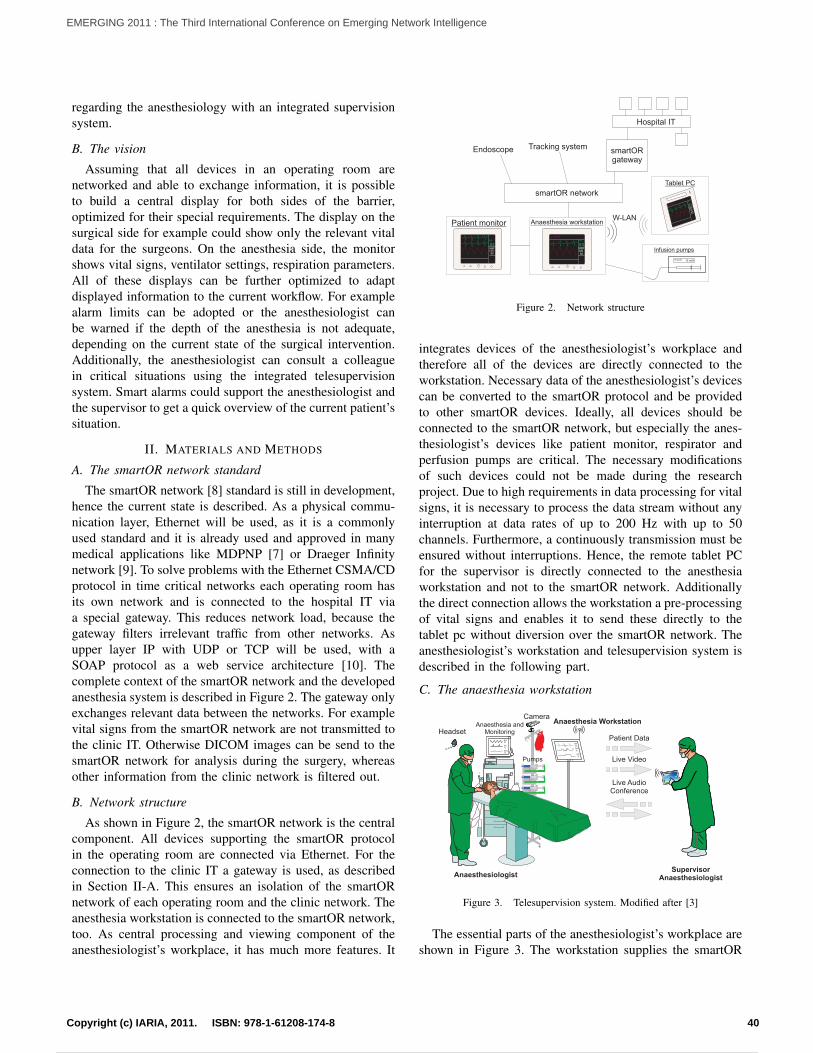
regarding the anesthesiology with an integrated supervisionsystem.
B. The vision
Assuming that all devices in an operating room arenetworked and able to exchange information, it is possibleto build a central display for both sides of the barrier,optimized for their special requirements. The display on thesurgical side for example could show only the relevant vitaldata for the surgeons. On the anesthesia side, the monitorshows vital signs, ventilator settings, respiration parameters.All of these displays can be further optimized to adaptdisplayed information to the current workflow. For examplealarm limits can be adopted or the anesthesiologist canbe warned if the depth of the anesthesia is not adequate,depending on the current state of the surgical intervention.Additionally, the anesthesiologist can consult a colleaguein critical situations using the integrated telesupervisionsystem. Smart alarms could support the anesthesiologist andthe supervisor to get a quick overview of the current patient’ssituation.
II. MATERIALS AND METHODS
A. The smartOR network standard
The smartOR network [8] standard is still in development,hence the current state is described. As a physical commu-nication layer, Ethernet will be used, as it is a commonlyused standard and it is already used and approved in manymedical applications like MDPNP [7] or Draeger Infinitynetwork [9]. To solve problems with the Ethernet CSMA/CDprotocol in time critical networks each operating room hasits own network and is connected to the hospital IT viaa special gateway. This reduces network load, because thegateway filters irrelevant traffic from other networks. Asupper layer IP with UDP or TCP will be used, with aSOAP protocol as a web service architecture [10]. Thecomplete context of the smartOR network and the developedanesthesia system is described in Figure 2. The gateway onlyexchanges relevant data between the networks. For examplevital signs from the smartOR network are not transmitted tothe clinic IT. Otherwise DICOM images can be send to thesmartOR network for analysis during the surgery, whereasother information from the clinic network is filtered out.
B. Network structure
As shown in Figure 2, the smartOR network is the centralcomponent. All devices supporting the smartOR protocolin the operating room are connected via Ethernet. For theconnection to the clinic IT a gateway is used, as describedin Section II-A. This ensures an isolation of the smartORnetwork of each operating room and the clinic network. Theanesthesia workstation is connected to the smartOR network,too. As central processing and viewing component of theanesthesiologist’s workplace, it has much more features. It
Hospital IT
smartORgateway
smartOR network
Tracking systemEndoscope
Anaesthesia workstation
HR
83
LL Lead Off
NIBP12080
HR
83LL Lead Off
NIBP
12080
Tablet PC
W-LANPatient monitor
HR
83NIBP12080
Propofol 15 ml/h
Infusion pumps
Figure 2. Network structure
integrates devices of the anesthesiologist’s workplace andtherefore all of the devices are directly connected to theworkstation. Necessary data of the anesthesiologist’s devicescan be converted to the smartOR protocol and be providedto other smartOR devices. Ideally, all devices should beconnected to the smartOR network, but especially the anes-thesiologist’s devices like patient monitor, respirator andperfusion pumps are critical. The necessary modificationsof such devices could not be made during the researchproject. Due to high requirements in data processing for vitalsigns, it is necessary to process the data stream without anyinterruption at data rates of up to 200 Hz with up to 50channels. Furthermore, a continuously transmission must beensured without interruptions. Hence, the remote tablet PCfor the supervisor is directly connected to the anesthesiaworkstation and not to the smartOR network. Additionallythe direct connection allows the workstation a pre-processingof vital signs and enables it to send these directly to thetablet pc without diversion over the smartOR network. Theanesthesiologist’s workstation and telesupervision system isdescribed in the following part.
C. The anaesthesia workstation
BIS50
HR75
SpO2
75
Anaesthesia and Monitoring
Pumps
Camera
Headset
AnaesthesiologistSupervisor
Anaesthesiologist
Patient Data
Live Video
Live AudioConference
HR75SpO2
75
ml/h15
Anaesthesia Workstation
Figure 3. Telesupervision system. Modified after [3]
The essential parts of the anesthesiologist’s workplace areshown in Figure 3. The workstation supplies the smartOR
40Copyright (c) IARIA, 2011. ISBN: 978-1-61208-174-8
EMERGING 2011 : The Third International Conference on Emerging Network Intelligence
47 / 141
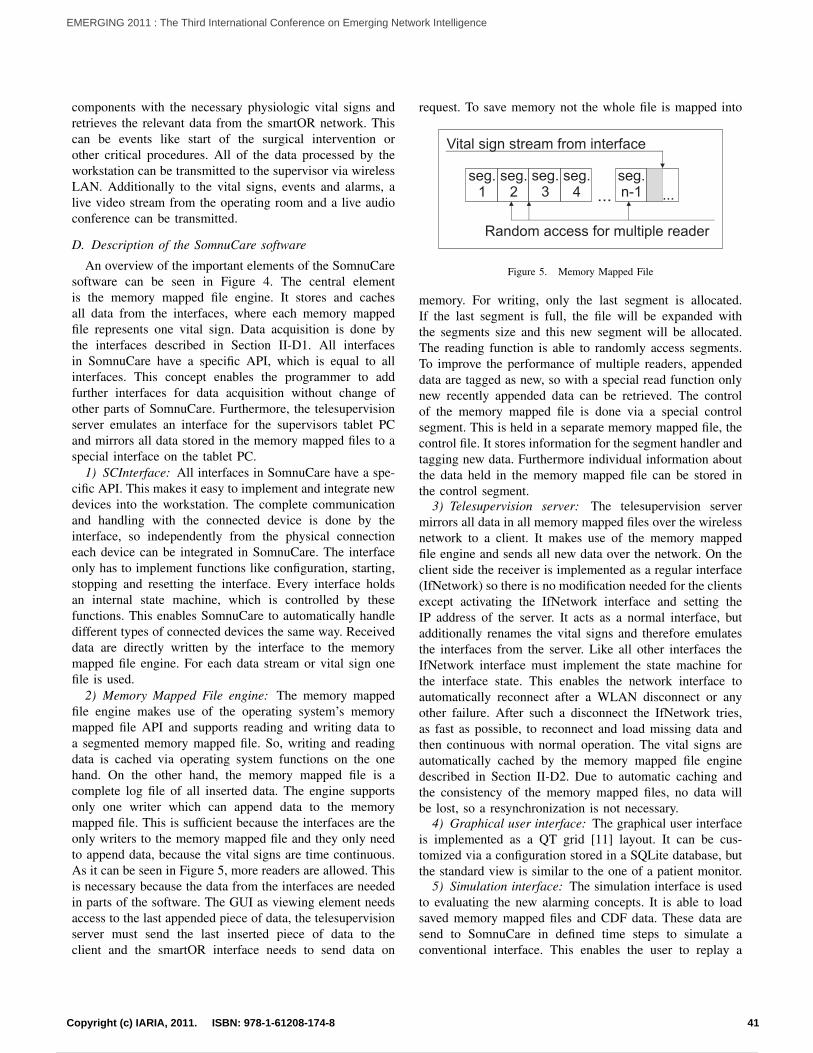
components with the necessary physiologic vital signs andretrieves the relevant data from the smartOR network. Thiscan be events like start of the surgical intervention orother critical procedures. All of the data processed by theworkstation can be transmitted to the supervisor via wirelessLAN. Additionally to the vital signs, events and alarms, alive video stream from the operating room and a live audioconference can be transmitted.
D. Description of the SomnuCare software
An overview of the important elements of the SomnuCaresoftware can be seen in Figure 4. The central elementis the memory mapped file engine. It stores and cachesall data from the interfaces, where each memory mappedfile represents one vital sign. Data acquisition is done bythe interfaces described in Section II-D1. All interfacesin SomnuCare have a specific API, which is equal to allinterfaces. This concept enables the programmer to addfurther interfaces for data acquisition without change ofother parts of SomnuCare. Furthermore, the telesupervisionserver emulates an interface for the supervisors tablet PCand mirrors all data stored in the memory mapped files to aspecial interface on the tablet PC.
1) SCInterface: All interfaces in SomnuCare have a spe-cific API. This makes it easy to implement and integrate newdevices into the workstation. The complete communicationand handling with the connected device is done by theinterface, so independently from the physical connectioneach device can be integrated in SomnuCare. The interfaceonly has to implement functions like configuration, starting,stopping and resetting the interface. Every interface holdsan internal state machine, which is controlled by thesefunctions. This enables SomnuCare to automatically handledifferent types of connected devices the same way. Receiveddata are directly written by the interface to the memorymapped file engine. For each data stream or vital sign onefile is used.
2) Memory Mapped File engine: The memory mappedfile engine makes use of the operating system’s memorymapped file API and supports reading and writing data toa segmented memory mapped file. So, writing and readingdata is cached via operating system functions on the onehand. On the other hand, the memory mapped file is acomplete log file of all inserted data. The engine supportsonly one writer which can append data to the memorymapped file. This is sufficient because the interfaces are theonly writers to the memory mapped file and they only needto append data, because the vital signs are time continuous.As it can be seen in Figure 5, more readers are allowed. Thisis necessary because the data from the interfaces are neededin parts of the software. The GUI as viewing element needsaccess to the last appended piece of data, the telesupervisionserver must send the last inserted piece of data to theclient and the smartOR interface needs to send data on
request. To save memory not the whole file is mapped into
...
Vital sign stream from interface
seg.1
seg.2
seg.3
seg.4
seg.n-1 ...
Random access for multiple reader
Figure 5. Memory Mapped File
memory. For writing, only the last segment is allocated.If the last segment is full, the file will be expanded withthe segments size and this new segment will be allocated.The reading function is able to randomly access segments.To improve the performance of multiple readers, appendeddata are tagged as new, so with a special read function onlynew recently appended data can be retrieved. The controlof the memory mapped file is done via a special controlsegment. This is held in a separate memory mapped file, thecontrol file. It stores information for the segment handler andtagging new data. Furthermore individual information aboutthe data held in the memory mapped file can be stored inthe control segment.
3) Telesupervision server: The telesupervision servermirrors all data in all memory mapped files over the wirelessnetwork to a client. It makes use of the memory mappedfile engine and sends all new data over the network. On theclient side the receiver is implemented as a regular interface(IfNetwork) so there is no modification needed for the clientsexcept activating the IfNetwork interface and setting theIP address of the server. It acts as a normal interface, butadditionally renames the vital signs and therefore emulatesthe interfaces from the server. Like all other interfaces theIfNetwork interface must implement the state machine forthe interface state. This enables the network interface toautomatically reconnect after a WLAN disconnect or anyother failure. After such a disconnect the IfNetwork tries,as fast as possible, to reconnect and load missing data andthen continuous with normal operation. The vital signs areautomatically cached by the memory mapped file enginedescribed in Section II-D2. Due to automatic caching andthe consistency of the memory mapped files, no data willbe lost, so a resynchronization is not necessary.
4) Graphical user interface: The graphical user interfaceis implemented as a QT grid [11] layout. It can be cus-tomized via a configuration stored in a SQLite database, butthe standard view is similar to the one of a patient monitor.
5) Simulation interface: The simulation interface is usedto evaluating the new alarming concepts. It is able to loadsaved memory mapped files and CDF data. These data aresend to SomnuCare in defined time steps to simulate aconventional interface. This enables the user to replay a
41Copyright (c) IARIA, 2011. ISBN: 978-1-61208-174-8
EMERGING 2011 : The Third International Conference on Emerging Network Intelligence
48 / 141
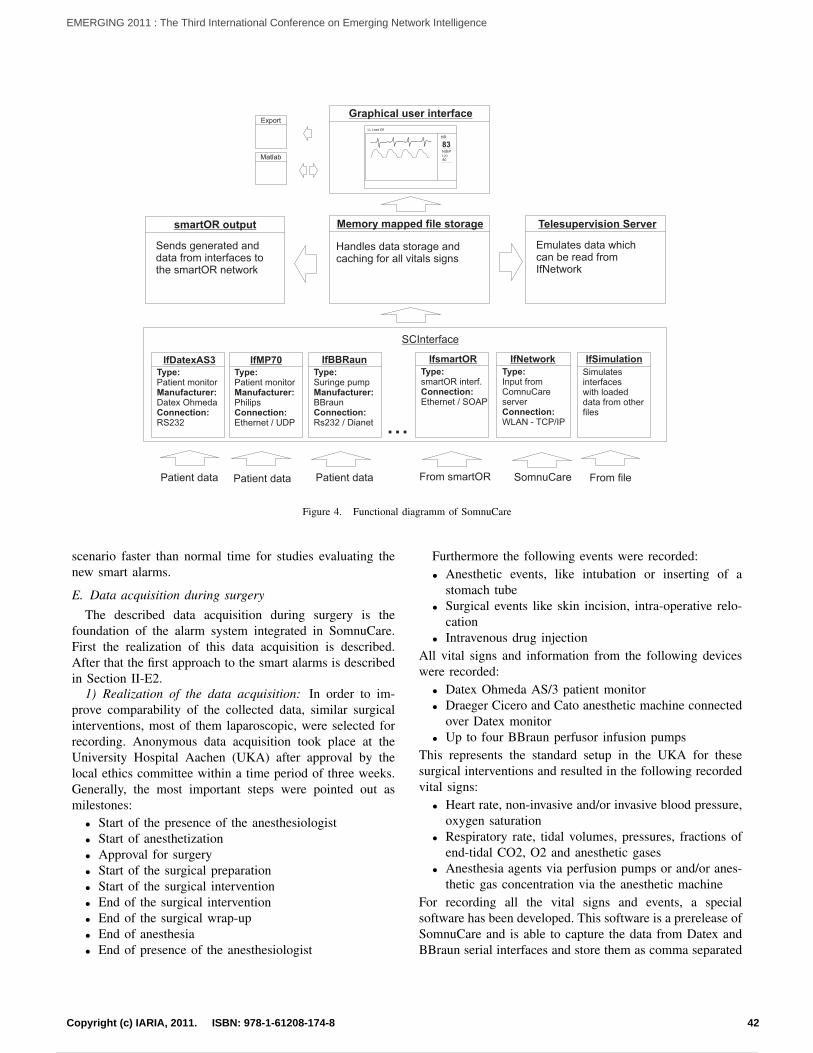
SCInterface
...
Patient data
Memory mapped file storage Telesupervision Server
From fileSomnuCarePatient dataPatient data
Matlab
Export
Type:Patient monitorManufacturer:Datex OhmedaConnection:RS232
IfDatexAS3Type:Patient monitorManufacturer:PhilipsConnection:Ethernet / UDP
IfMP70Type:Suringe pumpManufacturer:BBraunConnection:Rs232 / Dianet
IfBBRaunType:smartOR interf.Connection:Ethernet / SOAP
IfsmartORType:Input fromComnuCareserverConnection:WLAN - TCP/IP
IfNetwork
Simulates interfaceswith loadeddata from otherfiles
IfSimulation
From smartOR
Emulates data which can be read fromIfNetwork
smartOR output
Sends generated and data from interfaces to the smartOR network
Graphical user interface
Handles data storage and caching for all vitals signs
HR
83
LL Lead Off
NIBP12080
Figure 4. Functional diagramm of SomnuCare
scenario faster than normal time for studies evaluating thenew smart alarms.
E. Data acquisition during surgeryThe described data acquisition during surgery is the
foundation of the alarm system integrated in SomnuCare.First the realization of this data acquisition is described.After that the first approach to the smart alarms is describedin Section II-E2.
1) Realization of the data acquisition: In order to im-prove comparability of the collected data, similar surgicalinterventions, most of them laparoscopic, were selected forrecording. Anonymous data acquisition took place at theUniversity Hospital Aachen (UKA) after approval by thelocal ethics committee within a time period of three weeks.Generally, the most important steps were pointed out asmilestones:
• Start of the presence of the anesthesiologist• Start of anesthetization• Approval for surgery• Start of the surgical preparation• Start of the surgical intervention• End of the surgical intervention• End of the surgical wrap-up• End of anesthesia• End of presence of the anesthesiologist
Furthermore the following events were recorded:• Anesthetic events, like intubation or inserting of a
stomach tube• Surgical events like skin incision, intra-operative relo-
cation• Intravenous drug injection
All vital signs and information from the following deviceswere recorded:
• Datex Ohmeda AS/3 patient monitor• Draeger Cicero and Cato anesthetic machine connected
over Datex monitor• Up to four BBraun perfusor infusion pumps
This represents the standard setup in the UKA for thesesurgical interventions and resulted in the following recordedvital signs:
• Heart rate, non-invasive and/or invasive blood pressure,oxygen saturation
• Respiratory rate, tidal volumes, pressures, fractions ofend-tidal CO2, O2 and anesthetic gases
• Anesthesia agents via perfusion pumps or and/or anes-thetic gas concentration via the anesthetic machine
For recording all the vital signs and events, a specialsoftware has been developed. This software is a prerelease ofSomnuCare and is able to capture the data from Datex andBBraun serial interfaces and store them as comma separated
42Copyright (c) IARIA, 2011. ISBN: 978-1-61208-174-8
EMERGING 2011 : The Third International Conference on Emerging Network Intelligence
49 / 141
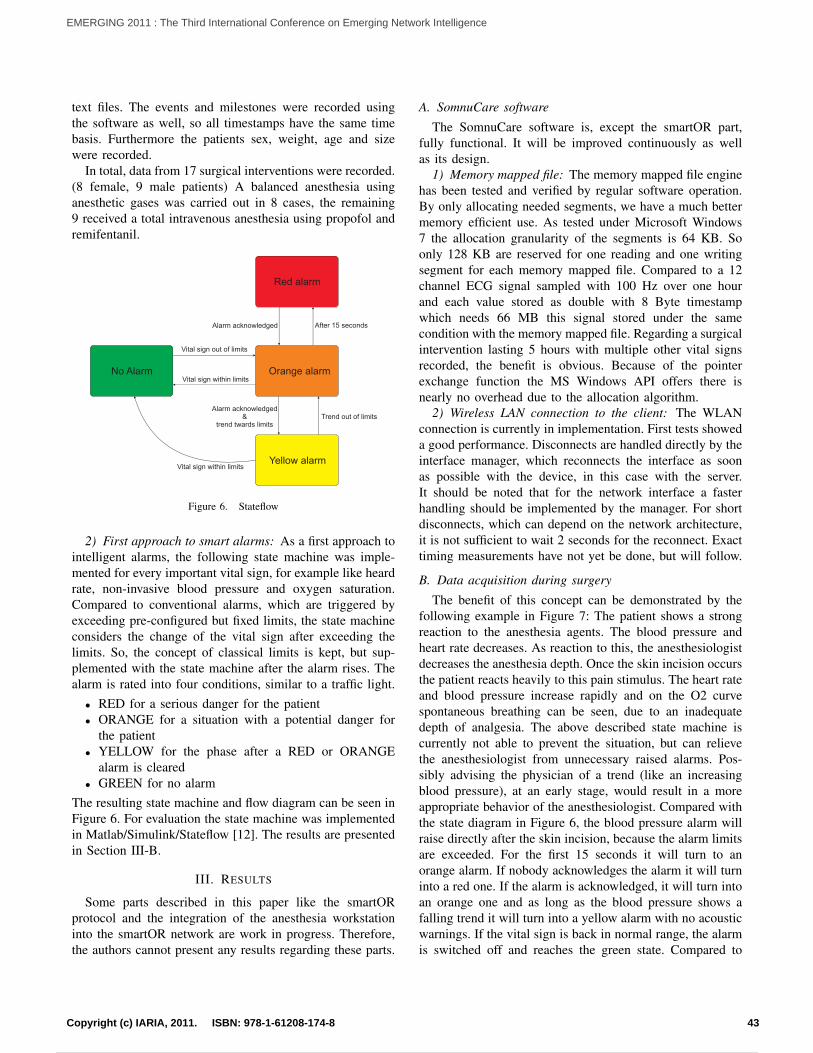
text files. The events and milestones were recorded usingthe software as well, so all timestamps have the same timebasis. Furthermore the patients sex, weight, age and sizewere recorded.
In total, data from 17 surgical interventions were recorded.(8 female, 9 male patients) A balanced anesthesia usinganesthetic gases was carried out in 8 cases, the remaining9 received a total intravenous anesthesia using propofol andremifentanil.
After 15 secondsAlarm acknowledged
Alarm acknowledged&
trend twards limitsTrend out of limits
Vital sign out of limits
Vital sign within limits
Vital sign within limits
Red alarm
Orange alarm
Yellow alarm
No Alarm
Figure 6. Stateflow
2) First approach to smart alarms: As a first approach tointelligent alarms, the following state machine was imple-mented for every important vital sign, for example like heardrate, non-invasive blood pressure and oxygen saturation.Compared to conventional alarms, which are triggered byexceeding pre-configured but fixed limits, the state machineconsiders the change of the vital sign after exceeding thelimits. So, the concept of classical limits is kept, but sup-plemented with the state machine after the alarm rises. Thealarm is rated into four conditions, similar to a traffic light.
• RED for a serious danger for the patient• ORANGE for a situation with a potential danger for
the patient• YELLOW for the phase after a RED or ORANGE
alarm is cleared• GREEN for no alarm
The resulting state machine and flow diagram can be seen inFigure 6. For evaluation the state machine was implementedin Matlab/Simulink/Stateflow [12]. The results are presentedin Section III-B.
III. RESULTS
Some parts described in this paper like the smartORprotocol and the integration of the anesthesia workstationinto the smartOR network are work in progress. Therefore,the authors cannot present any results regarding these parts.
A. SomnuCare software
The SomnuCare software is, except the smartOR part,fully functional. It will be improved continuously as wellas its design.
1) Memory mapped file: The memory mapped file enginehas been tested and verified by regular software operation.By only allocating needed segments, we have a much bettermemory efficient use. As tested under Microsoft Windows7 the allocation granularity of the segments is 64 KB. Soonly 128 KB are reserved for one reading and one writingsegment for each memory mapped file. Compared to a 12channel ECG signal sampled with 100 Hz over one hourand each value stored as double with 8 Byte timestampwhich needs 66 MB this signal stored under the samecondition with the memory mapped file. Regarding a surgicalintervention lasting 5 hours with multiple other vital signsrecorded, the benefit is obvious. Because of the pointerexchange function the MS Windows API offers there isnearly no overhead due to the allocation algorithm.
2) Wireless LAN connection to the client: The WLANconnection is currently in implementation. First tests showeda good performance. Disconnects are handled directly by theinterface manager, which reconnects the interface as soonas possible with the device, in this case with the server.It should be noted that for the network interface a fasterhandling should be implemented by the manager. For shortdisconnects, which can depend on the network architecture,it is not sufficient to wait 2 seconds for the reconnect. Exacttiming measurements have not yet be done, but will follow.
B. Data acquisition during surgery
The benefit of this concept can be demonstrated by thefollowing example in Figure 7: The patient shows a strongreaction to the anesthesia agents. The blood pressure andheart rate decreases. As reaction to this, the anesthesiologistdecreases the anesthesia depth. Once the skin incision occursthe patient reacts heavily to this pain stimulus. The heart rateand blood pressure increase rapidly and on the O2 curvespontaneous breathing can be seen, due to an inadequatedepth of analgesia. The above described state machine iscurrently not able to prevent the situation, but can relievethe anesthesiologist from unnecessary raised alarms. Pos-sibly advising the physician of a trend (like an increasingblood pressure), at an early stage, would result in a moreappropriate behavior of the anesthesiologist. Compared withthe state diagram in Figure 6, the blood pressure alarm willraise directly after the skin incision, because the alarm limitsare exceeded. For the first 15 seconds it will turn to anorange alarm. If nobody acknowledges the alarm it will turninto a red one. If the alarm is acknowledged, it will turn intoan orange one and as long as the blood pressure shows afalling trend it will turn into a yellow alarm with no acousticwarnings. If the vital sign is back in normal range, the alarmis switched off and reaches the green state. Compared to
43Copyright (c) IARIA, 2011. ISBN: 978-1-61208-174-8
EMERGING 2011 : The Third International Conference on Emerging Network Intelligence
50 / 141
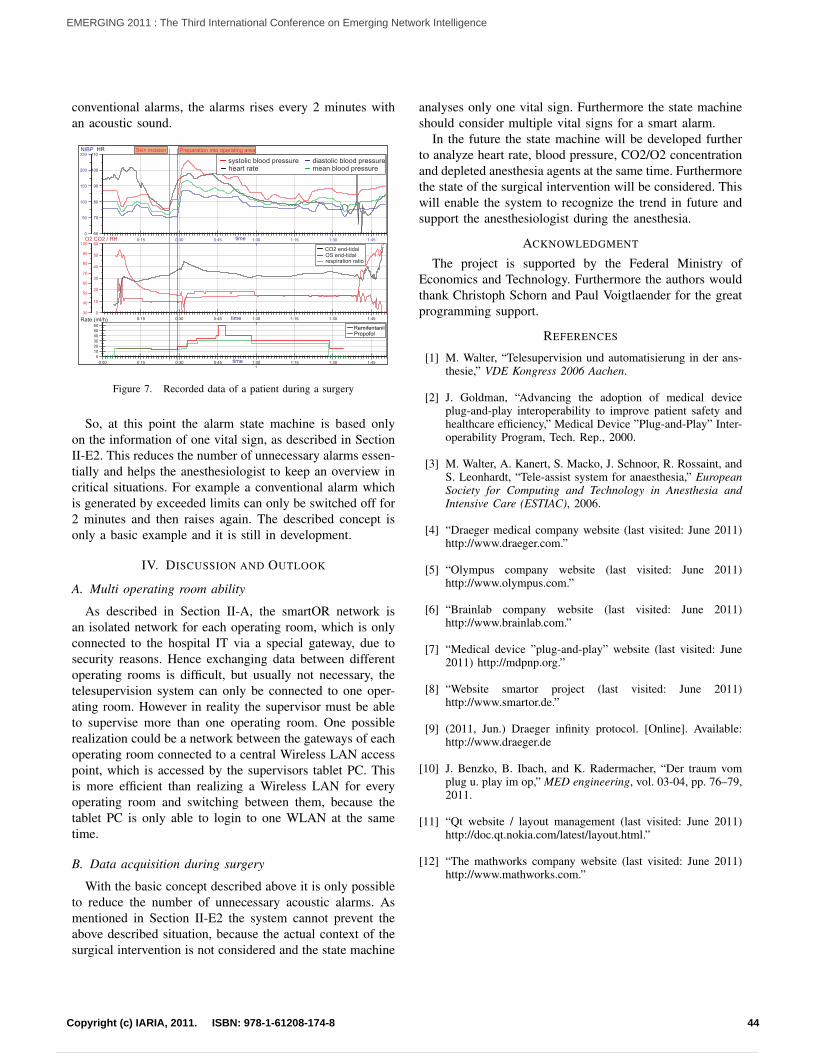
conventional alarms, the alarms rises every 2 minutes withan acoustic sound.
0:15 0:30 0:45 1:00 1:15 1:30 1:45time60
70
80
90
100
110HR
1
0
50
100
150
200
250NIBP
0:00 0:15 0:30 0:45 1:00 1:15 1:30 1:45time0
10
20
30
40
50
60
Rate (ml/h)
1
RemifentanilPropofol
0:15 0:30 0:45 1:00 1:15 1:30 1:45
0
10
20
30
40
50
60CO2 / RR
1
30
40
50
60
70
80
90
100O2
Preparation into operating areaSkin incision
heart ratesystolic blood pressure diastolic blood pressure
mean blood pressure
time
CO2 end-tidalOS end-tidalrespiration ratio
Figure 7. Recorded data of a patient during a surgery
So, at this point the alarm state machine is based onlyon the information of one vital sign, as described in SectionII-E2. This reduces the number of unnecessary alarms essen-tially and helps the anesthesiologist to keep an overview incritical situations. For example a conventional alarm whichis generated by exceeded limits can only be switched off for2 minutes and then raises again. The described concept isonly a basic example and it is still in development.
IV. DISCUSSION AND OUTLOOK
A. Multi operating room ability
As described in Section II-A, the smartOR network isan isolated network for each operating room, which is onlyconnected to the hospital IT via a special gateway, due tosecurity reasons. Hence exchanging data between differentoperating rooms is difficult, but usually not necessary, thetelesupervision system can only be connected to one oper-ating room. However in reality the supervisor must be ableto supervise more than one operating room. One possiblerealization could be a network between the gateways of eachoperating room connected to a central Wireless LAN accesspoint, which is accessed by the supervisors tablet PC. Thisis more efficient than realizing a Wireless LAN for everyoperating room and switching between them, because thetablet PC is only able to login to one WLAN at the sametime.
B. Data acquisition during surgery
With the basic concept described above it is only possibleto reduce the number of unnecessary acoustic alarms. Asmentioned in Section II-E2 the system cannot prevent theabove described situation, because the actual context of thesurgical intervention is not considered and the state machine
analyses only one vital sign. Furthermore the state machineshould consider multiple vital signs for a smart alarm.
In the future the state machine will be developed furtherto analyze heart rate, blood pressure, CO2/O2 concentrationand depleted anesthesia agents at the same time. Furthermorethe state of the surgical intervention will be considered. Thiswill enable the system to recognize the trend in future andsupport the anesthesiologist during the anesthesia.
ACKNOWLEDGMENT
The project is supported by the Federal Ministry ofEconomics and Technology. Furthermore the authors wouldthank Christoph Schorn and Paul Voigtlaender for the greatprogramming support.
REFERENCES
[1] M. Walter, “Telesupervision und automatisierung in der ans-thesie,” VDE Kongress 2006 Aachen.
[2] J. Goldman, “Advancing the adoption of medical deviceplug-and-play interoperability to improve patient safety andhealthcare efficiency,” Medical Device ”Plug-and-Play” Inter-operability Program, Tech. Rep., 2000.
[3] M. Walter, A. Kanert, S. Macko, J. Schnoor, R. Rossaint, andS. Leonhardt, “Tele-assist system for anaesthesia,” EuropeanSociety for Computing and Technology in Anesthesia andIntensive Care (ESTIAC), 2006.
[4] “Draeger medical company website (last visited: June 2011)http://www.draeger.com.”
[5] “Olympus company website (last visited: June 2011)http://www.olympus.com.”
[6] “Brainlab company website (last visited: June 2011)http://www.brainlab.com.”
[7] “Medical device ”plug-and-play” website (last visited: June2011) http://mdpnp.org.”
[8] “Website smartor project (last visited: June 2011)http://www.smartor.de.”
[9] (2011, Jun.) Draeger infinity protocol. [Online]. Available:http://www.draeger.de
[10] J. Benzko, B. Ibach, and K. Radermacher, “Der traum vomplug u. play im op,” MED engineering, vol. 03-04, pp. 76–79,2011.
[11] “Qt website / layout management (last visited: June 2011)http://doc.qt.nokia.com/latest/layout.html.”
[12] “The mathworks company website (last visited: June 2011)http://www.mathworks.com.”
44Copyright (c) IARIA, 2011. ISBN: 978-1-61208-174-8
EMERGING 2011 : The Third International Conference on Emerging Network Intelligence
51 / 141
Multi-Objective Optimization for Virtual Machine Migration on LANs for Opportunistic Grid Infrastructures
Nathalia Garcés, Nicolás Ortiz, David Mendez, Yezid Donoso
Departamento de Ingeniería de Sistemas y Computación
Universidad de los Andes
Bogotá, Colombia
n.garces26, dg.mendez67, n.ortiz980, [email protected]
Abstract—This paper illustrates how to apply a solution for a
multiple objective problem in a simple and efficient way through the case study of an example where we must copy a
single file, in this case a virtual machine, on to all computers of
a LAN. Our solution is intended to be used for the creation of
Virtual Clusters, which are clusters composed of virtual
machines that execute on opportunistic grid infrastructures. We specify the restrictions through a mathematical model and
then proceed to implement a two-part solution: First, we use
the solver CONOPT to determine the Pareto frontier; then we
implement an evolutionary algorithm to generate possible
solutions, and match them to the Pareto frontier. Finally, we evaluate our solution as an efficient way of solving the problem
through the result’s attributes and conclude which are the
advantages of using evolutionary algorithms to find an answer
for a multiple objective problem (time, possible solutions and
variability between them).
Keywords- MOP; SPEA; resource sharing; Grid Computing.
I. INTRODUCTION
Often, we find that there are problems for which no unique answer is clear and that there are many factors to
consider before a decision is made. Take for example an
archive copying problem where we have to give a single file to many computers connected to a Switch-based LAN
network in the least amount of time. But, if we also say that we have to do it while other people are us ing those
computers, so we cannot occupy the entire span of the bandwidth, then it becomes a bit more difficult to nail down
an answer. This type of problem is called a multiple objective problem.
This problem is found on opportunistic infrastructures,
where the goal is to take advantage of the unused capabilities of desktop computers. On a university campus , there are
computer labs in which students can develop their daily activities. These daily activities do not fully use the
processing capability of the computer. By the use of virtual machines, it is possible to create Virtual Clusters (VCs)
running on desktop computers to be used as a part of a grid
infrastructure. This is the goal of the infrastructure UnaGrid [1], which allows the creation of VCs and their execution on
desktop computer labs at the Universidad de Los Andes.
However, the Virtual Machines (VM) must be copied to each desktop computer.
In order to deploy a new cluster it is needed to transfer the VM from a source computer to the rest. This can be seen
as a file transfer from one node to every other node in a
network. Because the transfer is on an opportunistic infrastructure, it must be designed to not disturb the users of
the computer lab. In this paper, this case study is analyzed. The art icle
begins by addressing other solutions for similar problems and then describes the specifics of this problem. After that, it
evaluates the many components of its answer, including the
SPEA-based algorithm that is used (its chromosome design, its population selection process, its genetic operators and its
exit point). Finally, the results to our solution are exp lained and it concludes by specifying how it pertains to multiple
objective problems.
II. RELATED WORK
Efficient data management has been always a challenge on large scale infrastructures. On Computational Grids , it is
required to have a flexible, fast, reliable, and secure way of sharing resources across sites. Several solutions have been
developed while looking for an efficient way of file sharing
between numerous nodes . On Grid environments, Grid FTP [2] provides efficient
and reliable data transfer between computing nodes located among different sites. Some transfer services have been built
on top of GridFTP and added to the Globus Toolkit in order to provide fault recovery mechanisms. Nevertheless,
GridFTP is designed to transfer large amounts of data across
different networks. Another work based on FTP, designed for parallel transfer sessions is P-FTP. This protocol is also
intended to be used across different networks. Since our work aims to analyze the transfer inside a single LAN, it
requires a different approach. On Data Grids, several efforts have been made to manage
the data transfer between nodes [3] [4] [5]. On these infrastructures, the data is distributed on replicas among
them. There are applications that analyze the bandwidth
status between connections, in order to adjust the workloads and to reduce the file transfer time. They try to adapt the file
transfer to network links which do not have a predictable or
45Copyright (c) IARIA, 2011. ISBN: 978-1-61208-174-8
EMERGING 2011 : The Third International Conference on Emerging Network Intelligence
52 / 141

stable bandwidth. These algorithms also seek to reduce idle
time wasted waiting for the slowest server. This is the kind of approach that is useful in this work’s solution. However,
our context does not have replicas for file transfer; the file must be transferred from one node to every other node on a
LAN. In other words, it is needed to transfer one virtual
machine from one node to every other node on a LAN of
interconnected physical desktop computers. The solution proposed by the Ohio State University [6] migrates virtual
machines by using RDMA (Remote Direct Memory Access), which allows a computer to access the main memory of
another without involving the operating system. This schema permits a very high-throughput data transfer between the
nodes; it also reduces the transmission overhead up to 80%. Furthermore, this solution requires a special
configuration of each computer involved on the cluster. In
the UnaGrid infrastructure the VMs that constitute the VCs are deployed on common computer labs, in which the
computers are not controlled by the administrators of UnaGrid. This restriction makes it unfeasible to conFigure
the physical machines to support RDMA. On the other hand, multicast can save great amounts of
bandwidth if it is used for file transfer in a LAN. Earlier,
UnaGrid had been extended to copy VMs using reliable multicast. However, the firewall configuration of the
computer labs blocks any multicast transfer when it involves large files. Generally, the VMs copied on to the computer
labs consist of files greater than 5 GB. So another approach is needed, rather than multicast based schemas.
Some solutions involve the use of multicast-based
schemas such as overlay multicast [7]. That particular solution describes a method for reliable data transfer based
on this protocol, achieved by the usage of the application layer. They create a binary distribution tree, in which each
node acts both as a sender and a receiver of packets using TCP, and it changes its structure according to the network
condition. This solution is not in the scope of this paper but will be explored as future work.
III. PROBLEM STATEMENT
The situation starts off with a topology where n terminals
are connected to a switch with Cs capacity and all of the connections are Symmetric DSL with the same amount of
Bandwidth. (For practical purposes, assume that Cs is greater than or equal to the sum of the connections of the terminals,
establishing that the network will not collapse if all of the terminals are using their connection to their full extent.)
In one of these terminals, there is a large archive (a VM) that requires to be transfered to other computers throughout
the LAN. UDP cannot be used because of firewalls and it
must be done without the users of the computers knowing about it, so the Switch’s capacity cannot be consumed too
much or else the users will start to notice a lag in their connection.
The objective is to be able to copy the large archive onto all of the computers in the least amount of time and having
all of the computers finish downloading the archive at
approximately the same time.
A. Mathematical Formulation
1) Objective Functions
a) Min (Bwmax – Bwmin)
Minimize the waste. This means we want all the
nodes to end at approximately the same time.
b) Min (Tf )
Minimize the t ime that it takes to copy the
information to the last node.
2) Constraints
a)
The remnant that can be used, from the
connection of the th terminal, to trans mit the file is
equal to the capacity of the connection minus
the capacity being consumed by other functions
or the user.
b)
The percentage of use is equal to a defined
percentage that will be used from the remnant of
. Note that it is a percentage, not a capacity.
c) ( ) (download)
The min imum bandwidth of the configuration is
equal to the minimum actual usage of the
connection, which is the percentage of use
times the remnant of the connection . Note that
the usage is only from the central switch to
a node.
d) ( ) (download)
The maximum bandwidth of the configuration is
equal to the maximum actual usage of the
connection, which is the percentage of use times
the remnant of the connection . Note that the
usage is only from the central switch to a
node.
e)
The time it takes for the final node to finish
downloading the file is equal to the size of the file
divided by the min imum Bandwidth ,
plus the time it takes to establish the connection
and start sending the information to the next node
times the number of nodes minus one.
f) ∑
The sum of the actual usage of the connections
must be less than or equal to the Switch’s capacity
times a defined percentage .
46Copyright (c) IARIA, 2011. ISBN: 978-1-61208-174-8
EMERGING 2011 : The Third International Conference on Emerging Network Intelligence
53 / 141
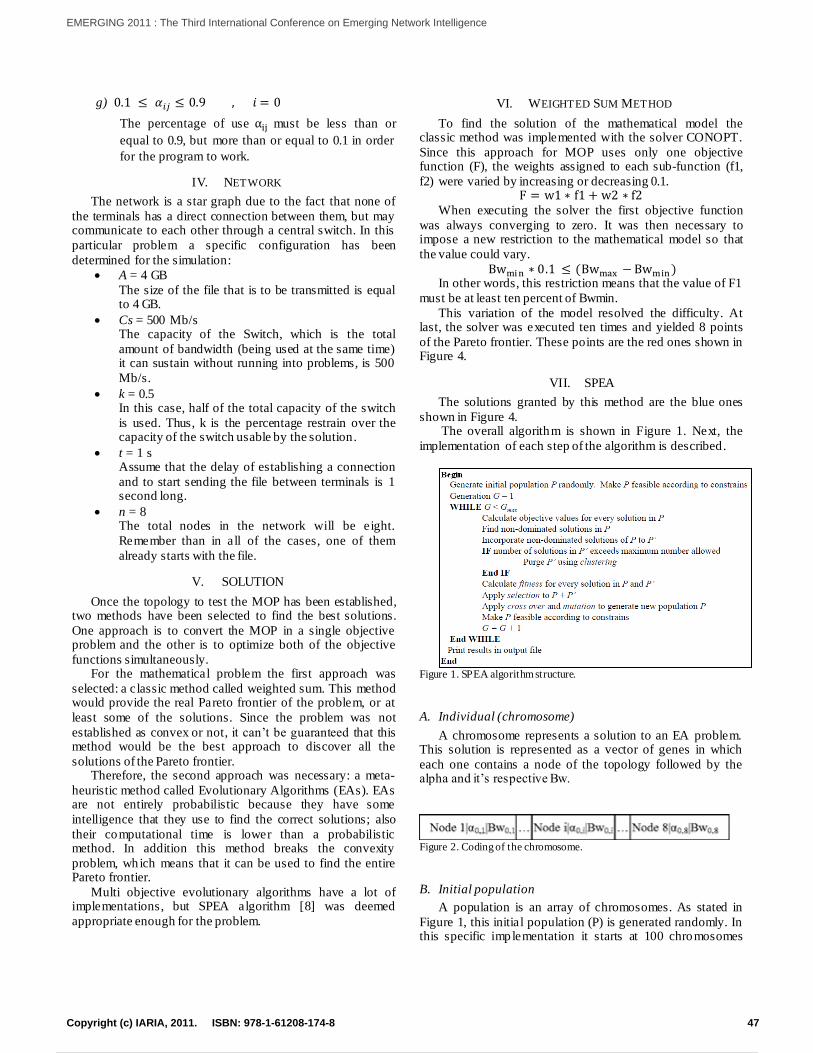
g)
The percentage of use must be less than or
equal to 0.9, but more than or equal to 0.1 in order
for the program to work.
IV. NETWORK
The network is a star graph due to the fact that none of
the terminals has a direct connection between them, but may communicate to each other through a central switch. In this
particular problem a specific configuration has been
determined for the simulation:
A = 4 GB
The size of the file that is to be transmitted is equal to 4 GB.
Cs = 500 Mb/s The capacity of the Switch, which is the total
amount of bandwidth (being used at the same time) it can sustain without running into problems, is 500
Mb/s.
k = 0.5 In this case, half of the total capacity of the switch
is used. Thus, k is the percentage restrain over the capacity of the switch usable by the solution.
t = 1 s Assume that the delay of establishing a connection
and to start sending the file between terminals is 1 second long.
n = 8 The total nodes in the network will be eight.
Remember than in all of the cases, one of them
already starts with the file.
V. SOLUTION
Once the topology to test the MOP has been established, two methods have been selected to find the best solutions.
One approach is to convert the MOP in a single objective problem and the other is to optimize both of the objective
functions simultaneously. For the mathematical problem the first approach was
selected: a classic method called weighted sum. This method would provide the real Pareto frontier of the problem, or at
least some of the solutions. Since the problem was not
established as convex or not, it can’t be guaranteed that this method would be the best approach to discover all the
solutions of the Pareto frontier. Therefore, the second approach was necessary: a meta-
heuristic method called Evolutionary Algorithms (EAs). EAs are not entirely probabilistic because they have some
intelligence that they use to find the correct solutions; also
their computational time is lower than a probabilistic method. In addition this method breaks the convexity
problem, which means that it can be used to find the entire Pareto frontier.
Multi objective evolutionary algorithms have a lot of implementations, but SPEA algorithm [8] was deemed
appropriate enough for the problem.
VI. WEIGHTED SUM METHOD
To find the solution of the mathematical model the classic method was implemented with the solver CONOPT.
Since this approach for MOP uses only one objective function (F), the weights assigned to each sub-function (f1,
f2) were varied by increasing or decreasing 0.1.
When executing the solver the first objective function
was always converging to zero. It was then necessary to impose a new restriction to the mathematical model so that
the value could vary.
In other words, this restriction means that the value of F1
must be at least ten percent of Bwmin.
This variation of the model resolved the difficulty. At last, the solver was executed ten times and yielded 8 points
of the Pareto frontier. These points are the red ones shown in Figure 4.
VII. SPEA
The solutions granted by this method are the blue ones
shown in Figure 4. The overall algorithm is shown in Figure 1. Next, the
implementation of each step of the algorithm is described.
Figure 1. SPEA algorithm structure.
A. Individual (chromosome)
A chromosome represents a solution to an EA problem. This solution is represented as a vector of genes in which
each one contains a node of the topology followed by the alpha and it’s respective Bw.
Figure 2. Coding of the chromosome.
B. Initial population
A population is an array of chromosomes. As stated in
Figure 1, this initial population (P) is generated randomly. In this specific implementation it starts at 100 chromosomes
47Copyright (c) IARIA, 2011. ISBN: 978-1-61208-174-8
EMERGING 2011 : The Third International Conference on Emerging Network Intelligence
54 / 141
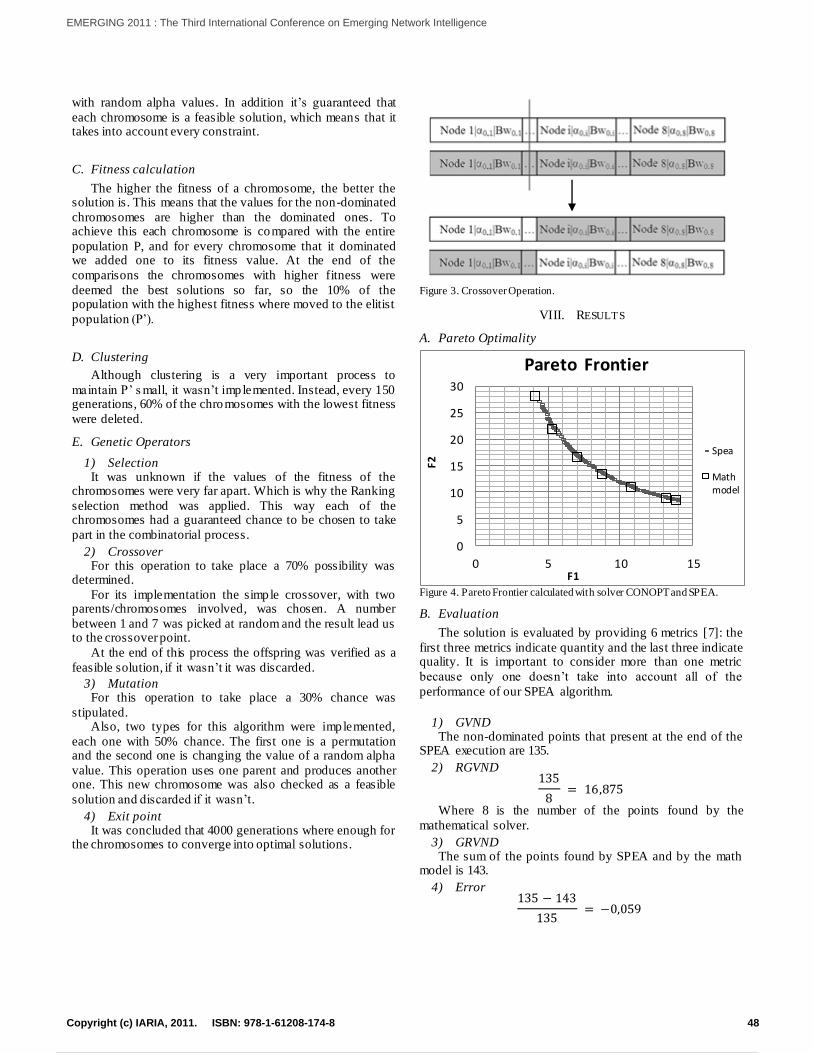
with random alpha values. In addition it’s guaranteed that
each chromosome is a feasible solution, which means that it takes into account every constraint.
C. Fitness calculation
The higher the fitness of a chromosome, the better the solution is. This means that the values for the non-dominated
chromosomes are higher than the dominated ones. To achieve this each chromosome is compared with the entire
population P, and for every chromosome that it dominated we added one to its fitness value. At the end of the
comparisons the chromosomes with higher fitness were
deemed the best solutions so far, so the 10% of the population with the highest fitness where moved to the elitist
population (P’).
D. Clustering
Although clustering is a very important process to
maintain P’ s mall, it wasn’t implemented. Instead, every 150 generations, 60% of the chromosomes with the lowest fitness
were deleted.
E. Genetic Operators
1) Selection It was unknown if the values of the fitness of the
chromosomes were very far apart. Which is why the Ranking
selection method was applied. This way each of the chromosomes had a guaranteed chance to be chosen to take
part in the combinatorial process.
2) Crossover For this operation to take place a 70% possibility was
determined.
For its implementation the simple crossover, with two parents/chromosomes involved, was chosen. A number
between 1 and 7 was picked at random and the result lead us to the crossover point.
At the end of this process the offspring was verified as a
feasible solution, if it wasn’t it was discarded.
3) Mutation For this operation to take place a 30% chance was
stipulated. Also, two types for this algorithm were implemented,
each one with 50% chance. The first one is a permutation and the second one is changing the value of a random alpha
value. This operation uses one parent and produces another one. This new chromosome was also checked as a feasible
solution and discarded if it wasn’t.
4) Exit point It was concluded that 4000 generations where enough for
the chromosomes to converge into optimal solutions.
Figure 3. Crossover Operation.
VIII. RESULTS
A. Pareto Optimality
Figure 4. Pareto Frontier calculated with solver CONOPT and SPEA.
B. Evaluation
The solution is evaluated by providing 6 metrics [7]: the
first three metrics indicate quantity and the last three indicate quality. It is important to consider more than one metric
because only one doesn’t take into account all of the
performance of our SPEA algorithm.
1) GVND The non-dominated points that present at the end of the
SPEA execution are 135.
2) RGVND
Where 8 is the number of the points found by the
mathematical solver.
3) GRVND The sum of the points found by SPEA and by the math
model is 143.
4) Error
0
5
10
15
20
25
30
0 5 10 15
F2
F1
Pareto Frontier
Spea
Mathmodel
48Copyright (c) IARIA, 2011. ISBN: 978-1-61208-174-8
EMERGING 2011 : The Third International Conference on Emerging Network Intelligence
55 / 141

5) Generational Distance By applying the formula, the value of this metric is
0,102.
6) Spacing
The ideal value of the last three metrics is zero, however our values are not that far apart. This means that we have a
good behavior of our algorithm. In other word, the distribution of our solution is adequate, the distance between
our solutions and the mathemat ical model is minimal and our error (our solution compared with the solution given by the
solver CONOPT) is nearly insignificant.
In addition, the first three metrics indicate that we have a considerable amount of solutions, which is something good.
IX. CONCLUSION
Our model can find an efficient way of transferring a file
from one source node to every other node on a LAN. This transfer is done in an opportunistic way, it is intended to
adapt to the use-percentage of each link of the network. So our algorithm can find a solution in which the user does not
perceive any change on the quality of service of the network due to the transfer.
From both our solutions calculated from the evolutionary algorithm and CONOPT we obtain practically the same
Pareto Frontier. This can be proven by our result for
generational distance. This tells us that our evolutionary algorithm is not obtaining only local minimums, and that our
mathematical model is well defined for our problem. We obtain more diversity of solutions from our
evolutionary algorithm. This shows that our evolutionary algorithm can provide more information in case we wanted
to develop software to calculate the best way of migrating
virtual machines on a LAN.
X. FUTURE WORK
Our algorithm has proven a good performance and
efficiency in small networks. However it is necessarily to test
it in bigger networks because in these tests is where it can evaluated the scalability of the proposed solution and the
complexity of the algorithm. Also in our algorithm, we simplified the way in which we
reduce the size of the elitist population. The SPEA algorithm proposes that to control the size of the elit ist population some
solutions have to be removed by using Clustering [8]. We
simplified this calculation by using a different algorithm to
reduce the population. When our elitist population reaches a size S greater than a defined maximum M, what we do is to
calculate the fitness inside the elitist population and then we eliminate the last M-S solutions. We suggest as a future work
to implement clustering for reducing the size of the elitist population.
In our solution we propose a way of transferring the file
by using a pipeline. A future work could consider a different schema, for example binary trees, or n-ary trees where the
root is the node that is the source of the file, and the tree defines how to organize the transfer. It must be considered
that these kinds of solutions require a different mathematical model.
REFERENCES
[1] H. Castro, E. Rosales, M. Villamizar and A. Jiménez, “UnaGrid: On Demand Opportunistic Desktop Grid” 10th IEEE/ACM International Conference on Cluster, Cloud and Grid Computing (VIC 2010), May. 2010, pp. 661 - 666, doi: 10.1109/CCGRID.2010.79.
[2] Globus. GridFTP. [Online] 5 2011. http://globus.org/toolkit/docs/3.2/gridftp/, retireved September, 2011
[3] R. Madduri, C. Hood, W. Allcock and W. E, “Reliable file transfer in Grid environments” Proc. Local 27th Annual IEEE Conference on Computer Networks, (LCN 2002), pp. 737-738, doi: 10.1109/LCN.2002.1181855.
[4] V. Velusamy, A. Skjiellum, and A. Kanevski, “Employing an RDMA-based file system for high performance computing” Proc. 12th IEEE International Conference on Networks (ICON 2004), pp. 66-70, doi: 10.1109/ICON.2004.1409089.
[5] Y. Chao-Tung, C. Yao-Chun, Y. Ming-Feng and H. Ching-Hsien, “An Anticipative Recursively-Adjusting Mechanism for Redundant Parallel file transfer in data grids” 13th Asia-Pacific. Computer Systems Architecture Conference (ACSAC 2008), Aug 2008, pp. 1-8, doi: 10.1109/APCSAC.2008.4625456
[6] H. Wei, G. Qi, and L. Jiuxing, “High performance virtual machine migration with RDMA over modern interconnects” IEEE International Conference on Cluster Computing (CLUSTR 2007), Sep 2007 pp. 11-20, doi: 10.1109/CLUSTR.2007.4629212
[7] E. Kwon, J. Park, and S. Kang “Reliable data transfer mechanism on dynamic nodes based overlay multicast” The 7th International Conference on Advanced Communication T echnology (ICACT 2005), Feb 2005, pp. 1349 – 1352, doi: 10.1109/ICACT.2005.246199
[8] Deb, Kalyanmoy. Mulit-Objetctive Optimization using Evolutionary Algorithms. Chichester : Wiley, 2004.
49Copyright (c) IARIA, 2011. ISBN: 978-1-61208-174-8
EMERGING 2011 : The Third International Conference on Emerging Network Intelligence
56 / 141
Restoring CSCF by Leveraging Feature of Retransmission Mechanism in Session Initiation Protocol
Takeshi Usui and Nozomu Nishinaga New Generation Network Laboratory National Institute of Information and
Communications Technology Koganei, Tokyo
e-mail: [email protected] and [email protected]
Yoshinori Kitatsuji and Hidetoshi Yokota Mobile Network Laboratory
KDDI R&D Laboratories, Inc. Fujimino, Saitama
e-mail: [email protected] and [email protected]
Abstract— The IP multimedia subsystem (IMS) is a key technology for providing various services over IP-based networks. IMS enables network service providers to collect information relating to the communications of customers, such as an accounting through call/session control function (CSCF) which is used to establish a session using the session initiation protocol (SIP). Therefore, the availability of CSCF has become important. We propose a system to recover the session states maintained by the CSCF in the alternate CSCFs. This is achieved in a low cost solution by leveraging the features of retransmission mechanism in SIP. Our proposed system selectively saves the session state in order to reduce the saved data and recovers the saved session state in the alternate CSCFs rapidly when the faults occur in CSCFs. We show that our proposed system can achieve 60% reduction of the backup servers and that the overhead of our proposed system is not large.
Keywords-component; Restoration system; IMS; SIP; Network Operation
I. INTRODUCTION
Many network service providers (NSPs) are now promoting convergence towards providing various services over IP-based networks. IP Multimedia Subsystem (IMS) [1] is supposed as the service management and control function over IP-based networks. In the IMS, a call/session control function (CSCF) [2], that is a session initiation protocol (SIP) [3] proxy server, is used to establish a session, that accompanies the information to start the application between user equipments (UEs), through the SIP. When the UE starts an application managed by IMS, such as IP telephony, a series of SIP messages are exchanged through multiple types of CSCFs that is referred to as the SIP signaling call flow.
The availability of the CSCFs is essential for session management, i.e., service control, administration, and accounting. If the CSCFs are not available, the UEs cannot start the application. In the worst case, the services managed by IMS may go down because the application initiation and the communications of the UE are broken off. Therefore, the availability of the CSCFs is of great importance.
For continuing services, the service status need to be recovered to an available server and the service execution is succeeded with this server when the original server becomes unavailable. E.g., in the case of the CSCFs, it is required to recover the session states which the CSCF keeps for each UE.
A session state is the information which is used for establishing the session (i.e., transaction and dialog, details are described in Section III-B). For restoring the CSCF, the NSP may adopt a fault tolerant (FT) server [4] which consists of a pair of active and backup hardware and copies all the data from the active server to the backup server. In this case, the NSPs must prepare the same number of backup servers as active servers. As the other methods, Peer-to-Peer (P2P) SIP [5] can be used to improve the redundancy of SIP proxy servers. However, P2P SIP cannot recover a session state when the SIP signaling call flow is not completed and a session is not yet established (hereafter, this incomplete session is termed “pre-session”). Here, we propose a system that recovers even the pre-session as well as the established sessions from the aggregated backup servers.
For completely restore the CSCF that halted because of faults (e.g., hardware fault) (hereafter, termed “fault CSCF”), the session states must be saved in the backup server which is positioned as the backup hardware in the case of FT and the alternate CSCF needs to take over the session state of the fault CSCF as described in a literature [6]. However, this process has two issues. The first is that the NSP encounters to maintain a number of the backup servers because of the high volume of the data to be saved. Now, NSPs aim to reduce the number of the servers for cost saving by aggregating multiple servers to fewer servers.The second is that the NSP needs to restore the CSCF within a limited period. This is because the NSP never want to lose the information related to the accounting.
To solve the first issue, we reduce the number of the backup server by selectively saving the session states. The SIP application retransmits SIP messages if they are lost. Our proposed system does not save the session states that can be restored by the retransmitted SIP messages, but save the session states based on the relationships between the retransmitted SIP messages and the session state that is necessary for the CSCFs to handle the retransmitted SIP messages. Our proposed system enables few backup servers to save the session states from a large number of CSCFs because the volume of the saved data is sufficiently reduced.
To solve the second issue, we propose that the specific session state be recovered rapidly in turn based on the type of each session state. We defined priorities from the session states which are required from the service. At first our proposed system recovers the pre-session in order to
50Copyright (c) The Government of Japan, 2011. Used by permission to IARIA. ISBN: 978-1-61208-174-8
EMERGING 2011 : The Third International Conference on Emerging Network Intelligence
57 / 141
continue the SIP signaling call flow and restricts the influence of the CSCF faults at the minimum level.
The rest of the paper is organized as follows. Section II and III describe the requirement for CSCF restoration system and the design of our proposed system. Section IV evaluates the overhead of our proposed system and how many backup servers are reduced. Section V concludes the paper.
II. REQUIREMENTS FOR CSCF RESTORATION SYSTEM
A. Overview of IMS Architecture
One of the features in the IMS is that three different SIP proxy servers are used. The core functional components of the IMS are these three different kinds of CSCFs: Proxy-CSCF (P-CSCF), Interrogating-CSCF (I-CSCF), and Serving-CSCF (S-CSCF). These components are responsible for the management of SIP signaling call flow, such as routing a SIP message, and authentication and registration for UEs.
The P-CSCF is the first functional point of contact between UE and IMS components. It maintains IPSec security associations (SA) with UE and applies integrity and confidentiality protection for the SIP message. The I-CSCF is responsible for assigning a suitable S-CSCF to the UE and routes incoming requests to S-CSCF. The S-CSCF handles the registration process and downloads authentication data from the Home Subscriber Server (HSS), which is a database containing the information base of the subscribed users, such as the users identifiers, location information, and so on.
In this paper, we focus on the P-CSCF and the S-CSCF for the restoration system because these servers maintain the sessions in a stateful mannr. Because the I-CSCF deals with the SIP messages in a stateless manner, the UE and CSCFs does not need to execute registration process from the beginning when the alternate I-CSCF is prepared. Therefore, recovering the session states of the I-CSCF is not necessary.
B. Functions of CSCF Restoration System
In this paper, we assume the CSCFs and UE use UDP as the transport protocol for exchanging SIP messages because many NSPs do so. Therefore, the CSCFs and UE use the retransmission mechanism in SIP. (When adopting TCP, our proposed system cannot be used because the CSCFs do not use the retransmission mechanism)
The following three functions are considered necessary for the restoration system. (1) Monitoring function to detect CSCFs failure quickly (2) Saving function to save the minimized data of the
session states from the CSCFs before their faults occurred
(3) Restoring function to rapidly recover the session state in the alternate CSCF without requiring any action of UE or without losing session management at the UE due to the faults.
After function (1) detects faults of CSCF, we can execute the procedures to recover the session states. In this paper, we assume that the existing tools and method (e.g., [7] [8]) are
used to detect the faults of CSCF. We thus focus instead on the design and implementations of functions (2) and (3) in a low cost solution.
In function (2), a key is reducing the saved data of the session state. To implement the low-cost restoration system, it is desirable that the volume of the saved data is low. Saving all the change of session state as the CSCF receives any types of SIP messages leads to a large amount of data transferred to and stored in the storage. The reduction of the saved data allows the number of backup servers maintained in the NSP to be reduced. We distinguish SIP message (INVITE, UPDATE, ACK, and so on) based on the priorities in recover the session state just after the CSCF is halt, and let the session state be saved when the important SIP message is received by the CSCF. Thus, the CSCF saves the limited session states instead of saving every change of the session state. The definition of the importance of SIP message and the other detail are described in Section IV.
Function (3) needs to be executed as rapidly as possible in order to not affect the recovered sessions maintained in the alternate CSCF server after the failure of the original CSCF server. No particular functions in the implementation of the UE should be additionally required for function (3).
Function (3) is also required to recover the pre-session. If the pre-session is not recovered, the UE fail to start the application and needs to execute the application initiation procedures from the beginning. In the SIP, there is no procedure to recover the broken procedure of the application initiation. In order that the UE start to use the application, that procedure is need to be defined.
C. Related Work
The FT server [4] requires the pairs of active and backup hardware resources because it saves data from active server to backup server whenever the CPU executes any commands. Therefore the FT server requires the specialized hardware is required. The FT server has function (3), but does not satisfy function (2).
The redundancy techniques for the web servers [9] [10] are applicable for CSCFs. However, these technologies do not achieve minimizing the saved data of the session states because these technologies do not consider the feature of the SIP. These technologies do not satisfy function (2).
The system for the replication of the SIP proxy server as described in [6] has been proposed. In this system, a pair of an active and backup server is prepared. The replication is executed every time SIP messages are exchanged between the SIP proxy and the UE. This system satisfies the function (3). But, this system does not consider the reduction of the data to be saved in the backup servers. Therefore, this system does not satisfy the function (2).
P2P SIP is also used to improve the redundancy of the servers, but it cannot recover the pre-session because there is no mechanism that shares the session states that the SIP proxy servers keep. For P2P SIP, it is necessary for the UE to re-register with the SIP proxy server so that a different SIP proxy server manages the session state of the UE. P2P SIP does not satisfy the function (3) because the data for restoring the CSCF is not saved anywhere.
51Copyright (c) The Government of Japan, 2011. Used by permission to IARIA. ISBN: 978-1-61208-174-8
EMERGING 2011 : The Third International Conference on Emerging Network Intelligence
58 / 141
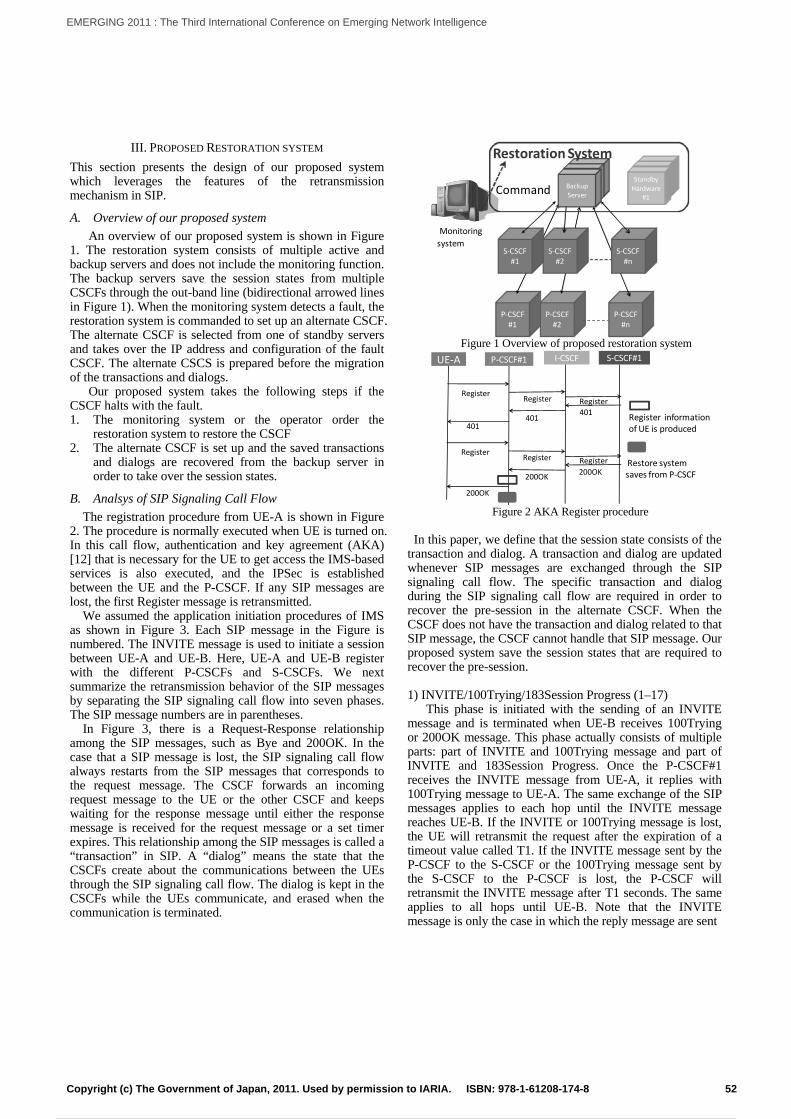
III. PROPOSED RESTORATION SYSTEM
This section presents the design of our proposed system which leverages the features of the retransmission mechanism in SIP.
A. Overview of our proposed system
An overview of our proposed system is shown in Figure 1. The restoration system consists of multiple active and backup servers and does not include the monitoring function. The backup servers save the session states from multiple CSCFs through the out-band line (bidirectional arrowed lines in Figure 1). When the monitoring system detects a fault, the restoration system is commanded to set up an alternate CSCF. The alternate CSCF is selected from one of standby servers and takes over the IP address and configuration of the fault CSCF. The alternate CSCS is prepared before the migration of the transactions and dialogs.
Our proposed system takes the following steps if the CSCF halts with the fault. 1. The monitoring system or the operator order the
restoration system to restore the CSCF 2. The alternate CSCF is set up and the saved transactions
and dialogs are recovered from the backup server in order to take over the session states.
B. Analsys of SIP Signaling Call Flow
The registration procedure from UE-A is shown in Figure 2. The procedure is normally executed when UE is turned on. In this call flow, authentication and key agreement (AKA) [12] that is necessary for the UE to get access the IMS-based services is also executed, and the IPSec is established between the UE and the P-CSCF. If any SIP messages are lost, the first Register message is retransmitted.
We assumed the application initiation procedures of IMS as shown in Figure 3. Each SIP message in the Figure is numbered. The INVITE message is used to initiate a session between UE-A and UE-B. Here, UE-A and UE-B register with the different P-CSCFs and S-CSCFs. We next summarize the retransmission behavior of the SIP messages by separating the SIP signaling call flow into seven phases. The SIP message numbers are in parentheses.
In Figure 3, there is a Request-Response relationship among the SIP messages, such as Bye and 200OK. In the case that a SIP message is lost, the SIP signaling call flow always restarts from the SIP messages that corresponds to the request message. The CSCF forwards an incoming request message to the UE or the other CSCF and keeps waiting for the response message until either the response message is received for the request message or a set timer expires. This relationship among the SIP messages is called a “transaction” in SIP. A “dialog” means the state that the CSCFs create about the communications between the UEs through the SIP signaling call flow. The dialog is kept in the CSCFs while the UEs communicate, and erased when the communication is terminated.
P‐CSCF#1
P‐CSCF#2
P‐CSCF#n
S‐CSCF#1
S‐CSCF#2
S‐CSCF#n
StandbyHardware#3
StandbyHardware#2
StandbyHardware
#1
Monitoring
system
StandbyHardware#3
StandbyHardware#2
BackupServerCommand
Restoration System
Figure 1 Overview of proposed restoration system
P‐CSCF#1 S‐CSCF#1UE‐A
Register
401
Register
401
Register
200OK
Register
200OK
Register information of UE is produced
Restore systemsaves from P‐CSCF
I‐CSCF
Register
401
Register
200OK
Figure 2 AKA Register procedure
In this paper, we define that the session state consists of the
transaction and dialog. A transaction and dialog are updated whenever SIP messages are exchanged through the SIP signaling call flow. The specific transaction and dialog during the SIP signaling call flow are required in order to recover the pre-session in the alternate CSCF. When the CSCF does not have the transaction and dialog related to that SIP message, the CSCF cannot handle that SIP message. Our proposed system save the session states that are required to recover the pre-session.
1) INVITE/100Trying/183Session Progress (1–17)
This phase is initiated with the sending of an INVITE message and is terminated when UE-B receives 100Trying or 200OK message. This phase actually consists of multiple parts: part of INVITE and 100Trying message and part of INVITE and 183Session Progress. Once the P-CSCF#1 receives the INVITE message from UE-A, it replies with 100Trying message to UE-A. The same exchange of the SIP messages applies to each hop until the INVITE message reaches UE-B. If the INVITE or 100Trying message is lost, the UE will retransmit the request after the expiration of a timeout value called T1. If the INVITE message sent by the P-CSCF to the S-CSCF or the 100Trying message sent by the S-CSCF to the P-CSCF is lost, the P-CSCF will retransmit the INVITE message after T1 seconds. The same applies to all hops until UE-B. Note that the INVITE message is only the case in which the reply message are sent
52Copyright (c) The Government of Japan, 2011. Used by permission to IARIA. ISBN: 978-1-61208-174-8
EMERGING 2011 : The Third International Conference on Emerging Network Intelligence
59 / 141
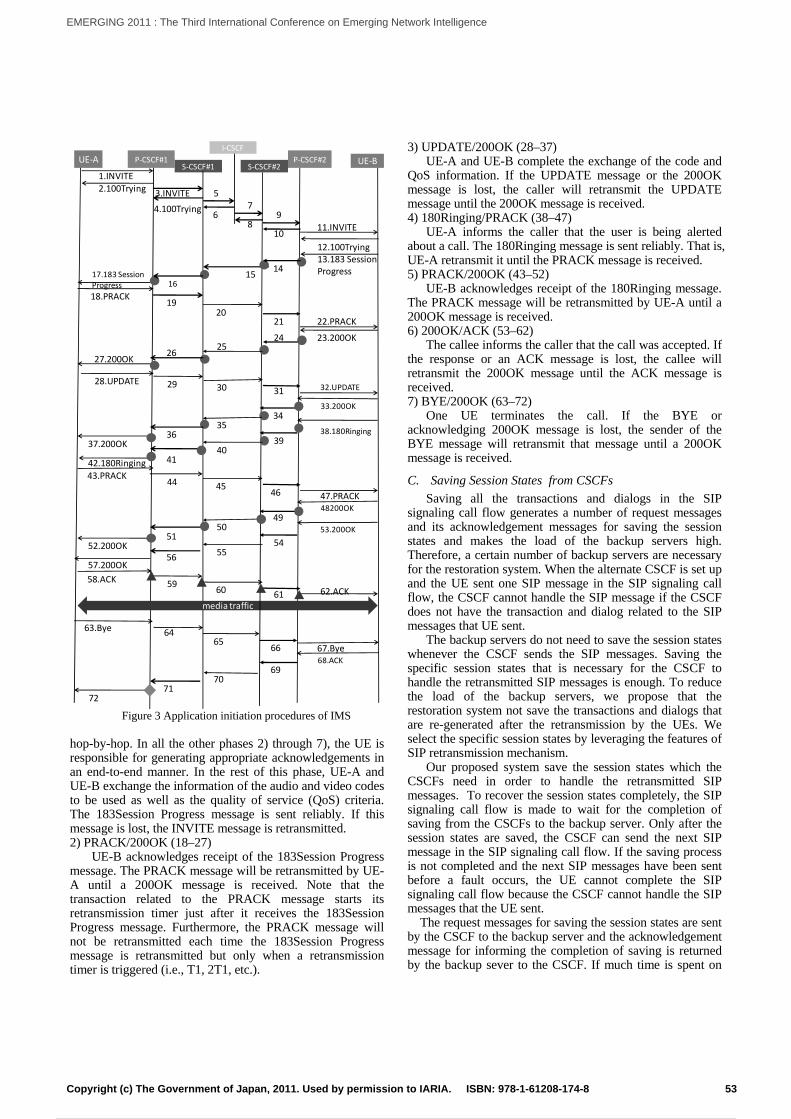
UE‐BP‐CSCF#1S‐CSCF#1
P‐CSCF#2
media traffic
UE‐A
1.INVITE2.100Trying 3.INVITE
4.100Trying
8
5
11.INVITE
12.100Trying13.183 SessionProgress
18.PRACK
23.200OK
28.UPDATE
33.200OK
38.180Ringing
43.PRACK
1417.183 SessionProgress
1920
22.PRACK
24
2627.200OK
29 30 32.UPDATE
3637.200OK
42.180Ringing
44 4547.PRACK
S‐CSCF#2
I‐CSCF
67
9
10
1516
21
25
31
3435
3940
41
46
48200OK
53.200OK51
52.200OK
57.200OK
4950
5455
56
58.ACK 5960 61 62.ACK
63.Bye 6465
67.Bye6668.ACK
71
6970
72
Figure 3 Application initiation procedures of IMS hop-by-hop. In all the other phases 2) through 7), the UE is responsible for generating appropriate acknowledgements in an end-to-end manner. In the rest of this phase, UE-A and UE-B exchange the information of the audio and video codes to be used as well as the quality of service (QoS) criteria. The 183Session Progress message is sent reliably. If this message is lost, the INVITE message is retransmitted. 2) PRACK/200OK (18–27)
UE-B acknowledges receipt of the 183Session Progress message. The PRACK message will be retransmitted by UE-A until a 200OK message is received. Note that the transaction related to the PRACK message starts its retransmission timer just after it receives the 183Session Progress message. Furthermore, the PRACK message will not be retransmitted each time the 183Session Progress message is retransmitted but only when a retransmission timer is triggered (i.e., T1, 2T1, etc.).
3) UPDATE/200OK (28–37) UE-A and UE-B complete the exchange of the code and
QoS information. If the UPDATE message or the 200OK message is lost, the caller will retransmit the UPDATE message until the 200OK message is received. 4) 180Ringing/PRACK (38–47)
UE-A informs the caller that the user is being alerted about a call. The 180Ringing message is sent reliably. That is, UE-A retransmit it until the PRACK message is received. 5) PRACK/200OK (43–52)
UE-B acknowledges receipt of the 180Ringing message. The PRACK message will be retransmitted by UE-A until a 200OK message is received. 6) 200OK/ACK (53–62)
The callee informs the caller that the call was accepted. If the response or an ACK message is lost, the callee will retransmit the 200OK message until the ACK message is received. 7) BYE/200OK (63–72)
One UE terminates the call. If the BYE or acknowledging 200OK message is lost, the sender of the BYE message will retransmit that message until a 200OK message is received.
C. Saving Session States from CSCFs
Saving all the transactions and dialogs in the SIP signaling call flow generates a number of request messages and its acknowledgement messages for saving the session states and makes the load of the backup servers high. Therefore, a certain number of backup servers are necessary for the restoration system. When the alternate CSCF is set up and the UE sent one SIP message in the SIP signaling call flow, the CSCF cannot handle the SIP message if the CSCF does not have the transaction and dialog related to the SIP messages that UE sent.
The backup servers do not need to save the session states whenever the CSCF sends the SIP messages. Saving the specific session states that is necessary for the CSCF to handle the retransmitted SIP messages is enough. To reduce the load of the backup servers, we propose that the restoration system not save the transactions and dialogs that are re-generated after the retransmission by the UEs. We select the specific session states by leveraging the features of SIP retransmission mechanism.
Our proposed system save the session states which the CSCFs need in order to handle the retransmitted SIP messages. To recover the session states completely, the SIP signaling call flow is made to wait for the completion of saving from the CSCFs to the backup server. Only after the session states are saved, the CSCF can send the next SIP message in the SIP signaling call flow. If the saving process is not completed and the next SIP messages have been sent before a fault occurs, the UE cannot complete the SIP signaling call flow because the CSCF cannot handle the SIP messages that the UE sent.
The request messages for saving the session states are sent by the CSCF to the backup server and the acknowledgement message for informing the completion of saving is returned by the backup sever to the CSCF. If much time is spent on
53Copyright (c) The Government of Japan, 2011. Used by permission to IARIA. ISBN: 978-1-61208-174-8
EMERGING 2011 : The Third International Conference on Emerging Network Intelligence
60 / 141
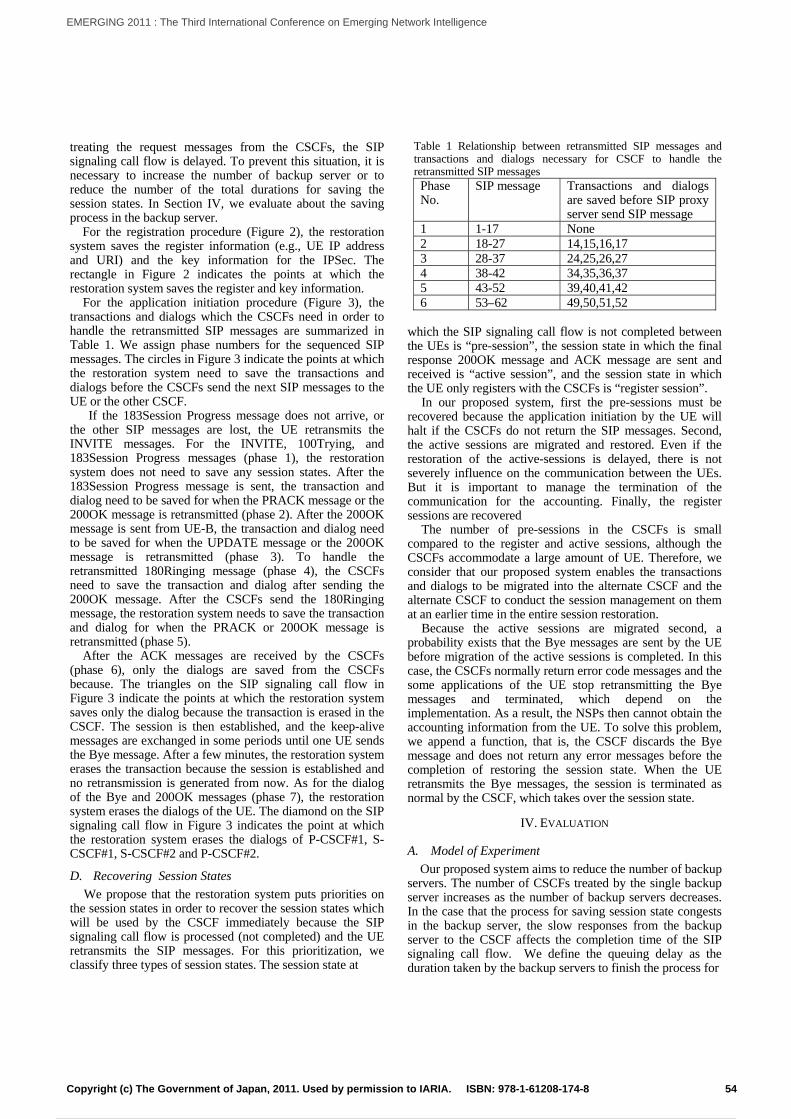
treating the request messages from the CSCFs, the SIP signaling call flow is delayed. To prevent this situation, it is necessary to increase the number of backup server or to reduce the number of the total durations for saving the session states. In Section IV, we evaluate about the saving process in the backup server.
For the registration procedure (Figure 2), the restoration system saves the register information (e.g., UE IP address and URI) and the key information for the IPSec. The rectangle in Figure 2 indicates the points at which the restoration system saves the register and key information.
For the application initiation procedure (Figure 3), the transactions and dialogs which the CSCFs need in order to handle the retransmitted SIP messages are summarized in Table 1. We assign phase numbers for the sequenced SIP messages. The circles in Figure 3 indicate the points at which the restoration system need to save the transactions and dialogs before the CSCFs send the next SIP messages to the UE or the other CSCF.
If the 183Session Progress message does not arrive, or the other SIP messages are lost, the UE retransmits the INVITE messages. For the INVITE, 100Trying, and 183Session Progress messages (phase 1), the restoration system does not need to save any session states. After the 183Session Progress message is sent, the transaction and dialog need to be saved for when the PRACK message or the 200OK message is retransmitted (phase 2). After the 200OK message is sent from UE-B, the transaction and dialog need to be saved for when the UPDATE message or the 200OK message is retransmitted (phase 3). To handle the retransmitted 180Ringing message (phase 4), the CSCFs need to save the transaction and dialog after sending the 200OK message. After the CSCFs send the 180Ringing message, the restoration system needs to save the transaction and dialog for when the PRACK or 200OK message is retransmitted (phase 5).
After the ACK messages are received by the CSCFs (phase 6), only the dialogs are saved from the CSCFs because. The triangles on the SIP signaling call flow in Figure 3 indicate the points at which the restoration system saves only the dialog because the transaction is erased in the CSCF. The session is then established, and the keep-alive messages are exchanged in some periods until one UE sends the Bye message. After a few minutes, the restoration system erases the transaction because the session is established and no retransmission is generated from now. As for the dialog of the Bye and 200OK messages (phase 7), the restoration system erases the dialogs of the UE. The diamond on the SIP signaling call flow in Figure 3 indicates the point at which the restoration system erases the dialogs of P-CSCF#1, S-CSCF#1, S-CSCF#2 and P-CSCF#2.
D. Recovering Session States
We propose that the restoration system puts priorities on the session states in order to recover the session states which will be used by the CSCF immediately because the SIP signaling call flow is processed (not completed) and the UE retransmits the SIP messages. For this prioritization, we classify three types of session states. The session state at
Table 1 Relationship between retransmitted SIP messages and transactions and dialogs necessary for CSCF to handle the retransmitted SIP messages Phase No.
SIP message Transactions and dialogs are saved before SIP proxy server send SIP message
1 1-17 None 2 18-27 14,15,16,17 3 28-37 24,25,26,27 4 38-42 34,35,36,37 5 43-52 39,40,41,42 6 53–62 49,50,51,52
which the SIP signaling call flow is not completed between the UEs is “pre-session”, the session state in which the final response 200OK message and ACK message are sent and received is “active session”, and the session state in which the UE only registers with the CSCFs is “register session”.
In our proposed system, first the pre-sessions must be recovered because the application initiation by the UE will halt if the CSCFs do not return the SIP messages. Second, the active sessions are migrated and restored. Even if the restoration of the active-sessions is delayed, there is not severely influence on the communication between the UEs. But it is important to manage the termination of the communication for the accounting. Finally, the register sessions are recovered
The number of pre-sessions in the CSCFs is small compared to the register and active sessions, although the CSCFs accommodate a large amount of UE. Therefore, we consider that our proposed system enables the transactions and dialogs to be migrated into the alternate CSCF and the alternate CSCF to conduct the session management on them at an earlier time in the entire session restoration.
Because the active sessions are migrated second, a probability exists that the Bye messages are sent by the UE before migration of the active sessions is completed. In this case, the CSCFs normally return error code messages and the some applications of the UE stop retransmitting the Bye messages and terminated, which depend on the implementation. As a result, the NSPs then cannot obtain the accounting information from the UE. To solve this problem, we append a function, that is, the CSCF discards the Bye message and does not return any error messages before the completion of restoring the session state. When the UE retransmits the Bye messages, the session is terminated as normal by the CSCF, which takes over the session state.
IV. EVALUATION
A. Model of Experiment
Our proposed system aims to reduce the number of backup servers. The number of CSCFs treated by the single backup server increases as the number of backup servers decreases. In the case that the process for saving session state congests in the backup server, the slow responses from the backup server to the CSCF affects the completion time of the SIP signaling call flow. We define the queuing delay as the duration taken by the backup servers to finish the process for
54Copyright (c) The Government of Japan, 2011. Used by permission to IARIA. ISBN: 978-1-61208-174-8
EMERGING 2011 : The Third International Conference on Emerging Network Intelligence
61 / 141
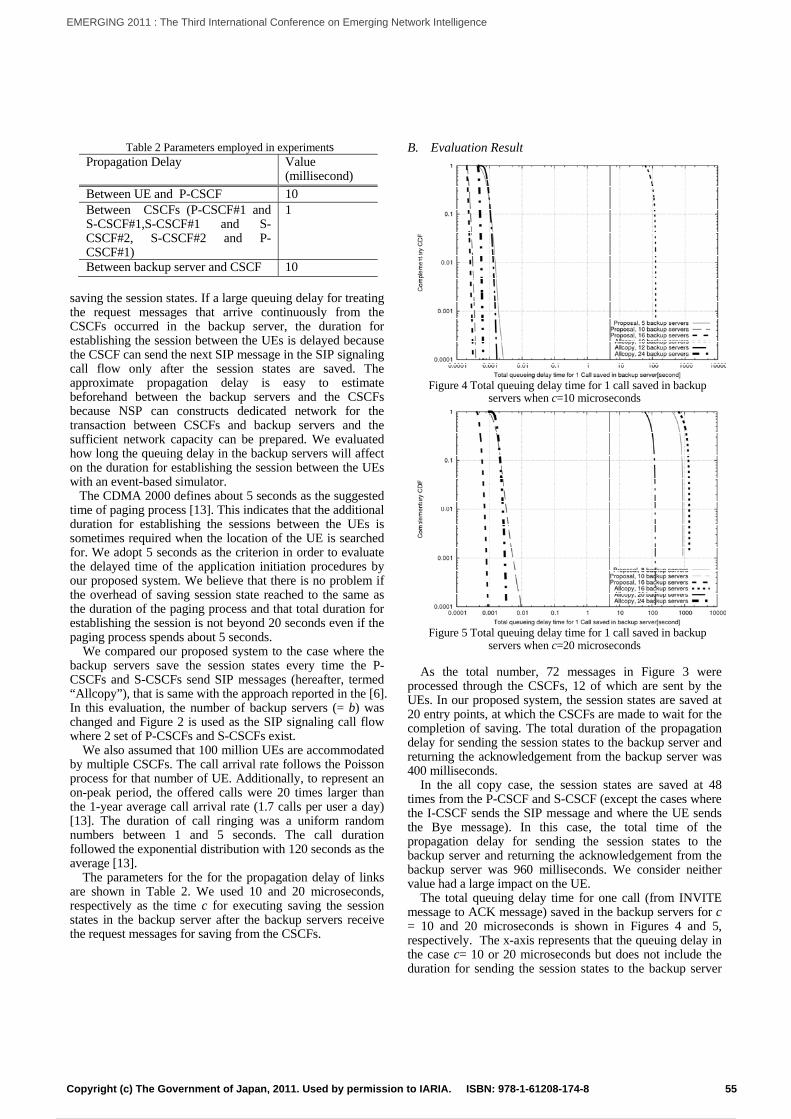
Table 2 Parameters employed in experiments Propagation Delay Value
(millisecond)
Between UE and P-CSCF 10 Between CSCFs (P-CSCF#1 and S-CSCF#1,S-CSCF#1 and S-CSCF#2, S-CSCF#2 and P-CSCF#1)
1
Between backup server and CSCF 10 saving the session states. If a large queuing delay for treating the request messages that arrive continuously from the CSCFs occurred in the backup server, the duration for establishing the session between the UEs is delayed because the CSCF can send the next SIP message in the SIP signaling call flow only after the session states are saved. The approximate propagation delay is easy to estimate beforehand between the backup servers and the CSCFs because NSP can constructs dedicated network for the transaction between CSCFs and backup servers and the sufficient network capacity can be prepared. We evaluated how long the queuing delay in the backup servers will affect on the duration for establishing the session between the UEs with an event-based simulator. The CDMA 2000 defines about 5 seconds as the suggested time of paging process [13]. This indicates that the additional duration for establishing the sessions between the UEs is sometimes required when the location of the UE is searched for. We adopt 5 seconds as the criterion in order to evaluate the delayed time of the application initiation procedures by our proposed system. We believe that there is no problem if the overhead of saving session state reached to the same as the duration of the paging process and that total duration for establishing the session is not beyond 20 seconds even if the paging process spends about 5 seconds.
We compared our proposed system to the case where the backup servers save the session states every time the P-CSCFs and S-CSCFs send SIP messages (hereafter, termed “Allcopy”), that is same with the approach reported in the [6]. In this evaluation, the number of backup servers (= b) was changed and Figure 2 is used as the SIP signaling call flow where 2 set of P-CSCFs and S-CSCFs exist.
We also assumed that 100 million UEs are accommodated by multiple CSCFs. The call arrival rate follows the Poisson process for that number of UE. Additionally, to represent an on-peak period, the offered calls were 20 times larger than the 1-year average call arrival rate (1.7 calls per user a day) [13]. The duration of call ringing was a uniform random numbers between 1 and 5 seconds. The call duration followed the exponential distribution with 120 seconds as the average [13].
The parameters for the for the propagation delay of links are shown in Table 2. We used 10 and 20 microseconds, respectively as the time c for executing saving the session states in the backup server after the backup servers receive the request messages for saving from the CSCFs.
B. Evaluation Result
Figure 4 Total queuing delay time for 1 call saved in backup
servers when c=10 microseconds
Figure 5 Total queuing delay time for 1 call saved in backup
servers when c=20 microseconds
As the total number, 72 messages in Figure 3 were processed through the CSCFs, 12 of which are sent by the UEs. In our proposed system, the session states are saved at 20 entry points, at which the CSCFs are made to wait for the completion of saving. The total duration of the propagation delay for sending the session states to the backup server and returning the acknowledgement from the backup server was 400 milliseconds.
In the all copy case, the session states are saved at 48 times from the P-CSCF and S-CSCF (except the cases where the I-CSCF sends the SIP message and where the UE sends the Bye message). In this case, the total time of the propagation delay for sending the session states to the backup server and returning the acknowledgement from the backup server was 960 milliseconds. We consider neither value had a large impact on the UE.
The total queuing delay time for one call (from INVITE message to ACK message) saved in the backup servers for c = 10 and 20 microseconds is shown in Figures 4 and 5, respectively. The x-axis represents that the queuing delay in the case c= 10 or 20 microseconds but does not include the duration for sending the session states to the backup server
55Copyright (c) The Government of Japan, 2011. Used by permission to IARIA. ISBN: 978-1-61208-174-8
EMERGING 2011 : The Third International Conference on Emerging Network Intelligence
62 / 141
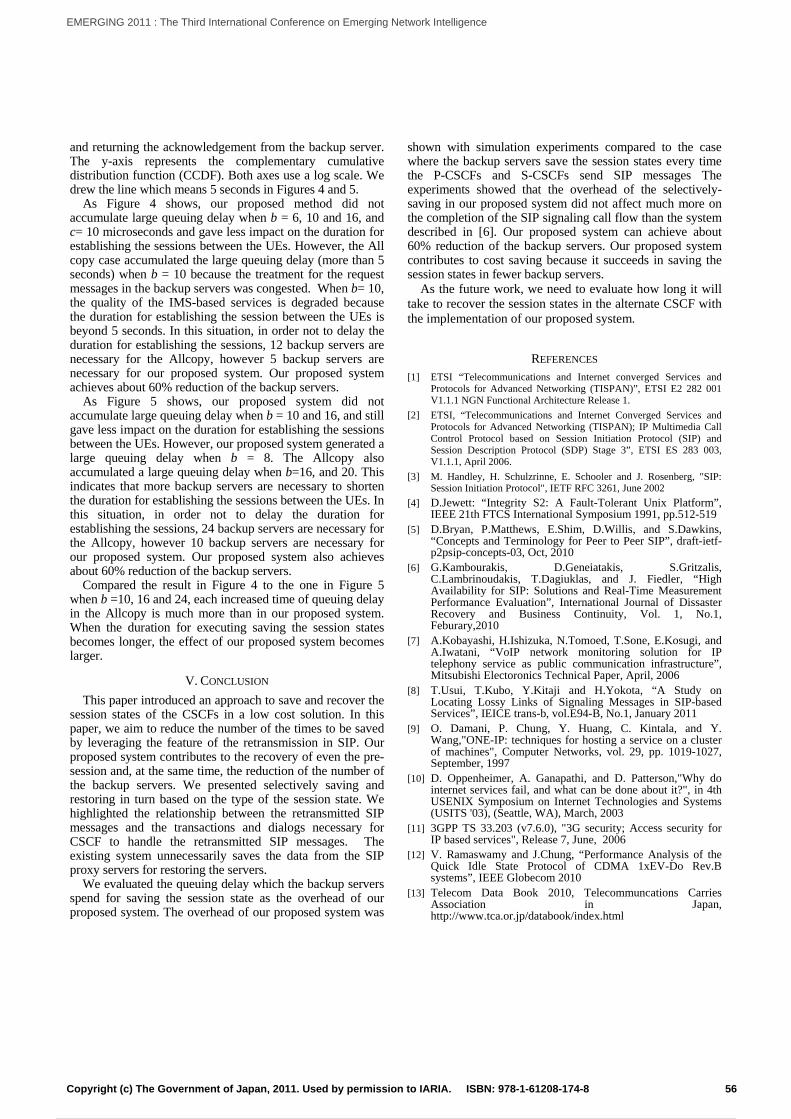
and returning the acknowledgement from the backup server. The y-axis represents the complementary cumulative distribution function (CCDF). Both axes use a log scale. We drew the line which means 5 seconds in Figures 4 and 5.
As Figure 4 shows, our proposed method did not accumulate large queuing delay when b = 6, 10 and 16, and c= 10 microseconds and gave less impact on the duration for establishing the sessions between the UEs. However, the All copy case accumulated the large queuing delay (more than 5 seconds) when b = 10 because the treatment for the request messages in the backup servers was congested. When b= 10, the quality of the IMS-based services is degraded because the duration for establishing the session between the UEs is beyond 5 seconds. In this situation, in order not to delay the duration for establishing the sessions, 12 backup servers are necessary for the Allcopy, however 5 backup servers are necessary for our proposed system. Our proposed system achieves about 60% reduction of the backup servers.
As Figure 5 shows, our proposed system did not accumulate large queuing delay when b = 10 and 16, and still gave less impact on the duration for establishing the sessions between the UEs. However, our proposed system generated a large queuing delay when b = 8. The Allcopy also accumulated a large queuing delay when b=16, and 20. This indicates that more backup servers are necessary to shorten the duration for establishing the sessions between the UEs. In this situation, in order not to delay the duration for establishing the sessions, 24 backup servers are necessary for the Allcopy, however 10 backup servers are necessary for our proposed system. Our proposed system also achieves about 60% reduction of the backup servers.
Compared the result in Figure 4 to the one in Figure 5 when b =10, 16 and 24, each increased time of queuing delay in the Allcopy is much more than in our proposed system. When the duration for executing saving the session states becomes longer, the effect of our proposed system becomes larger.
V. CONCLUSION
This paper introduced an approach to save and recover the session states of the CSCFs in a low cost solution. In this paper, we aim to reduce the number of the times to be saved by leveraging the feature of the retransmission in SIP. Our proposed system contributes to the recovery of even the pre-session and, at the same time, the reduction of the number of the backup servers. We presented selectively saving and restoring in turn based on the type of the session state. We highlighted the relationship between the retransmitted SIP messages and the transactions and dialogs necessary for CSCF to handle the retransmitted SIP messages. The existing system unnecessarily saves the data from the SIP proxy servers for restoring the servers.
We evaluated the queuing delay which the backup servers spend for saving the session state as the overhead of our proposed system. The overhead of our proposed system was
shown with simulation experiments compared to the case where the backup servers save the session states every time the P-CSCFs and S-CSCFs send SIP messages The experiments showed that the overhead of the selectively-saving in our proposed system did not affect much more on the completion of the SIP signaling call flow than the system described in [6]. Our proposed system can achieve about 60% reduction of the backup servers. Our proposed system contributes to cost saving because it succeeds in saving the session states in fewer backup servers.
As the future work, we need to evaluate how long it will take to recover the session states in the alternate CSCF with the implementation of our proposed system.
REFERENCES [1] ETSI “Telecommunications and Internet converged Services and
Protocols for Advanced Networking (TISPAN)”, ETSI E2 282 001 V1.1.1 NGN Functional Architecture Release 1.
[2] ETSI, “Telecommunications and Internet Converged Services and Protocols for Advanced Networking (TISPAN); IP Multimedia Call Control Protocol based on Session Initiation Protocol (SIP) and Session Description Protocol (SDP) Stage 3”, ETSI ES 283 003, V1.1.1, April 2006.
[3] M. Handley, H. Schulzrinne, E. Schooler and J. Rosenberg, "SIP: Session Initiation Protocol", IETF RFC 3261, June 2002
[4] D.Jewett: “Integrity S2: A Fault-Tolerant Unix Platform”, IEEE 21th FTCS International Symposium 1991, pp.512-519
[5] D.Bryan, P.Matthews, E.Shim, D.Willis, and S.Dawkins, “Concepts and Terminology for Peer to Peer SIP”, draft-ietf-p2psip-concepts-03, Oct, 2010
[6] G.Kambourakis, D.Geneiatakis, S.Gritzalis, C.Lambrinoudakis, T.Dagiuklas, and J. Fiedler, “High Availability for SIP: Solutions and Real-Time Measurement Performance Evaluation”, International Journal of Dissaster Recovery and Business Continuity, Vol. 1, No.1, Feburary,2010
[7] A.Kobayashi, H.Ishizuka, N.Tomoed, T.Sone, E.Kosugi, and A.Iwatani, “VoIP network monitoring solution for IP telephony service as public communication infrastructure”, Mitsubishi Electoronics Technical Paper, April, 2006
[8] T.Usui, T.Kubo, Y.Kitaji and H.Yokota, “A Study on Locating Lossy Links of Signaling Messages in SIP-based Services”, IEICE trans-b, vol.E94-B, No.1, January 2011
[9] O. Damani, P. Chung, Y. Huang, C. Kintala, and Y. Wang,"ONE-IP: techniques for hosting a service on a cluster of machines", Computer Networks, vol. 29, pp. 1019-1027, September, 1997
[10] D. Oppenheimer, A. Ganapathi, and D. Patterson,"Why do internet services fail, and what can be done about it?", in 4th USENIX Symposium on Internet Technologies and Systems (USITS '03), (Seattle, WA), March, 2003
[11] 3GPP TS 33.203 (v7.6.0), "3G security; Access security for IP based services", Release 7, June, 2006
[12] V. Ramaswamy and J.Chung, “Performance Analysis of the Quick Idle State Protocol of CDMA 1xEV-Do Rev.B systems”, IEEE Globecom 2010
[13] Telecom Data Book 2010, Telecommuncations Carries Association in Japan, http://www.tca.or.jp/databook/index.html
56Copyright (c) The Government of Japan, 2011. Used by permission to IARIA. ISBN: 978-1-61208-174-8
EMERGING 2011 : The Third International Conference on Emerging Network Intelligence
63 / 141
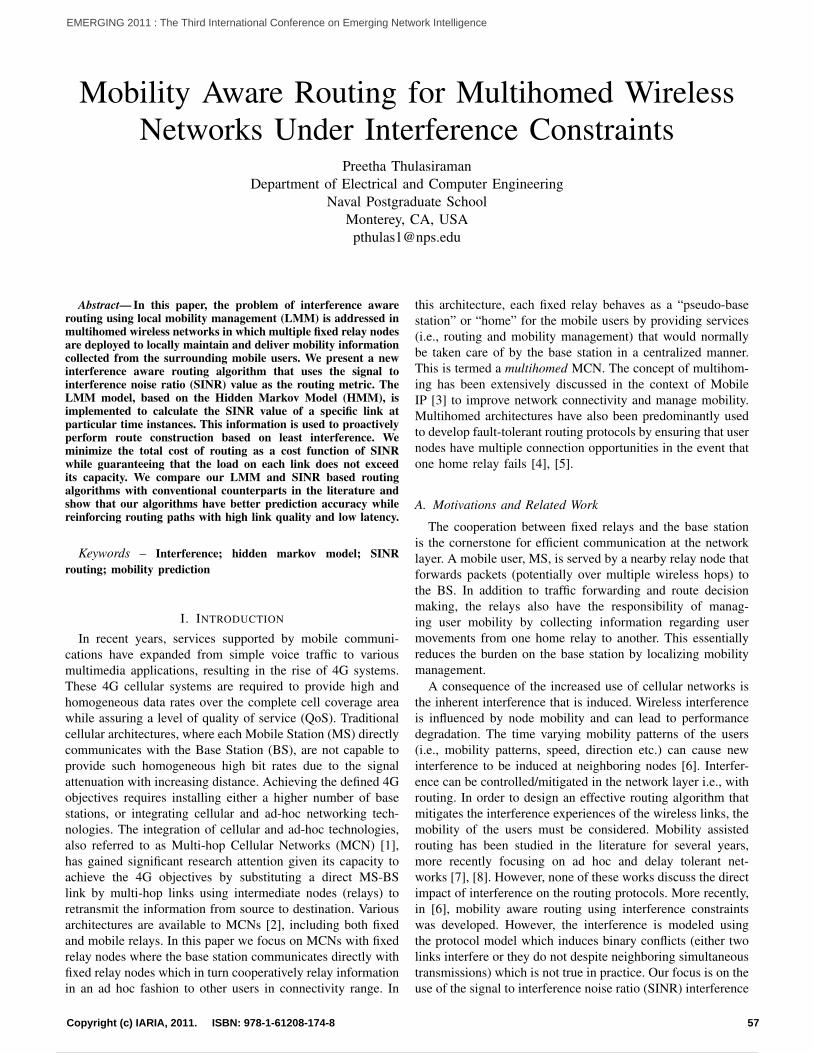
Mobility Aware Routing for Multihomed WirelessNetworks Under Interference Constraints
Preetha ThulasiramanDepartment of Electrical and Computer Engineering
Naval Postgraduate SchoolMonterey, CA, USA
Abstract— In this paper, the problem of interference awarerouting using local mobility management (LMM) is addressed inmultihomed wireless networks in which multiple fixed relay nodesare deployed to locally maintain and deliver mobility informationcollected from the surrounding mobile users. We present a newinterference aware routing algorithm that uses the signal tointerference noise ratio (SINR) value as the routing metric. TheLMM model, based on the Hidden Markov Model (HMM), isimplemented to calculate the SINR value of a specific link atparticular time instances. This information is used to proactivelyperform route construction based on least interference. Weminimize the total cost of routing as a cost function of SINRwhile guaranteeing that the load on each link does not exceedits capacity. We compare our LMM and SINR based routingalgorithms with conventional counterparts in the literature andshow that our algorithms have better prediction accuracy whilereinforcing routing paths with high link quality and low latency.
Keywords – Interference; hidden markov model; SINRrouting; mobility prediction
I. INTRODUCTION
In recent years, services supported by mobile communi-cations have expanded from simple voice traffic to variousmultimedia applications, resulting in the rise of 4G systems.These 4G cellular systems are required to provide high andhomogeneous data rates over the complete cell coverage areawhile assuring a level of quality of service (QoS). Traditionalcellular architectures, where each Mobile Station (MS) directlycommunicates with the Base Station (BS), are not capable toprovide such homogeneous high bit rates due to the signalattenuation with increasing distance. Achieving the defined 4Gobjectives requires installing either a higher number of basestations, or integrating cellular and ad-hoc networking tech-nologies. The integration of cellular and ad-hoc technologies,also referred to as Multi-hop Cellular Networks (MCN) [1],has gained significant research attention given its capacity toachieve the 4G objectives by substituting a direct MS-BSlink by multi-hop links using intermediate nodes (relays) toretransmit the information from source to destination. Variousarchitectures are available to MCNs [2], including both fixedand mobile relays. In this paper we focus on MCNs with fixedrelay nodes where the base station communicates directly withfixed relay nodes which in turn cooperatively relay informationin an ad hoc fashion to other users in connectivity range. In
this architecture, each fixed relay behaves as a “pseudo-basestation” or “home” for the mobile users by providing services(i.e., routing and mobility management) that would normallybe taken care of by the base station in a centralized manner.This is termed a multihomed MCN. The concept of multihom-ing has been extensively discussed in the context of MobileIP [3] to improve network connectivity and manage mobility.Multihomed architectures have also been predominantly usedto develop fault-tolerant routing protocols by ensuring that usernodes have multiple connection opportunities in the event thatone home relay fails [4], [5].
A. Motivations and Related Work
The cooperation between fixed relays and the base stationis the cornerstone for efficient communication at the networklayer. A mobile user, MS, is served by a nearby relay node thatforwards packets (potentially over multiple wireless hops) tothe BS. In addition to traffic forwarding and route decisionmaking, the relays also have the responsibility of manag-ing user mobility by collecting information regarding usermovements from one home relay to another. This essentiallyreduces the burden on the base station by localizing mobilitymanagement.
A consequence of the increased use of cellular networks isthe inherent interference that is induced. Wireless interferenceis influenced by node mobility and can lead to performancedegradation. The time varying mobility patterns of the users(i.e., mobility patterns, speed, direction etc.) can cause newinterference to be induced at neighboring nodes [6]. Interfer-ence can be controlled/mitigated in the network layer i.e., withrouting. In order to design an effective routing algorithm thatmitigates the interference experiences of the wireless links, themobility of the users must be considered. Mobility assistedrouting has been studied in the literature for several years,more recently focusing on ad hoc and delay tolerant net-works [7], [8]. However, none of these works discuss the directimpact of interference on the routing protocols. More recently,in [6], mobility aware routing using interference constraintswas developed. However, the interference is modeled usingthe protocol model which induces binary conflicts (either twolinks interfere or they do not despite neighboring simultaneoustransmissions) which is not true in practice. Our focus is on theuse of the signal to interference noise ratio (SINR) interference
57Copyright (c) IARIA, 2011. ISBN: 978-1-61208-174-8
EMERGING 2011 : The Third International Conference on Emerging Network Intelligence
64 / 141
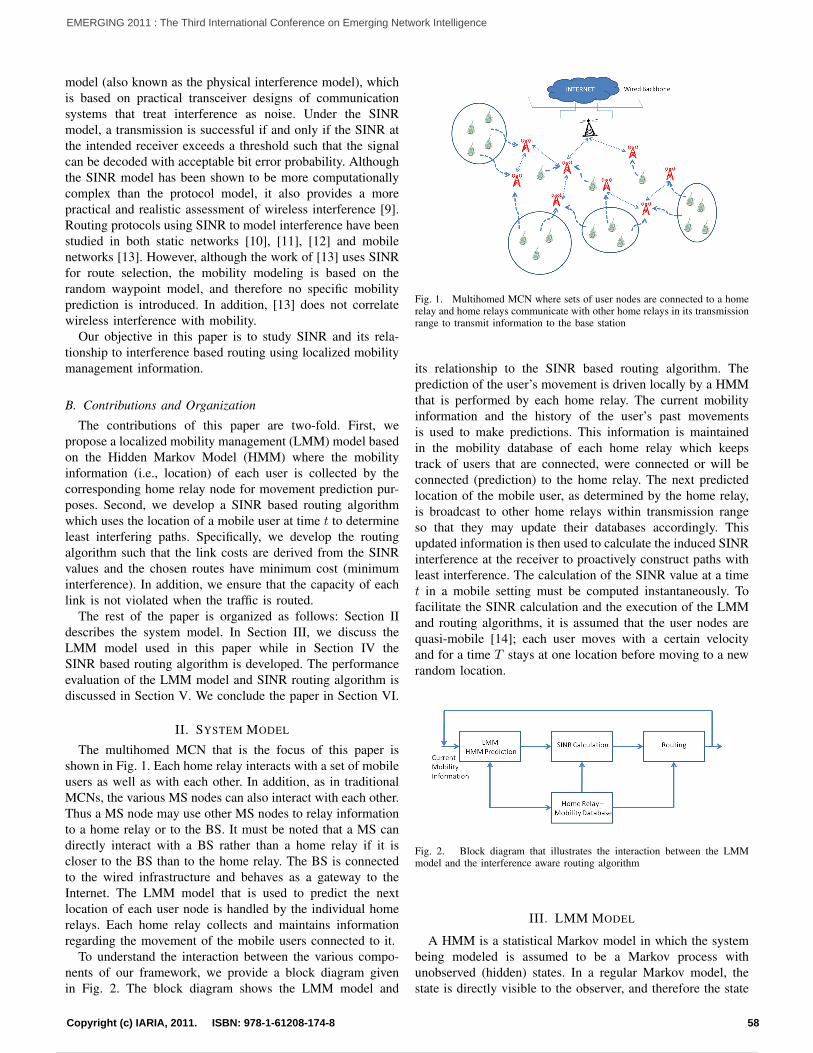
model (also known as the physical interference model), whichis based on practical transceiver designs of communicationsystems that treat interference as noise. Under the SINRmodel, a transmission is successful if and only if the SINR atthe intended receiver exceeds a threshold such that the signalcan be decoded with acceptable bit error probability. Althoughthe SINR model has been shown to be more computationallycomplex than the protocol model, it also provides a morepractical and realistic assessment of wireless interference [9].Routing protocols using SINR to model interference have beenstudied in both static networks [10], [11], [12] and mobilenetworks [13]. However, although the work of [13] uses SINRfor route selection, the mobility modeling is based on therandom waypoint model, and therefore no specific mobilityprediction is introduced. In addition, [13] does not correlatewireless interference with mobility.
Our objective in this paper is to study SINR and its rela-tionship to interference based routing using localized mobilitymanagement information.
B. Contributions and Organization
The contributions of this paper are two-fold. First, wepropose a localized mobility management (LMM) model basedon the Hidden Markov Model (HMM) where the mobilityinformation (i.e., location) of each user is collected by thecorresponding home relay node for movement prediction pur-poses. Second, we develop a SINR based routing algorithmwhich uses the location of a mobile user at time t to determineleast interfering paths. Specifically, we develop the routingalgorithm such that the link costs are derived from the SINRvalues and the chosen routes have minimum cost (minimuminterference). In addition, we ensure that the capacity of eachlink is not violated when the traffic is routed.
The rest of the paper is organized as follows: Section IIdescribes the system model. In Section III, we discuss theLMM model used in this paper while in Section IV theSINR based routing algorithm is developed. The performanceevaluation of the LMM model and SINR routing algorithm isdiscussed in Section V. We conclude the paper in Section VI.
II. SYSTEM MODEL
The multihomed MCN that is the focus of this paper isshown in Fig. 1. Each home relay interacts with a set of mobileusers as well as with each other. In addition, as in traditionalMCNs, the various MS nodes can also interact with each other.Thus a MS node may use other MS nodes to relay informationto a home relay or to the BS. It must be noted that a MS candirectly interact with a BS rather than a home relay if it iscloser to the BS than to the home relay. The BS is connectedto the wired infrastructure and behaves as a gateway to theInternet. The LMM model that is used to predict the nextlocation of each user node is handled by the individual homerelays. Each home relay collects and maintains informationregarding the movement of the mobile users connected to it.
To understand the interaction between the various compo-nents of our framework, we provide a block diagram givenin Fig. 2. The block diagram shows the LMM model and
Fig. 1. Multihomed MCN where sets of user nodes are connected to a homerelay and home relays communicate with other home relays in its transmissionrange to transmit information to the base station
its relationship to the SINR based routing algorithm. Theprediction of the user’s movement is driven locally by a HMMthat is performed by each home relay. The current mobilityinformation and the history of the user’s past movementsis used to make predictions. This information is maintainedin the mobility database of each home relay which keepstrack of users that are connected, were connected or will beconnected (prediction) to the home relay. The next predictedlocation of the mobile user, as determined by the home relay,is broadcast to other home relays within transmission rangeso that they may update their databases accordingly. Thisupdated information is then used to calculate the induced SINRinterference at the receiver to proactively construct paths withleast interference. The calculation of the SINR value at a timet in a mobile setting must be computed instantaneously. Tofacilitate the SINR calculation and the execution of the LMMand routing algorithms, it is assumed that the user nodes arequasi-mobile [14]; each user moves with a certain velocityand for a time T stays at one location before moving to a newrandom location.
Fig. 2. Block diagram that illustrates the interaction between the LMMmodel and the interference aware routing algorithm
III. LMM MODEL
A HMM is a statistical Markov model in which the systembeing modeled is assumed to be a Markov process withunobserved (hidden) states. In a regular Markov model, thestate is directly visible to the observer, and therefore the state
58Copyright (c) IARIA, 2011. ISBN: 978-1-61208-174-8
EMERGING 2011 : The Third International Conference on Emerging Network Intelligence
65 / 141
transition probabilities are the only parameters. In a hiddenMarkov model, the state is not directly visible, but output,dependent on the state, is visible. A HMM has two kindsof stochastic variables: state variables (hidden variable) andthe output variables (observable variable). A HMM can bedefined as follows:S : s1s2...sN are the N hidden states of the systemO : o1o2...oN are the values of the observed sequencesΠ : π is the initial state probabilities. πi indicates theprobability of starting in state iA = aij are the state transition probabilities where aijdenotes the probability of moving from state i to j
aij = P (tk = sj |tk−1 = si)
B = bik are the observation state probabilities where bik isthe probability of emitting symbol k at state i
bik = P (ok|tk = sj)
The 3-tuple (A,B, π) provides a complete specification ofthe HMM for the system considered in this paper.
A. Mobility Model Using HMM
To track the state of a mobile user we apply two approaches:1) forward-backward algorithm and 2) re-estimation algorithmfor the HMM parameters discussed above. The main steps ofthe tracking algorithm can be summarized as follows:
1) Apply HMM re-estimation algorithm to obtain initialestimates of (A,B, π) of the HMM.
2) Apply the HMM forward-backward estimation algo-rithm to predict at time t the next state of a user.
3) Obtain refined estimates of (A,B, π) by again applyingthe HMM re-estimation algorithm to the given observa-tion sequences.
These steps are performed at each home relay node duringeach observation interval. We define the observation intervalas the time intervals during which observations (mobilityinformation is collected) occur. The observation interval isassumed to be segmented into T subintervals indexed by1, 2, ..., T . T is defined as the time during which the mobileuser remains stationary. Thus, the time during which the noderemains stationary is the predicted state of the mobile networkin the HMM.
1) Forward-Backward Algorithm: A forward-backwardalgorithm is an algorithm for computing the probability ofa particular observation sequence in the context of hiddenMarkov models [15]. The algorithm first computes a setof forward probabilities which provide the probability ofobserving the first k observations in the sequence and endingin each of the possible Markov model states. The algorithmalso computes a set of backward probabilities which providethe probability of observing the remaining observations givenan initial state. For our model, we define the followingforward and backward variables:
Forward variables:αt(n) = P [ot1, state n sojourn ends at t], t ≥ 1
α∗t (n) = P [ot1, state n sojourn begins at t+ 1], t ≥ 1
Backward variables:βt(n) = P [oTt |sojourn in state n begins at t], t ≤ Tβ∗t (n) = P [oTt |sojourn in state n ends at t− 1 t ≤ T
The forward variables are then computed inductively fort = 1, 2, ..., T . Similarly, the backward variables are computedinductively for t = T, T−1, ..., 1. After computing the forwardand backward variables, a state estimate can be found. Let usdefine,
γt(n) = P [oT1 ; st = n]
as the probability that s is observed to be in state n at time t.Then the estimate of st is given by
st = arg max1≤n≤Nγt(n)
P [oT1 ], t = T, T − 1, ..., 1
2) Re-estimation Algorithm: A simple iterative procedurefor re-estimating the HMM parameters each time a nodemoves is reported in [15] and implemented in this paper.
IV. SINR BASED ROUTING USING LMM MODEL
This section will discuss the formulation of the SINRrouting algorithm using the developed LMM model.
A. Challenge of Routing with Interference and Mobility
Using the LMM model based on the HMM, we are ableto track the movement of the users to determine which relayit is connected to. Interference depends on the existence ofother sources/intermediate relays and their spatial separation.Thus the routing decision of a given source-BS pair becomescoupled to the routing decision of other source-BS pairs. Todetermine appropriate routing paths from the relay to the BSthat are cognizant of interference, we use SINR as a routingmetric.
B. Problem Formulation
For our analysis, we model the multihomed MCN as agraph, G(V,E), where V is the set of nodes (relays, mobileusers and base station inclusive) and E is the set of links.Let VN be the set of mobile users and let VM be the set ofhome relays. Note that the network has only one base station.The successful reception of a packet depends on the receivedsignal strength, the interference caused by the simultaneouslytransmitting nodes, and the ambient noise level η. The SINRof a link (i, j) is given as follows
SINRij =Pj(i)
η +∑
k∈V ′ Pj(k)≥ β (1)
where Pj(i) is the received power at node j due to node i,V ′ is the subset of nodes in the network that are transmittingsimultaneously, and β is the SINR threshold. Our proposedrouting protocol is implemented to route data using the leastinterfering path out of all path possibilities. If a link has ahigh SINR, it is an indication that it is experiencing lowinterference.
59Copyright (c) IARIA, 2011. ISBN: 978-1-61208-174-8
EMERGING 2011 : The Third International Conference on Emerging Network Intelligence
66 / 141
Each link (i, j) has an associated cost which is derivedfrom the SINR value calculation. Each link also has anassociated capacity denoted uij . The capacity is formulatedusing Shannon’s formula, given in Eq.2.
uij = log2(1 + SINRij) (2)
In addition, the flow of packets from node i to its neighborj over wireless link (i, j) is represented by fij .
C. SINR Based Routing
The position of each user node at time t affects the cumu-lative SINR on each link. The SINR is also affected by thepath loss model and channel gain. The SINR at time t on link(i, j) is given by Eq.3,
SINR(t)ij =GijPj(i)(t)
η +∑
k∈V ′ GkjPj(k)(t)≥ β (3)
where Gij is the channel gain on link (i, j) (in the simulations,the channel gain of each link is calculated using a Rayleighfading model and an appropriate path loss factor), Pj(i)(t) isthe received power at node j due to node i at time t, and k is asimultaneously transmitting node. The corresponding capacityuij is then modified to be
uij(t) = log2(1 + SINRij(t)) (4)
The SINR is calculated during each observation interval, t ∈T .
In order to determine the least cost (least interfering) paths,we use the minimum cost flow optimization technique. Inour case, the cost of a link is motivated by the amount ofinterference on that link due to neighboring transmissionsand/or noise. As we are using SINR as the routing metric,the higher the SINR, the better the link quality. Therefore, wewant to minimize the inverse of the SINR value.
The objective of the SINR routing problem is to deliver allthe data packets generated by the user nodes to the base stationin the most cost-effective (least interfering) manner withoutexceeding the link capacities. Formally, the problem can bestated as follows.
minimize∑
(i,j)∈E
SINR(t)−1fij(t) (5)
subject to∑j:(i,j)∈E
fij(t)−∑
j:(j,i)∈E
fji(t) = di(t),∀i ∈ VN (6)
∑k:k∈VM∪BS
(∑
j:(k,j)∈E
fkj(t)−∑
j:(j,k)∈E
fjk(t)) = −∑
i:i∈VN
di(t)
(7)0 ≤ fij(t) ≤ uij(t) (8)
In the above formulation, di represents the rate at which thedata packets are generated at user node i per unit time. The firstconstraint (Eq. 6) ensures flow conservation at each node. Thesecond constraint (Eq. 7) ensures that the base station receivesall the packets generated by all the nodes. The flow of packetson a link must not exceed its capacity and this is ensured bythe third constraint (Eq. 8).
1) Solution: The above defined problem is similar to theminimum-cost flow problem, known in the operations researchliterature [16]. We will convert the above problem into theminimum-cost circulation problem as follows.
1) Add a super source x, and a super base station node y,to the graph G(V,E).
2) Add directed links (x, i), connecting the super source xto node i, for all i ∈ VM ∪ VN . Set costs of these linksto 0 and the capacities to di.
3) Add directed links (j, y) connecting the base station andrelay nodes to the super base station y. Set costs of theselinks to 0 and the capacities to infinity.
4) Add a directed link (y, x) connecting the super basestation y to the super source x. Set the cost of the link(y, x) to −|V |β and the capacity to infinity, where β isthe minimum of any link cost (lower bound of SINR).
5) The modified graph is defined as G′(V ∪x, y, E∪E′),where E′ = (x, i) : i ∈ VN∪(j, y) : j ∈ VM∪BS∪(y, x).
2) Analysis of the Solution: Pushing more flow from x toy will decrease the overall cost of the flow due to the factthat the link from y back to x has sufficiently large negativecost. It is clear that the maximum flow is bounded from aboveby F = d1 + d2 + ... + d|VN | because F is the maximumpossible flow going out of x, the super source. There are twopossibilities that have to be analyzed.
Case 1:∑
i:i∈VNfxi =
∑i:i∈VN
diIn this case, all the links of the form (x, i), i ∈ VN are
saturated. The maximum-flow is restricted by the capacitiesof these links. Consider a link (x, 1) having the capacity d1.Since all the (x, i) links are saturated, the input flow at node1 must be d1 +
∑j:(j,1)∈E fj1 and the output flow must be
equal to the input flow (flow conservation). There must bepaths from node 1 to base stations which carry the flow d1 +∑
j:(j,1)∈E fj1. The same argument holds for other nodes.Case 2:
∑i:i∈VN
fxi <∑
i:i∈VNdi
In this case the maximum flow is restricted by the capacitieson the actual links ((i, j) ∈ A) of the network. The minimumcost flow algorithm will identify the paths from the user node ito the base stations which carry the flow d′i where 0 ≤ d′i ≤ di,∀i ∈ VN . The flow on the links (x, i) would be d′i, ∀i ∈ VN .
V. PERFORMANCE EVALUATION
We first evaluate the LMM model separately to gauge itseffectiveness in prediction accuracy. The initial parameters ofthe HMM are randomly generated using a uniform distribution(the number and locations of users and relays, relay-userassociations and the initial transition probabilities are ran-domly generated). Once the users begin to move, its movementhistory is tracked and stored in the databases of each homerelay for prediction.
We evaluate the SINR based routing algorithm using thefollowing performance metrics: packet delivery ratio and end-to-end delay. We use NS-2 to simulate our evaluations and useCPLEX to solve the optimization formulation for the minimumcost SINR based routing algorithm.
The simulation environment is based on a 2250m x 2250mManhattan type scenario, emulated with the NS-2 software
60Copyright (c) IARIA, 2011. ISBN: 978-1-61208-174-8
EMERGING 2011 : The Third International Conference on Emerging Network Intelligence
67 / 141
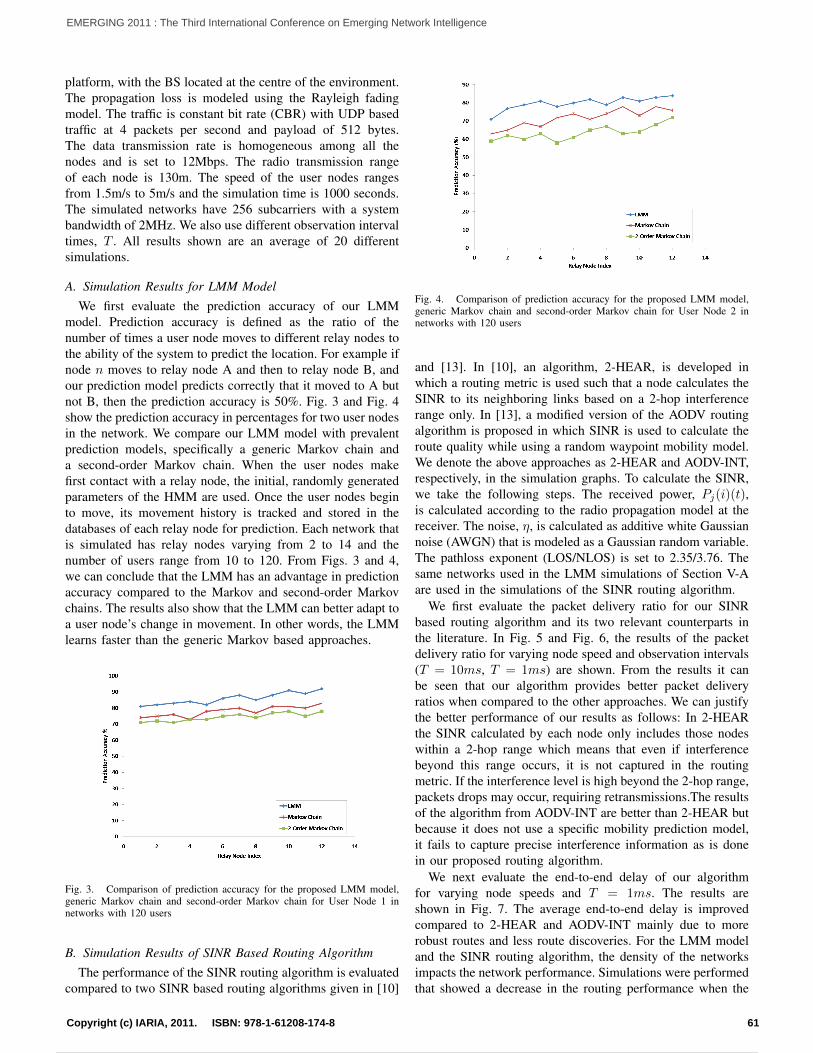
platform, with the BS located at the centre of the environment.The propagation loss is modeled using the Rayleigh fadingmodel. The traffic is constant bit rate (CBR) with UDP basedtraffic at 4 packets per second and payload of 512 bytes.The data transmission rate is homogeneous among all thenodes and is set to 12Mbps. The radio transmission rangeof each node is 130m. The speed of the user nodes rangesfrom 1.5m/s to 5m/s and the simulation time is 1000 seconds.The simulated networks have 256 subcarriers with a systembandwidth of 2MHz. We also use different observation intervaltimes, T . All results shown are an average of 20 differentsimulations.
A. Simulation Results for LMM ModelWe first evaluate the prediction accuracy of our LMM
model. Prediction accuracy is defined as the ratio of thenumber of times a user node moves to different relay nodes tothe ability of the system to predict the location. For example ifnode n moves to relay node A and then to relay node B, andour prediction model predicts correctly that it moved to A butnot B, then the prediction accuracy is 50%. Fig. 3 and Fig. 4show the prediction accuracy in percentages for two user nodesin the network. We compare our LMM model with prevalentprediction models, specifically a generic Markov chain anda second-order Markov chain. When the user nodes makefirst contact with a relay node, the initial, randomly generatedparameters of the HMM are used. Once the user nodes beginto move, its movement history is tracked and stored in thedatabases of each relay node for prediction. Each network thatis simulated has relay nodes varying from 2 to 14 and thenumber of users range from 10 to 120. From Figs. 3 and 4,we can conclude that the LMM has an advantage in predictionaccuracy compared to the Markov and second-order Markovchains. The results also show that the LMM can better adapt toa user node’s change in movement. In other words, the LMMlearns faster than the generic Markov based approaches.
Fig. 3. Comparison of prediction accuracy for the proposed LMM model,generic Markov chain and second-order Markov chain for User Node 1 innetworks with 120 users
B. Simulation Results of SINR Based Routing AlgorithmThe performance of the SINR routing algorithm is evaluated
compared to two SINR based routing algorithms given in [10]
Fig. 4. Comparison of prediction accuracy for the proposed LMM model,generic Markov chain and second-order Markov chain for User Node 2 innetworks with 120 users
and [13]. In [10], an algorithm, 2-HEAR, is developed inwhich a routing metric is used such that a node calculates theSINR to its neighboring links based on a 2-hop interferencerange only. In [13], a modified version of the AODV routingalgorithm is proposed in which SINR is used to calculate theroute quality while using a random waypoint mobility model.We denote the above approaches as 2-HEAR and AODV-INT,respectively, in the simulation graphs. To calculate the SINR,we take the following steps. The received power, Pj(i)(t),is calculated according to the radio propagation model at thereceiver. The noise, η, is calculated as additive white Gaussiannoise (AWGN) that is modeled as a Gaussian random variable.The pathloss exponent (LOS/NLOS) is set to 2.35/3.76. Thesame networks used in the LMM simulations of Section V-Aare used in the simulations of the SINR routing algorithm.
We first evaluate the packet delivery ratio for our SINRbased routing algorithm and its two relevant counterparts inthe literature. In Fig. 5 and Fig. 6, the results of the packetdelivery ratio for varying node speed and observation intervals(T = 10ms, T = 1ms) are shown. From the results it canbe seen that our algorithm provides better packet deliveryratios when compared to the other approaches. We can justifythe better performance of our results as follows: In 2-HEARthe SINR calculated by each node only includes those nodeswithin a 2-hop range which means that even if interferencebeyond this range occurs, it is not captured in the routingmetric. If the interference level is high beyond the 2-hop range,packets drops may occur, requiring retransmissions.The resultsof the algorithm from AODV-INT are better than 2-HEAR butbecause it does not use a specific mobility prediction model,it fails to capture precise interference information as is donein our proposed routing algorithm.
We next evaluate the end-to-end delay of our algorithmfor varying node speeds and T = 1ms. The results areshown in Fig. 7. The average end-to-end delay is improvedcompared to 2-HEAR and AODV-INT mainly due to morerobust routes and less route discoveries. For the LMM modeland the SINR routing algorithm, the density of the networksimpacts the network performance. Simulations were performedthat showed a decrease in the routing performance when the
61Copyright (c) IARIA, 2011. ISBN: 978-1-61208-174-8
EMERGING 2011 : The Third International Conference on Emerging Network Intelligence
68 / 141
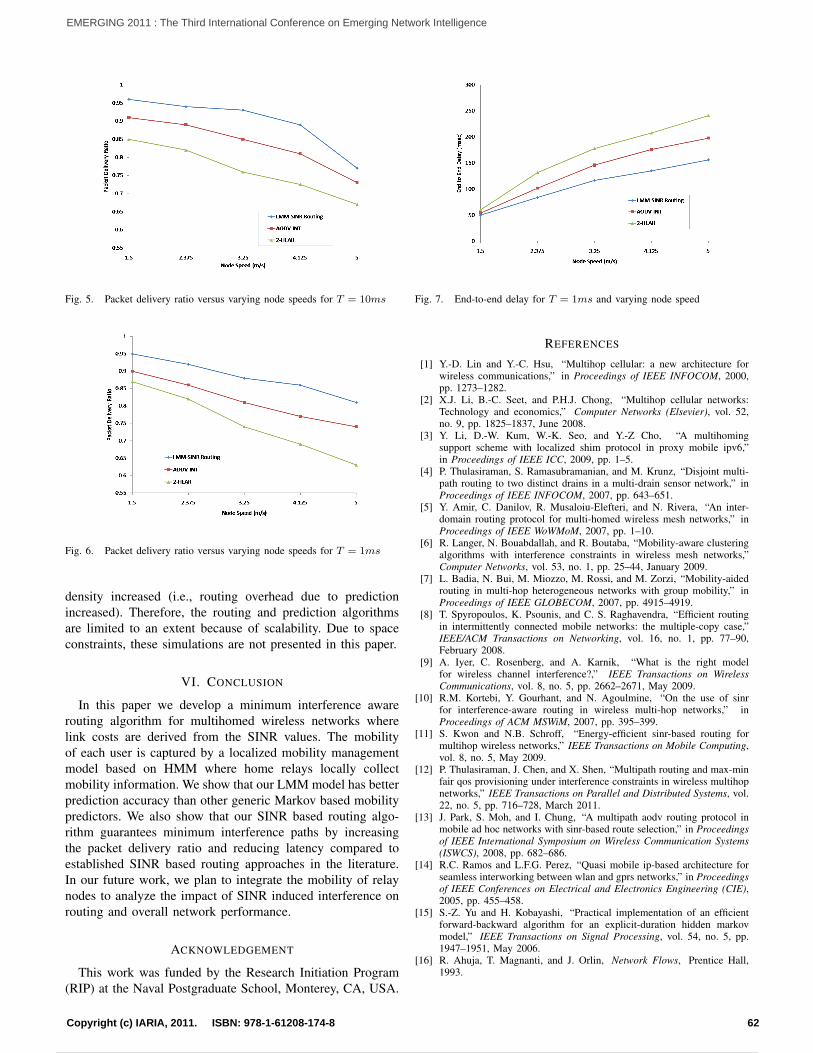
Fig. 5. Packet delivery ratio versus varying node speeds for T = 10ms
Fig. 6. Packet delivery ratio versus varying node speeds for T = 1ms
density increased (i.e., routing overhead due to predictionincreased). Therefore, the routing and prediction algorithmsare limited to an extent because of scalability. Due to spaceconstraints, these simulations are not presented in this paper.
VI. CONCLUSION
In this paper we develop a minimum interference awarerouting algorithm for multihomed wireless networks wherelink costs are derived from the SINR values. The mobilityof each user is captured by a localized mobility managementmodel based on HMM where home relays locally collectmobility information. We show that our LMM model has betterprediction accuracy than other generic Markov based mobilitypredictors. We also show that our SINR based routing algo-rithm guarantees minimum interference paths by increasingthe packet delivery ratio and reducing latency compared toestablished SINR based routing approaches in the literature.In our future work, we plan to integrate the mobility of relaynodes to analyze the impact of SINR induced interference onrouting and overall network performance.
ACKNOWLEDGEMENT
This work was funded by the Research Initiation Program(RIP) at the Naval Postgraduate School, Monterey, CA, USA.
Fig. 7. End-to-end delay for T = 1ms and varying node speed
REFERENCES
[1] Y.-D. Lin and Y.-C. Hsu, “Multihop cellular: a new architecture forwireless communications,” in Proceedings of IEEE INFOCOM, 2000,pp. 1273–1282.
[2] X.J. Li, B.-C. Seet, and P.H.J. Chong, “Multihop cellular networks:Technology and economics,” Computer Networks (Elsevier), vol. 52,no. 9, pp. 1825–1837, June 2008.
[3] Y. Li, D.-W. Kum, W.-K. Seo, and Y.-Z Cho, “A multihomingsupport scheme with localized shim protocol in proxy mobile ipv6,”in Proceedings of IEEE ICC, 2009, pp. 1–5.
[4] P. Thulasiraman, S. Ramasubramanian, and M. Krunz, “Disjoint multi-path routing to two distinct drains in a multi-drain sensor network,” inProceedings of IEEE INFOCOM, 2007, pp. 643–651.
[5] Y. Amir, C. Danilov, R. Musaloiu-Elefteri, and N. Rivera, “An inter-domain routing protocol for multi-homed wireless mesh networks,” inProceedings of IEEE WoWMoM, 2007, pp. 1–10.
[6] R. Langer, N. Bouabdallah, and R. Boutaba, “Mobility-aware clusteringalgorithms with interference constraints in wireless mesh networks,”Computer Networks, vol. 53, no. 1, pp. 25–44, January 2009.
[7] L. Badia, N. Bui, M. Miozzo, M. Rossi, and M. Zorzi, “Mobility-aidedrouting in multi-hop heterogeneous networks with group mobility,” inProceedings of IEEE GLOBECOM, 2007, pp. 4915–4919.
[8] T. Spyropoulos, K. Psounis, and C. S. Raghavendra, “Efficient routingin intermittently connected mobile networks: the multiple-copy case,”IEEE/ACM Transactions on Networking, vol. 16, no. 1, pp. 77–90,February 2008.
[9] A. Iyer, C. Rosenberg, and A. Karnik, “What is the right modelfor wireless channel interference?,” IEEE Transactions on WirelessCommunications, vol. 8, no. 5, pp. 2662–2671, May 2009.
[10] R.M. Kortebi, Y. Gourhant, and N. Agoulmine, “On the use of sinrfor interference-aware routing in wireless multi-hop networks,” inProceedings of ACM MSWiM, 2007, pp. 395–399.
[11] S. Kwon and N.B. Schroff, “Energy-efficient sinr-based routing formultihop wireless networks,” IEEE Transactions on Mobile Computing,vol. 8, no. 5, May 2009.
[12] P. Thulasiraman, J. Chen, and X. Shen, “Multipath routing and max-minfair qos provisioning under interference constraints in wireless multihopnetworks,” IEEE Transactions on Parallel and Distributed Systems, vol.22, no. 5, pp. 716–728, March 2011.
[13] J. Park, S. Moh, and I. Chung, “A multipath aodv routing protocol inmobile ad hoc networks with sinr-based route selection,” in Proceedingsof IEEE International Symposium on Wireless Communication Systems(ISWCS), 2008, pp. 682–686.
[14] R.C. Ramos and L.F.G. Perez, “Quasi mobile ip-based architecture forseamless interworking between wlan and gprs networks,” in Proceedingsof IEEE Conferences on Electrical and Electronics Engineering (CIE),2005, pp. 455–458.
[15] S.-Z. Yu and H. Kobayashi, “Practical implementation of an efficientforward-backward algorithm for an explicit-duration hidden markovmodel,” IEEE Transactions on Signal Processing, vol. 54, no. 5, pp.1947–1951, May 2006.
[16] R. Ahuja, T. Magnanti, and J. Orlin, Network Flows, Prentice Hall,1993.
62Copyright (c) IARIA, 2011. ISBN: 978-1-61208-174-8
EMERGING 2011 : The Third International Conference on Emerging Network Intelligence
69 / 141
Priority-based Packet Scheduling in Internet Protocol Television
Mehmet Deniz Demirci
Computer Science Department Istanbul University İstanbul, Turkey
e-mail:[email protected]
Abdul Halim Zaim
Institute of Science and Engineering Istanbul Commerce University
Istanbul, Turkey e-mail:[email protected]
Abstract—Techniques to provide the quality of service for policing and scheduling IPTV are discussed (Weighted Fair Queuing and Alpha-Beta Virtual Clock). Also, a new scheduling algorithm is proposed for prioritized services over IPTV. Simulation results for the proposed algorithm is presented. In the proposed algorithm, the amount of packets that belongs each of the five priority classes is broadcast to every switcher. A series of estimated values is obtained by calculating the status of the amount of received packets. Then, these estimation values are used to calculate the credit of each packet received. Switcher selects the appropriate packet to forward to the next switcher by its credit value. The results are discussed as epilogue with objective comments.
Keywords-IPTV; Priority; Scheduling; QoS; Class of Service; Priority Class
I. INTRODUCTION
Internet Protocol Television known as IPTV consists of several services that provide triple play entertainment. IPTV has 3 different services like television broadcasting, voice over IP [1] (Internet Protocol; RFC791 [2]) and data services bundled together to the subscribers. Providing all of these services at the same time to the subscribers is still a big challenge for researchers all around the world.
In IPTV, there have to be more than one types of
packets. If one tries to transmit a real-time live soccer match with normal best-effort traffic then the packets belonging to the match’s flow will suffer severe packet loss, delay and jitter.
Packet loss, delay and jitter are the most important
aspects of Quality of Service (QoS). That influence the performance and Quality of Experience (QoE) received by the subscriber.
In multimedia streams, packet loss between 1% to
20%, and end-to-end delays until 100 ms are optimum but delays between 100 ms to even 1000 ms (with additional set top box buffering) are acceptable [3]. So, that traffic
scheduling for IPTV must respect the difference of class for all kinds of triple-play packets.
The main challenge in IPTV implementation is distributing fairly the resources to each class of service. The Internet, is a best effort service which is neutral with respect to different services. The goal of this work is adjusting the flow of multi-serviced packets in terms of QoS.
Even though IP is a best effort service, the end-to-end
delay and jitter are reduced using the proposed algorithm. In Section 2, how the services are classified is
presented. In Section 3, the proposed algorithm is compared to other work. In Section 4, the details of the proposed algorithm are given. In Section 5, the results, and in Section 6, the conclusion, are shown, respectively.
II. CLASSIFICATION OF SERVICES
IPTV packets can be grouped into five priority classes shown as in Figure 1. Priority class 1 is the real time video broadcasting, i.e. a live Champions League Match. This is the most important class of service because a live stream never stops and every seconds count. Priority class 2 is video on demand (VoD) an IPTV class of service which means, a multi million dollar budget new movie is rented by the user and sometimes user stops or pauses the movie even rewind or forward. Voice over IP applications such as internet telephony, belong to Priority Class 3. Best effort services such as web surfing, e-mail or ftp are members of the priority class 4. The last one is the priority class 5 that possess the signalization data. The importance of the class of services is given in descending order.
63Copyright (c) IARIA, 2011. ISBN: 978-1-61208-174-8
EMERGING 2011 : The Third International Conference on Emerging Network Intelligence
70 / 141
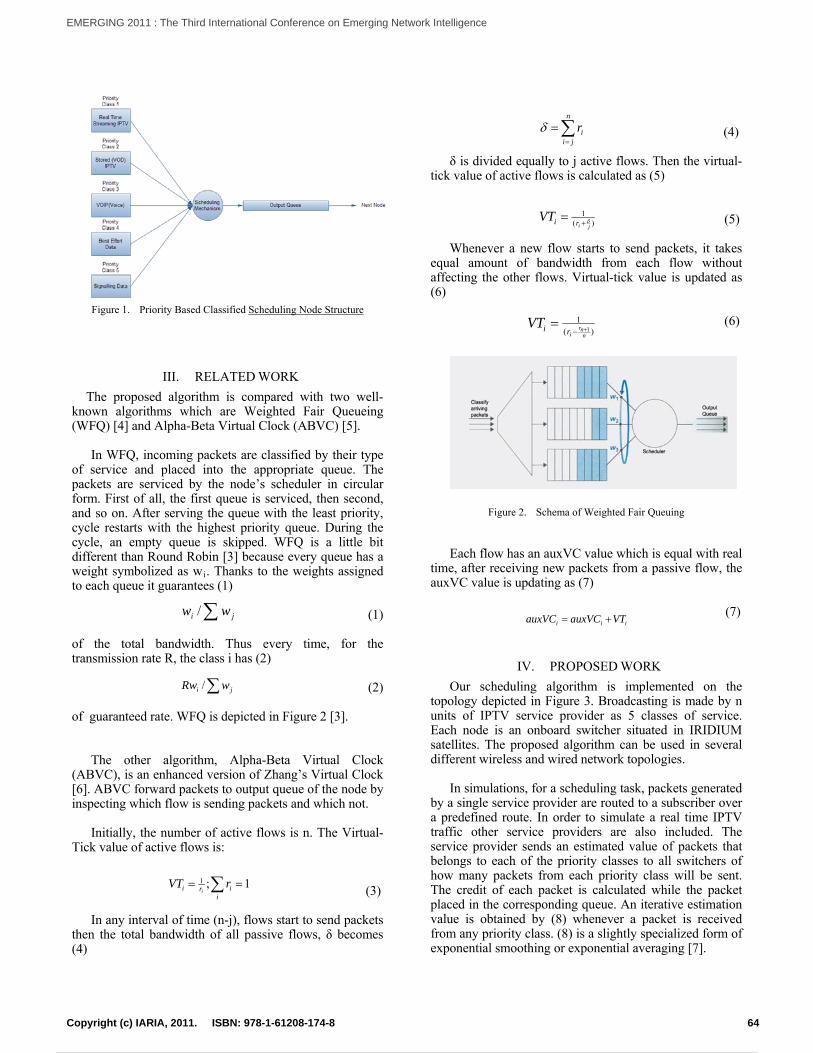
Figure 1. Priority Based Classified Scheduling Node Structure
III. RELATED WORK
The proposed algorithm is compared with two well-known algorithms which are Weighted Fair Queueing (WFQ) [4] and Alpha-Beta Virtual Clock (ABVC) [5].
In WFQ, incoming packets are classified by their type
of service and placed into the appropriate queue. The packets are serviced by the node’s scheduler in circular form. First of all, the first queue is serviced, then second, and so on. After serving the queue with the least priority, cycle restarts with the highest priority queue. During the cycle, an empty queue is skipped. WFQ is a little bit different than Round Robin [3] because every queue has a weight symbolized as wi. Thanks to the weights assigned to each queue it guarantees (1)
(1)
of the total bandwidth. Thus every time, for the transmission rate R, the class i has (2)
(2)
of guaranteed rate. WFQ is depicted in Figure 2 [3]. The other algorithm, Alpha-Beta Virtual Clock
(ABVC), is an enhanced version of Zhang’s Virtual Clock [6]. ABVC forward packets to output queue of the node by inspecting which flow is sending packets and which not.
Initially, the number of active flows is n. The Virtual-
Tick value of active flows is: (3) In any interval of time (n-j), flows start to send packets
then the total bandwidth of all passive flows, δ becomes (4)
(4)
n
ji δ is divided equally to j active flows. Then the virtual-
tick value of active flows is calculated as (5)
(5) Whenever a new flow starts to send packets, it takes
equal amount of bandwidth from each flow without affecting the other flows. Virtual-tick value is updated as (6)
(6)
Figure 2. Schema of Weighted Fair Queuing
Each flow has an auxVC value which is equal with real
time, after receiving new packets from a passive flow, the auxVC value is updating as (7)
(7)
IV. PROPOSED WORK
Our scheduling algorithm is implemented on the topology depicted in Figure 3. Broadcasting is made by n units of IPTV service provider as 5 classes of service. Each node is an onboard switcher situated in IRIDIUM satellites. The proposed algorithm can be used in several different wireless and wired network topologies.
In simulations, for a scheduling task, packets generated
by a single service provider are routed to a subscriber over a predefined route. In order to simulate a real time IPTV traffic other service providers are also included. The service provider sends an estimated value of packets that belongs to each of the priority classes to all switchers of how many packets from each priority class will be sent. The credit of each packet is calculated while the packet placed in the corresponding queue. An iterative estimation value is obtained by (8) whenever a packet is received from any priority class. (8) is a slightly specialized form of exponential smoothing or exponential averaging [7].
1;1 i
VT
ir
)(1
i jriVT
)(
1VT1
nnr
iri
ww /iTauxVC
iri ri
ii VauxVC
wRw / ji
ji
64Copyright (c) IARIA, 2011. ISBN: 978-1-61208-174-8
EMERGING 2011 : The Third International Conference on Emerging Network Intelligence
71 / 141
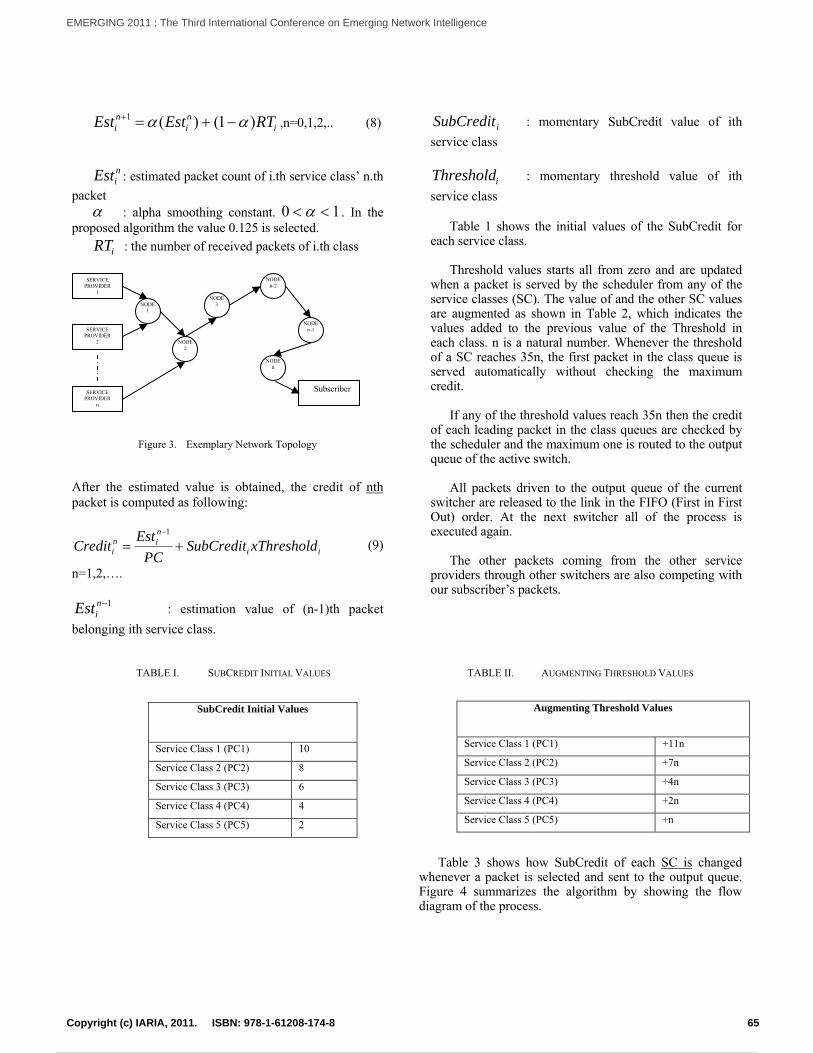
ini
ni RTEstEst )1()(1 ,n=0,1,2,.. (8)
niEst : estimated packet count of i.th service class’ n.th
packet : alpha smoothing constant. 10 . In the
proposed algorithm the value 0.125 is selected.
iRT : the number of received packets of i.th class
iSubCredit : momentary SubCredit value of ith
service class
iThreshold : momentary threshold value of ith
service class
Table 1 shows the initial values of the SubCredit for each service class.
Threshold values starts all from zero and are updated
when a packet is served by the scheduler from any of the service classes (SC). The value of and the other SC values are augmented as shown in Table 2, which indicates the values added to the previous value of the Threshold in each class. n is a natural number. Whenever the threshold of a SC reaches 35n, the first packet in the class queue is served automatically without checking the maximum credit.
Figure 3. Exemplary Network Topology
After the estimated value is obtained, the credit of nth packet is computed as following:
ii
nin
i xThresholdSubCreditPC
EstCredit
1
(9)
n=1,2,….
1n
iEst : estimation value of (n-1)th packet
belonging ith service class.
If any of the threshold values reach 35n then the credit
of each leading packet in the class queues are checked by the scheduler and the maximum one is routed to the output queue of the active switch.
All packets driven to the output queue of the current
switcher are released to the link in the FIFO (First in First Out) order. At the next switcher all of the process is executed again.
The other packets coming from the other service providers through other switchers are also competing with our subscriber’s packets.
TABLE I. SUBCREDIT INITIAL VALUES
SubCredit Initial Values
Service Class 1 (PC1) 10
Service Class 2 (PC2) 8
Service Class 3 (PC3) 6
Service Class 4 (PC4) 4
Service Class 5 (PC5) 2
TABLE II. AUGMENTING THRESHOLD VALUES
Table 3 shows how SubCredit of each SC is changed whenever a packet is selected and sent to the output queue. Figure 4 summarizes the algorithm by showing the flow diagram of the process.
Augmenting Threshold Values
Service Class 1 (PC1) +11n
Service Class 2 (PC2) +7n
Service Class 3 (PC3) +4n
Service Class 4 (PC4) +2n
Service Class 5 (PC5) +n
Subscriber
NOD En-2
SERVICE PROV DER I
1 NODE
3 NODE 1
NOD E
n-1 SERVICE PROV DER I
2 NO E D2
NO E Dn
SERVICE PROV DER I
n
65Copyright (c) IARIA, 2011. ISBN: 978-1-61208-174-8
EMERGING 2011 : The Third International Conference on Emerging Network Intelligence
72 / 141
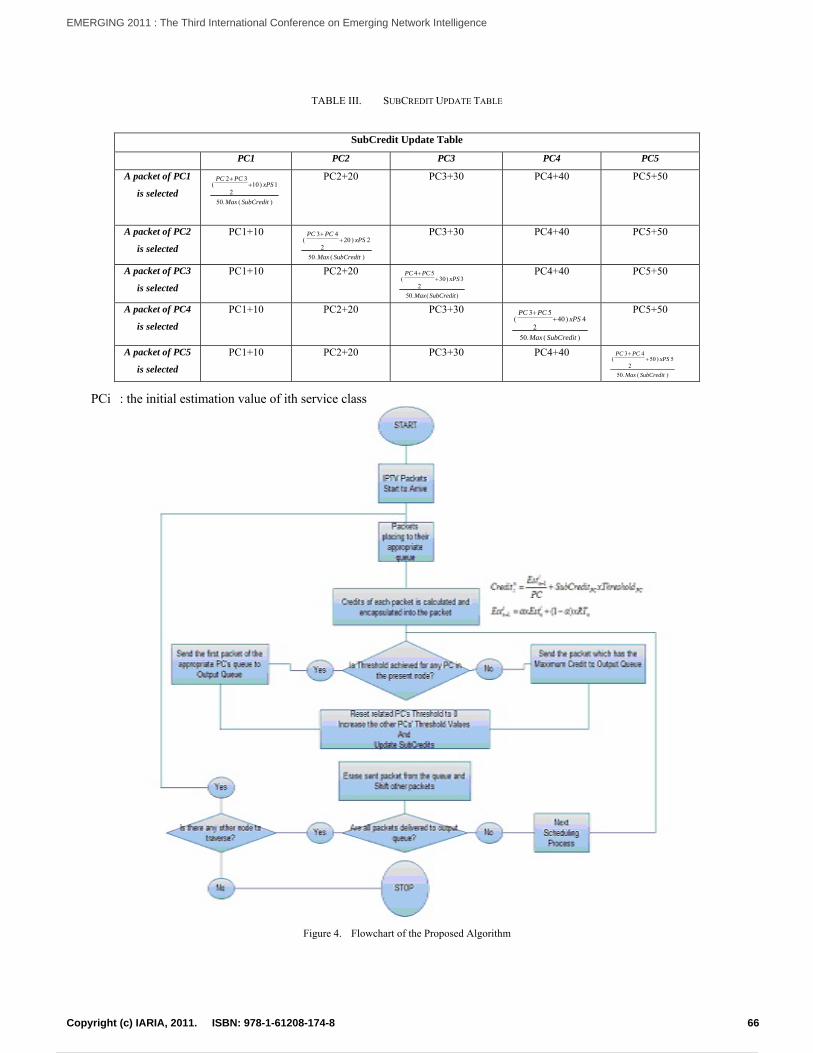
TABLE III. SUBCREDIT UPDATE TABLE
SubCredit Update Table
PC1 PC2 PC3 PC4 PC5
A packet of PC1
is selected )(.50
1)102
32(
SubCreditMax
xPSPCPC
PC2+20 PC3+30 PC4+40 PC5+50
A packet of PC2
is selected
PC1+10
)(.50
2)202
43(
SubCreditMax
xPSPCPC
PC3+30 PC4+40 PC5+50
A packet of PC3
is selected
PC1+10 PC2+20
)(.50
3)302
54(
SubCreditMax
xPSPCPC
PC4+40 PC5+50
A packet of PC4
is selected
PC1+10 PC2+20 PC3+30
)(.50
4)402
53(
SubCreditMax
xPSPCPC
PC5+50
A packet of PC5
is selected
PC1+10 PC2+20 PC3+30 PC4+40
)(.50
5)502
43(
SubCreditMax
xPSPCPC
PCi : the initial estimation value of ith service class
Figure 4. Flowchart of the Proposed Algorithm
66Copyright (c) IARIA, 2011. ISBN: 978-1-61208-174-8
EMERGING 2011 : The Third International Conference on Emerging Network Intelligence
73 / 141
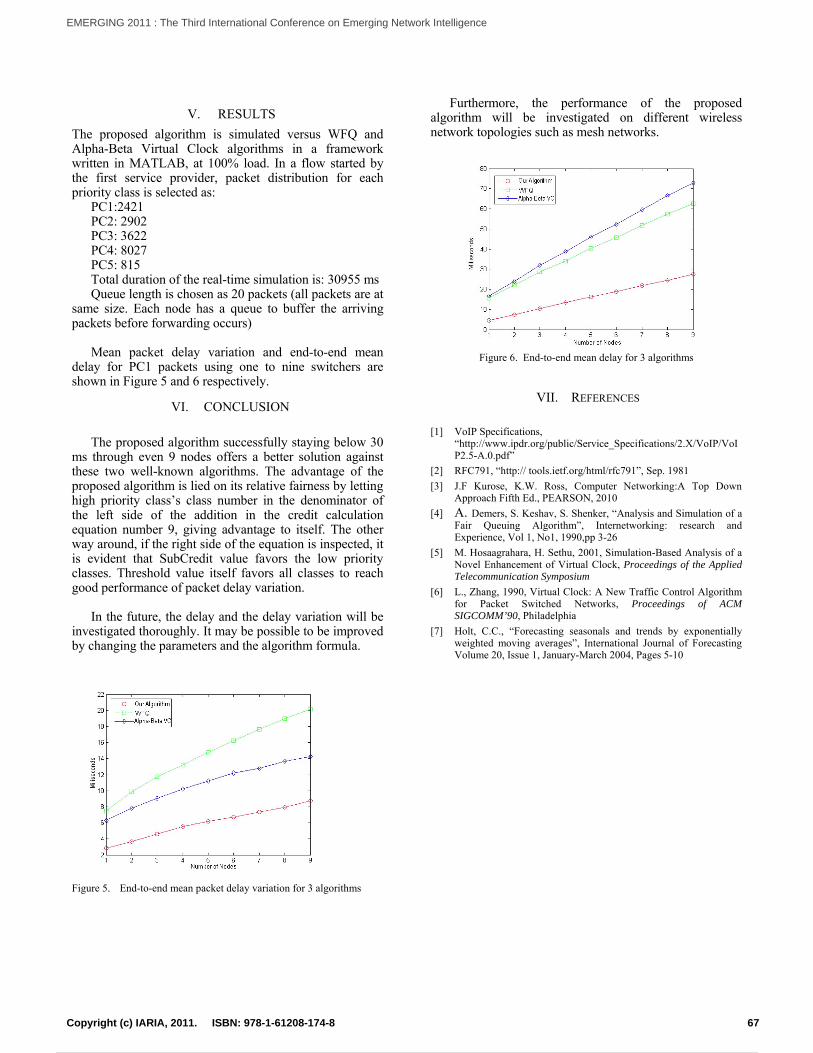
V. RESULTS
The proposed algorithm is simulated versus WFQ and Alpha-Beta Virtual Clock algorithms in a framework written in MATLAB, at 100% load. In a flow started by the first service provider, packet distribution for each priority class is selected as:
PC1:2421 PC2: 2902 PC3: 3622 PC4: 8027 PC5: 815 Total duration of the real-time simulation is: 30955 ms Queue length is chosen as 20 packets (all packets are at
same size. Each node has a queue to buffer the arriving packets before forwarding occurs)
Mean packet delay variation and end-to-end mean
delay for PC1 packets using one to nine switchers are shown in Figure 5 and 6 respectively.
VI. CONCLUSION
The proposed algorithm successfully staying below 30
ms through even 9 nodes offers a better solution against these two well-known algorithms. The advantage of the proposed algorithm is lied on its relative fairness by letting high priority class’s class number in the denominator of the left side of the addition in the credit calculation equation number 9, giving advantage to itself. The other way around, if the right side of the equation is inspected, it is evident that SubCredit value favors the low priority classes. Threshold value itself favors all classes to reach good performance of packet delay variation.
In the future, the delay and the delay variation will be
investigated thoroughly. It may be possible to be improved by changing the parameters and the algorithm formula.
Furthermore, the performance of the proposed algorithm will be investigated on different wireless network topologies such as mesh networks.
Figure 6. End-to-end mean delay for 3 algorithms
VII. REFERENCES
[1] VoIP Specifications,
“http://www.ipdr.org/public/Service_Specifications/2.X/VoIP/VoIP2.5-A.0.pdf”
[2] RFC791, “http:// tools.ietf.org/html/rfc791”, Sep. 1981
[3] J.F Kurose, K.W. Ross, Computer Networking:A Top Down Approach Fifth Ed., PEARSON, 2010
[4] A. Demers, S. Keshav, S. Shenker, “Analysis and Simulation of a Fair Queuing Algorithm”, Internetworking: research and Experience, Vol 1, No1, 1990,pp 3-26
[5] M. Hosaagrahara, H. Sethu, 2001, Simulation-Based Analysis of a Novel Enhancement of Virtual Clock, Proceedings of the Applied Telecommunication Symposium
[6] L., Zhang, 1990, Virtual Clock: A New Traffic Control Algorithm for Packet Switched Networks, Proceedings of ACM SIGCOMM’90, Philadelphia
[7] Holt, C.C., “Forecasting seasonals and trends by exponentially weighted moving averages”, International Journal of Forecasting Volume 20, Issue 1, January-March 2004, Pages 5-10
Figure 5. End-to-end mean packet delay variation for 3 algorithms
67Copyright (c) IARIA, 2011. ISBN: 978-1-61208-174-8
EMERGING 2011 : The Third International Conference on Emerging Network Intelligence
74 / 141
Optical CDMA Using Dual Encoding
with Different Optical Power
Shusaku Hata, Hiroyuki Yashima
Department of Management Science, Faculty of Engineering
Tokyo University of Science
1-3, Kagurazaka, Shinjuku-ku, Tokyo, Japan
E-mail: [email protected], [email protected]
Abstract— In this paper, we propose optical code division
multiple access (CDMA) systems using dual encoding with
different optical power to improve system performance. In
the proposed system, each user has two signature sequences,
and an information bit is modulated by the sequences with
the different power. In the receiver, the received signal is fed
into optical hard limiter (OHL). The reflected signal and the
transmitted signal of OHL are decoded by corresponding
decoders of the sequences, respectively. At each decoder,
correlation between received sequence and an assigned
sequence is calculated and then information bit is detected.
We theoretically derive bit error rate (BER), and show that
our proposed system can significantly improve BER.
Keywords-optical code division multiple access(CDMA);
power control; optical orthogonal codes.
I. INTRODUCTION
Recently, Optical Code Division Multiple Access
(CDMA) systems attract much attention particularly in the
field of fiber optic networks. In optical CDMA systems,
each user is assigned a unique signature sequence to allow
multiple accesses. Information bit is modulated by On-Off
Keying (OOK) signaling, then coded by each encoder,
which has own signature sequence [1]-[13]. Signals of all
users are coupled and send to optical fiber network. At the
receiver, multiplexed signal is fed into a decoder and
correlated with its sequence. When the correlation value is
larger than decision threshold, received bit is determined
as ―1‖, otherwise as ―0.‖ Generally, optical CDMA
systems suffer from multiple access interferences (MAI)
from other simultaneous users. In order to decrease MAI,
signature sequences are constructed so that cross
correlation is small. Optical Orthogonal Code (OOC) with λa = λc = 1 is frequently used, and is discussed on its
construction methods and its property [1]-[5]. Here, λa is
the maximum off-peak of auto correlation, and λc is the
maximum cross correlation. The code length must be long
to improve the BER, but it reduces bit rate. Increasing
weight of sequence also improve the BER, however, the
available number of user decrease. Since OOC with λc = 1
is restricted in the number of sequence for a given code
length, OOC with λc 1 is also discussed to increase the
number of sequence [6].
In order to improve the BER, various methods have
been reported [7]-[9]. In [1], an optical hard limiter (OHL),
where nonlinear optical effect is used for limiting power of
optical signal, is placed at the front of the receiver to
reduce the effect of interference.
On the other hand, optical CDMA systems using
different optical power have been also proposed [10]-[12].
In [11], users are divided into some groups, and each user
uses the optical power level assigned to own group, then
users of different groups can obtain different BER. In
conventional researches, different optical power is used to
achieve different requirement on BER in multimedia
communications or increase the number of user. In this paper, we propose an optical CDMA using dual
encoding with different optical power to improve BER by using two levels of optical power by each user. In the proposed system, each user has two signature sequences, and an information bit is modulated by the two sequences with different power levels. In the receiver, the received signal is passed through OHL, and the reflected signal and the transmitted signal of OHL are decoded by corresponding decoders, respectively. The proposed transmitter and receiver can remove MAI between signals of different power. Since we can increase the weight of sequence without increasing MAI in the same code length, the BER is improved. Moreover, we discuss how to assign two sequences to each user. By using cyclic shifted sequence, we can assign sequences without decreasing the number of user. We also derive BER theoretically, and show the proposed system provides significant performance improvement.
II. SYSTEM DESCRIPTION
Fig. 1 shows a block diagram of the transmitter of the
proposed system. There are N simultaneous users and each
have two encoders that are assigned different sequences.
We use OOC, whose code length and number of weights
are F and k, respectively. Here, the two sequences of user i
is denoted by Ci,1 and Ci,2, respectively. An information
bit is coded by both encoder 1 with Ci,1 and encoder 2
with Ci,2. The output of the encoder 1 and encoder 2 are
modulated by optical power P and 2P, respectively.
68Copyright (c) IARIA, 2011. ISBN: 978-1-61208-174-8
EMERGING 2011 : The Third International Conference on Emerging Network Intelligence
75 / 141
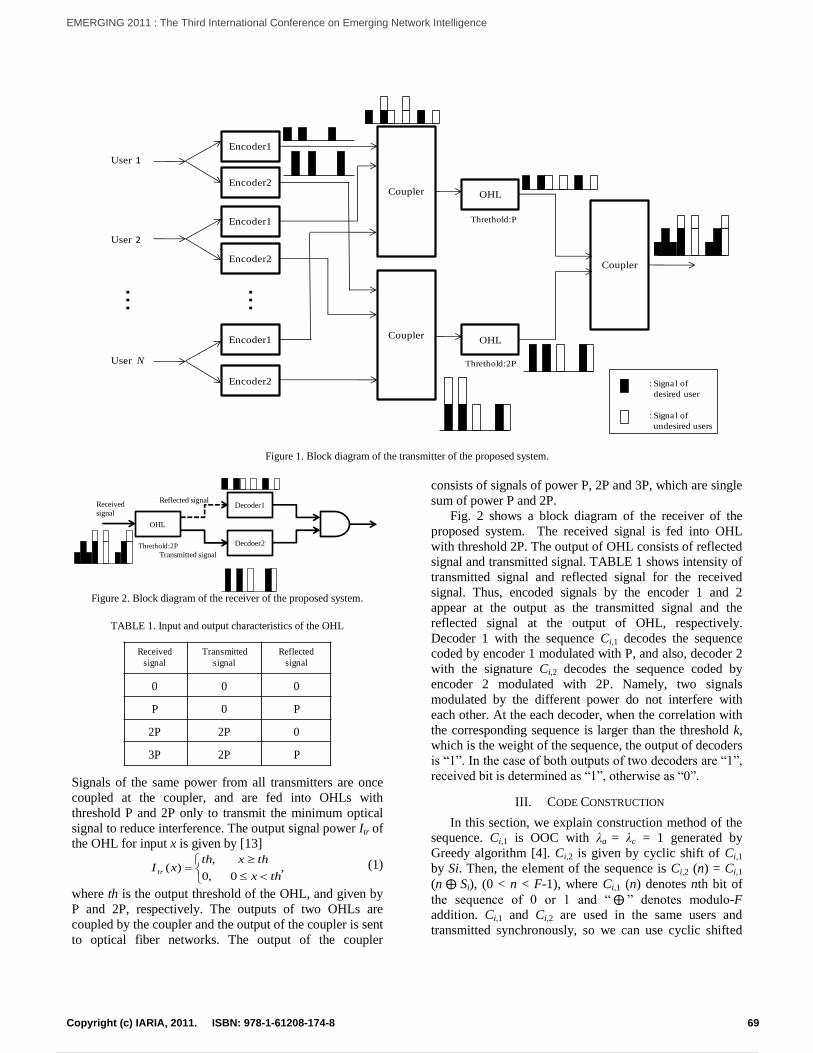
Figure 1. Block diagram of the transmitter of the proposed system.
Figure 2. Block diagram of the receiver of the proposed system.
TABLE 1. Input and output characteristics of the OHL
Signals of the same power from all transmitters are once
coupled at the coupler, and are fed into OHLs with
threshold P and 2P only to transmit the minimum optical
signal to reduce interference. The output signal power Itr of
the OHL for input x is given by [13]
,0 ,0
,)(
thx
thxthxI tr
(1)
where th is the output threshold of the OHL, and given by
P and 2P, respectively. The outputs of two OHLs are
coupled by the coupler and the output of the coupler is sent
to optical fiber networks. The output of the coupler
consists of signals of power P, 2P and 3P, which are single
sum of power P and 2P.
Fig. 2 shows a block diagram of the receiver of the
proposed system. The received signal is fed into OHL
with threshold 2P. The output of OHL consists of reflected
signal and transmitted signal. TABLE 1 shows intensity of
transmitted signal and reflected signal for the received
signal. Thus, encoded signals by the encoder 1 and 2
appear at the output as the transmitted signal and the
reflected signal at the output of OHL, respectively.
Decoder 1 with the sequence Ci,1 decodes the sequence
coded by encoder 1 modulated with P, and also, decoder 2
with the signature Ci,2 decodes the sequence coded by
encoder 2 modulated with 2P. Namely, two signals
modulated by the different power do not interfere with
each other. At the each decoder, when the correlation with
the corresponding sequence is larger than the threshold k,
which is the weight of the sequence, the output of decoders
is ―1‖. In the case of both outputs of two decoders are ―1‖,
received bit is determined as ―1‖, otherwise as ―0‖.
III. CODE CONSTRUCTION
In this section, we explain construction method of the
sequence. Ci,1 is OOC with λa = λc = 1 generated by
Greedy algorithm [4]. Ci,2 is given by cyclic shift of Ci,1
by Si. Then, the element of the sequence is Ci,2 (n) = Ci,1
(n Si), (0 < n < F-1), where Ci,1 (n) denotes nth bit of
the sequence of 0 or 1 and ― ‖ denotes modulo-F
addition. Ci,1 and Ci,2 are used in the same users and
transmitted synchronously, so we can use cyclic shifted
Encoder1
Encoder2Coupler
Coupler
Encoder1
Encoder2
Encoder1
Encoder2
OHL
OHL
Coupler
User 1
User 2
User N
・・・
・・・
Threthold:P
Threthold:2P
: Signal of
desired user
: Signal of
undesired users
Decoder1
Decdoer2
OHL
Transmitted signal
Reflected signalReceived
signal
Threthold:2P
Received
signal
Transmitted
signal
Reflected
signal
0 0 0
P 0 P
2P 2P 0
3P 2P P
69Copyright (c) IARIA, 2011. ISBN: 978-1-61208-174-8
EMERGING 2011 : The Third International Conference on Emerging Network Intelligence
76 / 141
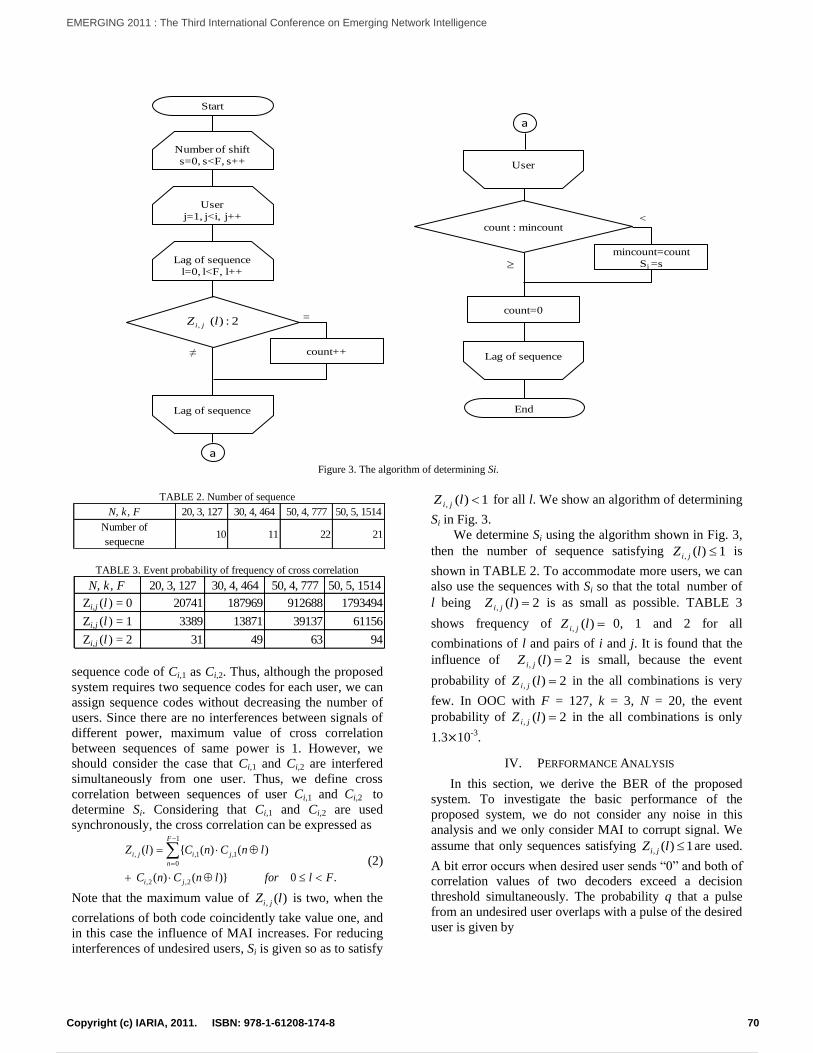
Figure 3. The algorithm of determining Si.
TABLE 2. Number of sequence
TABLE 3. Event probability of frequency of cross correlation
sequence code of Ci,1 as Ci,2. Thus, although the proposed
system requires two sequence codes for each user, we can
assign sequence codes without decreasing the number of
users. Since there are no interferences between signals of
different power, maximum value of cross correlation
between sequences of same power is 1. However, we
should consider the case that Ci,1 and Ci,2 are interfered
simultaneously from one user. Thus, we define cross
correlation between sequences of user Ci,1 and Ci,2 to
determine Si. Considering that Ci,1 and Ci,2 are used
synchronously, the cross correlation can be expressed as
.0)()(
)()()(
2,2,
1
0
1,1,,
FlforlnCnC
lnCnClZ
ji
F
n
jiji
(2)
Note that the maximum value of )(, lZ ji is two, when the
correlations of both code coincidently take value one, and
in this case the influence of MAI increases. For reducing
interferences of undesired users, Si is given so as to satisfy
1)(, lZ ji for all l. We show an algorithm of determining
Si in Fig. 3.
We determine Si using the algorithm shown in Fig. 3,
then the number of sequence satisfying 1)(, lZ ji is
shown in TABLE 2. To accommodate more users, we can
also use the sequences with Si so that the total number of
l being 2)(, lZ ji is as small as possible. TABLE 3
shows frequency of )(, lZ ji 0, 1 and 2 for all
combinations of l and pairs of i and j. It is found that the
influence of 2)(, lZ ji is small, because the event
probability of 2)(, lZ ji in the all combinations is very
few. In OOC with F = 127, k = 3, N = 20, the event
probability of 2)(, lZ ji in the all combinations is only
1.3 10-3
.
IV. PERFORMANCE ANALYSIS
In this section, we derive the BER of the proposed
system. To investigate the basic performance of the
proposed system, we do not consider any noise in this
analysis and we only consider MAI to corrupt signal. We
assume that only sequences satisfying 1)(, lZ ji are used.
A bit error occurs when desired user sends ―0‖ and both of
correlation values of two decoders exceed a decision
threshold simultaneously. The probability q that a pulse
from an undesired user overlaps with a pulse of the desired
user is given by
Number of shift
s=0, s<F, s++
User
j=1, j<i, j++
Lag of sequence
count++
Lag of sequence
l=0, l<F, l++
2:)(, lZ ji=
≠
User
count : mincount
mincount=count
Si =s
count=0
Lag of sequence
<
Start
End
a
a
N, k, F 20, 3, 127 30, 4, 464 50, 4, 777 50, 5, 1514
Number of
sequecne10 11 22 21
N, k, F 20, 3, 127 30, 4, 464 50, 4, 777 50, 5, 1514
Zi,j (l ) = 0 20741 187969 912688 1793494
Zi,j (l ) = 1 3389 13871 39137 61156
Zi,j (l ) = 2 31 49 63 94
70Copyright (c) IARIA, 2011. ISBN: 978-1-61208-174-8
EMERGING 2011 : The Third International Conference on Emerging Network Intelligence
77 / 141
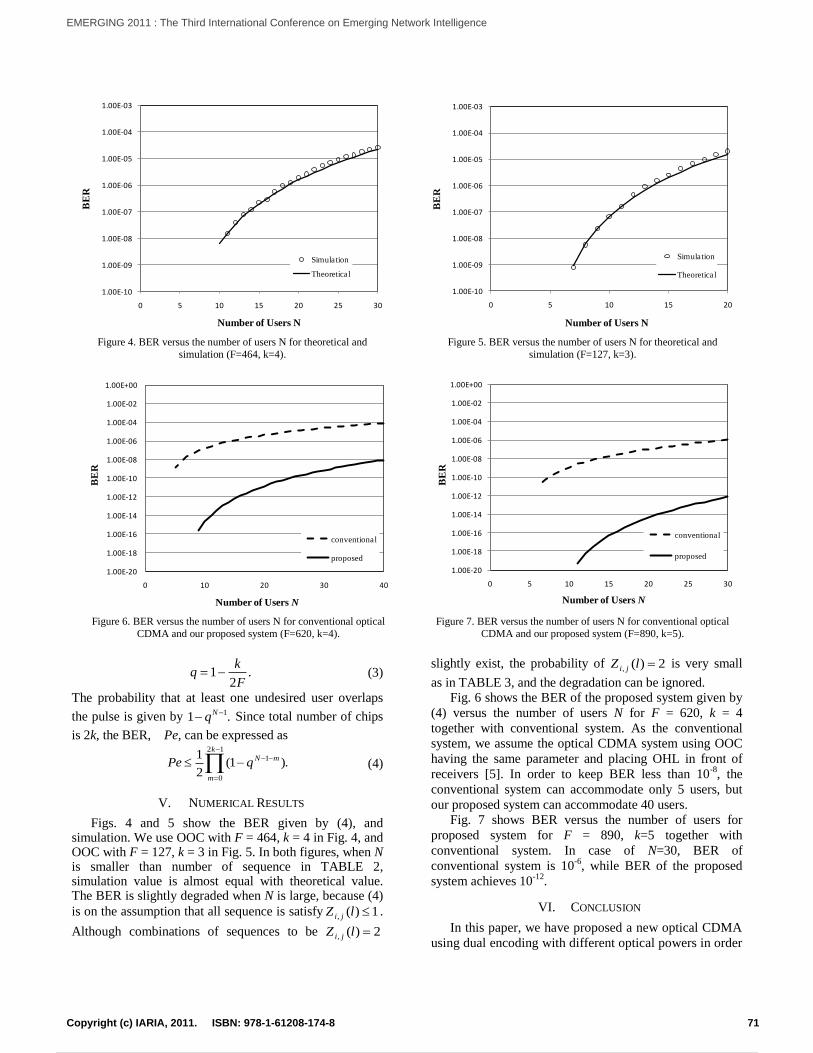
.2
1F
kq (3)
The probability that at least one undesired user overlaps
the pulse is given by .1 1 Nq Since total number of chips
is 2k, the BER, Pe, can be expressed as
.)1(2
112
0
1
k
m
mNqPe (4)
V. NUMERICAL RESULTS
Figs. 4 and 5 show the BER given by (4), and simulation. We use OOC with F = 464, k = 4 in Fig. 4, and OOC with F = 127, k = 3 in Fig. 5. In both figures, when N is smaller than number of sequence in TABLE 2, simulation value is almost equal with theoretical value. The BER is slightly degraded when N is large, because (4)
is on the assumption that all sequence is satisfy 1)(, lZ ji .
Although combinations of sequences to be 2)(, lZ ji
slightly exist, the probability of 2)(, lZ ji is very small
as in TABLE 3, and the degradation can be ignored. Fig. 6 shows the BER of the proposed system given by
(4) versus the number of users N for F = 620, k = 4
together with conventional system. As the conventional
system, we assume the optical CDMA system using OOC
having the same parameter and placing OHL in front of
receivers [5]. In order to keep BER less than 10-8
, the
conventional system can accommodate only 5 users, but
our proposed system can accommodate 40 users.
Fig. 7 shows BER versus the number of users for
proposed system for F = 890, k=5 together with
conventional system. In case of N=30, BER of
conventional system is 10-6
, while BER of the proposed
system achieves 10-12
.
VI. CONCLUSION
In this paper, we have proposed a new optical CDMA
using dual encoding with different optical powers in order
1.00E-10
1.00E-09
1.00E-08
1.00E-07
1.00E-06
1.00E-05
1.00E-04
1.00E-03
0 5 10 15 20 25 30
BE
R
Number of Users N
Simulation
Theoretical
1.00E-10
1.00E-09
1.00E-08
1.00E-07
1.00E-06
1.00E-05
1.00E-04
1.00E-03
0 5 10 15 20
BE
R
Number of Users N
Simulation
Theoretical
Figure 4. BER versus the number of users N for theoretical and
simulation (F=464, k=4).
Figure 5. BER versus the number of users N for theoretical and
simulation (F=127, k=3).
1.00E-20
1.00E-18
1.00E-16
1.00E-14
1.00E-12
1.00E-10
1.00E-08
1.00E-06
1.00E-04
1.00E-02
1.00E+00
0 10 20 30 40
BE
R
Number of Users N
conventional
proposed
1.00E-20
1.00E-18
1.00E-16
1.00E-14
1.00E-12
1.00E-10
1.00E-08
1.00E-06
1.00E-04
1.00E-02
1.00E+00
0 5 10 15 20 25 30
BE
R
Number of Users N
conventional
proposed
Figure 6. BER versus the number of users N for conventional optical
CDMA and our proposed system (F=620, k=4).
Figure 7. BER versus the number of users N for conventional optical
CDMA and our proposed system (F=890, k=5).
71Copyright (c) IARIA, 2011. ISBN: 978-1-61208-174-8
EMERGING 2011 : The Third International Conference on Emerging Network Intelligence
78 / 141
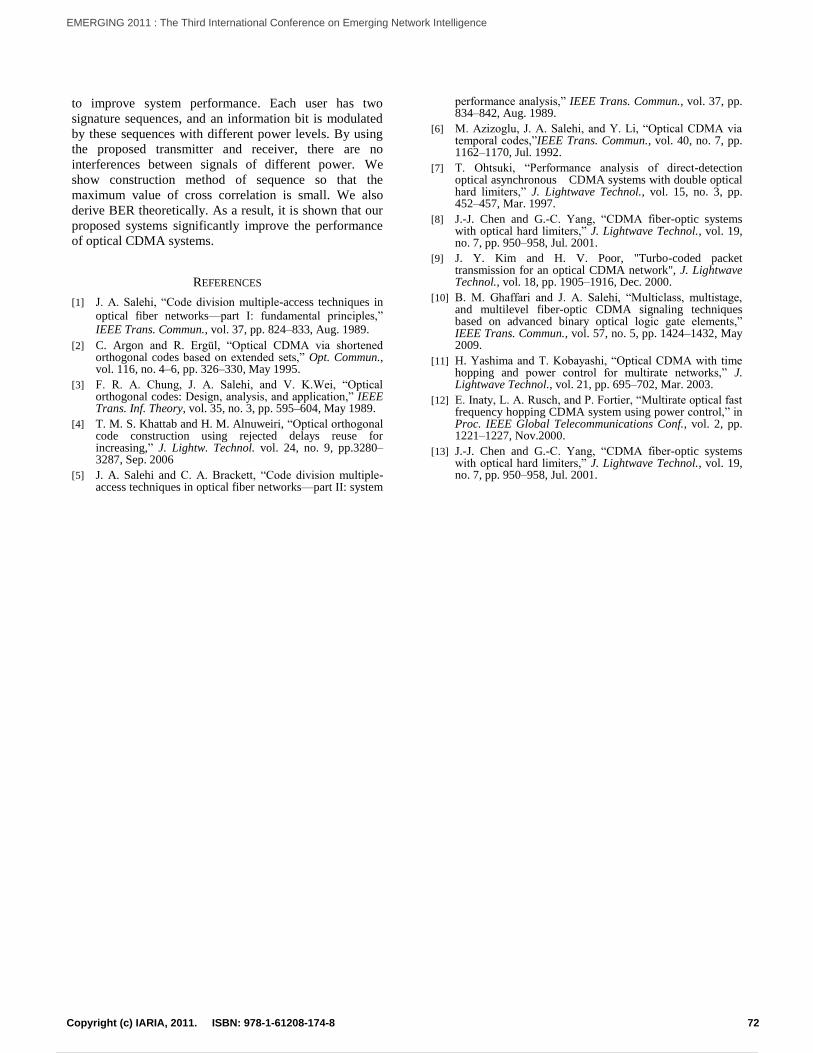
to improve system performance. Each user has two
signature sequences, and an information bit is modulated
by these sequences with different power levels. By using
the proposed transmitter and receiver, there are no
interferences between signals of different power. We
show construction method of sequence so that the
maximum value of cross correlation is small. We also
derive BER theoretically. As a result, it is shown that our
proposed systems significantly improve the performance
of optical CDMA systems.
REFERENCES
[1] J. A. Salehi, ―Code division multiple-access techniques in
optical fiber networks—part I: fundamental principles,‖
IEEE Trans. Commun., vol. 37, pp. 824–833, Aug. 1989.
[2] C. Argon and R. Ergül, ―Optical CDMA via shortened orthogonal codes based on extended sets,‖ Opt. Commun., vol. 116, no. 4–6, pp. 326–330, May 1995.
[3] F. R. A. Chung, J. A. Salehi, and V. K.Wei, ―Optical orthogonal codes: Design, analysis, and application,‖ IEEE Trans. Inf. Theory, vol. 35, no. 3, pp. 595–604, May 1989.
[4] T. M. S. Khattab and H. M. Alnuweiri, ―Optical orthogonal code construction using rejected delays reuse for increasing,‖ J. Lightw. Technol. vol. 24, no. 9, pp.3280–3287, Sep. 2006
[5] J. A. Salehi and C. A. Brackett, ―Code division multiple-access techniques in optical fiber networks—part II: system
performance analysis,‖ IEEE Trans. Commun., vol. 37, pp. 834–842, Aug. 1989.
[6] M. Azizoglu, J. A. Salehi, and Y. Li, ―Optical CDMA via temporal codes,‖IEEE Trans. Commun., vol. 40, no. 7, pp. 1162–1170, Jul. 1992.
[7] T. Ohtsuki, ―Performance analysis of direct-detection optical asynchronous CDMA systems with double optical hard limiters,‖ J. Lightwave Technol., vol. 15, no. 3, pp. 452–457, Mar. 1997.
[8] J.-J. Chen and G.-C. Yang, ―CDMA fiber-optic systems with optical hard limiters,‖ J. Lightwave Technol., vol. 19, no. 7, pp. 950–958, Jul. 2001.
[9] J. Y. Kim and H. V. Poor, "Turbo-coded packet transmission for an optical CDMA network", J. Lightwave Technol., vol. 18, pp. 1905–1916, Dec. 2000.
[10] B. M. Ghaffari and J. A. Salehi, ―Multiclass, multistage, and multilevel fiber-optic CDMA signaling techniques based on advanced binary optical logic gate elements,‖ IEEE Trans. Commun., vol. 57, no. 5, pp. 1424–1432, May 2009.
[11] H. Yashima and T. Kobayashi, ―Optical CDMA with time hopping and power control for multirate networks,‖ J. Lightwave Technol., vol. 21, pp. 695–702, Mar. 2003.
[12] E. Inaty, L. A. Rusch, and P. Fortier, ―Multirate optical fast frequency hopping CDMA system using power control,‖ in Proc. IEEE Global Telecommunications Conf., vol. 2, pp. 1221–1227, Nov.2000.
[13] J.-J. Chen and G.-C. Yang, ―CDMA fiber-optic systems with optical hard limiters,‖ J. Lightwave Technol., vol. 19, no. 7, pp. 950–958, Jul. 2001.
72Copyright (c) IARIA, 2011. ISBN: 978-1-61208-174-8
EMERGING 2011 : The Third International Conference on Emerging Network Intelligence
79 / 141
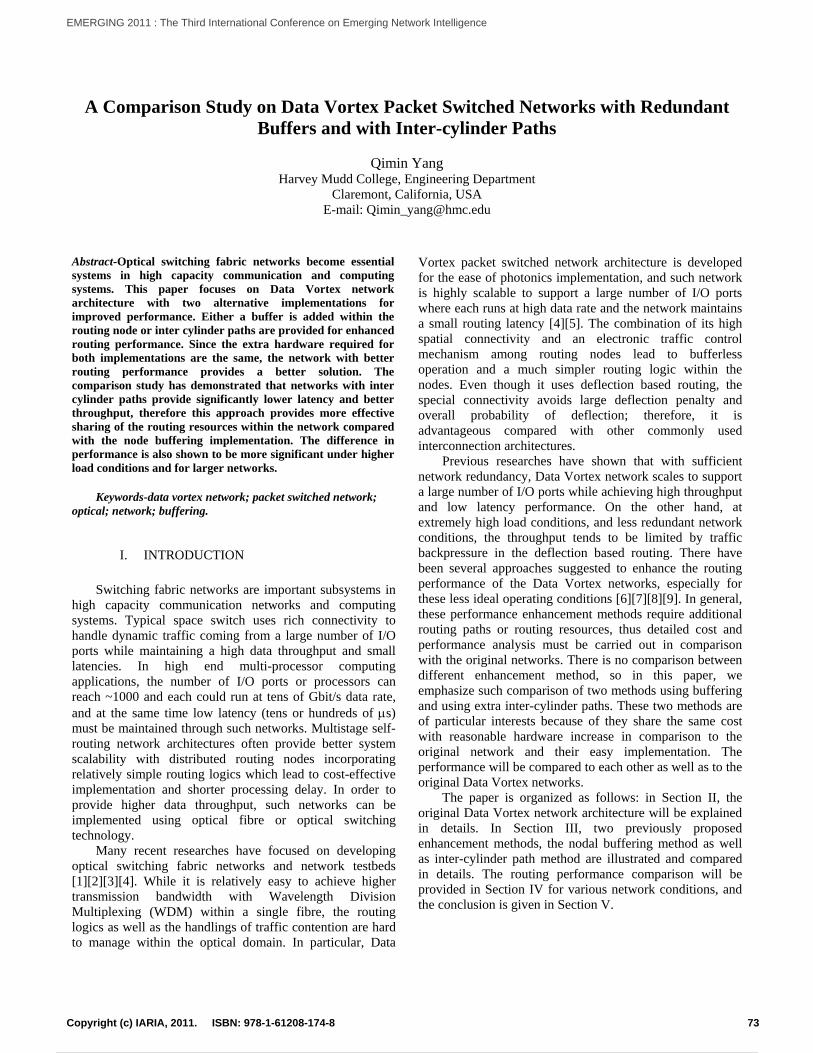
A Comparison Study on Data Vortex Packet Switched Networks with Redundant Buffers and with Inter-cylinder Paths
Qimin Yang Harvey Mudd College, Engineering Department
Claremont, California, USA E-mail: [email protected]
Abstract-Optical switching fabric networks become essential systems in high capacity communication and computing systems. This paper focuses on Data Vortex network architecture with two alternative implementations for improved performance. Either a buffer is added within the routing node or inter cylinder paths are provided for enhanced routing performance. Since the extra hardware required for both implementations are the same, the network with better routing performance provides a better solution. The comparison study has demonstrated that networks with inter cylinder paths provide significantly lower latency and better throughput, therefore this approach provides more effective sharing of the routing resources within the network compared with the node buffering implementation. The difference in performance is also shown to be more significant under higher load conditions and for larger networks.
Keywords-data vortex network; packet switched network;
optical; network; buffering.
I. INTRODUCTION Switching fabric networks are important subsystems in
high capacity communication networks and computing systems. Typical space switch uses rich connectivity to handle dynamic traffic coming from a large number of I/O ports while maintaining a high data throughput and small latencies. In high end multi-processor computing applications, the number of I/O ports or processors can reach ~1000 and each could run at tens of Gbit/s data rate, and at the same time low latency (tens or hundreds of μs) must be maintained through such networks. Multistage self-routing network architectures often provide better system scalability with distributed routing nodes incorporating relatively simple routing logics which lead to cost-effective implementation and shorter processing delay. In order to provide higher data throughput, such networks can be implemented using optical fibre or optical switching technology.
Many recent researches have focused on developing optical switching fabric networks and network testbeds [1][2][3][4]. While it is relatively easy to achieve higher transmission bandwidth with Wavelength Division Multiplexing (WDM) within a single fibre, the routing logics as well as the handlings of traffic contention are hard to manage within the optical domain. In particular, Data
Vortex packet switched network architecture is developed for the ease of photonics implementation, and such network is highly scalable to support a large number of I/O ports where each runs at high data rate and the network maintains a small routing latency [4][5]. The combination of its high spatial connectivity and an electronic traffic control mechanism among routing nodes lead to bufferless operation and a much simpler routing logic within the nodes. Even though it uses deflection based routing, the special connectivity avoids large deflection penalty and overall probability of deflection; therefore, it is advantageous compared with other commonly used interconnection architectures.
Previous researches have shown that with sufficient network redundancy, Data Vortex network scales to support a large number of I/O ports while achieving high throughput and low latency performance. On the other hand, at extremely high load conditions, and less redundant network conditions, the throughput tends to be limited by traffic backpressure in the deflection based routing. There have been several approaches suggested to enhance the routing performance of the Data Vortex networks, especially for these less ideal operating conditions [6][7][8][9]. In general, these performance enhancement methods require additional routing paths or routing resources, thus detailed cost and performance analysis must be carried out in comparison with the original networks. There is no comparison between different enhancement method, so in this paper, we emphasize such comparison of two methods using buffering and using extra inter-cylinder paths. These two methods are of particular interests because of they share the same cost with reasonable hardware increase in comparison to the original network and their easy implementation. The performance will be compared to each other as well as to the original Data Vortex networks.
The paper is organized as follows: in Section II, the original Data Vortex network architecture will be explained in details. In Section III, two previously proposed enhancement methods, the nodal buffering method as well as inter-cylinder path method are illustrated and compared in details. The routing performance comparison will be provided in Section IV for various network conditions, and the conclusion is given in Section V.
73Copyright (c) IARIA, 2011. ISBN: 978-1-61208-174-8
EMERGING 2011 : The Third International Conference on Emerging Network Intelligence
80 / 141
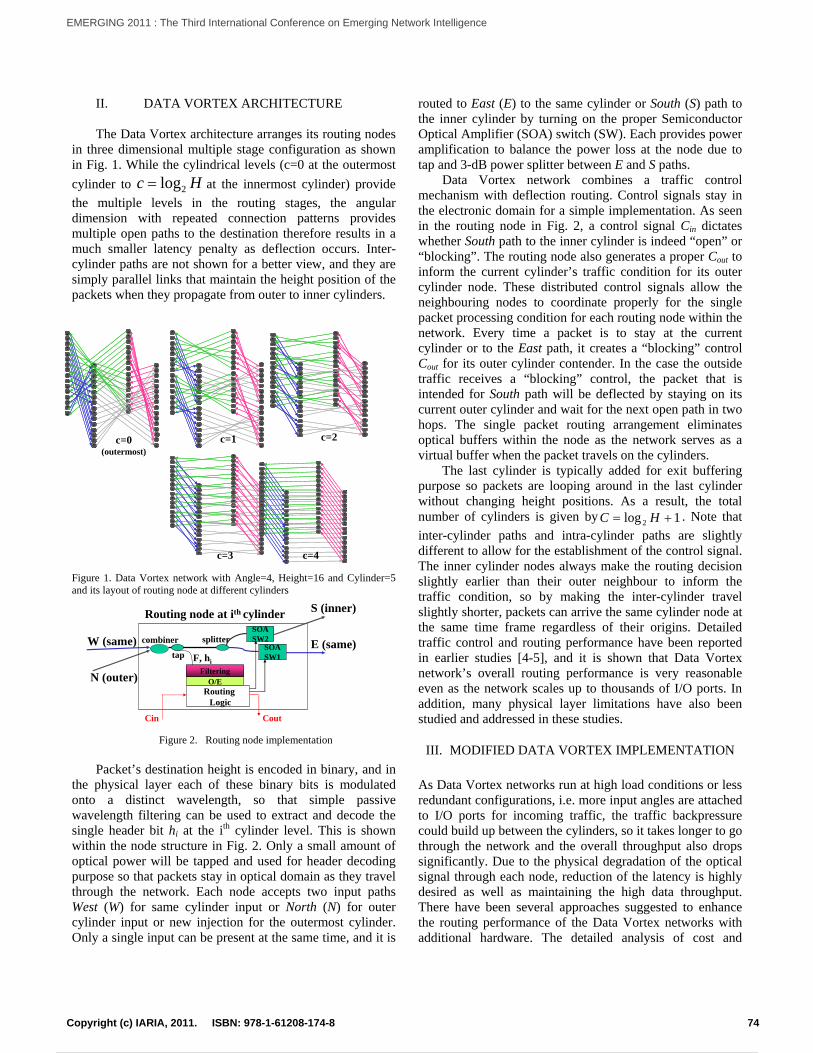
II. DATA VORTEX ARCHITECTURE
The Data Vortex architecture arranges its routing nodes in three dimensional multiple stage configuration as shown in Fig. 1. While the cylindrical levels (c=0 at the outermost cylinder to Hc 2log= at the innermost cylinder) provide the multiple levels in the routing stages, the angular dimension with repeated connection patterns provides multiple open paths to the destination therefore results in a much smaller latency penalty as deflection occurs. Inter-cylinder paths are not shown for a better view, and they are simply parallel links that maintain the height position of the packets when they propagate from outer to inner cylinders.
Figure 1. Data Vortex network with Angle=4, Height=16 and Cylinder=5 and its layout of routing node at different cylinders
Figure 2. Routing node implementation Packet’s destination height is encoded in binary, and in
the physical layer each of these binary bits is modulated onto a distinct wavelength, so that simple passive wavelength filtering can be used to extract and decode the single header bit hi at the ith cylinder level. This is shown within the node structure in Fig. 2. Only a small amount of optical power will be tapped and used for header decoding purpose so that packets stay in optical domain as they travel through the network. Each node accepts two input paths West (W) for same cylinder input or North (N) for outer cylinder input or new injection for the outermost cylinder. Only a single input can be present at the same time, and it is
routed to East (E) to the same cylinder or South (S) path to the inner cylinder by turning on the proper Semiconductor Optical Amplifier (SOA) switch (SW). Each provides power amplification to balance the power loss at the node due to tap and 3-dB power splitter between E and S paths.
Data Vortex network combines a traffic control mechanism with deflection routing. Control signals stay in the electronic domain for a simple implementation. As seen in the routing node in Fig. 2, a control signal Cin dictates whether South path to the inner cylinder is indeed “open” or “blocking”. The routing node also generates a proper Cout to inform the current cylinder’s traffic condition for its outer cylinder node. These distributed control signals allow the neighbouring nodes to coordinate properly for the single packet processing condition for each routing node within the network. Every time a packet is to stay at the current cylinder or to the East path, it creates a “blocking” control Cout for its outer cylinder contender. In the case the outside traffic receives a “blocking” control, the packet that is intended for South path will be deflected by staying on its current outer cylinder and wait for the next open path in two hops. The single packet routing arrangement eliminates optical buffers within the node as the network serves as a virtual buffer when the packet travels on the cylinders.
The last cylinder is typically added for exit buffering purpose so packets are looping around in the last cylinder without changing height positions. As a result, the total number of cylinders is given by 1log 2 += HC . Note that inter-cylinder paths and intra-cylinder paths are slightly different to allow for the establishment of the control signal. The inner cylinder nodes always make the routing decision slightly earlier than their outer neighbour to inform the traffic condition, so by making the inter-cylinder travel slightly shorter, packets can arrive the same cylinder node at the same time frame regardless of their origins. Detailed traffic control and routing performance have been reported in earlier studies [4-5], and it is shown that Data Vortex network’s overall routing performance is very reasonable even as the network scales up to thousands of I/O ports. In addition, many physical layer limitations have also been studied and addressed in these studies.
III. MODIFIED DATA VORTEX IMPLEMENTATION As Data Vortex networks run at high load conditions or less redundant configurations, i.e. more input angles are attached to I/O ports for incoming traffic, the traffic backpressure could build up between the cylinders, so it takes longer to go through the network and the overall throughput also drops significantly. Due to the physical degradation of the optical signal through each node, reduction of the latency is highly desired as well as maintaining the high data throughput. There have been several approaches suggested to enhance the routing performance of the Data Vortex networks with additional hardware. The detailed analysis of cost and
c=0(outermost)
c=1 c=2
c=3 c=4
RoutingLogic
F, hi
SOASW2
SOASW1
E (same)
S (inner)
Cin
Routing node at ith cylinder
W (same)
N (outer)
combiner
tap
splitter
Cout
FilteringO/E
74Copyright (c) IARIA, 2011. ISBN: 978-1-61208-174-8
EMERGING 2011 : The Third International Conference on Emerging Network Intelligence
81 / 141
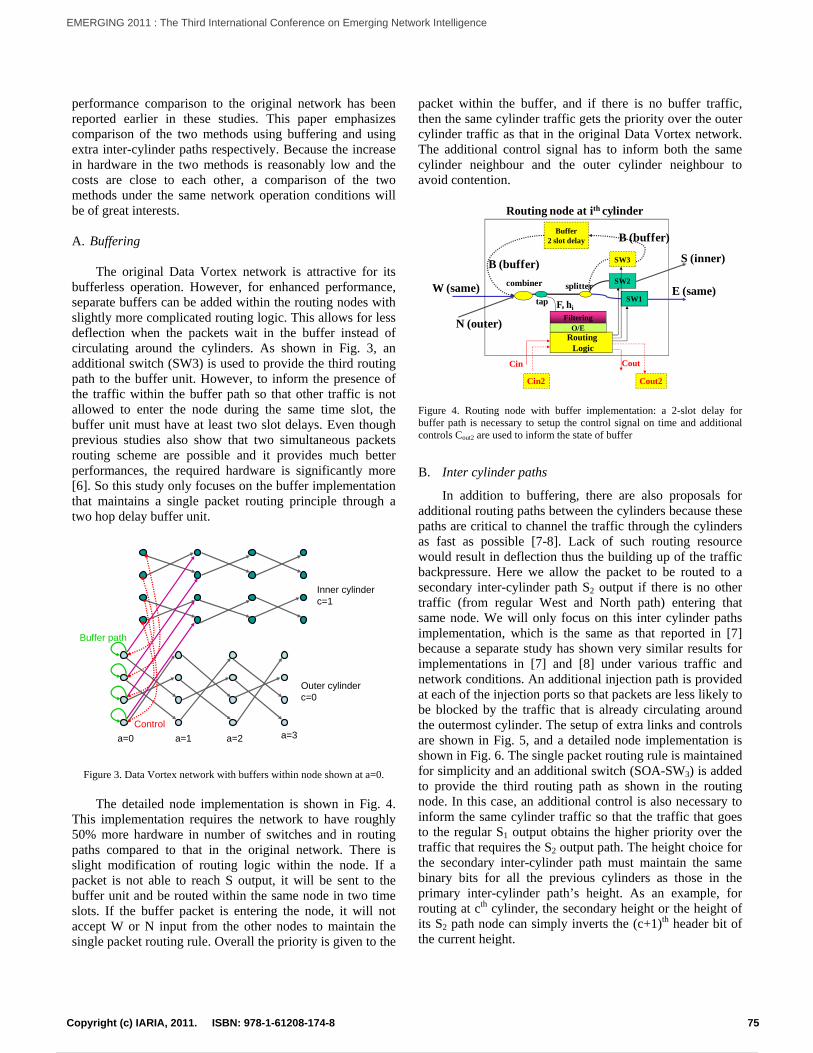
performance comparison to the original network has been reported earlier in these studies. This paper emphasizes comparison of the two methods using buffering and using extra inter-cylinder paths respectively. Because the increase in hardware in the two methods is reasonably low and the costs are close to each other, a comparison of the two methods under the same network operation conditions will be of great interests. A. Buffering
The original Data Vortex network is attractive for its bufferless operation. However, for enhanced performance, separate buffers can be added within the routing nodes with slightly more complicated routing logic. This allows for less deflection when the packets wait in the buffer instead of circulating around the cylinders. As shown in Fig. 3, an additional switch (SW3) is used to provide the third routing path to the buffer unit. However, to inform the presence of the traffic within the buffer path so that other traffic is not allowed to enter the node during the same time slot, the buffer unit must have at least two slot delays. Even though previous studies also show that two simultaneous packets routing scheme are possible and it provides much better performances, the required hardware is significantly more [6]. So this study only focuses on the buffer implementation that maintains a single packet routing principle through a two hop delay buffer unit.
Figure 3. Data Vortex network with buffers within node shown at a=0.
The detailed node implementation is shown in Fig. 4.
This implementation requires the network to have roughly 50% more hardware in number of switches and in routing paths compared to that in the original network. There is slight modification of routing logic within the node. If a packet is not able to reach S output, it will be sent to the buffer unit and be routed within the same node in two time slots. If the buffer packet is entering the node, it will not accept W or N input from the other nodes to maintain the single packet routing rule. Overall the priority is given to the
packet within the buffer, and if there is no buffer traffic, then the same cylinder traffic gets the priority over the outer cylinder traffic as that in the original Data Vortex network. The additional control signal has to inform both the same cylinder neighbour and the outer cylinder neighbour to avoid contention.
Figure 4. Routing node with buffer implementation: a 2-slot delay for buffer path is necessary to setup the control signal on time and additional controls Cout2 are used to inform the state of buffer
B. Inter cylinder paths
In addition to buffering, there are also proposals for additional routing paths between the cylinders because these paths are critical to channel the traffic through the cylinders as fast as possible [7-8]. Lack of such routing resource would result in deflection thus the building up of the traffic backpressure. Here we allow the packet to be routed to a secondary inter-cylinder path S2 output if there is no other traffic (from regular West and North path) entering that same node. We will only focus on this inter cylinder paths implementation, which is the same as that reported in [7] because a separate study has shown very similar results for implementations in [7] and [8] under various traffic and network conditions. An additional injection path is provided at each of the injection ports so that packets are less likely to be blocked by the traffic that is already circulating around the outermost cylinder. The setup of extra links and controls are shown in Fig. 5, and a detailed node implementation is shown in Fig. 6. The single packet routing rule is maintained for simplicity and an additional switch (SOA-SW3) is added to provide the third routing path as shown in the routing node. In this case, an additional control is also necessary to inform the same cylinder traffic so that the traffic that goes to the regular S1 output obtains the higher priority over the traffic that requires the S2 output path. The height choice for the secondary inter-cylinder path must maintain the same binary bits for all the previous cylinders as those in the primary inter-cylinder path’s height. As an example, for routing at cth cylinder, the secondary height or the height of its S2 path node can simply inverts the (c+1)th header bit of the current height.
RoutingLogic
F, hi
SW2
SW1E (same)
Cin
Routing node at ith cylinder
W (same)
N (outer)
combiner
tap
splitter
Cout
FilteringO/E
S (inner)SW3
Buffer2 slot delay
Cout2Cin2
B (buffer)
B (buffer)
Control
Buffer path
a=0 a=1 a=2 a=3
Inner cylinderc=1
Outer cylinderc=0
75Copyright (c) IARIA, 2011. ISBN: 978-1-61208-174-8
EMERGING 2011 : The Third International Conference on Emerging Network Intelligence
82 / 141
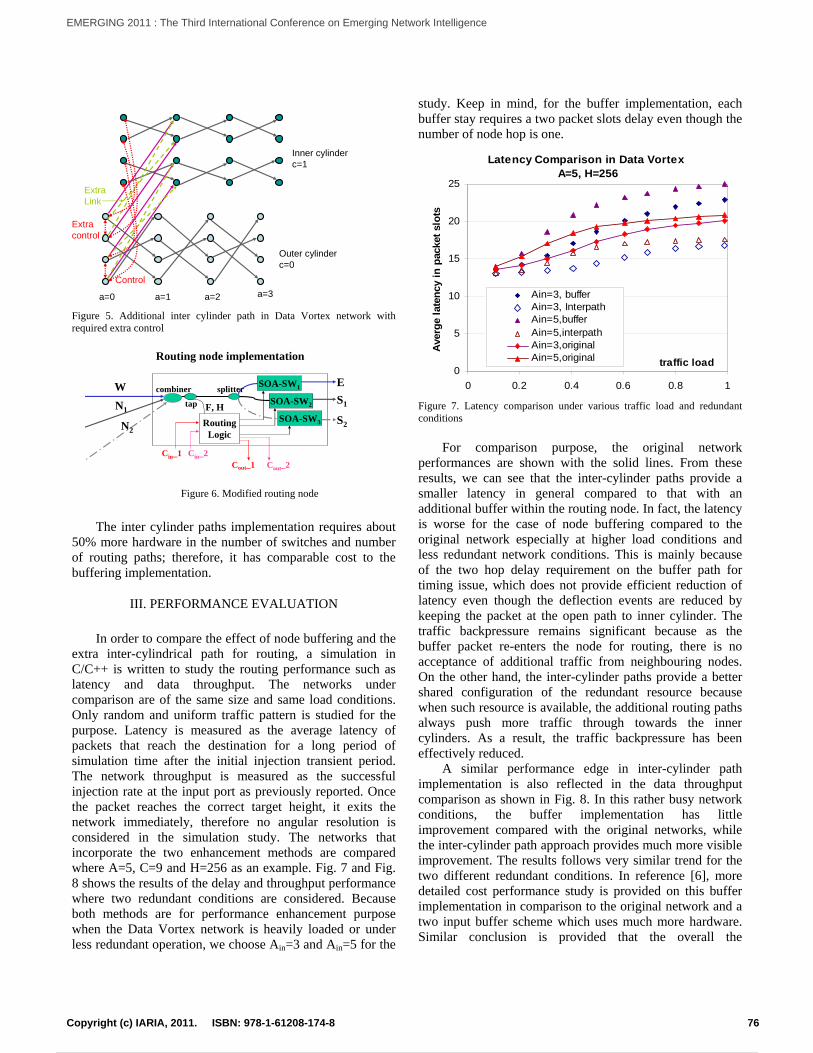
Figure 5. Additional inter cylinder path in Data Vortex network with required extra control
Figure 6. Modified routing node
The inter cylinder paths implementation requires about
50% more hardware in the number of switches and number of routing paths; therefore, it has comparable cost to the buffering implementation.
III. PERFORMANCE EVALUATION
In order to compare the effect of node buffering and the extra inter-cylindrical path for routing, a simulation in C/C++ is written to study the routing performance such as latency and data throughput. The networks under comparison are of the same size and same load conditions. Only random and uniform traffic pattern is studied for the purpose. Latency is measured as the average latency of packets that reach the destination for a long period of simulation time after the initial injection transient period. The network throughput is measured as the successful injection rate at the input port as previously reported. Once the packet reaches the correct target height, it exits the network immediately, therefore no angular resolution is considered in the simulation study. The networks that incorporate the two enhancement methods are compared where A=5, C=9 and H=256 as an example. Fig. 7 and Fig. 8 shows the results of the delay and throughput performance where two redundant conditions are considered. Because both methods are for performance enhancement purpose when the Data Vortex network is heavily loaded or under less redundant operation, we choose Ain=3 and Ain=5 for the
study. Keep in mind, for the buffer implementation, each buffer stay requires a two packet slots delay even though the number of node hop is one.
Figure 7. Latency comparison under various traffic load and redundant conditions
For comparison purpose, the original network performances are shown with the solid lines. From these results, we can see that the inter-cylinder paths provide a smaller latency in general compared to that with an additional buffer within the routing node. In fact, the latency is worse for the case of node buffering compared to the original network especially at higher load conditions and less redundant network conditions. This is mainly because of the two hop delay requirement on the buffer path for timing issue, which does not provide efficient reduction of latency even though the deflection events are reduced by keeping the packet at the open path to inner cylinder. The traffic backpressure remains significant because as the buffer packet re-enters the node for routing, there is no acceptance of additional traffic from neighbouring nodes. On the other hand, the inter-cylinder paths provide a better shared configuration of the redundant resource because when such resource is available, the additional routing paths always push more traffic through towards the inner cylinders. As a result, the traffic backpressure has been effectively reduced.
A similar performance edge in inter-cylinder path implementation is also reflected in the data throughput comparison as shown in Fig. 8. In this rather busy network conditions, the buffer implementation has little improvement compared with the original networks, while the inter-cylinder path approach provides much more visible improvement. The results follows very similar trend for the two different redundant conditions. In reference [6], more detailed cost performance study is provided on this buffer implementation in comparison to the original network and a two input buffer scheme which uses much more hardware. Similar conclusion is provided that the overall the
Latency Comparison in Data Vortex A=5, H=256
0
5
10
15
20
25
0 0.2 0.4 0.6 0.8 1
traffic load
Aver
ge la
tenc
y in
pac
ket s
lots
Ain=3, bufferAin=3, InterpathAin=5,bufferAin=5,interpathAin=3,originalAin=5,original
RoutingLogic
F, H
SOA-SW1
SOA-SW2
SOA-SW3
ES1
S2
Cin_1 Cin_2
Routing node implementation
WN1
N2
combiner
tap
splitter
Cout_1 Cout_2
Control
Extra Link
Extracontrol
Outer cylinderc=0
Inner cylinderc=1
a=0 a=1 a=2 a=3
76Copyright (c) IARIA, 2011. ISBN: 978-1-61208-174-8
EMERGING 2011 : The Third International Conference on Emerging Network Intelligence
83 / 141
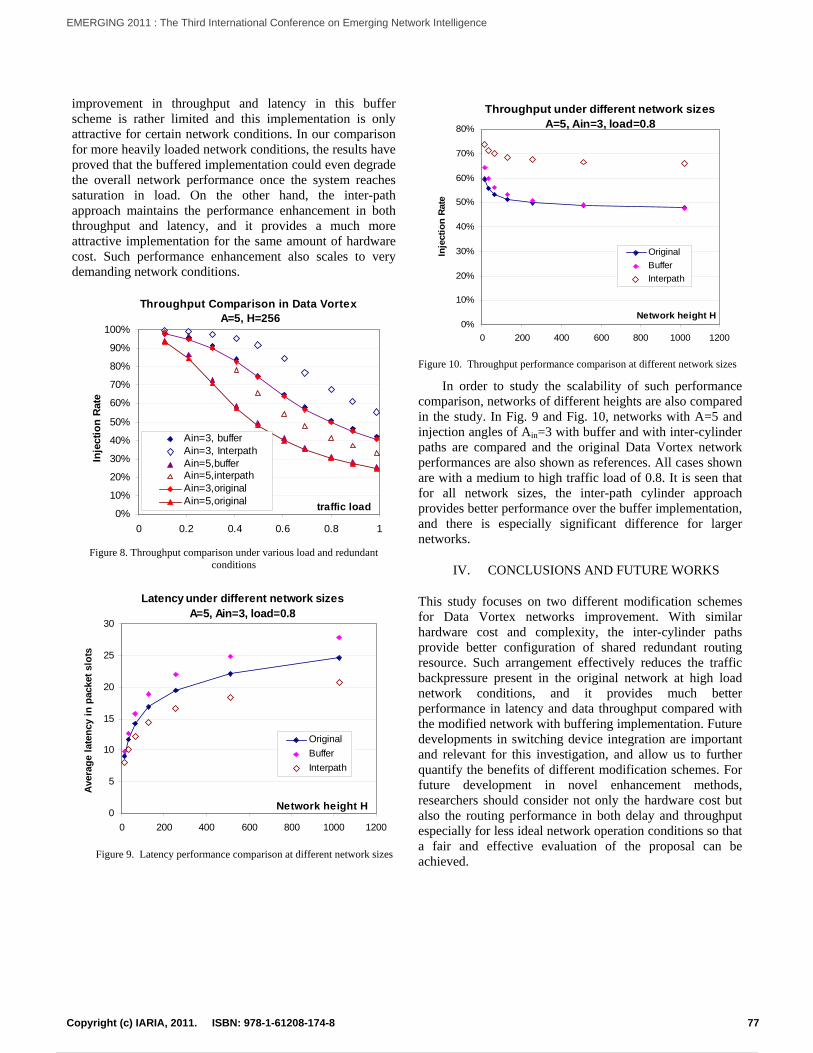
improvement in throughput and latency in this buffer scheme is rather limited and this implementation is only attractive for certain network conditions. In our comparison for more heavily loaded network conditions, the results have proved that the buffered implementation could even degrade the overall network performance once the system reaches saturation in load. On the other hand, the inter-path approach maintains the performance enhancement in both throughput and latency, and it provides a much more attractive implementation for the same amount of hardware cost. Such performance enhancement also scales to very demanding network conditions.
Figure 8. Throughput comparison under various load and redundant
conditions
Figure 9. Latency performance comparison at different network sizes
Figure 10. Throughput performance comparison at different network sizes
In order to study the scalability of such performance comparison, networks of different heights are also compared in the study. In Fig. 9 and Fig. 10, networks with A=5 and injection angles of Ain=3 with buffer and with inter-cylinder paths are compared and the original Data Vortex network performances are also shown as references. All cases shown are with a medium to high traffic load of 0.8. It is seen that for all network sizes, the inter-path cylinder approach provides better performance over the buffer implementation, and there is especially significant difference for larger networks.
IV. CONCLUSIONS AND FUTURE WORKS
This study focuses on two different modification schemes for Data Vortex networks improvement. With similar hardware cost and complexity, the inter-cylinder paths provide better configuration of shared redundant routing resource. Such arrangement effectively reduces the traffic backpressure present in the original network at high load network conditions, and it provides much better performance in latency and data throughput compared with the modified network with buffering implementation. Future developments in switching device integration are important and relevant for this investigation, and allow us to further quantify the benefits of different modification schemes. For future development in novel enhancement methods, researchers should consider not only the hardware cost but also the routing performance in both delay and throughput especially for less ideal network operation conditions so that a fair and effective evaluation of the proposal can be achieved.
Throughput Comparison in Data Vortex A=5, H=256
0%
10%
20%
30%
40%
50%
60%
70%
80%
90%
100%
0 0.2 0.4 0.6 0.8 1
traffic load
Inje
ctio
n Ra
te
Ain=3, bufferAin=3, InterpathAin=5,bufferAin=5,interpathAin=3,originalAin=5,original
Latency under different network sizesA=5, Ain=3, load=0.8
0
5
10
15
20
25
30
0 200 400 600 800 1000 1200
Network height H
Aver
age
late
ncy
in p
acke
t slo
ts
OriginalBufferInterpath
Throughput under different network sizesA=5, Ain=3, load=0.8
0%
10%
20%
30%
40%
50%
60%
70%
80%
0 200 400 600 800 1000 1200
Network height H
Inje
ctio
n Ra
te
OriginalBufferInterpath
77Copyright (c) IARIA, 2011. ISBN: 978-1-61208-174-8
EMERGING 2011 : The Third International Conference on Emerging Network Intelligence
84 / 141
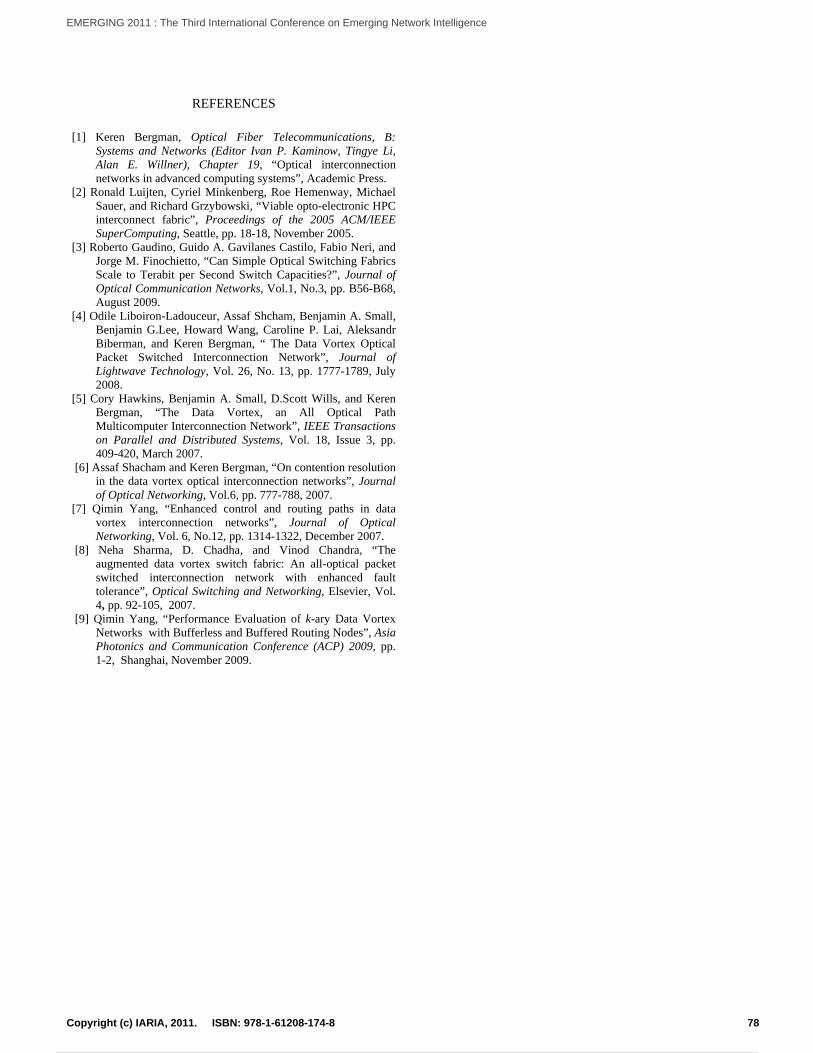
REFERENCES [1] Keren Bergman, Optical Fiber Telecommunications, B:
Systems and Networks (Editor Ivan P. Kaminow, Tingye Li, Alan E. Willner), Chapter 19, “Optical interconnection networks in advanced computing systems”, Academic Press.
[2] Ronald Luijten, Cyriel Minkenberg, Roe Hemenway, Michael Sauer, and Richard Grzybowski, “Viable opto-electronic HPC interconnect fabric”, Proceedings of the 2005 ACM/IEEE SuperComputing, Seattle, pp. 18-18, November 2005.
[3] Roberto Gaudino, Guido A. Gavilanes Castilo, Fabio Neri, and Jorge M. Finochietto, “Can Simple Optical Switching Fabrics Scale to Terabit per Second Switch Capacities?”, Journal of Optical Communication Networks, Vol.1, No.3, pp. B56-B68, August 2009.
[4] Odile Liboiron-Ladouceur, Assaf Shcham, Benjamin A. Small, Benjamin G.Lee, Howard Wang, Caroline P. Lai, Aleksandr Biberman, and Keren Bergman, “ The Data Vortex Optical Packet Switched Interconnection Network”, Journal of Lightwave Technology, Vol. 26, No. 13, pp. 1777-1789, July 2008.
[5] Cory Hawkins, Benjamin A. Small, D.Scott Wills, and Keren Bergman, “The Data Vortex, an All Optical Path Multicomputer Interconnection Network”, IEEE Transactions on Parallel and Distributed Systems, Vol. 18, Issue 3, pp. 409-420, March 2007.
[6] Assaf Shacham and Keren Bergman, “On contention resolution in the data vortex optical interconnection networks”, Journal of Optical Networking, Vol.6, pp. 777-788, 2007.
[7] Qimin Yang, “Enhanced control and routing paths in data vortex interconnection networks”, Journal of Optical Networking, Vol. 6, No.12, pp. 1314-1322, December 2007.
[8] Neha Sharma, D. Chadha, and Vinod Chandra, “The augmented data vortex switch fabric: An all-optical packet switched interconnection network with enhanced fault tolerance”, Optical Switching and Networking, Elsevier, Vol. 4, pp. 92-105, 2007.
[9] Qimin Yang, “Performance Evaluation of k-ary Data Vortex Networks with Bufferless and Buffered Routing Nodes”, Asia Photonics and Communication Conference (ACP) 2009, pp. 1-2, Shanghai, November 2009.
78Copyright (c) IARIA, 2011. ISBN: 978-1-61208-174-8
EMERGING 2011 : The Third International Conference on Emerging Network Intelligence
85 / 141
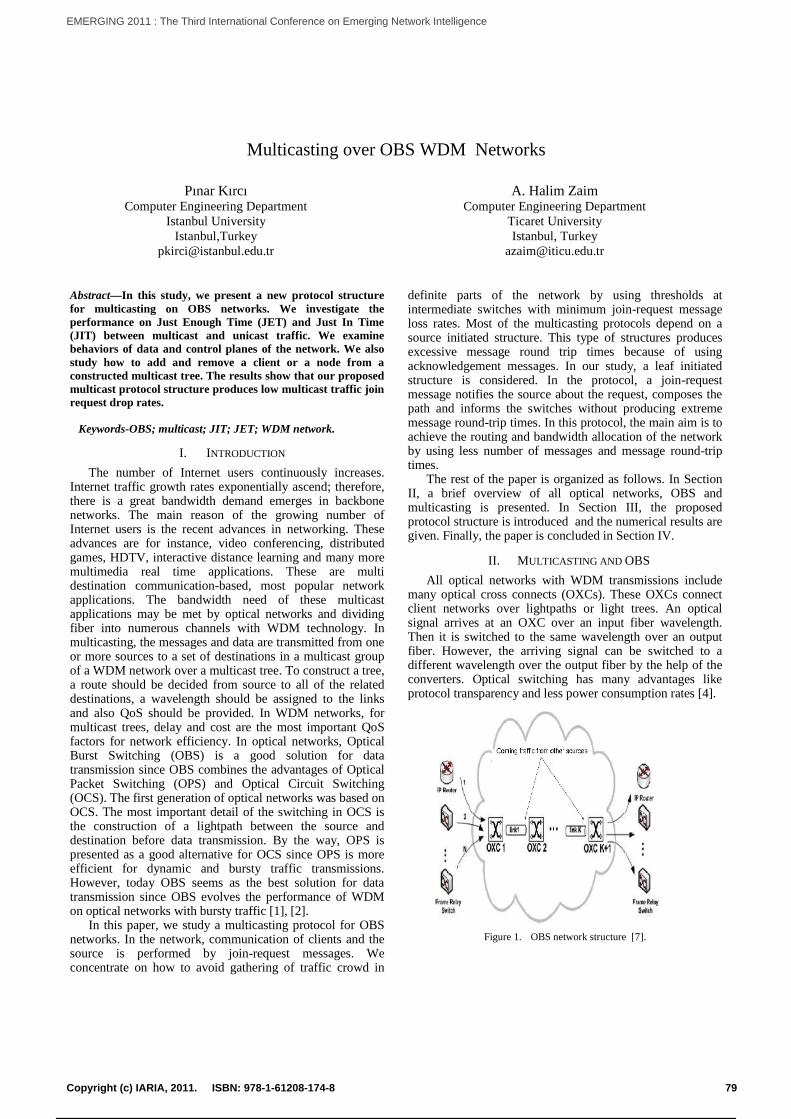
Multicasting over OBS WDM Networks
Pınar KırcıComputer Engineering Department
Istanbul UniversityIstanbul,Turkey
A. Halim ZaimComputer Engineering Department
Ticaret UniversityIstanbul, Turkey
Abstract—In this study, we present a new protocol structurefor multicasting on OBS networks. We investigate theperformance on Just Enough Time (JET) and Just In Time(JIT) between multicast and unicast traffic. We examinebehaviors of data and control planes of the network. We alsostudy how to add and remove a client or a node from aconstructed multicast tree. The results show that our proposedmulticast protocol structure produces low multicast traffic joinrequest drop rates.
Keywords-OBS; multicast; JIT; JET; WDM network.
I. INTRODUCTION
The number of Internet users continuously increases.Internet traffic growth rates exponentially ascend; therefore,there is a great bandwidth demand emerges in backbonenetworks. The main reason of the growing number ofInternet users is the recent advances in networking. Theseadvances are for instance, video conferencing, distributedgames, HDTV, interactive distance learning and many moremultimedia real time applications. These are multidestination communication-based, most popular networkapplications. The bandwidth need of these multicastapplications may be met by optical networks and dividingfiber into numerous channels with WDM technology. Inmulticasting, the messages and data are transmitted from oneor more sources to a set of destinations in a multicast groupof a WDM network over a multicast tree. To construct a tree,a route should be decided from source to all of the relateddestinations, a wavelength should be assigned to the linksand also QoS should be provided. In WDM networks, formulticast trees, delay and cost are the most important QoSfactors for network efficiency. In optical networks, OpticalBurst Switching (OBS) is a good solution for datatransmission since OBS combines the advantages of OpticalPacket Switching (OPS) and Optical Circuit Switching(OCS). The first generation of optical networks was based onOCS. The most important detail of the switching in OCS isthe construction of a lightpath between the source anddestination before data transmission. By the way, OPS ispresented as a good alternative for OCS since OPS is moreefficient for dynamic and bursty traffic transmissions.However, today OBS seems as the best solution for datatransmission since OBS evolves the performance of WDMon optical networks with bursty traffic [1], [2].
In this paper, we study a multicasting protocol for OBSnetworks. In the network, communication of clients and thesource is performed by join-request messages. Weconcentrate on how to avoid gathering of traffic crowd in
definite parts of the network by using thresholds atintermediate switches with minimum join-request messageloss rates. Most of the multicasting protocols depend on asource initiated structure. This type of structures producesexcessive message round trip times because of usingacknowledgement messages. In our study, a leaf initiatedstructure is considered. In the protocol, a join-requestmessage notifies the source about the request, composes thepath and informs the switches without producing extrememessage round-trip times. In this protocol, the main aim is toachieve the routing and bandwidth allocation of the networkby using less number of messages and message round-triptimes.
The rest of the paper is organized as follows. In SectionII, a brief overview of all optical networks, OBS andmulticasting is presented. In Section III, the proposedprotocol structure is introduced and the numerical results aregiven. Finally, the paper is concluded in Section IV.
II. MULTICASTING AND OBSAll optical networks with WDM transmissions include
many optical cross connects (OXCs). These OXCs connectclient networks over lightpaths or light trees. An opticalsignal arrives at an OXC over an input fiber wavelength.Then it is switched to the same wavelength over an outputfiber. However, the arriving signal can be switched to adifferent wavelength over the output fiber by the help of theconverters. Optical switching has many advantages likeprotocol transparency and less power consumption rates [4].
Figure 1. OBS network structure [7].
79Copyright (c) IARIA, 2011. ISBN: 978-1-61208-174-8
EMERGING 2011 : The Third International Conference on Emerging Network Intelligence
86 / 141
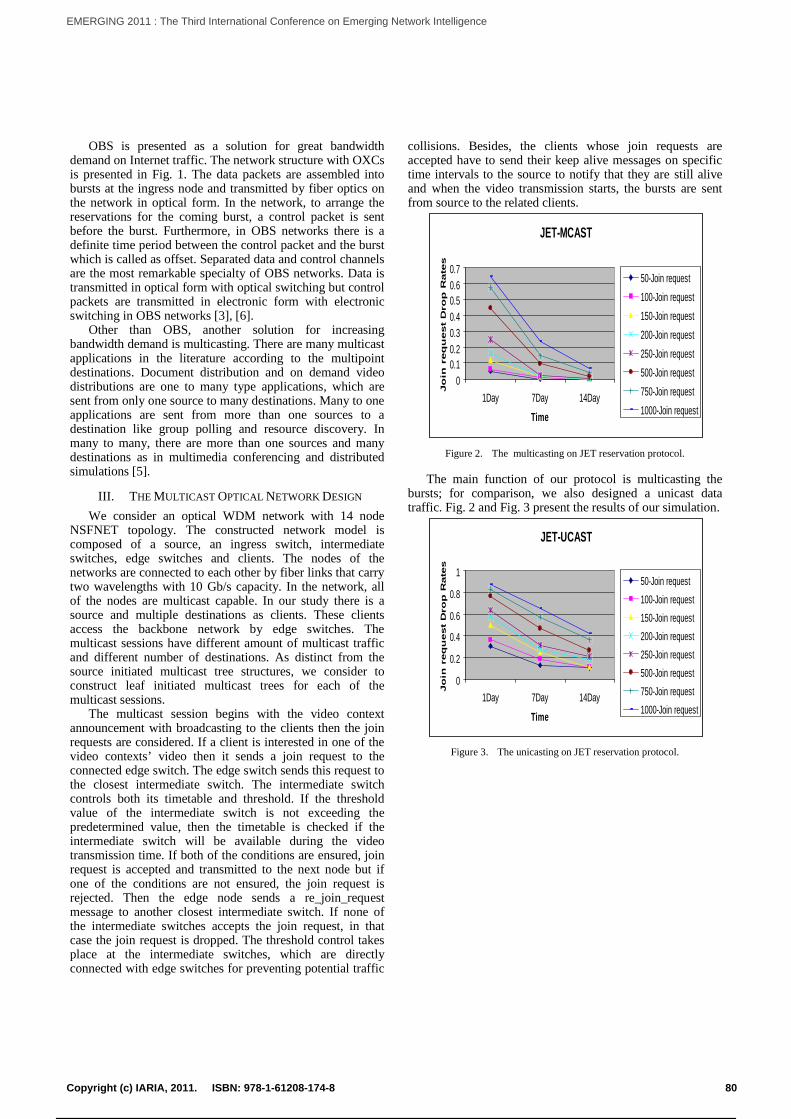
OBS is presented as a solution for great bandwidthdemand on Internet traffic. The network structure with OXCsis presented in Fig. 1. The data packets are assembled intobursts at the ingress node and transmitted by fiber optics onthe network in optical form. In the network, to arrange thereservations for the coming burst, a control packet is sentbefore the burst. Furthermore, in OBS networks there is adefinite time period between the control packet and the burstwhich is called as offset. Separated data and control channelsare the most remarkable specialty of OBS networks. Data istransmitted in optical form with optical switching but controlpackets are transmitted in electronic form with electronicswitching in OBS networks [3], [6].
Other than OBS, another solution for increasingbandwidth demand is multicasting. There are many multicastapplications in the literature according to the multipointdestinations. Document distribution and on demand videodistributions are one to many type applications, which aresent from only one source to many destinations. Many to oneapplications are sent from more than one sources to adestination like group polling and resource discovery. Inmany to many, there are more than one sources and manydestinations as in multimedia conferencing and distributedsimulations [5].
III. THE MULTICAST OPTICAL NETWORK DESIGN
We consider an optical WDM network with 14 nodeNSFNET topology. The constructed network model iscomposed of a source, an ingress switch, intermediateswitches, edge switches and clients. The nodes of thenetworks are connected to each other by fiber links that carrytwo wavelengths with 10 Gb/s capacity. In the network, allof the nodes are multicast capable. In our study there is asource and multiple destinations as clients. These clientsaccess the backbone network by edge switches. Themulticast sessions have different amount of multicast trafficand different number of destinations. As distinct from thesource initiated multicast tree structures, we consider toconstruct leaf initiated multicast trees for each of themulticast sessions.
The multicast session begins with the video contextannouncement with broadcasting to the clients then the joinrequests are considered. If a client is interested in one of thevideo contexts’ video then it sends a join request to theconnected edge switch. The edge switch sends this request tothe closest intermediate switch. The intermediate switchcontrols both its timetable and threshold. If the thresholdvalue of the intermediate switch is not exceeding thepredetermined value, then the timetable is checked if theintermediate switch will be available during the videotransmission time. If both of the conditions are ensured, joinrequest is accepted and transmitted to the next node but ifone of the conditions are not ensured, the join request isrejected. Then the edge node sends a re_join_requestmessage to another closest intermediate switch. If none ofthe intermediate switches accepts the join request, in thatcase the join request is dropped. The threshold control takesplace at the intermediate switches, which are directlyconnected with edge switches for preventing potential traffic
collisions. Besides, the clients whose join requests areaccepted have to send their keep alive messages on specifictime intervals to the source to notify that they are still aliveand when the video transmission starts, the bursts are sentfrom source to the related clients.
JET-MCAST
00.10.20.30.40.50.60.7
1Day 7Day 14DayTime
Jo
in r
eq
uest
Dro
p R
ate
s
50-Join request100-Join request150-Join request200-Join request250-Join request500-Join request750-Join request1000-Join request
Figure 2. The multicasting on JET reservation protocol.
The main function of our protocol is multicasting thebursts; for comparison, we also designed a unicast datatraffic. Fig. 2 and Fig. 3 present the results of our simulation.
JET-UCAST
0
0.2
0.4
0.6
0.8
1
1Day 7Day 14Day
Time
Jo
in r
eq
uest
Dro
p R
ate
s
50-Join request100-Join request150-Join request200-Join request250-Join request500-Join request750-Join request1000-Join request
Figure 3. The unicasting on JET reservation protocol.
80Copyright (c) IARIA, 2011. ISBN: 978-1-61208-174-8
EMERGING 2011 : The Third International Conference on Emerging Network Intelligence
87 / 141
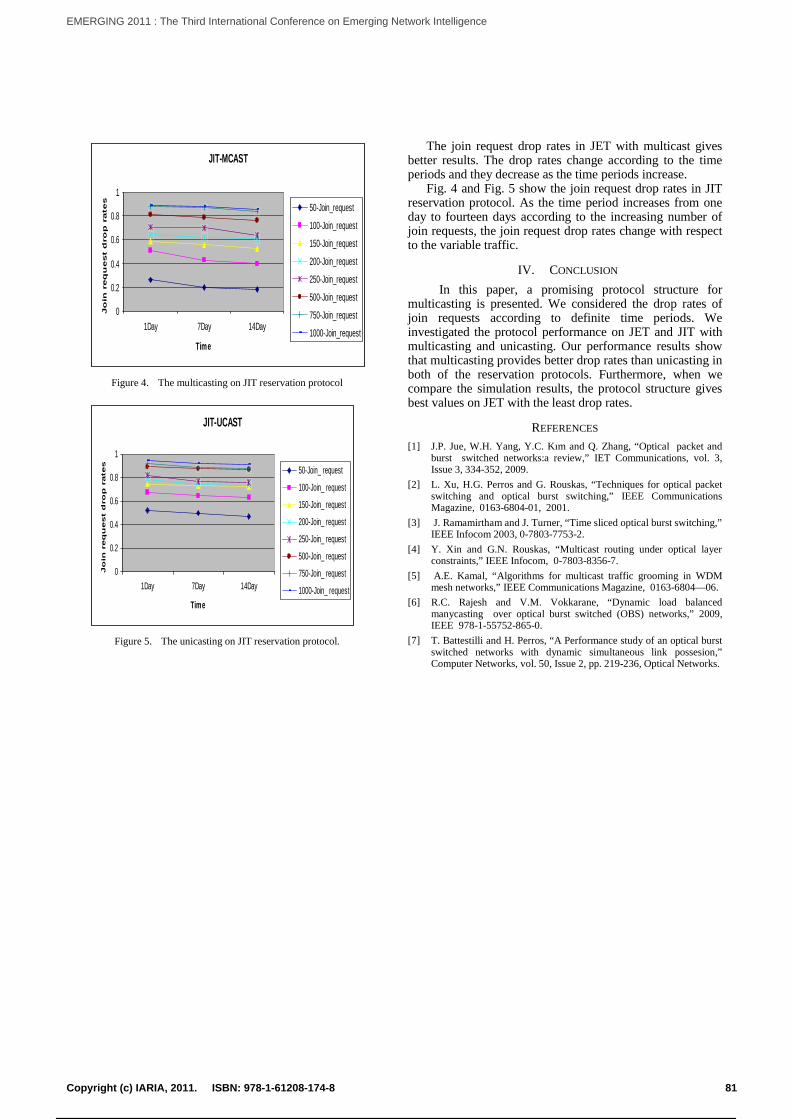
JIT-MCAST
0
0.2
0.4
0.6
0.8
1
1Day 7Day 14Day
Time
Jo
in r
eq
uest
dro
p r
ate
s
50-Join_request
100-Join_request
150-Join_request
200-Join_request
250-Join_request
500-Join_request
750-Join_request
1000-Join_request
Figure 4. The multicasting on JIT reservation protocol
JIT-UCAST
0
0.2
0.4
0.6
0.8
1
1Day 7Day 14Day
Time
Jo
in r
eq
uest
dro
p r
ate
s 50-Join_ request
100-Join_ request
150-Join_ request
200-Join_ request
250-Join_ request
500-Join_ request
750-Join_ request
1000-Join_ request
Figure 5. The unicasting on JIT reservation protocol.
The join request drop rates in JET with multicast givesbetter results. The drop rates change according to the timeperiods and they decrease as the time periods increase.
Fig. 4 and Fig. 5 show the join request drop rates in JITreservation protocol. As the time period increases from oneday to fourteen days according to the increasing number ofjoin requests, the join request drop rates change with respectto the variable traffic.
IV. CONCLUSION
In this paper, a promising protocol structure formulticasting is presented. We considered the drop rates ofjoin requests according to definite time periods. Weinvestigated the protocol performance on JET and JIT withmulticasting and unicasting. Our performance results showthat multicasting provides better drop rates than unicasting inboth of the reservation protocols. Furthermore, when wecompare the simulation results, the protocol structure givesbest values on JET with the least drop rates.
REFERENCES
[1] J.P. Jue, W.H. Yang, Y.C. Kım and Q. Zhang, “Optical packet andburst switched networks:a review,” IET Communications, vol. 3,Issue 3, 334-352, 2009.
[2] L. Xu, H.G. Perros and G. Rouskas, “Techniques for optical packetswitching and optical burst switching,” IEEE CommunicationsMagazine, 0163-6804-01, 2001.
[3] J. Ramamirtham and J. Turner, “Time sliced optical burst switching,”IEEE Infocom 2003, 0-7803-7753-2.
[4] Y. Xin and G.N. Rouskas, “Multicast routing under optical layerconstraints,” IEEE Infocom, 0-7803-8356-7.
[5] A.E. Kamal, “Algorithms for multicast traffic grooming in WDMmesh networks,” IEEE Communications Magazine, 0163-6804—06.
[6] R.C. Rajesh and V.M. Vokkarane, “Dynamic load balancedmanycasting over optical burst switched (OBS) networks,” 2009,IEEE 978-1-55752-865-0.
[7] T. Battestilli and H. Perros, “A Performance study of an optical burstswitched networks with dynamic simultaneous link possesion,”Computer Networks, vol. 50, Issue 2, pp. 219-236, Optical Networks.
81Copyright (c) IARIA, 2011. ISBN: 978-1-61208-174-8
EMERGING 2011 : The Third International Conference on Emerging Network Intelligence
88 / 141
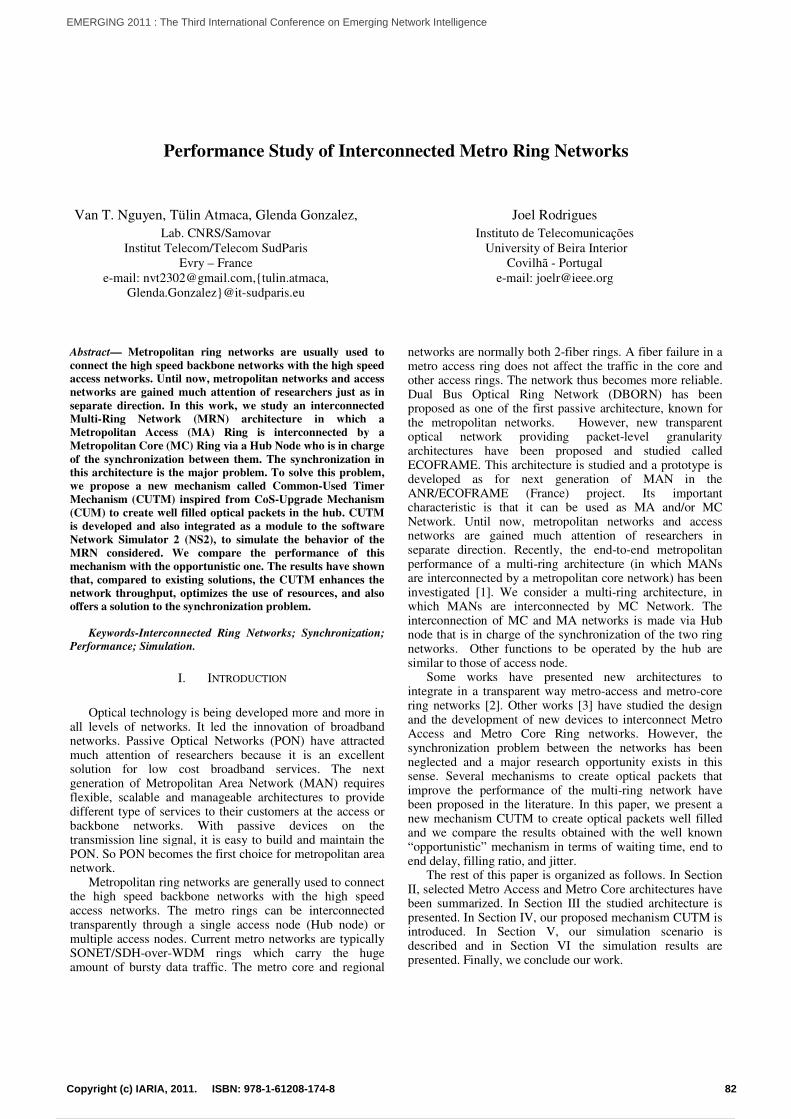
Performance Study of Interconnected Metro Ring Networks
Van T. Nguyen, Tülin Atmaca, Glenda Gonzalez,
Lab. CNRS/Samovar
Institut Telecom/Telecom SudParis
Evry – France
e-mail: [email protected],tulin.atmaca,
Joel Rodrigues
Instituto de Telecomunicações
University of Beira Interior
Covilhã - Portugal
e-mail: [email protected]
Abstract— Metropolitan ring networks are usually used to
connect the high speed backbone networks with the high speed
access networks. Until now, metropolitan networks and access
networks are gained much attention of researchers just as in
separate direction. In this work, we study an interconnected
Multi-Ring Network (MRN) architecture in which a
Metropolitan Access (MA) Ring is interconnected by a
Metropolitan Core (MC) Ring via a Hub Node who is in charge
of the synchronization between them. The synchronization in
this architecture is the major problem. To solve this problem,
we propose a new mechanism called Common-Used Timer
Mechanism (CUTM) inspired from CoS-Upgrade Mechanism
(CUM) to create well filled optical packets in the hub. CUTM
is developed and also integrated as a module to the software
Network Simulator 2 (NS2), to simulate the behavior of the
MRN considered. We compare the performance of this
mechanism with the opportunistic one. The results have shown
that, compared to existing solutions, the CUTM enhances the
network throughput, optimizes the use of resources, and also
offers a solution to the synchronization problem.
Keywords-Interconnected Ring Networks; Synchronization;
Performance; Simulation.
I. INTRODUCTION
Optical technology is being developed more and more in
all levels of networks. It led the innovation of broadband networks. Passive Optical Networks (PON) have attracted much attention of researchers because it is an excellent solution for low cost broadband services. The next generation of Metropolitan Area Network (MAN) requires flexible, scalable and manageable architectures to provide different type of services to their customers at the access or backbone networks. With passive devices on the transmission line signal, it is easy to build and maintain the PON. So PON becomes the first choice for metropolitan area network.
Metropolitan ring networks are generally used to connect the high speed backbone networks with the high speed access networks. The metro rings can be interconnected transparently through a single access node (Hub node) or multiple access nodes. Current metro networks are typically SONET/SDH-over-WDM rings which carry the huge amount of bursty data traffic. The metro core and regional
networks are normally both 2-fiber rings. A fiber failure in a metro access ring does not affect the traffic in the core and other access rings. The network thus becomes more reliable. Dual Bus Optical Ring Network (DBORN) has been proposed as one of the first passive architecture, known for the metropolitan networks. However, new transparent optical network providing packet-level granularity architectures have been proposed and studied called ECOFRAME. This architecture is studied and a prototype is developed as for next generation of MAN in the ANR/ECOFRAME (France) project. Its important characteristic is that it can be used as MA and/or MC Network. Until now, metropolitan networks and access networks are gained much attention of researchers in separate direction. Recently, the end-to-end metropolitan performance of a multi-ring architecture (in which MANs are interconnected by a metropolitan core network) has been investigated [1]. We consider a multi-ring architecture, in which MANs are interconnected by MC Network. The interconnection of MC and MA networks is made via Hub node that is in charge of the synchronization of the two ring networks. Other functions to be operated by the hub are similar to those of access node.
Some works have presented new architectures to integrate in a transparent way metro-access and metro-core ring networks [2]. Other works [3] have studied the design and the development of new devices to interconnect Metro Access and Metro Core Ring networks. However, the synchronization problem between the networks has been neglected and a major research opportunity exists in this sense. Several mechanisms to create optical packets that improve the performance of the multi-ring network have been proposed in the literature. In this paper, we present a new mechanism CUTM to create optical packets well filled and we compare the results obtained with the well known “opportunistic” mechanism in terms of waiting time, end to end delay, filling ratio, and jitter.
The rest of this paper is organized as follows. In Section II, selected Metro Access and Metro Core architectures have been summarized. In Section III the studied architecture is presented. In Section IV, our proposed mechanism CUTM is introduced. In Section V, our simulation scenario is described and in Section VI the simulation results are presented. Finally, we conclude our work.
82Copyright (c) IARIA, 2011. ISBN: 978-1-61208-174-8
EMERGING 2011 : The Third International Conference on Emerging Network Intelligence
89 / 141
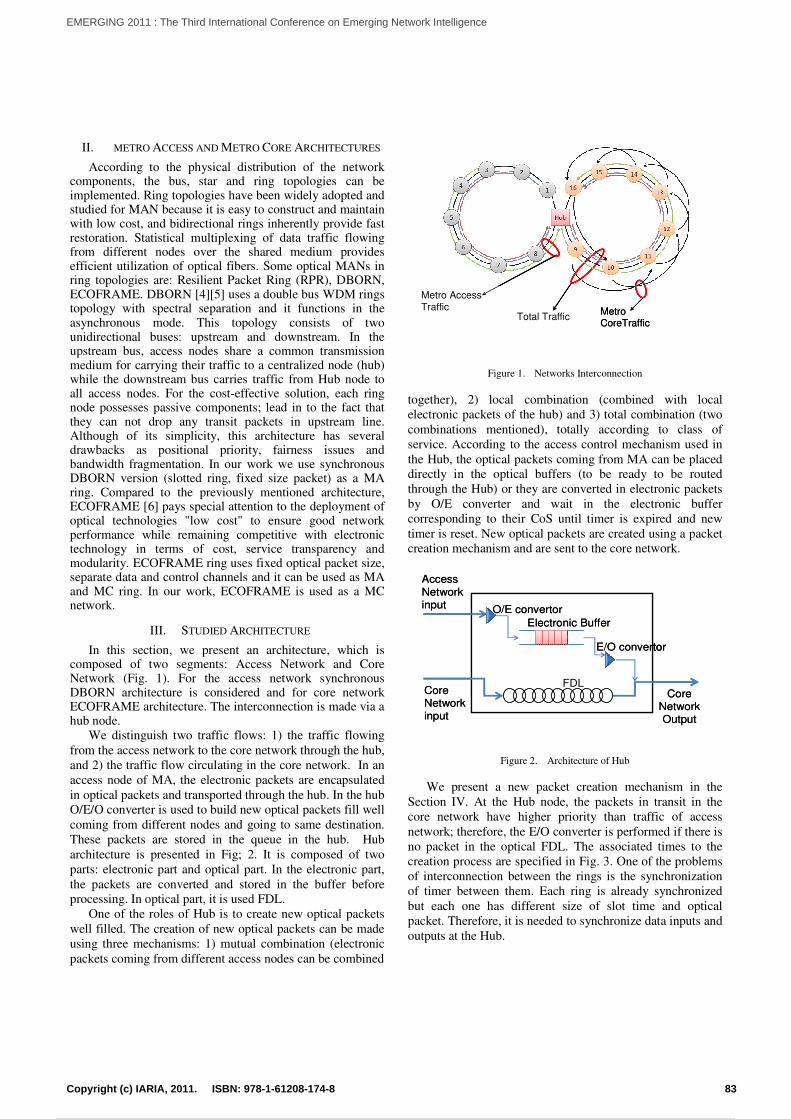
70% - 28Gb
Metro Access Trafic 60% - 32Gb Metro
CoreTrafficTotal Traffic
Metro Access Traffic Metro
CoreTraffic70% - 28Gb70% - 28Gb
Metro Access Trafic 60% - 32Gb Metro
CoreTrafficTotal Traffic
Metro Access Traffic Metro
CoreTraffic
O/E convertor
E/O convertor
Electronic Buffer
Access
Network input
Core Network input
Core Network Output
FDL
O/E convertorO/E convertor
E/O convertorE/O convertor
Electronic BufferElectronic Buffer
Access
Network input
Core Network input
Core Network Output
FDL
II. METRO ACCESS AND METRO CORE ARCHITECTURES
According to the physical distribution of the network components, the bus, star and ring topologies can be implemented. Ring topologies have been widely adopted and studied for MAN because it is easy to construct and maintain with low cost, and bidirectional rings inherently provide fast restoration. Statistical multiplexing of data traffic flowing from different nodes over the shared medium provides efficient utilization of optical fibers. Some optical MANs in ring topologies are: Resilient Packet Ring (RPR), DBORN, ECOFRAME. DBORN [4][5] uses a double bus WDM rings topology with spectral separation and it functions in the asynchronous mode. This topology consists of two unidirectional buses: upstream and downstream. In the upstream bus, access nodes share a common transmission medium for carrying their traffic to a centralized node (hub) while the downstream bus carries traffic from Hub node to all access nodes. For the cost-effective solution, each ring node possesses passive components; lead in to the fact that they can not drop any transit packets in upstream line. Although of its simplicity, this architecture has several drawbacks as positional priority, fairness issues and bandwidth fragmentation. In our work we use synchronous DBORN version (slotted ring, fixed size packet) as a MA ring. Compared to the previously mentioned architecture, ECOFRAME [6] pays special attention to the deployment of optical technologies "low cost" to ensure good network performance while remaining competitive with electronic technology in terms of cost, service transparency and modularity. ECOFRAME ring uses fixed optical packet size, separate data and control channels and it can be used as MA and MC ring. In our work, ECOFRAME is used as a MC network.
III. STUDIED ARCHITECTURE
In this section, we present an architecture, which is composed of two segments: Access Network and Core Network (Fig. 1). For the access network synchronous DBORN architecture is considered and for core network ECOFRAME architecture. The interconnection is made via a hub node.
We distinguish two traffic flows: 1) the traffic flowing
from the access network to the core network through the hub,
and 2) the traffic flow circulating in the core network. In an
access node of MA, the electronic packets are encapsulated
in optical packets and transported through the hub. In the hub
O/E/O converter is used to build new optical packets fill well
coming from different nodes and going to same destination.
These packets are stored in the queue in the hub. Hub
architecture is presented in Fig; 2. It is composed of two
parts: electronic part and optical part. In the electronic part,
the packets are converted and stored in the buffer before
processing. In optical part, it is used FDL.
One of the roles of Hub is to create new optical packets
well filled. The creation of new optical packets can be made
using three mechanisms: 1) mutual combination (electronic
packets coming from different access nodes can be combined
Figure 1. Networks Interconnection
together), 2) local combination (combined with local
electronic packets of the hub) and 3) total combination (two
combinations mentioned), totally according to class of
service. According to the access control mechanism used in
the Hub, the optical packets coming from MA can be placed
directly in the optical buffers (to be ready to be routed
through the Hub) or they are converted in electronic packets
by O/E converter and wait in the electronic buffer
corresponding to their CoS until timer is expired and new
timer is reset. New optical packets are created using a packet
creation mechanism and are sent to the core network.
Figure 2. Architecture of Hub
We present a new packet creation mechanism in the
Section IV. At the Hub node, the packets in transit in the
core network have higher priority than traffic of access
network; therefore, the E/O converter is performed if there is
no packet in the optical FDL. The associated times to the
creation process are specified in Fig. 3. One of the problems
of interconnection between the rings is the synchronization
of timer between them. Each ring is already synchronized
but each one has different size of slot time and optical
packet. Therefore, it is needed to synchronize data inputs and
outputs at the Hub.
83Copyright (c) IARIA, 2011. ISBN: 978-1-61208-174-8
EMERGING 2011 : The Third International Conference on Emerging Network Intelligence
90 / 141
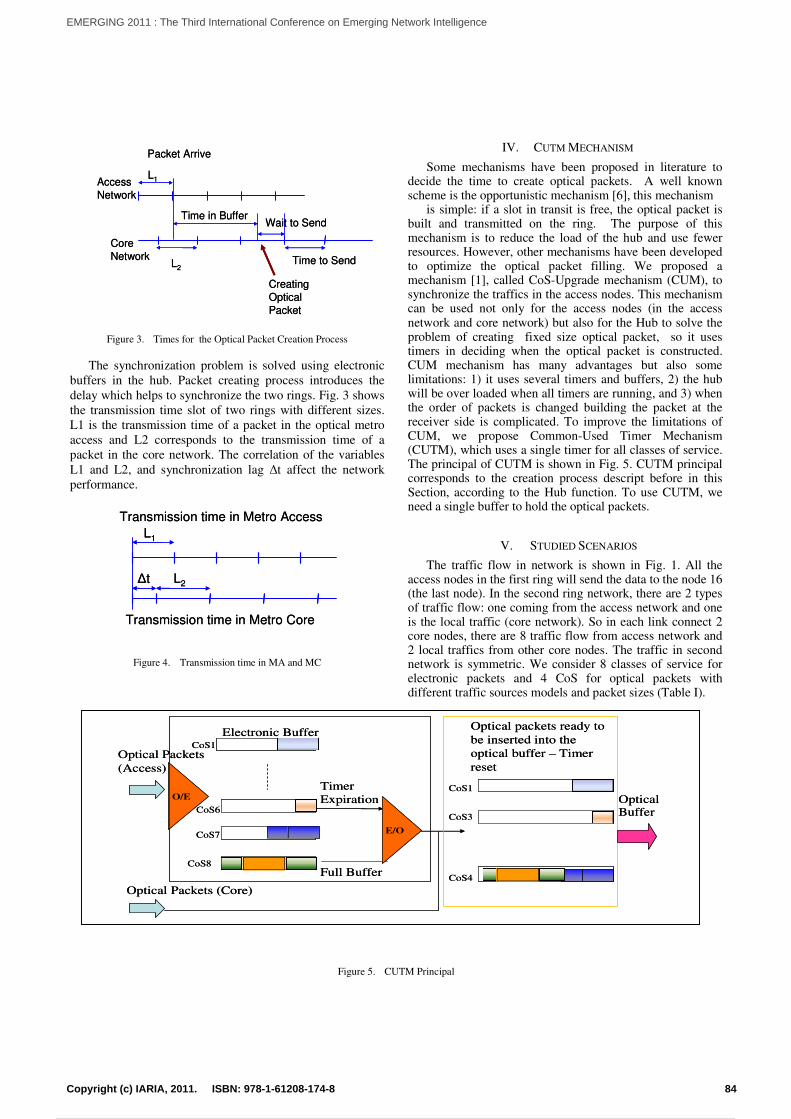
L1
L2∆t
Transmission time in Metro Access
Transmission time in Metro Core
L1
L2∆t
Transmission time in Metro Access
Transmission time in Metro Core
L1
L2Time to Send
Access
Network
Core
Network
Packet Arrive
Time in BufferWait to Send
Creating
Optical
Packet
L1
L2Time to Send
Access
Network
Core
Network
Packet Arrive
Time in BufferWait to Send
Creating
Optical
Packet
Timer
Expiration
Full Buffer
Optical Packets
(Access)
O/E
Electronic BufferCoS1
CoS8
CoS7E/O
CoS4
CoS1
CoS3
Optical packets ready to
be inserted into the
optical buffer – Timer
reset
Optical Packets (Core)
Optical BufferCoS6
Timer
Expiration
Full Buffer
Optical Packets
(Access)
O/E
Electronic BufferCoS1
CoS8
CoS7E/O
CoS4
CoS1
CoS3
Optical packets ready to
be inserted into the
optical buffer – Timer
reset
Optical Packets (Core)
Optical BufferCoS6
Figure 3. Times for the Optical Packet Creation Process
The synchronization problem is solved using electronic
buffers in the hub. Packet creating process introduces the
delay which helps to synchronize the two rings. Fig. 3 shows
the transmission time slot of two rings with different sizes.
L1 is the transmission time of a packet in the optical metro
access and L2 corresponds to the transmission time of a
packet in the core network. The correlation of the variables
L1 and L2, and synchronization lag ∆t affect the network
performance.
Figure 4. Transmission time in MA and MC
IV. CUTM MECHANISM
Some mechanisms have been proposed in literature to decide the time to create optical packets. A well known scheme is the opportunistic mechanism [6], this mechanism
is simple: if a slot in transit is free, the optical packet is built and transmitted on the ring. The purpose of this mechanism is to reduce the load of the hub and use fewer resources. However, other mechanisms have been developed to optimize the optical packet filling. We proposed a mechanism [1], called CoS-Upgrade mechanism (CUM), to synchronize the traffics in the access nodes. This mechanism can be used not only for the access nodes (in the access network and core network) but also for the Hub to solve the problem of creating fixed size optical packet, so it uses timers in deciding when the optical packet is constructed. CUM mechanism has many advantages but also some limitations: 1) it uses several timers and buffers, 2) the hub will be over loaded when all timers are running, and 3) when the order of packets is changed building the packet at the receiver side is complicated. To improve the limitations of CUM, we propose Common-Used Timer Mechanism (CUTM), which uses a single timer for all classes of service. The principal of CUTM is shown in Fig. 5. CUTM principal corresponds to the creation process descript before in this Section, according to the Hub function. To use CUTM, we need a single buffer to hold the optical packets.
V. STUDIED SCENARIOS
The traffic flow in network is shown in Fig. 1. All the access nodes in the first ring will send the data to the node 16 (the last node). In the second ring network, there are 2 types of traffic flow: one coming from the access network and one is the local traffic (core network). So in each link connect 2 core nodes, there are 8 traffic flow from access network and 2 local traffics from other core nodes. The traffic in second network is symmetric. We consider 8 classes of service for electronic packets and 4 CoS for optical packets with different traffic sources models and packet sizes (Table I).
Figure 5. CUTM Principal
84Copyright (c) IARIA, 2011. ISBN: 978-1-61208-174-8
EMERGING 2011 : The Third International Conference on Emerging Network Intelligence
91 / 141
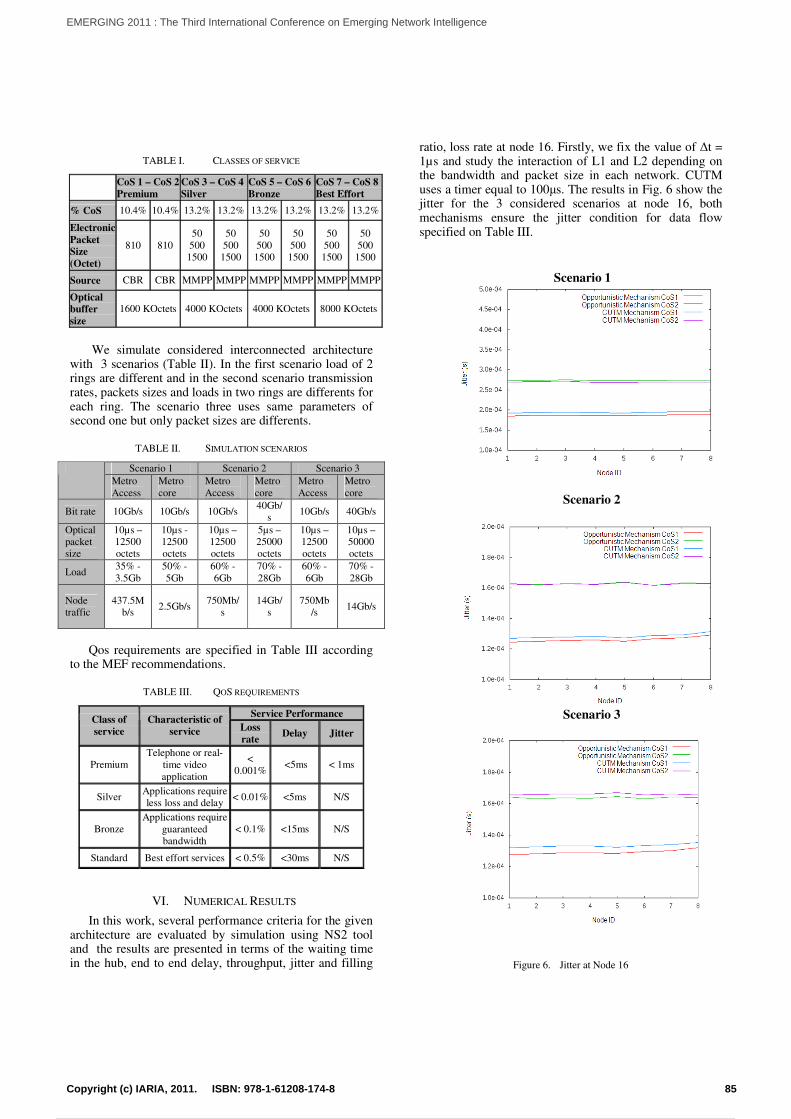
Scenario 1
Scenario 2
Scenario 3
TABLE I. CLASSES OF SERVICE
CoS 1 – CoS 2
Premium
CoS 3 – CoS 4
Silver
CoS 5 – CoS 6
Bronze
CoS 7 – CoS 8
Best Effort
% CoS 10.4% 10.4% 13.2% 13.2% 13.2% 13.2% 13.2% 13.2%
Electronic
Packet
Size
(Octet)
810 810
50
500
1500
50
500
1500
50
500
1500
50
500
1500
50
500
1500
50
500
1500
Source CBR CBR MMPP MMPP MMPP MMPP MMPP MMPP
Optical
buffer
size
1600 KOctets 4000 KOctets 4000 KOctets 8000 KOctets
We simulate considered interconnected architecture
with 3 scenarios (Table II). In the first scenario load of 2 rings are different and in the second scenario transmission rates, packets sizes and loads in two rings are differents for each ring. The scenario three uses same parameters of second one but only packet sizes are differents.
TABLE II. SIMULATION SCENARIOS
Scenario 1 Scenario 2 Scenario 3
Metro
Access
Metro
core
Metro
Access
Metro
core
Metro
Access
Metro
core
Bit rate 10Gb/s 10Gb/s 10Gb/s 40Gb/
s 10Gb/s 40Gb/s
Optical
packet
size
10µs –
12500
octets
10µs -
12500
octets
10µs –
12500
octets
5µs –
25000
octets
10µs –
12500
octets
10µs –
50000
octets
Load 35% -
3.5Gb
50% -
5Gb
60% -
6Gb
70% -
28Gb
60% -
6Gb
70% -
28Gb
Node
traffic
437.5M
b/s 2.5Gb/s
750Mb/
s
14Gb/
s
750Mb
/s 14Gb/s
Qos requirements are specified in Table III according
to the MEF recommendations.
TABLE III. QOS REQUIREMENTS
Service Performance Class of
service
Characteristic of
service Loss
rate Delay Jitter
Premium
Telephone or real-
time video
application
<
0.001% <5ms < 1ms
Silver Applications require
less loss and delay < 0.01% <5ms N/S
Bronze
Applications require
guaranteed
bandwidth
< 0.1% <15ms N/S
Standard Best effort services < 0.5% <30ms N/S
VI. NUMERICAL RESULTS
In this work, several performance criteria for the given architecture are evaluated by simulation using NS2 tool and the results are presented in terms of the waiting time in the hub, end to end delay, throughput, jitter and filling
ratio, loss rate at node 16. Firstly, we fix the value of ∆t = 1µs and study the interaction of L1 and L2 depending on the bandwidth and packet size in each network. CUTM uses a timer equal to 100µs. The results in Fig. 6 show the jitter for the 3 considered scenarios at node 16, both mechanisms ensure the jitter condition for data flow specified on Table III.
Figure 6. Jitter at Node 16
85Copyright (c) IARIA, 2011. ISBN: 978-1-61208-174-8
EMERGING 2011 : The Third International Conference on Emerging Network Intelligence
92 / 141
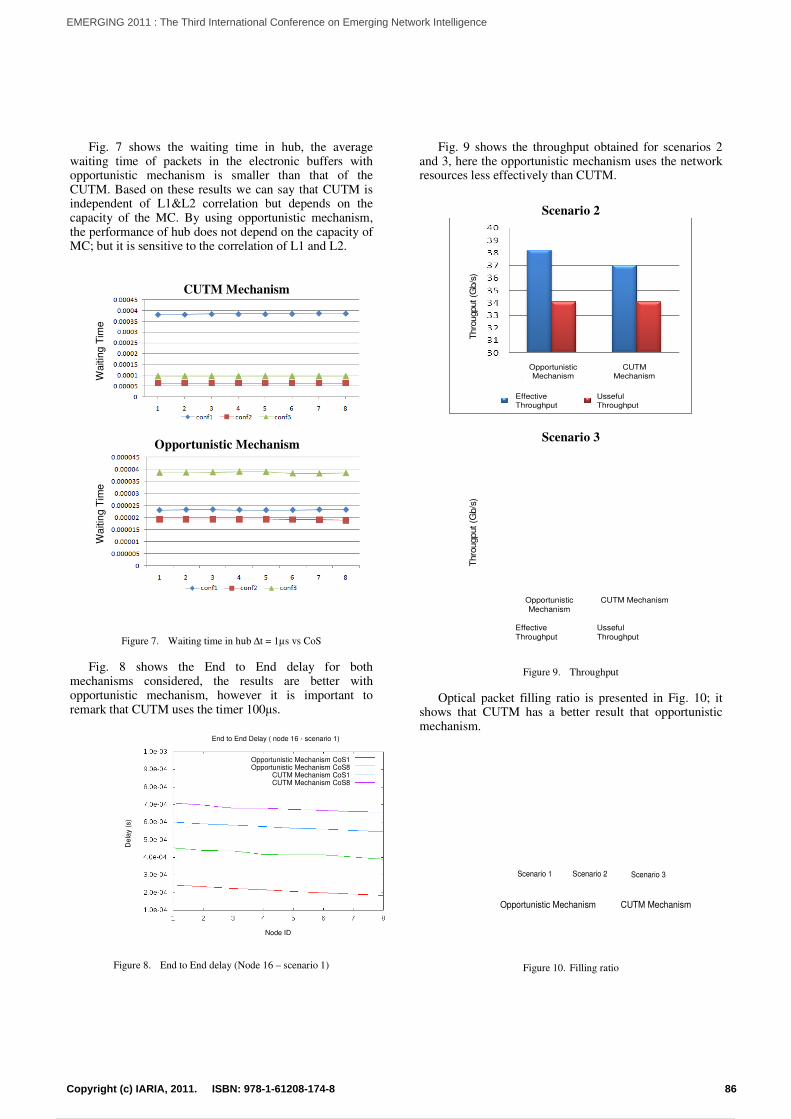
CUTM Mechanism
Waitin
g T
ime
Opportunistic Mechanism
Wa
itin
g T
ime
Opportunistic Mechanism CoS1Opportunistic Mechanism CoS8
CUTM Mechanism CoS1CUTM Mechanism CoS8
De
lay (
s)
End to End Delay ( node 16 - scenario 1)
Node ID
Opportunistic Mechanism CoS1Opportunistic Mechanism CoS8
CUTM Mechanism CoS1CUTM Mechanism CoS8
De
lay (
s)
End to End Delay ( node 16 - scenario 1)
Node ID
Scenario 2
Effective
Throughput
Usseful
Throughput
Thro
ugput (G
b/s
)
Opportunistic
Mechanism
CUTM
Mechanism
Effective
Throughput
Usseful
Throughput
Thro
ugput (G
b/s
)
Opportunistic
Mechanism
CUTM
Mechanism
Scenario 3
Effective
Throughput
Usseful
Throughput
Thro
ugput (G
b/s
)
Opportunistic
Mechanism
CUTM Mechanism
Effective
Throughput
Usseful
Throughput
Thro
ugput (G
b/s
)
Opportunistic
Mechanism
CUTM Mechanism
Scenario 1 Scenario 2 Scenario 3
Opportunistic Mechanism CUTM Mechanism
Scenario 1 Scenario 2 Scenario 3
Opportunistic Mechanism CUTM Mechanism
Fig. 7 shows the waiting time in hub, the average waiting time of packets in the electronic buffers with opportunistic mechanism is smaller than that of the CUTM. Based on these results we can say that CUTM is independent of L1&L2 correlation but depends on the capacity of the MC. By using opportunistic mechanism, the performance of hub does not depend on the capacity of MC; but it is sensitive to the correlation of L1 and L2.
Figure 7. Waiting time in hub ∆t = 1µs vs CoS
Fig. 8 shows the End to End delay for both mechanisms considered, the results are better with opportunistic mechanism, however it is important to remark that CUTM uses the timer 100µs.
Figure 8. End to End delay (Node 16 – scenario 1)
Fig. 9 shows the throughput obtained for scenarios 2 and 3, here the opportunistic mechanism uses the network resources less effectively than CUTM.
Figure 9. Throughput
Optical packet filling ratio is presented in Fig. 10; it shows that CUTM has a better result that opportunistic mechanism.
Figure 10. Filling ratio
86Copyright (c) IARIA, 2011. ISBN: 978-1-61208-174-8
EMERGING 2011 : The Third International Conference on Emerging Network Intelligence
93 / 141
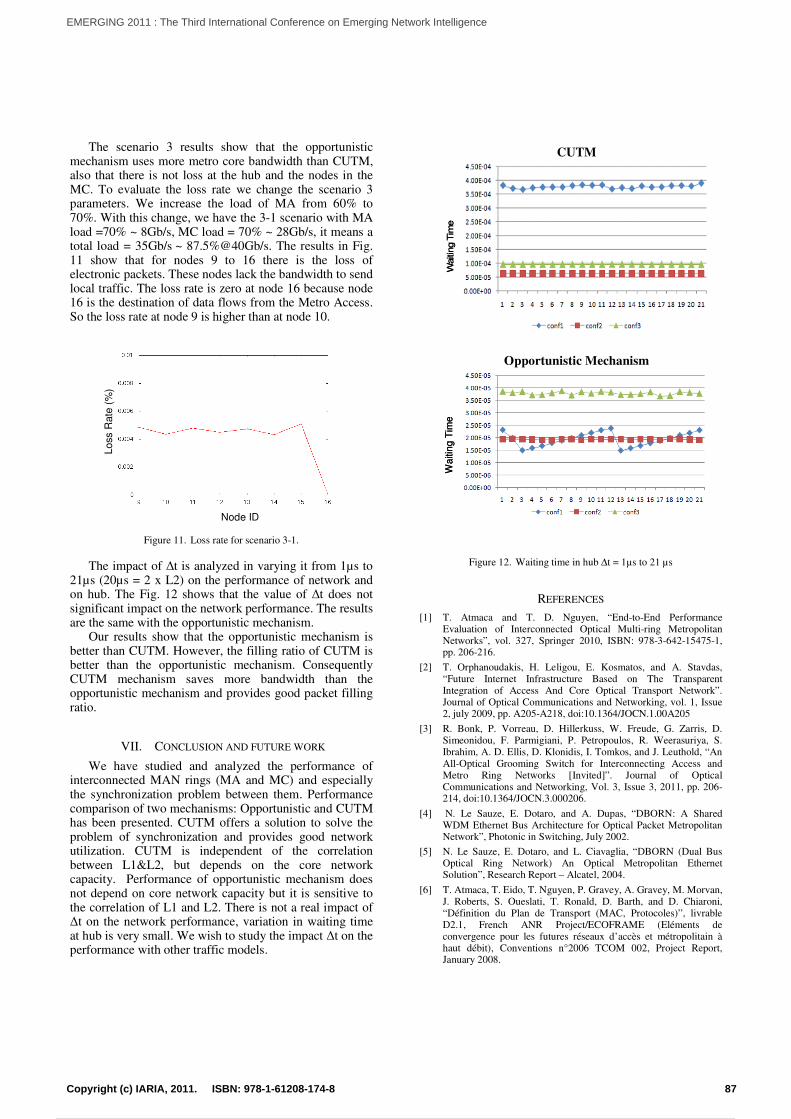
Node ID
Loss R
ate
(%
)
Node ID
Loss R
ate
(%
)
CUTM
Waitin
g T
ime
Waitin
g T
ime
Opportunistic Mechanism
Wa
itin
g T
ime
Wa
itin
g T
ime
The scenario 3 results show that the opportunistic mechanism uses more metro core bandwidth than CUTM, also that there is not loss at the hub and the nodes in the MC. To evaluate the loss rate we change the scenario 3 parameters. We increase the load of MA from 60% to 70%. With this change, we have the 3-1 scenario with MA load =70% ~ 8Gb/s, MC load = 70% ~ 28Gb/s, it means a total load = 35Gb/s ~ 87.5%@40Gb/s. The results in Fig. 11 show that for nodes 9 to 16 there is the loss of electronic packets. These nodes lack the bandwidth to send local traffic. The loss rate is zero at node 16 because node 16 is the destination of data flows from the Metro Access. So the loss rate at node 9 is higher than at node 10.
Figure 11. Loss rate for scenario 3-1.
The impact of ∆t is analyzed in varying it from 1µs to 21µs (20µs = 2 x L2) on the performance of network and on hub. The Fig. 12 shows that the value of ∆t does not significant impact on the network performance. The results are the same with the opportunistic mechanism.
Our results show that the opportunistic mechanism is better than CUTM. However, the filling ratio of CUTM is better than the opportunistic mechanism. Consequently CUTM mechanism saves more bandwidth than the opportunistic mechanism and provides good packet filling ratio.
VII. CONCLUSION AND FUTURE WORK
We have studied and analyzed the performance of interconnected MAN rings (MA and MC) and especially the synchronization problem between them. Performance comparison of two mechanisms: Opportunistic and CUTM has been presented. CUTM offers a solution to solve the problem of synchronization and provides good network utilization. CUTM is independent of the correlation between L1&L2, but depends on the core network capacity. Performance of opportunistic mechanism does not depend on core network capacity but it is sensitive to the correlation of L1 and L2. There is not a real impact of ∆t on the network performance, variation in waiting time at hub is very small. We wish to study the impact ∆t on the performance with other traffic models.
Figure 12. Waiting time in hub ∆t = 1µs to 21 µs
REFERENCES
[1] T. Atmaca and T. D. Nguyen, “End-to-End Performance Evaluation of Interconnected Optical Multi-ring Metropolitan Networks”, vol. 327, Springer 2010, ISBN: 978-3-642-15475-1, pp. 206-216.
[2] T. Orphanoudakis, H. Leligou, E. Kosmatos, and A. Stavdas, “Future Internet Infrastructure Based on The Transparent Integration of Access And Core Optical Transport Network”. Journal of Optical Communications and Networking, vol. 1, Issue 2, july 2009, pp. A205-A218, doi:10.1364/JOCN.1.00A205
[3] R. Bonk, P. Vorreau, D. Hillerkuss, W. Freude, G. Zarris, D. Simeonidou, F. Parmigiani, P. Petropoulos, R. Weerasuriya, S. Ibrahim, A. D. Ellis, D. Klonidis, I. Tomkos, and J. Leuthold, “An All-Optical Grooming Switch for Interconnecting Access and Metro Ring Networks [Invited]”. Journal of Optical Communications and Networking, Vol. 3, Issue 3, 2011, pp. 206-214, doi:10.1364/JOCN.3.000206.
[4] N. Le Sauze, E. Dotaro, and A. Dupas, “DBORN: A Shared WDM Ethernet Bus Architecture for Optical Packet Metropolitan Network”, Photonic in Switching, July 2002.
[5] N. Le Sauze, E. Dotaro, and L. Ciavaglia, “DBORN (Dual Bus Optical Ring Network) An Optical Metropolitan Ethernet Solution”, Research Report – Alcatel, 2004.
[6] T. Atmaca, T. Eido, T. Nguyen, P. Gravey, A. Gravey, M. Morvan, J. Roberts, S. Oueslati, T. Ronald, D. Barth, and D. Chiaroni, “Définition du Plan de Transport (MAC, Protocoles)”, livrable D2.1, French ANR Project/ECOFRAME (Eléments de convergence pour les futures réseaux d’accès et métropolitain à haut débit), Conventions n°2006 TCOM 002, Project Report, January 2008.
87Copyright (c) IARIA, 2011. ISBN: 978-1-61208-174-8
EMERGING 2011 : The Third International Conference on Emerging Network Intelligence
94 / 141
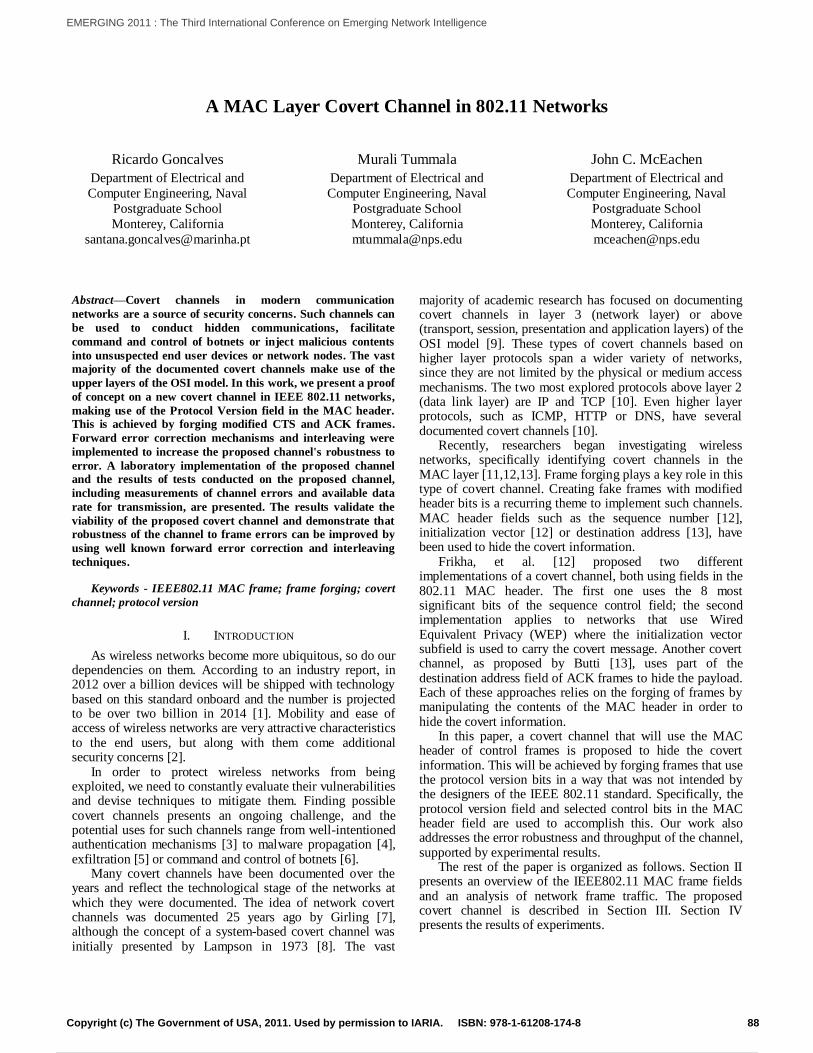
A MAC Layer Covert Channel in 802.11 Networks
Ricardo Goncalves
Department of Electrical and
Computer Engineering, Naval
Postgraduate School
Monterey, California
Murali Tummala
Department of Electrical and
Computer Engineering, Naval
Postgraduate School
Monterey, California
John C. McEachen
Department of Electrical and
Computer Engineering, Naval
Postgraduate School
Monterey, California
Abstract—Covert channels in modern communication
networks are a source of security concerns. Such channels can
be used to conduct hidden communications, facilitate
command and control of botnets or inject malicious contents
into unsuspected end user devices or network nodes. The vast
majority of the documented covert channels make use of the
upper layers of the OSI model. In this work, we present a proof
of concept on a new covert channel in IEEE 802.11 networks,
making use of the Protocol Version field in the MAC header.
This is achieved by forging modified CTS and ACK frames.
Forward error correction mechanisms and interleaving were
implemented to increase the proposed channel's robustness to
error. A laboratory implementation of the proposed channel
and the results of tests conducted on the proposed channel,
including measurements of channel errors and available data
rate for transmission, are presented. The results validate the
viability of the proposed covert channel and demonstrate that
robustness of the channel to frame errors can be improved by
using well known forward error correction and interleaving
techniques.
Keywords - IEEE802.11 MAC frame; frame forging; covert
channel; protocol version
I. INTRODUCTION
As wireless networks become more ubiquitous, so do our dependencies on them. According to an industry report, in 2012 over a billion devices will be shipped with technology based on this standard onboard and the number is projected to be over two billion in 2014 [1]. Mobility and ease of access of wireless networks are very attractive characteristics to the end users, but along with them come additional security concerns [2].
In order to protect wireless networks from being exploited, we need to constantly evaluate their vulnerabilities and devise techniques to mitigate them. Finding possible covert channels presents an ongoing challenge, and the potential uses for such channels range from well-intentioned authentication mechanisms [3] to malware propagation [4], exfiltration [5] or command and control of botnets [6].
Many covert channels have been documented over the years and reflect the technological stage of the networks at which they were documented. The idea of network covert channels was documented 25 years ago by Girling [7], although the concept of a system-based covert channel was initially presented by Lampson in 1973 [8]. The vast
majority of academic research has focused on documenting covert channels in layer 3 (network layer) or above (transport, session, presentation and application layers) of the OSI model [9]. These types of covert channels based on higher layer protocols span a wider variety of networks, since they are not limited by the physical or medium access mechanisms. The two most explored protocols above layer 2 (data link layer) are IP and TCP [10]. Even higher layer protocols, such as ICMP, HTTP or DNS, have several documented covert channels [10].
Recently, researchers began investigating wireless networks, specifically identifying covert channels in the MAC layer [11,12,13]. Frame forging plays a key role in this type of covert channel. Creating fake frames with modified header bits is a recurring theme to implement such channels. MAC header fields such as the sequence number [12], initialization vector [12] or destination address [13], have been used to hide the covert information.
Frikha, et al. [12] proposed two different implementations of a covert channel, both using fields in the 802.11 MAC header. The first one uses the 8 most significant bits of the sequence control field; the second implementation applies to networks that use Wired Equivalent Privacy (WEP) where the initialization vector subfield is used to carry the covert message. Another covert channel, as proposed by Butti [13], uses part of the destination address field of ACK frames to hide the payload. Each of these approaches relies on the forging of frames by manipulating the contents of the MAC header in order to hide the covert information.
In this paper, a covert channel that will use the MAC header of control frames is proposed to hide the covert information. This will be achieved by forging frames that use the protocol version bits in a way that was not intended by the designers of the IEEE 802.11 standard. Specifically, the protocol version field and selected control bits in the MAC header field are used to accomplish this. Our work also addresses the error robustness and throughput of the channel, supported by experimental results.
The rest of the paper is organized as follows. Section II presents an overview of the IEEE802.11 MAC frame fields and an analysis of network frame traffic. The proposed covert channel is described in Section III. Section IV presents the results of experiments.
88Copyright (c) The Government of USA, 2011. Used by permission to IARIA. ISBN: 978-1-61208-174-8
EMERGING 2011 : The Third International Conference on Emerging Network Intelligence
95 / 141
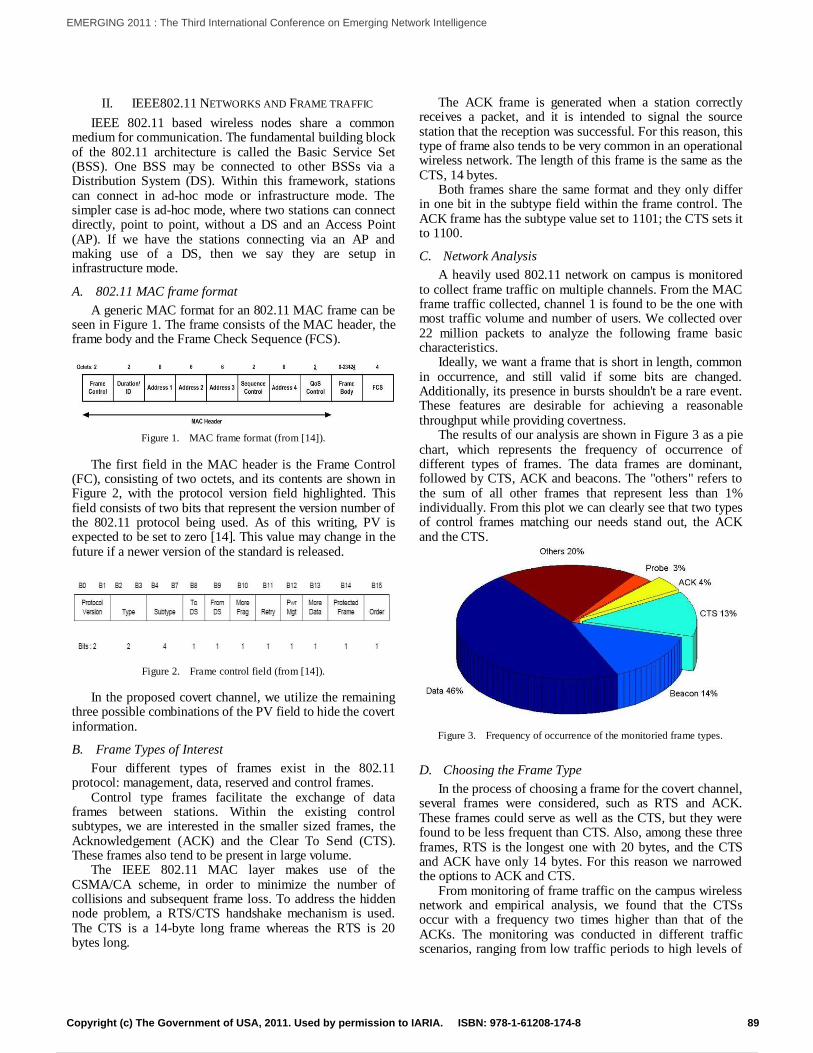
II. IEEE802.11 NETWORKS AND FRAME TRAFFIC
IEEE 802.11 based wireless nodes share a common medium for communication. The fundamental building block of the 802.11 architecture is called the Basic Service Set (BSS). One BSS may be connected to other BSSs via a Distribution System (DS). Within this framework, stations can connect in ad-hoc mode or infrastructure mode. The simpler case is ad-hoc mode, where two stations can connect directly, point to point, without a DS and an Access Point (AP). If we have the stations connecting via an AP and making use of a DS, then we say they are setup in infrastructure mode.
A. 802.11 MAC frame format
A generic MAC format for an 802.11 MAC frame can be seen in Figure 1. The frame consists of the MAC header, the frame body and the Frame Check Sequence (FCS).
Figure 1. MAC frame format (from [14]).
The first field in the MAC header is the Frame Control (FC), consisting of two octets, and its contents are shown in Figure 2, with the protocol version field highlighted. This field consists of two bits that represent the version number of the 802.11 protocol being used. As of this writing, PV is expected to be set to zero [14]. This value may change in the future if a newer version of the standard is released.
Figure 2. Frame control field (from [14]).
In the proposed covert channel, we utilize the remaining three possible combinations of the PV field to hide the covert information.
B. Frame Types of Interest
Four different types of frames exist in the 802.11 protocol: management, data, reserved and control frames.
Control type frames facilitate the exchange of data frames between stations. Within the existing control subtypes, we are interested in the smaller sized frames, the Acknowledgement (ACK) and the Clear To Send (CTS). These frames also tend to be present in large volume.
The IEEE 802.11 MAC layer makes use of the CSMA/CA scheme, in order to minimize the number of collisions and subsequent frame loss. To address the hidden node problem, a RTS/CTS handshake mechanism is used. The CTS is a 14-byte long frame whereas the RTS is 20 bytes long.
The ACK frame is generated when a station correctly receives a packet, and it is intended to signal the source station that the reception was successful. For this reason, this type of frame also tends to be very common in an operational wireless network. The length of this frame is the same as the CTS, 14 bytes.
Both frames share the same format and they only differ in one bit in the subtype field within the frame control. The ACK frame has the subtype value set to 1101; the CTS sets it to 1100.
C. Network Analysis
A heavily used 802.11 network on campus is monitored to collect frame traffic on multiple channels. From the MAC frame traffic collected, channel 1 is found to be the one with most traffic volume and number of users. We collected over 22 million packets to analyze the following frame basic characteristics.
Ideally, we want a frame that is short in length, common in occurrence, and still valid if some bits are changed. Additionally, its presence in bursts shouldn't be a rare event. These features are desirable for achieving a reasonable throughput while providing covertness.
The results of our analysis are shown in Figure 3 as a pie chart, which represents the frequency of occurrence of different types of frames. The data frames are dominant, followed by CTS, ACK and beacons. The "others" refers to the sum of all other frames that represent less than 1% individually. From this plot we can clearly see that two types of control frames matching our needs stand out, the ACK and the CTS.
Figure 3. Frequency of occurrence of the monitoried frame types.
D. Choosing the Frame Type
In the process of choosing a frame for the covert channel, several frames were considered, such as RTS and ACK. These frames could serve as well as the CTS, but they were found to be less frequent than CTS. Also, among these three frames, RTS is the longest one with 20 bytes, and the CTS and ACK have only 14 bytes. For this reason we narrowed the options to ACK and CTS.
From monitoring of frame traffic on the campus wireless network and empirical analysis, we found that the CTSs occur with a frequency two times higher than that of the ACKs. The monitoring was conducted in different traffic scenarios, ranging from low traffic periods to high levels of
89Copyright (c) The Government of USA, 2011. Used by permission to IARIA. ISBN: 978-1-61208-174-8
EMERGING 2011 : The Third International Conference on Emerging Network Intelligence
96 / 141
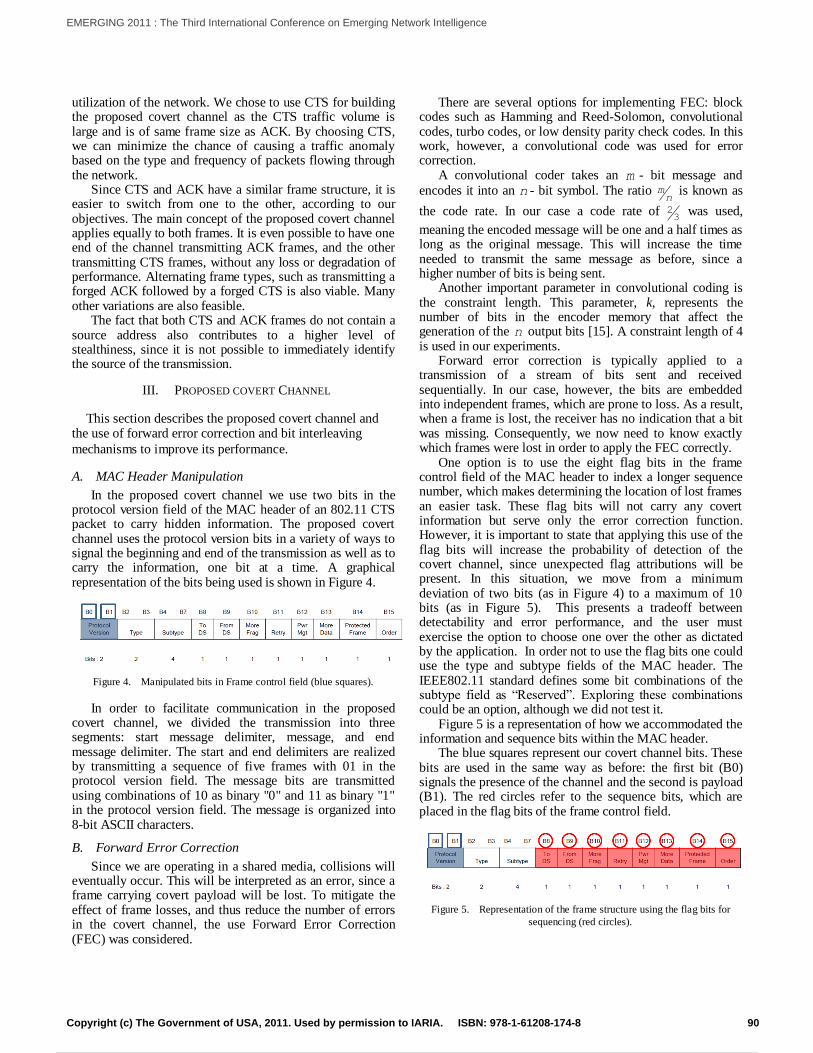
utilization of the network. We chose to use CTS for building the proposed covert channel as the CTS traffic volume is large and is of same frame size as ACK. By choosing CTS, we can minimize the chance of causing a traffic anomaly based on the type and frequency of packets flowing through the network.
Since CTS and ACK have a similar frame structure, it is easier to switch from one to the other, according to our objectives. The main concept of the proposed covert channel applies equally to both frames. It is even possible to have one end of the channel transmitting ACK frames, and the other transmitting CTS frames, without any loss or degradation of performance. Alternating frame types, such as transmitting a forged ACK followed by a forged CTS is also viable. Many other variations are also feasible.
The fact that both CTS and ACK frames do not contain a source address also contributes to a higher level of stealthiness, since it is not possible to immediately identify the source of the transmission.
III. PROPOSED COVERT CHANNEL
This section describes the proposed covert channel and the use of forward error correction and bit interleaving
mechanisms to improve its performance.
A. MAC Header Manipulation
In the proposed covert channel we use two bits in the protocol version field of the MAC header of an 802.11 CTS packet to carry hidden information. The proposed covert channel uses the protocol version bits in a variety of ways to signal the beginning and end of the transmission as well as to carry the information, one bit at a time. A graphical representation of the bits being used is shown in Figure 4.
Figure 4. Manipulated bits in Frame control field (blue squares).
In order to facilitate communication in the proposed covert channel, we divided the transmission into three segments: start message delimiter, message, and end message delimiter. The start and end delimiters are realized by transmitting a sequence of five frames with 01 in the protocol version field. The message bits are transmitted using combinations of 10 as binary "0" and 11 as binary "1" in the protocol version field. The message is organized into 8-bit ASCII characters.
B. Forward Error Correction
Since we are operating in a shared media, collisions will eventually occur. This will be interpreted as an error, since a frame carrying covert payload will be lost. To mitigate the effect of frame losses, and thus reduce the number of errors in the covert channel, the use Forward Error Correction (FEC) was considered.
There are several options for implementing FEC: block codes such as Hamming and Reed-Solomon, convolutional codes, turbo codes, or low density parity check codes. In this work, however, a convolutional code was used for error correction.
A convolutional coder takes an m - bit message and
encodes it into an n - bit symbol. The ratio mn
is known as
the code rate. In our case a code rate of 23
was used,
meaning the encoded message will be one and a half times as long as the original message. This will increase the time needed to transmit the same message as before, since a higher number of bits is being sent.
Another important parameter in convolutional coding is the constraint length. This parameter, k, represents the number of bits in the encoder memory that affect the generation of the n output bits [15]. A constraint length of 4 is used in our experiments.
Forward error correction is typically applied to a transmission of a stream of bits sent and received sequentially. In our case, however, the bits are embedded into independent frames, which are prone to loss. As a result, when a frame is lost, the receiver has no indication that a bit was missing. Consequently, we now need to know exactly which frames were lost in order to apply the FEC correctly.
One option is to use the eight flag bits in the frame control field of the MAC header to index a longer sequence number, which makes determining the location of lost frames an easier task. These flag bits will not carry any covert information but serve only the error correction function. However, it is important to state that applying this use of the flag bits will increase the probability of detection of the covert channel, since unexpected flag attributions will be present. In this situation, we move from a minimum deviation of two bits (as in Figure 4) to a maximum of 10 bits (as in Figure 5). This presents a tradeoff between detectability and error performance, and the user must exercise the option to choose one over the other as dictated by the application. In order not to use the flag bits one could use the type and subtype fields of the MAC header. The IEEE802.11 standard defines some bit combinations of the subtype field as “Reserved”. Exploring these combinations could be an option, although we did not test it.
Figure 5 is a representation of how we accommodated the information and sequence bits within the MAC header.
The blue squares represent our covert channel bits. These bits are used in the same way as before: the first bit (B0) signals the presence of the channel and the second is payload (B1). The red circles refer to the sequence bits, which are placed in the flag bits of the frame control field.
Figure 5. Representation of the frame structure using the flag bits for
sequencing (red circles).
90Copyright (c) The Government of USA, 2011. Used by permission to IARIA. ISBN: 978-1-61208-174-8
EMERGING 2011 : The Third International Conference on Emerging Network Intelligence
97 / 141
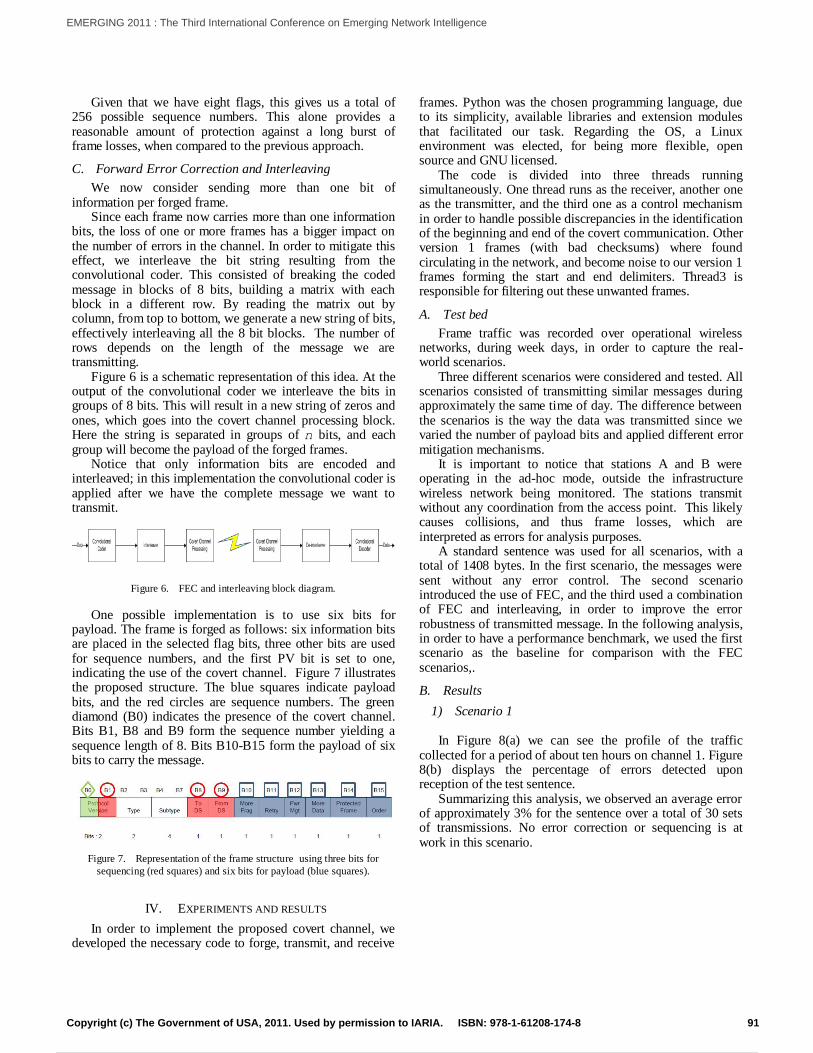
Given that we have eight flags, this gives us a total of 256 possible sequence numbers. This alone provides a reasonable amount of protection against a long burst of frame losses, when compared to the previous approach.
C. Forward Error Correction and Interleaving
We now consider sending more than one bit of information per forged frame.
Since each frame now carries more than one information bits, the loss of one or more frames has a bigger impact on the number of errors in the channel. In order to mitigate this effect, we interleave the bit string resulting from the convolutional coder. This consisted of breaking the coded message in blocks of 8 bits, building a matrix with each block in a different row. By reading the matrix out by column, from top to bottom, we generate a new string of bits, effectively interleaving all the 8 bit blocks. The number of rows depends on the length of the message we are transmitting.
Figure 6 is a schematic representation of this idea. At the output of the convolutional coder we interleave the bits in groups of 8 bits. This will result in a new string of zeros and ones, which goes into the covert channel processing block. Here the string is separated in groups of n bits, and each group will become the payload of the forged frames.
Notice that only information bits are encoded and interleaved; in this implementation the convolutional coder is applied after we have the complete message we want to transmit.
Figure 6. FEC and interleaving block diagram.
One possible implementation is to use six bits for payload. The frame is forged as follows: six information bits are placed in the selected flag bits, three other bits are used for sequence numbers, and the first PV bit is set to one, indicating the use of the covert channel. Figure 7 illustrates the proposed structure. The blue squares indicate payload bits, and the red circles are sequence numbers. The green diamond (B0) indicates the presence of the covert channel. Bits B1, B8 and B9 form the sequence number yielding a sequence length of 8. Bits B10-B15 form the payload of six bits to carry the message.
Figure 7. Representation of the frame structure using three bits for
sequencing (red squares) and six bits for payload (blue squares).
IV. EXPERIMENTS AND RESULTS
In order to implement the proposed covert channel, we developed the necessary code to forge, transmit, and receive
frames. Python was the chosen programming language, due to its simplicity, available libraries and extension modules that facilitated our task. Regarding the OS, a Linux environment was elected, for being more flexible, open source and GNU licensed.
The code is divided into three threads running simultaneously. One thread runs as the receiver, another one as the transmitter, and the third one as a control mechanism in order to handle possible discrepancies in the identification of the beginning and end of the covert communication. Other version 1 frames (with bad checksums) where found circulating in the network, and become noise to our version 1 frames forming the start and end delimiters. Thread3 is responsible for filtering out these unwanted frames.
A. Test bed
Frame traffic was recorded over operational wireless networks, during week days, in order to capture the real-world scenarios.
Three different scenarios were considered and tested. All scenarios consisted of transmitting similar messages during approximately the same time of day. The difference between the scenarios is the way the data was transmitted since we varied the number of payload bits and applied different error mitigation mechanisms.
It is important to notice that stations A and B were operating in the ad-hoc mode, outside the infrastructure wireless network being monitored. The stations transmit without any coordination from the access point. This likely causes collisions, and thus frame losses, which are interpreted as errors for analysis purposes.
A standard sentence was used for all scenarios, with a total of 1408 bytes. In the first scenario, the messages were sent without any error control. The second scenario introduced the use of FEC, and the third used a combination of FEC and interleaving, in order to improve the error robustness of transmitted message. In the following analysis, in order to have a performance benchmark, we used the first scenario as the baseline for comparison with the FEC scenarios,.
B. Results
1) Scenario 1
In Figure 8(a) we can see the profile of the traffic collected for a period of about ten hours on channel 1. Figure 8(b) displays the percentage of errors detected upon reception of the test sentence.
Summarizing this analysis, we observed an average error of approximately 3% for the sentence over a total of 30 sets of transmissions. No error correction or sequencing is at work in this scenario.
91Copyright (c) The Government of USA, 2011. Used by permission to IARIA. ISBN: 978-1-61208-174-8
EMERGING 2011 : The Third International Conference on Emerging Network Intelligence
98 / 141
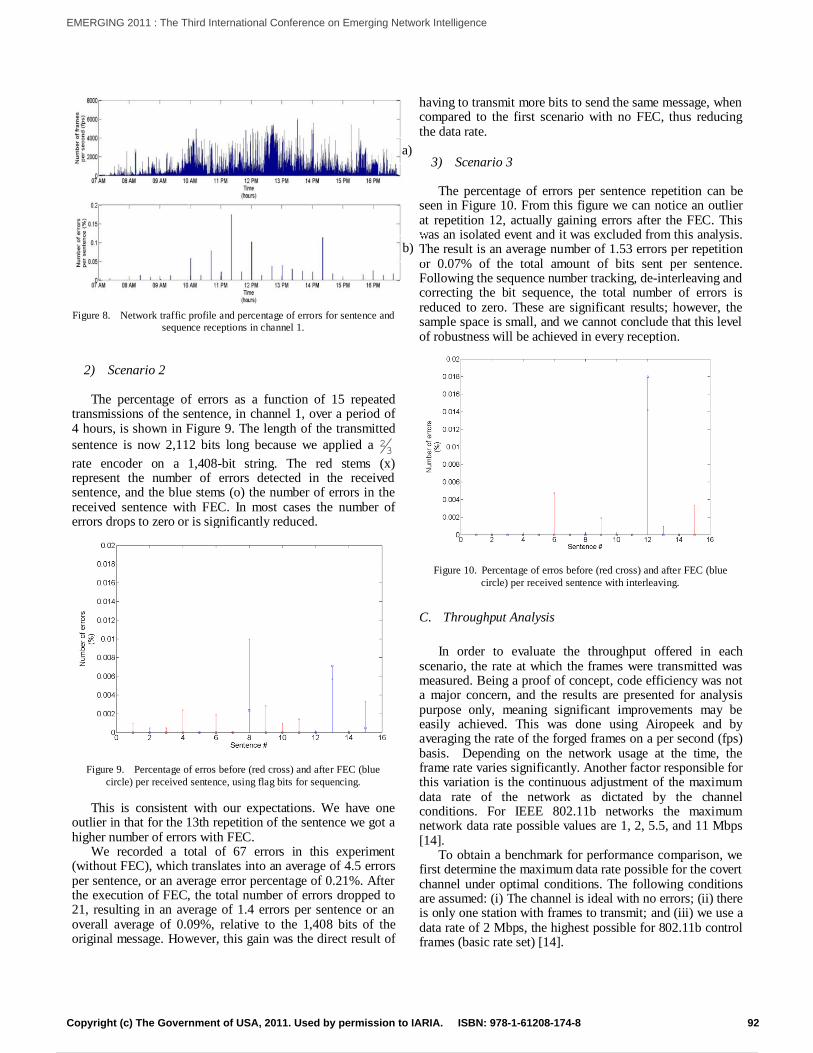
Figure 8. Network traffic profile and percentage of errors for sentence and
sequence receptions in channel 1.
2) Scenario 2
The percentage of errors as a function of 15 repeated transmissions of the sentence, in channel 1, over a period of 4 hours, is shown in Figure 9. The length of the transmitted
sentence is now 2,112 bits long because we applied a 23
rate encoder on a 1,408-bit string. The red stems (x) represent the number of errors detected in the received sentence, and the blue stems (o) the number of errors in the received sentence with FEC. In most cases the number of errors drops to zero or is significantly reduced.
Figure 9. Percentage of erros before (red cross) and after FEC (blue
circle) per received sentence, using flag bits for sequencing.
This is consistent with our expectations. We have one outlier in that for the 13th repetition of the sentence we got a higher number of errors with FEC.
We recorded a total of 67 errors in this experiment (without FEC), which translates into an average of 4.5 errors per sentence, or an average error percentage of 0.21%. After the execution of FEC, the total number of errors dropped to 21, resulting in an average of 1.4 errors per sentence or an overall average of 0.09%, relative to the 1,408 bits of the original message. However, this gain was the direct result of
having to transmit more bits to send the same message, when compared to the first scenario with no FEC, thus reducing the data rate.
3) Scenario 3 The percentage of errors per sentence repetition can be
seen in Figure 10. From this figure we can notice an outlier at repetition 12, actually gaining errors after the FEC. This was an isolated event and it was excluded from this analysis. The result is an average number of 1.53 errors per repetition or 0.07% of the total amount of bits sent per sentence. Following the sequence number tracking, de-interleaving and correcting the bit sequence, the total number of errors is reduced to zero. These are significant results; however, the sample space is small, and we cannot conclude that this level of robustness will be achieved in every reception.
Figure 10. Percentage of erros before (red cross) and after FEC (blue
circle) per received sentence with interleaving.
C. Throughput Analysis
In order to evaluate the throughput offered in each
scenario, the rate at which the frames were transmitted was measured. Being a proof of concept, code efficiency was not a major concern, and the results are presented for analysis purpose only, meaning significant improvements may be easily achieved. This was done using Airopeek and by averaging the rate of the forged frames on a per second (fps) basis. Depending on the network usage at the time, the frame rate varies significantly. Another factor responsible for this variation is the continuous adjustment of the maximum data rate of the network as dictated by the channel conditions. For IEEE 802.11b networks the maximum network data rate possible values are 1, 2, 5.5, and 11 Mbps [14].
To obtain a benchmark for performance comparison, we first determine the maximum data rate possible for the covert channel under optimal conditions. The following conditions are assumed: (i) The channel is ideal with no errors; (ii) there is only one station with frames to transmit; and (iii) we use a data rate of 2 Mbps, the highest possible for 802.11b control frames (basic rate set) [14].
a)
b)
92Copyright (c) The Government of USA, 2011. Used by permission to IARIA. ISBN: 978-1-61208-174-8
EMERGING 2011 : The Third International Conference on Emerging Network Intelligence
99 / 141
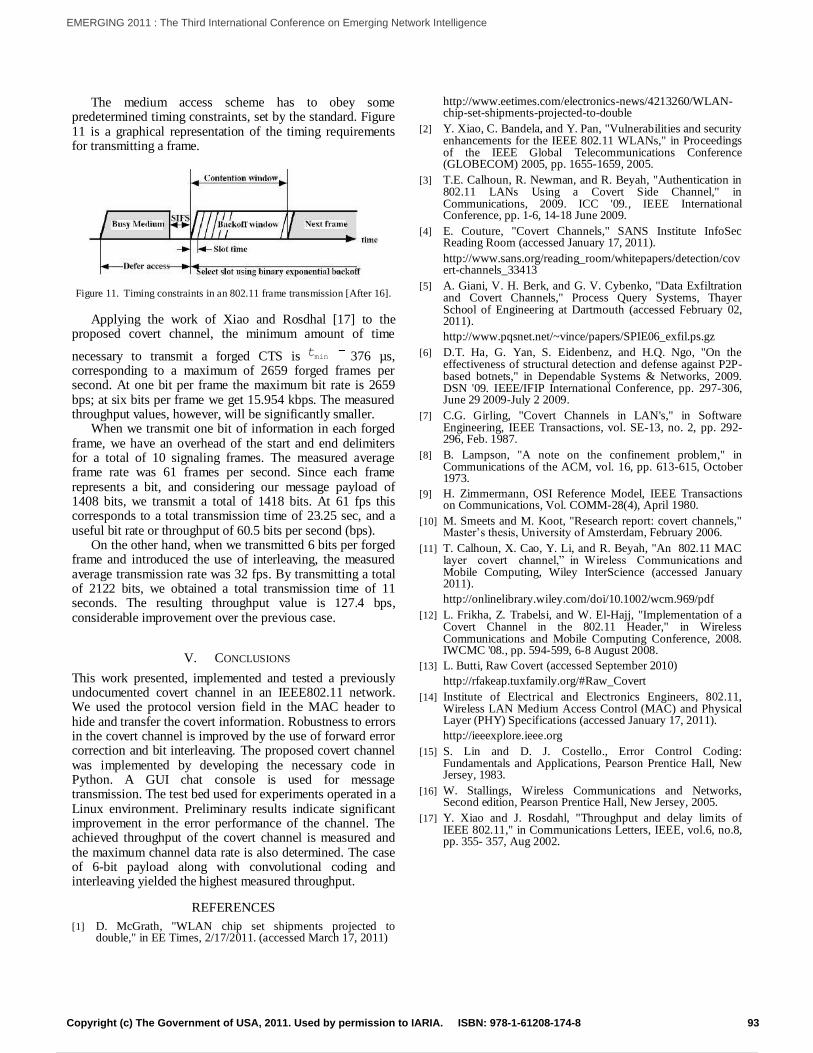
The medium access scheme has to obey some predetermined timing constraints, set by the standard. Figure 11 is a graphical representation of the timing requirements for transmitting a frame.
Figure 11. Timing constraints in an 802.11 frame transmission [After 16].
Applying the work of Xiao and Rosdhal [17] to the proposed covert channel, the minimum amount of time
necessary to transmit a forged CTS is mint 376 µs,
corresponding to a maximum of 2659 forged frames per second. At one bit per frame the maximum bit rate is 2659 bps; at six bits per frame we get 15.954 kbps. The measured throughput values, however, will be significantly smaller.
When we transmit one bit of information in each forged frame, we have an overhead of the start and end delimiters for a total of 10 signaling frames. The measured average frame rate was 61 frames per second. Since each frame represents a bit, and considering our message payload of 1408 bits, we transmit a total of 1418 bits. At 61 fps this corresponds to a total transmission time of 23.25 sec, and a useful bit rate or throughput of 60.5 bits per second (bps).
On the other hand, when we transmitted 6 bits per forged frame and introduced the use of interleaving, the measured average transmission rate was 32 fps. By transmitting a total of 2122 bits, we obtained a total transmission time of 11 seconds. The resulting throughput value is 127.4 bps, considerable improvement over the previous case.
V. CONCLUSIONS
This work presented, implemented and tested a previously undocumented covert channel in an IEEE802.11 network. We used the protocol version field in the MAC header to hide and transfer the covert information. Robustness to errors in the covert channel is improved by the use of forward error correction and bit interleaving. The proposed covert channel was implemented by developing the necessary code in Python. A GUI chat console is used for message transmission. The test bed used for experiments operated in a Linux environment. Preliminary results indicate significant improvement in the error performance of the channel. The achieved throughput of the covert channel is measured and the maximum channel data rate is also determined. The case of 6-bit payload along with convolutional coding and interleaving yielded the highest measured throughput.
REFERENCES
[1] D. McGrath, "WLAN chip set shipments projected to double," in EE Times, 2/17/2011. (accessed March 17, 2011)
http://www.eetimes.com/electronics-news/4213260/WLAN-chip-set-shipments-projected-to-double
[2] Y. Xiao, C. Bandela, and Y. Pan, "Vulnerabilities and security enhancements for the IEEE 802.11 WLANs," in Proceedings of the IEEE Global Telecommunications Conference (GLOBECOM) 2005, pp. 1655-1659, 2005.
[3] T.E. Calhoun, R. Newman, and R. Beyah, "Authentication in 802.11 LANs Using a Covert Side Channel," in Communications, 2009. ICC '09., IEEE International Conference, pp. 1-6, 14-18 June 2009.
[4] E. Couture, "Covert Channels," SANS Institute InfoSec Reading Room (accessed January 17, 2011).
http://www.sans.org/reading_room/whitepapers/detection/covert-channels_33413
[5] A. Giani, V. H. Berk, and G. V. Cybenko, "Data Exfiltration and Covert Channels," Process Query Systems, Thayer School of Engineering at Dartmouth (accessed February 02, 2011).
http://www.pqsnet.net/~vince/papers/SPIE06_exfil.ps.gz
[6] D.T. Ha, G. Yan, S. Eidenbenz, and H.Q. Ngo, "On the effectiveness of structural detection and defense against P2P-based botnets," in Dependable Systems & Networks, 2009. DSN '09. IEEE/IFIP International Conference, pp. 297-306, June 29 2009-July 2 2009.
[7] C.G. Girling, "Covert Channels in LAN's," in Software Engineering, IEEE Transactions, vol. SE-13, no. 2, pp. 292-296, Feb. 1987.
[8] B. Lampson, "A note on the confinement problem," in Communications of the ACM, vol. 16, pp. 613-615, October 1973.
[9] H. Zimmermann, OSI Reference Model, IEEE Transactions on Communications, Vol. COMM-28(4), April 1980.
[10] M. Smeets and M. Koot, "Research report: covert channels," Master’s thesis, University of Amsterdam, February 2006.
[11] T. Calhoun, X. Cao, Y. Li, and R. Beyah, "An 802.11 MAC layer covert channel,” in Wireless Communications and Mobile Computing, Wiley InterScience (accessed January 2011).
http://onlinelibrary.wiley.com/doi/10.1002/wcm.969/pdf
[12] L. Frikha, Z. Trabelsi, and W. El-Hajj, "Implementation of a Covert Channel in the 802.11 Header," in Wireless Communications and Mobile Computing Conference, 2008. IWCMC '08., pp. 594-599, 6-8 August 2008.
[13] L. Butti, Raw Covert (accessed September 2010)
http://rfakeap.tuxfamily.org/#Raw_Covert
[14] Institute of Electrical and Electronics Engineers, 802.11, Wireless LAN Medium Access Control (MAC) and Physical Layer (PHY) Specifications (accessed January 17, 2011).
http://ieeexplore.ieee.org
[15] S. Lin and D. J. Costello., Error Control Coding: Fundamentals and Applications, Pearson Prentice Hall, New Jersey, 1983.
[16] W. Stallings, Wireless Communications and Networks, Second edition, Pearson Prentice Hall, New Jersey, 2005.
[17] Y. Xiao and J. Rosdahl, "Throughput and delay limits of IEEE 802.11," in Communications Letters, IEEE, vol.6, no.8, pp. 355- 357, Aug 2002.
93Copyright (c) The Government of USA, 2011. Used by permission to IARIA. ISBN: 978-1-61208-174-8
EMERGING 2011 : The Third International Conference on Emerging Network Intelligence
100 / 141
Design Time Reliability Predictions for Supporting Runtime Security Measuring and Adaptation
Antti Evesti, Eila Ovaska VTT Technical Research Centre of Finland
Oulu, Finland antti.evesti, [email protected]
Abstract—The reliability of a quality-critical software component affects the security level that is achieved. There is currently no runtime security management approach that uses design time information. This paper presents an approach to exploiting design time reliability predictions in runtime security management. The Reliability and Availability Prediction (RAP) method is used to predict reliability at software design time. The predicted reliability values are stored in ontology form to support runtime use. The use case example illustrates the presented approach. The presented approach makes it possible to use design time reliability predictions at runtime for security measuring and adaptation. Hence, the reliability of security mechanisms is taken into account when security adaptation is triggered.
Keywords - information security; quality; evaluation; metric; architecture
I. INTRODUCTION A variety of quality prediction and testing techniques are
used at software design time. The results of these predictions are used to enhance architecture designs, select better component alternatives, and reveal implementation errors. The use of these prediction results ends when satisfactory quality is achieved for a component or system and the product is delivered. However, these prediction results could also be used in runtime situations. This is reasonable, especially in reliability and security management. Reliability is an important factor in achieving a required security level, as can clearly be seen from the security decomposition presented in [1]. Weak reliability of a security-related software component ruins the offered security. Hence, the reliability information of component is valuable for security-related decision-making. This paper therefore presents an approach to bring the design-time reliability prediction results for runtime security measuring and adaptation purposes. To achieve this, ISMO (Information Security Measuring Ontology) [2] is extended in a way that allows prediction results to be stored at design time.
In the literature, different security adaptation approaches exist. The adaptive SSL presented in [3] sets parameters for the SSL session based on the environment information. An Extensible Security Adaptation Framework [4] adds a middleware layer for security mechanisms. The application sets the required security policy and, based on the policy, the middleware layer selects security mechanisms. Context-
sensitive Adaptive Authentication [5] uses time and location information to calculate a confidence level for the authentication. In some situations, a low confidence level is sufficient while others require adaptation of the authentication method used. Our earlier work presents an approach that uses ontologies and risk-based measures for security adaptation [6]. These adaptation approaches are intended to work at runtime by observing the system’s resources and environment. Based on the observations, different security mechanisms or parameters are set. To our knowledge, none of the existing approaches uses design-time information for adaptation purposes.
Figure 1. presents the broader context of the contribution of this paper. In the first phase, the Reliability and Availability Prediction (RAP) method [7] is used to predict future reliability from software designs. The prediction results are stored in ontology form in order to ensure exploitation at runtime. In this paper we will focus on this first phase. In the second phase, application security is measured at runtime. Reliability predictions are used as input information for security measuring. The third phase is security adaptation, which is triggered by the measuring phase. The adaptation also uses reliability predictions to select the most suitable security mechanism for different situations. After the adaptation, the execution returns to the measuring phase.
Figure 1. Broader scope
The contribution of this paper makes it possible to use design-time reliability predictions for runtime security measuring and adaptation. Hence, a wider information set is available for triggering and making a decision on the adaptation. In other words, information for runtime use can be collected in different phases of the application lifecycle. Thus, the adaptation is not only based on the measurements made just before adaptation but also on knowledge of the whole life cycle of the component.
The paper is organised as follows. After the introductory section, background information is presented. Next, Section 3 is divided into three parts describing the design steps towards applications with security adaptation, design time
94Copyright (c) IARIA, 2011. ISBN: 978-1-61208-174-8
EMERGING 2011 : The Third International Conference on Emerging Network Intelligence
101 / 141
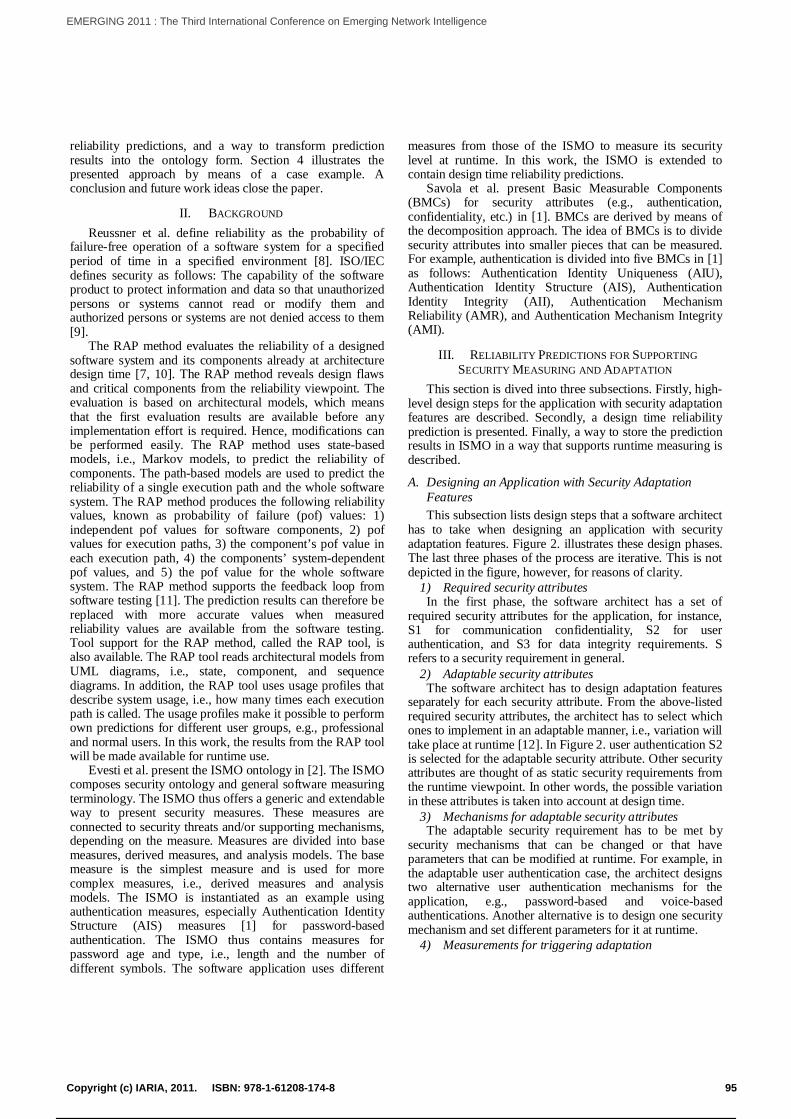
reliability predictions, and a way to transform prediction results into the ontology form. Section 4 illustrates the presented approach by means of a case example. A conclusion and future work ideas close the paper.
II. BACKGROUND Reussner et al. define reliability as the probability of
failure-free operation of a software system for a specified period of time in a specified environment [8]. ISO/IEC defines security as follows: The capability of the software product to protect information and data so that unauthorized persons or systems cannot read or modify them and authorized persons or systems are not denied access to them [9].
The RAP method evaluates the reliability of a designed software system and its components already at architecture design time [7, 10]. The RAP method reveals design flaws and critical components from the reliability viewpoint. The evaluation is based on architectural models, which means that the first evaluation results are available before any implementation effort is required. Hence, modifications can be performed easily. The RAP method uses state-based models, i.e., Markov models, to predict the reliability of components. The path-based models are used to predict the reliability of a single execution path and the whole software system. The RAP method produces the following reliability values, known as probability of failure (pof) values: 1) independent pof values for software components, 2) pof values for execution paths, 3) the component’s pof value in each execution path, 4) the components’ system-dependent pof values, and 5) the pof value for the whole software system. The RAP method supports the feedback loop from software testing [11]. The prediction results can therefore be replaced with more accurate values when measured reliability values are available from the software testing. Tool support for the RAP method, called the RAP tool, is also available. The RAP tool reads architectural models from UML diagrams, i.e., state, component, and sequence diagrams. In addition, the RAP tool uses usage profiles that describe system usage, i.e., how many times each execution path is called. The usage profiles make it possible to perform own predictions for different user groups, e.g., professional and normal users. In this work, the results from the RAP tool will be made available for runtime use.
Evesti et al. present the ISMO ontology in [2]. The ISMO composes security ontology and general software measuring terminology. The ISMO thus offers a generic and extendable way to present security measures. These measures are connected to security threats and/or supporting mechanisms, depending on the measure. Measures are divided into base measures, derived measures, and analysis models. The base measure is the simplest measure and is used for more complex measures, i.e., derived measures and analysis models. The ISMO is instantiated as an example using authentication measures, especially Authentication Identity Structure (AIS) measures [1] for password-based authentication. The ISMO thus contains measures for password age and type, i.e., length and the number of different symbols. The software application uses different
measures from those of the ISMO to measure its security level at runtime. In this work, the ISMO is extended to contain design time reliability predictions.
Savola et al. present Basic Measurable Components (BMCs) for security attributes (e.g., authentication, confidentiality, etc.) in [1]. BMCs are derived by means of the decomposition approach. The idea of BMCs is to divide security attributes into smaller pieces that can be measured. For example, authentication is divided into five BMCs in [1] as follows: Authentication Identity Uniqueness (AIU), Authentication Identity Structure (AIS), Authentication Identity Integrity (AII), Authentication Mechanism Reliability (AMR), and Authentication Mechanism Integrity (AMI).
III. RELIABILITY PREDICTIONS FOR SUPPORTING SECURITY MEASURING AND ADAPTATION
This section is dived into three subsections. Firstly, high-level design steps for the application with security adaptation features are described. Secondly, a design time reliability prediction is presented. Finally, a way to store the prediction results in ISMO in a way that supports runtime measuring is described.
A. Designing an Application with Security Adaptation Features This subsection lists design steps that a software architect
has to take when designing an application with security adaptation features. Figure 2. illustrates these design phases. The last three phases of the process are iterative. This is not depicted in the figure, however, for reasons of clarity.
1) Required security attributes In the first phase, the software architect has a set of
required security attributes for the application, for instance, S1 for communication confidentiality, S2 for user authentication, and S3 for data integrity requirements. S refers to a security requirement in general.
2) Adaptable security attributes The software architect has to design adaptation features
separately for each security attribute. From the above-listed required security attributes, the architect has to select which ones to implement in an adaptable manner, i.e., variation will take place at runtime [12]. In Figure 2. user authentication S2 is selected for the adaptable security attribute. Other security attributes are thought of as static security requirements from the runtime viewpoint. In other words, the possible variation in these attributes is taken into account at design time.
3) Mechanisms for adaptable security attributes The adaptable security requirement has to be met by
security mechanisms that can be changed or that have parameters that can be modified at runtime. For example, in the adaptable user authentication case, the architect designs two alternative user authentication mechanisms for the application, e.g., password-based and voice-based authentications. Another alternative is to design one security mechanism and set different parameters for it at runtime.
4) Measurements for triggering adaptation
95Copyright (c) IARIA, 2011. ISBN: 978-1-61208-174-8
EMERGING 2011 : The Third International Conference on Emerging Network Intelligence
102 / 141
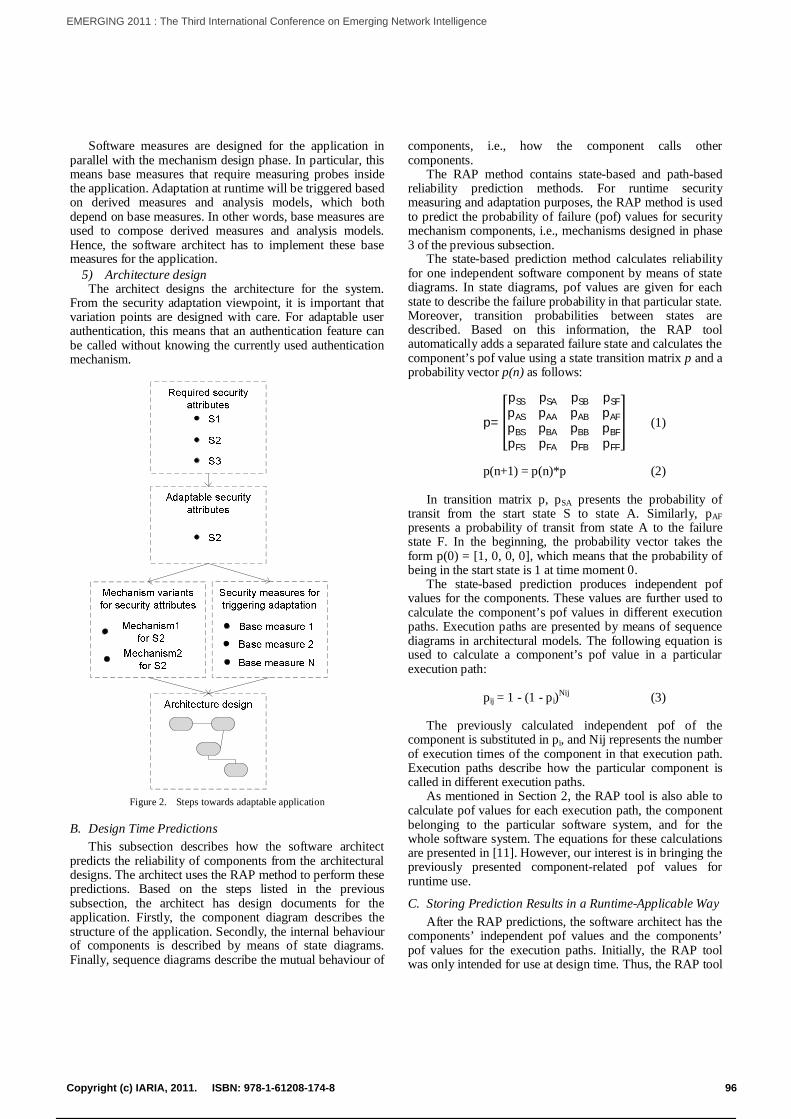
Software measures are designed for the application in parallel with the mechanism design phase. In particular, this means base measures that require measuring probes inside the application. Adaptation at runtime will be triggered based on derived measures and analysis models, which both depend on base measures. In other words, base measures are used to compose derived measures and analysis models. Hence, the software architect has to implement these base measures for the application.
5) Architecture design The architect designs the architecture for the system.
From the security adaptation viewpoint, it is important that variation points are designed with care. For adaptable user authentication, this means that an authentication feature can be called without knowing the currently used authentication mechanism.
Figure 2. Steps towards adaptable application
B. Design Time Predictions This subsection describes how the software architect
predicts the reliability of components from the architectural designs. The architect uses the RAP method to perform these predictions. Based on the steps listed in the previous subsection, the architect has design documents for the application. Firstly, the component diagram describes the structure of the application. Secondly, the internal behaviour of components is described by means of state diagrams. Finally, sequence diagrams describe the mutual behaviour of
components, i.e., how the component calls other components.
The RAP method contains state-based and path-based reliability prediction methods. For runtime security measuring and adaptation purposes, the RAP method is used to predict the probability of failure (pof) values for security mechanism components, i.e., mechanisms designed in phase 3 of the previous subsection.
The state-based prediction method calculates reliability for one independent software component by means of state diagrams. In state diagrams, pof values are given for each state to describe the failure probability in that particular state. Moreover, transition probabilities between states are described. Based on this information, the RAP tool automatically adds a separated failure state and calculates the component’s pof value using a state transition matrix p and a probability vector p(n) as follows:
p=
pSS pSA pSB pSFpAS pAA pAB pAFpBS pBA pBB pBFpFS pFA pFB pFF
(1)
p(n+1) = p(n)*p (2)
In transition matrix p, pSA presents the probability of
transit from the start state S to state A. Similarly, pAF presents a probability of transit from state A to the failure state F. In the beginning, the probability vector takes the form p(0) = [1, 0, 0, 0], which means that the probability of being in the start state is 1 at time moment 0.
The state-based prediction produces independent pof values for the components. These values are further used to calculate the component’s pof values in different execution paths. Execution paths are presented by means of sequence diagrams in architectural models. The following equation is used to calculate a component’s pof value in a particular execution path:
pij = 1 - (1 - pi)Nij (3)
The previously calculated independent pof of the
component is substituted in pi, and Nij represents the number of execution times of the component in that execution path. Execution paths describe how the particular component is called in different execution paths.
As mentioned in Section 2, the RAP tool is also able to calculate pof values for each execution path, the component belonging to the particular software system, and for the whole software system. The equations for these calculations are presented in [11]. However, our interest is in bringing the previously presented component-related pof values for runtime use.
C. Storing Prediction Results in a Runtime-Applicable Way After the RAP predictions, the software architect has the
components’ independent pof values and the components’ pof values for the execution paths. Initially, the RAP tool was only intended for use at design time. Thus, the RAP tool
96Copyright (c) IARIA, 2011. ISBN: 978-1-61208-174-8
EMERGING 2011 : The Third International Conference on Emerging Network Intelligence
103 / 141
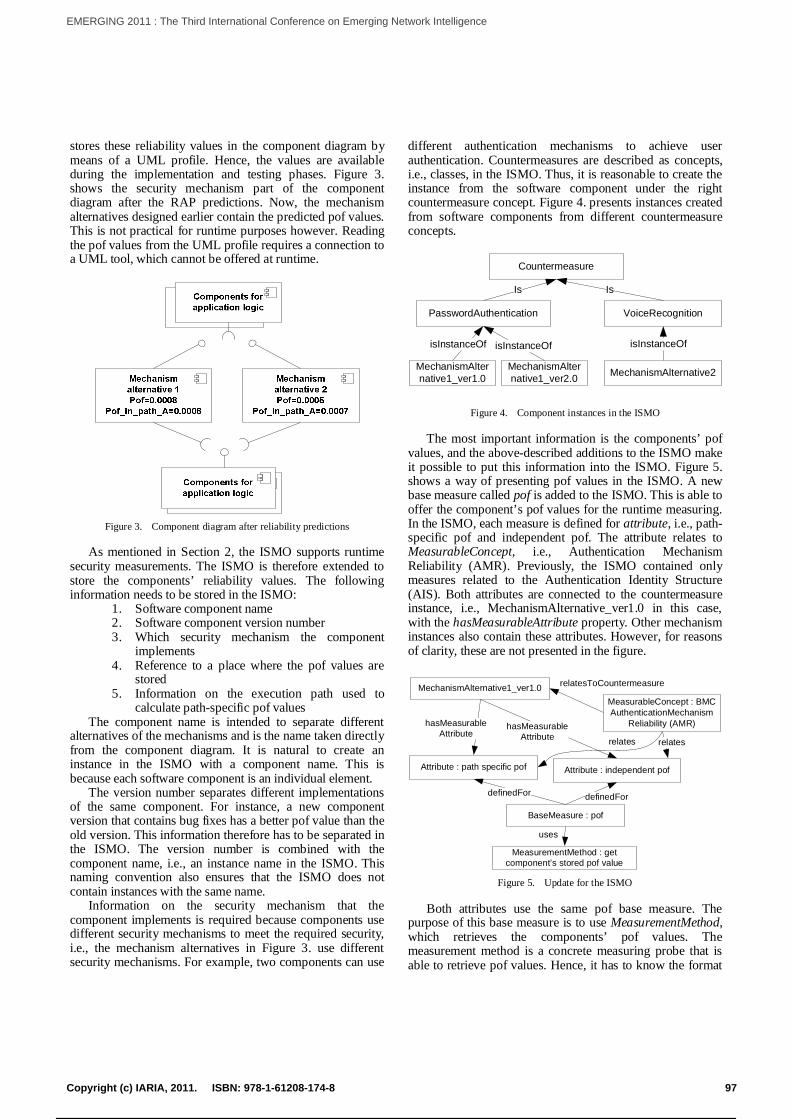
stores these reliability values in the component diagram by means of a UML profile. Hence, the values are available during the implementation and testing phases. Figure 3. shows the security mechanism part of the component diagram after the RAP predictions. Now, the mechanism alternatives designed earlier contain the predicted pof values. This is not practical for runtime purposes however. Reading the pof values from the UML profile requires a connection to a UML tool, which cannot be offered at runtime.
Figure 3. Component diagram after reliability predictions
As mentioned in Section 2, the ISMO supports runtime security measurements. The ISMO is therefore extended to store the components’ reliability values. The following information needs to be stored in the ISMO:
1. Software component name 2. Software component version number 3. Which security mechanism the component
implements 4. Reference to a place where the pof values are
stored 5. Information on the execution path used to
calculate path-specific pof values The component name is intended to separate different
alternatives of the mechanisms and is the name taken directly from the component diagram. It is natural to create an instance in the ISMO with a component name. This is because each software component is an individual element.
The version number separates different implementations of the same component. For instance, a new component version that contains bug fixes has a better pof value than the old version. This information therefore has to be separated in the ISMO. The version number is combined with the component name, i.e., an instance name in the ISMO. This naming convention also ensures that the ISMO does not contain instances with the same name.
Information on the security mechanism that the component implements is required because components use different security mechanisms to meet the required security, i.e., the mechanism alternatives in Figure 3. use different security mechanisms. For example, two components can use
different authentication mechanisms to achieve user authentication. Countermeasures are described as concepts, i.e., classes, in the ISMO. Thus, it is reasonable to create the instance from the software component under the right countermeasure concept. Figure 4. presents instances created from software components from different countermeasure concepts.
Countermeasure
MechanismAlternative1_ver1.0 MechanismAlternative2
PasswordAuthentication VoiceRecognition
IsIs
isInstanceOf isInstanceOf
MechanismAlternative1_ver2.0
isInstanceOf
Figure 4. Component instances in the ISMO
The most important information is the components’ pof values, and the above-described additions to the ISMO make it possible to put this information into the ISMO. Figure 5. shows a way of presenting pof values in the ISMO. A new base measure called pof is added to the ISMO. This is able to offer the component’s pof values for the runtime measuring. In the ISMO, each measure is defined for attribute, i.e., path-specific pof and independent pof. The attribute relates to MeasurableConcept, i.e., Authentication Mechanism Reliability (AMR). Previously, the ISMO contained only measures related to the Authentication Identity Structure (AIS). Both attributes are connected to the countermeasure instance, i.e., MechanismAlternative_ver1.0 in this case, with the hasMeasurableAttribute property. Other mechanism instances also contain these attributes. However, for reasons of clarity, these are not presented in the figure.
MeasurableConcept : BMC AuthenticationMechanism
Reliability (AMR)
Attribute : independent pof
relatesToCountermeasure
relates
definedFor
BaseMeasure : pof
MeasurementMethod : get component’s stored pof value
uses
hasMeasurableAttribute
MechanismAlternative1_ver1.0
Attribute : path specific pof
hasMeasurableAttribute
relates
definedFor
Figure 5. Update for the ISMO
Both attributes use the same pof base measure. The purpose of this base measure is to use MeasurementMethod, which retrieves the components’ pof values. The measurement method is a concrete measuring probe that is able to retrieve pof values. Hence, it has to know the format
97Copyright (c) IARIA, 2011. ISBN: 978-1-61208-174-8
EMERGING 2011 : The Third International Conference on Emerging Network Intelligence
104 / 141
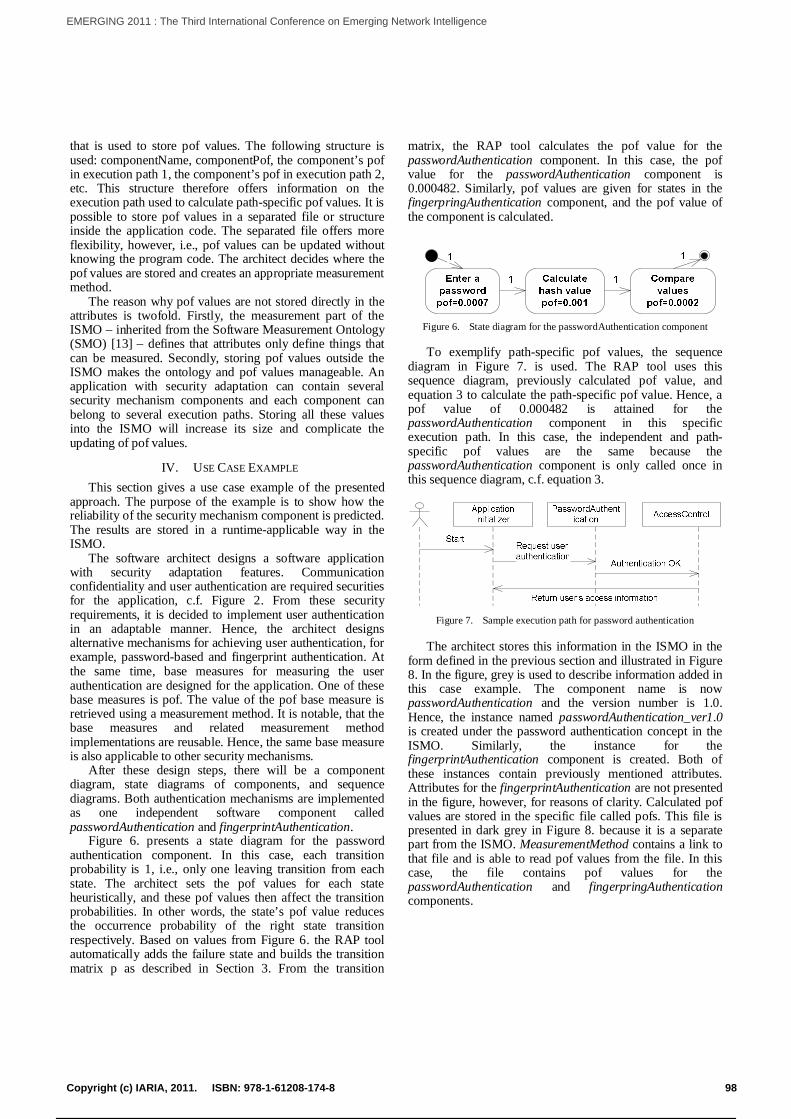
that is used to store pof values. The following structure is used: componentName, componentPof, the component’s pof in execution path 1, the component’s pof in execution path 2, etc. This structure therefore offers information on the execution path used to calculate path-specific pof values. It is possible to store pof values in a separated file or structure inside the application code. The separated file offers more flexibility, however, i.e., pof values can be updated without knowing the program code. The architect decides where the pof values are stored and creates an appropriate measurement method.
The reason why pof values are not stored directly in the attributes is twofold. Firstly, the measurement part of the ISMO – inherited from the Software Measurement Ontology (SMO) [13] – defines that attributes only define things that can be measured. Secondly, storing pof values outside the ISMO makes the ontology and pof values manageable. An application with security adaptation can contain several security mechanism components and each component can belong to several execution paths. Storing all these values into the ISMO will increase its size and complicate the updating of pof values.
IV. USE CASE EXAMPLE This section gives a use case example of the presented
approach. The purpose of the example is to show how the reliability of the security mechanism component is predicted. The results are stored in a runtime-applicable way in the ISMO.
The software architect designs a software application with security adaptation features. Communication confidentiality and user authentication are required securities for the application, c.f. Figure 2. From these security requirements, it is decided to implement user authentication in an adaptable manner. Hence, the architect designs alternative mechanisms for achieving user authentication, for example, password-based and fingerprint authentication. At the same time, base measures for measuring the user authentication are designed for the application. One of these base measures is pof. The value of the pof base measure is retrieved using a measurement method. It is notable, that the base measures and related measurement method implementations are reusable. Hence, the same base measure is also applicable to other security mechanisms.
After these design steps, there will be a component diagram, state diagrams of components, and sequence diagrams. Both authentication mechanisms are implemented as one independent software component called passwordAuthentication and fingerprintAuthentication.
Figure 6. presents a state diagram for the password authentication component. In this case, each transition probability is 1, i.e., only one leaving transition from each state. The architect sets the pof values for each state heuristically, and these pof values then affect the transition probabilities. In other words, the state’s pof value reduces the occurrence probability of the right state transition respectively. Based on values from Figure 6. the RAP tool automatically adds the failure state and builds the transition matrix p as described in Section 3. From the transition
matrix, the RAP tool calculates the pof value for the passwordAuthentication component. In this case, the pof value for the passwordAuthentication component is 0.000482. Similarly, pof values are given for states in the fingerpringAuthentication component, and the pof value of the component is calculated.
Figure 6. State diagram for the passwordAuthentication component
To exemplify path-specific pof values, the sequence diagram in Figure 7. is used. The RAP tool uses this sequence diagram, previously calculated pof value, and equation 3 to calculate the path-specific pof value. Hence, a pof value of 0.000482 is attained for the passwordAuthentication component in this specific execution path. In this case, the independent and path-specific pof values are the same because the passwordAuthentication component is only called once in this sequence diagram, c.f. equation 3.
Figure 7. Sample execution path for password authentication
The architect stores this information in the ISMO in the form defined in the previous section and illustrated in Figure 8. In the figure, grey is used to describe information added in this case example. The component name is now passwordAuthentication and the version number is 1.0. Hence, the instance named passwordAuthentication_ver1.0 is created under the password authentication concept in the ISMO. Similarly, the instance for the fingerprintAuthentication component is created. Both of these instances contain previously mentioned attributes. Attributes for the fingerprintAuthentication are not presented in the figure, however, for reasons of clarity. Calculated pof values are stored in the specific file called pofs. This file is presented in dark grey in Figure 8. because it is a separate part from the ISMO. MeasurementMethod contains a link to that file and is able to read pof values from the file. In this case, the file contains pof values for the passwordAuthentication and fingerpringAuthentication components.
98Copyright (c) IARIA, 2011. ISBN: 978-1-61208-174-8
EMERGING 2011 : The Third International Conference on Emerging Network Intelligence
105 / 141
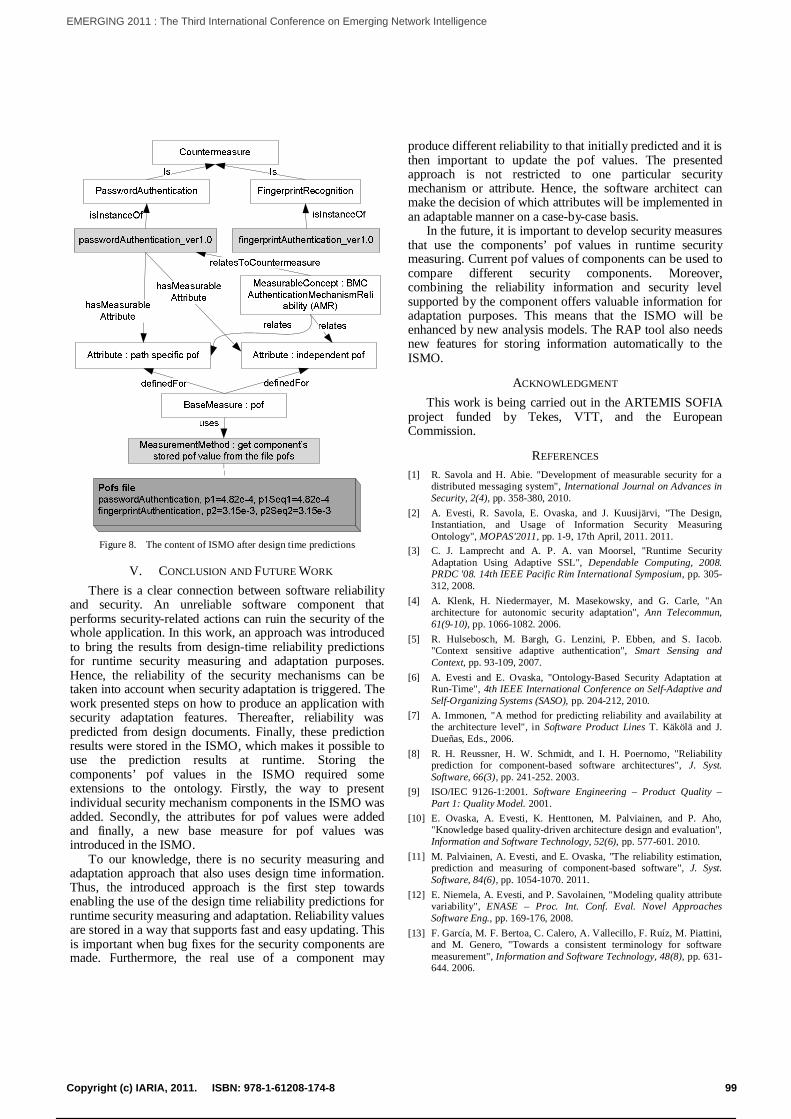
Figure 8. The content of ISMO after design time predictions
V. CONCLUSION AND FUTURE WORK There is a clear connection between software reliability
and security. An unreliable software component that performs security-related actions can ruin the security of the whole application. In this work, an approach was introduced to bring the results from design-time reliability predictions for runtime security measuring and adaptation purposes. Hence, the reliability of the security mechanisms can be taken into account when security adaptation is triggered. The work presented steps on how to produce an application with security adaptation features. Thereafter, reliability was predicted from design documents. Finally, these prediction results were stored in the ISMO, which makes it possible to use the prediction results at runtime. Storing the components’ pof values in the ISMO required some extensions to the ontology. Firstly, the way to present individual security mechanism components in the ISMO was added. Secondly, the attributes for pof values were added and finally, a new base measure for pof values was introduced in the ISMO.
To our knowledge, there is no security measuring and adaptation approach that also uses design time information. Thus, the introduced approach is the first step towards enabling the use of the design time reliability predictions for runtime security measuring and adaptation. Reliability values are stored in a way that supports fast and easy updating. This is important when bug fixes for the security components are made. Furthermore, the real use of a component may
produce different reliability to that initially predicted and it is then important to update the pof values. The presented approach is not restricted to one particular security mechanism or attribute. Hence, the software architect can make the decision of which attributes will be implemented in an adaptable manner on a case-by-case basis.
In the future, it is important to develop security measures that use the components’ pof values in runtime security measuring. Current pof values of components can be used to compare different security components. Moreover, combining the reliability information and security level supported by the component offers valuable information for adaptation purposes. This means that the ISMO will be enhanced by new analysis models. The RAP tool also needs new features for storing information automatically to the ISMO.
ACKNOWLEDGMENT This work is being carried out in the ARTEMIS SOFIA
project funded by Tekes, VTT, and the European Commission.
REFERENCES [1] R. Savola and H. Abie. "Development of measurable security for a
distributed messaging system", International Journal on Advances in Security, 2(4), pp. 358-380, 2010.
[2] A. Evesti, R. Savola, E. Ovaska, and J. Kuusijärvi, "The Design, Instantiation, and Usage of Information Security Measuring Ontology", MOPAS'2011, pp. 1-9, 17th April, 2011. 2011.
[3] C. J. Lamprecht and A. P. A. van Moorsel, "Runtime Security Adaptation Using Adaptive SSL", Dependable Computing, 2008. PRDC '08. 14th IEEE Pacific Rim International Symposium, pp. 305-312, 2008.
[4] A. Klenk, H. Niedermayer, M. Masekowsky, and G. Carle, "An architecture for autonomic security adaptation", Ann Telecommun, 61(9-10), pp. 1066-1082. 2006.
[5] R. Hulsebosch, M. Bargh, G. Lenzini, P. Ebben, and S. Iacob. "Context sensitive adaptive authentication", Smart Sensing and Context, pp. 93-109, 2007.
[6] A. Evesti and E. Ovaska, "Ontology-Based Security Adaptation at Run-Time", 4th IEEE International Conference on Self-Adaptive and Self-Organizing Systems (SASO), pp. 204-212, 2010.
[7] A. Immonen, "A method for predicting reliability and availability at the architecture level", in Software Product Lines T. Käkölä and J. Dueñas, Eds., 2006.
[8] R. H. Reussner, H. W. Schmidt, and I. H. Poernomo, "Reliability prediction for component-based software architectures", J. Syst. Software, 66(3), pp. 241-252. 2003.
[9] ISO/IEC 9126-1:2001. Software Engineering – Product Quality – Part 1: Quality Model. 2001.
[10] E. Ovaska, A. Evesti, K. Henttonen, M. Palviainen, and P. Aho, "Knowledge based quality-driven architecture design and evaluation", Information and Software Technology, 52(6), pp. 577-601. 2010.
[11] M. Palviainen, A. Evesti, and E. Ovaska, "The reliability estimation, prediction and measuring of component-based software", J. Syst. Software, 84(6), pp. 1054-1070. 2011.
[12] E. Niemela, A. Evesti, and P. Savolainen, "Modeling quality attribute variability", ENASE – Proc. Int. Conf. Eval. Novel Approaches Software Eng., pp. 169-176, 2008.
[13] F. García, M. F. Bertoa, C. Calero, A. Vallecillo, F. Ruíz, M. Piattini, and M. Genero, "Towards a consistent terminology for software measurement", Information and Software Technology, 48(8), pp. 631-644. 2006.
99Copyright (c) IARIA, 2011. ISBN: 978-1-61208-174-8
EMERGING 2011 : The Third International Conference on Emerging Network Intelligence
106 / 141
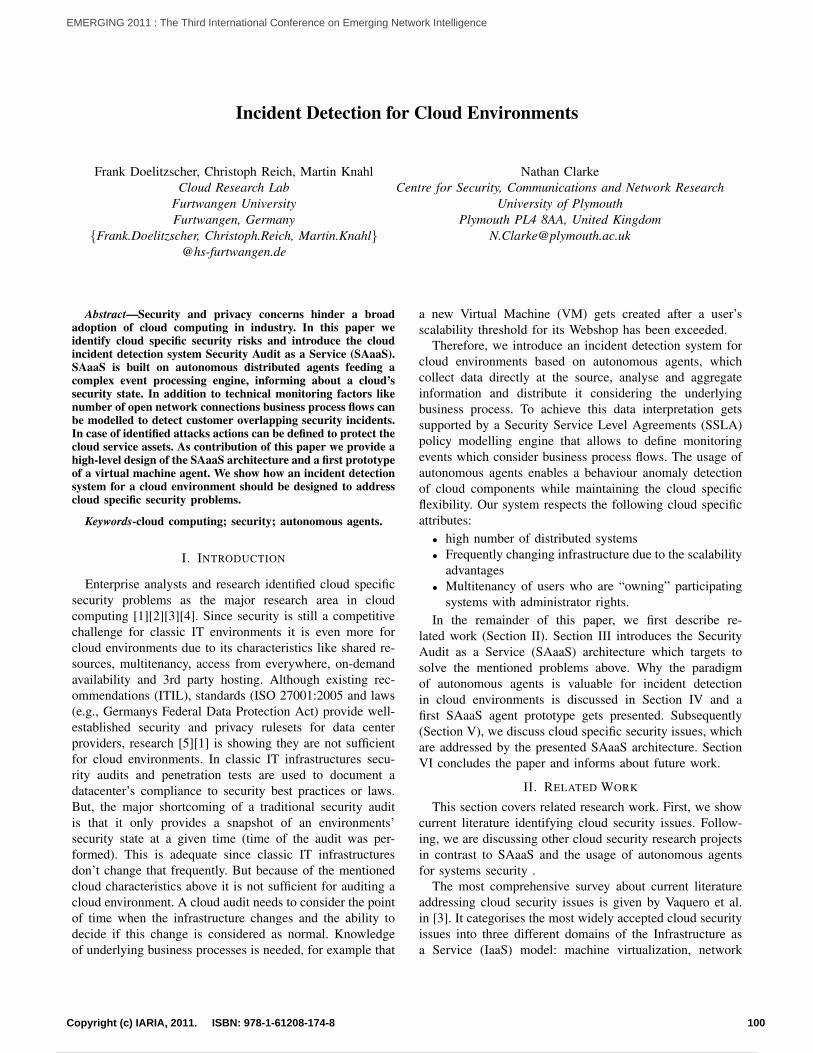
Incident Detection for Cloud Environments
Frank Doelitzscher, Christoph Reich, Martin KnahlCloud Research Lab
Furtwangen UniversityFurtwangen, Germany
Frank.Doelitzscher, Christoph.Reich, [email protected]
Nathan ClarkeCentre for Security, Communications and Network Research
University of PlymouthPlymouth PL4 8AA, United Kingdom
Abstract—Security and privacy concerns hinder a broadadoption of cloud computing in industry. In this paper weidentify cloud specific security risks and introduce the cloudincident detection system Security Audit as a Service (SAaaS).SAaaS is built on autonomous distributed agents feeding acomplex event processing engine, informing about a cloud’ssecurity state. In addition to technical monitoring factors likenumber of open network connections business process flows canbe modelled to detect customer overlapping security incidents.In case of identified attacks actions can be defined to protect thecloud service assets. As contribution of this paper we provide ahigh-level design of the SAaaS architecture and a first prototypeof a virtual machine agent. We show how an incident detectionsystem for a cloud environment should be designed to addresscloud specific security problems.
Keywords-cloud computing; security; autonomous agents.
I. INTRODUCTION
Enterprise analysts and research identified cloud specificsecurity problems as the major research area in cloudcomputing [1][2][3][4]. Since security is still a competitivechallenge for classic IT environments it is even more forcloud environments due to its characteristics like shared re-sources, multitenancy, access from everywhere, on-demandavailability and 3rd party hosting. Although existing rec-ommendations (ITIL), standards (ISO 27001:2005 and laws(e.g., Germanys Federal Data Protection Act) provide well-established security and privacy rulesets for data centerproviders, research [5][1] is showing they are not sufficientfor cloud environments. In classic IT infrastructures secu-rity audits and penetration tests are used to document adatacenter’s compliance to security best practices or laws.But, the major shortcoming of a traditional security auditis that it only provides a snapshot of an environments’security state at a given time (time of the audit was per-formed). This is adequate since classic IT infrastructuresdon’t change that frequently. But because of the mentionedcloud characteristics above it is not sufficient for auditing acloud environment. A cloud audit needs to consider the pointof time when the infrastructure changes and the ability todecide if this change is considered as normal. Knowledgeof underlying business processes is needed, for example that
a new Virtual Machine (VM) gets created after a user’sscalability threshold for its Webshop has been exceeded.
Therefore, we introduce an incident detection system forcloud environments based on autonomous agents, whichcollect data directly at the source, analyse and aggregateinformation and distribute it considering the underlyingbusiness process. To achieve this data interpretation getssupported by a Security Service Level Agreements (SSLA)policy modelling engine that allows to define monitoringevents which consider business process flows. The usage ofautonomous agents enables a behaviour anomaly detectionof cloud components while maintaining the cloud specificflexibility. Our system respects the following cloud specificattributes:
• high number of distributed systems• Frequently changing infrastructure due to the scalability
advantages• Multitenancy of users who are “owning” participating
systems with administrator rights.In the remainder of this paper, we first describe re-
lated work (Section II). Section III introduces the SecurityAudit as a Service (SAaaS) architecture which targets tosolve the mentioned problems above. Why the paradigmof autonomous agents is valuable for incident detectionin cloud environments is discussed in Section IV and afirst SAaaS agent prototype gets presented. Subsequently(Section V), we discuss cloud specific security issues, whichare addressed by the presented SAaaS architecture. SectionVI concludes the paper and informs about future work.
II. RELATED WORK
This section covers related research work. First, we showcurrent literature identifying cloud security issues. Follow-ing, we are discussing other cloud security research projectsin contrast to SAaaS and the usage of autonomous agentsfor systems security .
The most comprehensive survey about current literatureaddressing cloud security issues is given by Vaquero et al.in [3]. It categorises the most widely accepted cloud securityissues into three different domains of the Infrastructure asa Service (IaaS) model: machine virtualization, network
100Copyright (c) IARIA, 2011. ISBN: 978-1-61208-174-8
EMERGING 2011 : The Third International Conference on Emerging Network Intelligence
107 / 141
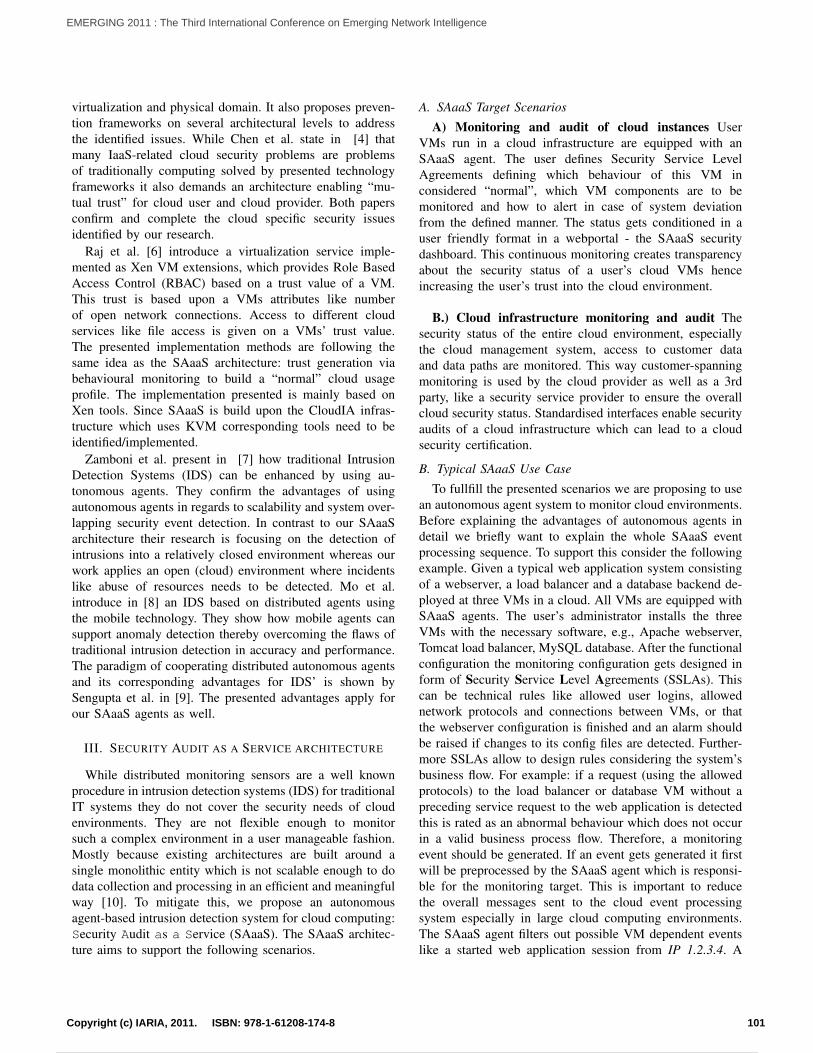
virtualization and physical domain. It also proposes preven-tion frameworks on several architectural levels to addressthe identified issues. While Chen et al. state in [4] thatmany IaaS-related cloud security problems are problemsof traditionally computing solved by presented technologyframeworks it also demands an architecture enabling “mu-tual trust” for cloud user and cloud provider. Both papersconfirm and complete the cloud specific security issuesidentified by our research.
Raj et al. [6] introduce a virtualization service imple-mented as Xen VM extensions, which provides Role BasedAccess Control (RBAC) based on a trust value of a VM.This trust is based upon a VMs attributes like numberof open network connections. Access to different cloudservices like file access is given on a VMs’ trust value.The presented implementation methods are following thesame idea as the SAaaS architecture: trust generation viabehavioural monitoring to build a “normal” cloud usageprofile. The implementation presented is mainly based onXen tools. Since SAaaS is build upon the CloudIA infras-tructure which uses KVM corresponding tools need to beidentified/implemented.
Zamboni et al. present in [7] how traditional IntrusionDetection Systems (IDS) can be enhanced by using au-tonomous agents. They confirm the advantages of usingautonomous agents in regards to scalability and system over-lapping security event detection. In contrast to our SAaaSarchitecture their research is focusing on the detection ofintrusions into a relatively closed environment whereas ourwork applies an open (cloud) environment where incidentslike abuse of resources needs to be detected. Mo et al.introduce in [8] an IDS based on distributed agents usingthe mobile technology. They show how mobile agents cansupport anomaly detection thereby overcoming the flaws oftraditional intrusion detection in accuracy and performance.The paradigm of cooperating distributed autonomous agentsand its corresponding advantages for IDS’ is shown bySengupta et al. in [9]. The presented advantages apply forour SAaaS agents as well.
III. SECURITY AUDIT AS A SERVICE ARCHITECTURE
While distributed monitoring sensors are a well knownprocedure in intrusion detection systems (IDS) for traditionalIT systems they do not cover the security needs of cloudenvironments. They are not flexible enough to monitorsuch a complex environment in a user manageable fashion.Mostly because existing architectures are built around asingle monolithic entity which is not scalable enough to dodata collection and processing in an efficient and meaningfulway [10]. To mitigate this, we propose an autonomousagent-based intrusion detection system for cloud computing:Security Audit as a Service (SAaaS). The SAaaS architec-ture aims to support the following scenarios.
A. SAaaS Target Scenarios
A) Monitoring and audit of cloud instances UserVMs run in a cloud infrastructure are equipped with anSAaaS agent. The user defines Security Service LevelAgreements defining which behaviour of this VM inconsidered “normal”, which VM components are to bemonitored and how to alert in case of system deviationfrom the defined manner. The status gets conditioned in auser friendly format in a webportal - the SAaaS securitydashboard. This continuous monitoring creates transparencyabout the security status of a user’s cloud VMs henceincreasing the user’s trust into the cloud environment.
B.) Cloud infrastructure monitoring and audit Thesecurity status of the entire cloud environment, especiallythe cloud management system, access to customer dataand data paths are monitored. This way customer-spanningmonitoring is used by the cloud provider as well as a 3rdparty, like a security service provider to ensure the overallcloud security status. Standardised interfaces enable securityaudits of a cloud infrastructure which can lead to a cloudsecurity certification.
B. Typical SAaaS Use Case
To fullfill the presented scenarios we are proposing to usean autonomous agent system to monitor cloud environments.Before explaining the advantages of autonomous agents indetail we briefly want to explain the whole SAaaS eventprocessing sequence. To support this consider the followingexample. Given a typical web application system consistingof a webserver, a load balancer and a database backend de-ployed at three VMs in a cloud. All VMs are equipped withSAaaS agents. The user’s administrator installs the threeVMs with the necessary software, e.g., Apache webserver,Tomcat load balancer, MySQL database. After the functionalconfiguration the monitoring configuration gets designed inform of Security Service Level Agreements (SSLAs). Thiscan be technical rules like allowed user logins, allowednetwork protocols and connections between VMs, or thatthe webserver configuration is finished and an alarm shouldbe raised if changes to its config files are detected. Further-more SSLAs allow to design rules considering the system’sbusiness flow. For example: if a request (using the allowedprotocols) to the load balancer or database VM without apreceding service request to the web application is detectedthis is rated as an abnormal behaviour which does not occurin a valid business process flow. Therefore, a monitoringevent should be generated. If an event gets generated it firstwill be preprocessed by the SAaaS agent which is responsi-ble for the monitoring target. This is important to reducethe overall messages sent to the cloud event processingsystem especially in large cloud computing environments.The SAaaS agent filters out possible VM dependent eventslike a started web application session from IP 1.2.3.4. A
101Copyright (c) IARIA, 2011. ISBN: 978-1-61208-174-8
EMERGING 2011 : The Third International Conference on Emerging Network Intelligence
108 / 141
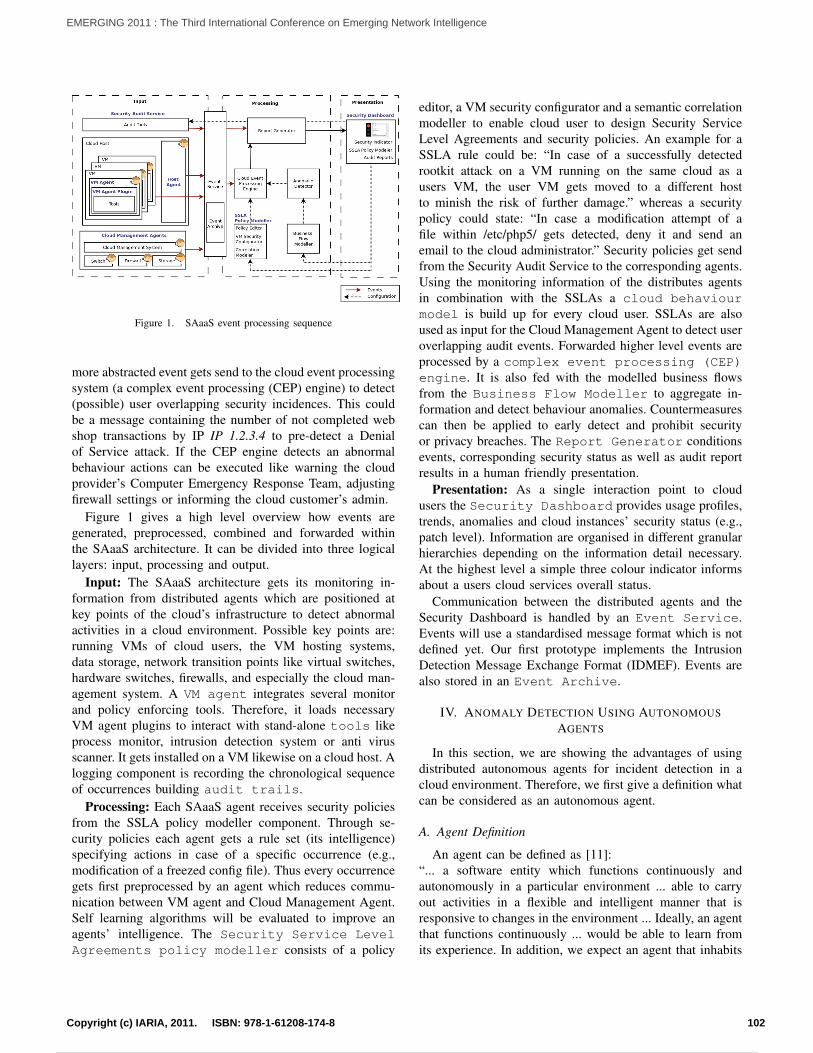
Figure 1. SAaaS event processing sequence
more abstracted event gets send to the cloud event processingsystem (a complex event processing (CEP) engine) to detect(possible) user overlapping security incidences. This couldbe a message containing the number of not completed webshop transactions by IP IP 1.2.3.4 to pre-detect a Denialof Service attack. If the CEP engine detects an abnormalbehaviour actions can be executed like warning the cloudprovider’s Computer Emergency Response Team, adjustingfirewall settings or informing the cloud customer’s admin.
Figure 1 gives a high level overview how events aregenerated, preprocessed, combined and forwarded withinthe SAaaS architecture. It can be divided into three logicallayers: input, processing and output.
Input: The SAaaS architecture gets its monitoring in-formation from distributed agents which are positioned atkey points of the cloud’s infrastructure to detect abnormalactivities in a cloud environment. Possible key points are:running VMs of cloud users, the VM hosting systems,data storage, network transition points like virtual switches,hardware switches, firewalls, and especially the cloud man-agement system. A VM agent integrates several monitorand policy enforcing tools. Therefore, it loads necessaryVM agent plugins to interact with stand-alone tools likeprocess monitor, intrusion detection system or anti virusscanner. It gets installed on a VM likewise on a cloud host. Alogging component is recording the chronological sequenceof occurrences building audit trails.
Processing: Each SAaaS agent receives security policiesfrom the SSLA policy modeller component. Through se-curity policies each agent gets a rule set (its intelligence)specifying actions in case of a specific occurrence (e.g.,modification of a freezed config file). Thus every occurrencegets first preprocessed by an agent which reduces commu-nication between VM agent and Cloud Management Agent.Self learning algorithms will be evaluated to improve anagents’ intelligence. The Security Service LevelAgreements policy modeller consists of a policy
editor, a VM security configurator and a semantic correlationmodeller to enable cloud user to design Security ServiceLevel Agreements and security policies. An example for aSSLA rule could be: “In case of a successfully detectedrootkit attack on a VM running on the same cloud as ausers VM, the user VM gets moved to a different hostto minish the risk of further damage.” whereas a securitypolicy could state: “In case a modification attempt of afile within /etc/php5/ gets detected, deny it and send anemail to the cloud administrator.” Security policies get sendfrom the Security Audit Service to the corresponding agents.Using the monitoring information of the distributes agentsin combination with the SSLAs a cloud behaviourmodel is build up for every cloud user. SSLAs are alsoused as input for the Cloud Management Agent to detect useroverlapping audit events. Forwarded higher level events areprocessed by a complex event processing (CEP)engine. It is also fed with the modelled business flowsfrom the Business Flow Modeller to aggregate in-formation and detect behaviour anomalies. Countermeasurescan then be applied to early detect and prohibit securityor privacy breaches. The Report Generator conditionsevents, corresponding security status as well as audit reportresults in a human friendly presentation.
Presentation: As a single interaction point to cloudusers the Security Dashboard provides usage profiles,trends, anomalies and cloud instances’ security status (e.g.,patch level). Information are organised in different granularhierarchies depending on the information detail necessary.At the highest level a simple three colour indicator informsabout a users cloud services overall status.
Communication between the distributed agents and theSecurity Dashboard is handled by an Event Service.Events will use a standardised message format which is notdefined yet. Our first prototype implements the IntrusionDetection Message Exchange Format (IDMEF). Events arealso stored in an Event Archive.
IV. ANOMALY DETECTION USING AUTONOMOUSAGENTS
In this section, we are showing the advantages of usingdistributed autonomous agents for incident detection in acloud environment. Therefore, we first give a definition whatcan be considered as an autonomous agent.
A. Agent Definition
An agent can be defined as [11]:“... a software entity which functions continuously andautonomously in a particular environment ... able to carryout activities in a flexible and intelligent manner that isresponsive to changes in the environment ... Ideally, an agentthat functions continuously ... would be able to learn fromits experience. In addition, we expect an agent that inhabits
102Copyright (c) IARIA, 2011. ISBN: 978-1-61208-174-8
EMERGING 2011 : The Third International Conference on Emerging Network Intelligence
109 / 141
an environment with other agents and processes to be ableto communicate and cooperate with them ...”
Since the agents in the SAaaS architecture are runningindependently, not necessarily connected to a certain centralinstance, are self-defending and self-acting, we term themautonomous. Agents can receive data from other instances,e.g., the policy module and send information to otherinstances like other agents or SAaaS’ event processingsystem. The “central” event processing system gets itselfimplemented as an agent which can be scaled and distributedover multiple VMs.
B. How agents can improve incident detection
Incident detection in cloud environments is a non trivialtask due to its characteristics as discussed in Section I.Therefore, it is important to have a high number of sensorscapturing simple events. Preprocessed and combinedcomplex events can be generated reducing the possibility of“event storms”. Combined with knowledge about businessprocess flows it will be possible to detect security incidentslike discussed in Section V, while keeping the network loadlow.
The usage of autonomous agents delivers this possibilitybecause agents are independent units that can be added,removed or reconfigurated during runtime without alteringother components. Thus, the amount of monitoring entities(e.g., network connections of a VM, running processes,storage access, etc.) of a cloud instance can be changedwithout restarting the incident detection system. Simultane-ously using agents can save computing resources since theunderlying business process flow can be taken into account.Imagine a business process of a web application P1 whereuser Bob adds a new user to a user database by fillingout a web form. By pressing the “Save” button a legalrequest R gets executed as part of business process P1. Anagent A monitoring database access can get moved at thebeginning of R to the request-executing VM V1, monitoringthe data access during process time and gets deleted fromV1 after P is finished. Furthermore agents can be updated tonew versions (depending their interface remains unchanged)without restarting the whole incident detection system orother SAaaS agents running at a VM.
While single agents can monitor simple events (e.g., userlogin on VM) and share them with other agents complexevents can be detected. Given the scenario of a successfulunauthorised login of an attacker at a virtual machineVM2, misusing a webserver’s directory to deposit maliciouscontent for instance a trojan. Agent A1 monitors the userlogin, agent A2 detects the change of a directory contentand agent A3 detects a download of a not known file (thetrojan). Instead of sending those three simple messages to acentral event processing unit a VM agent can collect themconditioning one higher level event message that VM2 was
hijacked. This can result in a predefined action by the CloudManagement Agent, e.g., moving a hijacked VM into aquarantine environment, alerting the user and simultaneouslystarting a fresh instance of VM2 based on its VM image.
By ordering agents in a hierarchical structure and prepro-cessing of detected events reduces network load originatedfrom the incidents detection system. Furthermore this makesthe system more scalable by reducing data sent to upper sys-tem layers. This is introduced and used in [12]. Combiningevents from system deployed agents (e.g., VM agent, hostagent) and infrastructure monitoring agents (network agent,firewall agent) incident detection is not limited to either hostor network based sensors which is especially important forthe characteristics of cloud environments.
Furthermore using autonomous agents has advantages incase of a system failure. Agents can monitor the existence ofco-located agents. If an agent stops for whatever reasons thisstays not undetected. Concepts of asymmetric cryptographyor Trusted Platform Module (TPM) technology can be usedto guarantee the integrity of a (re-)started agent. If an agentstops the damage is restricted to this single agent or a smallsubset of connected agents which are requiring informationfrom this agent.
C. SAaaS Agent prototype
For the SAaaS architecture we evaluated existing agentframeworks with the following requirements:
• Agents can be deployed, moved, updated during run-time
• Agent performance• Open Source software platform• Documentation & community supportSince our cloud environment at HFU’s Cloud Research
Lab CloudIA [13] is build around the cloud managementsystem Open Nebula another requirement was the agentprogramming language: Java. As a result we choose theJava Agent DEvelopment Platform (JADE), which enablesthe implementation of multi-agent systems and complies toFIPA (IEEE Computer Society standards organisation foragent-based technology and its interoperability with othertechnologies) specifications. Furthermore it already providesa user interface which alleviates agents creation, deploymentand testing.
Figure 2 illustrates a basic agent architecture we alreadyassumed in the SAaaS Use Case presentation in SectionIII-B. It shows three SAaaS VM agents. Agents life in anagent platform which provides them with basic services suchas message delivery. A platform is composed of one or moreContainers. Containers can be executed on different hoststhus achieving a distributed platform. Each container cancontain zero or more agents [14]. To provide monitoringfunctionality a VM agent interacts through agent pluginswith stand-alone tools like process monitor, intrusion de-tection system or anti virus scanner, as depicted in Figure
103Copyright (c) IARIA, 2011. ISBN: 978-1-61208-174-8
EMERGING 2011 : The Third International Conference on Emerging Network Intelligence
110 / 141
Figure 2. Basic SAaaS agent design
2. To harness the potential of cloud computing an agentcan be deployed to a VM on-demand according to theSSLA policies a user defines. Different agents based onmodelled business processes are stored within an agentrepository. To be able to move a JADE agent to a runningcloud instance the Inter Platform Mobility Service (IPMS)by Cucurull et al. [15] was integrated. This supports thepresented advantage of deploying agents on-demand if adesigned business process flow was started (as described inSection IV-B). Though this implementation is up to futurework.
As a first prototype, a two layered agent platform wasdeveloped, consisting of a VM agent running inside aVM, a Cloud Management Agent running as a serviceat a dedicated VM feeding information to a SecurityDashboard. Since all cloud VMs in CloudIA are Linuxbased, only Open Source Linux tools were considered duringour research. Two notification mechanisms were imple-mented: a) the tool sends agent compatible events directlyto the agent plugin; b) the tool writes events in a proprietaryformat into a logfile which gets parsed by an agent plugin.As for mechanism a) the filesystem changes monitoring toolinotify was used, whereas for mechanism b) fail2ban [15],an intrusion prevention framework was chosen.
For demo purposes a simple web frontend was writtenwhich offers to launch several attack scenarios on a VMagent equipped VM in CloudIA. Before/After tests wereperformed to validate, that an attack was detected and(depending on the plugin’s configuration) prohibited. Aprototype version of the Security Dashboard, showing asignal light indicator informed about occurring events. Whenstarted it shows a green light. After launching an attack,the Security Dashboard indicator light changes its colour toyellow or red as defined in a severity matrix given the typeof detected attack.
D. Agent Performance Test
It is essential for the SAaaS architecture that the agents arevery efficient not causing a high offset of resource consump-
tion. JADE agent performance is very low as demonstratedby E.Cortese et al. in [16]. They show that CPU overhead isvery low. Average round trip time of a message between toagents (request message, answer message) with a messagecontent of seven characters takes only 13,4 ms. Jurasovic etal. [17] show that even with increasing message size theround trip time does not increase significantly. Also themessage overhead by the agent communication does notincrease significantly with increasing message size. Detailsabout the used test lab are given in the mentioned literature.
In our first prototype, we wanted to see how fast an agentcan be deployed to a new platform. All tests were doneat the university’s research cloud infrastructure CloudIA.Hardware of machines hosting the VMs was: 8x CPU: In-tel(R) Xeon(R) CPU E5504 @ 2.00GHz 64-bit architecture,12 GB of memory and 1 Gigabit Ethernet. Each VM wasassigned with 512 MB RAM, 274 MB Swap, 1 CPU and4GB HDD local storage. Over all test runs we confirmed thatthe average time for an agent move is below 1,5 seconds.This proves the applicability of the JADE agent platform tosupport the presented SAaaS use case.
V. DISCUSSION - CLOUD SPECIFIC SECURITY ISSUESADDRESSED BY SAAAS
The German Federal Office for Information Securitypublishes the IT baseline protection catalogues enablingenterprises to achieve an appropriate security level for alltypes of information. The catalogues were extended by aspecial module covering virtualization in 2010. In a com-prehensive study on all IT baseline protection catalogues aswell as current scientific literature available [1][18][2][3][4],we made a comparison between classic IT-Housing, IT-Outsourcing and cloud computing. The following cloudspecific security issues were identified as solvable by theSAaaS system:
Abuse of cloud resources Cloud computing advantagesare also used by hackers, enabling them to have a big amountof computing power for a relatively decent price, startablein no time. Cloud infrastructure gets used to crack WPA,and PGP keys as well as to host malware, trojans, softwareexploits used by phishing attacks or to build botnets likethe Zeus botnet. The problem of malicious insiders alsoexists in classical IT-Outsourcing but gets amplified in cloudcomputing through the lack of transparency into providerprocess and procedure. This issue affects authorisation,integrity, non-repudiation and privacy. Strong monitoringof user activities on all cloud infrastructure components isnecessary to increase transparency. The presented SAaaSscenario A) Monitoring and audit of cloud instances ad-dresses this problem.
Missing security monitoring in cloud infrastructureSecurity incidents in cloud environments occur and (nor-mally) get fixed by the cloud provider. But to our bestknowledge no cloud provider so far provides a system
104Copyright (c) IARIA, 2011. ISBN: 978-1-61208-174-8
EMERGING 2011 : The Third International Conference on Emerging Network Intelligence
111 / 141
which informs user promptly if the cloud infrastructure getsattacked, enabling them to evaluate the risk of keeping theircloud services productive during the attack. Thereby thecustomer must not necessarily be a victim of the attack,but still might be informed to decide about the continuity ofhis running cloud service. Furthermore no cloud provider sofar shares information about possible security issues causedby software running directly on cloud host machines. In anevent of a possible 0-day exploit in software running oncloud hosts (e.g., hypervisor, OS kernel) cloud customerblindly depend on a working patch management of thecloud provider. The presented SAaaS scenario B) Cloudinfrastructure monitoring and audit addresses this problem.
Defective isolation of shared resources In cloud comput-ing isolation in depth is not easily achievable due to usage ofrather complex virtualization technology like VMware, Xenor KVM. Persistent storage is shared between customersas well. Cloud provider advertise implemented reliabilitymeasures to pretend data loss like replicating data up to sixtimes. In contrast customer have no possibility to prove if allthese copies get securely erased in case they quit with theprovider and this storage gets newly assigned to a differentcustomer. While the presented SAaaS architecture does notdirectly increase isolation in depth it adds to the detectionof security breaches helping to contain its damage by thepresented actions.
VI. CONCLUSION AND FUTURE WORK
In this paper, we introduced the Security Audit as aService architecture to mitigate the shortcoming traditionalaudit systems suffer to audit cloud computing environments.We showed the advantages of using autonomous agentsas a source for sensor information. We explained howincident detection in clouds can be done by adding businessprocess information to technical monitored events to performanomaly detection in clouds.
As for future work, we identified the following tasks:a) comprehensive research in anomaly detection algorithms,b) comprehensive research in complex event processing, c)development of the SSLA policy modeller, d) developmentof SAaaS agents.
ACKNOWLEDGMENT
This research is supported by the German Federal Min-istry of Education and Research (BMBF) through the re-search grant number 01BY1116.
REFERENCES[1] Cloud Security Alliance, “Security Guidance for Critical
Areas of Focus in Cloud Computing v2.1,” 12 2009.[2] European Network and Information Security Agency, “Cloud
Computing Security Risk Assessment,” Tech. Rep., 11 2009.[3] L. Vaquero, L. Rodero-Merino, and D. Morn, “Locking the
sky: a survey on iaas cloud security,” Computing, vol. 91, pp.93–118.
[4] Y. Chen, V. Paxson, and R. H. Katz, “What’s New AboutCloud Computing Security?” EECS Department, Universityof California, Berkeley, Tech. Rep. UCB/EECS-2010-5, 012010.
[5] F. Doelitzscher, C. Reich, and A. Sulistio, “Designing cloudservices adhering to government privacy laws,” in Proceed-ings of 10th IEEE International Conference on Computer andInformation Technology (CIT 2010), 2010, pp. 930–935.
[6] H. Raj and K. Schwan, “Extending virtualization serviceswith trust guarantees via behavioral monitoring,” in Proceed-ings of the 1st EuroSys Workshop on Virtualization Technol-ogy for Dependable Systems, ser. VDTS ’09. New York,NY, USA: ACM, 2009, pp. 24–29.
[7] J. Balasubramaniyan, J. Garcia-Fernandez, D. Isacoff,E. Spafford, and D. Zamboni, “An architecture for intrusiondetection using autonomous agents,” in Computer SecurityApplications Conference, 1998, Proceedings., 14th Annual,dec 1998, pp. 13 –24.
[8] Y. Mo, Y. Ma, and L. Xu, “Design and implementation ofintrusion detection based on mobile agents,” in IT in Medicineand Education, 2008. ITME 2008. IEEE International Sym-posium on, dec. 2008, pp. 278 –281.
[9] J. Sen, I. Sengupta, and P. Chowdhury, “An architecture ofa distributed intrusion detection system using cooperatingagents,” in Computing Informatics, 2006. ICOCI ’06. Inter-national Conference on, june 2006, pp. 1 –6.
[10] E. H. Spafford and D. Zamboni, “Intrusion detection usingautonomous agents,” Computer Networks, vol. 34, no. 4, pp.547 – 570, 2000, recent Advances in Intrusion DetectionSystems.
[11] J. M. Bradshaw, An introduction to software agents. Cam-bridge, MA, USA: MIT Press, 1997, pp. 3–46.
[12] S. Staniford-chen, S. Cheung, R. Crawford, M. Dilger,J. Frank, J. Hoagl, K. Levitt, C. Wee, R. Yip, and D. Zerkle,“Grids - a graph based intrusion detection system for largenetworks,” in In Proceedings of the 19th National InformationSystems Security Conference, 1996, pp. 361–370.
[13] A. Sulistio, C. Reich, and F. Doelitzscher, “Cloud Infrastruc-ture & Applications - CloudIA,” in Proceedings of the 1st In-ternational Conference on Cloud Computing (CloudCom’09),Beijing, China, 2009.
[14] D. Grimshaw, “JADE Administration Tutorial,”http://jade.tilab.com/doc/tutorials/JADEAdmin, 06.09.2011.
[15] J. Cucurull, R. Mart, G. Navarro-Arribas, S. Robles,B. Overeinder, and J. Borrell, “Agent mobility architecturebased on ieee-fipa standards,” Computer Communications,vol. 32, no. 4, pp. 712 – 729, 2009.
[16] E. Cortese, F. Quarta, G. Vitaglione, T. I. Lab, C. Direzionale,J. Message, and T. System, “Scalability and performance ofjade message transport system,” 2002.
[17] K. Jurasovic, G. Jezic, and M. Kusek, “A perfor-mance analysis of multi-agent systems.” ITSSA, vol. 1,no. 4, pp. 335–342, 2006, http://dblp.uni-trier.de/db/ jour-nals/itssa/itssa1.html#JurasovicJK06, 06.09.2011.
[18] Cloud Security Alliance, “Top Threats to Cloud ComputingV1.0,” 2010, https://cloudsecurityalliance.org/topthreats.html,06.09.2011.
105Copyright (c) IARIA, 2011. ISBN: 978-1-61208-174-8
EMERGING 2011 : The Third International Conference on Emerging Network Intelligence
112 / 141
Multipath Routing for Survivability of ComplexNetworks Under Cascading Failures
Preetha ThulasiramanDepartment of Electrical and Computer Engineering
Naval Postgraduate SchoolMonterey, CA, USA
Abstract—Complex infrastructure networks have been charac-terized as being scale-free and therefore maintain a heterogeneousnode distribution. While scale free networks (SFN) have beeninvestigated using vulnerability assessments, particularly that ofcascading node failures, existing research has not dealt with theaftermath of these failures. This paper addresses the problem ofdiscovering end to end paths in a SFN in the presence of cascad-ing failures such that survivability is achieved for each source-destination pair. We first develop a model to capture cascadingfailures in SFNs while redistributing traffic load to neighboringnodes. Given the traffic distribution after the cascade of failures,we develop a routing algorithm such that backup connections areconstructed for each source-destination pair. We formulate therouting algorithm by exploiting the multipath topology of SFNsand the different priorities of the traffic flows. We compare ourrouting approach in a SFN with that of a random network inwhich node distributions are homogeneous. We show that ourrouting algorithm performs well under intentional node attacksand efficiently considers the classification of the traffic whenconstructing alternate routing paths.
Keywords – scale free networks; multipath routing; cascadingfailures; load redistribution
I. INTRODUCTION
Complex networks such as the Internet, electrical powergrid and telecommunication and transportation systems arean essential part of the global society. These infrastructurenetworks are not random but rather known to be scale free,with some nodes having a tremendous number of connections,whereas others have only a few connections [1]. This highlyheterogeneous node distribution has led researchers to provethat the degrees of the nodes in scale free networks (SFN)follow a power law distribution: the probability that any nodeis connected to k other nodes, P (k), is proportional to 1
kn ,where n is a parameter whose value is typically in the range2 < n < 3 [1]. Due to its topology, SFNs are robust againstaccidental failures (which tend to affect low degree nodes),but are vulnerable to coordinated attacks that target highlyconnected nodes in order to inflict maximum damage bydisabling numerous connections.
The fragile properties of SFNs become more evident whenthe intrinsic dynamics of the network flows are taken intoaccount. Specifically, due to the existence of many simul-taneous traffic flows, the removal of a single, highly ormoderately connected node can cause large scale cascading
failures. This domino effect results in the interruption of trafficflow, service, and distribution of network resources. Thus, thevulnerability and reliability of SFNs in the face of attacks mustbe investigated.
The notion of survivability is an essential aspect of reliablecommunications. Survivability consists of the ability of thenetwork to continue to deliver and preserve essential servicesin the presence of failures. These failures can occur due tonatural faults and other unintentional errors or due to maliciousadversaries. From the viewpoint of network resilience andsurvivability, a key question is whether a SFN can, in theface of dependent and correlated node failures, retain itsfunctionality in terms of maintaining some sense of globalcommunication. In this regard, traffic redistribution and robust-ness of routing policies for SFNs is a central problem whichis gaining increased attention with a growing awareness tosafeguard critical infrastructure networks.
A. Related Work and Motivations
Over the years, researchers have investigated the cascadebased attack vulnerability of either specific infrastructureSFNs, such as the power grid [2], [3], or that of general SFNswith heterogeneous traffic load distributions [4], [5], [6]. Inthese works, different cascading failure models are analyzedto determine the best manner in which traffic load shouldbe redistributed to maintain service. With advances in cyberbased communication systems and their logical coupling toinfrastructure networks [7], it is imperative that the vulnera-bilities and consequences of node failures are studied from theperspective of network survivability [8], [9]. Survivability ofnetworks depends on three key capabilities: resistance, recog-nition, and recovery [10]. While resistance repels failures fromhappening, recognition and recovery deal with and evaluatethe failures to provide network restoration protocols. Thusfar, the research on providing survivable network solutions toinfrastructure networks has been tailored to focus on failuremodeling and vulnerability assessments rather than networkmanagement [11], [12]. It is important not only to understandhow to recognize faults and vulnerabilities but also how torecover from them.
Multipath routing has long been recognized as an effectivestrategy to increase reliability. To improve the transmissionreliability, the multiple paths can be selected to be node
106Copyright (c) IARIA, 2011. ISBN: 978-1-61208-174-8
EMERGING 2011 : The Third International Conference on Emerging Network Intelligence
113 / 141
disjoint. Disjoint multipath routing provides better robustnessand a greater degree of fault tolerance than compared to thegeneric multipath routing scheme. Due to these advantages,disjoint multipath routing has been researched in order toenhance network survivability [13], [14].
SFNs are inherently highly connected, thus there alwaysexists two or more paths between each source-destination pair.When a node fails in a SFN, potentially causing a cascade ofnode failures, the traffic flows that use the failed node shouldbe maintained and the services they provide must be sustained.The aim of this paper is to ensure end to end survivability bybypassing failed nodes using efficient, robust multipath routingin the presence of cascading failures, while redistributing thecorresponding traffic loads accordingly.
B. Contributions and Organization
The contributions of this paper are two-fold. First, wedevelop a local traffic redistribution model for a failed node byredistributing its load uniformly among its neighbors, takinginto consideration that this redistribution can possibly overloadthe neighboring nodes, causing a series of cascading failures.Second, given the redistribution of the load, we establishsurvivable shortest disjoint multipath routes that bypass thefailed node(s). The shortest disjoint paths are determined bythe priority of the traffic flows; some flows, due to its servicerequirements, require backup paths that are more reliablethan others (i.e., to ensure service availability). Therefore, thebackup path for each traffic flow should be determined usinglocal topological and connection information. In other words,the shortest paths for increasing traffic flow priority are thosebetween a source and destination that cumulatively traversethe least number of highly connected nodes.
The rest of this paper is organized as follows: Section IIdiscusses the system model. Section III discusses the load re-distribution model based on cascading failures and Section IVdevelops the disjoint multipath route selection procedure basedon traffic priority. We show our performance analysis usingsimulations in Section V and conclude the paper in Section VI.
II. SYSTEM MODEL
The topology used in this paper is that of a SFN. TheBarabasi-Albert (BA) model is used to generate SFNs with apower law degree distribution. The BA model is a well knownalgorithm for generating random SFNs using a preferentialattachment mechanism [15]. Without loss of generality, forthe purposes of this work, we construct the underlying networkstructure using the BA network model.
We consider a SFN consisting of N nodes (n = 1, ..., N )and A directed arcs (a = 1, ..., A). We assume that thereare K (k = 1, ...,K) different traffic flows that are routedthrough the SFN, where a traffic flow is defined as a set ofdemands from a source to destination. Each traffic flow has alevel of service that has to be maintained, therefore a certainamount of capacity is required along each arc of the routetaken by a traffic flow, k. Within these K traffic flows, thereare M classes of priority numbered from 0 to M − 1, whereClass 0 represents the highest class and M − 1 represents
the lowest class. Because highly connected nodes in a SFNare more vulnerable to outside attack, it is critical that highpriority traffic flows route along paths that contain the leastnumber of highly connected nodes to ensure end to end routesurvivability.
A manner in which node connectivity is measured is bythe betweenness centrality (BC) parameter of SFNs. The BCis a measure of the number of shortest paths that go througha node n [1]. Nodes that occur on many shortest paths havehigher betweenness than those that do not and are thereforemore vulnerable to a coordinated attack. The BC of a node isdenoted as
BC(n) =∑ δn(p, q)
δ(p, q)(1)
where δn(p, q) is the number of shortest paths between nodesp and q and δn(p, q) is the number of shortest paths betweenp and q that run through node n. The BC parameter providesinformation about the physical connectivity of each node forthe purposes of routing.
For the purpose of modeling network node failures, theactual traffic load of a node (the amount of traffic that eachnode processes) must be considered. The traffic load of a nodeis directly related to its BC; the higher the BC, the higher thetraffic load that the node has to support. In this paper weassume that highly connected nodes are more susceptible toattacks than those that are not highly connected. Therefore,our proposed cascading failure model and routing algorithmare developed under the scenario that a highly connected nodehas failed and has caused a series of cascading failures.
III. CASCADING FAILURE MODEL: LOCALREDISTRIBUTION OF FAILURE LOAD
Each source-destination pair in a SFN has an active path.This is the path on which a traffic flow is typically routed.Active paths often run through highly connected nodes andare thus exposed to attacks. In order to find active paths on ashortest path basis, a cost is defined, κa, of an arc a as
κma =m
M − 1da +
(M − 1)−mM − 1
BC(n) (2)
where m is the current class of traffic flow, m =0, 1, 2, ...,M − 1, da is the length of arc a, and BC(n) isthe betweenness centrality parameter.
The active paths that are determined with the above costare used as the default routing connection. However, when anode fails, the path that uses this node and its load has to beredistributed. The redistribution of the load may cause furthernode failures due to overload. Fig. 1 illustrates an exampleof a failed node’s traffic being redistributed to its neighbors.Note that SFNs are always at least 2-connected, meaning thateach node will have at least two disjoint paths to every othernode in the network [16]. Not all the connections for eachnode to show 2-connectivity are shown in Fig. 1. The networkof Fig. 1 is simply for illustration of the load redistributionconcept.
Within a SFN, we assume that every node has a minimumload value, Lmin and a maximum value, Lmax. All nodes have
107Copyright (c) IARIA, 2011. ISBN: 978-1-61208-174-8
EMERGING 2011 : The Third International Conference on Emerging Network Intelligence
114 / 141
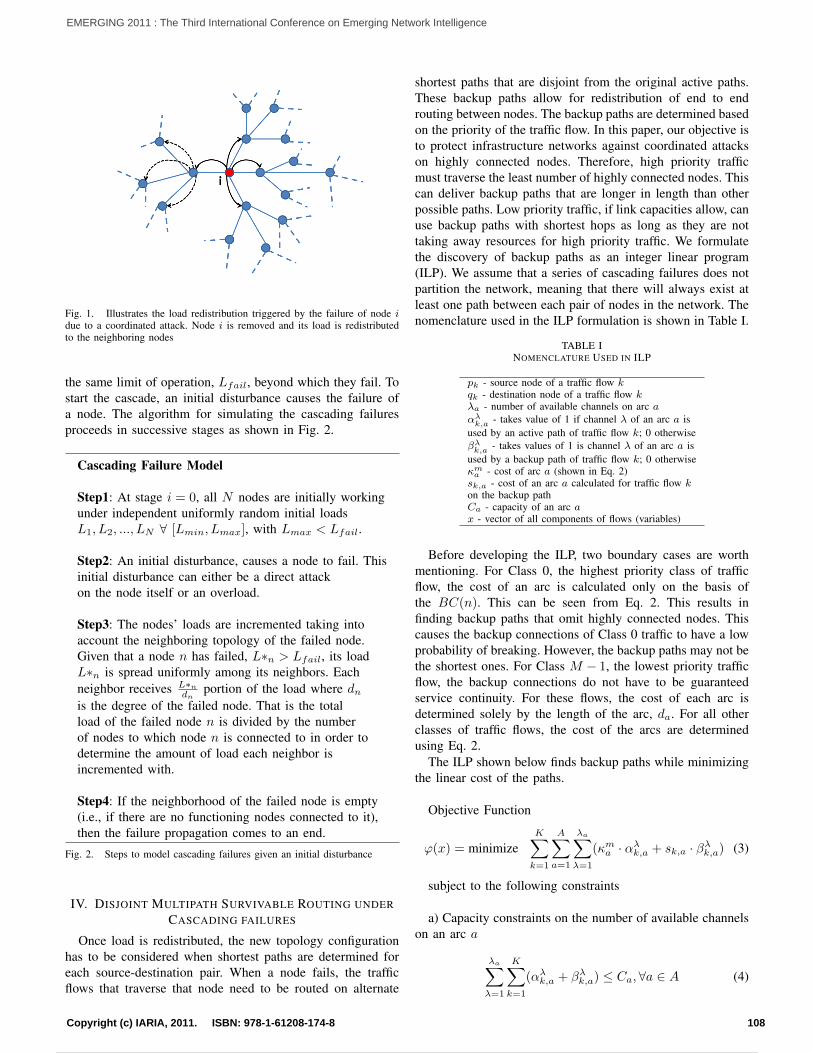
Fig. 1. Illustrates the load redistribution triggered by the failure of node idue to a coordinated attack. Node i is removed and its load is redistributedto the neighboring nodes
the same limit of operation, Lfail, beyond which they fail. Tostart the cascade, an initial disturbance causes the failure ofa node. The algorithm for simulating the cascading failuresproceeds in successive stages as shown in Fig. 2.
Cascading Failure Model
Step1: At stage i = 0, all N nodes are initially workingunder independent uniformly random initial loadsL1, L2, ..., LN ∀ [Lmin, Lmax], with Lmax < Lfail.
Step2: An initial disturbance, causes a node to fail. Thisinitial disturbance can either be a direct attackon the node itself or an overload.
Step3: The nodes’ loads are incremented taking intoaccount the neighboring topology of the failed node.Given that a node n has failed, L∗n > Lfail, its loadL∗n is spread uniformly among its neighbors. Eachneighbor receives L∗n
dnportion of the load where dn
is the degree of the failed node. That is the totalload of the failed node n is divided by the numberof nodes to which node n is connected to in order todetermine the amount of load each neighbor isincremented with.
Step4: If the neighborhood of the failed node is empty(i.e., if there are no functioning nodes connected to it),then the failure propagation comes to an end.
Fig. 2. Steps to model cascading failures given an initial disturbance
IV. DISJOINT MULTIPATH SURVIVABLE ROUTING UNDERCASCADING FAILURES
Once load is redistributed, the new topology configurationhas to be considered when shortest paths are determined foreach source-destination pair. When a node fails, the trafficflows that traverse that node need to be routed on alternate
shortest paths that are disjoint from the original active paths.These backup paths allow for redistribution of end to endrouting between nodes. The backup paths are determined basedon the priority of the traffic flow. In this paper, our objective isto protect infrastructure networks against coordinated attackson highly connected nodes. Therefore, high priority trafficmust traverse the least number of highly connected nodes. Thiscan deliver backup paths that are longer in length than otherpossible paths. Low priority traffic, if link capacities allow, canuse backup paths with shortest hops as long as they are nottaking away resources for high priority traffic. We formulatethe discovery of backup paths as an integer linear program(ILP). We assume that a series of cascading failures does notpartition the network, meaning that there will always exist atleast one path between each pair of nodes in the network. Thenomenclature used in the ILP formulation is shown in Table I.
TABLE INOMENCLATURE USED IN ILP
pk - source node of a traffic flow kqk - destination node of a traffic flow kλa - number of available channels on arc aαλk,a - takes value of 1 if channel λ of an arc a isused by an active path of traffic flow k; 0 otherwiseβλk,a - takes values of 1 is channel λ of an arc a isused by a backup path of traffic flow k; 0 otherwiseκma - cost of arc a (shown in Eq. 2)sk,a - cost of an arc a calculated for traffic flow kon the backup pathCa - capacity of an arc ax - vector of all components of flows (variables)
Before developing the ILP, two boundary cases are worthmentioning. For Class 0, the highest priority class of trafficflow, the cost of an arc is calculated only on the basis ofthe BC(n). This can be seen from Eq. 2. This results infinding backup paths that omit highly connected nodes. Thiscauses the backup connections of Class 0 traffic to have a lowprobability of breaking. However, the backup paths may not bethe shortest ones. For Class M − 1, the lowest priority trafficflow, the backup connections do not have to be guaranteedservice continuity. For these flows, the cost of each arc isdetermined solely by the length of the arc, da. For all otherclasses of traffic flows, the cost of the arcs are determinedusing Eq. 2.
The ILP shown below finds backup paths while minimizingthe linear cost of the paths.
Objective Function
ϕ(x) = minimizeK∑k=1
A∑a=1
λa∑λ=1
(κma · αλk,a + sk,a · βλk,a) (3)
subject to the following constraints
a) Capacity constraints on the number of available channelson an arc a
λa∑λ=1
K∑k=1
(αλk,a + βλk,a) ≤ Ca,∀a ∈ A (4)
108Copyright (c) IARIA, 2011. ISBN: 978-1-61208-174-8
EMERGING 2011 : The Third International Conference on Emerging Network Intelligence
115 / 141
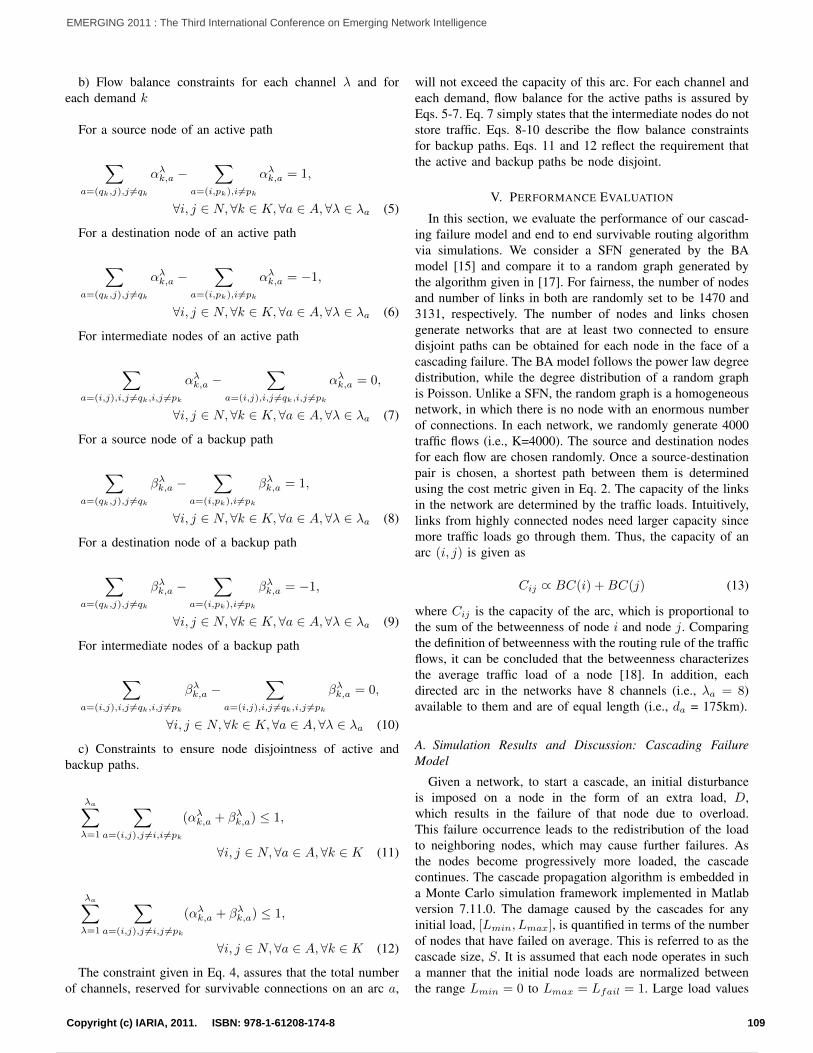
b) Flow balance constraints for each channel λ and foreach demand k
For a source node of an active path
∑a=(qk,j),j 6=qk
αλk,a −∑
a=(i,pk),i6=pk
αλk,a = 1,
∀i, j ∈ N, ∀k ∈ K,∀a ∈ A,∀λ ∈ λa (5)
For a destination node of an active path
∑a=(qk,j),j 6=qk
αλk,a −∑
a=(i,pk),i6=pk
αλk,a = −1,
∀i, j ∈ N, ∀k ∈ K,∀a ∈ A,∀λ ∈ λa (6)
For intermediate nodes of an active path
∑a=(i,j),i,j 6=qk,i,j 6=pk
αλk,a −∑
a=(i,j),i,j 6=qk,i,j 6=pk
αλk,a = 0,
∀i, j ∈ N, ∀k ∈ K,∀a ∈ A,∀λ ∈ λa (7)
For a source node of a backup path
∑a=(qk,j),j 6=qk
βλk,a −∑
a=(i,pk),i6=pk
βλk,a = 1,
∀i, j ∈ N, ∀k ∈ K,∀a ∈ A,∀λ ∈ λa (8)
For a destination node of a backup path
∑a=(qk,j),j 6=qk
βλk,a −∑
a=(i,pk),i6=pk
βλk,a = −1,
∀i, j ∈ N, ∀k ∈ K,∀a ∈ A,∀λ ∈ λa (9)
For intermediate nodes of a backup path
∑a=(i,j),i,j 6=qk,i,j 6=pk
βλk,a −∑
a=(i,j),i,j 6=qk,i,j 6=pk
βλk,a = 0,
∀i, j ∈ N, ∀k ∈ K, ∀a ∈ A,∀λ ∈ λa (10)
c) Constraints to ensure node disjointness of active andbackup paths.
λa∑λ=1
∑a=(i,j),j 6=i,i 6=pk
(αλk,a + βλk,a) ≤ 1,
∀i, j ∈ N, ∀a ∈ A,∀k ∈ K (11)
λa∑λ=1
∑a=(i,j),j 6=i,j 6=pk
(αλk,a + βλk,a) ≤ 1,
∀i, j ∈ N, ∀a ∈ A,∀k ∈ K (12)
The constraint given in Eq. 4, assures that the total numberof channels, reserved for survivable connections on an arc a,
will not exceed the capacity of this arc. For each channel andeach demand, flow balance for the active paths is assured byEqs. 5-7. Eq. 7 simply states that the intermediate nodes do notstore traffic. Eqs. 8-10 describe the flow balance constraintsfor backup paths. Eqs. 11 and 12 reflect the requirement thatthe active and backup paths be node disjoint.
V. PERFORMANCE EVALUATION
In this section, we evaluate the performance of our cascad-ing failure model and end to end survivable routing algorithmvia simulations. We consider a SFN generated by the BAmodel [15] and compare it to a random graph generated bythe algorithm given in [17]. For fairness, the number of nodesand number of links in both are randomly set to be 1470 and3131, respectively. The number of nodes and links chosengenerate networks that are at least two connected to ensuredisjoint paths can be obtained for each node in the face of acascading failure. The BA model follows the power law degreedistribution, while the degree distribution of a random graphis Poisson. Unlike a SFN, the random graph is a homogeneousnetwork, in which there is no node with an enormous numberof connections. In each network, we randomly generate 4000traffic flows (i.e., K=4000). The source and destination nodesfor each flow are chosen randomly. Once a source-destinationpair is chosen, a shortest path between them is determinedusing the cost metric given in Eq. 2. The capacity of the linksin the network are determined by the traffic loads. Intuitively,links from highly connected nodes need larger capacity sincemore traffic loads go through them. Thus, the capacity of anarc (i, j) is given as
Cij ∝ BC(i) +BC(j) (13)
where Cij is the capacity of the arc, which is proportional tothe sum of the betweenness of node i and node j. Comparingthe definition of betweenness with the routing rule of the trafficflows, it can be concluded that the betweenness characterizesthe average traffic load of a node [18]. In addition, eachdirected arc in the networks have 8 channels (i.e., λa = 8)available to them and are of equal length (i.e., da = 175km).
A. Simulation Results and Discussion: Cascading FailureModel
Given a network, to start a cascade, an initial disturbanceis imposed on a node in the form of an extra load, D,which results in the failure of that node due to overload.This failure occurrence leads to the redistribution of the loadto neighboring nodes, which may cause further failures. Asthe nodes become progressively more loaded, the cascadecontinues. The cascade propagation algorithm is embedded ina Monte Carlo simulation framework implemented in Matlabversion 7.11.0. The damage caused by the cascades for anyinitial load, [Lmin, Lmax], is quantified in terms of the numberof nodes that have failed on average. This is referred to as thecascade size, S. It is assumed that each node operates in sucha manner that the initial node loads are normalized betweenthe range Lmin = 0 to Lmax = Lfail = 1. Large load values
109Copyright (c) IARIA, 2011. ISBN: 978-1-61208-174-8
EMERGING 2011 : The Third International Conference on Emerging Network Intelligence
116 / 141
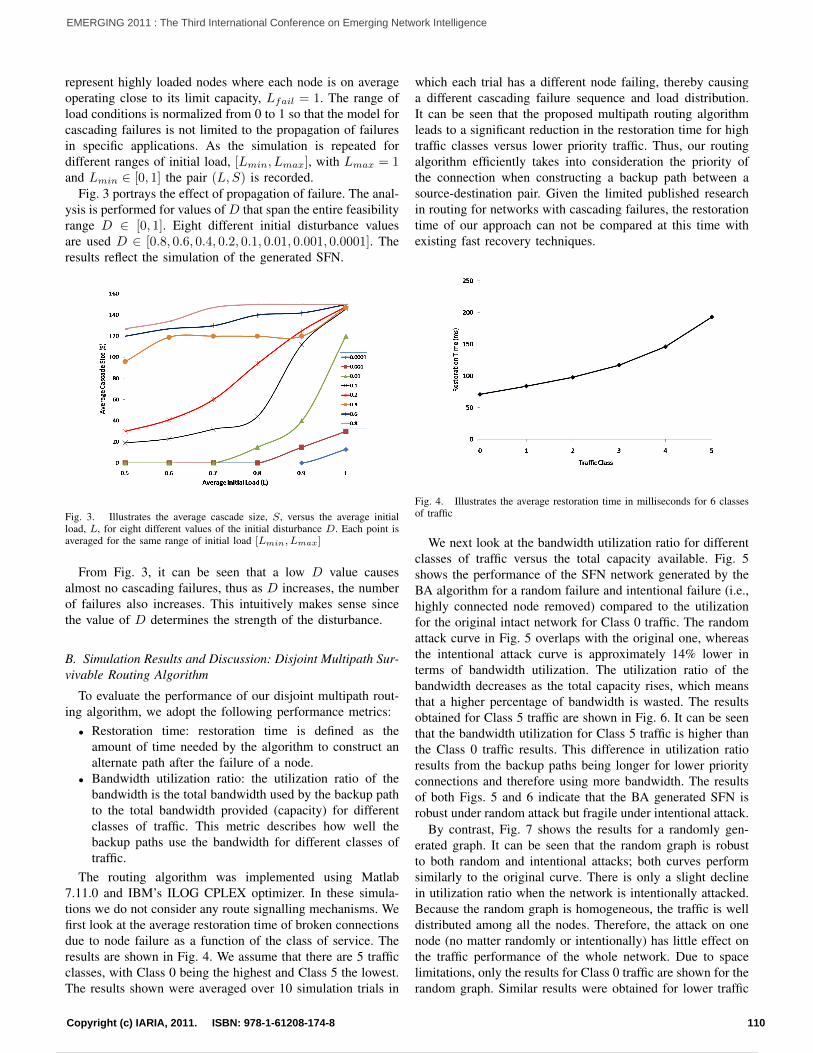
represent highly loaded nodes where each node is on averageoperating close to its limit capacity, Lfail = 1. The range ofload conditions is normalized from 0 to 1 so that the model forcascading failures is not limited to the propagation of failuresin specific applications. As the simulation is repeated fordifferent ranges of initial load, [Lmin, Lmax], with Lmax = 1and Lmin ∈ [0, 1] the pair (L, S) is recorded.
Fig. 3 portrays the effect of propagation of failure. The anal-ysis is performed for values of D that span the entire feasibilityrange D ∈ [0, 1]. Eight different initial disturbance valuesare used D ∈ [0.8, 0.6, 0.4, 0.2, 0.1, 0.01, 0.001, 0.0001]. Theresults reflect the simulation of the generated SFN.
Fig. 3. Illustrates the average cascade size, S, versus the average initialload, L, for eight different values of the initial disturbance D. Each point isaveraged for the same range of initial load [Lmin, Lmax]
From Fig. 3, it can be seen that a low D value causesalmost no cascading failures, thus as D increases, the numberof failures also increases. This intuitively makes sense sincethe value of D determines the strength of the disturbance.
B. Simulation Results and Discussion: Disjoint Multipath Sur-vivable Routing Algorithm
To evaluate the performance of our disjoint multipath rout-ing algorithm, we adopt the following performance metrics:• Restoration time: restoration time is defined as the
amount of time needed by the algorithm to construct analternate path after the failure of a node.
• Bandwidth utilization ratio: the utilization ratio of thebandwidth is the total bandwidth used by the backup pathto the total bandwidth provided (capacity) for differentclasses of traffic. This metric describes how well thebackup paths use the bandwidth for different classes oftraffic.
The routing algorithm was implemented using Matlab7.11.0 and IBM’s ILOG CPLEX optimizer. In these simula-tions we do not consider any route signalling mechanisms. Wefirst look at the average restoration time of broken connectionsdue to node failure as a function of the class of service. Theresults are shown in Fig. 4. We assume that there are 5 trafficclasses, with Class 0 being the highest and Class 5 the lowest.The results shown were averaged over 10 simulation trials in
which each trial has a different node failing, thereby causinga different cascading failure sequence and load distribution.It can be seen that the proposed multipath routing algorithmleads to a significant reduction in the restoration time for hightraffic classes versus lower priority traffic. Thus, our routingalgorithm efficiently takes into consideration the priority ofthe connection when constructing a backup path between asource-destination pair. Given the limited published researchin routing for networks with cascading failures, the restorationtime of our approach can not be compared at this time withexisting fast recovery techniques.
Fig. 4. Illustrates the average restoration time in milliseconds for 6 classesof traffic
We next look at the bandwidth utilization ratio for differentclasses of traffic versus the total capacity available. Fig. 5shows the performance of the SFN network generated by theBA algorithm for a random failure and intentional failure (i.e.,highly connected node removed) compared to the utilizationfor the original intact network for Class 0 traffic. The randomattack curve in Fig. 5 overlaps with the original one, whereasthe intentional attack curve is approximately 14% lower interms of bandwidth utilization. The utilization ratio of thebandwidth decreases as the total capacity rises, which meansthat a higher percentage of bandwidth is wasted. The resultsobtained for Class 5 traffic are shown in Fig. 6. It can be seenthat the bandwidth utilization for Class 5 traffic is higher thanthe Class 0 traffic results. This difference in utilization ratioresults from the backup paths being longer for lower priorityconnections and therefore using more bandwidth. The resultsof both Figs. 5 and 6 indicate that the BA generated SFN isrobust under random attack but fragile under intentional attack.
By contrast, Fig. 7 shows the results for a randomly gen-erated graph. It can be seen that the random graph is robustto both random and intentional attacks; both curves performsimilarly to the original curve. There is only a slight declinein utilization ratio when the network is intentionally attacked.Because the random graph is homogeneous, the traffic is welldistributed among all the nodes. Therefore, the attack on onenode (no matter randomly or intentionally) has little effect onthe traffic performance of the whole network. Due to spacelimitations, only the results for Class 0 traffic are shown for therandom graph. Similar results were obtained for lower traffic
110Copyright (c) IARIA, 2011. ISBN: 978-1-61208-174-8
EMERGING 2011 : The Third International Conference on Emerging Network Intelligence
117 / 141
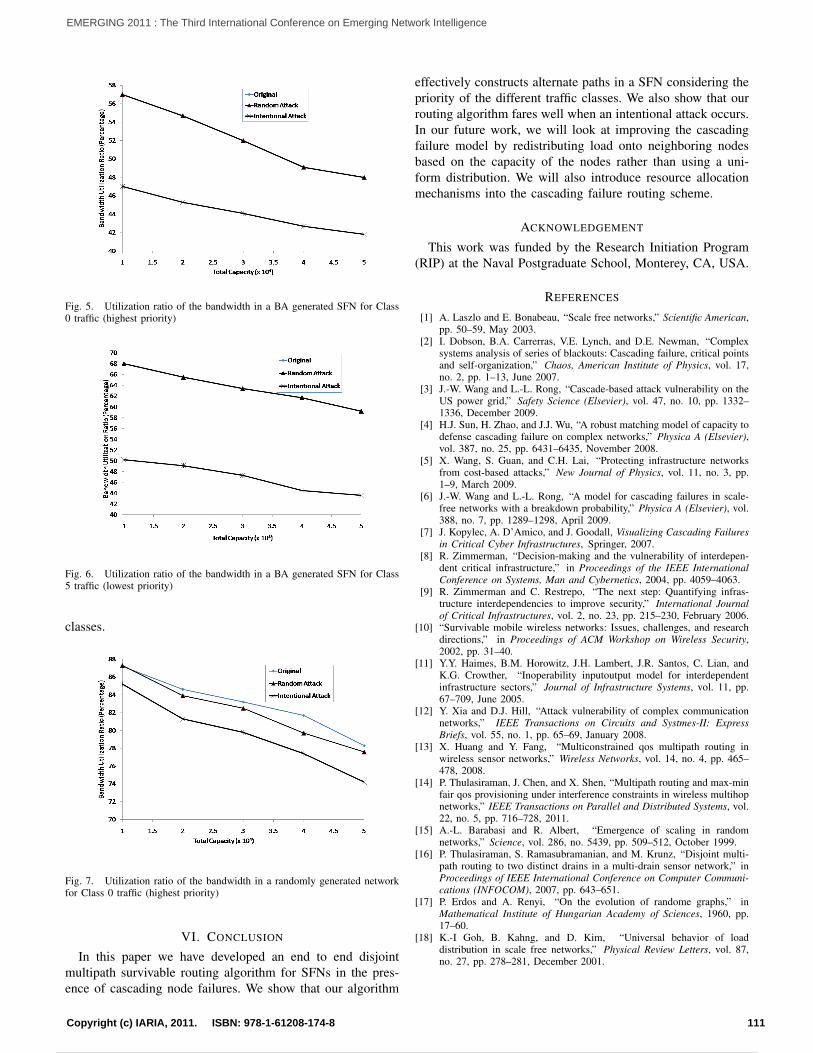
Fig. 5. Utilization ratio of the bandwidth in a BA generated SFN for Class0 traffic (highest priority)
Fig. 6. Utilization ratio of the bandwidth in a BA generated SFN for Class5 traffic (lowest priority)
classes.
Fig. 7. Utilization ratio of the bandwidth in a randomly generated networkfor Class 0 traffic (highest priority)
VI. CONCLUSION
In this paper we have developed an end to end disjointmultipath survivable routing algorithm for SFNs in the pres-ence of cascading node failures. We show that our algorithm
effectively constructs alternate paths in a SFN considering thepriority of the different traffic classes. We also show that ourrouting algorithm fares well when an intentional attack occurs.In our future work, we will look at improving the cascadingfailure model by redistributing load onto neighboring nodesbased on the capacity of the nodes rather than using a uni-form distribution. We will also introduce resource allocationmechanisms into the cascading failure routing scheme.
ACKNOWLEDGEMENT
This work was funded by the Research Initiation Program(RIP) at the Naval Postgraduate School, Monterey, CA, USA.
REFERENCES
[1] A. Laszlo and E. Bonabeau, “Scale free networks,” Scientific American,pp. 50–59, May 2003.
[2] I. Dobson, B.A. Carrerras, V.E. Lynch, and D.E. Newman, “Complexsystems analysis of series of blackouts: Cascading failure, critical pointsand self-organization,” Chaos, American Institute of Physics, vol. 17,no. 2, pp. 1–13, June 2007.
[3] J.-W. Wang and L.-L. Rong, “Cascade-based attack vulnerability on theUS power grid,” Safety Science (Elsevier), vol. 47, no. 10, pp. 1332–1336, December 2009.
[4] H.J. Sun, H. Zhao, and J.J. Wu, “A robust matching model of capacity todefense cascading failure on complex networks,” Physica A (Elsevier),vol. 387, no. 25, pp. 6431–6435, November 2008.
[5] X. Wang, S. Guan, and C.H. Lai, “Protecting infrastructure networksfrom cost-based attacks,” New Journal of Physics, vol. 11, no. 3, pp.1–9, March 2009.
[6] J.-W. Wang and L.-L. Rong, “A model for cascading failures in scale-free networks with a breakdown probability,” Physica A (Elsevier), vol.388, no. 7, pp. 1289–1298, April 2009.
[7] J. Kopylec, A. D’Amico, and J. Goodall, Visualizing Cascading Failuresin Critical Cyber Infrastructures, Springer, 2007.
[8] R. Zimmerman, “Decision-making and the vulnerability of interdepen-dent critical infrastructure,” in Proceedings of the IEEE InternationalConference on Systems, Man and Cybernetics, 2004, pp. 4059–4063.
[9] R. Zimmerman and C. Restrepo, “The next step: Quantifying infras-tructure interdependencies to improve security,” International Journalof Critical Infrastructures, vol. 2, no. 23, pp. 215–230, February 2006.
[10] “Survivable mobile wireless networks: Issues, challenges, and researchdirections,” in Proceedings of ACM Workshop on Wireless Security,2002, pp. 31–40.
[11] Y.Y. Haimes, B.M. Horowitz, J.H. Lambert, J.R. Santos, C. Lian, andK.G. Crowther, “Inoperability inputoutput model for interdependentinfrastructure sectors,” Journal of Infrastructure Systems, vol. 11, pp.67–709, June 2005.
[12] Y. Xia and D.J. Hill, “Attack vulnerability of complex communicationnetworks,” IEEE Transactions on Circuits and Systmes-II: ExpressBriefs, vol. 55, no. 1, pp. 65–69, January 2008.
[13] X. Huang and Y. Fang, “Multiconstrained qos multipath routing inwireless sensor networks,” Wireless Networks, vol. 14, no. 4, pp. 465–478, 2008.
[14] P. Thulasiraman, J. Chen, and X. Shen, “Multipath routing and max-minfair qos provisioning under interference constraints in wireless multihopnetworks,” IEEE Transactions on Parallel and Distributed Systems, vol.22, no. 5, pp. 716–728, 2011.
[15] A.-L. Barabasi and R. Albert, “Emergence of scaling in randomnetworks,” Science, vol. 286, no. 5439, pp. 509–512, October 1999.
[16] P. Thulasiraman, S. Ramasubramanian, and M. Krunz, “Disjoint multi-path routing to two distinct drains in a multi-drain sensor network,” inProceedings of IEEE International Conference on Computer Communi-cations (INFOCOM), 2007, pp. 643–651.
[17] P. Erdos and A. Renyi, “On the evolution of randome graphs,” inMathematical Institute of Hungarian Academy of Sciences, 1960, pp.17–60.
[18] K.-I Goh, B. Kahng, and D. Kim, “Universal behavior of loaddistribution in scale free networks,” Physical Review Letters, vol. 87,no. 27, pp. 278–281, December 2001.
111Copyright (c) IARIA, 2011. ISBN: 978-1-61208-174-8
EMERGING 2011 : The Third International Conference on Emerging Network Intelligence
118 / 141
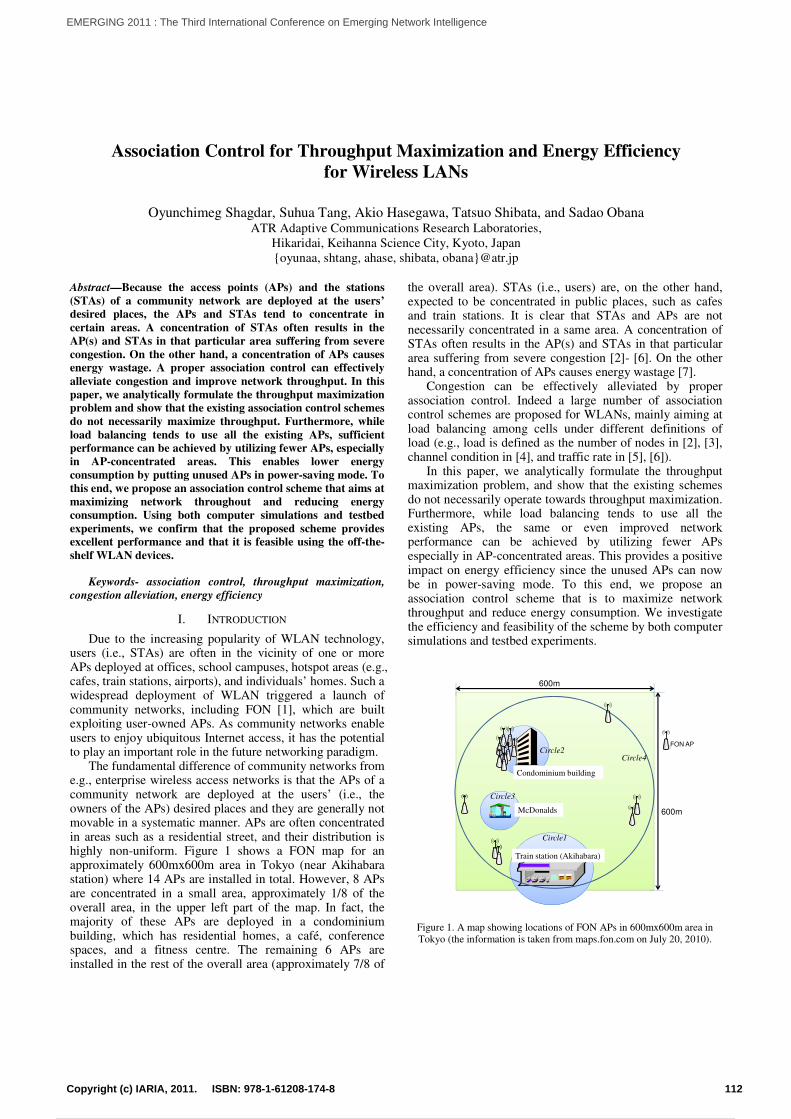
Association Control for Throughput Maximization and Energy Efficiency
for Wireless LANs
Oyunchimeg Shagdar, Suhua Tang, Akio Hasegawa, Tatsuo Shibata, and Sadao Obana ATR Adaptive Communications Research Laboratories,
Hikaridai, Keihanna Science City, Kyoto, Japan
oyunaa, shtang, ahase, shibata, [email protected]
Abstract—Because the access points (APs) and the stations
(STAs) of a community network are deployed at the users’
desired places, the APs and STAs tend to concentrate in
certain areas. A concentration of STAs often results in the
AP(s) and STAs in that particular area suffering from severe
congestion. On the other hand, a concentration of APs causes
energy wastage. A proper association control can effectively
alleviate congestion and improve network throughput. In this
paper, we analytically formulate the throughput maximization
problem and show that the existing association control schemes
do not necessarily maximize throughput. Furthermore, while
load balancing tends to use all the existing APs, sufficient
performance can be achieved by utilizing fewer APs, especially
in AP-concentrated areas. This enables lower energy
consumption by putting unused APs in power-saving mode. To
this end, we propose an association control scheme that aims at
maximizing network throughout and reducing energy
consumption. Using both computer simulations and testbed
experiments, we confirm that the proposed scheme provides
excellent performance and that it is feasible using the off-the-
shelf WLAN devices.
Keywords- association control, throughput maximization,
congestion alleviation, energy efficiency
I. INTRODUCTION
Due to the increasing popularity of WLAN technology, users (i.e., STAs) are often in the vicinity of one or more APs deployed at offices, school campuses, hotspot areas (e.g., cafes, train stations, airports), and individuals’ homes. Such a widespread deployment of WLAN triggered a launch of community networks, including FON [1], which are built exploiting user-owned APs. As community networks enable users to enjoy ubiquitous Internet access, it has the potential to play an important role in the future networking paradigm.
The fundamental difference of community networks from e.g., enterprise wireless access networks is that the APs of a community network are deployed at the users’ (i.e., the owners of the APs) desired places and they are generally not movable in a systematic manner. APs are often concentrated in areas such as a residential street, and their distribution is highly non-uniform. Figure 1 shows a FON map for an approximately 600mx600m area in Tokyo (near Akihabara station) where 14 APs are installed in total. However, 8 APs are concentrated in a small area, approximately 1/8 of the overall area, in the upper left part of the map. In fact, the majority of these APs are deployed in a condominium building, which has residential homes, a café, conference spaces, and a fitness centre. The remaining 6 APs are installed in the rest of the overall area (approximately 7/8 of
the overall area). STAs (i.e., users) are, on the other hand, expected to be concentrated in public places, such as cafes and train stations. It is clear that STAs and APs are not necessarily concentrated in a same area. A concentration of STAs often results in the AP(s) and STAs in that particular area suffering from severe congestion [2]- [6]. On the other hand, a concentration of APs causes energy wastage [7].
Congestion can be effectively alleviated by proper association control. Indeed a large number of association control schemes are proposed for WLANs, mainly aiming at load balancing among cells under different definitions of load (e.g., load is defined as the number of nodes in [2], [3], channel condition in [4], and traffic rate in [5], [6]).
In this paper, we analytically formulate the throughput maximization problem, and show that the existing schemes do not necessarily operate towards throughput maximization. Furthermore, while load balancing tends to use all the existing APs, the same or even improved network performance can be achieved by utilizing fewer APs especially in AP-concentrated areas. This provides a positive impact on energy efficiency since the unused APs can now be in power-saving mode. To this end, we propose an association control scheme that is to maximize network throughput and reduce energy consumption. We investigate the efficiency and feasibility of the scheme by both computer simulations and testbed experiments.
Train station (Akihabara)
Condominium building
McDonalds
Circle1
Circle3
Circle2Circle4
600m
600m
FON AP
Figure 1. A map showing locations of FON APs in 600mx600m area in
Tokyo (the information is taken from maps.fon.com on July 20, 2010).
112Copyright (c) IARIA, 2011. ISBN: 978-1-61208-174-8
EMERGING 2011 : The Third International Conference on Emerging Network Intelligence
119 / 141
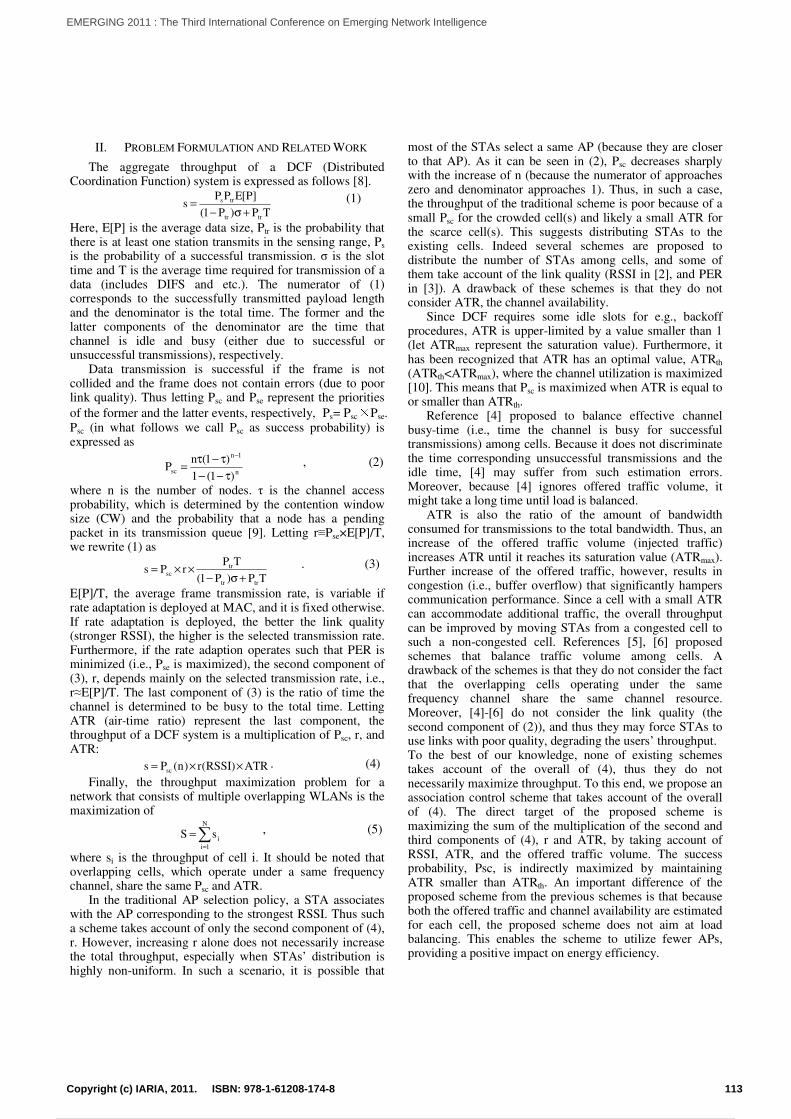
II. PROBLEM FORMULATION AND RELATED WORK
The aggregate throughput of a DCF (Distributed Coordination Function) system is expressed as follows [8].
TP)P1(
]P[EPPs
trtr
trs
+σ−
= (1)
Here, E[P] is the average data size, Ptr is the probability that there is at least one station transmits in the sensing range, Ps is the probability of a successful transmission. σ is the slot time and T is the average time required for transmission of a data (includes DIFS and etc.). The numerator of (1) corresponds to the successfully transmitted payload length and the denominator is the total time. The former and the latter components of the denominator are the time that channel is idle and busy (either due to successful or unsuccessful transmissions), respectively.
Data transmission is successful if the frame is not collided and the frame does not contain errors (due to poor link quality). Thus letting Psc and Pse represent the priorities
of the former and the latter events, respectively, Ps= Psc×Pse. Psc (in what follows we call Psc as success probability) is expressed as
n
1n
sc)1(1
)1(nP
τ−−
τ−τ=
−
, (2)
where n is the number of nodes. τ is the channel access probability, which is determined by the contention window size (CW) and the probability that a node has a pending packet in its transmission queue [9]. Letting r≡Pse×E[P]/T, we rewrite (1) as
TP)P1(
TPrPs
trtr
trsc
+σ−
××= . (3)
E[P]/T, the average frame transmission rate, is variable if rate adaptation is deployed at MAC, and it is fixed otherwise. If rate adaptation is deployed, the better the link quality (stronger RSSI), the higher is the selected transmission rate. Furthermore, if the rate adaption operates such that PER is minimized (i.e., Pse is maximized), the second component of (3), r, depends mainly on the selected transmission rate, i.e., r≈E[P]/T. The last component of (3) is the ratio of time the channel is determined to be busy to the total time. Letting ATR (air-time ratio) represent the last component, the throughput of a DCF system is a multiplication of Psc, r, and ATR:
ATR)RSSI(r)n(Ps sc ××= . (4)
Finally, the throughput maximization problem for a network that consists of multiple overlapping WLANs is the maximization of
∑=
=
N
1i
isS , (5)
where si is the throughput of cell i. It should be noted that overlapping cells, which operate under a same frequency channel, share the same Psc and ATR.
In the traditional AP selection policy, a STA associates with the AP corresponding to the strongest RSSI. Thus such a scheme takes account of only the second component of (4), r. However, increasing r alone does not necessarily increase the total throughput, especially when STAs’ distribution is highly non-uniform. In such a scenario, it is possible that
most of the STAs select a same AP (because they are closer to that AP). As it can be seen in (2), Psc decreases sharply with the increase of n (because the numerator of approaches zero and denominator approaches 1). Thus, in such a case, the throughput of the traditional scheme is poor because of a small Psc for the crowded cell(s) and likely a small ATR for the scarce cell(s). This suggests distributing STAs to the existing cells. Indeed several schemes are proposed to distribute the number of STAs among cells, and some of them take account of the link quality (RSSI in [2], and PER in [3]). A drawback of these schemes is that they do not consider ATR, the channel availability.
Since DCF requires some idle slots for e.g., backoff procedures, ATR is upper-limited by a value smaller than 1 (let ATRmax represent the saturation value). Furthermore, it has been recognized that ATR has an optimal value, ATRth (ATRth<ATRmax), where the channel utilization is maximized [10]. This means that Psc is maximized when ATR is equal to or smaller than ATRth.
Reference [4] proposed to balance effective channel busy-time (i.e., time the channel is busy for successful transmissions) among cells. Because it does not discriminate the time corresponding unsuccessful transmissions and the idle time, [4] may suffer from such estimation errors. Moreover, because [4] ignores offered traffic volume, it might take a long time until load is balanced.
ATR is also the ratio of the amount of bandwidth consumed for transmissions to the total bandwidth. Thus, an increase of the offered traffic volume (injected traffic) increases ATR until it reaches its saturation value (ATRmax). Further increase of the offered traffic, however, results in congestion (i.e., buffer overflow) that significantly hampers communication performance. Since a cell with a small ATR can accommodate additional traffic, the overall throughput can be improved by moving STAs from a congested cell to such a non-congested cell. References [5], [6] proposed schemes that balance traffic volume among cells. A drawback of the schemes is that they do not consider the fact that the overlapping cells operating under the same frequency channel share the same channel resource. Moreover, [4]-[6] do not consider the link quality (the second component of (2)), and thus they may force STAs to use links with poor quality, degrading the users’ throughput. To the best of our knowledge, none of existing schemes takes account of the overall of (4), thus they do not necessarily maximize throughput. To this end, we propose an association control scheme that takes account of the overall of (4). The direct target of the proposed scheme is maximizing the sum of the multiplication of the second and third components of (4), r and ATR, by taking account of RSSI, ATR, and the offered traffic volume. The success probability, Psc, is indirectly maximized by maintaining ATR smaller than ATRth. An important difference of the proposed scheme from the previous schemes is that because both the offered traffic and channel availability are estimated for each cell, the proposed scheme does not aim at load balancing. This enables the scheme to utilize fewer APs, providing a positive impact on energy efficiency.
113Copyright (c) IARIA, 2011. ISBN: 978-1-61208-174-8
EMERGING 2011 : The Third International Conference on Emerging Network Intelligence
120 / 141
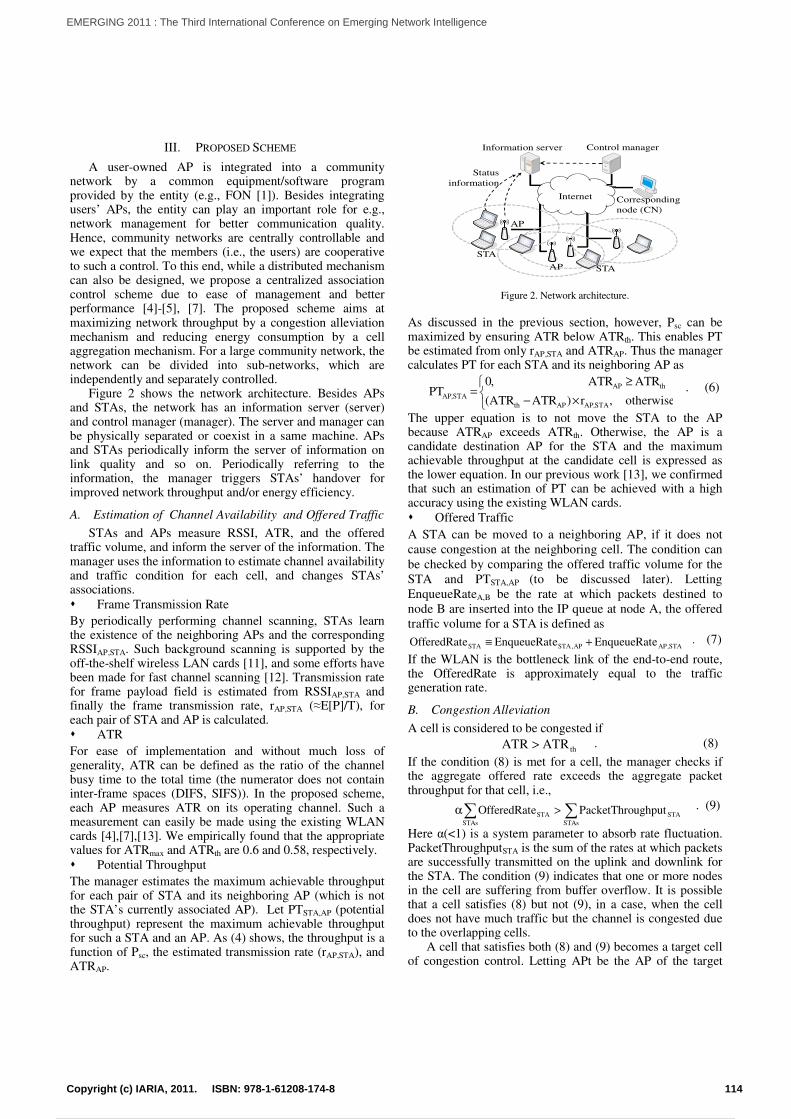
III. PROPOSED SCHEME
A user-owned AP is integrated into a community network by a common equipment/software program provided by the entity (e.g., FON [1]). Besides integrating users’ APs, the entity can play an important role for e.g., network management for better communication quality. Hence, community networks are centrally controllable and we expect that the members (i.e., the users) are cooperative to such a control. To this end, while a distributed mechanism can also be designed, we propose a centralized association control scheme due to ease of management and better performance [4]-[5], [7]. The proposed scheme aims at maximizing network throughput by a congestion alleviation mechanism and reducing energy consumption by a cell aggregation mechanism. For a large community network, the network can be divided into sub-networks, which are independently and separately controlled.
Figure 2 shows the network architecture. Besides APs and STAs, the network has an information server (server) and control manager (manager). The server and manager can be physically separated or coexist in a same machine. APs and STAs periodically inform the server of information on link quality and so on. Periodically referring to the information, the manager triggers STAs’ handover for improved network throughput and/or energy efficiency.
A. Estimation of Channel Availability and Offered Traffic
STAs and APs measure RSSI, ATR, and the offered traffic volume, and inform the server of the information. The manager uses the information to estimate channel availability and traffic condition for each cell, and changes STAs’ associations.
Frame Transmission Rate
By periodically performing channel scanning, STAs learn the existence of the neighboring APs and the corresponding RSSIAP,STA. Such background scanning is supported by the off-the-shelf wireless LAN cards [11], and some efforts have been made for fast channel scanning [12]. Transmission rate for frame payload field is estimated from RSSIAP,STA and finally the frame transmission rate, rAP,STA (≈E[P]/T), for each pair of STA and AP is calculated.
ATR
For ease of implementation and without much loss of generality, ATR can be defined as the ratio of the channel busy time to the total time (the numerator does not contain inter-frame spaces (DIFS, SIFS)). In the proposed scheme, each AP measures ATR on its operating channel. Such a measurement can easily be made using the existing WLAN cards [4],[7],[13]. We empirically found that the appropriate values for ATRmax and ATRth are 0.6 and 0.58, respectively.
Potential Throughput
The manager estimates the maximum achievable throughput for each pair of STA and its neighboring AP (which is not the STA’s currently associated AP). Let PTSTA,AP (potential throughput) represent the maximum achievable throughput for such a STA and an AP. As (4) shows, the throughput is a function of Psc, the estimated transmission rate (rAP,STA), and ATRAP.
Status
information
STA
AP
Corresponding
node (CN)
Control managerInformation server
Internet
STAAP
Figure 2. Network architecture.
As discussed in the previous section, however, Psc can be maximized by ensuring ATR below ATRth. This enables PT be estimated from only rAP,STA and ATRAP. Thus the manager calculates PT for each STA and its neighboring AP as
×−
≥
=otherwise,r)ATRATR(
ATRATR,0PT
STA,APAPth
thAP
STA,AP . (6)
The upper equation is to not move the STA to the AP because ATRAP exceeds ATRth. Otherwise, the AP is a candidate destination AP for the STA and the maximum achievable throughput at the candidate cell is expressed as the lower equation. In our previous work [13], we confirmed that such an estimation of PT can be achieved with a high accuracy using the existing WLAN cards.
Offered Traffic
A STA can be moved to a neighboring AP, if it does not
cause congestion at the neighboring cell. The condition can
be checked by comparing the offered traffic volume for the
STA and PTSTA,AP (to be discussed later). Letting
EnqueueRateA,B be the rate at which packets destined to
node B are inserted into the IP queue at node A, the offered
traffic volume for a STA is defined as STA,APAP,STASTA eEnqueueRateEnqueueRateOfferedRat +≡ . (7)
If the WLAN is the bottleneck link of the end-to-end route, the OfferedRate is approximately equal to the traffic generation rate.
B. Congestion Alleviation
A cell is considered to be congested if
thATRATR > . (8)
If the condition (8) is met for a cell, the manager checks if the aggregate offered rate exceeds the aggregate packet throughput for that cell, i.e., ∑∑ >α
STAs
STA
STAs
STA ughputPacketThroeOfferedRat . (9)
Here α(<1) is a system parameter to absorb rate fluctuation. PacketThroughputSTA is the sum of the rates at which packets are successfully transmitted on the uplink and downlink for the STA. The condition (9) indicates that one or more nodes in the cell are suffering from buffer overflow. It is possible that a cell satisfies (8) but not (9), in a case, when the cell does not have much traffic but the channel is congested due to the overlapping cells.
A cell that satisfies both (8) and (9) becomes a target cell of congestion control. Letting APt be the AP of the target
114Copyright (c) IARIA, 2011. ISBN: 978-1-61208-174-8
EMERGING 2011 : The Third International Conference on Emerging Network Intelligence
121 / 141
cell, the manager selects STAs to move from APt to its neighboring cells. The association control is made based on the following policies: 1. Moving STAs are selected such that the number of
handovers is minimized. 2. A STA should be moved only if it will not cause
congestion at the destination cell. 3. Among the candidate destination APs, the STA should
be moved to the AP corresponding to the strongest RSSI.
The more the handovers, the larger is the control overhead.
Thus policy 1 is to minimize the number of moving STAs.
To support this objective, we define “load” of a STA, as
LoadSTA≡OfferedRateSTA/TxRateSTA,APt. Here TxRateSTA,APt
is the rate used for transmissions of frame payload fields
between the STA and APt. Obviously, the larger the offered
traffic and/or the lower the transmission rate, the heavier
loaded is the STA for APt. Due to policy 1, heavier loaded
STAs are preferred to be moved from APt over lighter
loaded STAs. For policy 2, a STA is moved to a
neighbouring AP, APd, only if the condition (10) is met.
OfferedRateSTA< PTSTA, APd (10)
In other words, the STA is moved to APd only if the
destination cell can accommodate the offered traffic volume
for the STA. Finally, among the candidate destination APs
(i.e., the APs that satisfy (10) for the STA), the AP
corresponding to the strongest RSSI is selected as the
destination AP for the STA. When a STA, STAm, is selected to be moved from APt,
the manager updates the aggregate offered rate (see (9)) for the target cell by decrementing it by OfferedRateSTAm. Moreover ATR for the destination cell and its overlapping cells (which operate using the same channel) is incremented by OfferedRateSTAm/rAPd,STAm. After updating the values, the manager checks if the target cell still satisfies (9). If it does, the manager selects the next moving STA.
Discussion on TCP traffic
TCP reacts to congestion and controls its rate based on AIMD algorithm. However such a rate change occurs in the order of RTT (milliseconds) which is much shorter than the control period at the manager (in order of seconds). Therefore we expect that the proposed scheme does not react to the AIMD-based rate fluctuation, but only the gradual change of the average rate. Hence, the proposed scheme and TCP can stably coexist. Moreover because TCP adjusts its traffic rate, OfferedRateSTA for STA might be largely changed due to the STA’s movement. However, it should be reminded that a STA is moved to a neighbouring cell only if the destination cell can accommodate the current OfferedRate for the STA (see (10)). Thus we expect that TCP throughput will be increased or maintained after the STA’s movement. Furthermore, since some amount of channel resource is released at the previous cell of the moving STA, STAs in that cell can now increase their rate.
C. Cell Aggregation
Since both of the offered traffic volume and the channel availability are known for each cell, load balancing among
cells is not necessary. Indeed, if all the associated STAs of an AP can be moved to its neighboring cells without hampering the network throughput, such STA movements should be encouraged for energy efficiency, since the AP can now be in power-saving mode. Our scheme can provide such an association control based on the following policies: 1. The target AP is an AP that is associated with
preferably a few STAs, which can all be moved to the neighboring cells.
2. To suppress channel interference, the target AP should have overlapping cells that operate using the same frequency channel.
3. Policy 2 described in the previous subsection. 4. Policy 3 described in the previous subsection. The manager triggers a handover only if destination APs are found for all the STAs of the target AP. A detailed protocol design for actually putting APs in power-saving mode is left for our future work. The main concern of such a protocol design is to ensure newly arriving STAs are covered by the network. For such a control, Wake-on-WLAN technology [14] can be used.
D. Changing STA’s Association
To change a STA’s association, the manager sends a control frame to the STA, indicating the destination AP and the corresponding channel information. Such a network directed association control can be supported by the upcoming IEEE 802.11v [15], which enables APs to explicitly request STAs to re-associate with an alternate AP.
IV. PERFORMANCE EVALUATION
A. Simulation Evaluations
Using Scenargie network simulator [16], we investigate the proposed scheme with and without cell aggregation capability. The performance of the proposed scheme is compared against: - Strongest RSSI: The traditional AP selection scheme. - LB(NumofSTAs): A load balancing scheme [2], which
takes account of the number of STAs and RSSI. - LB(Traffic): A load balancing scheme [5], where load of
a cell is defined by traffic rate. In each scheme, STAs initially associate with APs based on the strongest RSSI policy. In the proposed scheme, STAs inform the server of the measured information using a 160 bytes packet. The manager checks the collected information in every 1s. 20-bytes of packets are used for handover requests and replies between the manager and moving STAs. α (see (9)) is set to 0.98.
Performances of the schemes are investigated for the real-world scenario depicted in Figure 1, where 14 APs are non-uniformly distributed in a 600mx600m area. 8 APs are concentrated in the small area (around the condominium), the other 6 APs are installed in the remaining area as shown in the figure. The network operates using IEEE 802.11a [17], where 3 orthogonal frequency channels are available. Frequency channel allocation (to the APs) is made based on a simple graph coloring technique.
115Copyright (c) IARIA, 2011. ISBN: 978-1-61208-174-8
EMERGING 2011 : The Third International Conference on Emerging Network Intelligence
122 / 141
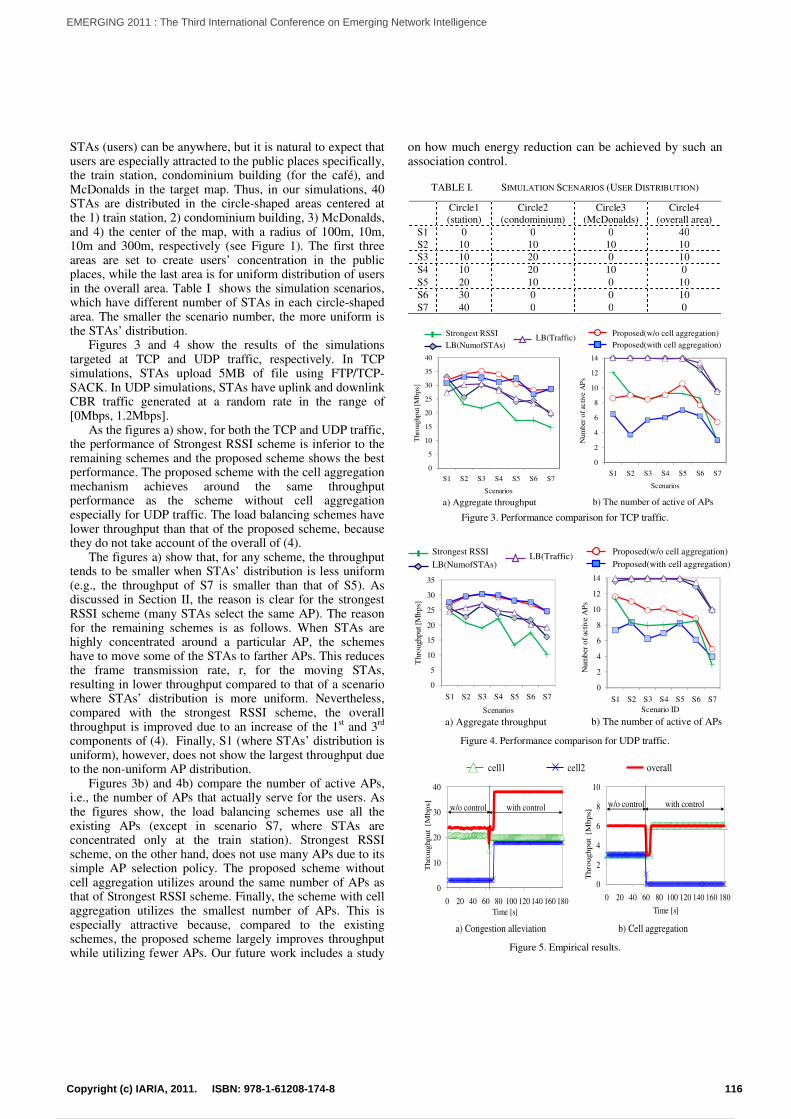
STAs (users) can be anywhere, but it is natural to expect that users are especially attracted to the public places specifically, the train station, condominium building (for the café), and McDonalds in the target map. Thus, in our simulations, 40 STAs are distributed in the circle-shaped areas centered at the 1) train station, 2) condominium building, 3) McDonalds, and 4) the center of the map, with a radius of 100m, 10m, 10m and 300m, respectively (see Figure 1). The first three areas are set to create users’ concentration in the public places, while the last area is for uniform distribution of users in the overall area. Table I shows the simulation scenarios, which have different number of STAs in each circle-shaped area. The smaller the scenario number, the more uniform is the STAs’ distribution.
Figures 3 and 4 show the results of the simulations targeted at TCP and UDP traffic, respectively. In TCP simulations, STAs upload 5MB of file using FTP/TCP-SACK. In UDP simulations, STAs have uplink and downlink CBR traffic generated at a random rate in the range of [0Mbps, 1.2Mbps].
As the figures a) show, for both the TCP and UDP traffic, the performance of Strongest RSSI scheme is inferior to the remaining schemes and the proposed scheme shows the best performance. The proposed scheme with the cell aggregation mechanism achieves around the same throughput performance as the scheme without cell aggregation especially for UDP traffic. The load balancing schemes have lower throughput than that of the proposed scheme, because they do not take account of the overall of (4).
The figures a) show that, for any scheme, the throughput tends to be smaller when STAs’ distribution is less uniform (e.g., the throughput of S7 is smaller than that of S5). As discussed in Section II, the reason is clear for the strongest RSSI scheme (many STAs select the same AP). The reason for the remaining schemes is as follows. When STAs are highly concentrated around a particular AP, the schemes have to move some of the STAs to farther APs. This reduces the frame transmission rate, r, for the moving STAs, resulting in lower throughput compared to that of a scenario where STAs’ distribution is more uniform. Nevertheless, compared with the strongest RSSI scheme, the overall throughput is improved due to an increase of the 1
st and 3
rd
components of (4). Finally, S1 (where STAs’ distribution is uniform), however, does not show the largest throughput due to the non-uniform AP distribution.
Figures 3b) and 4b) compare the number of active APs, i.e., the number of APs that actually serve for the users. As the figures show, the load balancing schemes use all the existing APs (except in scenario S7, where STAs are concentrated only at the train station). Strongest RSSI scheme, on the other hand, does not use many APs due to its simple AP selection policy. The proposed scheme without cell aggregation utilizes around the same number of APs as that of Strongest RSSI scheme. Finally, the scheme with cell aggregation utilizes the smallest number of APs. This is especially attractive because, compared to the existing schemes, the proposed scheme largely improves throughput while utilizing fewer APs. Our future work includes a study
on how much energy reduction can be achieved by such an association control.
TABLE I. SIMULATION SCENARIOS (USER DISTRIBUTION)
Circle1
(station)
Circle2
(condominium)
Circle3
(McDonalds)
Circle4
(overall area)
S1 0 0 0 40
S2 10 10 10 10
S3 10 20 0 10
S4 10 20 10 0
S5 20 10 0 10
S6 30 0 0 10
S7 40 0 0 0
Figure 3. Performance comparison for TCP traffic.
Figure 4. Performance comparison for UDP traffic.
Figure 5. Empirical results.
0
10
20
30
40
0 20 40 60 80 100 120 140 160 180
Thro
ughput
[Mbps]
Time [s]
0
2
4
6
8
10
0 20 40 60 80 100 120 140 160 180
Thro
ughput
[Mbps]
Time [s]
a) Congestion alleviation b) Cell aggregation
cell1 cell2 overall
w/o control with control w/o control with control
0
5
10
15
20
25
30
35
S1 S2 S3 S4 S5 S6 S7
Thro
ughp
ut [M
bp
s]
Scenarios
0
2
4
6
8
10
12
14
S1 S2 S3 S4 S5 S6 S7
Num
ber
of
active
AP
s
Scenario ID
Strongest RSSI
LB(NumofSTAs)LB(Traffic)
Proposed(w/o cell aggregation)
Proposed(with cell aggregation)
a) Aggregate throughput b) The number of active of APs
Strongest RSSI
LB(NumofSTAs)LB(Traffic)
Proposed(w/o cell aggregation)
Proposed(with cell aggregation)
0
5
10
15
20
25
30
35
40
S1 S2 S3 S4 S5 S6 S7
Thro
ughp
ut [M
bp
s]
Scenarios
a) Aggregate throughput b) The number of active of APs
0
2
4
6
8
10
12
14
S1 S2 S3 S4 S5 S6 S7
Num
ber
of
active
AP
s
Scenarios
116Copyright (c) IARIA, 2011. ISBN: 978-1-61208-174-8
EMERGING 2011 : The Third International Conference on Emerging Network Intelligence
123 / 141
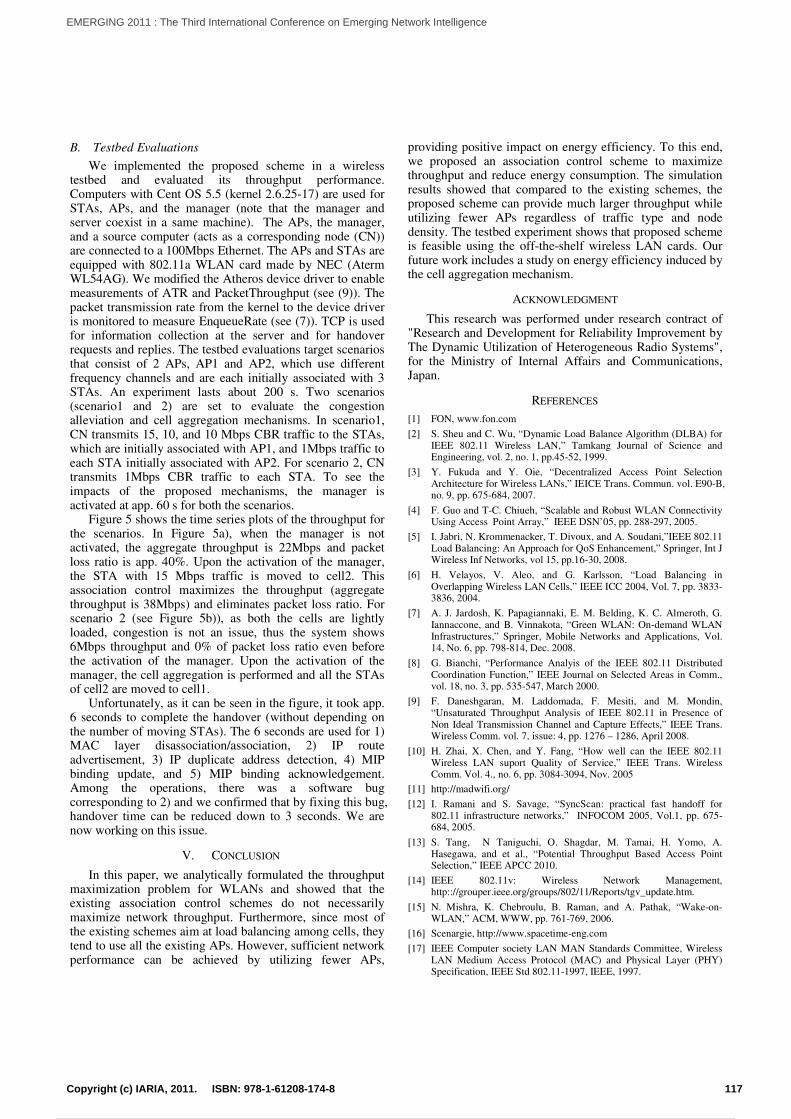
B. Testbed Evaluations
We implemented the proposed scheme in a wireless testbed and evaluated its throughput performance. Computers with Cent OS 5.5 (kernel 2.6.25-17) are used for STAs, APs, and the manager (note that the manager and server coexist in a same machine). The APs, the manager, and a source computer (acts as a corresponding node (CN)) are connected to a 100Mbps Ethernet. The APs and STAs are equipped with 802.11a WLAN card made by NEC (Aterm WL54AG). We modified the Atheros device driver to enable measurements of ATR and PacketThroughput (see (9)). The packet transmission rate from the kernel to the device driver is monitored to measure EnqueueRate (see (7)). TCP is used for information collection at the server and for handover requests and replies. The testbed evaluations target scenarios that consist of 2 APs, AP1 and AP2, which use different frequency channels and are each initially associated with 3 STAs. An experiment lasts about 200 s. Two scenarios (scenario1 and 2) are set to evaluate the congestion alleviation and cell aggregation mechanisms. In scenario1, CN transmits 15, 10, and 10 Mbps CBR traffic to the STAs, which are initially associated with AP1, and 1Mbps traffic to each STA initially associated with AP2. For scenario 2, CN transmits 1Mbps CBR traffic to each STA. To see the impacts of the proposed mechanisms, the manager is activated at app. 60 s for both the scenarios.
Figure 5 shows the time series plots of the throughput for the scenarios. In Figure 5a), when the manager is not activated, the aggregate throughput is 22Mbps and packet loss ratio is app. 40%. Upon the activation of the manager, the STA with 15 Mbps traffic is moved to cell2. This association control maximizes the throughput (aggregate throughput is 38Mbps) and eliminates packet loss ratio. For scenario 2 (see Figure 5b)), as both the cells are lightly loaded, congestion is not an issue, thus the system shows 6Mbps throughput and 0% of packet loss ratio even before the activation of the manager. Upon the activation of the manager, the cell aggregation is performed and all the STAs of cell2 are moved to cell1.
Unfortunately, as it can be seen in the figure, it took app. 6 seconds to complete the handover (without depending on the number of moving STAs). The 6 seconds are used for 1) MAC layer disassociation/association, 2) IP route advertisement, 3) IP duplicate address detection, 4) MIP binding update, and 5) MIP binding acknowledgement. Among the operations, there was a software bug corresponding to 2) and we confirmed that by fixing this bug, handover time can be reduced down to 3 seconds. We are now working on this issue.
V. CONCLUSION
In this paper, we analytically formulated the throughput maximization problem for WLANs and showed that the existing association control schemes do not necessarily maximize network throughput. Furthermore, since most of the existing schemes aim at load balancing among cells, they tend to use all the existing APs. However, sufficient network performance can be achieved by utilizing fewer APs,
providing positive impact on energy efficiency. To this end, we proposed an association control scheme to maximize throughput and reduce energy consumption. The simulation results showed that compared to the existing schemes, the proposed scheme can provide much larger throughput while utilizing fewer APs regardless of traffic type and node density. The testbed experiment shows that proposed scheme is feasible using the off-the-shelf wireless LAN cards. Our future work includes a study on energy efficiency induced by the cell aggregation mechanism.
ACKNOWLEDGMENT
This research was performed under research contract of "Research and Development for Reliability Improvement by The Dynamic Utilization of Heterogeneous Radio Systems", for the Ministry of Internal Affairs and Communications, Japan.
REFERENCES
[1] FON, www.fon.com
[2] S. Sheu and C. Wu, “Dynamic Load Balance Algorithm (DLBA) for IEEE 802.11 Wireless LAN,” Tamkang Journal of Science and Engineering, vol. 2, no. 1, pp.45-52, 1999.
[3] Y. Fukuda and Y. Oie, “Decentralized Access Point Selection Architecture for Wireless LANs,” IEICE Trans. Commun. vol. E90-B, no. 9, pp. 675-684, 2007.
[4] F. Guo and T-C. Chiueh, “Scalable and Robust WLAN Connectivity Using Access Point Array,” IEEE DSN’05, pp. 288-297, 2005.
[5] I. Jabri, N. Krommenacker, T. Divoux, and A. Soudani,”IEEE 802.11 Load Balancing: An Approach for QoS Enhancement,” Springer, Int J Wireless Inf Networks, vol 15, pp.16-30, 2008.
[6] H. Velayos, V. Aleo, and G. Karlsson, “Load Balancing in Overlapping Wireless LAN Cells,” IEEE ICC 2004, Vol. 7, pp. 3833-3836, 2004.
[7] A. J. Jardosh, K. Papagiannaki, E. M. Belding, K. C. Almeroth, G. Iannaccone, and B. Vinnakota, “Green WLAN: On-demand WLAN Infrastructures,” Springer, Mobile Networks and Applications, Vol. 14, No. 6, pp. 798-814, Dec. 2008.
[8] G. Bianchi, “Performance Analyis of the IEEE 802.11 Distributed Coordination Function,” IEEE Journal on Selected Areas in Comm., vol. 18, no. 3, pp. 535-547, March 2000.
[9] F. Daneshgaran, M. Laddomada, F. Mesiti, and M. Mondin, “Unsaturated Throughput Analysis of IEEE 802.11 in Presence of Non Ideal Transmission Channel and Capture Effects,” IEEE Trans. Wireless Comm. vol. 7, issue: 4, pp. 1276 – 1286, April 2008.
[10] H. Zhai, X. Chen, and Y. Fang, “How well can the IEEE 802.11 Wireless LAN suport Quality of Service,” IEEE Trans. Wireless Comm. Vol. 4., no. 6, pp. 3084-3094, Nov. 2005
[11] http://madwifi.org/
[12] I. Ramani and S. Savage, “SyncScan: practical fast handoff for 802.11 infrastructure networks,” INFOCOM 2005, Vol.1, pp. 675-684, 2005.
[13] S. Tang, N Taniguchi, O. Shagdar, M. Tamai, H. Yomo, A. Hasegawa, and et al., “Potential Throughput Based Access Point Selection,” IEEE APCC 2010.
[14] IEEE 802.11v: Wireless Network Management, http:://grouper.ieee.org/groups/802/11/Reports/tgv_update.htm.
[15] N. Mishra, K. Chebroulu, B. Raman, and A. Pathak, “Wake-on-WLAN,” ACM, WWW, pp. 761-769, 2006.
[16] Scenargie, http://www.spacetime-eng.com
[17] IEEE Computer society LAN MAN Standards Committee, Wireless LAN Medium Access Protocol (MAC) and Physical Layer (PHY) Specification, IEEE Std 802.11-1997, IEEE, 1997.
117Copyright (c) IARIA, 2011. ISBN: 978-1-61208-174-8
EMERGING 2011 : The Third International Conference on Emerging Network Intelligence
124 / 141
Multipath Routing Management using
Neural Networks-Based Traffic Prediction
Melinda Barabas, Georgeta Boanea, Virgil Dobrota
Communications Department
Technical University of Cluj-Napoca
28 Memorandumului Street, 400114 Cluj-Napoca, Romania
Email: Melinda.Barabas, Georgeta.Boanea, [email protected]
Abstract—Embedding forecasting algorithms into routingmanagement systems can play an important role in guaranteeingQoS in IP networks. In this paper, we propose an intelligentrouting framework, consisting of a situation aware multipathrouting algorithm and a routing management system involvingneural networks-based predictors with multi-task learning. Thesolution is characterized by QoS-awareness, load balancing andself-management. The main goal is to offer a proof-of-conceptby practical implementation of predictive QoS-aware multipathrouting in a real test environment. The proposed solution iscompared with the OSPF and ECMP routing protocols incase of congested network links. The experimental results showthat traffic prediction enables proactive routing managementand improves the global performance of the network throughcongestion control and avoidance.
Keywords–cross-layer QoS; multipath routing; neural networks;self-management; traffic prediction
I. INTRODUCTION
Ensuring Quality of Service (QoS) over the Internet is
difficult, especially in the case of real-time multimedia ap-
plications where the retransmission of packets is not a viable
option. The occurrence of congestion can severely degrade
the quality of transmissions due to packet losses, increased
delay and jitter [1]. Embedding forecasting algorithms into
routing management systems can play an important role in
guaranteeing QoS in IP networks. Traffic prediction enables
proactive network management which improves the global
performance of the network through congestion control and
prevention.
Initially, it was believed that adaptive routing protocols,
such as OSPF (Open Shortest Path First) [2], can react to
congestion. Unfortunately, congested links often remain unde-
tected because of the way OSPF assesses link connectivity. If
a link flaps constantly due to congestion, but at least 1 out of
every 4 Hello messages is received, OSPF does not detect the
problem. If the congestion is severe and no Hello messages
are received from a neighbor, it is automatically considered
down because OSPF makes no distinction between hardware
failures and congestion. Thus, the involved router will not be
further used and all the traffic will be rerouted to a different
link which in turn can also become congested. The solution
adopted by OSPF does not resolve the underlying problem,
that of transmitting too much traffic on a single link.
In the present Internet, congestion control mechanisms rely
on queue management algorithms (dropping packets randomly
or based on their priority) or TCP (Transmission Control
Protocol) congestion avoidance (reducing the sending rate).
From the end-user perspective, these solutions are not optimal
because they mean lost packets or a reduced bitrate, both af-
fecting the quality of transmission, especially the QoE (Quality
of Experience) of multimedia content.
The main motivation for this paper is to resolve the above
mentioned limitations of legacy routing protocols and conges-
tion control mechanisms by applying the multipath routing
paradigm. We focus on the problems caused by congested
network links and our goal is to improve the overall network
performance by load balancing and prediction of network traf-
fic. We envision an intelligent routing framework, consisting
of the SAMP (Situation Aware Multipath) routing algorithm
[3] and a routing management system.
The routing strategy presented herein is characterized by
self-management and QoS-awareness, achieved via monitoring
link resources through cross-layering techniques. QoS-aware
routing means that not only shortest paths, but traffic-aware
shortest paths are computed for optimal network performance.
The traffic predictors integrated into the routing management
system enable proactive decision-making, as opposed to re-
acting to past events. Employing a prediction-based approach
helps to match network resources to the traffic demand [4].
Thanks to the early warning, a prediction-based approach will
be faster, in terms of congestion detection and elimination,
than reactive methods which detect congestion only after
it significantly influenced the operation of the network, as
demonstrated in [5].
The rest of this paper is organized as follows. Section
II briefly presents previous work regarding prediction used
in combination with routing systems. In Section III, neural
network traffic predictors with multi-task learning approaches
are described. Section IV presents the multipath routing
framework. In Section V, the practical testbed is described,
followed by the experimental results in Section VI. Section
VII concludes the paper and discusses future work.
II. RELATED WORK
In the literature, several works address the topic of network
parameter prediction techniques integrated into single-path [6],
118Copyright (c) IARIA, 2011. ISBN: 978-1-61208-174-8
EMERGING 2011 : The Third International Conference on Emerging Network Intelligence
125 / 141
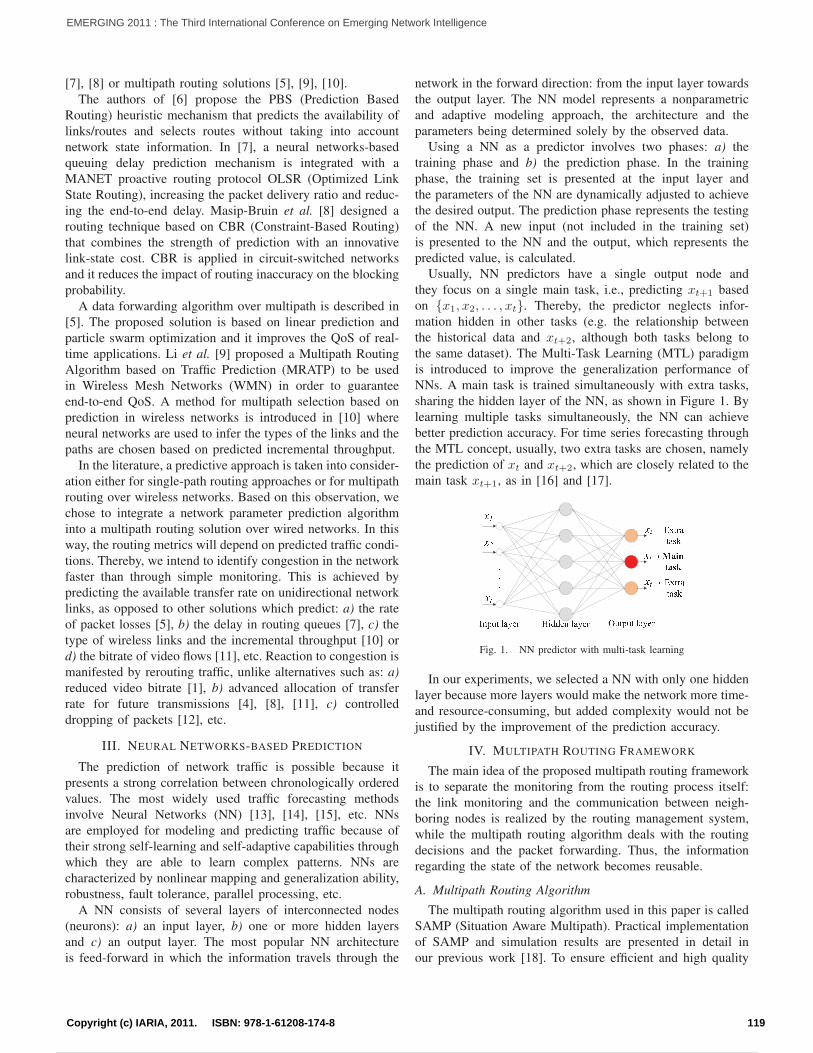
[7], [8] or multipath routing solutions [5], [9], [10].
The authors of [6] propose the PBS (Prediction Based
Routing) heuristic mechanism that predicts the availability of
links/routes and selects routes without taking into account
network state information. In [7], a neural networks-based
queuing delay prediction mechanism is integrated with a
MANET proactive routing protocol OLSR (Optimized Link
State Routing), increasing the packet delivery ratio and reduc-
ing the end-to-end delay. Masip-Bruin et al. [8] designed a
routing technique based on CBR (Constraint-Based Routing)
that combines the strength of prediction with an innovative
link-state cost. CBR is applied in circuit-switched networks
and it reduces the impact of routing inaccuracy on the blocking
probability.
A data forwarding algorithm over multipath is described in
[5]. The proposed solution is based on linear prediction and
particle swarm optimization and it improves the QoS of real-
time applications. Li et al. [9] proposed a Multipath Routing
Algorithm based on Traffic Prediction (MRATP) to be used
in Wireless Mesh Networks (WMN) in order to guarantee
end-to-end QoS. A method for multipath selection based on
prediction in wireless networks is introduced in [10] where
neural networks are used to infer the types of the links and the
paths are chosen based on predicted incremental throughput.
In the literature, a predictive approach is taken into consider-
ation either for single-path routing approaches or for multipath
routing over wireless networks. Based on this observation, we
chose to integrate a network parameter prediction algorithm
into a multipath routing solution over wired networks. In this
way, the routing metrics will depend on predicted traffic condi-
tions. Thereby, we intend to identify congestion in the network
faster than through simple monitoring. This is achieved by
predicting the available transfer rate on unidirectional network
links, as opposed to other solutions which predict: a) the rate
of packet losses [5], b) the delay in routing queues [7], c) the
type of wireless links and the incremental throughput [10] or
d) the bitrate of video flows [11], etc. Reaction to congestion is
manifested by rerouting traffic, unlike alternatives such as: a)
reduced video bitrate [1], b) advanced allocation of transfer
rate for future transmissions [4], [8], [11], c) controlled
dropping of packets [12], etc.
III. NEURAL NETWORKS-BASED PREDICTION
The prediction of network traffic is possible because it
presents a strong correlation between chronologically ordered
values. The most widely used traffic forecasting methods
involve Neural Networks (NN) [13], [14], [15], etc. NNs
are employed for modeling and predicting traffic because of
their strong self-learning and self-adaptive capabilities through
which they are able to learn complex patterns. NNs are
characterized by nonlinear mapping and generalization ability,
robustness, fault tolerance, parallel processing, etc.
A NN consists of several layers of interconnected nodes
(neurons): a) an input layer, b) one or more hidden layers
and c) an output layer. The most popular NN architecture
is feed-forward in which the information travels through the
network in the forward direction: from the input layer towards
the output layer. The NN model represents a nonparametric
and adaptive modeling approach, the architecture and the
parameters being determined solely by the observed data.
Using a NN as a predictor involves two phases: a) the
training phase and b) the prediction phase. In the training
phase, the training set is presented at the input layer and
the parameters of the NN are dynamically adjusted to achieve
the desired output. The prediction phase represents the testing
of the NN. A new input (not included in the training set)
is presented to the NN and the output, which represents the
predicted value, is calculated.
Usually, NN predictors have a single output node and
they focus on a single main task, i.e., predicting xt+1 based
on x1, x2, . . . , xt. Thereby, the predictor neglects infor-
mation hidden in other tasks (e.g. the relationship between
the historical data and xt+2, although both tasks belong to
the same dataset). The Multi-Task Learning (MTL) paradigm
is introduced to improve the generalization performance of
NNs. A main task is trained simultaneously with extra tasks,
sharing the hidden layer of the NN, as shown in Figure 1. By
learning multiple tasks simultaneously, the NN can achieve
better prediction accuracy. For time series forecasting through
the MTL concept, usually, two extra tasks are chosen, namely
the prediction of xt and xt+2, which are closely related to the
main task xt+1, as in [16] and [17].
Fig. 1. NN predictor with multi-task learning
In our experiments, we selected a NN with only one hidden
layer because more layers would make the network more time-
and resource-consuming, but added complexity would not be
justified by the improvement of the prediction accuracy.
IV. MULTIPATH ROUTING FRAMEWORK
The main idea of the proposed multipath routing framework
is to separate the monitoring from the routing process itself:
the link monitoring and the communication between neigh-
boring nodes is realized by the routing management system,
while the multipath routing algorithm deals with the routing
decisions and the packet forwarding. Thus, the information
regarding the state of the network becomes reusable.
A. Multipath Routing Algorithm
The multipath routing algorithm used in this paper is called
SAMP (Situation Aware Multipath). Practical implementation
of SAMP and simulation results are presented in detail in
our previous work [18]. To ensure efficient and high quality
119Copyright (c) IARIA, 2011. ISBN: 978-1-61208-174-8
EMERGING 2011 : The Third International Conference on Emerging Network Intelligence
126 / 141
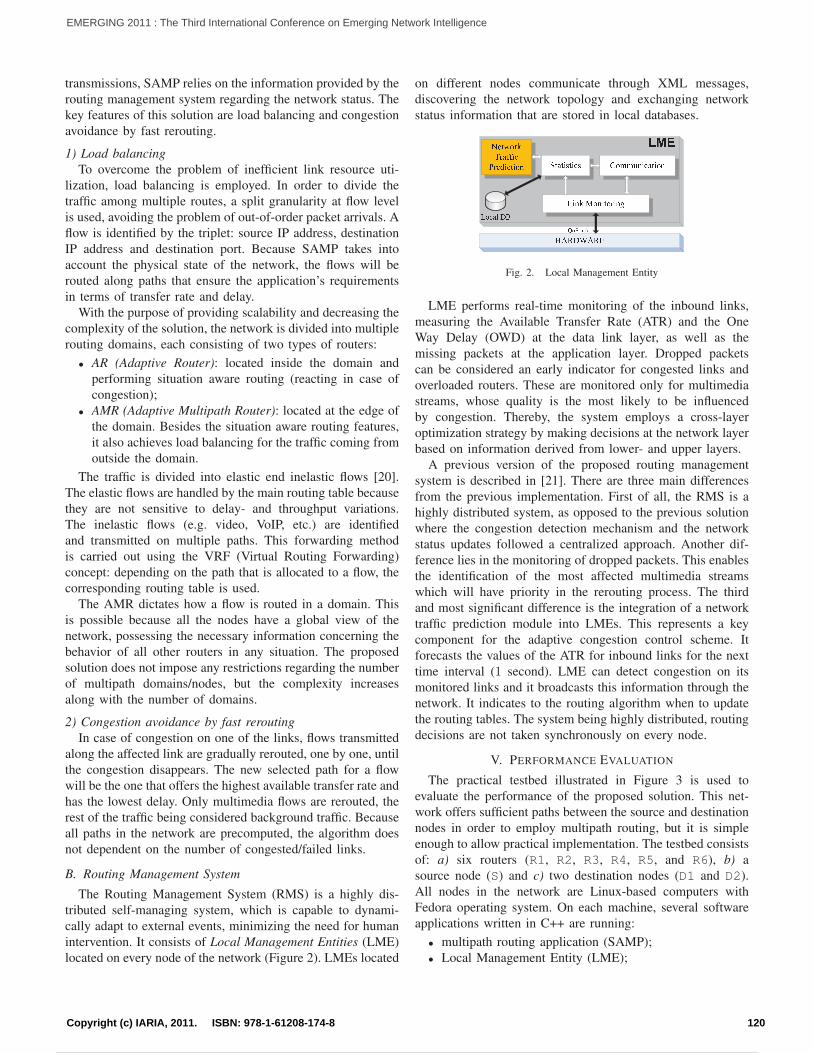
transmissions, SAMP relies on the information provided by the
routing management system regarding the network status. The
key features of this solution are load balancing and congestion
avoidance by fast rerouting.
1) Load balancing
To overcome the problem of inefficient link resource uti-
lization, load balancing is employed. In order to divide the
traffic among multiple routes, a split granularity at flow level
is used, avoiding the problem of out-of-order packet arrivals. A
flow is identified by the triplet: source IP address, destination
IP address and destination port. Because SAMP takes into
account the physical state of the network, the flows will be
routed along paths that ensure the application’s requirements
in terms of transfer rate and delay.
With the purpose of providing scalability and decreasing the
complexity of the solution, the network is divided into multiple
routing domains, each consisting of two types of routers:
• AR (Adaptive Router): located inside the domain and
performing situation aware routing (reacting in case of
congestion);
• AMR (Adaptive Multipath Router): located at the edge of
the domain. Besides the situation aware routing features,
it also achieves load balancing for the traffic coming from
outside the domain.
The traffic is divided into elastic end inelastic flows [20].
The elastic flows are handled by the main routing table because
they are not sensitive to delay- and throughput variations.
The inelastic flows (e.g. video, VoIP, etc.) are identified
and transmitted on multiple paths. This forwarding method
is carried out using the VRF (Virtual Routing Forwarding)
concept: depending on the path that is allocated to a flow, the
corresponding routing table is used.
The AMR dictates how a flow is routed in a domain. This
is possible because all the nodes have a global view of the
network, possessing the necessary information concerning the
behavior of all other routers in any situation. The proposed
solution does not impose any restrictions regarding the number
of multipath domains/nodes, but the complexity increases
along with the number of domains.
2) Congestion avoidance by fast rerouting
In case of congestion on one of the links, flows transmitted
along the affected link are gradually rerouted, one by one, until
the congestion disappears. The new selected path for a flow
will be the one that offers the highest available transfer rate and
has the lowest delay. Only multimedia flows are rerouted, the
rest of the traffic being considered background traffic. Because
all paths in the network are precomputed, the algorithm does
not dependent on the number of congested/failed links.
B. Routing Management System
The Routing Management System (RMS) is a highly dis-
tributed self-managing system, which is capable to dynami-
cally adapt to external events, minimizing the need for human
intervention. It consists of Local Management Entities (LME)
located on every node of the network (Figure 2). LMEs located
on different nodes communicate through XML messages,
discovering the network topology and exchanging network
status information that are stored in local databases.
! " # $ % & ' ( ' ) * ' ) + * , - . . / 0 ) + ( ' ) - 01 ) 0 2 3 - 0 ) ' - 4 ) 0 5 6 7 89 : ; < = : ; >? @ A B C D @
E F ' G - 4 2H 4 ( I I ) +J 4 F K ) + ' ) - 0Fig. 2. Local Management Entity
LME performs real-time monitoring of the inbound links,
measuring the Available Transfer Rate (ATR) and the One
Way Delay (OWD) at the data link layer, as well as the
missing packets at the application layer. Dropped packets
can be considered an early indicator for congested links and
overloaded routers. These are monitored only for multimedia
streams, whose quality is the most likely to be influenced
by congestion. Thereby, the system employs a cross-layer
optimization strategy by making decisions at the network layer
based on information derived from lower- and upper layers.
A previous version of the proposed routing management
system is described in [21]. There are three main differences
from the previous implementation. First of all, the RMS is a
highly distributed system, as opposed to the previous solution
where the congestion detection mechanism and the network
status updates followed a centralized approach. Another dif-
ference lies in the monitoring of dropped packets. This enables
the identification of the most affected multimedia streams
which will have priority in the rerouting process. The third
and most significant difference is the integration of a network
traffic prediction module into LMEs. This represents a key
component for the adaptive congestion control scheme. It
forecasts the values of the ATR for inbound links for the next
time interval (1 second). LME can detect congestion on its
monitored links and it broadcasts this information through the
network. It indicates to the routing algorithm when to update
the routing tables. The system being highly distributed, routing
decisions are not taken synchronously on every node.
V. PERFORMANCE EVALUATION
The practical testbed illustrated in Figure 3 is used to
evaluate the performance of the proposed solution. This net-
work offers sufficient paths between the source and destination
nodes in order to employ multipath routing, but it is simple
enough to allow practical implementation. The testbed consists
of: a) six routers (R1, R2, R3, R4, R5, and R6), b) a
source node (S) and c) two destination nodes (D1 and D2).
All nodes in the network are Linux-based computers with
Fedora operating system. On each machine, several software
applications written in C++ are running:
• multipath routing application (SAMP);
• Local Management Entity (LME);
120Copyright (c) IARIA, 2011. ISBN: 978-1-61208-174-8
EMERGING 2011 : The Third International Conference on Emerging Network Intelligence
127 / 141
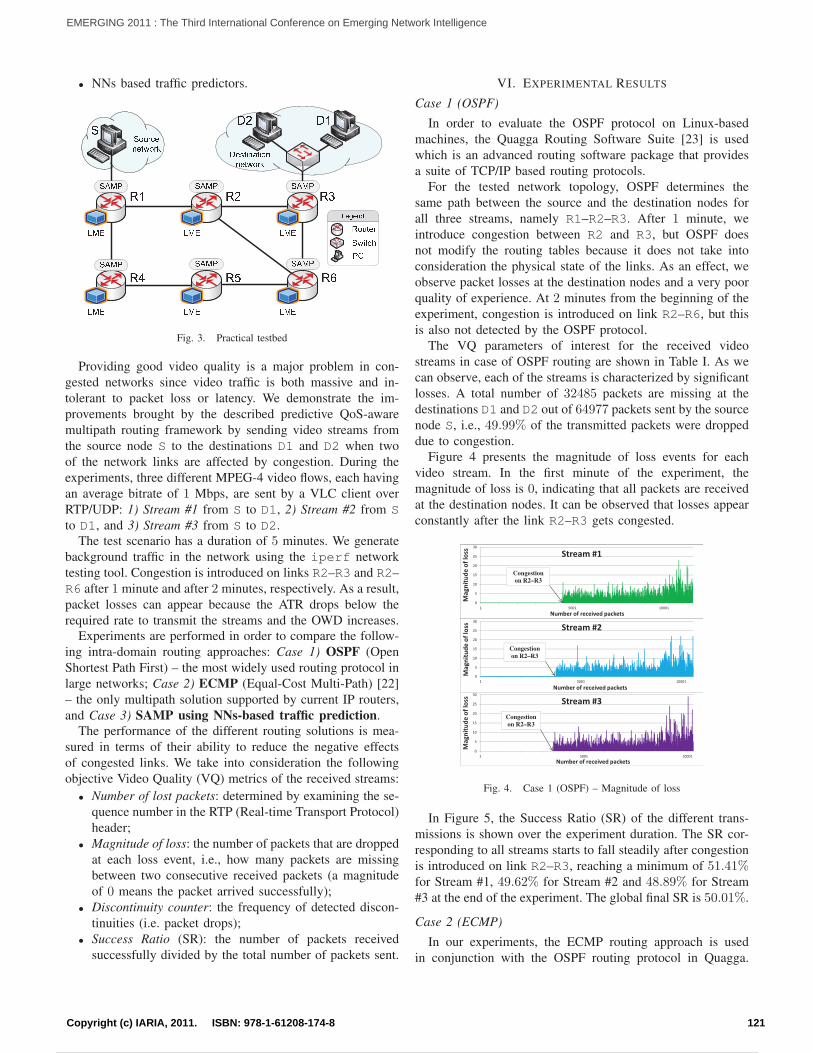
• NNs based traffic predictors.
L M L N L OL P L QL RS
T U VT U V T U V T U VT U V T U VW X U Y W X U YW X U Y W X U YW X U YW X U Y W Z [ \ ] ^_ ^ ` a Z \ b c ^ d ` e _ f ` e Z __ ^ ` a Z \ b g h i h j kY lm Z [ ` ^ \W a e ` ] no N o M
Fig. 3. Practical testbed
Providing good video quality is a major problem in con-
gested networks since video traffic is both massive and in-
tolerant to packet loss or latency. We demonstrate the im-
provements brought by the described predictive QoS-aware
multipath routing framework by sending video streams from
the source node S to the destinations D1 and D2 when two
of the network links are affected by congestion. During the
experiments, three different MPEG-4 video flows, each having
an average bitrate of 1 Mbps, are sent by a VLC client over
RTP/UDP: 1) Stream #1 from S to D1, 2) Stream #2 from S
to D1, and 3) Stream #3 from S to D2.
The test scenario has a duration of 5 minutes. We generate
background traffic in the network using the iperf network
testing tool. Congestion is introduced on links R2–R3 and R2–
R6 after 1 minute and after 2 minutes, respectively. As a result,
packet losses can appear because the ATR drops below the
required rate to transmit the streams and the OWD increases.
Experiments are performed in order to compare the follow-
ing intra-domain routing approaches: Case 1) OSPF (Open
Shortest Path First) – the most widely used routing protocol in
large networks; Case 2) ECMP (Equal-Cost Multi-Path) [22]
– the only multipath solution supported by current IP routers,
and Case 3) SAMP using NNs-based traffic prediction.
The performance of the different routing solutions is mea-
sured in terms of their ability to reduce the negative effects
of congested links. We take into consideration the following
objective Video Quality (VQ) metrics of the received streams:
• Number of lost packets: determined by examining the se-
quence number in the RTP (Real-time Transport Protocol)
header;
• Magnitude of loss: the number of packets that are dropped
at each loss event, i.e., how many packets are missing
between two consecutive received packets (a magnitude
of 0 means the packet arrived successfully);
• Discontinuity counter: the frequency of detected discon-
tinuities (i.e. packet drops);
• Success Ratio (SR): the number of packets received
successfully divided by the total number of packets sent.
VI. EXPERIMENTAL RESULTS
Case 1 (OSPF)
In order to evaluate the OSPF protocol on Linux-based
machines, the Quagga Routing Software Suite [23] is used
which is an advanced routing software package that provides
a suite of TCP/IP based routing protocols.
For the tested network topology, OSPF determines the
same path between the source and the destination nodes for
all three streams, namely R1–R2–R3. After 1 minute, we
introduce congestion between R2 and R3, but OSPF does
not modify the routing tables because it does not take into
consideration the physical state of the links. As an effect, we
observe packet losses at the destination nodes and a very poor
quality of experience. At 2 minutes from the beginning of the
experiment, congestion is introduced on link R2–R6, but this
is also not detected by the OSPF protocol.
The VQ parameters of interest for the received video
streams in case of OSPF routing are shown in Table I. As we
can observe, each of the streams is characterized by significant
losses. A total number of 32485 packets are missing at the
destinations D1 and D2 out of 64977 packets sent by the source
node S, i.e., 49.99% of the transmitted packets were dropped
due to congestion.
Figure 4 presents the magnitude of loss events for each
video stream. In the first minute of the experiment, the
magnitude of loss is 0, indicating that all packets are received
at the destination nodes. It can be observed that losses appear
constantly after the link R2–R3 gets congested.
Fig. 4. Case 1 (OSPF) – Magnitude of loss
In Figure 5, the Success Ratio (SR) of the different trans-
missions is shown over the experiment duration. The SR cor-
responding to all streams starts to fall steadily after congestion
is introduced on link R2–R3, reaching a minimum of 51.41%
for Stream #1, 49.62% for Stream #2 and 48.89% for Stream
#3 at the end of the experiment. The global final SR is 50.01%.
Case 2 (ECMP)
In our experiments, the ECMP routing approach is used
in conjunction with the OSPF routing protocol in Quagga.
121Copyright (c) IARIA, 2011. ISBN: 978-1-61208-174-8
EMERGING 2011 : The Third International Conference on Emerging Network Intelligence
128 / 141
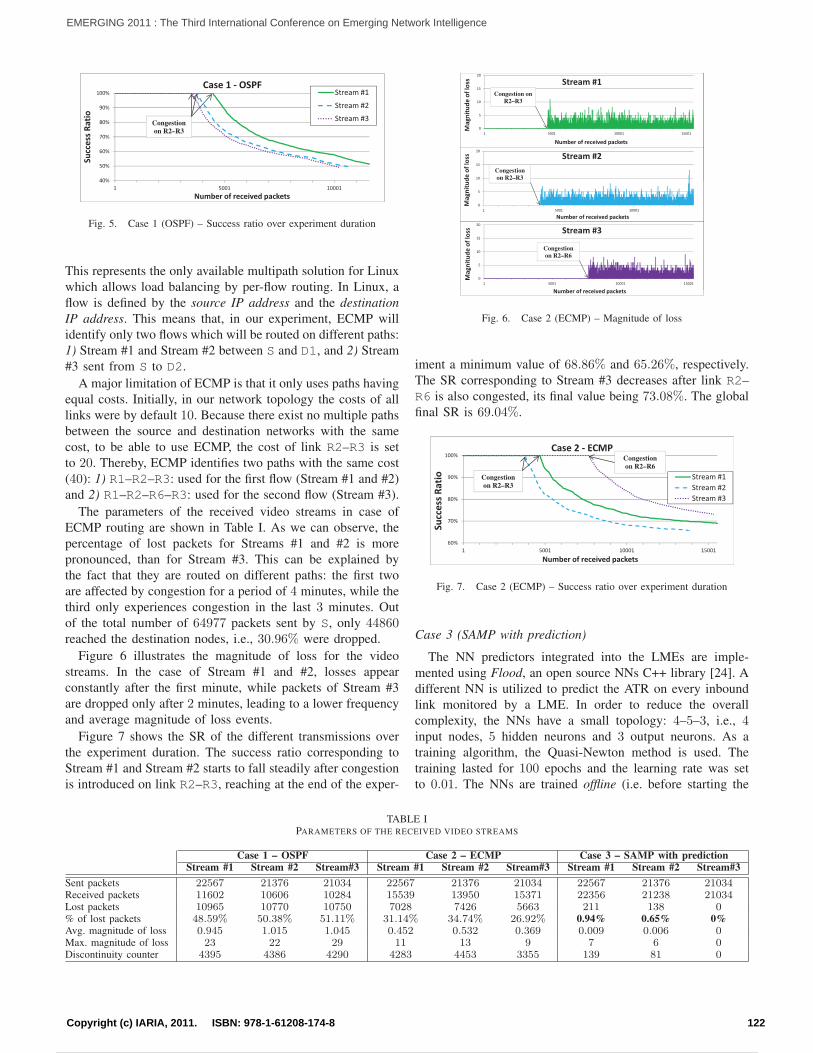
Fig. 5. Case 1 (OSPF) – Success ratio over experiment duration
This represents the only available multipath solution for Linux
which allows load balancing by per-flow routing. In Linux, a
flow is defined by the source IP address and the destination
IP address. This means that, in our experiment, ECMP will
identify only two flows which will be routed on different paths:
1) Stream #1 and Stream #2 between S and D1, and 2) Stream
#3 sent from S to D2.
A major limitation of ECMP is that it only uses paths having
equal costs. Initially, in our network topology the costs of all
links were by default 10. Because there exist no multiple paths
between the source and destination networks with the same
cost, to be able to use ECMP, the cost of link R2–R3 is set
to 20. Thereby, ECMP identifies two paths with the same cost
(40): 1) R1–R2–R3: used for the first flow (Stream #1 and #2)
and 2) R1–R2–R6–R3: used for the second flow (Stream #3).
The parameters of the received video streams in case of
ECMP routing are shown in Table I. As we can observe, the
percentage of lost packets for Streams #1 and #2 is more
pronounced, than for Stream #3. This can be explained by
the fact that they are routed on different paths: the first two
are affected by congestion for a period of 4 minutes, while the
third only experiences congestion in the last 3 minutes. Out
of the total number of 64977 packets sent by S, only 44860
reached the destination nodes, i.e., 30.96% were dropped.
Figure 6 illustrates the magnitude of loss for the video
streams. In the case of Stream #1 and #2, losses appear
constantly after the first minute, while packets of Stream #3
are dropped only after 2 minutes, leading to a lower frequency
and average magnitude of loss events.
Figure 7 shows the SR of the different transmissions over
the experiment duration. The success ratio corresponding to
Stream #1 and Stream #2 starts to fall steadily after congestion
is introduced on link R2–R3, reaching at the end of the exper-
Fig. 6. Case 2 (ECMP) – Magnitude of loss
iment a minimum value of 68.86% and 65.26%, respectively.
The SR corresponding to Stream #3 decreases after link R2–
R6 is also congested, its final value being 73.08%. The global
final SR is 69.04%.
Fig. 7. Case 2 (ECMP) – Success ratio over experiment duration
Case 3 (SAMP with prediction)
The NN predictors integrated into the LMEs are imple-
mented using Flood, an open source NNs C++ library [24]. A
different NN is utilized to predict the ATR on every inbound
link monitored by a LME. In order to reduce the overall
complexity, the NNs have a small topology: 4–5–3, i.e., 4
input nodes, 5 hidden neurons and 3 output neurons. As a
training algorithm, the Quasi-Newton method is used. The
training lasted for 100 epochs and the learning rate was set
to 0.01. The NNs are trained offline (i.e. before starting the
TABLE IPARAMETERS OF THE RECEIVED VIDEO STREAMS
Case 1 – OSPF Case 2 – ECMP Case 3 – SAMP with predictionStream #1 Stream #2 Stream#3 Stream #1 Stream #2 Stream#3 Stream #1 Stream #2 Stream#3
Sent packets 22567 21376 21034 22567 21376 21034 22567 21376 21034
Received packets 11602 10606 10284 15539 13950 15371 22356 21238 21034
Lost packets 10965 10770 10750 7028 7426 5663 211 138 0
% of lost packets 48.59% 50.38% 51.11% 31.14% 34.74% 26.92% 0.94% 0.65% 0%Avg. magnitude of loss 0.945 1.015 1.045 0.452 0.532 0.369 0.009 0.006 0
Max. magnitude of loss 23 22 29 11 13 9 7 6 0
Discontinuity counter 4395 4386 4290 4283 4453 3355 139 81 0
122Copyright (c) IARIA, 2011. ISBN: 978-1-61208-174-8
EMERGING 2011 : The Third International Conference on Emerging Network Intelligence
129 / 141
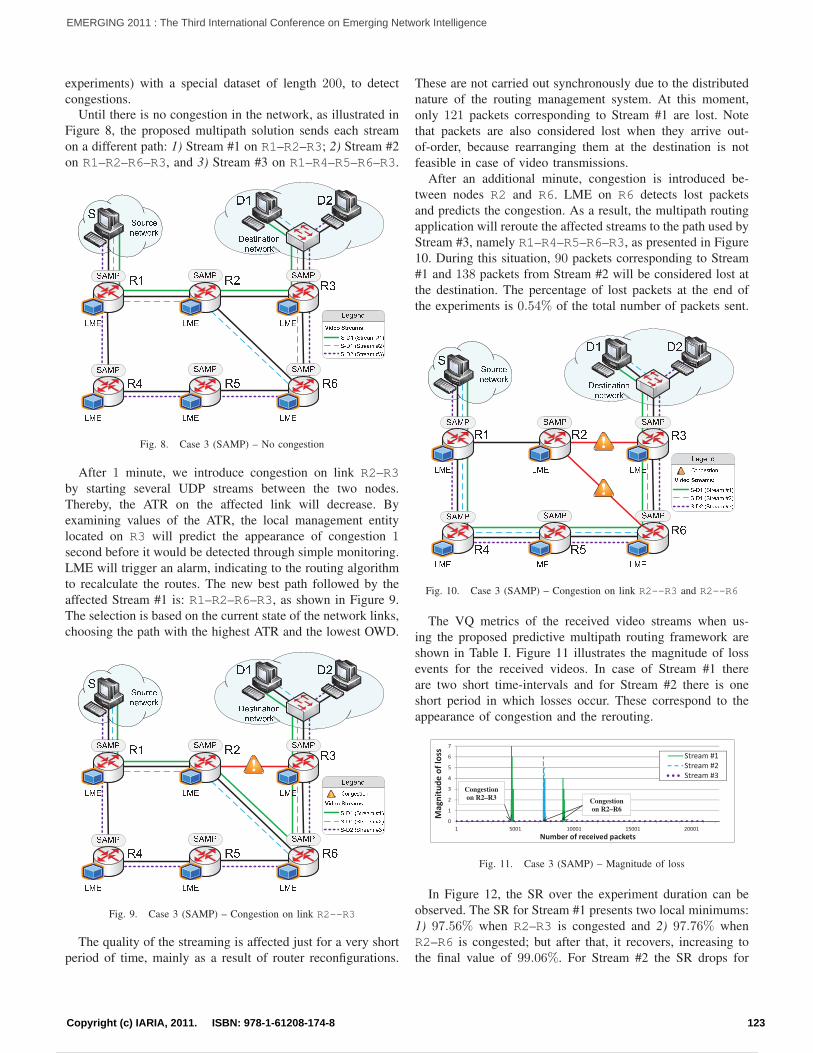
experiments) with a special dataset of length 200, to detect
congestions.
Until there is no congestion in the network, as illustrated in
Figure 8, the proposed multipath solution sends each stream
on a different path: 1) Stream #1 on R1–R2–R3; 2) Stream #2
on R1–R2–R6–R3, and 3) Stream #3 on R1–R4–R5–R6–R3.
p q r sp q r s
p t u v w xy x z t v | x ~ z y z t yy x z t v | p q r s r p q r s r r ¡ ¢ £ ¤ ¥ ¦ § ¨ r p q r s © r ª r p q r s
Fig. 8. Case 3 (SAMP) – No congestion
After 1 minute, we introduce congestion on link R2–R3
by starting several UDP streams between the two nodes.
Thereby, the ATR on the affected link will decrease. By
examining values of the ATR, the local management entity
located on R3 will predict the appearance of congestion 1
second before it would be detected through simple monitoring.
LME will trigger an alarm, indicating to the routing algorithm
to recalculate the routes. The new best path followed by the
affected Stream #1 is: R1–R2–R6–R3, as shown in Figure 9.
The selection is based on the current state of the network links,
choosing the path with the highest ATR and the lowest OWD.
p q r sp q r s
p t u v w xy x z t v | x ~ z y z t yy x z t v | p q r s r p q r s r r ¡ ¢ £ ¤ ¥ ¦ §« ¬ ® ¯ ° ± ² ¬ ¨ r p q r s © r ª r p q r s
Fig. 9. Case 3 (SAMP) – Congestion on link R2--R3
The quality of the streaming is affected just for a very short
period of time, mainly as a result of router reconfigurations.
These are not carried out synchronously due to the distributed
nature of the routing management system. At this moment,
only 121 packets corresponding to Stream #1 are lost. Note
that packets are also considered lost when they arrive out-
of-order, because rearranging them at the destination is not
feasible in case of video transmissions.
After an additional minute, congestion is introduced be-
tween nodes R2 and R6. LME on R6 detects lost packets
and predicts the congestion. As a result, the multipath routing
application will reroute the affected streams to the path used by
Stream #3, namely R1–R4–R5–R6–R3, as presented in Figure
10. During this situation, 90 packets corresponding to Stream
#1 and 138 packets from Stream #2 will be considered lost at
the destination. The percentage of lost packets at the end of
the experiments is 0.54% of the total number of packets sent.
p q r sp q r s
p t u v w xy x z t v | x ~ z y z t yy x z t v | p q r s r p q r s r r ¡ ¢ £ ¤ ¥ ¦ §³ ´ µ ¶ · ¸ ¹ º ´ µ ¨ r p q r s © r ª r p q r s
Fig. 10. Case 3 (SAMP) – Congestion on link R2--R3 and R2--R6
The VQ metrics of the received video streams when us-
ing the proposed predictive multipath routing framework are
shown in Table I. Figure 11 illustrates the magnitude of loss
events for the received videos. In case of Stream #1 there
are two short time-intervals and for Stream #2 there is one
short period in which losses occur. These correspond to the
appearance of congestion and the rerouting.
Fig. 11. Case 3 (SAMP) – Magnitude of loss
In Figure 12, the SR over the experiment duration can be
observed. The SR for Stream #1 presents two local minimums:
1) 97.56% when R2–R3 is congested and 2) 97.76% when
R2–R6 is congested; but after that, it recovers, increasing to
the final value of 99.06%. For Stream #2 the SR drops for
123Copyright (c) IARIA, 2011. ISBN: 978-1-61208-174-8
EMERGING 2011 : The Third International Conference on Emerging Network Intelligence
130 / 141
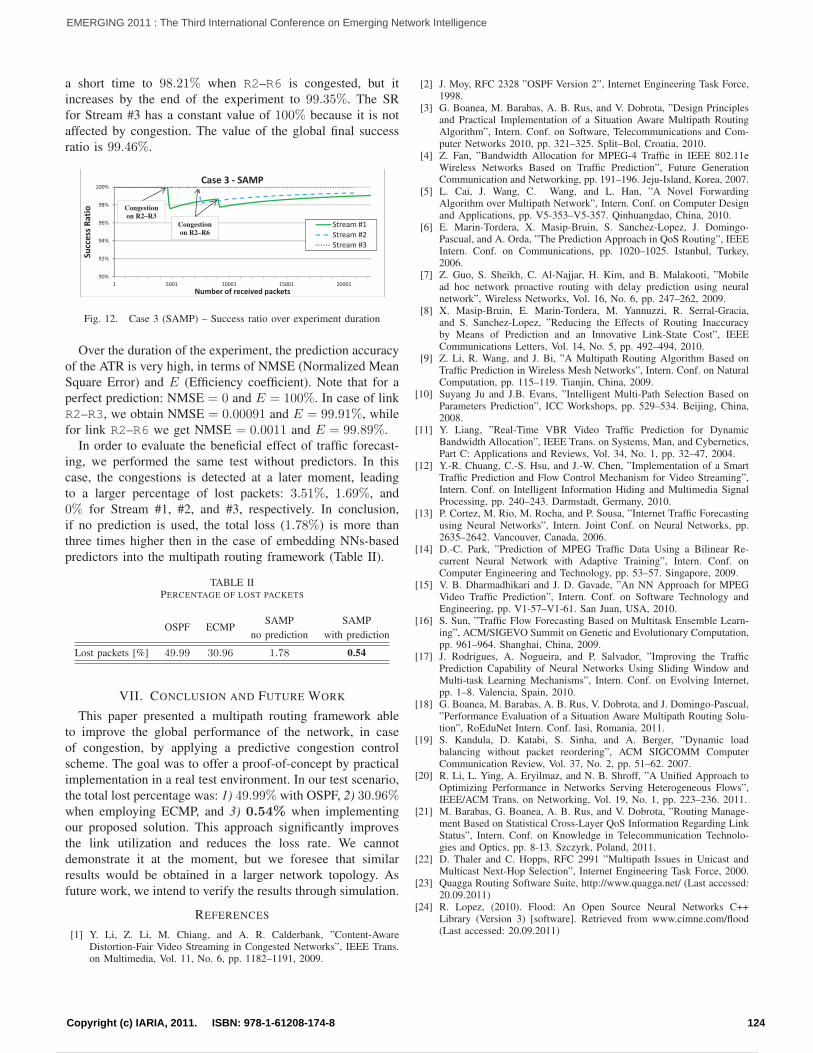
a short time to 98.21% when R2–R6 is congested, but it
increases by the end of the experiment to 99.35%. The SR
for Stream #3 has a constant value of 100% because it is not
affected by congestion. The value of the global final success
ratio is 99.46%.
Fig. 12. Case 3 (SAMP) – Success ratio over experiment duration
Over the duration of the experiment, the prediction accuracy
of the ATR is very high, in terms of NMSE (Normalized Mean
Square Error) and E (Efficiency coefficient). Note that for a
perfect prediction: NMSE = 0 and E = 100%. In case of link
R2–R3, we obtain NMSE = 0.00091 and E = 99.91%, while
for link R2–R6 we get NMSE = 0.0011 and E = 99.89%.
In order to evaluate the beneficial effect of traffic forecast-
ing, we performed the same test without predictors. In this
case, the congestions is detected at a later moment, leading
to a larger percentage of lost packets: 3.51%, 1.69%, and
0% for Stream #1, #2, and #3, respectively. In conclusion,
if no prediction is used, the total loss (1.78%) is more than
three times higher then in the case of embedding NNs-based
predictors into the multipath routing framework (Table II).
TABLE IIPERCENTAGE OF LOST PACKETS
OSPF ECMPSAMP SAMP
no prediction with prediction
Lost packets [%] 49.99 30.96 1.78 0.54
VII. CONCLUSION AND FUTURE WORK
This paper presented a multipath routing framework able
to improve the global performance of the network, in case
of congestion, by applying a predictive congestion control
scheme. The goal was to offer a proof-of-concept by practical
implementation in a real test environment. In our test scenario,
the total lost percentage was: 1) 49.99% with OSPF, 2) 30.96%
when employing ECMP, and 3) 0.54% when implementing
our proposed solution. This approach significantly improves
the link utilization and reduces the loss rate. We cannot
demonstrate it at the moment, but we foresee that similar
results would be obtained in a larger network topology. As
future work, we intend to verify the results through simulation.
REFERENCES
[1] Y. Li, Z. Li, M. Chiang, and A. R. Calderbank, ”Content-AwareDistortion-Fair Video Streaming in Congested Networks”, IEEE Trans.on Multimedia, Vol. 11, No. 6, pp. 1182–1191, 2009.
[2] J. Moy, RFC 2328 ”OSPF Version 2”, Internet Engineering Task Force,1998.
[3] G. Boanea, M. Barabas, A. B. Rus, and V. Dobrota, ”Design Principlesand Practical Implementation of a Situation Aware Multipath RoutingAlgorithm”, Intern. Conf. on Software, Telecommunications and Com-puter Networks 2010, pp. 321–325. Split–Bol, Croatia, 2010.
[4] Z. Fan, ”Bandwidth Allocation for MPEG-4 Traffic in IEEE 802.11eWireless Networks Based on Traffic Prediction”, Future GenerationCommunication and Networking, pp. 191–196. Jeju-Island, Korea, 2007.
[5] L. Cai, J. Wang, C. Wang, and L. Han, ”A Novel ForwardingAlgorithm over Multipath Network”, Intern. Conf. on Computer Designand Applications, pp. V5-353–V5-357. Qinhuangdao, China, 2010.
[6] E. Marin-Tordera, X. Masip-Bruin, S. Sanchez-Lopez, J. Domingo-Pascual, and A. Orda, ”The Prediction Approach in QoS Routing”, IEEEIntern. Conf. on Communications, pp. 1020–1025. Istanbul, Turkey,2006.
[7] Z. Guo, S. Sheikh, C. Al-Najjar, H. Kim, and B. Malakooti, ”Mobilead hoc network proactive routing with delay prediction using neuralnetwork”, Wireless Networks, Vol. 16, No. 6, pp. 247–262, 2009.
[8] X. Masip-Bruin, E. Marin-Tordera, M. Yannuzzi, R. Serral-Gracia,and S. Sanchez-Lopez, ”Reducing the Effects of Routing Inaccuracyby Means of Prediction and an Innovative Link-State Cost”, IEEECommunications Letters, Vol. 14, No. 5, pp. 492–494, 2010.
[9] Z. Li, R. Wang, and J. Bi, ”A Multipath Routing Algorithm Based onTraffic Prediction in Wireless Mesh Networks”, Intern. Conf. on NaturalComputation, pp. 115–119. Tianjin, China, 2009.
[10] Suyang Ju and J.B. Evans, ”Intelligent Multi-Path Selection Based onParameters Prediction”, ICC Workshops, pp. 529–534. Beijing, China,2008.
[11] Y. Liang, ”Real-Time VBR Video Traffic Prediction for DynamicBandwidth Allocation”, IEEE Trans. on Systems, Man, and Cybernetics,Part C: Applications and Reviews, Vol. 34, No. 1, pp. 32–47, 2004.
[12] Y.-R. Chuang, C.-S. Hsu, and J.-W. Chen, ”Implementation of a SmartTraffic Prediction and Flow Control Mechanism for Video Streaming”,Intern. Conf. on Intelligent Information Hiding and Multimedia SignalProcessing, pp. 240–243. Darmstadt, Germany, 2010.
[13] P. Cortez, M. Rio, M. Rocha, and P. Sousa, ”Internet Traffic Forecastingusing Neural Networks”, Intern. Joint Conf. on Neural Networks, pp.2635–2642. Vancouver, Canada, 2006.
[14] D.-C. Park, ”Prediction of MPEG Traffic Data Using a Bilinear Re-current Neural Network with Adaptive Training”, Intern. Conf. onComputer Engineering and Technology, pp. 53–57. Singapore, 2009.
[15] V. B. Dharmadhikari and J. D. Gavade, ”An NN Approach for MPEGVideo Traffic Prediction”, Intern. Conf. on Software Technology andEngineering, pp. V1-57–V1-61. San Juan, USA, 2010.
[16] S. Sun, ”Traffic Flow Forecasting Based on Multitask Ensemble Learn-ing”, ACM/SIGEVO Summit on Genetic and Evolutionary Computation,pp. 961–964. Shanghai, China, 2009.
[17] J. Rodrigues, A. Nogueira, and P. Salvador, ”Improving the TrafficPrediction Capability of Neural Networks Using Sliding Window andMulti-task Learning Mechanisms”, Intern. Conf. on Evolving Internet,pp. 1–8. Valencia, Spain, 2010.
[18] G. Boanea, M. Barabas, A. B. Rus, V. Dobrota, and J. Domingo-Pascual,”Performance Evaluation of a Situation Aware Multipath Routing Solu-tion”, RoEduNet Intern. Conf. Iasi, Romania, 2011.
[19] S. Kandula, D. Katabi, S. Sinha, and A. Berger, ”Dynamic loadbalancing without packet reordering”, ACM SIGCOMM ComputerCommunication Review, Vol. 37, No. 2, pp. 51–62. 2007.
[20] R. Li, L. Ying, A. Eryilmaz, and N. B. Shroff, ”A Unified Approach toOptimizing Performance in Networks Serving Heterogeneous Flows”,IEEE/ACM Trans. on Networking, Vol. 19, No. 1, pp. 223–236. 2011.
[21] M. Barabas, G. Boanea, A. B. Rus, and V. Dobrota, ”Routing Manage-ment Based on Statistical Cross-Layer QoS Information Regarding LinkStatus”, Intern. Conf. on Knowledge in Telecommunication Technolo-gies and Optics, pp. 8-13. Szczyrk, Poland, 2011.
[22] D. Thaler and C. Hopps, RFC 2991 ”Multipath Issues in Unicast andMulticast Next-Hop Selection”, Internet Engineering Task Force, 2000.
[23] Quagga Routing Software Suite, http://www.quagga.net/ (Last accessed:20.09.2011)
[24] R. Lopez, (2010). Flood: An Open Source Neural Networks C++Library (Version 3) [software]. Retrieved from www.cimne.com/flood(Last accessed: 20.09.2011)
124Copyright (c) IARIA, 2011. ISBN: 978-1-61208-174-8
EMERGING 2011 : The Third International Conference on Emerging Network Intelligence
131 / 141
Blocking Performance of Multi-Rate OCDMA Passive Optical Networks
John S. Vardakas∗, Ioannis D. Moscholios†, Michael D. Logothetis‡ and Vassilios G. Stylianakis§∗WCL, Dept. of Electrical & Computer Engineering, University of Patras, 265 04, Patras, Greece
Email: [email protected]†Dept. of Telecommunications Science and Technology, University of Peloponnese, 221 00, Tripolis, Greece
Email: [email protected]‡WCL, Dept. of Electrical & Computer Engineering, University of Patras, 265 04, Patras, Greece
Email: [email protected]§WCL, Dept. of Electrical & Computer Engineering, University of Patras, 265 04, Patras, Greece
Email: [email protected]
Abstract—Optical Code Division Multiple Access (OCDMA)is one promising candidate for the provision of moderatesecurity communications with large dedicated bandwidth toeach end user. We present a new teletraffic model for thecall-level performance of an OCDMA Passive Optical Net-work (PON) configuration that accommodates multiple service-classes. Parameters related to the local blocking, MultipleAccess Interference (MAI) and user activity are incorporatedto our analysis, which is based on a two-dimensional Markovchain. In this paper we focus on the derivation of recursiveformulas for the efficient calculation of blocking probabilities.To evaluate the proposed model, the analytical results arecompared with simulation results to reveal that the model’ saccuracy is quite satisfactory.
Keywords-PON; OCDMA; Multiple Access Interference; Loss;Blocking Probability; Recursive Formula; Markov chain.
I. INTRODUCTION
The popularity of broadband applications, includingbandwidth-hungry multimedia services and Internet Proto-col Television (IPTV), has promoted the fiber-to-the-end-user as a feasible access networking technology. Amongdifferent optical access solutions, Passive Optical Networks(PONs) have received a tremendous attention from bothindustrial and academic communities, mainly due to the lowoperational cost, the enormous bandwidth offering and theabsence of active components between the central office andthe customers premises [1].
Over the years, several standards for PONs have evolved,in the form of the G.983 ITU-T recommendations series,which include Asynchronous Transfer Mode PONs (ATM-PONs), Ethernet PONs (EPONs) and Broadband PONs(BPONs). These architectures are based on a Time DivisionMultiple Access (TDMA) scheme and they typically use a1550 nm wavelength for the downstream traffic and a 1310nm for the upstream traffic [2]. While these TDMA-PONsemploy two wavelengths for the upstream and downstreamdirection, respectively, the Wavelength Division Multiplex-ing (WDM)-PON utilizes multiple wavelengths, so that twowavelengths are allocated to each user for down/upstream
transmissions. A different approach for the provision of mul-tiple access in PONs is the Optical Code Division MultipleAccess (OCDMA). In contrast to the other multiple accessschemes OCDMA can multiplex a number of channels onthe same wavelength and on the same time-slot [3]. Inaddition, OCDMA offers full asynchronous transmission,soft capacity on demand, low latency access, simple networkcontrol and better security against unauthorized access [4].
In OCDMA, each communication channel is distinguishedby a specific optical code. The encoding procedure involvesthe multiplication of each data bit by a code sequence eitherin the time domain [5], in the wavelength domain [6], orin a combination of both [7]. The decoder receives thesum of all encoded signals (from different transmitters) andrecovers the data from a specific encoder, by using the sameoptical code. All the remaining signals appear as noise tothe specific receiver; this noise is known as Multiple AccessInterference (MAI) and is the key degrading factor of thenetworks performance.
To perform service differentiation in OCDMA networks,different solutions have been investigated. A simple ap-proach is based on the utilization of multi-length codes[8]; however, under multi-length coding, short-length codesintroduce significant interference over long-length codes,while high error probability emerges for high rate users.Optical fast-frequency hopping has been also proposed formulti-rate OCDMA networks [9]. This technique is based onmultiple wavelengths; therefore it requires multi-wavelengthtransmitters with high sensitivity on power control. Anotherway to provide service differentiation is the assignment ofseveral codes to each service-class. This procedure is knownas the parallel mapping technique [10]. In this case thenumber of codes is proportional to the data rate of theassigned service-class.
The research activity on OCDMA networks is mainly fo-cused on the performance of several OCDMA components;only a few analytical models have been presented in theliterature involving the computation of blocking probabilitiesin OCDMA networks. Goldberg and Prucnal [11] provide
125Copyright (c) IARIA, 2011. ISBN: 978-1-61208-174-8
EMERGING 2011 : The Third International Conference on Emerging Network Intelligence
132 / 141
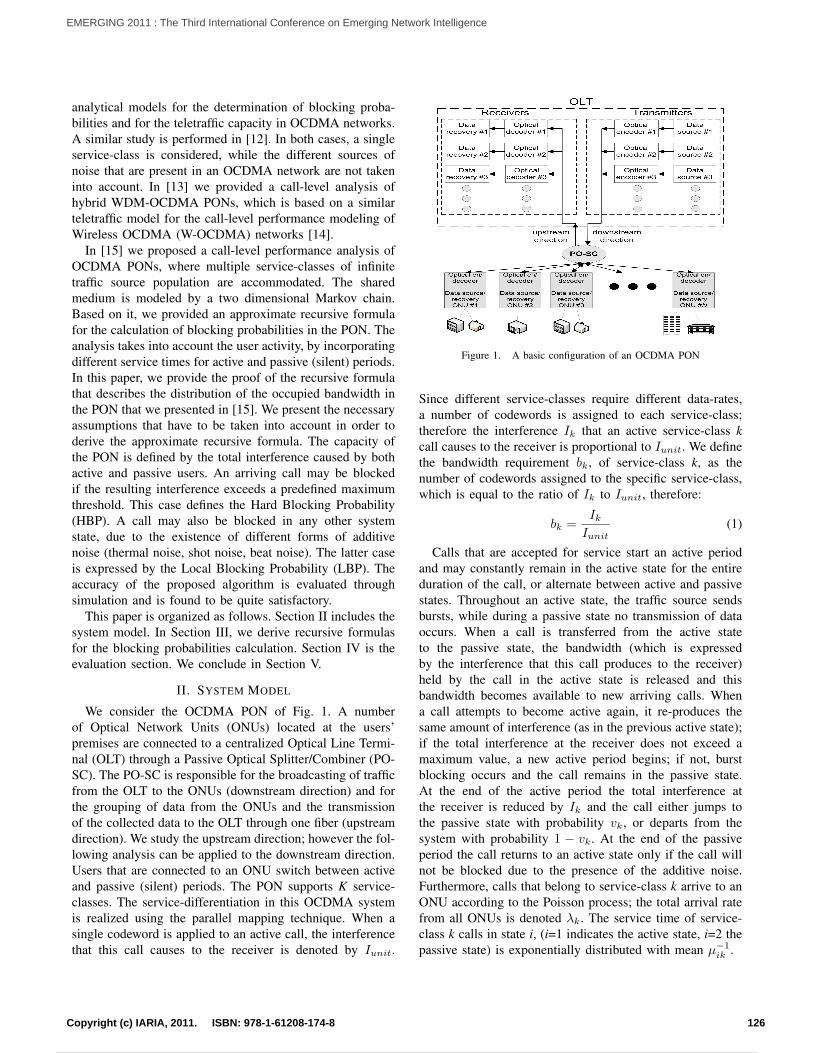
analytical models for the determination of blocking proba-bilities and for the teletraffic capacity in OCDMA networks.A similar study is performed in [12]. In both cases, a singleservice-class is considered, while the different sources ofnoise that are present in an OCDMA network are not takeninto account. In [13] we provided a call-level analysis ofhybrid WDM-OCDMA PONs, which is based on a similarteletraffic model for the call-level performance modeling ofWireless OCDMA (W-OCDMA) networks [14].
In [15] we proposed a call-level performance analysis ofOCDMA PONs, where multiple service-classes of infinitetraffic source population are accommodated. The sharedmedium is modeled by a two dimensional Markov chain.Based on it, we provided an approximate recursive formulafor the calculation of blocking probabilities in the PON. Theanalysis takes into account the user activity, by incorporatingdifferent service times for active and passive (silent) periods.In this paper, we provide the proof of the recursive formulathat describes the distribution of the occupied bandwidth inthe PON that we presented in [15]. We present the necessaryassumptions that have to be taken into account in order toderive the approximate recursive formula. The capacity ofthe PON is defined by the total interference caused by bothactive and passive users. An arriving call may be blockedif the resulting interference exceeds a predefined maximumthreshold. This case defines the Hard Blocking Probability(HBP). A call may also be blocked in any other systemstate, due to the existence of different forms of additivenoise (thermal noise, shot noise, beat noise). The latter caseis expressed by the Local Blocking Probability (LBP). Theaccuracy of the proposed algorithm is evaluated throughsimulation and is found to be quite satisfactory.
This paper is organized as follows. Section II includes thesystem model. In Section III, we derive recursive formulasfor the blocking probabilities calculation. Section IV is theevaluation section. We conclude in Section V.
II. SYSTEM MODEL
We consider the OCDMA PON of Fig. 1. A numberof Optical Network Units (ONUs) located at the users’premises are connected to a centralized Optical Line Termi-nal (OLT) through a Passive Optical Splitter/Combiner (PO-SC). The PO-SC is responsible for the broadcasting of trafficfrom the OLT to the ONUs (downstream direction) and forthe grouping of data from the ONUs and the transmissionof the collected data to the OLT through one fiber (upstreamdirection). We study the upstream direction; however the fol-lowing analysis can be applied to the downstream direction.Users that are connected to an ONU switch between activeand passive (silent) periods. The PON supports K service-classes. The service-differentiation in this OCDMA systemis realized using the parallel mapping technique. When asingle codeword is applied to an active call, the interferencethat this call causes to the receiver is denoted by Iunit.
Figure 1. A basic configuration of an OCDMA PON
Since different service-classes require different data-rates,a number of codewords is assigned to each service-class;therefore the interference Ik that an active service-class kcall causes to the receiver is proportional to Iunit. We definethe bandwidth requirement bk, of service-class k, as thenumber of codewords assigned to the specific service-class,which is equal to the ratio of Ik to Iunit, therefore:
bk =IkIunit
(1)
Calls that are accepted for service start an active periodand may constantly remain in the active state for the entireduration of the call, or alternate between active and passivestates. Throughout an active state, the traffic source sendsbursts, while during a passive state no transmission of dataoccurs. When a call is transferred from the active stateto the passive state, the bandwidth (which is expressedby the interference that this call produces to the receiver)held by the call in the active state is released and thisbandwidth becomes available to new arriving calls. Whena call attempts to become active again, it re-produces thesame amount of interference (as in the previous active state);if the total interference at the receiver does not exceed amaximum value, a new active period begins; if not, burstblocking occurs and the call remains in the passive state.At the end of the active period the total interference atthe receiver is reduced by Ik and the call either jumps tothe passive state with probability vk, or departs from thesystem with probability 1 − vk. At the end of the passiveperiod the call returns to an active state only if the call willnot be blocked due to the presence of the additive noise.Furthermore, calls that belong to service-class k arrive to anONU according to the Poisson process; the total arrival ratefrom all ONUs is denoted λk. The service time of service-class k calls in state i, (i=1 indicates the active state, i=2 thepassive state) is exponentially distributed with mean µ−1
ik .
126Copyright (c) IARIA, 2011. ISBN: 978-1-61208-174-8
EMERGING 2011 : The Third International Conference on Emerging Network Intelligence
133 / 141
According to the principle of the CDMA technology, acall should be blocked if it increases the noise of all in-service calls above a predefined level, given that a call isnoise for all other calls. This noise is known as MAI. Wedistinguish the MAI from other forms of noise, the shotnoise, the thermal noise and the fiber-link noise. The thermalnoise is generally modeled as Gauss distribution (0, th),and the fiber-link noise is modeled as Gauss distribution (0,σfb) [16]. The shot noise is modeled as a Poisson processwhere its expectation and variance are both denoted by p[16]. According to the central limit theorem, we can assumethat the additive shot noise is modeled as Gauss distribution(µN , σN ), considering that the number of users in the PON isrelatively large. Therefore, the interference IN caused by thethe three types of noise is modeled as a Gaussian distributionwith mean µN = p and variance σN =
√σ2th + σ2
fb + p2.The Call Admission Control (CAC) in the OCDMA PON
under consideration is performed by measuring the totalinterference at the receiver. When a new call arrives (whichautomatically enters an active state), the CAC checks iftwo conditions are valid. The first condition (condition A)estimates the total received interference and if it exceeds amaximum value Imax, the call is blocked and lost. There-fore, condition A is expressed by the following relation:
K∑k=1
(n1kIk)+Ik+IN>Imax⇔
INImax
>1−K∑k=1
(n1k
IkImax
)− IkImax
(2)
where n1k represent the number of the service-class k calls in
the active system. The same condition is used at the receiver,when a passive call jumps to an active state. Based on (2), wedefine the LBP lbk(n1
k) that a service-class k call is blockeddue to the presence of the additive noise, when the numberof active calls is n1
k:
lbk(n1k) = P
(INImax
> 1−K∑k=1
(n1k
IkImax
)− IkImax
)(3)
or
1− lbk(n1k)=P
(INImax
≤1−K∑k=1
(n1k
IkImax
)− IkImax
)(4)
Since the total additive noise IN follows a Gaussiandistribution (µN , σN ), the variable IN/Imax, which is usedfor the LBP calculation also follows a Gaussian distribution(µN/Imax, σN/Imax) Therefore the right-hand side of (4),which is the Cumulative Distribution Function (CDF) ofIN/Imax, is denoted by Fn(x) = P (IN/Imax ≤ x) andis given by:
Fn(x) =1
2(1 + erf(
x− (µN/Imax)
(σN/Imax)√
2)) (5)
where erf(•) is the well-known error function. Using (2)and (4) we can calculate the LBP, lbk(n1
k) by means of the
substitution x = 1−∑Kk=1(n1
kIkImax
)− IkImax
:
lbk(x) =
1− Fn(x), x ≥ 01, x < 0
(6)
III. THE DISTRIBUTION OF THE NUMBER OF ACTIVEAND PASSIVE CALLS
The following analysis is inspired by the multi-rate ON-OFF model for the call-level performance of a single link,presented in [17], [18] , which considers discrete state space.The discretization of the total interference Imax is performedby using the interference caused by a single-codeword call:
C1 =
∣∣∣∣ Imax
Iunit
∣∣∣∣ (7)
When a call is at the passive state, it is assumed thatit produces a fictitious interference of a fictitious system,with a discrete capacity C2: This passive system is used toprevent new calls to enter the system when a large number ofcalls are at the passive state. In order to employ the analysispresented in [17], we use the following notations:
1) the total interference of the in-service active calls rep-resents the occupied bandwidth of the active system,and is denoted by j1.
2) the total (fictitious) interference of the in-service pas-sive calls represents the occupied bandwidth of thepassive system, and is denoted by j2.
Based on the analysis presented in the previous section,a new call will be accepted for service if the call’s interfer-ence (which is expressed by the bandwidth requirement cktogether with the interference caused by all the in-serviceactive calls, (which is expressed by the parameter j1), willnot exceed Imax. Moreover, in order to avert the acceptanceof new calls when a large number of calls are at the passivestate, the interference of the new call together with the totalinterference of all in-service active calls and the fictitiousinterference of all in-service passive calls should not exceedthe fictitious capacity (which is expressed by the discretevalue C2). Based on this analysis, a new service-class k callwill be accepted for service in the system, if it satisfies boththe following constraints:
j1 + bk ≤ C1 and j1 + j2 + bk ≤ C2 (8)
If we denote by Ω the set of the permissible states,then the distribution ~j = (j1, j2), denoted as q(~j) can becalculated by the proposed two-dimensional approximaterecursive formula:
2∑i=1
K∑k=1
bi,k,spik
(~j)q(~j −Bi,k) = jsq(~j) (9)
where
~j ∈ Ω⇔
(j1 ≤ C1 ∩
(2∑s=1
js ≤ C2
))(10)
127Copyright (c) IARIA, 2011. ISBN: 978-1-61208-174-8
EMERGING 2011 : The Third International Conference on Emerging Network Intelligence
134 / 141
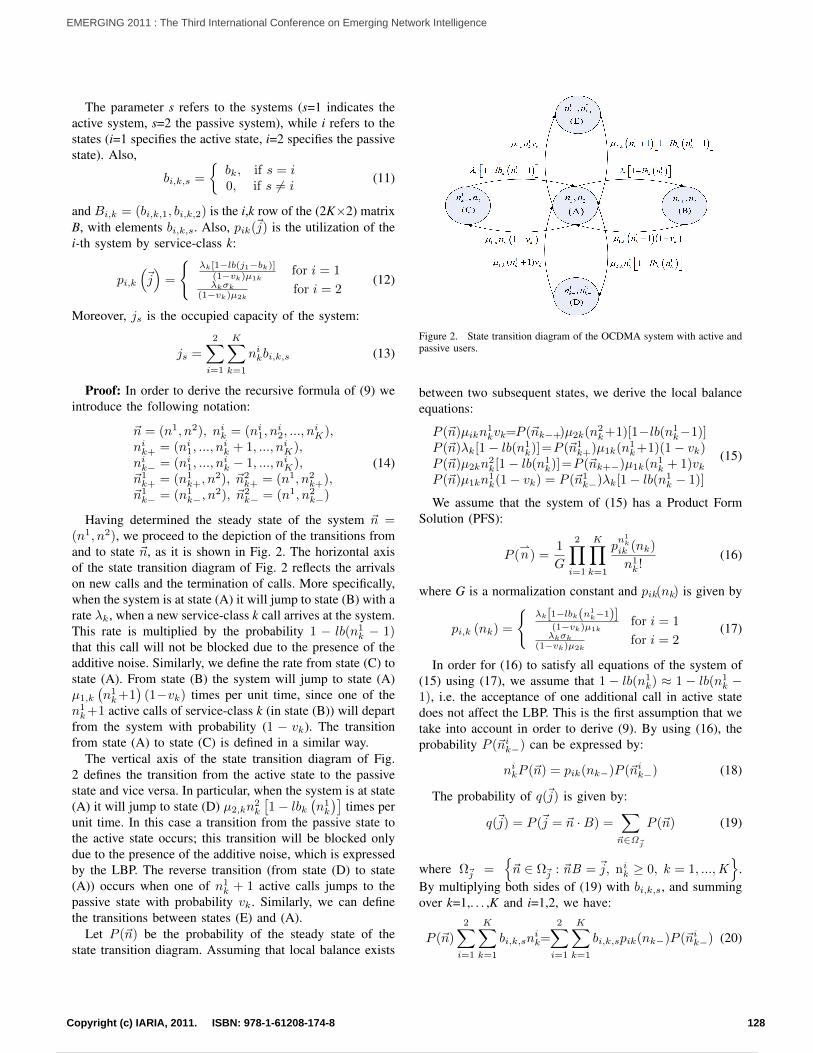
The parameter s refers to the systems (s=1 indicates theactive system, s=2 the passive system), while i refers to thestates (i=1 specifies the active state, i=2 specifies the passivestate). Also,
bi,k,s =
bk, if s = i0, if s 6= i
(11)
and Bi,k = (bi,k,1, bi,k,2) is the i,k row of the (2K×2) matrixB, with elements bi,k,s. Also, pik(~j) is the utilization of thei-th system by service-class k:
pi,k
(~j)
=
λk[1−lb(j1−bk)]
(1−vk)µ1kfor i = 1
λkσk
(1−vk)µ2kfor i = 2
(12)
Moreover, js is the occupied capacity of the system:
js =
2∑i=1
K∑k=1
nikbi,k,s (13)
Proof: In order to derive the recursive formula of (9) weintroduce the following notation:
~n = (n1, n2), nik = (ni1, ni2, ..., n
iK),
nik+ = (ni1, ..., nik + 1, ..., niK),
nik− = (ni1, ..., nik − 1, ..., niK),
~n1k+ = (n1
k+, n2), ~n2
k+ = (n1, n2k+),
~n1k− = (n1
k−, n2), ~n2
k− = (n1, n2k−)
(14)
Having determined the steady state of the system ~n =(n1, n2), we proceed to the depiction of the transitions fromand to state ~n, as it is shown in Fig. 2. The horizontal axisof the state transition diagram of Fig. 2 reflects the arrivalson new calls and the termination of calls. More specifically,when the system is at state (A) it will jump to state (B) with arate λk, when a new service-class k call arrives at the system.This rate is multiplied by the probability 1 − lb(n1
k − 1)that this call will not be blocked due to the presence of theadditive noise. Similarly, we define the rate from state (C) tostate (A). From state (B) the system will jump to state (A)µ1,k
(n1k+1
)(1−vk) times per unit time, since one of the
n1k+1 active calls of service-class k (in state (B)) will depart
from the system with probability (1 − vk). The transitionfrom state (A) to state (C) is defined in a similar way.
The vertical axis of the state transition diagram of Fig.2 defines the transition from the active state to the passivestate and vice versa. In particular, when the system is at state(A) it will jump to state (D) µ2,kn
2k
[1− lbk
(n1k
)]times per
unit time. In this case a transition from the passive state tothe active state occurs; this transition will be blocked onlydue to the presence of the additive noise, which is expressedby the LBP. The reverse transition (from state (D) to state(A)) occurs when one of n1
k + 1 active calls jumps to thepassive state with probability vk. Similarly, we can definethe transitions between states (E) and (A).
Let P (~n) be the probability of the steady state of thestate transition diagram. Assuming that local balance exists
Figure 2. State transition diagram of the OCDMA system with active andpassive users.
between two subsequent states, we derive the local balanceequations:
P (~n)µikn1kvk=P (~nk−+)µ2k(n2
k+1)[1−lb(n1k−1)]
P (~n)λk[1− lb(n1k)]=P (~n1
k+)µ1k(n1k+1)(1− vk)
P (~n)µ2kn2k[1− lb(n1
k)]=P (~nk+−)µ1k(n1k + 1)vk
P (~n)µ1kn1k(1− vk) = P (~n1
k−)λk[1− lb(n1k − 1)]
(15)
We assume that the system of (15) has a Product FormSolution (PFS):
P (n) =
1
G
2∏i=1
K∏k=1
pn1k
ik (nk)
n1k!
(16)
where G is a normalization constant and pik(nk) is given by
pi,k (nk) =
λk[1−lbk(n1
k−1)](1−vk)µ1k
for i = 1λkσk
(1−vk)µ2kfor i = 2
(17)
In order for (16) to satisfy all equations of the system of(15) using (17), we assume that 1 − lb(n1
k) ≈ 1 − lb(n1k −
1), i.e. the acceptance of one additional call in active statedoes not affect the LBP. This is the first assumption that wetake into account in order to derive (9). By using (16), theprobability P (~nik−) can be expressed by:
nikP (~n) = pik(nk−)P (~nik−) (18)
The probability of q(~j) is given by:
q(~j) = P (~j = ~n ·B) =∑~n∈Ω~j
P (~n) (19)
where Ω~j =~n ∈ Ω~j : ~nB = ~j, ni
k ≥ 0, k = 1, ...,K
.By multiplying both sides of (19) with bi,k,s, and summingover k=1,. . . ,K and i=1,2, we have:
P (~n)
2∑i=1
K∑k=1
bi,k,snik=
2∑i=1
K∑k=1
bi,k,spik(nk−)P (~nik−) (20)
128Copyright (c) IARIA, 2011. ISBN: 978-1-61208-174-8
EMERGING 2011 : The Third International Conference on Emerging Network Intelligence
135 / 141
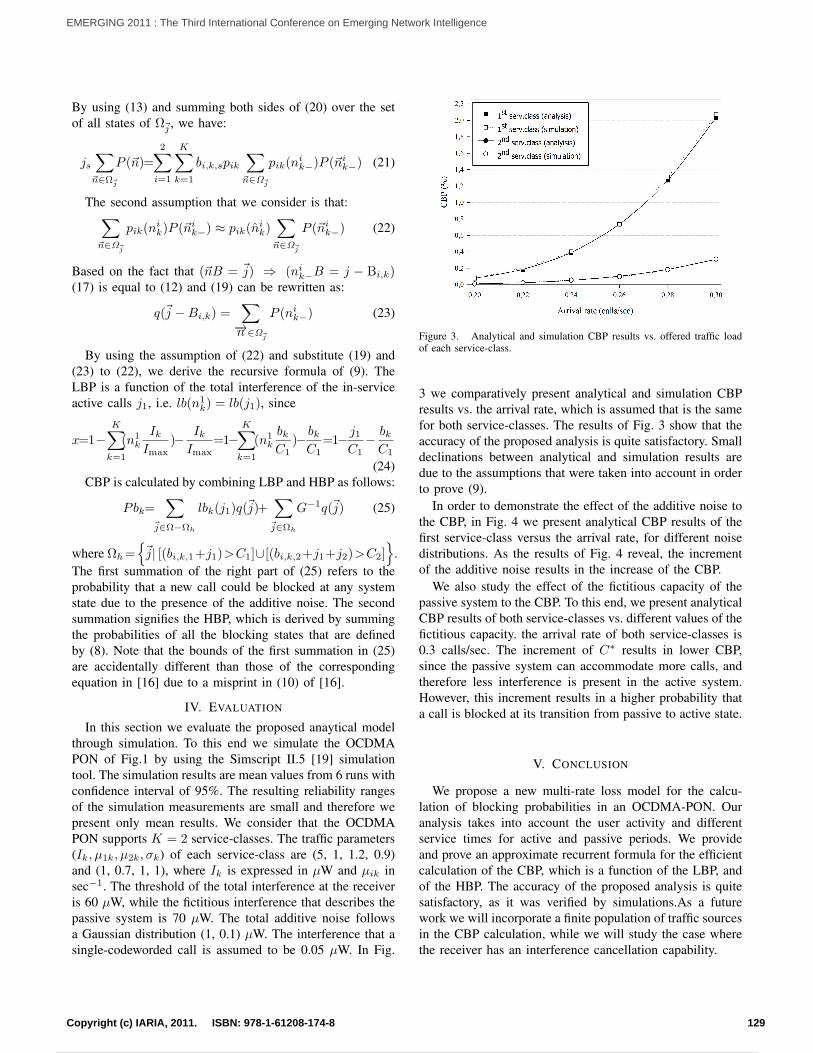
By using (13) and summing both sides of (20) over the setof all states of Ω~j , we have:
js∑~n∈Ω~j
P (~n)=
2∑i=1
K∑k=1
bi,k,spik∑~n∈Ω~j
pik(nik−)P (~nik−) (21)
The second assumption that we consider is that:∑~n∈Ω~j
pik(nik)P (~nik−) ≈ pik(nik)∑~n∈Ω~j
P (~nik−) (22)
Based on the fact that (~nB = ~j) ⇒ (nik−B = j − Bi,k)(17) is equal to (12) and (19) can be rewritten as:
q(~j −Bi,k) =∑−→n ∈Ω~j
P (nik−) (23)
By using the assumption of (22) and substitute (19) and(23) to (22), we derive the recursive formula of (9). TheLBP is a function of the total interference of the in-serviceactive calls j1, i.e. lb(n1
k) = lb(j1), since
x=1−K∑k=1
(n1k
IkImax
)− IkImax
=1−K∑k=1
(n1k
bkC1
)−bkC1
=1− j1C1− bkC1
(24)CBP is calculated by combining LBP and HBP as follows:
Pbk=∑
~j∈Ω−Ωh
lbk(j1)q(~j)+∑~j∈Ωh
G−1q(~j) (25)
where Ωh=~j| [(bi,k,1+j1)>C1]∪[(bi,k,2+j1+j2)>C2]
.
The first summation of the right part of (25) refers to theprobability that a new call could be blocked at any systemstate due to the presence of the additive noise. The secondsummation signifies the HBP, which is derived by summingthe probabilities of all the blocking states that are definedby (8). Note that the bounds of the first summation in (25)are accidentally different than those of the correspondingequation in [16] due to a misprint in (10) of [16].
IV. EVALUATION
In this section we evaluate the proposed anaytical modelthrough simulation. To this end we simulate the OCDMAPON of Fig.1 by using the Simscript II.5 [19] simulationtool. The simulation results are mean values from 6 runs withconfidence interval of 95%. The resulting reliability rangesof the simulation measurements are small and therefore wepresent only mean results. We consider that the OCDMAPON supports K = 2 service-classes. The traffic parameters(Ik, µ1k, µ2k, σk) of each service-class are (5, 1, 1.2, 0.9)and (1, 0.7, 1, 1), where Ik is expressed in µW and µik insec−1. The threshold of the total interference at the receiveris 60 µW, while the fictitious interference that describes thepassive system is 70 µW. The total additive noise followsa Gaussian distribution (1, 0.1) µW. The interference that asingle-codeworded call is assumed to be 0.05 µW. In Fig.
Figure 3. Analytical and simulation CBP results vs. offered traffic loadof each service-class.
3 we comparatively present analytical and simulation CBPresults vs. the arrival rate, which is assumed that is the samefor both service-classes. The results of Fig. 3 show that theaccuracy of the proposed analysis is quite satisfactory. Smalldeclinations between analytical and simulation results aredue to the assumptions that were taken into account in orderto prove (9).
In order to demonstrate the effect of the additive noise tothe CBP, in Fig. 4 we present analytical CBP results of thefirst service-class versus the arrival rate, for different noisedistributions. As the results of Fig. 4 reveal, the incrementof the additive noise results in the increase of the CBP.
We also study the effect of the fictitious capacity of thepassive system to the CBP. To this end, we present analyticalCBP results of both service-classes vs. different values of thefictitious capacity. the arrival rate of both service-classes is0.3 calls/sec. The increment of C∗ results in lower CBP,since the passive system can accommodate more calls, andtherefore less interference is present in the active system.However, this increment results in a higher probability thata call is blocked at its transition from passive to active state.
V. CONCLUSION
We propose a new multi-rate loss model for the calcu-lation of blocking probabilities in an OCDMA-PON. Ouranalysis takes into account the user activity and differentservice times for active and passive periods. We provideand prove an approximate recurrent formula for the efficientcalculation of the CBP, which is a function of the LBP, andof the HBP. The accuracy of the proposed analysis is quitesatisfactory, as it was verified by simulations.As a futurework we will incorporate a finite population of traffic sourcesin the CBP calculation, while we will study the case wherethe receiver has an interference cancellation capability.
129Copyright (c) IARIA, 2011. ISBN: 978-1-61208-174-8
EMERGING 2011 : The Third International Conference on Emerging Network Intelligence
136 / 141
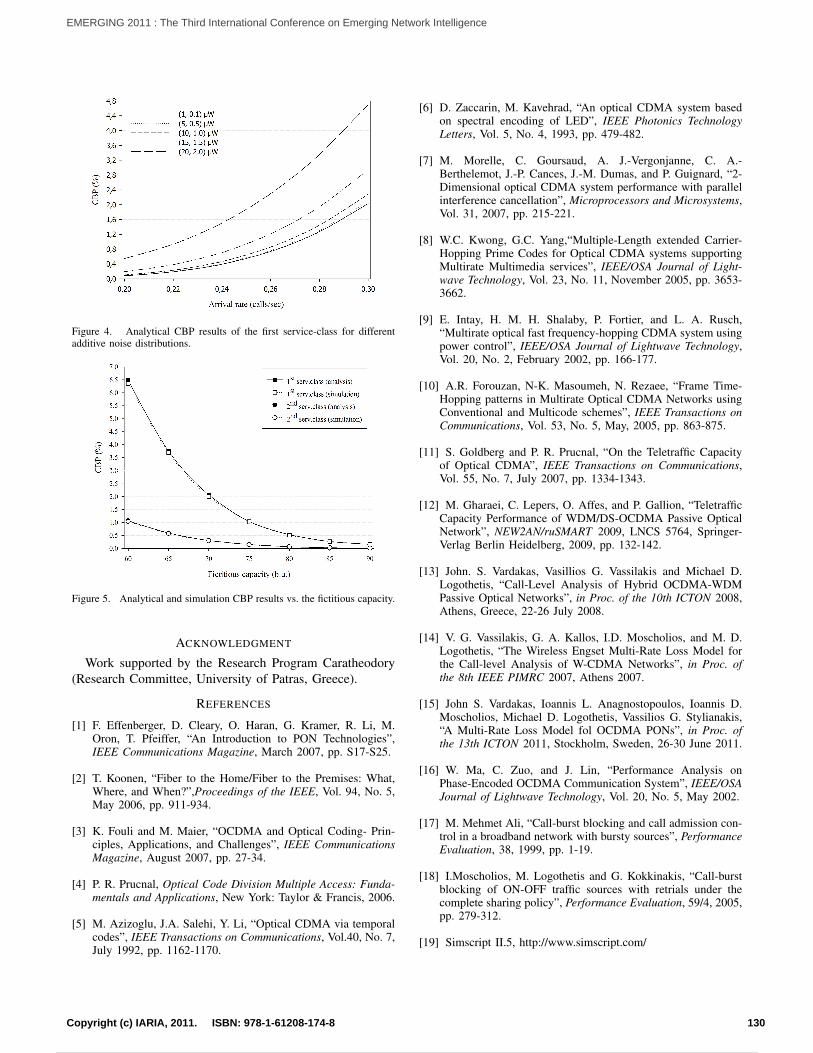
Figure 4. Analytical CBP results of the first service-class for differentadditive noise distributions.
Figure 5. Analytical and simulation CBP results vs. the fictitious capacity.
ACKNOWLEDGMENT
Work supported by the Research Program Caratheodory(Research Committee, University of Patras, Greece).
REFERENCES
[1] F. Effenberger, D. Cleary, O. Haran, G. Kramer, R. Li, M.Oron, T. Pfeiffer, “An Introduction to PON Technologies”,IEEE Communications Magazine, March 2007, pp. S17-S25.
[2] T. Koonen, “Fiber to the Home/Fiber to the Premises: What,Where, and When?”,Proceedings of the IEEE, Vol. 94, No. 5,May 2006, pp. 911-934.
[3] K. Fouli and M. Maier, “OCDMA and Optical Coding- Prin-ciples, Applications, and Challenges”, IEEE CommunicationsMagazine, August 2007, pp. 27-34.
[4] P. R. Prucnal, Optical Code Division Multiple Access: Funda-mentals and Applications, New York: Taylor & Francis, 2006.
[5] M. Azizoglu, J.A. Salehi, Y. Li, “Optical CDMA via temporalcodes”, IEEE Transactions on Communications, Vol.40, No. 7,July 1992, pp. 1162-1170.
[6] D. Zaccarin, M. Kavehrad, “An optical CDMA system basedon spectral encoding of LED”, IEEE Photonics TechnologyLetters, Vol. 5, No. 4, 1993, pp. 479-482.
[7] M. Morelle, C. Goursaud, A. J.-Vergonjanne, C. A.-Berthelemot, J.-P. Cances, J.-M. Dumas, and P. Guignard, “2-Dimensional optical CDMA system performance with parallelinterference cancellation”, Microprocessors and Microsystems,Vol. 31, 2007, pp. 215-221.
[8] W.C. Kwong, G.C. Yang,“Multiple-Length extended Carrier-Hopping Prime Codes for Optical CDMA systems supportingMultirate Multimedia services”, IEEE/OSA Journal of Light-wave Technology, Vol. 23, No. 11, November 2005, pp. 3653-3662.
[9] E. Intay, H. M. H. Shalaby, P. Fortier, and L. A. Rusch,“Multirate optical fast frequency-hopping CDMA system usingpower control”, IEEE/OSA Journal of Lightwave Technology,Vol. 20, No. 2, February 2002, pp. 166-177.
[10] A.R. Forouzan, N-K. Masoumeh, N. Rezaee, “Frame Time-Hopping patterns in Multirate Optical CDMA Networks usingConventional and Multicode schemes”, IEEE Transactions onCommunications, Vol. 53, No. 5, May, 2005, pp. 863-875.
[11] S. Goldberg and P. R. Prucnal, “On the Teletraffic Capacityof Optical CDMA”, IEEE Transactions on Communications,Vol. 55, No. 7, July 2007, pp. 1334-1343.
[12] M. Gharaei, C. Lepers, O. Affes, and P. Gallion, “TeletrafficCapacity Performance of WDM/DS-OCDMA Passive OpticalNetwork”, NEW2AN/ruSMART 2009, LNCS 5764, Springer-Verlag Berlin Heidelberg, 2009, pp. 132-142.
[13] John. S. Vardakas, Vasillios G. Vassilakis and Michael D.Logothetis, “Call-Level Analysis of Hybrid OCDMA-WDMPassive Optical Networks”, in Proc. of the 10th ICTON 2008,Athens, Greece, 22-26 July 2008.
[14] V. G. Vassilakis, G. A. Kallos, I.D. Moscholios, and M. D.Logothetis, “The Wireless Engset Multi-Rate Loss Model forthe Call-level Analysis of W-CDMA Networks”, in Proc. ofthe 8th IEEE PIMRC 2007, Athens 2007.
[15] John S. Vardakas, Ioannis L. Anagnostopoulos, Ioannis D.Moscholios, Michael D. Logothetis, Vassilios G. Stylianakis,“A Multi-Rate Loss Model fol OCDMA PONs”, in Proc. ofthe 13th ICTON 2011, Stockholm, Sweden, 26-30 June 2011.
[16] W. Ma, C. Zuo, and J. Lin, “Performance Analysis onPhase-Encoded OCDMA Communication System”, IEEE/OSAJournal of Lightwave Technology, Vol. 20, No. 5, May 2002.
[17] M. Mehmet Ali, “Call-burst blocking and call admission con-trol in a broadband network with bursty sources”, PerformanceEvaluation, 38, 1999, pp. 1-19.
[18] I.Moscholios, M. Logothetis and G. Kokkinakis, “Call-burstblocking of ON-OFF traffic sources with retrials under thecomplete sharing policy”, Performance Evaluation, 59/4, 2005,pp. 279-312.
[19] Simscript II.5, http://www.simscript.com/
130Copyright (c) IARIA, 2011. ISBN: 978-1-61208-174-8
EMERGING 2011 : The Third International Conference on Emerging Network Intelligence
137 / 141
A Multimedia Capture System for Wildlife Studies
Kim Arild SteenDepartment of Engineering,
Aarhus UniversityFaculty of Science and Technology
Dalgas Avenue 2, Aarhus, [email protected]
Henrik KarstoftDepartment of Engineering,
Aarhus UniversityFaculty of Science and Technology
Aarhus, [email protected]
Ole GreenDepartment of Engineering,
Aarhus UniversityFaculty of Science and Technology
Aarhus, [email protected]
Abstract—This paper presents a system for video and audiorecording of wildlife geese in their natural environment. Thesystem enables remote controlled recording, and is designedfor an outdoor environment. The recordings lasted 1 month,where 4-5 hours of geese video and audio were succesfullycaptured. Data recorded using the system is a part of ongoingresearch to design a method for automatic recognition of animalbehaviour and species based on audio and video recordings.Automatic recognition could potentially lead to systems capableof reducing habituation.
Keywords-video; audio; recording; wildlife surveillance; re-mote
I. INTRODUCTION
In modern society, we often experience unwanted en-counters between groups of animals and human activities,such as in agricultural fields or at airports. This can be acostly affair and often inflicts damages both to the animalsas well as humans. In the case of agricultural fields, visualand acoustic stimuli may be used as mechanisms for scaringaway unwanted animals. However, these methods often havelimited success rates, as the animals habituate to the stimulus[2].
Recently, computer technology has been applied for char-acterising animal behaviour using computer vision for track-ing animal trajectories [6][8] and audio processing for recog-nition of animal vocalizations [1][5][7]. These approachesmay lead to systems capable of recognizing specific speciesand behaviours, and scare off the animals before they inflictdamage or get hurt. In [2] different approaches to scaring offanimals is reviewed, such as guard animals, gas explodersand distress calls, with the latter showing good results.
In the process of linking wildlife animals vocalizationswith specific behaviour, a system for recording video andaudio data in a wildlife setting is presented. Wildlifesurveillance systems have been previously described [3][4];however, these systems are designed for specific scenarios.Likewise, the present system is specific to the context ofvideo and audio recording of wildlife birds foraging inagricultural fields. The system described in [3] support bothaudio and video recording in a harsh environment (humid
environment), however the data recorded is used for manualinspection and not research regarding automatic recognition.
The system has been used for video and audio recordingof wildlife geese foraging in agricultural fields. The mainpurpose of this system is to record and store images andaudio of geese as they land, eat and flee. The data providedby the system will be used in further research regarding au-tomatic recognition of geese behaviour. Geese were chosenin this study, as they inflict much damage in agriculture, andthey are very vocal.
The structure of this paper is as follows: In Section IIthe requirements for the system is presented followed by adescription of the system in Section III. The implementedinfrastructure is presented in Section IV and preliminaryresults, using the system, are presented in Section V. Thediscussion in Section VI follows up on the results andexperience gained while using the system. The paper endswith a conclusion in Section VII.
II. SYSTEM REQUIREMENTS
Agricultural fields are wide open spaces, implying windyconditions during wildlife recordings. Wind reduction istherefore necessary to preserve the quality of the audiorecordings, and can be accomplished for instance throughuse of a casing. Furthermore, the remote location of agricul-tural fields reduces access to power grids. Consequently theconsideration of a power source and power consumption isimportant, as the system requires a standalone power source.
Barnacle geese are highly mobile with flight speed up to20m
s [9], and the video recording equipment needs to provideadequate frame rates to capture their movements. It is notdesirable to reduce the image quality or add computations byadding compression, as this could degrade performance oflater image processing and potentially cause fluctating framerates, as compression time could be affected by informationin the images.
As it is impossible to pinpoint in advance where the geesewill land and eat, video and audio recordings need to beinspected during the study. Consequently remote access isan important system requirement, to avoid frightening thegeese during inspection.
131Copyright (c) IARIA, 2011. ISBN: 978-1-61208-174-8
EMERGING 2011 : The Third International Conference on Emerging Network Intelligence
138 / 141

A further system requirement is a minimum uptime longenough to capture video and audio as the geese return tothe location, to avoid interference caused by installation ofthe system. An uptime of 36 hours has been chosen, asthe geese are likely to return to the same location becauseof the availability of food, however it is not certain thatthey will return the same day. Therefore, a harddrive witha large enough capacitiy, must be chosen to ensure no lossof data.
To summarize the most important requirements for amultimedia capture device for wildlife studies:
• Reduction of wind noise in the audio recording equip-ment
• Standalone power source (limitations to power con-sumption)
• Adequate frame rates (20−30 frames per second (fps)),due to the mobile animals
• Remote access, to monitor the recording without scar-ing off the animals
• Minimum uptime of 36 hours• High harddrive capacity (> 1 TB), due to the long
uptime and no compression
III. SYSTEM DESCRIPTION
The requirements, specified above, led to the systemsetup, described in this section and illustrated in Figure 1.
The power source needs to be standalone, and twosoultions were considered: car batteries and solar panels.The power produced by a solar panel is dependent on theweather, and, as sunlight is not garanteed on the west coastof Denmark, risks downtime. Another risk of solar panelsis to scare off or interfere with the animals’ behaviour,because of their shiny surface. Car batteries, were thereforechosen as the power source, as they are reliable, howeverthey eventually run out and need to be replaced andcharged. To aviod unnecassary power consumption, thesystem is set to stand-by during the night and automaticallyrestarted the next morning.
The lifetime of average car batteries are highly reducedwhen they are drained, which would be the case in thesystem setup. Deep cycling batteries are therefore preferable,as they are designed to cope with this kind of treatment.
The system is a work in progress, and it was chosen to useDC/AC converters, as a part of the power source, for moreflexibility. This ensures easy expansion if other equipmentwere to be used at a later stage, however it also introducesa loss in efficiency. The chosen converter has an efficiencyof 90%.
The overall power consumption of the system is 60 W,and with a 90% efficiency. The minimum uptime must be36 hours, which requires batteries of approximately 200 Ah(two 95 Ah were chosen), however this is derived from the
System componentsComponent Details
Battery 12 VDeep Cycling
DC/AC converter Sine waveconverter
uEye Camera UI-1245LE-C Lens: 6 mm640 x 480
Harddrive 3 TB3G connection 5 MBSennheiser MKE 400 Microphone Shotgun
Asus Eee Laptop 1.6 Ghz1 Gb memory
Table ITABLE OF SYSTEM COMPONENTS USED IN THE SETUP
worst case power consumption scenario and without theplanned stand-by hours.
To preserve quality in the audio recording a directionalshotgun microphone, with wind reduction filter was chosen.For the connection, a 10 m long multiple shielded audioextension cable is being used, which enables differentplacement of the microphone.
The high frame rates are provided by the chosen camera,which enables 20 − 30 fps depending on the resolutionof the image. The camera uses a global shutter, whichreduces blurring caused by movements. It is powered viathe USB connection, which is also used for data transfer.The recorded images are not compressed, which requiresa high capacity harddrive. The SSD technology would bepreferable, because of the low power consumption, howeverdue to dollar/GB, this was not chosen for the system.
For remote connection, a 3G connection was chosen.Due to lack of coverage, this solution can potentially leadto loss of connection, however the location chosen for therecording had good 3G coverage. A lack of coverage wouldnot be vital for the recordings, however remote accesswould be affected. A list of the specific items used in thissetup can be seen in table III.
IV. INFRASTRUCTURE AND DATA DESCRIPTION
The main purpose of the system is to record and storelarge amounts of data. In Figure 2 an overview of the dataflow and connections are shown. With a frame rate of 20fps, an image is captured from the camera and stored on theexternal harddrive. Meanwhile an audio file is saved on theharddrive every 5 minutes. This is accomplished by a loop-recording software, which increments filenames and recordswhile storing the files. The audio recordings were done witha sample rate of 44.1kHz and 16 bit resolution, which isthe default settings of the loop-recording software.
The images captured from the camera, are stored as theraw bayer pattern. This reduced the file size (from 900 kb to
132Copyright (c) IARIA, 2011. ISBN: 978-1-61208-174-8
EMERGING 2011 : The Third International Conference on Emerging Network Intelligence
139 / 141
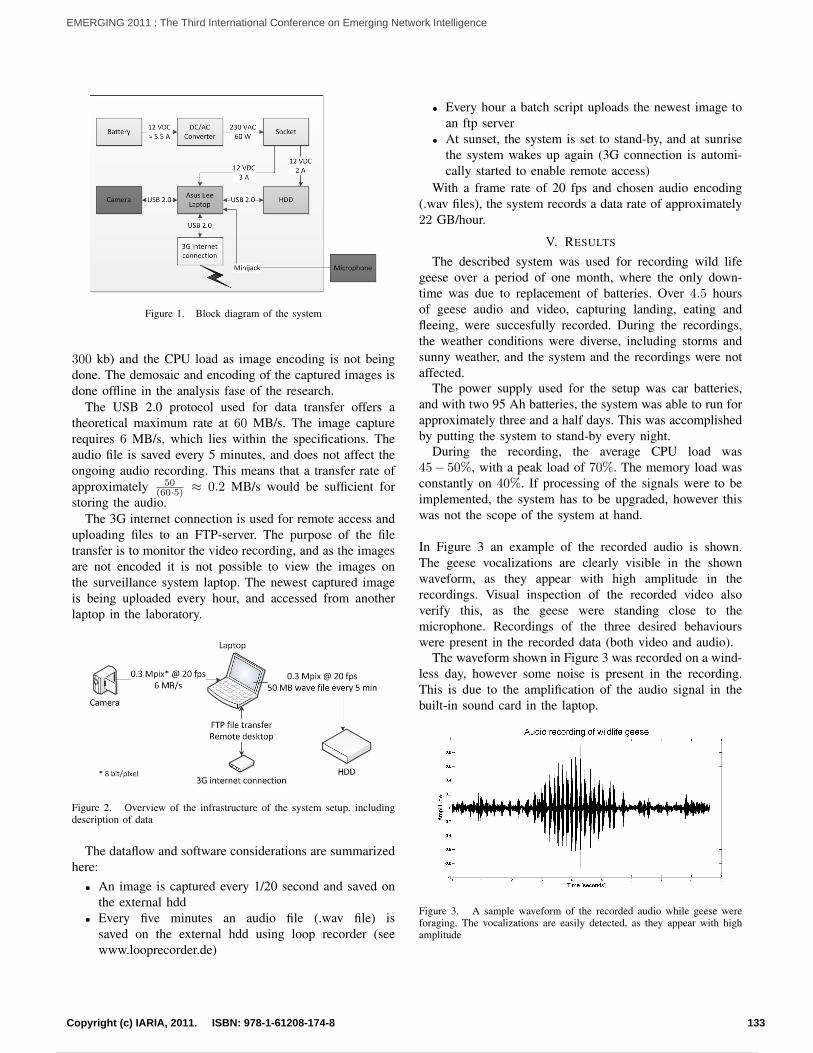
Figure 1. Block diagram of the system
300 kb) and the CPU load as image encoding is not beingdone. The demosaic and encoding of the captured images isdone offline in the analysis fase of the research.
The USB 2.0 protocol used for data transfer offers atheoretical maximum rate at 60 MB/s. The image capturerequires 6 MB/s, which lies within the specifications. Theaudio file is saved every 5 minutes, and does not affect theongoing audio recording. This means that a transfer rate ofapproximately 50
(60·5) ≈ 0.2 MB/s would be sufficient forstoring the audio.
The 3G internet connection is used for remote access anduploading files to an FTP-server. The purpose of the filetransfer is to monitor the video recording, and as the imagesare not encoded it is not possible to view the images onthe surveillance system laptop. The newest captured imageis being uploaded every hour, and accessed from anotherlaptop in the laboratory.
Figure 2. Overview of the infrastructure of the system setup, includingdescription of data
The dataflow and software considerations are summarizedhere:
• An image is captured every 1/20 second and saved onthe external hdd
• Every five minutes an audio file (.wav file) issaved on the external hdd using loop recorder (seewww.looprecorder.de)
• Every hour a batch script uploads the newest image toan ftp server
• At sunset, the system is set to stand-by, and at sunrisethe system wakes up again (3G connection is automi-cally started to enable remote access)
With a frame rate of 20 fps and chosen audio encoding(.wav files), the system records a data rate of approximately22 GB/hour.
V. RESULTS
The described system was used for recording wild lifegeese over a period of one month, where the only down-time was due to replacement of batteries. Over 4.5 hoursof geese audio and video, capturing landing, eating andfleeing, were succesfully recorded. During the recordings,the weather conditions were diverse, including storms andsunny weather, and the system and the recordings were notaffected.
The power supply used for the setup was car batteries,and with two 95 Ah batteries, the system was able to run forapproximately three and a half days. This was accomplishedby putting the system to stand-by every night.
During the recording, the average CPU load was45− 50%, with a peak load of 70%. The memory load wasconstantly on 40%. If processing of the signals were to beimplemented, the system has to be upgraded, however thiswas not the scope of the system at hand.
In Figure 3 an example of the recorded audio is shown.The geese vocalizations are clearly visible in the shownwaveform, as they appear with high amplitude in therecordings. Visual inspection of the recorded video alsoverify this, as the geese were standing close to themicrophone. Recordings of the three desired behaviourswere present in the recorded data (both video and audio).
The waveform shown in Figure 3 was recorded on a wind-less day, however some noise is present in the recording.This is due to the amplification of the audio signal in thebuilt-in sound card in the laptop.
Figure 3. A sample waveform of the recorded audio while geese wereforaging. The vocalizations are easily detected, as they appear with highamplitude
133Copyright (c) IARIA, 2011. ISBN: 978-1-61208-174-8
EMERGING 2011 : The Third International Conference on Emerging Network Intelligence
140 / 141

VI. DISCUSSION
As mentioned in the results section, the chosen laptopcannot be used if processing of the recorded audio orvideo were to be done, which will be a part of furtherdevelopment of the system. A laptop with more memoryand a faster CPU is desirable. Other limitations with thechosen laptop, are the frame rate and resolution of theimages. The camera supports both higher frame rates andhigher resolution, and a faster laptop could increase bothwithout over-burdening the CPU.
The overall power consumption was reduced by setting thesystem to stand-by at nighttime. Another approach couldbe to trigger the recording, and only record when animalsare present. This was not chosen as a loss of usefull data,due to potential trigger errors, could delay the furtherresearch. However a suggested modification could be to usea computer vision approach to trigger the recording.
The microphone used in the experiment, was a directionalshotgun microphone. Another approach could be parabolicmicrophones, which are directional and amplify the soundbefore the digitizing of the audio. This was not used in thisrecording due to the physical size of the microphone.
Some noise is present in the recordings, even on windlessdays. This is due to the low quality sound card in the laptop,and an external sound card or a microphone amplifier couldprovide a better quality recording, however the vocalizationswere clear in the recordings. A spectrogram analysis of therecorded vocalizations have shown that all information inthe geese vocalizations is within 10 kHz, which means thatsample rate could be reduced, which is preferable if moreprocessing were to be performed in the system.
The remote access allowed for adjustments of audioand video recording, however aperture could not beadjusted as this must be done manually. Adjustments werenot made during the recordings, as it was hard to verifythe image quality on the remote access, which was mainlyused to verify the presence of geese.
The recorded data contained examples of the threedesired behaviours: land, eat and take off. Automaticbehaviour recognition research, based on these recordings,could lead to a system capable of reducing habituation,as scaring mechanism could be targeted towards specificbehaviours or species.
Even though the system was used for a specific scenario,it is applicable to other wildlife studies where audio andvideo material is essential. It is designed to cope withdifferent weather conditions and the remote access makesit possible to verify recordings.
VII. CONCLUSION
Based on the described system setup, it was possibleto record geese in order to analyze the link betweentheir vocalizations and behaviour. The geese quickly grewaccustomed to the setup, and only two days after theinstallation of the system, the geese landed and foraged.
Data provided by the described system is a part ofongoing research to automatically recognize animalbehaviour based on audio and video recordings. The resultsof this research are to be tested using a modfication of thedescibed system, where both audio and video processingwill be a part of the system.
ACKNOWLEDGMENT
We would like to thank Morten Laursen for contributingto the overall design, and I would also like to thank EsbenRasmussen and Claus Andersen for support in developingthe imaging capture software.
REFERENCES
[1] Seppo Fagerlund. Bird Species Recognition Using SupportVector Machines. EURASIP Journal on Advances in SignalProcessing, 2007:1–9, 2007.
[2] Jason M Gilsdorf, Scott E Hygnstrom, and Kurt C Vercauteren.Use of frightening devices in wildlife damage management.Integrated Pest Management Reviews, 7(1):29–45, 2002.
[3] Roman Gula, Jorn Theuerkauf, Sophie Rouys, and AndrewLegault. An audio / video surveillance system for wildlife.European Journal of Wildlife Research, 56(5):803–807, 2010.
[4] Andrea M. Kleist, Richard A. Lancia, and Phillip D. Doerr. Us-ing Video Surveillance to Estimate Wildlife Use of a HighwayUnderpass. Journal of Wildlife Management, 71(8):2792–2800,2007.
[5] C Lee, C Chou, C Han, and R Huang. Automatic recognitionof animal vocalizations using averaged MFCC and lineardiscriminant analysis. Pattern Recognition Letters, 27(2):93–101, January 2006.
[6] Maja Matetic, Slobodan Ribaric, and Ivo Ipsic. QualitativeModelling and Analysis of Animal Behaviour. Applied Intel-ligence, 21(1):25–44, July 2004.
[7] Vlad M Trifa, Alexander N G Kirschel, Charles E Taylor, andEdgar E Vallejo. Automated species recognition of antbirdsin a Mexican rainforest using hidden Markov models. TheJournal of the Acoustical Society of America, 123(4):2424–31,April 2008.
[8] D. Tweed and A. Calway. Tracking multiple animals in wildlifefootage. In Proceedings of the 16th International Conferenceon Pattern Recognition, pages 24–27. IEEE Comput. Soc,2002.
[9] S Ward, C M Bishop, a J Woakes, and P J Butler. Heart rate andthe rate of oxygen consumption of flying and walking barnaclegeese (Branta leucopsis) and bar-headed geese (Anser indicus).The Journal of experimental biology, 205(Pt 21):3347–56,November 2002.
134Copyright (c) IARIA, 2011. ISBN: 978-1-61208-174-8
EMERGING 2011 : The Third International Conference on Emerging Network Intelligence
Powered by TCPDF (www.tcpdf.org)
141 / 141