proceedings - rp2u unsyiah
TRANSCRIPT
PROCEEDINGSEditors:
unardiawati Cahyani
ul Iftitahan
ICEO 2019Proceedings of the
2nd International Conference ofEssential Oils
Banda Aceh - Indonesia
October 29 - 30, 2019
Copyright © 2020 by SCITEPRESS – Science and Technology Publications, Lda.All rights reserved
Edited by
Yunardi1,2, Chandrawati Cahyani3,4, Hesti Meilina1,2, Elvina Dhiaul Iftitah4,5 and Khairan2,6
1Chemical Engineering Department, Syiah Kuala University, Indonesia2Atsiri Research Center, Syiah Kuala University, Indonesia
3Chemical Engineering Department, Brawijaya University, Indonesia4Atsiri Institute, Brawijaya University, Indonesia
5Department of Chemistry, Brawijaya University, Indonesia6Department of Pharmacy, Syiah Kuala University, Indonesia
Printed in Portugal
ISBN: 978-989-758-456-5
Depósito Legal: 471682/20
http://iceo.ub.ac.id

BRIEF CONTENTS
INVITED SPEAKERS . . . . . . . . . . . . . . . . . . . . . . . . . . . . . . . . . . . . . . . . . . . . . . . . . . . . . . . . . . . . . . . . . . . . . . . . . . IV
ORGANIZING COMMITTEES . . . . . . . . . . . . . . . . . . . . . . . . . . . . . . . . . . . . . . . . . . . . . . . . . . . . . . . . . . . . . . . . . . . . V
SCIENTIFIC COMMITTEE . . . . . . . . . . . . . . . . . . . . . . . . . . . . . . . . . . . . . . . . . . . . . . . . . . . . . . . . . . . . . . . . . . . . . . VI
FOREWORD . . . . . . . . . . . . . . . . . . . . . . . . . . . . . . . . . . . . . . . . . . . . . . . . . . . . . . . . . . . . . . . . . . . . . . . . . . . . . . . . . . IX
CONTENTS . . . . . . . . . . . . . . . . . . . . . . . . . . . . . . . . . . . . . . . . . . . . . . . . . . . . . . . . . . . . . . . . . . . . . . . . . . . . . . . . . . . XI
III

INVITED SPEAKERSProf. Dr. Ibrahim Jantan
Taylor’s UniversityMalaysia
Prof. Tohru MitsunagaGifu University
Japan
Prof. Chandrawati CahyaniBrawijaya University
Indonesia
IV
ORGANIZING COMMITTEES
CONFERENCE CHAIR
Dr. Yunardi, Chemical Engineering Department, Syiah Kuala University, Indonesia
CONFERENCE CO-CHAIR
Dr. Ir. Rina Sriwati, M.Si, Syiah Kuala University, Indonesia
SECRETARIAT
Yasser Premana, Atsiri Reasearch Center, Syiah Kuala University, Indonesia
STEERING COMMITTEE
Prof. Samsul Rizal, Syiah Kuala University, Indonesia
Prof. Taufik Fuadi Abidin, Syiah Kuala University, Indonesia
Dr. Agussabti, Syiah Kuala University, Indonesia
Dr. Hizir, Syiah Kuala University, Indonesia
Dr. Syaifullah Muhammad, Atsiri Research Center, Syiah Kuala University, Indonesia
PUBLICITY
Wahyu Rinaldi, ST, M. Sc, Syiah Kuala University, Indonesia
Ismi Radhiallah Yaqut, ST, Syiah Kuala University, Indonesia
EXHIBITION
Suraiya Kamaruzzaman, ST., LLM., MT, Syiah Kuala University, Indonesia
Dr. Rer.Nat.Khairan, S.Si, M.Si, Syiah Kuala University, Indonesia
TREASURER
Dr. Hesti Melina, ST. M.Si, Syiah Kuala University, Indonesia
V
SCIENTIFIC COMMITTEE
NATIONAL SCIENTIFIC COMMITTEE
Prof. Dr. Mahfud, Department of ChemicalEngineering, Sepuluh Nopember Institute ofTechnology, Surabaya, Indonesia
Prof. Dr. Edy Cahyono, Department of Chemistry,State University of Semarang, Semarang, Indonesia
Prof. Dr. Novizar Nazir, Faculty of AgriculturalTechnology, Andalas University, Padang, Indonesia
Dr. Warsito, Department of Chemistry, BrawijayaUniversity, Malang, Indonesia
Dr.rer.nat. Triana Hertiani, Department ofPharmaceutical Biology, Faculty of Pharmacy,Gadjah Mada University, Jogjakarta, Indonesia
Dr. Rina Sriwati, Department of Plant Protection,Syiah Kuala University, Banda Aceh, Indonesia
Dr. Elvina Dhiaul Iftitah, Department ofChemistry, Brawijaya University, Malang,IndonesiaDr. Harlinda Kuspradini, Faculty of Forestry,Mulawarman University, Samarinda, Indonesia
Dr. Jauharlina, Department of Plant Protection,Syiah Kuala University, Banda Aceh, Indonesia
Dr. Edi Priyo Utomo, Department of Chemistry,Brawijaya University, Malang, Indonesia
Dr. Hesti Meilina, Department of ChemicalEngineering, Syiah Kuala University, Banda Aceh,Indonesia
Dr. Sukardi, Department of AgroindustialTechnology, Brawijaya University, Malang,IndonesiaDr. Nurdin, Department of Chemistry, Syiah KualaUniversity, Banda Aceh, Indonesia
Dr. Wahyu Widoretno, Department of Biology,Brawijaya University, Malang, Indonesia
Dr.rer.nat. Khairan, Head of Herbal MedicineResearch Center, Syiah Kuala University, BandaAceh, Indonesia
Dr. Wayan Firdaus Mahmudy, Faculty ofComputer Science, Brawijaya University, Malang,IndonesiaDr. Betty Mauliya Bustam, Department ofBiology, Syiah Kuala University, Banda Aceh,IndonesiaDr. Achmad Basuki, Faculty of Computer Science,Brawijaya University, Malang, Indonesia
Dr. Irmanida Batubara, Department of Chemistry,Bogor Agricultural University, Bogor, Indonesia
Dr. Bambang Dwi Argo, Department ofBioprocess Technology, Brawijaya University,Malang, Indonesia
Dr. Molide Rizal, Research Institute for Spices andMedicinal Crops, Ministry of Agriculture, Bogor,Indonesia
INTERNATIONAL SCIENTIFIC COMMITTEE
Prof. Dr. Maria Nicoletta Ravasio, NationalResearch Council Italy, CNR ISTM, Italy
Prof. Dr. Chin Hang Shu, National CentralUniversity, Taoyuan City, Taiwan
Prof. Dr. Philip Marriott, Monash University,Australia
Dr. Prabodh Satyal, Chief Scientific Officer,Aromatic Plant Research Center, Lehi, UT, USA
Prof. Dr. Tatik Wardiyati, Faculty of Agriculture,Brawijaya University, Malang, Indonesia
Dr. Marilú Roxana Soto Vásquez, Facultad deFarmacia y Bioquímica, Universidad Nacional deTrujillo, Peru
Prof. Dr. Priyani A. Paranagama, Director,Institute of Indigenous Medicine, University ofColombo, Colombo, Sri Lanka
Prof. Dr. Tati Suryati Syamsudin, School ofLife Sciences and Technology, Bandung Institute ofTechnology, Bandung, Indonesia
VI
Asst. Prof. Dr. Patcharee Pripdeevech, Schoolof Science, Mae Fah Luang University, Chiang Rai,ThailandProf. Dr. Shafique Ahmed Arain, Director ofInstitute of Chemistry, Shah Abdul Latif University,Khairpur, Pakistan
Prof. Dr. Noor Fitrah Abu Bakar, Facultyof Chemical Engineering, Universiti TeknologiMARA, UiTM, Shah Alam, Malaysia
Dr. Chutimon Satirapipathkul, ChemicalEngineering Department, ChulalongkornUniversity, Bangkok, Thailand
Assoc. Prof. Dr. Abdullah T. Al-fawwaz,Department of Biological Sciences, Al al-BaytUniversity, Mafraq, Jordan
Prof. Dr. C. Hanny Wijaya, Department ofFood Science and Technology, Bogor AgriculturalUniversity, Bogor, Indonesia
Dr. Wichitra Singhirunnusorn, MultidisciplinaryResearch Center for Environmental Sustainability,MRCES, Mahasarakham University, Thailand
VII

FOREWORD
It is a great privilege for us to present to you the 2nd International Conference of Essential Oils Indonesia(ICEO 2019). We hope that you will find it useful, exciting and inspiring. The 2nd ICEO 2019 taking placein Banda Aceh, Indonesia during 29-30 October 2019 was organized by the Essential Oil Research Centerof Syiah Kuala University (ARC-UNSYIAH) Banda Aceh, Indonesia in cooperation with the Essential OilInstitute of Brawijaya University (AI-UB), Malang, East Java, Indonesia. With the theme “Improvementof Quality Through Standardization of Raw Material, Processes and Essential Oil Products”, this eventserved as a platform researchers academician, and practitioners in the field of essential oils to meet, interact,discus and exchange of new developments and research findings, and develop new networking for futurecollaborations.
The conference was attended by more than 100 participants coming from Indonesia and overseas. Thekeynote speakers were internationally acclaimed professors from Japan, Malaysia and Indonesia. The tech-nical presenters are well-respected researchers from universities in Indonesia and ASEAN. The organizingcommittee received 83 papers submitted by prospective authors of which after reviewed, only 56 paperswere accepted for presentation at the venue of the conference.
The conference proceedings consisting papers which went further reviewed by the Scientific Committee.After a rigorous review process, out of submitted papers to the organizing committee, only 40 percentaccepted for the publication in the conference proceedings. Through this online proceedings, we are sharingwith you the papers from the 2nd ICEO 2019. We hope that you will find it useful, exciting and inspiring.
We would like to express our deep gratitude to all the authors for their contribution and support to theconference as well as to the proceedings and also to the keynote speakers, organizing committee members,reviewers, chairpersons, volunteers, sponsors and all participants who have made the event of the 2nd ICEO2019 a success.
Dr. YunardiChairman of the 2nd ICEO 2019Chemical Engineering DepartmentSyiah Kuala University, Banda Aceh, Indonesia
IX

CONTENTS
PAPERS
FULL PAPERS
The Medical Benefits of Vetiver Essential OilHandi Suyono and Deby Susanti 5
Effect of 10% Lavender Essential Oil Balm on Serum Cortisol Levels in Male Wistar RatsChristian Jaya Sumarto Putra 9
Effect of Essential Oil of Cedarwood (Cedrus Atlantica) against Serum Cortisol Levels in Rats WhichWere Given StressorJose Giovanny
14
Hybrid of Wavelet Feature Extraction and LVQ Neural Network to Recognize Patchouli Variety usingLeaf ImagesCandra Dewi
18
Release Profile of the Antimicrobial Agent from Clove Oil Encapsulated in a Polyurethane ShellChicha Nuraeni, Dwinna Rahmi, Retno Yunilawati, Emmy Ratnawati, Tiara Mailisa, Trisny Andrianty,Irwinanita, Bunda Amalia and Arief Riyanto
25
Lactonization Castor Oil (Ricinus Communis) using Lipase B from Candida Antarctica RecombinedAspergillus oryzae as BioflavorGaluh Alya Stywarni, Elvina Dhiaul Iftitah and Arie Srihardyastutie
33
Method Development for Analysis of Essential Oils Authenticity using Gas Chromatography-MassSpectrometry (GC-MS)Novi Nur Aidha, Retno Yunilawati and Irma Rumondang
37
Stick Perfume Formulation from Jeumpa Flowers (Magnolia champaca (L) Baill Ex. Pierre)Hilda Maysarah, Irma Sari, Meutia Faradilla and Edrina Elfia Rosa 43
Antimicrobial Effect of Concord Paper Containing with Lemongrass Oil against Escherichia coli andStaphylococcus aureusBunda Amalia, Retno Yunilawati, Windri Handayani, Agustina Arianita C. and Cuk Imawan
50
Simple Antimicrobial Labels from Cinnamon Oil Added to Recycled PaperAgustina Arianita Cahyaningtyas, Retno Yunilawati, Bunda Amalia, Windri Handayani andCuk Imawan
56
Patchouli (Pogostemon cablin Benth): Chemistry, Biology, and Anti-inflammatory Activities: AReviewKhairan, Syaifullah Muhammad and Muhammad Diah
63
Conjugation Reaction between Citronellal and L-Tyrosine and Its Antimicrobial Properties againstBacteria and FungiRila Suryani, Nazaruddin Nazaruddin, Kartini Hasballah, Muhammad Diah, Hardi Yusuf, Juniarti,Syaifullah Muhammad and Khairan
70
Effect of the Fractional Distillation on an Increment Patchouli Alcohol Content in Patchouli OilYuliani Aisyah, Sri Haryani Anwar and Yulia Annisa 76
XI
Characterization of Seedlac Hydrolysis from Kesambi (Schleicera oleosa Merr) as an IntermediateCompound for Fragrance SynthesisRetno Yunilawati, Dwinna Rahmi, Chicha Nuraeni, Arief Riyanto, Novinci Muharyani,Pujo Sumantoro, Murgunadi and Nur Hidayati
82
Separation Process of Citronellal and Rhodinol from Citronella Oil using Vacuum Fractionations atPilot Plant ScaleRisna Silvianti, Warsito and Chandrawati Cahyani
87
Soil Nutrient Content Classification for Essential Oil Plants using kNNYoke Kusuma Arbawa and Candra Dewi
92
Eugenol Production from Clove Oil in Pilot Plant Scale for Small and Medium Enterprises (SME)Ali Nurdin
97
Moisturizing Lotion Formulation on Tropical Skin based on Cananga Oil (Cananga odorata), KaffirLime Oil (Citrus hystrix DC) and Patchouli Oil (Pogostemon cablin) as a BioactiveVivi Nurhadianty, Indah Amalia Amri, Safira Kanza, Luh Putu Maharani and Chandrawati Cahyani
102
Quality Characteristics and Antibacterial Activity of Transparent Solid Soap with Addition of CanangaOil (Cananga odorata)Rulita Maulidya, Yuliani Aisyah and Dewi Yunita
108
Evaluation of Antibacterial and Antioxidant Effects of Mix Essential Oil for Oral Health CareJuniarti, Moch Abdussalam, Indah Permata Yuda and Indra Kusuma 115
Esterification of Rhodinol Fraction with Acetic Anhydride using Zeolite CatalystGadis Dian Anggreini, Mafud Cahayo, Masruri and Warsito 119
The Effect of NAA Concentration and Different Parts of Stem on Growth of Patchouli (Pogostemoncablin Benth.)Mardhiah Hayati, Nurhayati and Revira Sari
123
Perception of Patchouli Farmers on the Development of the Innovation Cluster in Panga, Aceh JayaRegencyM. Y. Wardhana, I. Indra and D. Andriani
130
Wild Andaliman (Zanthoxylum acanthopodium DC.) Varieties as an Aromatic Plants from NorthSumateraEndang Kintamani, Cecep Kusmana, Tatang Tiryana, Irmanida Batubara and Edi Mirmanto
136
Antimicrobial Label from Lemongrass Oil Incorporated with Chitosan/Ascorbic AcidRetno Yunilawati, Windri Handayani, Agustina Arianita C., Bunda Amalia and Cuk Imawan 143
The Antibacterial Effect from Combining Cinnamon, Patchouli and Coriander Essential OilsWindri Handayani, Retno Yunilawati and Cuk Imawan 149
The Effects of Colchicine Concentration and Length of Immersion on Cutting Growth of Patchouli(Pogostemon cablin Benth)Zuyasna, Andre and Siti Hafsah
155
Synthesis of Rhodinol Ester from Citronella Oil Reduction ProductAli Nurdin and Retno Yunilawati
161
AUTHOR INDEX 167
XII

PAPERS


FULL PAPERS

The Medical Benefits of Vetiver Essential Oil
Handi Suyono1 and Deby Susanti2 1Faculty of Medicine, Widya Mandala Surabaya Catholic University, Pakuwon City Campus, Jalan Kalisari Selatan no.1
Pakuwon City, Surabaya, East Java, Indonesia 2Private Medical Practice, Aesthetic Medicine, Surabaya, East Java, Indonesia
Keywords: Vetiver Essential Oil. essential oil, toxicity, carcinogenic, treatment
Abstract: Vetiver essential oil (VEO) has been used century ago for religious and medical purposes. Vetiver plants are
cultivated in tropical and subtropical countries. VEO contains sesquiterpenes compounds. VEO can be
applied to treat neurological, psychiatric, dermatological, and musculoskeletal disorders. VEO has low
toxicity and no carcinogenic effect. VEO has some pharmacological mechanism in medical treatments. The
possible mechanisms are gamma aminobutyric acid (GABA) potentiation, antioxidant, antiinflammation,
anti-stress, tissues regeneration, anti-microbe, and cytotoxic against cancer. VEO can be applied as topical
and oral treatment.
1 INTRODUCTION
Vetiver essential oil (VEO) has been used century
ago in north India then spreading to Southeast Asia,
China, Middle East, West Africa, and Europe. VEO
is used for religious and medical purposes (Maffei,
2002). VEO is made from distillation process of
Vetiver plant (Vetiveria zizanioides). Vetiver plant
in Indonesia is known as akar wangi or narwastu.
Vetiver plants have been cultivated in Java island,
especially West Java region. Indonesia is the top
rank 3 producer in the world, after India and Haiti.
VEO has fragrant odour and pharmacological
effects. Several studies report the effect of VEO as
antioxidant, anti-inflammatory, anti-microbe, and
neuroendocrine modulator. VEO has high economic
value, because its property is not only for fragrance
but for medicine. This paper will discuss the benefits
of VEO for human health and the pharmacological
mechanisms.
2.1 The History of Vetiver Plant and Essential Oil
The origin of Vetiver plant is north India. It is called
Khas Khas. There are several names in Sanskrit,
namely Virana, Lamajjaka, Lamaja, Bala, or
Turushka-danda (turushka = fragrant compound,
danda = stem). Vetiver plant is known as
Saewaendara or Vettyveer in Sri Lanka. Vetiver
plants were spread from Sri Lanka to Europe then
called Vetiver until now. Vetiver plants are
cultivated in tropical and subtropical countries, e.g.
Southeast Asia (Indonesia, Malaysia, Burma,
Thailand, Laos, Philippines), China (south region),
Middle East (Iran), Africa (Nigeria, Ethiopia,
Ghana, Senegal, Sierra Leone, Reunion, South
Africa, Zambia, Zimbabwe), South America (Puerto
Rico, Haiti, Costa Rica, Honduras, Guatemala,
Mexico) (Maffei, 2002). Vetiver is called as akar
wangi, laraseta, or usar in Indonesia. Botanical name
of Vetiver is Vetiveria zizanioides (L.) Nash,
Andropogon muricatus (Retz), Andropogon
zizanioides (L.) Urban, Chrysopogon zizanioides
(L.) Roberty, or Phalaris zizanioides L. (Tisserand
and Young, 2014).
The root and leaf (stem) of Vetiver plant have
some benefits. The root is proceeding to produce
essential oil. The raw root has benefits as room or
container fragrance and bio pesticide. The leaf
(stem) can be used for animal food and handicraft.
The Vetiver plants are useful in soil erosion
prevention, soil conservation and restoration. The
root of Vetiver reach until 2 m in depth. The main
producers in the world are India, Haiti, and
Indonesia, however the best quality are from
Reunion and Haiti (Maffei, 2002).
VEO has been used on Ayurveda medicine in
South Asia (India, Pakistan, Sri Lanka, Nepal). VEO
used into religious purposes because it was belief to
Suyono, H. and Susanti, D.The Medical Benefits of Vetiver Essential Oil.In Proceedings of the 2nd International Conference of Essential Oils (ICEO 2019), pages 5-8ISBN: 978-989-758-456-5Copyright © 2020 by SCITEPRESS – Science and Technology Publications, Lda. All rights reserved
5
avoid evil and its fragrance has relaxing effect in
praying. Traditional medicine used VEO to draw out
evil from sick person. The root of Vetiver was
stirred and drunk as treatment for fever, digestive
illness, and diarrhoea. VEO was rubbed onto skin to
treat burn wound (Maffei, 2002).
2.2 Vetiver Essential Oil Characteristics
VEO contains sesquiterpenes and hydrocarbon
compounds. Sesquiterpenes precursor is farnesyl
diphosphate. Basic structure sesquiterpene consist of
15 atoms carbon. Sesquiterpenes have large
molecules and less volatile. Hydrocarbons are
hydrophobic (Tisserand and Young, 2014). VEO
contains more than 75 sesquiterpenes, namely
monocyclic sesquiterpenes, bicyclic sesquiterpenes,
tricyclic sesquiterpenes, and tetracyclic
sesquiterpenes (Maffei, 2002).
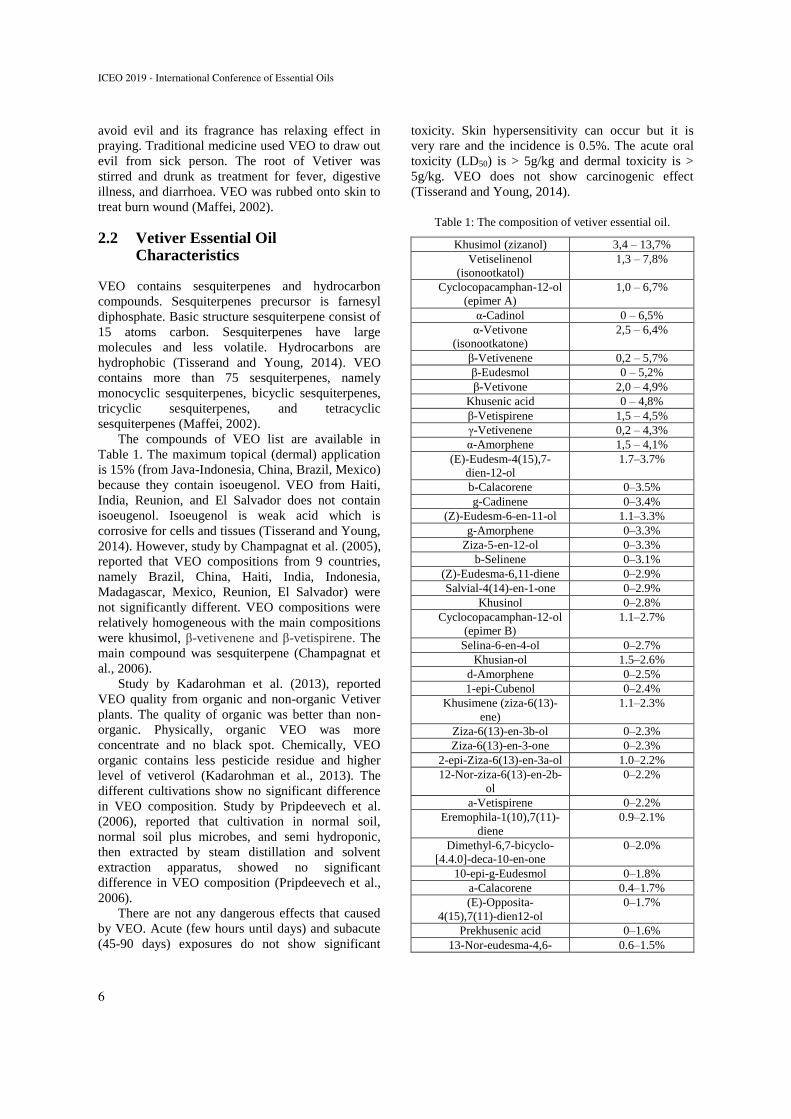
The compounds of VEO list are available in
Table 1. The maximum topical (dermal) application
is 15% (from Java-Indonesia, China, Brazil, Mexico)
because they contain isoeugenol. VEO from Haiti,
India, Reunion, and El Salvador does not contain
isoeugenol. Isoeugenol is weak acid which is
corrosive for cells and tissues (Tisserand and Young,
2014). However, study by Champagnat et al. (2005),
reported that VEO compositions from 9 countries,
namely Brazil, China, Haiti, India, Indonesia,
Madagascar, Mexico, Reunion, El Salvador) were
not significantly different. VEO compositions were
relatively homogeneous with the main compositions
were khusimol, β-vetivenene and β-vetispirene. The
main compound was sesquiterpene (Champagnat et
al., 2006).
Study by Kadarohman et al. (2013), reported
VEO quality from organic and non-organic Vetiver
plants. The quality of organic was better than non-
organic. Physically, organic VEO was more
concentrate and no black spot. Chemically, VEO
organic contains less pesticide residue and higher
level of vetiverol (Kadarohman et al., 2013). The
different cultivations show no significant difference
in VEO composition. Study by Pripdeevech et al.
(2006), reported that cultivation in normal soil,
normal soil plus microbes, and semi hydroponic,
then extracted by steam distillation and solvent
extraction apparatus, showed no significant
difference in VEO composition (Pripdeevech et al.,
2006).
There are not any dangerous effects that caused
by VEO. Acute (few hours until days) and subacute
(45-90 days) exposures do not show significant
toxicity. Skin hypersensitivity can occur but it is
very rare and the incidence is 0.5%. The acute oral
toxicity (LD50) is > 5g/kg and dermal toxicity is >
5g/kg. VEO does not show carcinogenic effect
(Tisserand and Young, 2014).
Table 1: The composition of vetiver essential oil.
Khusimol (zizanol) 3,4 – 13,7%
Vetiselinenol
(isonootkatol)
1,3 – 7,8%
Cyclocopacamphan-12-ol
(epimer A)
1,0 – 6,7%
α-Cadinol 0 – 6,5%
α-Vetivone
(isonootkatone)
2,5 – 6,4%
β-Vetivenene 0,2 – 5,7%
β-Eudesmol 0 – 5,2%
β-Vetivone 2,0 – 4,9%
Khusenic acid 0 – 4,8%
β-Vetispirene 1,5 – 4,5%
γ-Vetivenene 0,2 – 4,3%
α-Amorphene 1,5 – 4,1%
(E)-Eudesm-4(15),7-
dien-12-ol
1.7–3.7%
b-Calacorene 0–3.5%
g-Cadinene 0–3.4%
(Z)-Eudesm-6-en-11-ol 1.1–3.3%
g-Amorphene 0–3.3%
Ziza-5-en-12-ol 0–3.3%
b-Selinene 0–3.1%
(Z)-Eudesma-6,11-diene 0–2.9%
Salvial-4(14)-en-1-one 0–2.9%
Khusinol 0–2.8%
Cyclocopacamphan-12-ol
(epimer B)
1.1–2.7%
Selina-6-en-4-ol 0–2.7%
Khusian-ol 1.5–2.6%
d-Amorphene 0–2.5%
1-epi-Cubenol 0–2.4%
Khusimene (ziza-6(13)-
ene)
1.1–2.3%
Ziza-6(13)-en-3b-ol 0–2.3%
Ziza-6(13)-en-3-one 0–2.3%
2-epi-Ziza-6(13)-en-3a-ol 1.0–2.2%
12-Nor-ziza-6(13)-en-2b-
ol
0–2.2%
a-Vetispirene 0–2.2%
Eremophila-1(10),7(11)-
diene
0.9–2.1%
Dimethyl-6,7-bicyclo-
[4.4.0]-deca-10-en-one
0–2.0%
10-epi-g-Eudesmol 0–1.8%
a-Calacorene 0.4–1.7%
(E)-Opposita-
4(15),7(11)-dien12-ol
0–1.7%
Prekhusenic acid 0–1.6%
13-Nor-eudesma-4,6- 0.6–1.5%
ICEO 2019 - International Conference of Essential Oils
6
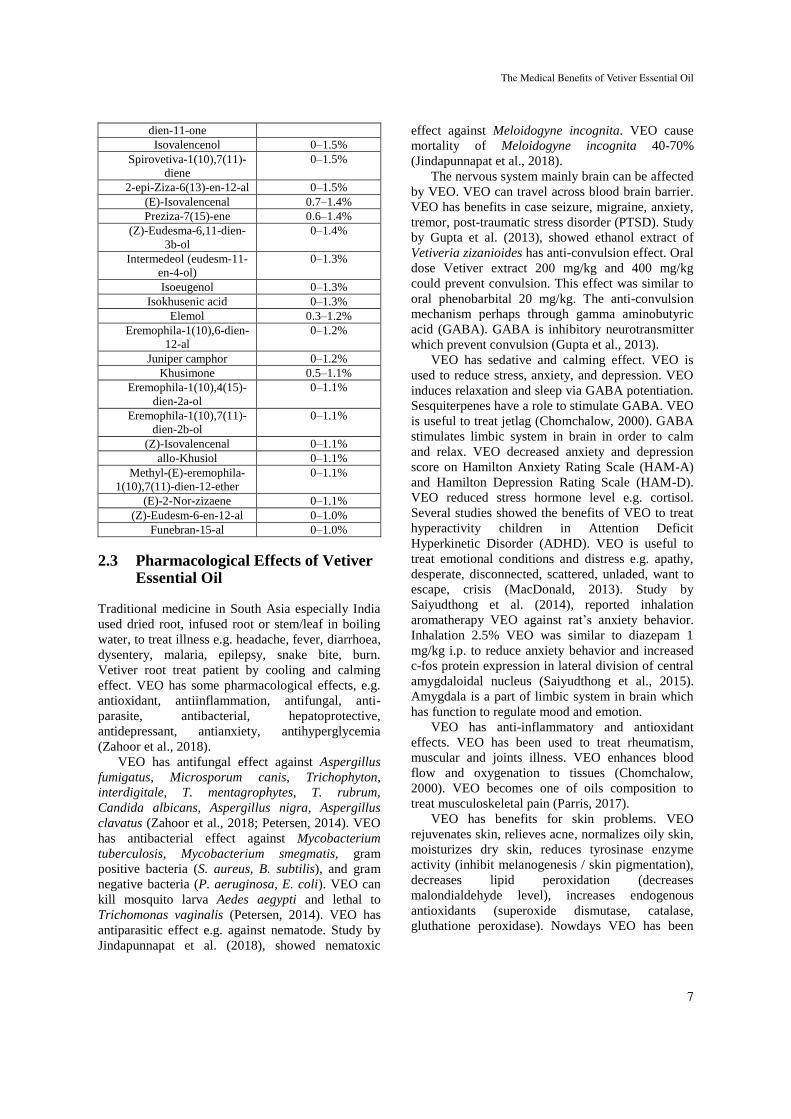
dien-11-one
Isovalencenol 0–1.5%
Spirovetiva-1(10),7(11)-
diene
0–1.5%
2-epi-Ziza-6(13)-en-12-al 0–1.5%
(E)-Isovalencenal 0.7–1.4%
Preziza-7(15)-ene 0.6–1.4%
(Z)-Eudesma-6,11-dien-
3b-ol
0–1.4%
Intermedeol (eudesm-11-
en-4-ol)
0–1.3%
Isoeugenol 0–1.3%
Isokhusenic acid 0–1.3%
Elemol 0.3–1.2%
Eremophila-1(10),6-dien-
12-al
0–1.2%
Juniper camphor 0–1.2%
Khusimone 0.5–1.1%
Eremophila-1(10),4(15)-
dien-2a-ol
0–1.1%
Eremophila-1(10),7(11)-
dien-2b-ol
0–1.1%
(Z)-Isovalencenal 0–1.1%
allo-Khusiol 0–1.1%
Methyl-(E)-eremophila-
1(10),7(11)-dien-12-ether
0–1.1%
(E)-2-Nor-zizaene 0–1.1%
(Z)-Eudesm-6-en-12-al 0–1.0%
Funebran-15-al 0–1.0%
2.3 Pharmacological Effects of Vetiver Essential Oil
Traditional medicine in South Asia especially India
used dried root, infused root or stem/leaf in boiling
water, to treat illness e.g. headache, fever, diarrhoea,
dysentery, malaria, epilepsy, snake bite, burn.
Vetiver root treat patient by cooling and calming
effect. VEO has some pharmacological effects, e.g.
antioxidant, antiinflammation, antifungal, anti-
parasite, antibacterial, hepatoprotective,
antidepressant, antianxiety, antihyperglycemia
(Zahoor et al., 2018).
VEO has antifungal effect against Aspergillus
fumigatus, Microsporum canis, Trichophyton,
interdigitale, T. mentagrophytes, T. rubrum,
Candida albicans, Aspergillus nigra, Aspergillus
clavatus (Zahoor et al., 2018; Petersen, 2014). VEO
has antibacterial effect against Mycobacterium
tuberculosis, Mycobacterium smegmatis, gram
positive bacteria (S. aureus, B. subtilis), and gram
negative bacteria (P. aeruginosa, E. coli). VEO can
kill mosquito larva Aedes aegypti and lethal to
Trichomonas vaginalis (Petersen, 2014). VEO has
antiparasitic effect e.g. against nematode. Study by
Jindapunnapat et al. (2018), showed nematoxic
effect against Meloidogyne incognita. VEO cause
mortality of Meloidogyne incognita 40-70%
(Jindapunnapat et al., 2018).
The nervous system mainly brain can be affected
by VEO. VEO can travel across blood brain barrier.
VEO has benefits in case seizure, migraine, anxiety,
tremor, post-traumatic stress disorder (PTSD). Study
by Gupta et al. (2013), showed ethanol extract of
Vetiveria zizanioides has anti-convulsion effect. Oral
dose Vetiver extract 200 mg/kg and 400 mg/kg
could prevent convulsion. This effect was similar to
oral phenobarbital 20 mg/kg. The anti-convulsion
mechanism perhaps through gamma aminobutyric
acid (GABA). GABA is inhibitory neurotransmitter
which prevent convulsion (Gupta et al., 2013).
VEO has sedative and calming effect. VEO is
used to reduce stress, anxiety, and depression. VEO
induces relaxation and sleep via GABA potentiation.
Sesquiterpenes have a role to stimulate GABA. VEO
is useful to treat jetlag (Chomchalow, 2000). GABA
stimulates limbic system in brain in order to calm
and relax. VEO decreased anxiety and depression
score on Hamilton Anxiety Rating Scale (HAM-A)
and Hamilton Depression Rating Scale (HAM-D).
VEO reduced stress hormone level e.g. cortisol.
Several studies showed the benefits of VEO to treat
hyperactivity children in Attention Deficit
Hyperkinetic Disorder (ADHD). VEO is useful to
treat emotional conditions and distress e.g. apathy,
desperate, disconnected, scattered, unladed, want to
escape, crisis (MacDonald, 2013). Study by
Saiyudthong et al. (2014), reported inhalation
aromatherapy VEO against rat’s anxiety behavior.
Inhalation 2.5% VEO was similar to diazepam 1
mg/kg i.p. to reduce anxiety behavior and increased
c-fos protein expression in lateral division of central
amygdaloidal nucleus (Saiyudthong et al., 2015).
Amygdala is a part of limbic system in brain which
has function to regulate mood and emotion.
VEO has anti-inflammatory and antioxidant
effects. VEO has been used to treat rheumatism,
muscular and joints illness. VEO enhances blood
flow and oxygenation to tissues (Chomchalow,
2000). VEO becomes one of oils composition to
treat musculoskeletal pain (Parris, 2017).
VEO has benefits for skin problems. VEO
rejuvenates skin, relieves acne, normalizes oily skin,
moisturizes dry skin, reduces tyrosinase enzyme
activity (inhibit melanogenesis / skin pigmentation),
decreases lipid peroxidation (decreases
malondialdehyde level), increases endogenous
antioxidants (superoxide dismutase, catalase,
gluthatione peroxidase). Nowdays VEO has been
The Medical Benefits of Vetiver Essential Oil
7
applied to skincare products (Chomchalow, 2000;
Burger et al., 2017; Peng et al., 2014).
VEO is cytotoxic to cancer cells. Study by
Powers et al. (2018), showed the cytotoxic effect of
VEO against breast cancer cells (Powers et al.,
2018). VEO also had cytotoxic effect against mouth
epidermal carcinoma and colon cancer cells
(Tisserand and Young, 2014). It seems promising,
however it still need further investigations about the
exact mechanisms.
2.3 Potency of Vetiver Essential Oil in Health Industry
VEO has promising role in health or medical
treatment. VEO can be applied in many products e.g.
ointment, balm, cream, shampoo, soap, and
aromatherapy. Indonesia is rank as the third biggest
producer in the world however it needs to improve
high quality, especially to treat smoky burn smell
and pesticide contamination. VEO can be useful for
children until elderly. VEO can be developed as
topical and oral products.
4 CONCLUSIONS
VEO has benefits as antifungal, antibacterial, anti-
parasite, anti-convulsion, sedative, antianxiety,
antidepressant, antioxidant, antiinflammation,
analgesic, skin antiaging, and cytotoxic against
cancer. VEO can be useful in to treat neurological,
psychiatric, dermatological, and musculoskeletal
disorders.
REFERENCES
Burger, P., Landreau, A., Watson, M., Janci, L., Cassisa,
V., Kempf, M., Azoulay, S., Fernandez, X., 2017.
Vetiver Essential Oil in Cosmetics: What is New?
Medicines, 4(41).
Champagnat P., Figueredo G., Chalchat J. C., Carnat A.
P., Bessière J. M., 2006. A Study on the Composition
of Commercial Vetiveria zizanioides Oils from
Different Geographical Origins. Journal of Essential
Oil Research, 18(4).
Chomchalow N., 2000. The Utilization of Vetiver as
Medicinal and Aromatic Plants with Special
References to Thailand. Tech. Bull. No. 2001/1,
PVRN/ORDPB, Bangkok, Thailand.
Gupta R., Sharma K. K., Afzal M., Damanhouri Z. A., Ali
B., Kaur R., Kazmi I., Anwar F., 2013. Anticonvulsant
Activity of Ethanol Extracts of Vetiveria zizanioides
Roots in Experimental Mice. Pharmaceutical Biology,
51(12), 1521-1524.
Jindapunnapat K., Reetz N. D., MacDonald M. H.,
Bhagavathy G., Chinnasri B., Soonthornchareonnon
N., Saanarukkit A., Chauhan K. R., Chitwood D. J.,
Meyer S. L. F., 2018. Activity of Vetiver Extracts and
Essential Oil against Meloidogyne incognita. Journal
of Nematology, 50(2), 147-162.
Kadarohman A., Ratnaningsih E. S., Dwiyanti G., Lela L.
K., Kadarusman E., Ahmad N. F., 2014. Quality and
Chemical Composition of Organic and Non-organic
Vetiver Oil. Indo J. Chem, 14(1), 43-50.
MacDonald D., 2013. Emotions and Essential Oils. A
Modern Resource for Healing Emotional Reference
Guide. Enlighten Alternative Healing. 2nd edition.
Maffei M., 2002. Vetiveria. The Genus Vetiveria. Taylor
and Francis.
Parris W. C. V., 2017. Composition for Musculoskeletal
Pain. US Patent No. 2017/0056464A1.
Peng H. Y., Lai C. C., Lin C. C., Chou S. T., 2014. Effect
of Vetiveria Zizanioides Essential Oil on
Melanogenesis in Melanoma Cells: Downregulation of
Tyrosinase Expression and Suppression of Oxidative
Stress. The Scientific World Journal.
Petersen D., 2014. The Essential Oils of Indonesia.
American College of Healthcare Sciences.
Powers C. N., Osier J. L., McFeeters R. L., Brazell C. B.,
Olsen E. L., Moriarity D. M., Styal P., Setzer W. N.,
2018. Antifungal and Cytotoxicity Activities of Sixty
Comercially-Available Essential Oils. Molecules,
23(1549),1-13.
Pripdeevech P., Wongpornchai S., Promsiri A., 2006.
Highly Volatile Constituents of Vetiver zizanioides
Roots Grown under Different Cultivation Conditions.
Molecules, 11, 817-826.
Saiyudthong S., Pongmayteegul S., Marsden C. A.,
Phansuwan-Pujito P., 2015. Anxiety-like Behaviour
and c-fos Expression in Rats that Inhaled Vetiver
Essential Oil. Natural Product Research, 29(22).
Tisserand R., Young R., 2014. Essential Oil Safety. A
Guide for Health Care Professional. Elsevier, 2nd
edition.
Zahoor S., Shahid S., Fatima U., 2018. Review of
Pharmacological Activities of Vetiveria zizanioides
(Linn) Nash. Journal of Basic and Sciences, 14, 235-
238.
ICEO 2019 - International Conference of Essential Oils
8
Effect of 10% Lavender Essential Oil Balm on Serum Cortisol Levels
in Male Wistar Rats
Christian Jaya Sumarto Putra1 1Institute Faculty of Medicine, Widya Mandala Catholic University Surabaya, Surabaya, Indonesia
Email: [email protected]
Keywords: Lavender, Essential Oil, Balm, Serum Cortisol, Wistar Rat.
Abstract: Lavender (Lavandula angustifolia) is a Mediterranean plant that has developed throughout the world and
often used as aromatherapy for relaxation. Balm is one of the topical drug forms that effective for patients
with very dry skin and has a higher potency and greater drug penetration. Therefore, this study was
conducted to determine the effect of 10% lavender essential oil balm on serum cortisol levels. This study
used 36 male Wistar rats divided into 4 groups (negative control = no stressor; positive control = stressor
only; placebo = stressor + placebo; L1 = stressor + Lavender 10%), the forced swim test was given as the
stressor. Serum cortisol levels were analysed using the Kruskal-Wallis Test (p<0.05) and continued with
the Mann-Whitney Test (p<0,05). The result of the serum cortisol levels analysis showed that 10%
lavender essential oil balm significantly (p=0.007 and p=0.041) decreased the serum cortisol levels in rats
compared to negative control group and positive control group (684.19 ± 54.081 (L1), 712.95 ± 129.589 (C-
), and 728.13 ± 48.125 (C+)). These results indicate that lavender essential oil balm can be used as an
alternative treatment to relieve stress but should be further researched for other biochemical parameters.
1 INTRODUCTION
The incidence of stress is still high in various groups
and professions in the world. According to the World
Health Organization, more than 300 million people
in 2015 suffer from depression and depression is the
leading cause of morbidity and disability in the
world (World Health Organization, 2017). In 2013,
the Indonesian Ministry of Health published Basic
Health Research (Riskesdas) stated that 6% of the
total population in Indonesia experienced emotional
mental disorder (Kementerian Kesehatan, 2013).
Riskesdas Data in 2018 showed that the figure had
increased to 9.8% (Kementerian Kesehatan, 2018).
Untreated stress can lead to various problems.
According to a study conducted by Wada et al.
(2013) stated that high occupational stress exposure
could lead to the onset of depression (Wada et al.,
2013). Furthermore, patients diagnosed with acute
stress reactions had a greater rate for
completed suicide (Gradus et al., 2010). Stress is
a stimulus that evokes the release of ACTH and
adrenal glucocorticoid (Fink, 2016). Stress causes
activation of various physiological responses
especially in the endocrine system, the nervous
system, and the immune system (Contrada and
Baum, 2011). The biological response to stress is
differentiated between acute reaction and chronic
reaction. Acute reaction t r igge r s a rapid release of
noradrenaline and adrenaline through the
sympathetic-medullary-adrenal axis (SMA Axis).
While the chronic reaction activating the
hypothalamic-pituitary-adrenal (HPA Axis) produces
cortisol (Matteri et al., 2000).
Cortisol is a glucocorticoid hormone produced
by the adrenal glands and synthesized from
cholesterol (Silverthorn, 2007). Cortisol levels are
regulated by adrenocorticotropic hormone (ACTH),
which response to corticotropin-releasing hormone
(CRH). Cortisol has widespread action such as
reduces inflammation, suppresses the immune
system, helps the body to manage stress, and
increases blood sugar through gluconeogenesis
(Guyton and Hall, 2016). Serum cortisol levels is
often used as an indicator of stress conditions
(Möstl and Palme, 2002). Forced swim test can be
used as a stressor which stimulate the release of
cortisol hormone (Khaleel Jameel et al., 2014).
Essential oils are a volatile product of a plant that
Jaya Sumarto Putra, C.Effect of 10% Lavender Essential Oil Balm on Serum Cortisol Levels in Male Wistar Rats.In Proceedings of the 2nd International Conference of Essential Oils (ICEO 2019), pages 9-13ISBN: 978-989-758-456-5Copyright © 2020 by SCITEPRESS – Science and Technology Publications, Lda. All rights reserved
9
has a scent so it is often used for cosmetic products,
perfumes, and aromatherapy. Essential oils obtained
from plants by steam distillation. One of the essential
oils that can be used is lavender. Lavender has more
than 30 species, dozens of subspecies, and hundreds
of hybrids, some of which are Lavandula angustifolia
(English Lavender), Lavandula stoechas (French
Lavender), Lavandula latifolia, and Lavandula
intermedia (Cavanagh and Wilkinson, 2002).
Lavandula angustifolia derived from the
Lamiaceae family is a native Mediterranean plant and
thrives in highland areas (Verma et al., 2010).
Lavender has two major constituents, there are
linalool and linalyl acetate (Kıvrak, 2018). Lavender
essential oil has many benefits such as relieve pain,
improve sleep quality, antimicrobial, anxiolytic, and
repellent (Cavanagh and Wilkinson, 2002).
The administration of lavender essential oil can be
oral, inhalation, and topical (Dornic et al., 2016).
Research showed the use of lavender essential oil in
inhalation can decrease the cortisol levels in blood
and saliva (Kim et al., 2012; Hosseini et al., 2016).
Moreover, oral administration of lavender essential
oil has an anxiolytic effect (Kasper et al., 2010). The
study of Jager et al. (1992) suggested that linalool
and linalyl acetate (active components of lavender
essential oil) are rapidly absorbed through the skin
and reaching peak levels after 19 minutes (Jager et
al., 1992). This study aims to research the usage of natural
topical medication like lavender essential oil balm to investigate the effectiveness for stress conditions. Currently, treatment for stress conditions always oriented to synthetic drugs such as psychotropic drugs. These drugs are susceptible to misuse. Serum cortisol levels are the indicator of stress conditions.
2 METHODS
2.1 Animals
Male Wistar rats (2-3 months, 100-200 grams) were
habituated for 7 days before the experiment. Foods
were given 60 grams and water was available ad
libitum. Animals were individually housed in the
cage.
2.2 Materials
Placebo balm consists of 1-gram beeswax and 5
ml (4.62 gram) virgin coconut oil as vehicle formula
and no active ingredient formula was given. 10%
lavender essential oil balm consists of 1-gram
beeswax and 5 ml (4.62 gram) virgin coconut oil as
vehicle formula and 0.625-gram lavender essential oil
(Lavandula angustifolia) as active formula.
2.3 Experimental Procedures
This study used 36 male Wistar rats divided into 4
groups (negative control = no stressor; positive
control = stressor only; placebo = stressor + placebo;
L1 = stressor + Lavender 10%), the forced swim test
was given as the stressor. The cylinder was filled with
lukewarm water to a height of 30 cm. Animal was
placed in a water-filled cylinder for 10 second every
day for 30 days. Lavender essential oil balm was
given to the treatment group (L1) on the back (was
shaved 2x2 cm) within 30 minutes after the forced
swim test. These experiments were conducted
between 6:00 AM and 8:00 AM.
All of the rats were sacrificed on the 30th day.
The blood was collected via intracardiac puncture
and was centrifuged for plasma collection. All
plasma was stored in the freezer until assayed by
ELISA.
2.4 Statistic
This study This study was an experimental study
with a post-test only control group design. All the
results are presented as means ± standard error of
the mean. Statistical significance was analysed using
the Kruskal-Wallis test with the Mann-Whitney U as
post-hoc analysis by SPSS 25.0 software. P<0.05 was
considered to indicate a statistically significant
difference.
3 RESULT
Mann-Whitney U test showed that 10% lavender
essential oil balm significantly decreased the serum
cortisol levels in male Wistar rats compared to the
negative control group. Mean ± SD of serum
cortisol levels in 10% lavender essential oil balm
and negative control group were 684.19 ± 54.081
and 712.95 ± 129.589 (Table 1).
Also 10% lavender essential oil balm significantly
decreased the serum cortisol levels in male Wistar
rats compared to untreated rats. Mean ± SD of serum
cortisol levels in 10% lavender essential oil balm and
positive control group were 684.19 ± 54.081 and
728.13 ± 48.125 (Table 2).
Results showed no significant difference in
ICEO 2019 - International Conference of Essential Oils
10
serum cortisol levels in the placebo balm group and
positive control group. Mean ± SD of serum cortisol
levels in the placebo balm group and positive
control group were 699.59 ± 64.135 and 728.13 ±
48.125 (Table 3).
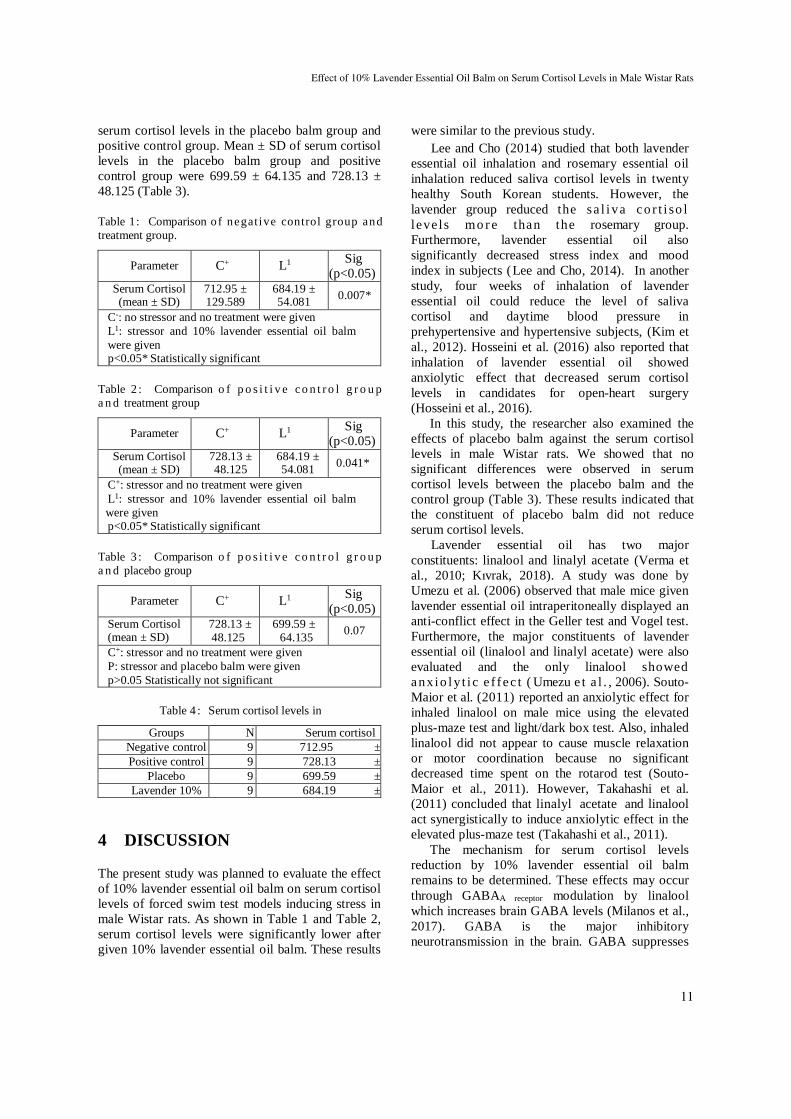
Table 1: Comparison of negative control group and
treatment group.
Parameter
C+
L1 Sig (p<0.05)
Serum Cortisol (mean ± SD) (mean ± SD)
712.95 ± 129.589
684.19 ± 54.081
0.007*
C-: no stressor and no treatment were given
L1: stressor and 10% lavender essential oil balm
were given p<0.05* Statistically significant
Table 2 : Comparison o f p o s i t i v e c o n t r o l g r o u p
a n d treatment group
Parameter
C+
L1 Sig (p<0.05)
Serum Cortisol (mean ± SD)
728.13 ± 48.125
684.19 ± 54.081
0.041*
C+: stressor and no treatment were given
L1: stressor and 10% lavender essential oil balm
were given p<0.05* Statistically significant
Table 3 : Comparison o f p o s i t i v e c o n t r o l g r o u p
a n d placebo group
Parameter
C+
L1 Sig (p<0.05)
Serum Cortisol (mean ± SD)
728.13 ± 48.125
699.59 ± 64.135 0.07
C+: stressor and no treatment were given
P: stressor and placebo balm were given
p>0.05 Statistically not significant
Table 4 : Serum cortisol levels in
Groups N Serum cortisol Negative control 9 712.95 ±
129.589 Positive control 9 728.13 ± 48.125 Placebo 9 699.59 ± 64.135 Lavender 10% 9 684.19 ± 54.081
4 DISCUSSION
The present study was planned to evaluate the effect
of 10% lavender essential oil balm on serum cortisol
levels of forced swim test models inducing stress in
male Wistar rats. As shown in Table 1 and Table 2,
serum cortisol levels were significantly lower after
given 10% lavender essential oil balm. These results
were similar to the previous study.
Lee and Cho (2014) studied that both lavender
essential oil inhalation and rosemary essential oil
inhalation reduced saliva cortisol levels in twenty
healthy South Korean students. However, the
lavender group reduced the sa l iva co r t i so l
leve ls mo r e than the rosemary group.
Furthermore, lavender essential oil also
significantly decreased stress index and mood
index in subjects (Lee and Cho, 2014). In another
study, four weeks of inhalation of lavender
essential oil could reduce the level of saliva
cortisol and daytime blood pressure in
prehypertensive and hypertensive subjects, (Kim et
al., 2012). Hosseini et al. (2016) also reported that
inhalation of lavender essential oil showed
anxiolytic effect that decreased serum cortisol
levels in candidates for open-heart surgery
(Hosseini et al., 2016).
In this study, the researcher also examined the
effects of placebo balm against the serum cortisol
levels in male Wistar rats. We showed that no
significant differences were observed in serum
cortisol levels between the placebo balm and the
control group (Table 3). These results indicated that
the constituent of placebo balm did not reduce
serum cortisol levels.
Lavender essential oil has two major
constituents: linalool and linalyl acetate (Verma et
al., 2010; Kıvrak, 2018). A study was done by
Umezu et al. (2006) observed that male mice given
lavender essential oil intraperitoneally displayed an
anti-conflict effect in the Geller test and Vogel test.
Furthermore, the major constituents of lavender
essential oil (linalool and linalyl acetate) were also
evaluated and the only linalool showed
anxio l y t i c e f fec t ( Umezu e t a l . , 2006). Souto-
Maior et al. (2011) reported an anxiolytic effect for
inhaled linalool on male mice using the elevated
plus-maze test and light/dark box test. Also, inhaled
linalool did not appear to cause muscle relaxation
or motor coordination because no significant
decreased time spent on the rotarod test (Souto-
Maior et al., 2011). However, Takahashi et al.
(2011) concluded that linalyl acetate and linalool
act synergistically to induce anxiolytic effect in the
elevated plus-maze test (Takahashi et al., 2011).
The mechanism for serum cortisol levels
reduction by 10% lavender essential oil balm
remains to be determined. These effects may occur
through GABAA receptor modulation by linalool
which increases brain GABA levels (Milanos et al.,
2017). GABA is the major inhibitory
neurotransmission in the brain. GABA suppresses
Effect of 10% Lavender Essential Oil Balm on Serum Cortisol Levels in Male Wistar Rats
11
the activity of the HPA Axis by inhibiting
paraventricular nuclei in the hypothalamus
(Cullinan et al., 2008). Therefore, impaired
secretion of corticotropin- releasing hormone
(CRH) by paraventricular nuclei will disturb the
secretion of adrenocorticotropic hormone by the
anterior pituitary gland (Hannibal and Bishop,
2014). As a result of HPA Axis suppression, the
cortisol levels secretion by the adrenal gland will be
reduced.
5 CONCLUSIONS
This study was performed to investigate the
effectiveness of 10% lavender essential oil balm for
stress conditions. These result demonstrate that 10%
lavender essential oil balm reduced the serum cortisol
levels in male Wistar rats. The 10% lavender essential
oil balm determined to have a meaningful anxiolytic
effect. These results indicate that lavender essential
oil balm can be used as an alternative treatment to
relieve stress but should be further researched for
other biochemical parameters.
REFERENCES
Cavanagh, H, M, A., Wilkinson, J, M., 2002. Biological
Activities of Lavender Essential Oil, Phytotherapy
Research, 16(4), 301–308.
Contrada, R, J., Baum, A., 2011. The Handbook of Stress
Science: Biology, Psychology, and Health. New
York, Springer Pub.
Cullinan, W, E., Ziegler, D, R., Herman, J, P., 2008.
Functional Role of Local Gabaergic Influences on the
HPA Axis. Brain Structure and Function, 213(1–2),
63–72.
Dornic, N., Ficheux, A, S., Roudot, A, C., Saboureau, D.,
Ezzedine, K., 2016. Usage Patterns of Aromatherapy
among the French General Population: A Descriptive
Study Focusing on Dermal Exposure. Regulatory
Toxicology and Pharmacology, 76, 87–93.
Fink, G., 2016. Stress, Definitions, Mechanisms, and
Effects Outlined Lessons from Anxiety, Stress Concepts
and Cognition, Emotion, and Behavior. Elsevier Inc.
Gradus, J, L., Qin, P., Lincoln, A, K., Miller, M., Lawler, E.
V., Sorensen, H, T., Lash, T, L., 2010. Acute Stress
Reaction and Completed Suicide. International
Journal of Epidemiology, 39(6), 1478–1484.
Guyton, A, C., Hall, J, E., 2016. Textbook of Medical
Physiology 13th Edition. Philadelphia, PA: Elsevier.
Hannibal, K, E., Bishop, M, D., 2014. Chronic Stress,
Cortisol Dysfunction, and Pain: A
Psychoneuroendocrine Rationale for Stress
Management in Pain Rehabilitation. Physical Therapy,
94(12), 1816–1825.
Hosseini, S., Heydari, A., Vakili, M, A.,
Moghadam, S., Tazyky, S., 2016. Effect of
Lavender Essence Inhalation on the Level of Anxiety
and Blood Cortisol in Candidates for Open-Heart
Surgery. Iranian Journal of Nursing and Midwifery
Research, 21(4), 397.
Jager, W., B u c h b a u e r , G . , J i r o v e t z , L . ,
F r i t z e r , M . , 1992. Percutaneous Absorption of
Lavender Oil from a Massage Oil. Journal of the
Society of Cosmetic Chemists, 43(1), 49–54.
Kasper, S., Gastpar, M., Muller, W, E., Volz, H, P.,
Moller, H, J., Dienel, A., Schlafke, S., 2010. Silexan,
an Orally Administered Lavandula Oil Preparation,
is Effective in the Treatment of “Subsyndromal”
Anxiety Disorder: A Randomized, Double-Blind,
Placebo Controlled Trial. International Clinical
Psychopharmacology, 25(5), 277–287.
Kementerian Kesehatan. 2013. Riset Kesehatan Dasar
(Riskesdas) 2013. Jakarta, Badan Penelitian dan
Pengembangan Kesehatan, Kementerian Kesehatan Republik Indonesia.
Kementerian Kesehatan. 2018. Riset Kesehatan Dasar (Riskesdas) 2018. Jakarta, Badan Penelitian dan
Pengembangan Kesehatan, Kementerian Kesehatan
Republik Indonesia.
Khaleel Jameel, M., Joshi, A, R., Dawane, J, S., Padwal, M.,
Joshi, A., Pandit, V., Melinkeri, R., 2014. Effect of
Various Physical Stress Models on Serum Cortisol
Level in Wistar Rats. Journal of Clinical and
Diagnostic Research, 8(3), 181–183.
Kim, I., Kim, C., Seong, K., Hur, M, H., Lim, H, M.,
Lee, M, S., 2012. Essential Oil Inhalation on Blood
Pressure and Salivary Cortisol Levels in
Prehypertensive and Hypertensive Subjects.
Evidence-Based Complementary and Alternative
Medicine, 2012, 1–9.
Kıvrak, Ş., 2018. Essential Oil Composition and
Antioxidant Activities of Eight Cultivars of Lavender
and Lavandin from Western Anatolia. Industrial
Crops and Products, 117, 88–96.
Lee, A., Cho, H., 2014. The Effects Caused by Lavender
and Rosemary for Salivary Cortisol, Stress Levels
and Mood Alteration. Fashion business, 17(6), 18–
27.
Matteri, R, L., Carroll, J, A., Dyer, C, J., 2000.
Neuroendocrine Responses to Stress. The biology of
animal stress: basic principles and implications for
animal welfare, 43–62.
Milanos, S., Elsharif, S., Janzen, D., Buettner, A.,
Villmann, C., 2017. Metabolic Products of Linalool
and Modulation of GABAA Receptors. Frontiers in
Chemistry, 5, 1–9.
Möstl, E., Palme, R., 2002. Hormones as Indicators of Stress. Domestic Animal Endocrinology, 23(1–2), 67–
74.
Silverthorn, D, U., 2007 Human physiology : An
ICEO 2019 - International Conference of Essential Oils
12
Integrated Approach. San Francisco, Pearson/Benjamin Cummings.
Souto-Maior, F, N., de Carvalho, F, L., de Morais,
L, C, S, L., Netto, S, M., de Sousa, D, P., de
Almeida, R, N., 2011. Anxiolytic-Like Effects of
Inhaled Linalool Oxide in Experimental Mouse
Anxiety Models. Pharmacology Biochemistry and
Behavior, 100(2), 259–263.
Takahashi, M., Satou, T., Ohashi, M., Hayashi, S.,
Sadamoto, K., Koike, K., 2011. Interspecies Comparison of Chemical Composition and Anxiolytic-
Like Effects of Lavender Oils upon Inhalation. Natural
Product Communications, 6(11), 1769–74.
Umezu, T., N a g a n o , K . , I t o , H . , K o s a k a i ,
K . , S a k a n i w a , M . , M o r t a , M . , 2006.
Anticonflict Effects of Lavender Oil and
Identification of Its Active Constituents.
Pharmacology Biochemistry and Behavior, 85(4),
713–721.
Verma, R. S., Rahman, L, U., Chanotiya, C, S., Rk, V.,
Chauhan, A., Singh, A., Yadav, A, L., 2010. Esential
Oil Composition of Lavandula angustifolia Mill.
Cultivated in the Mid Hills of Uttarakhand, India.
Journal of the Serbian Chemical Society, 75(3), 343–
348.
Wada, K., Sairenchi, T., Haruyama, Y., Taneichi, H.,
Ishikawa, Y., Muto, T., 2013. Relationship between
the Onset of Depression and Stress Response
Measured by the Brief Job Stress Questionnaire among
Japanese Employees : A Cohort Study. 8(2).
World Health Organization. 2017. Depression and Other
Common Mental Disorders. Cc By-Nc-Sa 3.0 Igo, (1),
1–22.
Effect of 10% Lavender Essential Oil Balm on Serum Cortisol Levels in Male Wistar Rats
13
Effect of Essential Oil of Cedarwood (Cedrus Atlantica) against Serum Cortisol Levels in Rats Which Were Given Stressor
Jose Giovanny1 1Faculty Of Medicine, Widya Mandala Catholic University, Kalisari Raya 01 Street, Surabaya,East Java, Indonesia
Keywords: Essential Oil, Cedarwood Balm, Forced Swim Test, Serum Cortisol.
Abstract: Stress is a response of the body to any demand that can affect the body’s endocrine system such as the release of cortisol into the bloodstream. Essential oils have been widely used for stress treatment because they have a calming effect. One of them is cedarwood essential oil. This study was conducted to determine the effect of cedarwood balm against serum cortisol levels in rats which were given stressor. In this study wistar male rats were randomly selected. This animal was exposed to forced swim test as stressor and then they were given cedarwood balm. We used 3 groups, the first group were given a daily forced swim test and applied cedarwood balm on the shaved back, the second group were given a daily forced swim test only, the third group were given nothing. Their serum cortisol levels were measured by ELISA test after 30 days. Result were analysed by Kruskal Wallis test for all group and man whitney test as a post test (p < 0,05). Serum cortisol level was significantly lower in cedarwood balm group then the other groups. When the all group were compared, serum cortisol level was significantly different (p = 0,018). In conclusion this indicates that cedarwood balm affect the endocrine regulatory mechanism to modulate stress responses.
1 INTRODUCTION
Stress is the body's response to mental, emotional and / or physical needs that exceed the body's regulatory capacity (Cohen et al., 2013; Fink, 2016). Stress is well known to change serum cortisol in animal models (Hall, 2016). There are a variety of stress delivery techniques, one of which is the forced swim test. Forced swim test is a stressor technique that is often used for cases of depression in experimental animals, the forced swim test (FST), which is one of the most commonly used assays for the study of depressive-like behavior in rodents). The use of FST as a stressor to increase cortisol hormone levels has been demonstrated by various researchers (Khaleel Jameel et al., 2014).
The central regulation of stress and cortisol release occurs in the hypothalamus, which contains multiple responses from the brain. This biological response is the activation of three systems namely the sensory system in the brain, the Sympathetic Adrenal Medullary (SAM), and the hypothalamic-pituitary-adrenal (HPA) axis. Stressors that are stimulated by the sensory system in the brain will activate two
hormonal systems to help individuals cope with this condition, the first of which is mediated by a sympathetic nerve called a "fight-or-flight" response which rapidly results in the release of epinephrine and norepinephrine6. Second is a slower and longer hormonal response, mediated by the hypothalamic-pituitary-adrenal (HPA) axis. This response is mediated by a group of neurons in the hypothalamic paraventricular nucleus (PVN), which secretes corticotrophin-releasing hormone (CRH) to give pituitary signals so that the pituitary releases adrenocorticotropic hormone (ACTH). ACTH stimulates the adrenal glands to synthesize and secrete Cortisol (Hall, 2016).
Cortisol is an indication of a stress condition. Almost all types of stress that are physical or mental cause an increase in ACTH secretion which increases cortisol secretion within a period of several minutes. Stimulation resulting from physical stress or tissue damage will be delivered to the eminence of the hypothalamic median through the brain stem which causes the activation of the HPA axis so that there is an increase in cortisol secretion into the blood (Cohen et al., 2013; Fink, 2016). In rats given stressor by
14Giovanny, J.Effect of Essential Oil of Cedarwood (Cedrus Atlantica) against Serum Cortisol Levels in Rats Which Were Given Stressor.In Proceedings of the 2nd International Conference of Essential Oils (ICEO 2019), pages 14-17ISBN: 978-989-758-456-5Copyright © 2020 by SCITEPRESS – Science and Technology Publications, Lda. All rights reserved
forced swim test method has been shown to increase levels of the hormone cortisol, but the signaling of cortisol hormone levels is higher in acute exposure to FST in mice, it increases stress hormone more than chronic FST exposure (Khaleel Jameel et al., 2014).
Cedrus atlantica plant is one species that comes from the family Pinaceae. Oil from the cedarwood plant is extracted from the Cedrus atlantica tree by distilling it from shavings and splinters from the Cedrus atlantica tree. especially in α-atlantone which can help calm the mind (Rhind, 2012). The high sesquiterpene alcohol content in cedarwood oil has a sedative effect that can overcome tension, fear, anxiety, and depression (Fradelos and Komini, 2015; K G Stiles, 2017). In previous studies the use of cedarwood oil to reduce stress is still unclear, because the method is not clearly explained and there are still many cases of stress management with the use of synthetic drugs such as psychotropic drugs. The use of drugs with this class is still often misused, therefore researchers are interested in further research on the use of natural ingredients such as cedarwood oil to see the effectiveness of cedarwood oil in dealing with stress conditions, with the hormone cortisol as a marker of stress conditions.
2 METHODS AND MATERIALS
2.1 Animal
Rats in this study were male Wistar strain rats weighing 120-150gr, aged 2-3 months, and healthy. The experiments were performed after the animal had been habituated to the experimental environment for 1 week.. foods were given 60 gram and water were given 45 ml every day. These animals were individually housed in cage. The male rat were divided into 3 groups, the first group is negative control group who were not given balms and stressors (C-), the second group is positive control group who were given forced swim test but were not given balms (C+), and the treatment groups who were given cedarwood oil balms and given stressors (T1). Rats will be shaved feathers on the back to apply cedarwood oil balm to the group to be given balm. Mice will be given a forced swim test for 30 days. Experiments were conducted between 1 to 4pm every day.
2.2 Materials
10 % Cedarwood balm consist of 5 ml virgin coconut oil, 1-gram beeswax, and 0,625 gram cedarwood essential oil (Cedrus atlantica). Cedarwood balm will be applied at the back of the rats after getting forced swim test.
2.3 Forced Swim Test and Cedarwood Balm
Forced swim tests were given to control group two and treatment group for 30 days, every day on cylinder tubes with a diameter of 20 cm and a height of 30 cm. This cylinder tube will be filled with water as high as 20 cm then the mouse will be placed in a cylindrical tube filled with water and will be quenched for 10 seconds then the rat will be removed and dried by wiping with a towel and allowed to stand for 30 minutes at room temperature. After that the treatment group will be applied cedarwood oil balm with a concentration of 10%.
2.4 Measurement of Serum Cortisol Level
Blood was collected from all the study group animals after 30 days at 4 pm, all blood samples were taken at the same time to get the same result. 3ml of blood was collected by intra cardiac and then the serum was separated by centrifugation at 3000rpm for 5 minutes and stored at -20c. The serum sample was analyzed with ELISA KIT to determine the cortisol level. This assay has high sensitivity and specificity for estimation of cortisol levels in wistar rats.
2.5 Statistic
Data were analyzed by statistical test and the Kruskal Wallis followed Whitney test man as a post hoc test with SPSS 25.0 software to indicate a statistically significant difference between the control group and the treatment group with a significant value of p <0.05.
3 RESULTS
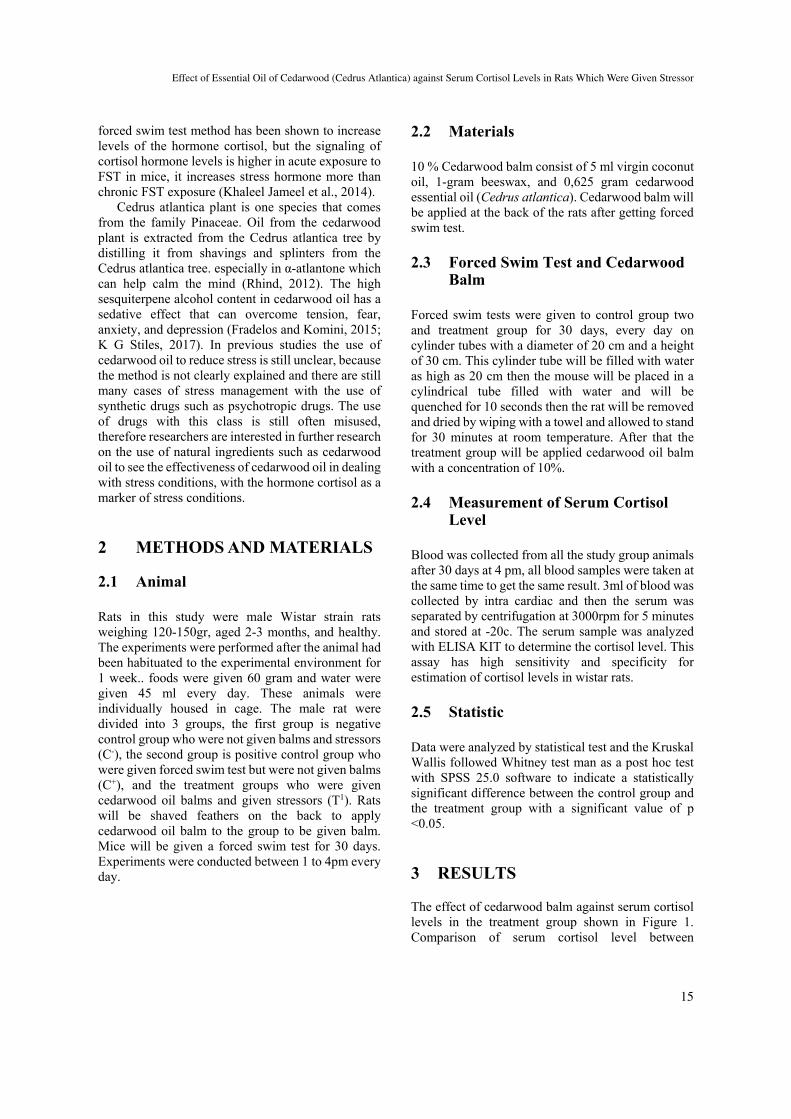
The effect of cedarwood balm against serum cortisol levels in the treatment group shown in Figure 1. Comparison of serum cortisol level between
Effect of Essential Oil of Cedarwood (Cedrus Atlantica) against Serum Cortisol Levels in Rats Which Were Given Stressor
15
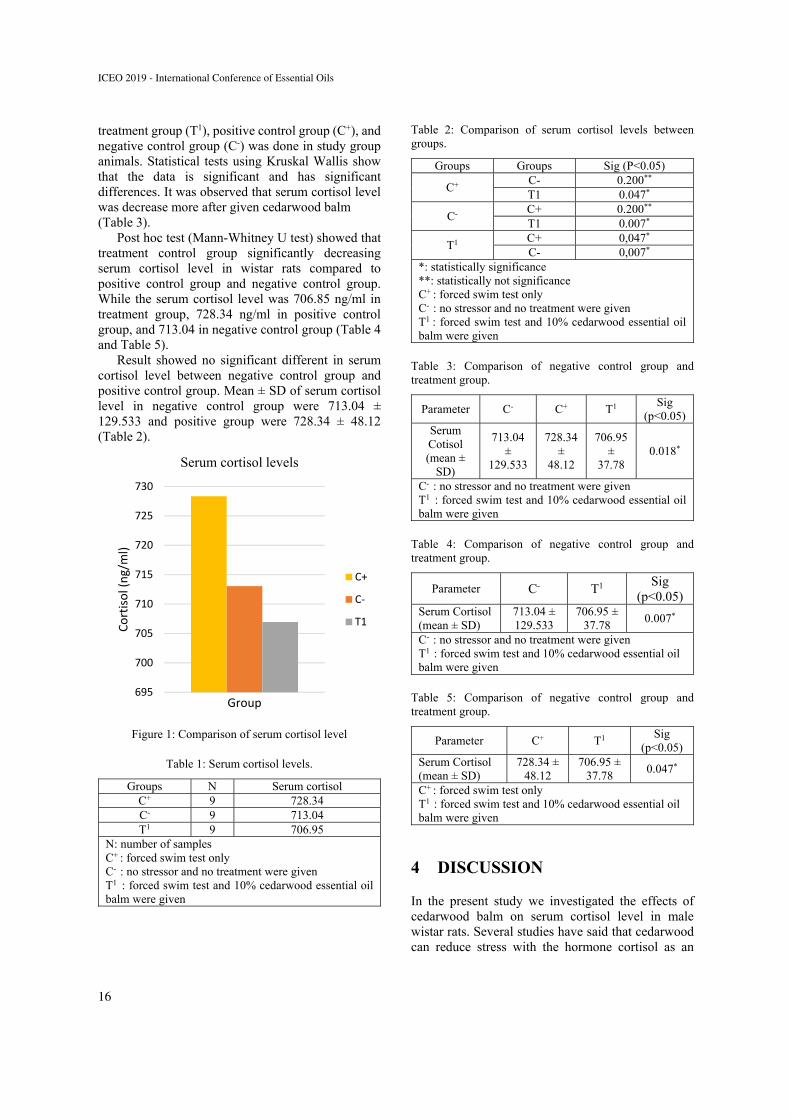
treatment group (T1), positive control group (C+), and negative control group (C-) was done in study group animals. Statistical tests using Kruskal Wallis show that the data is significant and has significant differences. It was observed that serum cortisol level was decrease more after given cedarwood balm (Table 3).
Post hoc test (Mann-Whitney U test) showed that treatment control group significantly decreasing serum cortisol level in wistar rats compared to positive control group and negative control group. While the serum cortisol level was 706.85 ng/ml in treatment group, 728.34 ng/ml in positive control group, and 713.04 in negative control group (Table 4 and Table 5).
Result showed no significant different in serum cortisol level between negative control group and positive control group. Mean ± SD of serum cortisol level in negative control group were 713.04 ± 129.533 and positive group were 728.34 ± 48.12 (Table 2).
Figure 1: Comparison of serum cortisol level
Table 1: Serum cortisol levels.
Groups N Serum cortisol C+ 9 728.34 C- 9 713.04 T1 9 706.95
N: number of samples C+ : forced swim test only C- : no stressor and no treatment were given T1 : forced swim test and 10% cedarwood essential oil balm were given
Table 2: Comparison of serum cortisol levels between groups.
Groups Groups Sig (P<0.05)
C+ C- 0.200** T1 0.047*
C- C+ 0.200** T1 0.007*
T1 C+ 0,047* C- 0,007*
*: statistically significance **: statistically not significance C+ : forced swim test only C- : no stressor and no treatment were given T1 : forced swim test and 10% cedarwood essential oil balm were given
Table 3: Comparison of negative control group and treatment group.
Parameter C- C+ T1 Sig
(p<0.05) Serum Cotisol (mean ±
SD)
713.04 ±
129.533
728.34 ±
48.12
706.95 ±
37.78 0.018*
C- : no stressor and no treatment were given T1 : forced swim test and 10% cedarwood essential oil balm were given
Table 4: Comparison of negative control group and treatment group.
Parameter C- T1 Sig
(p<0.05) Serum Cortisol (mean ± SD)
713.04 ± 129.533
706.95 ± 37.78
0.007*
C- : no stressor and no treatment were given T1 : forced swim test and 10% cedarwood essential oil balm were given
Table 5: Comparison of negative control group and treatment group.
Parameter C+ T1 Sig
(p<0.05) Serum Cortisol (mean ± SD)
728.34 ± 48.12
706.95 ± 37.78
0.047*
C+ : forced swim test only T1 : forced swim test and 10% cedarwood essential oil balm were given
4 DISCUSSION
In the present study we investigated the effects of cedarwood balm on serum cortisol level in male wistar rats. Several studies have said that cedarwood can reduce stress with the hormone cortisol as an
695
700
705
710
715
720
725
730
Cortisol (ng/ml)
Group
Serum cortisol levels
C+
C‐
T1
ICEO 2019 - International Conference of Essential Oils
16
indication. However, the mechanisms is not clearly explained and the species used is different (Worwood, 2016).
Our result showed that cedarwood balm has an effect to reduce stress by reducing the level of the hormone cortisol in male wistar rats. This happen when we compare treatment group and positive control group. There was significant different between serum cortisol level, which is a decrease in the level of the serum cortisol, which is thought to be caused by the content of cedarwood oil.
There are four major constituent in cedarwood essential oil such as cedrol, α-atlantone, α-pinene, and himachalol (Aberchane and Fechtal, 2004; Tisserand and Young, 2013). The composition of essential oils differ according to the part of the plant used, according to the region or origin of the plant, the stage of germination and its extraction methods (Ainane et al., 2018; Fidah et al., 2016; Satrani et al., 2015). All of this major constituent has an effect on stress. The high content of sesquiterpene alcohol in cedarwood oil has a sedative effect that can overcome tension, fear, anxiety, and depression10,13.
Cedrol works by activating GABA so that it causes a sedative effect that can cope with stress conditions8,30,31. In research conducted by Ryuji et al. (2016) cedrol is given inhaled in male wistar rats and provides a sedation and relaxation effect that is thought to be caused by the mechanism of GABA inhibition (Kagawa et al., 2003). In another study cedrol improve sleep in young women by heightening parasympathetic activity (Takeda et al., 2017). Another constituent that can cause sedation and relaxation effect is α-pinene that produces cinnamon scent which can help calm the mind and works on GABAergic transmission like cedrol (Aoshima and Hamamoto, 1999; Rhind, 2012).
The mechanism of action of cedarwood essential oils to produce sedative and relaxing effects remains to be determined. These effect may occur through inhibition of the activity of am-aminobutyric acid (GABA) transaminases which are enzymes for GABA metabolism in synapses. This inhibitory activity causes an increase in GABA levels and a decrease in glutamate levels which will cause a sedative effect (Franz and Novak, 2015). Previous studies have suggested that there is a barrier to the activity of the HPA axis after injecting GABA-A agonists by inhibiting the production of CRH in the parvocellular paraventricular nucleus (Herman et al., 2004). As a result of HPA axis suppression and the cessation of CRH production, the serum cortisol level will be reduced.
5 CONCLUSIONS
Our study showed that 10% cedarwood balm has the effect of reducing stress by reducing the level of the hormone cortisol in male wistar rats given the stressor. Cedarwood balm showed potential to be used as alternative treatment to relief stress condition but further studies will be needed to have more conclusive evidence on this aromatherapy.
REFERENCES
Aberchane, M., Fechtal, M., 2004. Analysis Of Moroccan Atlas Cedarwood Oil (Cedrus atlantica Manetti). 16, 542–547.
Ainane, A., Khammour, F., Kouali, M., Salamat, A., Kenz, A., 2018. Chemical Characterization On The Aromatic Composition OOf Cedrus Atlantica From Morocco In Two Geographical Areas Will Break. 2, 134–137.
Aoshima, H., Hamamoto, K., 1999. Potentiation of GABA-A Receptors Expressed In Xenopus Oocytes By Perfume And Phytoncid. Biosci. Biotechnol. Biochem. 63, 743–8.
Cohen, M.M., Tottenham, N., Casey, B.J., 2013. Review Translational Developmental Studies Of Stress On Brain And Behavior: Implication For Adolescent Mental Health And Illness. Neuroscience. 249, 53–62.
Fidah, A., Salhi, N., Rahouti, M., Kabouchi, B., Ziani, M., Aberchane, M., Famiri, A., 2016. Natural Durability Of Cedrus Atlantica Wood Related To The Bioactivity Of Its Essential Oil Against Wood Decaying Fungi. 18, 567–576.
Fink, G., 2016. Stress, Definitions, Mechanisms, And Effects Outlined: Lessons from Anxiety, in: Stress: Concepts, Definition and History. Elsevier Inc, 1–20.
Fradelos, E., Komini, A., 2015. The Use of Essential Oils As A Complementary Treatment For Anxiety. 4, 1–5.
Franz, C., Novak, J., 2015. Sources of Essential Oils, in: Handbook Of Essential Oils: Science, Technology, and Applications. CRC Press. 43–86.
Hall, J.E., 2016. Hormon Adrenokortikal, in: Guyton and Hall Textbook of Medical Physiology. Elsevier Inc, 921–933.
Herman, J.P., Mueller, N.K., Figueiredo, H., 2004. Role of GABA And Glutamate Circuitry In Hypothalamo-Pituitary- Adrenocortical Stress Integration. Ann. N. Y. Acad. Sci. 1018, 35–45.
Effect of Essential Oil of Cedarwood (Cedrus Atlantica) against Serum Cortisol Levels in Rats Which Were Given Stressor
17
Hybrid of Wavelet Feature Extraction and LVQ Neural Network to Recognize Patchouli Variety using Leaf Images
Candra Dewi1 1Department of Informatics, Brawijaya University, Veteran Street, Malang, Indonesia
Institute of Essential Oil, Brawijaya University, Malang, Indonesia [email protected]
Keywords: Patchouli Variety, Leaf Image, Wavelet Feature Extraction, LVQ Neural Network.
Abstract: Patchouli consist of some varieties that have different patchouli alcohol (PA). This variety can be recognized by experts who dabbling with patchouli plants through observation of shape and texture of the leaf. This study introduced a new method to identify patchouli varieties by utilizing leaf images. The wavelet feature extraction was used to obtain leaf texture characteristics. The varieties then are identified by using Learning Vector Quantization (LVQ) Neural Network algorithm. The results of testing on 40 leaf image data showed the value of recognition accuracy of patchouli varieties reached 83, 33%. This result is obtained by wavelet parameters namely doubechies level 3, doubechies coefficient 3, and LVQ parameters, namely learning rate 0.1 learning rate reduction constant 0.2. These results can be said to be quite good considering that the patchouli leaf tested have almost similar shape and color.
1 INTRODUCTION
Patchouli (Pogostemon cablin Benth) is one of the essential plants that belongs to the family Labiateae. This plant was first cultivated in the Aceh region, then spread in several provinces such as North Sumatra, West Sumatra, and Bengkulu. Patchouli plants produce essential oils known as patchouli oil.
There are three types of patchouli in Indonesia that can be distinguished by morphological character, patchouli alcohol content (PA) and oil quality, as well as resistance to biotic and abiotic stresses. The three types are Pogostemon cablin Benth (Aceh patchouli), Pogostemon heyneanus Benth (Java patchouli), and Pogostemon hortensis Backer (Soap patchouli) (Guenther, 1952). Of the three types, Pogostemon cablin Benth has the highest oil content and good composition. While Pogostemon heyneanus Benth or Javanese patchouli more resistance to pests and diseases, bacterial wilt and nematodes (Nuryani et al., 1997). Besides Javanese patchouli is also resistant to a disease, called budok in Indonesian which is caused by the fungus Synchytrium pogostemonis (Wahyuno and Sukamto, 2010).
Based on the description above, it can be concluded that the selection of patchouli varieties during crop cultivation is very necessary in order to
obtain an optimal harvest. One specific characteristic that distinguishes patchouli varieties visually is found in the leaves. For example, the leaves in the Lhokseumawe variety are green and have a flat, rounded leaf tip. While the leaves of the Sidikalang variety are purplish green and the tips of the leaves are flat and rounded. These differences in physical characteristics can sometimes be recognized by experienced of experts or farmers. However, each variety will have different characteristics if planted in different regions, making it even more difficult to recognize. For example, Sidikalang varieties from Aceh will have different leaf color and texture characteristics if planted in Kolaka, Sulawesi. This is often unknown to farmers and only certain experts can recognize it. To adopt a limited number of expert capabilities, a technology is needed in the process of identifying patchouli leaf varieties. This paper proposed a new method for identification of patchouli varieties using leaf imagery. Specifically, the purpose of this study is 1) to obtain the characteristics of leaf texture by extracting texture features 2) to calculate the accuracy of the recognizing of patchouli varieties using leaf images.
Several studies on the use of leaf image processing technology for plant identification have been carried out. Among them is the identification of plants through leaf shapes by counting the number of
18Dewi, C.Hybrid of Wavelet Feature Extraction and LVQ Neural Network to Recognize Patchouli Variety using Leaf Images.In Proceedings of the 2nd International Conference of Essential Oils (ICEO 2019), pages 18-24ISBN: 978-989-758-456-5Copyright © 2020 by SCITEPRESS – Science and Technology Publications, Lda. All rights reserved
leaf shape patterns, PCA, and EF (Chong et al., 2015; Laga et al., 2014; Neto et al., 2006). Furthermore, several studies have also been carried out for leaf classification through texture, shape, and color features using PSO and FRVM (Lakshmi and Vasudef, 2016); leaf identification using DBNs and PID (Liu and Jiang-ming, 2016); Android application for identification of plant species based on leaf imagery (Zhao et al., 2015); plant leaf identification based on leaf skeleton (Zang et al., 2016); identification of plant species based on leaf texture (Pahikkala et al., 2015); and classification of plants based on leaf images using backpropagation ANN method (Aakif and M. Faisal, 2015). Other related research is the identification of plant leaves with three extraction features, namely shape features using the SIFT method, color features using the color moment method, and texture features using the SFTA method. The use of these three features resulted in an identification accuracy of 94% (Jamil et al., 2015). These studies provide good enough results so that the leaf image is quite effective for the identification of certain plants.
In contrast to previous studies where it was used to identify different types of plants using leaf images, this study distinguishes plants with the same type namely patchouli, but having different varieties. The level of difficulty in this study lies in the characteristics of the leaves are almost the same, so we need an appropriate feature extraction method.
Based on field observations and discussions with experts, it is known that almost all young patchouli leaves have a green color and are getting red as the plant ages. These color characteristics cannot be used to distinguish between one variety to another. Besides the shape of the leaves, another characteristic that can be used to distinguish patchouli varieties is the texture of the leaves where several varieties have slightly different textures. To get information about leaf texture that is almost similar requires a specific method so that the slightest difference can be known in detail. Of the several methods available, extraction of texture features using wavelet texture analyzers is one suitable alternative for patchouli leaf problems. Wavelet ability has been demonstrated in several studies such as in the research of Abdolmaleki et al (2017) which extracted spectral features on hyperspectral images and produced good recommendations for the detection of copper deposits. Research conducted by Bakhshipour et al., 2017 also shows that feature extraction with wavelets can increase the effectiveness of the weed detection process in beet plants. Other research also shows that the use of wavelets in feature selection can improve
performance in the recognition process (Singh et al., 2016; Murguia et al., 2013; Imtiaz and Fattah, 2013). In contrast to previous studies, this study used daubechies wavelet in the transformation process. Daubechies wavelet uses overlapping windows, so the spectrum of high frequency coefficient represents all high frequency changes. A daubechies level and coefficient were also tested to get the best texture features that can distinguish between leaf characteristics.
The best features of each leaf image obtained from the feature extraction process are then used as input to the variety recognition process. This study uses the Learning Vector Quantization (LVQ) algorithm which is one of the Neural Network based classification algorithms as the recognition method. The use of the LVQ method has been done in previous studies, namely to identify the quality of patchouli using leaf images (Dewi et al., 2016), identification of diseases of soybean leaves (Dewi et al., 2016; Dewi, 2017), identification of diseases on orange leaves (Dewi and Basuki, 2016). Research conducted by Desylvia (2013), discusses the comparison of SOM and LVQ in the identification of facial images with wavelets as feature extraction. This study concludes that the LVQ method is better than the SOM method, with accuracy for SOM is 97.894% and accracy for LVQ is 100% Desylva, 2013). Furthermore, research conducted by Nurkhozin (2011) classifies diabetes mellitus by using the LVQ and Backpropagation method, wherein it is known that LVQ provides a higher accuracy than Backpropagation. The study gave 82.56% results for LVQ and 73.25% for Backpropagation for classification using learning rate = 0.5, number of iteration = 100, training data were 345 and test data were 86 patients. The above reference shows that the use of LVQ in the identification process provides quite optimal results.
2 DATA AND METHOD
This section gives the explanation of data and general steps of recognizing the patchouli varieties. 2.1 Identification of Patchouli Leave
Characteristic
Patchouli is one of the plants that produce essential oils and belongs to the Labiatea family. One of the characteristics that can be used to identify patchouli varieties is by observing leaf morphology (Haryudin and Suhesti, 2014). In general, the shape of patchouli
Hybrid of Wavelet Feature Extraction and LVQ Neural Network to Recognize Patchouli Variety using Leaf Images
19
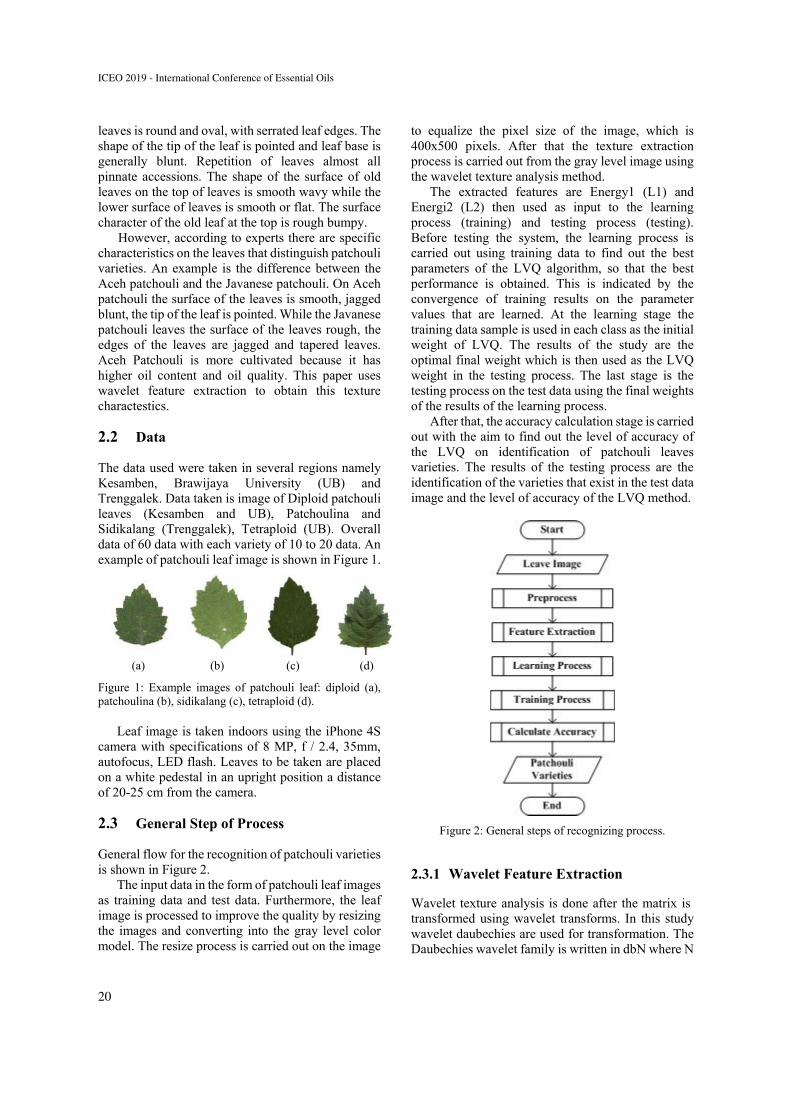
leaves is round and oval, with serrated leaf edges. The shape of the tip of the leaf is pointed and leaf base is generally blunt. Repetition of leaves almost all pinnate accessions. The shape of the surface of old leaves on the top of leaves is smooth wavy while the lower surface of leaves is smooth or flat. The surface character of the old leaf at the top is rough bumpy.
However, according to experts there are specific characteristics on the leaves that distinguish patchouli varieties. An example is the difference between the Aceh patchouli and the Javanese patchouli. On Aceh patchouli the surface of the leaves is smooth, jagged blunt, the tip of the leaf is pointed. While the Javanese patchouli leaves the surface of the leaves rough, the edges of the leaves are jagged and tapered leaves. Aceh Patchouli is more cultivated because it has higher oil content and oil quality. This paper uses wavelet feature extraction to obtain this texture charactestics.
2.2 Data
The data used were taken in several regions namely Kesamben, Brawijaya University (UB) and Trenggalek. Data taken is image of Diploid patchouli leaves (Kesamben and UB), Patchoulina and Sidikalang (Trenggalek), Tetraploid (UB). Overall data of 60 data with each variety of 10 to 20 data. An example of patchouli leaf image is shown in Figure 1.
(a) (b) (c) (d)
Figure 1: Example images of patchouli leaf: diploid (a), patchoulina (b), sidikalang (c), tetraploid (d).
Leaf image is taken indoors using the iPhone 4S
camera with specifications of 8 MP, f / 2.4, 35mm, autofocus, LED flash. Leaves to be taken are placed on a white pedestal in an upright position a distance of 20-25 cm from the camera.
2.3 General Step of Process
General flow for the recognition of patchouli varieties is shown in Figure 2.
The input data in the form of patchouli leaf images as training data and test data. Furthermore, the leaf image is processed to improve the quality by resizing the images and converting into the gray level color model. The resize process is carried out on the image
to equalize the pixel size of the image, which is 400x500 pixels. After that the texture extraction process is carried out from the gray level image using the wavelet texture analysis method.
The extracted features are Energy1 (L1) and Energi2 (L2) then used as input to the learning process (training) and testing process (testing). Before testing the system, the learning process is carried out using training data to find out the best parameters of the LVQ algorithm, so that the best performance is obtained. This is indicated by the convergence of training results on the parameter values that are learned. At the learning stage the training data sample is used in each class as the initial weight of LVQ. The results of the study are the optimal final weight which is then used as the LVQ weight in the testing process. The last stage is the testing process on the test data using the final weights of the results of the learning process.
After that, the accuracy calculation stage is carried out with the aim to find out the level of accuracy of the LVQ on identification of patchouli leaves varieties. The results of the testing process are the identification of the varieties that exist in the test data image and the level of accuracy of the LVQ method.
Figure 2: General steps of recognizing process.
2.3.1 Wavelet Feature Extraction
Wavelet texture analysis is done after the matrix is transformed using wavelet transforms. In this study wavelet daubechies are used for transformation. The Daubechies wavelet family is written in dbN where N
ICEO 2019 - International Conference of Essential Oils
20
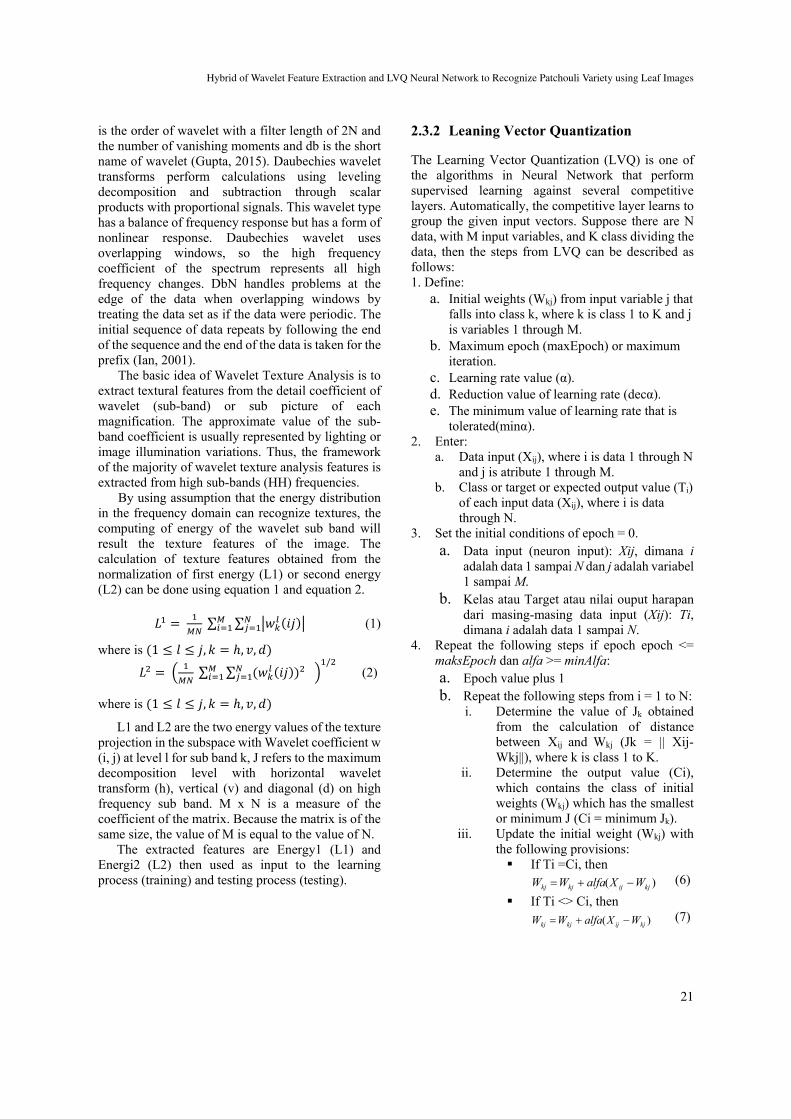
is the order of wavelet with a filter length of 2N and the number of vanishing moments and db is the short name of wavelet (Gupta, 2015). Daubechies wavelet transforms perform calculations using leveling decomposition and subtraction through scalar products with proportional signals. This wavelet type has a balance of frequency response but has a form of nonlinear response. Daubechies wavelet uses overlapping windows, so the high frequency coefficient of the spectrum represents all high frequency changes. DbN handles problems at the edge of the data when overlapping windows by treating the data set as if the data were periodic. The initial sequence of data repeats by following the end of the sequence and the end of the data is taken for the prefix (Ian, 2001).
The basic idea of Wavelet Texture Analysis is to extract textural features from the detail coefficient of wavelet (sub-band) or sub picture of each magnification. The approximate value of the sub-band coefficient is usually represented by lighting or image illumination variations. Thus, the framework of the majority of wavelet texture analysis features is extracted from high sub-bands (HH) frequencies.
By using assumption that the energy distribution in the frequency domain can recognize textures, the computing of energy of the wavelet sub band will result the texture features of the image. The calculation of texture features obtained from the normalization of first energy (L1) or second energy (L2) can be done using equation 1 and equation 2.
∑ ∑ (1)
where is 1 , , ,
∑ ∑ /
(2)
where is 1 , , ,
L1 and L2 are the two energy values of the texture projection in the subspace with Wavelet coefficient w (i, j) at level l for sub band k, J refers to the maximum decomposition level with horizontal wavelet transform (h), vertical (v) and diagonal (d) on high frequency sub band. M x N is a measure of the coefficient of the matrix. Because the matrix is of the same size, the value of M is equal to the value of N.
The extracted features are Energy1 (L1) and Energi2 (L2) then used as input to the learning process (training) and testing process (testing).
2.3.2 Leaning Vector Quantization
The Learning Vector Quantization (LVQ) is one of the algorithms in Neural Network that perform supervised learning against several competitive layers. Automatically, the competitive layer learns to group the given input vectors. Suppose there are N data, with M input variables, and K class dividing the data, then the steps from LVQ can be described as follows: 1. Define:
a. Initial weights (Wkj) from input variable j that falls into class k, where k is class 1 to K and j is variables 1 through M.
b. Maximum epoch (maxEpoch) or maximum iteration.
c. Learning rate value (α). d. Reduction value of learning rate (decα). e. The minimum value of learning rate that is
tolerated(minα). 2. Enter:
a. Data input (Xij), where i is data 1 through N and j is atribute 1 through M.
b. Class or target or expected output value (Ti) of each input data (Xij), where i is data through N.
3. Set the initial conditions of epoch = 0. a. Data input (neuron input): Xij, dimana i
adalah data 1 sampai N dan j adalah variabel 1 sampai M.
b. Kelas atau Target atau nilai ouput harapan dari masing-masing data input (Xij): Ti, dimana i adalah data 1 sampai N.
4. Repeat the following steps if epoch epoch <= maksEpoch dan alfa >= minAlfa: a. Epoch value plus 1 b. Repeat the following steps from i = 1 to N:
i. Determine the value of Jk obtained from the calculation of distance between Xij and Wkj (Jk = || Xij-Wkj||), where k is class 1 to K.
ii. Determine the output value (Ci), which contains the class of initial weights (Wkj) which has the smallest or minimum J (Ci = minimum Jk).
iii. Update the initial weight (Wkj) with the following provisions: If Ti =Ci, then
)( kjijkjkj WXalfaWW (6)
If Ti <> Ci, then )( kjijkjkj WXalfaWW (7)
Hybrid of Wavelet Feature Extraction and LVQ Neural Network to Recognize Patchouli Variety using Leaf Images
21
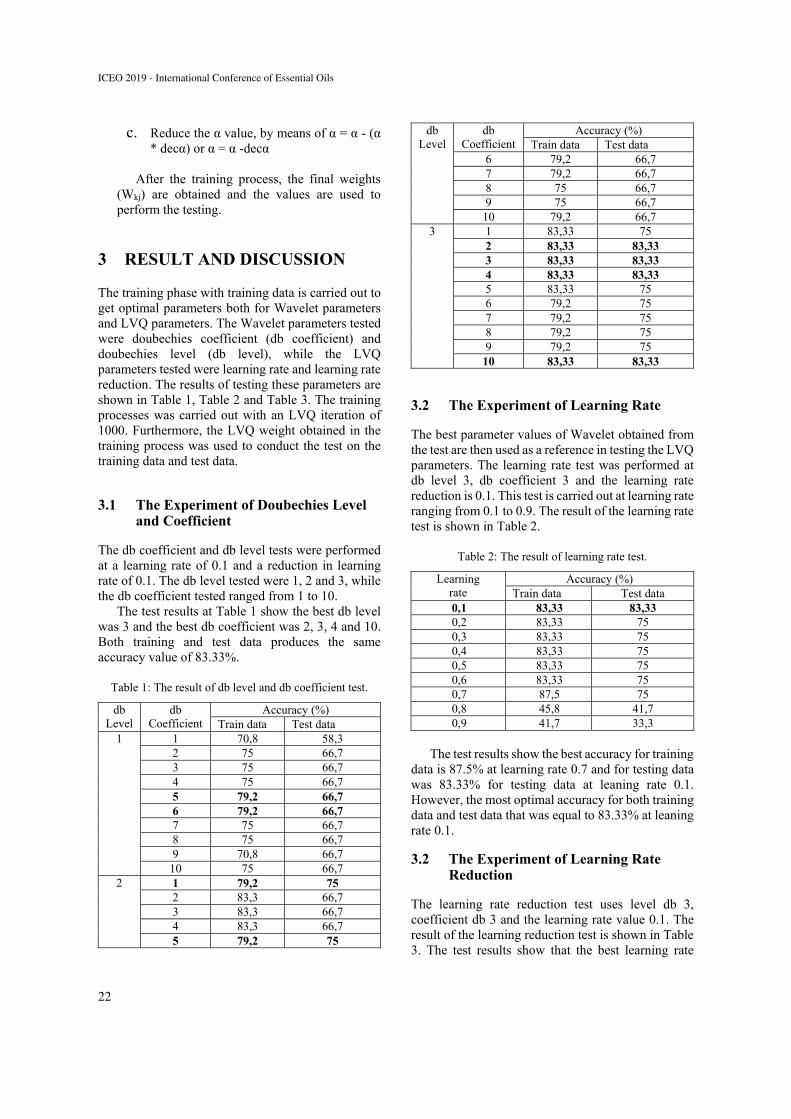
c. Reduce the α value, by means of α = α - (α * decα) or α = α -decα
After the training process, the final weights
(Wkj) are obtained and the values are used to perform the testing.
3 RESULT AND DISCUSSION
The training phase with training data is carried out to get optimal parameters both for Wavelet parameters and LVQ parameters. The Wavelet parameters tested were doubechies coefficient (db coefficient) and doubechies level (db level), while the LVQ parameters tested were learning rate and learning rate reduction. The results of testing these parameters are shown in Table 1, Table 2 and Table 3. The training processes was carried out with an LVQ iteration of 1000. Furthermore, the LVQ weight obtained in the training process was used to conduct the test on the training data and test data.
3.1 The Experiment of Doubechies Level and Coefficient
The db coefficient and db level tests were performed at a learning rate of 0.1 and a reduction in learning rate of 0.1. The db level tested were 1, 2 and 3, while the db coefficient tested ranged from 1 to 10.
The test results at Table 1 show the best db level was 3 and the best db coefficient was 2, 3, 4 and 10. Both training and test data produces the same accuracy value of 83.33%.
Table 1: The result of db level and db coefficient test.
db Level
db Coefficient
Accuracy (%) Train data Test data
1 1 70,8 58,3 2 75 66,7 3 75 66,7 4 75 66,7 5 79,2 66,7 6 79,2 66,7 7 75 66,7 8 75 66,7 9 70,8 66,7 10 75 66,7
2 1 79,2 75 2 83,3 66,7 3 83,3 66,7 4 83,3 66,7 5 79,2 75
db Level
db Coefficient
Accuracy (%) Train data Test data
6 79,2 66,7 7 79,2 66,7 8 75 66,7 9 75 66,7 10 79,2 66,7
3 1 83,33 75 2 83,33 83,33 3 83,33 83,33 4 83,33 83,33 5 83,33 75 6 79,2 75 7 79,2 75 8 79,2 75 9 79,2 75 10 83,33 83,33
3.2 The Experiment of Learning Rate
The best parameter values of Wavelet obtained from the test are then used as a reference in testing the LVQ parameters. The learning rate test was performed at db level 3, db coefficient 3 and the learning rate reduction is 0.1. This test is carried out at learning rate ranging from 0.1 to 0.9. The result of the learning rate test is shown in Table 2.
Table 2: The result of learning rate test.
Learning rate
Accuracy (%) Train data Test data
0,1 83,33 83,33 0,2 83,33 75 0,3 83,33 75 0,4 83,33 75 0,5 83,33 75 0,6 83,33 75 0,7 87,5 75 0,8 45,8 41,7 0,9 41,7 33,3
The test results show the best accuracy for training
data is 87.5% at learning rate 0.7 and for testing data was 83.33% for testing data at leaning rate 0.1. However, the most optimal accuracy for both training data and test data that was equal to 83.33% at leaning rate 0.1.
3.2 The Experiment of Learning Rate Reduction
The learning rate reduction test uses level db 3, coefficient db 3 and the learning rate value 0.1. The result of the learning reduction test is shown in Table 3. The test results show that the best learning rate
ICEO 2019 - International Conference of Essential Oils
22
reduction is 0.2, and 0.4 with an accuracy value of test data is 83.33% (Table 3).
Table 3: The result of learning rate reduction test.
Learning rate reduction
Accuracy (%) Train data Test data
0,1 83,33 83,33 0,2 87,5 83,33 0,3 87,5 75 0,4 87,5 83,33 0,5 83,33 83,33 0,6 79,2 83,33 0,7 75 83,3 0,8 75 83,3 0,9 70,8 83,3
4 CONCLUSIONS
This study carried out the identification of patchouli plant varieties using the image of patchouli leaves. This process combines the ability of the wavelet method to extract texture features and LVQ for the classification of patchouli varieties. The process of identifying patchouli varieties begins with the training to get the optimum wavelet parameters (db level and db coefficient) and LVQ parameters (constant of learning rate and learning rate reduction) to find out the optimal method performance. Test results at db level 3, db coefficient 2, 3 and 4, learning rate 0.1 and the reduction of leaning rates 0.2 and 0.4 obtained the highest accuracy is 83.33%. The results obtained are quite good, but further research needs to be done especially by increasing the amount of data and adding patchouli varieties.
ACKNOWLEDGEMENTS
We would like to thank to Faculty of Computer Science, University of Brawijaya for the funding of this research.
REFERENCES
Aakif, A., Faisal Khan, M., 2015. Automatic Classification of Plants Based on Their Leaves. Biosystems Engineering. 139, 66–75.
Abdolmaleki, M., Tabaei, M., Fathianpour, N., Gorte, B. G.H., 2017. Selecting Optimum Base Wavelet For Extracting Spectral Alteration Features Associated With Porphyry Copper Mineralization Using
Hyperspectral Image. International Journal of Applied Earth Observation and Geoinformation, 58, 134-144.
Bakhshipour, B., Jafari, A., Nassiri, S. M., Zare, D., 2017. Weed Segmentation using Texture Features Extracted from Wavelet Sub-Images. Biosystems Engineering, 157, 1-12.
Zhao, C., Chan, S.S.F., Cham, W.K., Chu, L.M., 2015. Plant Identification using Leaf Shapes—A Pattern Counting Approach. Pattern Recognition. 48, 10, 3203–3215
Dewi, C, Krisnanti, G.W., Cholissodin, I., Basuki, A., 2016. Identifying Quality of Patchouli Leaves through Its Leave Image Using Learning Vector Quantization. The 6th Annual Basic Science International Conference, March 2016, Malang, Indonesia.
Dewi, C., Umam, M. S., Cholissodin, I., 2016. Identification of Disease on Leaf Soybean Image Using Learning Vector Quantization. International Congress on Engineering and Information, May 2016, Osaka, Japan.
Imtiaz, H., Fattah, S. A., 2013. A Wavelet -Based Dominant Feature Extraction Algorithm for Palm-Print Recognition. Digital Signal Processing, 23(1), 244-258.
Jamil, N., Aslina, N., Hussin, C., Awang, K., 2015. Automatic Plant Identification: Is Shape the Key Feature?. Procedia Computer Science, 76, 2015, 436-442.
Lakshmi, B.V., Mohan, F., 2016. Kernel-Based PSO and FRVM: An Automatic Plant Leaf Type Detection using Texture, Shape, and Color Features. Computers and Electronics in Agriculture, 125, 99–112.
Liu, N., Kan, J-M., 2016. Improved Deep Belief Networks and Multi-Feature Fusion for Leaf Identification. Neurocomputing, 216, 460–467.
Laga, H., Kurtek, S., Srivastava, A., Miklavcic, S.J., 2014. Landmark-Free Statistical Analysis of the Shape of Plant Leaves. Journal of Theoretical Biology, 363, 41–52.
Murguía, J.S., Vergara, A., Vargas-Olmos, C., Wong, T. J., Fonollosa, J., Huerta, R., 2013. Two-dimensional Wavelet Transform Feature Extraction for Porous Silicon Chemical Sensors. Analytica Chimica Acta, 785, 1-15.
Neto, J. C., Meyer, G.E., Jones, D.D., Samal, A.K., 2006. Plant Species Identification using Elliptic Fourier Leaf Shape Analysis. Computers and Electronics in Agriculture. 50(2), 121–134.
Pahikkala, T., Kari, K., Mattila, H., Lepisto, A., Teuhola, J., Nevalainen, O.S., Tyystjärvi, E., 2015. Classification of Plant Species from Images of Overlapping Leaves. Computers and Electronics in Agriculture, 118, 186–192.
Singh, A., Dutta, M. K., Sarathi, M.P., Uher, V., Burget, R., 2016. Image processing Based Automatic Diagnosis of Glaucoma using Wavelet Features of Segmented Optic Disc from Fundus Image. Computer Methods and Programs in Biomedicine, 124, 108-120.
Zhang, L., Weckler, P., Wang, N., Xiao, D., Chai, X., 2016. Individual Leaf Identification from Horticultural
Hybrid of Wavelet Feature Extraction and LVQ Neural Network to Recognize Patchouli Variety using Leaf Images
23

Crop Images Based on the Leaf Skeleton. Computers and Electronics in Agriculture, 127, 184–196.
Zhao, Z.-Q., Ma, L.H., Cheung, Y.M, Wu, X., Tang, Y., Chen, C.L.P., 2015. ApLeaf: An Efficient Android-Based Plant Leaf Identification System. Neurocomputing, 151(3), 1112–1119.
Haryudin, W., Suhesti, S., 2014. Karakteristik Morfologi, Produksi dan Mutu 15 Aksesi Nilam (Morphological characteristics, production and quality of 15 patchouli accessions). Bul. Littro, 25(1).
ICEO 2019 - International Conference of Essential Oils
24
Release Profile of the Antimicrobial Agent from Clove Oil
Encapsulated in a Polyurethane Shell
Chicha Nuraeni1, Dwinna Rahmi1, Retno Yunilawati1, Emmy Ratnawati1, Tiara Mailisa1, Trisny
Andrianty1, Irwinanita1, Bunda Amalia1 and Arief Riyanto1 1Balai Besar Kimia dan Kemasan, Badan Penelitian dan Pengembangan Industri
Kementerian Perindustrian, Jakarta, Indonesia
Keywords: Clove Oil, Encapsulation, Polyurethane Shell, Release Profile.
Abstract: The essential oil has been known for its antimicrobial properties and has the potency to be utilized as an
active agent in food preservative, packaging, and textile. Eugenol and caryophyllene are a major
antimicrobial component in the clove oil, which is proved against several bacterial and fungal strains. Due
to the clove oil is easily oxidized and have a strong smell, it needs to be encapsulated so it can be used for
long-term application. The encapsulation of the clove oil in the polyurethane shell was prepared by
polymerization in an oil-in-water emulsion. The FTIR spectra of the microcapsules showed that the clove
oil was successfully encapsulated. The release profile of the antimicrobial agent from the microcapsules was
measured using Headscape GC. From the prediction based on the release profile showed that the
microcapsules could emit the eugenol for 59 days and the caryophyllene for 15 days. Therefore, it could be
concluded that the microcapsules of clove oil in the polyurethane shell is suitable for long term application.
1 INTRODUCTION
Clove (Syzygium aromaticum) is one of the native
Indonesian plants that are well known worldwide.
Clove oils collected from the distillation of the
clove’s leaves have proved against several bacterial
and fungal strains (Cortés-Rojas et al., 2014). The
antimicrobial agent from natural plants such as the
clove oil is considered safe, so it has more consumer
preference than the chemical antimicrobial agent
(Han, 2003). Therefore, the oils have been
developed for widespread applications such as food
preservatives (Cui et al., 2015), active packaging
(Hosseini et al., 2009), and textiles (Kim and
Sharma, 2011). However, clove oils are easily
oxidized and have a strong smell, so they are not
suitable for long-term use. The encapsulation
process had been known could reduce those
weaknesses (Kfoury et al., 2016).
Encapsulation is the process through which one
substance or a combination of materials is coated or
trapped in another material or system. The coated
material is referred to as active or core material, and
the coating material is referred to as a shell, wall
material, carrier, or encapsulant (Madene et al.,
2006). Chemical encapsulation using polymerization
technique has been known as easy to be scaled-up,
generically fast, and provides high encapsulation
efficiency (Carvalho et al., 2016).
Many lists of researches regarding encapsulation
by polymerization method, but only a few were
using the essential oil, especially clove oil, as core
material. Scarfato et al. (2007) provided
encapsulation of essential oils by interfacial
polymerization in o/w emulsion between
polyfunctional isocyanates and diamines. They used
essential oils from lemon balm (Melissa officinalis
L.), lavender (Lavandula angustifolia Miller), sage
(Salvia officinalis L.), and thyme (Thymus vulgaris
L.). Liu et al. (2015) proposed a process for
nanocapsules containing cologne essential oil for
textile applications. Methyl methacrylate (MMA)–
styrene (St) copolymer was used as a shell material
to prepare nanocapsules containing cologne essential
oil as a core material by miniemulsion
polymerization. Chung et al. (2013) encapsulated
thyme oil using melamine–formaldehyde
prepolymer.
Nuraeni, C., Rahmi, D., Yunilawati, R., Ratnawati, E., Mailisa, T., Andrianty, T., Irwinanita, Amalia, B. and Riyanto, A.Release Profile of the Antimicrobial Agent from Clove Oil Encapsulated in a Polyurethane Shell.In Proceedings of the 2nd International Conference of Essential Oils (ICEO 2019), pages 25-32ISBN: 978-989-758-456-5Copyright © 2020 by SCITEPRESS – Science and Technology Publications, Lda. All rights reserved
25
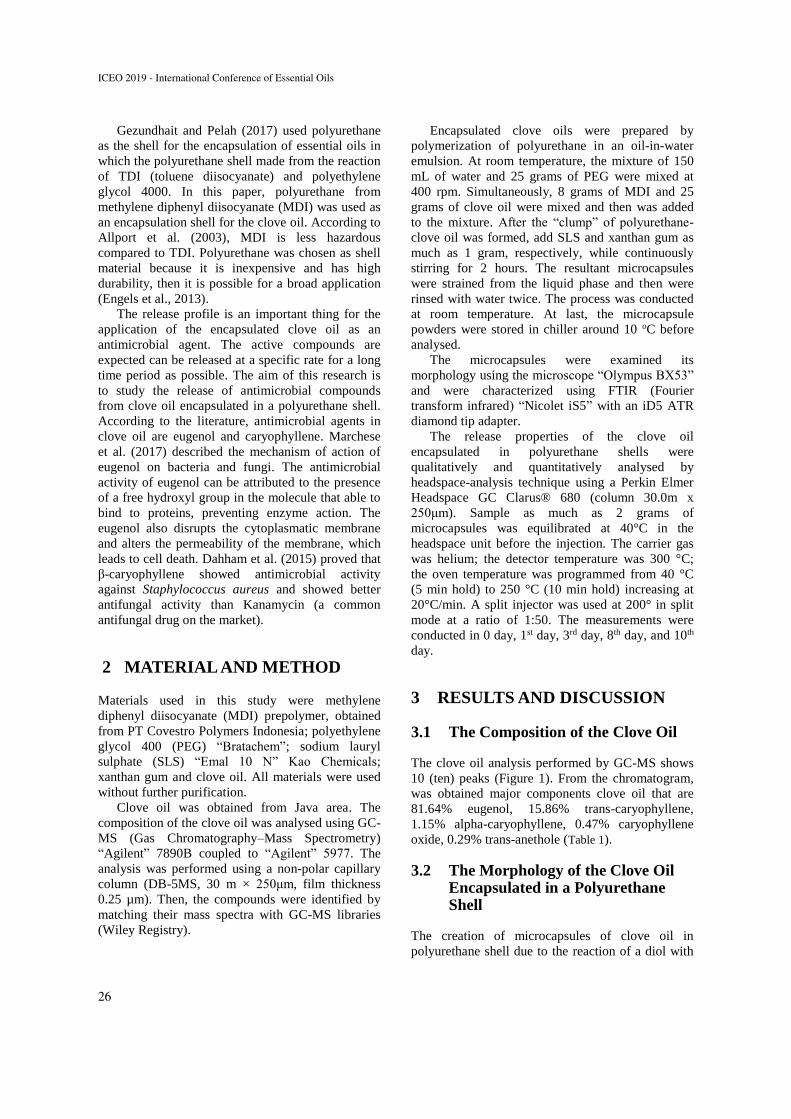
Gezundhait and Pelah (2017) used polyurethane
as the shell for the encapsulation of essential oils in
which the polyurethane shell made from the reaction
of TDI (toluene diisocyanate) and polyethylene
glycol 4000. In this paper, polyurethane from
methylene diphenyl diisocyanate (MDI) was used as
an encapsulation shell for the clove oil. According to
Allport et al. (2003), MDI is less hazardous
compared to TDI. Polyurethane was chosen as shell
material because it is inexpensive and has high
durability, then it is possible for a broad application
(Engels et al., 2013).
The release profile is an important thing for the
application of the encapsulated clove oil as an
antimicrobial agent. The active compounds are
expected can be released at a specific rate for a long
time period as possible. The aim of this research is
to study the release of antimicrobial compounds
from clove oil encapsulated in a polyurethane shell.
According to the literature, antimicrobial agents in
clove oil are eugenol and caryophyllene. Marchese
et al. (2017) described the mechanism of action of
eugenol on bacteria and fungi. The antimicrobial
activity of eugenol can be attributed to the presence
of a free hydroxyl group in the molecule that able to
bind to proteins, preventing enzyme action. The
eugenol also disrupts the cytoplasmatic membrane
and alters the permeability of the membrane, which
leads to cell death. Dahham et al. (2015) proved that
β-caryophyllene showed antimicrobial activity
against Staphylococcus aureus and showed better
antifungal activity than Kanamycin (a common
antifungal drug on the market).
2 MATERIAL AND METHOD
Materials used in this study were methylene
diphenyl diisocyanate (MDI) prepolymer, obtained
from PT Covestro Polymers Indonesia; polyethylene
glycol 400 (PEG) “Bratachem”; sodium lauryl
sulphate (SLS) “Emal 10 N” Kao Chemicals;
xanthan gum and clove oil. All materials were used
without further purification.
Clove oil was obtained from Java area. The
composition of the clove oil was analysed using GC-
MS (Gas Chromatography–Mass Spectrometry)
“Agilent” 7890B coupled to “Agilent” 5977. The
analysis was performed using a non-polar capillary
column (DB-5MS, 30 m × 250μm, film thickness
0.25 µm). Then, the compounds were identified by
matching their mass spectra with GC-MS libraries
(Wiley Registry).
Encapsulated clove oils were prepared by
polymerization of polyurethane in an oil-in-water
emulsion. At room temperature, the mixture of 150
mL of water and 25 grams of PEG were mixed at
400 rpm. Simultaneously, 8 grams of MDI and 25
grams of clove oil were mixed and then was added
to the mixture. After the “clump” of polyurethane-
clove oil was formed, add SLS and xanthan gum as
much as 1 gram, respectively, while continuously
stirring for 2 hours. The resultant microcapsules
were strained from the liquid phase and then were
rinsed with water twice. The process was conducted
at room temperature. At last, the microcapsule
powders were stored in chiller around 10 oC before
analysed.
The microcapsules were examined its
morphology using the microscope “Olympus BX53”
and were characterized using FTIR (Fourier
transform infrared) “Nicolet iS5” with an iD5 ATR
diamond tip adapter.
The release properties of the clove oil
encapsulated in polyurethane shells were
qualitatively and quantitatively analysed by
headspace-analysis technique using a Perkin Elmer
Headspace GC Clarus® 680 (column 30.0m x
250μm). Sample as much as 2 grams of
microcapsules was equilibrated at 40°C in the
headspace unit before the injection. The carrier gas
was helium; the detector temperature was 300 °C;
the oven temperature was programmed from 40 °C
(5 min hold) to 250 °C (10 min hold) increasing at
20°C/min. A split injector was used at 200° in split
mode at a ratio of 1:50. The measurements were
conducted in 0 day, 1st day, 3rd day, 8th day, and 10th
day.
3 RESULTS AND DISCUSSION
3.1 The Composition of the Clove Oil
The clove oil analysis performed by GC-MS shows
10 (ten) peaks (Figure 1). From the chromatogram,
was obtained major components clove oil that are
81.64% eugenol, 15.86% trans-caryophyllene,
1.15% alpha-caryophyllene, 0.47% caryophyllene
oxide, 0.29% trans-anethole (Table 1).
3.2 The Morphology of the Clove Oil Encapsulated in a Polyurethane Shell
The creation of microcapsules of clove oil in
polyurethane shell due to the reaction of a diol with
ICEO 2019 - International Conference of Essential Oils
26
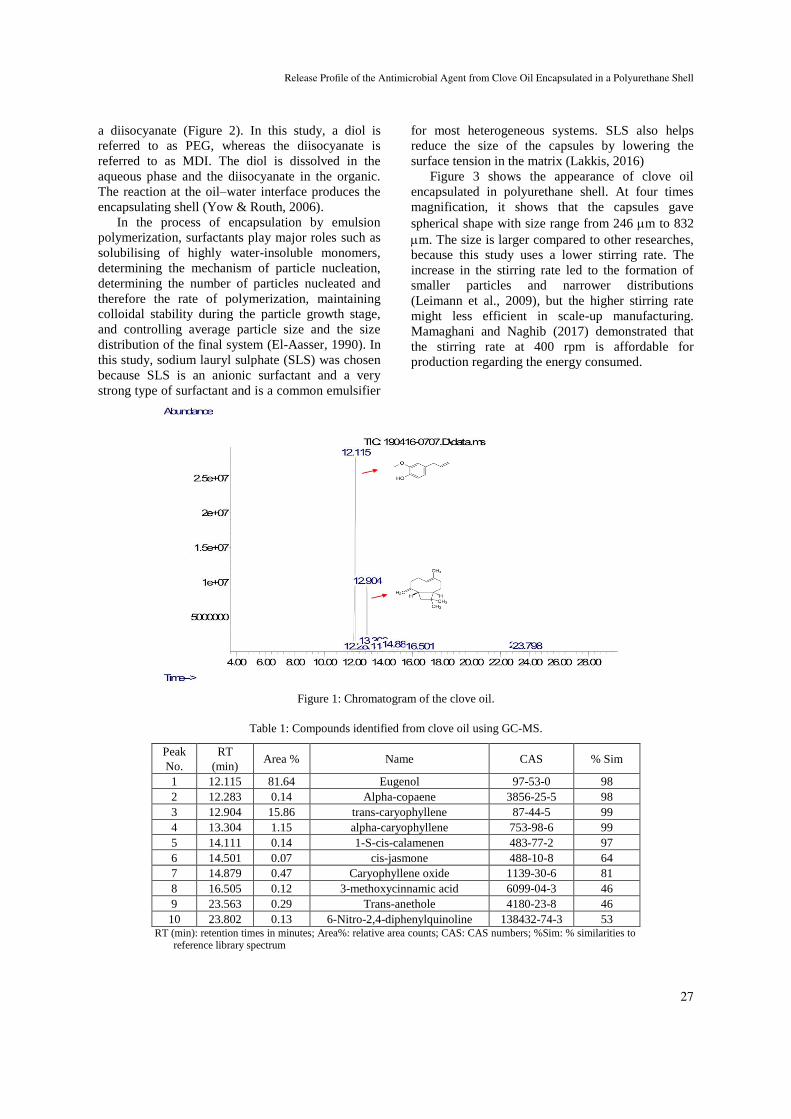
a diisocyanate (Figure 2). In this study, a diol is
referred to as PEG, whereas the diisocyanate is
referred to as MDI. The diol is dissolved in the
aqueous phase and the diisocyanate in the organic.
The reaction at the oil–water interface produces the
encapsulating shell (Yow & Routh, 2006).
In the process of encapsulation by emulsion
polymerization, surfactants play major roles such as
solubilising of highly water-insoluble monomers,
determining the mechanism of particle nucleation,
determining the number of particles nucleated and
therefore the rate of polymerization, maintaining
colloidal stability during the particle growth stage,
and controlling average particle size and the size
distribution of the final system (El-Aasser, 1990). In
this study, sodium lauryl sulphate (SLS) was chosen
because SLS is an anionic surfactant and a very
strong type of surfactant and is a common emulsifier
for most heterogeneous systems. SLS also helps
reduce the size of the capsules by lowering the
surface tension in the matrix (Lakkis, 2016)
Figure 3 shows the appearance of clove oil
encapsulated in polyurethane shell. At four times
magnification, it shows that the capsules gave
spherical shape with size range from 246 m to 832
m. The size is larger compared to other researches,
because this study uses a lower stirring rate. The
increase in the stirring rate led to the formation of
smaller particles and narrower distributions
(Leimann et al., 2009), but the higher stirring rate
might less efficient in scale-up manufacturing.
Mamaghani and Naghib (2017) demonstrated that
the stirring rate at 400 rpm is affordable for
production regarding the energy consumed.
Figure 1: Chromatogram of the clove oil.
Table 1: Compounds identified from clove oil using GC-MS.
Peak
No.
RT
(min) Area % Name CAS % Sim
1 12.115 81.64 Eugenol 97-53-0 98
2 12.283 0.14 Alpha-copaene 3856-25-5 98
3 12.904 15.86 trans-caryophyllene 87-44-5 99
4 13.304 1.15 alpha-caryophyllene 753-98-6 99
5 14.111 0.14 1-S-cis-calamenen 483-77-2 97
6 14.501 0.07 cis-jasmone 488-10-8 64
7 14.879 0.47 Caryophyllene oxide 1139-30-6 81
8 16.505 0.12 3-methoxycinnamic acid 6099-04-3 46
9 23.563 0.29 Trans-anethole 4180-23-8 46
10 23.802 0.13 6-Nitro-2,4-diphenylquinoline 138432-74-3 53 RT (min): retention times in minutes; Area%: relative area counts; CAS: CAS numbers; %Sim: % similarities to
reference library spectrum
Release Profile of the Antimicrobial Agent from Clove Oil Encapsulated in a Polyurethane Shell
27
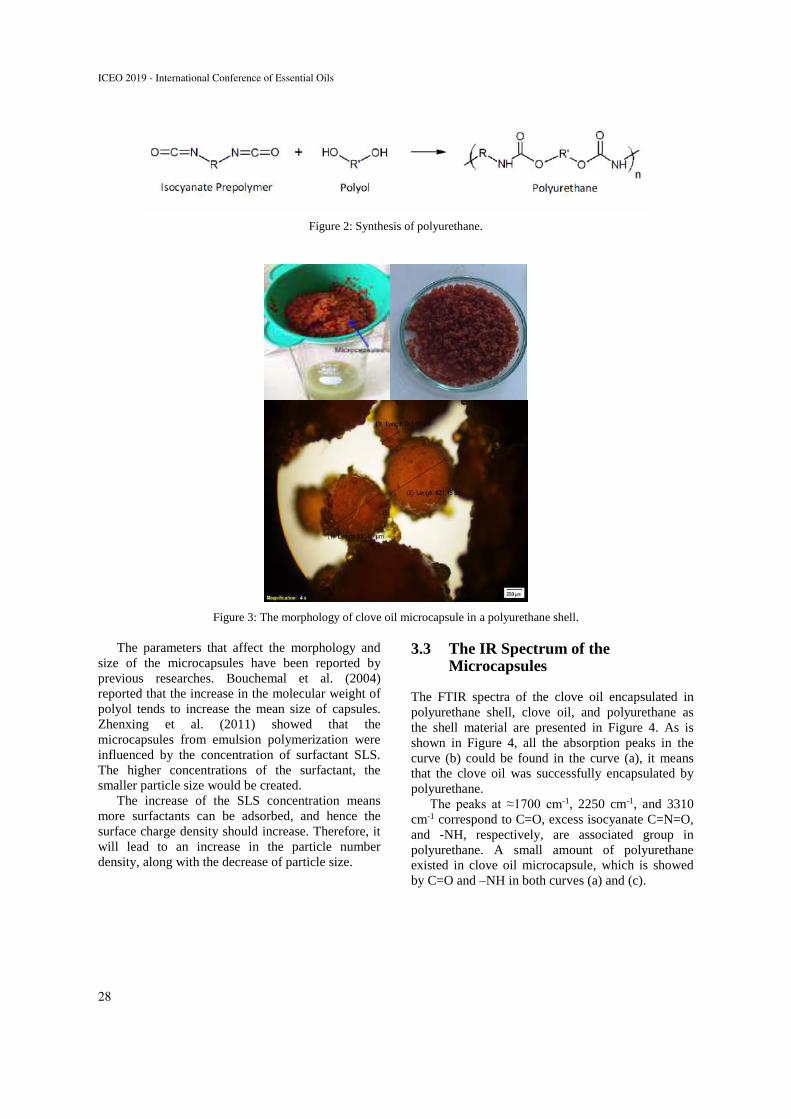
Figure 2: Synthesis of polyurethane.
Figure 3: The morphology of clove oil microcapsule in a polyurethane shell.
The parameters that affect the morphology and
size of the microcapsules have been reported by
previous researches. Bouchemal et al. (2004)
reported that the increase in the molecular weight of
polyol tends to increase the mean size of capsules.
Zhenxing et al. (2011) showed that the
microcapsules from emulsion polymerization were
influenced by the concentration of surfactant SLS.
The higher concentrations of the surfactant, the
smaller particle size would be created.
The increase of the SLS concentration means
more surfactants can be adsorbed, and hence the
surface charge density should increase. Therefore, it
will lead to an increase in the particle number
density, along with the decrease of particle size.
3.3 The IR Spectrum of the Microcapsules
The FTIR spectra of the clove oil encapsulated in
polyurethane shell, clove oil, and polyurethane as
the shell material are presented in Figure 4. As is
shown in Figure 4, all the absorption peaks in the
curve (b) could be found in the curve (a), it means
that the clove oil was successfully encapsulated by
polyurethane.
The peaks at ≈1700 cm-1, 2250 cm-1, and 3310
cm-1 correspond to C=O, excess isocyanate C=N=O,
and -NH, respectively, are associated group in
polyurethane. A small amount of polyurethane
existed in clove oil microcapsule, which is showed
by C=O and –NH in both curves (a) and (c).
ICEO 2019 - International Conference of Essential Oils
28
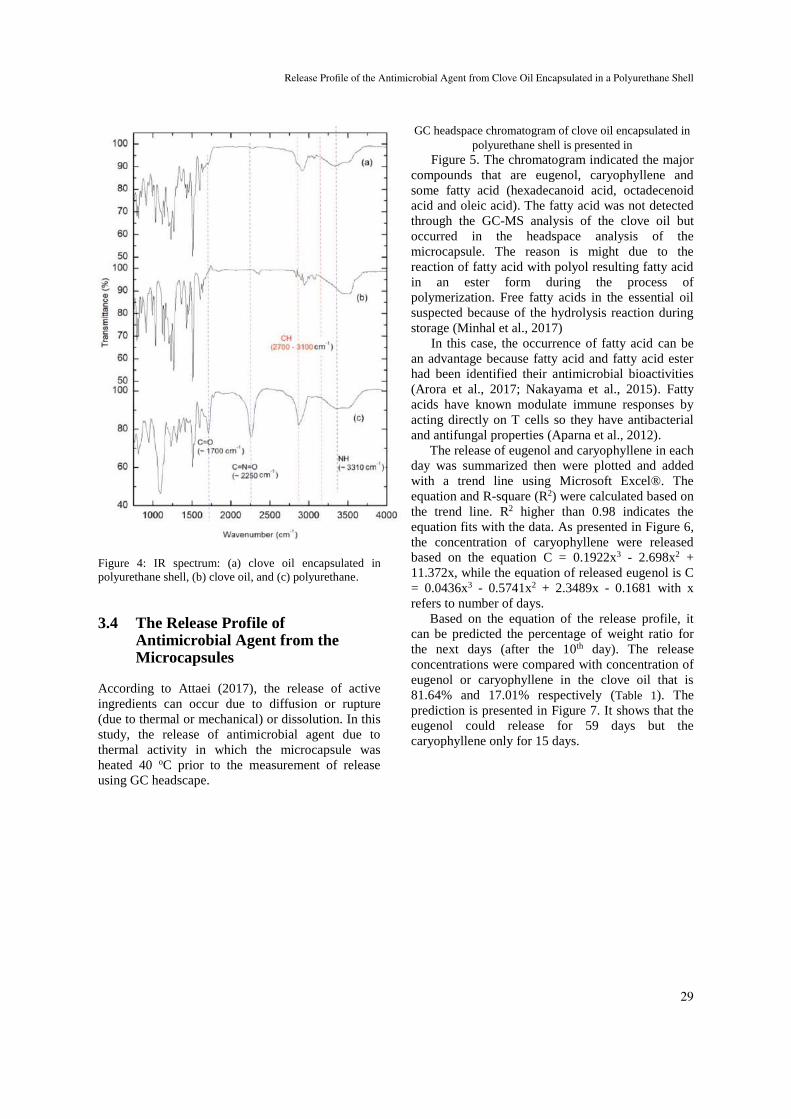
Figure 4: IR spectrum: (a) clove oil encapsulated in
polyurethane shell, (b) clove oil, and (c) polyurethane.
3.4 The Release Profile of Antimicrobial Agent from the Microcapsules
According to Attaei (2017), the release of active
ingredients can occur due to diffusion or rupture
(due to thermal or mechanical) or dissolution. In this
study, the release of antimicrobial agent due to
thermal activity in which the microcapsule was
heated 40 oC prior to the measurement of release
using GC headscape.
GC headspace chromatogram of clove oil encapsulated in
polyurethane shell is presented in
Figure 5. The chromatogram indicated the major
compounds that are eugenol, caryophyllene and
some fatty acid (hexadecanoid acid, octadecenoid
acid and oleic acid). The fatty acid was not detected
through the GC-MS analysis of the clove oil but
occurred in the headspace analysis of the
microcapsule. The reason is might due to the
reaction of fatty acid with polyol resulting fatty acid
in an ester form during the process of
polymerization. Free fatty acids in the essential oil
suspected because of the hydrolysis reaction during
storage (Minhal et al., 2017)
In this case, the occurrence of fatty acid can be
an advantage because fatty acid and fatty acid ester
had been identified their antimicrobial bioactivities
(Arora et al., 2017; Nakayama et al., 2015). Fatty
acids have known modulate immune responses by
acting directly on T cells so they have antibacterial
and antifungal properties (Aparna et al., 2012).
The release of eugenol and caryophyllene in each
day was summarized then were plotted and added
with a trend line using Microsoft Excel®. The
equation and R-square (R2) were calculated based on
the trend line. R2 higher than 0.98 indicates the
equation fits with the data. As presented in Figure 6,
the concentration of caryophyllene were released
based on the equation C = 0.1922x3 - 2.698x2 +
11.372x, while the equation of released eugenol is C
= 0.0436x3 - 0.5741x2 + 2.3489x - 0.1681 with x
refers to number of days.
Based on the equation of the release profile, it
can be predicted the percentage of weight ratio for
the next days (after the 10th day). The release
concentrations were compared with concentration of
eugenol or caryophyllene in the clove oil that is
81.64% and 17.01% respectively (Table 1). The
prediction is presented in Figure 7. It shows that the
eugenol could release for 59 days but the
caryophyllene only for 15 days.
Release Profile of the Antimicrobial Agent from Clove Oil Encapsulated in a Polyurethane Shell
29
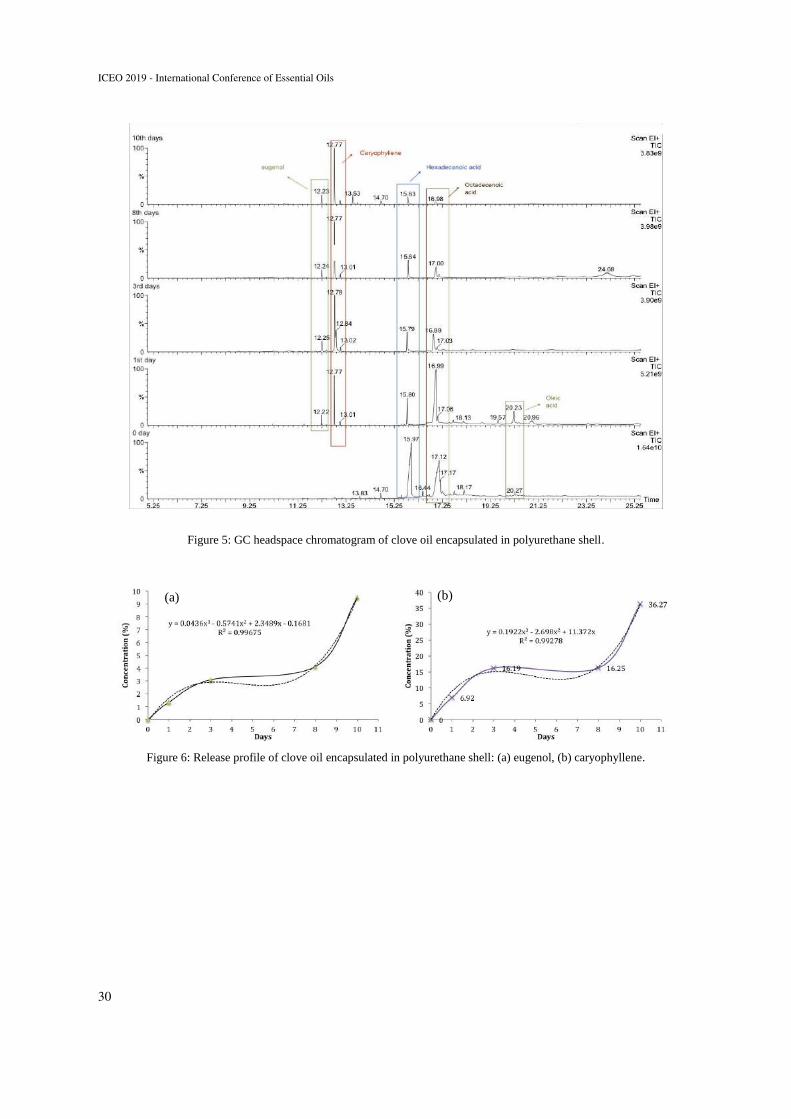
Figure 5: GC headspace chromatogram of clove oil encapsulated in polyurethane shell.
Figure 6: Release profile of clove oil encapsulated in polyurethane shell: (a) eugenol, (b) caryophyllene.
(a) (b)
ICEO 2019 - International Conference of Essential Oils
30
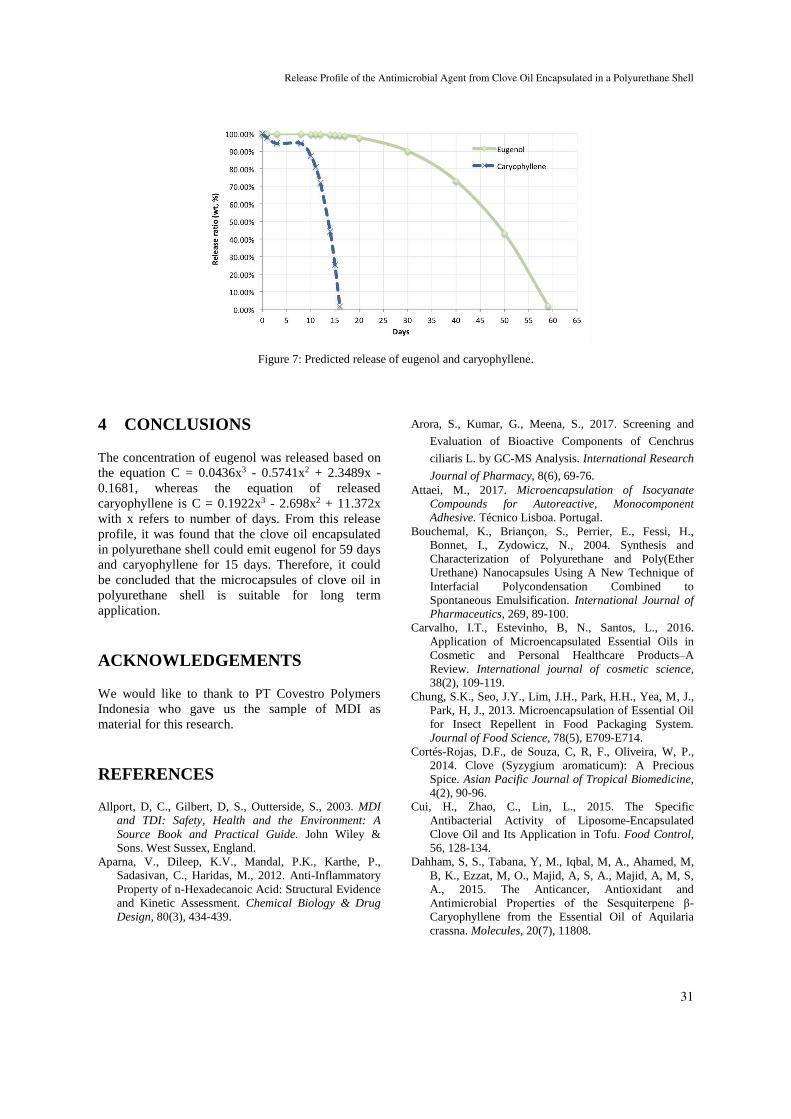
Figure 7: Predicted release of eugenol and caryophyllene.
4 CONCLUSIONS
The concentration of eugenol was released based on
the equation C = 0.0436x3 - 0.5741x2 + 2.3489x -
0.1681, whereas the equation of released
caryophyllene is C = 0.1922x3 - 2.698x2 + 11.372x
with x refers to number of days. From this release
profile, it was found that the clove oil encapsulated
in polyurethane shell could emit eugenol for 59 days
and caryophyllene for 15 days. Therefore, it could
be concluded that the microcapsules of clove oil in
polyurethane shell is suitable for long term
application.
ACKNOWLEDGEMENTS
We would like to thank to PT Covestro Polymers
Indonesia who gave us the sample of MDI as
material for this research.
REFERENCES
Allport, D, C., Gilbert, D, S., Outterside, S., 2003. MDI
and TDI: Safety, Health and the Environment: A
Source Book and Practical Guide. John Wiley &
Sons. West Sussex, England.
Aparna, V., Dileep, K.V., Mandal, P.K., Karthe, P.,
Sadasivan, C., Haridas, M., 2012. Anti-Inflammatory
Property of n-Hexadecanoic Acid: Structural Evidence
and Kinetic Assessment. Chemical Biology & Drug
Design, 80(3), 434-439.
Arora, S., Kumar, G., Meena, S., 2017. Screening and
Evaluation of Bioactive Components of Cenchrus
ciliaris L. by GC-MS Analysis. International Research
Journal of Pharmacy, 8(6), 69-76.
Attaei, M., 2017. Microencapsulation of Isocyanate
Compounds for Autoreactive, Monocomponent
Adhesive. Técnico Lisboa. Portugal.
Bouchemal, K., Briançon, S., Perrier, E., Fessi, H.,
Bonnet, I., Zydowicz, N., 2004. Synthesis and
Characterization of Polyurethane and Poly(Ether
Urethane) Nanocapsules Using A New Technique of
Interfacial Polycondensation Combined to
Spontaneous Emulsification. International Journal of
Pharmaceutics, 269, 89-100.
Carvalho, I.T., Estevinho, B, N., Santos, L., 2016.
Application of Microencapsulated Essential Oils in
Cosmetic and Personal Healthcare Products–A
Review. International journal of cosmetic science,
38(2), 109-119.
Chung, S.K., Seo, J.Y., Lim, J.H., Park, H.H., Yea, M, J.,
Park, H, J., 2013. Microencapsulation of Essential Oil
for Insect Repellent in Food Packaging System.
Journal of Food Science, 78(5), E709-E714.
Cortés-Rojas, D.F., de Souza, C, R, F., Oliveira, W, P.,
2014. Clove (Syzygium aromaticum): A Precious
Spice. Asian Pacific Journal of Tropical Biomedicine,
4(2), 90-96.
Cui, H., Zhao, C., Lin, L., 2015. The Specific
Antibacterial Activity of Liposome-Encapsulated
Clove Oil and Its Application in Tofu. Food Control,
56, 128-134.
Dahham, S, S., Tabana, Y, M., Iqbal, M, A., Ahamed, M,
B, K., Ezzat, M, O., Majid, A, S, A., Majid, A, M, S,
A., 2015. The Anticancer, Antioxidant and
Antimicrobial Properties of the Sesquiterpene β-
Caryophyllene from the Essential Oil of Aquilaria
crassna. Molecules, 20(7), 11808.
Release Profile of the Antimicrobial Agent from Clove Oil Encapsulated in a Polyurethane Shell
31
El-Aasser, M, S., 1990. Emulsion polymerization. In:
Candau, F. & Ottewill, R.H. (eds.). An Introduction to
Polymer Colloids. Springer. Dordrecht. 1st edition.
Engels, H-W., Pirkl, H-G., Albers, R., Albach, R, W.,
Krause, J., Hoffmann, A., Casselmann, H., Dormish,
J., 2013. Polyurethanes: Versatile Materials and
Sustainable Problem Solvers for Today’s Challenges.
Angewandte Chemie International Edition,
52(36):9422-9441.
Gezundhait, Y., Pelah, A., 2017. Non-woven fabric
containing microencapsulated essential oils for
preservation of crops. US 20170245493A1.
Han, J, H., 2003. Antimicrobial Food Packaging. In:
Ahvenainen, R. Cambridge: Woodhead Publishing
Ltd.
Hosseini, M, H., Razavi, S, H., Mousavi, M, A., 2009.
Antimicrobial, Physical and Mechanical Properties of
Chitosan-Based Films Incorporated With Thyme,
Clove and Cinnamon Essential Oils. Journal of Food
Processing and Preservation, 33(6):727-743.
Kfoury, M., Hadaruga, N, G., Hadaruga, D, I.,
Fourmentin, S., 2016. 4 - Cyclodextrins as
Encapsulation Material for Flavors and Aroma.
London. Academic Press.
Kim, J, R., Sharma, S., 2011. Acaricidal Activities of
Clove Bud Oil and Red Thyme Oil using
Microencapsulation Against HDMs. Journal of
Microencapsulation, 28(1):82-91.
Lakkis, J, M., 2016. Encapsulation and Controlled
Release Technologies in Food Systems. Blackwell
Publishing. USA. 1st edition.
Leimann, F, V., Gonçalves, O, H., Machado, R, A, F.,
Bolzan, A., 2009. Antimicrobial Activity of
Microencapsulated Lemongrass Essential Oil and the
Effect of Experimental Parameters on Microcapsules
Size and Morphology. Materials Science and
Engineering, 29(2):430-436.
Liu, C., Liang, B., Shi, G., Li, Z., Zheng, X., Huang, Y.,
Lin, L., 2015. Preparation and Characteristics of
Nanocapsules Containing Essential Oil for textile
Application. Flavour and Fragrance Journal,
30(4):295-301.
Madene, A., Jacquot, M., Scher, J., Desobry, S., 2006.
Flavour Encapsulation and Controlled Release – a
Review. International Journal of Food Science &
Technology, 41(1):1-21.
Mamaghani, K, R., Naghib, S, M., 2017. The Effect of
Stirring Rate on Electrodeposition of Nanocrystalline
Nickel Coatings and Their Corrosion Behaviors and
Mechanical Characteristics. Int. J. Electrochem. Sci.,
12:5023-5035.
Marchese, A., Barbieri, R., Coppo, E., Orhan, I.E., Daglia,
M., Nabavi, S.F., Izadi, M., Abdollahi, M., Nabavi, S,
M., Ajami, M., 2017. Antimicrobial Activity of
Eugenol and Essential Oils Containing Eugenol: A
Mechanistic Viewpoint. Critical Reviews in
Microbiology, 43(6):668-689.
Minhal, L., Harahap, L, A., Daulay, S, B., 2017. Uji Suhu
Uap Pada Alat Penyuling Minyak Atsiri Cengkeh Tipe
Uap Langsung (Temperature Test on Clove Oil
Distillator Direct Steam Type). Jurnal Rekayasa
Pangan dan Pertanian, 5(2):375-378.
Nakayama, M., Tomiyama, D., Ikeda, K., Katsuki, M.,
Nonaka, A., Miyamoto, T., 2015. Antibacterial Effects
of Monoglycerol Fatty Acid Esters and Sucrose Fatty
Acid Esters on Bacillus spp. Food Science and
Technology Research, 21(3):431-437.
Scarfato, P., Avallone, E., Iannelli, P., De Feo, V.,
Acierno, D., 2007. Synthesis and Characterization of
Polyurea Microcapsules Containing Essential Oils
with Antigerminative Activity. Journal of applied
polymer science, 105(6):3568-3577.
Yow, H.N., Routh, A.F., 2006. Formation of Liquid Core–
Polymer Shell Microcapsules. Soft Matter, 2(11):940-
949.
Zhenxing, H., Xiaowei, Y., Junliang, L., Yuping, Y., Ling,
W., Yanwei, Z., 2011. An Investigation of the Effect
of Sodium Dodecyl Sulfate on Quasi-Emulsifier-Free
Emulsion Polymerization for highly Monodisperse
Polystyrene Nanospheres. European Polymer Journal,
47(1):24-30.
ICEO 2019 - International Conference of Essential Oils
32
Lactonization Castor Oil (Ricinus Communis) using Lipase B from
Candida Antarctica Recombined Aspergillus oryzae as Bioflavor
Galuh Alya Stywarni1, Elvina Dhiaul Iftitah1 and Arie Srihardyastutie1 1Department of Chemistry, Faculty of Mathematics and Science, Brawijaya
University, Malang, Indonesia [email protected]
Keywords: Castor Oil (Ricinus communis), Lactonization, Lipase, Bioflavor.
Abstract: Lactone is a widely flavor that is used in food production. Lactonization using microbial or enzyme has natural labelled products, has a higher economic value than artificial products and is safe for the environment. Lactonization of castor oil (Ricinus communis) using lipase B from Candida antarctica recombined Aspergillus oryzae (T = room, 40ºC) for 24, 48 and 72 h were investigated. The lactonization reaction was carried out using a magnetic hotplate stirrer with the reaction system consisting of castor oil, n-hexane solvent, Na2CO3 solution, and lipase biocatalyst. Lactonization castor oil products were analysed using GC-MS. At T = room, the major products were ester: methyl ricinoleate, 53.64% (t = 24 h) and other products were fatty acids and lactone. Lactone: γ-dodecalactone, 1.75% (t = 48 h) was a minor product. Whereas at T = 40ºC, only produced ester, the major product was methyl ricinoleate, 81.33% (t = 72 h).
1 INTRODUCTION
One of the potential sources of natural-based raw materials that are widely used in industry is castor oil. Castor oil consists of thick yellow liquid, has a characteristic odour with a molecular weight of 933.45 g/mol, a density of 0.95 g / cm3 and a boiling point of 313°C (Moradi et al., 2013). The content of castor oil consists of ricinoleic acid, linoleic acid, oleic acid, stearic acid, palmitic acid, dihydroxystearic acid, linoleic acid, and eicosanoic acid (Farbood and Willis, 1985). The main component of castor oil is ricinolein, a glyceride from ricinoleic acid. Ricinoleic acid has three functional groups namely ester linkage, double bonds and hydroxyl groups which are used as sources of renewable raw materials in chemical reactions, modification, and transformation into useful products (Wache et al., 2001). In the food industry, castor oil potential produces bioflavor. Various lipase-producing microbes have been reported as catalyse bioflavor (γ-decalactone) using castor oil substrate or ricinoleic acid (12-hydroxy-9- octadecenoic acid).
γ-Decalactone as a flavouring agent has fruit, creamy, peach, apricot, and fatty taste. In enzymatic biotransformation, the substrate is degraded through α-oxidation to produce 4-hydroxidecanoic acid, then
cyclization to γ-decalactone (Gutman et al., 1989). Based on research by Gotz et al. (2013), immobilized B lipase from Candida antarctica able to catalyse the formation of (S) -γ-valerolactone from a substrate (S) -ethyl-4- hydroxy pentanoate with a yield of 90% (Antczak et al., 1991). According to Gutman et al. (1989), the lactonization reaction rate affected by the hydrophobicity of the solvent, n-hexane solvent is two times faster than ether and four times faster than chloroform (Khan and Rathod, 2018).
2 MATERIALS AND METHODS
2.1 Chemicals and Enzymes
Candida antarctica lipase B (recombinant from Aspergillus oryzae) (1800 U/gram), n- hexane, and sodium carbonate were obtained from Sigma-Aldrich. Castor oil were obtained from Organic Supply Co.
2.2 GC-MS Analysis of Castor Oil (Ricinus communis)
Transesterification reaction castor oil was carried out
Stywarni, G., Iftitah, E. and Srihardyastutie, A.Lactonization Castor Oil (Ricinus Communis) using Lipase B from Candida Antarctica Recombined Aspergillus oryzae as Bioflavor.In Proceedings of the 2nd International Conference of Essential Oils (ICEO 2019), pages 33-36ISBN: 978-989-758-456-5Copyright © 2020 by SCITEPRESS – Science and Technology Publications, Lda. All rights reserved
33
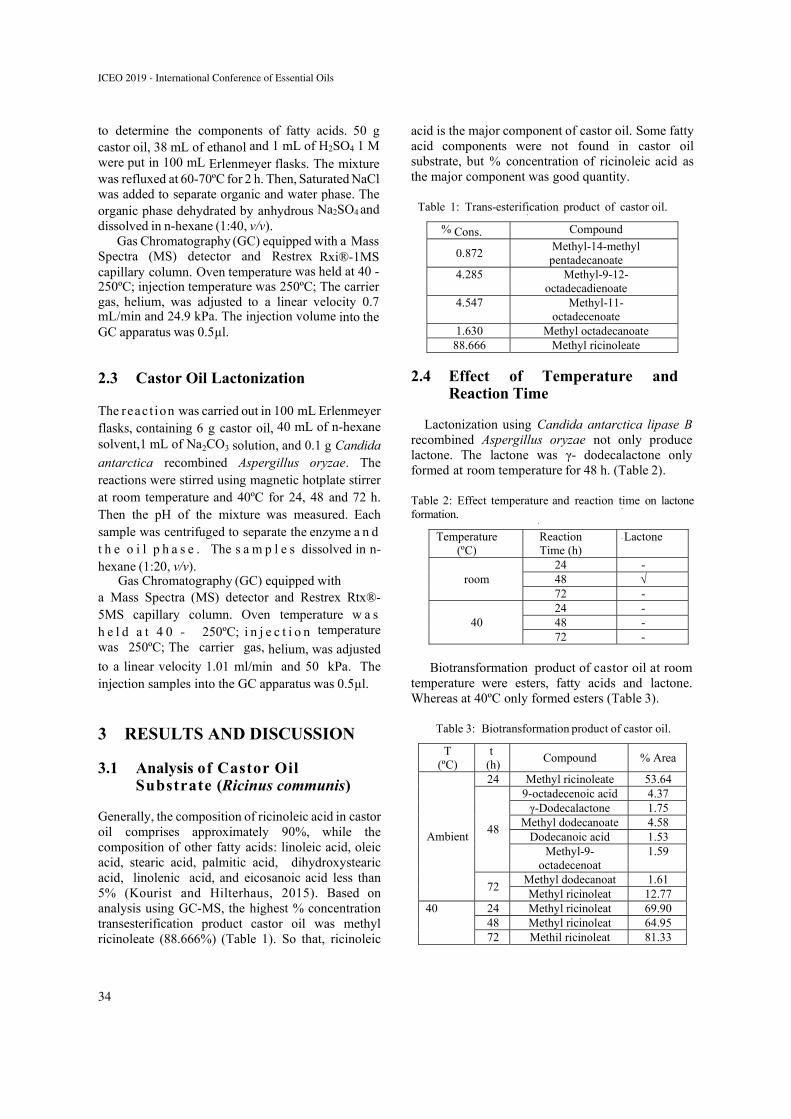
to determine the components of fatty acids. 50 g castor oil, 38 mL of ethanol and 1 mL of H2SO4 1 M were put in 100 mL Erlenmeyer flasks. The mixture was refluxed at 60-70ºC for 2 h. Then, Saturated NaCl was added to separate organic and water phase. The organic phase dehydrated by anhydrous Na2SO4 and dissolved in n-hexane (1:40, v/v).
Gas Chromatography (GC) equipped with a Mass Spectra (MS) detector and Restrex Rxi®-1MS capillary column. Oven temperature was held at 40 - 250ºC; injection temperature was 250ºC; The carrier gas, helium, was adjusted to a linear velocity 0.7 mL/min and 24.9 kPa. The injection volume into the GC apparatus was 0.5µl.
2.3 Castor Oil Lactonization
The reac t ion was carried out in 100 mL Erlenmeyer flasks, containing 6 g castor oil, 40 mL of n-hexane solvent,1 mL of Na2CO3 solution, and 0.1 g Candida antarctica recombined Aspergillus oryzae. The reactions were stirred using magnetic hotplate stirrer at room temperature and 40ºC for 24, 48 and 72 h. Then the pH of the mixture was measured. Each sample was centrifuged to separate the enzyme a n d t h e o i l p h a s e . The s a m p l e s dissolved in n-hexane (1:20, v/v).
Gas Chromatography (GC) equipped with a Mass Spectra (MS) detector and Restrex Rtx®-5MS capillary column. Oven temperature w a s h e l d a t 4 0 - 250ºC; i n j e c t i o n temperature was 250ºC; The carrier gas, helium, was adjusted to a linear velocity 1.01 ml/min and 50 kPa. The injection samples into the GC apparatus was 0.5µl.
3 RESULTS AND DISCUSSION
3.1 Analysis of Castor Oil Substrate (Ricinus communis)
Generally, the composition of ricinoleic acid in castor oil comprises approximately 90%, while the composition of other fatty acids: linoleic acid, oleic acid, stearic acid, palmitic acid, dihydroxystearic acid, linolenic acid, and eicosanoic acid less than 5% (Kourist and Hilterhaus, 2015). Based on analysis using GC-MS, the highest % concentration transesterification product castor oil was methyl ricinoleate (88.666%) (Table 1). So that, ricinoleic
acid is the major component of castor oil. Some fatty acid components were not found in castor oil substrate, but % concentration of ricinoleic acid as the major component was good quantity.
Table 1: Trans-esterification product of castor oil.
% Cons. Compound
0.872 Methyl-14-methyl pentadecanoate
4.285 Methyl-9-12-octadecadienoate
4.547 Methyl-11-octadecenoate
1.630 Methyl octadecanoate 88.666 Methyl ricinoleate
2.4 Effect of Temperature and Reaction Time
Lactonization using Candida antarctica lipase B recombined Aspergillus oryzae not only produce lactone. The lactone was γ- dodecalactone only formed at room temperature for 48 h. (Table 2).
Table 2: Effect temperature and reaction time on lactone formation.
Temperature (ºC)
Reaction Time (h)
Lactone
room 24 - 48 √ 72 -
40 24 - 48 - 72 -
Biotransformation product of castor oil at room
temperature were esters, fatty acids and lactone. Whereas at 40ºC only formed esters (Table 3).
Table 3: Biotransformation product of castor oil.
T (ºC)
t (h)
Compound % Area
Ambient
24 Methyl ricinoleate 53.64
48
9-octadecenoic acid 4.37 γ-Dodecalactone 1.75
Methyl dodecanoate 4.58 Dodecanoic acid 1.53
Methyl-9- octadecenoat
1.59
72 Methyl dodecanoat 1.61 Methyl ricinoleat 12.77
40 24 Methyl ricinoleat 69.90 48 Methyl ricinoleat 64.95 72 Methil ricinoleat 81.33
ICEO 2019 - International Conference of Essential Oils
34
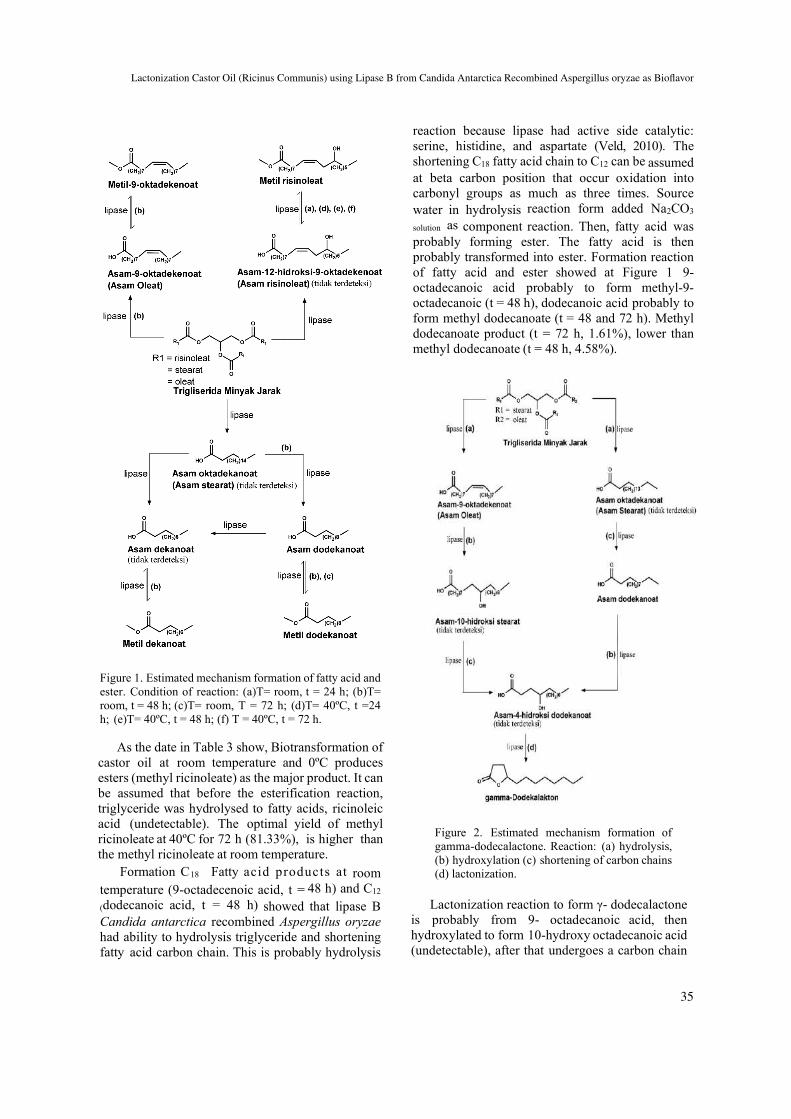
Figure 1. Estimated mechanism formation of fatty acid and ester. Condition of reaction: (a)T= room, t = 24 h; (b)T= room, t = 48 h; (c)T= room, T = 72 h; (d)T= 40ºC, t =24 h; (e)T= 40ºC, t = 48 h; (f) T = 40ºC, t = 72 h.
As the date in Table 3 show, Biotransformation of castor oil at room temperature and 0ºC produces esters (methyl ricinoleate) as the major product. It can be assumed that before the esterification reaction, triglyceride was hydrolysed to fatty acids, ricinoleic acid (undetectable). The optimal yield of methyl ricinoleate at 40ºC for 72 h (81.33%), is higher than the methyl ricinoleate at room temperature.
Formation C18 Fatty acid products at room temperature (9-octadecenoic acid, t = 48 h) and C12
(dodecanoic acid, t = 48 h) showed that lipase B Candida antarctica recombined Aspergillus oryzae had ability to hydrolysis triglyceride and shortening fatty acid carbon chain. This is probably hydrolysis
reaction because lipase had active side catalytic: serine, histidine, and aspartate (Veld, 2010). The shortening C18 fatty acid chain to C12 can be assumed at beta carbon position that occur oxidation into carbonyl groups as much as three times. Source water in hydrolysis reaction form added Na2CO3
solution as component reaction. Then, fatty acid was probably forming ester. The fatty acid is then probably transformed into ester. Formation reaction of fatty acid and ester showed at Figure 1 9-octadecanoic acid probably to form methyl-9-octadecanoic (t = 48 h), dodecanoic acid probably to form methyl dodecanoate (t = 48 and 72 h). Methyl dodecanoate product (t = 72 h, 1.61%), lower than methyl dodecanoate (t = 48 h, 4.58%).
Figure 2. Estimated mechanism formation of gamma-dodecalactone. Reaction: (a) hydrolysis, (b) hydroxylation (c) shortening of carbon chains (d) lactonization.
Lactonization reaction to form γ- dodecalactone is probably from 9- octadecanoic acid, then hydroxylated to form 10-hydroxy octadecanoic acid (undetectable), after that undergoes a carbon chain
Lactonization Castor Oil (Ricinus Communis) using Lipase B from Candida Antarctica Recombined Aspergillus oryzae as Bioflavor
35
shortening to form 4-hydroxy dodecanoic acid (undetectable), and it was occurring lactonization become γ-dodecalactone. Formation of γ-dodecalactone product is also probably from dodecanoic acid (Figure 2). The mechanism of γ-dodecalactone formation (Figure 2) refers to Han et al. (1995) who use Mortierella isabellina on dodecanoic acid substrate and Haffner et al. (1996) using the sporobolomyces odour on 9-octadecanoic acid (oleic acid) that occur hydroxylation (Goswami et al., 2013) to form γ-dodecalactone
The target compound that is γ-decalactone was not formed in biotransformation of castor oil at room temperature and 40ºC, it is estimated that due to ideal biotransformation reaction conditions for esterification, so that the hydroxylation reaction to form ricinoleic acid (not detected) as substrate probably convert quickly to ester (methyl ricinoleate). The formation of another lactone (γ- dodecalactone, 1.75%) as minor product at room temperature for 48 h probably so because the hydrolysis of 9-octadecenoic acid and dodecanoic acid was formed during the 48 h, so that lactonization (intra-esterification reaction) is possible at these time.
4 CONCLUSIONS
Lactonization of castor oil only produces lactone at room temperature for 48 h. The lactone product was γ-dodekalakton as minor product (1.75%). The major products biotransformation was methyl ricinoleat (T=room, t=24 h: 53.64%); (T=room, t= 72 jam: 12.77%); (T=40ºC, t=24 h: 69.90%); (T=40ºC, t=48 h: 64.95%); (T=40ºC, t=72 h 81.33%).
REFERENCES
Antczak, U., Gora J., Antczak, T., Galas, E., 1991. Enzymatic Lactonization of 15-Hydroxypentadecenoic and 16-Hyhroxyhexadecenoic Acids to Macrocyclic Lactones. Enzyme Microbial Technology, 13, 589-593.
Farbood, M, I., Willis B, J., 1985. Production of ᵧ- Decalactone. US Patent, 306, 691.
Goswami, D., Basu, J.K., De, Sirhendu., 2013. Lipase Applications in Oil Hydrolysis with a Case Study on Castor Oil: A Review. Critical Reviews in Biotechnology, 33(1), 81–96.
Gotz, K., Liase, A., Ansorge-Schumacher M., Hilterhalus, L., 2013. A- Chemo-Enzymatic Route to Synthesize (S)-ᵧ- Valerolactone From Levulinic Acid. Application Microbial Biotechnology, 97, 3865-3873.
Gutman, A, L., Zuobi, K., Bravdo, T., 1989. Lipase-Catalyzed Preparation of Optically Active γ- Butyrolactones in Organic Solvent. Journal Organic Chemistry, 55, 3546-3552.
Khan, N, R., Rathod, V, R., 2018. Microwave Assisted Enzymatis Synthesis of Specially Esters: A Mini - Review. Process Biochemistry, Department of Chemical Engineering, India, Institute of Chemical Technology.
Kourist, R., Hilterhaus, R., 2015. Microbial Lactone Synthesis Based on Renewable Resources, Microbiology Monographs, 2, 277-278.
Moradi, H., Asadollahi, M, A., Nahvi, I., 2013. Improved γ-Decalactone Production from Castor Oil by Fed-Batch Cultivation of Yarrowia Lipolytica. Biocatalytic Agriculture Biotechnology, 2(1), 64–68.
Wache, Y., Aguedo, M., Choquet, A., Gatfield, IL., Nicaud, J-M., Belin, J-M., 2001. Role of Beta-Oxidation Enzymes in Gamma-Decalactone Production by the Yeast Yarrowia Lipolytica, Applied And Environmental Microbiology, 67(12), 5700–5704.
Veld, M, A, J., 2010. Candida antarctica Lipase B catalysis inorganic, polymer and supramolecular chemistry:Eindhoven University of Technology.
ICEO 2019 - International Conference of Essential Oils
36
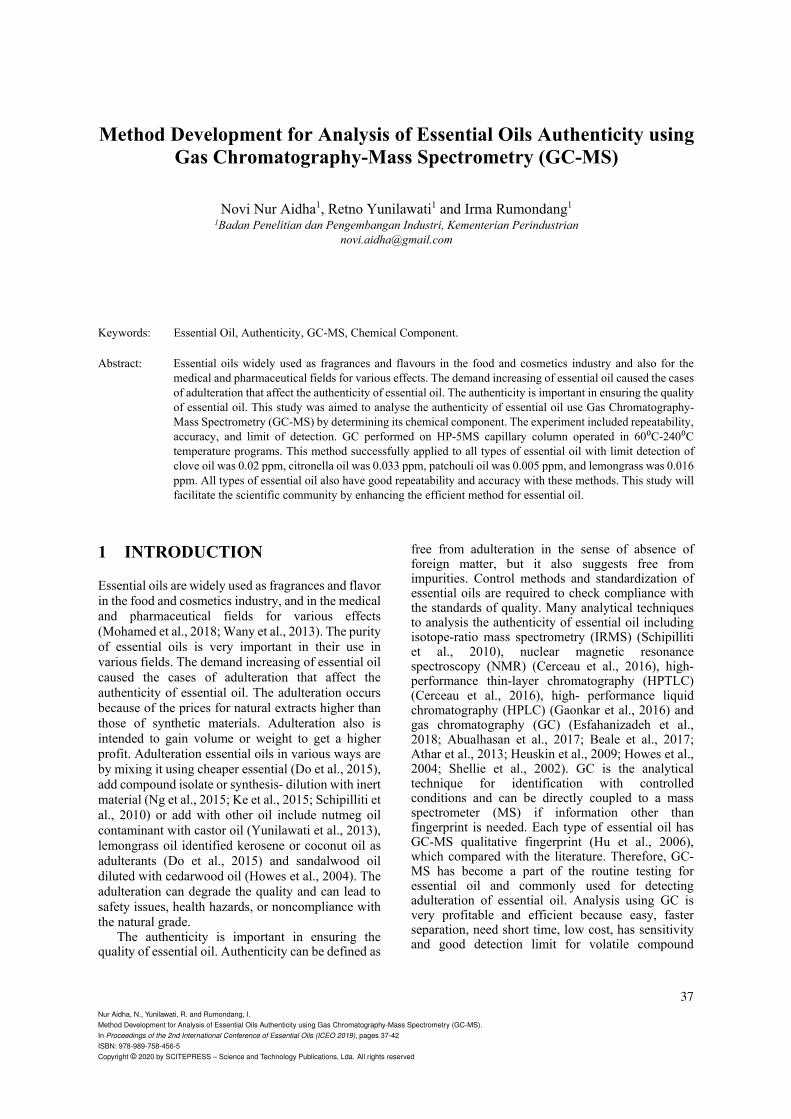
Method Development for Analysis of Essential Oils Authenticity using Gas Chromatography-Mass Spectrometry (GC-MS)
Novi Nur Aidha1, Retno Yunilawati1 and Irma Rumondang1 1Badan Penelitian dan Pengembangan Industri, Kementerian Perindustrian
Keywords: Essential Oil, Authenticity, GC-MS, Chemical Component.
Abstract: Essential oils widely used as fragrances and flavours in the food and cosmetics industry and also for the medical and pharmaceutical fields for various effects. The demand increasing of essential oil caused the cases of adulteration that affect the authenticity of essential oil. The authenticity is important in ensuring the quality of essential oil. This study was aimed to analyse the authenticity of essential oil use Gas Chromatography-Mass Spectrometry (GC-MS) by determining its chemical component. The experiment included repeatability, accuracy, and limit of detection. GC performed on HP-5MS capillary column operated in 60⁰C-240⁰C temperature programs. This method successfully applied to all types of essential oil with limit detection of clove oil was 0.02 ppm, citronella oil was 0.033 ppm, patchouli oil was 0.005 ppm, and lemongrass was 0.016 ppm. All types of essential oil also have good repeatability and accuracy with these methods. This study will facilitate the scientific community by enhancing the efficient method for essential oil.
1 INTRODUCTION
Essential oils are widely used as fragrances and flavor in the food and cosmetics industry, and in the medical and pharmaceutical fields for various effects (Mohamed et al., 2018; Wany et al., 2013). The purity of essential oils is very important in their use in various fields. The demand increasing of essential oil caused the cases of adulteration that affect the authenticity of essential oil. The adulteration occurs because of the prices for natural extracts higher than those of synthetic materials. Adulteration also is intended to gain volume or weight to get a higher profit. Adulteration essential oils in various ways are by mixing it using cheaper essential (Do et al., 2015), add compound isolate or synthesis- dilution with inert material (Ng et al., 2015; Ke et al., 2015; Schipilliti et al., 2010) or add with other oil include nutmeg oil contaminant with castor oil (Yunilawati et al., 2013), lemongrass oil identified kerosene or coconut oil as adulterants (Do et al., 2015) and sandalwood oil diluted with cedarwood oil (Howes et al., 2004). The adulteration can degrade the quality and can lead to safety issues, health hazards, or noncompliance with the natural grade.
The authenticity is important in ensuring the quality of essential oil. Authenticity can be defined as
free from adulteration in the sense of absence of foreign matter, but it also suggests free from impurities. Control methods and standardization of essential oils are required to check compliance with the standards of quality. Many analytical techniques to analysis the authenticity of essential oil including isotope-ratio mass spectrometry (IRMS) (Schipilliti et al., 2010), nuclear magnetic resonance spectroscopy (NMR) (Cerceau et al., 2016), high-performance thin-layer chromatography (HPTLC) (Cerceau et al., 2016), high- performance liquid chromatography (HPLC) (Gaonkar et al., 2016) and gas chromatography (GC) (Esfahanizadeh et al., 2018; Abualhasan et al., 2017; Beale et al., 2017; Athar et al., 2013; Heuskin et al., 2009; Howes et al., 2004; Shellie et al., 2002). GC is the analytical technique for identification with controlled conditions and can be directly coupled to a mass spectrometer (MS) if information other than fingerprint is needed. Each type of essential oil has GC-MS qualitative fingerprint (Hu et al., 2006), which compared with the literature. Therefore, GC-MS has become a part of the routine testing for essential oil and commonly used for detecting adulteration of essential oil. Analysis using GC is very profitable and efficient because easy, faster separation, need short time, low cost, has sensitivity and good detection limit for volatile compound
Nur Aidha, N., Yunilawati, R. and Rumondang, I.Method Development for Analysis of Essential Oils Authenticity using Gas Chromatography-Mass Spectrometry (GC-MS).In Proceedings of the 2nd International Conference of Essential Oils (ICEO 2019), pages 37-42ISBN: 978-989-758-456-5Copyright © 2020 by SCITEPRESS – Science and Technology Publications, Lda. All rights reserved
37
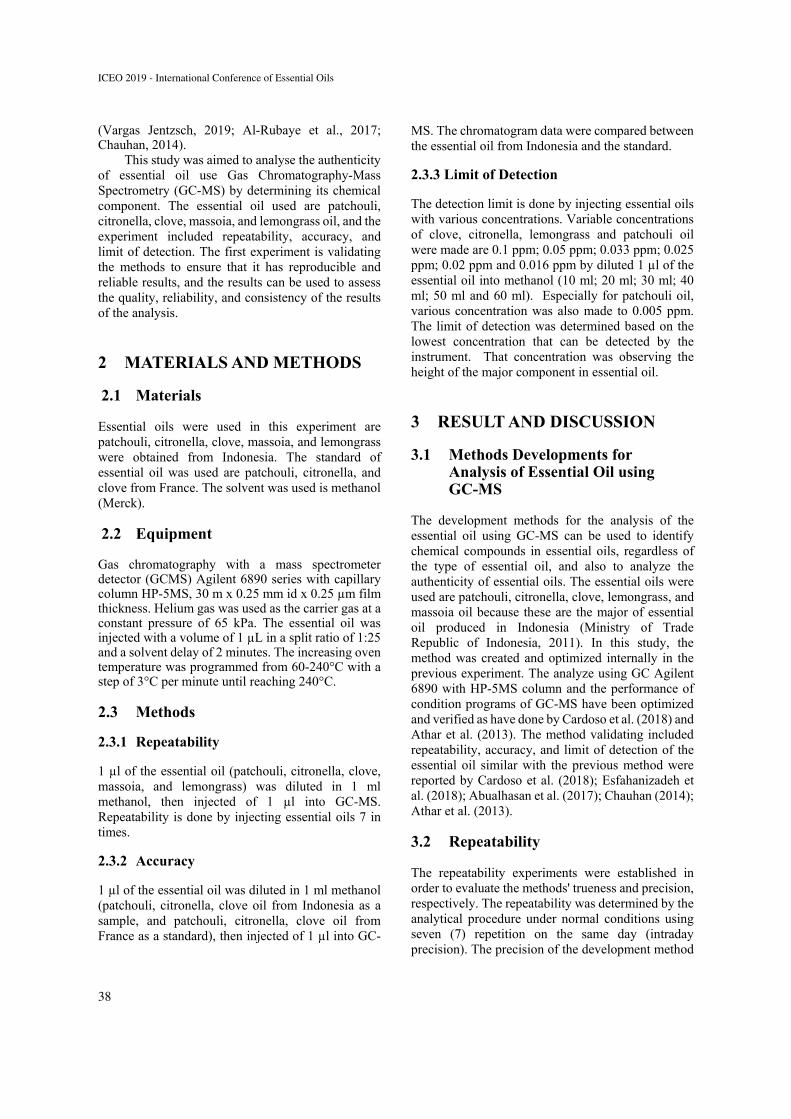
(Vargas Jentzsch, 2019; Al-Rubaye et al., 2017; Chauhan, 2014).
This study was aimed to analyse the authenticity of essential oil use Gas Chromatography-Mass Spectrometry (GC-MS) by determining its chemical component. The essential oil used are patchouli, citronella, clove, massoia, and lemongrass oil, and the experiment included repeatability, accuracy, and limit of detection. The first experiment is validating the methods to ensure that it has reproducible and reliable results, and the results can be used to assess the quality, reliability, and consistency of the results of the analysis.
2 MATERIALS AND METHODS
2.1 Materials
Essential oils were used in this experiment are patchouli, citronella, clove, massoia, and lemongrass were obtained from Indonesia. The standard of essential oil was used are patchouli, citronella, and clove from France. The solvent was used is methanol (Merck).
2.2 Equipment
Gas chromatography with a mass spectrometer detector (GCMS) Agilent 6890 series with capillary column HP-5MS, 30 m x 0.25 mm id x 0.25 µm film thickness. Helium gas was used as the carrier gas at a constant pressure of 65 kPa. The essential oil was injected with a volume of 1 µL in a split ratio of 1:25 and a solvent delay of 2 minutes. The increasing oven temperature was programmed from 60-240°C with a step of 3°C per minute until reaching 240°C.
2.3 Methods
2.3.1 Repeatability
1 µl of the essential oil (patchouli, citronella, clove, massoia, and lemongrass) was diluted in 1 ml methanol, then injected of 1 µl into GC-MS. Repeatability is done by injecting essential oils 7 in times.
2.3.2 Accuracy
1 µl of the essential oil was diluted in 1 ml methanol (patchouli, citronella, clove oil from Indonesia as a sample, and patchouli, citronella, clove oil from France as a standard), then injected of 1 µl into GC-
MS. The chromatogram data were compared between the essential oil from Indonesia and the standard.
2.3.3 Limit of Detection
The detection limit is done by injecting essential oils with various concentrations. Variable concentrations of clove, citronella, lemongrass and patchouli oil were made are 0.1 ppm; 0.05 ppm; 0.033 ppm; 0.025 ppm; 0.02 ppm and 0.016 ppm by diluted 1 µl of the essential oil into methanol (10 ml; 20 ml; 30 ml; 40 ml; 50 ml and 60 ml). Especially for patchouli oil, various concentration was also made to 0.005 ppm. The limit of detection was determined based on the lowest concentration that can be detected by the instrument. That concentration was observing the height of the major component in essential oil.
3 RESULT AND DISCUSSION
3.1 Methods Developments for Analysis of Essential Oil using GC-MS
The development methods for the analysis of the essential oil using GC-MS can be used to identify chemical compounds in essential oils, regardless of the type of essential oil, and also to analyze the authenticity of essential oils. The essential oils were used are patchouli, citronella, clove, lemongrass, and massoia oil because these are the major of essential oil produced in Indonesia (Ministry of Trade Republic of Indonesia, 2011). In this study, the method was created and optimized internally in the previous experiment. The analyze using GC Agilent 6890 with HP-5MS column and the performance of condition programs of GC-MS have been optimized and verified as have done by Cardoso et al. (2018) and Athar et al. (2013). The method validating included repeatability, accuracy, and limit of detection of the essential oil similar with the previous method were reported by Cardoso et al. (2018); Esfahanizadeh et al. (2018); Abualhasan et al. (2017); Chauhan (2014); Athar et al. (2013).
3.2 Repeatability
The repeatability experiments were established in order to evaluate the methods' trueness and precision, respectively. The repeatability was determined by the analytical procedure under normal conditions using seven (7) repetition on the same day (intraday precision). The precision of the development method
ICEO 2019 - International Conference of Essential Oils
38
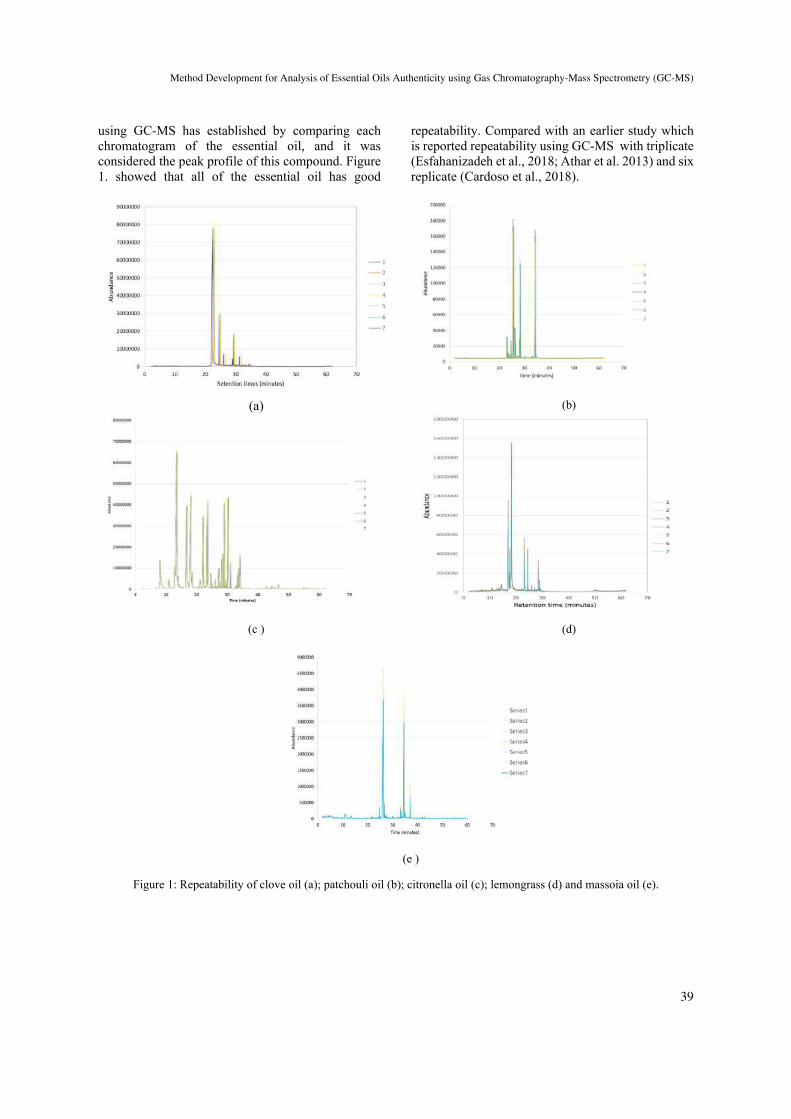
using GC-MS has established by comparing each chromatogram of the essential oil, and it was considered the peak profile of this compound. Figure 1. showed that all of the essential oil has good
repeatability. Compared with an earlier study which is reported repeatability using GC-MS with triplicate (Esfahanizadeh et al., 2018; Athar et al. 2013) and six replicate (Cardoso et al., 2018).
(a) (b)
(c ) (d)
(e )
Figure 1: Repeatability of clove oil (a); patchouli oil (b); citronella oil (c); lemongrass (d) and massoia oil (e).
Method Development for Analysis of Essential Oils Authenticity using Gas Chromatography-Mass Spectrometry (GC-MS)
39
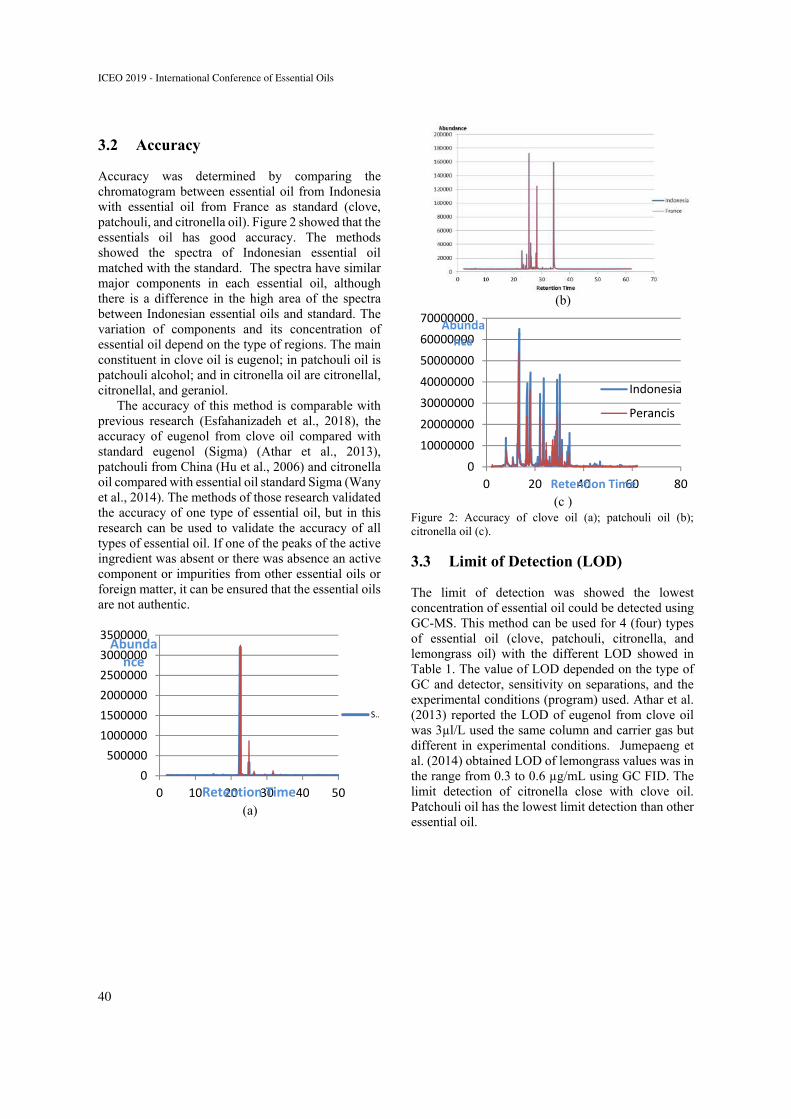
3.2 Accuracy
Accuracy was determined by comparing the chromatogram between essential oil from Indonesia with essential oil from France as standard (clove, patchouli, and citronella oil). Figure 2 showed that the essentials oil has good accuracy. The methods showed the spectra of Indonesian essential oil matched with the standard. The spectra have similar major components in each essential oil, although there is a difference in the high area of the spectra between Indonesian essential oils and standard. The variation of components and its concentration of essential oil depend on the type of regions. The main constituent in clove oil is eugenol; in patchouli oil is patchouli alcohol; and in citronella oil are citronellal, citronellal, and geraniol.
The accuracy of this method is comparable with previous research (Esfahanizadeh et al., 2018), the accuracy of eugenol from clove oil compared with standard eugenol (Sigma) (Athar et al., 2013), patchouli from China (Hu et al., 2006) and citronella oil compared with essential oil standard Sigma (Wany et al., 2014). The methods of those research validated the accuracy of one type of essential oil, but in this research can be used to validate the accuracy of all types of essential oil. If one of the peaks of the active ingredient was absent or there was absence an active component or impurities from other essential oils or foreign matter, it can be ensured that the essential oils are not authentic.
(a)
(b)
(c ) Figure 2: Accuracy of clove oil (a); patchouli oil (b); citronella oil (c).
3.3 Limit of Detection (LOD)
The limit of detection was showed the lowest concentration of essential oil could be detected using GC-MS. This method can be used for 4 (four) types of essential oil (clove, patchouli, citronella, and lemongrass oil) with the different LOD showed in Table 1. The value of LOD depended on the type of GC and detector, sensitivity on separations, and the experimental conditions (program) used. Athar et al. (2013) reported the LOD of eugenol from clove oil was 3µl/L used the same column and carrier gas but different in experimental conditions. Jumepaeng et al. (2014) obtained LOD of lemongrass values was in the range from 0.3 to 0.6 µg/mL using GC FID. The limit detection of citronella close with clove oil. Patchouli oil has the lowest limit detection than other essential oil.
0
500000
1000000
1500000
2000000
2500000
3000000
3500000
0 10 20 30 40 50
Abundance
Retention Time
S…
0
10000000
20000000
30000000
40000000
50000000
60000000
70000000
0 20 40 60 80
Abundance
Retention Time
Indonesia
Perancis
ICEO 2019 - International Conference of Essential Oils
40
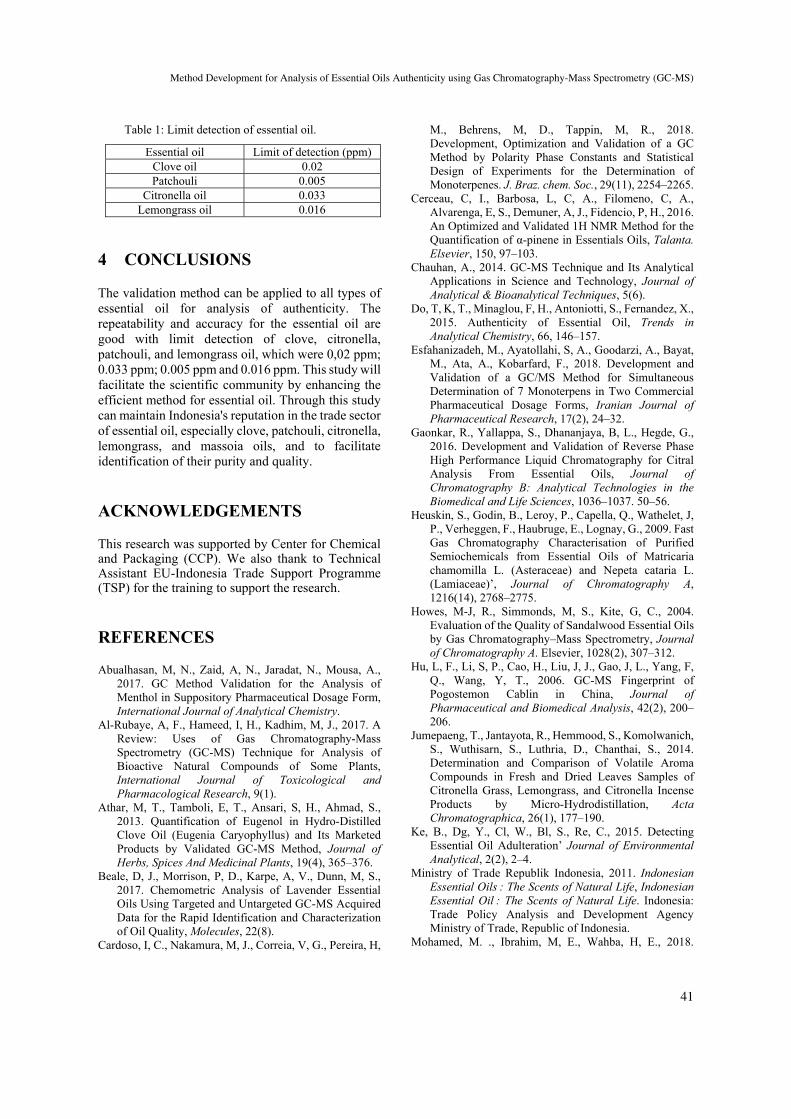
Table 1: Limit detection of essential oil.
Essential oil Limit of detection (ppm) Clove oil 0.02 Patchouli 0.005
Citronella oil 0.033 Lemongrass oil 0.016
4 CONCLUSIONS
The validation method can be applied to all types of essential oil for analysis of authenticity. The repeatability and accuracy for the essential oil are good with limit detection of clove, citronella, patchouli, and lemongrass oil, which were 0,02 ppm; 0.033 ppm; 0.005 ppm and 0.016 ppm. This study will facilitate the scientific community by enhancing the efficient method for essential oil. Through this study can maintain Indonesia's reputation in the trade sector of essential oil, especially clove, patchouli, citronella, lemongrass, and massoia oils, and to facilitate identification of their purity and quality.
ACKNOWLEDGEMENTS
This research was supported by Center for Chemical and Packaging (CCP). We also thank to Technical Assistant EU-Indonesia Trade Support Programme (TSP) for the training to support the research.
REFERENCES
Abualhasan, M, N., Zaid, A, N., Jaradat, N., Mousa, A., 2017. GC Method Validation for the Analysis of Menthol in Suppository Pharmaceutical Dosage Form, International Journal of Analytical Chemistry.
Al-Rubaye, A, F., Hameed, I, H., Kadhim, M, J., 2017. A Review: Uses of Gas Chromatography-Mass Spectrometry (GC-MS) Technique for Analysis of Bioactive Natural Compounds of Some Plants, International Journal of Toxicological and Pharmacological Research, 9(1).
Athar, M, T., Tamboli, E, T., Ansari, S, H., Ahmad, S., 2013. Quantification of Eugenol in Hydro-Distilled Clove Oil (Eugenia Caryophyllus) and Its Marketed Products by Validated GC-MS Method, Journal of Herbs, Spices And Medicinal Plants, 19(4), 365–376.
Beale, D, J., Morrison, P, D., Karpe, A, V., Dunn, M, S., 2017. Chemometric Analysis of Lavender Essential Oils Using Targeted and Untargeted GC-MS Acquired Data for the Rapid Identification and Characterization of Oil Quality, Molecules, 22(8).
Cardoso, I, C., Nakamura, M, J., Correia, V, G., Pereira, H,
M., Behrens, M, D., Tappin, M, R., 2018. Development, Optimization and Validation of a GC Method by Polarity Phase Constants and Statistical Design of Experiments for the Determination of Monoterpenes. J. Braz. chem. Soc., 29(11), 2254–2265.
Cerceau, C, I., Barbosa, L, C, A., Filomeno, C, A., Alvarenga, E, S., Demuner, A, J., Fidencio, P, H., 2016. An Optimized and Validated 1H NMR Method for the Quantification of α-pinene in Essentials Oils, Talanta. Elsevier, 150, 97–103.
Chauhan, A., 2014. GC-MS Technique and Its Analytical Applications in Science and Technology, Journal of Analytical & Bioanalytical Techniques, 5(6).
Do, T, K, T., Minaglou, F, H., Antoniotti, S., Fernandez, X., 2015. Authenticity of Essential Oil, Trends in Analytical Chemistry, 66, 146–157.
Esfahanizadeh, M., Ayatollahi, S, A., Goodarzi, A., Bayat, M., Ata, A., Kobarfard, F., 2018. Development and Validation of a GC/MS Method for Simultaneous Determination of 7 Monoterpens in Two Commercial Pharmaceutical Dosage Forms, Iranian Journal of Pharmaceutical Research, 17(2), 24–32.
Gaonkar, R., Yallappa, S., Dhananjaya, B, L., Hegde, G., 2016. Development and Validation of Reverse Phase High Performance Liquid Chromatography for Citral Analysis From Essential Oils, Journal of Chromatography B: Analytical Technologies in the Biomedical and Life Sciences, 1036–1037. 50–56.
Heuskin, S., Godin, B., Leroy, P., Capella, Q., Wathelet, J, P., Verheggen, F., Haubruge, E., Lognay, G., 2009. Fast Gas Chromatography Characterisation of Purified Semiochemicals from Essential Oils of Matricaria chamomilla L. (Asteraceae) and Nepeta cataria L. (Lamiaceae)’, Journal of Chromatography A, 1216(14), 2768–2775.
Howes, M-J, R., Simmonds, M, S., Kite, G, C., 2004. Evaluation of the Quality of Sandalwood Essential Oils by Gas Chromatography–Mass Spectrometry, Journal of Chromatography A. Elsevier, 1028(2), 307–312.
Hu, L, F., Li, S, P., Cao, H., Liu, J, J., Gao, J, L., Yang, F, Q., Wang, Y, T., 2006. GC-MS Fingerprint of Pogostemon Cablin in China, Journal of Pharmaceutical and Biomedical Analysis, 42(2), 200–206.
Jumepaeng, T., Jantayota, R., Hemmood, S., Komolwanich, S., Wuthisarn, S., Luthria, D., Chanthai, S., 2014. Determination and Comparison of Volatile Aroma Compounds in Fresh and Dried Leaves Samples of Citronella Grass, Lemongrass, and Citronella Incense Products by Micro-Hydrodistillation, Acta Chromatographica, 26(1), 177–190.
Ke, B., Dg, Y., Cl, W., Bl, S., Re, C., 2015. Detecting Essential Oil Adulteration’ Journal of Environmental Analytical, 2(2), 2–4.
Ministry of Trade Republik Indonesia, 2011. Indonesian Essential Oils : The Scents of Natural Life, Indonesian Essential Oil : The Scents of Natural Life. Indonesia: Trade Policy Analysis and Development Agency Ministry of Trade, Republic of Indonesia.
Mohamed, M. ., Ibrahim, M, E., Wahba, H, E., 2018.
Method Development for Analysis of Essential Oils Authenticity using Gas Chromatography-Mass Spectrometry (GC-MS)
41
Flavoring Compounds of Essential Oil Isolated from Agriculture Waste of Coriander (Coriandrum sativum) Plant, Journal of Materials and Environmental Sciences, 9(1), 77–82.
Ng, B, T., Fang, F, E., Bekhit, A, E-D., Wong, J, H., 2015. Methods for the Characterization, Authentication, and Adulteration of Essential Oils, Essential Oils in Food Preservation, Flavor and Safety. Edited by V. R. Preedy. Elsevier Science & Technology.
Schipilliti, L., Tranchida, P, Q., Sciarrone, D., Russo, M., Dugo, P., Dugo, G., Mondello, L., 2010. Genuineness Assessment of Mandarin Essential Oils Employing Gas Chromatography-Combustion-Isotope Ratio MS (GC-C-IRMS)’, Journal of Separation Science, 33(4–5), 617–625.
Shellie, R., Mondello, L., Marriott, P., Dugo, G., 2002. Characterisation of Lavender Essential Oils by Using Gas Chromatography–Mass Spectrometry with Correlation of Linear Retention Indices And Comparison with Comprehensive Two-Dimensional Gas Chromatography, Journal of Chromatography A, 970(1–2), 225–234.
Vargas Jentzsch, P., 2019. Detection of Essential Oils Adulteration: A Quick Overview and Current Challenges, American Journal of Biomedical Science & Research, 4(1), 10–11.
Wany, A., Jha, S., Nigam, V, K., Pandey, D, M., 2013. Chemical Analysis and Therapeutic Uses of Citronella Oil from Cymnopogon Winterianus: A Short Review, International Journal of Advanced Research, 1(6), 504–521. Available at: http://www.journalijar.com/uploads/2013-09 06_030154_471.pdf.
Wany, A., Kumar, A., Nallapeta, S., Jha, S., Nigam, V, K., Pandey, D, M., 2014. Extraction and Characterization of Essential Oil Components Based on Geraniol and Citronellol from Java citronella (Cymbopogon winterianus Jowitt), Plant Growth Regulation, 73(2), 133–145.
Yunilawati, R., Riyanto, A., Aidha, N, N., 2013. Pemurnian Minyak Pala Terkontaminasi untuk mendapatkan Minyak Pala Dengan Mutu sesuai SNI 06-2388-2006, in Prosiding Pertemuan dan Presentasi Ilmiah Standardisasi 2013, 173–182.
ICEO 2019 - International Conference of Essential Oils
42
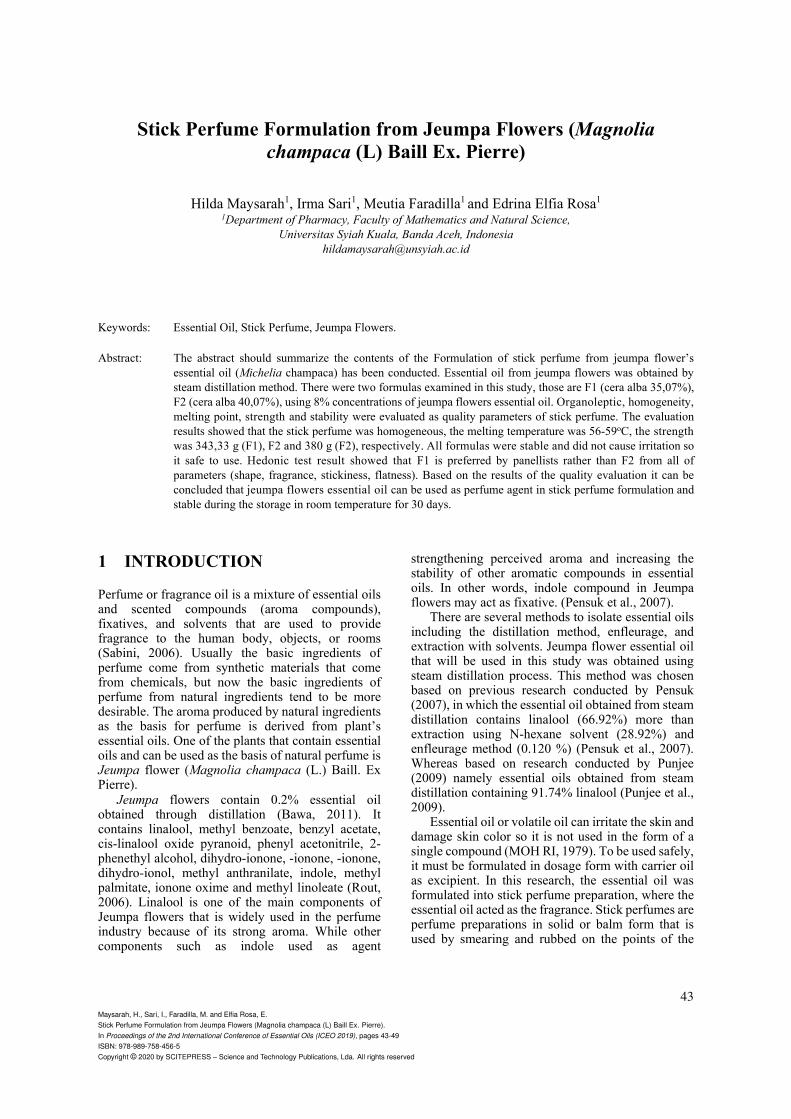
Stick Perfume Formulation from Jeumpa Flowers (Magnolia champaca (L) Baill Ex. Pierre)
Hilda Maysarah1, Irma Sari1, Meutia Faradilla1 and Edrina Elfia Rosa1 1Department of Pharmacy, Faculty of Mathematics and Natural Science,
Universitas Syiah Kuala, Banda Aceh, Indonesia [email protected]
Keywords: Essential Oil, Stick Perfume, Jeumpa Flowers.
Abstract: The abstract should summarize the contents of the Formulation of stick perfume from jeumpa flower’s essential oil (Michelia champaca) has been conducted. Essential oil from jeumpa flowers was obtained by steam distillation method. There were two formulas examined in this study, those are F1 (cera alba 35,07%), F2 (cera alba 40,07%), using 8% concentrations of jeumpa flowers essential oil. Organoleptic, homogeneity, melting point, strength and stability were evaluated as quality parameters of stick perfume. The evaluation results showed that the stick perfume was homogeneous, the melting temperature was 56-59oC, the strength was 343,33 g (F1), F2 and 380 g (F2), respectively. All formulas were stable and did not cause irritation so it safe to use. Hedonic test result showed that F1 is preferred by panellists rather than F2 from all of parameters (shape, fragrance, stickiness, flatness). Based on the results of the quality evaluation it can be concluded that jeumpa flowers essential oil can be used as perfume agent in stick perfume formulation and stable during the storage in room temperature for 30 days.
1 INTRODUCTION
Perfume or fragrance oil is a mixture of essential oils and scented compounds (aroma compounds), fixatives, and solvents that are used to provide fragrance to the human body, objects, or rooms (Sabini, 2006). Usually the basic ingredients of perfume come from synthetic materials that come from chemicals, but now the basic ingredients of perfume from natural ingredients tend to be more desirable. The aroma produced by natural ingredients as the basis for perfume is derived from plant’s essential oils. One of the plants that contain essential oils and can be used as the basis of natural perfume is Jeumpa flower (Magnolia champaca (L.) Baill. Ex Pierre).
Jeumpa flowers contain 0.2% essential oil obtained through distillation (Bawa, 2011). It contains linalool, methyl benzoate, benzyl acetate, cis-linalool oxide pyranoid, phenyl acetonitrile, 2- phenethyl alcohol, dihydro-ionone, -ionone, -ionone, dihydro-ionol, methyl anthranilate, indole, methyl palmitate, ionone oxime and methyl linoleate (Rout, 2006). Linalool is one of the main components of Jeumpa flowers that is widely used in the perfume industry because of its strong aroma. While other components such as indole used as agent
strengthening perceived aroma and increasing the stability of other aromatic compounds in essential oils. In other words, indole compound in Jeumpa flowers may act as fixative. (Pensuk et al., 2007).
There are several methods to isolate essential oils including the distillation method, enfleurage, and extraction with solvents. Jeumpa flower essential oil that will be used in this study was obtained using steam distillation process. This method was chosen based on previous research conducted by Pensuk (2007), in which the essential oil obtained from steam distillation contains linalool (66.92%) more than extraction using N-hexane solvent (28.92%) and enfleurage method (0.120 %) (Pensuk et al., 2007). Whereas based on research conducted by Punjee (2009) namely essential oils obtained from steam distillation containing 91.74% linalool (Punjee et al., 2009).
Essential oil or volatile oil can irritate the skin and damage skin color so it is not used in the form of a single compound (MOH RI, 1979). To be used safely, it must be formulated in dosage form with carrier oil as excipient. In this research, the essential oil was formulated into stick perfume preparation, where the essential oil acted as the fragrance. Stick perfumes are perfume preparations in solid or balm form that is used by smearing and rubbed on the points of the
Maysarah, H., Sari, I., Faradilla, M. and Elfia Rosa, E.Stick Perfume Formulation from Jeumpa Flowers (Magnolia champaca (L) Baill Ex. Pierre).In Proceedings of the 2nd International Conference of Essential Oils (ICEO 2019), pages 43-49ISBN: 978-989-758-456-5Copyright © 2020 by SCITEPRESS – Science and Technology Publications, Lda. All rights reserved
43
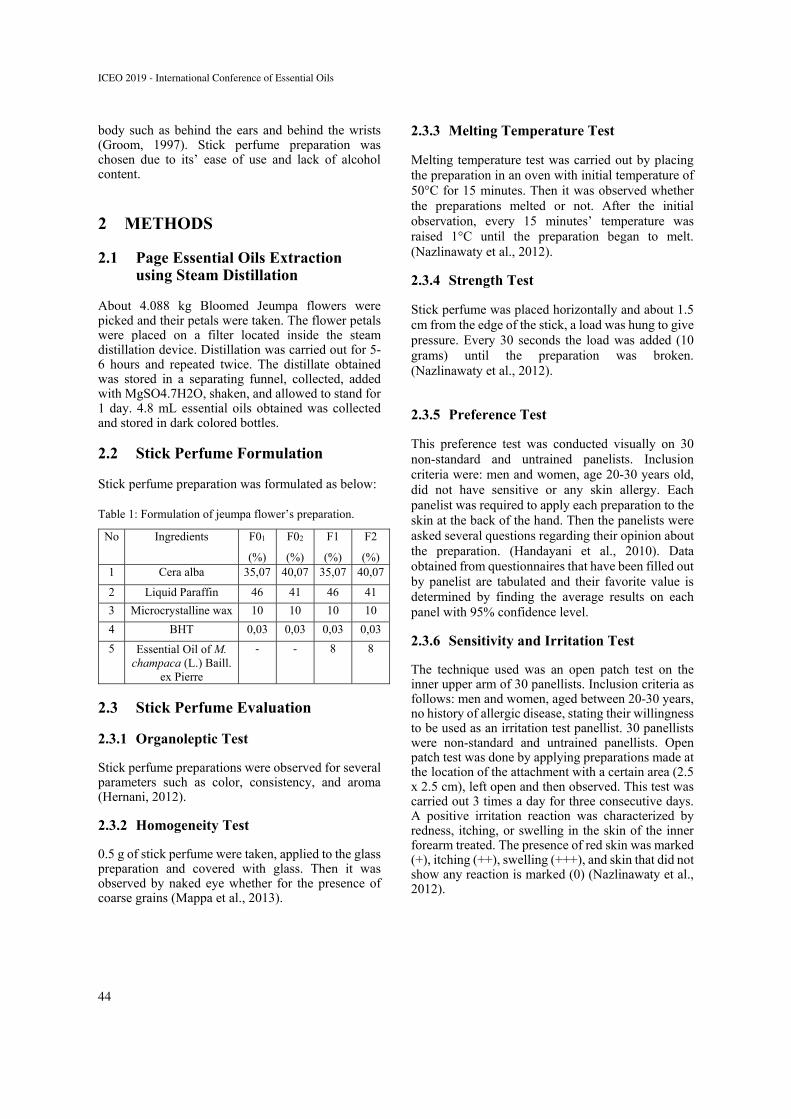
body such as behind the ears and behind the wrists (Groom, 1997). Stick perfume preparation was chosen due to its’ ease of use and lack of alcohol content.
2 METHODS
2.1 Page Essential Oils Extraction using Steam Distillation
About 4.088 kg Bloomed Jeumpa flowers were picked and their petals were taken. The flower petals were placed on a filter located inside the steam distillation device. Distillation was carried out for 5-6 hours and repeated twice. The distillate obtained was stored in a separating funnel, collected, added with MgSO4.7H2O, shaken, and allowed to stand for 1 day. 4.8 mL essential oils obtained was collected and stored in dark colored bottles.
2.2 Stick Perfume Formulation
Stick perfume preparation was formulated as below:
Table 1: Formulation of jeumpa flower’s preparation.
No Ingredients F01
(%)
F02
(%)
F1
(%)
F2
(%) 1 Cera alba 35,07 40,07 35,07 40,07
2 Liquid Paraffin 46 41 46 41
3 Microcrystalline wax 10 10 10 10
4 BHT 0,03 0,03 0,03 0,03
5 Essential Oil of M. champaca (L.) Baill.
ex Pierre
- - 8 8
2.3 Stick Perfume Evaluation
2.3.1 Organoleptic Test
Stick perfume preparations were observed for several parameters such as color, consistency, and aroma (Hernani, 2012).
2.3.2 Homogeneity Test
0.5 g of stick perfume were taken, applied to the glass preparation and covered with glass. Then it was observed by naked eye whether for the presence of coarse grains (Mappa et al., 2013).
2.3.3 Melting Temperature Test
Melting temperature test was carried out by placing the preparation in an oven with initial temperature of 50°C for 15 minutes. Then it was observed whether the preparations melted or not. After the initial observation, every 15 minutes’ temperature was raised 1°C until the preparation began to melt. (Nazlinawaty et al., 2012).
2.3.4 Strength Test
Stick perfume was placed horizontally and about 1.5 cm from the edge of the stick, a load was hung to give pressure. Every 30 seconds the load was added (10 grams) until the preparation was broken. (Nazlinawaty et al., 2012).
2.3.5 Preference Test
This preference test was conducted visually on 30 non-standard and untrained panelists. Inclusion criteria were: men and women, age 20-30 years old, did not have sensitive or any skin allergy. Each panelist was required to apply each preparation to the skin at the back of the hand. Then the panelists were asked several questions regarding their opinion about the preparation. (Handayani et al., 2010). Data obtained from questionnaires that have been filled out by panelist are tabulated and their favorite value is determined by finding the average results on each panel with 95% confidence level.
2.3.6 Sensitivity and Irritation Test
The technique used was an open patch test on the inner upper arm of 30 panellists. Inclusion criteria as follows: men and women, aged between 20-30 years, no history of allergic disease, stating their willingness to be used as an irritation test panellist. 30 panellists were non-standard and untrained panellists. Open patch test was done by applying preparations made at the location of the attachment with a certain area (2.5 x 2.5 cm), left open and then observed. This test was carried out 3 times a day for three consecutive days. A positive irritation reaction was characterized by redness, itching, or swelling in the skin of the inner forearm treated. The presence of red skin was marked (+), itching (++), swelling (+++), and skin that did not show any reaction is marked (0) (Nazlinawaty et al., 2012).
ICEO 2019 - International Conference of Essential Oils
44
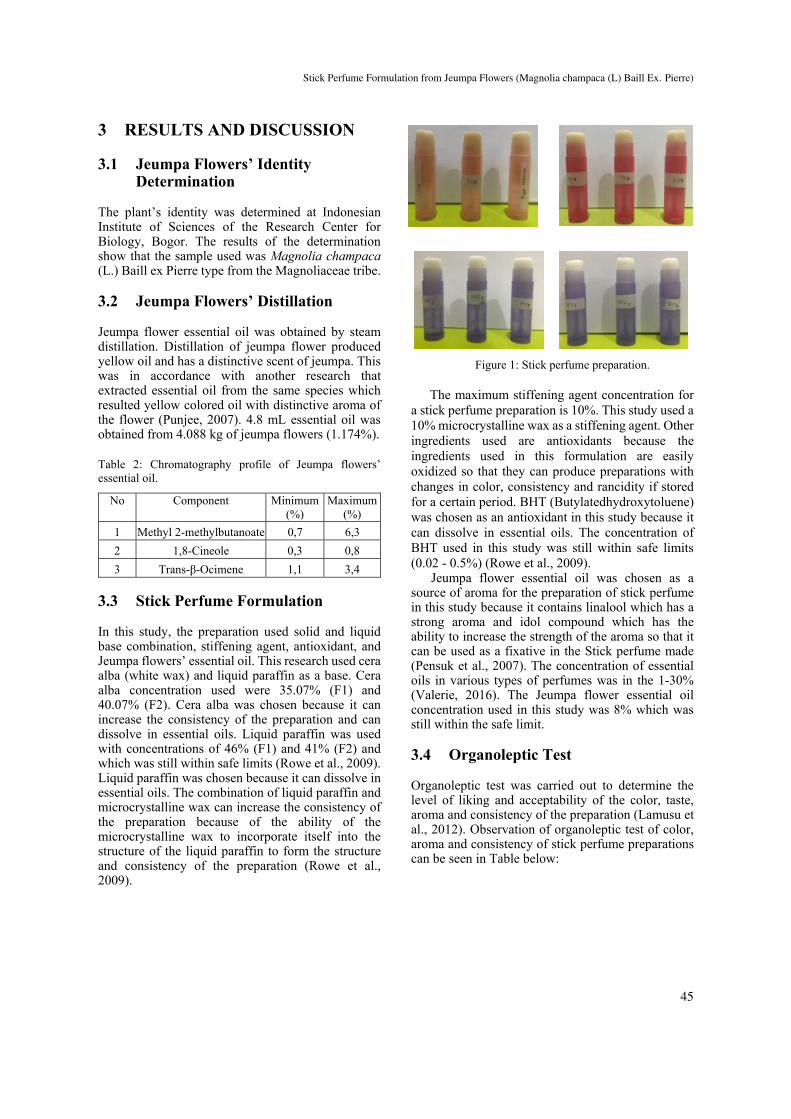
3 RESULTS AND DISCUSSION
3.1 Jeumpa Flowers’ Identity Determination
The plant’s identity was determined at Indonesian Institute of Sciences of the Research Center for Biology, Bogor. The results of the determination show that the sample used was Magnolia champaca (L.) Baill ex Pierre type from the Magnoliaceae tribe.
3.2 Jeumpa Flowers’ Distillation
Jeumpa flower essential oil was obtained by steam distillation. Distillation of jeumpa flower produced yellow oil and has a distinctive scent of jeumpa. This was in accordance with another research that extracted essential oil from the same species which resulted yellow colored oil with distinctive aroma of the flower (Punjee, 2007). 4.8 mL essential oil was obtained from 4.088 kg of jeumpa flowers (1.174%).
Table 2: Chromatography profile of Jeumpa flowers’ essential oil.
No Component Minimum (%)
Maximum (%)
1 Methyl 2-methylbutanoate 0,7 6,3
2 1,8-Cineole 0,3 0,8
3 Trans-β-Ocimene 1,1 3,4
3.3 Stick Perfume Formulation
In this study, the preparation used solid and liquid base combination, stiffening agent, antioxidant, and Jeumpa flowers’ essential oil. This research used cera alba (white wax) and liquid paraffin as a base. Cera alba concentration used were 35.07% (F1) and 40.07% (F2). Cera alba was chosen because it can increase the consistency of the preparation and can dissolve in essential oils. Liquid paraffin was used with concentrations of 46% (F1) and 41% (F2) and which was still within safe limits (Rowe et al., 2009). Liquid paraffin was chosen because it can dissolve in essential oils. The combination of liquid paraffin and microcrystalline wax can increase the consistency of the preparation because of the ability of the microcrystalline wax to incorporate itself into the structure of the liquid paraffin to form the structure and consistency of the preparation (Rowe et al., 2009).
Figure 1: Stick perfume preparation. The maximum stiffening agent concentration for
a stick perfume preparation is 10%. This study used a 10% microcrystalline wax as a stiffening agent. Other ingredients used are antioxidants because the ingredients used in this formulation are easily oxidized so that they can produce preparations with changes in color, consistency and rancidity if stored for a certain period. BHT (Butylatedhydroxytoluene) was chosen as an antioxidant in this study because it can dissolve in essential oils. The concentration of BHT used in this study was still within safe limits (0.02 - 0.5%) (Rowe et al., 2009).
Jeumpa flower essential oil was chosen as a source of aroma for the preparation of stick perfume in this study because it contains linalool which has a strong aroma and idol compound which has the ability to increase the strength of the aroma so that it can be used as a fixative in the Stick perfume made (Pensuk et al., 2007). The concentration of essential oils in various types of perfumes was in the 1-30% (Valerie, 2016). The Jeumpa flower essential oil concentration used in this study was 8% which was still within the safe limit.
3.4 Organoleptic Test
Organoleptic test was carried out to determine the level of liking and acceptability of the color, taste, aroma and consistency of the preparation (Lamusu et al., 2012). Observation of organoleptic test of color, aroma and consistency of stick perfume preparations can be seen in Table below:
Stick Perfume Formulation from Jeumpa Flowers (Magnolia champaca (L) Baill Ex. Pierre)
45
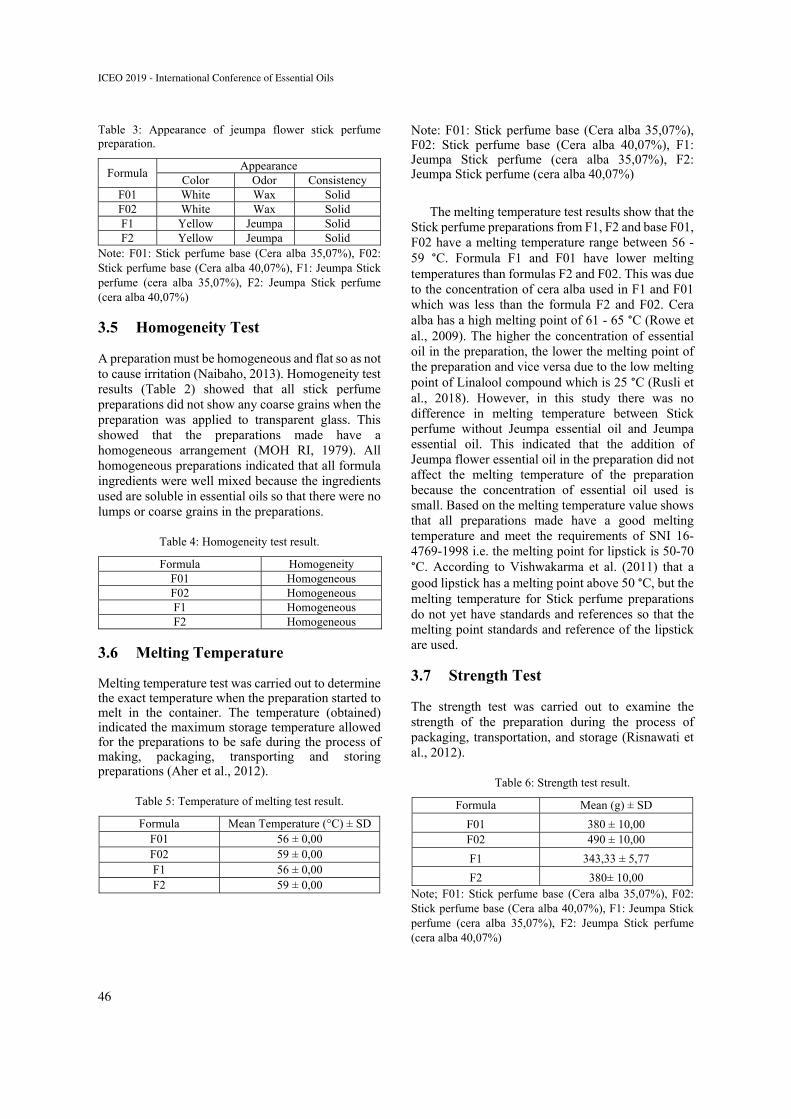
Table 3: Appearance of jeumpa flower stick perfume preparation.
Formula Appearance
Color Odor Consistency F01 White Wax Solid F02 White Wax Solid F1 Yellow Jeumpa Solid F2 Yellow Jeumpa Solid
Note: F01: Stick perfume base (Cera alba 35,07%), F02: Stick perfume base (Cera alba 40,07%), F1: Jeumpa Stick perfume (cera alba 35,07%), F2: Jeumpa Stick perfume (cera alba 40,07%)
3.5 Homogeneity Test
A preparation must be homogeneous and flat so as not to cause irritation (Naibaho, 2013). Homogeneity test results (Table 2) showed that all stick perfume preparations did not show any coarse grains when the preparation was applied to transparent glass. This showed that the preparations made have a homogeneous arrangement (MOH RI, 1979). All homogeneous preparations indicated that all formula ingredients were well mixed because the ingredients used are soluble in essential oils so that there were no lumps or coarse grains in the preparations.
Table 4: Homogeneity test result.
Formula Homogeneity F01 Homogeneous F02 Homogeneous F1 Homogeneous F2 Homogeneous
3.6 Melting Temperature
Melting temperature test was carried out to determine the exact temperature when the preparation started to melt in the container. The temperature (obtained) indicated the maximum storage temperature allowed for the preparations to be safe during the process of making, packaging, transporting and storing preparations (Aher et al., 2012).
Table 5: Temperature of melting test result.
Formula Mean Temperature (°C) ± SD F01 56 ± 0,00 F02 59 ± 0,00 F1 56 ± 0,00 F2 59 ± 0,00
Note: F01: Stick perfume base (Cera alba 35,07%), F02: Stick perfume base (Cera alba 40,07%), F1: Jeumpa Stick perfume (cera alba 35,07%), F2: Jeumpa Stick perfume (cera alba 40,07%)
The melting temperature test results show that the Stick perfume preparations from F1, F2 and base F01, F02 have a melting temperature range between 56 - 59 °C. Formula F1 and F01 have lower melting temperatures than formulas F2 and F02. This was due to the concentration of cera alba used in F1 and F01 which was less than the formula F2 and F02. Cera alba has a high melting point of 61 - 65 °C (Rowe et al., 2009). The higher the concentration of essential oil in the preparation, the lower the melting point of the preparation and vice versa due to the low melting point of Linalool compound which is 25 °C (Rusli et al., 2018). However, in this study there was no difference in melting temperature between Stick perfume without Jeumpa essential oil and Jeumpa essential oil. This indicated that the addition of Jeumpa flower essential oil in the preparation did not affect the melting temperature of the preparation because the concentration of essential oil used is small. Based on the melting temperature value shows that all preparations made have a good melting temperature and meet the requirements of SNI 16-4769-1998 i.e. the melting point for lipstick is 50-70 °C. According to Vishwakarma et al. (2011) that a good lipstick has a melting point above 50 °C, but the melting temperature for Stick perfume preparations do not yet have standards and references so that the melting point standards and reference of the lipstick are used.
3.7 Strength Test
The strength test was carried out to examine the strength of the preparation during the process of packaging, transportation, and storage (Risnawati et al., 2012).
Table 6: Strength test result.
Formula Mean (g) ± SD
F01 380 ± 10,00 F02 490 ± 10,00
F1 343,33 ± 5,77
F2 380± 10,00 Note; F01: Stick perfume base (Cera alba 35,07%), F02: Stick perfume base (Cera alba 40,07%), F1: Jeumpa Stick perfume (cera alba 35,07%), F2: Jeumpa Stick perfume (cera alba 40,07%)
ICEO 2019 - International Conference of Essential Oils
46
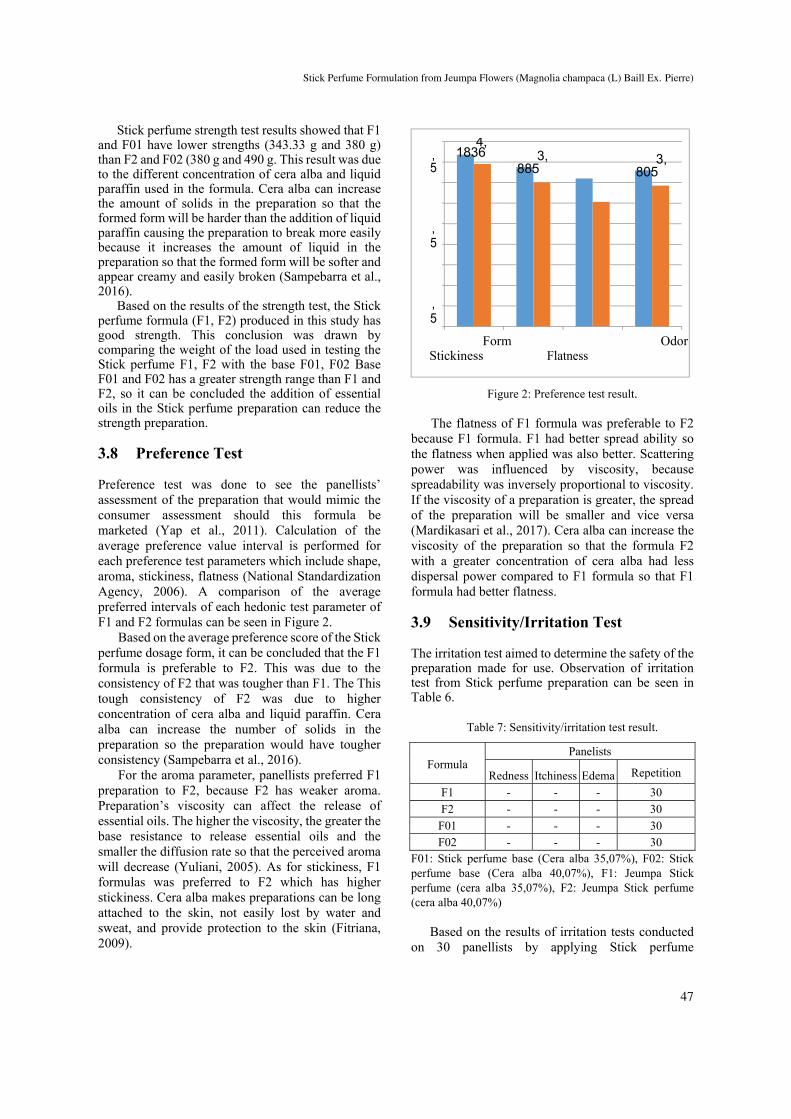
Stick perfume strength test results showed that F1 and F01 have lower strengths (343.33 g and 380 g) than F2 and F02 (380 g and 490 g. This result was due to the different concentration of cera alba and liquid paraffin used in the formula. Cera alba can increase the amount of solids in the preparation so that the formed form will be harder than the addition of liquid paraffin causing the preparation to break more easily because it increases the amount of liquid in the preparation so that the formed form will be softer and appear creamy and easily broken (Sampebarra et al., 2016).
Based on the results of the strength test, the Stick perfume formula (F1, F2) produced in this study has good strength. This conclusion was drawn by comparing the weight of the load used in testing the Stick perfume F1, F2 with the base F01, F02 Base F01 and F02 has a greater strength range than F1 and F2, so it can be concluded the addition of essential oils in the Stick perfume preparation can reduce the strength preparation.
3.8 Preference Test
Preference test was done to see the panellists’ assessment of the preparation that would mimic the consumer assessment should this formula be marketed (Yap et al., 2011). Calculation of the average preference value interval is performed for each preference test parameters which include shape, aroma, stickiness, flatness (National Standardization Agency, 2006). A comparison of the average preferred intervals of each hedonic test parameter of F1 and F2 formulas can be seen in Figure 2.
Based on the average preference score of the Stick perfume dosage form, it can be concluded that the F1 formula is preferable to F2. This was due to the consistency of F2 that was tougher than F1. The This tough consistency of F2 was due to higher concentration of cera alba and liquid paraffin. Cera alba can increase the number of solids in the preparation so the preparation would have tougher consistency (Sampebarra et al., 2016).
For the aroma parameter, panellists preferred F1 preparation to F2, because F2 has weaker aroma. Preparation’s viscosity can affect the release of essential oils. The higher the viscosity, the greater the base resistance to release essential oils and the smaller the diffusion rate so that the perceived aroma will decrease (Yuliani, 2005). As for stickiness, F1 formulas was preferred to F2 which has higher stickiness. Cera alba makes preparations can be long attached to the skin, not easily lost by water and sweat, and provide protection to the skin (Fitriana, 2009).
Figure 2: Preference test result.
The flatness of F1 formula was preferable to F2 because F1 formula. F1 had better spread ability so the flatness when applied was also better. Scattering power was influenced by viscosity, because spreadability was inversely proportional to viscosity. If the viscosity of a preparation is greater, the spread of the preparation will be smaller and vice versa (Mardikasari et al., 2017). Cera alba can increase the viscosity of the preparation so that the formula F2 with a greater concentration of cera alba had less dispersal power compared to F1 formula so that F1 formula had better flatness.
3.9 Sensitivity/Irritation Test
The irritation test aimed to determine the safety of the preparation made for use. Observation of irritation test from Stick perfume preparation can be seen in Table 6.
Table 7: Sensitivity/irritation test result.
Formula
Panelists
Redness Itchiness Edema Repetition
F1 - - - 30
F2 - - - 30
F01 - - - 30 F02 - - - 30
F01: Stick perfume base (Cera alba 35,07%), F02: Stick perfume base (Cera alba 40,07%), F1: Jeumpa Stick perfume (cera alba 35,07%), F2: Jeumpa Stick perfume (cera alba 40,07%)
Based on the results of irritation tests conducted on 30 panellists by applying Stick perfume
Form Odor Stickiness
3,805
3,885
4,1836
Stick Perfume Formulation from Jeumpa Flowers (Magnolia champaca (L) Baill Ex. Pierre)
47
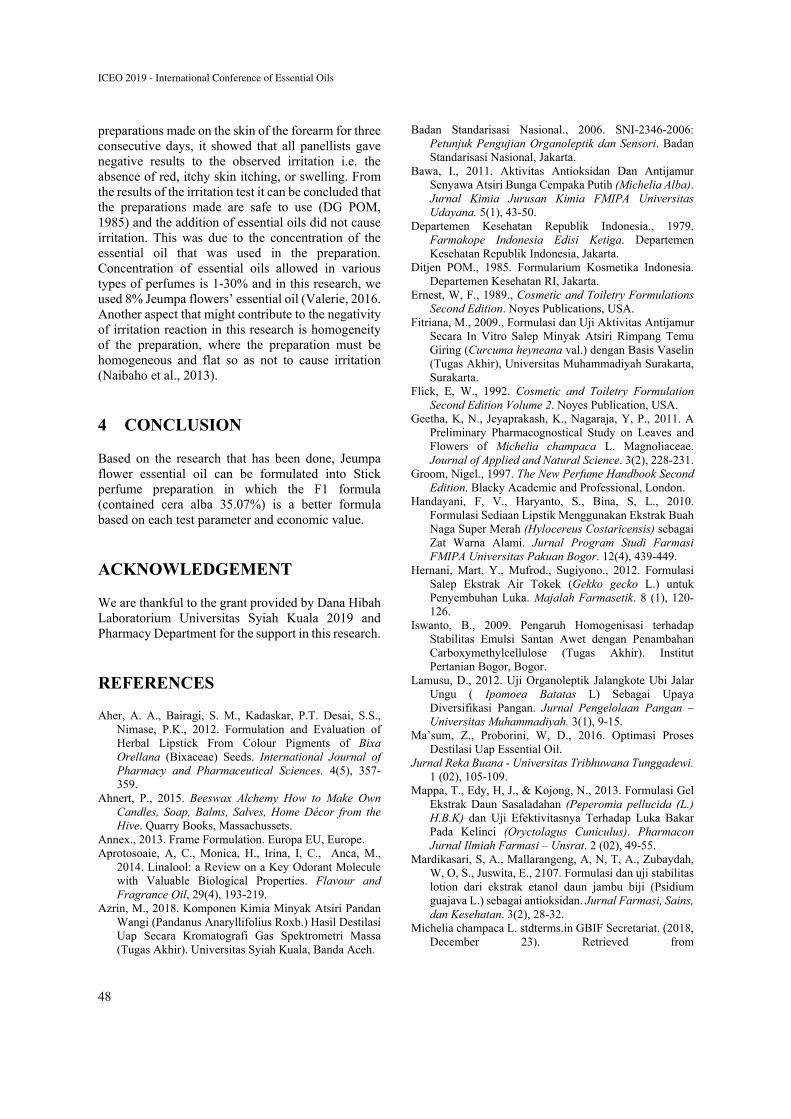
preparations made on the skin of the forearm for three consecutive days, it showed that all panellists gave negative results to the observed irritation i.e. the absence of red, itchy skin itching, or swelling. From the results of the irritation test it can be concluded that the preparations made are safe to use (DG POM, 1985) and the addition of essential oils did not cause irritation. This was due to the concentration of the essential oil that was used in the preparation. Concentration of essential oils allowed in various types of perfumes is 1-30% and in this research, we used 8% Jeumpa flowers’ essential oil (Valerie, 2016. Another aspect that might contribute to the negativity of irritation reaction in this research is homogeneity of the preparation, where the preparation must be homogeneous and flat so as not to cause irritation (Naibaho et al., 2013).
4 CONCLUSION
Based on the research that has been done, Jeumpa flower essential oil can be formulated into Stick perfume preparation in which the F1 formula (contained cera alba 35.07%) is a better formula based on each test parameter and economic value.
ACKNOWLEDGEMENT
We are thankful to the grant provided by Dana Hibah Laboratorium Universitas Syiah Kuala 2019 and Pharmacy Department for the support in this research.
REFERENCES
Aher, A. A., Bairagi, S. M., Kadaskar, P.T. Desai, S.S., Nimase, P.K., 2012. Formulation and Evaluation of Herbal Lipstick From Colour Pigments of Bixa Orellana (Bixaceae) Seeds. International Journal of Pharmacy and Pharmaceutical Sciences. 4(5), 357-359.
Ahnert, P., 2015. Beeswax Alchemy How to Make Own Candles, Soap, Balms, Salves, Home Décor from the Hive. Quarry Books, Massachussets.
Annex., 2013. Frame Formulation. Europa EU, Europe. Aprotosoaie, A, C., Monica, H., Irina, I, C., Anca, M.,
2014. Linalool: a Review on a Key Odorant Molecule with Valuable Biological Properties. Flavour and Fragrance Oil, 29(4), 193-219.
Azrin, M., 2018. Komponen Kimia Minyak Atsiri Pandan Wangi (Pandanus Anaryllifolius Roxb.) Hasil Destilasi Uap Secara Kromatografi Gas Spektrometri Massa (Tugas Akhir). Universitas Syiah Kuala, Banda Aceh.
Badan Standarisasi Nasional., 2006. SNI-2346-2006: Petunjuk Pengujian Organoleptik dan Sensori. Badan Standarisasi Nasional, Jakarta.
Bawa, I., 2011. Aktivitas Antioksidan Dan Antijamur Senyawa Atsiri Bunga Cempaka Putih (Michelia Alba). Jurnal Kimia Jurusan Kimia FMIPA Universitas Udayana. 5(1), 43-50.
Departemen Kesehatan Republik Indonesia., 1979. Farmakope Indonesia Edisi Ketiga. Departemen Kesehatan Republik Indonesia, Jakarta.
Ditjen POM., 1985. Formularium Kosmetika Indonesia. Departemen Kesehatan RI, Jakarta.
Ernest, W, F., 1989., Cosmetic and Toiletry Formulations Second Edition. Noyes Publications, USA.
Fitriana, M., 2009., Formulasi dan Uji Aktivitas Antijamur Secara In Vitro Salep Minyak Atsiri Rimpang Temu Giring (Curcuma heyneana val.) dengan Basis Vaselin (Tugas Akhir), Universitas Muhammadiyah Surakarta, Surakarta.
Flick, E, W., 1992. Cosmetic and Toiletry Formulation Second Edition Volume 2. Noyes Publication, USA.
Geetha, K, N., Jeyaprakash, K., Nagaraja, Y, P., 2011. A Preliminary Pharmacognostical Study on Leaves and Flowers of Michelia champaca L. Magnoliaceae. Journal of Applied and Natural Science. 3(2), 228-231.
Groom, Nigel., 1997. The New Perfume Handbook Second Edition. Blacky Academic and Professional, London.
Handayani, F, V., Haryanto, S., Bina, S, L., 2010. Formulasi Sediaan Lipstik Menggunakan Ekstrak Buah Naga Super Merah (Hylocereus Costaricensis) sebagai Zat Warna Alami. Jurnal Program Studi Farmasi FMIPA Universitas Pakuan Bogor. 12(4), 439-449.
Hernani, Mart, Y., Mufrod., Sugiyono., 2012. Formulasi Salep Ekstrak Air Tokek (Gekko gecko L.) untuk Penyembuhan Luka. Majalah Farmasetik. 8 (1), 120-126.
Iswanto, B., 2009. Pengaruh Homogenisasi terhadap Stabilitas Emulsi Santan Awet dengan Penambahan Carboxymethylcellulose (Tugas Akhir). Institut Pertanian Bogor, Bogor.
Lamusu, D., 2012. Uji Organoleptik Jalangkote Ubi Jalar Ungu ( Ipomoea Batatas L) Sebagai Upaya Diversifikasi Pangan. Jurnal Pengelolaan Pangan – Universitas Muhammadiyah. 3(1), 9-15.
Ma’sum, Z., Proborini, W, D., 2016. Optimasi Proses Destilasi Uap Essential Oil.
Jurnal Reka Buana - Universitas Tribhuwana Tunggadewi. 1 (02), 105-109.
Mappa, T., Edy, H, J., & Kojong, N., 2013. Formulasi Gel Ekstrak Daun Sasaladahan (Peperomia pellucida (L.) H.B.K) dan Uji Efektivitasnya Terhadap Luka Bakar Pada Kelinci (Oryctolagus Cuniculus). Pharmacon Jurnal Ilmiah Farmasi – Unsrat. 2 (02), 49-55.
Mardikasari, S, A., Mallarangeng, A, N, T, A., Zubaydah, W, O, S., Juswita, E., 2107. Formulasi dan uji stabilitas lotion dari ekstrak etanol daun jambu biji (Psidium guajava L.) sebagai antioksidan. Jurnal Farmasi, Sains, dan Kesehatan. 3(2), 28-32.
Michelia champaca L. stdterms.in GBIF Secretariat. (2018, December 23). Retrieved from
ICEO 2019 - International Conference of Essential Oils
48
https://doi.org/10.15468/39omei accessed via GBIF.org.
Naibaho, O, H., Yamlean P, V, Y., Wiyono, W., 2013. Pengaruh Basis Salep terhadap Formulasi Sediaan Salep Ekstrak Daun Kemangi (Ocimum Sanctum L.) pada Kulit Punggung Kelinci yang Dibuat Infeksi Staphylococcus Aureus. Jurnal Ilmiah Farmasi. 2(02), 2302-2493.
Negara, J, K., A, K, Sio., Rifkhan., M, Arifin., A, Y, Oktaviana., R, R, S, Wihansah., M, Yusuf., 2016. Aspek Mikkrobiologis, serta Sensori (Rasa, Warna, Tekstur, Aroma) pada Dua Bentuk Penyajian Keju yang Berbeda, Jurnal Ilmu Produksi dan Teknologi Hasil Peternakan, 4(2), 286-290.
Pensuk, W., Padumanonda, T., Pichaesoonthon., 2007. Comparison of the Chemical Constituents in Michelia alba Flower Oil Extracted by Steam Distillation, Hexane Extraction and Enfleurage Method. Journal of Thai Traditional & Alternative Medicine. 5(1), 30-39.
Punjee, Putthita., Uraiwan, D., Udomlak, S., Srunya, V., Vichai, H., Potechaman, P., Prapassorn, R., 2009. Scented Extracts and Essential Oil Extraction from Michelia alba. Kasestart J. 43(5), 197-203.
Raja S., Ravindranadh, K., 2014. A Complete Profile on Michelia champaca - Traditional Uses, Pharmacological Activities and Phytoconstituents. IJPRS. 3(2), 496-504.
Rismana, E., Rosidah, I., Bunga, O., Yunianto, P., Erna, E., 2015. Pengujian Stabilitas Sediaan Luka Bakar Berbahan Baku Aktif Kitosan/Ekstrak Pegagan(Centella Asiatica). Jurnal Kimia Terapan Indonesia. 17(1), 27-37.
Risnawati, Nazliniwaty., Djendakita, P., 2012. Formulasi Lipstik Menggunakan Ekstrak Biji Coklat (Theobroma cacao L.) sebagai Pewarna. Journal of Pharmacology, Pharmaceutics and Pharmacology. 1(1), 78 – 86.
Rout, K., Prasant., Naik, S, N., Rao, Y, R., 2006). Composition of the Concrete, Absolute, Headspace and Essential Oil of the Flowers of Michelia champaca Linn. Flavour and Fragrance Journal. 21, 906-911.
Rowe, R, C., Paul J, S., Marian, E, Q., 2009. Handbook of Pharmaceutical Excepients 6th Edition. Pharmaceutical Press, USA.
Rusli, N., Rerung, Y, W, R., 2018. Formulasi Sediaan Lilin Aromaterapi Sebagai Anti Nyamuk Dari Minyak Atsiri Daun Nilam (Pogostemon cablin Benth) Kombinasi Minyak Atsiri Buah Jeruk Nipis (Citrus aurantifolia Swingle). Jurnal Mandala Pharmacon Indonesia. 4(1), 68-73.
Sabini, D., 2006. Aplikasi Minyak Atsiri pada Produk Homecare dan Personalcare. Proc. Pengembangan Produk Baru dan Turunannya. Solo. 83-85.
Sampebarra, A, L., 2016. Mempelajari Kestabilan Dan Efek Iritasi Sediaan Lipstik Yang Diformulasi dengan Lemak Kakao. Balai Besar Industri Hasil Perkebunan Makassar. 97-103
Sani, N, S., Racchmawati, R., Mahfud., 2011. Pengambilan Minyak Atsiri dari Melati dengan Metode Enfleurasi dan Ekstraksi Pelarut Menguap. Jurnal Teknik Pomits. 1(1), 1-4.
Sinha, R., Varma, R., 2016. Michelia champaca L. (Swarna Champa): A Review. International Journal of Enhanced Research in Science, Technology & Engineering. 5(8), 205.
Valerie, A, W., 2016. The Complete Book of Essential Oil and Aromatherapy. New World Library, California
Vishwakarma, B., Dwivedi, S., Dubey, K., Joshi, H., 2011. Formulation and Evaluation of Herbal Lipstick. International Journal of Drug Discovery & Herbal Research. 1(1), 18-19.
Wikipedia. Solid Perfume. 2018 (December 23). Retrieved from https://en.wikipedia.org/wiki/Solid_perfume.
Yap, K, C, S., Aminah, A., 2011. Sensory Analysis of Lipstick. International Journal of Cosmetic Science. 33(3), 245-250.
Yuliani, Hartati, S., 2005. Optimasi dan Kontrol Kulaitas Gel Repelan Minyak Atsiri Sereh Jawa: Tinjauan terhadap basis Karboksimetilselulosa. Majalah farmasi Indonesia. 16(4), 197203.
Stick Perfume Formulation from Jeumpa Flowers (Magnolia champaca (L) Baill Ex. Pierre)
49
Antimicrobial Effect of Concord Paper Containing with Lemongrass
Oil against Escherichia coli and Staphylococcus aureus
Bunda Amalia3, Retno Yunilawati1, Windri Handayani2, Agustina Arianita C.3 and Cuk Imawan1 1Department of Physics, Faculty of Mathematics and Natural Sciences (FMIPA) Universitas Indonesia, 16424 Depok,
Indonesia 2Department of Biology, Faculty of Mathematics and Natural Sciences (FMIPA) Universitas Indonesia, 16424 Depok,
Indonesia 3 Badan Penelitian dan Pengembangan Industri, BBKK, Kementerian Perindustrian, Indonesia
Keywords: Lemongrass Oils, Concord Paper, Antimicrobial Activity.
Abstract: The use of an antimicrobial label in food packaging as a form of active packaging is an interesting to
investigate. This label can be used to extend the shelf life of food. Lemongrass oil is one of essential oil that
is potential used as an antimicrobial agent. In this study, the antimicrobial effect of label made from concord
paper which incorporated with lemongrass oil was prepared and tested against the bacteria Escherichia coli
and Staphylococcus aureus using disk inhibition zone method. This antimicrobial label was tested using FTIR
to investigate the interaction between essential oil and the matrix. The lemongrass oil was tested using Gas
Chromatography-Mass Spectrometry to determine the levels and presence of compounds suspected of having
antimicrobial activity. The labels have antibacterial activity against E. coli with the diameter of inhibition
zone maximum about 47.85 mm but not active toward the S. aureus. From the results of the antibacterial test
can be seen that the use of antibacterial label is promising when used for food safety with a prolonged shelf
life.
1 INTRODUCTION
Contamination of food can occur during the process
of harvesting, food processing, packaging and
distribution. Packaging is one of the effective ways to
protect food from contamination from the outside
environment such as air, dust, physical, chemical and
biological impacts such as microbes that cause food
spoilage. Conventional packaging which is widely
used today, cannot actively control the reactions that
occur in food (Mousavi et al., 2018). One of the
packaging technologies that have been developed to
maintain the quality of food and extend the shelf life
of food is to use active packaging. The use of
antimicrobial labels on active packaging is now an
interesting technology for research.
With the aim to reduce the use of additional
chemical substances in food, one way is to use natural
ingredients to inhibit the growth of microbes that
cause food spoilage that does not have a negative
effect on human health (Chiralt and Atar, 2016).
Essential Oil is one of the antimicrobial agents
derived from plant extracts that have antimicrobial
properties. However, this essential has a strong
enough odour that it is rarely used to be added directly
to food because it will damage the taste of the food
itself. Because that reason, it is interested to combine
essential oils into a matrix to reduce the strong odour
as antimicrobial label.
Several studies have been carried out by
combining essential oil such as oregano with cassava
starch/chitosan with oregano essential oil (Pelissari et
al., 2009), alginate with lemongrass oil (Chiralt and
Atar, 2016), and coated paper with Cuminum
cyminum L. and Prubus mahaleb L. in terms of
improving antimicrobial properties (Ezel and Dal,
2018). In this research, lemongrass oil is combined
into a paper matrix. The paper used is Concord paper.
Concord paper which has another name namely
Japanese linen paper is textured paper. By combining
lemongrass oil into the concord, it is hoped that it can
make an effective antimicrobial label which effective
against Eschericha coli and Staphylococcus aureus
which can be used to extend the shelf life of food.
50Amalia, B., Yunilawati, R., Handayani, W., Arianita C., A. and Imawan, C.Antimicrobial Effect of Concord Paper Containing with Lemongrass Oil against Escherichia coli and Staphylococcus aureus.In Proceedings of the 2nd International Conference of Essential Oils (ICEO 2019), pages 50-55ISBN: 978-989-758-456-5Copyright © 2020 by SCITEPRESS – Science and Technology Publications, Lda. All rights reserved
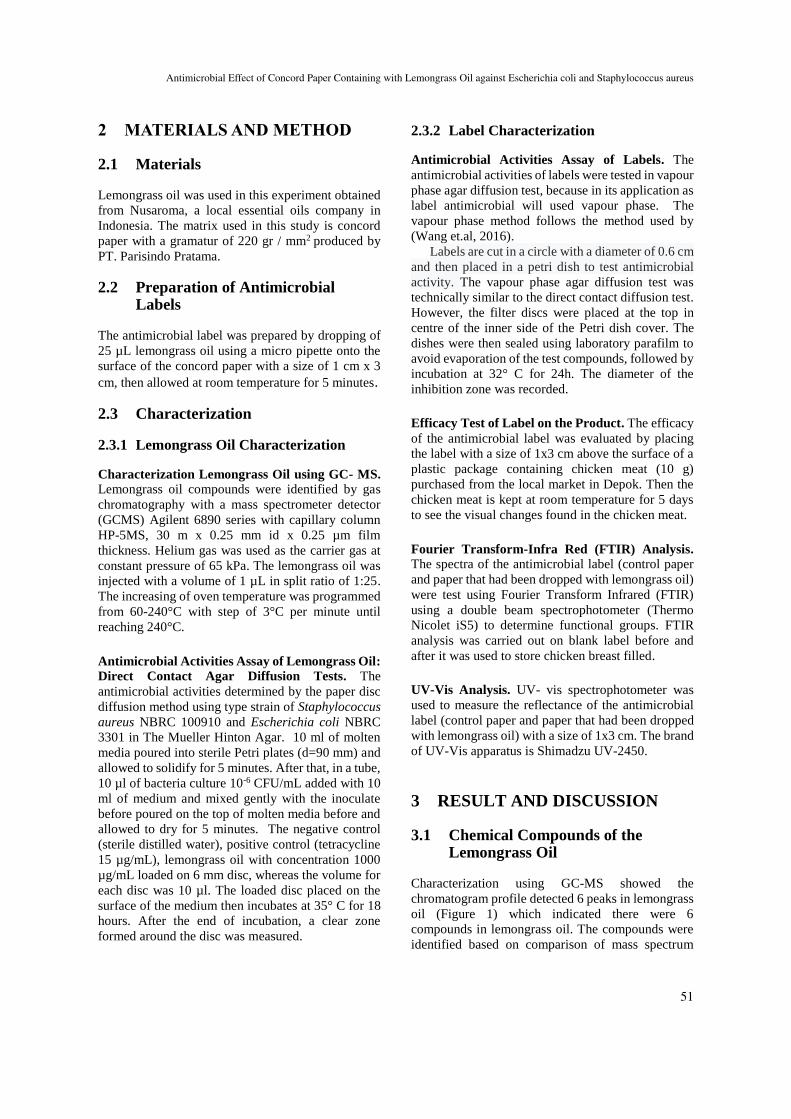
2 MATERIALS AND METHOD
2.1 Materials
Lemongrass oil was used in this experiment obtained
from Nusaroma, a local essential oils company in
Indonesia. The matrix used in this study is concord
paper with a gramatur of 220 gr / mm2 produced by
PT. Parisindo Pratama.
2.2 Preparation of Antimicrobial Labels
The antimicrobial label was prepared by dropping of
25 µL lemongrass oil using a micro pipette onto the
surface of the concord paper with a size of 1 cm x 3
cm, then allowed at room temperature for 5 minutes.
2.3 Characterization
2.3.1 Lemongrass Oil Characterization
Characterization Lemongrass Oil using GC- MS.
Lemongrass oil compounds were identified by gas
chromatography with a mass spectrometer detector
(GCMS) Agilent 6890 series with capillary column
HP-5MS, 30 m x 0.25 mm id x 0.25 µm film
thickness. Helium gas was used as the carrier gas at
constant pressure of 65 kPa. The lemongrass oil was
injected with a volume of 1 µL in split ratio of 1:25.
The increasing of oven temperature was programmed
from 60-240°C with step of 3°C per minute until
reaching 240°C.
Antimicrobial Activities Assay of Lemongrass Oil:
Direct Contact Agar Diffusion Tests. The
antimicrobial activities determined by the paper disc
diffusion method using type strain of Staphylococcus
aureus NBRC 100910 and Escherichia coli NBRC
3301 in The Mueller Hinton Agar. 10 ml of molten
media poured into sterile Petri plates (d=90 mm) and
allowed to solidify for 5 minutes. After that, in a tube,
10 µl of bacteria culture 10-6 CFU/mL added with 10
ml of medium and mixed gently with the inoculate
before poured on the top of molten media before and
allowed to dry for 5 minutes. The negative control
(sterile distilled water), positive control (tetracycline
15 µg/mL), lemongrass oil with concentration 1000
µg/mL loaded on 6 mm disc, whereas the volume for
each disc was 10 µl. The loaded disc placed on the
surface of the medium then incubates at 35° C for 18
hours. After the end of incubation, a clear zone
formed around the disc was measured.
2.3.2 Label Characterization
Antimicrobial Activities Assay of Labels. The
antimicrobial activities of labels were tested in vapour
phase agar diffusion test, because in its application as
label antimicrobial will used vapour phase. The
vapour phase method follows the method used by
(Wang et.al, 2016).
Labels are cut in a circle with a diameter of 0.6 cm
and then placed in a petri dish to test antimicrobial
activity. The vapour phase agar diffusion test was
technically similar to the direct contact diffusion test.
However, the filter discs were placed at the top in
centre of the inner side of the Petri dish cover. The
dishes were then sealed using laboratory parafilm to
avoid evaporation of the test compounds, followed by
incubation at 32° C for 24h. The diameter of the
inhibition zone was recorded.
Efficacy Test of Label on the Product. The efficacy
of the antimicrobial label was evaluated by placing
the label with a size of 1x3 cm above the surface of a
plastic package containing chicken meat (10 g)
purchased from the local market in Depok. Then the
chicken meat is kept at room temperature for 5 days
to see the visual changes found in the chicken meat.
Fourier Transform-Infra Red (FTIR) Analysis.
The spectra of the antimicrobial label (control paper
and paper that had been dropped with lemongrass oil)
were test using Fourier Transform Infrared (FTIR)
using a double beam spectrophotometer (Thermo
Nicolet iS5) to determine functional groups. FTIR
analysis was carried out on blank label before and
after it was used to store chicken breast filled.
UV-Vis Analysis. UV- vis spectrophotometer was
used to measure the reflectance of the antimicrobial
label (control paper and paper that had been dropped
with lemongrass oil) with a size of 1x3 cm. The brand
of UV-Vis apparatus is Shimadzu UV-2450.
3 RESULT AND DISCUSSION
3.1 Chemical Compounds of the Lemongrass Oil
Characterization using GC-MS showed the
chromatogram profile detected 6 peaks in lemongrass
oil (Figure 1) which indicated there were 6
compounds in lemongrass oil. The compounds were
identified based on comparison of mass spectrum
Antimicrobial Effect of Concord Paper Containing with Lemongrass Oil against Escherichia coli and Staphylococcus aureus
51
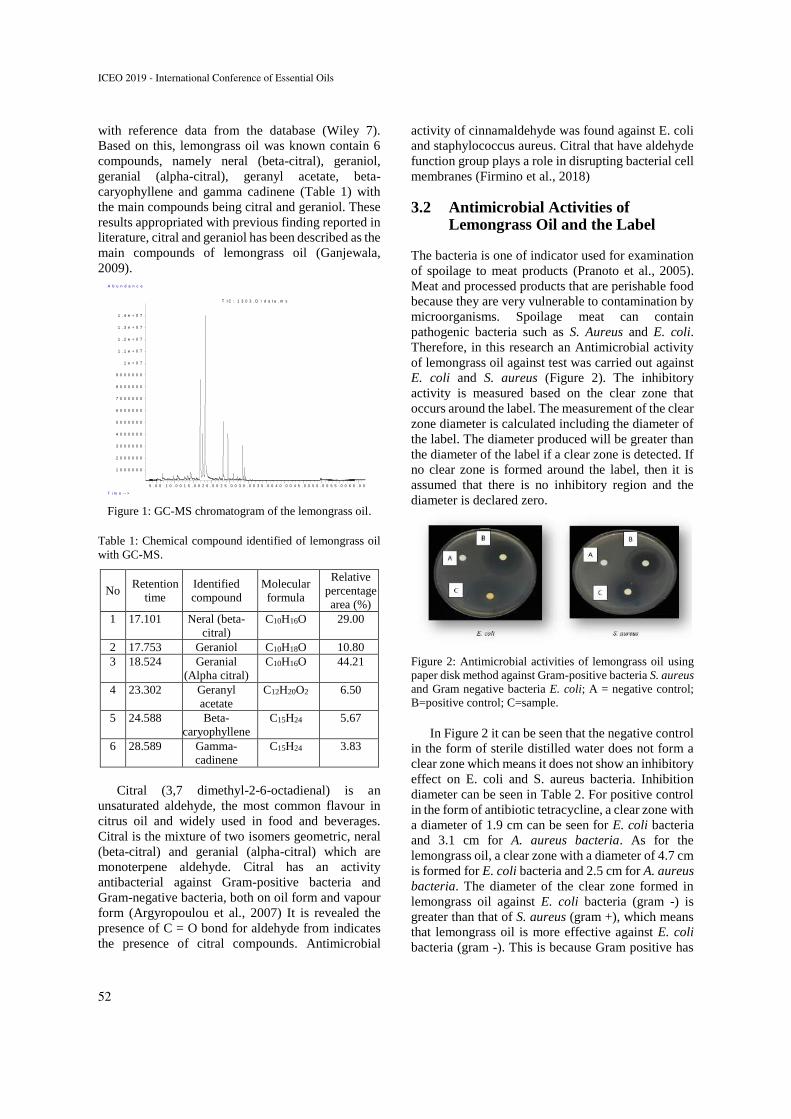
with reference data from the database (Wiley 7).
Based on this, lemongrass oil was known contain 6
compounds, namely neral (beta-citral), geraniol,
geranial (alpha-citral), geranyl acetate, beta-
caryophyllene and gamma cadinene (Table 1) with
the main compounds being citral and geraniol. These
results appropriated with previous finding reported in
literature, citral and geraniol has been described as the
main compounds of lemongrass oil (Ganjewala,
2009).
Figure 1: GC-MS chromatogram of the lemongrass oil.
Table 1: Chemical compound identified of lemongrass oil
with GC-MS.
No Retention
time
Identified
compound
Molecular
formula
Relative
percentage
area (%)
1 17.101 Neral (beta-
citral)
C10H16O 29.00
2 17.753 Geraniol C10H18O 10.80
3 18.524 Geranial
(Alpha citral)
C10H16O 44.21
4 23.302 Geranyl
acetate
C12H20O2 6.50
5 24.588 Beta-
caryophyllene
C15H24 5.67
6 28.589 Gamma-
cadinene
C15H24 3.83
Citral (3,7 dimethyl-2-6-octadienal) is an
unsaturated aldehyde, the most common flavour in
citrus oil and widely used in food and beverages.
Citral is the mixture of two isomers geometric, neral
(beta-citral) and geranial (alpha-citral) which are
monoterpene aldehyde. Citral has an activity
antibacterial against Gram-positive bacteria and
Gram-negative bacteria, both on oil form and vapour
form (Argyropoulou et al., 2007) It is revealed the
presence of C = O bond for aldehyde from indicates
the presence of citral compounds. Antimicrobial
activity of cinnamaldehyde was found against E. coli
and staphylococcus aureus. Citral that have aldehyde
function group plays a role in disrupting bacterial cell
membranes (Firmino et al., 2018)
3.2 Antimicrobial Activities of Lemongrass Oil and the Label
The bacteria is one of indicator used for examination
of spoilage to meat products (Pranoto et al., 2005).
Meat and processed products that are perishable food
because they are very vulnerable to contamination by
microorganisms. Spoilage meat can contain
pathogenic bacteria such as S. Aureus and E. coli.
Therefore, in this research an Antimicrobial activity
of lemongrass oil against test was carried out against
E. coli and S. aureus (Figure 2). The inhibitory
activity is measured based on the clear zone that
occurs around the label. The measurement of the clear
zone diameter is calculated including the diameter of
the label. The diameter produced will be greater than
the diameter of the label if a clear zone is detected. If
no clear zone is formed around the label, then it is
assumed that there is no inhibitory region and the
diameter is declared zero.
Figure 2: Antimicrobial activities of lemongrass oil using
paper disk method against Gram-positive bacteria S. aureus
and Gram negative bacteria E. coli; A = negative control;
B=positive control; C=sample.
In Figure 2 it can be seen that the negative control
in the form of sterile distilled water does not form a
clear zone which means it does not show an inhibitory
effect on E. coli and S. aureus bacteria. Inhibition
diameter can be seen in Table 2. For positive control
in the form of antibiotic tetracycline, a clear zone with
a diameter of 1.9 cm can be seen for E. coli bacteria
and 3.1 cm for A. aureus bacteria. As for the
lemongrass oil, a clear zone with a diameter of 4.7 cm
is formed for E. coli bacteria and 2.5 cm for A. aureus
bacteria. The diameter of the clear zone formed in
lemongrass oil against E. coli bacteria (gram -) is
greater than that of S. aureus (gram +), which means
that lemongrass oil is more effective against E. coli
bacteria (gram -). This is because Gram positive has
5 . 0 0 1 0 . 0 0 1 5 . 0 0 2 0 . 0 0 2 5 . 0 0 3 0 . 0 0 3 5 . 0 0 4 0 . 0 0 4 5 . 0 0 5 0 . 0 0 5 5 . 0 0 6 0 . 0 0
1 0 0 0 0 0 0
2 0 0 0 0 0 0
3 0 0 0 0 0 0
4 0 0 0 0 0 0
5 0 0 0 0 0 0
6 0 0 0 0 0 0
7 0 0 0 0 0 0
8 0 0 0 0 0 0
9 0 0 0 0 0 0
1 e + 0 7
1 . 1 e + 0 7
1 . 2 e + 0 7
1 . 3 e + 0 7
1 . 4 e + 0 7
T i m e - - >
A b u n d a n c e
T I C : 1 3 0 3 . D \ d a t a . m s
ICEO 2019 - International Conference of Essential Oils
52
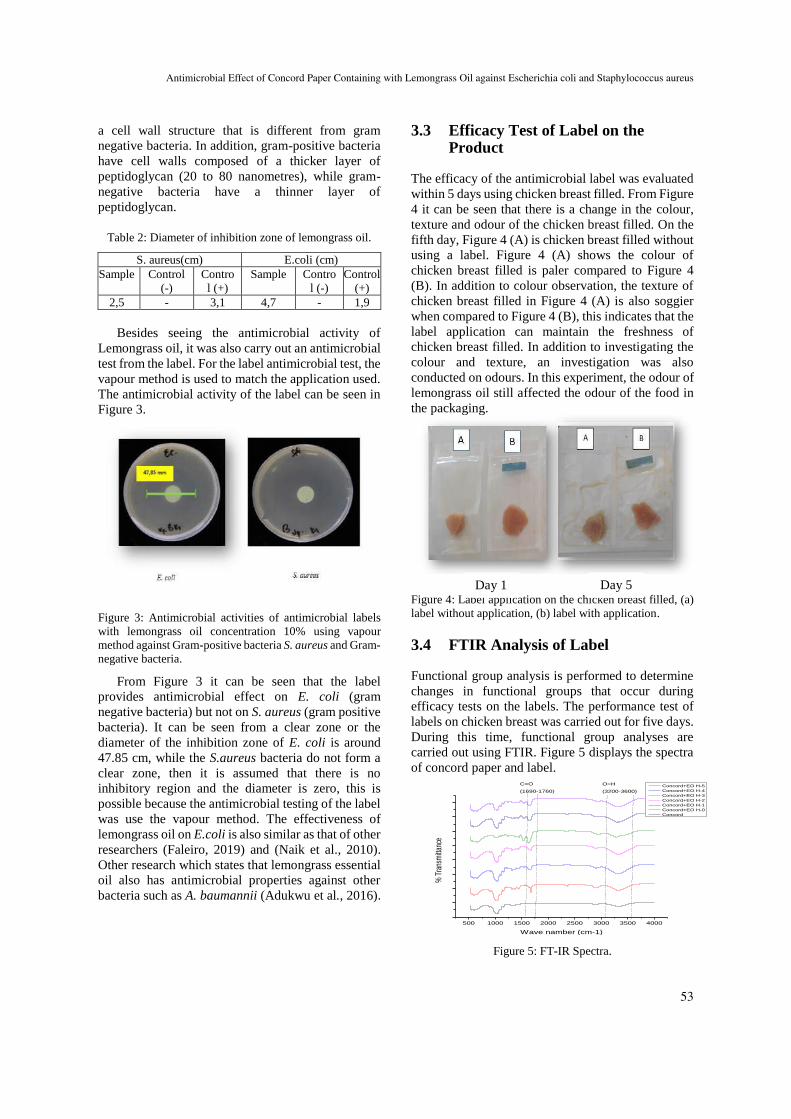
a cell wall structure that is different from gram
negative bacteria. In addition, gram-positive bacteria
have cell walls composed of a thicker layer of
peptidoglycan (20 to 80 nanometres), while gram-
negative bacteria have a thinner layer of
peptidoglycan.
Table 2: Diameter of inhibition zone of lemongrass oil.
S. aureus(cm) E.coli (cm)
Sample Control
(-)
Contro
l (+)
Sample Contro
l (-)
Control
(+)
2,5 - 3,1 4,7 - 1,9
Besides seeing the antimicrobial activity of
Lemongrass oil, it was also carry out an antimicrobial
test from the label. For the label antimicrobial test, the
vapour method is used to match the application used.
The antimicrobial activity of the label can be seen in
Figure 3.
Figure 3: Antimicrobial activities of antimicrobial labels
with lemongrass oil concentration 10% using vapour
method against Gram-positive bacteria S. aureus and Gram-
negative bacteria.
From Figure 3 it can be seen that the label
provides antimicrobial effect on E. coli (gram
negative bacteria) but not on S. aureus (gram positive
bacteria). It can be seen from a clear zone or the
diameter of the inhibition zone of E. coli is around
47.85 cm, while the S.aureus bacteria do not form a
clear zone, then it is assumed that there is no
inhibitory region and the diameter is zero, this is
possible because the antimicrobial testing of the label
was use the vapour method. The effectiveness of
lemongrass oil on E.coli is also similar as that of other
researchers (Faleiro, 2019) and (Naik et al., 2010).
Other research which states that lemongrass essential
oil also has antimicrobial properties against other
bacteria such as A. baumannii (Adukwu et al., 2016).
3.3 Efficacy Test of Label on the Product
The efficacy of the antimicrobial label was evaluated
within 5 days using chicken breast filled. From Figure
4 it can be seen that there is a change in the colour,
texture and odour of the chicken breast filled. On the
fifth day, Figure 4 (A) is chicken breast filled without
using a label. Figure 4 (A) shows the colour of
chicken breast filled is paler compared to Figure 4
(B). In addition to colour observation, the texture of
chicken breast filled in Figure 4 (A) is also soggier
when compared to Figure 4 (B), this indicates that the
label application can maintain the freshness of
chicken breast filled. In addition to investigating the
colour and texture, an investigation was also
conducted on odours. In this experiment, the odour of
lemongrass oil still affected the odour of the food in
the packaging.
Figure 4: Label application on the chicken breast filled, (a)
label without application, (b) label with application.
3.4 FTIR Analysis of Label
Functional group analysis is performed to determine
changes in functional groups that occur during
efficacy tests on the labels. The performance test of
labels on chicken breast was carried out for five days.
During this time, functional group analyses are
carried out using FTIR. Figure 5 displays the spectra
of concord paper and label.
Figure 5: FT-IR Spectra.
500 1000 1500 2000 2500 3000 3500 4000
O=H
(3200-3600)
% T
rans
mitt
ance
Wave namber (cm-1)
Concord+EO H-5
Concord+EO H-4
Concord+EO H-3
Concord+EO H-2
Concord+EO H-1
Concord+EO H-0
Concord
C=O
(1690-1760)
Day 1 Day 5
Antimicrobial Effect of Concord Paper Containing with Lemongrass Oil against Escherichia coli and Staphylococcus aureus
53
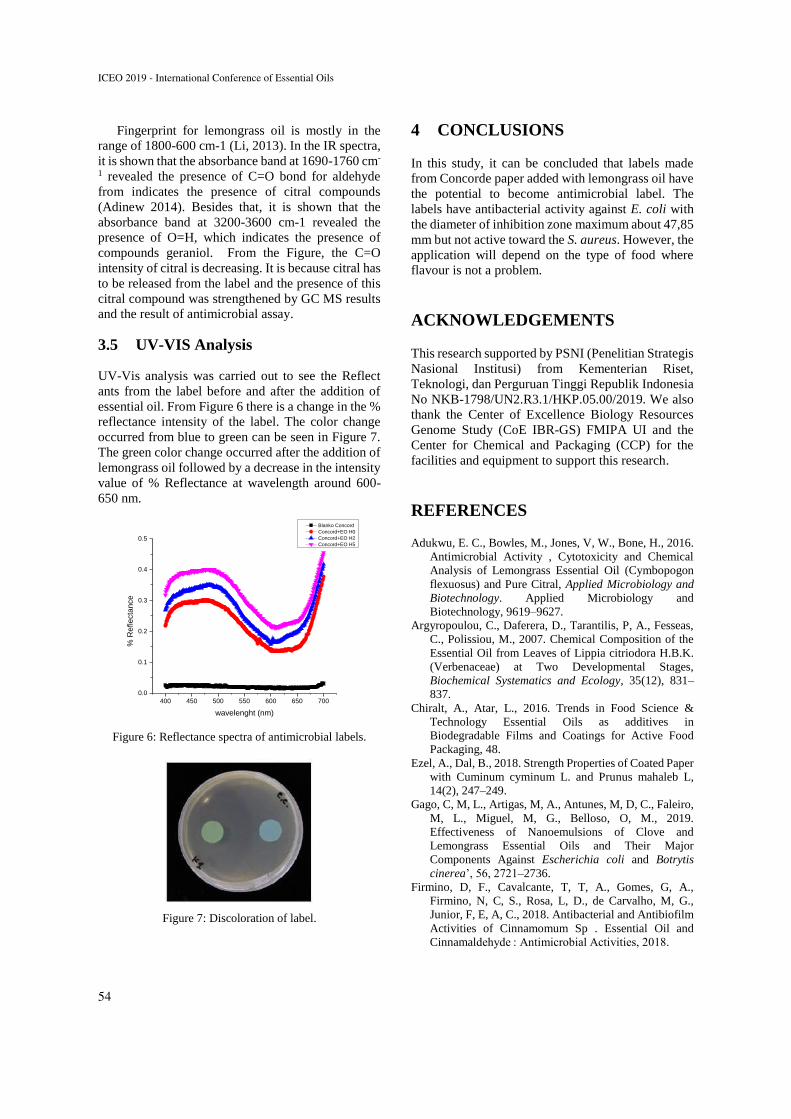
Fingerprint for lemongrass oil is mostly in the
range of 1800-600 cm-1 (Li, 2013). In the IR spectra,
it is shown that the absorbance band at 1690-1760 cm-
1 revealed the presence of C=O bond for aldehyde
from indicates the presence of citral compounds
(Adinew 2014). Besides that, it is shown that the
absorbance band at 3200-3600 cm-1 revealed the
presence of O=H, which indicates the presence of
compounds geraniol. From the Figure, the C=O
intensity of citral is decreasing. It is because citral has
to be released from the label and the presence of this
citral compound was strengthened by GC MS results
and the result of antimicrobial assay.
3.5 UV-VIS Analysis
UV-Vis analysis was carried out to see the Reflect
ants from the label before and after the addition of
essential oil. From Figure 6 there is a change in the %
reflectance intensity of the label. The color change
occurred from blue to green can be seen in Figure 7.
The green color change occurred after the addition of
lemongrass oil followed by a decrease in the intensity
value of % Reflectance at wavelength around 600-
650 nm.
400 450 500 550 600 650 700
0.0
0.1
0.2
0.3
0.4
0.5
% R
efle
cta
nce
wavelenght (nm)
Blanko Concord
Concord+EO H0
Concord+EO H2
Concord+EO H5
Figure 6: Reflectance spectra of antimicrobial labels.
Figure 7: Discoloration of label.
4 CONCLUSIONS
In this study, it can be concluded that labels made
from Concorde paper added with lemongrass oil have
the potential to become antimicrobial label. The
labels have antibacterial activity against E. coli with
the diameter of inhibition zone maximum about 47,85
mm but not active toward the S. aureus. However, the
application will depend on the type of food where
flavour is not a problem.
ACKNOWLEDGEMENTS
This research supported by PSNI (Penelitian Strategis
Nasional Institusi) from Kementerian Riset,
Teknologi, dan Perguruan Tinggi Republik Indonesia
No NKB-1798/UN2.R3.1/HKP.05.00/2019. We also
thank the Center of Excellence Biology Resources
Genome Study (CoE IBR-GS) FMIPA UI and the
Center for Chemical and Packaging (CCP) for the
facilities and equipment to support this research.
REFERENCES
Adukwu, E. C., Bowles, M., Jones, V, W., Bone, H., 2016.
Antimicrobial Activity , Cytotoxicity and Chemical
Analysis of Lemongrass Essential Oil (Cymbopogon
flexuosus) and Pure Citral, Applied Microbiology and
Biotechnology. Applied Microbiology and
Biotechnology, 9619–9627.
Argyropoulou, C., Daferera, D., Tarantilis, P, A., Fesseas,
C., Polissiou, M., 2007. Chemical Composition of the
Essential Oil from Leaves of Lippia citriodora H.B.K.
(Verbenaceae) at Two Developmental Stages,
Biochemical Systematics and Ecology, 35(12), 831–
837.
Chiralt, A., Atar, L., 2016. Trends in Food Science &
Technology Essential Oils as additives in
Biodegradable Films and Coatings for Active Food
Packaging, 48.
Ezel, A., Dal, B., 2018. Strength Properties of Coated Paper
with Cuminum cyminum L. and Prunus mahaleb L,
14(2), 247–249.
Gago, C, M, L., Artigas, M, A., Antunes, M, D, C., Faleiro,
M, L., Miguel, M, G., Belloso, O, M., 2019.
Effectiveness of Nanoemulsions of Clove and
Lemongrass Essential Oils and Their Major
Components Against Escherichia coli and Botrytis
cinerea’, 56, 2721–2736.
Firmino, D, F., Cavalcante, T, T, A., Gomes, G, A.,
Firmino, N, C, S., Rosa, L, D., de Carvalho, M, G.,
Junior, F, E, A, C., 2018. Antibacterial and Antibiofilm
Activities of Cinnamomum Sp . Essential Oil and
Cinnamaldehyde : Antimicrobial Activities, 2018.
ICEO 2019 - International Conference of Essential Oils
54
Ganjewala, D., 2009. Cymbopogon Essential Oils :
Chemical Compositions and Bioactivities,
International Journal of Essential Oil Therapeutics, 3,
56–65.
Khaneghah, A, M., Hashemi, S, M, G., Limbo, S., 2018.
Food and Bioproducts Processing Antimicrobial
Agents and Packaging Systems in Antimicrobial Active
Food Packaging : An Overview of Approaches and
Interactions, Food and Bioproducts Processing.
Institution of Chemical Engineers, 111, 1–19.
Naik, M. I., Fomda, B, A., Jaykumar, E., Bhat, J, A., 2010.
Antibacterial Activity of Lemongrass (Cymbopogon
citratus) Oil Against some Selected Pathogenic
Bacterias, Asian Pacific Journal of Tropical Medicine,
3(7), 535–538.
Pelissari, F. M., Grossmann, M, V, E., Yamashita, F.,
Pineda, E, A, G., 2009. Antimicrobial, Mechanical, and
Barrier Properties of Cassava Starch-Chitosan Films
Incorporated with Oregano Essential Oil, Journal of
agricultural and food chemistry, 7499–7504.
Pranoto, Y., Rakshit, S, K, A., Salokhe, V, M., 2005.
Enhancing Antimicrobial Activity of Chitosan Films by
incorporating garlic oil , Potassium Sorbate and Nisin,
38, 859–865.
Antimicrobial Effect of Concord Paper Containing with Lemongrass Oil against Escherichia coli and Staphylococcus aureus
55
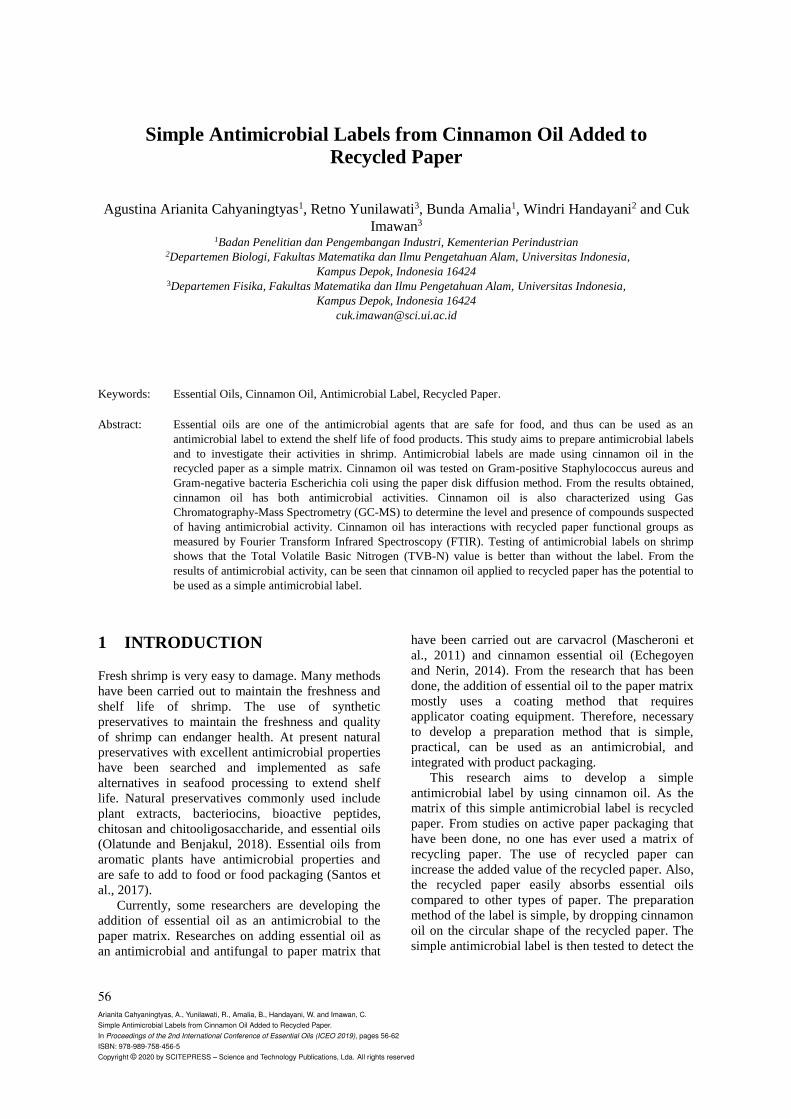
Simple Antimicrobial Labels from Cinnamon Oil Added to
Recycled Paper
Agustina Arianita Cahyaningtyas1, Retno Yunilawati3, Bunda Amalia1, Windri Handayani2 and Cuk
Imawan3 1Badan Penelitian dan Pengembangan Industri, Kementerian Perindustrian
2Departemen Biologi, Fakultas Matematika dan Ilmu Pengetahuan Alam, Universitas Indonesia,
Kampus Depok, Indonesia 16424 3Departemen Fisika, Fakultas Matematika dan Ilmu Pengetahuan Alam, Universitas Indonesia,
Kampus Depok, Indonesia 16424
Keywords: Essential Oils, Cinnamon Oil, Antimicrobial Label, Recycled Paper.
Abstract: Essential oils are one of the antimicrobial agents that are safe for food, and thus can be used as an
antimicrobial label to extend the shelf life of food products. This study aims to prepare antimicrobial labels
and to investigate their activities in shrimp. Antimicrobial labels are made using cinnamon oil in the
recycled paper as a simple matrix. Cinnamon oil was tested on Gram-positive Staphylococcus aureus and
Gram-negative bacteria Escherichia coli using the paper disk diffusion method. From the results obtained,
cinnamon oil has both antimicrobial activities. Cinnamon oil is also characterized using Gas
Chromatography-Mass Spectrometry (GC-MS) to determine the level and presence of compounds suspected
of having antimicrobial activity. Cinnamon oil has interactions with recycled paper functional groups as
measured by Fourier Transform Infrared Spectroscopy (FTIR). Testing of antimicrobial labels on shrimp
shows that the Total Volatile Basic Nitrogen (TVB-N) value is better than without the label. From the
results of antimicrobial activity, can be seen that cinnamon oil applied to recycled paper has the potential to
be used as a simple antimicrobial label.
1 INTRODUCTION
Fresh shrimp is very easy to damage. Many methods
have been carried out to maintain the freshness and
shelf life of shrimp. The use of synthetic
preservatives to maintain the freshness and quality
of shrimp can endanger health. At present natural
preservatives with excellent antimicrobial properties
have been searched and implemented as safe
alternatives in seafood processing to extend shelf
life. Natural preservatives commonly used include
plant extracts, bacteriocins, bioactive peptides,
chitosan and chitooligosaccharide, and essential oils
(Olatunde and Benjakul, 2018). Essential oils from
aromatic plants have antimicrobial properties and
are safe to add to food or food packaging (Santos et
al., 2017).
Currently, some researchers are developing the
addition of essential oil as an antimicrobial to the
paper matrix. Researches on adding essential oil as
an antimicrobial and antifungal to paper matrix that
have been carried out are carvacrol (Mascheroni et
al., 2011) and cinnamon essential oil (Echegoyen
and Nerin, 2014). From the research that has been
done, the addition of essential oil to the paper matrix
mostly uses a coating method that requires
applicator coating equipment. Therefore, necessary
to develop a preparation method that is simple,
practical, can be used as an antimicrobial, and
integrated with product packaging.
This research aims to develop a simple
antimicrobial label by using cinnamon oil. As the
matrix of this simple antimicrobial label is recycled
paper. From studies on active paper packaging that
have been done, no one has ever used a matrix of
recycling paper. The use of recycled paper can
increase the added value of the recycled paper. Also,
the recycled paper easily absorbs essential oils
compared to other types of paper. The preparation
method of the label is simple, by dropping cinnamon
oil on the circular shape of the recycled paper. The
simple antimicrobial label is then tested to detect the
56Arianita Cahyaningtyas, A., Yunilawati, R., Amalia, B., Handayani, W. and Imawan, C.Simple Antimicrobial Labels from Cinnamon Oil Added to Recycled Paper.In Proceedings of the 2nd International Conference of Essential Oils (ICEO 2019), pages 56-62ISBN: 978-989-758-456-5Copyright © 2020 by SCITEPRESS – Science and Technology Publications, Lda. All rights reserved
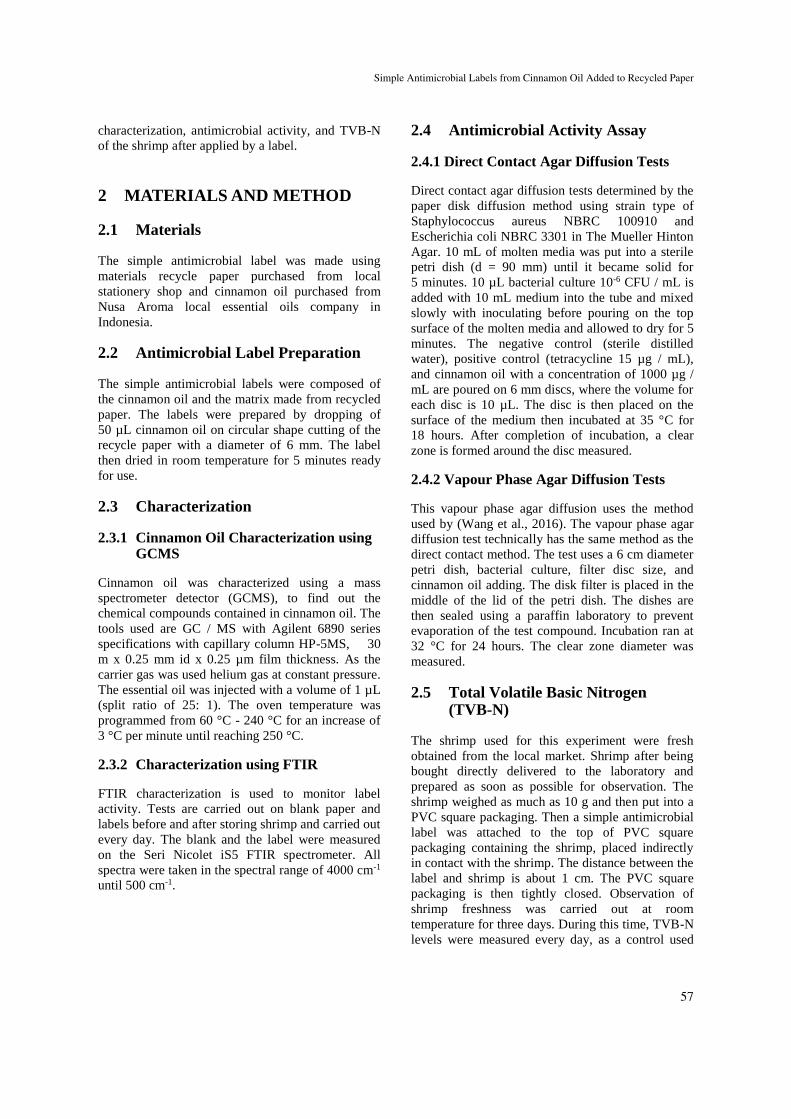
characterization, antimicrobial activity, and TVB-N
of the shrimp after applied by a label.
2 MATERIALS AND METHOD
2.1 Materials
The simple antimicrobial label was made using
materials recycle paper purchased from local
stationery shop and cinnamon oil purchased from
Nusa Aroma local essential oils company in
Indonesia.
2.2 Antimicrobial Label Preparation
The simple antimicrobial labels were composed of
the cinnamon oil and the matrix made from recycled
paper. The labels were prepared by dropping of
50 µL cinnamon oil on circular shape cutting of the
recycle paper with a diameter of 6 mm. The label
then dried in room temperature for 5 minutes ready
for use.
2.3 Characterization
2.3.1 Cinnamon Oil Characterization using GCMS
Cinnamon oil was characterized using a mass
spectrometer detector (GCMS), to find out the
chemical compounds contained in cinnamon oil. The
tools used are GC / MS with Agilent 6890 series
specifications with capillary column HP-5MS, 30
m x 0.25 mm id x 0.25 µm film thickness. As the
carrier gas was used helium gas at constant pressure.
The essential oil was injected with a volume of 1 µL
(split ratio of 25: 1). The oven temperature was
programmed from 60 °C - 240 °C for an increase of
3 °C per minute until reaching 250 °C.
2.3.2 Characterization using FTIR
FTIR characterization is used to monitor label
activity. Tests are carried out on blank paper and
labels before and after storing shrimp and carried out
every day. The blank and the label were measured
on the Seri Nicolet iS5 FTIR spectrometer. All
spectra were taken in the spectral range of 4000 cm-1
until 500 cm-1.
2.4 Antimicrobial Activity Assay
2.4.1 Direct Contact Agar Diffusion Tests
Direct contact agar diffusion tests determined by the
paper disk diffusion method using strain type of
Staphylococcus aureus NBRC 100910 and
Escherichia coli NBRC 3301 in The Mueller Hinton
Agar. 10 mL of molten media was put into a sterile
petri dish (d = 90 mm) until it became solid for
5 minutes. 10 µL bacterial culture 10-6 CFU / mL is
added with 10 mL medium into the tube and mixed
slowly with inoculating before pouring on the top
surface of the molten media and allowed to dry for 5
minutes. The negative control (sterile distilled
water), positive control (tetracycline 15 µg / mL),
and cinnamon oil with a concentration of 1000 µg /
mL are poured on 6 mm discs, where the volume for
each disc is 10 µL. The disc is then placed on the
surface of the medium then incubated at 35 °C for
18 hours. After completion of incubation, a clear
zone is formed around the disc measured.
2.4.2 Vapour Phase Agar Diffusion Tests
This vapour phase agar diffusion uses the method
used by (Wang et al., 2016). The vapour phase agar
diffusion test technically has the same method as the
direct contact method. The test uses a 6 cm diameter
petri dish, bacterial culture, filter disc size, and
cinnamon oil adding. The disk filter is placed in the
middle of the lid of the petri dish. The dishes are
then sealed using a paraffin laboratory to prevent
evaporation of the test compound. Incubation ran at
32 °C for 24 hours. The clear zone diameter was
measured.
2.5 Total Volatile Basic Nitrogen (TVB-N)
The shrimp used for this experiment were fresh
obtained from the local market. Shrimp after being
bought directly delivered to the laboratory and
prepared as soon as possible for observation. The
shrimp weighed as much as 10 g and then put into a
PVC square packaging. Then a simple antimicrobial
label was attached to the top of PVC square
packaging containing the shrimp, placed indirectly
in contact with the shrimp. The distance between the
label and shrimp is about 1 cm. The PVC square
packaging is then tightly closed. Observation of
shrimp freshness was carried out at room
temperature for three days. During this time, TVB-N
levels were measured every day, as a control used
Simple Antimicrobial Labels from Cinnamon Oil Added to Recycled Paper
57
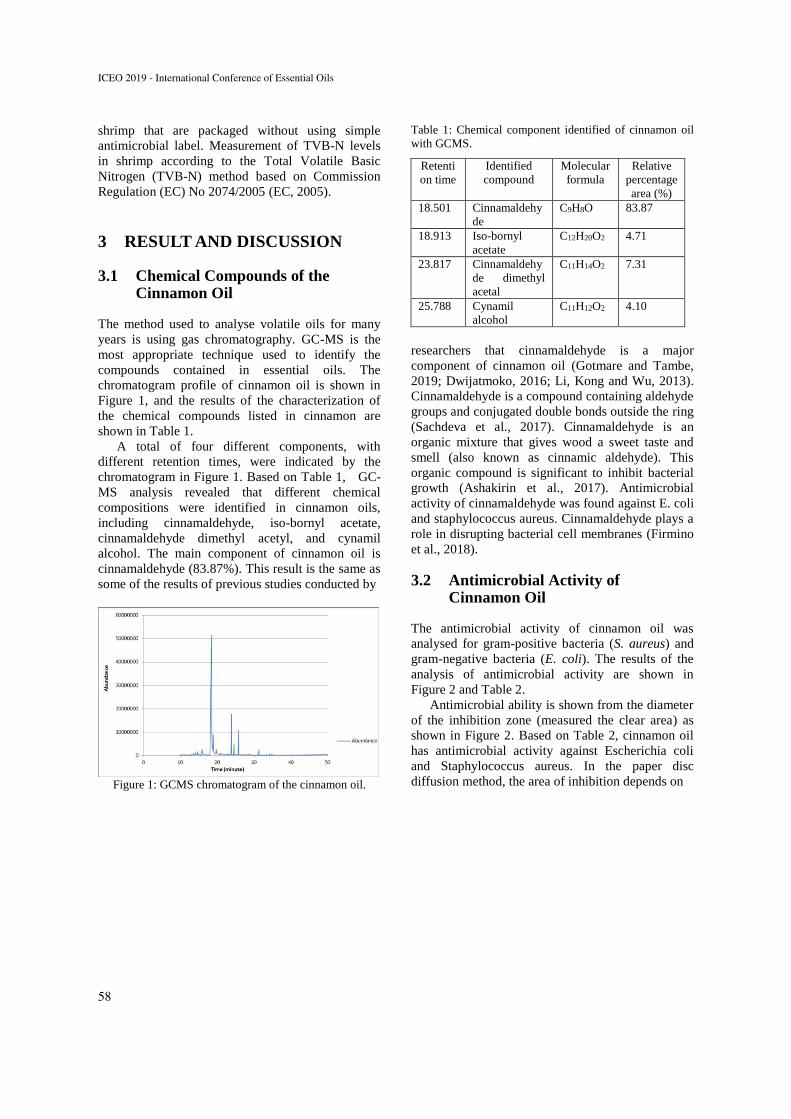
shrimp that are packaged without using simple
antimicrobial label. Measurement of TVB-N levels
in shrimp according to the Total Volatile Basic
Nitrogen (TVB-N) method based on Commission
Regulation (EC) No 2074/2005 (EC, 2005).
3 RESULT AND DISCUSSION
3.1 Chemical Compounds of the Cinnamon Oil
The method used to analyse volatile oils for many
years is using gas chromatography. GC-MS is the
most appropriate technique used to identify the
compounds contained in essential oils. The
chromatogram profile of cinnamon oil is shown in
Figure 1, and the results of the characterization of
the chemical compounds listed in cinnamon are
shown in Table 1. A total of four different components, with
different retention times, were indicated by the
chromatogram in Figure 1. Based on Table 1, GC-
MS analysis revealed that different chemical
compositions were identified in cinnamon oils,
including cinnamaldehyde, iso-bornyl acetate,
cinnamaldehyde dimethyl acetyl, and cynamil
alcohol. The main component of cinnamon oil is
cinnamaldehyde (83.87%). This result is the same as
some of the results of previous studies conducted by
Figure 1: GCMS chromatogram of the cinnamon oil.
Table 1: Chemical component identified of cinnamon oil
with GCMS.
Retenti
on time
Identified
compound
Molecular
formula
Relative
percentage
area (%)
18.501 Cinnamaldehy
de
C9H8O 83.87
18.913 Iso-bornyl
acetate
C12H20O2 4.71
23.817 Cinnamaldehy
de dimethyl
acetal
C11H14O2 7.31
25.788 Cynamil
alcohol
C11H12O2 4.10
researchers that cinnamaldehyde is a major
component of cinnamon oil (Gotmare and Tambe,
2019; Dwijatmoko, 2016; Li, Kong and Wu, 2013).
Cinnamaldehyde is a compound containing aldehyde
groups and conjugated double bonds outside the ring
(Sachdeva et al., 2017). Cinnamaldehyde is an
organic mixture that gives wood a sweet taste and
smell (also known as cinnamic aldehyde). This
organic compound is significant to inhibit bacterial
growth (Ashakirin et al., 2017). Antimicrobial
activity of cinnamaldehyde was found against E. coli
and staphylococcus aureus. Cinnamaldehyde plays a
role in disrupting bacterial cell membranes (Firmino
et al., 2018).
3.2 Antimicrobial Activity of Cinnamon Oil
The antimicrobial activity of cinnamon oil was
analysed for gram-positive bacteria (S. aureus) and
gram-negative bacteria (E. coli). The results of the
analysis of antimicrobial activity are shown in
Figure 2 and Table 2.
Antimicrobial ability is shown from the diameter
of the inhibition zone (measured the clear area) as
shown in Figure 2. Based on Table 2, cinnamon oil
has antimicrobial activity against Escherichia coli
and Staphylococcus aureus. In the paper disc
diffusion method, the area of inhibition depends on
ICEO 2019 - International Conference of Essential Oils
58
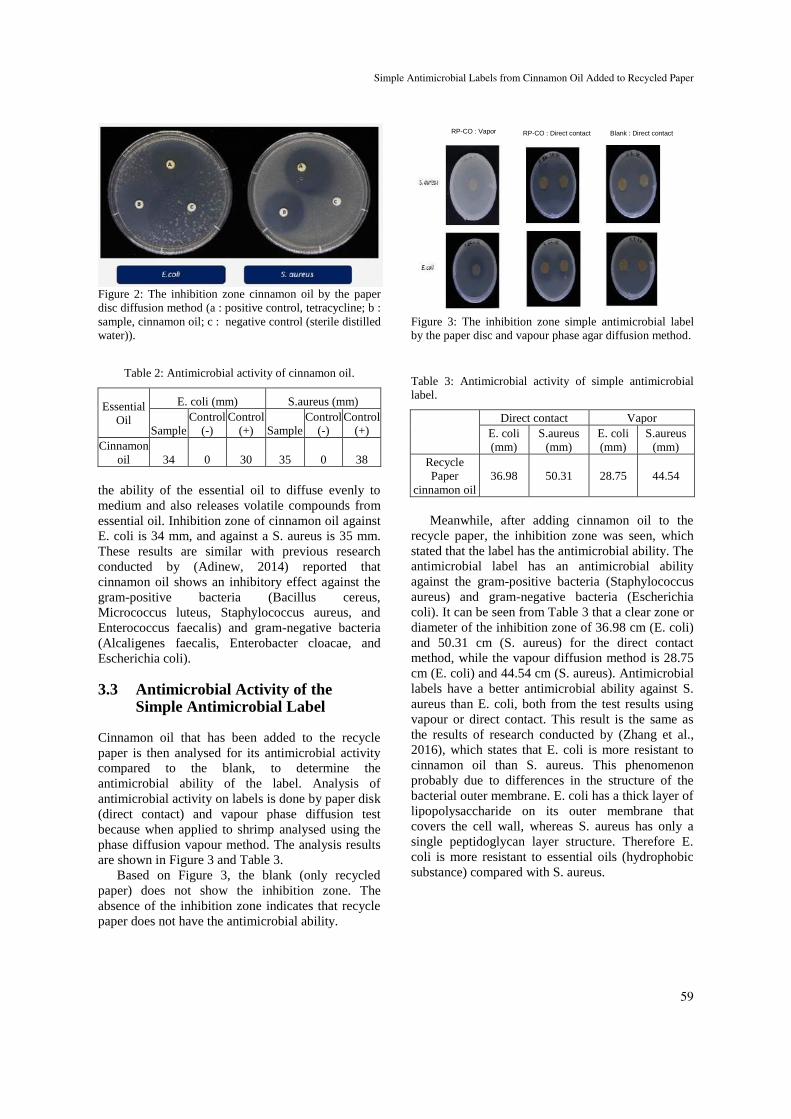
Figure 2: The inhibition zone cinnamon oil by the paper
disc diffusion method (a : positive control, tetracycline; b :
sample, cinnamon oil; c : negative control (sterile distilled
water)).
Table 2: Antimicrobial activity of cinnamon oil.
Essential
Oil
E. coli (mm) S.aureus (mm)
Sample
Control
(-)
Control
(+) Sample
Control
(-)
Control
(+)
Cinnamon
oil 34 0 30 35 0 38
the ability of the essential oil to diffuse evenly to
medium and also releases volatile compounds from
essential oil. Inhibition zone of cinnamon oil against
E. coli is 34 mm, and against a S. aureus is 35 mm.
These results are similar with previous research
conducted by (Adinew, 2014) reported that
cinnamon oil shows an inhibitory effect against the
gram-positive bacteria (Bacillus cereus,
Micrococcus luteus, Staphylococcus aureus, and
Enterococcus faecalis) and gram-negative bacteria
(Alcaligenes faecalis, Enterobacter cloacae, and
Escherichia coli).
3.3 Antimicrobial Activity of the Simple Antimicrobial Label
Cinnamon oil that has been added to the recycle
paper is then analysed for its antimicrobial activity
compared to the blank, to determine the
antimicrobial ability of the label. Analysis of
antimicrobial activity on labels is done by paper disk
(direct contact) and vapour phase diffusion test
because when applied to shrimp analysed using the
phase diffusion vapour method. The analysis results
are shown in Figure 3 and Table 3.
Based on Figure 3, the blank (only recycled
paper) does not show the inhibition zone. The
absence of the inhibition zone indicates that recycle
paper does not have the antimicrobial ability.
Figure 3: The inhibition zone simple antimicrobial label
by the paper disc and vapour phase agar diffusion method.
Table 3: Antimicrobial activity of simple antimicrobial
label.
Direct contact Vapor
E. coli
(mm)
S.aureus
(mm)
E. coli
(mm)
S.aureus
(mm)
Recycle
Paper
cinnamon oil
36.98 50.31 28.75 44.54
Meanwhile, after adding cinnamon oil to the
recycle paper, the inhibition zone was seen, which
stated that the label has the antimicrobial ability. The
antimicrobial label has an antimicrobial ability
against the gram-positive bacteria (Staphylococcus
aureus) and gram-negative bacteria (Escherichia
coli). It can be seen from Table 3 that a clear zone or
diameter of the inhibition zone of 36.98 cm (E. coli)
and 50.31 cm (S. aureus) for the direct contact
method, while the vapour diffusion method is 28.75
cm (E. coli) and 44.54 cm (S. aureus). Antimicrobial
labels have a better antimicrobial ability against S.
aureus than E. coli, both from the test results using
vapour or direct contact. This result is the same as
the results of research conducted by (Zhang et al.,
2016), which states that E. coli is more resistant to
cinnamon oil than S. aureus. This phenomenon
probably due to differences in the structure of the
bacterial outer membrane. E. coli has a thick layer of
lipopolysaccharide on its outer membrane that
covers the cell wall, whereas S. aureus has only a
single peptidoglycan layer structure. Therefore E.
coli is more resistant to essential oils (hydrophobic
substance) compared with S. aureus.
RP-CO : Vapor RP-CO : Direct contact Blank : Direct contact
Simple Antimicrobial Labels from Cinnamon Oil Added to Recycled Paper
59
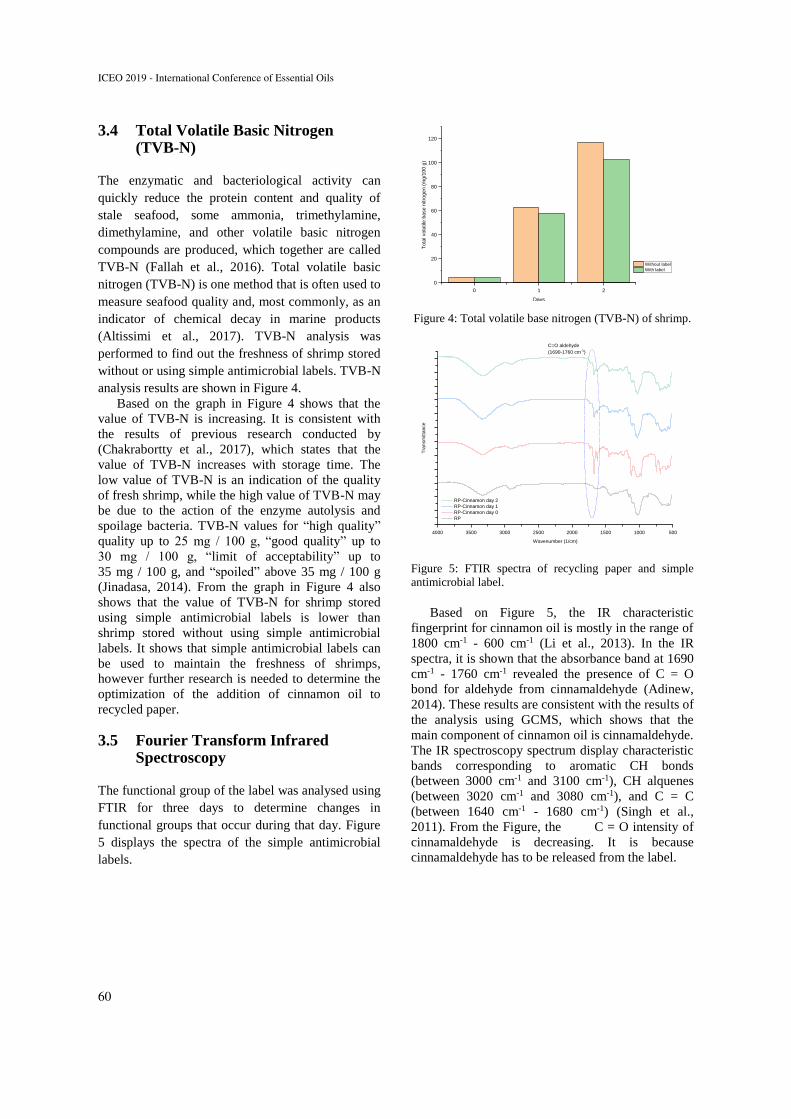
3.4 Total Volatile Basic Nitrogen (TVB-N)
The enzymatic and bacteriological activity can
quickly reduce the protein content and quality of
stale seafood, some ammonia, trimethylamine,
dimethylamine, and other volatile basic nitrogen
compounds are produced, which together are called
TVB-N (Fallah et al., 2016). Total volatile basic
nitrogen (TVB-N) is one method that is often used to
measure seafood quality and, most commonly, as an
indicator of chemical decay in marine products
(Altissimi et al., 2017). TVB-N analysis was
performed to find out the freshness of shrimp stored
without or using simple antimicrobial labels. TVB-N
analysis results are shown in Figure 4.
Based on the graph in Figure 4 shows that the
value of TVB-N is increasing. It is consistent with
the results of previous research conducted by
(Chakrabortty et al., 2017), which states that the
value of TVB-N increases with storage time. The
low value of TVB-N is an indication of the quality
of fresh shrimp, while the high value of TVB-N may
be due to the action of the enzyme autolysis and
spoilage bacteria. TVB-N values for “high quality”
quality up to 25 mg / 100 g, “good quality” up to
30 mg / 100 g, “limit of acceptability” up to
35 mg / 100 g, and “spoiled” above 35 mg / 100 g
(Jinadasa, 2014). From the graph in Figure 4 also
shows that the value of TVB-N for shrimp stored
using simple antimicrobial labels is lower than
shrimp stored without using simple antimicrobial
labels. It shows that simple antimicrobial labels can
be used to maintain the freshness of shrimps,
however further research is needed to determine the
optimization of the addition of cinnamon oil to
recycled paper.
3.5 Fourier Transform Infrared Spectroscopy
The functional group of the label was analysed using
FTIR for three days to determine changes in
functional groups that occur during that day. Figure
5 displays the spectra of the simple antimicrobial
labels.
Figure 4: Total volatile base nitrogen (TVB-N) of shrimp.
Figure 5: FTIR spectra of recycling paper and simple
antimicrobial label.
Based on Figure 5, the IR characteristic
fingerprint for cinnamon oil is mostly in the range of
1800 cm-1 - 600 cm-1 (Li et al., 2013). In the IR
spectra, it is shown that the absorbance band at 1690
cm-1 - 1760 cm-1 revealed the presence of C = O
bond for aldehyde from cinnamaldehyde (Adinew,
2014). These results are consistent with the results of
the analysis using GCMS, which shows that the
main component of cinnamon oil is cinnamaldehyde.
The IR spectroscopy spectrum display characteristic
bands corresponding to aromatic CH bonds
(between 3000 cm-1 and 3100 cm-1), CH alquenes
(between 3020 cm-1 and 3080 cm-1), and C = C
(between 1640 cm-1 - 1680 cm-1) (Singh et al.,
2011). From the Figure, the C = O intensity of
cinnamaldehyde is decreasing. It is because
cinnamaldehyde has to be released from the label.
0 1 2
0
20
40
60
80
100
120
Tota
l vola
tile
base n
itro
gen (
mg/1
00 g
)
Days
Without label
With label
4000 3500 3000 2500 2000 1500 1000 500
Tra
nsm
itta
nce
Wavenumber (1/cm)
RP-Cinnamon day 2
RP-Cinnamon day 1
RP-Cinnamon day 0
RP
C=O aldehyde
(1690-1760 cm-1)
ICEO 2019 - International Conference of Essential Oils
60
4 CONCLUSION
In this experiment, cinnamon oil has antimicrobial
ability against the gram-positive bacteria
(Staphylococcus aureus) and gram-negative bacteria
(Escherichia coli). Simple antimicrobial labels from
cinnamon oil added to the recycled paper also have
antimicrobial ability against the gram-positive
bacteria (Staphylococcus aureus) and gram-negative
bacteria (Escherichia coli). The results obtained
from this experiment indicated that this simple
antimicrobial label could be used to maintain the
freshness of shrimps. Further research is needed to
determine the optimization of the addition of
cinnamon oil to recycled paper.
ACKNOWLEDGEMENT
This research supported by PSNI (Penelitian Strategis Nasional Institusi) from Kementerian Riset, Teknologi, dan Perguruan Tinggi Republik Indonesia No NKB-1798/UN2.R3.1/HKP.05.00/2019. We also thank the Center of Excellence Biology Resources Genome Study (CoE IBR-GS) FMIPA UI and the Center for Chemical and Packaging (CCP) for the facilities and equipment to support this research.
REFERENCES
Adinew, B., 2014. GC-MS and FT-IR Analysis of
Constituents of Essential Oil From Cinnamon Bark
Growing in South-west of Ethiopia, International
Journal of Herbal Medicine, 1(6), 22–31.
Altissimi, S., Mercuri, M. L., Framboas, M., Tommasino,
M., Pelli, S., Benedetti, F., Di Bella, S., Haouet, N.,
2017. Indicators of Protein Spoilage in Fresh and
Defrosted Crustaceans and Cephalopods Stored in
Domestic Condition, Italian Journal of Food Safety,
6(4), 217–221.
Ashakirin, S. N., Tripathy, M., Patil, U, K., Majeed, A, B,
A., 2017. Chemistry and Bioactivity of
Cinnamaldehyde : A Natural Molecule of Medicinal
Importance, International Journal of Pharmaceutical
Sciences and Research, 8(6), 2333–2340.
Chakrabortty, A., Aziz, M, A., Rashad, M, A., Quality, F.,
2017. Study on Protein Losses and Total Volatile Base
Nitrogen (TVBN) of Fresh Water Prawn (Galda) in
the Shrimp Value Chain of Bagerhat Region,
Bangladesh for the Development of Sea Food Quality,
Journal of Engineering Science, 8(1), 79–82.
Dwijatmoko, M, I., 2016. Effect of Cinnamon Essential
Oils Addition in the Sensory Attributes of Dark
Chocolate, Nusantara Bioscience, 8(2), 301–305.
EC., 2005. Commission regulation (EC) No 2074/2005,
Official Journal of the European Union.
Echegoyen, Y., Nerin, C., 2014. Performance of An
Active Paper Based on Cinnamon Essential Oil in
Mushrooms Quality, Food Chemistry, 1–28.
Fallah, F., Ebrahimnezhad, Y., Maheri-Sis, N., Ghasemi-
Sadabadi, M., 2016, The Effect of Different Levels of
Diet Total Volatile Nitrogen on Performance, Carcass
Characteristics and Meat Total Volatile Nitrogen in
Broiler Chickens, Archives Animal Breeding, 59(2),
191–199.
Firmino, D, F., Cavalcante, T, T, A., Gomes, G, A.,
Firmino, N, C, S., Rosa, L, D., De Carvalho, M, G.,
Catunda, F, E, A., 2018. Antibacterial and Antibiofilm
Activities of Cinnamomum Sp. Essential Oil and
Cinnamaldehyde: Antimicrobial Activities, The
Scientific World Journal, 2018, 1–9.
Gotmare, B., Tambe, E., 2019. Identification of Chemical
Constituents of Cinnamon Bark Oil by GCMS and
Comparative Study Garnered from Five Different
Countries, 19(1).
Jinadasa, B, K, K, K., 2014. Determination of Quality of
Marine Fishes Based on Total Volatile Base Nitrogen
Test (TVB-N), Nature and Science, 12(5), 106–111.
Li, Y, Q., Kong, D, X., Wu, H., 2013. Analysis and
Evaluation of Essential Oil Components of Cinnamon
Barks using GC-MS and FTIR Spectroscopy,
Industrial Crops and Products, 41(1), 269–278.
Mascheroni, E., Guillard, V., Gastaldi, E., Gontard, N.,
Chalier, P., 2011. Anti-Microbial Effectiveness of
Relative Humidity-Controlled Carvacrol Release from
Wheat Gluten/Montmorillonite Coated Papers, Food
Control, 22(10), 1582–1591.
Olatunde, O, O., Benjakul, S., 2018. Natural Preservatives
for Extending the Shelf-Life of Seafood: A Revisit,
Comprehensive Reviews in Food Science and Food
Safety, 17(6), 1595–1612.
Sachdeva, A., Vashist, S., Chopra, R., Puri, D., 2017.
Antimicrobial Activity of Active Packaging Film to
Prevent Bread Spoilage, International Journal of Food
Science and Nutrition, 2(4), 29–37.
Santos, R, R., Andrade, M., Melo, N, R., Sanches-Silva,
A., 2017. Use of Essential Oils in Active Food
Packaging: Recent Advances and Future Trends,
Trends in Food Science and Technology, 61, 132–140.
Singh, P., Andola, H, C., Rawat, M, S, M., Pant, G, J, N,
P., Purohit, V K., 2011. Fourier Transform Infrared
(FT-IR) Spectroscopy in An-Overview, Research
Journal of Medicinal Plant, 5(2), 127–135.
Simple Antimicrobial Labels from Cinnamon Oil Added to Recycled Paper
61

Wang, T, H., Hsia, S, M., Wu, C, H., Ko, S, Y., Chen, M,
Y., Shih, Y, H., Shieh, T, M., Chuang, L, C., Wu, C,
Y., 2016. Evaluation of the Antibacterial Potential of
Liquid and Vapor Phase Phenolic Essential Oil
Compounds Against Oral Microorganisms, Plos One,
11(9), 1–17.
Zhang, Y., Liu, X., Wang, Y., Jiang, P., Quek, S, Y., 2016.
Antibacterial Activity and Mechanism of Cinnamon
Essential Oil Against Escherichia Coli and
Staphylococcus aureus, Food Control, 59, 282–289.
ICEO 2019 - International Conference of Essential Oils
62
Patchouli (Pogostemon cablin Benth): Chemistry, Biology, and Anti-inflammatory Activities: A Review
Khairan1,2,3,4, Syaifullah Muhammad4,5 and Muhammad Diah6 1Departement of Pharmacy, Universitas Syiah Kuala, Banda Aceh, Indonesia 2 Pusat Riset Obat Herbal, Universitas Syiah Kuala, Banda Aceh, Indonesia 3Pusat Riset Etnoscience, Universitas Syiah Kuala, Banda Aceh, Indonesia
4PUI-Nilam Aceh-Atsiri Research Centre, Universitas Syiah Kuala, Banda Aceh, Indonesia 5Department of Chemical Engineering, Universitas Syiah Kuala, Banda Aceh, Indonesia
6Division of Cardiology, Department of Internal Medicine, Dr. Zainoel Abidin Hospital, Faculty of Medicine, Universitas Syiah Kuala, Banda Aceh, Indonesia
Keywords: Pogostemon cablin Benth, Phytochemicals, Biology Activities, Anti-Inflammatory Activity.
Abstract: Patchouli (Pogostemon cablin Benth) is an essential oil and an aromatic medicinal plant, industrially valued due to widely used in flavours, fragrance and pharmaceuticals. Recently, researchers are showing deep interest towards patchouli alcohol. In Indonesia, patchouli is commonly known as ‘nilam’ which stand for Nederlands Indische Land ook Acheh Maatscappij. Understanding the chemistry, biology, and anti-inflammatory activities allows its utilization in medicine, toiletries, perfumery and insecticides. This review provides a comprehensive information on chemical compositions of patchouli species and its extracts by gas chromatography-mass spectroscopy (GC-MS) and gas chromatography-flame ionization detection (GC-FID). The biological activities of patchouli towards microorganisms is also being reviewed. This review also provides an additional information on anti-inflammatory activities of Pogostemon cablin Benth.
1 INTRODUCTION
Nowadays, the natural product from plants are widely used as herbal medicines and health therapy to treat various diseases. Some products including essential oils, dyes, cosmetics, and drugs also derived from natural products. Currently, several medicinal and aromatic plants are widely cultivated by farmers and industrial agricultural both large and small scale to obtain plants metabolites that are indispensable for industrial needs (Lubbe and Verpoorte, 2011). The aromatic plants are capable to produce some essentials oils that are useful for several therapeutics such as pharmaceutical, perfume and food industries. For example, perfumes, cosmetics, and other health products used 90% of essential oils sourced from plants.
In Indonesia, patchouli oil (Pogostemon cablin Benth) is commonly known as ‘NILAM’ which stand for Nederlands Indische Land ook Acheh Maatscappij. P. cablin is an herbaceous plant, spread in Southeast Asia, especially Vietnam, Malaysia, Thailand, and Indonesia. P. cablin mainly contains of
patchouli alcohol, this compound is functioned as long-lasting aroma or as fixative in perfumes industries. This compound commonly used as indicator to determine the quality of essential oils from patchouli (Anonis, 2006). Patchouli alcohol, commonly used in the perfume manufacturing industry and some products such as soap, detergents, body lotions, and cosmetics (Swamy and Sinniah, 2015), deodorants, and insecticides (Hasegawa et al., 1992).
P. cablin is also known contain several metabolites such as sesquiterpenes, hydrocarbons, patchoulol, patchoulene, bulnesene, guaiene, caryophyllene, elemene, and copaene. P. cablin also contains others bioactive compounds such as flavonoids and glycosides (Hasegawa et al., 1992). In addition, patchouli oil is also widely used as aromatherapy to increase sexual arousal (aphrodisiac), to mitigate depression, and anxiety to calm nerves. Several studies reported that patchouli oil are potentials used for treatments of antimicrobial, analgesic, antioxidant, antiplatelet, aphrodisiac, antithrombotic, antidepressant, antimutagenic,
Khairan, Muhammad, S. and Diah, M.Patchouli (Pogostemon cablin Benth): Chemistry, Biology, and Anti-inflammatory Activities: A Review.In Proceedings of the 2nd International Conference of Essential Oils (ICEO 2019), pages 63-69ISBN: 978-989-758-456-5Copyright © 2020 by SCITEPRESS – Science and Technology Publications, Lda. All rights reserved
63
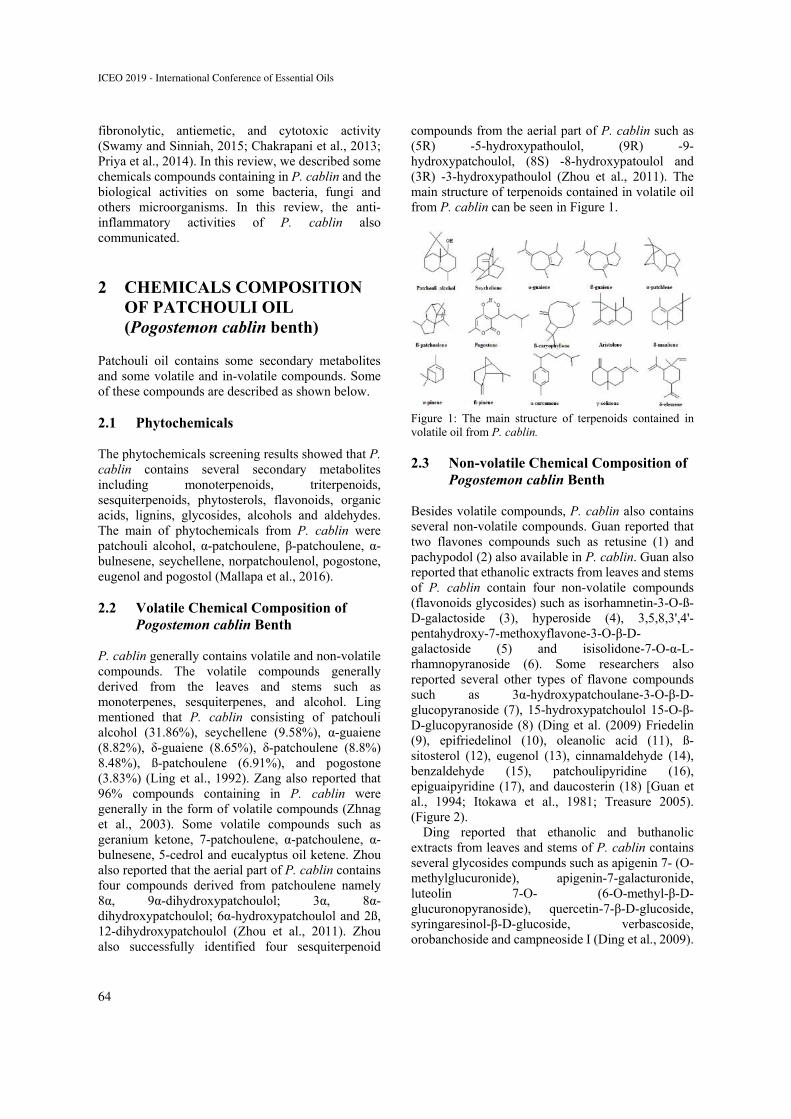
fibronolytic, antiemetic, and cytotoxic activity (Swamy and Sinniah, 2015; Chakrapani et al., 2013; Priya et al., 2014). In this review, we described some chemicals compounds containing in P. cablin and the biological activities on some bacteria, fungi and others microorganisms. In this review, the anti-inflammatory activities of P. cablin also communicated.
2 CHEMICALS COMPOSITION OF PATCHOULI OIL (Pogostemon cablin benth)
Patchouli oil contains some secondary metabolites and some volatile and in-volatile compounds. Some of these compounds are described as shown below. 2.1 Phytochemicals The phytochemicals screening results showed that P. cablin contains several secondary metabolites including monoterpenoids, triterpenoids, sesquiterpenoids, phytosterols, flavonoids, organic acids, lignins, glycosides, alcohols and aldehydes. The main of phytochemicals from P. cablin were patchouli alcohol, α-patchoulene, β-patchoulene, α-bulnesene, seychellene, norpatchoulenol, pogostone, eugenol and pogostol (Mallapa et al., 2016).
2.2 Volatile Chemical Composition of
Pogostemon cablin Benth P. cablin generally contains volatile and non-volatile compounds. The volatile compounds generally derived from the leaves and stems such as monoterpenes, sesquiterpenes, and alcohol. Ling mentioned that P. cablin consisting of patchouli alcohol (31.86%), seychellene (9.58%), α-guaiene (8.82%), δ-guaiene (8.65%), δ-patchoulene (8.8%) 8.48%), ß-patchoulene (6.91%), and pogostone (3.83%) (Ling et al., 1992). Zang also reported that 96% compounds containing in P. cablin were generally in the form of volatile compounds (Zhnag et al., 2003). Some volatile compounds such as geranium ketone, 7-patchoulene, α-patchoulene, α-bulnesene, 5-cedrol and eucalyptus oil ketene. Zhou also reported that the aerial part of P. cablin contains four compounds derived from patchoulene namely 8α, 9α-dihydroxypatchoulol; 3α, 8α-dihydroxypatchoulol; 6α-hydroxypatchoulol and 2ß, 12-dihydroxypatchoulol (Zhou et al., 2011). Zhou also successfully identified four sesquiterpenoid
compounds from the aerial part of P. cablin such as (5R) -5-hydroxypathoulol, (9R) -9-hydroxypatchoulol, (8S) -8-hydroxypatoulol and (3R) -3-hydroxypathoulol (Zhou et al., 2011). The main structure of terpenoids contained in volatile oil from P. cablin can be seen in Figure 1.
Figure 1: The main structure of terpenoids contained in volatile oil from P. cablin. 2.3 Non-volatile Chemical Composition of
Pogostemon cablin Benth Besides volatile compounds, P. cablin also contains several non-volatile compounds. Guan reported that two flavones compounds such as retusine (1) and pachypodol (2) also available in P. cablin. Guan also reported that ethanolic extracts from leaves and stems of P. cablin contain four non-volatile compounds (flavonoids glycosides) such as isorhamnetin-3-O-ß-D-galactoside (3), hyperoside (4), 3,5,8,3',4'-pentahydroxy-7-methoxyflavone-3-O-β-D-galactoside (5) and isisolidone-7-O-α-L-rhamnopyranoside (6). Some researchers also reported several other types of flavone compounds such as 3α-hydroxypatchoulane-3-O-β-D-glucopyranoside (7), 15-hydroxypatchoulol 15-O-β-D-glucopyranoside (8) (Ding et al. (2009) Friedelin (9), epifriedelinol (10), oleanolic acid (11), ß-sitosterol (12), eugenol (13), cinnamaldehyde (14), benzaldehyde (15), patchoulipyridine (16), epiguaipyridine (17), and daucosterin (18) [Guan et al., 1994; Itokawa et al., 1981; Treasure 2005). (Figure 2).
Ding reported that ethanolic and buthanolic extracts from leaves and stems of P. cablin contains several glycosides compunds such as apigenin 7- (O-methylglucuronide), apigenin-7-galacturonide, luteolin 7-O- (6-O-methyl-β-D-glucuronopyranoside), quercetin-7-β-D-glucoside, syringaresinol-β-D-glucoside, verbascoside, orobanchoside and campneoside I (Ding et al., 2009).
ICEO 2019 - International Conference of Essential Oils
64
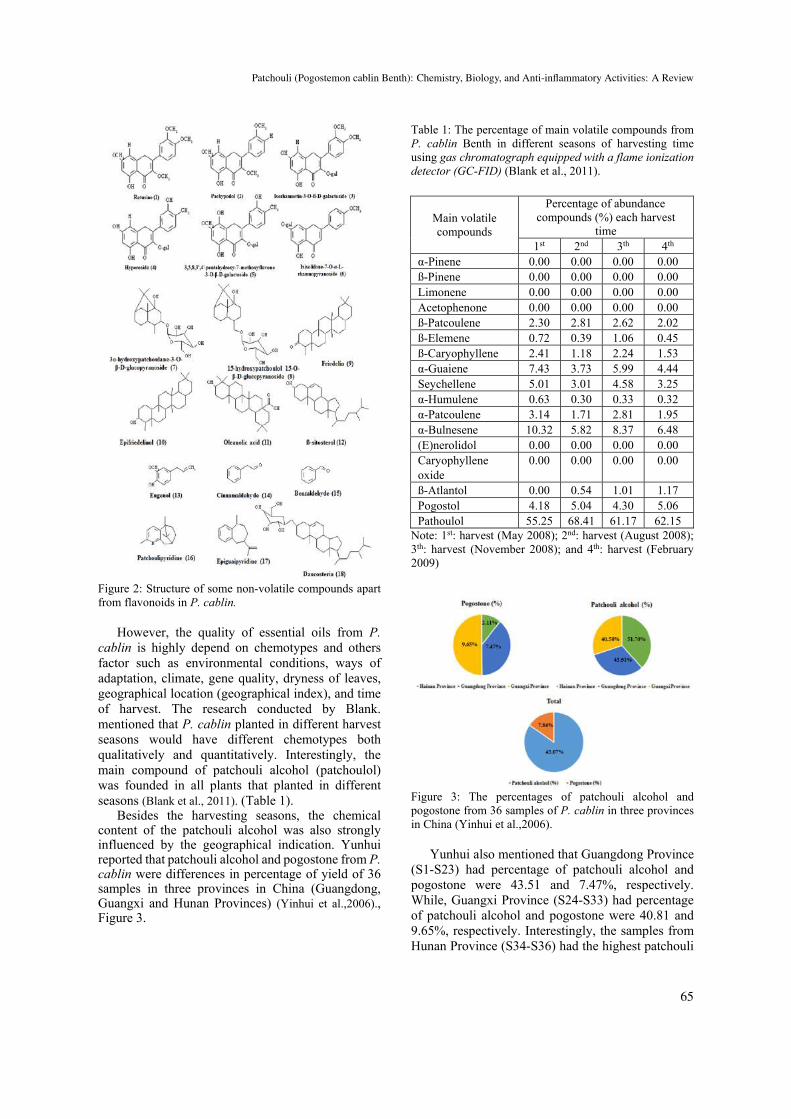
Figure 2: Structure of some non-volatile compounds apart from flavonoids in P. cablin.
However, the quality of essential oils from P.
cablin is highly depend on chemotypes and others factor such as environmental conditions, ways of adaptation, climate, gene quality, dryness of leaves, geographical location (geographical index), and time of harvest. The research conducted by Blank. mentioned that P. cablin planted in different harvest seasons would have different chemotypes both qualitatively and quantitatively. Interestingly, the main compound of patchouli alcohol (patchoulol) was founded in all plants that planted in different seasons (Blank et al., 2011). (Table 1).
Besides the harvesting seasons, the chemical content of the patchouli alcohol was also strongly influenced by the geographical indication. Yunhui reported that patchouli alcohol and pogostone from P. cablin were differences in percentage of yield of 36 samples in three provinces in China (Guangdong, Guangxi and Hunan Provinces) (Yinhui et al.,2006)., Figure 3.
Table 1: The percentage of main volatile compounds from P. cablin Benth in different seasons of harvesting time using gas chromatograph equipped with a flame ionization detector (GC-FID) (Blank et al., 2011).
Note: 1st: harvest (May 2008); 2nd: harvest (August 2008); 3th: harvest (November 2008); and 4th: harvest (February 2009)
Figure 3: The percentages of patchouli alcohol and pogostone from 36 samples of P. cablin in three provinces in China (Yinhui et al.,2006).
Yunhui also mentioned that Guangdong Province (S1-S23) had percentage of patchouli alcohol and pogostone were 43.51 and 7.47%, respectively. While, Guangxi Province (S24-S33) had percentage of patchouli alcohol and pogostone were 40.81 and 9.65%, respectively. Interestingly, the samples from Hunan Province (S34-S36) had the highest patchouli
Main volatile compounds
Percentage of abundance compounds (%) each harvest
time 1st 2nd 3th 4th
α-Pinene 0.00 0.00 0.00 0.00 ß-Pinene 0.00 0.00 0.00 0.00 Limonene 0.00 0.00 0.00 0.00 Acetophenone 0.00 0.00 0.00 0.00 ß-Patcoulene 2.30 2.81 2.62 2.02 ß-Elemene 0.72 0.39 1.06 0.45 ß-Caryophyllene 2.41 1.18 2.24 1.53 α-Guaiene 7.43 3.73 5.99 4.44 Seychellene 5.01 3.01 4.58 3.25 α-Humulene 0.63 0.30 0.33 0.32 α-Patcoulene 3.14 1.71 2.81 1.95 α-Bulnesene 10.32 5.82 8.37 6.48 (E)nerolidol 0.00 0.00 0.00 0.00 Caryophyllene oxide
0.00 0.00 0.00 0.00
ß-Atlantol 0.00 0.54 1.01 1.17 Pogostol 4.18 5.04 4.30 5.06 Pathoulol 55.25 68.41 61.17 62.15
Patchouli (Pogostemon cablin Benth): Chemistry, Biology, and Anti-inflammatory Activities: A Review
65
alcohol content (51.70%) and the lowest pogostone content (2.11%). These results indicate that plant sources (cultivation sources), growth temperature (climate) and time of growth (harvesting time) greatly affect the chemical composition of essential oils of P. cablin (Yinhui et al.,2006).
3 BIOLOGY ACTIVITIES
3.1 Antibacterial Activities Luo reported that aqueous P. cablin extract possess antibacterial activity against Staphylococcus aureus, Bacillus subtilis, Pseudomonas aeruginosa, Enteritis coccus and Aerobacter aerogenes. Interestingly, this extract has antibacterial activity against Staphylococcus aureus significantly, but does not show activity against Escherichia coli (Luo, 2005). Pattnaik mentioned that patchouli oil was effective in inhibiting on 20 bacterial strains and 12 fungal strains. He also mentioned that the patchouli oil derived from several countries with geographical differences such as China, India, and Indonesia showed antifungal activity against 17 of pathogenic fungi, and effective against 16 commensal bacteria from the skin, mucous membranes, nails, feet and armpits (Pattnaik et al., 1996). Hammer also mentioned that P. cablin extract were effective in inhibiting Acenitobacter baumanii, Aeromonas veronii, Candida albicans, Enterococcus faecalis, Escherichia coli, Klebsiella pneumonia, Pseudomonas aeruginosa, Salmonella enteric and Staphyllococcus aureus. The organics leave extracts of P. cablin were reported have significant activity against Escherichia coli, Escherichia aerogenes, Bacillus substilis, and Staphylococcus aureus. Among all the compounds contained in patchouli oil, pogostone and (-) - patchoulol have the greatest therapeutic effect on bacteria (Hammer et al., 1999).
3.2 Antifungal Activities The research conducted by Kocevski showed that patchouli oil has antifungal activity against 11 fungal types. However, it has no activity against Aspergillus flavus, Aspergillus niger and Escherichia coli, but showed antifungal activity against several Aspergillus species at concentration of 44.52% (Kocevski et al., 2013). Yang reported that patchouli alcohol, α-bulnesene and patchoulene isolated from P. cablin from China have activity on 12 types of dermatophytes (dermatophytes) with MIC50 values were around 50-400 μg / L (Yang et al., 2000). In
addition, the combination of patchouli oil and sodium artesunate has a synergistic effect on Plasmodium berghei (Liu et al., 2000). Yu also reported that pogostone from P. cablin had antifungal activity against clinical isolate of Candida albicans at concentrations of 50-400 µg / ml both in vitro and in vivo (Yu et al., 2012). Lie showed that pogostone from P. cablin is also effective as candidiasis especially against Vulvovaginal candidiasis (Lie et al., 1994). 3.3 Antiviral Activities P. cablin extracts were reported have anti-influenza activity against the FMI virus in vivo to the mouse model by evaluating the pulmonary index, while the methanolic extract of P. cablin leaves was known have antiviral activity against influenza viruses (Kiyohara et al., 2012). Gao reported that patchouli alcohol in volatile oils obtained from isolation using HPLC showed antiviral activity against H1N1 with an IC50 value of 2,635 µM. In addition, Gao also reported that the methanol and ethyl acetate extracts of P. cablin had an excellent antiviral effect against the coxsackie B virus, with IC50 values of 26.92 and 13.84 µg / ml, respectively (Gao et al., 2009). P. cablin was also known to have effects on Herpes simplex types I and II in people with HIV-AIDS (Buckle, 2002). However, until now it has not been known exactly how the mechanism of action of P. cablin as an antivirus. 3.4 Insecticidal Activities P. cablin leaf extract at a concentration of 1% (w / w) was known to be effective as a repellent against Stegobium paniceum (Kardian, 1997). Chun reported that patchouli oil was effective against Lasioderma serricorne, Sitophilus zeamais, Tribolium confusum, Falsogastrallus sauteri, and Coptotermes formosanus Shiraki (Chun et al., 2000). Patchouli oil is also effective as a repellent for mosquitoes Ades aegypti, Anopheles stephensi and Culex quinquefasciatus (Trongtokit et al., 2005; Albuquerque et al., 2013; Gokulakrishnan et al., 2013). Petroleum ether extract of P. cablin leaves was also reported to be effective against Dermatophagoides farina (Wu et al., 2010). Progostone compounds from P. cablin were also reported effective as larvicidal, antifeedant, pupicidal activities against Spodoptera litura and Spodoptera exigua (Huang et al., 2014).
ICEO 2019 - International Conference of Essential Oils
66
3.5 Nematicidal Activities Wiratno reported that patchouli oil from P. cablin has nematicidal activity against root-knot nematode of Meloidogyne incognita with a mortality rate of around 4 ± 5.6% with IC20, IC50, and IC90 values was more than 19.2 mg / ml (Wiratno et al., 2009). Patidar also reported that P. cablin extract at a concentration of 500 ppm had nematicidal effect on second stage juveniles (J2) Meloidogyne incognita with a percent mortality of 28.25% after 48 hours of incubation of time (Patidar et al., 2016).
4 ANTIOXIDANT EFFECTS
Hussin reported that patchouli oil had antioxidant activity and radical scavenging by DPPH assay. The results of the antioxidant effect test also showed that patchouli oil from P. cablin had a higher activity than mannitol. Polysaccharide compounds from P. cablin are reported to be able to remove hydroxyl radicals (•OH) and superoxide radicals (O2•) (Hussin et al., 2012). Other results also show that P. cablin is very effective in protecting A172 cells (human neuroglioma cell line) from necrosis and apoptosis induced by hydrogen peroxide (H2O2), which is indicated by the ability of P. cablin act as reactive oxygen (ROS)-scavenger (Kim et al., 2010). In addition, patchouli alcohol reported able to reduce the level of ROS and Ca2+ ions to cells induced by Aß25-35. P. cablin is also reported to be able to protect the intestinal barrier function by protecting membrane’s fluidity of epithelial cells through regulation of NO and TNF-α in serum. The volatile oil from P. cablin has also been reported to have an antitussive and expectorant effect on ammonia-induced mice (Xie and Tang, 2009).
5 ANTI-INFLAMMANTORY ACTIVITIES
It has been reported that methanolic extract of P. cablin possess anti-inflammatory activity by reduced the level of malondialdehyde in paw endema on mice by increasing the antioxidant activity of enzymes in the liver (Lu et al., 2011). Lu also mentioned that this extract was able to reduce the level of superoxide dismutase activity, glutathione peroxidase, gluthathione reductase, COX-2 and TNF-α in paw endema of mice. The extract of P. cablin also reported have strongest anti-inflammatory response by regulation of interleukin-1β (IL-1β) and prostaglandin E (2). Yu also reported that patchouli
alcohol from Pogostemonis plant mice was able to inhibit ear edema and paw edema in xylene and carrageenan-induced mice at concentration of 10-40 mg / kg body weight of mice. The patchouli alcohol was also able to reduce the production of TNF-α, IL-1ß, iNOS, and COX-2 in hind paw to carrageenan-induced mice (Yu et al., 2011). In addition, Jin also reported that patchouli alcohol has anti-inflammatory activity against RAW264.7 and HT-29 cell lines through suppressing ERK mediated by the NF-κB pathway (Jin et al., 2013). Li mentioned that pogostone has an anti-inflammatory effect and could be potential developed as septic shock therapy (Li et al., 2014). Besides that, Park reported that aqueous P. cablin extract was be able to suppressed colon inflammation by suppressing the expression of pro-inflammatory cytokines (Park et al., 2014).
6 CONCLUSIONS AND RECOMMENDATIONS
This review tries to summarize the latest research related to the phytochemical content, biological activity and anti-inflammatory effect of P. cablin. The chemical constituents of P. cablin were strongly influence by several factors including environmental conditions, adaptation methods, climate, gene quality, dryness of leaves, harvest time, and its geographical location. However, further research needed to develop patchouli oil as drug candidate particularly for anti-inflammatory drugs.
ACKNOWLEDGEMENTS
The authors thank to Atsiri Research Center (ARC) and Herbal Medicine Research Center (ProHerbal) of Universitas Syiah Kuala for their support of this study.
CONFLICT OF INTEREST
The authors declare that there are no conflicts of interest.
REFERENCES
Albuquerque, E, L., Lima, J, K., Souza, F, H., Silva, I, M., Santos, A, A., Araujo, A, P., Blank, A, F., Lima, R, N., Alves, P, B., Bacci, L., 2013. Insecticidal and
Patchouli (Pogostemon cablin Benth): Chemistry, Biology, and Anti-inflammatory Activities: A Review
67
Repellence Activity of the Essential Oil of Pogostemon Cablin Against Urban Ants Species. Acta Trop, 127(3) 181–186.
Anonis, D, P., 2006. Woody Notes in Perfumery, Patchouli Oil, Absolute and Aroma Chemicals. Part I. Perfum. Flavor, 31, 36–39.
Blank., Fitzgerald, A., Sant’ana., Pergentino, T, C., Santos., Santana, P., Blank, A., Fatima, M., do Nascimento, A, P., Jesus., Ramos, H, C., Alves., Barreto P., 2011. Chemical Characterization of the Essential Oil from Patchouli Accessions Harvested Over Four Seasons, Industrial Crops and Products, 34(1), 831– 837.
Buckle, J., 2002. Clinical Aromatherapy and AIDS, J. Assoc. Nurses Aids Care, 13(3), 81–99.
Chakrapani, P., Venkatesh, K., Singh, B, C, S., Jyothi, B, A., Kumar, P., Amareshwari, P., Roja, A, R., 2013. Phytochemical, Pharmacological Importance of Patchouli (Pagostemon cablin (Blanco) Benth) an Aromatic Medicinal Plant, Int. J. Pharm. Sci. Rev. Res, 21(2), 7–15.
Chun, W., DeJun, Y., ShiLin, H., Qun, T., 2000. Determination of Toxicity of Plant Essential Oils to Museum Insect Pests, J. Southwest Agric. Univ, 22(6), 494–495.
Ding W, Liu M, Wei X 2009 J. Trop. Subtropical Bot., 17 610-616.
Gao X, Xiong S, Wang Y 2009 J Chin Med Mater. 32 761-764.
Gokulakrishnan, J., Kuppusamy, E., Shanmugam, D., Appavu, A., Kaliyamoorthi, K., 2013. Pupicidal and Repellent Activities of Pogostemon cablin Essential Oil Chemical Compounds Againts Medically Important Human Vector Mosquitoes Asian Pac. J. Trop. Dis, 3(1), 26–31.
Guan L, Quan L, Xu L 1994 China J Chin. Mater Med. 19 355-360.
Hammer, K, A., Carson, C, F., Riley, T, V., 1998. In-Vitro Activity of Essential Oils, in Particular Melaleuca alternifolia (Tea Tree) Oil and Tea Tree Oil Products, Against Candida spp. Journal of Antimicrobial Chemotherapy, 42, 591–595.
Hasegawa, Y., Tajima, K., Toi, N., 1992. An Additional Constituent Occuring in the Oil From a Patchouli Cultivar, Flavour Fragrance. J, 7, 333-335.
Huang, G, J., Deng, J, S., Chen, C, C., Huang, C, J., Sung, P, J., Huang, S, S., Kuo, Y, H., 2014. Methanol Extract of Antrodia Camphorata Protects Against Lipopolysaccharide-Induced Acute Lung Injury by Suppressing NF-κB and MAPK Pathways in Mice, J.Agric.Food. Chem, 62(23), 5321–5329.
Hussin, N., Mondello, L., Costa, R., 2012. Quantitative and Physical Evaluation of Patchouli Essential Oils Obtained from Different Sources of Pogostemon Cablin, Nat. Prod. Commun. 7 927.
Itokawa H, Suto K, Takeya K 1981 Chem Pharm. 29 254-260.
Jeong, J, B., Shin, Y, K., Lee, S, H., 2013. Anti-Inflammatory Activity of Patchouli Alcohol in RAW264.7 and HT-29 cells, Food and Chemical Toxicology, 55, 229–233.
Kardinan, A., Wikardi, E, A., 1997. The Prospect of Botanical Insecticides on Stored Food Insects Management, Biotrop. Spec. Publ, 59, 199–208.
Kim, H, W., Cho, S, J., Kim, B, Y., Cho, S, I., Kim, Y, K., 2010. Pogostemon cablin as ROS Scavenger in Oxidant-Induced Cell Death of Human Neuroglioma Cells, Evid Based Complement Alternat Med. 7 239-47.
Kiyohara, H., Ichino, C., Kawamura, Y., Nagai, T., Sato, N., Yamada, H., 2012. Patchouli Alcohol: In Vitro Direct Anti-Influenza Virus Sesquiterpene in Pogostemon Cablin Benth, J. Nat. Med, 66(1), 55-61.
Kocevski, D., Du, M., Kan, J., Jing, C., Lacanin, I., Pavlovic, H., 2013. Antifungal Effect of Allium tuberosum, Cinnamomum cassia, and Pogostemon cablin Essential Oils and Their Components Against Population of Aspergillus species, J. Food Sci, 78, M731–M737.
Li, Y, C., Xian Y F, Su Z R, Ip S P, Xie J H, Liao J B, Wu D W, Li C W, Chen J N, Lin Z X, Lai X P 2014 J. Ethnopharmacol. 157 212–221.
Lie, Quan L, Xu L 1994 China J Chin. Mater Med 19 355-6.
Ling G, Lihui Q, Puzhu C 1992 Nat. Prod. Res. Dev. 2 5 Liu A, Yu Z, Lu L 2000 Chin. J. Parasitol Parasitic Dis.,
18 76. Lu T C, Liao J C, Huang T H 2011 Evid. Based Complement
Alternat Med. 671-41. Lubbe, A., Verpoorte, R., 2011. Cultivation of Medicinal
and Aromatic Plants for Specialty Industrial Materials, Ind. Crop Prod. 34, 785–801.
Luo C 2005 J Chin Med Mater 28:700-710. Mallappa, K, S., Uma, R, S., 2016. Patchouli (Pogostemon
cablin Benth.): Botany, Agrotechnology and Biotechnological Aspects, Industrial Crops and Products, 87, 161–176.
Park, S, Y., Neupane, G, P., Lee, S, O., Lee, J, S., Kim, M, Y., Kim, S, Y., Park, B, C., Park, Y, J., Kim, J, A., 2014. Protective Effects of Pogostemon cablin Bentham Water Extract on Inflammatory Cytokine Expression in TNBS-Induced Colitis in Rats, Arch. Pharmacal. Res, 37, 253–262.
Patidar, R, K., Debashish, S., Pathak, M., Shakywar, R, C., Rajesh K, P., 2016. Effect of Essential Oils on Mortality, Hatching and Multiplication of Root-Knot Nematode, Meloidogyne incognita and Its Impact on Plant Growth Parameters. International Journal of Agriculture, Environment and Biotechnology, 9(5), 887-895.
Pattnaik, S., Subramanyam, V, R., Kole, C., 1996. Antibacterial Antifungal Activity of Ten Essential Oils In Vitro, Microbios, 86, 237–246.
Priya, D., Swati, D., Vilasrao, D, K., 2014. A Review on Pogostemon patchouli, Res. J. Pharmacogn. Phytochem, 691, 41–47.
Swamy, M, K., Sinniah, U, R., 2015. A Comprehensive Review on the Phytochemical Constituents and Pharmacological Activities of Pogostemon cablin Benth.: An Aromatic Medicinal Plant of Industrial Importance, Molecules, 20(5), 8521–8547.
ICEO 2019 - International Conference of Essential Oils
68
Treasure, J., 2005. Herbal Medicine and Cancer: An Introductory Overview, 21(3), 177-83.
Trongtokit Y, Rongsriyam Y, Komalamisra N, Apiwathnasorn C 2005 Phytother. Res. 19 303–309.Zhang M G, Yuan M, Yuan P 2003 Chin. Tradit. Herbal Drugs 34 749-751.
Wiratno, D., Taniwiryono, H., den Berg, V., Riksen, J, A, G., Rietjens, I, M, C, M., Djiwanti, S,R., Kammenga, J, E., Murk, A, J., 2009. Nematicidal Activity of Plant Extracts Against the Root-Knot Nematode, Meloidogyne incognite, The Open Natural Products Journal, 2, 77-85.
Wu, H, Q., Li, J., He, Z, D., Liu, Z, G., 2010. Acaricidal Activities of Traditional Chinese Medicine Against the House Dust Mite, Dermatophagoides Farinae, Parasitology, 137(6), 975–983.
Xie, Y, C., Tang, F., 2009. Protective Effect Pogostemon cablin on Membrane Fluidity of Intestinal Epithelia Cell in Ischemia/Reperfusion Rats After Ischemia/Reperfusion, Chin. J. Integr. Tradit. West Med, 29, 639-641.
Yang, D, P., Chaumont, J, P., Millet, J., 2000. Antifungal Activity of the Essential Oils from Agastache rugosa and Pogostemon cablin Against Dermatophytes and Opportunistic Fungi, Chin. Pharm. J, 35, 9-11.
Yang, Y., Kong, W., Feng, H., Dou, X., Zhao, L., Xiao, Q., Yang, M., 2006. Quantitative and Fingerprinting Analysis of Pogostemon cablin Based on GC-FID Combined with Chemometrics, Journal of Pharmaceutical and Biomedical Analysis, 121, 84–90.
Yu-Cui Li, Hai-Chun Lianga, Hai-Ming Chen, Li-Rong Tan, Yu-Yang Yia, Zhen Qin, Wei-Min Zhang, Dian-Wei Wu, Chu-Wen Li, Rong-Feng Lin, Zi-Ren Su, Xiao-Ping La 2012 Phytomedicine 20 77– 83.
CuiLi, Y., FangXian, Y., Polp, S., RenSu, Z., YanSu, J., JinHe, J., FengXie, Q., PingLai, X., XiuLin, Z., 2011. Anti-Inflammatory Activity of Patchouli Alcohol Isolated from Pogostemonis Herba in Animal Models, Fitoterapia, 82, 1295–1301.
Zhou, L., Xu, M., Yang, C, R., Wang, Y, F., Zhang, Y, J., 2011. New Patchoulol-Type Sesquiterpenoids From Pogostemon cablin. Helv. Chim. Acta, 94, 218-23.
Patchouli (Pogostemon cablin Benth): Chemistry, Biology, and Anti-inflammatory Activities: A Review
69
Conjugation Reaction between Citronellal and L-Tyrosine and Its Antimicrobial Properties against Bacteria and Fungi
1Magister Program, Department of Chemistry, Universitas Syiah Kuala, Banda Aceh, Indonesia 2Department of Chemistry, Universitas Syiah Kuala, Banda Aceh, Indonesia
3Faculty of Medicine, Universitas Syiah Kuala, Banda Aceh, Indonesia 4Department of Cardiovascular, Dr. Zainoel Abidin Hospital, Banda Aceh, Indonesia 5Department of Chemistry, Universitas Tadulako, Palu, Sulawesi Tengah, Indonesia
6Herbal Research Centre, Universitas Yarsi, Jakarta, Indonesia Department of Chemical Engineering, Universitas Syiah Kuala, Banda Aceh, Indonesia
8PUI-Nilam Aceh-Atsiri Research Centre, Universitas Syiah Kuala, Banda Aceh, Indonesia 9Departement of Pharmacy, Universitas Syiah Kuala, Banda Aceh, Indonesia 10Pusat Riset Obat Herbal, Universitas Syiah Kuala, Banda Aceh, Indonesia 11Pusat Riset Etnoscience, Universitas Syiah Kuala, Banda Aceh, Indonesia
Keywords: Conjugation Reaction, Citronellal, L-tyrosine, Staphylococcus aureus, Escherichia coli, Candida albicans.
Abstract: The study of citronellal with L-tyrosin conjugation for antimicrobial properties has been conducted. The aim of this study to determine the relationship stucture between two compounds citronellal and L-tyrosine on antimicrobial activity against Staphylococcus aureus, Escherichia coli, and Candida albicans. The conjugation product obtained was yellow-white solid amorphous with the Rf value was 0.84 and the percentage of yield was 71.12%. The FT-IR spectra peak at 3205.69 cm-1 is represented the N-H stretching vibration from L-tyrosine, while the spectra appears at 1460.11 - 1438.90 cm-1 are represented the C=N which derived from imine or immonium from shift base reaction between citronellal and L-tyrosine. The GC-MS analysis showed that the peak 15 observed at RT 10.27 min. be expected a conjugation product with the m/z 316 [M+H]+ ion. The antimicrobial activity were determined by well diffusion method and the results showed that product of conjugation were have no antimicrobail activities at concentration tested.
1 INTRODUCTION
Citronellal is a monoterpene that has two optical isomers with a molecular weight of 154.25 g / mol. The reactivity of citronellal is resulting from carbonyl group, double bond, and acidity of Hα. These groups allowing citronellal to react with an acid or a base. Some biological activities of citronellal including insecticides (Griffith and Grentile, 1979), perfumery (Anderson et al., 1993; Sangwan et al., 2001), stimulants, antidepressants, analgesics, antipyretics, and antimicrobials (Adhikari et al., 2015) L-tyrosine or 4-hydroxyphenylalanine is a non-essential amino acid, a primary amine, has a polar group. L-tyrosine widely used in food industry and pharmaceutical
industry (Tina, 2007). The conjugation of natural product with several constituents has attracted some researchers due to their biological reactivity on several microorganisms and cells (Martinez et al., 2015; Hong et al., 2017). For examples, novobiocin, serrulatane, xanthorhizol (Finland and Nichols, 1957; Lewis and Klibanov, 2005; Rukayadi and Hwang, 2006), which contain prenil and aromatic hydroxy groups are believed to play an important role in antimicrobial activity.
2,4-Dimethyl-2,6-heptadiene-1-ol and 5-Amino-2-methylphenol are two compounds produced from a conjugation reaction are known to have antibacterial activity against Staphylococcus epidermidis (Ys, 2015), Rusdin reported that product conjugation between citronellal and L-tyrosine has antibacterial
Rila Suryani1, Nazaruddin2, Kartini Hasballah3, Muhammad Diah3,4, Hardi Yusuf5, Juniarti6, Syaifullah Muhammad7,8, Khairan8,9,10,11
70Suryani, R., Nazaruddin, N., Hasballah, K., Diah, M., Yusuf, H., Juniarti, Muhammad, S. and KhairanConjugation Reaction between Citronellal and L-Tyrosine and Its Antimicrobial Properties against Bacteria and Fungi.In Proceedings of the 2nd International Conference of Essential Oils (ICEO 2019), pages 70-75ISBN: 978-989-758-456-5Copyright © 2020 by SCITEPRESS – Science and Technology Publications, Lda. All rights reserved
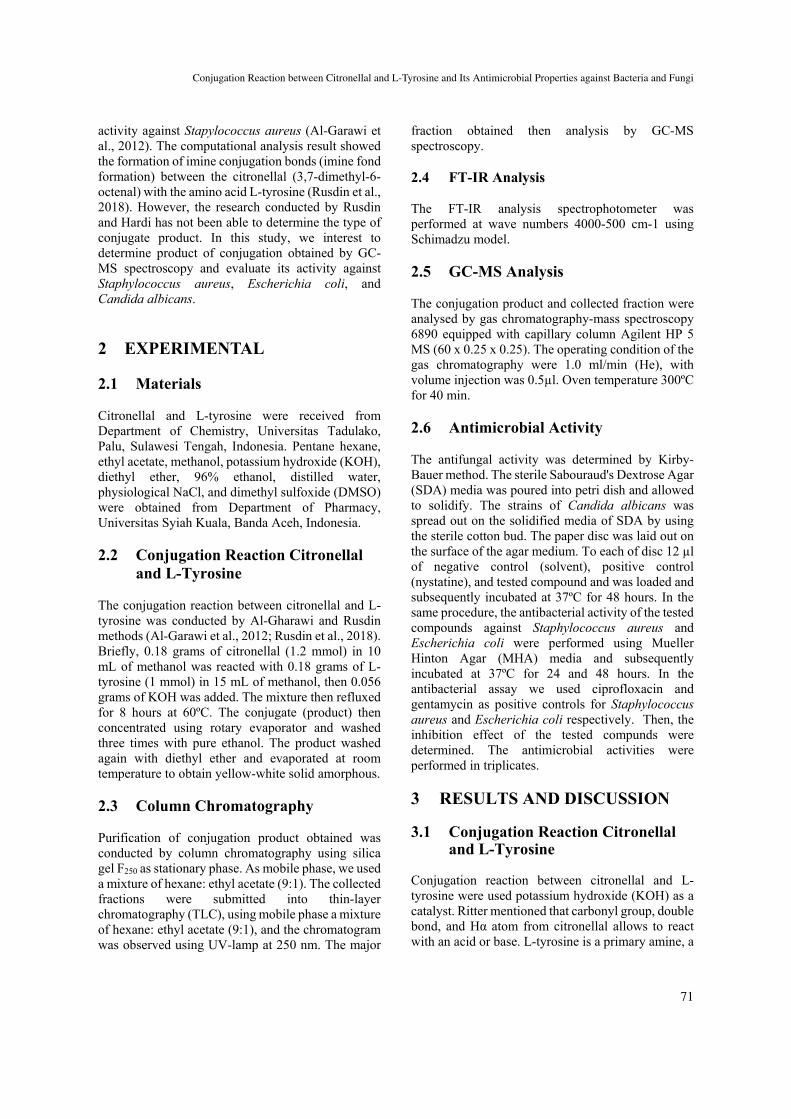
activity against Stapylococcus aureus (Al-Garawi et al., 2012). The computational analysis result showed the formation of imine conjugation bonds (imine fond formation) between the citronellal (3,7-dimethyl-6-octenal) with the amino acid L-tyrosine (Rusdin et al., 2018). However, the research conducted by Rusdin and Hardi has not been able to determine the type of conjugate product. In this study, we interest to determine product of conjugation obtained by GC-MS spectroscopy and evaluate its activity against Staphylococcus aureus, Escherichia coli, and Candida albicans.
2 EXPERIMENTAL
2.1 Materials Citronellal and L-tyrosine were received from Department of Chemistry, Universitas Tadulako, Palu, Sulawesi Tengah, Indonesia. Pentane hexane, ethyl acetate, methanol, potassium hydroxide (KOH), diethyl ether, 96% ethanol, distilled water, physiological NaCl, and dimethyl sulfoxide (DMSO) were obtained from Department of Pharmacy, Universitas Syiah Kuala, Banda Aceh, Indonesia.
2.2 Conjugation Reaction Citronellal
and L-Tyrosine The conjugation reaction between citronellal and L-tyrosine was conducted by Al-Gharawi and Rusdin methods (Al-Garawi et al., 2012; Rusdin et al., 2018). Briefly, 0.18 grams of citronellal (1.2 mmol) in 10 mL of methanol was reacted with 0.18 grams of L-tyrosine (1 mmol) in 15 mL of methanol, then 0.056 grams of KOH was added. The mixture then refluxed for 8 hours at 60ºC. The conjugate (product) then concentrated using rotary evaporator and washed three times with pure ethanol. The product washed again with diethyl ether and evaporated at room temperature to obtain yellow-white solid amorphous. 2.3 Column Chromatography Purification of conjugation product obtained was conducted by column chromatography using silica gel F250 as stationary phase. As mobile phase, we used a mixture of hexane: ethyl acetate (9:1). The collected fractions were submitted into thin-layer chromatography (TLC), using mobile phase a mixture of hexane: ethyl acetate (9:1), and the chromatogram was observed using UV-lamp at 250 nm. The major
fraction obtained then analysis by GC-MS spectroscopy. 2.4 FT-IR Analysis The FT-IR analysis spectrophotometer was performed at wave numbers 4000-500 cm-1 using Schimadzu model. 2.5 GC-MS Analysis The conjugation product and collected fraction were analysed by gas chromatography-mass spectroscopy 6890 equipped with capillary column Agilent HP 5 MS (60 x 0.25 x 0.25). The operating condition of the gas chromatography were 1.0 ml/min (He), with volume injection was 0.5µl. Oven temperature 300ºC for 40 min. 2.6 Antimicrobial Activity The antifungal activity was determined by Kirby-Bauer method. The sterile Sabouraud's Dextrose Agar (SDA) media was poured into petri dish and allowed to solidify. The strains of Candida albicans was spread out on the solidified media of SDA by using the sterile cotton bud. The paper disc was laid out on the surface of the agar medium. To each of disc 12 µl of negative control (solvent), positive control (nystatine), and tested compound and was loaded and subsequently incubated at 37ºC for 48 hours. In the same procedure, the antibacterial activity of the tested compounds against Staphylococcus aureus and Escherichia coli were performed using Mueller Hinton Agar (MHA) media and subsequently incubated at 37ºC for 24 and 48 hours. In the antibacterial assay we used ciprofloxacin and gentamycin as positive controls for Staphylococcus aureus and Escherichia coli respectively. Then, the inhibition effect of the tested compunds were determined. The antimicrobial activities were performed in triplicates.
3 RESULTS AND DISCUSSION 3.1 Conjugation Reaction Citronellal
and L-Tyrosine
Conjugation reaction between citronellal and L-tyrosine were used potassium hydroxide (KOH) as a catalyst. Ritter mentioned that carbonyl group, double bond, and Hα atom from citronellal allows to react with an acid or base. L-tyrosine is a primary amine, a
Conjugation Reaction between Citronellal and L-Tyrosine and Its Antimicrobial Properties against Bacteria and Fungi
71
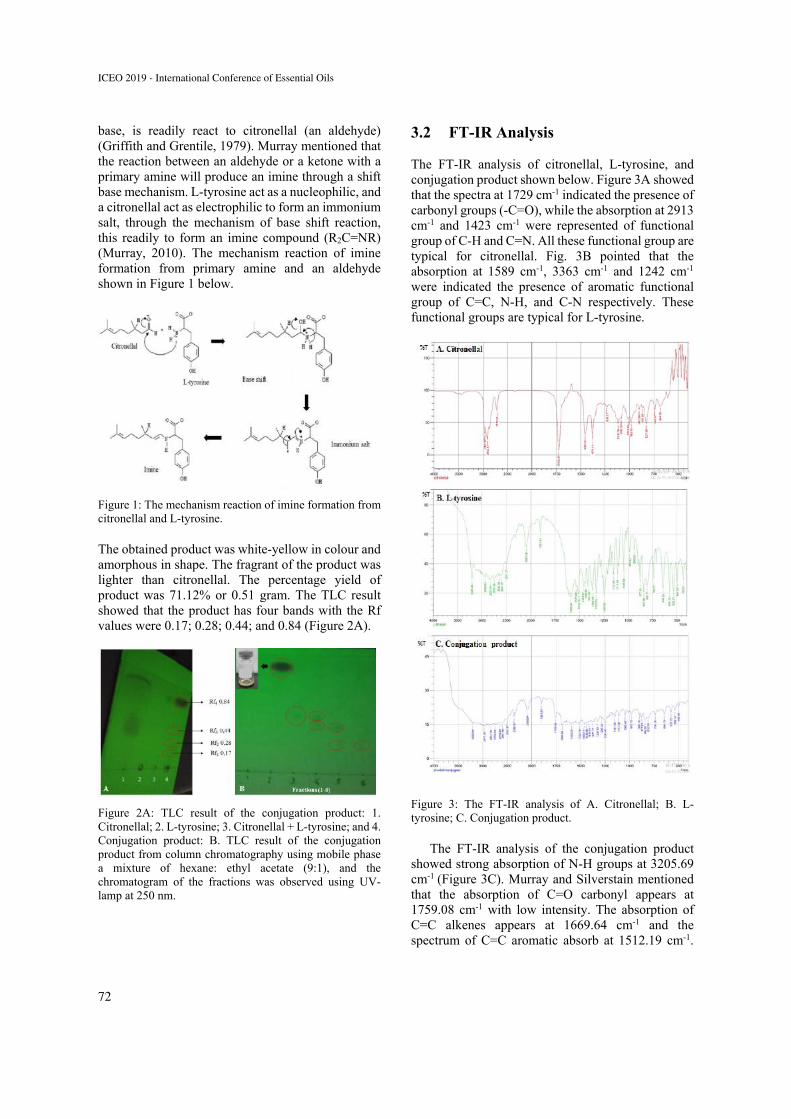
base, is readily react to citronellal (an aldehyde) (Griffith and Grentile, 1979). Murray mentioned that the reaction between an aldehyde or a ketone with a primary amine will produce an imine through a shift base mechanism. L-tyrosine act as a nucleophilic, and a citronellal act as electrophilic to form an immonium salt, through the mechanism of base shift reaction, this readily to form an imine compound (R2C=NR) (Murray, 2010). The mechanism reaction of imine formation from primary amine and an aldehyde shown in Figure 1 below.
Figure 1: The mechanism reaction of imine formation from citronellal and L-tyrosine.
The obtained product was white-yellow in colour and amorphous in shape. The fragrant of the product was lighter than citronellal. The percentage yield of product was 71.12% or 0.51 gram. The TLC result showed that the product has four bands with the Rf values were 0.17; 0.28; 0.44; and 0.84 (Figure 2A).
Figure 2A: TLC result of the conjugation product: 1. Citronellal; 2. L-tyrosine; 3. Citronellal + L-tyrosine; and 4. Conjugation product: B. TLC result of the conjugation product from column chromatography using mobile phase a mixture of hexane: ethyl acetate (9:1), and the chromatogram of the fractions was observed using UV-lamp at 250 nm.
3.2 FT-IR Analysis The FT-IR analysis of citronellal, L-tyrosine, and conjugation product shown below. Figure 3A showed that the spectra at 1729 cm-1 indicated the presence of carbonyl groups (-C=O), while the absorption at 2913 cm-1 and 1423 cm-1 were represented of functional group of C-H and C=N. All these functional group are typical for citronellal. Fig. 3B pointed that the absorption at 1589 cm-1, 3363 cm-1 and 1242 cm-1 were indicated the presence of aromatic functional group of C=C, N-H, and C-N respectively. These functional groups are typical for L-tyrosine.
Figure 3: The FT-IR analysis of A. Citronellal; B. L-tyrosine; C. Conjugation product.
The FT-IR analysis of the conjugation product showed strong absorption of N-H groups at 3205.69 cm-1 (Figure 3C). Murray and Silverstain mentioned that the absorption of C=O carbonyl appears at 1759.08 cm-1 with low intensity. The absorption of C=C alkenes appears at 1669.64 cm-1 and the spectrum of C=C aromatic absorb at 1512.19 cm-1.
ICEO 2019 - International Conference of Essential Oils
72
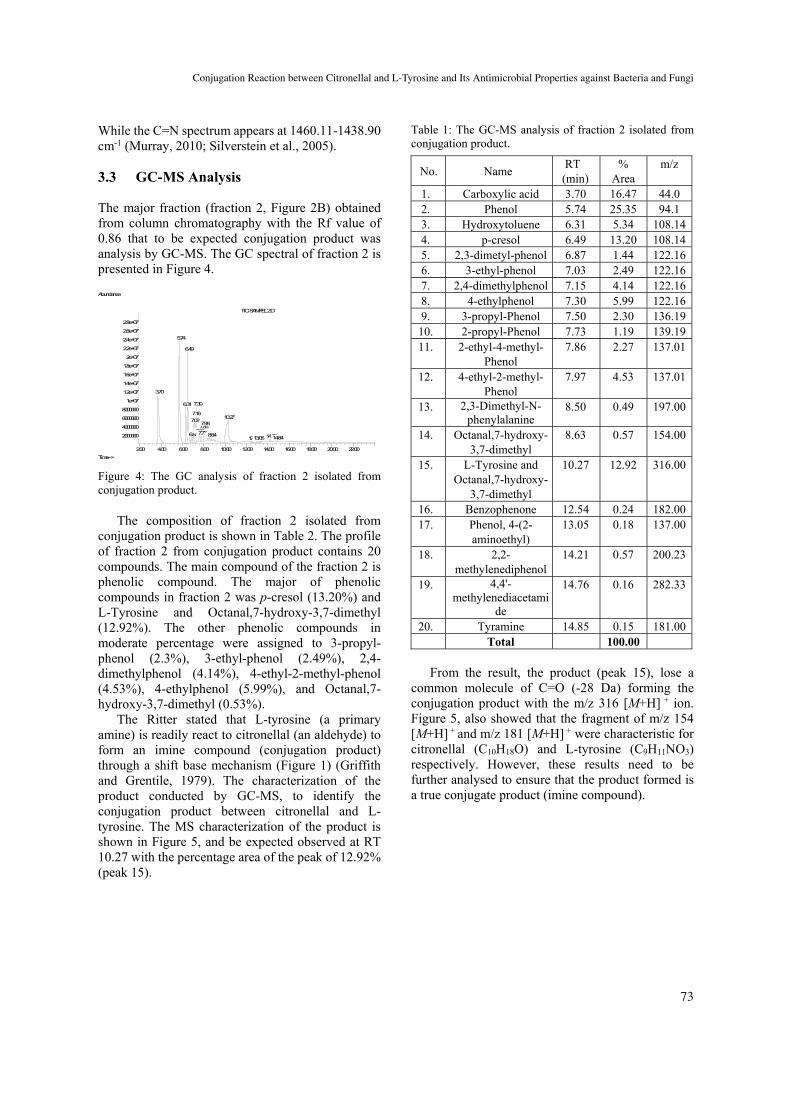
While the C=N spectrum appears at 1460.11-1438.90 cm-1 (Murray, 2010; Silverstein et al., 2005).
3.3 GC-MS Analysis
The major fraction (fraction 2, Figure 2B) obtained from column chromatography with the Rf value of 0.86 that to be expected conjugation product was analysis by GC-MS. The GC spectral of fraction 2 is presented in Figure 4.
Figure 4: The GC analysis of fraction 2 isolated from conjugation product.
The composition of fraction 2 isolated from conjugation product is shown in Table 2. The profile of fraction 2 from conjugation product contains 20 compounds. The main compound of the fraction 2 is phenolic compound. The major of phenolic compounds in fraction 2 was p-cresol (13.20%) and L-Tyrosine and Octanal,7-hydroxy-3,7-dimethyl (12.92%). The other phenolic compounds in moderate percentage were assigned to 3-propyl-phenol (2.3%), 3-ethyl-phenol (2.49%), 2,4-dimethylphenol (4.14%), 4-ethyl-2-methyl-phenol (4.53%), 4-ethylphenol (5.99%), and Octanal,7-hydroxy-3,7-dimethyl (0.53%).
The Ritter stated that L-tyrosine (a primary amine) is readily react to citronellal (an aldehyde) to form an imine compound (conjugation product) through a shift base mechanism (Figure 1) (Griffith and Grentile, 1979). The characterization of the product conducted by GC-MS, to identify the conjugation product between citronellal and L-tyrosine. The MS characterization of the product is shown in Figure 5, and be expected observed at RT 10.27 with the percentage area of the peak of 12.92% (peak 15).
Table 1: The GC-MS analysis of fraction 2 isolated from conjugation product.
No. Name RT (min)
% Area
m/z
1. Carboxylic acid 3.70 16.47 44.0 2. Phenol 5.74 25.35 94.1 3. Hydroxytoluene 6.31 5.34 108.144. p-cresol 6.49 13.20 108.145. 2,3-dimetyl-phenol 6.87 1.44 122.166. 3-ethyl-phenol 7.03 2.49 122.167. 2,4-dimethylphenol 7.15 4.14 122.168. 4-ethylphenol 7.30 5.99 122.169. 3-propyl-Phenol 7.50 2.30 136.1910. 2-propyl-Phenol 7.73 1.19 139.1911. 2-ethyl-4-methyl-
Phenol 7.86 2.27 137.01
12. 4-ethyl-2-methyl-Phenol
7.97 4.53 137.01
13. 2,3-Dimethyl-N-phenylalanine
8.50 0.49 197.00
14. Octanal,7-hydroxy-3,7-dimethyl
8.63 0.57 154.00
15. L-Tyrosine and Octanal,7-hydroxy-
3,7-dimethyl
10.27 12.92 316.00
16. Benzophenone 12.54 0.24 182.0017. Phenol, 4-(2-
aminoethyl) 13.05 0.18 137.00
18. 2,2-methylenediphenol
14.21 0.57 200.23
19. 4,4'-methylenediacetami
de
14.76 0.16 282.33
20. Tyramine 14.85 0.15 181.00 Total 100.00
From the result, the product (peak 15), lose a
common molecule of C=O (-28 Da) forming the conjugation product with the m/z 316 [M+H] + ion. Figure 5, also showed that the fragment of m/z 154 [M+H] + and m/z 181 [M+H] + were characteristic for citronellal (C10H18O) and L-tyrosine (C9H11NO3) respectively. However, these results need to be further analysed to ensure that the product formed is a true conjugate product (imine compound).
2.00 4.00 6.00 8.00 10.00 12.00 14.00 16.00 18.00 20.00 22.00
2000000
4000000
6000000
8000000
1e+07
1.2e+07
1.4e+07
1.6e+07
1.8e+07
2e+07
2.2e+07
2.4e+07
2.6e+07
2.8e+07
Time-->
Abundance
TIC: SAMPEL 2.D
3.70
5.74
6.31
6.49
6.87
7.03
7.16
7.30
7.50 7.73 7.86 7.98
8.50 8.64
10.27
12.54 13.05 14.22 14.75 14.84
Conjugation Reaction between Citronellal and L-Tyrosine and Its Antimicrobial Properties against Bacteria and Fungi
73
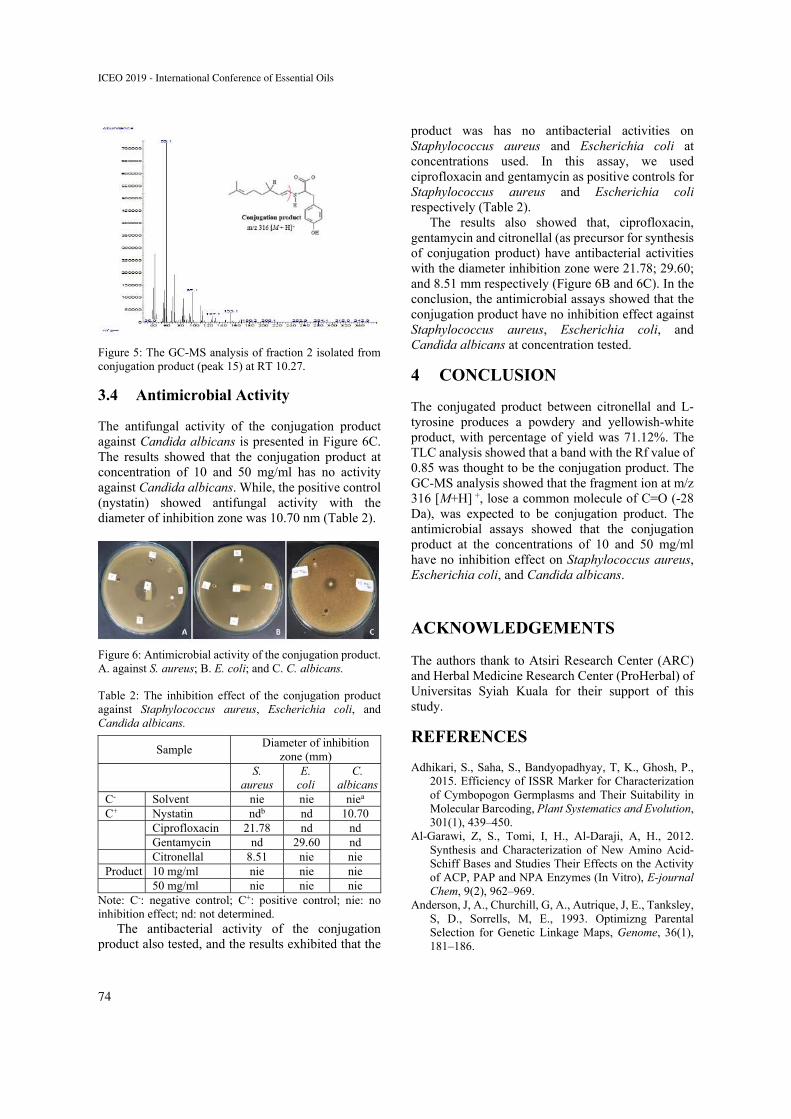
Figure 5: The GC-MS analysis of fraction 2 isolated from conjugation product (peak 15) at RT 10.27.
3.4 Antimicrobial Activity
The antifungal activity of the conjugation product against Candida albicans is presented in Figure 6C. The results showed that the conjugation product at concentration of 10 and 50 mg/ml has no activity against Candida albicans. While, the positive control (nystatin) showed antifungal activity with the diameter of inhibition zone was 10.70 nm (Table 2).
Figure 6: Antimicrobial activity of the conjugation product. A. against S. aureus; B. E. coli; and C. C. albicans.
Table 2: The inhibition effect of the conjugation product against Staphylococcus aureus, Escherichia coli, and Candida albicans.
Sample Diameter of inhibition
zone (mm)
S.
aureus E.
coli C.
albicansC- Solvent nie nie niea C+ Nystatin ndb nd 10.70 Ciprofloxacin 21.78 nd nd
Gentamycin nd 29.60 nd Citronellal 8.51 nie nie Product 10 mg/ml nie nie nie 50 mg/ml nie nie nie
Note: C-: negative control; C+: positive control; nie: no inhibition effect; nd: not determined.
The antibacterial activity of the conjugation product also tested, and the results exhibited that the
product was has no antibacterial activities on Staphylococcus aureus and Escherichia coli at concentrations used. In this assay, we used ciprofloxacin and gentamycin as positive controls for Staphylococcus aureus and Escherichia coli respectively (Table 2).
The results also showed that, ciprofloxacin, gentamycin and citronellal (as precursor for synthesis of conjugation product) have antibacterial activities with the diameter inhibition zone were 21.78; 29.60; and 8.51 mm respectively (Figure 6B and 6C). In the conclusion, the antimicrobial assays showed that the conjugation product have no inhibition effect against Staphylococcus aureus, Escherichia coli, and Candida albicans at concentration tested.
4 CONCLUSION
The conjugated product between citronellal and L-tyrosine produces a powdery and yellowish-white product, with percentage of yield was 71.12%. The TLC analysis showed that a band with the Rf value of 0.85 was thought to be the conjugation product. The GC-MS analysis showed that the fragment ion at m/z 316 [M+H] +, lose a common molecule of C=O (-28 Da), was expected to be conjugation product. The antimicrobial assays showed that the conjugation product at the concentrations of 10 and 50 mg/ml have no inhibition effect on Staphylococcus aureus, Escherichia coli, and Candida albicans.
ACKNOWLEDGEMENTS The authors thank to Atsiri Research Center (ARC) and Herbal Medicine Research Center (ProHerbal) of Universitas Syiah Kuala for their support of this study.
REFERENCES
Adhikari, S., Saha, S., Bandyopadhyay, T, K., Ghosh, P., 2015. Efficiency of ISSR Marker for Characterization of Cymbopogon Germplasms and Their Suitability in Molecular Barcoding, Plant Systematics and Evolution, 301(1), 439–450.
Al-Garawi, Z, S., Tomi, I, H., Al-Daraji, A, H., 2012. Synthesis and Characterization of New Amino Acid-Schiff Bases and Studies Their Effects on the Activity of ACP, PAP and NPA Enzymes (In Vitro), E-journal Chem, 9(2), 962–969.
Anderson, J, A., Churchill, G, A., Autrique, J, E., Tanksley, S, D., Sorrells, M, E., 1993. Optimizng Parental Selection for Genetic Linkage Maps, Genome, 36(1), 181–186.
ICEO 2019 - International Conference of Essential Oils
74
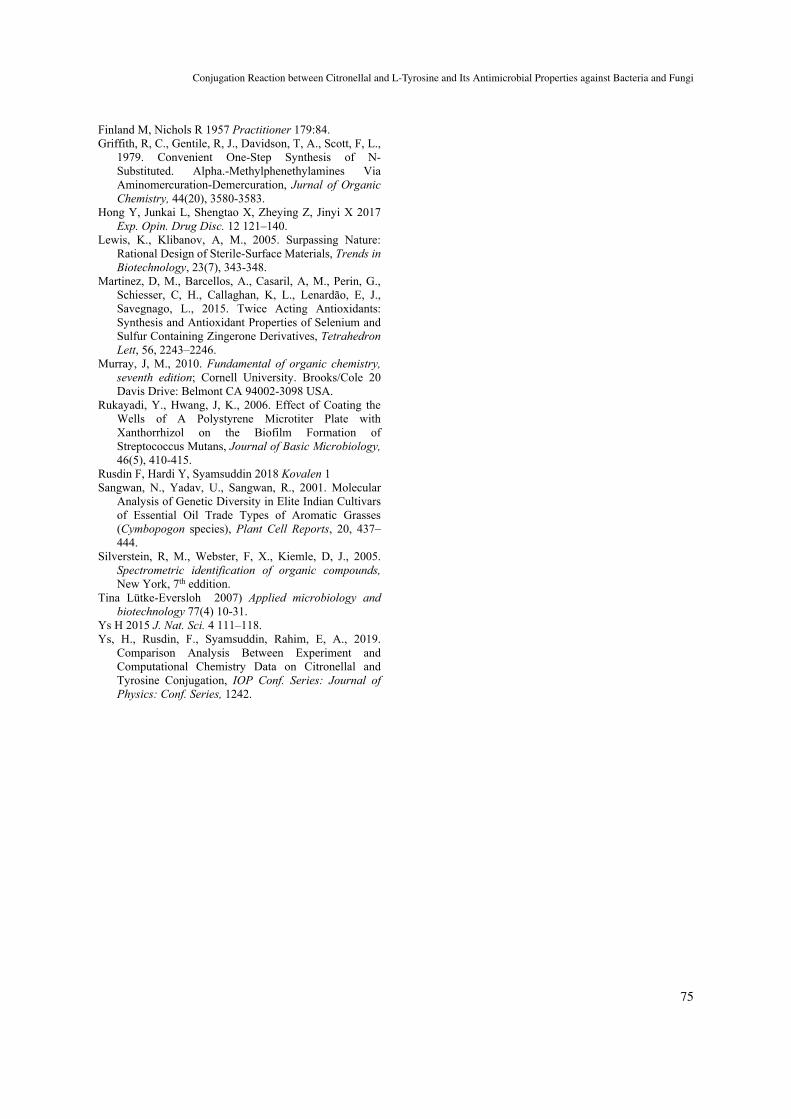
Finland M, Nichols R 1957 Practitioner 179:84. Griffith, R, C., Gentile, R, J., Davidson, T, A., Scott, F, L.,
1979. Convenient One-Step Synthesis of N-Substituted. Alpha.-Methylphenethylamines Via Aminomercuration-Demercuration, Jurnal of Organic Chemistry, 44(20), 3580-3583.
Hong Y, Junkai L, Shengtao X, Zheying Z, Jinyi X 2017 Exp. Opin. Drug Disc. 12 121–140.
Lewis, K., Klibanov, A, M., 2005. Surpassing Nature: Rational Design of Sterile-Surface Materials, Trends in Biotechnology, 23(7), 343-348.
Martinez, D, M., Barcellos, A., Casaril, A, M., Perin, G., Schiesser, C, H., Callaghan, K, L., Lenardão, E, J., Savegnago, L., 2015. Twice Acting Antioxidants: Synthesis and Antioxidant Properties of Selenium and Sulfur Containing Zingerone Derivatives, Tetrahedron Lett, 56, 2243–2246.
Murray, J, M., 2010. Fundamental of organic chemistry, seventh edition; Cornell University. Brooks/Cole 20 Davis Drive: Belmont CA 94002-3098 USA.
Rukayadi, Y., Hwang, J, K., 2006. Effect of Coating the Wells of A Polystyrene Microtiter Plate with Xanthorrhizol on the Biofilm Formation of Streptococcus Mutans, Journal of Basic Microbiology, 46(5), 410-415.
Rusdin F, Hardi Y, Syamsuddin 2018 Kovalen 1 Sangwan, N., Yadav, U., Sangwan, R., 2001. Molecular
Analysis of Genetic Diversity in Elite Indian Cultivars of Essential Oil Trade Types of Aromatic Grasses (Cymbopogon species), Plant Cell Reports, 20, 437–444.
Silverstein, R, M., Webster, F, X., Kiemle, D, J., 2005. Spectrometric identification of organic compounds, New York, 7th eddition.
Tina Lütke-Eversloh 2007) Applied microbiology and biotechnology 77(4) 10-31.
Ys H 2015 J. Nat. Sci. 4 111–118. Ys, H., Rusdin, F., Syamsuddin, Rahim, E, A., 2019.
Comparison Analysis Between Experiment and Computational Chemistry Data on Citronellal and Tyrosine Conjugation, IOP Conf. Series: Journal of Physics: Conf. Series, 1242.
Conjugation Reaction between Citronellal and L-Tyrosine and Its Antimicrobial Properties against Bacteria and Fungi
75
Effect of the Fractional Distillation on an Increment Patchouli Alcohol Content in Patchouli Oil
Yuliani Aisyah1,2, Sri Haryani Anwar1 and Yulia Annisa1 1Agricultural Product Technology, Agriculture Faculty, Universitas Syiah Kuala, Banda Aceh, Indonesia, 23111
2PUI - Atsiri Research Center, Universitas Syiah Kuala, Banda Aceh, Indonesia, 23111 [email protected]
Keywords: Patchouli oil, fractional distillation, patchouli alcohol, boiling point.
Abstract: Indonesia is one of the patchouli oil producers in the world, however, the problem is the quality of patchouli oil, especially patchouli alcohol content that are still below the required standard. One of the methods that can be used to increase the content of patchouli alcohol is fractional distillation method. This research aims to know the influence of the initial concentration of patchouli alcohol and height of column against increment of patchouli alcohol content in patchouli oil. The experimental design which used was Complete Randomized Design (CRD) consist of two factors, first factor namely the initial concentration of patchouli alcohol (C1 = 31,11%, C2 = 32,83%, and C3 = 33,61%) and second factor is height of column (H1 = 25 cm and H2 = 45 cm). Analysis of variance shows that the height of vigreux column has a real influence against the increased levels of patchouli alcohol. The highest levels of patchouli alcohol (83,86%) obtained from the residue fraction of distillation with 31.11 % initial concentration of patchouli alcohol and 45 cm height of column. The higher levels of patchouli alcohol in patchouli oil residue fraction, the higher specific gravity and the refractive index, and solubility in ethanol will be easier. The result shows that this sample have 1.013 specific gravity, clear in ethanol at 1:5 and have 1.5166 refractive index.
1 INTRODUCTION
Patchouli (Pogostemon cablin Benth) is one of the plants that produce an essential oil known as the Patchouli oil. Patchouli comes from a family of Lamiaceae, the order of Lamiales and Class of Angiospermae. There are several types of Patchouli in Indonesia, such as Pogostemon cablin Benth, or widely known as Aceh Patchouli (Nilam Aceh), which has the oil content of 2.5-5%. Furthermore, the Pogostemon heyneanus which is known as Java Patchouli (Nilam Jawa) with the oil content of 0.5-1.5%, and Pogostemon hortensis also known as Soap Patchouli with the oil content of 0.5-1.5% (Rukmana, 2003).
According to Aisyah et al. (2008), there are 15 identified chemical constituents of Patchouli oil. The constituents with the highest percentage are patchouli alcohol (32.60%), δ-guaiene (23.07%), α-guaiene (15.91%), seychellene (6.95%) dan α-patchoulene (5.47%). These five components are also similar to the result of Corine and Sellier (2004).
The patchouli alcohol (PA) is one of the quality parameters of patchouli oil. Patchouli alcohol is an
oxygenated sesquiterpene that has a boiling point of 140 ºC at 8 mmHg pressure, the molecular weight of 224 and a molecular formula of C15H26O (Bulan et al., 2000). According to the international standard, the best quality of patchouli oil is the one with patchouli alcohol content at least 38% (Essential Oil Association of USA, 1975), and 31% (SNI 06-2385-2006). The patchouli oil produced in Indonesia relatively has a low content of patchouli alcohol which is < 30%. This is because the postharvest handling before distillation is not conducted very well, the distillation process is not optimal (simple method and equipment, and short distillation time), and because of the material source. Therefore, the parameter of patchouli alcohol content needs to be improved to expand the market.
All this time the farmers only capable to produce the oil with patchouli content of 26-28%, while the distillation industry that uses the stainless-steel distillation equipment can produce the oil with patchouli alcohol content up to 31-35% (Sarwono, 1998).
Several types of research have been conducted to improve the patchouli alcohol content in patchouli oil
76Aisyah, Y., Anwar, S. and Annisa, Y.Effect of the Fractional Distillation on an Increment Patchouli Alcohol Content in Patchouli Oil.In Proceedings of the 2nd International Conference of Essential Oils (ICEO 2019), pages 76-81ISBN: 978-989-758-456-5Copyright © 2020 by SCITEPRESS – Science and Technology Publications, Lda. All rights reserved
by using different method, for instance the fractional distillation (Bulan et al., 2000; Harfizal, 2003; Yanyan et al., 2004), rotary evaporator with fractionation temperature control (Suryatmi, 2008), cellulose acetate membrane (Aisyah et al., 2010), vacuum fractionation distillation (Aisyah et al., 2013; Isaroiny and Mitarlis, 2005), a combination of fermentation, delignification and distillation methods (Muharam et al., 2017). The result showed that the increase of patchouli alcohol content varies depends on the method used.
Based on the boiling point, constituents of patchouli oil have boiling point as follows: patchouli alcohol (140°C at 8 mmHg), eugenol (252.66 °C at 760 mmHg), benzaldehyde (178.07 °C at 760 mmHg), cinnamic aldehydes (251.00 °C at 760 mmHg) and cadinene (274 °C at 760 mmHg) (Guenther, 1949). The difference in the boiling point leads the components to be separated by the fractionation distillation process. To provide a thorough result and prevent component damage due to the impact of temperature on ordinary fractionation distillation, the process will be accompanied by vacuum fractionation distillation.
This research aims to optimize the vacuum fractional distillation by considering the factor of initial patchouli alcohol of patchouli oil and factor of fractionational distillation column used in this process. It is assumed that these two factors can produce a higher percentage of final patchouli alcohol than initial patchouli alcohol from patchouli oil.
2 MATERIAL AND METHOD
2.1 Material
The material used in this research is patchouli oil from Meukek, Pasie Raja, and Panjupian Sub-district of Aceh Selatan Regency. The equipment used is a series of vacuum fractionation distillation equipment consisting of 500 ml round neck flasks, vigreux columns, thermometers, condensers, 3 heart-shaped flasks, vacuum pumps, pans, and hot plates. Quality analysis is using Gas chromatography-mass spectrometry Shimadzu GCMS-QP 2010S, GC-QP 2010S, pycnometer, analytical scale, test tubes, drop pipettes and Abbe refractometers.
2.2 Method
Vacuum Fractional Distillation Process (Modified by Aisyah, 2008). The fractional distillation process of patchouli oil is using a series of vacuum fractionation
distillation equipment which is accompanied by a vacuum pump. The patchouli oil used is 300 ml. The distillation was done at ±2 KPa (± 15.001 mmHg) pressure and temperature of 30-190 °C. The distillation was conducted until there are no more distillate drops on the heart-shaped flask. The sample of patchouli oil is analyzed by using GC-MS before fractionation. The residue from the fractional distillation then was analyzed to determine the final patchouli alcohol content. Furthermore, the residue with the highest content of patchouli alcohol was analyzed for refractive index and solubility in water.
3 RESULT AND DISCUSSION
3.1 Chemical Constituent of Patchouli Alcohol
The Chromatogram (Figure 1) represents the analysis result of chemical constituent using GC-MS on three patchouli oil before fractionation, and the chemical constituent components in patchouli oil that is above 1% can be seen in Table 1.
Table 1: Chemical constituent of Patchouli Oil
Chemical constituent Meukek Pasie Raja
Panju pian
β-Patchoulene 1,62 1,76 1,73 2,4-Diisopropenyl-1-methyl-1-vinyl-cyclohexane
1,00 1.02 1,20
β-Caryophyllene 2,87 2,77 3,06 -Guaiene 17,39 16,61 18,10
Seychellene 4,68 4,27 4,67 α-Patchoulene 6,89 6,46 6,65 Alloaromadendrene 2,82 2,81 3,32 Δ -Guaiene 21,45 20,23 20,08 1H-Cycloprop[e]azulen-4-ol, decahydro-1,1,4,7-tetramethyl
4,03 5,35
Patchouli alcohol 31,11 32,83 33,61 2H-Pyran-2,4(3H)-dione, 3-acetyl-6-methyl
1,12
Effect of the Fractional Distillation on an Increment Patchouli Alcohol Content in Patchouli Oil
77
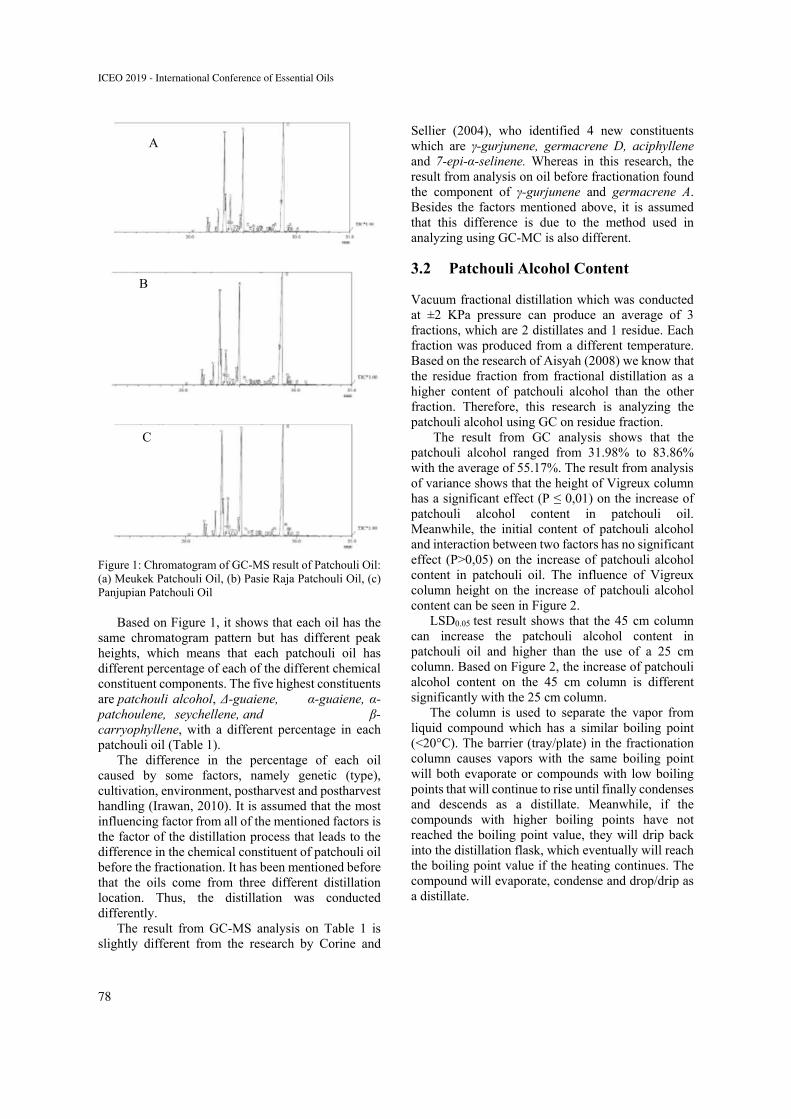
Figure 1: Chromatogram of GC-MS result of Patchouli Oil: (a) Meukek Patchouli Oil, (b) Pasie Raja Patchouli Oil, (c) Panjupian Patchouli Oil
Based on Figure 1, it shows that each oil has the
same chromatogram pattern but has different peak heights, which means that each patchouli oil has different percentage of each of the different chemical constituent components. The five highest constituents are patchouli alcohol, Δ-guaiene, α-guaiene, α-patchoulene, seychellene, and β-carryophyllene, with a different percentage in each patchouli oil (Table 1).
The difference in the percentage of each oil caused by some factors, namely genetic (type), cultivation, environment, postharvest and postharvest handling (Irawan, 2010). It is assumed that the most influencing factor from all of the mentioned factors is the factor of the distillation process that leads to the difference in the chemical constituent of patchouli oil before the fractionation. It has been mentioned before that the oils come from three different distillation location. Thus, the distillation was conducted differently.
The result from GC-MS analysis on Table 1 is slightly different from the research by Corine and
Sellier (2004), who identified 4 new constituents which are γ-gurjunene, germacrene D, aciphyllene and 7-epi-α-selinene. Whereas in this research, the result from analysis on oil before fractionation found the component of γ-gurjunene and germacrene A. Besides the factors mentioned above, it is assumed that this difference is due to the method used in analyzing using GC-MC is also different.
3.2 Patchouli Alcohol Content
Vacuum fractional distillation which was conducted at ±2 KPa pressure can produce an average of 3 fractions, which are 2 distillates and 1 residue. Each fraction was produced from a different temperature. Based on the research of Aisyah (2008) we know that the residue fraction from fractional distillation as a higher content of patchouli alcohol than the other fraction. Therefore, this research is analyzing the patchouli alcohol using GC on residue fraction.
The result from GC analysis shows that the patchouli alcohol ranged from 31.98% to 83.86% with the average of 55.17%. The result from analysis of variance shows that the height of Vigreux column has a significant effect (P ≤ 0,01) on the increase of patchouli alcohol content in patchouli oil. Meanwhile, the initial content of patchouli alcohol and interaction between two factors has no significant effect (P>0,05) on the increase of patchouli alcohol content in patchouli oil. The influence of Vigreux column height on the increase of patchouli alcohol content can be seen in Figure 2.
LSD0.05 test result shows that the 45 cm column can increase the patchouli alcohol content in patchouli oil and higher than the use of a 25 cm column. Based on Figure 2, the increase of patchouli alcohol content on the 45 cm column is different significantly with the 25 cm column.
The column is used to separate the vapor from liquid compound which has a similar boiling point (<20°C). The barrier (tray/plate) in the fractionation column causes vapors with the same boiling point will both evaporate or compounds with low boiling points that will continue to rise until finally condenses and descends as a distillate. Meanwhile, if the compounds with higher boiling points have not reached the boiling point value, they will drip back into the distillation flask, which eventually will reach the boiling point value if the heating continues. The compound will evaporate, condense and drop/drip as a distillate.
A
B
C
ICEO 2019 - International Conference of Essential Oils
78
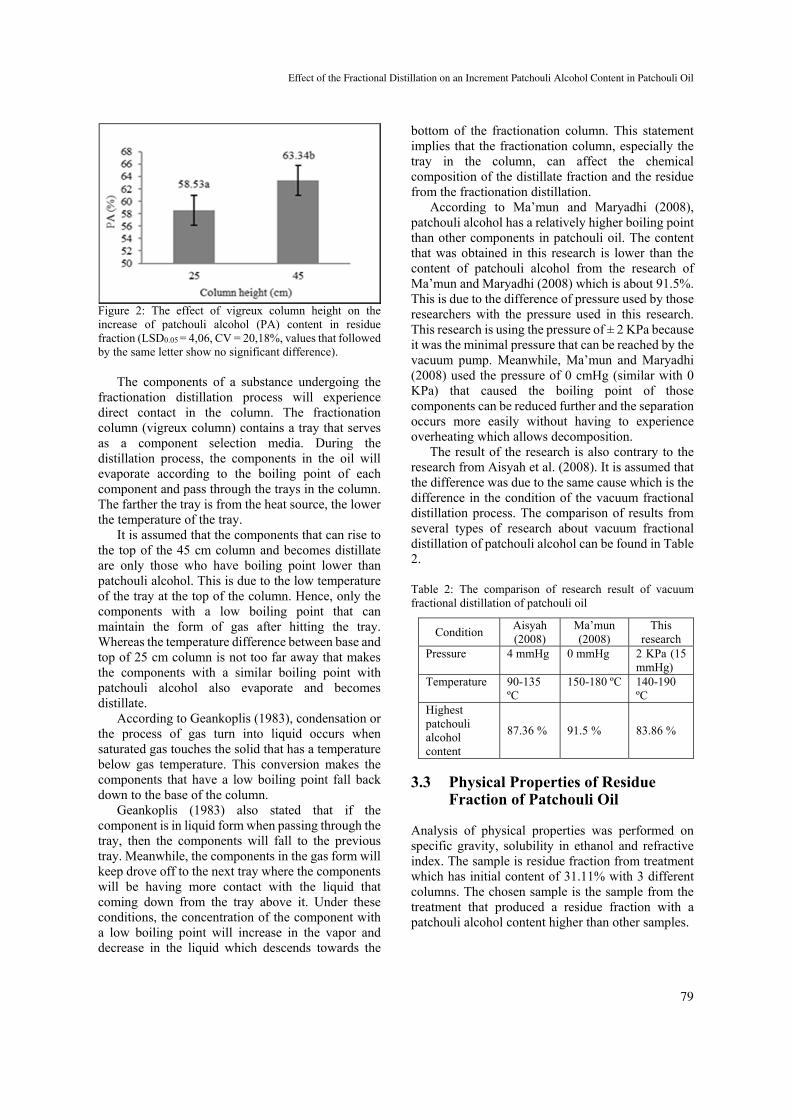
Figure 2: The effect of vigreux column height on the increase of patchouli alcohol (PA) content in residue fraction (LSD0.05 = 4,06, CV = 20,18%, values that followed by the same letter show no significant difference).
The components of a substance undergoing the fractionation distillation process will experience direct contact in the column. The fractionation column (vigreux column) contains a tray that serves as a component selection media. During the distillation process, the components in the oil will evaporate according to the boiling point of each component and pass through the trays in the column. The farther the tray is from the heat source, the lower the temperature of the tray.
It is assumed that the components that can rise to the top of the 45 cm column and becomes distillate are only those who have boiling point lower than patchouli alcohol. This is due to the low temperature of the tray at the top of the column. Hence, only the components with a low boiling point that can maintain the form of gas after hitting the tray. Whereas the temperature difference between base and top of 25 cm column is not too far away that makes the components with a similar boiling point with patchouli alcohol also evaporate and becomes distillate.
According to Geankoplis (1983), condensation or the process of gas turn into liquid occurs when saturated gas touches the solid that has a temperature below gas temperature. This conversion makes the components that have a low boiling point fall back down to the base of the column.
Geankoplis (1983) also stated that if the component is in liquid form when passing through the tray, then the components will fall to the previous tray. Meanwhile, the components in the gas form will keep drove off to the next tray where the components will be having more contact with the liquid that coming down from the tray above it. Under these conditions, the concentration of the component with a low boiling point will increase in the vapor and decrease in the liquid which descends towards the
bottom of the fractionation column. This statement implies that the fractionation column, especially the tray in the column, can affect the chemical composition of the distillate fraction and the residue from the fractionation distillation.
According to Ma’mun and Maryadhi (2008), patchouli alcohol has a relatively higher boiling point than other components in patchouli oil. The content that was obtained in this research is lower than the content of patchouli alcohol from the research of Ma’mun and Maryadhi (2008) which is about 91.5%. This is due to the difference of pressure used by those researchers with the pressure used in this research. This research is using the pressure of ± 2 KPa because it was the minimal pressure that can be reached by the vacuum pump. Meanwhile, Ma’mun and Maryadhi (2008) used the pressure of 0 cmHg (similar with 0 KPa) that caused the boiling point of those components can be reduced further and the separation occurs more easily without having to experience overheating which allows decomposition.
The result of the research is also contrary to the research from Aisyah et al. (2008). It is assumed that the difference was due to the same cause which is the difference in the condition of the vacuum fractional distillation process. The comparison of results from several types of research about vacuum fractional distillation of patchouli alcohol can be found in Table 2.
Table 2: The comparison of research result of vacuum fractional distillation of patchouli oil
Condition Aisyah (2008)
Ma’mun (2008)
This research
Pressure 4 mmHg 0 mmHg 2 KPa (15 mmHg)
Temperature 90-135 ºC
150-180 ºC 140-190 ºC
Highest patchouli alcohol content
87.36 % 91.5 % 83.86 %
3.3 Physical Properties of Residue Fraction of Patchouli Oil
Analysis of physical properties was performed on specific gravity, solubility in ethanol and refractive index. The sample is residue fraction from treatment which has initial content of 31.11% with 3 different columns. The chosen sample is the sample from the treatment that produced a residue fraction with a patchouli alcohol content higher than other samples.
Effect of the Fractional Distillation on an Increment Patchouli Alcohol Content in Patchouli Oil
79
3.4 Specific Gravity
Specific gravity is the result of the ratio comparison between oil weight and water weight at the same volume and temperature (SNI, 2006). According to Gunther (1949), this parameter is essential in finding the foreign matter in a liquid or the shifts that may be affecting the quality of the oil. The result from the analysis of specific gravity (Table 3) shows that the specific gravity of the sample goes beyond the standard that has been determined by the Indonesian National Standard (SNI) which is about 0.950-0.975. This suggests that the residue fraction of patchouli oil from the treatment of 25 cm and 45 cm column cannot be sell as crude oil. However, the residue fraction can be applied as a material in derivative products from patchouli oil.
Table 3: Specific gravity and refractive index of residue fraction of patchouli oil
Sample Specific Gravity
Refractive Index
Without fractionation 0.953 1.5070 25 cm column height 1.005 1.5156 45 cm column height 1.013 1.5166
Table 3 shows the increase of the specific gravity
of patchouli oil before and after fractionation (control). This increase influenced by the components in the oil. According to Rizal (2010), specific gravity represents the comparison between heavy fractions and light fractions contained in the oil. The heavier fractions contained a higher specific gravity. The heavy fractions are influenced by the length of the molecular chain of a compound contained in the oil.
Patchouli oil is a compound with a molecular formula of C15H26O. Hence, this compound has a relatively long molecular chain which caused the oil to dominated by high specific gravity patchouli alcohol components. The result is shown in Table 3. The patchouli oil before fractional distillate only contains 31.11% of patchouli alcohol and a specific gravity of 0.953, while the residue fraction of patchouli oil which has been fractionated by 25 cm column has 75.14% of patchouli alcohol and a specific gravity of 1.005. Furthermore, the residue fraction of patchouli oil which has been fractionated by 45 cm column has 83.86% of patchouli alcohol and a specific gravity of 1.013.
3.5 Refractive Index
The refractive index is the ratio of the velocity of light in air to its velocity in the examined substance at
a certain temperature (Armando, 2009). According to Guenther (1949), the index of refraction value of patchouli oil or other essential oil can be determined by using Abbe refractometer. The result from the analysis of the refractive index (Table 3) shows the treatment of a 45 cm column with the initial content of 31.11% resulting in the highest refractive index of 1.5166. Guenther (1949) explained that the value of the specific gravity of essential oil will affect the refractive index value. As can be seen at Table 3, Patchouli oil which has not been fractionated and with a patchouli alcohol content of 31.11% with a specific gravity value of 0.953, has a refractive index value of 1.5070, where this value is much lower than after fractionation with a 45 cm column height of 1.5166. This is in accordance with the statement from Armando (2009) who stated that the more components with a long chain-like sesquiterpene or sesquiterpene or oxygen clusters components contained, the density of essential oil medium will increase. Hence, the light will be harder to refract and the refractive index value will be higher.
3.6 Solubility in Ethanol 90%
The solubility of patchouli oil in ethanol is one of the examinations of patchouli oil quality based on physical properties. This test is conducted to determine the purity of essential oil.
Table 4: Residue fraction of patchouli oil solubility in Ethanol 90%
Without fractionation
25 cm column height
45 cm column height
1 : 5 Turbid 1 : 4 Turbid 1:3 Turbid 1 : 6 Turbid 1 : 5 Turbid 1:4 Turbid 1 : 7 Turbid 1 : 6 Turbid 1:5 Soluble 1 : 8 Soluble 1 : 7 Soluble 1:6 Soluble
Based on Table 4, it can be seen that the patchouli
oil residue fraction resulting from the K1T2 treatment is soluble at a ratio of 1: 5 (1 ml of oil and 5 ml of ethanol). The treatment shows a clear solution at the lowest ratio compared to other treatments, even clearer than the raw material (control) which is soluble at a ratio of 1:8. According to Guenther (1949), the solubility of oil in alcohol is determined by the type of chemical components contained in essential oil. In general, essential oils which contain oxygenated terpene compounds will be more soluble in alcohol compared to essential oils containing non-oxygenated terpene components. This is because of the non-oxygenated terpene compounds which are
ICEO 2019 - International Conference of Essential Oils
80
nonpolar compounds that do not have functional groups. Thus, it is difficult to react with alcohol.
Patchouli alcohol is a component in patchouli oil which is included in an oxygenated terpene compound and has a functional group. Therefore, patchouli oil which has a higher level of patchouli alcohol such as the residual fraction resulting from the K1T2 treatment will be more soluble in alcohol compared to other treatment.
4 CONCLUSION
The height of vigreux column used in vacuum fractionation distillation has a significant effect on the increase of patchouli alcohol levels in patchouli oil residue fraction, while the initial patchouli alcohol levels did not affect the increase in patchouli alcohol levels in patchouli oil residue fraction. The value of specific gravity and refractive index from the fraction of residual fractionation result of patchouli oil is higher than patchouli oil before fractionation so that the solubility in ethanol will be easier. The highest alcohol content of patchouli was obtained from fractionation distillation using a column height of 45 cm which was 83.86%.
REFERENCES
Aisyah, Y., Hastuti, P., Sastrohamidjojo, H., and Hidayat, C. 2008. Komposisi Kimia dan Sifat Antibakteri Minyak nilam (Pogostemon cablin). Majalah Farmasi Indonesia, 19 (3), 151-156.
Aisyah, Y., Hastuti, P., Hidayat, C., and Sastrohamidjojo, H. 2010. Peningkatan Kadar Patchouli Alkohol Minyak Nilam (Pogostemon cablin Benth) dengan Menggunakan Membran Selulosa Asetat. Jurnal Agritech, 30(3), 184-191.
Aisyah, Y., S.H. Anwar., and Y, Annisa. 2013. Increment of patchouli alcohol in patchouli oil by vacuum distillation fraction method. Proceedings of The 3rd Annual International Conference Syiah Kuala University (AIC Unsyiah) In conjunction with The 2nd International Conference on Multidisciplinary Research (ICMR).
Armando, R. 2009. Memproduksi 15 Jenis Minyak Atsiri Berkualitas. Penebar Swadaya, Jakarta.
BSN (Badan Standardisasi Nasional). 2006. SNI No. 06-2385-2006. http://sisni.bsn.go.id (10 Mei 2012).
Bulan, R. 2004. Esterifikasi Patchouli Alkohol Hasil Isolasi dari Minyak Daun Nilam (Patchouli Oil). Jurusan Kimia Fakultas Matematika dan Ilmu Pengetahuan Alam Universitas Sumatera Utara.
Corine, M.B., Sellier, N.M., 2004. Analysis of The Essential Oil of Indonesian Patchouli (Pogostemon
cablin Benth.) Using GC/MS (EI/CI). J. Essent. Oil Res., 16, 17-19.
Essential Oil Association of USA. 1975. EOA Spesifications and Standard. EOA USA. New York.
Geankoplis, G.J. 1983. Transport Process and Unit Operation. Second Edition, Allyn and Bacon, Inc, Boston, London, Sydney, Toronto.
Guenther, E. 1949. Essential Oils : Volume II. Van Nostrand Reinhold Company, New York.
Harfizal. 2003. Penerapan teknologi distilasi vakum untuk meningkatkan mutu minyak nilam. Prosiding Seminar Teknologi untuk Negeri.
Irawan, B. 2010. Peningkatan Mutu Minyak Nilam dengan Ekstraksi dan Destilasi Pada Berbagai Komposisi Pelarut. Tesis. Magister Teknik Kimia Universitas Diponegoro, Semarang.
Isaroiny, R., Mitarlis. 2005. Peningkatan Kadar Patchouli Alkohol pada Minyak Nilam (Pogostemon cablin Benth) dengan Metode Distilasi Fraksinasi Vakum. Berk. Penel. Hayati, 10, 123–127.
Ma’mun., Adhi Maryadhi. Isolasi Patchouli Alkohol dari Minyak Nilam untuk Bahan Referensi Pengujian dalam Analisis Mutu. Bul. Littro, 19(1), 95 – 99.
Muharam, S., Lela, M. Y., and Iim, S. R. 2017. Peningkatan Kualitas Minyak Nilam (Pogostemon Cablin Benth) menggunakan Kombinasi Metode Fermentasi, Delignifikasi dan Destilasi. Jurnal Kimia Valensi, 3 (2), 116-121.
Rizal, S. 2010. Kajian Proses Penyulingan Minyak Nilam Menggunakan Sistem Distilasi Air. Fakultas Teknologi Pertanian IPB, Bogor.
Rukmana, R. 2003. Nilam: Prospek Agribisnis dan Teknik Budidaya. Kanisius. Yogyakarta.
Sarwono, B. 1998. Budidaya Nilam di Purbalingga. Trubus 343-Th XXIX-Juni 1998. 77-78.
Suryatmi, R.D. 2008. Fraksinasi minyak nilam. Prosiding Konferensi Nasional Minyak Atsiri.
Yanyan, F.N., Zainuddin, A., Sumiarsa, D. 2004. Peningkatan kadar patchouli alkohol dalam minyak nilam (patchouli oil) dan usaha derivatisasi komponen minornya. Jurnal Perkembangan Teknologi TRO, 16, 72-78.
Effect of the Fractional Distillation on an Increment Patchouli Alcohol Content in Patchouli Oil
81
Characterization of Seedlac Hydrolysis from Kesambi (Schleicera oleosa Merr) as an Intermediate Compound for Fragrance Synthesis
Retno Yunilawati1, Dwinna Rahmi1, Chicha Nuraeni1, Arief Riyanto1, Novinci Muharyani2, Pujo Sumantoro2, Murgunadi2, and Nur Hidayati1
1 Badan Penelitian dan Pengembangan Industri, Kementerian Perindustrian, Indonesia 2 Pusat Penelitian dan Pengembangan Perum Perhutani, Indonesia
Keywords: Seedlac, Kesambi, Hydrolysis, Aleuritic Acid.
Abstract: Seedlac is the organic resin obtained from secretion of female insect Laccifer lacca Kerr on a selected plant, one of them is Kesambi (Schleicera oleosa Merr). Seedlac contains almost 80% polyester which can be hydrolysed to ester compounds such as aleuritic acid which is an intermediate compound for the fragrance synthesis of the perfume industry. One of the problems in the seedlac hydrolysis is the presence of natural dyes (laccaic acid) which interfered with the hydrolysis process and affect the purity of the hydrolysis products. In this research, hydrolysis was carried out by first removing the natural dyes of shellac (decolorized process). The hydrolysis results were characterized using Gas Chromatography-Mass Spectrometry to determine the type of ester and its composition. The decolorized process of seedlac before hydrolysis in this experiment could improve the percentage of aleuritic acid up to 56%. Therefore, seedlac hydrolysis by decolorized process before hydrolysis can be considered for the production of esters from seedlac, especially aleuritic acid.
1 INTRODUCTION
Lac is an organic resin secreted by the insect Laccifer lacca Kerr on a selected plant (Sutherland and Río, 2014) (Nagappayya and Gaikar, 2010). In Indonesia, Kesambi (Schleicera oleosa Merr) is a plant prioritized for use as the host plant in the cultivation of the insects (Taskirawati et al., 2017). Lac forms a solid material on the branches of host plants attacked by the insects, and when collected in this form it is referred to as sticklac. The sticklac is crushed and sieved to remove impurities to get seedlac. Further processing in the refining of seedlac produced shellac.
Lac in Indonesia is developed by Perhutani (Probolinggo) and the insect’s cultivation has spread evenly in Nusa Tenggara Barat and Nusa Tenggara Timur (Taskirawati et al., 2017). Pehutani produced lac in the form of seedlac to fulfil domestics and foreign market and used mainly as varnish. So far there was no diversification of other lac products were done by Perhutani.
Shellac consists of 68% resin, 6% wax, and 1-2% dyes (such as laccaic acid and erythrolaccin). The resin of seedlac is a mixture of cross-linked polyester
or cyclic aliphatic polyhydroxy acid with sesquiterpenic acid (Biswas, 2014) (Sutherland and Río, 2014) (Nagappayya and Gaikar, 2010). The composition varies depending on the insect species and the host plant where seedlac is obtained (Farag and Leopold, 2009). The main compositions of polyester in shellac consists of aleuritic acid, butolic acid, shellolic acid and jalaric acid (Farag, 2010).
Aleuritic acid (9,10,16-trihydroxyhexadecanoic acid) was used as the starting material because of its multi functionalities (Ravi, Padmanabhan and Mamdapur, 2001). Aleuritic acid is mainly used in the perfumery industry, as a starting material for preparation isoambritolite is the main ingredient fragrance compounds "musk" (Biswas, 2014). Derivatization of shellac to aleuritic acid can increase shellac added value up to 15 times (Prasad, 2014).
The most common method in the isolation of aleuritic acid is alkaline hydrolysis of lac resin, separation, and purification. Besides containing polyester, seedlac also contains natural dyes which the presence influences the isolation of aleuritic acid. It is possible that polyester could be transferred into the colorant matrix (Berbers et al., 2019) and so the otherwise that colorant matrix could have been
82Yunilawati, R., Rahmi, D., Nuraeni, C., Riyanto, A., Muharyani, N., Sumantoro, P., Murgunadi and Hidayati, N.Characterization of Seedlac Hydrolysis from Kesambi (Schleicera oleosa Merr) as an Intermediate Compound for Fragrance Synthesis.In Proceedings of the 2nd International Conference of Essential Oils (ICEO 2019), pages 82-86ISBN: 978-989-758-456-5Copyright © 2020 by SCITEPRESS – Science and Technology Publications, Lda. All rights reserved
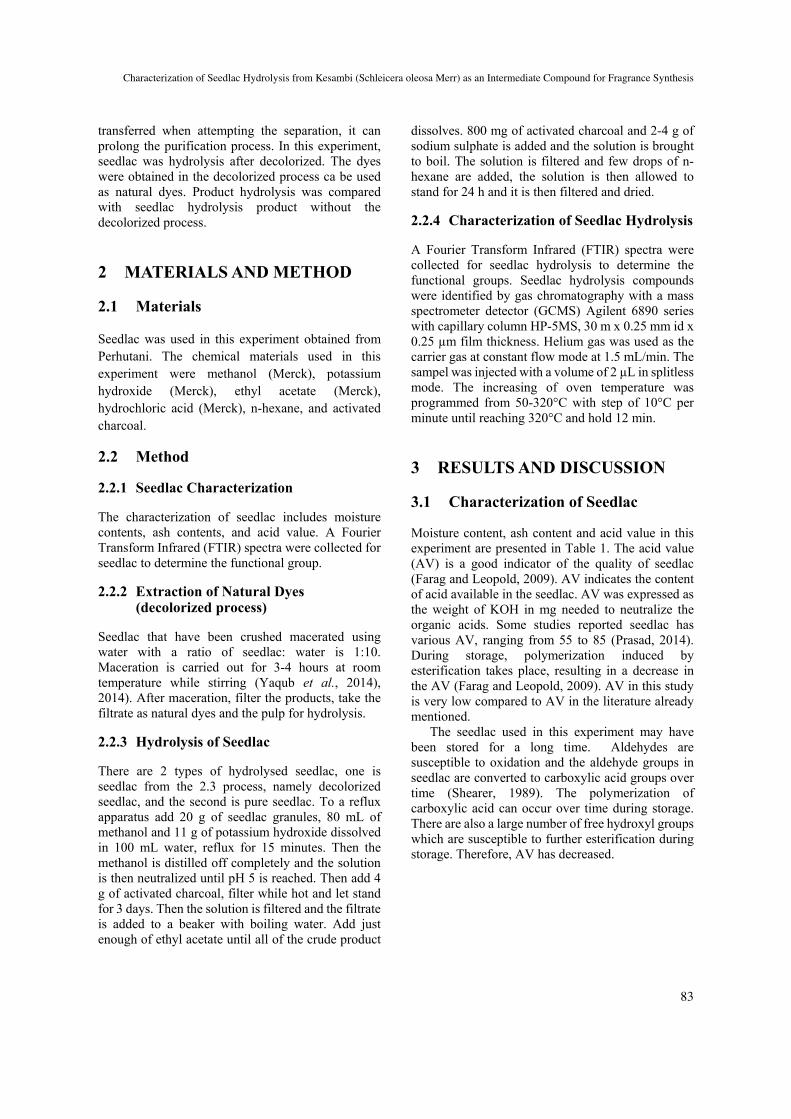
transferred when attempting the separation, it can prolong the purification process. In this experiment, seedlac was hydrolysis after decolorized. The dyes were obtained in the decolorized process ca be used as natural dyes. Product hydrolysis was compared with seedlac hydrolysis product without the decolorized process.
2 MATERIALS AND METHOD
2.1 Materials
Seedlac was used in this experiment obtained from Perhutani. The chemical materials used in this experiment were methanol (Merck), potassium hydroxide (Merck), ethyl acetate (Merck), hydrochloric acid (Merck), n-hexane, and activated charcoal.
2.2 Method
2.2.1 Seedlac Characterization
The characterization of seedlac includes moisture contents, ash contents, and acid value. A Fourier Transform Infrared (FTIR) spectra were collected for seedlac to determine the functional group.
2.2.2 Extraction of Natural Dyes (decolorized process)
Seedlac that have been crushed macerated using water with a ratio of seedlac: water is 1:10. Maceration is carried out for 3-4 hours at room temperature while stirring (Yaqub et al., 2014), 2014). After maceration, filter the products, take the filtrate as natural dyes and the pulp for hydrolysis.
2.2.3 Hydrolysis of Seedlac
There are 2 types of hydrolysed seedlac, one is seedlac from the 2.3 process, namely decolorized seedlac, and the second is pure seedlac. To a reflux apparatus add 20 g of seedlac granules, 80 mL of methanol and 11 g of potassium hydroxide dissolved in 100 mL water, reflux for 15 minutes. Then the methanol is distilled off completely and the solution is then neutralized until pH 5 is reached. Then add 4 g of activated charcoal, filter while hot and let stand for 3 days. Then the solution is filtered and the filtrate is added to a beaker with boiling water. Add just enough of ethyl acetate until all of the crude product
dissolves. 800 mg of activated charcoal and 2-4 g of sodium sulphate is added and the solution is brought to boil. The solution is filtered and few drops of n-hexane are added, the solution is then allowed to stand for 24 h and it is then filtered and dried.
2.2.4 Characterization of Seedlac Hydrolysis
A Fourier Transform Infrared (FTIR) spectra were collected for seedlac hydrolysis to determine the functional groups. Seedlac hydrolysis compounds were identified by gas chromatography with a mass spectrometer detector (GCMS) Agilent 6890 series with capillary column HP-5MS, 30 m x 0.25 mm id x 0.25 µm film thickness. Helium gas was used as the carrier gas at constant flow mode at 1.5 mL/min. The sampel was injected with a volume of 2 µL in splitless mode. The increasing of oven temperature was programmed from 50-320°C with step of 10°C per minute until reaching 320°C and hold 12 min.
3 RESULTS AND DISCUSSION
3.1 Characterization of Seedlac
Moisture content, ash content and acid value in this experiment are presented in Table 1. The acid value (AV) is a good indicator of the quality of seedlac (Farag and Leopold, 2009). AV indicates the content of acid available in the seedlac. AV was expressed as the weight of KOH in mg needed to neutralize the organic acids. Some studies reported seedlac has various AV, ranging from 55 to 85 (Prasad, 2014). During storage, polymerization induced by esterification takes place, resulting in a decrease in the AV (Farag and Leopold, 2009). AV in this study is very low compared to AV in the literature already mentioned.
The seedlac used in this experiment may have been stored for a long time. Aldehydes are susceptible to oxidation and the aldehyde groups in seedlac are converted to carboxylic acid groups over time (Shearer, 1989). The polymerization of carboxylic acid can occur over time during storage. There are also a large number of free hydroxyl groups which are susceptible to further esterification during storage. Therefore, AV has decreased.
Characterization of Seedlac Hydrolysis from Kesambi (Schleicera oleosa Merr) as an Intermediate Compound for Fragrance Synthesis
83
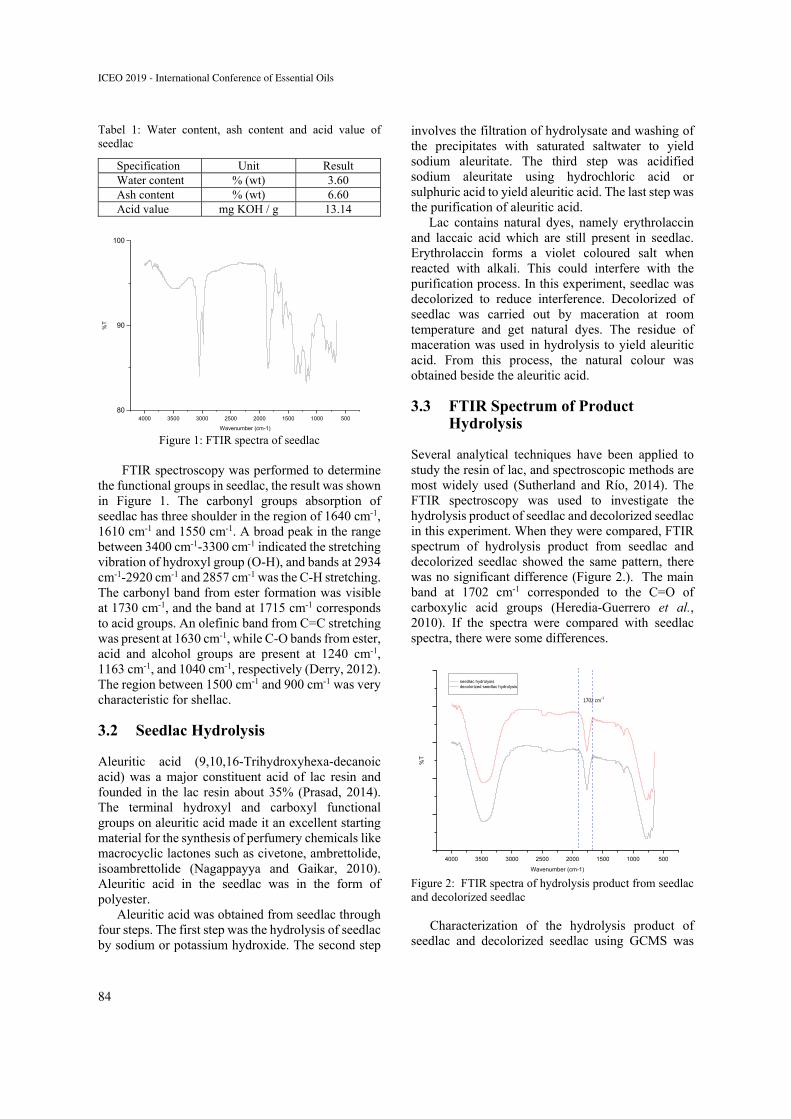
Tabel 1: Water content, ash content and acid value of seedlac
Specification Unit Result Water content % (wt) 3.60 Ash content % (wt) 6.60 Acid value mg KOH / g 13.14
4000 3500 3000 2500 2000 1500 1000 500
80
90
100
%T
Wavenumber (cm-1)
Figure 1: FTIR spectra of seedlac
FTIR spectroscopy was performed to determine the functional groups in seedlac, the result was shown in Figure 1. The carbonyl groups absorption of seedlac has three shoulder in the region of 1640 cm-1, 1610 cm-1 and 1550 cm-1. A broad peak in the range between 3400 cm-1-3300 cm-1 indicated the stretching vibration of hydroxyl group (O-H), and bands at 2934 cm-1-2920 cm-1 and 2857 cm-1 was the C-H stretching. The carbonyl band from ester formation was visible at 1730 cm-1, and the band at 1715 cm-1 corresponds to acid groups. An olefinic band from C=C stretching was present at 1630 cm-1, while C-O bands from ester, acid and alcohol groups are present at 1240 cm-1, 1163 cm-1, and 1040 cm-1, respectively (Derry, 2012). The region between 1500 cm-1 and 900 cm-1 was very characteristic for shellac.
3.2 Seedlac Hydrolysis
Aleuritic acid (9,10,16-Trihydroxyhexa-decanoic acid) was a major constituent acid of lac resin and founded in the lac resin about 35% (Prasad, 2014). The terminal hydroxyl and carboxyl functional groups on aleuritic acid made it an excellent starting material for the synthesis of perfumery chemicals like macrocyclic lactones such as civetone, ambrettolide, isoambrettolide (Nagappayya and Gaikar, 2010). Aleuritic acid in the seedlac was in the form of polyester.
Aleuritic acid was obtained from seedlac through four steps. The first step was the hydrolysis of seedlac by sodium or potassium hydroxide. The second step
involves the filtration of hydrolysate and washing of the precipitates with saturated saltwater to yield sodium aleuritate. The third step was acidified sodium aleuritate using hydrochloric acid or sulphuric acid to yield aleuritic acid. The last step was the purification of aleuritic acid.
Lac contains natural dyes, namely erythrolaccin and laccaic acid which are still present in seedlac. Erythrolaccin forms a violet coloured salt when reacted with alkali. This could interfere with the purification process. In this experiment, seedlac was decolorized to reduce interference. Decolorized of seedlac was carried out by maceration at room temperature and get natural dyes. The residue of maceration was used in hydrolysis to yield aleuritic acid. From this process, the natural colour was obtained beside the aleuritic acid.
3.3 FTIR Spectrum of Product Hydrolysis
Several analytical techniques have been applied to study the resin of lac, and spectroscopic methods are most widely used (Sutherland and Río, 2014). The FTIR spectroscopy was used to investigate the hydrolysis product of seedlac and decolorized seedlac in this experiment. When they were compared, FTIR spectrum of hydrolysis product from seedlac and decolorized seedlac showed the same pattern, there was no significant difference (Figure 2.). The main band at 1702 cm-1 corresponded to the C=O of carboxylic acid groups (Heredia-Guerrero et al., 2010). If the spectra were compared with seedlac spectra, there were some differences.
4000 3500 3000 2500 2000 1500 1000 500
1702 cm‐1
%T
Wavenumber (cm-1)
seedlac hydrolysis decolorized seedlac hydrolysis
Figure 2: FTIR spectra of hydrolysis product from seedlac and decolorized seedlac
Characterization of the hydrolysis product of
seedlac and decolorized seedlac using GCMS was
ICEO 2019 - International Conference of Essential Oils
84
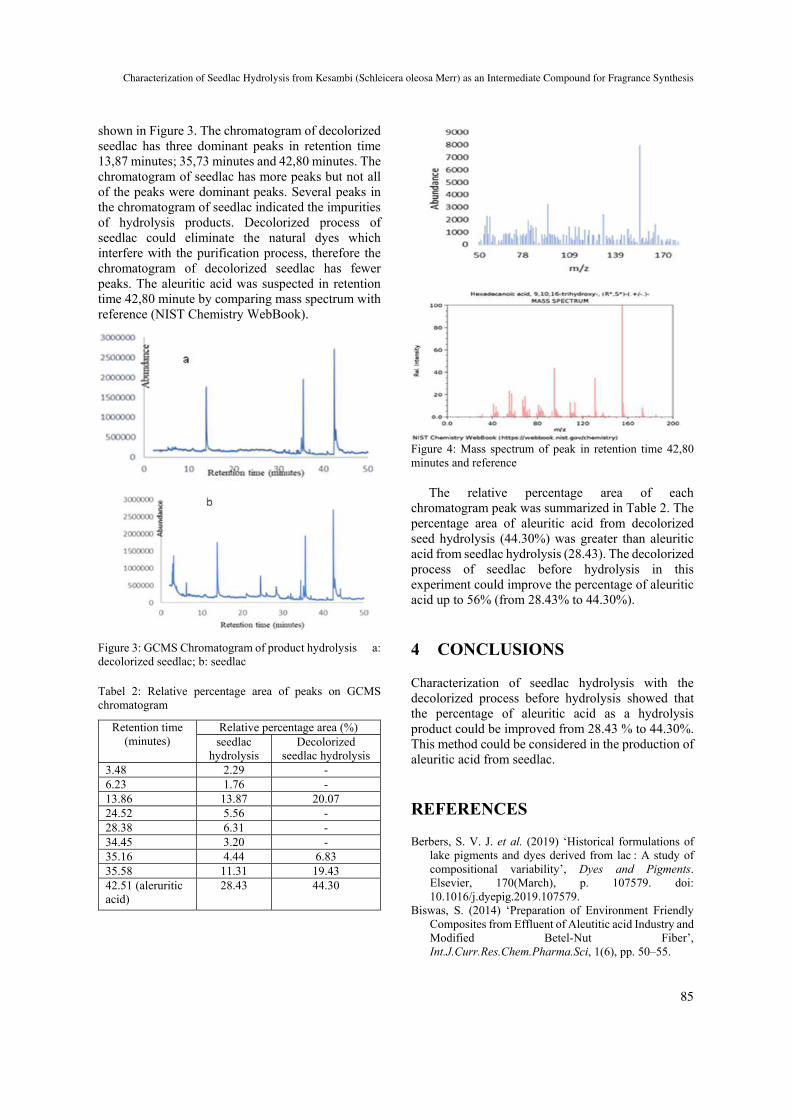
shown in Figure 3. The chromatogram of decolorized seedlac has three dominant peaks in retention time 13,87 minutes; 35,73 minutes and 42,80 minutes. The chromatogram of seedlac has more peaks but not all of the peaks were dominant peaks. Several peaks in the chromatogram of seedlac indicated the impurities of hydrolysis products. Decolorized process of seedlac could eliminate the natural dyes which interfere with the purification process, therefore the chromatogram of decolorized seedlac has fewer peaks. The aleuritic acid was suspected in retention time 42,80 minute by comparing mass spectrum with reference (NIST Chemistry WebBook).
Figure 3: GCMS Chromatogram of product hydrolysis a: decolorized seedlac; b: seedlac
Tabel 2: Relative percentage area of peaks on GCMS chromatogram
Retention time (minutes)
Relative percentage area (%) seedlac
hydrolysis Decolorized
seedlac hydrolysis 3.48 2.29 - 6.23 1.76 - 13.86 13.87 20.07 24.52 5.56 - 28.38 6.31 - 34.45 3.20 - 35.16 4.44 6.83 35.58 11.31 19.43 42.51 (aleruritic acid)
28.43 44.30
Figure 4: Mass spectrum of peak in retention time 42,80 minutes and reference
The relative percentage area of each
chromatogram peak was summarized in Table 2. The percentage area of aleuritic acid from decolorized seed hydrolysis (44.30%) was greater than aleuritic acid from seedlac hydrolysis (28.43). The decolorized process of seedlac before hydrolysis in this experiment could improve the percentage of aleuritic acid up to 56% (from 28.43% to 44.30%).
4 CONCLUSIONS
Characterization of seedlac hydrolysis with the decolorized process before hydrolysis showed that the percentage of aleuritic acid as a hydrolysis product could be improved from 28.43 % to 44.30%. This method could be considered in the production of aleuritic acid from seedlac.
REFERENCES
Berbers, S. V. J. et al. (2019) ‘Historical formulations of lake pigments and dyes derived from lac : A study of compositional variability’, Dyes and Pigments. Elsevier, 170(March), p. 107579. doi: 10.1016/j.dyepig.2019.107579.
Biswas, S. (2014) ‘Preparation of Environment Friendly Composites from Effluent of Aleutitic acid Industry and Modified Betel-Nut Fiber’, Int.J.Curr.Res.Chem.Pharma.Sci, 1(6), pp. 50–55.
Characterization of Seedlac Hydrolysis from Kesambi (Schleicera oleosa Merr) as an Intermediate Compound for Fragrance Synthesis
85
Derry, J. (2012) ‘Investigating shellac: documenting the process, defining the product. A study on the processing methods of shellac, and the analysis of selected physical and chemical characteristics’, The Institute of Archeology, Conservation and History, Faculty of Humanities, Master The.
Farag, Y. (2010) Characterization of Different Shellac Types and Development of Shellac-Coated Dosage Forms, Fakultät für Mathematik, Informatik und Naturwissenschaften.
Farag, Y. and Leopold, C. S. (2009) ‘Physicochemical Properties of Various Shellac Types’, Dissolution Technologies, (May), pp. 33–39.
Heredia-Guerrero, J. A. et al. (2010) ‘Aleuritic (9,10,16-trihydroxypalmitic) acid self-assembly on mica’, Physical Chemistry Chemical Physics, 12(35), pp. 10423–10428. doi: 10.1039/c0cp00163e.
Nagappayya, S. K. and Gaikar, V. G. (2010) ‘Extraction of Aleuritic Acid from Seedlac and Purification by Reactive Adsorption on Functionalized Polymers’, Ind.Eng.Chem.Res, 49, pp. 6547–6553.
Prasad, N. (2014) ‘Final Report of NAIP sub-project on A Value Chain on Lac and Lac based Products for Domestic and Export Markets’, . Indian Institute of Natural Resins and Gums, Namkum, Ranchi.
Ravi, S., Padmanabhan, D. and Mamdapur, V. R. (2001) ‘Macrocyclic musk compounds: Synthetic approaches to key intermediates for exaltolide, exaltone and dilactones’, Journal of the Indian Institute of Science, 81(3), pp. 299–312.
Shearer, G. L. (1989) ‘An Evaluation of Fourier Transform Infrared Spectroscopy for the Characterzation of Organic Compounds in Art and Archaeology’, (October), pp. 1–399.
Sutherland, K. and Río, J. C. (2014) ‘Characterisation and discrimination of various types of lac resin using gas chromatography mass spectrometry techniques with quaternary ammonium reagents’, Journal of Chromatography A. Elsevier B.V., 1338, pp. 149–163. doi: 10.1016/j.chroma.2014.02.063.
Taskirawati, I. et al. (2017) ‘Peluang investasi dan strategi pengembangan usaha budidaya kutu lak (Laccifer lacca Kerr): studi kasus di KPH probolinggo, perum perhutani unit II jawa timur’, Jurnal Entomologi Indonesia, 4(1), p. 42. doi: 10.5994/jei.4.1.42.
Yaqub, A. et al. (2014) ‘Isolation and its Purification of Laccaic Acid Dye from Stick Lac and study of its ( Colour Fastness ) Properties and Reflactance on Silk Fabric Dyed with Heavy Metal Mordants’, Technical Journal, University of Engineering and Technology Taxila, 19(I), pp. 6–12.
ICEO 2019 - International Conference of Essential Oils
86
Separation Process of Citronellal and Rhodinol from Citronella Oil using Vacuum Fractionations at Pilot Plant Scale
Risna Silvianti1, Warsito2, and Chandrawati Cahyani3 1Department of Chemistry, Faculty of Mathematics and Science, Brawijaya University 2Department of Chemical Engineering, Faculty of Engineering, Brawijaya University
2Institut Atsiri, Brawijaya University [email protected]
Keywords: Distillation Fractionation, Citronelal Oil, Citronellal, Limonene, Rhodinol, Temperatur, Vacuum pressure.
Abstract: The aim of this work was to separate major components from citronella oil using vacuum distillation fractionation method. Operating condition that used in this study is vacuum pressure 10-30 mmHg. This process depends on the pressure and temperature of the system, as well the physical and chemical characteristics of the components to be separated.Based on GC-MS analysis of Citronella Oil is known that citronellal, citronellol, and geraniol has yielded 7,42%; 11,25%; and 31,68%, respectively. Fractional distillation under reduced pressure can isolate major component like limonene,citronellal,citronellol and rhodinol with higher purity 55.56%; 25.57%; and 46.19%, respectively.
1 INTRODUCTION
Essential oils are secondary metabolites that contain a mixture of terpenes and other complex volatile compounds produced from living organism. Essential oils have widely used as raw material for medicine , cosmetics, perfume and flavor fragrance agent (Almeida et al., 2018). The potential components of essential oil which generally consist of oxygenated compounds is very important to determine quality of essential oil and widely used as starting materials for flavor and fragrance industry.
Potential of essential oils in Indonesia is very large, but to supply the demand of its downstream industry, Indonesia should to import essential oils in the form of pure oils which contain high purity potential components.This fact show that the separation of the potential compounds in essential oils is a step that needs to be done to improve the purity of potential components that are needed by many industries.
Separation technique of potential components of essential oils can be carried out through chemical or physical processes.Separation of the components of essential oils by chemical processes can be done by adding chemical reagents that are selective to the desired compound, while physical separation can be done based on the physical properties of each
compounds that can be done by fractionation distillation method. Fractionation distillation is a physical separation process that uses the volatility of different components in a mixture. The advantages of the fractionation distillation method can be used to separate components that have adjacent boiling points (Budiman, 2016).
Process of separation in fractionation distillation occurs due to contact and equilibrium between vapor and liquid in the fractionation coloumn (Ibrahim, 2014). According to Kister (1992) the main factors that influencing the effectiveness of the separation occuring in the fractionation process are design of fractionation coloumn and operating conditions. Therefore, optimization of the separation process is needed that can provide the most optimal operating conditions like temperature operation, so that contact between liquid and vapor takes longer to produce high purity compounds. The fractional distillation is one of unit operation that aims the separation of two or more substances using vacuum state by the volatility difference between them. This process depends on the pressure and temperature of the system, as well the physical and chemical characteristics of the components to be separated (Eden, 2018).
Citronella oil is the essential oil from citronella grasses (Cymbopogon winterianus) from Java Island, Indonesia. One part of Indonesia which is abundant
Silvianti, R., Warsito and Cahyani, C.Separation Process of Citronellal and Rhodinol from Citronella Oil using Vacuum Fractionations at Pilot Plant Scale.In Proceedings of the 2nd International Conference of Essential Oils (ICEO 2019), pages 87-91ISBN: 978-989-758-456-5Copyright © 2020 by SCITEPRESS – Science and Technology Publications, Lda. All rights reserved
87
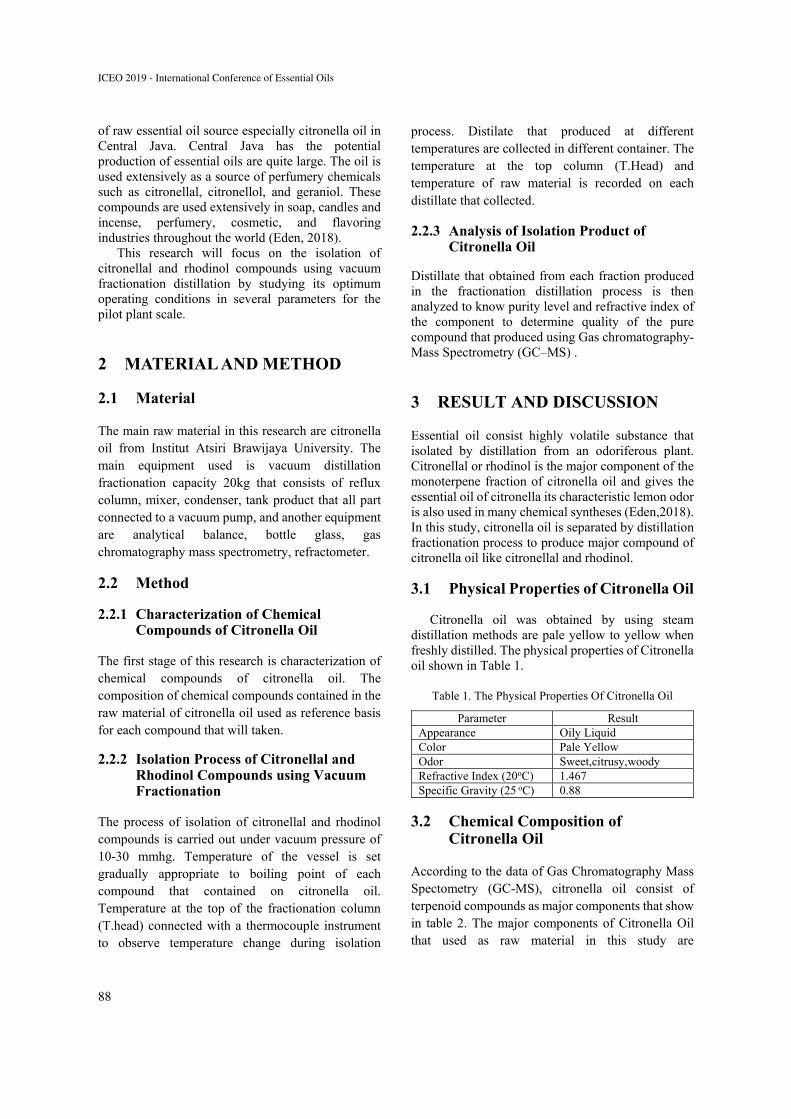
of raw essential oil source especially citronella oil in Central Java. Central Java has the potential production of essential oils are quite large. The oil is used extensively as a source of perfumery chemicals such as citronellal, citronellol, and geraniol. These compounds are used extensively in soap, candles and incense, perfumery, cosmetic, and flavoring industries throughout the world (Eden, 2018).
This research will focus on the isolation of citronellal and rhodinol compounds using vacuum fractionation distillation by studying its optimum operating conditions in several parameters for the pilot plant scale.
2 MATERIAL AND METHOD
2.1 Material
The main raw material in this research are citronella oil from Institut Atsiri Brawijaya University. The main equipment used is vacuum distillation fractionation capacity 20kg that consists of reflux column, mixer, condenser, tank product that all part connected to a vacuum pump, and another equipment are analytical balance, bottle glass, gas chromatography mass spectrometry, refractometer.
2.2 Method
2.2.1 Characterization of Chemical Compounds of Citronella Oil
The first stage of this research is characterization of chemical compounds of citronella oil. The composition of chemical compounds contained in the raw material of citronella oil used as reference basis for each compound that will taken.
2.2.2 Isolation Process of Citronellal and Rhodinol Compounds using Vacuum Fractionation
The process of isolation of citronellal and rhodinol compounds is carried out under vacuum pressure of 10-30 mmhg. Temperature of the vessel is set gradually appropriate to boiling point of each compound that contained on citronella oil. Temperature at the top of the fractionation column (T.head) connected with a thermocouple instrument to observe temperature change during isolation
process. Distilate that produced at different temperatures are collected in different container. The temperature at the top column (T.Head) and temperature of raw material is recorded on each distillate that collected.
2.2.3 Analysis of Isolation Product of Citronella Oil
Distillate that obtained from each fraction produced in the fractionation distillation process is then analyzed to know purity level and refractive index of the component to determine quality of the pure compound that produced using Gas chromatography-Mass Spectrometry (GC–MS) .
3 RESULT AND DISCUSSION
Essential oil consist highly volatile substance that isolated by distillation from an odoriferous plant. Citronellal or rhodinol is the major component of the monoterpene fraction of citronella oil and gives the essential oil of citronella its characteristic lemon odor is also used in many chemical syntheses (Eden,2018). In this study, citronella oil is separated by distillation fractionation process to produce major compound of citronella oil like citronellal and rhodinol.
3.1 Physical Properties of Citronella Oil
Citronella oil was obtained by using steam distillation methods are pale yellow to yellow when freshly distilled. The physical properties of Citronella oil shown in Table 1.
Table 1. The Physical Properties Of Citronella Oil
Parameter Result Appearance Oily Liquid Color Pale Yellow Odor Sweet,citrusy,woody Refractive Index (20oC) 1.467 Specific Gravity (25 oC) 0.88
3.2 Chemical Composition of Citronella Oil
According to the data of Gas Chromatography Mass Spectometry (GC-MS), citronella oil consist of terpenoid compounds as major components that show in table 2. The major components of Citronella Oil that used as raw material in this study are
ICEO 2019 - International Conference of Essential Oils
88
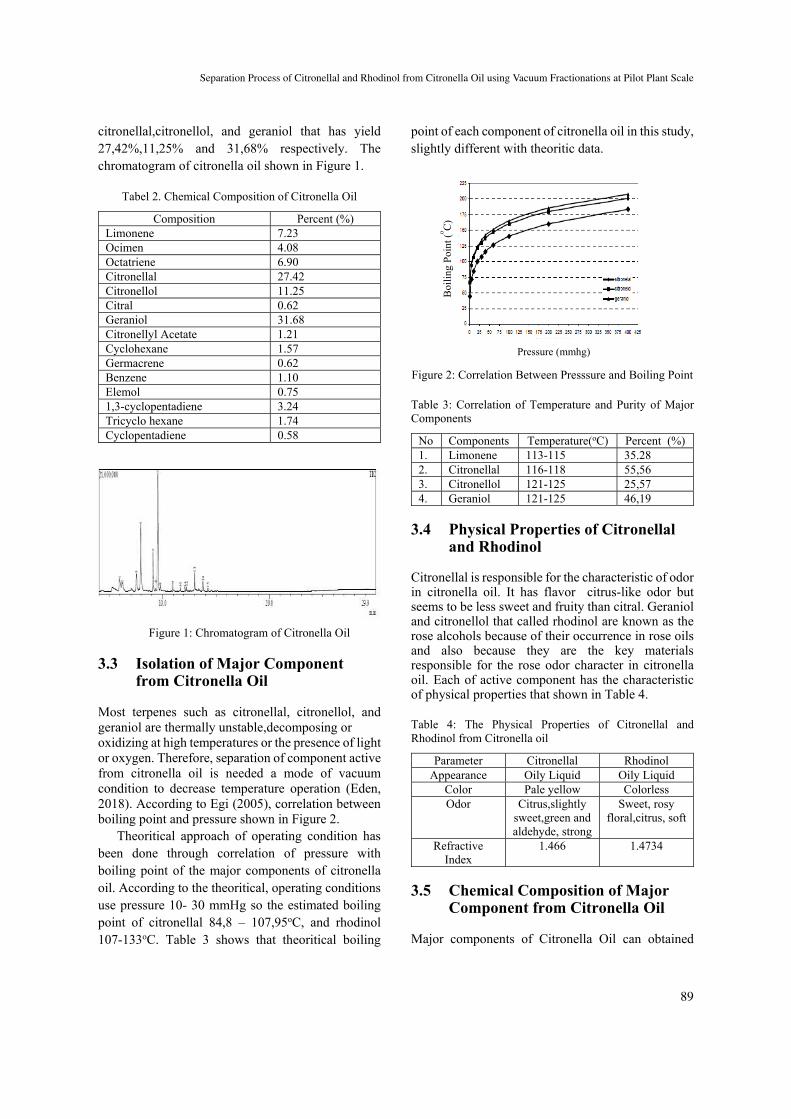
citronellal,citronellol, and geraniol that has yield 27,42%,11,25% and 31,68% respectively. The chromatogram of citronella oil shown in Figure 1.
Tabel 2. Chemical Composition of Citronella Oil
Composition Percent (%) Limonene 7.23 Ocimen 4.08 Octatriene 6.90 Citronellal 27.42 Citronellol 11.25 Citral 0.62 Geraniol 31.68 Citronellyl Acetate 1.21 Cyclohexane 1.57 Germacrene 0.62 Benzene 1.10 Elemol 0.75 1,3-cyclopentadiene 3.24 Tricyclo hexane 1.74 Cyclopentadiene 0.58
Figure 1: Chromatogram of Citronella Oil
3.3 Isolation of Major Component from Citronella Oil
Most terpenes such as citronellal, citronellol, and geraniol are thermally unstable,decomposing or oxidizing at high temperatures or the presence of light or oxygen. Therefore, separation of component active from citronella oil is needed a mode of vacuum condition to decrease temperature operation (Eden, 2018). According to Egi (2005), correlation between boiling point and pressure shown in Figure 2.
Theoritical approach of operating condition has been done through correlation of pressure with boiling point of the major components of citronella oil. According to the theoritical, operating conditions use pressure 10- 30 mmHg so the estimated boiling point of citronellal 84,8 – 107,95oC, and rhodinol 107-133oC. Table 3 shows that theoritical boiling
point of each component of citronella oil in this study, slightly different with theoritic data.
Figure 2: Correlation Between Presssure and Boiling Point
Table 3: Correlation of Temperature and Purity of Major Components
No Components Temperature(oC) Percent (%) 1. Limonene 113-115 35.28 2. Citronellal 116-118 55,56 3. Citronellol 121-125 25,57 4. Geraniol 121-125 46,19
3.4 Physical Properties of Citronellal and Rhodinol
Citronellal is responsible for the characteristic of odor in citronella oil. It has flavor citrus-like odor but seems to be less sweet and fruity than citral. Geraniol and citronellol that called rhodinol are known as the rose alcohols because of their occurrence in rose oils and also because they are the key materials responsible for the rose odor character in citronella oil. Each of active component has the characteristic of physical properties that shown in Table 4.
Table 4: The Physical Properties of Citronellal and Rhodinol from Citronella oil
Parameter Citronellal Rhodinol Appearance Oily Liquid Oily Liquid
Color Pale yellow Colorless Odor Citrus,slightly
sweet,green and aldehyde, strong
Sweet, rosy floral,citrus, soft
Refractive Index
1.466 1.4734
3.5 Chemical Composition of Major Component from Citronella Oil
Major components of Citronella Oil can obtained
Boi
ling
Poi
nt (
o C)
Pressure (mmhg)
Separation Process of Citronellal and Rhodinol from Citronella Oil using Vacuum Fractionations at Pilot Plant Scale
89
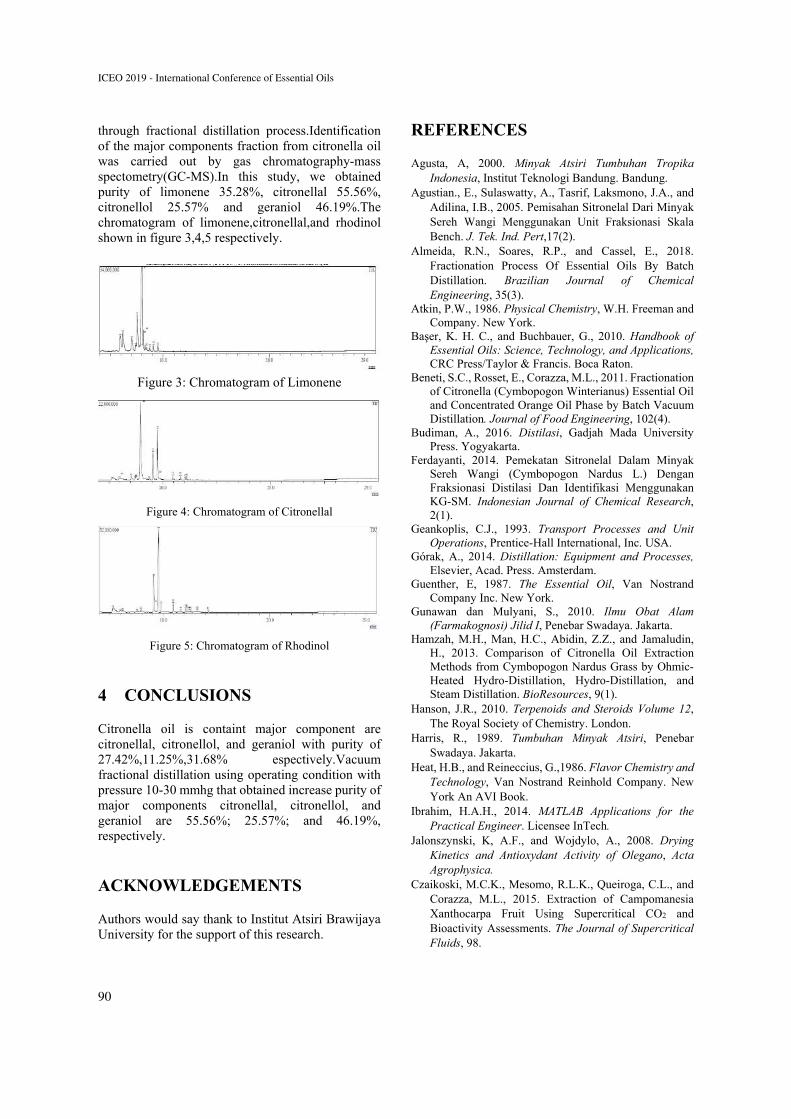
through fractional distillation process.Identification of the major components fraction from citronella oil was carried out by gas chromatography-mass spectometry(GC-MS).In this study, we obtained purity of limonene 35.28%, citronellal 55.56%, citronellol 25.57% and geraniol 46.19%.The chromatogram of limonene,citronellal,and rhodinol shown in figure 3,4,5 respectively.
Figure 3: Chromatogram of Limonene
Figure 4: Chromatogram of Citronellal
Figure 5: Chromatogram of Rhodinol
4 CONCLUSIONS
Citronella oil is containt major component are citronellal, citronellol, and geraniol with purity of 27.42%,11.25%,31.68% espectively.Vacuum fractional distillation using operating condition with pressure 10-30 mmhg that obtained increase purity of major components citronellal, citronellol, and geraniol are 55.56%; 25.57%; and 46.19%, respectively.
ACKNOWLEDGEMENTS
Authors would say thank to Institut Atsiri Brawijaya University for the support of this research.
REFERENCES
Agusta, A, 2000. Minyak Atsiri Tumbuhan Tropika Indonesia, Institut Teknologi Bandung. Bandung.
Agustian., E., Sulaswatty, A., Tasrif, Laksmono, J.A., and Adilina, I.B., 2005. Pemisahan Sitronelal Dari Minyak Sereh Wangi Menggunakan Unit Fraksionasi Skala Bench. J. Tek. Ind. Pert,17(2).
Almeida, R.N., Soares, R.P., and Cassel, E., 2018. Fractionation Process Of Essential Oils By Batch Distillation. Brazilian Journal of Chemical Engineering, 35(3).
Atkin, P.W., 1986. Physical Chemistry, W.H. Freeman and Company. New York.
Başer, K. H. C., and Buchbauer, G., 2010. Handbook of Essential Oils: Science, Technology, and Applications, CRC Press/Taylor & Francis. Boca Raton.
Beneti, S.C., Rosset, E., Corazza, M.L., 2011. Fractionation of Citronella (Cymbopogon Winterianus) Essential Oil and Concentrated Orange Oil Phase by Batch Vacuum Distillation. Journal of Food Engineering, 102(4).
Budiman, A., 2016. Distilasi, Gadjah Mada University Press. Yogyakarta.
Ferdayanti, 2014. Pemekatan Sitronelal Dalam Minyak Sereh Wangi (Cymbopogon Nardus L.) Dengan Fraksionasi Distilasi Dan Identifikasi Menggunakan KG-SM. Indonesian Journal of Chemical Research, 2(1).
Geankoplis, C.J., 1993. Transport Processes and Unit Operations, Prentice-Hall International, Inc. USA.
Górak, A., 2014. Distillation: Equipment and Processes, Elsevier, Acad. Press. Amsterdam.
Guenther, E, 1987. The Essential Oil, Van Nostrand Company Inc. New York.
Gunawan dan Mulyani, S., 2010. Ilmu Obat Alam (Farmakognosi) Jilid I, Penebar Swadaya. Jakarta.
Hamzah, M.H., Man, H.C., Abidin, Z.Z., and Jamaludin, H., 2013. Comparison of Citronella Oil Extraction Methods from Cymbopogon Nardus Grass by Ohmic-Heated Hydro-Distillation, Hydro-Distillation, and Steam Distillation. BioResources, 9(1).
Hanson, J.R., 2010. Terpenoids and Steroids Volume 12, The Royal Society of Chemistry. London.
Harris, R., 1989. Tumbuhan Minyak Atsiri, Penebar Swadaya. Jakarta.
Heat, H.B., and Reineccius, G.,1986. Flavor Chemistry and Technology, Van Nostrand Reinhold Company. New York An AVI Book.
Ibrahim, H.A.H., 2014. MATLAB Applications for the Practical Engineer. Licensee InTech.
Jalonszynski, K, A.F., and Wojdylo, A., 2008. Drying Kinetics and Antioxydant Activity of Olegano, Acta Agrophysica.
Czaikoski, M.C.K., Mesomo, R.L.K., Queiroga, C.L., and Corazza, M.L., 2015. Extraction of Campomanesia Xanthocarpa Fruit Using Supercritical CO2 and Bioactivity Assessments. The Journal of Supercritical Fluids, 98.
ICEO 2019 - International Conference of Essential Oils
90
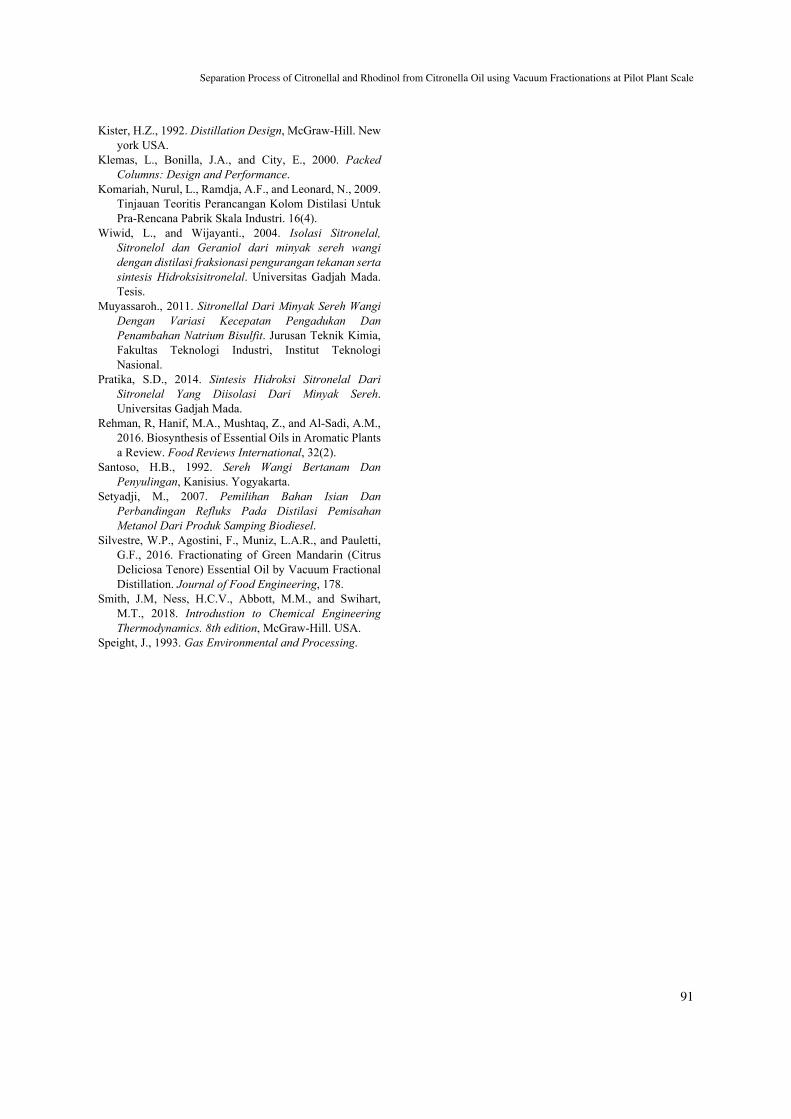
Kister, H.Z., 1992. Distillation Design, McGraw-Hill. New york USA.
Klemas, L., Bonilla, J.A., and City, E., 2000. Packed Columns: Design and Performance.
Komariah, Nurul, L., Ramdja, A.F., and Leonard, N., 2009. Tinjauan Teoritis Perancangan Kolom Distilasi Untuk Pra-Rencana Pabrik Skala Industri. 16(4).
Wiwid, L., and Wijayanti., 2004. Isolasi Sitronelal, Sitronelol dan Geraniol dari minyak sereh wangi dengan distilasi fraksionasi pengurangan tekanan serta sintesis Hidroksisitronelal. Universitas Gadjah Mada. Tesis.
Muyassaroh., 2011. Sitronellal Dari Minyak Sereh Wangi Dengan Variasi Kecepatan Pengadukan Dan Penambahan Natrium Bisulfit. Jurusan Teknik Kimia, Fakultas Teknologi Industri, Institut Teknologi Nasional.
Pratika, S.D., 2014. Sintesis Hidroksi Sitronelal Dari Sitronelal Yang Diisolasi Dari Minyak Sereh. Universitas Gadjah Mada.
Rehman, R, Hanif, M.A., Mushtaq, Z., and Al-Sadi, A.M., 2016. Biosynthesis of Essential Oils in Aromatic Plants a Review. Food Reviews International, 32(2).
Santoso, H.B., 1992. Sereh Wangi Bertanam Dan Penyulingan, Kanisius. Yogyakarta.
Setyadji, M., 2007. Pemilihan Bahan Isian Dan Perbandingan Refluks Pada Distilasi Pemisahan Metanol Dari Produk Samping Biodiesel.
Silvestre, W.P., Agostini, F., Muniz, L.A.R., and Pauletti, G.F., 2016. Fractionating of Green Mandarin (Citrus Deliciosa Tenore) Essential Oil by Vacuum Fractional Distillation. Journal of Food Engineering, 178.
Smith, J.M, Ness, H.C.V., Abbott, M.M., and Swihart, M.T., 2018. Introdustion to Chemical Engineering Thermodynamics. 8th edition, McGraw-Hill. USA.
Speight, J., 1993. Gas Environmental and Processing.
Separation Process of Citronellal and Rhodinol from Citronella Oil using Vacuum Fractionations at Pilot Plant Scale
91
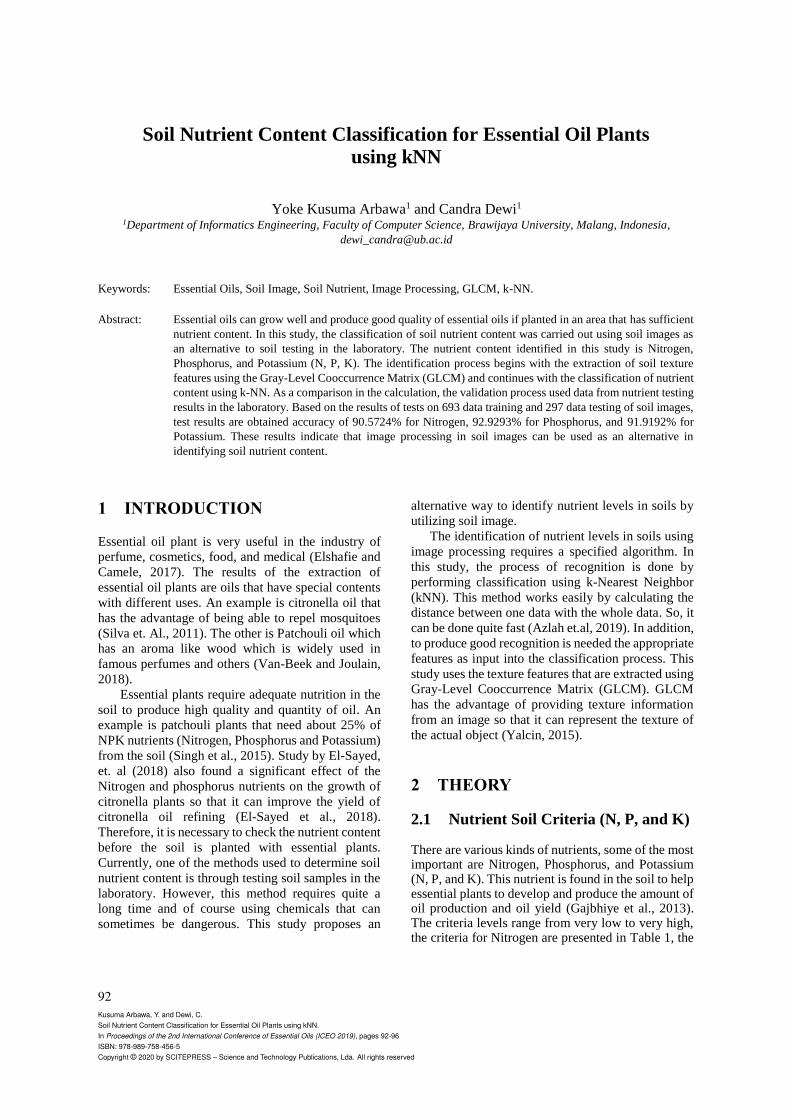
Soil Nutrient Content Classification for Essential Oil Plants
using kNN
Yoke Kusuma Arbawa1 and Candra Dewi1 1Department of Informatics Engineering, Faculty of Computer Science, Brawijaya University, Malang, Indonesia,
Keywords: Essential Oils, Soil Image, Soil Nutrient, Image Processing, GLCM, k-NN.
Abstract: Essential oils can grow well and produce good quality of essential oils if planted in an area that has sufficient
nutrient content. In this study, the classification of soil nutrient content was carried out using soil images as
an alternative to soil testing in the laboratory. The nutrient content identified in this study is Nitrogen,
Phosphorus, and Potassium (N, P, K). The identification process begins with the extraction of soil texture
features using the Gray-Level Cooccurrence Matrix (GLCM) and continues with the classification of nutrient
content using k-NN. As a comparison in the calculation, the validation process used data from nutrient testing
results in the laboratory. Based on the results of tests on 693 data training and 297 data testing of soil images,
test results are obtained accuracy of 90.5724% for Nitrogen, 92.9293% for Phosphorus, and 91.9192% for
Potassium. These results indicate that image processing in soil images can be used as an alternative in
identifying soil nutrient content.
1 INTRODUCTION
Essential oil plant is very useful in the industry of
perfume, cosmetics, food, and medical (Elshafie and
Camele, 2017). The results of the extraction of
essential oil plants are oils that have special contents
with different uses. An example is citronella oil that
has the advantage of being able to repel mosquitoes
(Silva et. Al., 2011). The other is Patchouli oil which
has an aroma like wood which is widely used in
famous perfumes and others (Van-Beek and Joulain,
2018).
Essential plants require adequate nutrition in the
soil to produce high quality and quantity of oil. An
example is patchouli plants that need about 25% of
NPK nutrients (Nitrogen, Phosphorus and Potassium)
from the soil (Singh et al., 2015). Study by El-Sayed,
et. al (2018) also found a significant effect of the
Nitrogen and phosphorus nutrients on the growth of
citronella plants so that it can improve the yield of
citronella oil refining (El-Sayed et al., 2018).
Therefore, it is necessary to check the nutrient content
before the soil is planted with essential plants.
Currently, one of the methods used to determine soil
nutrient content is through testing soil samples in the
laboratory. However, this method requires quite a
long time and of course using chemicals that can
sometimes be dangerous. This study proposes an
alternative way to identify nutrient levels in soils by
utilizing soil image.
The identification of nutrient levels in soils using
image processing requires a specified algorithm. In
this study, the process of recognition is done by
performing classification using k-Nearest Neighbor
(kNN). This method works easily by calculating the
distance between one data with the whole data. So, it
can be done quite fast (Azlah et.al, 2019). In addition,
to produce good recognition is needed the appropriate
features as input into the classification process. This
study uses the texture features that are extracted using
Gray-Level Cooccurrence Matrix (GLCM). GLCM
has the advantage of providing texture information
from an image so that it can represent the texture of
the actual object (Yalcin, 2015).
2 THEORY
2.1 Nutrient Soil Criteria (N, P, and K)
There are various kinds of nutrients, some of the most important are Nitrogen, Phosphorus, and Potassium (N, P, and K). This nutrient is found in the soil to help essential plants to develop and produce the amount of oil production and oil yield (Gajbhiye et al., 2013). The criteria levels range from very low to very high, the criteria for Nitrogen are presented in Table 1, the
92Kusuma Arbawa, Y. and Dewi, C.Soil Nutrient Content Classification for Essential Oil Plants using kNN.In Proceedings of the 2nd International Conference of Essential Oils (ICEO 2019), pages 92-96ISBN: 978-989-758-456-5Copyright © 2020 by SCITEPRESS – Science and Technology Publications, Lda. All rights reserved
criteria for phosphorus are presented in Table 2 and the criteria for Potassium are presented in Table 3.
Table 1: Criteria for Nitrogen
N.Total (%) Criteria
<0.1 Very Low
0.1 - 0.2 Low
0.21 - 0.5 Moderate
0.51 - 0.75 High
>0.75 Very High
Table 2: Criteria for Phosphorus
P.Bray1 (%) Criteria
<10 Very Low
10 - 15 Low
16 - 25 Moderate
26 - 35 High
>35 Very High
Table 3: Criteria for Potassium
K NH4OAc1N pH 7 (%) Criteria
<0.1 Very Low
0.1 - 0.29 Low
0.3 - 0.59 Moderate
0.6 - 1.0 High
>1.0 Very High
2.2 Gray-Level Co-occurrence Matrix (GLCM)
Image processing is a process to get information in an image so that it can be processed to become valuable information. Information that can be used in imagery such as color, texture, and shapes taken from the color values in the image. Implementation of image processing in the classification of nutrients in the soil required information from the soil image. In this study, we use information in the form of textures from soil images. This soil image texture feature represents soil texture which has different soil nutrient criteria. The texture feature that we use is the Gray Level Co-occurrence Matrix.
GLCM is an extraction that has often been used by researchers to obtain texture features from images. GLCM is a matrix n x n that contains the opportunity value of meeting pairs of pixel values between neighbors (Kekre et al., 2010). Determining the probability of meeting pairs of neighboring pixel
values is determined by the distance value (d = 0,1,2,3,4) and the angle of neighbor orientation (θ = 0o, 45o, 90o, and 135o). In this GLCM feature extraction, the color space used is grayscale with a range of pixel values from 0 to 255 (Asery, Sunkaria, Sharma, & Kumar, 2016). The GLCM matrix is then used to calculate the value of the feature to be used. This research uses Contrast, Dissimilarity, Homogeneity, Energy, Correlation and Angular Second Moment (ASM) of GLCM features (Deenadayalan et al., 2019).
2.3 K-Nearest Neighbor (KNN)
Image processing results cannot be directly used for classification. Classification requires a computational algorithm for computers to learn what will be classified. There are several algorithms that can be used as a classification algorithm such as neural networks, kNN, SVM and others. One algorithm that has simple computation is k-Nearest Neighbor (kNN).
kNN is an unsupervised learning classification method wherein directly calculates the value of the distance between the tested data and the training data (Alalousi et al., 2016). Then the tested data are classified according to the data objects that appear the most with the smallest distance value a number of k = 3, 5, 7, 9 ... n values. The steps of the KNN algorithm are as follows (Guo et al., 2006): 1. Calculate the value of the distance between the
tested data and the training data. 2. Sort the smallest distance value to the largest
distance value. 3. Determine the value of k and retrieve data from
a number of values k value of the top distance 4. Calculate the class frequency from the data
taken in step 3. 5. Classification is taken from the class that has the
most frequency from step 4.
3 METHOD
3.1 Data Acquisition
Data was taken from several different locations,
namely Dilem Wilis-Trenggalek, Tulungagung,
Kesamben-Blitar, Ngijo-Malang, UB Forest-Malang
and Institut Atsiri-Malang. Soil samples taken are
land planted with essential oil plants. The sample of
soil taken is soil from 20-30 cm depth from surface.
Soil images are taken using a DSLR camera on a
ministudio that has a stable light. Some soil images
samples are presented in Figure 1.
Soil Nutrient Content Classification for Essential Oil Plants using kNN
93
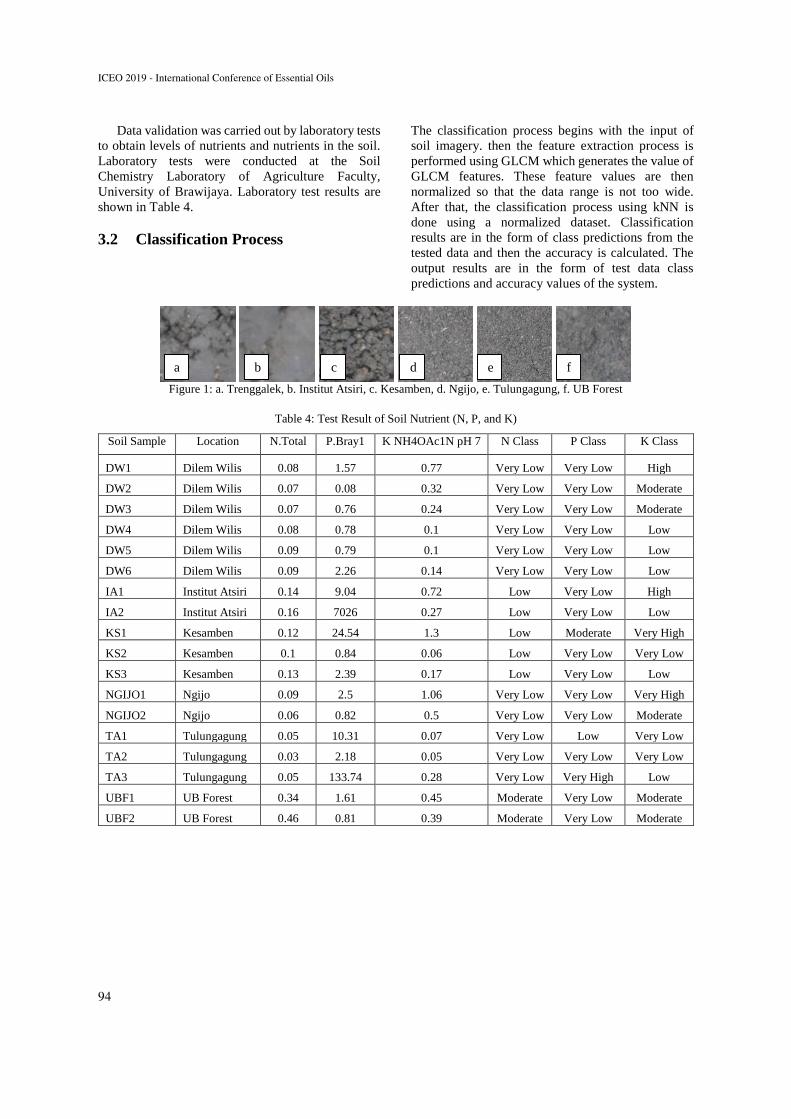
Data validation was carried out by laboratory tests
to obtain levels of nutrients and nutrients in the soil.
Laboratory tests were conducted at the Soil
Chemistry Laboratory of Agriculture Faculty,
University of Brawijaya. Laboratory test results are
shown in Table 4.
3.2 Classification Process
The classification process begins with the input of
soil imagery. then the feature extraction process is
performed using GLCM which generates the value of
GLCM features. These feature values are then
normalized so that the data range is not too wide.
After that, the classification process using kNN is
done using a normalized dataset. Classification
results are in the form of class predictions from the
tested data and then the accuracy is calculated. The
output results are in the form of test data class
predictions and accuracy values of the system.
Figure 1: a. Trenggalek, b. Institut Atsiri, c. Kesamben, d. Ngijo, e. Tulungagung, f. UB Forest
Table 4: Test Result of Soil Nutrient (N, P, and K)
Soil Sample Location N.Total P.Bray1 K NH4OAc1N pH 7 N Class P Class K Class
DW1 Dilem Wilis 0.08 1.57 0.77 Very Low Very Low High
DW2 Dilem Wilis 0.07 0.08 0.32 Very Low Very Low Moderate
DW3 Dilem Wilis 0.07 0.76 0.24 Very Low Very Low Moderate
DW4 Dilem Wilis 0.08 0.78 0.1 Very Low Very Low Low
DW5 Dilem Wilis 0.09 0.79 0.1 Very Low Very Low Low
DW6 Dilem Wilis 0.09 2.26 0.14 Very Low Very Low Low
IA1 Institut Atsiri 0.14 9.04 0.72 Low Very Low High
IA2 Institut Atsiri 0.16 7026 0.27 Low Very Low Low
KS1 Kesamben 0.12 24.54 1.3 Low Moderate Very High
KS2 Kesamben 0.1 0.84 0.06 Low Very Low Very Low
KS3 Kesamben 0.13 2.39 0.17 Low Very Low Low
NGIJO1 Ngijo 0.09 2.5 1.06 Very Low Very Low Very High
NGIJO2 Ngijo 0.06 0.82 0.5 Very Low Very Low Moderate
TA1 Tulungagung 0.05 10.31 0.07 Very Low Low Very Low
TA2 Tulungagung 0.03 2.18 0.05 Very Low Very Low Very Low
TA3 Tulungagung 0.05 133.74 0.28 Very Low Very High Low
UBF1 UB Forest 0.34 1.61 0.45 Moderate Very Low Moderate
UBF2 UB Forest 0.46 0.81 0.39 Moderate Very Low Moderate
a b c d e f
ICEO 2019 - International Conference of Essential Oils
94
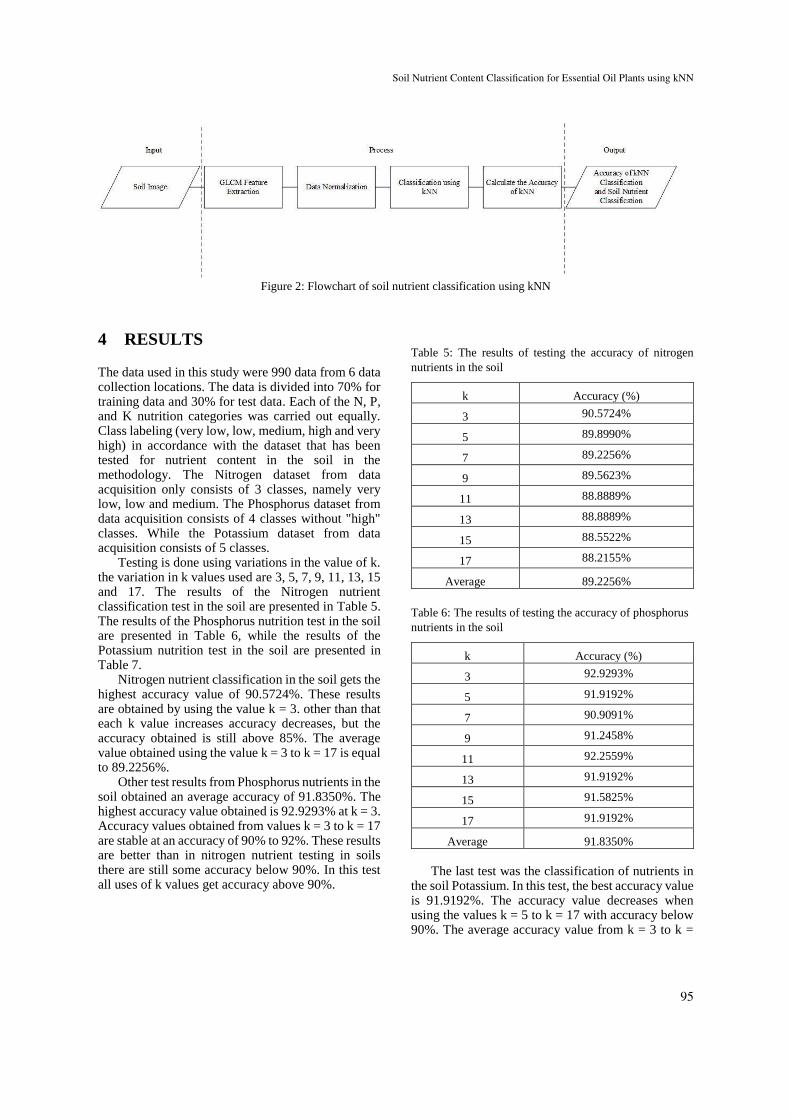
Figure 2: Flowchart of soil nutrient classification using kNN
4 RESULTS
The data used in this study were 990 data from 6 data collection locations. The data is divided into 70% for training data and 30% for test data. Each of the N, P, and K nutrition categories was carried out equally. Class labeling (very low, low, medium, high and very high) in accordance with the dataset that has been tested for nutrient content in the soil in the methodology. The Nitrogen dataset from data acquisition only consists of 3 classes, namely very low, low and medium. The Phosphorus dataset from data acquisition consists of 4 classes without "high" classes. While the Potassium dataset from data acquisition consists of 5 classes.
Testing is done using variations in the value of k. the variation in k values used are 3, 5, 7, 9, 11, 13, 15 and 17. The results of the Nitrogen nutrient classification test in the soil are presented in Table 5. The results of the Phosphorus nutrition test in the soil are presented in Table 6, while the results of the Potassium nutrition test in the soil are presented in Table 7.
Nitrogen nutrient classification in the soil gets the highest accuracy value of 90.5724%. These results are obtained by using the value k = 3. other than that each k value increases accuracy decreases, but the accuracy obtained is still above 85%. The average value obtained using the value k = 3 to k = 17 is equal to 89.2256%.
Other test results from Phosphorus nutrients in the soil obtained an average accuracy of 91.8350%. The highest accuracy value obtained is 92.9293% at k = 3. Accuracy values obtained from values k = 3 to k = 17 are stable at an accuracy of 90% to 92%. These results are better than in nitrogen nutrient testing in soils there are still some accuracy below 90%. In this test all uses of k values get accuracy above 90%.
Table 5: The results of testing the accuracy of nitrogen
nutrients in the soil
k Accuracy (%)
3 90.5724%
5 89.8990%
7 89.2256%
9 89.5623%
11 88.8889%
13 88.8889%
15 88.5522%
17 88.2155%
Average 89.2256%
Table 6: The results of testing the accuracy of phosphorus
nutrients in the soil
k Accuracy (%)
3 92.9293%
5 91.9192%
7 90.9091%
9 91.2458%
11 92.2559%
13 91.9192%
15 91.5825%
17 91.9192%
Average 91.8350%
The last test was the classification of nutrients in
the soil Potassium. In this test, the best accuracy value is 91.9192%. The accuracy value decreases when using the values k = 5 to k = 17 with accuracy below 90%. The average accuracy value from k = 3 to k =
Soil Nutrient Content Classification for Essential Oil Plants using kNN
95
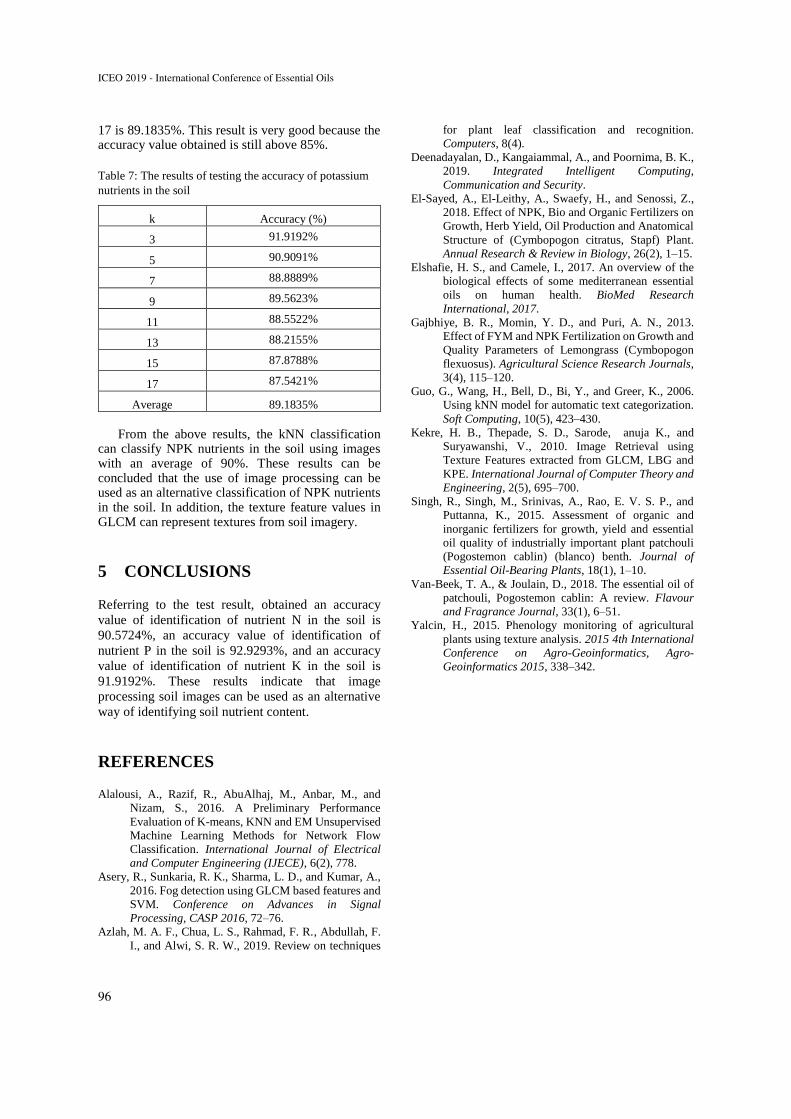
17 is 89.1835%. This result is very good because the accuracy value obtained is still above 85%.
Table 7: The results of testing the accuracy of potassium
nutrients in the soil
k Accuracy (%)
3 91.9192%
5 90.9091%
7 88.8889%
9 89.5623%
11 88.5522%
13 88.2155%
15 87.8788%
17 87.5421%
Average 89.1835%
From the above results, the kNN classification
can classify NPK nutrients in the soil using images with an average of 90%. These results can be concluded that the use of image processing can be used as an alternative classification of NPK nutrients in the soil. In addition, the texture feature values in GLCM can represent textures from soil imagery.
5 CONCLUSIONS
Referring to the test result, obtained an accuracy
value of identification of nutrient N in the soil is
90.5724%, an accuracy value of identification of
nutrient P in the soil is 92.9293%, and an accuracy
value of identification of nutrient K in the soil is
91.9192%. These results indicate that image
processing soil images can be used as an alternative
way of identifying soil nutrient content.
REFERENCES
Alalousi, A., Razif, R., AbuAlhaj, M., Anbar, M., and
Nizam, S., 2016. A Preliminary Performance
Evaluation of K-means, KNN and EM Unsupervised
Machine Learning Methods for Network Flow
Classification. International Journal of Electrical
and Computer Engineering (IJECE), 6(2), 778.
Asery, R., Sunkaria, R. K., Sharma, L. D., and Kumar, A.,
2016. Fog detection using GLCM based features and
SVM. Conference on Advances in Signal
Processing, CASP 2016, 72–76.
Azlah, M. A. F., Chua, L. S., Rahmad, F. R., Abdullah, F.
I., and Alwi, S. R. W., 2019. Review on techniques
for plant leaf classification and recognition.
Computers, 8(4).
Deenadayalan, D., Kangaiammal, A., and Poornima, B. K.,
2019. Integrated Intelligent Computing,
Communication and Security.
El-Sayed, A., El-Leithy, A., Swaefy, H., and Senossi, Z.,
2018. Effect of NPK, Bio and Organic Fertilizers on
Growth, Herb Yield, Oil Production and Anatomical
Structure of (Cymbopogon citratus, Stapf) Plant.
Annual Research & Review in Biology, 26(2), 1–15.
Elshafie, H. S., and Camele, I., 2017. An overview of the
biological effects of some mediterranean essential
oils on human health. BioMed Research
International, 2017.
Gajbhiye, B. R., Momin, Y. D., and Puri, A. N., 2013.
Effect of FYM and NPK Fertilization on Growth and
Quality Parameters of Lemongrass (Cymbopogon
flexuosus). Agricultural Science Research Journals,
3(4), 115–120.
Guo, G., Wang, H., Bell, D., Bi, Y., and Greer, K., 2006.
Using kNN model for automatic text categorization.
Soft Computing, 10(5), 423–430.
Kekre, H. B., Thepade, S. D., Sarode, anuja K., and
Suryawanshi, V., 2010. Image Retrieval using
Texture Features extracted from GLCM, LBG and
KPE. International Journal of Computer Theory and
Engineering, 2(5), 695–700.
Singh, R., Singh, M., Srinivas, A., Rao, E. V. S. P., and
Puttanna, K., 2015. Assessment of organic and
inorganic fertilizers for growth, yield and essential
oil quality of industrially important plant patchouli
(Pogostemon cablin) (blanco) benth. Journal of
Essential Oil-Bearing Plants, 18(1), 1–10.
Van-Beek, T. A., & Joulain, D., 2018. The essential oil of
patchouli, Pogostemon cablin: A review. Flavour
and Fragrance Journal, 33(1), 6–51.
Yalcin, H., 2015. Phenology monitoring of agricultural
plants using texture analysis. 2015 4th International
Conference on Agro-Geoinformatics, Agro-
Geoinformatics 2015, 338–342.
ICEO 2019 - International Conference of Essential Oils
96
Eugenol Production from Clove Oil in Pilot Plant Scale for Small and Medium Enterprises (SME)
Ali Nurdin1 1Pusat Teknologi Sumberdaya Energi dan Industri Kimia, Badan Pengkajian dan Penerapan Teknologi, Puspiptek Serpong,
Indonesia [email protected]
Keywords: Eugenol, Saponification, Distillation, Pilot Plant Scale
Abstract: Clove oil was the largest essential oil commodity in Indonesia and production at Small and Medium Enterprises (SME) was still below the standard quality due to low eugenol levels (70-80%). The eugenol level can be increased by isolation which generally can be carried out by saponification and neutralization methods. This method was the most widely used, inexpensive, and easy to scale-up from the laboratory scale to the pilot plant scale. In this research, the production of eugenol from clove oil has been carried out in a pilot plant scale with stages of saponification reaction using sodium hydroxide and neutralization using sulfuric acid followed by vacuum distillation. All stages of this process produce eugenol with a yield of 50.25%, and an increase in eugenol levels from 75% to 98%. The eugenol production technology that has been carried out was expected to provide a solution for the small clove oil industry to improve its quality.
1 INTRODUCTION
Indonesia is one of the major Asian producers of clove besides India, Malaysia and Sri Lanka (Kamatou, et al., 2012). Clove oil production in Indonesia reached 2500 MT – 3000 MT (Dewan Atsiri Indonesia, 2017). Most of the clove oil is produced in some small industries (Industri Kecil dan Menengah/IKM). There are several types of clove oil, namely clove bud oil, clove stem oil, and clove leaf oil (Anonim, 2013), but the most is clove leaf oil.
Clove oil consists of a mixture of a different compounds, with the main compound being eugenol, eugenyl acetate, and caryophyllene. The quality of clove oil is determined by eugenol. Eugenol is a phenolic compound, which is weakly acidic, slightly soluble in water and soluble in organic solvents (Kamatou, et al., 2012). Eugenol has many roles both in flavor, fragrance, and pharmacology. Standar Nasional Indonesia (SNI) requires minimum eugenol content in clove oil is 78% (v/v) (Badan Standardisasi Nasional, 2006). Clove leaf oil from the distillation of farmers (small industries) generally has not been able to fulfill this requirement, and this is still become the problem for small clove oil industries (Widayat and Hardiyanto, 2016). The eugenol content in clove leaf oil is influenced by various factors such as soil type,
distillation time, type of plant, and equipment of distillation. Therefore further processes are needed to improve eugenol content (Sastrohamidjojo and Fariyatun, 2016)
There are some methods can be used on the isolation of eugenol in order to increase eugenol contents. The most common method for eugenol isolation is saponification-distillation. Several methods have been modified to get more efficient as compared to the traditional method, like microwave-assisted extraction (Kapadiya, et al., 2018), supercritical carbon dioxide extraction (Cassiana et al., 2019), ultra-sound assisted extraction (Khalil et al., 2017), and polymeric membrane technology (Kusworo, 2018)
The eugenol isolation method that can be applied to small industries (IKM) by considering the availability of equipment, a simple production method and energy-efficient is the saponification-distillation method. In this research, eugenol isolation from clove leaf oil using saponification-distillation method was studied in the pilot plant scale. Clove leaf oil was saponified with sodium hydroxide and neutralized with sulfuric acid followed by separation using distillation. The result obtained from this research would be beneficial for the IKM applicability to give simple method on eugenol production.
Nurdin, A.Eugenol Production from Clove Oil in Pilot Plant Scale for Small and Medium Enterprises (SME).In Proceedings of the 2nd International Conference of Essential Oils (ICEO 2019), pages 97-101ISBN: 978-989-758-456-5Copyright © 2020 by SCITEPRESS – Science and Technology Publications, Lda. All rights reserved
97
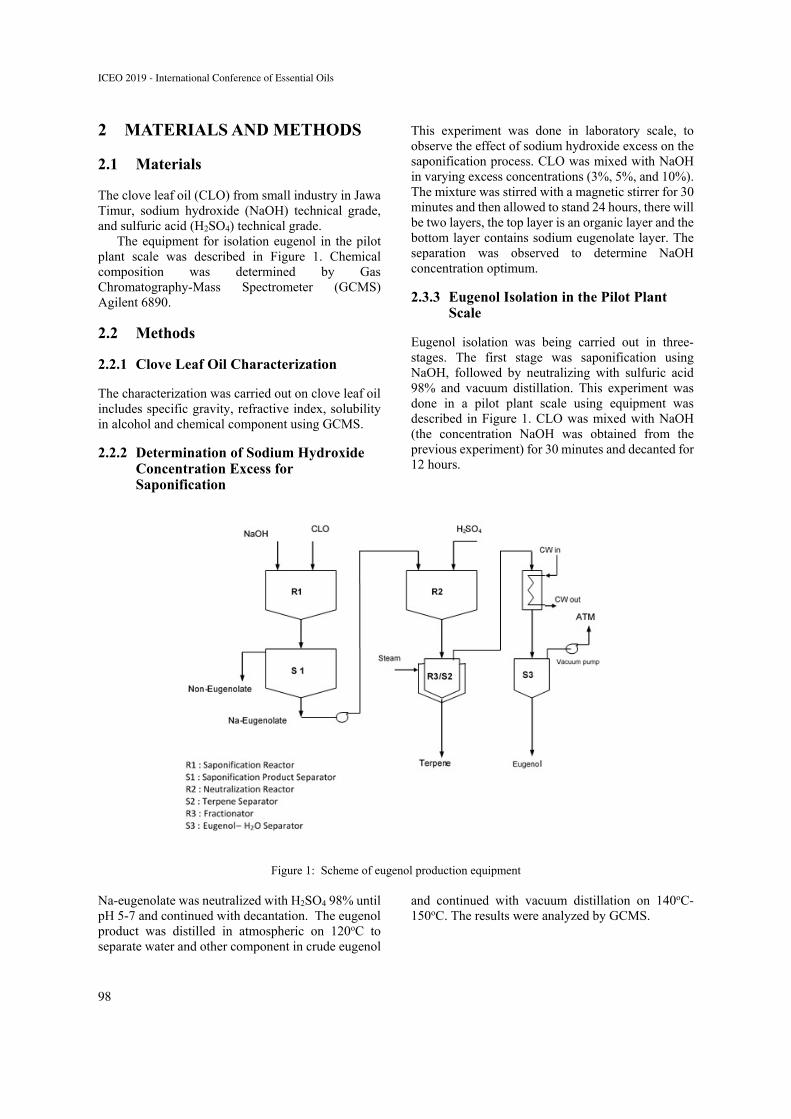
2 MATERIALS AND METHODS
2.1 Materials
The clove leaf oil (CLO) from small industry in Jawa Timur, sodium hydroxide (NaOH) technical grade, and sulfuric acid (H2SO4) technical grade.
The equipment for isolation eugenol in the pilot plant scale was described in Figure 1. Chemical composition was determined by Gas Chromatography-Mass Spectrometer (GCMS) Agilent 6890.
2.2 Methods
2.2.1 Clove Leaf Oil Characterization
The characterization was carried out on clove leaf oil includes specific gravity, refractive index, solubility in alcohol and chemical component using GCMS.
2.2.2 Determination of Sodium Hydroxide Concentration Excess for Saponification
This experiment was done in laboratory scale, to observe the effect of sodium hydroxide excess on the saponification process. CLO was mixed with NaOH in varying excess concentrations (3%, 5%, and 10%). The mixture was stirred with a magnetic stirrer for 30 minutes and then allowed to stand 24 hours, there will be two layers, the top layer is an organic layer and the bottom layer contains sodium eugenolate layer. The separation was observed to determine NaOH concentration optimum.
2.3.3 Eugenol Isolation in the Pilot Plant Scale
Eugenol isolation was being carried out in three-stages. The first stage was saponification using NaOH, followed by neutralizing with sulfuric acid 98% and vacuum distillation. This experiment was done in a pilot plant scale using equipment was described in Figure 1. CLO was mixed with NaOH (the concentration NaOH was obtained from the previous experiment) for 30 minutes and decanted for 12 hours.
Figure 1: Scheme of eugenol production equipment Na-eugenolate was neutralized with H2SO4 98% until pH 5-7 and continued with decantation. The eugenol product was distilled in atmospheric on 120oC to separate water and other component in crude eugenol
and continued with vacuum distillation on 140oC-150oC. The results were analyzed by GCMS.
ICEO 2019 - International Conference of Essential Oils
98
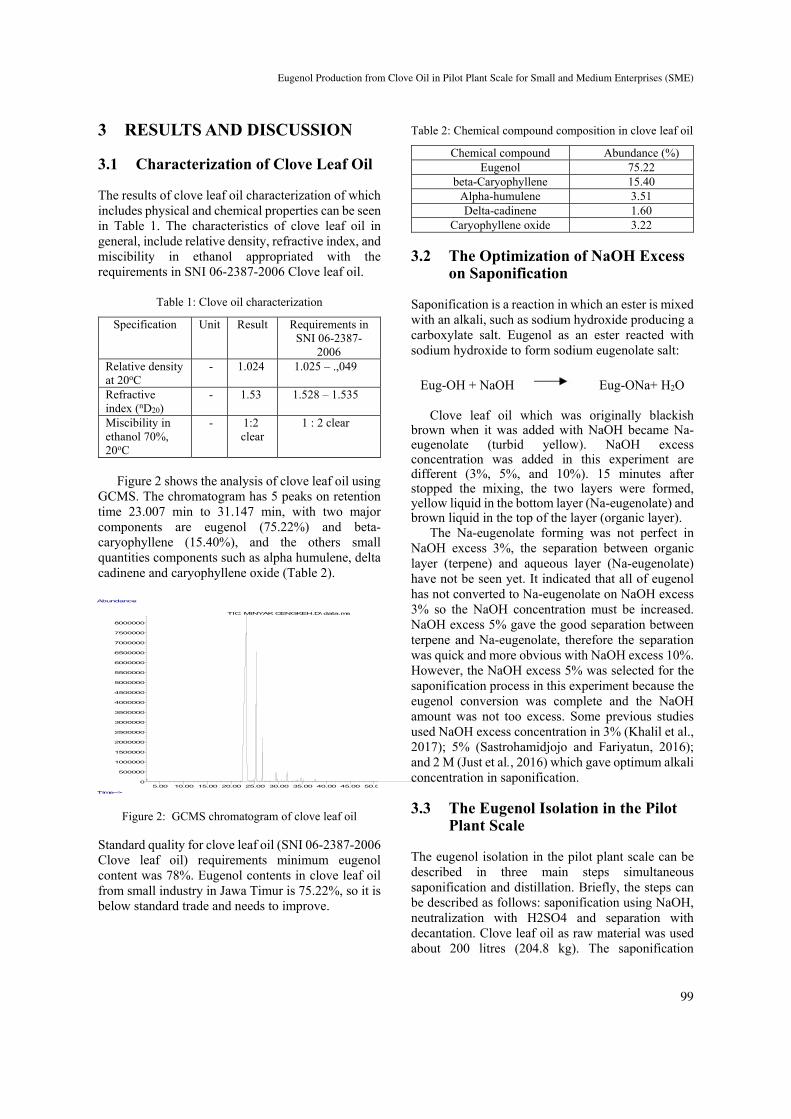
3 RESULTS AND DISCUSSION
3.1 Characterization of Clove Leaf Oil
The results of clove leaf oil characterization of which includes physical and chemical properties can be seen in Table 1. The characteristics of clove leaf oil in general, include relative density, refractive index, and miscibility in ethanol appropriated with the requirements in SNI 06-2387-2006 Clove leaf oil.
Table 1: Clove oil characterization
Specification Unit Result Requirements in SNI 06-2387-
2006Relative density at 20oC
- 1.024 1.025 – .,049
Refractive index (nD20)
- 1.53 1.528 – 1.535
Miscibility in ethanol 70%, 20oC
- 1:2 clear
1 : 2 clear
Figure 2 shows the analysis of clove leaf oil using
GCMS. The chromatogram has 5 peaks on retention time 23.007 min to 31.147 min, with two major components are eugenol (75.22%) and beta-caryophyllene (15.40%), and the others small quantities components such as alpha humulene, delta cadinene and caryophyllene oxide (Table 2).
Figure 2: GCMS chromatogram of clove leaf oil
Standard quality for clove leaf oil (SNI 06-2387-2006 Clove leaf oil) requirements minimum eugenol content was 78%. Eugenol contents in clove leaf oil from small industry in Jawa Timur is 75.22%, so it is below standard trade and needs to improve.
Table 2: Chemical compound composition in clove leaf oil
Chemical compound Abundance (%) Eugenol 75.22
beta-Caryophyllene 15.40 Alpha-humulene 3.51 Delta-cadinene 1.60
Caryophyllene oxide 3.22
3.2 The Optimization of NaOH Excess on Saponification
Saponification is a reaction in which an ester is mixed with an alkali, such as sodium hydroxide producing a carboxylate salt. Eugenol as an ester reacted with sodium hydroxide to form sodium eugenolate salt:
Eug-OH + NaOH Eug-ONa+ H2O Clove leaf oil which was originally blackish
brown when it was added with NaOH became Na-eugenolate (turbid yellow). NaOH excess concentration was added in this experiment are different (3%, 5%, and 10%). 15 minutes after stopped the mixing, the two layers were formed, yellow liquid in the bottom layer (Na-eugenolate) and brown liquid in the top of the layer (organic layer).
The Na-eugenolate forming was not perfect in NaOH excess 3%, the separation between organic layer (terpene) and aqueous layer (Na-eugenolate) have not be seen yet. It indicated that all of eugenol has not converted to Na-eugenolate on NaOH excess 3% so the NaOH concentration must be increased. NaOH excess 5% gave the good separation between terpene and Na-eugenolate, therefore the separation was quick and more obvious with NaOH excess 10%. However, the NaOH excess 5% was selected for the saponification process in this experiment because the eugenol conversion was complete and the NaOH amount was not too excess. Some previous studies used NaOH excess concentration in 3% (Khalil et al., 2017); 5% (Sastrohamidjojo and Fariyatun, 2016); and 2 M (Just et al., 2016) which gave optimum alkali concentration in saponification.
3.3 The Eugenol Isolation in the Pilot Plant Scale
The eugenol isolation in the pilot plant scale can be described in three main steps simultaneous saponification and distillation. Briefly, the steps can be described as follows: saponification using NaOH, neutralization with H2SO4 and separation with decantation. Clove leaf oil as raw material was used about 200 litres (204.8 kg). The saponification
5.00 10.00 15.00 20.00 25.00 30.00 35.00 40.00 45.00 50.00
500000
1000000
1500000
2000000
2500000
3000000
3500000
4000000
4500000
5000000
5500000
6000000
6500000
7000000
7500000
8000000
Time-->
Abundance
TIC: MINYAK CENGKEH.D\data.ms
Eugenol Production from Clove Oil in Pilot Plant Scale for Small and Medium Enterprises (SME)
99
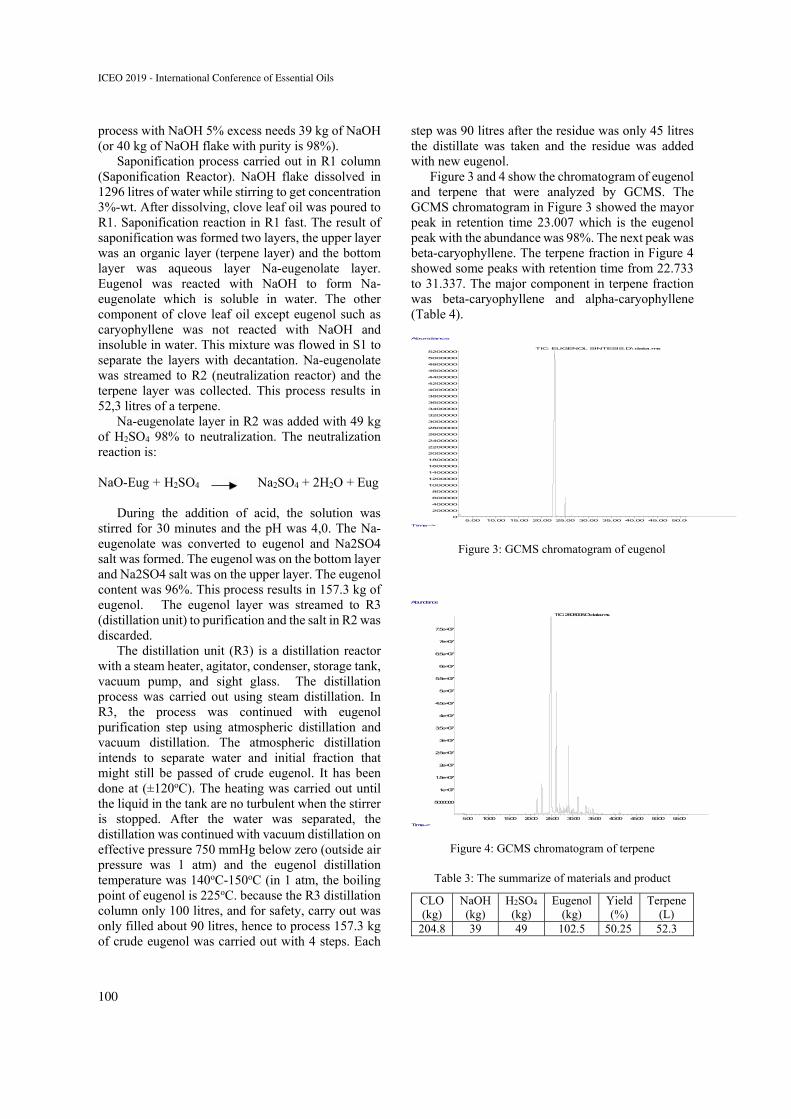
process with NaOH 5% excess needs 39 kg of NaOH (or 40 kg of NaOH flake with purity is 98%).
Saponification process carried out in R1 column (Saponification Reactor). NaOH flake dissolved in 1296 litres of water while stirring to get concentration 3%-wt. After dissolving, clove leaf oil was poured to R1. Saponification reaction in R1 fast. The result of saponification was formed two layers, the upper layer was an organic layer (terpene layer) and the bottom layer was aqueous layer Na-eugenolate layer. Eugenol was reacted with NaOH to form Na-eugenolate which is soluble in water. The other component of clove leaf oil except eugenol such as caryophyllene was not reacted with NaOH and insoluble in water. This mixture was flowed in S1 to separate the layers with decantation. Na-eugenolate was streamed to R2 (neutralization reactor) and the terpene layer was collected. This process results in 52,3 litres of a terpene.
Na-eugenolate layer in R2 was added with 49 kg of H2SO4 98% to neutralization. The neutralization reaction is:
NaO-Eug + H2SO4 Na2SO4 + 2H2O + Eug
During the addition of acid, the solution was stirred for 30 minutes and the pH was 4,0. The Na-eugenolate was converted to eugenol and Na2SO4 salt was formed. The eugenol was on the bottom layer and Na2SO4 salt was on the upper layer. The eugenol content was 96%. This process results in 157.3 kg of eugenol. The eugenol layer was streamed to R3 (distillation unit) to purification and the salt in R2 was discarded.
The distillation unit (R3) is a distillation reactor with a steam heater, agitator, condenser, storage tank, vacuum pump, and sight glass. The distillation process was carried out using steam distillation. In R3, the process was continued with eugenol purification step using atmospheric distillation and vacuum distillation. The atmospheric distillation intends to separate water and initial fraction that might still be passed of crude eugenol. It has been done at (±120oC). The heating was carried out until the liquid in the tank are no turbulent when the stirrer is stopped. After the water was separated, the distillation was continued with vacuum distillation on effective pressure 750 mmHg below zero (outside air pressure was 1 atm) and the eugenol distillation temperature was 140oC-150oC (in 1 atm, the boiling point of eugenol is 225oC. because the R3 distillation column only 100 litres, and for safety, carry out was only filled about 90 litres, hence to process 157.3 kg of crude eugenol was carried out with 4 steps. Each
step was 90 litres after the residue was only 45 litres the distillate was taken and the residue was added with new eugenol.
Figure 3 and 4 show the chromatogram of eugenol and terpene that were analyzed by GCMS. The GCMS chromatogram in Figure 3 showed the mayor peak in retention time 23.007 which is the eugenol peak with the abundance was 98%. The next peak was beta-caryophyllene. The terpene fraction in Figure 4 showed some peaks with retention time from 22.733 to 31.337. The major component in terpene fraction was beta-caryophyllene and alpha-caryophyllene (Table 4).
Figure 3: GCMS chromatogram of eugenol
Figure 4: GCMS chromatogram of terpene
Table 3: The summarize of materials and product
CLO (kg)
NaOH (kg)
H2SO4
(kg) Eugenol
(kg) Yield (%)
Terpene (L)
204.8 39 49 102.5 50.25 52.3
5.00 10.00 15.00 20.00 25.00 30.00 35.00 40.00 45.00 50.000
200000
400000
600000
800000
1000000
1200000
1400000
1600000
1800000
2000000
2200000
2400000
2600000
2800000
3000000
3200000
3400000
3600000
3800000
4000000
4200000
4400000
4600000
4800000
5000000
5200000
Time-->
Abundance
TIC: EUGENOL SINTESIS.D\data.ms
5.00 10.00 15.00 20.00 25.00 30.00 35.00 40.00 45.00 50.00 55.00
5000000
1e+07
1.5e+07
2e+07
2.5e+07
3e+07
3.5e+07
4e+07
4.5e+07
5e+07
5.5e+07
6e+07
6.5e+07
7e+07
7.5e+07
Time-->
Abundance
TIC: 2608008.D\data.ms
ICEO 2019 - International Conference of Essential Oils
100
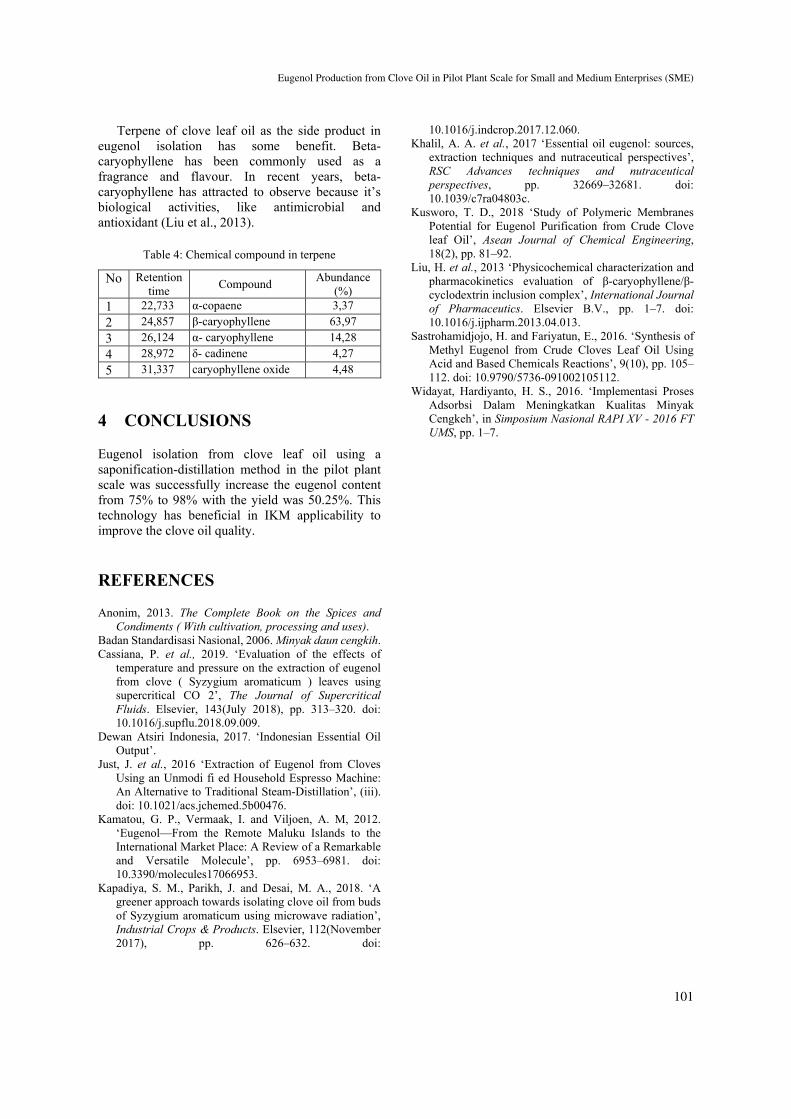
Terpene of clove leaf oil as the side product in eugenol isolation has some benefit. Beta-caryophyllene has been commonly used as a fragrance and flavour. In recent years, beta-caryophyllene has attracted to observe because it’s biological activities, like antimicrobial and antioxidant (Liu et al., 2013).
Table 4: Chemical compound in terpene
No Retention time Compound Abundance
(%)1 22,733 α-copaene 3,37
2 24,857 β-caryophyllene 63,97
3 26,124 α- caryophyllene 14,28
4 28,972 δ- cadinene 4,27
5 31,337 caryophyllene oxide 4,48
4 CONCLUSIONS
Eugenol isolation from clove leaf oil using a saponification-distillation method in the pilot plant scale was successfully increase the eugenol content from 75% to 98% with the yield was 50.25%. This technology has beneficial in IKM applicability to improve the clove oil quality.
REFERENCES
Anonim, 2013. The Complete Book on the Spices and Condiments ( With cultivation, processing and uses).
Badan Standardisasi Nasional, 2006. Minyak daun cengkih. Cassiana, P. et al., 2019. ‘Evaluation of the effects of
temperature and pressure on the extraction of eugenol from clove ( Syzygium aromaticum ) leaves using supercritical CO 2’, The Journal of Supercritical Fluids. Elsevier, 143(July 2018), pp. 313–320. doi: 10.1016/j.supflu.2018.09.009.
Dewan Atsiri Indonesia, 2017. ‘Indonesian Essential Oil Output’.
Just, J. et al., 2016 ‘Extraction of Eugenol from Cloves Using an Unmodi fi ed Household Espresso Machine: An Alternative to Traditional Steam-Distillation’, (iii). doi: 10.1021/acs.jchemed.5b00476.
Kamatou, G. P., Vermaak, I. and Viljoen, A. M, 2012. ‘Eugenol—From the Remote Maluku Islands to the International Market Place: A Review of a Remarkable and Versatile Molecule’, pp. 6953–6981. doi: 10.3390/molecules17066953.
Kapadiya, S. M., Parikh, J. and Desai, M. A., 2018. ‘A greener approach towards isolating clove oil from buds of Syzygium aromaticum using microwave radiation’, Industrial Crops & Products. Elsevier, 112(November 2017), pp. 626–632. doi:
10.1016/j.indcrop.2017.12.060. Khalil, A. A. et al., 2017 ‘Essential oil eugenol: sources,
extraction techniques and nutraceutical perspectives’, RSC Advances techniques and nutraceutical perspectives, pp. 32669–32681. doi: 10.1039/c7ra04803c.
Kusworo, T. D., 2018 ‘Study of Polymeric Membranes Potential for Eugenol Purification from Crude Clove leaf Oil’, Asean Journal of Chemical Engineering, 18(2), pp. 81–92.
Liu, H. et al., 2013 ‘Physicochemical characterization and pharmacokinetics evaluation of β-caryophyllene/β-cyclodextrin inclusion complex’, International Journal of Pharmaceutics. Elsevier B.V., pp. 1–7. doi: 10.1016/j.ijpharm.2013.04.013.
Sastrohamidjojo, H. and Fariyatun, E., 2016. ‘Synthesis of Methyl Eugenol from Crude Cloves Leaf Oil Using Acid and Based Chemicals Reactions’, 9(10), pp. 105–112. doi: 10.9790/5736-091002105112.
Widayat, Hardiyanto, H. S., 2016. ‘Implementasi Proses Adsorbsi Dalam Meningkatkan Kualitas Minyak Cengkeh’, in Simposium Nasional RAPI XV - 2016 FT UMS, pp. 1–7.
Eugenol Production from Clove Oil in Pilot Plant Scale for Small and Medium Enterprises (SME)
101
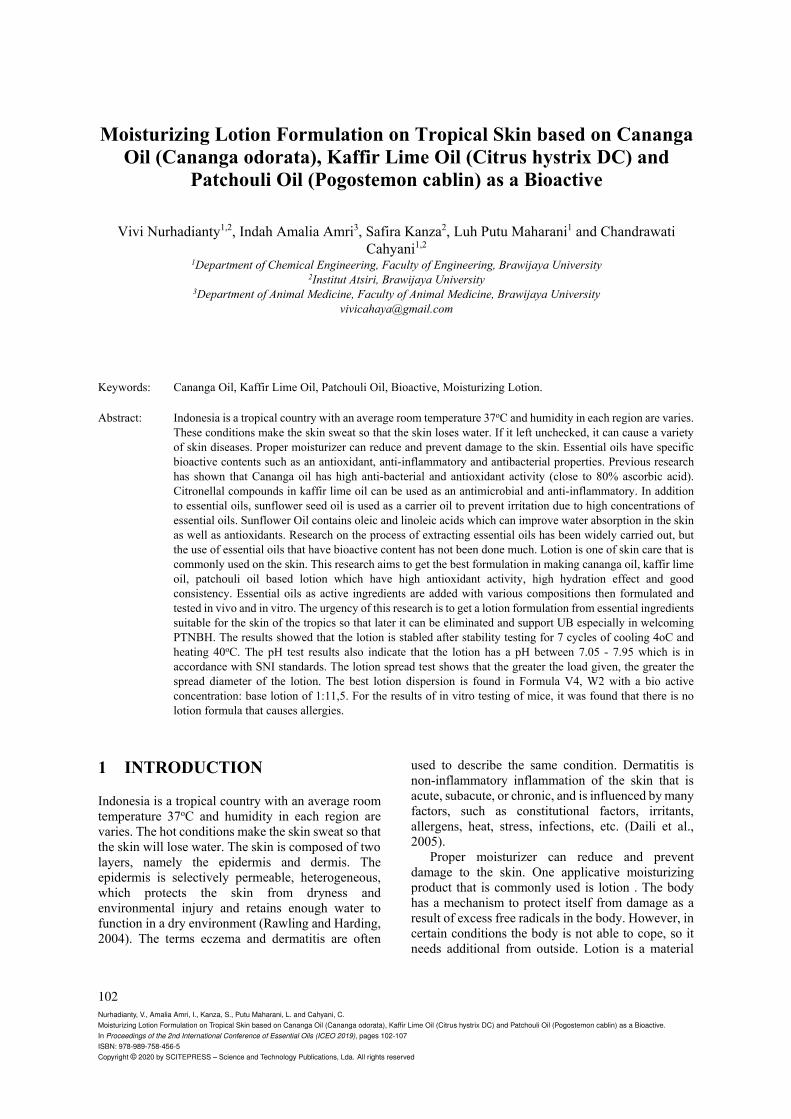
Moisturizing Lotion Formulation on Tropical Skin based on Cananga Oil (Cananga odorata), Kaffir Lime Oil (Citrus hystrix DC) and
Patchouli Oil (Pogostemon cablin) as a Bioactive
Vivi Nurhadianty1,2, Indah Amalia Amri3, Safira Kanza2, Luh Putu Maharani1 and Chandrawati Cahyani1,2
1Department of Chemical Engineering, Faculty of Engineering, Brawijaya University 2Institut Atsiri, Brawijaya University
3Department of Animal Medicine, Faculty of Animal Medicine, Brawijaya University [email protected]
Keywords: Cananga Oil, Kaffir Lime Oil, Patchouli Oil, Bioactive, Moisturizing Lotion.
Abstract: Indonesia is a tropical country with an average room temperature 37oC and humidity in each region are varies. These conditions make the skin sweat so that the skin loses water. If it left unchecked, it can cause a variety of skin diseases. Proper moisturizer can reduce and prevent damage to the skin. Essential oils have specific bioactive contents such as an antioxidant, anti-inflammatory and antibacterial properties. Previous research has shown that Cananga oil has high anti-bacterial and antioxidant activity (close to 80% ascorbic acid). Citronellal compounds in kaffir lime oil can be used as an antimicrobial and anti-inflammatory. In addition to essential oils, sunflower seed oil is used as a carrier oil to prevent irritation due to high concentrations of essential oils. Sunflower Oil contains oleic and linoleic acids which can improve water absorption in the skin as well as antioxidants. Research on the process of extracting essential oils has been widely carried out, but the use of essential oils that have bioactive content has not been done much. Lotion is one of skin care that is commonly used on the skin. This research aims to get the best formulation in making cananga oil, kaffir lime oil, patchouli oil based lotion which have high antioxidant activity, high hydration effect and good consistency. Essential oils as active ingredients are added with various compositions then formulated and tested in vivo and in vitro. The urgency of this research is to get a lotion formulation from essential ingredients suitable for the skin of the tropics so that later it can be eliminated and support UB especially in welcoming PTNBH. The results showed that the lotion is stabled after stability testing for 7 cycles of cooling 4oC and heating 40oC. The pH test results also indicate that the lotion has a pH between 7.05 - 7.95 which is in accordance with SNI standards. The lotion spread test shows that the greater the load given, the greater the spread diameter of the lotion. The best lotion dispersion is found in Formula V4, W2 with a bio active concentration: base lotion of 1:11,5. For the results of in vitro testing of mice, it was found that there is no lotion formula that causes allergies.
1 INTRODUCTION
Indonesia is a tropical country with an average room temperature 37oC and humidity in each region are varies. The hot conditions make the skin sweat so that the skin will lose water. The skin is composed of two layers, namely the epidermis and dermis. The epidermis is selectively permeable, heterogeneous, which protects the skin from dryness and environmental injury and retains enough water to function in a dry environment (Rawling and Harding, 2004). The terms eczema and dermatitis are often
used to describe the same condition. Dermatitis is non-inflammatory inflammation of the skin that is acute, subacute, or chronic, and is influenced by many factors, such as constitutional factors, irritants, allergens, heat, stress, infections, etc. (Daili et al., 2005).
Proper moisturizer can reduce and prevent damage to the skin. One applicative moisturizing product that is commonly used is lotion . The body has a mechanism to protect itself from damage as a result of excess free radicals in the body. However, in certain conditions the body is not able to cope, so it needs additional from outside. Lotion is a material
102Nurhadianty, V., Amalia Amri, I., Kanza, S., Putu Maharani, L. and Cahyani, C.Moisturizing Lotion Formulation on Tropical Skin based on Cananga Oil (Cananga odorata), Kaffir Lime Oil (Citrus hystrix DC) and Patchouli Oil (Pogostemon cablin) as a Bioactive.In Proceedings of the 2nd International Conference of Essential Oils (ICEO 2019), pages 102-107ISBN: 978-989-758-456-5Copyright © 2020 by SCITEPRESS – Science and Technology Publications, Lda. All rights reserved
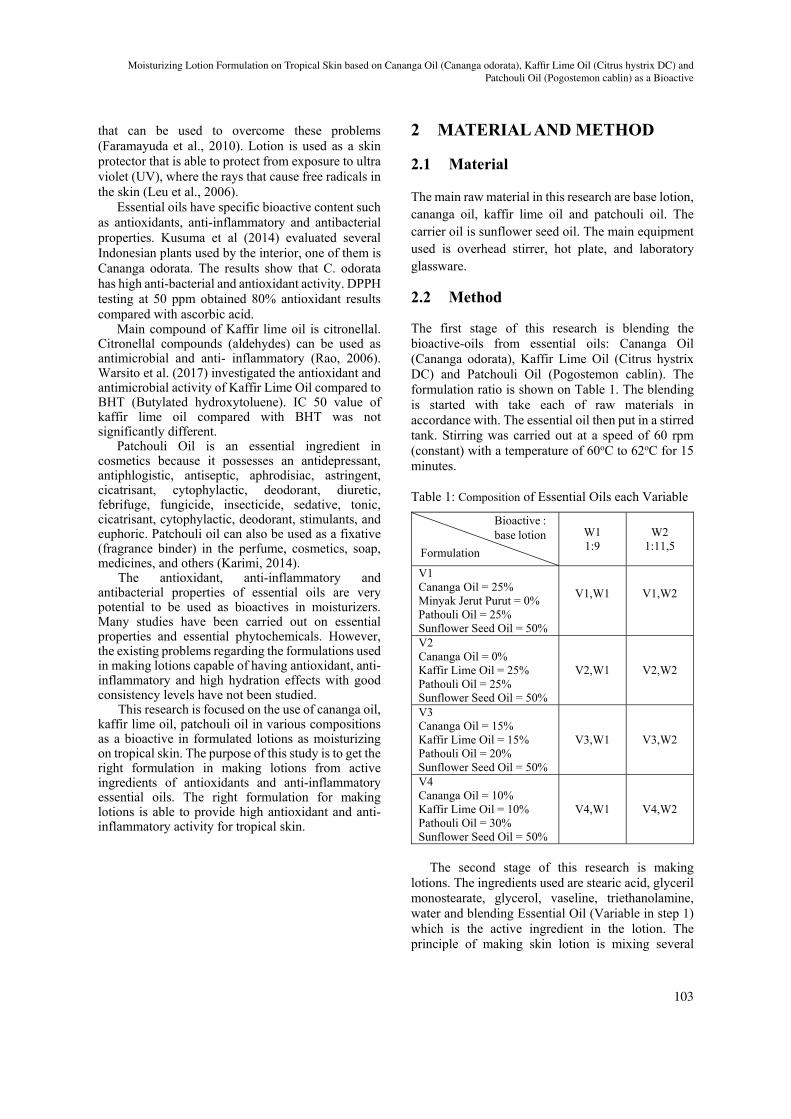
that can be used to overcome these problems (Faramayuda et al., 2010). Lotion is used as a skin protector that is able to protect from exposure to ultra violet (UV), where the rays that cause free radicals in the skin (Leu et al., 2006).
Essential oils have specific bioactive content such as antioxidants, anti-inflammatory and antibacterial properties. Kusuma et al (2014) evaluated several Indonesian plants used by the interior, one of them is Cananga odorata. The results show that C. odorata has high anti-bacterial and antioxidant activity. DPPH testing at 50 ppm obtained 80% antioxidant results compared with ascorbic acid.
Main compound of Kaffir lime oil is citronellal. Citronellal compounds (aldehydes) can be used as antimicrobial and anti- inflammatory (Rao, 2006). Warsito et al. (2017) investigated the antioxidant and antimicrobial activity of Kaffir Lime Oil compared to BHT (Butylated hydroxytoluene). IC 50 value of kaffir lime oil compared with BHT was not significantly different.
Patchouli Oil is an essential ingredient in cosmetics because it possesses an antidepressant, antiphlogistic, antiseptic, aphrodisiac, astringent, cicatrisant, cytophylactic, deodorant, diuretic, febrifuge, fungicide, insecticide, sedative, tonic, cicatrisant, cytophylactic, deodorant, stimulants, and euphoric. Patchouli oil can also be used as a fixative (fragrance binder) in the perfume, cosmetics, soap, medicines, and others (Karimi, 2014).
The antioxidant, anti-inflammatory and antibacterial properties of essential oils are very potential to be used as bioactives in moisturizers. Many studies have been carried out on essential properties and essential phytochemicals. However, the existing problems regarding the formulations used in making lotions capable of having antioxidant, anti-inflammatory and high hydration effects with good consistency levels have not been studied.
This research is focused on the use of cananga oil, kaffir lime oil, patchouli oil in various compositions as a bioactive in formulated lotions as moisturizing on tropical skin. The purpose of this study is to get the right formulation in making lotions from active ingredients of antioxidants and anti-inflammatory essential oils. The right formulation for making lotions is able to provide high antioxidant and anti-inflammatory activity for tropical skin.
2 MATERIAL AND METHOD
2.1 Material
The main raw material in this research are base lotion, cananga oil, kaffir lime oil and patchouli oil. The carrier oil is sunflower seed oil. The main equipment used is overhead stirrer, hot plate, and laboratory glassware.
2.2 Method
The first stage of this research is blending the bioactive-oils from essential oils: Cananga Oil (Cananga odorata), Kaffir Lime Oil (Citrus hystrix DC) and Patchouli Oil (Pogostemon cablin). The formulation ratio is shown on Table 1. The blending is started with take each of raw materials in accordance with. The essential oil then put in a stirred tank. Stirring was carried out at a speed of 60 rpm (constant) with a temperature of 60oC to 62oC for 15 minutes.
Table 1: Composition of Essential Oils each Variable
W1 1:9
W2 1:11,5
V1 Cananga Oil = 25% Minyak Jerut Purut = 0% Pathouli Oil = 25% Sunflower Seed Oil = 50%
V1,W1 V1,W2
V2 Cananga Oil = 0% Kaffir Lime Oil = 25% Pathouli Oil = 25% Sunflower Seed Oil = 50%
V2,W1 V2,W2
V3 Cananga Oil = 15% Kaffir Lime Oil = 15% Pathouli Oil = 20% Sunflower Seed Oil = 50%
V3,W1 V3,W2
V4 Cananga Oil = 10% Kaffir Lime Oil = 10% Pathouli Oil = 30% Sunflower Seed Oil = 50%
V4,W1 V4,W2
The second stage of this research is making
lotions. The ingredients used are stearic acid, glyceril monostearate, glycerol, vaseline, triethanolamine, water and blending Essential Oil (Variable in step 1) which is the active ingredient in the lotion. The principle of making skin lotion is mixing several
Bioactive : base lotion
Formulation
Moisturizing Lotion Formulation on Tropical Skin based on Cananga Oil (Cananga odorata), Kaffir Lime Oil (Citrus hystrix DC) andPatchouli Oil (Pogostemon cablin) as a Bioactive
103
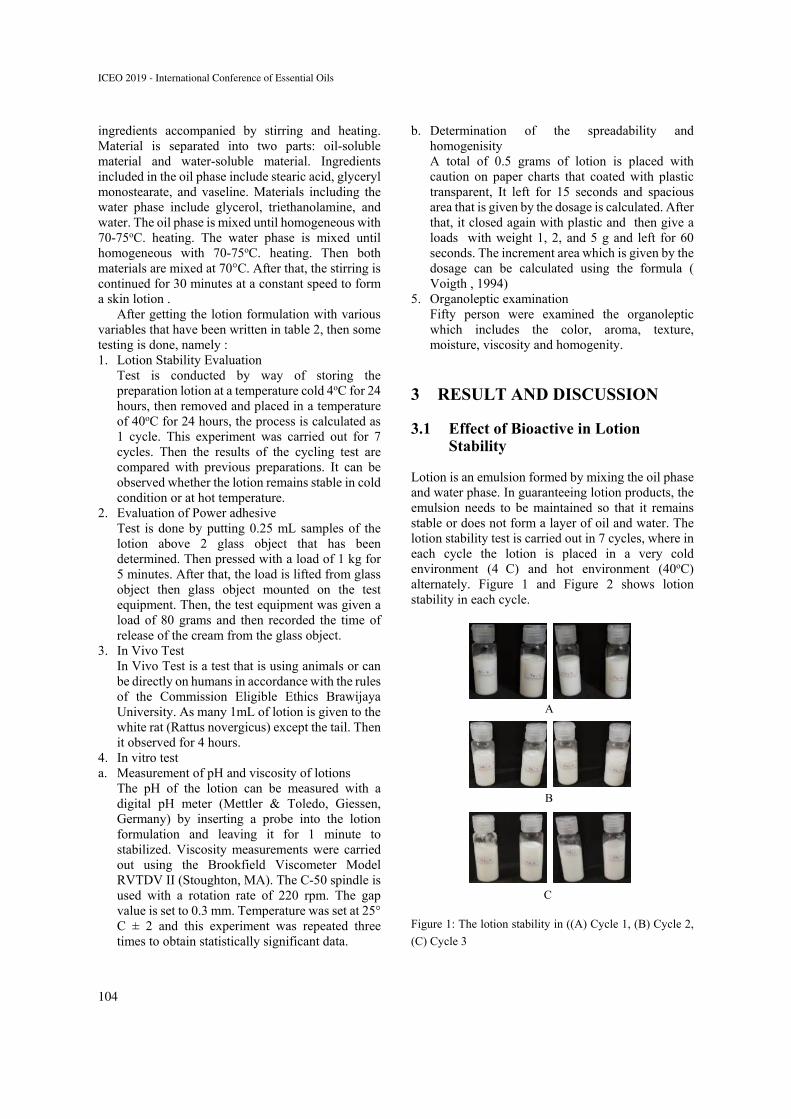
ingredients accompanied by stirring and heating. Material is separated into two parts: oil-soluble material and water-soluble material. Ingredients included in the oil phase include stearic acid, glyceryl monostearate, and vaseline. Materials including the water phase include glycerol, triethanolamine, and water. The oil phase is mixed until homogeneous with 70-75oC. heating. The water phase is mixed until homogeneous with 70-75oC. heating. Then both materials are mixed at 70°C. After that, the stirring is continued for 30 minutes at a constant speed to form a skin lotion .
After getting the lotion formulation with various variables that have been written in table 2, then some testing is done, namely : 1. Lotion Stability Evaluation
Test is conducted by way of storing the preparation lotion at a temperature cold 4oC for 24 hours, then removed and placed in a temperature of 40oC for 24 hours, the process is calculated as 1 cycle. This experiment was carried out for 7 cycles. Then the results of the cycling test are compared with previous preparations. It can be observed whether the lotion remains stable in cold condition or at hot temperature.
2. Evaluation of Power adhesive Test is done by putting 0.25 mL samples of the lotion above 2 glass object that has been determined. Then pressed with a load of 1 kg for 5 minutes. After that, the load is lifted from glass object then glass object mounted on the test equipment. Then, the test equipment was given a load of 80 grams and then recorded the time of release of the cream from the glass object.
3. In Vivo Test In Vivo Test is a test that is using animals or can be directly on humans in accordance with the rules of the Commission Eligible Ethics Brawijaya University. As many 1mL of lotion is given to the white rat (Rattus novergicus) except the tail. Then it observed for 4 hours.
4. In vitro test a. Measurement of pH and viscosity of lotions
The pH of the lotion can be measured with a digital pH meter (Mettler & Toledo, Giessen, Germany) by inserting a probe into the lotion formulation and leaving it for 1 minute to stabilized. Viscosity measurements were carried out using the Brookfield Viscometer Model RVTDV II (Stoughton, MA). The C-50 spindle is used with a rotation rate of 220 rpm. The gap value is set to 0.3 mm. Temperature was set at 25° C ± 2 and this experiment was repeated three times to obtain statistically significant data.
b. Determination of the spreadability and homogenisity A total of 0.5 grams of lotion is placed with caution on paper charts that coated with plastic transparent, It left for 15 seconds and spacious area that is given by the dosage is calculated. After that, it closed again with plastic and then give a loads with weight 1, 2, and 5 g and left for 60 seconds. The increment area which is given by the dosage can be calculated using the formula ( Voigth , 1994)
5. Organoleptic examination Fifty person were examined the organoleptic which includes the color, aroma, texture, moisture, viscosity and homogenity.
3 RESULT AND DISCUSSION
3.1 Effect of Bioactive in Lotion Stability
Lotion is an emulsion formed by mixing the oil phase and water phase. In guaranteeing lotion products, the emulsion needs to be maintained so that it remains stable or does not form a layer of oil and water. The lotion stability test is carried out in 7 cycles, where in each cycle the lotion is placed in a very cold environment (4 C) and hot environment (40oC) alternately. Figure 1 and Figure 2 shows lotion stability in each cycle.
Figure 1: The lotion stability in ((A) Cycle 1, (B) Cycle 2,
(C) Cycle 3
A
B
C
ICEO 2019 - International Conference of Essential Oils
104
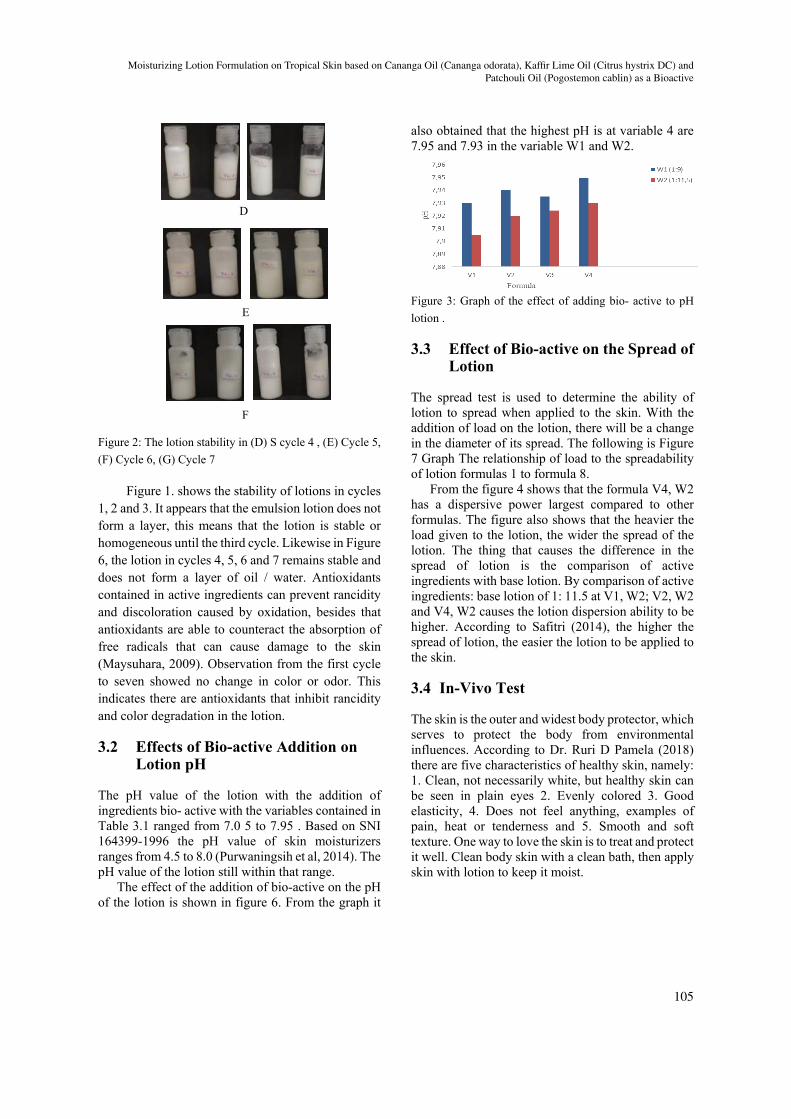
Figure 2: The lotion stability in (D) S cycle 4 , (E) Cycle 5,
(F) Cycle 6, (G) Cycle 7
Figure 1. shows the stability of lotions in cycles 1, 2 and 3. It appears that the emulsion lotion does not form a layer, this means that the lotion is stable or homogeneous until the third cycle. Likewise in Figure 6, the lotion in cycles 4, 5, 6 and 7 remains stable and does not form a layer of oil / water. Antioxidants contained in active ingredients can prevent rancidity and discoloration caused by oxidation, besides that antioxidants are able to counteract the absorption of free radicals that can cause damage to the skin (Maysuhara, 2009). Observation from the first cycle to seven showed no change in color or odor. This indicates there are antioxidants that inhibit rancidity and color degradation in the lotion.
3.2 Effects of Bio-active Addition on Lotion pH
The pH value of the lotion with the addition of ingredients bio- active with the variables contained in Table 3.1 ranged from 7.0 5 to 7.95 . Based on SNI 164399-1996 the pH value of skin moisturizers ranges from 4.5 to 8.0 (Purwaningsih et al, 2014). The pH value of the lotion still within that range.
The effect of the addition of bio-active on the pH of the lotion is shown in figure 6. From the graph it
also obtained that the highest pH is at variable 4 are 7.95 and 7.93 in the variable W1 and W2.
Figure 3: Graph of the effect of adding bio- active to pH
lotion .
3.3 Effect of Bio-active on the Spread of Lotion
The spread test is used to determine the ability of lotion to spread when applied to the skin. With the addition of load on the lotion, there will be a change in the diameter of its spread. The following is Figure 7 Graph The relationship of load to the spreadability of lotion formulas 1 to formula 8.
From the figure 4 shows that the formula V4, W2 has a dispersive power largest compared to other formulas. The figure also shows that the heavier the load given to the lotion, the wider the spread of the lotion. The thing that causes the difference in the spread of lotion is the comparison of active ingredients with base lotion. By comparison of active ingredients: base lotion of 1: 11.5 at V1, W2; V2, W2 and V4, W2 causes the lotion dispersion ability to be higher. According to Safitri (2014), the higher the spread of lotion, the easier the lotion to be applied to the skin.
3.4 In-Vivo Test
The skin is the outer and widest body protector, which serves to protect the body from environmental influences. According to Dr. Ruri D Pamela (2018) there are five characteristics of healthy skin, namely: 1. Clean, not necessarily white, but healthy skin can be seen in plain eyes 2. Evenly colored 3. Good elasticity, 4. Does not feel anything, examples of pain, heat or tenderness and 5. Smooth and soft texture. One way to love the skin is to treat and protect it well. Clean body skin with a clean bath, then apply skin with lotion to keep it moist.
D
E
F
Moisturizing Lotion Formulation on Tropical Skin based on Cananga Oil (Cananga odorata), Kaffir Lime Oil (Citrus hystrix DC) andPatchouli Oil (Pogostemon cablin) as a Bioactive
105
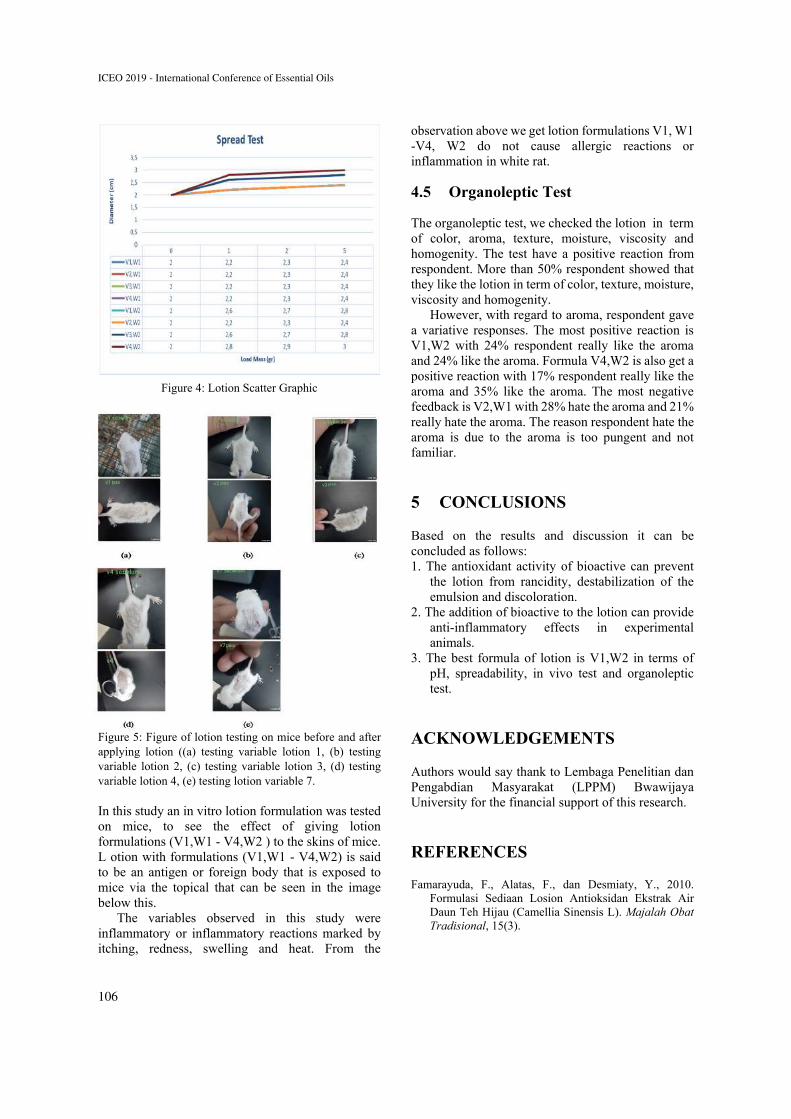
Figure 4: Lotion Scatter Graphic
Figure 5: Figure of lotion testing on mice before and after applying lotion ((a) testing variable lotion 1, (b) testing variable lotion 2, (c) testing variable lotion 3, (d) testing variable lotion 4, (e) testing lotion variable 7. In this study an in vitro lotion formulation was tested on mice, to see the effect of giving lotion formulations (V1,W1 - V4,W2 ) to the skins of mice. L otion with formulations (V1,W1 - V4,W2) is said to be an antigen or foreign body that is exposed to mice via the topical that can be seen in the image below this.
The variables observed in this study were inflammatory or inflammatory reactions marked by itching, redness, swelling and heat. From the
observation above we get lotion formulations V1, W1 -V4, W2 do not cause allergic reactions or inflammation in white rat.
4.5 Organoleptic Test
The organoleptic test, we checked the lotion in term of color, aroma, texture, moisture, viscosity and homogenity. The test have a positive reaction from respondent. More than 50% respondent showed that they like the lotion in term of color, texture, moisture, viscosity and homogenity.
However, with regard to aroma, respondent gave a variative responses. The most positive reaction is V1,W2 with 24% respondent really like the aroma and 24% like the aroma. Formula V4,W2 is also get a positive reaction with 17% respondent really like the aroma and 35% like the aroma. The most negative feedback is V2,W1 with 28% hate the aroma and 21% really hate the aroma. The reason respondent hate the aroma is due to the aroma is too pungent and not familiar.
5 CONCLUSIONS
Based on the results and discussion it can be concluded as follows: 1. The antioxidant activity of bioactive can prevent
the lotion from rancidity, destabilization of the emulsion and discoloration.
2. The addition of bioactive to the lotion can provide anti-inflammatory effects in experimental animals.
3. The best formula of lotion is V1,W2 in terms of pH, spreadability, in vivo test and organoleptic test.
ACKNOWLEDGEMENTS
Authors would say thank to Lembaga Penelitian dan Pengabdian Masyarakat (LPPM) Bwawijaya University for the financial support of this research.
REFERENCES
Famarayuda, F., Alatas, F., dan Desmiaty, Y., 2010. Formulasi Sediaan Losion Antioksidan Ekstrak Air Daun Teh Hijau (Camellia Sinensis L). Majalah Obat Tradisional, 15(3).
ICEO 2019 - International Conference of Essential Oils
106
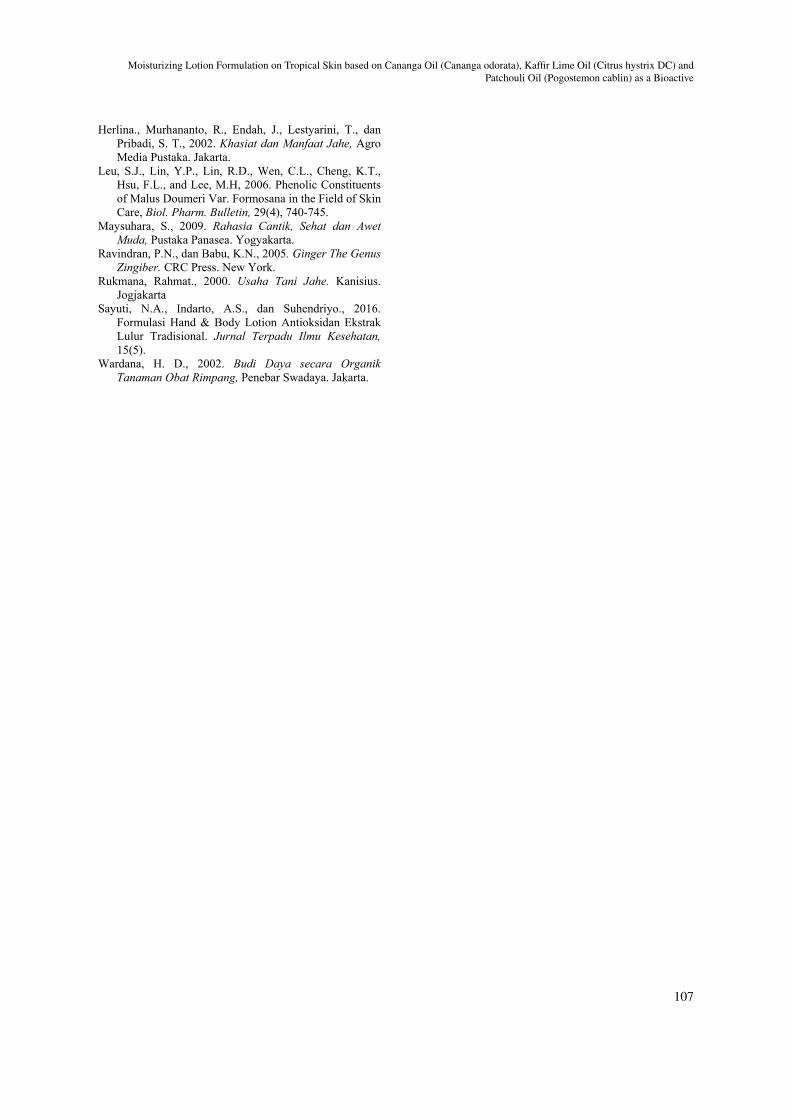
Herlina., Murhananto, R., Endah, J., Lestyarini, T., dan Pribadi, S. T., 2002. Khasiat dan Manfaat Jahe, Agro Media Pustaka. Jakarta.
Leu, S.J., Lin, Y.P., Lin, R.D., Wen, C.L., Cheng, K.T., Hsu, F.L., and Lee, M.H, 2006. Phenolic Constituents of Malus Doumeri Var. Formosana in the Field of Skin Care, Biol. Pharm. Bulletin, 29(4), 740-745.
Maysuhara, S., 2009. Rahasia Cantik, Sehat dan Awet Muda, Pustaka Panasea. Yogyakarta.
Ravindran, P.N., dan Babu, K.N., 2005. Ginger The Genus Zingiber. CRC Press. New York.
Rukmana, Rahmat., 2000. Usaha Tani Jahe. Kanisius. Jogjakarta
Sayuti, N.A., Indarto, A.S., dan Suhendriyo., 2016. Formulasi Hand & Body Lotion Antioksidan Ekstrak Lulur Tradisional. Jurnal Terpadu Ilmu Kesehatan, 15(5).
Wardana, H. D., 2002. Budi Daya secara Organik Tanaman Obat Rimpang, Penebar Swadaya. Jakarta.
Moisturizing Lotion Formulation on Tropical Skin based on Cananga Oil (Cananga odorata), Kaffir Lime Oil (Citrus hystrix DC) andPatchouli Oil (Pogostemon cablin) as a Bioactive
107
Quality Characteristics and Antibacterial Activity of Transparent Solid Soap with Addition of Cananga Oil (Cananga odorata)
Rulita Maulidya1, Yuliani Aisyah1,2 and Dewi Yunita1 1Agricultural Industry Technology Department, Agriculture Faculty, Universitas Syiah Kuala,
Banda Aceh, Indonesia 23111 2Atsiri Research Center, Universitas Syiah Kuala, Banda Aceh, Indonesia, 23111
Keywords: Transparent solid soap, cananga, virgin coconut oil, palm oil, alkali.
Abstract: Cananga oil (Cananga odorata) is a natural source of fragrances that can be used as an antibacterial agent, so cananga oil can be added to the formulation for making antibacterial soap. Therefore, the aim of this study is to determine the formulation of cananga soap using different types of oil and to characterize the quality of transparent solid soap. This study uses a completely randomized design (CRD) with a factorial pattern consisting of two factors and three replications. Oil type (VCO and palm oil) and cananga oil concentration (0% (control), 0.5%, 1%, and 1.5%; w / v) were factors in this study. Moisture content, free alkali content, pH, hardness, foam stability and antibacterial activity were analyzed. Staphylococcus aureus and Escherichia coli were used to test antibacterial activity. The results showed that soap made from VCO oil and 1.5% cananga oil was the best formulation. The characteristics of transparent solid soap are water content 1.81-4.39%, free alkali content 0.63-0.96%, pH 11.33-11.81, hardness 0.042 - 0.065 mm / g / s, and foam stability 69.70-85.45%. However, soaps made from VCO were only able to inhibit the growth of Staphylococcus aureus with inhibitory diameters of 8.1-11.0 mm. Further research is needed to reduce the levels of free alkali in soap and to increase the concentration of cananga oil so that it can inhibit the growth of Escherichia coli.
1 INTRODUCTION
Soap is a product of fatty acids and strong alkali salts (sodium or potassium) hydrolysis. There are two forms of soaps which are bar and liquid. Bar soap is divided into 3 types, namely opaque, translucent and transparent solid soaps. Transparent solid soap has the highest level of clarity where this soap can be penetrated by light (Prihandana et al., 2007). Transparent solid soap has more excellence compared to opaque soap specifically in its clear appearance and its softer foam because diethanolamine cocoamide, alcohol and sugar solution were added during production. Also, high concentration of glycerine was added giving the transparent solid soap moister.
The types of fatty acid of the raw materials used in production of transparent solid soap influence the characteristics of the soap produced (Momuat et al., 2017). Fatty acids are the major component which is made up from fat so selection of the fat in the soap production is very important. The types of fatty acids used in making transparent soap can come from VCO oil and palm oil (Widyasanti, 2016), coconut oil
(Rozi, 2013), used cooking oil (Priani, 2010), VCO and olive oil (Febriyenti, 2014).
Nowadays, transparent solid soap produced with addition of natural ingredients is in great demand by consumers especially because of beneficial effects on skin health. Many synthetic antibacterial ingredients such as triclosan and chloroxylenol are used to produce antibacterial soaps (Wijana et al., 2019). Unfortunately, the use of chemical soap continuously can cause antibiotic resistance (Roslan et al., 2009). Natural antibacterial alternatives are needed in soap production.
In this research, cananga oil was added as essential oil because cananga is a local flowering plant in Aceh Province, Indonesia. In Indonesia, in addition to being used as flowers for the ceremonial cananga become the identity flora of the Province of Nanggroe Aceh Darussalam and North Sumatra Province (Sotyati, 2016). It has a distinctive and fragrant flower aroma. The chemical composition of cananga oil is -humulene (7.1%), germacrene D (8.1%), -farnesene (12.6%), farnesol (5.6%) and benzyl benzoate (3.8%). The main components that
108Maulidya, R., Aisyah, Y. and Yunita, D.Quality Characteristics and Antibacterial Activity of Transparent Solid Soap with Addition of Cananga Oil (Cananga odorata).In Proceedings of the 2nd International Conference of Essential Oils (ICEO 2019), pages 108-114ISBN: 978-989-758-456-5Copyright © 2020 by SCITEPRESS – Science and Technology Publications, Lda. All rights reserved
contribute to the aroma of cananga oil are linalool (8.7%), dan -caryophyllene (26.8%) (Giang and Son, 2016). Cananga has also been used for antibacterial, anti-inflammatory and local anesthetic activity (Erindyah, 2002).
Cananga oil has the ability to inhibit the growth of Staphylococcus aureus bacteria. Activity against bacteria continued to increase in accordance with the amount of antibacterial compounds in the oil (Maulidya, 2016; Anggia et al., 2014). The components of O-methylmoschatoline, liriodenine (24%), 3,4-dihydroxybenzoic acid, germacrene D (11%), and -caryophyllene (12%) have been investigated to contribute in antimicrobial activity (Tan et al., 2015). The use of cananga oil serves not only as a substitute for synthetic antibacterial substances, but also as a fragrance in transparent solid soap.
Therefore, the purpose of this study was to determine the cananga soap formulation as well as to characterise the quality of the transparent solid soap. The raw materials used were palm oil and virgin coconut oil (VCO). Also, cananga oil was used in various concentration (0.5%, 1%, 1.5%).
2 MATERIALS AND METHODS
2.1 Material
The materials used in this study were cananga oil, virgin coconut oil (VCO), palm oil, stearic acid, NaOH, glycerin, ethanol, sugar solution, NaCl, diethanolamine cocoamide, aquadest, nutrient agar (Merck®), commercial antibacterial soap, Staphylococcus aureus and Escherichia coli.
2.2 Research Design
This study used a completely randomized design (CRD) with a factorial pattern consisting of two factors. The first factor was types of oils (M) consisting of two levels (VCO (M1) and palm oil (M2)). The second factor was cananga oil concentration (K; w/v) consisting of four levels (0% (K1; control), 0.5% (K2), 1% (K3) and 1.5% (K4).
2.3 Transparent Soap Production
The oils (coconut oil and palm oil) were heated at 70°C. Stearate acid and NaOH 30% were added and mixed until homogeneous to produce soap stocks. Ethanol, glycerin, sugar solutions, sodium chloride, and diethanolamine cocoamide were added to the
soap stock and stirred constantly for 10 minutes until the mixture became homogeneous and clear solution was formed. Cananga oil (0.5%, 1%, 1.5%) was added to the soap mixture at 40°C and was stirred until homogeneous. The soap mixture was molded in a transparent solid soap mold. Furthermore, the curing process took for 3 weeks.
2.4 Analysis of Transparent Soap
The chemical (water content, free alkali level, pH) and physical (hardness and foam stability) properties were examined following Indonesia National Standard (SNI 06-4085-1996). The soap was examined for antibacterial testing on Escherichia coli and Staphylococcus aureus (Widyasanti, 2016). The antibacterial ability was observed by measuring the inhibitory area around the media which had been placed on disc paper, which was marked by the presence of a clear zone. The clear zone formed is measured using a callipers.
2.5 Statistical Analysis
Data from water content, free alkali content, pH test, hardness and foam stability were analysed with analyse of variance (ANNOVA). The level used in this analysis was 5%. If there is a significant effect between treatments, Least Significance Different (LSD) was used as the post hoc test to find out the differences between treatments.
3 RESULTS AND DISCUSSION
3.1 Chemical Properties of Transparent Solid Soap
3.1.1 Water Content
Based on SNI 06-3532-1994, the maximum moisture content in soap is 15%. The amount of water contained in soap can affect the characteristics of the soap during the storage period. Soap with a high water content or > 15% will experience a decrease in weight and dimensions (Fachmi, 2008). Based on the analysis of variance, it is known that the type of oils has a very significant influence on the water content of the transparent solid soap produced. The percentage of water content can be seen in Figure 1. This result showed that the moisture content of transparent solid soap made from VCO and palm oil met the SNI.
Quality Characteristics and Antibacterial Activity of Transparent Solid Soap with Addition of Cananga Oil (Cananga odorata)
109
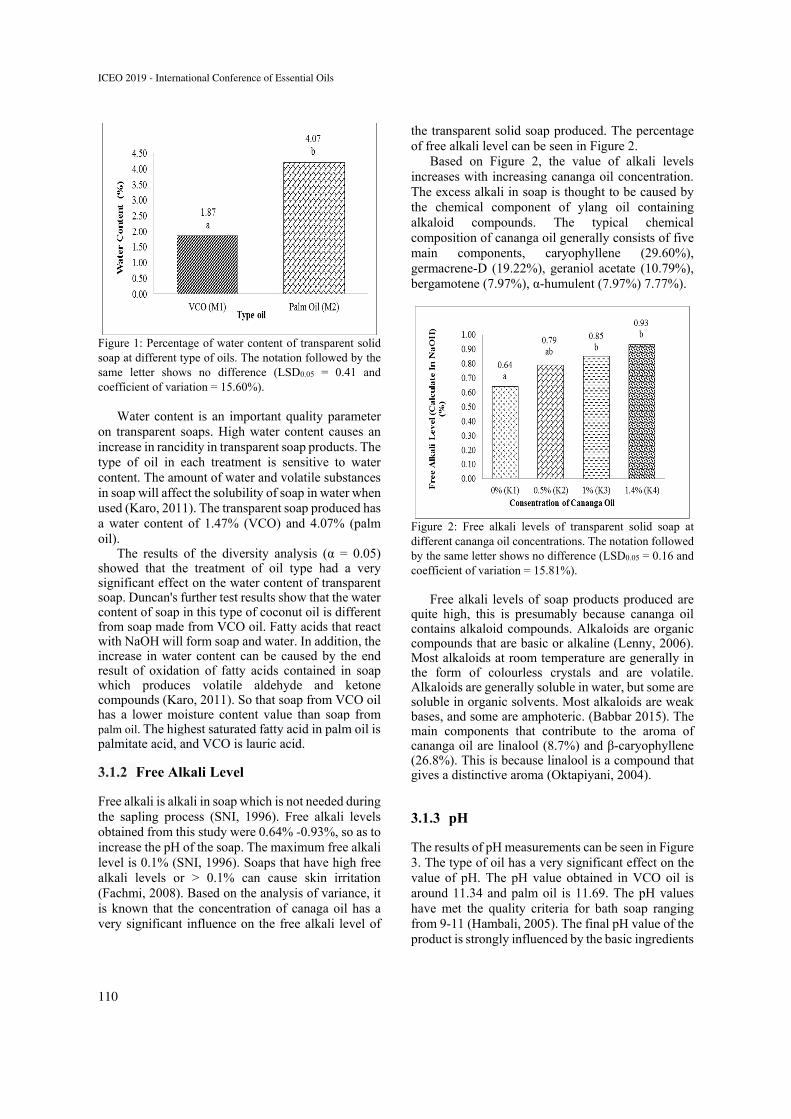
Figure 1: Percentage of water content of transparent solid soap at different type of oils. The notation followed by the same letter shows no difference (LSD0.05 = 0.41 and coefficient of variation = 15.60%).
Water content is an important quality parameter on transparent soaps. High water content causes an increase in rancidity in transparent soap products. The type of oil in each treatment is sensitive to water content. The amount of water and volatile substances in soap will affect the solubility of soap in water when used (Karo, 2011). The transparent soap produced has a water content of 1.47% (VCO) and 4.07% (palm oil).
The results of the diversity analysis (α = 0.05) showed that the treatment of oil type had a very significant effect on the water content of transparent soap. Duncan's further test results show that the water content of soap in this type of coconut oil is different from soap made from VCO oil. Fatty acids that react with NaOH will form soap and water. In addition, the increase in water content can be caused by the end result of oxidation of fatty acids contained in soap which produces volatile aldehyde and ketone compounds (Karo, 2011). So that soap from VCO oil has a lower moisture content value than soap from palm oil. The highest saturated fatty acid in palm oil is palmitate acid, and VCO is lauric acid.
3.1.2 Free Alkali Level
Free alkali is alkali in soap which is not needed during the sapling process (SNI, 1996). Free alkali levels obtained from this study were 0.64% -0.93%, so as to increase the pH of the soap. The maximum free alkali level is 0.1% (SNI, 1996). Soaps that have high free alkali levels or > 0.1% can cause skin irritation (Fachmi, 2008). Based on the analysis of variance, it is known that the concentration of canaga oil has a very significant influence on the free alkali level of
the transparent solid soap produced. The percentage of free alkali level can be seen in Figure 2.
Based on Figure 2, the value of alkali levels increases with increasing cananga oil concentration. The excess alkali in soap is thought to be caused by the chemical component of ylang oil containing alkaloid compounds. The typical chemical composition of cananga oil generally consists of five main components, caryophyllene (29.60%), germacrene-D (19.22%), geraniol acetate (10.79%), bergamotene (7.97%), α-humulent (7.97%) 7.77%).
Figure 2: Free alkali levels of transparent solid soap at different cananga oil concentrations. The notation followed by the same letter shows no difference (LSD0.05 = 0.16 and coefficient of variation = 15.81%).
Free alkali levels of soap products produced are quite high, this is presumably because cananga oil contains alkaloid compounds. Alkaloids are organic compounds that are basic or alkaline (Lenny, 2006). Most alkaloids at room temperature are generally in the form of colourless crystals and are volatile. Alkaloids are generally soluble in water, but some are soluble in organic solvents. Most alkaloids are weak bases, and some are amphoteric. (Babbar 2015). The main components that contribute to the aroma of cananga oil are linalool (8.7%) and β-caryophyllene (26.8%). This is because linalool is a compound that gives a distinctive aroma (Oktapiyani, 2004).
3.1.3 pH
The results of pH measurements can be seen in Figure 3. The type of oil has a very significant effect on the value of pH. The pH value obtained in VCO oil is around 11.34 and palm oil is 11.69. The pH values have met the quality criteria for bath soap ranging from 9-11 (Hambali, 2005). The final pH value of the product is strongly influenced by the basic ingredients
ICEO 2019 - International Conference of Essential Oils
110
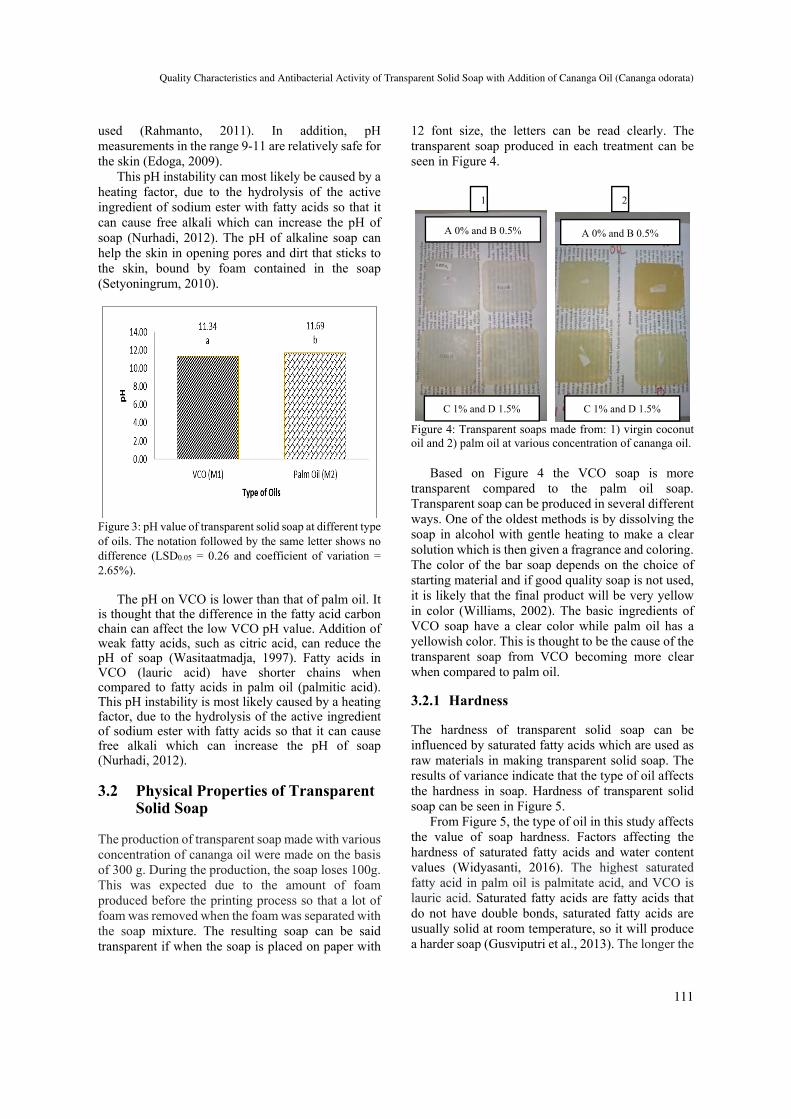
used (Rahmanto, 2011). In addition, pH measurements in the range 9-11 are relatively safe for the skin (Edoga, 2009).
This pH instability can most likely be caused by a heating factor, due to the hydrolysis of the active ingredient of sodium ester with fatty acids so that it can cause free alkali which can increase the pH of soap (Nurhadi, 2012). The pH of alkaline soap can help the skin in opening pores and dirt that sticks to the skin, bound by foam contained in the soap (Setyoningrum, 2010).
Figure 3: pH value of transparent solid soap at different type of oils. The notation followed by the same letter shows no difference (LSD0.05 = 0.26 and coefficient of variation = 2.65%).
The pH on VCO is lower than that of palm oil. It
is thought that the difference in the fatty acid carbon chain can affect the low VCO pH value. Addition of weak fatty acids, such as citric acid, can reduce the pH of soap (Wasitaatmadja, 1997). Fatty acids in VCO (lauric acid) have shorter chains when compared to fatty acids in palm oil (palmitic acid). This pH instability is most likely caused by a heating factor, due to the hydrolysis of the active ingredient of sodium ester with fatty acids so that it can cause free alkali which can increase the pH of soap (Nurhadi, 2012).
3.2 Physical Properties of Transparent Solid Soap
The production of transparent soap made with various concentration of cananga oil were made on the basis of 300 g. During the production, the soap loses 100g. This was expected due to the amount of foam produced before the printing process so that a lot of foam was removed when the foam was separated with the soap mixture. The resulting soap can be said transparent if when the soap is placed on paper with
12 font size, the letters can be read clearly. The transparent soap produced in each treatment can be seen in Figure 4.
Figure 4: Transparent soaps made from: 1) virgin coconut oil and 2) palm oil at various concentration of cananga oil.
Based on Figure 4 the VCO soap is more transparent compared to the palm oil soap. Transparent soap can be produced in several different ways. One of the oldest methods is by dissolving the soap in alcohol with gentle heating to make a clear solution which is then given a fragrance and coloring. The color of the bar soap depends on the choice of starting material and if good quality soap is not used, it is likely that the final product will be very yellow in color (Williams, 2002). The basic ingredients of VCO soap have a clear color while palm oil has a yellowish color. This is thought to be the cause of the transparent soap from VCO becoming more clear when compared to palm oil.
3.2.1 Hardness
The hardness of transparent solid soap can be influenced by saturated fatty acids which are used as raw materials in making transparent solid soap. The results of variance indicate that the type of oil affects the hardness in soap. Hardness of transparent solid soap can be seen in Figure 5.
From Figure 5, the type of oil in this study affects the value of soap hardness. Factors affecting the hardness of saturated fatty acids and water content values (Widyasanti, 2016). The highest saturated fatty acid in palm oil is palmitate acid, and VCO is lauric acid. Saturated fatty acids are fatty acids that do not have double bonds, saturated fatty acids are usually solid at room temperature, so it will produce a harder soap (Gusviputri et al., 2013). The longer the
A 0% and B 0.5% A 0% and B 0.5%
C 1% and D 1.5% C 1% and D 1.5%
1 2
Quality Characteristics and Antibacterial Activity of Transparent Solid Soap with Addition of Cananga Oil (Cananga odorata)
111
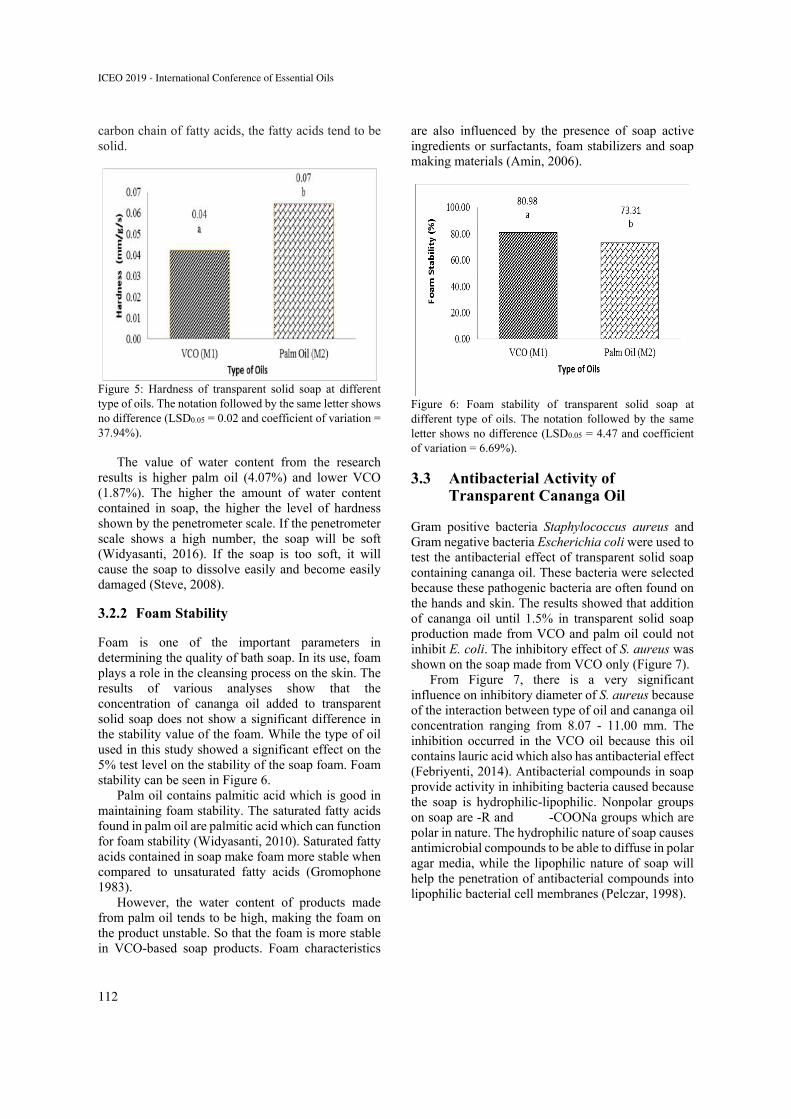
carbon chain of fatty acids, the fatty acids tend to be solid.
Figure 5: Hardness of transparent solid soap at different type of oils. The notation followed by the same letter shows no difference (LSD0.05 = 0.02 and coefficient of variation = 37.94%).
The value of water content from the research results is higher palm oil (4.07%) and lower VCO (1.87%). The higher the amount of water content contained in soap, the higher the level of hardness shown by the penetrometer scale. If the penetrometer scale shows a high number, the soap will be soft (Widyasanti, 2016). If the soap is too soft, it will cause the soap to dissolve easily and become easily damaged (Steve, 2008).
3.2.2 Foam Stability
Foam is one of the important parameters in determining the quality of bath soap. In its use, foam plays a role in the cleansing process on the skin. The results of various analyses show that the concentration of cananga oil added to transparent solid soap does not show a significant difference in the stability value of the foam. While the type of oil used in this study showed a significant effect on the 5% test level on the stability of the soap foam. Foam stability can be seen in Figure 6.
Palm oil contains palmitic acid which is good in maintaining foam stability. The saturated fatty acids found in palm oil are palmitic acid which can function for foam stability (Widyasanti, 2010). Saturated fatty acids contained in soap make foam more stable when compared to unsaturated fatty acids (Gromophone 1983).
However, the water content of products made from palm oil tends to be high, making the foam on the product unstable. So that the foam is more stable in VCO-based soap products. Foam characteristics
are also influenced by the presence of soap active ingredients or surfactants, foam stabilizers and soap making materials (Amin, 2006).
Figure 6: Foam stability of transparent solid soap at different type of oils. The notation followed by the same letter shows no difference (LSD0.05 = 4.47 and coefficient of variation = 6.69%).
3.3 Antibacterial Activity of Transparent Cananga Oil
Gram positive bacteria Staphylococcus aureus and Gram negative bacteria Escherichia coli were used to test the antibacterial effect of transparent solid soap containing cananga oil. These bacteria were selected because these pathogenic bacteria are often found on the hands and skin. The results showed that addition of cananga oil until 1.5% in transparent solid soap production made from VCO and palm oil could not inhibit E. coli. The inhibitory effect of S. aureus was shown on the soap made from VCO only (Figure 7).
From Figure 7, there is a very significant influence on inhibitory diameter of S. aureus because of the interaction between type of oil and cananga oil concentration ranging from 8.07 - 11.00 mm. The inhibition occurred in the VCO oil because this oil contains lauric acid which also has antibacterial effect (Febriyenti, 2014). Antibacterial compounds in soap provide activity in inhibiting bacteria caused because the soap is hydrophilic-lipophilic. Nonpolar groups on soap are -R and -COONa groups which are polar in nature. The hydrophilic nature of soap causes antimicrobial compounds to be able to diffuse in polar agar media, while the lipophilic nature of soap will help the penetration of antibacterial compounds into lipophilic bacterial cell membranes (Pelczar, 1998).
ICEO 2019 - International Conference of Essential Oils
112
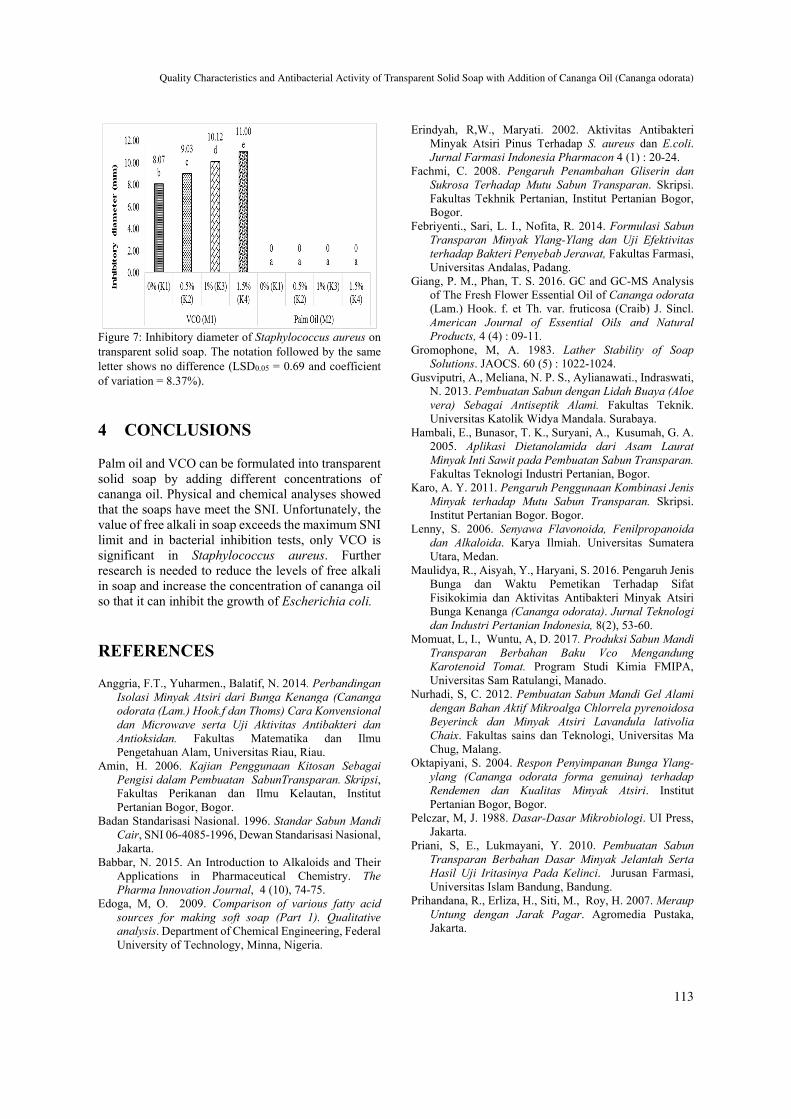
Figure 7: Inhibitory diameter of Staphylococcus aureus on transparent solid soap. The notation followed by the same letter shows no difference (LSD0.05 = 0.69 and coefficient of variation = 8.37%).
4 CONCLUSIONS
Palm oil and VCO can be formulated into transparent solid soap by adding different concentrations of cananga oil. Physical and chemical analyses showed that the soaps have meet the SNI. Unfortunately, the value of free alkali in soap exceeds the maximum SNI limit and in bacterial inhibition tests, only VCO is significant in Staphylococcus aureus. Further research is needed to reduce the levels of free alkali in soap and increase the concentration of cananga oil so that it can inhibit the growth of Escherichia coli.
REFERENCES
Anggria, F.T., Yuharmen., Balatif, N. 2014. Perbandingan Isolasi Minyak Atsiri dari Bunga Kenanga (Cananga odorata (Lam.) Hook.f dan Thoms) Cara Konvensional dan Microwave serta Uji Aktivitas Antibakteri dan Antioksidan. Fakultas Matematika dan Ilmu Pengetahuan Alam, Universitas Riau, Riau.
Amin, H. 2006. Kajian Penggunaan Kitosan Sebagai Pengisi dalam Pembuatan SabunTransparan. Skripsi, Fakultas Perikanan dan Ilmu Kelautan, Institut Pertanian Bogor, Bogor.
Badan Standarisasi Nasional. 1996. Standar Sabun Mandi Cair, SNI 06-4085-1996, Dewan Standarisasi Nasional, Jakarta.
Babbar, N. 2015. An Introduction to Alkaloids and Their Applications in Pharmaceutical Chemistry. The Pharma Innovation Journal, 4 (10), 74-75.
Edoga, M, O. 2009. Comparison of various fatty acid sources for making soft soap (Part 1). Qualitative analysis. Department of Chemical Engineering, Federal University of Technology, Minna, Nigeria.
Erindyah, R,W., Maryati. 2002. Aktivitas Antibakteri Minyak Atsiri Pinus Terhadap S. aureus dan E.coli. Jurnal Farmasi Indonesia Pharmacon 4 (1) : 20-24.
Fachmi, C. 2008. Pengaruh Penambahan Gliserin dan Sukrosa Terhadap Mutu Sabun Transparan. Skripsi. Fakultas Tekhnik Pertanian, Institut Pertanian Bogor, Bogor.
Febriyenti., Sari, L. I., Nofita, R. 2014. Formulasi Sabun Transparan Minyak Ylang-Ylang dan Uji Efektivitas terhadap Bakteri Penyebab Jerawat, Fakultas Farmasi, Universitas Andalas, Padang.
Giang, P. M., Phan, T. S. 2016. GC and GC-MS Analysis of The Fresh Flower Essential Oil of Cananga odorata (Lam.) Hook. f. et Th. var. fruticosa (Craib) J. Sincl. American Journal of Essential Oils and Natural Products, 4 (4) : 09-11.
Gromophone, M, A. 1983. Lather Stability of Soap Solutions. JAOCS. 60 (5) : 1022-1024.
Gusviputri, A., Meliana, N. P. S., Aylianawati., Indraswati, N. 2013. Pembuatan Sabun dengan Lidah Buaya (Aloe vera) Sebagai Antiseptik Alami. Fakultas Teknik. Universitas Katolik Widya Mandala. Surabaya.
Hambali, E., Bunasor, T. K., Suryani, A., Kusumah, G. A. 2005. Aplikasi Dietanolamida dari Asam Laurat Minyak Inti Sawit pada Pembuatan Sabun Transparan. Fakultas Teknologi Industri Pertanian, Bogor.
Karo, A. Y. 2011. Pengaruh Penggunaan Kombinasi Jenis Minyak terhadap Mutu Sabun Transparan. Skripsi. Institut Pertanian Bogor. Bogor.
Lenny, S. 2006. Senyawa Flavonoida, Fenilpropanoida dan Alkaloida. Karya Ilmiah. Universitas Sumatera Utara, Medan.
Maulidya, R., Aisyah, Y., Haryani, S. 2016. Pengaruh Jenis Bunga dan Waktu Pemetikan Terhadap Sifat Fisikokimia dan Aktivitas Antibakteri Minyak Atsiri Bunga Kenanga (Cananga odorata). Jurnal Teknologi dan Industri Pertanian Indonesia, 8(2), 53-60.
Momuat, L, I., Wuntu, A, D. 2017. Produksi Sabun Mandi Transparan Berbahan Baku Vco Mengandung Karotenoid Tomat. Program Studi Kimia FMIPA, Universitas Sam Ratulangi, Manado.
Nurhadi, S, C. 2012. Pembuatan Sabun Mandi Gel Alami dengan Bahan Aktif Mikroalga Chlorrela pyrenoidosa Beyerinck dan Minyak Atsiri Lavandula lativolia Chaix. Fakultas sains dan Teknologi, Universitas Ma Chug, Malang.
Oktapiyani, S. 2004. Respon Penyimpanan Bunga Ylang-ylang (Cananga odorata forma genuina) terhadap Rendemen dan Kualitas Minyak Atsiri. Institut Pertanian Bogor, Bogor.
Pelczar, M, J. 1988. Dasar-Dasar Mikrobiologi. UI Press, Jakarta.
Priani, S, E., Lukmayani, Y. 2010. Pembuatan Sabun Transparan Berbahan Dasar Minyak Jelantah Serta Hasil Uji Iritasinya Pada Kelinci. Jurusan Farmasi, Universitas Islam Bandung, Bandung.
Prihandana, R., Erliza, H., Siti, M., Roy, H. 2007. Meraup Untung dengan Jarak Pagar. Agromedia Pustaka, Jakarta.
Quality Characteristics and Antibacterial Activity of Transparent Solid Soap with Addition of Cananga Oil (Cananga odorata)
113
Rahmanto, A., 2011. Pemanfaatan Minyak Jarak Pagar (Jatropha curcas, Linn) Sebagai Komponen Sediaan dalam Formulasi Produk Hand and Body Cream. Program Studi Teknologi Industri Pertanian Pascasarjana, Institut Pertanian Bogor, Bogor.
Roslan, A, N., Sunariani, J., Irmawati, A. 2009. Penurunan Sensitivitas Rasa Manis Akibat Pemakaian Pasta Gigi yang Mengandung Sodium Lauryl Sulphate 5%. Jurnal Persatuan Dokter Gigi Indonesia Vol 58 (2) : 10-13.
Rozi, M., Sulaiman, T, N, S., Indrayudha, P. 2013. Formulasi Sediaan Sabun Mandi Transparan Minyak Atsiri Jeruk Nipis (Citrus Aurantifolia) Dengan Cocamid Dea Sebagai Surfaktan. Fakultas Farmasi, Universitas Muhammadiyah Surakarta.
Setyoningrum., Maharani, E, N. 2010. Optimasi Formula Sabun Transparan dengan Fase Minyak Virgin Coconut Oil dan Surfaktan Cocoamidopropil Betaine. Fakultas Farmasi, Universitas Sanata Dharma, Yogyakarta.
Sotyati. 2016. Kenanga, Flora Identitas Aceh. http://www.satuharapan.com/read detail/read/kenanga-flora-identitas-aceh-kaya-manfaat.16 Desember 2019.
Steve., 2008. Saponification Table Plus The Characteristics of Oils in Soap. USA. http://www.soap-making-resource.com/saponification-table.html. 19 Desember 2019.
Tan, L. T. H., Learn, H. L., Wai, F. Y., Chim, K. C., Habsah, A. K., Kok, G. C., Bey, H. G. 2015. Traditional Uses, Phytochemistry, and Bioactivities of Cananga odprata (Ylang-Ylang). Evidence-Based Complementary and Alternative Medicine : 1-30.
Wasitaatmadja, S. M. 1997. Penuntun Ilmu Kosmetik Medik. Universitas Indonesia, Jakarta.
Widyasanti, A., Farddani, C, L., Rohdiana, D. 2016. Pembuatan Sabun Padat Transparan Menggunakan Minyak Kelapa Sawit (Palm Oil) dengan Penambahan Bahan Aktif Ekstrak Teh Putih (Camellia sinensis). Fakultas Teknologi Industri Pertanian Universitas Padjadjaran, Bandung.
Wijana, S., Tika, P., Nur, L. R. 2019. Optimization of Solubilizers Combinations on The Transparent Liquid Soap with The Addition of Peppermint (Mentha piperita L.) and Lavender (Lavandula L.) Oil. AIP Conference Proceedings 2120, 050020 (2019).
Williams, D, F., Schmitt, W, H. 2002. Kimia dan Teknologi Industri Kosmetika dan Produk-produk Perawatan Diri. Fakultas Teknologi Pertanian,IPB. Bogor.
ICEO 2019 - International Conference of Essential Oils
114
Evaluation of Antibacterial and Antioxidant Effects of Mix Essential Oil for Oral Health Care
Juniarti1,2,3, Moch Abdussalam3, Indah Permata Yuda3 and Indra Kusuma2,4,5 1 Biochemistry Department, Faculty of Medicine, YARSI University, Jakarta, Indonesia
2 Magister of Biomedical Science, Graduate School, YARSI University 3 Herbal Research Center, YARSI University, Jakarta, Indonesia
4 Physiology Department, Faculty of Medicine, YARSI University, Jakarta, Indonesia 5 Stem Cell Research Center, YARSI University, Jakarta, Indonesia
Keywords: Mix essential oil, antioxidant, antibacterial
Abstract: Essential oil have some antioxidant and antimicrobial properties. The aim of this study was to determine the chemical compounds, antioxidant and antimicrobial activities of essential oil. The analysis of the mix essential oil was carried out using gas chromatography mass Spectrometry. The antioxidant activity of the essential oil was also evaluated using 2,2-diphenyl-1-picrylhydrazyl (DPPH) radical scavenging assay. Antimicrobial properties of the essential oil were assessed against Enterococcus faecalis, Streptococcus mutans, Streptococcus sanguinis using the disk diffusion method. Free radical scavenging potentials showed values for IC50 in 194 µg/ml for mix essential oil, which are close to the natural antioxidant (ascorbic acid) with an IC50 of 2.98 µg/mL. The major of mix essential oil were α-pinene (24.54%), D-limonen (18.00%), cis-1-methyl-4-(1-methylethenyi)-l-cyclohexane (14.95%), 3-carene (8.92%), L-menthone (8.26) and β-pinene (5.72%).
1 INTRODUCTION
In the 21st century, multidrug resistant antibiotic is widely recognized as a serious threat to global health (Martelli and Giacomini, 2018.) According to World Health Organization (WHO) data in 2017, the most dangerous multidrug-resistant to which new antibiotics should be highly discovered (World Health Organization, 2017). The discovery of new antibiotics agents was mainly from natural product (Jackson et al., 2018). Natural products have been a source of medicinal agents and traditional medicine system that have been used for thousands of years in many countries (Dias et al., 2012; Newan and Cragg, 2016). Natural antimicrobial and antioxidant agents can be obtained from different sources including plants, bacteria, algae animals, and fungi, but there has been an increased interest in plant-based active compound as an alternative to the common antibiotics (Rossiter et al., 2017; Helal et al., 2019).
Essential oil of many plant special have become popular in recent years. Essential oils are volatile natural mixtures extracted from different plant parts (seeds, flowers, buds, leaves, twigs, bark, herbs,
wood and roots), and are composed of terpenoid structures with broad activities (Seow et al., 2014). Plant essential oils are also well-known to be the rich sources of bioactive compounds. They are use as alternative medicines, particulary as anti-inflammatoty, antimicrobial, analgesic, antipasmodic, anthelmintic, antipruritic and many other theraperutic (Bakkali et al., 2008; Jaradat et al., 2017). Nowadays, essential oils are used broadly in preservatives in food and beverages industry, cosmetics and pharmaceutical products (Seow et al., 2014; Bakkali et al., 2008). Research on the use and efficacy of essential oils significantly contribute to the disclosure of their therapeutic properties, so that they are frequently prescribed, even if their chemical constituents are not always completely knowns. Therefore, in this study the antimicrobial and antioxidant activities of essential oils are the subjects of particular interest. Evaluation of antioxidant properties and antimicrobial activity against different oral bacteria.
Juniarti, Abdussalam, M., Permata Yuda, I. and Kusuma, I.Evaluation of Antibacterial and Antioxidant Effects of Mix Essential Oil for Oral Health Care.In Proceedings of the 2nd International Conference of Essential Oils (ICEO 2019), pages 115-118ISBN: 978-989-758-456-5Copyright © 2020 by SCITEPRESS – Science and Technology Publications, Lda. All rights reserved
115
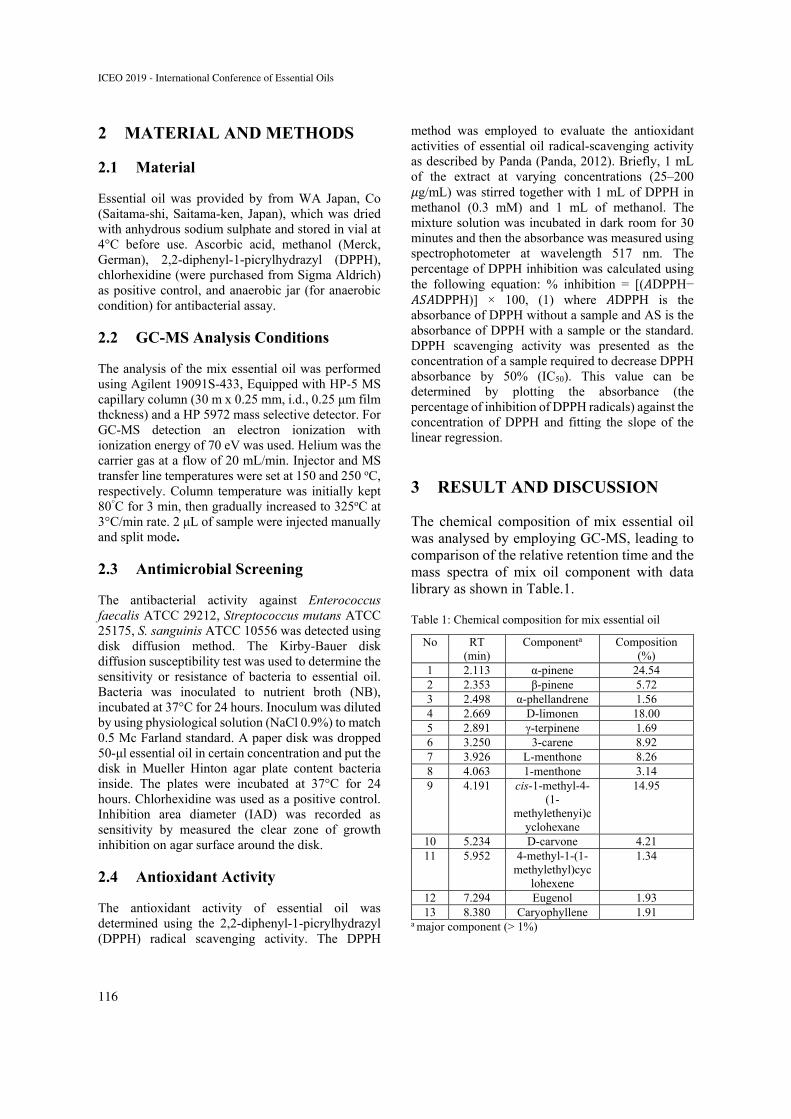
2 MATERIAL AND METHODS
2.1 Material
Essential oil was provided by from WA Japan, Co (Saitama-shi, Saitama-ken, Japan), which was dried with anhydrous sodium sulphate and stored in vial at 4°C before use. Ascorbic acid, methanol (Merck, German), 2,2-diphenyl-1-picrylhydrazyl (DPPH), chlorhexidine (were purchased from Sigma Aldrich) as positive control, and anaerobic jar (for anaerobic condition) for antibacterial assay.
2.2 GC-MS Analysis Conditions
The analysis of the mix essential oil was performed using Agilent 19091S-433, Equipped with HP-5 MS capillary column (30 m x 0.25 mm, i.d., 0.25 μm film thckness) and a HP 5972 mass selective detector. For GC-MS detection an electron ionization with ionization energy of 70 eV was used. Helium was the carrier gas at a flow of 20 mL/min. Injector and MS transfer line temperatures were set at 150 and 250 oC, respectively. Column temperature was initially kept 80°C for 3 min, then gradually increased to 325oC at 3°C/min rate. 2 μL of sample were injected manually and split mode.
2.3 Antimicrobial Screening
The antibacterial activity against Enterococcus faecalis ATCC 29212, Streptococcus mutans ATCC 25175, S. sanguinis ATCC 10556 was detected using disk diffusion method. The Kirby-Bauer disk diffusion susceptibility test was used to determine the sensitivity or resistance of bacteria to essential oil. Bacteria was inoculated to nutrient broth (NB), incubated at 37°C for 24 hours. Inoculum was diluted by using physiological solution (NaCl 0.9%) to match 0.5 Mc Farland standard. A paper disk was dropped 50-μl essential oil in certain concentration and put the disk in Mueller Hinton agar plate content bacteria inside. The plates were incubated at 37°C for 24 hours. Chlorhexidine was used as a positive control. Inhibition area diameter (IAD) was recorded as sensitivity by measured the clear zone of growth inhibition on agar surface around the disk.
2.4 Antioxidant Activity
The antioxidant activity of essential oil was determined using the 2,2-diphenyl-1-picrylhydrazyl (DPPH) radical scavenging activity. The DPPH
method was employed to evaluate the antioxidant activities of essential oil radical-scavenging activity as described by Panda (Panda, 2012). Briefly, 1 mL of the extract at varying concentrations (25–200
g/mL) was stirred together with 1 mL of DPPH in methanol (0.3 mM) and 1 mL of methanol. The mixture solution was incubated in dark room for 30 minutes and then the absorbance was measured using spectrophotometer at wavelength 517 nm. The percentage of DPPH inhibition was calculated using the following equation: % inhibition = [( DPPH−
DPPH)] × 100, (1) where DPPH is the absorbance of DPPH without a sample and AS is the absorbance of DPPH with a sample or the standard. DPPH scavenging activity was presented as the concentration of a sample required to decrease DPPH absorbance by 50% (IC50). This value can be determined by plotting the absorbance (the percentage of inhibition of DPPH radicals) against the concentration of DPPH and fitting the slope of the linear regression.
3 RESULT AND DISCUSSION
The chemical composition of mix essential oil was analysed by employing GC-MS, leading to comparison of the relative retention time and the mass spectra of mix oil component with data library as shown in Table.1.
Table 1: Chemical composition for mix essential oil
No RT (min)
Componenta Composition (%)
1 2.113 α-pinene 24.54 2 2.353 β-pinene 5.72 3 2.498 α-phellandrene 1.56 4 2.669 D-limonen 18.00 5 2.891 γ-terpinene 1.69 6 3.250 3-carene 8.92 7 3.926 L-menthone 8.26 8 4.063 1-menthone 3.14 9 4.191 cis-1-methyl-4-
(1-methylethenyi)c
yclohexane
14.95
10 5.234 D-carvone 4.21 11 5.952 4-methyl-1-(1-
methylethyl)cyclohexene
1.34
12 7.294 Eugenol 1.93 13 8.380 Caryophyllene 1.91
a major component (> 1%)
ICEO 2019 - International Conference of Essential Oils
116
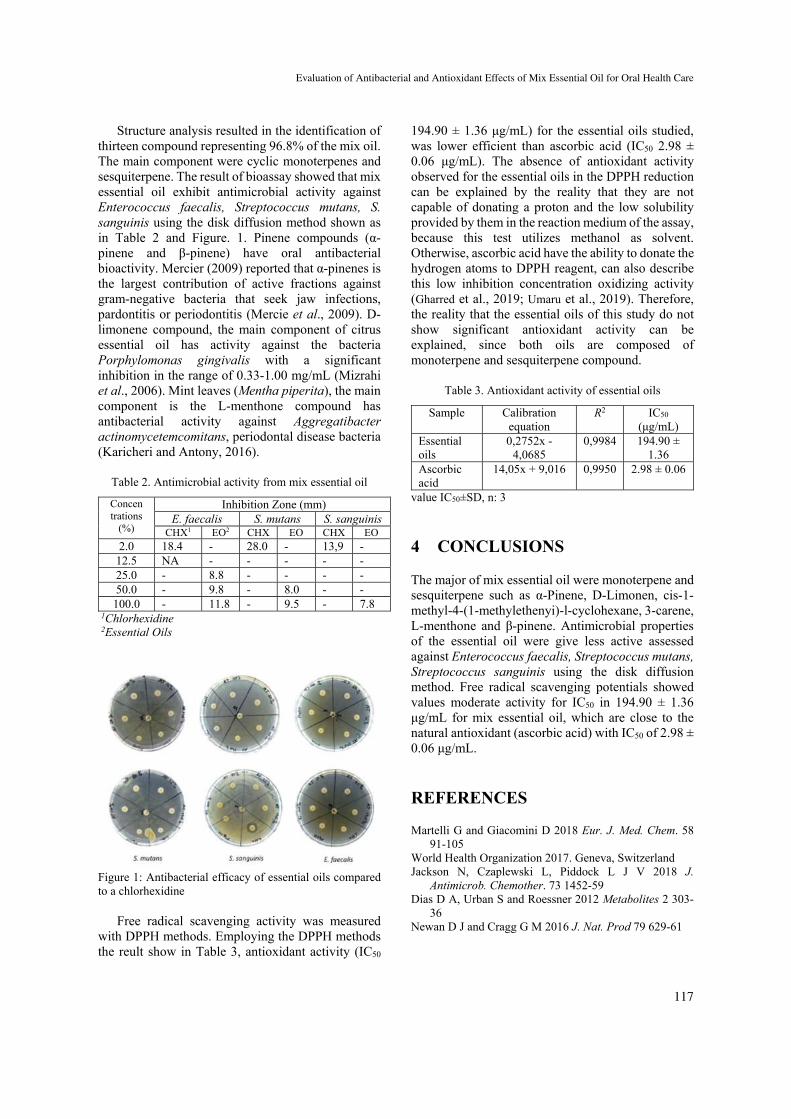
Structure analysis resulted in the identification of thirteen compound representing 96.8% of the mix oil. The main component were cyclic monoterpenes and sesquiterpene. The result of bioassay showed that mix essential oil exhibit antimicrobial activity against Enterococcus faecalis, Streptococcus mutans, S. sanguinis using the disk diffusion method shown as in Table 2 and Figure. 1. Pinene compounds (α-pinene and β-pinene) have oral antibacterial bioactivity. Mercier (2009) reported that α-pinenes is the largest contribution of active fractions against gram-negative bacteria that seek jaw infections, pardontitis or periodontitis (Mercie et al., 2009). D-limonene compound, the main component of citrus essential oil has activity against the bacteria Porphylomonas gingivalis with a significant inhibition in the range of 0.33-1.00 mg/mL (Mizrahi et al., 2006). Mint leaves (Mentha piperita), the main component is the L-menthone compound has antibacterial activity against Aggregatibacter actinomycetemcomitans, periodontal disease bacteria (Karicheri and Antony, 2016).
Table 2. Antimicrobial activity from mix essential oil
Concen trations
(%)
Inhibition Zone (mm) E. faecalis S. mutans S. sanguinis
CHX1 EO2 CHX EO CHX EO 2.0 18.4 - 28.0 - 13,9 -
12.5 NA - - - - - 25.0 - 8.8 - - - - 50.0 - 9.8 - 8.0 - - 100.0 - 11.8 - 9.5 - 7.8
1Chlorhexidine 2Essential Oils
Figure 1: Antibacterial efficacy of essential oils compared to a chlorhexidine
Free radical scavenging activity was measured with DPPH methods. Employing the DPPH methods the reult show in Table 3, antioxidant activity (IC50
194.90 ± 1.36 μg/mL) for the essential oils studied, was lower efficient than ascorbic acid (IC50 2.98 ± 0.06 μg/mL). The absence of antioxidant activity observed for the essential oils in the DPPH reduction can be explained by the reality that they are not capable of donating a proton and the low solubility provided by them in the reaction medium of the assay, because this test utilizes methanol as solvent. Otherwise, ascorbic acid have the ability to donate the hydrogen atoms to DPPH reagent, can also describe this low inhibition concentration oxidizing activity (Gharred et al., 2019; Umaru et al., 2019). Therefore, the reality that the essential oils of this study do not show significant antioxidant activity can be explained, since both oils are composed of monoterpene and sesquiterpene compound.
Table 3. Antioxidant activity of essential oils
Sample Calibration equation
R2 IC50 (μg/mL)
Essential oils
0,2752x - 4,0685
0,9984 194.90 ± 1.36
Ascorbic acid
14,05x + 9,016 0,9950 2.98 ± 0.06
value IC50±SD, n: 3
4 CONCLUSIONS
The major of mix essential oil were monoterpene and sesquiterpene such as α-Pinene, D-Limonen, cis-1-methyl-4-(1-methylethenyi)-l-cyclohexane, 3-carene, L-menthone and β-pinene. Antimicrobial properties of the essential oil were give less active assessed against Enterococcus faecalis, Streptococcus mutans, Streptococcus sanguinis using the disk diffusion method. Free radical scavenging potentials showed values moderate activity for IC50 in 194.90 ± 1.36 μg/mL for mix essential oil, which are close to the natural antioxidant (ascorbic acid) with IC50 of 2.98 ± 0.06 μg/mL.
REFERENCES
Martelli G and Giacomini D 2018 Eur. J. Med. Chem. 58 91-105
World Health Organization 2017. Geneva, Switzerland Jackson N, Czaplewski L, Piddock L J V 2018 J.
Antimicrob. Chemother. 73 1452-59 Dias D A, Urban S and Roessner 2012 Metabolites 2 303-
36 Newan D J and Cragg G M 2016 J. Nat. Prod 79 629-61
Evaluation of Antibacterial and Antioxidant Effects of Mix Essential Oil for Oral Health Care
117
Rossiter S E, Fletcher M H and Wuest W M 2017 Chem. Rev. 117 12415-74
Helal I M, Bessoumy A E, Bataineh E A, Joseph M R P, Rajagopalan P, Chandramoorthy H C and Ahmed S B H 2019 Hindawi 2019 1-9.
Seow YX, Yeo CR, Chung HL and Yuk HG 2014. Critical Rev. in Food Sci. and Nutrition 54 625-44.
Bakkali F, Averbeck S, Averbeck D and Idaomar M 2008 Food and Chemical Toxicology 46 446-75.
Jaradat N, Adwan L, K’aibni S, Zaid A N, Shatya M J Y, Shraim N and Assali M 2017 BioMed Re.s Intern. 2017 1-9
Panda S K 2012 Antioxidant Enzym (Egypt: IntechOpen) p 381-400
Mercie B, Prost J and Prost M 2009 Int J Occup Med Environ. Health 22 331-42
Mizrahi B, Shapira L, Domb A J and Houri Haddad Y 2006 J. Periodontol 77 963-8
Karicheri R and Antony B 2016 European Journal of Pharma. and Med. Res. 3 577-81
Gharred N, Dbeibia A, Falconieri D, Hammami S, Piras A and Dridi S D 2019 J Ess. Oil Res. 2019 1-8
Umaru I J, Badruddin F A and Umaru H A 2019 Bio. Res. Int 2019 1-8.
ICEO 2019 - International Conference of Essential Oils
118
Esterification of Rhodinol Fraction with Acetic Anhydride using Zeolite Catalyst
Gadis Dian Anggreini1, Mafud Cahayo1, Masruri2, and Warsito1,2
1Essential Oil’s Institute, Brawijaya University, Jl. Veteran Malang 65145, Malang, Indonesia 2Department of Chemistry, Faculty of Science, Brawijaya University, Jl. Veteran Malang 65145, Malang, Indonesia
Keywords: Esterification, Rhodinol, Java Citronella Oil, Acetic Anhydride, Zeolite.
Abstract: This research has been conducted on the effect of esterification reaction in the chemical composition of rhodinol fraction from java citronella oil (Cymbopogon winterianus). The reaction process in this research is done at 230 ° C by using rhodinol fraction and acetic anhydride with zeolite as a catalyst. Based on the research, the optimum reaction time is 1 hour and the optimum mole ratio of reactants is 1: 1. The% yield of citronellyl acetate and geranyl acetate are 74.06% and 95.92%.
1 INTRODUCTION
Indonesia is a country rich in the diversity of essential oil-producing plants. As many as 40 types of essential oils produced from these plants have been traded and one type of essential oil that has the potential to be developed commercially is citronella oil (Gunawan, 2009).
Citronella oil consists of 40 components, but the identity of citronella oil scent is only determined by three compounds namely citronellal, citronellol, and geraniol (Kaul et al., 1997).
Citronellal, citronellol, and geraniol are single components that have a higher selling price than fragrant citronella essential oils in the form of crude oil (Aldrich, 2019). Separation of fragrant citronella oil using batch scale vacuum fractionation distillation has been able to separate the citronellal fraction and rhodinol fraction (a mixture of citronellol and geraniol) (Eden et al., 2018).
Citronellol and geraniol can be further enhanced for its selling value by converting them into compounds that are widely used in the food, cosmetics and pharmaceutical industries, namely citronellyl acetate and geranyl acetate (Claon and Akoh, 1993).
Citronellyl acetate and geranyl acetate are ester compounds that can be synthesized through an esterification reaction between an acidic compound and alcohol using an acid catalyst (Fessenden and Fessenden, 1999). The HZSM-5 zeolite catalyst was
used in a previous study to synthesize isopentyl acetate and succeeded in obtaining a yield of 95.1% (Ma et al., 1996)
Therefore, to increase the higher selling value of the rhodinol fraction obtained from citronella oil, it is necessary to esterify the rhodinol fraction to obtain citronellyl acetate and geranyl acetate.
2 METHOD
2.1 Esterification of Rhodinol Fraction
Rhodinol of 10 mL (citronellol = 0.02 mole and geraniol = 0.01 mole) were taken into a 20 mL boiling flask flat and then added 2.92 mL of acetic anhydride (0.03 mole) and 0.14 g of zeolite. after that, the flask is heated at 130°C with stirring using a magnetic stirrer and after 1 hour the catalyst can be separated by filtering.
The organic liquid from the previous reaction is washed with distilled water repeatedly until the pH of the water phase is equal to 7. after that, the organic phase is separated and weighed.
The same method is used to find out the optimum reflux times by repeating the previous method with the variation of reflux time (2 hours and 3 hours). The reflux time method that produces optimum citronellyl acetate and geranyl acetate products is used to find out the optimum mole ratio of acetic anhydride (0.06 mole and 0.9 moles) for this esterification reaction.
Dian Anggreini, G., Cahayo, M., Masruri and WarsitoEsterification of Rhodinol Fraction with Acetic Anhydride using Zeolite Catalyst.In Proceedings of the 2nd International Conference of Essential Oils (ICEO 2019), pages 119-122ISBN: 978-989-758-456-5Copyright © 2020 by SCITEPRESS – Science and Technology Publications, Lda. All rights reserved
119
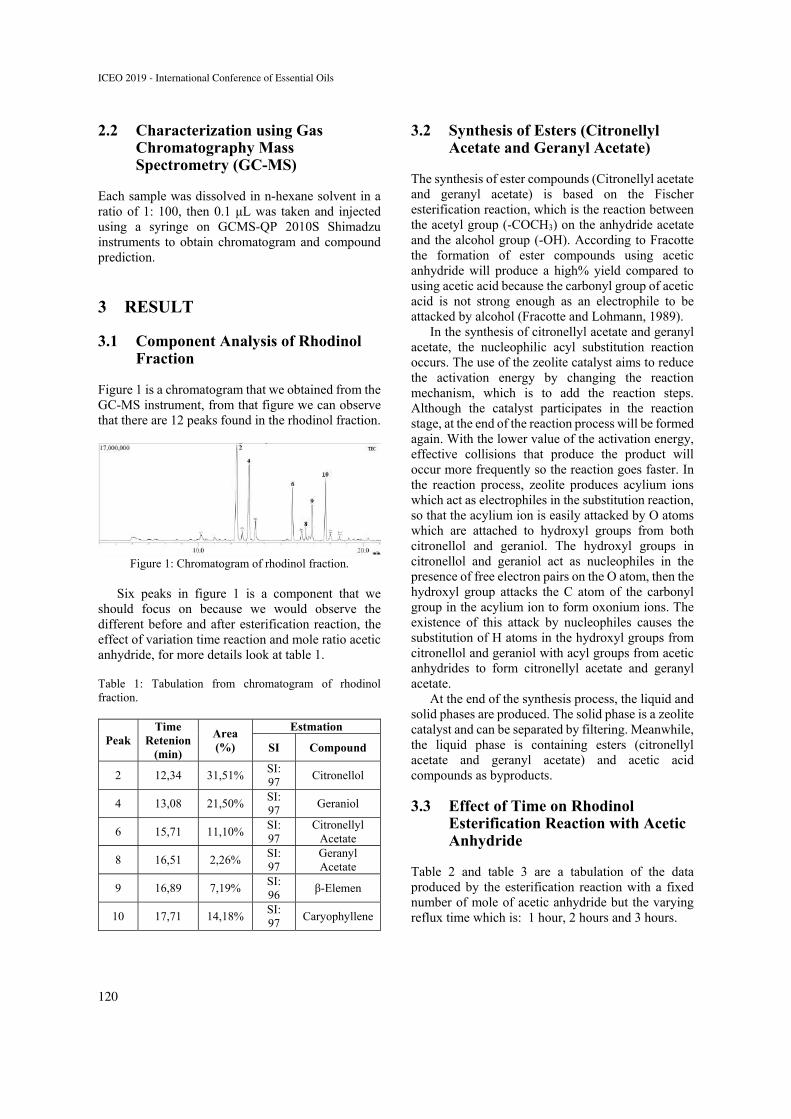
2.2 Characterization using Gas Chromatography Mass Spectrometry (GC-MS)
Each sample was dissolved in n-hexane solvent in a ratio of 1: 100, then 0.1 μL was taken and injected using a syringe on GCMS-QP 2010S Shimadzu instruments to obtain chromatogram and compound prediction.
3 RESULT
3.1 Component Analysis of Rhodinol Fraction
Figure 1 is a chromatogram that we obtained from the GC-MS instrument, from that figure we can observe that there are 12 peaks found in the rhodinol fraction.
Figure 1: Chromatogram of rhodinol fraction.
Six peaks in figure 1 is a component that we
should focus on because we would observe the different before and after esterification reaction, the effect of variation time reaction and mole ratio acetic anhydride, for more details look at table 1.
Table 1: Tabulation from chromatogram of rhodinol fraction.
Peak Time
Retenion (min)
Area (%)
Estmation
SI Compound
2 12,34 31,51% SI: 97
Citronellol
4 13,08 21,50% SI: 97
Geraniol
6 15,71 11,10% SI: 97
Citronellyl Acetate
8 16,51 2,26% SI: 97
Geranyl Acetate
9 16,89 7,19% SI: 96
β-Elemen
10 17,71 14,18% SI: 97
Caryophyllene
3.2 Synthesis of Esters (Citronellyl Acetate and Geranyl Acetate)
The synthesis of ester compounds (Citronellyl acetate and geranyl acetate) is based on the Fischer esterification reaction, which is the reaction between the acetyl group (-COCH3) on the anhydride acetate and the alcohol group (-OH). According to Fracotte the formation of ester compounds using acetic anhydride will produce a high% yield compared to using acetic acid because the carbonyl group of acetic acid is not strong enough as an electrophile to be attacked by alcohol (Fracotte and Lohmann, 1989).
In the synthesis of citronellyl acetate and geranyl acetate, the nucleophilic acyl substitution reaction occurs. The use of the zeolite catalyst aims to reduce the activation energy by changing the reaction mechanism, which is to add the reaction steps. Although the catalyst participates in the reaction stage, at the end of the reaction process will be formed again. With the lower value of the activation energy, effective collisions that produce the product will occur more frequently so the reaction goes faster. In the reaction process, zeolite produces acylium ions which act as electrophiles in the substitution reaction, so that the acylium ion is easily attacked by O atoms which are attached to hydroxyl groups from both citronellol and geraniol. The hydroxyl groups in citronellol and geraniol act as nucleophiles in the presence of free electron pairs on the O atom, then the hydroxyl group attacks the C atom of the carbonyl group in the acylium ion to form oxonium ions. The existence of this attack by nucleophiles causes the substitution of H atoms in the hydroxyl groups from citronellol and geraniol with acyl groups from acetic anhydrides to form citronellyl acetate and geranyl acetate.
At the end of the synthesis process, the liquid and solid phases are produced. The solid phase is a zeolite catalyst and can be separated by filtering. Meanwhile, the liquid phase is containing esters (citronellyl acetate and geranyl acetate) and acetic acid compounds as byproducts.
3.3 Effect of Time on Rhodinol Esterification Reaction with Acetic Anhydride
Table 2 and table 3 are a tabulation of the data produced by the esterification reaction with a fixed number of mole of acetic anhydride but the varying reflux time which is: 1 hour, 2 hours and 3 hours.
ICEO 2019 - International Conference of Essential Oils
120
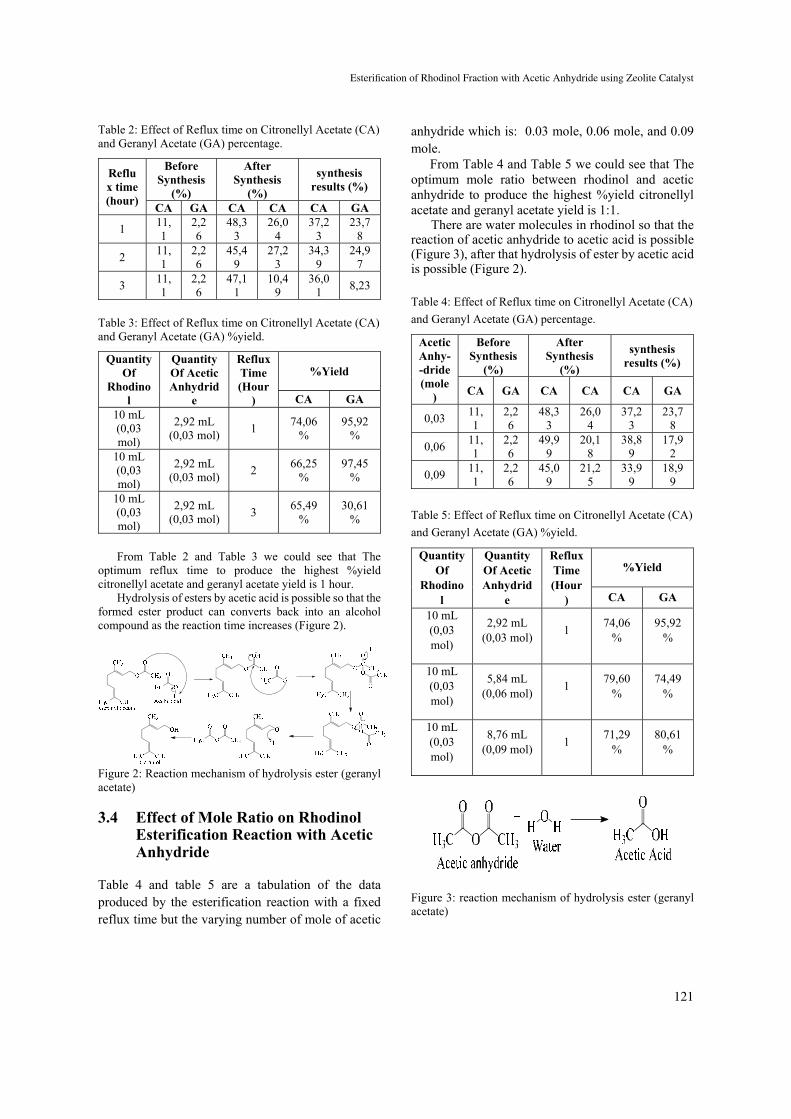
Table 2: Effect of Reflux time on Citronellyl Acetate (CA) and Geranyl Acetate (GA) percentage.
Reflux time (hour)
Before Synthesis
(%)
After Synthesis
(%)
synthesis results (%)
CA GA CA CA CA GA
1 11,1
2,26
48,33
26,04
37,23
23,78
2 11,1
2,26
45,49
27,23
34,39
24,97
3 11,1
2,26
47,11
10,49
36,01
8,23
Table 3: Effect of Reflux time on Citronellyl Acetate (CA) and Geranyl Acetate (GA) %yield.
Quantity Of
Rhodinol
Quantity Of Acetic Anhydrid
e
Reflux Time (Hour
)
%Yield
CA GA 10 mL (0,03 mol)
2,92 mL (0,03 mol)
1 74,06
% 95,92
%
10 mL (0,03 mol)
2,92 mL (0,03 mol)
2 66,25
% 97,45
%
10 mL (0,03 mol)
2,92 mL (0,03 mol)
3 65,49
% 30,61
%
From Table 2 and Table 3 we could see that The optimum reflux time to produce the highest %yield citronellyl acetate and geranyl acetate yield is 1 hour.
Hydrolysis of esters by acetic acid is possible so that the formed ester product can converts back into an alcohol compound as the reaction time increases (Figure 2).
Figure 2: Reaction mechanism of hydrolysis ester (geranyl acetate)
3.4 Effect of Mole Ratio on Rhodinol Esterification Reaction with Acetic Anhydride
Table 4 and table 5 are a tabulation of the data produced by the esterification reaction with a fixed reflux time but the varying number of mole of acetic
anhydride which is: 0.03 mole, 0.06 mole, and 0.09 mole.
From Table 4 and Table 5 we could see that The optimum mole ratio between rhodinol and acetic anhydride to produce the highest %yield citronellyl acetate and geranyl acetate yield is 1:1.
There are water molecules in rhodinol so that the reaction of acetic anhydride to acetic acid is possible (Figure 3), after that hydrolysis of ester by acetic acid is possible (Figure 2).
Table 4: Effect of Reflux time on Citronellyl Acetate (CA)
and Geranyl Acetate (GA) percentage.
Acetic Anhy- -dride (mole
)
Before Synthesis
(%)
After Synthesis
(%)
synthesis results (%)
CA GA CA CA CA GA
0,03 11,1
2,26
48,33
26,04
37,23
23,78
0,06 11,1
2,26
49,99
20,18
38,89
17,92
0,09 11,1
2,26
45,09
21,25
33,99
18,99
Table 5: Effect of Reflux time on Citronellyl Acetate (CA)
and Geranyl Acetate (GA) %yield.
Quantity Of
Rhodinol
Quantity Of Acetic Anhydrid
e
Reflux Time (Hour
)
%Yield
CA GA
10 mL (0,03 mol)
2,92 mL (0,03 mol)
1 74,06
% 95,92
%
10 mL (0,03 mol)
5,84 mL (0,06 mol)
1 79,60
% 74,49
%
10 mL (0,03 mol)
8,76 mL (0,09 mol)
1 71,29
% 80,61
%
Figure 3: reaction mechanism of hydrolysis ester (geranyl acetate)
Esterification of Rhodinol Fraction with Acetic Anhydride using Zeolite Catalyst
121
4 CONCLUSIONS
Based on research by the author, it can be concluded that: 1. The optimum ratio of rhodinol to acetic anhydride
is 1: 1, with the yield of citronellyl acetate obtained is 74.06% while the % of geranyl acetate yield is 95.92%. Based on the results of the GC-MS analysis obtained 37.23% citronellyl acetate and 23.78% geranyl acetate.
2. The optimal reflux reaction time for esterification of rhodinol with acetic anhydride is 1 hour.
REFERENCES
Aldrich, S. (2019) Catalogue Product. Claon, P. and Akoh, C. 1993. Enzymatic synthesis of
geranyl acetate in n-hexane with Candida antarctica lipase. Biotechnology Letters, 15(12), 1211–1216.
Eden, W. T. et al. 2018. Fractionation of Java Citronella Oil and Citronellal Purification by Batch Vacuum Fractional Distillation. The 12th Joint Conference on Chemistry. Semarang: IOP Publishing, p. 349.
Fessenden, R. J. and Fessenden, J. s. 1999. Kimia Organik Jilid 2. 3rd edn. Jakarta: Erlangga.
Fracotte, E. and Lohmann, D. 1989. Helv. Chim. Acta, 114, 647.
Gunawan, W. 2009. Kualitas dan Nilai Minyak Atsiri, Implikasi pada Pengembangan Turunannya. Booklet Seminar Nasional Kimia Bervisi SETS. Semarang: Himpunan Kimia Indonesia Jawa Tengah, 18–29.
Kaul, P. N. et al. 1997. Chemical Composition of the Essential Oil Of Java Citronella (Cymbopogon Winterianus Jowitt) Grown in Andhra Pradesh, Pafai Journal, 19, 29–33.
Ma, Y. et al. 1996. Zeolite-Catalyzed Esterification I. Synthesis of Acetates, Benzoates, and Phthalates, Applied Catalyst A: General, 139, 51–57.
ICEO 2019 - International Conference of Essential Oils
122
The Effect of NAA Concentration and Different Parts of Stem on
Growth of Patchouli (Pogostemon cablin Benth.)
Mardhiah Hayati1, 2, Nurhayati1 and Revira Sari3 1 Department of Agrotechnology, Faculty of Agriculture, Universitas Syiah Kuala, Banda Aceh, 2311, Indonesia
2Atsiri Research Center, Universitas Syiah kuala, Banda Aceh, 2311, Indonesia 3Student of Department of Agrotechnology, Faculty of Agriculture, Universitas Syiah kuala, Banda Aceh, 2311,
Indonesia
Keywords: NAA concentration, cutting, patchouli. Stem, growth
Abstract: The need for patchouli is increasing with the increase of population and the development of the cosmetics
industry. The supply of healthy and of high production patchouli cutting is necessary to ensure the optimum
of production. The purpose of this study was to determine the effect of NAA concentration and the right parts
source of cuttings and the interaction between the two on the growth of patchouli. The study was conducted
in the Experimental Field and Plant Physiology Laboratory of the Faculty of Agriculture, Universitas Syiah
Kuala, Banda Aceh, in January to April 2019. The study used a factorial randomized block design with a 4x3
factorial pattern with three replications. NAA was applied using Growtone, a brand with an NAA
concentration of 3%. Factors studied were Growtone concentration at 0, 4.0, 8.0, and 12.0 g L-1 water, and
parts of stem source (shoots, middle, and base). The results showed that the best growth of patchouli cuttings
was at Growtone concentration of 4.0 g L-1 water, while the best shoot length and leaf area was found in the
treatment of Growtone concentration of 12.0 g L-1 water. Meanwhile, the best growth of patchouli cuttings
was found in the stem taken from the shoot’s part. There was no significant interaction between NAA
concentration and the source of the different parts of stem on the growth of patchouli.
1 INTRODUCTION
Patchouli (Pogostemon cablin Benth.) is a highest
ranked essential oil producing plants (Singh et al.,
2015). It has a strategic potential in the world market
where the oil is used as a scent binding agent in
perfumes, cosmetics, medicines and aromatherapy
(Swamy and Sinniah, 2016; Yang et al., 2013).
Patchouli oil can also be used as insect repellent
(Maia and Moore, 2011) and antiseptic (Haryudin and
Maslahah 2011). Recently, no synthetic ingredients
or substitutes have been found to match the benefits
of patchouli oil. The largest quantity of patchouli oil
is produced in Indonesia (Swamy and Sinniah, 2016). Patchouli cultivation in Indonesia was originally
developed in Aceh, North Sumatra, West Sumatra
and Bengkulu (Haryudin and Maslahah 2011). Three
superior quality of patchouli varieties (Tapak Tuan,
Lhokseumawe, and Sidikalang varieties) have been
resealed by the Indonesian Research Institute of
Spices and Medical Plants, Bogor, Indonesia. Tapak
Tuan varieties is superior for its production,
Lhokseumawe varieties has high oil content, while
Sidikalang varieties tolerant to bacterial wilt and
nematode (Nuryani, 2006).
In recent years, according to Kementerian
Pertanian Republik Indonesia (2019), Indonesian
patchouli production is unstable and does not show
any progress (2.207 tons in 2017 and 2.211 tons in
2019). The problem of unincreased production and
quality of Indonesian patchouli is caused by many
factors such as plant genetic quality, non-intensive
cultivation, poor seedlings, limited seed sources,
varied seedling, reduced planting area, decreased
level of soil fertility, harvest and postharvest
mechanism, and patchouli oil distillation that is far
from perfect (Nuryani, 2006; Setiawan and Rosman,
2013).
The formation of adventitious roots of plant is
controlled by genetic and environmental factors,
among which phytohormone auxin plays a major role
(Zhao et al., 2014). Exogenous auxin application
(e.g., naphthalene acetic acid, NAA) can increase
adventitious root formation in cuttings of most plant
Hayati, M., Nurhayati and Sari, R.The Effect of NAA Concentration and Different Parts of Stem on Growth of Patchouli (Pogostemon cablin Benth.).In Proceedings of the 2nd International Conference of Essential Oils (ICEO 2019), pages 123-129ISBN: 978-989-758-456-5Copyright © 2020 by SCITEPRESS – Science and Technology Publications, Lda. All rights reserved
123
species (Damiano et al., 2008; Ragonezi et al., 2010.
The growth of patchouli cuttings can be stimulated by
the application of growth regulators containing auxin
(exogenously) to stimulate root growth and can
physiologically influence plant growth.
Currently, there are many growth regulators in the
market, including Growtone with Naphthalene acetic
acid (NAA) content of 0.3% and acetamide 1-
naphthalene of 0.75%. NAA serves to stimulate root
growth and reduce the risk of cuttings decay. Faizin
(2016) found that the number of leaves, shoot length,
number of roots, and root length of patchouli plant
cuttings were best shown at Growtone concentration
of 6.0 g L-1 water. This shows that Growtone
concentration of 6.0 g L-1 water has been able to
increase the growth of patchouli cuttings more than
any other treatment. Handriyano (2007) states that the
length of cuttings of 25 cm with a soaking time of 45
minutes at Growtone concentration of 0.8 g L-1 water,
increase the growth of Jatropha cuttings where the
root length, root volume and buds of Jatropha cuttings
appear better than in other treatments.
Propagation by cuttings is one of vegetative
propagation technique that is widely used in
horticultural crops such as ornamental plants (Oinam
et al., 2011) and forestry plants (Nakhooda et al.,
2016) or for the propagation of elite genotypes on a
large scale. As patchouli plants are rarely produce
seeds, it is mostly propagated using stem cutting or in
vitro multiplication (Swamy et al., 2010; Saravanan
et al., 2015). The success of vegetative propagation
mainly depends on the efficient selection of stem
cuttings. Rathnayake et al. (2015) found in
Pogostemon heyneanus, two nodal hardwood cuttings
performed better in rooting parameters when
compared to semi-hardwood and softwood cuttings.
Cuttings must be available in good conditions,
because it is likely that cuttings will decay after
planting. For the best result, cuttings are suggested to
be prepared in nurseries before planting them directly
in the field (Nuryani et al., 2007). Differences in stem
cuttings affect plant growth, while cuttings for
patchouli plants can be used at the shoots, the middle
and the base of the stem. Melati et al., (2006) found
that almost all growth parameters (plant height,
number of branches, number of leaves) observed
showed that the growth of leafy cuttings of patchouli
was better than non-leaf cuttings. Conversely,
Iskandar (2014) found that the suitable planting
material was base cuttings compared to other parts of
stem. The results of his study showed that the plant
height, number of leaves, and the number of shoots
were higher.
The length of time for a stem to produce root was
a problem faced by patchouli farmers in patchouli
planting (Pandji and Sofyan, 1986). The capacity to
form adventitious roots in stem cuttings varies
between cuttings and within plant species or even
genotypes (De Klerk et al., 1999). Stuepp et al. (2014)
suggested that age, size, juvenility and maturity levels
of vegetative cuttings play a key role in the
establishment of better rooting. The cuttings are taken
from woody stems and parts of plants that are not too
old, and the cuttings chosen for seedlings must be free
from pests and diseases.
The use of suitable patchouli cuttings along with
a combination of IBA concentration provide a high
percentage of cuttings life, initially buds emerge,
number of shoots, root length, root volume, biomass
dry weight and root dry weights, exceeding the base
cuttings and middle cuttings of patchouli (Purba et al.,
2017).
Based on the description above, this study used
several concentrations of Growtone as a source of
NAA and different parts of stem cutting to determine
the highest growth of patchouli plant. This study aims
to determine the effect of Growtone concentration
and different parts of stem as the best part of stem
cutting and the interaction between the two factors on
the growth of patchouli plant.
2 MATERIALS AND METHODS
2.1 Experimental Site
The research was carried out at the Experimental
Field and Plant Physiology Laboratory of the Faculty
of Agriculture, Universitas Syiah Kuala, Banda Aceh,
which was carried out in January to April 2019.
2.2 Tools and Materials
The tools used in this study were analytical scales,
100 ml measuring cups, calipers, Tapak Tuan
varieties patchouli cuttings from different parts of
stem (shoots, middle stem and base), Growtone of 72
g, polybags with a size of 25 cm x 30 cm as much as
108 sheet, and Urea fertilizer as much as 216 g.
Paranet was used as a shading material.
2.3 Research Implementation
Planting media used were soil and manure with a ratio
of 3:1 (based on volume). Patchouli cuttings from
different plant parts with a length of 25 cm were
soaked in Growtone with a concentration according
ICEO 2019 - International Conference of Essential Oils
124
to treatment for 24 hours. Patchouli cuttings control
treatment soaked with water without Growtone. Each
patchouli cutting was planted in each polybag with a
depth of 5 cm. Maintenance of patchouli plant
includes watering, fertilizing with Urea of 2 g per
polybag at one week after planting (DAP), weeding
and losing the soil was carried out at 25, 45 and 55
DAP. Plant revocation was done at the age of 75
DAP.
2.4 Experimental Design
This study used Randomized Block Design with a
4x3 factorial pattern with 3 replications. There were
2 factors studied, the first factor was Growtone
concentration consists of 4 levels (0, 4.0, 8.0 and 12.0
g L-1 water). The second factor was cuttings from
different parts of stem (shoots, middle and base parts
of stem). Each experiment unit consists of three
polybags. Data were analyzed with analysis of
variance (ANOVA), and analysis of differences in
mean values using Tukey Test at 5% significant level.
2.5 Observation Parameters
Observations were made on the number of shoots,
shoot length, shoot diameter, number of leaves at 15,
30, 45, 60 and 75 DAP. Measurement of leaf length,
leaf width, leaf area, fresh and dry weight of biomass
(using an oven for 3x24 hours with a temperature of
60ºC to a constant weight), number of roots, root
length and root volume of patchouli plant were
performed at 75 DAP.
3 RESULT AND DISCUSSION
3.1 Effect of Growtone Concentration on Growth of Patchouli Cuttings
The results of analysis of variance showed that
Growtone concentration had a very significant effect
on all observed growth variables. The average growth
of patchouli cuttings due to the treatment of
Growtone concentration were as indicated in Table 1.
The results showed that the highest number of shoots
at 15, 30 and 75 DAP were obtained at Growtone
concentration of 4.0 g L-1 water and the highest
number of shoots at 45 and 60 DAP at Growtone
concentrations of 8.0 g L-1 water. The largest shoot
diameter at 15 and 30 DAP were obtained in control
treatment, while at 45 and 60 DAP at Growtone
concentrations of 8.0 g L-1 water, and at 75 DAP was
the largest at Growtone concentrations of 12.0 g L-1
water. The highest shoot lengths at 15, 30, 45 and 60
DAP were found at Growtone concentrations of 12.0
g L-1 water, while at 75 DAP was at Growtone
concentrations of 8.0 g L-1 water. The highest number
of leaves at ages 15, 30, 45 and 60 DAP were found
at Growtone concentration of 8.0 g L-1 water but not
significantly different from Growtone concentrations
of 4.0 g L-1 water. The highest number of leaves at 75
DAP was found at Growtone concentration of 4.0 g
L-1 of water, and was not significantly different from
control. The highest leaf length and leaf width were
found at Growtone concentration of 8.0 g L-1 water,
while the largest leaf area was found at Growtone
concentration of 12.0 g L-1 water. Fresh and dry
biomass weights, the highest number of roots and root
volume were found at Growtone concentration of 4.0
g L-1 water, while the highest root length was found
at Growtone concentration of 8.0 g L-1 water.
The best Growtone treatment was found at a
concentration of 4.0 g L-1 water. This fact indicated
that the use of Growtone concentration of 4.0 g L-1
water had been able to provide a better growth of
patchouli cuttings. Faizin's (2016) found that
Growtone concentrations of 6.0 g L-1 water which
was applied to patchouli plants showed the best
results compared to other treatments. This fact
indicated that Growtone concentrations of 6.0 g L-1
water was optimal enough to stimulate the formation
of new patchouli plant roots, cell division, formation
and growth of patchouli plant cuttings. This also
indicated that the lower the use of Growtone
concentration, the better the growth of patchouli
cuttings. According to Zhao (2010) and Heddy (2006)
auxin as a plant growth regulator (PGR) play its role
in plant growth and development by affecting
membrane proteins, so protein synthesis and nucleic
acid can be faster and auxin influence the formation
of new roots, cell division and the formation of new
shoots. The best shoot length and leaf area parameters
were found in the treatment of Growtone
concentration of 12.0 g L-1 water. The increasing
concentration of Growtone containing auxin
(naphthalene acetic acid) play a role in stimulating
growth, thus Growtone at the base of plant cuttings
increased the speed of growth of patchouli shoots and
enlarge the leaf area. Purba et al. (2017) suggested
that auxin hormone in cuttings was active enough to
divide the plant plus exogenous PGR to provide
optimal auxin conditions in the growth and
development of patchouli cuttings. The formation of
adventitious roots is the main condition for its success
in propagation.
The Effect of NAA Concentration and Different Parts of Stem on Growth of Patchouli (Pogostemon cablin Benth.)
125
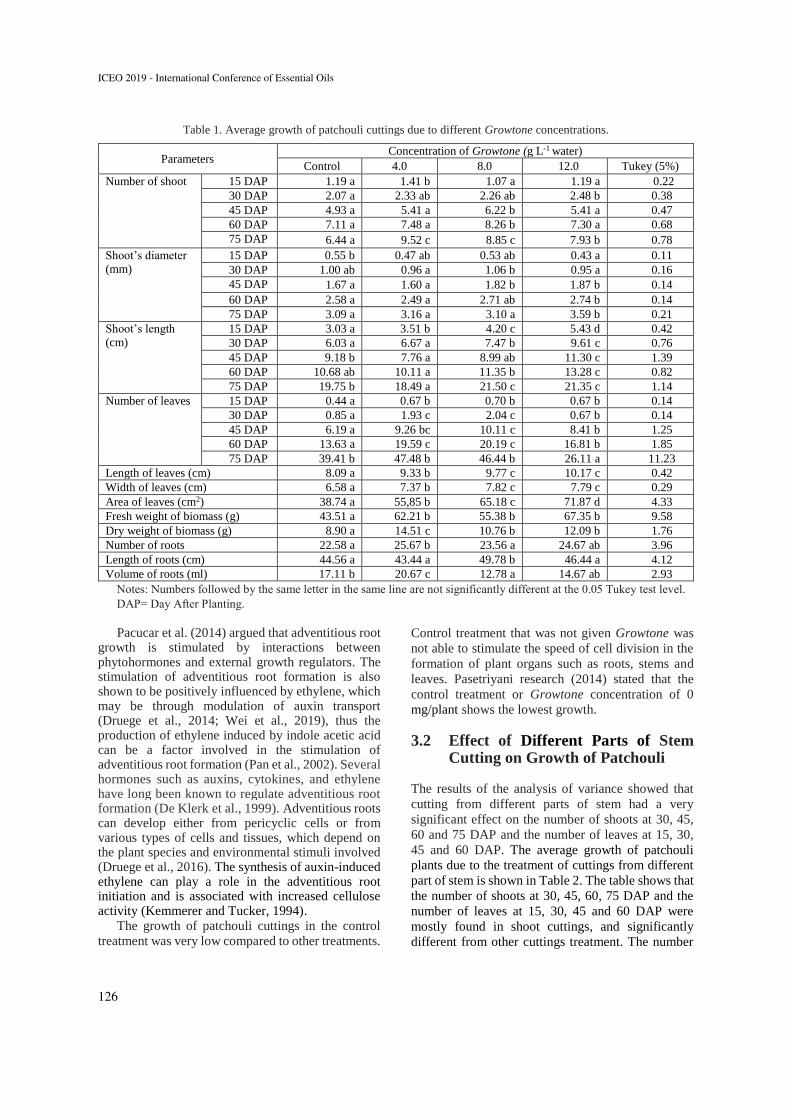
Table 1. Average growth of patchouli cuttings due to different Growtone concentrations.
Parameters Concentration of Growtone (g L-1 water)
Control 4.0 8.0 12.0 Tukey (5%)
Number of shoot 15 DAP 1.19 a 1.41 b 1.07 a 1.19 a 0.22
30 DAP 2.07 a 2.33 ab 2.26 ab 2.48 b 0.38
45 DAP 4.93 a 5.41 a 6.22 b 5.41 a 0.47
60 DAP 7.11 a 7.48 a 8.26 b 7.30 a 0.68
75 DAP 6.44 a 9.52 c 8.85 c 7.93 b 0.78
Shoot’s diameter
(mm)
15 DAP 0.55 b 0.47 ab 0.53 ab 0.43 a 0.11
30 DAP 1.00 ab 0.96 a 1.06 b 0.95 a 0.16
45 DAP 1.67 a 1.60 a 1.82 b 1.87 b 0.14
60 DAP 2.58 a 2.49 a 2.71 ab 2.74 b 0.14
75 DAP 3.09 a 3.16 a 3.10 a 3.59 b 0.21
Shoot’s length
(cm)
15 DAP 3.03 a 3.51 b 4.20 c 5.43 d 0.42
30 DAP 6.03 a 6.67 a 7.47 b 9.61 c 0.76
45 DAP 9.18 b 7.76 a 8.99 ab 11.30 c 1.39
60 DAP 10.68 ab 10.11 a 11.35 b 13.28 c 0.82
75 DAP 19.75 b 18.49 a 21.50 c 21.35 c 1.14
Number of leaves 15 DAP 0.44 a 0.67 b 0.70 b 0.67 b 0.14
30 DAP 0.85 a 1.93 c 2.04 c 0.67 b 0.14
45 DAP 6.19 a 9.26 bc 10.11 c 8.41 b 1.25
60 DAP 13.63 a 19.59 c 20.19 c 16.81 b 1.85
75 DAP 39.41 b 47.48 b 46.44 b 26.11 a 11.23
Length of leaves (cm) 8.09 a 9.33 b 9.77 c 10.17 c 0.42
Width of leaves (cm) 6.58 a 7.37 b 7.82 c 7.79 c 0.29
Area of leaves (cm2) 38.74 a 55,85 b 65.18 c 71.87 d 4.33
Fresh weight of biomass (g) 43.51 a 62.21 b 55.38 b 67.35 b 9.58
Dry weight of biomass (g) 8.90 a 14.51 c 10.76 b 12.09 b 1.76
Number of roots 22.58 a 25.67 b 23.56 a 24.67 ab 3.96
Length of roots (cm) 44.56 a 43.44 a 49.78 b 46.44 a 4.12
Volume of roots (ml) 17.11 b 20.67 c 12.78 a 14.67 ab 2.93
Notes: Numbers followed by the same letter in the same line are not significantly different at the 0.05 Tukey test level.
DAP= Day After Planting.
Pacucar et al. (2014) argued that adventitious root growth is stimulated by interactions between phytohormones and external growth regulators. The stimulation of adventitious root formation is also shown to be positively influenced by ethylene, which may be through modulation of auxin transport (Druege et al., 2014; Wei et al., 2019), thus the production of ethylene induced by indole acetic acid can be a factor involved in the stimulation of adventitious root formation (Pan et al., 2002). Several hormones such as auxins, cytokines, and ethylene have long been known to regulate adventitious root formation (De Klerk et al., 1999). Adventitious roots can develop either from pericyclic cells or from various types of cells and tissues, which depend on the plant species and environmental stimuli involved (Druege et al., 2016). The synthesis of auxin-induced ethylene can play a role in the adventitious root initiation and is associated with increased cellulose activity (Kemmerer and Tucker, 1994).
The growth of patchouli cuttings in the control
treatment was very low compared to other treatments.
Control treatment that was not given Growtone was
not able to stimulate the speed of cell division in the
formation of plant organs such as roots, stems and
leaves. Pasetriyani research (2014) stated that the
control treatment or Growtone concentration of 0
mg/plant shows the lowest growth.
3.2 Effect of Different Parts of Stem Cutting on Growth of Patchouli
The results of the analysis of variance showed that
cutting from different parts of stem had a very
significant effect on the number of shoots at 30, 45,
60 and 75 DAP and the number of leaves at 15, 30,
45 and 60 DAP. The average growth of patchouli
plants due to the treatment of cuttings from different
part of stem is shown in Table 2. The table shows that
the number of shoots at 30, 45, 60, 75 DAP and the
number of leaves at 15, 30, 45 and 60 DAP were
mostly found in shoot cuttings, and significantly
different from other cuttings treatment. The number
ICEO 2019 - International Conference of Essential Oils
126
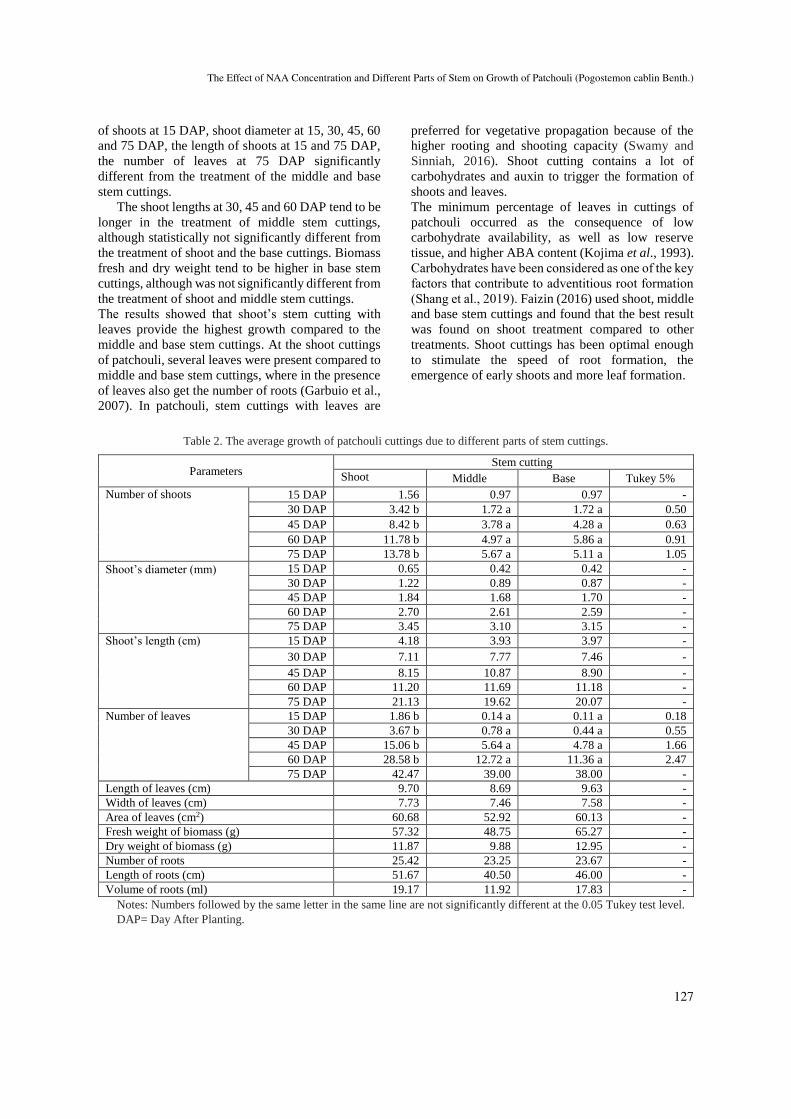
of shoots at 15 DAP, shoot diameter at 15, 30, 45, 60
and 75 DAP, the length of shoots at 15 and 75 DAP,
the number of leaves at 75 DAP significantly
different from the treatment of the middle and base
stem cuttings.
The shoot lengths at 30, 45 and 60 DAP tend to be
longer in the treatment of middle stem cuttings,
although statistically not significantly different from
the treatment of shoot and the base cuttings. Biomass
fresh and dry weight tend to be higher in base stem
cuttings, although was not significantly different from
the treatment of shoot and middle stem cuttings.
The results showed that shoot’s stem cutting with
leaves provide the highest growth compared to the
middle and base stem cuttings. At the shoot cuttings
of patchouli, several leaves were present compared to
middle and base stem cuttings, where in the presence
of leaves also get the number of roots (Garbuio et al.,
2007). In patchouli, stem cuttings with leaves are
preferred for vegetative propagation because of the
higher rooting and shooting capacity (Swamy and
Sinniah, 2016). Shoot cutting contains a lot of
carbohydrates and auxin to trigger the formation of
shoots and leaves.
The minimum percentage of leaves in cuttings of
patchouli occurred as the consequence of low
carbohydrate availability, as well as low reserve
tissue, and higher ABA content (Kojima et al., 1993).
Carbohydrates have been considered as one of the key
factors that contribute to adventitious root formation
(Shang et al., 2019). Faizin (2016) used shoot, middle
and base stem cuttings and found that the best result
was found on shoot treatment compared to other
treatments. Shoot cuttings has been optimal enough
to stimulate the speed of root formation, the
emergence of early shoots and more leaf formation.
Table 2. The average growth of patchouli cuttings due to different parts of stem cuttings.
Parameters Stem cutting
Shoot Middle Base Tukey 5%
Number of shoots 15 DAP 1.56 0.97 0.97 -
30 DAP 3.42 b 1.72 a 1.72 a 0.50
45 DAP 8.42 b 3.78 a 4.28 a 0.63
60 DAP 11.78 b 4.97 a 5.86 a 0.91
75 DAP 13.78 b 5.67 a 5.11 a 1.05
Shoot’s diameter (mm) 15 DAP 0.65 0.42 0.42 -
30 DAP 1.22 0.89 0.87 -
45 DAP 1.84 1.68 1.70 -
60 DAP 2.70 2.61 2.59 -
75 DAP 3.45 3.10 3.15 -
Shoot’s length (cm) 15 DAP 4.18 3.93 3.97 -
30 DAP 7.11 7.77 7.46 -
45 DAP 8.15 10.87 8.90 -
60 DAP 11.20 11.69 11.18 -
75 DAP 21.13 19.62 20.07 -
Number of leaves 15 DAP 1.86 b 0.14 a 0.11 a 0.18
30 DAP 3.67 b 0.78 a 0.44 a 0.55
45 DAP 15.06 b 5.64 a 4.78 a 1.66
60 DAP 28.58 b 12.72 a 11.36 a 2.47
75 DAP 42.47 39.00 38.00 -
Length of leaves (cm) 9.70 8.69 9.63 -
Width of leaves (cm) 7.73 7.46 7.58 -
Area of leaves (cm2) 60.68 52.92 60.13 -
Fresh weight of biomass (g) 57.32 48.75 65.27 -
Dry weight of biomass (g) 11.87 9.88 12.95 -
Number of roots 25.42 23.25 23.67 -
Length of roots (cm) 51.67 40.50 46.00 -
Volume of roots (ml) 19.17 11.92 17.83 -
Notes: Numbers followed by the same letter in the same line are not significantly different at the 0.05 Tukey test level.
DAP= Day After Planting.
The Effect of NAA Concentration and Different Parts of Stem on Growth of Patchouli (Pogostemon cablin Benth.)
127
Abidin (1990) argued that shoot cuttings contain
a lot of auxin when compared to other parts, as
endogenous auxin from a plant is produced from
meristem tissue and causes apical dominance so that
the formation of roots is faster and stimulates the
emergence of shoots. Heddy (2006) argued that the
role of carbohydrates to form roots and shoots is very
large. The growth of good shoots and roots will lead
to good leaf formation and increases the
photosynthetic process, thus more carbohydrates are
produced. Purba et al. (2017) found that the use of
shoot cuttings in the provision of PGR IBA with a
concentration of 100 ppm increased the growth of
patchouli cuttings in all variables, such as the
percentage of live cuttings, age of buds, number of
shoots, root length, root volume, and root dry weight.
3.3 Effect of Interaction of Growtone Concentration and Difference Parts of Stem on the Growth from Patchouli
The results showed that there was no significant
interaction between the concentration of Growtone
and the stem cuttings on all patchouli growth
variables. The growth of different patchouli stem
cuttings due to differences in the concentration of
Growtone applied was not affected by different parts
of stem cuttings, and the treatment of stem cuttings
were not affected by differences in concentration of
Growtone.
4 CONCLUSION
The results showed that Growtone concentration had
a very significant effect on all growth variables. The
best growth of patchouli cuttings was found at
Growtone concentration of 4 g L-1 water, while the
highest shoot length, shoot diameter at 75 DAP and
the leaf area was found in the treatment of Growtone
concentration of 12 g L-1 water. Different stem
cuttings have a very significant effect on the number
of shoots at 30, 45, 60 and 75 DAP and the number of
leaves at 15, 30, 45, and 60 DAP. The best growth of
patchouli cuttings was found in the shoot cutting.
There was no significant interaction between
Growtone concentration and the different part of stem
cutting on all patchouli growth variables that were
observed.
REFERENCES
Abidin, Z., 1990. Dasar-dasar pengetahuan zat pengatur
tumbuh, Penerbit Angkasa, Bandung, Indonesia.
Damiano, C. Padro, M.D.A., Frattarelli, A., 2008.
Propagation and establishment in vitro of myrtle
(Myrtus communis L.), pomegranate (Punica granatum
L.) and mulberry (Morus alba L.). Propag. Ornam.
Plants. 8, 3–8.
De Klerk, G.J., Van der Krieken, W., de Jong, J.C., 1999.
Review the formation of adventitious roots: New
concepts, new possibilities. In Vitro Cell. Dev. Plants.
35, 189–199.
Druege, U., Franken, P., Lischewski, S., Ahkami, A.H.,
Zerche, S., Hause, B., Hajirezaei, M.R., 2014.
Transcriptomic analysis reveals ethylene as stimulator
and auxin as regulator of adventitious root formation in
petunia cuttings. Front. Plant Sci. 5,1-19.
Druege, W., Franken, P., Hajirezaei, M.R., 2016. Plant
hormone homeostasis, signaling, and function during
adventitious root formation in cuttings. Front. Plant
Sci. 7, 1-14.
Faizin, R., 2016. Pengaruh jenis setek dan konsentrasi zat
pengatur tumbuh Growtone terhadap pertumbuhan
tanaman nilam (Pogostemon cablin Benth). J. Agrotek
Lestari. 2(1), 39-50.
Garbuio, C., Biasi, L.A., Kowalski, A.P.J., Signor, D.,
Machado, E.M., Deschamps, C., 2007. Propagação por
estaquia em patchouli com diferentes números de folhas
e tipos de estaca. Scientia Agraria. 8, 435-438.
Handriyano, A., 2007. Pengaruh panjang setek dan lama
perendaman dalam Growtone terhadap
pertumbuhan stek jarak pagar (Jatropha curcas L.).
Tesis. University of muhammadiyah Malang.
Indonesia.
Haryudin, W., Maslahah, N., 2011. Karakteristik
morfologi, anatomi dan produksi terna aksesi nilam asal
Aceh dan Sumatera Utara. Bul. Littro. 22(2), 115-126.
Heddy, S., 2006. Hormon Tumbuhan, Raja Grafindo
Persada, Jakarta.
Iskandar, S., 2014. Pengaruh asal bahan setek dan dosis
pupuk N terhadap pertumbuhan bibit Nilam
(Pogostemon caplin Benth). Skripsi. Sekolah Tinggi
Pertanian Dharma Wacana, Lampung. Indonesia.
Kementerian Pertanian Republik Indonesia. 2019. Data
lima tahun terakhir. Retrieved on October 25, 2019
from: pertanian.go.id.
Kemmerer, E.C. Tucker, M.L., 1994. Comparative study of
celluloses associated with adventitious root initiation,
apical buds, and leaf, flower, and pod abscission zones
in soybean. Plant Physiol. 104, 557-62.
Kojima, K., Kuraishi, S., Sakurai, N., Itou T., Tsurusaki, K.
1993. Spatial distribution of abscisic acid and 2-trans-
abscisic acid in spear, buds, roots and roots of asparagus
(Asparagus officinalis L.). Sci. Hort. Amsterdam. 54,
177-89.
Maia, M.F., Moore, S.J., 2011. Plant-based insect
repellents: a review of their efficacy, development and
testing. Malaria J. 10.
ICEO 2019 - International Conference of Essential Oils
128
Melati, Rusmin, D., Sukarman, 2006. Pengaruh lama
penyimpanan setek berakar terhadap pertumbuhan
nilam (Pogostemon cablin Benth.). Jurnal Littri. 12(4),
135-139.
Nakhooda, M., Jain, S.M., 2016. A review of eucalyptus
propagation and conservation. Propag. Ornam. Plants.
16, 101–119.
Nuryani, Y., 2006. Karakterisasi empat aksesi nilam.
Buletin Plasma Nutfah. 12(2), 45-49.
Nuryani, Y., Emmyzar, Wiratno, 2007. Budidaya
Tanaman Nilam. Badan Penelitian dan
Pengembangan. Balai Penelitian Tanaman Obat dan
Aromatik. J. Penelitian Sirkuler. 12, 1-27.
Oinam, G., Yeung, E., Kurepin, L., Haslam, T., Lopez-
Villalobos, A., 2011. Adventitious root formation in
ornamental plants: I. General overview and recent
successes. Propag. Ornam. Plants. 11, 78–90.
Pan, R., Wang, J., Tian, X., 2002. Influence of ethylene on
adventitious root formation in mung bean hypocotyl
cuttings. Plant Growth Regulation. 36, 135-139.
Pandji, M., Sofyan, R., 1986. Tanaman nilam sebagai
sumber minyak atsiri, Balai Penelitian Tanaman Obat
dan Rempah, Bogor.
Pasetriyani, E.T., 2014. Pengaruh macam media tanam dan
zat pengatur tumbuh Growtone terhadap pertumbuhan
stek batang tanaman jarak pagar (Jatropha curcas
Linn). J. Agroscience. 7, 82-88.
Pacurar, D.I., Perrone, I., Bellini, C., 2014. Auxin is a
central player in the hormone cross-talks that control
adventitious rooting. Physiol. Plant. 151, 83–96.
Purba, R.S., Ginting, J., Ginting, J. 2017. Respons
pertumbuhan setek nilam (Pogostemon cablin Benth.)
pada berbagai bahan tanam dan konsentrasi IBA. J.
Agroteknologi FP USU. 5(4), 799-805.
Ragonezi, C., Klimaszewska, K., Castro, M.R., Lima, M.,
de Oliveira, P., Zavattieri, M.A., 2010. Adventitious
rooting of conifers: Influence of physical and chemical
factors. Trees. 24, 975–992.
Rathnayake, R.M.D.H., Dharmadasa, R.M., Abeysinghe,
D.C., 2015. Suitable maturity stage, type of cuttings and
potting media for vegetative propagation of
Pogostemon heyneanus Benth. World J. Agric. Res. 3,
203-207.
Saravanan, R., Kumar, V.S., Maiti, S., 2015.
Standardization of single eye cutting in patchouli
(Pogostemon cablin). Current Hort. 3(1), 19-23.
Setiawan dan R. Rosman. 2013. Produktivitas nilam
nasional semakin menurun. Warta Penelitian dan
Pengembangan Tanaman Industri. 19(3), 8-11.
Shang, C., Yang, H., Ma, S., Shen, Q., Liu, L., Hou, C.,
Cao, X., Cheng, J., 2019. Physiological and
transcriptomic changes during the early phases os
adventitious root formation in mulberry stem hardwood
cuttings. Int. J. Mol. Sci. 20, 1-20.
Singh, R., Singh, M., Srinivas, A., Rao, E.P., Puttanna, K.,
2015. Assessment of organic and inorganic fertilizers
for growth, yield and essential oil quality of industrially
important plant patchouli (Pogostemon cablin)
(Blanco) Benth. J. Essent. Oil Bear. Plants. 18(1), 1–
10.
Stuepp, C.A., Zuffellato-Ribas, K.C., Wendling, I.,
Koehler, H.S., Bona, C., 2014. Vegetative propagation
of mature dragon trees through epicormic shoots.
Bosque. 35(3), 337–345.
Swamy, M.K., Balasubramanya, S., Anuradha, M., 2010. In
vitro multiplication on Pogostemon cablin Benth.
through direct regeneration. African J. Biotech. 9(14),
2069-2075.
Swamy, M.K., Sinniah, U.R., 2016. Patchouli (Pogostemon
cablin Benth.): Botany, agrotechnology and
biotechnological aspects. Industrial Crops and
Products. 87, 161-176.
Wei, K., Ruan, L., Wang, L., Chang, H., 2019. Auxin-
induced adventitious root formation in nodal cuttings of
Camellia sinensis. Int. J. Mol. Sci. 20(19), 4817.
Wu L, Wu Y, Guo Q, Li S, Zhou K, Zhang J. 2011.
Comparison of genetic diversity in Pogostemon cablin
from China revealed by RAPD, morphological and
chemical analyses. J. Med. Plants Res. 5, 4549-4559.
Yang, X., Zhang, X., Yang S.P., Liu, W.Q., 2013.
Evaluation of the antibacterial activity of patchouli oil.
Iran J. Pharm. Res. 12, 307-316.
Zhao, X., Zheng, H., Li, S., Yang, C., Jiang, J., Liu, G.,
2014. The rooting of poplar cuttings: A review. New
Forest. 45, 21-34.
Zhao, Y., 2010, Auxin biosynthesis and its role in plant
development. Annu. Rev. Plant Biol. 61, 49-64.
The Effect of NAA Concentration and Different Parts of Stem on Growth of Patchouli (Pogostemon cablin Benth.)
129
Perception of Patchouli Farmers on the Development of the Innovation Cluster in Panga, Aceh Jaya Regency
M. Y. Wardhana1, I. Indra1, D. Andriani1 1Department of Agribusiness, Syiah Kuala University, 23111, Banda Aceh, Indonesia
Keywords: Perception, Patchouli Farmers, Innovation Cluster, Community Development
Abstract: The purpose of this study was to identify the interests and attitudes of patchouli farmers towards the development of patchouli innovation clusters and to find out and analyze people's perceptions of the development of patchouli innovation clusters in Panga, Aceh Jaya Regency. The choice of location in this study was done intentionally (purposive sampling) with the reason that the research location is the place for the patchouli innovation cluster development plan. How to determine the sample in this study using the census method. The samples determined in this study were 80 patchouli farmers. The analytical method used in this research is the Likert scale and descriptive qualitative method. The results of the study showed that the attitudes (affective) and perception (cognitive) of patchouli farmers were good for the development of patchouli innovation clusters. Respondents hope the patchouli innovation cluster can be built immediately so that the standard of living of the community in the District of Panga can be prosperous. Perceptions generated from patchouli farmers are positive perceptions, the community is very receptive to innovations in Aceh Jaya on patchouli cultivation from upstream to downstream so that the cluster is very beneficial for the surrounding community.
1 INTRODUCTION
Patchouli (Pogostemon cablin Benth) is a plant that grows low close to the soil surface, has smooth leaves and rectangular-shaped stems. The dried leaves of the patchouli plant are distilled to produce patchouli oil. Patchouli oil is commonly used as a binding agent in the perfume, cosmetic and pharmaceutical industries (Maulidi, 2005).
Syaifullah, head of the Aceh ARC (2017) said that Patchouli Aceh (Pogostemon Cablin, Benth) is one of Aceh's leading commodities. Patchouli Aceh is the best patchouli in the world which has a Patchouli Alcohol (PA) content above 30%. Indonesia is a supplier of 90% of the world's patchouli oil needs and 15% of them have come from Aceh. Some patchouli oil-producing provinces in Indonesia, namely the provinces of West Sulawesi, South Sulawesi, Central Sulawesi, Gorontalo, Aceh, North Sumatra, West Sumatra, Jambi, South Sumatra, Lampung, West Java, Central Java, D.I. Yogyakarta, East Java, Bali, East Nusa Tenggara, and East Kalimantan. Production from these regions controls 80% to 90% of the world patchouli market. When viewed from the area of smallholder plantations, then West Sumatra is
the widest area, while in terms of production, that is the province of Aceh with the most production, estimated at 645 tons. In addition to the amount of production, Aceh Province is famous for the best patchouli quality in the world with one of its superior, namely Tapaktuan varieties.
According to Mahmud, (2019) the quality of patchouli oil in Aceh province has a yield (oil content) ranging from 2.6% -3.3%, while the average patchouli in the world only reaches 2.5%. This is based on the results of the research team of researchers from Bogor. Aceh patchouli production is spread in Aceh Jaya District, Southeast Aceh, Aceh Besar, Pidie, Pidie Jaya, Bireuen, Central Aceh, North Aceh, Aceh Tamiang, Gayo Lues, Sabang, West Aceh, Nagan Raya, Southwest Aceh, South Aceh, and Aceh Singkil. Aceh Jaya has a long history of patchouli oil production, along with areas that cultivate patchouli plants, namely Lamno, Sampoiniet, Lhokruet, Panga, Pasie Raya and Teunom since decades ago. Aside from having a long history of patchouli, Aceh Jaya is also easily accessible and has a very strategic position.
130Wardhana, M., Indra, I. and Andriani, D.Perception of Patchouli Farmers on the Development of the Innovation Cluster in Panga, Aceh Jaya Regency.In Proceedings of the 2nd International Conference of Essential Oils (ICEO 2019), pages 130-135ISBN: 978-989-758-456-5Copyright © 2020 by SCITEPRESS – Science and Technology Publications, Lda. All rights reserved
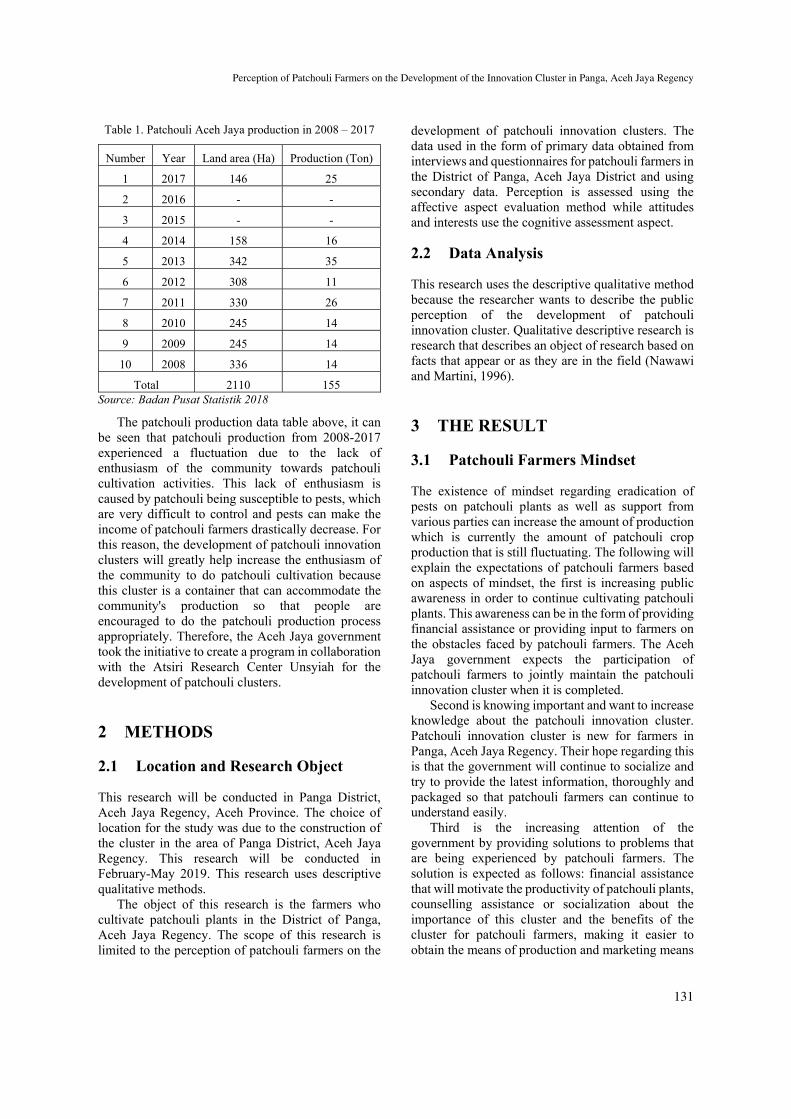
Table 1. Patchouli Aceh Jaya production in 2008 – 2017
Number Year Land area (Ha) Production (Ton)
1 2017 146 25
2 2016 - -
3 2015 - -
4 2014 158 16
5 2013 342 35
6 2012 308 11
7 2011 330 26
8 2010 245 14
9 2009 245 14
10 2008 336 14
Total 2110 155 Source: Badan Pusat Statistik 2018
The patchouli production data table above, it can be seen that patchouli production from 2008-2017 experienced a fluctuation due to the lack of enthusiasm of the community towards patchouli cultivation activities. This lack of enthusiasm is caused by patchouli being susceptible to pests, which are very difficult to control and pests can make the income of patchouli farmers drastically decrease. For this reason, the development of patchouli innovation clusters will greatly help increase the enthusiasm of the community to do patchouli cultivation because this cluster is a container that can accommodate the community's production so that people are encouraged to do the patchouli production process appropriately. Therefore, the Aceh Jaya government took the initiative to create a program in collaboration with the Atsiri Research Center Unsyiah for the development of patchouli clusters.
2 METHODS
2.1 Location and Research Object
This research will be conducted in Panga District, Aceh Jaya Regency, Aceh Province. The choice of location for the study was due to the construction of the cluster in the area of Panga District, Aceh Jaya Regency. This research will be conducted in February-May 2019. This research uses descriptive qualitative methods.
The object of this research is the farmers who cultivate patchouli plants in the District of Panga, Aceh Jaya Regency. The scope of this research is limited to the perception of patchouli farmers on the
development of patchouli innovation clusters. The data used in the form of primary data obtained from interviews and questionnaires for patchouli farmers in the District of Panga, Aceh Jaya District and using secondary data. Perception is assessed using the affective aspect evaluation method while attitudes and interests use the cognitive assessment aspect.
2.2 Data Analysis
This research uses the descriptive qualitative method because the researcher wants to describe the public perception of the development of patchouli innovation cluster. Qualitative descriptive research is research that describes an object of research based on facts that appear or as they are in the field (Nawawi and Martini, 1996).
3 THE RESULT
3.1 Patchouli Farmers Mindset
The existence of mindset regarding eradication of pests on patchouli plants as well as support from various parties can increase the amount of production which is currently the amount of patchouli crop production that is still fluctuating. The following will explain the expectations of patchouli farmers based on aspects of mindset, the first is increasing public awareness in order to continue cultivating patchouli plants. This awareness can be in the form of providing financial assistance or providing input to farmers on the obstacles faced by patchouli farmers. The Aceh Jaya government expects the participation of patchouli farmers to jointly maintain the patchouli innovation cluster when it is completed.
Second is knowing important and want to increase knowledge about the patchouli innovation cluster. Patchouli innovation cluster is new for farmers in Panga, Aceh Jaya Regency. Their hope regarding this is that the government will continue to socialize and try to provide the latest information, thoroughly and packaged so that patchouli farmers can continue to understand easily.
Third is the increasing attention of the government by providing solutions to problems that are being experienced by patchouli farmers. The solution is expected as follows: financial assistance that will motivate the productivity of patchouli plants, counselling assistance or socialization about the importance of this cluster and the benefits of the cluster for patchouli farmers, making it easier to obtain the means of production and marketing means
Perception of Patchouli Farmers on the Development of the Innovation Cluster in Panga, Aceh Jaya Regency
131
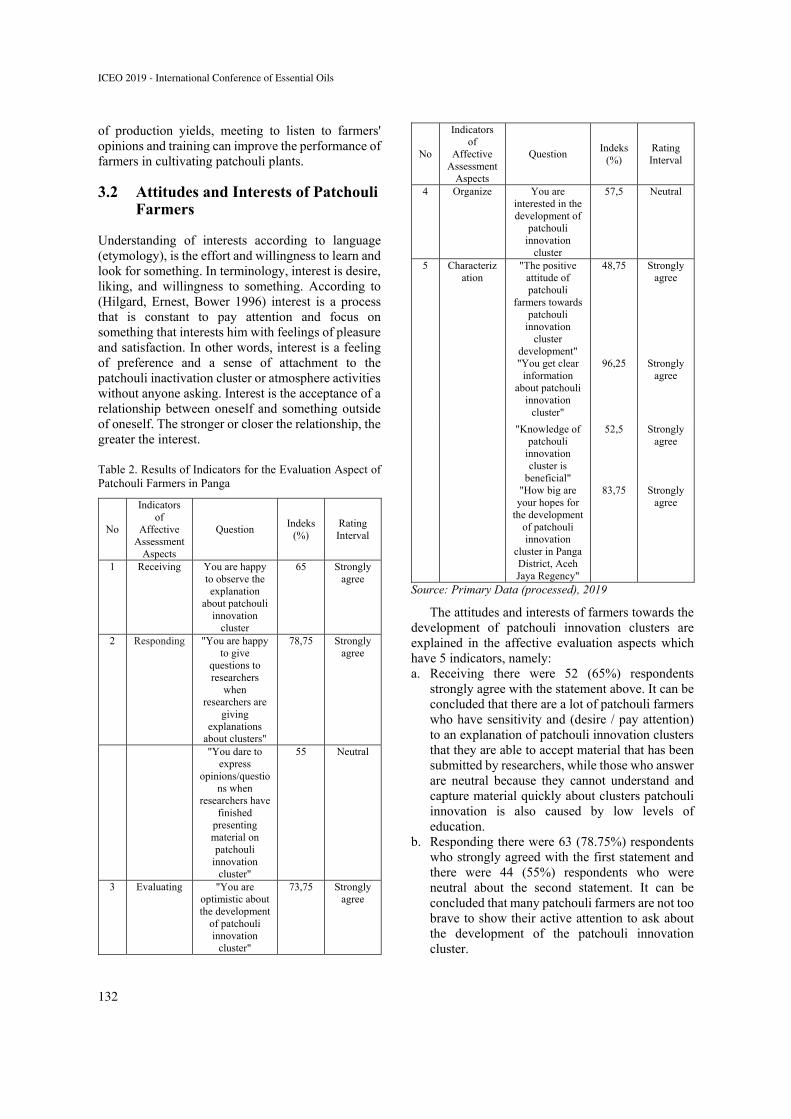
of production yields, meeting to listen to farmers' opinions and training can improve the performance of farmers in cultivating patchouli plants.
3.2 Attitudes and Interests of Patchouli Farmers
Understanding of interests according to language (etymology), is the effort and willingness to learn and look for something. In terminology, interest is desire, liking, and willingness to something. According to (Hilgard, Ernest, Bower 1996) interest is a process that is constant to pay attention and focus on something that interests him with feelings of pleasure and satisfaction. In other words, interest is a feeling of preference and a sense of attachment to the patchouli inactivation cluster or atmosphere activities without anyone asking. Interest is the acceptance of a relationship between oneself and something outside of oneself. The stronger or closer the relationship, the greater the interest.
Table 2. Results of Indicators for the Evaluation Aspect of Patchouli Farmers in Panga
No
Indicators of
Affective Assessment
Aspects
Question Indeks
(%) Rating Interval
1 Receiving You are happy to observe the explanation
about patchouli innovation
cluster
65 Strongly agree
2 Responding "You are happy to give
questions to researchers
when researchers are
giving explanations
about clusters"
78,75
Strongly agree
"You dare to express
opinions/questions when
researchers have finished
presenting material on patchouli
innovation cluster"
55 Neutral
3 Evaluating "You are optimistic about the development
of patchouli innovation
cluster"
73,75 Strongly agree
No
Indicators of
Affective Assessment
Aspects
Question Indeks
(%) Rating Interval
4 Organize You are interested in the development of
patchouli innovation
cluster
57,5 Neutral
5 Characterization
"The positive attitude of patchouli
farmers towards patchouli
innovation cluster
development"
48,75
Strongly agree
"You get clear information
about patchouli innovation
cluster"
96,25 Strongly agree
"Knowledge of patchouli
innovation cluster is
beneficial"
52,5 Strongly agree
"How big are your hopes for
the development of patchouli innovation
cluster in Panga District, Aceh Jaya Regency"
83,75 Strongly agree
Source: Primary Data (processed), 2019
The attitudes and interests of farmers towards the development of patchouli innovation clusters are explained in the affective evaluation aspects which have 5 indicators, namely: a. Receiving there were 52 (65%) respondents
strongly agree with the statement above. It can be concluded that there are a lot of patchouli farmers who have sensitivity and (desire / pay attention) to an explanation of patchouli innovation clusters that they are able to accept material that has been submitted by researchers, while those who answer are neutral because they cannot understand and capture material quickly about clusters patchouli innovation is also caused by low levels of education.
b. Responding there were 63 (78.75%) respondents who strongly agreed with the first statement and there were 44 (55%) respondents who were neutral about the second statement. It can be concluded that many patchouli farmers are not too brave to show their active attention to ask about the development of the patchouli innovation cluster.
ICEO 2019 - International Conference of Essential Oils
132
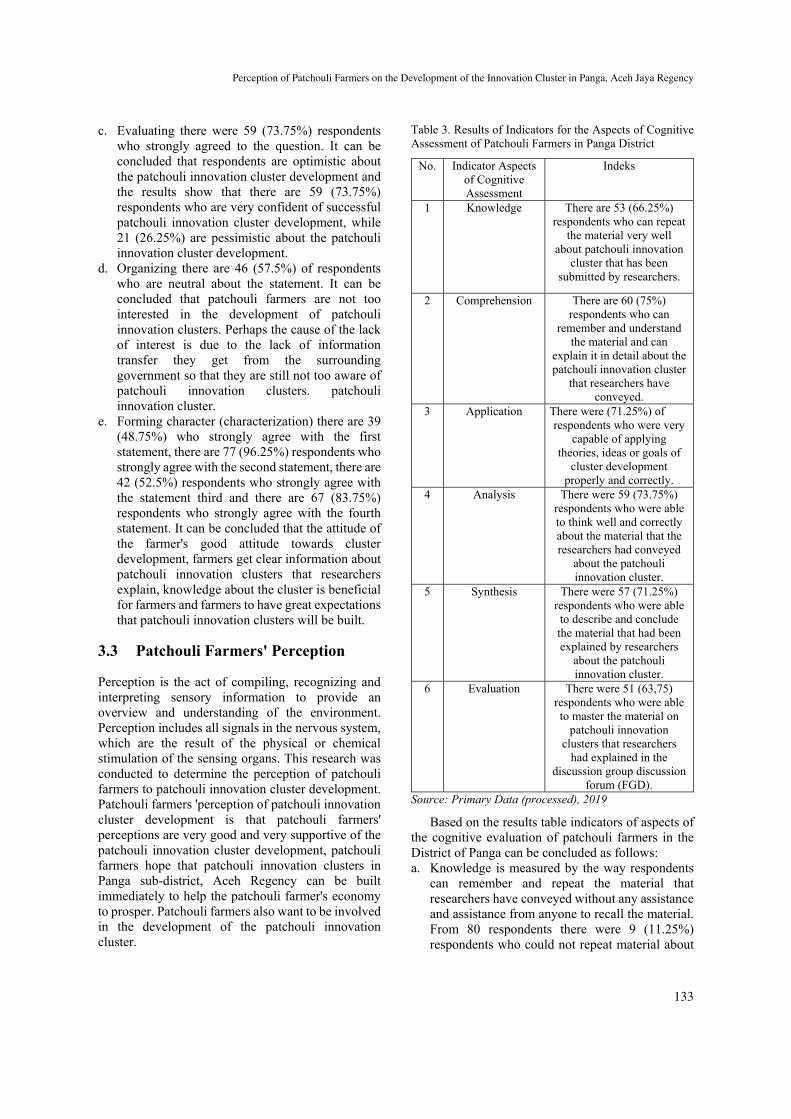
c. Evaluating there were 59 (73.75%) respondents who strongly agreed to the question. It can be concluded that respondents are optimistic about the patchouli innovation cluster development and the results show that there are 59 (73.75%) respondents who are very confident of successful patchouli innovation cluster development, while 21 (26.25%) are pessimistic about the patchouli innovation cluster development.
d. Organizing there are 46 (57.5%) of respondents who are neutral about the statement. It can be concluded that patchouli farmers are not too interested in the development of patchouli innovation clusters. Perhaps the cause of the lack of interest is due to the lack of information transfer they get from the surrounding government so that they are still not too aware of patchouli innovation clusters. patchouli innovation cluster.
e. Forming character (characterization) there are 39 (48.75%) who strongly agree with the first statement, there are 77 (96.25%) respondents who strongly agree with the second statement, there are 42 (52.5%) respondents who strongly agree with the statement third and there are 67 (83.75%) respondents who strongly agree with the fourth statement. It can be concluded that the attitude of the farmer's good attitude towards cluster development, farmers get clear information about patchouli innovation clusters that researchers explain, knowledge about the cluster is beneficial for farmers and farmers to have great expectations that patchouli innovation clusters will be built.
3.3 Patchouli Farmers' Perception
Perception is the act of compiling, recognizing and interpreting sensory information to provide an overview and understanding of the environment. Perception includes all signals in the nervous system, which are the result of the physical or chemical stimulation of the sensing organs. This research was conducted to determine the perception of patchouli farmers to patchouli innovation cluster development. Patchouli farmers 'perception of patchouli innovation cluster development is that patchouli farmers' perceptions are very good and very supportive of the patchouli innovation cluster development, patchouli farmers hope that patchouli innovation clusters in Panga sub-district, Aceh Regency can be built immediately to help the patchouli farmer's economy to prosper. Patchouli farmers also want to be involved in the development of the patchouli innovation cluster.
Table 3. Results of Indicators for the Aspects of Cognitive Assessment of Patchouli Farmers in Panga District
No. Indicator Aspects of Cognitive Assessment
Indeks
1 Knowledge There are 53 (66.25%) respondents who can repeat
the material very well about patchouli innovation
cluster that has been submitted by researchers.
2 Comprehension There are 60 (75%) respondents who can
remember and understand the material and can
explain it in detail about the patchouli innovation cluster
that researchers have conveyed.
3 Application There were (71.25%) of respondents who were very
capable of applying theories, ideas or goals of
cluster development properly and correctly.
4 Analysis There were 59 (73.75%) respondents who were able to think well and correctly about the material that the researchers had conveyed
about the patchouli innovation cluster.
5 Synthesis There were 57 (71.25%) respondents who were able to describe and conclude the material that had been explained by researchers
about the patchouli innovation cluster.
6 Evaluation There were 51 (63,75) respondents who were able to master the material on
patchouli innovation clusters that researchers
had explained in the discussion group discussion
forum (FGD). Source: Primary Data (processed), 2019
Based on the results table indicators of aspects of the cognitive evaluation of patchouli farmers in the District of Panga can be concluded as follows: a. Knowledge is measured by the way respondents
can remember and repeat the material that researchers have conveyed without any assistance and assistance from anyone to recall the material. From 80 respondents there were 9 (11.25%) respondents who could not repeat material about
Perception of Patchouli Farmers on the Development of the Innovation Cluster in Panga, Aceh Jaya Regency
133
patchouli innovation clusters that the researchers had explained, but there were also respondents who were unable to repeat well the material about patchouli innovation clusters that researchers had explained that was equal to 15 (15 18.75%) and there were 53 (66.25%) respondents who were able to repeat the material very well about the patchouli innovation cluster that was submitted by the researcher.
b. Comprehension is measured by the way respondents can understand and comprehend material that has been known and can recall the patchouli innovation cluster that has been delivered by researchers in detail and can explain in their own words. From 80 respondents there were 12 (15%) respondents who could not understand the patchouli innovation cluster material submitted by researchers, 8 (10%) were respondents who did not really understand the material about patchouli innovation cluster that researchers had conveyed and there were 60 (75%) respondents who are able to remember and understand the material and can explain it in detail about the patchouli innovation cluster that researchers have conveyed.
c. Application is measured by the ability to connect, choose, organize, move, arrange, use, apply, classify, change the structure. From 80 respondents there are 7 (8.75%) respondents who are unable to apply theories, ideas or goals of the patchouli innovation cluster development that researchers have conveyed, but there are 16 (20%) respondents who are not able to apply theories, ideas or cluster development goals and 57 (71.25%) other respondents are very capable of applying theories, ideas or cluster development goals properly and correctly.
d. The analysis is measured by the ability to think logically in reviewing a fact/object in more detail. Characterized by the ability to compare, analyse, find, allocate, differentiate, categorize. namely the ability to think to capture & apply appropriately about theories, principles, symbols in new/real situations. From 80 respondents there were 9 (11.25%) respondents who could not think logically in reviewing the material that researchers had conveyed about the patchouli innovation cluster, but there were 12 (15%) respondents who could not think logically in reviewing material that had been researchers convey about patchouli innovation cluster and there are 59 (73.75%) other respondents who are able to think well and correctly about the material
that researchers have conveyed about patchouli innovation cluster.
e. Synthesis is measured by the ability to think to integrate concepts logically so that it becomes a new pattern. Characterized by the ability to synthesize, infer, produce, develop, connect, specialize. From 80 respondents there were 6 (7.5%) respondents who were unable to conclude properly about patchouli innovation caster material that had been submitted by researchers, but there were also 17 (21.25%) respondents who could conclude material about patchouli innovation cluster was not so detailed and complete and there are 57 (71.25%) other respondents were able to describe and conclude the material that has been explained by researchers about the patchouli innovation cluster.
f. Evaluation is measured by the ability to think to be able to consider a situation, value system, methods, problems and solutions by using certain benchmarks as a benchmark. Characterized by the ability to judge, interpret, consider and determine. Of the 80 respondents there were 10 (12.5%) respondents who could not understand what the researchers explained about patchouli innovation clusters, but also there were 19 (23.75%) respondents who understood but not all of them understood only a portion of the material about patchouli innovation which he understood, and in addition there were 51 (63.75) respondents who were able to master the material on patchouli innovation clusters that researchers had explained in the Focus Group Discussion (FGD) forum.
4 CONCLUSION
1. After conducting the research, it was concluded that the attitudes and interests of patchouli farmers towards the development of patchouli innovation clusters based on the 5 indicators tested were: (1) Receiving 65% of respondents strongly agreed and accepting the development of patchouli innovation clusters. (2) Responding of 78.75% strongly agreed and happy to give questions about patchouli innovation cluster material and 55% of respondents strongly agreed and dared to express their opinions when the researchers had finished presenting material about the cluster. (3) Evaluating of 73.75% of respondents strongly agreed and optimistic about the development of the patchouli innovation cluster while 26.25% of the other respondents were pessimistic about the construction of the cluster. (4) Organizing 57.5%
ICEO 2019 - International Conference of Essential Oils
134
of respondents were neutral or the farmers' lack of interest in the development of patchouli innovation clusters caused the farmers were not interested because of lack of information obtained and frequent socialization or outreach by the local government. (5) Establish characterization of 48.75% of respondents strongly agree and have a positive attitude and attitude towards cluster development, amounting to 96.25% strongly agree and get very clear information from researchers about the cluster, amounting to 52.5% respondents strongly agree and according to these respondents knowledge of the cluster provides good benefits for them and 83.75% of respondents strongly agree and their expectations are very large towards the development of patchouli innovation cluster From the attitudes and interests in a scale of 5 (strongly agree). Because the most answers from respondents are scale 5 or (strongly agree) to the questions the researcher gave so it can be concluded that this shows that the cluster needs to be built immediately.
2. After conducting the research, it was concluded that patchouli farmers' perceptions of patchouli innovation cluster development based on 6 indicators tested were: (1) Knowledge of 66.25% of respondents who were able to repeat material very well. (2) Comprehension (75%) of respondents who can remember and understand the material and can explain it in detail about the patchouli innovation cluster. (3) Application of 71.25% of respondents is very capable of applying theories, ideas or the purpose of cluster development properly and correctly. (4) Analysis of 73.75% of respondents who can think properly and correctly about the material that researchers have conveyed about the patchouli innovation cluster. (5) Synthesis of 71.25% of respondents was able to describe and conclude the material that has been explained by researchers about patchouli innovation clusters and (6) Evaluation of 63.75% of respondents who can master the material about patchouli innovation clusters that the researcher explained in the Focus Group Discussion (FGD).
REFERENCES
Adam Smith 1998 Address: Location Cluster and The New Micro Economics of Competition. Business Economics: Jan 1998:33,1:
ABI/INFORM Global. 1990. The Competitive Advantage of Nations. Harvard Business Review.
Badan Perencanaan Pembangunan Nasional, 2004. Kajian Strategi Pengembangan Kawasan Dalam Rangka Mendukung Akselerasi Peningkatan Daya Saing Jakarta.
Badan Pusat Statistik: Produksi Nilam Aceh Jaya. BPS Aceh 2018.
Calhoun dan Acocella. 1990. Psikologi Tentang Penyesuaian dan Hubungan Kemanusiaan. Ed Ke-3, Terjemahan. IKIP. Semarang: Semarang Press.
Citra Dewi Nugrahenny 2016. Persepsi Masyarakat terhadap Pengelolaan Taman Wisata Alam Telogo Warno Telogo Pengilon.
Davidoff Linda L. 1980. Psikologi Suatu Pengantar. Erlangga. Jakarta.
Den Hartog C. 1998. The Seagrasses of The World. North holland publishing company. Amsterdam.
Direktorat Jenderal, Penguatan Inovasi Kementrian Riset, Teknologi, dan Perguruan Tinggi. 2017.
Information Design Associates with ICF Kaiser International, 1997. Cluster-based Economic Development: a key to regional competitiveness. US Department of Commerce. Washington, DC.
Fajar Muhaimin Abdha 2016. Persepsi Masyarakat Terhadap Hutan Mangrove di Desa Margasari Kabupaten Lampung Timur.
Harihanto. 2001. Persepsi, Sikap, dan Perilaku Masyarakat Terhadap Air Sungai. Pasca Sarjana. Institut Pertanian Bogor.
H. Nawawi dan M. Martini 1996. Penelitian Terapan. Gajah Mada University Press. Yogyakarta.
Hilgard, Ernest R., Gordon H. Bower, 1996. Theories of Learning, American Book Company, Meredith Publishing Company. New York.
Maulidi, L. 2005. Profil Investasi Pengusaha Nilam. Badan Penelitian dan Pengembangan Pertanian, Bogor.
Mahmud. 2011. Metode Penelitian Pendidikan. Pustaka Setia. Bandung.
Porter, M.E. 1998a. Cluster and The New Economics of Competition. Harvard Business Review.
Sugiyono. 2017. Metode Penelitian Kuantitatif, Kualitatif, dan R&D. Alfabeta. Bandung.
Syaifulloh. 2017. Unsyiah Kembangkan Minyak Atsiri di Aceh Jaya. www.unsyiah.ac.id/berita/unsyiah-kembangkan-minyak-atsiri-di-aceh-jaya
T. C. Mahmud A. 2019. Aceh Punya Nilam Singapore Punya Nama. Opini Koran WASPADA. https://waspadaaceh.com/2019/03/01/aceh-punya-nilam-terbaik-singapura-punya-nam
Perception of Patchouli Farmers on the Development of the Innovation Cluster in Panga, Aceh Jaya Regency
135
Wild Andaliman (Zanthoxylum acanthopodium DC.) Varieties as an
Aromatic Plants from North Sumatera
Endang Kintamani1,3, Cecep Kusmana 1, Tatang Tiryana1, Irmanida Batubara2, and Edi Mirmanto 3 1 Department of Tropical Silviculture, Forestry Faculty, IPB University, Bogor, Indonesia
2 Department of Chemistry, Natural Sciences Faculty, IPB University, Bogor, Indonesia 3 Research Center for Biology, Indonesian Institute of Sciences (LIPI), Cibinong, Indonesia
Keywords: Andaliman, Zanthoxylum acanthopodium DC., Variety, North Sumatera.
Abstract: Andaliman (Zanthoxylum acanthopodium DC.) is one of endemic plant in North Sumatera which produce
essential oil. This study aims to explore the wild Andaliman varieties and their characteristics based on
specimens and any information sourced from local community knowledge in North Sumatera. This research
was conducted through a vegetation survey with local communities in three districts based on three altitude
levels: North Tapanuli (1500-1600 masl), Samosir Island (1600-1700 masl) and Humbang Hasundutan
(1700-1800 masl) using 20 x 20 m plot with three replicates at each altitude level, totaling nine plots.
Observation was carried out through morphological characteristics: seeds, leaves, and prickles based on
specimens from the fieldwork and observing fruits, leaves, stems and prickles based on local community
knowledge by in-depth interview. The results showed that there were nine varieties Andaliman in North
Sumatera: Siholpu, Siganjangpat, Sihalus, Sihorbo, Simanuk, Sirangkak and there were three unnamed
varieties. Each variety grows in a different altitude and has morphological characteristics. Further research
will be carried out, related to the essential oil content of each Andaliman variety and its ecological conditions.
1 INTRODUCTION
Andaliman (Zanthoxylum acanthopodium DC.) is a
one of the Rutaceae family. (Hartley, 1966) reported
the natural distribution of Z. acanthopodium in India,
Nepal, Sikkim, Eastern Pakistan, Myanmar,
Thailand, China and Sumatra (Indonesia). In
Indonesia, this plant spread only in North Sumatera
Province and Aceh. The fruit of Andaliman is often
used by the Batak people as a spice for traditional
cuisine (Raja and Hartana, 2017; Wijaya, 1999).
Andaliman also an aromatic plant that can produce
essential oils in the fruit (Moektiwardoyo et al., 2014;
Wijaya et al., 2001; Majumder et al., 2014; He et al.,
2018) and the leaf (Rakic et al., 2009; Devi et al.,
2015; Rana and Blazquez, 2014).
Initially, Andaliman was not known to have
several varieties. However, Siregar (2003) stated that
there were two Andaliman “tuba sihorbo” and “tuba
siparjolo” in Dairi. (Parhusip, 2006) also stated that
there were three Andaliman varieties: Simanuk,
Sihorbo and Sitanga around Toba Lake. Raja and
Hartana, (2017) were reported that there were four
Andaliman cultivars: Simanuk, Sihorbo, Silokot and
Sikoreng which were distributed in Toba Samosir,
Simalungun, Dairi and North Tapanuli. Meanwhile
according to (Simbolon, 2018) there were two
varieties of Andaliman: Simanuk and Sihorbo in
Dairi, Toba Samosir and Simalungun. The objective
of this research is to explore the wild Andaliman
varieties and their characteristics based on specimens
and any information sourced from local community
knowledge in North Sumatera.
2 METHOD
This research was conducted at 2019 through a
vegetation survey with local communities in three
districts based on three altitude levels: North Tapanuli
(1.500-1.600 masl), Samosir Island (1.600-1.700
masl) and Humbang Hasundutan (1.700-1.800 masl)
using 20 x 20 m plot with three replicates at each
altitude level, totaling nine plots. Observation was
carried out through morphological characteristics:
seeds, leaves, and prickles based on specimens from
the fieldwork and observing fruits, leaves, stems and
prickles based on local community knowledge by in-
depth interview.
136Kintamani, E., Kusmana, C., Tiryana, T., Batubara, I. and Mirmanto, E.Wild Andaliman (Zanthoxylum acanthopodium DC.) Varieties as an Aromatic Plants from North Sumatera.In Proceedings of the 2nd International Conference of Essential Oils (ICEO 2019), pages 136-142ISBN: 978-989-758-456-5Copyright © 2020 by SCITEPRESS – Science and Technology Publications, Lda. All rights reserved
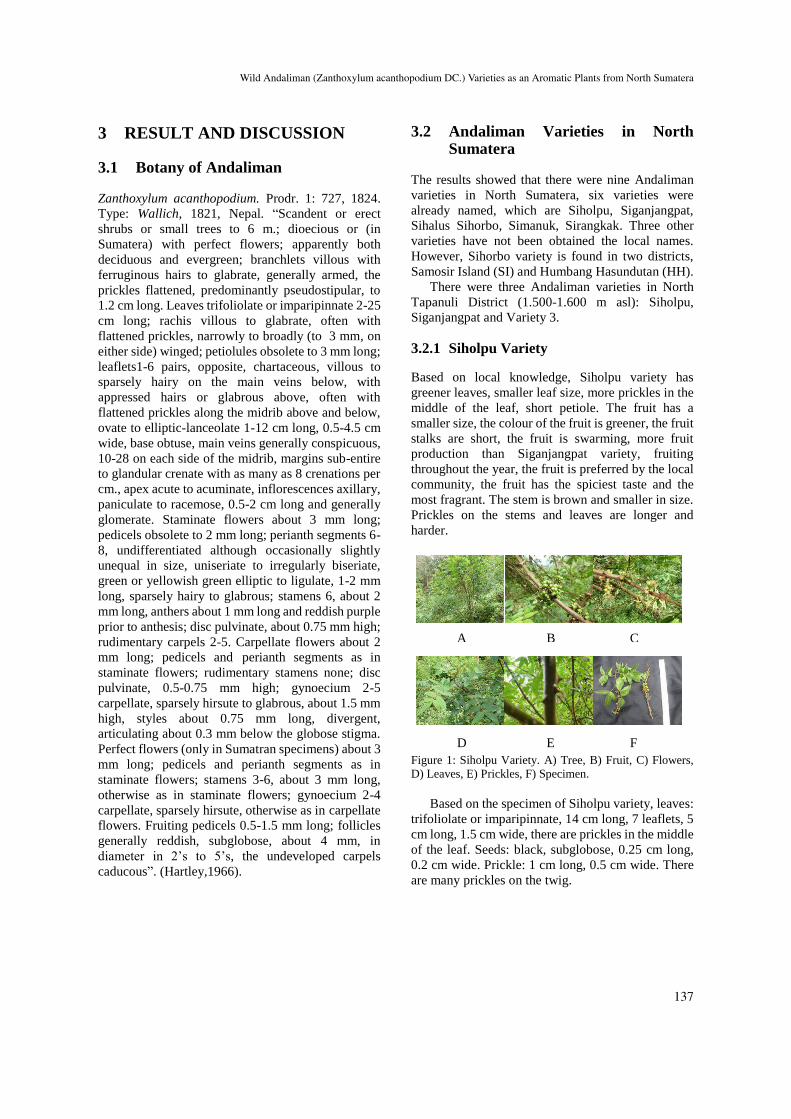
3 RESULT AND DISCUSSION
3.1 Botany of Andaliman
Zanthoxylum acanthopodium. Prodr. 1: 727, 1824.
Type: Wallich, 1821, Nepal. “Scandent or erect
shrubs or small trees to 6 m.; dioecious or (in
Sumatera) with perfect flowers; apparently both
deciduous and evergreen; branchlets villous with
ferruginous hairs to glabrate, generally armed, the
prickles flattened, predominantly pseudostipular, to
1.2 cm long. Leaves trifoliolate or imparipinnate 2-25
cm long; rachis villous to glabrate, often with
flattened prickles, narrowly to broadly (to 3 mm, on
either side) winged; petiolules obsolete to 3 mm long;
leaflets1-6 pairs, opposite, chartaceous, villous to
sparsely hairy on the main veins below, with
appressed hairs or glabrous above, often with
flattened prickles along the midrib above and below,
ovate to elliptic-lanceolate 1-12 cm long, 0.5-4.5 cm
wide, base obtuse, main veins generally conspicuous,
10-28 on each side of the midrib, margins sub-entire
to glandular crenate with as many as 8 crenations per
cm., apex acute to acuminate, inflorescences axillary,
paniculate to racemose, 0.5-2 cm long and generally
glomerate. Staminate flowers about 3 mm long;
pedicels obsolete to 2 mm long; perianth segments 6-
8, undifferentiated although occasionally slightly
unequal in size, uniseriate to irregularly biseriate,
green or yellowish green elliptic to ligulate, 1-2 mm
long, sparsely hairy to glabrous; stamens 6, about 2
mm long, anthers about 1 mm long and reddish purple
prior to anthesis; disc pulvinate, about 0.75 mm high;
rudimentary carpels 2-5. Carpellate flowers about 2
mm long; pedicels and perianth segments as in
staminate flowers; rudimentary stamens none; disc
pulvinate, 0.5-0.75 mm high; gynoecium 2-5
carpellate, sparsely hirsute to glabrous, about 1.5 mm
high, styles about 0.75 mm long, divergent,
articulating about 0.3 mm below the globose stigma.
Perfect flowers (only in Sumatran specimens) about 3
mm long; pedicels and perianth segments as in
staminate flowers; stamens 3-6, about 3 mm long,
otherwise as in staminate flowers; gynoecium 2-4
carpellate, sparsely hirsute, otherwise as in carpellate
flowers. Fruiting pedicels 0.5-1.5 mm long; follicles
generally reddish, subglobose, about 4 mm, in
diameter in 2’s to 5’s, the undeveloped carpels
caducous”. (Hartley,1966).
3.2 Andaliman Varieties in North Sumatera
The results showed that there were nine Andaliman
varieties in North Sumatera, six varieties were
already named, which are Siholpu, Siganjangpat,
Sihalus Sihorbo, Simanuk, Sirangkak. Three other
varieties have not been obtained the local names.
However, Sihorbo variety is found in two districts,
Samosir Island (SI) and Humbang Hasundutan (HH).
There were three Andaliman varieties in North
Tapanuli District (1.500-1.600 m asl): Siholpu,
Siganjangpat and Variety 3.
3.2.1 Siholpu Variety
Based on local knowledge, Siholpu variety has
greener leaves, smaller leaf size, more prickles in the
middle of the leaf, short petiole. The fruit has a
smaller size, the colour of the fruit is greener, the fruit
stalks are short, the fruit is swarming, more fruit
production than Siganjangpat variety, fruiting
throughout the year, the fruit is preferred by the local
community, the fruit has the spiciest taste and the
most fragrant. The stem is brown and smaller in size.
Prickles on the stems and leaves are longer and
harder.
Figure 1: Siholpu Variety. A) Tree, B) Fruit, C) Flowers,
D) Leaves, E) Prickles, F) Specimen.
Based on the specimen of Siholpu variety, leaves:
trifoliolate or imparipinnate, 14 cm long, 7 leaflets, 5
cm long, 1.5 cm wide, there are prickles in the middle
of the leaf. Seeds: black, subglobose, 0.25 cm long,
0.2 cm wide. Prickle: 1 cm long, 0.5 cm wide. There
are many prickles on the twig.
A B C
D E F
Wild Andaliman (Zanthoxylum acanthopodium DC.) Varieties as an Aromatic Plants from North Sumatera
137
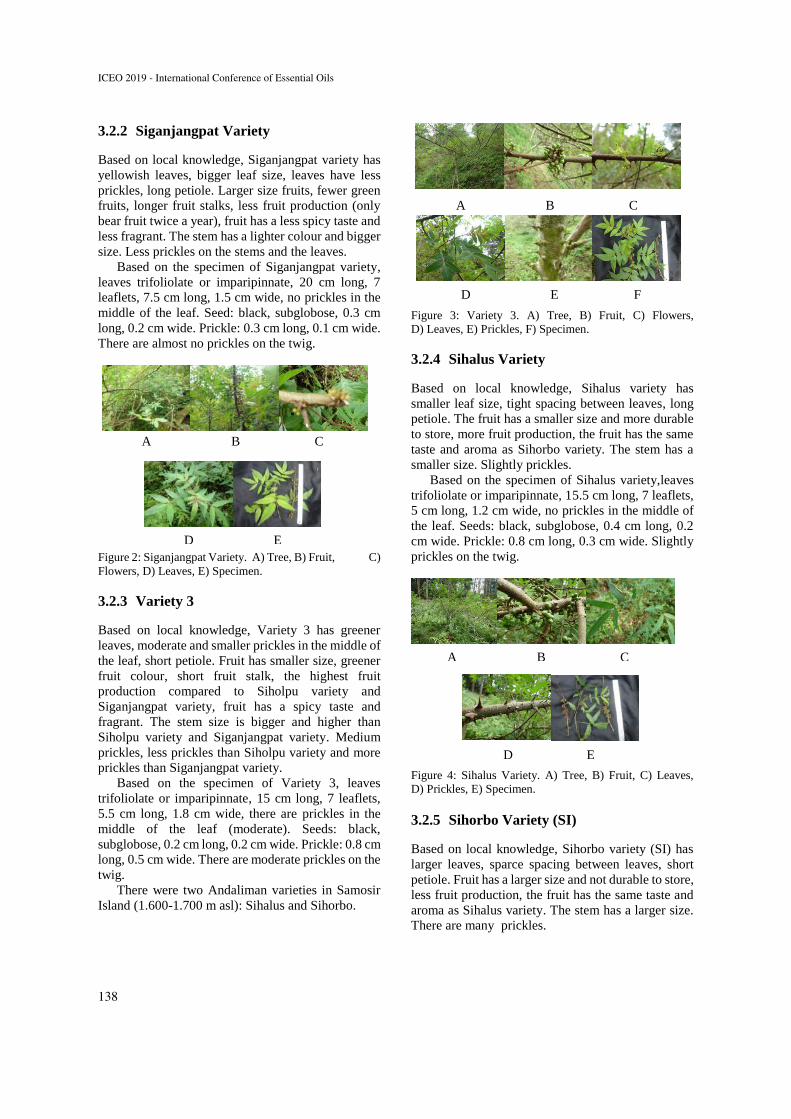
3.2.2 Siganjangpat Variety
Based on local knowledge, Siganjangpat variety has
yellowish leaves, bigger leaf size, leaves have less
prickles, long petiole. Larger size fruits, fewer green
fruits, longer fruit stalks, less fruit production (only
bear fruit twice a year), fruit has a less spicy taste and
less fragrant. The stem has a lighter colour and bigger
size. Less prickles on the stems and the leaves.
Based on the specimen of Siganjangpat variety,
leaves trifoliolate or imparipinnate, 20 cm long, 7
leaflets, 7.5 cm long, 1.5 cm wide, no prickles in the
middle of the leaf. Seed: black, subglobose, 0.3 cm
long, 0.2 cm wide. Prickle: 0.3 cm long, 0.1 cm wide.
There are almost no prickles on the twig.
Figure 2: Siganjangpat Variety. A) Tree, B) Fruit, C)
Flowers, D) Leaves, E) Specimen.
3.2.3 Variety 3
Based on local knowledge, Variety 3 has greener
leaves, moderate and smaller prickles in the middle of
the leaf, short petiole. Fruit has smaller size, greener
fruit colour, short fruit stalk, the highest fruit
production compared to Siholpu variety and
Siganjangpat variety, fruit has a spicy taste and
fragrant. The stem size is bigger and higher than
Siholpu variety and Siganjangpat variety. Medium
prickles, less prickles than Siholpu variety and more
prickles than Siganjangpat variety.
Based on the specimen of Variety 3, leaves
trifoliolate or imparipinnate, 15 cm long, 7 leaflets,
5.5 cm long, 1.8 cm wide, there are prickles in the
middle of the leaf (moderate). Seeds: black,
subglobose, 0.2 cm long, 0.2 cm wide. Prickle: 0.8 cm
long, 0.5 cm wide. There are moderate prickles on the
twig. There were two Andaliman varieties in Samosir
Island (1.600-1.700 m asl): Sihalus and Sihorbo.
Figure 3: Variety 3. A) Tree, B) Fruit, C) Flowers,
D) Leaves, E) Prickles, F) Specimen.
3.2.4 Sihalus Variety
Based on local knowledge, Sihalus variety has
smaller leaf size, tight spacing between leaves, long
petiole. The fruit has a smaller size and more durable
to store, more fruit production, the fruit has the same
taste and aroma as Sihorbo variety. The stem has a
smaller size. Slightly prickles.
Based on the specimen of Sihalus variety,leaves
trifoliolate or imparipinnate, 15.5 cm long, 7 leaflets,
5 cm long, 1.2 cm wide, no prickles in the middle of
the leaf. Seeds: black, subglobose, 0.4 cm long, 0.2
cm wide. Prickle: 0.8 cm long, 0.3 cm wide. Slightly
prickles on the twig.
Figure 4: Sihalus Variety. A) Tree, B) Fruit, C) Leaves,
D) Prickles, E) Specimen.
3.2.5 Sihorbo Variety (SI)
Based on local knowledge, Sihorbo variety (SI) has
larger leaves, sparce spacing between leaves, short
petiole. Fruit has a larger size and not durable to store,
less fruit production, the fruit has the same taste and
aroma as Sihalus variety. The stem has a larger size.
There are many prickles.
A B C
D E
A B C
D E F
A B C
D E
ICEO 2019 - International Conference of Essential Oils
138
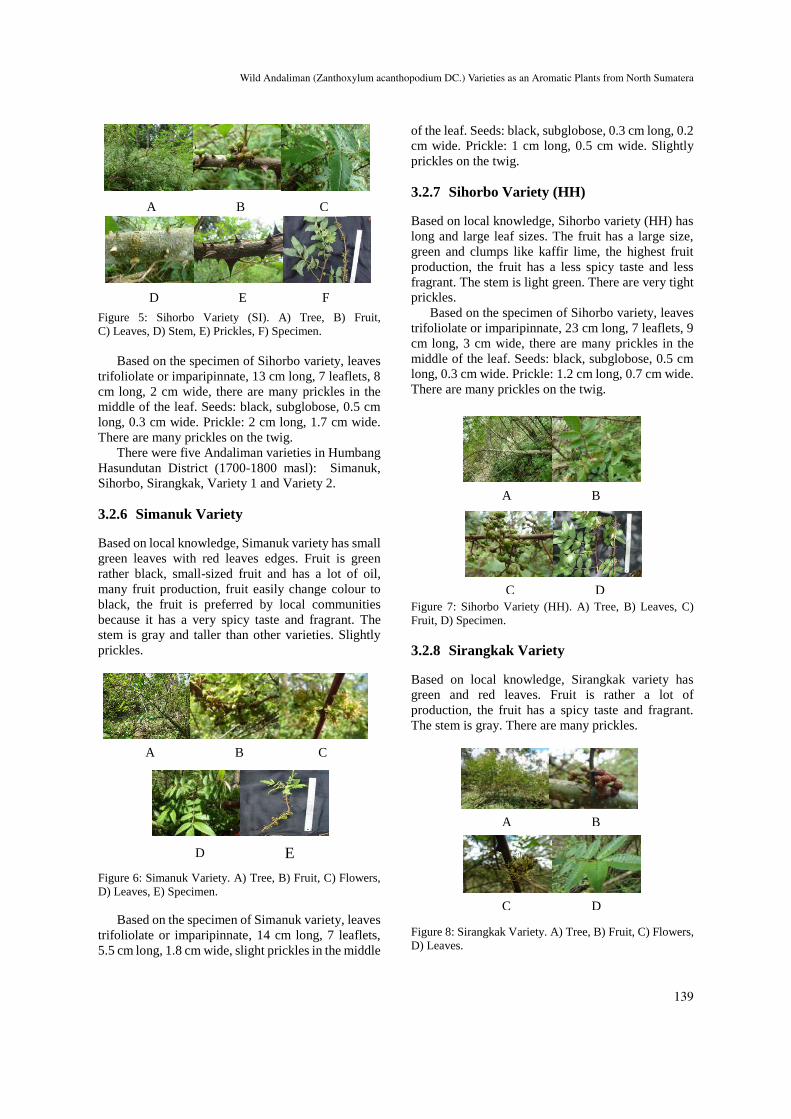
Figure 5: Sihorbo Variety (SI). A) Tree, B) Fruit,
C) Leaves, D) Stem, E) Prickles, F) Specimen.
Based on the specimen of Sihorbo variety, leaves
trifoliolate or imparipinnate, 13 cm long, 7 leaflets, 8
cm long, 2 cm wide, there are many prickles in the
middle of the leaf. Seeds: black, subglobose, 0.5 cm
long, 0.3 cm wide. Prickle: 2 cm long, 1.7 cm wide.
There are many prickles on the twig.
There were five Andaliman varieties in Humbang
Hasundutan District (1700-1800 masl): Simanuk,
Sihorbo, Sirangkak, Variety 1 and Variety 2.
3.2.6 Simanuk Variety
Based on local knowledge, Simanuk variety has small
green leaves with red leaves edges. Fruit is green
rather black, small-sized fruit and has a lot of oil,
many fruit production, fruit easily change colour to
black, the fruit is preferred by local communities
because it has a very spicy taste and fragrant. The
stem is gray and taller than other varieties. Slightly
prickles.
Figure 6: Simanuk Variety. A) Tree, B) Fruit, C) Flowers,
D) Leaves, E) Specimen.
Based on the specimen of Simanuk variety, leaves
trifoliolate or imparipinnate, 14 cm long, 7 leaflets,
5.5 cm long, 1.8 cm wide, slight prickles in the middle
of the leaf. Seeds: black, subglobose, 0.3 cm long, 0.2
cm wide. Prickle: 1 cm long, 0.5 cm wide. Slightly
prickles on the twig.
3.2.7 Sihorbo Variety (HH)
Based on local knowledge, Sihorbo variety (HH) has
long and large leaf sizes. The fruit has a large size,
green and clumps like kaffir lime, the highest fruit
production, the fruit has a less spicy taste and less
fragrant. The stem is light green. There are very tight
prickles.
Based on the specimen of Sihorbo variety, leaves
trifoliolate or imparipinnate, 23 cm long, 7 leaflets, 9
cm long, 3 cm wide, there are many prickles in the
middle of the leaf. Seeds: black, subglobose, 0.5 cm
long, 0.3 cm wide. Prickle: 1.2 cm long, 0.7 cm wide.
There are many prickles on the twig.
Figure 7: Sihorbo Variety (HH). A) Tree, B) Leaves, C)
Fruit, D) Specimen.
3.2.8 Sirangkak Variety
Based on local knowledge, Sirangkak variety has
green and red leaves. Fruit is rather a lot of
production, the fruit has a spicy taste and fragrant.
The stem is gray. There are many prickles.
Figure 8: Sirangkak Variety. A) Tree, B) Fruit, C) Flowers,
D) Leaves.
A B C
D E F
A B C
D E
A B
C D
A B
C D
Wild Andaliman (Zanthoxylum acanthopodium DC.) Varieties as an Aromatic Plants from North Sumatera
139
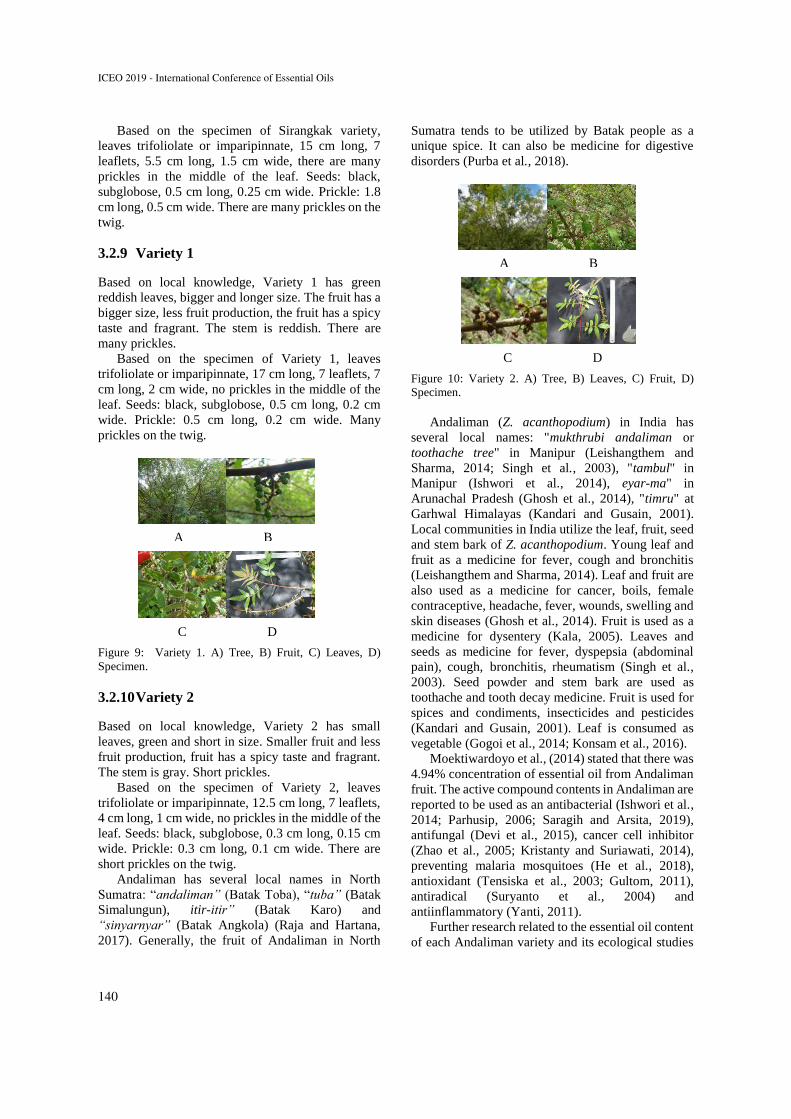
Based on the specimen of Sirangkak variety,
leaves trifoliolate or imparipinnate, 15 cm long, 7
leaflets, 5.5 cm long, 1.5 cm wide, there are many
prickles in the middle of the leaf. Seeds: black,
subglobose, 0.5 cm long, 0.25 cm wide. Prickle: 1.8
cm long, 0.5 cm wide. There are many prickles on the
twig.
3.2.9 Variety 1
Based on local knowledge, Variety 1 has green
reddish leaves, bigger and longer size. The fruit has a
bigger size, less fruit production, the fruit has a spicy
taste and fragrant. The stem is reddish. There are
many prickles.
Based on the specimen of Variety 1, leaves
trifoliolate or imparipinnate, 17 cm long, 7 leaflets, 7
cm long, 2 cm wide, no prickles in the middle of the
leaf. Seeds: black, subglobose, 0.5 cm long, 0.2 cm
wide. Prickle: 0.5 cm long, 0.2 cm wide. Many
prickles on the twig.
Figure 9: Variety 1. A) Tree, B) Fruit, C) Leaves, D)
Specimen.
3.2.10 Variety 2
Based on local knowledge, Variety 2 has small
leaves, green and short in size. Smaller fruit and less
fruit production, fruit has a spicy taste and fragrant.
The stem is gray. Short prickles.
Based on the specimen of Variety 2, leaves
trifoliolate or imparipinnate, 12.5 cm long, 7 leaflets,
4 cm long, 1 cm wide, no prickles in the middle of the
leaf. Seeds: black, subglobose, 0.3 cm long, 0.15 cm
wide. Prickle: 0.3 cm long, 0.1 cm wide. There are
short prickles on the twig.
Andaliman has several local names in North
Sumatra: “andaliman” (Batak Toba), “tuba” (Batak
Simalungun), itir-itir” (Batak Karo) and
“sinyarnyar” (Batak Angkola) (Raja and Hartana,
2017). Generally, the fruit of Andaliman in North
Sumatra tends to be utilized by Batak people as a
unique spice. It can also be medicine for digestive
disorders (Purba et al., 2018).
Figure 10: Variety 2. A) Tree, B) Leaves, C) Fruit, D)
Specimen.
Andaliman (Z. acanthopodium) in India has
several local names: "mukthrubi andaliman or
toothache tree" in Manipur (Leishangthem and
Sharma, 2014; Singh et al., 2003), "tambul" in
Manipur (Ishwori et al., 2014), eyar-ma" in
Arunachal Pradesh (Ghosh et al., 2014), "timru" at
Garhwal Himalayas (Kandari and Gusain, 2001).
Local communities in India utilize the leaf, fruit, seed
and stem bark of Z. acanthopodium. Young leaf and
fruit as a medicine for fever, cough and bronchitis
(Leishangthem and Sharma, 2014). Leaf and fruit are
also used as a medicine for cancer, boils, female
contraceptive, headache, fever, wounds, swelling and
skin diseases (Ghosh et al., 2014). Fruit is used as a
medicine for dysentery (Kala, 2005). Leaves and
seeds as medicine for fever, dyspepsia (abdominal
pain), cough, bronchitis, rheumatism (Singh et al.,
2003). Seed powder and stem bark are used as
toothache and tooth decay medicine. Fruit is used for
spices and condiments, insecticides and pesticides
(Kandari and Gusain, 2001). Leaf is consumed as
vegetable (Gogoi et al., 2014; Konsam et al., 2016).
Moektiwardoyo et al., (2014) stated that there was
4.94% concentration of essential oil from Andaliman
fruit. The active compound contents in Andaliman are
reported to be used as an antibacterial (Ishwori et al.,
2014; Parhusip, 2006; Saragih and Arsita, 2019),
antifungal (Devi et al., 2015), cancer cell inhibitor
(Zhao et al., 2005; Kristanty and Suriawati, 2014),
preventing malaria mosquitoes (He et al., 2018),
antioxidant (Tensiska et al., 2003; Gultom, 2011),
antiradical (Suryanto et al., 2004) and
antiinflammatory (Yanti, 2011).
Further research related to the essential oil content
of each Andaliman variety and its ecological studies
A B
C D
A B
C D
ICEO 2019 - International Conference of Essential Oils
140
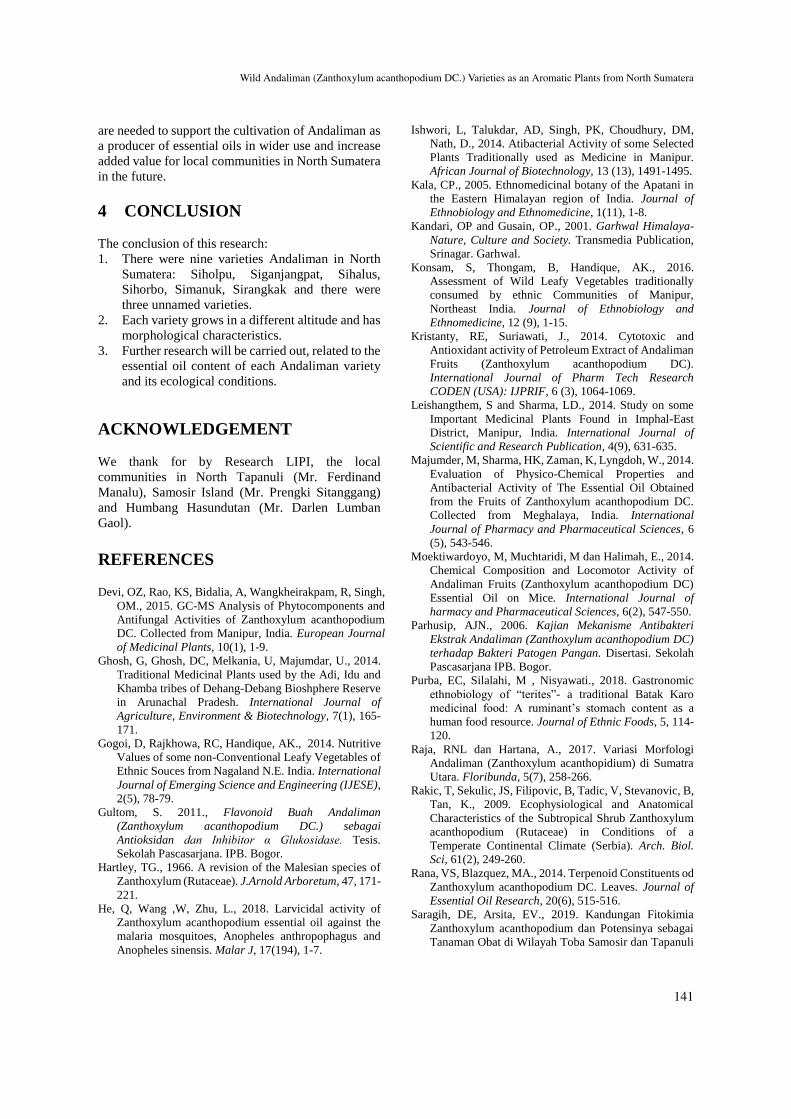
are needed to support the cultivation of Andaliman as
a producer of essential oils in wider use and increase
added value for local communities in North Sumatera
in the future.
4 CONCLUSION
The conclusion of this research:
1. There were nine varieties Andaliman in North
Sumatera: Siholpu, Siganjangpat, Sihalus,
Sihorbo, Simanuk, Sirangkak and there were
three unnamed varieties.
2. Each variety grows in a different altitude and has
morphological characteristics.
3. Further research will be carried out, related to the
essential oil content of each Andaliman variety
and its ecological conditions.
ACKNOWLEDGEMENT
We thank for by Research LIPI, the local
communities in North Tapanuli (Mr. Ferdinand
Manalu), Samosir Island (Mr. Prengki Sitanggang)
and Humbang Hasundutan (Mr. Darlen Lumban
Gaol).
REFERENCES
Devi, OZ, Rao, KS, Bidalia, A, Wangkheirakpam, R, Singh,
OM., 2015. GC-MS Analysis of Phytocomponents and
Antifungal Activities of Zanthoxylum acanthopodium
DC. Collected from Manipur, India. European Journal
of Medicinal Plants, 10(1), 1-9.
Ghosh, G, Ghosh, DC, Melkania, U, Majumdar, U., 2014.
Traditional Medicinal Plants used by the Adi, Idu and
Khamba tribes of Dehang-Debang Bioshphere Reserve
in Arunachal Pradesh. International Journal of
Agriculture, Environment & Biotechnology, 7(1), 165-
171.
Gogoi, D, Rajkhowa, RC, Handique, AK., 2014. Nutritive
Values of some non-Conventional Leafy Vegetables of
Ethnic Souces from Nagaland N.E. India. International
Journal of Emerging Science and Engineering (IJESE),
2(5), 78-79.
Gultom, S. 2011., Flavonoid Buah Andaliman
(Zanthoxylum acanthopodium DC.) sebagai
Antioksidan dan Inhibitor α Glukosidase. Tesis.
Sekolah Pascasarjana. IPB. Bogor.
Hartley, TG., 1966. A revision of the Malesian species of
Zanthoxylum (Rutaceae). J.Arnold Arboretum, 47, 171-
221.
He, Q, Wang ,W, Zhu, L., 2018. Larvicidal activity of
Zanthoxylum acanthopodium essential oil against the
malaria mosquitoes, Anopheles anthropophagus and
Anopheles sinensis. Malar J, 17(194), 1-7.
Ishwori, L, Talukdar, AD, Singh, PK, Choudhury, DM,
Nath, D., 2014. Atibacterial Activity of some Selected
Plants Traditionally used as Medicine in Manipur.
African Journal of Biotechnology, 13 (13), 1491-1495.
Kala, CP., 2005. Ethnomedicinal botany of the Apatani in
the Eastern Himalayan region of India. Journal of
Ethnobiology and Ethnomedicine, 1(11), 1-8.
Kandari, OP and Gusain, OP., 2001. Garhwal Himalaya-
Nature, Culture and Society. Transmedia Publication,
Srinagar. Garhwal.
Konsam, S, Thongam, B, Handique, AK., 2016.
Assessment of Wild Leafy Vegetables traditionally
consumed by ethnic Communities of Manipur,
Northeast India. Journal of Ethnobiology and
Ethnomedicine, 12 (9), 1-15.
Kristanty, RE, Suriawati, J., 2014. Cytotoxic and
Antioxidant activity of Petroleum Extract of Andaliman
Fruits (Zanthoxylum acanthopodium DC).
International Journal of Pharm Tech Research
CODEN (USA): IJPRIF, 6 (3), 1064-1069.
Leishangthem, S and Sharma, LD., 2014. Study on some
Important Medicinal Plants Found in Imphal-East
District, Manipur, India. International Journal of
Scientific and Research Publication, 4(9), 631-635.
Majumder, M, Sharma, HK, Zaman, K, Lyngdoh, W., 2014.
Evaluation of Physico-Chemical Properties and
Antibacterial Activity of The Essential Oil Obtained
from the Fruits of Zanthoxylum acanthopodium DC.
Collected from Meghalaya, India. International
Journal of Pharmacy and Pharmaceutical Sciences, 6
(5), 543-546.
Moektiwardoyo, M, Muchtaridi, M dan Halimah, E., 2014.
Chemical Composition and Locomotor Activity of
Andaliman Fruits (Zanthoxylum acanthopodium DC)
Essential Oil on Mice. International Journal of
harmacy and Pharmaceutical Sciences, 6(2), 547-550.
Parhusip, AJN., 2006. Kajian Mekanisme Antibakteri
Ekstrak Andaliman (Zanthoxylum acanthopodium DC)
terhadap Bakteri Patogen Pangan. Disertasi. Sekolah
Pascasarjana IPB. Bogor.
Purba, EC, Silalahi, M , Nisyawati., 2018. Gastronomic
ethnobiology of “terites”- a traditional Batak Karo
medicinal food: A ruminant’s stomach content as a
human food resource. Journal of Ethnic Foods, 5, 114-
120.
Raja, RNL dan Hartana, A., 2017. Variasi Morfologi
Andaliman (Zanthoxylum acanthopidium) di Sumatra
Utara. Floribunda, 5(7), 258-266.
Rakic, T, Sekulic, JS, Filipovic, B, Tadic, V, Stevanovic, B,
Tan, K., 2009. Ecophysiological and Anatomical
Characteristics of the Subtropical Shrub Zanthoxylum
acanthopodium (Rutaceae) in Conditions of a
Temperate Continental Climate (Serbia). Arch. Biol.
Sci, 61(2), 249-260.
Rana, VS, Blazquez, MA., 2014. Terpenoid Constituents od
Zanthoxylum acanthopodium DC. Leaves. Journal of
Essential Oil Research, 20(6), 515-516.
Saragih, DE, Arsita, EV., 2019. Kandungan Fitokimia
Zanthoxylum acanthopodium dan Potensinya sebagai
Tanaman Obat di Wilayah Toba Samosir dan Tapanuli
Wild Andaliman (Zanthoxylum acanthopodium DC.) Varieties as an Aromatic Plants from North Sumatera
141
Utara, Sumatera Utara. Pros Sem Nas Masy Biodiv
Indon, 5(1), 71-76.
Simbolon, WE, Kardhinata, EH, Bangun, MK dan
Simatupang, S., 2018. Identifikasi Karakter Morfologis
Andaliman (Zanthoxylum acanthopodium DC.) di
Beberapa Kabupaten di Sumatera Utara. Jurnal
Agroekoteknologi FP USU, 6(4), 745-756.
Singh, HB, Singh, RS, Sandhu, JS., 2003. Herbal Medicine
of Manipur. Daya Publishing House. Delhi Vol. 1.
Siregar, BL., 2003. Andaliman (Zanthoxylum
acanthopodium DC) di Sumatera Utara: Deskripsi dan
Perkecambahan. Hayati, 10 (1), 38-40.
Suryanto, E, Sastrohamidjojo, H, Raharjo, S, Tranggono.,
2004. Antiradical activity of Andaliman (Zanthoxylum
acanthopodium DC) Fruit Extract. Indonesian Food
and Nutrition Progress, 11 (1), 15-19.
Tensiska, Wijaya, CH, Andarwulan, N., 2003. Antivitas
Antioksidan Ekstrak Buah Andaliman (Zanthoxylum
acanthopodium DC) dalam Beberapa Sistem Pangan
dan Kestabilan Aktivitasnya terhadap Kondisi Suhu
dan pH. Jurnal Teknologi dan Industri Pangan XIV, (1),
29-39.
Wijaya, CH., 1999. Telaah Ringkas Rempah-Rempah
Tradisional Andaliman, Rempah Tradisional Sumatera
Utara dengan Aktivitas Antioksidan dan Antimikroba.
Bul. Teknol. Dan Industri Pangan X, (2), 59-61.
Wijaya, CH, Hadiprodjo, IT, dan Apriyantono, A., 2001.
Komponen Volatil dan Karakterisasi Komponen Kunci
Aroma Buah Andaliman (Zanthoxylum acanthopodium
DC). Jurnal Teknol. Dan Industri Pangan XII, (2), 117-
125.
Yanti, Pramudito, TE, Nuriasari, N , Juliana, K., 2011.
Lemon Pepper Fruit Extract (Zanthoxylum
acanthopodium DC.) Supress the Expression of
Inflammatory Mediators in Lipopolysaccharide-
Induced Macrophages in Vitro. American Journal of
Biochemistry and Biotechnology, 7(4), 190-195.
Zhao, Q, Cui, C, Cai, B, Qiu, F, Guo, T, Yao, X., 2005. Cell
Cycle Inhibitory Activity of 137 Traditional Chinese
Herbal Medicines Against tsFT210 Cell Line.
Pharmaceutical Biology, 43 (2), 135-139.
ICEO 2019 - International Conference of Essential Oils
142
Antimicrobial Label from Lemongrass Oil Incorporated with Chitosan/Ascorbic Acid
Retno Yunilawati 1, Windri Handayani 2, Agustina Arianita C.3, Bunda Amalia 3 and Cuk Imawan *1
1 Departemen Fisika, Fakultas Matematika dan Ilmu Pengetahuan Alam (FMIPA), Universitas Indonesia, Depok 16424, Indonesia
2 Departemen Biologi, Fakultas Matematika dan Ilmu Pengetahuan Alam (FMIPA), Universitas Indonesia, Depok 16424, Indonesia
3 Badan Penelitian dan Pengembangan Industri, Kementerian Perindustrian, Indonesia [email protected]
Keywords: Antimicrobial Label, Lemongrass Oil, Chitosan, Ascorbic Acid
Abstract: Lemongrass oil is one of the essential oil which potential to be used as an antimicrobial agent in active packaging. The aim of this research is to prepare antimicrobial labels and assess their activity. Antimicrobial labels are made from a matrix of chitosan/ascorbic acid and lemongrass oil as active ingredients with various concentrations ranging from 1% to 10%. Lemongrass oil was characterized using Gas Chromatography-Mass Spectrometry (GC-MS) to determine compounds suspected of having antimicrobial activity. The GCMS chromatograms have shown that lemongrass oil contains 73.21% citral compounds composed of 29% neral (beta-citral) and 44.21% geranial (alpha-citral) as antimicrobial agents. Lemongrass oil was tested on Gram-positive bacteria Staphylococcus aureus and Gram-negative bacteria Escherichia coli using direct method and vapor method. This test has shown that lemongrass oil has antimicrobial activity in both bacteria. The labels provide optimum antimicrobial activity for the lemongrass oil concentration of 10%. These results conclude that the lemongrass oil incorporated with chitosan/ascorbic acid has the potential to be an active packaging. The abstract should summarize the contents of the paper and should contain at least 70 and at most 200 words. It should be set in 9-point font size, justified and should have a hanging indent of 2-centimenter. There should be a space before of 12-point and after of 30-point.
1 INTRODUCTION
Antimicrobial label is one form of active packaging application, where the packaging made with the aim to maintain the quality of the material it is packaged. Antimicrobial labels are made by combining antimicrobial materials into a polymer. Essential oil has been widely used as an antimicrobial agent considering its safe, natural, environmentally friendly, and has a broad spectrum. One of the essential oils is lemongrass oil. Lemongrass oil contains several compounds such as neral and geranial which can function as antimicrobials (Argyropoulou et al., 2007).
In this research lemongrass oil is incorporated with chitosan which is a biodegradable polymer forming an antimicrobial label. Chitosan is a polymer that insoluble in neutral pH, but soluble in acidic environment, such as acetic acid, formic acid, and hydrochloric acid. Acetic acid has an unpleasant and
pungent odor that can later affect food products in the label application. Likewise, formic acid and hydrochloric acid which has a pungent odor and can penetrate (Ozdemir Kubra S, 2017). Therefore, this research uses ascorbic acid as an alternative to chitosan, which has safer than acetic acid and hydrochloric acid.
This research aims to prepare antimicrobial label using lemongrass oil incorporate with chitosan/ascorbic acid and investigate their antimicrobial activity
2 MATERIALS AND METHODS
2.1 Materials
Lemongrass oil was used in this experiment obtained from Nusaroma, a local essential oils company in Indonesia. The chemical materials used in this
Yunilawati, R., Handayani, W., Arianita C., A., Amalia, B. and Imawan, C.Antimicrobial Label from Lemongrass Oil Incorporated with Chitosan/Ascorbic Acid.In Proceedings of the 2nd International Conference of Essential Oils (ICEO 2019), pages 143-148ISBN: 978-989-758-456-5Copyright © 2020 by SCITEPRESS – Science and Technology Publications, Lda. All rights reserved
143
experiment were ascorbic acid (Merck), chitosan in powder form (PT. Biokitosan Indonesia), and tween 80.
2.2 Methods
2.2.1 Lemongrass Oil Characterization
Lemongrass oil compounds were identified by gas chromatography with a mass spectrometer detector (GC-MS) Agilent 6890 series with capillary column HP-5MS, 30 m x 0.25 mm id x 0.25 µm film thickness. Helium gas was used as the carrier gas at constant pressure of 65 kPa. The lemongrass oil was injected with a volume of 1 µL in split ratio of 1:25. The increasing of oven temperature was programmed from 60-240°C with step of 3°C per minute until reaching 240°C.
2.2.2 Antimicrobial Assay of Lemongrass Oil
Direct Contact Agar Diffusion Tests. This method used the method carried out by (Handayani et al., 2019). The antimicrobial activities determined by the paper disc diffusion method using type strain of Staphylococcus aureus NBRC 100910 and Escherichia coli NBRC 3301 in The Mueller Hinton Agar. 10 ml of molten media poured into sterile Petri plates (d=90 mm) and allowed to solidify for 5 minutes. After that, in a tube, 10 µl of bacteria culture 10-6 CFU/mL added with 10 ml of medium and mixed gently with the inoculate before poured on the top of molten media before and allowed to dry for 5 minutes. The negative control (sterile distilled water), positive control (tetracycline 15 µg/mL), lemongrass oil with concentration 1000 µg/mL loaded on 6 mm disc, whereas the volume for each disc was 10 µl. The loaded disc placed on the surface of the medium then incubates at 35°C for 18 hours. After the end of incubation, a clear zone formed around the disc was measured.
Vapor Phase Agar Diffusion Test. This vapor method used the method carried out by (Wang et al., 2016). The vapor phase agar diffusion test was technically similar to the direct contact diffusion test. However, the filter discs were placed at the top in centre of the inner side of the Petri dish cover. The dishes were then sealed using laboratory parafilm to
avoid evaporation of the test compounds, followed by incubation at 37°C for 24 h. The diameter of the inhibition zone was recorded.
2.2.3 Antimicrobial Labels Preparation
The chitosan solution was prepared by dissolving 2 g of chitosan powder into 100 mL of 1% (w/v) ascorbic acid and stirring at 200 rpm for 2 h at 50 °C using a magnetic stirrer. The antimicrobial label was prepared by mixing lemongrass oil with 30 mL of the chitosan solution in four different concentrations (1 % v/v, 3%v/v, 5% v/v and 10% v/v) with the added of tween 80 as surfactant (0.2% v/v) and stirring the resultant mixture for 10 min at room temperature using a magnetic stirrer. The label solution was poured onto a 10 × 15 cm acrylic board and left for 48 h at room temperature to form the film.
2.2.4 Antimicrobial Labels Characterization
A uv vis spectrophotometer (Shimadzu UV-2450) was used to measure the reflectance of the chitosan label and lemongrass-chitosan labels. A Fourier Transform Infrared (FTIR) spectra were collected for the chitosan label dan the lemongrass-chitosan labels using a double-beam spectrophotometer (Thermo Nicolet iS5) to determine the functional group
2.2.5 Antimicrobial Assay of Labels
The antimicrobial activities of labels were tested in direct contact agar diffusion test and vapor phase agar diffusion test. Labels are cut in a circle with a diameter of 6 mm and then placed in a petri dish to test antimicrobial activity with the technique as described previously.
3 RESULTS AND DISCUSSION
3.1 Chemical Compounds of Lemongrass Oil
Characterization using GC-MS showed the chromatogram profile detected 6 peaks in lemongrass oil (Figure 1) which indicated there were 6 compounds in lemongrass oil. The compounds were identified based on comparison of mass spectrum
ICEO 2019 - International Conference of Essential Oils
144
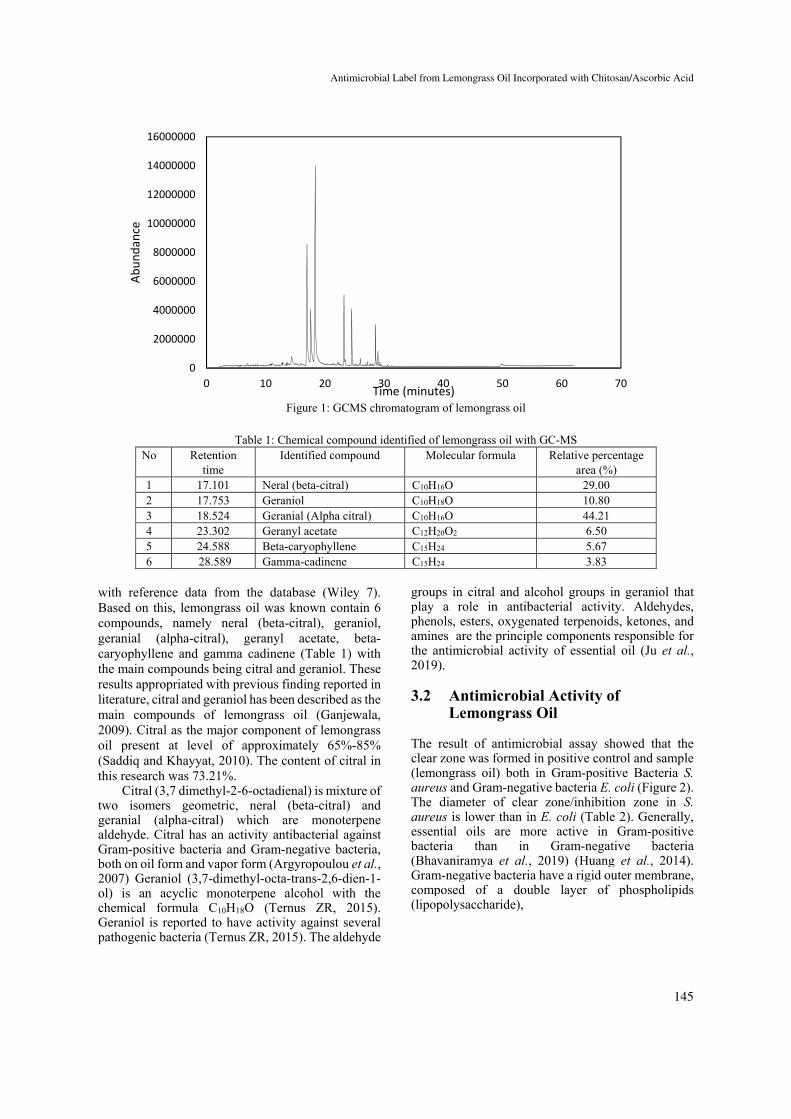
Figure 1: GCMS chromatogram of lemongrass oil
Table 1: Chemical compound identified of lemongrass oil with GC-MS
No Retention time
Identified compound Molecular formula Relative percentage area (%)
1 17.101 Neral (beta-citral) C10H16O 29.00 2 17.753 Geraniol C10H18O 10.80 3 18.524 Geranial (Alpha citral) C10H16O 44.21 4 23.302 Geranyl acetate C12H20O2 6.50 5 24.588 Beta-caryophyllene C15H24 5.67 6 28.589 Gamma-cadinene C15H24 3.83
with reference data from the database (Wiley 7). Based on this, lemongrass oil was known contain 6 compounds, namely neral (beta-citral), geraniol, geranial (alpha-citral), geranyl acetate, beta-caryophyllene and gamma cadinene (Table 1) with the main compounds being citral and geraniol. These results appropriated with previous finding reported in literature, citral and geraniol has been described as the main compounds of lemongrass oil (Ganjewala, 2009). Citral as the major component of lemongrass oil present at level of approximately 65%-85% (Saddiq and Khayyat, 2010). The content of citral in this research was 73.21%.
Citral (3,7 dimethyl-2-6-octadienal) is mixture of two isomers geometric, neral (beta-citral) and geranial (alpha-citral) which are monoterpene aldehyde. Citral has an activity antibacterial against Gram-positive bacteria and Gram-negative bacteria, both on oil form and vapor form (Argyropoulou et al., 2007) Geraniol (3,7-dimethyl-octa-trans-2,6-dien-1-ol) is an acyclic monoterpene alcohol with the chemical formula C10H18O (Ternus ZR, 2015). Geraniol is reported to have activity against several pathogenic bacteria (Ternus ZR, 2015). The aldehyde
groups in citral and alcohol groups in geraniol that play a role in antibacterial activity. Aldehydes, phenols, esters, oxygenated terpenoids, ketones, and amines are the principle components responsible for the antimicrobial activity of essential oil (Ju et al., 2019).
3.2 Antimicrobial Activity of Lemongrass Oil
The result of antimicrobial assay showed that the clear zone was formed in positive control and sample (lemongrass oil) both in Gram-positive Bacteria S. aureus and Gram-negative bacteria E. coli (Figure 2). The diameter of clear zone/inhibition zone in S. aureus is lower than in E. coli (Table 2). Generally, essential oils are more active in Gram-positive bacteria than in Gram-negative bacteria (Bhavaniramya et al., 2019) (Huang et al., 2014). Gram-negative bacteria have a rigid outer membrane, composed of a double layer of phospholipids (lipopolysaccharide),
0
2000000
4000000
6000000
8000000
10000000
12000000
14000000
16000000
0 10 20 30 40 50 60 70
Abundance
Time (minutes)
Antimicrobial Label from Lemongrass Oil Incorporated with Chitosan/Ascorbic Acid
145
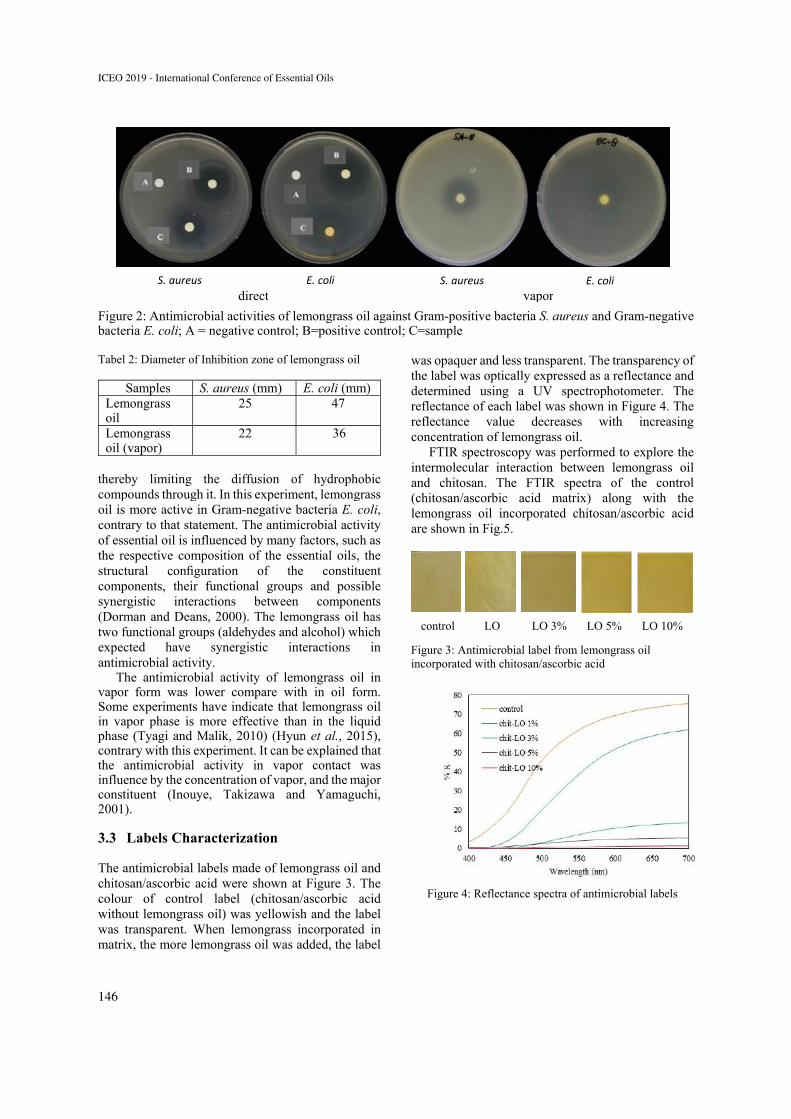
Figure 2: Antimicrobial activities of lemongrass oil against Gram-positive bacteria S. aureus and Gram-negative bacteria E. coli; A = negative control; B=positive control; C=sample Tabel 2: Diameter of Inhibition zone of lemongrass oil
Samples S. aureus (mm) E. coli (mm)Lemongrass oil
25 47
Lemongrass oil (vapor)
22 36
thereby limiting the diffusion of hydrophobic compounds through it. In this experiment, lemongrass oil is more active in Gram-negative bacteria E. coli, contrary to that statement. The antimicrobial activity of essential oil is influenced by many factors, such as the respective composition of the essential oils, the structural configuration of the constituent components, their functional groups and possible synergistic interactions between components (Dorman and Deans, 2000). The lemongrass oil has two functional groups (aldehydes and alcohol) which expected have synergistic interactions in antimicrobial activity.
The antimicrobial activity of lemongrass oil in vapor form was lower compare with in oil form. Some experiments have indicate that lemongrass oil in vapor phase is more effective than in the liquid phase (Tyagi and Malik, 2010) (Hyun et al., 2015), contrary with this experiment. It can be explained that the antimicrobial activity in vapor contact was influence by the concentration of vapor, and the major constituent (Inouye, Takizawa and Yamaguchi, 2001).
3.3 Labels Characterization
The antimicrobial labels made of lemongrass oil and chitosan/ascorbic acid were shown at Figure 3. The colour of control label (chitosan/ascorbic acid without lemongrass oil) was yellowish and the label was transparent. When lemongrass incorporated in matrix, the more lemongrass oil was added, the label
was opaquer and less transparent. The transparency of the label was optically expressed as a reflectance and determined using a UV spectrophotometer. The reflectance of each label was shown in Figure 4. The reflectance value decreases with increasing concentration of lemongrass oil.
FTIR spectroscopy was performed to explore the intermolecular interaction between lemongrass oil and chitosan. The FTIR spectra of the control (chitosan/ascorbic acid matrix) along with the lemongrass oil incorporated chitosan/ascorbic acid are shown in Fig.5.
Figure 3: Antimicrobial label from lemongrass oil incorporated with chitosan/ascorbic acid
Figure 4: Reflectance spectra of antimicrobial labels
control LO LO 3% LO 5% LO 10%
S. aureus E. coli S. aureus E. coli direct vapor
ICEO 2019 - International Conference of Essential Oils
146
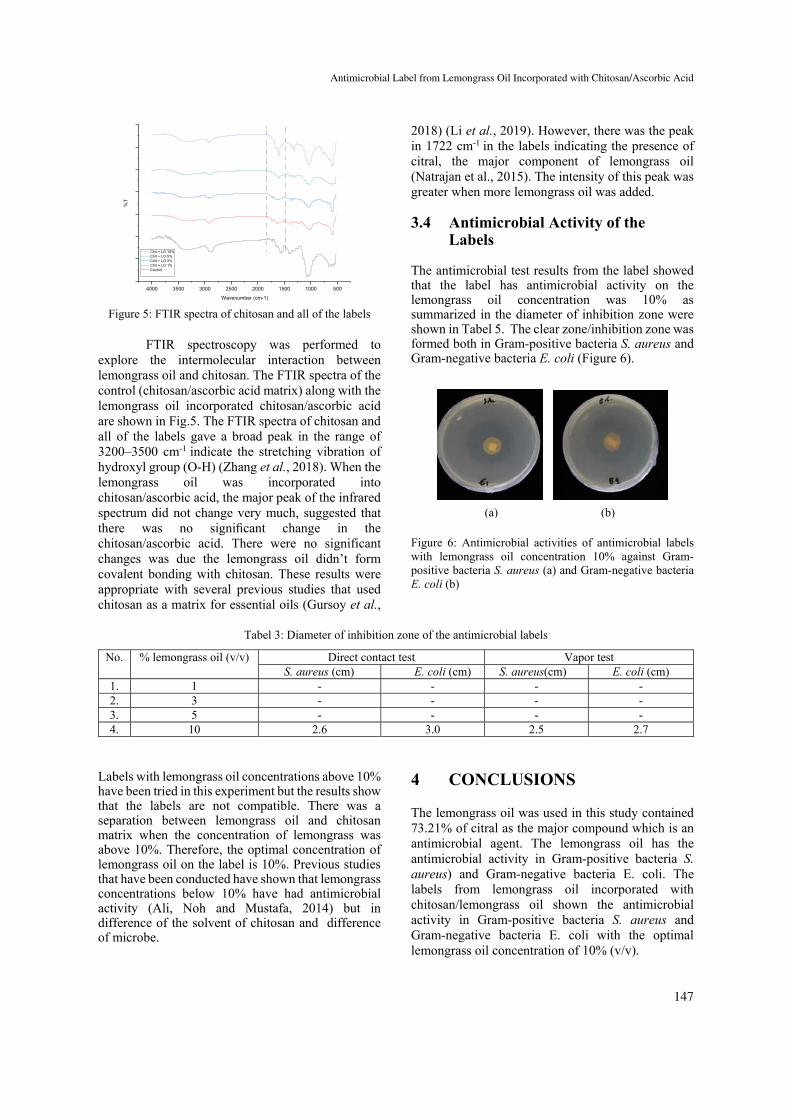
4000 3500 3000 2500 2000 1500 1000 500
%T
Wavenumber (cm-1)
Chit + LO 10% Chit + LO 5% Chit + LO 3% Chit + LO 1% Control
Figure 5: FTIR spectra of chitosan and all of the labels
FTIR spectroscopy was performed to explore the intermolecular interaction between lemongrass oil and chitosan. The FTIR spectra of the control (chitosan/ascorbic acid matrix) along with the lemongrass oil incorporated chitosan/ascorbic acid are shown in Fig.5. The FTIR spectra of chitosan and all of the labels gave a broad peak in the range of 3200–3500 cm-1 indicate the stretching vibration of hydroxyl group (O-H) (Zhang et al., 2018). When the lemongrass oil was incorporated into chitosan/ascorbic acid, the major peak of the infrared spectrum did not change very much, suggested that there was no significant change in the chitosan/ascorbic acid. There were no significant changes was due the lemongrass oil didn’t form covalent bonding with chitosan. These results were appropriate with several previous studies that used chitosan as a matrix for essential oils (Gursoy et al.,
2018) (Li et al., 2019). However, there was the peak in 1722 cm-1 in the labels indicating the presence of citral, the major component of lemongrass oil (Natrajan et al., 2015). The intensity of this peak was greater when more lemongrass oil was added.
3.4 Antimicrobial Activity of the Labels
The antimicrobial test results from the label showed that the label has antimicrobial activity on the lemongrass oil concentration was 10% as summarized in the diameter of inhibition zone were shown in Tabel 5. The clear zone/inhibition zone was formed both in Gram-positive bacteria S. aureus and Gram-negative bacteria E. coli (Figure 6).
Figure 6: Antimicrobial activities of antimicrobial labels with lemongrass oil concentration 10% against Gram-positive bacteria S. aureus (a) and Gram-negative bacteria E. coli (b)
Tabel 3: Diameter of inhibition zone of the antimicrobial labels
No. % lemongrass oil (v/v) Direct contact test Vapor test S. aureus (cm) E. coli (cm) S. aureus(cm) E. coli (cm)
1. 1 - - - - 2. 3 - - - - 3. 5 - - - - 4. 10 2.6 3.0 2.5 2.7
Labels with lemongrass oil concentrations above 10% have been tried in this experiment but the results show that the labels are not compatible. There was a separation between lemongrass oil and chitosan matrix when the concentration of lemongrass was above 10%. Therefore, the optimal concentration of lemongrass oil on the label is 10%. Previous studies that have been conducted have shown that lemongrass concentrations below 10% have had antimicrobial activity (Ali, Noh and Mustafa, 2014) but in difference of the solvent of chitosan and difference of microbe.
4 CONCLUSIONS
The lemongrass oil was used in this study contained 73.21% of citral as the major compound which is an antimicrobial agent. The lemongrass oil has the antimicrobial activity in Gram-positive bacteria S. aureus) and Gram-negative bacteria E. coli. The labels from lemongrass oil incorporated with chitosan/lemongrass oil shown the antimicrobial activity in Gram-positive bacteria S. aureus and Gram-negative bacteria E. coli with the optimal lemongrass oil concentration of 10% (v/v).
(a) (b)
Antimicrobial Label from Lemongrass Oil Incorporated with Chitosan/Ascorbic Acid
147
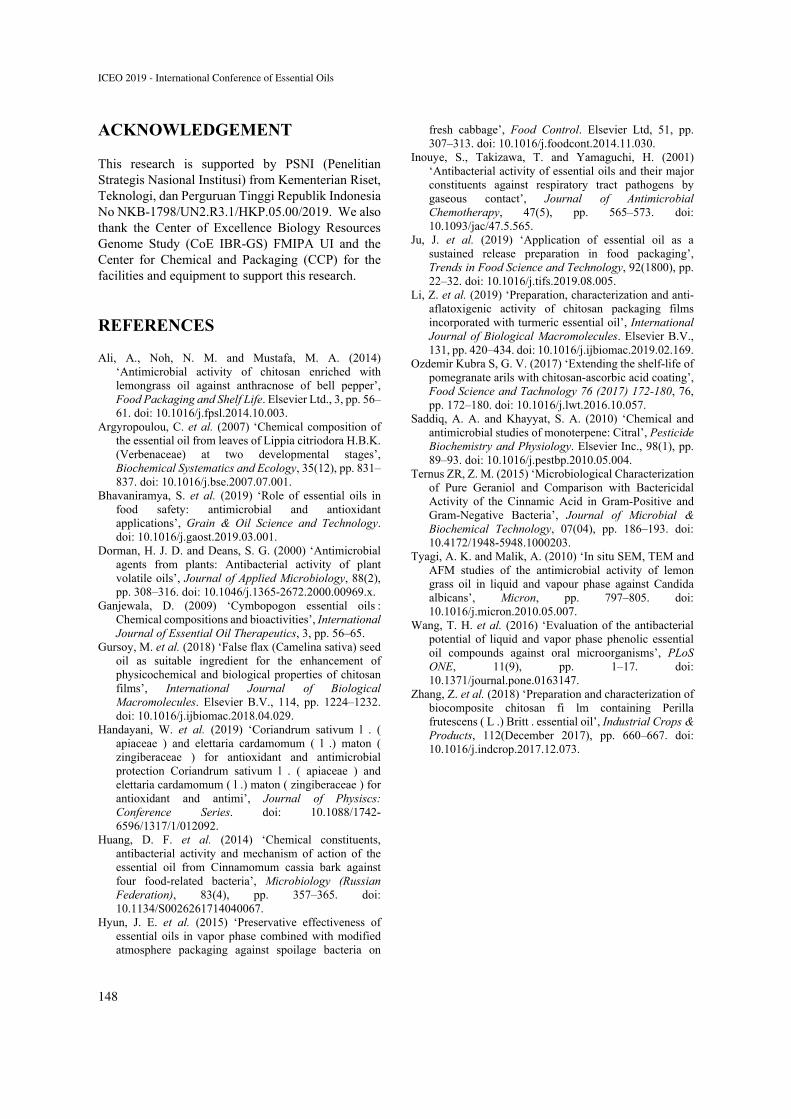
ACKNOWLEDGEMENT
This research is supported by PSNI (Penelitian Strategis Nasional Institusi) from Kementerian Riset, Teknologi, dan Perguruan Tinggi Republik Indonesia No NKB-1798/UN2.R3.1/HKP.05.00/2019. We also thank the Center of Excellence Biology Resources Genome Study (CoE IBR-GS) FMIPA UI and the Center for Chemical and Packaging (CCP) for the facilities and equipment to support this research.
REFERENCES
Ali, A., Noh, N. M. and Mustafa, M. A. (2014) ‘Antimicrobial activity of chitosan enriched with lemongrass oil against anthracnose of bell pepper’, Food Packaging and Shelf Life. Elsevier Ltd., 3, pp. 56–61. doi: 10.1016/j.fpsl.2014.10.003.
Argyropoulou, C. et al. (2007) ‘Chemical composition of the essential oil from leaves of Lippia citriodora H.B.K. (Verbenaceae) at two developmental stages’, Biochemical Systematics and Ecology, 35(12), pp. 831–837. doi: 10.1016/j.bse.2007.07.001.
Bhavaniramya, S. et al. (2019) ‘Role of essential oils in food safety: antimicrobial and antioxidant applications’, Grain & Oil Science and Technology. doi: 10.1016/j.gaost.2019.03.001.
Dorman, H. J. D. and Deans, S. G. (2000) ‘Antimicrobial agents from plants: Antibacterial activity of plant volatile oils’, Journal of Applied Microbiology, 88(2), pp. 308–316. doi: 10.1046/j.1365-2672.2000.00969.x.
Ganjewala, D. (2009) ‘Cymbopogon essential oils : Chemical compositions and bioactivities’, International Journal of Essential Oil Therapeutics, 3, pp. 56–65.
Gursoy, M. et al. (2018) ‘False flax (Camelina sativa) seed oil as suitable ingredient for the enhancement of physicochemical and biological properties of chitosan films’, International Journal of Biological Macromolecules. Elsevier B.V., 114, pp. 1224–1232. doi: 10.1016/j.ijbiomac.2018.04.029.
Handayani, W. et al. (2019) ‘Coriandrum sativum l . ( apiaceae ) and elettaria cardamomum ( l .) maton ( zingiberaceae ) for antioxidant and antimicrobial protection Coriandrum sativum l . ( apiaceae ) and elettaria cardamomum ( l .) maton ( zingiberaceae ) for antioxidant and antimi’, Journal of Physiscs: Conference Series. doi: 10.1088/1742-6596/1317/1/012092.
Huang, D. F. et al. (2014) ‘Chemical constituents, antibacterial activity and mechanism of action of the essential oil from Cinnamomum cassia bark against four food-related bacteria’, Microbiology (Russian Federation), 83(4), pp. 357–365. doi: 10.1134/S0026261714040067.
Hyun, J. E. et al. (2015) ‘Preservative effectiveness of essential oils in vapor phase combined with modified atmosphere packaging against spoilage bacteria on
fresh cabbage’, Food Control. Elsevier Ltd, 51, pp. 307–313. doi: 10.1016/j.foodcont.2014.11.030.
Inouye, S., Takizawa, T. and Yamaguchi, H. (2001) ‘Antibacterial activity of essential oils and their major constituents against respiratory tract pathogens by gaseous contact’, Journal of Antimicrobial Chemotherapy, 47(5), pp. 565–573. doi: 10.1093/jac/47.5.565.
Ju, J. et al. (2019) ‘Application of essential oil as a sustained release preparation in food packaging’, Trends in Food Science and Technology, 92(1800), pp. 22–32. doi: 10.1016/j.tifs.2019.08.005.
Li, Z. et al. (2019) ‘Preparation, characterization and anti-aflatoxigenic activity of chitosan packaging films incorporated with turmeric essential oil’, International Journal of Biological Macromolecules. Elsevier B.V., 131, pp. 420–434. doi: 10.1016/j.ijbiomac.2019.02.169.
Ozdemir Kubra S, G. V. (2017) ‘Extending the shelf-life of pomegranate arils with chitosan-ascorbic acid coating’, Food Science and Tachnology 76 (2017) 172-180, 76, pp. 172–180. doi: 10.1016/j.lwt.2016.10.057.
Saddiq, A. A. and Khayyat, S. A. (2010) ‘Chemical and antimicrobial studies of monoterpene: Citral’, Pesticide Biochemistry and Physiology. Elsevier Inc., 98(1), pp. 89–93. doi: 10.1016/j.pestbp.2010.05.004.
Ternus ZR, Z. M. (2015) ‘Microbiological Characterization of Pure Geraniol and Comparison with Bactericidal Activity of the Cinnamic Acid in Gram-Positive and Gram-Negative Bacteria’, Journal of Microbial & Biochemical Technology, 07(04), pp. 186–193. doi: 10.4172/1948-5948.1000203.
Tyagi, A. K. and Malik, A. (2010) ‘In situ SEM, TEM and AFM studies of the antimicrobial activity of lemon grass oil in liquid and vapour phase against Candida albicans’, Micron, pp. 797–805. doi: 10.1016/j.micron.2010.05.007.
Wang, T. H. et al. (2016) ‘Evaluation of the antibacterial potential of liquid and vapor phase phenolic essential oil compounds against oral microorganisms’, PLoS ONE, 11(9), pp. 1–17. doi: 10.1371/journal.pone.0163147.
Zhang, Z. et al. (2018) ‘Preparation and characterization of biocomposite chitosan fi lm containing Perilla frutescens ( L .) Britt . essential oil’, Industrial Crops & Products, 112(December 2017), pp. 660–667. doi: 10.1016/j.indcrop.2017.12.073.
ICEO 2019 - International Conference of Essential Oils
148
The Antibacterial Effect from Combining Cinnamon, Patchouli and Coriander Essential Oils
Windri Handayani1, Retno Yunilawati2,3, Cuk Imawan3*
1Departemen Biologi, Fakultas Matematika dan Ilmu Pengetahuan Alam, Universitas Indonesia, Kampus Depok, Indonesia 16424
2Badan Penelitian dan Pengembangan Industri, Kementerian Perindustrian 3Departemen Fisika, Fakultas Matematika dan Ilmu Pengetahuan Alam, Universitas
Indonesia, Kampus Depok, Indonesia 16424 [email protected]
Keywords: Essential Oils, Cinnamon, Patchouli, Coriander, vapour test, antimicrobial
Abstract: Essential oils are dynamic organic liquids that work in synergy with each other. In general, essential oils work better when mixed with other essential oils. Every essential oil has many compounds and known for their benefits like healing properties and aromatic compound. When mixing essential oils between one oil and another, they can compensate for their strengths and weaknesses of each other. In this research, Cinnamon, Patchouli and Coriander essential oil combined to strengthen their antimicrobial activities. Variation was done by combining between 3 types of essential oils at different combination ratios 1:1 and 1:2 (v/v). Furthermore, the oil was tested on Gram-positive bacteria Staphylococcus aureus and Gram-negative bacteria Escherichia coli using the paper disk method and vapour test. From the results obtained it is known the strength of the antibacterial activity when the oil is in direct contact with microorganisms and the strength of volatile compounds of essential oils in inhibiting antimicrobial activity. The essential oils were also characterized using Gas Chromatography Mass Spectroscopy (GC-MS) to determine the levels and presence of compounds suspected of having antimicrobial activity. The results show the weakest antimicrobial activity EO combination were when using patchouli and coriander. Meanwhile, the strongest when testing paper disks and the vapour test is a combination of cinnamon and patchouli, cinnamon and coriander, cinnamon, patchouli and coriander.
1 INTRODUCTION
Nowadays, the development of active packaging by utilizing natural ingredients are quite engaging studies (Calo, et.al., 2015). Aromatic plants and their extracts have the potential to be applied in the field of food safety and food preservation. A part of phytochemical compounds there are group of essential oils that generally contain a very complex mixture of several types of aromatic phytochemical compounds, which had potential to be develop in this application (Chen et.al. 2018; Marques et.al., 2019).
Essential oils are dynamic organic liquids that work together in synergy. In general, essential oils work better when they mixed with other essential oils. Each essential oil contains many compounds and is known for its benefits, such as healing properties and aromatic compounds. When mixing essential oils
between one oil and another, they can compensate for each other's strengths and weaknesses. Antagonism activity observed when the effects of one or both compounds are less when they are applied together than when applied individually. Synergism observed when the effects of the combined substances are higher than the sum of the individual effects (Davidson and Parish, 1989; Park et.al., 2018).
Certain phytochemical compounds derived from plants are known to have a role in inhibiting the growth and survival of microorganism (Guedes et.al., 2018; Merino et.al., 2019). However, besides their benefits, the used of essential oil as a food preservative have some disadvantages because of the strong smell that will affect the aroma and food flavour. Therefore, it is necessary to choose the type, composition, and dosage of a constant essential oil.
Handayani, W., Yunilawati, R. and Imawan, C.The Antibacterial Effect from Combining Cinnamon, Patchouli and Coriander Essential Oils.In Proceedings of the 2nd International Conference of Essential Oils (ICEO 2019), pages 149-154ISBN: 978-989-758-456-5Copyright © 2020 by SCITEPRESS – Science and Technology Publications, Lda. All rights reserved
149
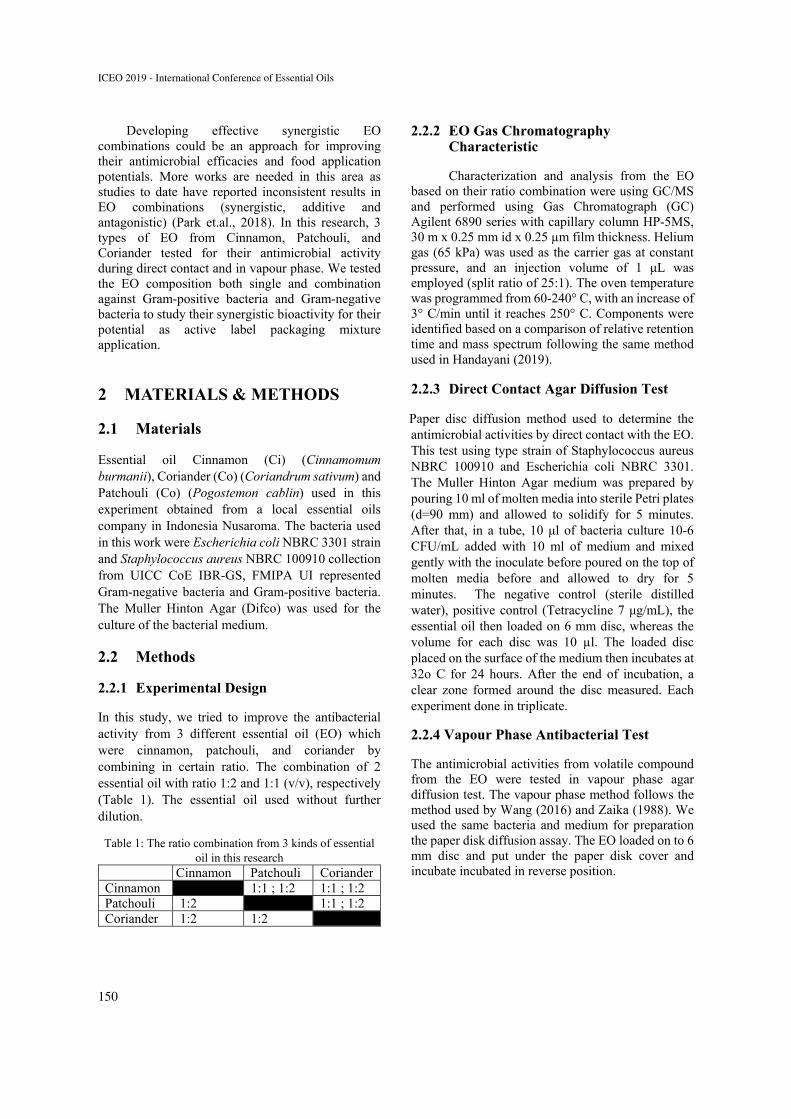
Developing effective synergistic EO combinations could be an approach for improving their antimicrobial efficacies and food application potentials. More works are needed in this area as studies to date have reported inconsistent results in EO combinations (synergistic, additive and antagonistic) (Park et.al., 2018). In this research, 3 types of EO from Cinnamon, Patchouli, and Coriander tested for their antimicrobial activity during direct contact and in vapour phase. We tested the EO composition both single and combination against Gram-positive bacteria and Gram-negative bacteria to study their synergistic bioactivity for their potential as active label packaging mixture application.
2 MATERIALS & METHODS
2.1 Materials
Essential oil Cinnamon (Ci) (Cinnamomum burmanii), Coriander (Co) (Coriandrum sativum) and Patchouli (Co) (Pogostemon cablin) used in this experiment obtained from a local essential oils company in Indonesia Nusaroma. The bacteria used in this work were Escherichia coli NBRC 3301 strain and Staphylococcus aureus NBRC 100910 collection from UICC CoE IBR-GS, FMIPA UI represented Gram-negative bacteria and Gram-positive bacteria. The Muller Hinton Agar (Difco) was used for the culture of the bacterial medium.
2.2 Methods
2.2.1 Experimental Design
In this study, we tried to improve the antibacterial activity from 3 different essential oil (EO) which were cinnamon, patchouli, and coriander by combining in certain ratio. The combination of 2 essential oil with ratio 1:2 and 1:1 (v/v), respectively (Table 1). The essential oil used without further dilution.
Table 1: The ratio combination from 3 kinds of essential oil in this research
Cinnamon Patchouli CorianderCinnamon 1:1 ; 1:2 1:1 ; 1:2Patchouli 1:2 1:1 ; 1:2Coriander 1:2 1:2
2.2.2 EO Gas Chromatography Characteristic
Characterization and analysis from the EO based on their ratio combination were using GC/MS and performed using Gas Chromatograph (GC) Agilent 6890 series with capillary column HP-5MS, 30 m x 0.25 mm id x 0.25 µm film thickness. Helium gas (65 kPa) was used as the carrier gas at constant pressure, and an injection volume of 1 μL was employed (split ratio of 25:1). The oven temperature was programmed from 60-240° C, with an increase of 3° C/min until it reaches 250° C. Components were identified based on a comparison of relative retention time and mass spectrum following the same method used in Handayani (2019).
2.2.3 Direct Contact Agar Diffusion Test
Paper disc diffusion method used to determine the antimicrobial activities by direct contact with the EO. This test using type strain of Staphylococcus aureus NBRC 100910 and Escherichia coli NBRC 3301. The Muller Hinton Agar medium was prepared by pouring 10 ml of molten media into sterile Petri plates (d=90 mm) and allowed to solidify for 5 minutes. After that, in a tube, 10 μl of bacteria culture 10-6 CFU/mL added with 10 ml of medium and mixed gently with the inoculate before poured on the top of molten media before and allowed to dry for 5 minutes. The negative control (sterile distilled water), positive control (Tetracycline 7 μg/mL), the essential oil then loaded on 6 mm disc, whereas the volume for each disc was 10 µl. The loaded disc placed on the surface of the medium then incubates at 32o C for 24 hours. After the end of incubation, a clear zone formed around the disc measured. Each experiment done in triplicate.
2.2.4 Vapour Phase Antibacterial Test
The antimicrobial activities from volatile compound from the EO were tested in vapour phase agar diffusion test. The vapour phase method follows the method used by Wang (2016) and Zaika (1988). We used the same bacteria and medium for preparation the paper disk diffusion assay. The EO loaded on to 6 mm disc and put under the paper disk cover and incubate incubated in reverse position.
ICEO 2019 - International Conference of Essential Oils
150
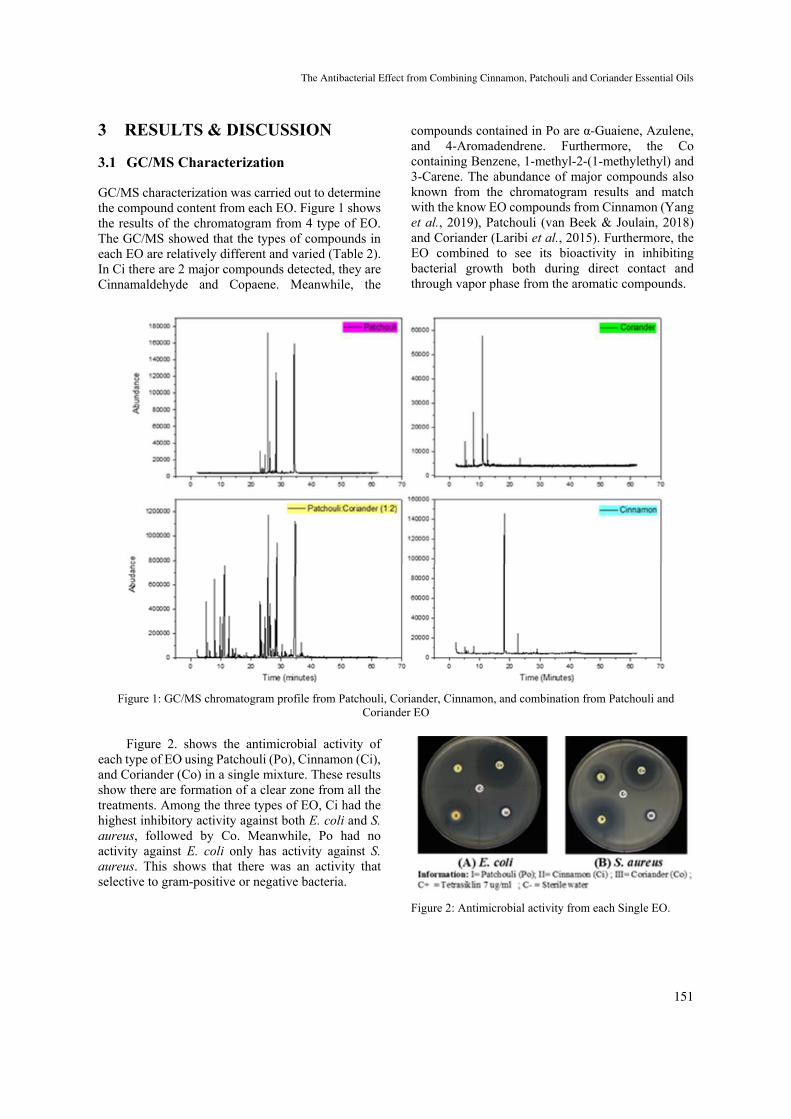
3 RESULTS & DISCUSSION
3.1 GC/MS Characterization
GC/MS characterization was carried out to determine the compound content from each EO. Figure 1 shows the results of the chromatogram from 4 type of EO. The GC/MS showed that the types of compounds in each EO are relatively different and varied (Table 2). In Ci there are 2 major compounds detected, they are Cinnamaldehyde and Copaene. Meanwhile, the
compounds contained in Po are α-Guaiene, Azulene, and 4-Aromadendrene. Furthermore, the Co containing Benzene, 1-methyl-2-(1-methylethyl) and 3-Carene. The abundance of major compounds also known from the chromatogram results and match with the know EO compounds from Cinnamon (Yang et al., 2019), Patchouli (van Beek & Joulain, 2018) and Coriander (Laribi et al., 2015). Furthermore, the EO combined to see its bioactivity in inhibiting bacterial growth both during direct contact and through vapor phase from the aromatic compounds.
Figure 1: GC/MS chromatogram profile from Patchouli, Coriander, Cinnamon, and combination from Patchouli and
Coriander EO
Figure 2. shows the antimicrobial activity of each type of EO using Patchouli (Po), Cinnamon (Ci), and Coriander (Co) in a single mixture. These results show there are formation of a clear zone from all the treatments. Among the three types of EO, Ci had the highest inhibitory activity against both E. coli and S. aureus, followed by Co. Meanwhile, Po had no activity against E. coli only has activity against S. aureus. This shows that there was an activity that selective to gram-positive or negative bacteria.
Figure 2: Antimicrobial activity from each Single EO.
The Antibacterial Effect from Combining Cinnamon, Patchouli and Coriander Essential Oils
151
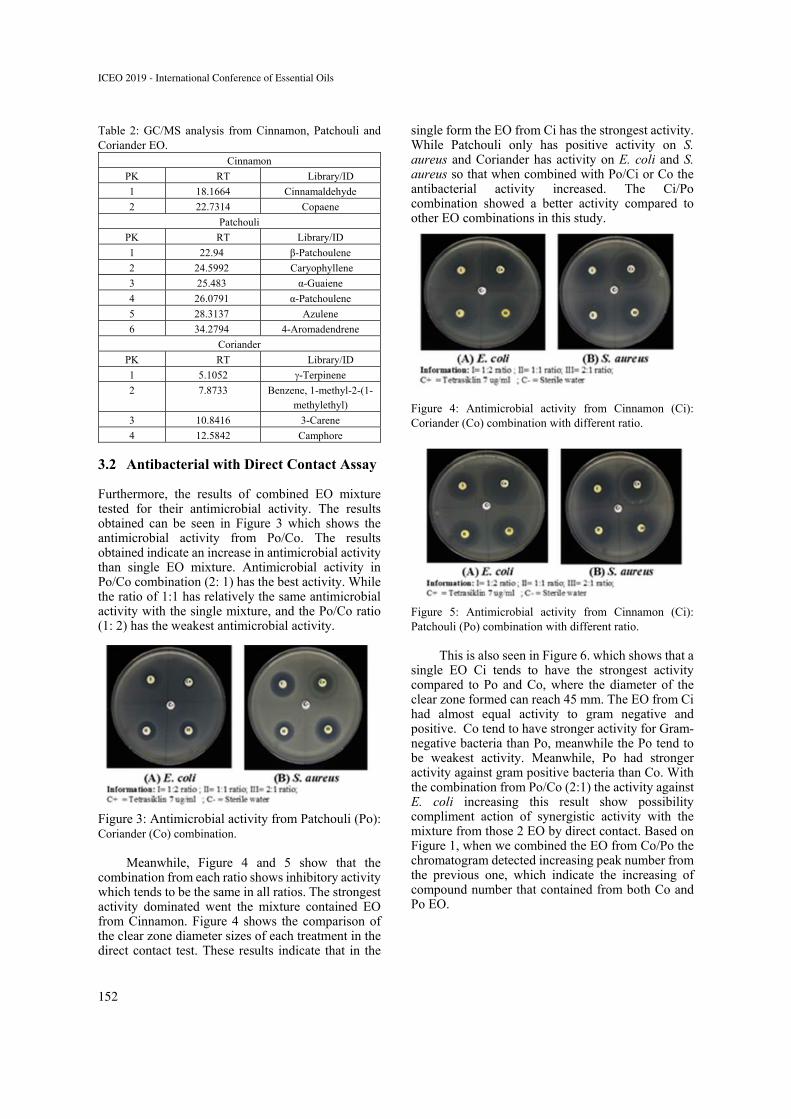
Table 2: GC/MS analysis from Cinnamon, Patchouli and Coriander EO.
3.2 Antibacterial with Direct Contact Assay
Furthermore, the results of combined EO mixture tested for their antimicrobial activity. The results obtained can be seen in Figure 3 which shows the antimicrobial activity from Po/Co. The results obtained indicate an increase in antimicrobial activity than single EO mixture. Antimicrobial activity in Po/Co combination (2: 1) has the best activity. While the ratio of 1:1 has relatively the same antimicrobial activity with the single mixture, and the Po/Co ratio (1: 2) has the weakest antimicrobial activity.
Figure 3: Antimicrobial activity from Patchouli (Po): Coriander (Co) combination.
Meanwhile, Figure 4 and 5 show that the
combination from each ratio shows inhibitory activity which tends to be the same in all ratios. The strongest activity dominated went the mixture contained EO from Cinnamon. Figure 4 shows the comparison of the clear zone diameter sizes of each treatment in the direct contact test. These results indicate that in the
single form the EO from Ci has the strongest activity. While Patchouli only has positive activity on S. aureus and Coriander has activity on E. coli and S. aureus so that when combined with Po/Ci or Co the antibacterial activity increased. The Ci/Po combination showed a better activity compared to other EO combinations in this study.
Figure 4: Antimicrobial activity from Cinnamon (Ci): Coriander (Co) combination with different ratio.
Figure 5: Antimicrobial activity from Cinnamon (Ci): Patchouli (Po) combination with different ratio.
This is also seen in Figure 6. which shows that a single EO Ci tends to have the strongest activity compared to Po and Co, where the diameter of the clear zone formed can reach 45 mm. The EO from Ci had almost equal activity to gram negative and positive. Co tend to have stronger activity for Gram-negative bacteria than Po, meanwhile the Po tend to be weakest activity. Meanwhile, Po had stronger activity against gram positive bacteria than Co. With the combination from Po/Co (2:1) the activity against E. coli increasing this result show possibility compliment action of synergistic activity with the mixture from those 2 EO by direct contact. Based on Figure 1, when we combined the EO from Co/Po the chromatogram detected increasing peak number from the previous one, which indicate the increasing of compound number that contained from both Co and Po EO.
Cinnamon
PK RT Library/ID
1 18.1664 Cinnamaldehyde
2 22.7314 Copaene
Patchouli
PK RT Library/ID
1 22.94 β-Patchoulene
2 24.5992 Caryophyllene
3 25.483 α-Guaiene
4 26.0791 α-Patchoulene
5 28.3137 Azulene
6 34.2794 4-Aromadendrene
Coriander
PK RT Library/ID
1 5.1052 -Terpinene
2 7.8733 Benzene, 1-methyl-2-(1-methylethyl)
3 10.8416 3-Carene
4 12.5842 Camphore
ICEO 2019 - International Conference of Essential Oils
152
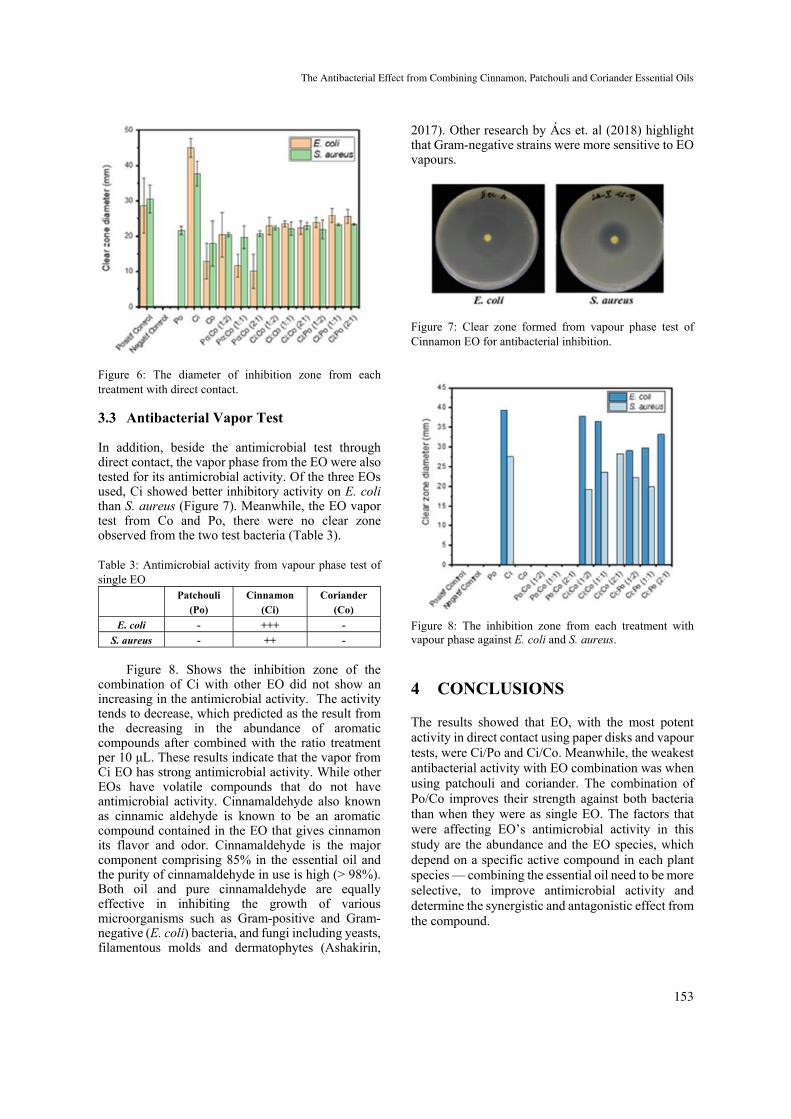
Figure 6: The diameter of inhibition zone from each treatment with direct contact.
3.3 Antibacterial Vapor Test
In addition, beside the antimicrobial test through direct contact, the vapor phase from the EO were also tested for its antimicrobial activity. Of the three EOs used, Ci showed better inhibitory activity on E. coli than S. aureus (Figure 7). Meanwhile, the EO vapor test from Co and Po, there were no clear zone observed from the two test bacteria (Table 3). Table 3: Antimicrobial activity from vapour phase test of single EO
Patchouli (Po)
Cinnamon (Ci)
Coriander (Co)
E. coli - +++ -
S. aureus - ++ -
Figure 8. Shows the inhibition zone of the
combination of Ci with other EO did not show an increasing in the antimicrobial activity. The activity tends to decrease, which predicted as the result from the decreasing in the abundance of aromatic compounds after combined with the ratio treatment per 10 μL. These results indicate that the vapor from Ci EO has strong antimicrobial activity. While other EOs have volatile compounds that do not have antimicrobial activity. Cinnamaldehyde also known as cinnamic aldehyde is known to be an aromatic compound contained in the EO that gives cinnamon its flavor and odor. Cinnamaldehyde is the major component comprising 85% in the essential oil and the purity of cinnamaldehyde in use is high (> 98%). Both oil and pure cinnamaldehyde are equally effective in inhibiting the growth of various microorganisms such as Gram-positive and Gram-negative (E. coli) bacteria, and fungi including yeasts, filamentous molds and dermatophytes (Ashakirin,
2017). Other research by Ács et. al (2018) highlight that Gram-negative strains were more sensitive to EO vapours.
Figure 7: Clear zone formed from vapour phase test of Cinnamon EO for antibacterial inhibition.
Figure 8: The inhibition zone from each treatment with vapour phase against E. coli and S. aureus.
4 CONCLUSIONS
The results showed that EO, with the most potent activity in direct contact using paper disks and vapour tests, were Ci/Po and Ci/Co. Meanwhile, the weakest antibacterial activity with EO combination was when using patchouli and coriander. The combination of Po/Co improves their strength against both bacteria than when they were as single EO. The factors that were affecting EO’s antimicrobial activity in this study are the abundance and the EO species, which depend on a specific active compound in each plant species — combining the essential oil need to be more selective, to improve antimicrobial activity and determine the synergistic and antagonistic effect from the compound.
The Antibacterial Effect from Combining Cinnamon, Patchouli and Coriander Essential Oils
153
ACKNOWLEDGEMENTS
We would like to thank The Center of Excellence Biology Resources-Genome Study (CoE IBR-GS) FMIPA UI for the facilities and equipment to support this research.
REFERENCES
Ács, K., V.L. Balázs, B. Kocsis, T. Bencsik1, A. Böszörményi & G. Horváth, 2018, Antibacterial activity evaluation of selected essential oils in liquid and vapour phase on respiratory tract pathogens. BMC Complementary and Alternative Medicine 18: 227
Ashakirin, S.N., M. Tripathy, U.K. Patil & A.B.A. Majeed, 2017, chemistry and bioactivity of cinnamaldehyde: a natural molecule of Medicinal importance. IJPSR 8(6): 2333-2340.
Calo, J.R., P.G. Crandall, C.A. O’Bryan & S.C. Ricke, 2015, Essential oils as antimicrobials in food systems e A review, Food Control 54: 111-119
Chen C., Z. Xu, Y. Ma, J. Liu, Q. Zhang, Z. Tang, K. Fu, F. Yang & Jing Xie. 2018. Properties, vapour-phase antimicrobial and antioxidant activities of active poly (vinyl alcohol) packaging films incorporated with clove oil. Food Control 88: 105-112
Davidson, P.M. and M.E. Parish, 1989, Method for testing the efficacy of food antimicrobial, Food Technology 43(1): 148-155.
Guedes, J.P. de Sousa & E.L. de Souza, 2018, Investigation of damage to Escherichia coli, Listeria monocytogenes and Salmonella Enteritidis exposed to Mentha arvensis L. and M. piperita L. essential oils in pineapple and mango juice by flow cytometry, Food Microbiology 76: 564-571
Handayani, W., Y. Yasman, R. Yunilawati, V. Fauzia & Cuk Imawan. 2018. Coriandrum sativum L. (Apiaceae) and Elettaria cardamomum (L.) Maton (Zingiberaceae) for antioxidant and antimicrobial protection. Journal of Physics: Conference Series 1317 (1), 012092
Laribi, B. et al., 2015, Coriander (Coriandrum sativum L.) and its bioactive constituents, Fitoterapia, 103: 9–26.
Marques, C.S., R.P. Grillo, D.G. Bravim, P.V. Pereira, J.C.O. Villanova, P.F. Pinheiro, J.C.S. Carneiro & P.C. Bernardes, 2019, Preservation of ready-to-eat salad: A study with combination of sanitizers, ultrasound, and essential oil-containing β-cyclodextrin inclusion complex, LWT - Food Science and Technology 115: 108433
Merino, N., D. Berdejo, R. Bento, H. Salman, M. Lanz, F. Maggi, S. Sánchez-Gómez, D. García-Gonzalo & R. Pagán, Antimicrobial efficacy of Thymbra capitata (L.) Cav. essential oil loaded in self-assembled zein nanoparticles in combination with heat, Industrial Crops & Products 133: 98–104
Park, J.B., J.H. Kang & K.B. Song, 2018, Antibacterial activities of a cinnamon essential oil with cetylpyridinium chloride emulsion against Escherichia
coli O157:H7 and Salmonella Typhimurium in basil leaves, Food Sci Biotechnol. 2018 Feb; 27(1): 47–55
van Beek, T.A. & D. Joulain, 2017, The essential oil of patchouli, Pogostemon cablin: A review, Flavour Fragr. J. 33:6–51
Wang, T.H., S.M. Hsia, C.H. Wu, S.Y. Ko, M.Y. Chen, Y.H. Shih, T.M. Shieh, L.C. Chuang & C.Y. Wu. 2016. Evaluation of the Antibacterial Potential of Liquid and Vapor Phase Phenolic Essential Oil Compounds against Oral Microorganisms. PLOS ONE DOI: 10.1371/journal.pone.0163147.
Yang, Y. Feng et al. (2019) ‘Effects of dietary graded levels of cinnamon essential oil and its combination with bamboo leaf flavonoid on immune function, antioxidative ability and intestinal microbiota of broilers’, Journal of Integrative Agriculture 18(9): 2123–2132.
Zaika, L.L., 1988. Spices and herbs: Their antimicrobial activity and its determination1. J. Food Safety 9: 97-118.
ICEO 2019 - International Conference of Essential Oils
154
The Effects of Colchicine Concentration and Length of Immersion on Cutting Growth of Patchouli (Pogostemon cablin Benth)
Zuyasna1, Andre2 and Siti Hafsah1 1Faculty of Agriculture, Syiah Kuala University, Jl.T.H.Krueng Kalee, Banda Aceh, Indonesia
2Pidie Regency Agriculture and Food Service, Sigli, Indonesia [email protected]
Keywords: mutation, diversity, colchicine, immersion, patchouli
Abstract: The aims of the study were to determine the concentration of colchicine and the best immersion length for the growth of patchouli cuttings. This study used a Randomized Block Design (RBD) 4 x 4 factorial pattern with 5 replications, the factors tested were: Colchicine concentration consisted of 4 levels (C0: Without Colchicine, C1: 0.25% Colchicine, C2: 0.50% Colchicine and C3: 0.75% Colchicine) and immersion length consists of 4 levels (R1: 2 hours, R2: 4 hours, R3: 6 hours, and R4: 8 hours). This research conducted in Sigli - Pidie Regency, Aceh-Indonesia from May to July 2016. The colchicine concentration affected the height, leaf area, and number of patchouli branches. Length of immersion give a different response. There was an interaction between the concentrations of colchicine and length of immersion in plant height, but there was no interaction on leaf area and number of patchouli branches.
1 INTRODUCTION
Pogostemon cablin Benth is plant that produce the essential oil and has high economic value in the world. This plant is an important crop in Indonesia because it can contribute a high foreign exchange to the country (Hariyani et al., 2015). This essential oil is one of the most important naturally occurring perfumery raw materials because of its characteristic woody fragrance and fixative properties by which the scent is fixed and make it last longer on the skin. Patchouli essential oil produced from the distillation process of the patchouli leaves. Pogostemon cablin (P.cablin; common known as Patchouli) originated from southeast Asia is cultivated extensively in Indonesia, Philippines, Malaysia, China, and Brazil (Miyazawa et al., 2000; Singh et al., 2002; Wu et al., 2008). The aerial part of P.cablin has been used for the treatment of the common cold, headache, fever, vomiting, indigestion and diarrhea as well as an antifungal agent in the medicinal materials of China and its surrounding regions (Board of Pharmacopoeia of P. R. China). It is an herbaceous perennial plant with oil glands producing an essential oil (patchouli oil), which is commonly used to give a base and lasting character to a fragrance in the perfume industry.
Due to its uses in perfumery, the demand of patchouli oil is increasing dramatically in the world. Therefore, available preparations of the patchouli oil products may differ significantly in quality depending on a number of factors such as the plant varieties, tissues or organs used, harvesting time (different developmental stages of the plant) and the different and poorly controlled analysis conditions (Bergonzi et al., 2001). In addition, the geographic location was an important factor affecting the chemical composition and developmental process of the medicinal plant. The plant growth progress and chemical characterization varied under different environmental conditions and cultivation locations.
Indonesia has three types of patchouli namely Pogostemon cablin Benth, Pogostemon heyneatus Benth, and Pogostemon hortensis. Patchouli plants are vegetative propagated by cuttings, because propagation through seeds is not possible, this is because patchouli plants do not have flowers even under the photoperiodical control (Hefendehl and Murray, 1979), so it does not allow pollination and fertilization. Therefore, the diversity of patchouli plants is very narrow and undeveloped, so it needs efforts in increasing plant diversity by mutation approach. A possible alternative is to produce a mutant trait in order to have a new clone.
Zuyasna, Andre and Hafsah, S.The Effects of Colchicine Concentration and Length of Immersion on Cutting Growth of Patchouli (Pogostemon cablin Benth).In Proceedings of the 2nd International Conference of Essential Oils (ICEO 2019), pages 155-160ISBN: 978-989-758-456-5Copyright © 2020 by SCITEPRESS – Science and Technology Publications, Lda. All rights reserved
155
Mutation induction is one of the non-conventional plant breeding methods that aims to increase the genetic diversity of a plant. Mutations are changes in genetic material in living things that occur suddenly and randomly inherited. Mutations that occur inherited and can return to normal (epigenetic). Mutations can occur naturally or intentionally induced for certain purposes for genetic improvement of plants. Natural mutations can occur due to the presence of sunlight, as well as electrical energy such as lightning. Artificial mutations for plant breeding is by giving mutagens. There are two groups of mutagens that used to get mutants, physical mutagens and chemical mutagens. Physical mutagens are x-rays, gamma rays and ultra violet rays. While Chemical mutagens are Ethyl Methane Sulfonate, Diethyl sulphate, Ethyl Amin and colchicine.
Colchicine is a toxic and carcinogenic alkaloid obtained from the extract of the Colchium autumnale plant and various other members of the Colchicaceae tribe (Eka et al., 2014). Colchicine is applied to the part of the plant that is actively dividing at a vegetative growth point so that it can inhibit the metaphase stage. Giving colchicine known to affect plant growth, such as producing changes in plant morphology, decreasing plant height, stem circumference diameter, leaf area, number of crop flowers and number of plant capsules and increasing the flowering age of a plant. The addition of colchicine by dropping at the growing point affected the plant height and diameter of the lower stem circumference, then the leaf area became narrower, the flowering period was longer, but the percentage of plants that produced higher seeds than using the immersion technique at the tip of the sprouts (Sri et al., 1999).
In this study, we conducted the use of colchicine with several concentrations and length of immersion to the patchouli of Lhokseumawe var. in an effort to increase the genetic diversity and productivity of patchouli plants.
2 MATERIALS AND METHODS
This research conducted in Sigli, Pidie Regency, Aceh-Indonesia. This research took place from May to July 2016. This study used 4 x 4 factorial randomized block design (RBD). The factors that were tried were: The concentration of colchicine consisted of 4 levels (C0: No Colchicine; C1: 0.25% Colchicine; C2: 0.50% Colchicine, and C3: 0.75% Colchicine). The immersion length consists of 4 levels (R1: 2 hours; R2: 4 hours; R3: 6 hours, and R4:
8 hours). Thus, there were 16 treatment combinations with 5 replications, so this study consisted of 80 experimental units. The planting media used in this study was top soil mixed with husk and compost with ratio of 1: 1:1, which then filled in a 17 × 23 cm polybag.
2.1 Preparation of Colchicine Solution
Colchicine solution made as much as 1 L for each concentration. Colchicine with a level of 0.25% obtained by weighing 2.5 mg of colchicine and then put into a measuring cup and dissolved with distilled water up to 1 L. For 0.50 and 0.75% colchicine solution, 5.0 and 7.5 mg of colchicine weighed and dissolved with distilled water up to 1 L.
2.2 Preparation for Planting Material (Patchouli Cuttings)
The planting material cleaned with distil water. Then immersed in a colchicine solution according to the treatment level of concentration and soaking time. Then rinse with distilled water.
2.3 Planting
The planting material that has been prepared directly planted on the media according to the treatment.
2.4 Maintenance
Plant watered every day and when needed the areal plant cleaned from weeds.
2.5 Observation
The factors observed in this study were: a) Plant Height (cm), plant height measured at 30, 60 and 90 DAP (day after planting). b) Leaf area (cm2), leaf area was observed at 30, 60, and 90 DAP, using millimetre paper. c) Number of branches, the number of branches calculated from the base of the stem to the growing point at 30, 60, and 90 DAP.
3 RESULT AND DISCUSSION
3.1 Plant Height
Results on the analysis of variance showed that the concentration of colchicine and length of immersion did not significantly affect the average height of
ICEO 2019 - International Conference of Essential Oils
156
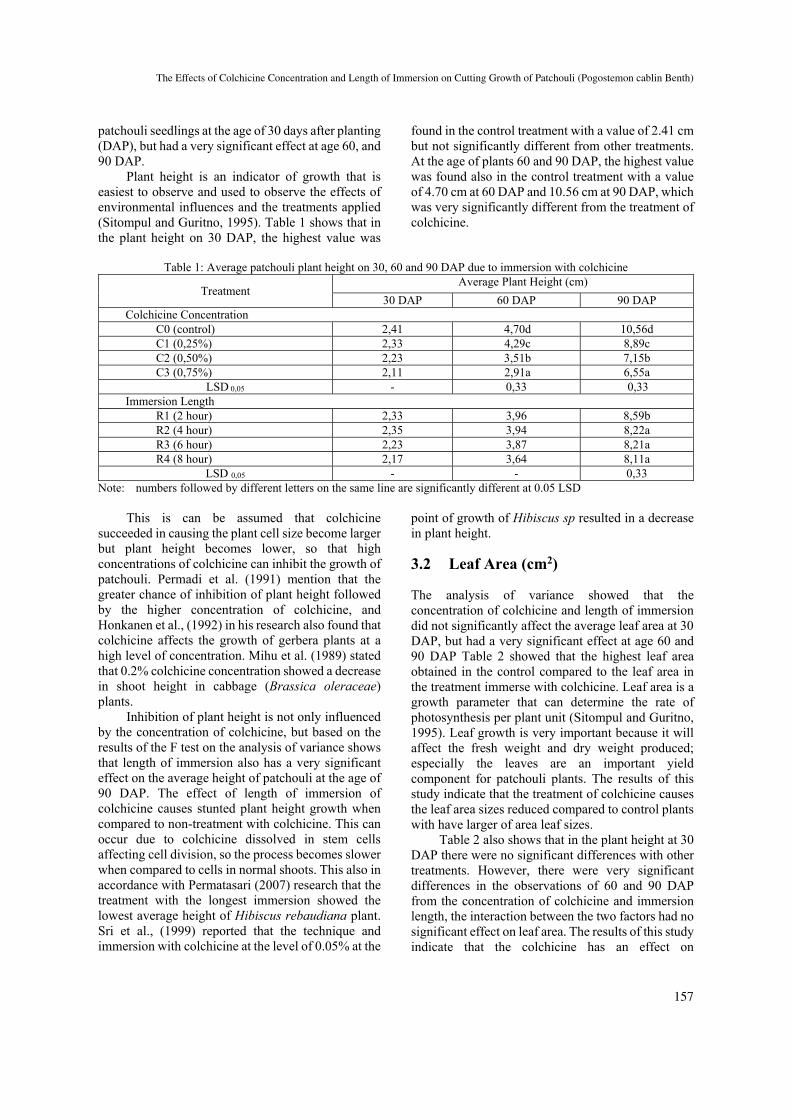
patchouli seedlings at the age of 30 days after planting (DAP), but had a very significant effect at age 60, and 90 DAP.
Plant height is an indicator of growth that is easiest to observe and used to observe the effects of environmental influences and the treatments applied (Sitompul and Guritno, 1995). Table 1 shows that in the plant height on 30 DAP, the highest value was
found in the control treatment with a value of 2.41 cm but not significantly different from other treatments. At the age of plants 60 and 90 DAP, the highest value was found also in the control treatment with a value of 4.70 cm at 60 DAP and 10.56 cm at 90 DAP, which was very significantly different from the treatment of colchicine.
Table 1: Average patchouli plant height on 30, 60 and 90 DAP due to immersion with colchicine
Treatment Average Plant Height (cm)
30 DAP 60 DAP 90 DAP Colchicine Concentration
C0 (control) 2,41 4,70d 10,56d C1 (0,25%) 2,33 4,29c 8,89c C2 (0,50%) 2,23 3,51b 7,15b C3 (0,75%) 2,11 2,91a 6,55a
LSD 0,05 - 0,33 0,33 Immersion Length
R1 (2 hour) 2,33 3,96 8,59b R2 (4 hour) 2,35 3,94 8,22a R3 (6 hour) 2,23 3,87 8,21a R4 (8 hour) 2,17 3,64 8,11a
LSD 0,05 - - 0,33 Note: numbers followed by different letters on the same line are significantly different at 0.05 LSD
This is can be assumed that colchicine succeeded in causing the plant cell size become larger but plant height becomes lower, so that high concentrations of colchicine can inhibit the growth of patchouli. Permadi et al. (1991) mention that the greater chance of inhibition of plant height followed by the higher concentration of colchicine, and Honkanen et al., (1992) in his research also found that colchicine affects the growth of gerbera plants at a high level of concentration. Mihu et al. (1989) stated that 0.2% colchicine concentration showed a decrease in shoot height in cabbage (Brassica oleraceae) plants.
Inhibition of plant height is not only influenced by the concentration of colchicine, but based on the results of the F test on the analysis of variance shows that length of immersion also has a very significant effect on the average height of patchouli at the age of 90 DAP. The effect of length of immersion of colchicine causes stunted plant height growth when compared to non-treatment with colchicine. This can occur due to colchicine dissolved in stem cells affecting cell division, so the process becomes slower when compared to cells in normal shoots. This also in accordance with Permatasari (2007) research that the treatment with the longest immersion showed the lowest average height of Hibiscus rebaudiana plant. Sri et al., (1999) reported that the technique and immersion with colchicine at the level of 0.05% at the
point of growth of Hibiscus sp resulted in a decrease in plant height.
3.2 Leaf Area (cm2)
The analysis of variance showed that the concentration of colchicine and length of immersion did not significantly affect the average leaf area at 30 DAP, but had a very significant effect at age 60 and 90 DAP Table 2 showed that the highest leaf area obtained in the control compared to the leaf area in the treatment immerse with colchicine. Leaf area is a growth parameter that can determine the rate of photosynthesis per plant unit (Sitompul and Guritno, 1995). Leaf growth is very important because it will affect the fresh weight and dry weight produced; especially the leaves are an important yield component for patchouli plants. The results of this study indicate that the treatment of colchicine causes the leaf area sizes reduced compared to control plants with have larger of area leaf sizes.
Table 2 also shows that in the plant height at 30 DAP there were no significant differences with other treatments. However, there were very significant differences in the observations of 60 and 90 DAP from the concentration of colchicine and immersion length, the interaction between the two factors had no significant effect on leaf area. The results of this study indicate that the colchicine has an effect on
The Effects of Colchicine Concentration and Length of Immersion on Cutting Growth of Patchouli (Pogostemon cablin Benth)
157
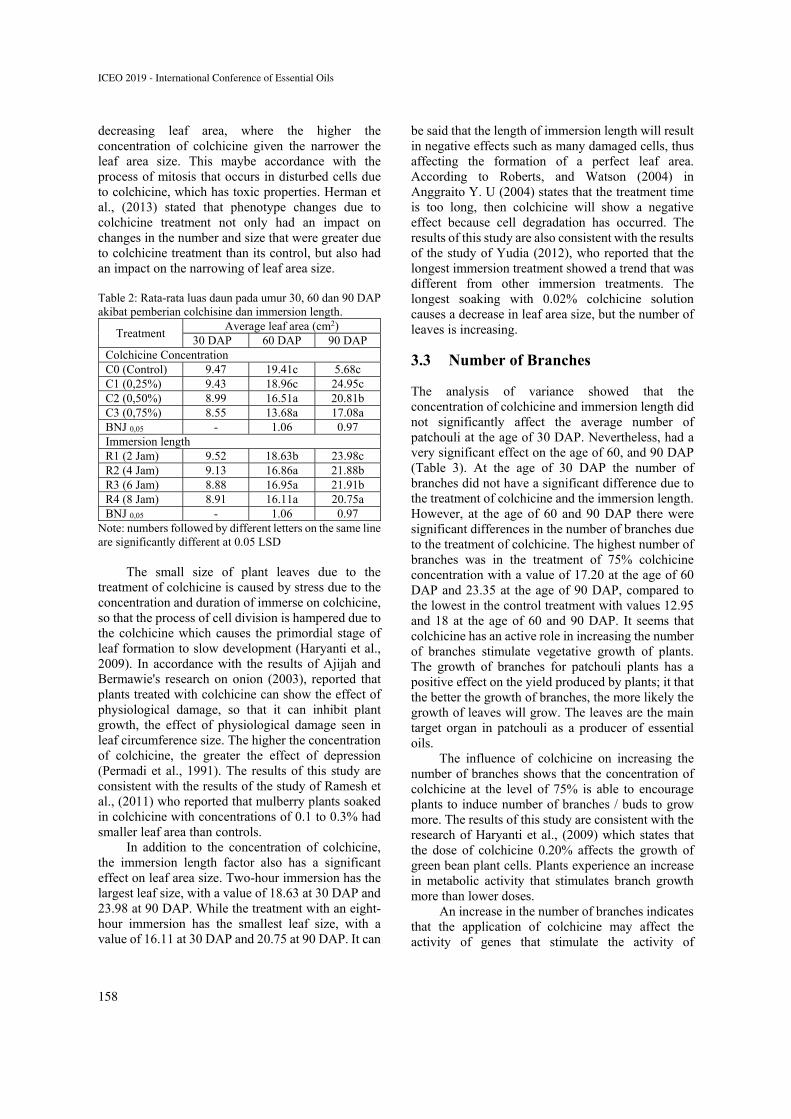
decreasing leaf area, where the higher the concentration of colchicine given the narrower the leaf area size. This maybe accordance with the process of mitosis that occurs in disturbed cells due to colchicine, which has toxic properties. Herman et al., (2013) stated that phenotype changes due to colchicine treatment not only had an impact on changes in the number and size that were greater due to colchicine treatment than its control, but also had an impact on the narrowing of leaf area size. Table 2: Rata-rata luas daun pada umur 30, 60 dan 90 DAP akibat pemberian colchisine dan immersion length.
Treatment Average leaf area (cm2)
30 DAP 60 DAP 90 DAP Colchicine Concentration C0 (Control) 9.47 19.41c 5.68c C1 (0,25%) 9.43 18.96c 24.95c C2 (0,50%) 8.99 16.51a 20.81b C3 (0,75%) 8.55 13.68a 17.08a BNJ 0,05 - 1.06 0.97 Immersion length R1 (2 Jam) 9.52 18.63b 23.98c R2 (4 Jam) 9.13 16.86a 21.88b R3 (6 Jam) 8.88 16.95a 21.91b R4 (8 Jam) 8.91 16.11a 20.75a BNJ 0,05 - 1.06 0.97
Note: numbers followed by different letters on the same line are significantly different at 0.05 LSD
The small size of plant leaves due to the
treatment of colchicine is caused by stress due to the concentration and duration of immerse on colchicine, so that the process of cell division is hampered due to the colchicine which causes the primordial stage of leaf formation to slow development (Haryanti et al., 2009). In accordance with the results of Ajijah and Bermawie's research on onion (2003), reported that plants treated with colchicine can show the effect of physiological damage, so that it can inhibit plant growth, the effect of physiological damage seen in leaf circumference size. The higher the concentration of colchicine, the greater the effect of depression (Permadi et al., 1991). The results of this study are consistent with the results of the study of Ramesh et al., (2011) who reported that mulberry plants soaked in colchicine with concentrations of 0.1 to 0.3% had smaller leaf area than controls.
In addition to the concentration of colchicine, the immersion length factor also has a significant effect on leaf area size. Two-hour immersion has the largest leaf size, with a value of 18.63 at 30 DAP and 23.98 at 90 DAP. While the treatment with an eight-hour immersion has the smallest leaf size, with a value of 16.11 at 30 DAP and 20.75 at 90 DAP. It can
be said that the length of immersion length will result in negative effects such as many damaged cells, thus affecting the formation of a perfect leaf area. According to Roberts, and Watson (2004) in Anggraito Y. U (2004) states that the treatment time is too long, then colchicine will show a negative effect because cell degradation has occurred. The results of this study are also consistent with the results of the study of Yudia (2012), who reported that the longest immersion treatment showed a trend that was different from other immersion treatments. The longest soaking with 0.02% colchicine solution causes a decrease in leaf area size, but the number of leaves is increasing.
3.3 Number of Branches
The analysis of variance showed that the concentration of colchicine and immersion length did not significantly affect the average number of patchouli at the age of 30 DAP. Nevertheless, had a very significant effect on the age of 60, and 90 DAP (Table 3). At the age of 30 DAP the number of branches did not have a significant difference due to the treatment of colchicine and the immersion length. However, at the age of 60 and 90 DAP there were significant differences in the number of branches due to the treatment of colchicine. The highest number of branches was in the treatment of 75% colchicine concentration with a value of 17.20 at the age of 60 DAP and 23.35 at the age of 90 DAP, compared to the lowest in the control treatment with values 12.95 and 18 at the age of 60 and 90 DAP. It seems that colchicine has an active role in increasing the number of branches stimulate vegetative growth of plants. The growth of branches for patchouli plants has a positive effect on the yield produced by plants; it that the better the growth of branches, the more likely the growth of leaves will grow. The leaves are the main target organ in patchouli as a producer of essential oils.
The influence of colchicine on increasing the number of branches shows that the concentration of colchicine at the level of 75% is able to encourage plants to induce number of branches / buds to grow more. The results of this study are consistent with the research of Haryanti et al., (2009) which states that the dose of colchicine 0.20% affects the growth of green bean plant cells. Plants experience an increase in metabolic activity that stimulates branch growth more than lower doses.
An increase in the number of branches indicates that the application of colchicine may affect the activity of genes that stimulate the activity of
ICEO 2019 - International Conference of Essential Oils
158
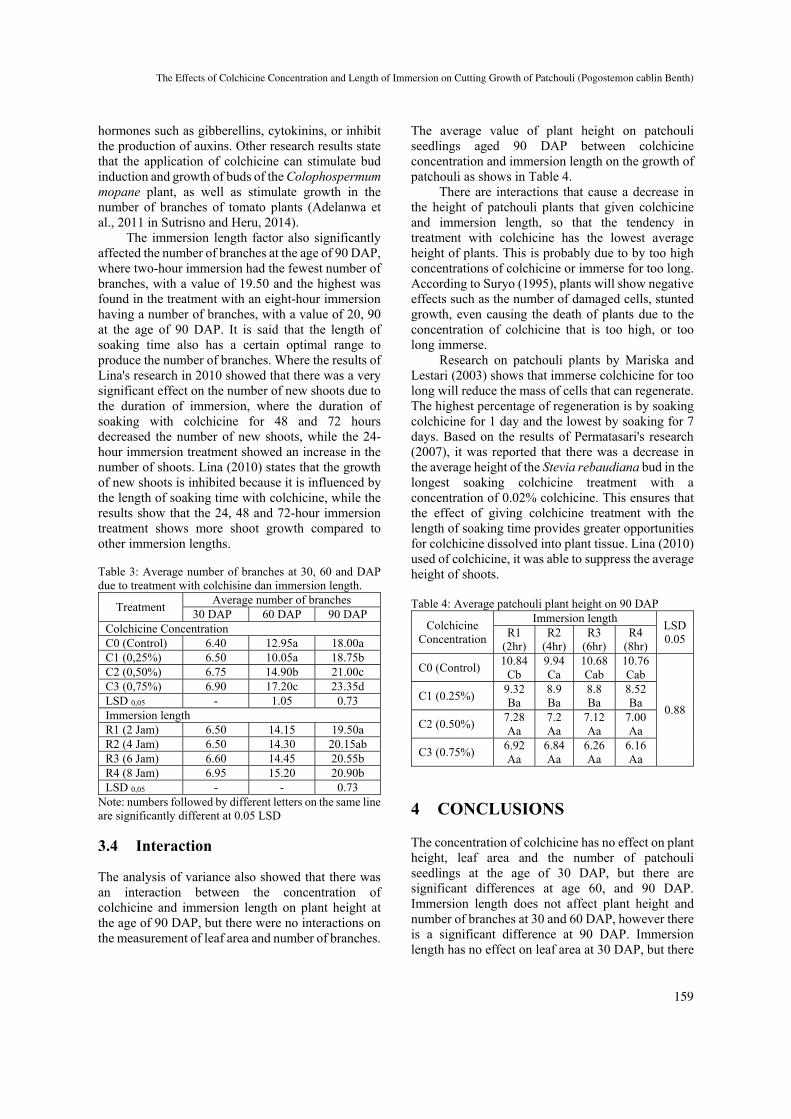
hormones such as gibberellins, cytokinins, or inhibit the production of auxins. Other research results state that the application of colchicine can stimulate bud induction and growth of buds of the Colophospermum mopane plant, as well as stimulate growth in the number of branches of tomato plants (Adelanwa et al., 2011 in Sutrisno and Heru, 2014).
The immersion length factor also significantly affected the number of branches at the age of 90 DAP, where two-hour immersion had the fewest number of branches, with a value of 19.50 and the highest was found in the treatment with an eight-hour immersion having a number of branches, with a value of 20, 90 at the age of 90 DAP. It is said that the length of soaking time also has a certain optimal range to produce the number of branches. Where the results of Lina's research in 2010 showed that there was a very significant effect on the number of new shoots due to the duration of immersion, where the duration of soaking with colchicine for 48 and 72 hours decreased the number of new shoots, while the 24-hour immersion treatment showed an increase in the number of shoots. Lina (2010) states that the growth of new shoots is inhibited because it is influenced by the length of soaking time with colchicine, while the results show that the 24, 48 and 72-hour immersion treatment shows more shoot growth compared to other immersion lengths. Table 3: Average number of branches at 30, 60 and DAP due to treatment with colchisine dan immersion length.
Treatment Average number of branches
30 DAP 60 DAP 90 DAP Colchicine Concentration C0 (Control) 6.40 12.95a 18.00a C1 (0,25%) 6.50 10.05a 18.75b C2 (0,50%) 6.75 14.90b 21.00c C3 (0,75%) 6.90 17.20c 23.35d LSD 0,05 - 1.05 0.73 Immersion length R1 (2 Jam) 6.50 14.15 19.50a R2 (4 Jam) 6.50 14.30 20.15ab R3 (6 Jam) 6.60 14.45 20.55b R4 (8 Jam) 6.95 15.20 20.90b LSD 0,05 - - 0.73
Note: numbers followed by different letters on the same line are significantly different at 0.05 LSD
3.4 Interaction
The analysis of variance also showed that there was an interaction between the concentration of colchicine and immersion length on plant height at the age of 90 DAP, but there were no interactions on the measurement of leaf area and number of branches.
The average value of plant height on patchouli seedlings aged 90 DAP between colchicine concentration and immersion length on the growth of patchouli as shows in Table 4.
There are interactions that cause a decrease in the height of patchouli plants that given colchicine and immersion length, so that the tendency in treatment with colchicine has the lowest average height of plants. This is probably due to by too high concentrations of colchicine or immerse for too long. According to Suryo (1995), plants will show negative effects such as the number of damaged cells, stunted growth, even causing the death of plants due to the concentration of colchicine that is too high, or too long immerse.
Research on patchouli plants by Mariska and Lestari (2003) shows that immerse colchicine for too long will reduce the mass of cells that can regenerate. The highest percentage of regeneration is by soaking colchicine for 1 day and the lowest by soaking for 7 days. Based on the results of Permatasari's research (2007), it was reported that there was a decrease in the average height of the Stevia rebaudiana bud in the longest soaking colchicine treatment with a concentration of 0.02% colchicine. This ensures that the effect of giving colchicine treatment with the length of soaking time provides greater opportunities for colchicine dissolved into plant tissue. Lina (2010) used of colchicine, it was able to suppress the average height of shoots. Table 4: Average patchouli plant height on 90 DAP
Colchicine Concentration
Immersion length LSD 0.05 R1
(2hr) R2
(4hr) R3
(6hr) R4
(8hr)
C0 (Control) 10.84
Cb 9.94 Ca
10.68 Cab
10.76 Cab
0.88 C1 (0.25%)
9.32 Ba
8.9 Ba
8.8 Ba
8.52 Ba
C2 (0.50%) 7.28 Aa
7.2 Aa
7.12 Aa
7.00 Aa
C3 (0.75%) 6.92 Aa
6.84 Aa
6.26 Aa
6.16 Aa
4 CONCLUSIONS
The concentration of colchicine has no effect on plant height, leaf area and the number of patchouli seedlings at the age of 30 DAP, but there are significant differences at age 60, and 90 DAP. Immersion length does not affect plant height and number of branches at 30 and 60 DAP, however there is a significant difference at 90 DAP. Immersion length has no effect on leaf area at 30 DAP, but there
The Effects of Colchicine Concentration and Length of Immersion on Cutting Growth of Patchouli (Pogostemon cablin Benth)
159
are significant differences at 60 and 90 DAP. There is an interaction between the concentration of colchicine and immersion length on plant height at the age of 90 DAP.
REFERENCES
Ajijah,N. dan N. Bermawie. 2003. Pengaruh Kolkisin Terhadap Pertumbuhan dan Produksi Dua Tipe Kencur (Kaempferia galanga Linn). Buletin Tanaman Rempah dan Obat 16 (1):46-55.
Anggraito, Y. U. 2004. Identifikasi berat, diameter, dan tebal daging buah melon (Cucumis Melo, L.) kultivar action 434 tetraploid akibat perlakuan kolkisin. Berk. Hayati. 10:37–42.
Board of Pharmacopoeia of P. R. China (ed.), “Pharmacopoeia of the People’s Republic of China,” Chinese Edition 2010, Part I, Chemical Industry Press,Beijing, 2010, pp. 42.
Eka J S, Bayu E S, Hasyim H. 2014. Pengaruh concentration kolkhisin terhadap pertumbuhan dan produksi kacang hijau (Vigna radiata L.) Program Studi Agroekoteknologi, Fakultas Pertanian USU, Medan. Jurnal Online Agroekoteknologi . ISSN No. 2337- 6597. 2 (3):1238- 1244.
Evi N A, Respatijarti dan Sugiharto A N. 2016. Pengaruh pemberian colchisine terhadap penampilan fenotip Galur inbrida jagung pakan (Zea mays L.) pada fase pertumbuhan Vegetatif. Jurnal Produksi Tanaman, Universitas Brawijaya. Jawa Timur. 4 (5): 370-377
Hariyani, E. Widaryanto, N. Herlina. 2015. Pengaruh umur panen terhadap rendemen dan kualitas minyak atsiri tanaman nilam (Pogostemon cablin Benth.). Jurnal Produksi Tanaman. 3 (3) : 205-211.
Haryanti, S., R. B. Hastuti, N. Setiari and A. Banowo. 2009. The influence of colchicine to grow, metaphase cell size and protein content of green beans plant (Vigna radiata (L) Wilczek). Jurnal Penelitian Sains & Teknologi 10(2):112-120.
Herman, Irma Natalina M dan Dewi Indriyani Roslim. 2013. Pengaruh Mutagen Kolkisin Pada Biji kacang Hijau (Vigna radiata L.) Terhadap Jumlah Kromosom dan Pertumbuhan. Jurusan Biologi FMIPA Universitas Riau. Pekanbaru. J. BioETI. : 13-20.
Honkanen, J., A. Aapola, P. Seppanen, T. Tormala, J. C. Wit, H. F. Esendam, L. J. M. Stravers, and J. C. De-Wit. 1992. Production of doubled haploid Gerbera clones. Acta Hortic.300: 341, 346
Lina, N .2010. Induksi mutasi kromosom dengan colchisine pada Anthurium wave of love (Anthurium plowmanii Croat.) secara in vitro. Skripsi. Departemen Agronomi dan Hortikultura Fakultas Pertanian Institut Pertanian Bogor. Bogor.
Mariska, I. dan E.G. Lestari. 2003. Pemanfaatan kultur in vitro untuk meningkatkan keragaman genetik tanaman nilam. Jurnal Litbang Pertanian 22(2):64-69.
Mihu, G., N. Munteanu, and V. Timofte. 1989. Aspect of some phenotypic changes induced by kolkisin in cabbage. Cercetari Agronomice in Moldova. 22(4):85-93.
Mirzada, C. D. 1994. Pengaruh Beberapa Taraf BAP dan IBA terhadapPerbanyakan Calla Lily secara In Vitro. Skripsi. Program Sarjana, InstitutPertanian Bogor. Bogor. 55 hal.
Miyazawa, M., Okuno, Y., Nakamura, S., Kosaka, H., 2000. Antimutagenic activity of flavonoids from Pogostemon cablin. J.Agric. Food Chem.48, 642-647.
Ningsih E. M. N., Nugroho Y. A., dan Trianitasari, 2010. Pertumbuhan Stek Nilam (pogostemon cablin, benth) Pada Berbagai Komposisi Media Tumbuh dan Dosis Penyiraman Limbah Air Kelapa.Jurnal Agrika 4 (1): 37-47
Permadi, A. H., R. Cahyani, dan S. Syarif. 1991. Cara pembelahan umbi, lama perendaman, dan konsentrasi kolkisin pada ploidisasi bawang merah Jurnal Pemuliaan Indonesia. Zuriat. Universitas Padjadjaran. ISSN : 265-6261. 2 (2):36-41
Permatasari, D. 2007. Evaluasi Keragaman Fenotipe Tanaman Stevia (Steviarebaudiana Bertoni M) Klon Zweereners Hasil Mutasi Kromosom denganKolkisin. Skripsi. Program Sarjana, Institut Pertanian Bogor. Bogor.44 hal.
Ramesh, H. L., V. N. Y. Murthy and M. Munirajappa. 2011. Colchicine induced morphological variation mulberry variety M5. The Bioscan 6(1):115-118.
Singh, M., Sharma, S., Ramesh, S., 2002. Herbage, oil yield and oil quality of patchouli [Pogostemon cablin (Blanco) Benth.] influenced by irrigation, organic mulch and nitrogen application in semi-arid tropical climate. Ind. Crop Prod.16, 101-107.
Sitompul S.M. dan B. Guritno. 1995. Analisis Pertumbuhan Tanaman. Gajah Mada University Press. Yogyakarta.Hal 113-114.
Sri, R., Sudjindro, dan Basuki. 1999. Penggunaan Colchicine dalam Penggandaan Kromosom Hasil Hibridisasi Interspesifik pada Hibiscus sp. Untuk Mengatasi Sterilitas F1. Tesis. Program Pascasarjana Universitas Brawijaya. Malang
Suryo. 1995. Sitogenetika. Gajah Mada University Press. Yogyakarta. 446 hal. Suryo. 1995. Sitogenetika. Gajah Mada University Press. Yogyakarta. 446 hal.
Sutrino dan Heru. 2014. Keragaan Dua Varietas Kedelai Pada Enam Concentration Colchisine. Balai Penelitian Tanaman Aneka Kacang dan Umbi. Malang.
Wu, Y.G., Guo, Q.S., Zheng, H.Q., Studies on residuals of organochlorine pesticides and heavy metals in soil of planting base and Pogostemon cablin. China J. Chin.Materia Med.33(2008) 1528-1532.
Yudia P A. 2012. Induksi mutasi melalui penggandaan kromosom nilam varietas sidikalang (Pogostemon cablin Benth.) dengan colchisine secara in vitro. Skripsi. Departemen Agronomi dan Hortikultura Fakultas Pertanian Institut Pertanian Bogor. Bogor.
ICEO 2019 - International Conference of Essential Oils
160
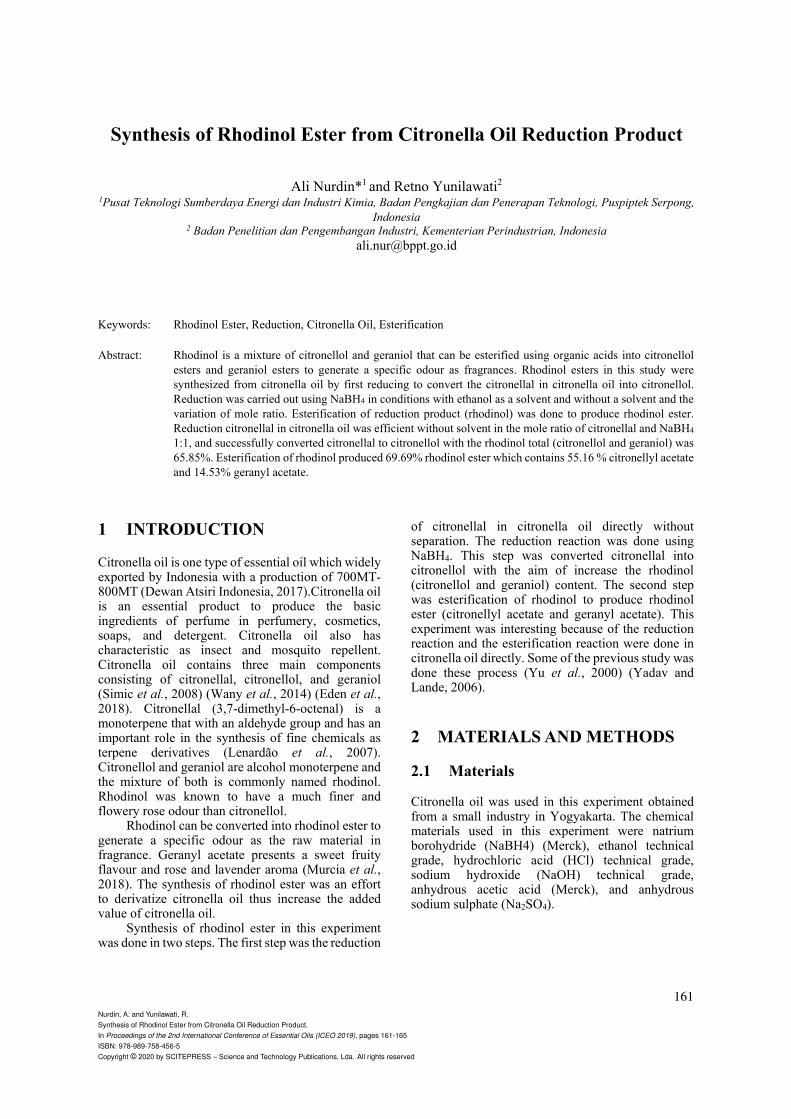
Synthesis of Rhodinol Ester from Citronella Oil Reduction Product
Ali Nurdin*1 and Retno Yunilawati2 1Pusat Teknologi Sumberdaya Energi dan Industri Kimia, Badan Pengkajian dan Penerapan Teknologi, Puspiptek Serpong,
Indonesia 2 Badan Penelitian dan Pengembangan Industri, Kementerian Perindustrian, Indonesia
Keywords: Rhodinol Ester, Reduction, Citronella Oil, Esterification
Abstract: Rhodinol is a mixture of citronellol and geraniol that can be esterified using organic acids into citronellol esters and geraniol esters to generate a specific odour as fragrances. Rhodinol esters in this study were synthesized from citronella oil by first reducing to convert the citronellal in citronella oil into citronellol. Reduction was carried out using NaBH4 in conditions with ethanol as a solvent and without a solvent and the variation of mole ratio. Esterification of reduction product (rhodinol) was done to produce rhodinol ester. Reduction citronellal in citronella oil was efficient without solvent in the mole ratio of citronellal and NaBH4
1:1, and successfully converted citronellal to citronellol with the rhodinol total (citronellol and geraniol) was 65.85%. Esterification of rhodinol produced 69.69% rhodinol ester which contains 55.16 % citronellyl acetate and 14.53% geranyl acetate.
1 INTRODUCTION
Citronella oil is one type of essential oil which widely exported by Indonesia with a production of 700MT-800MT (Dewan Atsiri Indonesia, 2017).Citronella oil is an essential product to produce the basic ingredients of perfume in perfumery, cosmetics, soaps, and detergent. Citronella oil also has characteristic as insect and mosquito repellent. Citronella oil contains three main components consisting of citronellal, citronellol, and geraniol (Simic et al., 2008) (Wany et al., 2014) (Eden et al., 2018). Citronellal (3,7-dimethyl-6-octenal) is a monoterpene that with an aldehyde group and has an important role in the synthesis of fine chemicals as terpene derivatives (Lenardão et al., 2007). Citronellol and geraniol are alcohol monoterpene and the mixture of both is commonly named rhodinol. Rhodinol was known to have a much finer and flowery rose odour than citronellol.
Rhodinol can be converted into rhodinol ester to generate a specific odour as the raw material in fragrance. Geranyl acetate presents a sweet fruity flavour and rose and lavender aroma (Murcia et al., 2018). The synthesis of rhodinol ester was an effort to derivatize citronella oil thus increase the added value of citronella oil.
Synthesis of rhodinol ester in this experiment was done in two steps. The first step was the reduction
of citronellal in citronella oil directly without separation. The reduction reaction was done using NaBH4. This step was converted citronellal into citronellol with the aim of increase the rhodinol (citronellol and geraniol) content. The second step was esterification of rhodinol to produce rhodinol ester (citronellyl acetate and geranyl acetate). This experiment was interesting because of the reduction reaction and the esterification reaction were done in citronella oil directly. Some of the previous study was done these process (Yu et al., 2000) (Yadav and Lande, 2006).
2 MATERIALS AND METHODS
2.1 Materials
Citronella oil was used in this experiment obtained from a small industry in Yogyakarta. The chemical materials used in this experiment were natrium borohydride (NaBH4) (Merck), ethanol technical grade, hydrochloric acid (HCl) technical grade, sodium hydroxide (NaOH) technical grade, anhydrous acetic acid (Merck), and anhydrous sodium sulphate (Na2SO4).
Nurdin, A. and Yunilawati, R.Synthesis of Rhodinol Ester from Citronella Oil Reduction Product.In Proceedings of the 2nd International Conference of Essential Oils (ICEO 2019), pages 161-165ISBN: 978-989-758-456-5Copyright © 2020 by SCITEPRESS – Science and Technology Publications, Lda. All rights reserved
161
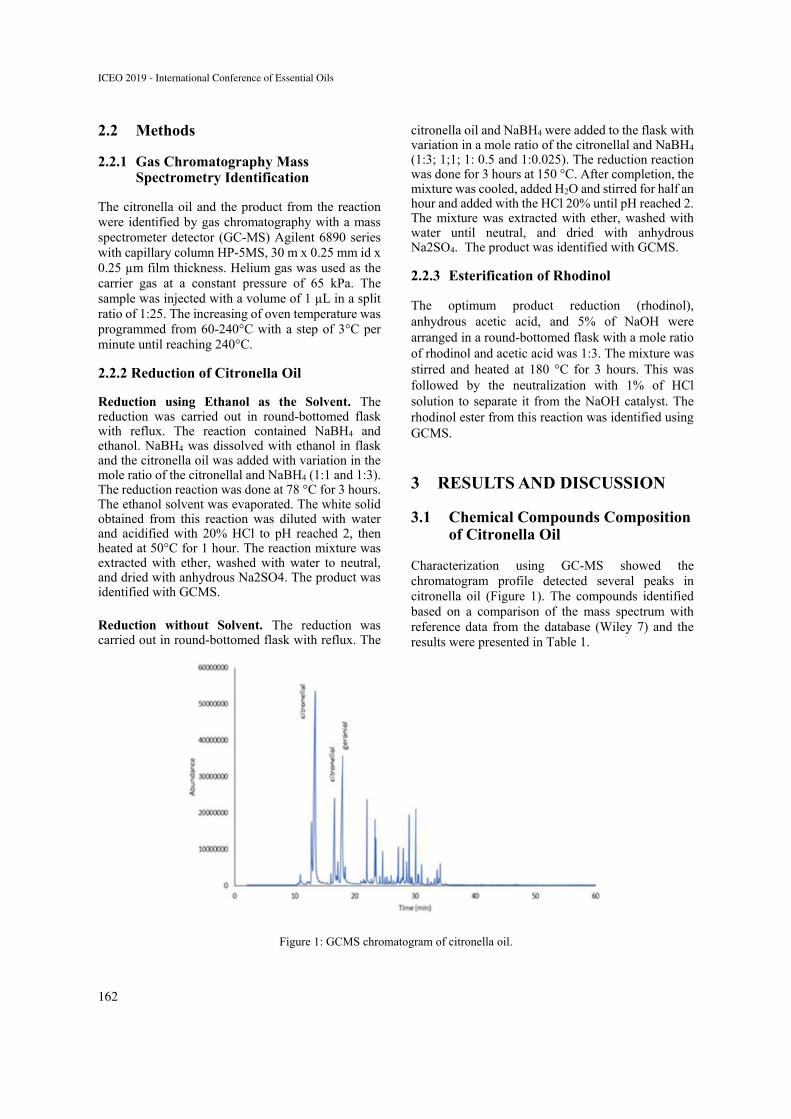
2.2 Methods
2.2.1 Gas Chromatography Mass Spectrometry Identification
The citronella oil and the product from the reaction were identified by gas chromatography with a mass spectrometer detector (GC-MS) Agilent 6890 series with capillary column HP-5MS, 30 m x 0.25 mm id x 0.25 µm film thickness. Helium gas was used as the carrier gas at a constant pressure of 65 kPa. The sample was injected with a volume of 1 µL in a split ratio of 1:25. The increasing of oven temperature was programmed from 60-240°C with a step of 3°C per minute until reaching 240°C.
2.2.2 Reduction of Citronella Oil
Reduction using Ethanol as the Solvent. The reduction was carried out in round-bottomed flask with reflux. The reaction contained NaBH4 and ethanol. NaBH4 was dissolved with ethanol in flask and the citronella oil was added with variation in the mole ratio of the citronellal and NaBH4 (1:1 and 1:3). The reduction reaction was done at 78 °C for 3 hours. The ethanol solvent was evaporated. The white solid obtained from this reaction was diluted with water and acidified with 20% HCl to pH reached 2, then heated at 50°C for 1 hour. The reaction mixture was extracted with ether, washed with water to neutral, and dried with anhydrous Na2SO4. The product was identified with GCMS.
Reduction without Solvent. The reduction was carried out in round-bottomed flask with reflux. The
citronella oil and NaBH4 were added to the flask with variation in a mole ratio of the citronellal and NaBH4 (1:3; 1;1; 1: 0.5 and 1:0.025). The reduction reaction was done for 3 hours at 150 °C. After completion, the mixture was cooled, added H2O and stirred for half an hour and added with the HCl 20% until pH reached 2. The mixture was extracted with ether, washed with water until neutral, and dried with anhydrous Na2SO4. The product was identified with GCMS.
2.2.3 Esterification of Rhodinol
The optimum product reduction (rhodinol), anhydrous acetic acid, and 5% of NaOH were arranged in a round-bottomed flask with a mole ratio of rhodinol and acetic acid was 1:3. The mixture was stirred and heated at 180 °C for 3 hours. This was followed by the neutralization with 1% of HCl solution to separate it from the NaOH catalyst. The rhodinol ester from this reaction was identified using GCMS.
3 RESULTS AND DISCUSSION
3.1 Chemical Compounds Composition of Citronella Oil
Characterization using GC-MS showed the chromatogram profile detected several peaks in citronella oil (Figure 1). The compounds identified based on a comparison of the mass spectrum with reference data from the database (Wiley 7) and the results were presented in Table 1.
Figure 1: GCMS chromatogram of citronella oil.
ICEO 2019 - International Conference of Essential Oils
162
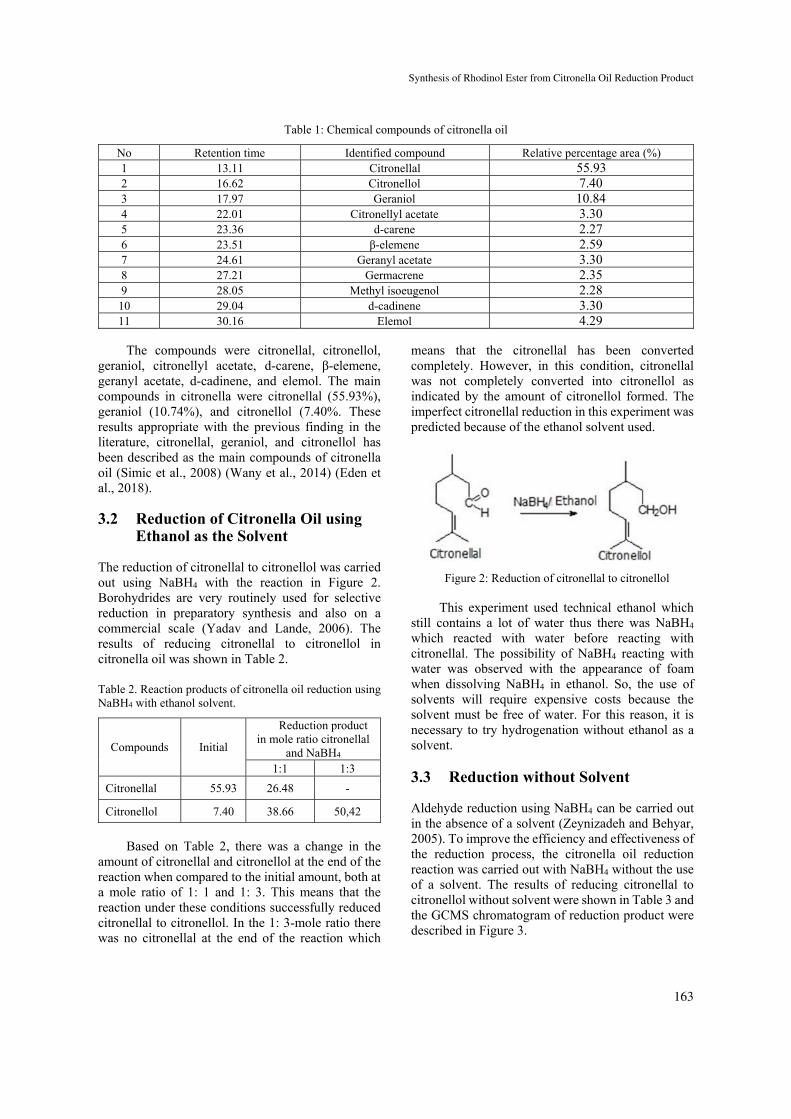
Table 1: Chemical compounds of citronella oil
No Retention time Identified compound Relative percentage area (%) 1 13.11 Citronellal 55.93 2 16.62 Citronellol 7.40 3 17.97 Geraniol 10.84 4 22.01 Citronellyl acetate 3.30 5 23.36 d-carene 2.27 6 23.51 β-elemene 2.59 7 24.61 Geranyl acetate 3.30 8 27.21 Germacrene 2.35 9 28.05 Methyl isoeugenol 2.28 10 29.04 d-cadinene 3.30 11 30.16 Elemol 4.29
The compounds were citronellal, citronellol,
geraniol, citronellyl acetate, d-carene, β-elemene, geranyl acetate, d-cadinene, and elemol. The main compounds in citronella were citronellal (55.93%), geraniol (10.74%), and citronellol (7.40%. These results appropriate with the previous finding in the literature, citronellal, geraniol, and citronellol has been described as the main compounds of citronella oil (Simic et al., 2008) (Wany et al., 2014) (Eden et al., 2018).
3.2 Reduction of Citronella Oil using Ethanol as the Solvent
The reduction of citronellal to citronellol was carried out using NaBH4 with the reaction in Figure 2. Borohydrides are very routinely used for selective reduction in preparatory synthesis and also on a commercial scale (Yadav and Lande, 2006). The results of reducing citronellal to citronellol in citronella oil was shown in Table 2.
Table 2. Reaction products of citronella oil reduction using NaBH4 with ethanol solvent.
Compounds Initial
Reduction product in mole ratio citronellal
and NaBH4 1:1 1:3
Citronellal 55.93 26.48 -
Citronellol 7.40 38.66 50,42
Based on Table 2, there was a change in the
amount of citronellal and citronellol at the end of the reaction when compared to the initial amount, both at a mole ratio of 1: 1 and 1: 3. This means that the reaction under these conditions successfully reduced citronellal to citronellol. In the 1: 3-mole ratio there was no citronellal at the end of the reaction which
means that the citronellal has been converted completely. However, in this condition, citronellal was not completely converted into citronellol as indicated by the amount of citronellol formed. The imperfect citronellal reduction in this experiment was predicted because of the ethanol solvent used.
Figure 2: Reduction of citronellal to citronellol
This experiment used technical ethanol which still contains a lot of water thus there was NaBH4 which reacted with water before reacting with citronellal. The possibility of NaBH4 reacting with water was observed with the appearance of foam when dissolving NaBH4 in ethanol. So, the use of solvents will require expensive costs because the solvent must be free of water. For this reason, it is necessary to try hydrogenation without ethanol as a solvent.
3.3 Reduction without Solvent
Aldehyde reduction using NaBH4 can be carried out in the absence of a solvent (Zeynizadeh and Behyar, 2005). To improve the efficiency and effectiveness of the reduction process, the citronella oil reduction reaction was carried out with NaBH4 without the use of a solvent. The results of reducing citronellal to citronellol without solvent were shown in Table 3 and the GCMS chromatogram of reduction product were described in Figure 3.
Synthesis of Rhodinol Ester from Citronella Oil Reduction Product
163
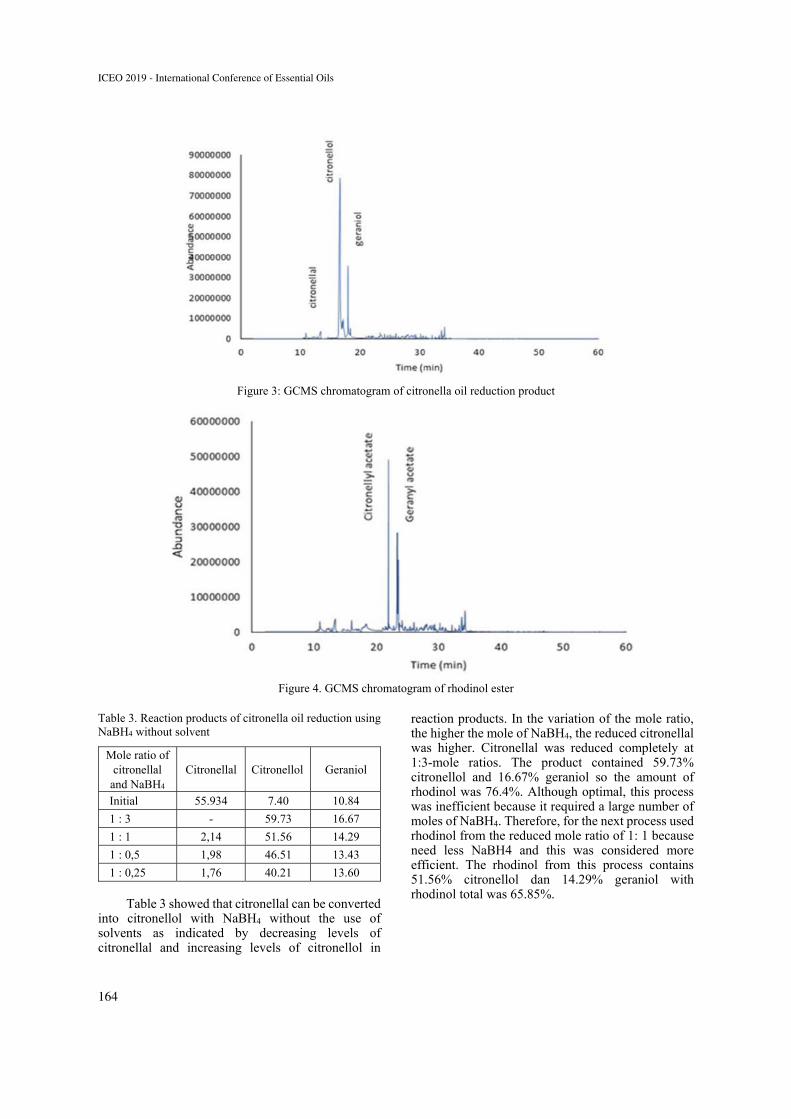
Figure 3: GCMS chromatogram of citronella oil reduction product
Figure 4. GCMS chromatogram of rhodinol ester
Table 3. Reaction products of citronella oil reduction using NaBH4 without solvent
Mole ratio of citronellal
and NaBH4 Citronellal Citronellol Geraniol
Initial 55.934 7.40 10.84
1 : 3 - 59.73 16.67
1 : 1 2,14 51.56 14.29
1 : 0,5 1,98 46.51 13.43
1 : 0,25 1,76 40.21 13.60
Table 3 showed that citronellal can be converted
into citronellol with NaBH4 without the use of solvents as indicated by decreasing levels of citronellal and increasing levels of citronellol in
reaction products. In the variation of the mole ratio, the higher the mole of NaBH4, the reduced citronellal was higher. Citronellal was reduced completely at 1:3-mole ratios. The product contained 59.73% citronellol and 16.67% geraniol so the amount of rhodinol was 76.4%. Although optimal, this process was inefficient because it required a large number of moles of NaBH4. Therefore, for the next process used rhodinol from the reduced mole ratio of 1: 1 because need less NaBH4 and this was considered more efficient. The rhodinol from this process contains 51.56% citronellol dan 14.29% geraniol with rhodinol total was 65.85%.
ICEO 2019 - International Conference of Essential Oils
164
3.4 Esterification of Rhodinol
Esterification of rhodinol was conducted to obtained rhodinol ester that has a specific smell. Geranyl acetate presents a sweet fruity flavour and rose and lavender aroma (Murcia et al., 2018). Rhodinol ester (citronellyl acetate, geranyl acetate) can be isolated by vacuum fractionation, but the availability of these natural raw materials was limited. However, this method was not suitable for large-scale industrial production. For the alternative, these esters may be produced by chemical synthesis and enzymatic extraction or catalysis (bio catalysis) (Paroul et al., 2012) (Wu et al., 2018) (Murcia et al., 2018). Chemical synthesis was often performed using acetic acid anhydride or direct acetic acid esterification (Jian et al., 2014). This method was the traditional chemical synthesis and commonly used in large-scale industries. Rhodinol ester in this experiment was synthesized using acetic acid.
Table 4. Rhodinol ester product from esterification
Compounds Rhodinol (%) Rhodinol ester (%)
Citronellol 51.56 -
Geraniol 14.29 -
Citronellyl acetate 3.00 55.16
Geranyl acetate - 14.53
The GCMS analysis showed that all rhodinol
(citronellol and geraniol) have changed to rhodinol acetate esters. This result was observed with the loss of the rhodinol peak and the appearance of the rhodinol acetate peak, as shown in Figure 4. The complete data on the results of the experiment are shown in Table 4.
4 CONCLUSIONS
Reduction citronellal in citronella oil was successfully converted citronellal to citronellol with the rhodinol total (citronellol and geraniol) was 65.85%. Esterification of rhodinol produced 69.69% rhodinol ester which contains 55.16 % citronellyl acetate and 14.53% geranyl acetate.
REFERENCES
Dewan Atsiri Indonesia (2017) ‘Indonesian Essential Oil Output’.
Eden, W. T. et al. (2018) ‘Fractionation of Java Citronella Oil and Citronellal Purification by Batch Vacuum Fractional Distillation’, IOP Conference Series: Materials Science and Engineering, 349(1). doi: 10.1088/1757-899X/349/1/012067.
Jian, X. et al. (2014) ‘Lipase-Catalyzed Transesterification Synthesis of Geranyl Acetate in Organic Solvents and Its Kinetics’, Food Science and Technology Research, 20(2), pp. 207–216. doi: 10.3136/fstr.20.207.
Lenardão, E. J. et al. (2007) ‘Citronellal as key compound in organic synthesis’, Tetrahedron, 63(29), pp. 6671–6712. doi: 10.1016/j.tet.2007.03.159.
Murcia, M. D. et al. (2018) ‘Kinetic modelling and kinetic parameters calculation in the lipase-catalysed synthesis of geranyl acetate’, Chemical Engineering Research and Design. Institution of Chemical Engineers, 138, pp. 135–143. doi: 10.1016/j.cherd.2018.08.025.
Paroul, N. et al. (2012) ‘Solvent-free production of bioflavors by enzymatic esterification of citronella (Cymbopogon winterianus) essential oil’, Applied Biochemistry and Biotechnology, 166(1), pp. 13–21. doi: 10.1007/s12010-011-9399-4.
Simic, A. et al. (2008) ‘Essential oil composition of Cymbopogon winterianus and Carum carvi and their antimicrobial activities’, Pharmaceutical Biology, 46(6), pp. 437–441. doi: 10.1080/13880200802055917.
Wany, A. et al. (2014) ‘Extraction and characterization of essential oil components based on geraniol and citronellol from Java citronella (Cymbopogon winterianus Jowitt)’, Plant Growth Regulation, 73(2), pp. 133–145. doi: 10.1007/s10725-013-9875-7.
Wu, T. et al. (2018) ‘Engineering Saccharomyces cerevisiae for the production of the valuable monoterpene ester geranyl acetate’, Microbial Cell Factories. BioMed Central, 17(1), pp. 1–11. doi: 10.1186/s12934-018-0930-y.
Yadav, G. D. and Lande, S. V (2006) ‘Novelties of kinetics of chemoselective reduction of citronellal to citronellol by sodium borohydride under liquid – liquid phase transfer catalysis’, Journal of Molecular Catalysis A : Chemical, 247, pp. 253–259. doi: 10.1016/j.molcata.2005.11.015.
Yu, W. et al. (2000) ‘Selective hydrogenation of citronellal to citronellol over polymer-stabilized noble metal colloids’, Reactive and Functional Polymers, 44(1), pp. 21–29. doi: 10.1016/S1381-5148(99)00073-5.
Zeynizadeh, B. and Behyar, T. (2005) ‘Fast and Efficient Method for Reduction of Carbonyl Compounds with NaBH 4 /Wet SiO 2 Under Solvent Free Condition’, J. Braz.Chem.Soc., 16(6), pp. 1200–1209.
Synthesis of Rhodinol Ester from Citronella Oil Reduction Product
165

AUTHOR INDEX
Abdussalam, M. . . . . . . . . . 115Aisyah, Y. . . . . . . . . . . . 76, 108Amalia Amri, I. . . . . . . . . . . 102Amalia, B. . . . . 25, 50, 56, 143Andre . . . . . . . . . . . . . . . . . . . 155Andriani, D. . . . . . . . . . . . . . 130Andrianty, T. . . . . . . . . . . . . . 25Annisa, Y. . . . . . . . . . . . . . . . . 76Anwar, S. . . . . . . . . . . . . . . . . 76Arianita C., A. . . . . . . . 50, 143Arianita Cahyaningtyas, A. .56
Batubara, I. . . . . . . . . . . . . . . 136
Cahayo, M. . . . . . . . . . . . . . . 119Cahyani, C. . . . . . . . . . . 87, 102
Dewi, C. . . . . . . . . . . . . . . 18, 92Diah, M. . . . . . . . . . . . . . . 63, 70Dian Anggreini, G. . . . . . . . 119
Elfia Rosa, E. . . . . . . . . . . . . . 43
Faradilla, M. . . . . . . . . . . . . . . 43
Giovanny, J. . . . . . . . . . . . . . . 14
Hafsah, S. . . . . . . . . . . . . . . . 155Handayani, W. 50, 56, 143, 149Hasballah, K. . . . . . . . . . . . . . 70Hayati, M. . . . . . . . . . . . . . . 123
Hidayati, N. . . . . . . . . . . . . . . 82
Iftitah, E. . . . . . . . . . . . . . . . . . 33Imawan, C. . . 50, 56, 143, 149Indra, I. . . . . . . . . . . . . . . . . . 130Irwinanita . . . . . . . . . . . . . . . . 25
Jaya Sumarto Putra, C. . . . . . . 9Juniarti . . . . . . . . . . . . . . 70, 115
Kanza, S. . . . . . . . . . . . . . . . .102Khairan . . . . . . . . . . . . . . . 63, 70Kintamani, E. . . . . . . . . . . . . 136Kusmana, C. . . . . . . . . . . . . .136Kusuma Arbawa, Y. . . . . . . . 92Kusuma, I. . . . . . . . . . . . . . . 115
Mailisa, T. . . . . . . . . . . . . . . . . 25Masruri . . . . . . . . . . . . . . . . . 119Maulidya, R. . . . . . . . . . . . . 108Maysarah, H. . . . . . . . . . . . . . 43Mirmanto, E. . . . . . . . . . . . . 136Muhammad, S. . . . . . . . . 63, 70Muharyani, N. . . . . . . . . . . . . 82Murgunadi . . . . . . . . . . . . . . . 82
Nazaruddin, N. . . . . . . . . . . . 70Nur Aidha, N. . . . . . . . . . . . . 37Nuraeni, C. . . . . . . . . . . . 25, 82Nurdin, A. . . . . . . . . . . . 97, 161Nurhadianty, V. . . . . . . . . . . 102
Nurhayati . . . . . . . . . . . . . . . 123
Permata Yuda, I. . . . . . . . . . 115Putu Maharani, L. . . . . . . . . 102
Rahmi, D. . . . . . . . . . . . . . 25, 82Ratnawati, E. . . . . . . . . . . . . . 25Riyanto, A. . . . . . . . . . . . 25, 82Rumondang, I. . . . . . . . . . . . . 37
Sari, I. . . . . . . . . . . . . . . . . . . . 43Sari, R. . . . . . . . . . . . . . . . . . 123Silvianti, R. . . . . . . . . . . . . . . 87Srihardyastutie, A. . . . . . . . . 33Stywarni, G. . . . . . . . . . . . . . . 33Sumantoro, P. . . . . . . . . . . . . . 82Suryani, R. . . . . . . . . . . . . . . . 70Susanti, D. . . . . . . . . . . . . . . . . .5Suyono, H. . . . . . . . . . . . . . . . . 5
Tiryana, T. . . . . . . . . . . . . . . 136
Wardhana, M. . . . . . . . . . . . 130Warsito . . . . . . . . . . . . . . 87, 119
Yunilawati, R. . . 25, 37, 50, 56,82, 143, 149, 161
Yunita, D. . . . . . . . . . . . . . . . 108Yusuf, H. . . . . . . . . . . . . . . . . . 70
Zuyasna . . . . . . . . . . . . . . . . .155
167
Copyright © 2020 by SCITEPRESS - Science and Technology Publications, Lda. All Rights Reserved
ISBN: 978-989-758-456-5