electrical performance evaluation of ehv post insulators covered with ice under different air gap...
TRANSCRIPT
Seediscussions,stats,andauthorprofilesforthispublicationat:https://www.researchgate.net/publication/272375397
ElectricalPerformanceEvaluationofEHVPostInsulatorsCoveredWithIceunderDifferentAirGapConfigurations
ARTICLEinIEEETRANSACTIONSONDIELECTRICSANDELECTRICALINSULATION·DECEMBER2014
ImpactFactor:1.28·DOI:10.1109/TDEI.2014.004280
CITATION
1
READS
34
3AUTHORS:
ShamsodinTaheri
UniversityofQuébecinChicoutimi,Saskpower
10PUBLICATIONS34CITATIONS
SEEPROFILE
MasoudFarzaneh
UniversityofQuébecinChicoutimi
433PUBLICATIONS4,344CITATIONS
SEEPROFILE
IssoufFofana
UniversityofQuébecinChicoutimi
219PUBLICATIONS1,076CITATIONS
SEEPROFILE
Allin-textreferencesunderlinedinbluearelinkedtopublicationsonResearchGate,
lettingyouaccessandreadthemimmediately.
Availablefrom:IssoufFofana
Retrievedon:03February2016
IEEE Transactions on Dielectrics and Electrical Insulation Vol. 21, No. 6; December 2014 2619
DOI 10.1109/TDEI.2014.004280
Electrical Performance Evaluation of EHV Post Insulators Covered With Ice under Different Air Gap Configurations
S. Taheri1, M. Farzaneh2 and I. Fofana2
1 Département d’informatique et d’ingénierie, Université du Québec en Outaouais, Gatineau, Qc, Canada, J8X 3X7 2 NSERC / Hydro-Quebec / UQAC Industrial Chair on Atmospheric Icing of Power Network Equipment (CIGELE) and Canada
Research Chair on Engineering of Power Network Atmospheric Icing (INGIVRE) (www.cigele.ca) Université du Québec à Chicoutimi, 555, Boulevard de l'Université, Chicoutimi, Qc, Canada, G7H 2B1
ABSTRACT
This paper investigates the influence of air gaps on the maximum AC withstand voltage (VWS) of ice-covered post insulators, typically used in Hydro-Quebec 735-kV substations. The VWS was experimentally determined based on IEEE Standard 1783, under icing conditions. The results reveal that the number of air gaps affects the VWS significantly. The configuration with four air gaps allows improving the VWS by 15% in comparison to the configuration with three air gaps. Moreover, high speed video camera techniques were used to observe the mechanism of electric arc propagation over ice surface with respect to the air gap configuration. Also, to interpret the performance of the ice-covered insulators with different air gap positions, the voltage and electric field distributions along the ice-covered insulator were simulated numerically by the Finite Element Method (FEM) during the melting period. The simulation results confirmed that increasing the number of air gaps improves satisfactory the uniformity of voltage distribution of the EHV post insulators and consequently the maximum withstand voltage. Based on the obtained results, the installation of booster sheds to improve the insulating performance of post insulators under icing conditions was recommended.
Index Terms - Ice-covered insulator, maximum withstand voltage, air gap, flashover, electric arc, voltage distribution.
1 INTRODUCTION
ULTRA-HIGH voltage (UHV) and extra-high voltage (EHV) offer interesting solutions to long distance transmission systems for both technical and economic viewpoints. However, an increase in the voltage level in such a way has to face the challenge of preserving the performance of insulators, especially under adverse conditions such as atmospheric icing. Over the years, a great deal of efforts has been made to investigate the flashover performance of ice-covered insulators [1-6].
The flashover phenomena is influenced by several factors including type and density of ice, air pressure and air pollution [7, 8]. Among these factors, the presence of a conductive water film on the ice surface is recognized to be one of the most detrimental conditions of flashover occurrence [9, 10]. Experimental observations have revealed that ice accretion over an energized insulator is not uniform. Several sections of an ice-covered insulator are free of ice (referred to as air gaps) due to ice shedding resulting from the heating effect of partial arcs, increase in air temperature and other ambient conditions [10-12]. In general, air gaps are formed in the vicinity of the electrodes, where the electric field strength is high enough [13, 14]. Non-uniformity of the voltage distribution along the ice-covered insulator leads to an extreme increase in voltage drop across the air gaps [15, 16]. Under
sufficiently high electrical field, partial discharges initiated from the air gaps propagate over the ice surface eventually forming a white arc. When the white arc reaches a critical length of insulator, a sudden flashover will happen [6, 17]. Therefore, air gaps play a significant role in the flashover performance of ice-covered insulators since the arc propagation process over the ice surface is affected by the air gap positions [18, 19].
Among the insulators used in substations, semiconducting glaze post station insulators showed better performance under heavy icing conditions [20]. Moreover, investigations of insulators performance in North America have revealed that most flashover occurrences are associated with post station insulators [21-23]. Hence, much interest has been focused on the improvement of EHV porcelain post station insulators performance under icing conditions. For this purpose, some mitigation solutions have been proposed to prevent icicles buildup at the insulator surface. To achieve this, several solutions consisting in the addition of booster sheds [24], grading rings [25] and alternating diameter sheds [24] have been proposed. However, since these solutions lead to an increase in insulator surface, they are presently limited to regions with high levels of pollution [20]. These solutions are expected to have a direct impact on the number and position of air gaps and thus on the maximum withstand voltage (VWS). Hence, it is necessary to evaluate the flashover performance of ice-covered insulator as well as the mechanism of arc propagation under different air gap
Manuscript received on 27 August 2013, in final form 20 July 2014, accepted 20 July 2014.
2620 S. Taheri et al.: Electrical Performance Evaluation of EHV Post Insulators Covered With Ice under Different Air Gap Configurations
configurations. The flashover behavior of an ice-covered post insulator under DC positive voltage was recently investigated by the authors [26]. Preliminary results confirmed that under icing conditions, the creation of artificial air gaps significantly influenced the VWS of post insulators. However, additional investigations have to be carried out to verify the effect of air gaps position on the flashover performance of post station insulators under AC voltage.
The main objectives of the present work are twofold:
- to determine experimentally the influence of air gaps position on the maximum withstand voltage and
- to investigate the mechanism of the electric arc development over the surface of ice-covered insulators.
A series of numerical simulations were carried out using the Finite Element Method (FEM) to help interpreting the experimental results through voltage and electric field distribution computations. Finally, emphasizes are laid on the consequences resulting from the flashover occurrences on the structure of the insulators under icing conditions.
2 TEST FACILITIES AND PROCEDURES
2.1 TEST FACILITIES
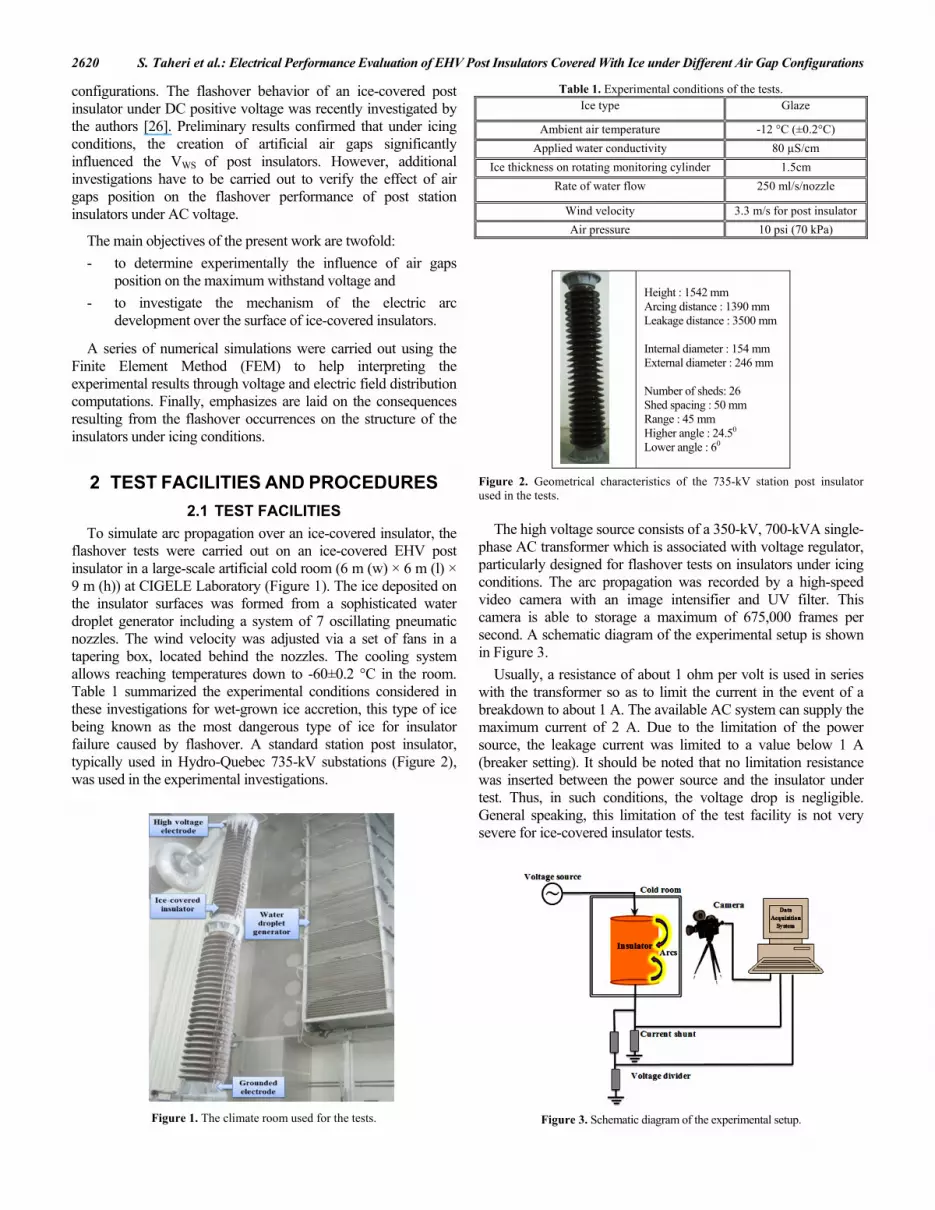
To simulate arc propagation over an ice-covered insulator, the flashover tests were carried out on an ice-covered EHV post insulator in a large-scale artificial cold room (6 m (w) × 6 m (l) × 9 m (h)) at CIGELE Laboratory (Figure 1). The ice deposited on the insulator surfaces was formed from a sophisticated water droplet generator including a system of 7 oscillating pneumatic nozzles. The wind velocity was adjusted via a set of fans in a tapering box, located behind the nozzles. The cooling system allows reaching temperatures down to -60±0.2 °C in the room. Table 1 summarized the experimental conditions considered in these investigations for wet-grown ice accretion, this type of ice being known as the most dangerous type of ice for insulator failure caused by flashover. A standard station post insulator, typically used in Hydro-Quebec 735-kV substations (Figure 2), was used in the experimental investigations.
Figure 1. The climate room used for the tests.
Table 1. Experimental conditions of the tests. Ice type Glaze
Ambient air temperature -12 °C (±0.2°C)
Applied water conductivity 80 µS/cm
Ice thickness on rotating monitoring cylinder 1.5cm
Rate of water flow 250 ml/s/nozzle
Wind velocity 3.3 m/s for post insulator
Air pressure 10 psi (70 kPa)
Height : 1542 mm Arcing distance : 1390 mm Leakage distance : 3500 mm Internal diameter : 154 mm External diameter : 246 mm Number of sheds: 26 Shed spacing : 50 mm Range : 45 mm Higher angle : 24.50 Lower angle : 60
Figure 2. Geometrical characteristics of the 735-kV station post insulator used in the tests.
The high voltage source consists of a 350-kV, 700-kVA single-
phase AC transformer which is associated with voltage regulator, particularly designed for flashover tests on insulators under icing conditions. The arc propagation was recorded by a high-speed video camera with an image intensifier and UV filter. This camera is able to storage a maximum of 675,000 frames per second. A schematic diagram of the experimental setup is shown in Figure 3.
Usually, a resistance of about 1 ohm per volt is used in series with the transformer so as to limit the current in the event of a breakdown to about 1 A. The available AC system can supply the maximum current of 2 A. Due to the limitation of the power source, the leakage current was limited to a value below 1 A (breaker setting). It should be noted that no limitation resistance was inserted between the power source and the insulator under test. Thus, in such conditions, the voltage drop is negligible. General speaking, this limitation of the test facility is not very severe for ice-covered insulator tests.
Figure 3. Schematic diagram of the experimental setup.
IEEE Transactions on Dielectrics and Electrical Insulation Vol. 21, No. 6; December 2014 2621
2.2 TEST PROCEDURES
Due to variations in ambient conditions as well as to uneven voltage distribution along the insulator, the position and number of air gaps on an ice surface are somewhat accidental [24]. Hence, ice was deposited on the de-energized insulator surface and once it reached its expected thickness of 15 mm, several air gaps, corresponding to positions at 6-8% [26, 27] of insulator length, were created artificially on the ice-covered insulator.
In order to evaluate the insulating performance of an insulator under icing conditions, a procedure presented in IEEE Standard 1783, for test methods to evaluate the electrical performance of insulators under icing conditions, was considered [28]. In order to save time, the icing regime test method was used for all flashover tests. Under icing regime, the flashover test was carried out shortly after ice accumulation, while a layer of conductive water is still present on the ice surface [29]. The VWS is the maximum level of the applied voltage at which the insulator does not undergo flashover occurrence for a minimum of 3 tests out of 4 [28]. The minimum flashover voltage (VMF) corresponds to a voltage level one step higher than the VWS at which flashover occurs.
3 EXPERIMENTAL RESULTS AND DISCUSSIONS
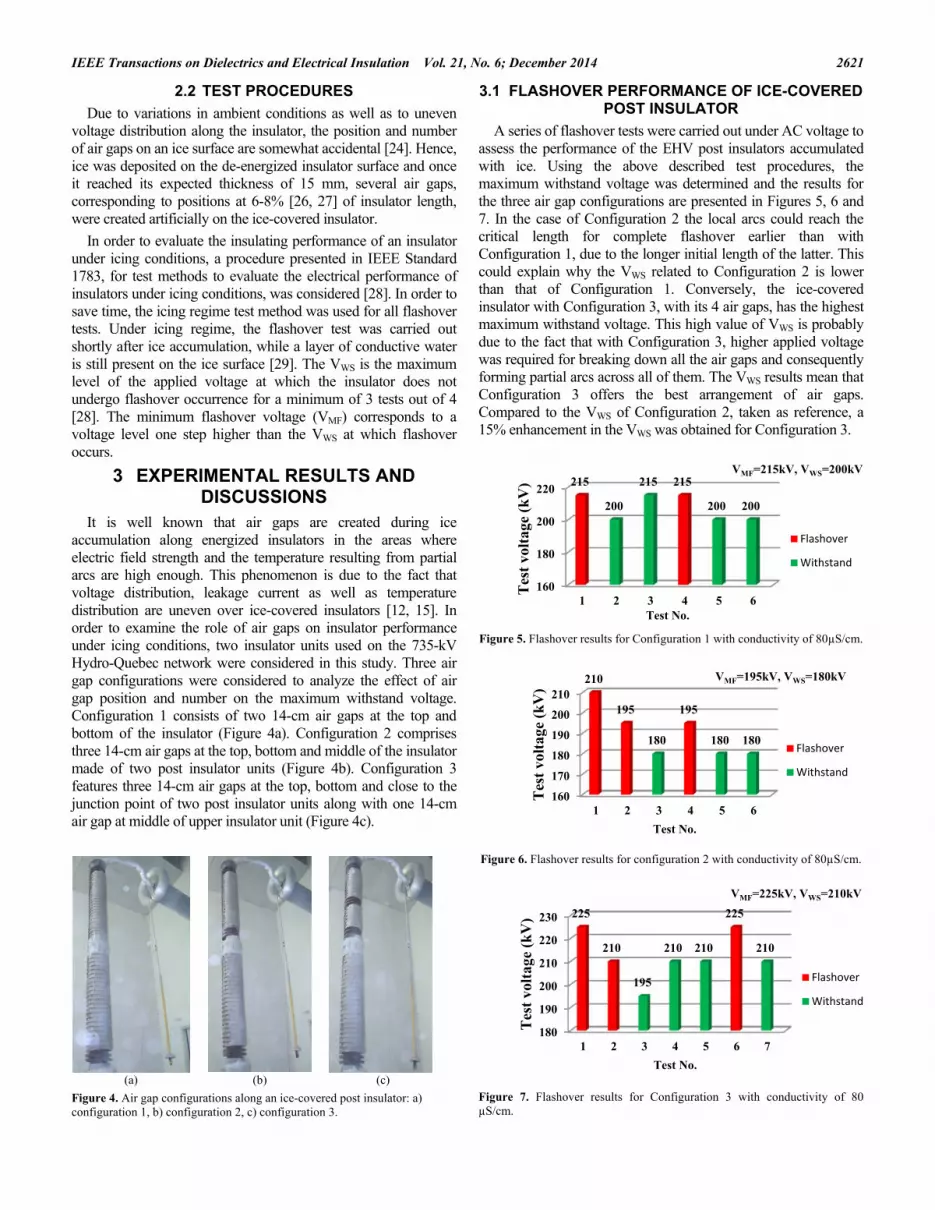
It is well known that air gaps are created during ice accumulation along energized insulators in the areas where electric field strength and the temperature resulting from partial arcs are high enough. This phenomenon is due to the fact that voltage distribution, leakage current as well as temperature distribution are uneven over ice-covered insulators [12, 15]. In order to examine the role of air gaps on insulator performance under icing conditions, two insulator units used on the 735-kV Hydro-Quebec network were considered in this study. Three air gap configurations were considered to analyze the effect of air gap position and number on the maximum withstand voltage. Configuration 1 consists of two 14-cm air gaps at the top and bottom of the insulator (Figure 4a). Configuration 2 comprises three 14-cm air gaps at the top, bottom and middle of the insulator made of two post insulator units (Figure 4b). Configuration 3 features three 14-cm air gaps at the top, bottom and close to the junction point of two post insulator units along with one 14-cm air gap at middle of upper insulator unit (Figure 4c).
(a) (b) (c)
Figure 4. Air gap configurations along an ice-covered post insulator: a) configuration 1, b) configuration 2, c) configuration 3.
3.1 FLASHOVER PERFORMANCE OF ICE-COVERED POST INSULATOR
A series of flashover tests were carried out under AC voltage to assess the performance of the EHV post insulators accumulated with ice. Using the above described test procedures, the maximum withstand voltage was determined and the results for the three air gap configurations are presented in Figures 5, 6 and 7. In the case of Configuration 2 the local arcs could reach the critical length for complete flashover earlier than with Configuration 1, due to the longer initial length of the latter. This could explain why the VWS related to Configuration 2 is lower than that of Configuration 1. Conversely, the ice-covered insulator with Configuration 3, with its 4 air gaps, has the highest maximum withstand voltage. This high value of VWS is probably due to the fact that with Configuration 3, higher applied voltage was required for breaking down all the air gaps and consequently forming partial arcs across all of them. The VWS results mean that Configuration 3 offers the best arrangement of air gaps. Compared to the VWS of Configuration 2, taken as reference, a 15% enhancement in the VWS was obtained for Configuration 3.
Figure 5. Flashover results for Configuration 1 with conductivity of 80µS/cm.
Figure 6. Flashover results for configuration 2 with conductivity of 80µS/cm.
Figure 7. Flashover results for Configuration 3 with conductivity of 80 µS/cm.
160
180
200
220
1 2 3 4 5 6
215
200
215 215
200 200
Tes
t vo
ltag
e (k
V)
Test No.
VMF=215kV, VWS=200kV
Flashover
Withstand
160
170
180
190
200
210
1 2 3 4 5 6
210
195
180
195
180 180
Tes
t vo
ltag
e (k
V)
Test No.
VMF=195kV, VWS=180kV
Flashover
Withstand
180
190
200
210
220
230
1 2 3 4 5 6 7
225
210
195
210 210
225
210
Tes
t vo
ltag
e (k
V)
Test No.
VMF=225kV, VWS=210kV
Flashover
Withstand

2622 S. Taheri et al.: Electrical Performance Evaluation of EHV Post Insulators Covered With Ice under Different Air Gap Configurations
3.2. MULTI-ARC PROPAGATION OVER AN ICE-COVERED POST INSULATOR
Based on the similarity of arc propagation over ice and polluted surfaces, some current theories developed for the mechanism of the arc propagation over polluted insulators can be used to explain streamer propagation over an ice surface. Jolly [30] reviewed the different external forces, including electrostatic attraction, electromagnetic force, thermal buoyant force and steam pressure, which may pull the electric arcs along the polluted surfaces. The electromagnetic and steam forces are relatively small when compared with the thermal buoyant force (FBuoyancy) and electrostatic force (FElectric) so that arc propagation is mainly due to the thermal buoyant and electrostatic forces [31]. Jolly [30] believes that polluted insulator flashover is essentially an electrical breakdown process caused by ionization of the air in front of the discharge tip. However, air resistance force (FAir) [32] acts in the opposite direction of an electric arc motion.
It has been generally observed that the arc channel can be subdivided into two major parts as shown in Figure 8. The upper part is related to the arc discharge along the air gap bowing hot channel due to the buoyancy phenomenon. The remaining part is associated to the arc discharge over the ice surface due to electrostatic force. The above mentioned principal applied forces on the streamer spreading over a perpendicular surface of an insulator covered with ice are indicated in the figure. In fact, the buoyancy force caused by the temperature difference given by Archimedes' principle as well as the electric field force which pulls the discharge across the surface. In the meantime, the air resistance acts as a type of frictional force preventing the streamer from moving forward. Therefore, the mechanism of multiple-arc propagation is affected by the above mentioned external forces, particularly the electrostatic force. Generally speaking, higher arc velocity, arc temperature and electric field lead to greater air resistance, buoyancy and electric forces, respectively.
Figure 8. Forces applied on an arc propagating over an ice surface.
To investigate the role of air gaps on the flashover performance of ice-covered insulators, the discharge process for each air gap configuration was recorded at a framing rate of 10,000 frames per seconds using a high-speed camera. Figure 9 shows the flashover
process of Configuration 1 with two air gaps each at the top and bottom of the insulator. The arcs on both air gaps propagate and lead to flashover when they meet at the junction point of the two post insulators. At the junction point, it can be seen that an arc was initiated as this area was not completely covered with ice. Since the electric field in this area is not strong enough, this partial arc cannot propagate toward the other arcs whereas it remains unionized during flashover process. Figure 10 depicts the flashover process for Configuration 2 with two air gaps on the upper unit and one on the lower one. The arc near the high voltage electrode propagates toward the arc initiated upward from the middle. When these two upper arcs join together, a single arc appears. Then, they form a single arc over the upper unit whereas the one initiated on the lower unit propagates toward the other one along the remaining unabridged ice, leading to complete flashover. As observed from Figure 10, the middle arc first connected itself to the upper arc. This is probably due to the natural convection of fluid motion as a result of the buoyancy force [33]. Moreover, the surface emission and ionization rate was enhanced due to the high electric field distribution on the upper unit [34].
Figure 9. Arc propagation over ice surface under Configuration 1.
Figure 10. Arc propagation over ice surface under Configuration 2.
IEEE Transactions on Dielectrics and Electrical Insulation Vol. 21, No. 6; December 2014 2623
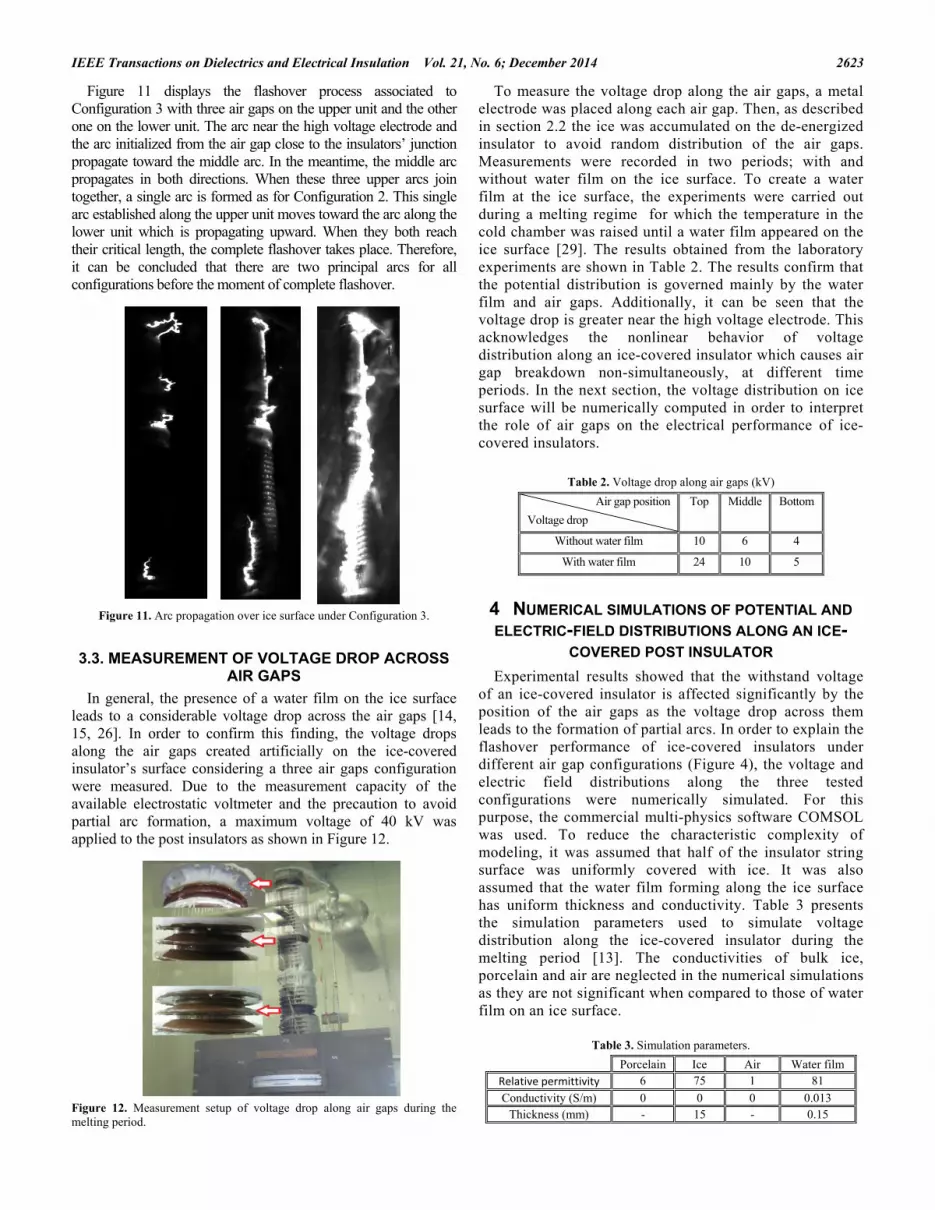
Figure 11 displays the flashover process associated to Configuration 3 with three air gaps on the upper unit and the other one on the lower unit. The arc near the high voltage electrode and the arc initialized from the air gap close to the insulators’ junction propagate toward the middle arc. In the meantime, the middle arc propagates in both directions. When these three upper arcs join together, a single arc is formed as for Configuration 2. This single arc established along the upper unit moves toward the arc along the lower unit which is propagating upward. When they both reach their critical length, the complete flashover takes place. Therefore, it can be concluded that there are two principal arcs for all configurations before the moment of complete flashover.
Figure 11. Arc propagation over ice surface under Configuration 3.
3.3. MEASUREMENT OF VOLTAGE DROP ACROSS AIR GAPS
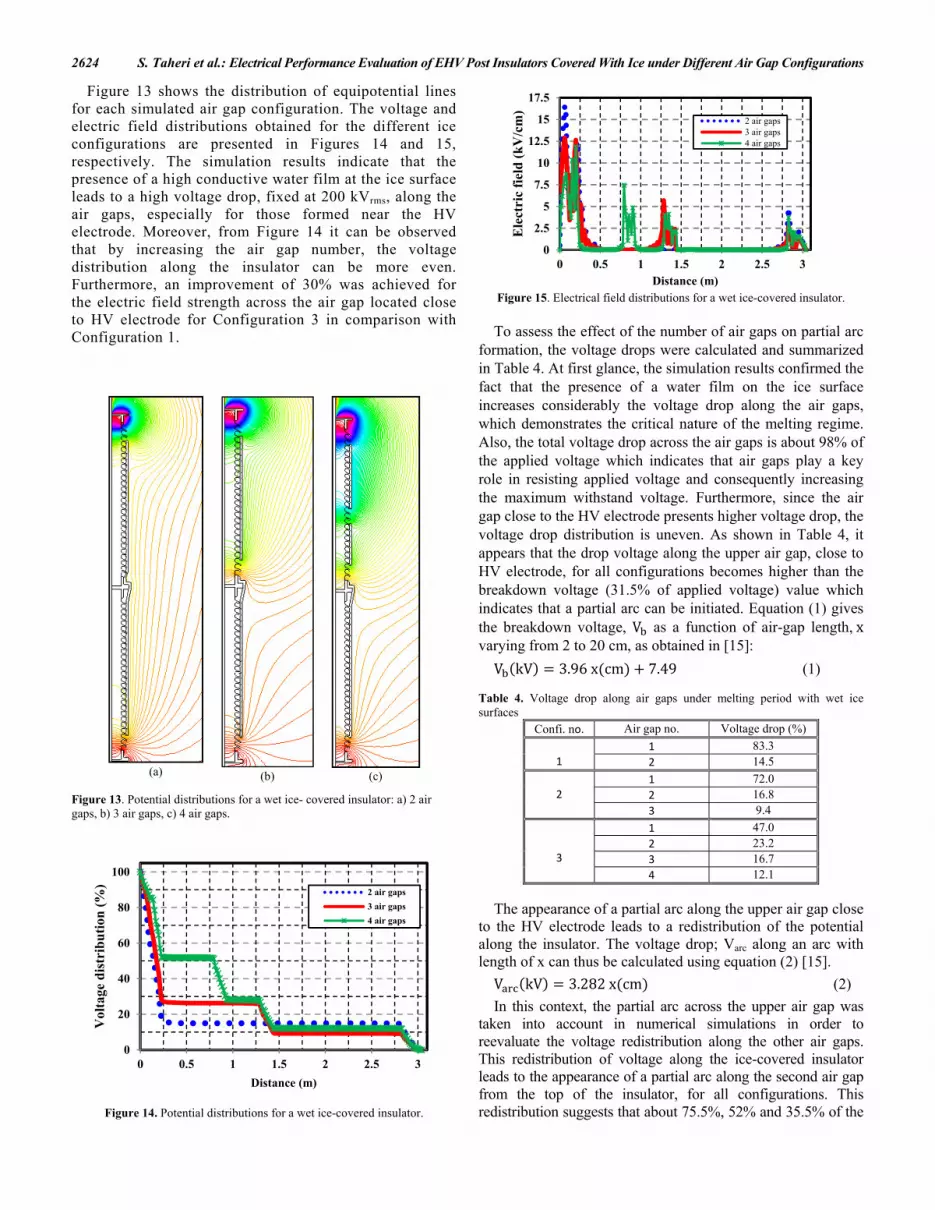
In general, the presence of a water film on the ice surface leads to a considerable voltage drop across the air gaps [14, 15, 26]. In order to confirm this finding, the voltage drops along the air gaps created artificially on the ice-covered insulator’s surface considering a three air gaps configuration were measured. Due to the measurement capacity of the available electrostatic voltmeter and the precaution to avoid partial arc formation, a maximum voltage of 40 kV was applied to the post insulators as shown in Figure 12.
Figure 12. Measurement setup of voltage drop along air gaps during the melting period.
To measure the voltage drop along the air gaps, a metal electrode was placed along each air gap. Then, as described in section 2.2 the ice was accumulated on the de-energized insulator to avoid random distribution of the air gaps. Measurements were recorded in two periods; with and without water film on the ice surface. To create a water film at the ice surface, the experiments were carried out during a melting regime for which the temperature in the cold chamber was raised until a water film appeared on the ice surface [29]. The results obtained from the laboratory experiments are shown in Table 2. The results confirm that the potential distribution is governed mainly by the water film and air gaps. Additionally, it can be seen that the voltage drop is greater near the high voltage electrode. This acknowledges the nonlinear behavior of voltage distribution along an ice-covered insulator which causes air gap breakdown non-simultaneously, at different time periods. In the next section, the voltage distribution on ice surface will be numerically computed in order to interpret the role of air gaps on the electrical performance of ice-covered insulators.
Table 2. Voltage drop along air gaps (kV)
Air gap position
Voltage drop
Top Middle Bottom
Without water film 10 6 4
With water film 24 10 5
4 NUMERICAL SIMULATIONS OF POTENTIAL AND
ELECTRIC-FIELD DISTRIBUTIONS ALONG AN ICE-COVERED POST INSULATOR
Experimental results showed that the withstand voltage of an ice-covered insulator is affected significantly by the position of the air gaps as the voltage drop across them leads to the formation of partial arcs. In order to explain the flashover performance of ice-covered insulators under different air gap configurations (Figure 4), the voltage and electric field distributions along the three tested configurations were numerically simulated. For this purpose, the commercial multi-physics software COMSOL was used. To reduce the characteristic complexity of modeling, it was assumed that half of the insulator string surface was uniformly covered with ice. It was also assumed that the water film forming along the ice surface has uniform thickness and conductivity. Table 3 presents the simulation parameters used to simulate voltage distribution along the ice-covered insulator during the melting period [13]. The conductivities of bulk ice, porcelain and air are neglected in the numerical simulations as they are not significant when compared to those of water film on an ice surface.
Table 3. Simulation parameters.
Porcelain Ice Air Water film Relative permittivity 6 75 1 81
Conductivity (S/m) 0 0 0 0.013 Thickness (mm) - 15 - 0.15
2624 S. Taheri et al.: Electrical Performance Evaluation of EHV Post Insulators Covered With Ice under Different Air Gap Configurations
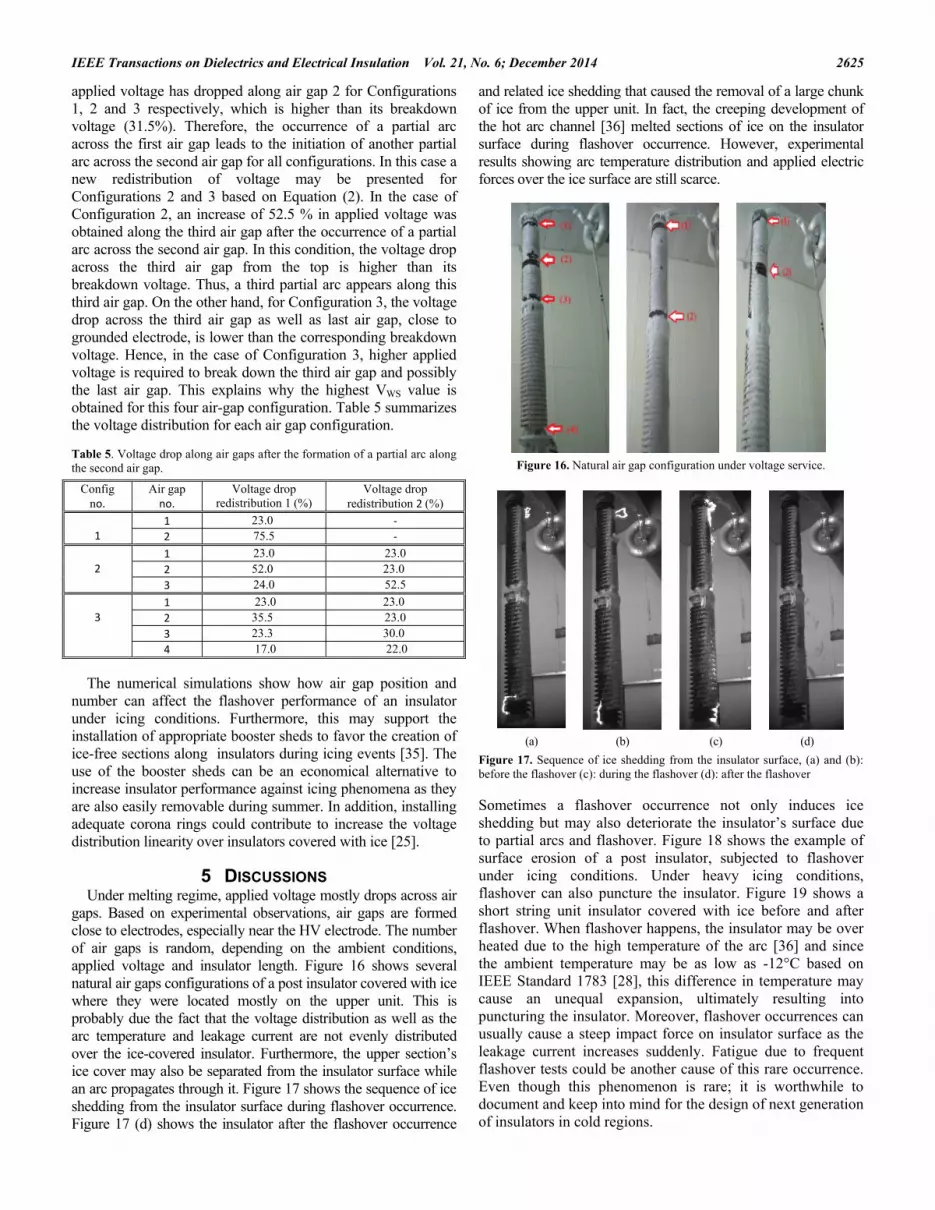
Figure 13 shows the distribution of equipotential lines for each simulated air gap configuration. The voltage and electric field distributions obtained for the different ice configurations are presented in Figures 14 and 15, respectively. The simulation results indicate that the presence of a high conductive water film at the ice surface leads to a high voltage drop, fixed at 200 kVrms, along the air gaps, especially for those formed near the HV electrode. Moreover, from Figure 14 it can be observed that by increasing the air gap number, the voltage distribution along the insulator can be more even. Furthermore, an improvement of 30% was achieved for the electric field strength across the air gap located close to HV electrode for Configuration 3 in comparison with Configuration 1.
(a)
(b)
(c)
Figure 13. Potential distributions for a wet ice- covered insulator: a) 2 air gaps, b) 3 air gaps, c) 4 air gaps.
Figure 14. Potential distributions for a wet ice-covered insulator.
Figure 15. Electrical field distributions for a wet ice-covered insulator.
To assess the effect of the number of air gaps on partial arc
formation, the voltage drops were calculated and summarized in Table 4. At first glance, the simulation results confirmed the fact that the presence of a water film on the ice surface increases considerably the voltage drop along the air gaps, which demonstrates the critical nature of the melting regime. Also, the total voltage drop across the air gaps is about 98% of the applied voltage which indicates that air gaps play a key role in resisting applied voltage and consequently increasing the maximum withstand voltage. Furthermore, since the air gap close to the HV electrode presents higher voltage drop, the voltage drop distribution is uneven. As shown in Table 4, it appears that the drop voltage along the upper air gap, close to HV electrode, for all configurations becomes higher than the breakdown voltage (31.5% of applied voltage) value which indicates that a partial arc can be initiated. Equation (1) gives the breakdown voltage, V as a function of air-gap length, x varying from 2 to 20 cm, as obtained in [15]:
V kV 3.96 x cm 7.49 (1)
Table 4. Voltage drop along air gaps under melting period with wet ice surfaces
Confi. no. Air gap no. Voltage drop (%)
1 1 83.32 14.5
2 1 72.02 16.83 9.4
3
1 47.02 23.23 16.74 12.1
The appearance of a partial arc along the upper air gap close to the HV electrode leads to a redistribution of the potential along the insulator. The voltage drop; Varc along an arc with length of x can thus be calculated using equation (2) [15].
V kV 3.282 x cm (2)
In this context, the partial arc across the upper air gap was taken into account in numerical simulations in order to reevaluate the voltage redistribution along the other air gaps. This redistribution of voltage along the ice-covered insulator leads to the appearance of a partial arc along the second air gap from the top of the insulator, for all configurations. This redistribution suggests that about 75.5%, 52% and 35.5% of the
0
20
40
60
80
100
0 0.5 1 1.5 2 2.5 3
Vol
tage
dis
trib
uti
on (
%)
Distance (m)
2 air gaps
3 air gaps
4 air gaps
0
2.5
5
7.5
10
12.5
15
17.5
0 0.5 1 1.5 2 2.5 3
Ele
ctri
c fi
eld
(k
V/c
m)
Distance (m)
2 air gaps3 air gaps4 air gaps
IEEE Transactions on Dielectrics and Electrical Insulation Vol. 21, No. 6; December 2014 2625
applied voltage has dropped along air gap 2 for Configurations 1, 2 and 3 respectively, which is higher than its breakdown voltage (31.5%). Therefore, the occurrence of a partial arc across the first air gap leads to the initiation of another partial arc across the second air gap for all configurations. In this case a new redistribution of voltage may be presented for Configurations 2 and 3 based on Equation (2). In the case of Configuration 2, an increase of 52.5 % in applied voltage was obtained along the third air gap after the occurrence of a partial arc across the second air gap. In this condition, the voltage drop across the third air gap from the top is higher than its breakdown voltage. Thus, a third partial arc appears along this third air gap. On the other hand, for Configuration 3, the voltage drop across the third air gap as well as last air gap, close to grounded electrode, is lower than the corresponding breakdown voltage. Hence, in the case of Configuration 3, higher applied voltage is required to break down the third air gap and possibly the last air gap. This explains why the highest VWS value is obtained for this four air-gap configuration. Table 5 summarizes the voltage distribution for each air gap configuration.
Table 5. Voltage drop along air gaps after the formation of a partial arc along the second air gap.
Config no.
Air gap no.
Voltage drop redistribution 1 (%)
Voltage drop redistribution 2 (%)
1
1 23.0 ‐
2 75.5 ‐
2
1 23.0 23.02 52.0 23.0 3 24.0 52.5
3
1 23.0 23.0 2 35.5 23.03 23.3 30.0 4 17.0 22.0
The numerical simulations show how air gap position and number can affect the flashover performance of an insulator under icing conditions. Furthermore, this may support the installation of appropriate booster sheds to favor the creation of ice-free sections along insulators during icing events [35]. The use of the booster sheds can be an economical alternative to increase insulator performance against icing phenomena as they are also easily removable during summer. In addition, installing adequate corona rings could contribute to increase the voltage distribution linearity over insulators covered with ice [25].
5 DISCUSSIONS Under melting regime, applied voltage mostly drops across air
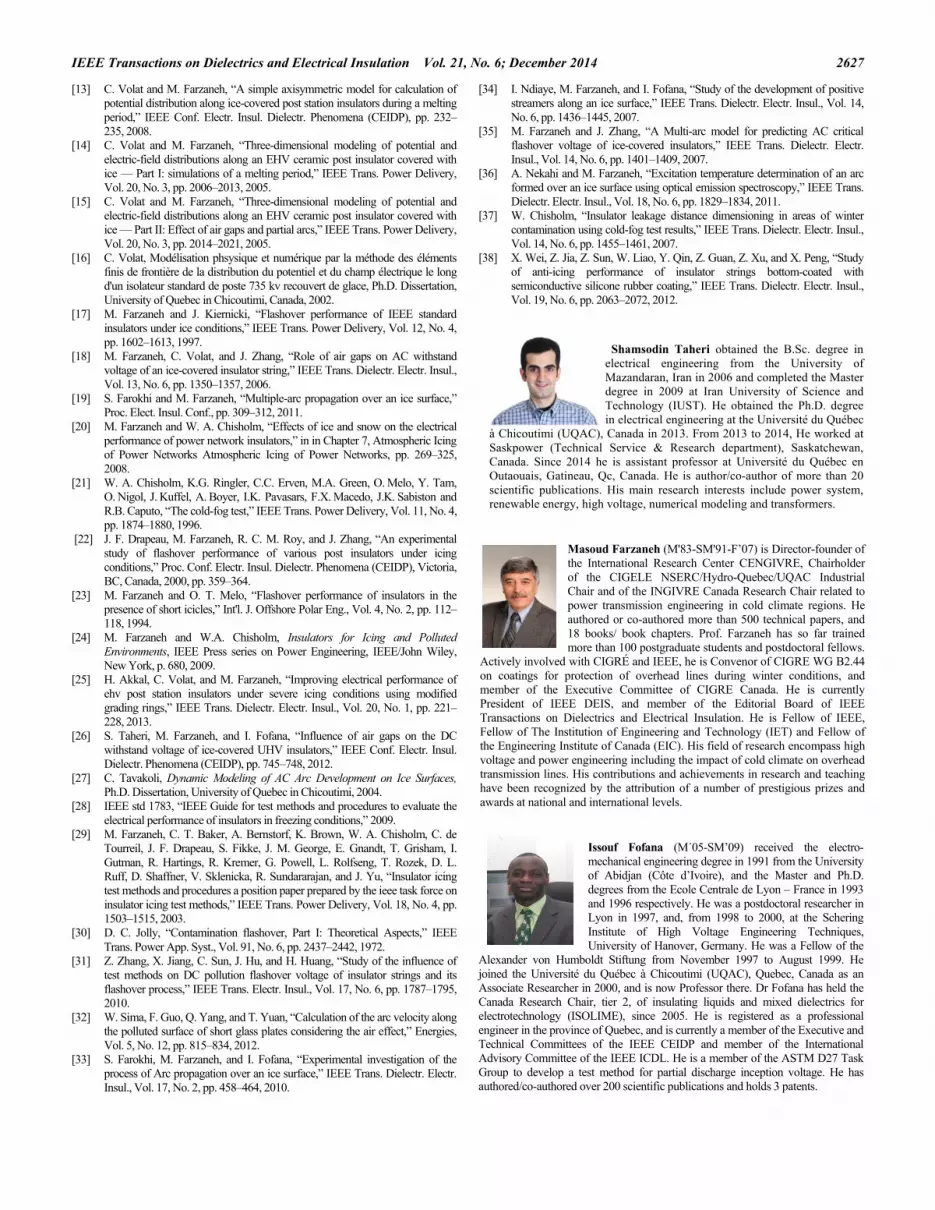
gaps. Based on experimental observations, air gaps are formed close to electrodes, especially near the HV electrode. The number of air gaps is random, depending on the ambient conditions, applied voltage and insulator length. Figure 16 shows several natural air gaps configurations of a post insulator covered with ice where they were located mostly on the upper unit. This is probably due the fact that the voltage distribution as well as the arc temperature and leakage current are not evenly distributed over the ice-covered insulator. Furthermore, the upper section’s ice cover may also be separated from the insulator surface while an arc propagates through it. Figure 17 shows the sequence of ice shedding from the insulator surface during flashover occurrence. Figure 17 (d) shows the insulator after the flashover occurrence
and related ice shedding that caused the removal of a large chunk of ice from the upper unit. In fact, the creeping development of the hot arc channel [36] melted sections of ice on the insulator surface during flashover occurrence. However, experimental results showing arc temperature distribution and applied electric forces over the ice surface are still scarce.
Figure 16. Natural air gap configuration under voltage service.
(a) (b) (c) (d)
Figure 17. Sequence of ice shedding from the insulator surface, (a) and (b): before the flashover (c): during the flashover (d): after the flashover
Sometimes a flashover occurrence not only induces ice shedding but may also deteriorate the insulator’s surface due to partial arcs and flashover. Figure 18 shows the example of surface erosion of a post insulator, subjected to flashover under icing conditions. Under heavy icing conditions, flashover can also puncture the insulator. Figure 19 shows a short string unit insulator covered with ice before and after flashover. When flashover happens, the insulator may be over heated due to the high temperature of the arc [36] and since the ambient temperature may be as low as -12°C based on IEEE Standard 1783 [28], this difference in temperature may cause an unequal expansion, ultimately resulting into puncturing the insulator. Moreover, flashover occurrences can usually cause a steep impact force on insulator surface as the leakage current increases suddenly. Fatigue due to frequent flashover tests could be another cause of this rare occurrence. Even though this phenomenon is rare; it is worthwhile to document and keep into mind for the design of next generation of insulators in cold regions.

2626 S. Taheri et al.: Electrical Performance Evaluation of EHV Post Insulators Covered With Ice under Different Air Gap Configurations
Figure 18. Erosion on post insulator surface.
(a) (b) (c)
Figure 19. Puncture of an insulator (a): before flashover, (b): during flashover, (c): after flashover.
Figure 20 shows the behavior of the leakage current during flashover. When leakage current rises abruptly, the insulator geometry may undergo a severe force due to electric field strength which can deteriorate its structure. This may sometimes be irreparable as shown in Figure 19. Hence, the role of partial discharges formed along the air gaps on the insulating performance of ice-covered insulators is fundamental. Coating the surface of insulators can help melting ice thus improving their electrical performance under icing conditions [37, 38]. In addition, current growth rate can also be considered as a criterion for the modeling of flashover of an ice covered-insulator. However, more study of the leakage current evolution is required to determine a criterion for flashover occurrence.
Figure 20. Evolution of the leakage current during flashover.
6 CONCLUSION Numerical and experimental investigations under different air
gap configurations relevant to the improvement of the maximum withstand voltage of two EHV post station insulator units under icing condition was investigated. The obtained experimental results showed that the maximum withstand voltage was significantly affected by the position of the air gaps. In the three air gap configurations studied, an improvement of 15% of the VWS was observed in the case of four air gaps along insulator surface.
Moreover, voltage drop measurements across the air gaps confirmed that the voltage was unevenly distributed along the ice-covered insulator surface. Furthermore, arc propagation recorded by high speed camera showed that regardless of the air gap positions at the instant of flashover, there are only two main arcs leading to flashover.
The simulation results showed that the voltage distribution, mostly along the air gaps, could be more even by increasing the air gap number. In addition, the formation of a partial arc along an air gap was observed to lead to voltage redistribution over ice-covered insulators. This voltage redistribution could explain why a high VWS value was achieved for Configuration 3, as a higher voltage level was required to break down the remaining air gaps leading to flashover.
ACKNOWLEDGMENT This work was carried out within the framework of the
NSERC/Hydro-Quebec/UQAC Industrial Chair on Atmospheric Icing of Power Network Equipment (CIGELE) and the Canada Research Chair on Engineering of Power Network Atmospheric Icing (INGIVRE) at Université du Québec à Chicoutimi. The authors would like to thank the CIGELE partners (Hydro-Québec, Hydro One, Réseaux de Transport d’Électricité (RTE), Rio Tinto Alcan, General Cable, K-Line Insulators, Dual-ADE, and FUQAC) whose financial support made this research possible.
REFERENCES
[1] M. Kawai, “AC Flashover tests at project UHV on ice-coated insulators,” IEEE Trans. Power App. Syst., Vol. 89, No. 8, pp. 1800–1804, Nov. 1970.
[2] T. Fujimura, K. Naito, Y. Hasegawa, and T. Kawaguchi, “Performance of insulators covered with snow or ice,” IEEE Trans. Power App. Syst., Vol. 98, No. 5, pp. 1621–1631, 1979.
[3] E. A. Cherney, “Flashover performance of artificially contaminated and iced long-rod transmission line insulators,” IEEE Trans. Power App. Syst., Vol. 99, No. 1, pp. 46–52, 1980.
[4] L. C. Phan and H. Matsuo, “Minimum flashover voltage of iced insulators,” IEEE Trans. Dielectr. Electr. Insul., Vol. 18, No. 6, pp. 605– 618, 1983.
[5] S. M. Fikke, J. E. Hanssen, and L. Rolfseng, “Long range transported pollutants and conductivity of atmospheric ice on insulators,” IEEE Trans. Power Delivery, Vol. 8, No. 3, pp. 1311–1321, 1993.
[6] M. Farzaneh and J. Kiernicki, “Flashover problems caused by ice build-up on insulators,” IEEE Electr. Insul. Mag., Vol. 11, No. 2, pp. 5–17, 1995.
[7] CIGRE Task Force 33.04.09, “Influence of ice and snow on the flashover performance of outdoor insulators, part I: Effects of Ice,” Electra, Vol. 187, pp. 91–111, 1999.
[8] M. Farzaneh, T. Baker, A. Bernstorf, J. T. Burnham, T. Carreira, E. Cherney, W. A. Chisholm, R. Christman, R. Cole, J. Cortinas, C. de Tourreil, J. F. Drapeau, J. Farzaneh-Dehkordi, S. Fikke, R. Gorur, T. Grisham, I. Gutman, J. Kuffel, A. Phillips, G. Powell, L. Rolfseng, M. Roy, T. Rozek, D. L. Ruff, A. Schwalm, V. Sklenicka, G. Stewart, R. Sundararajan, M. Szeto, R. Tay, and J. Zhang, “Selection of station insulators with respect to ice and snow — Part I: technical context and environmental exposure,” A position paper prepared by the IEEE Task Force on icing performance of line insulators, IEEE Trans. Power Delivery, Vol. 20, No. 1, pp. 264–270, 2005.
[9] M. Farzaneh and J.F. Drapeau, “AC flashover performance of insulators covered with artificial ice,” IEEE Trans. Power Delivery, Vol. 10, No. 2, pp. 1038–1051, 1995.
[10] M. Farzaneh, “Ice accretion on high-voltage conductors and insulators and related phenomena,” Phil. Trans. Roy. Soc., Vol. 358, No. 1776, pp. 2971–3005, 2000.
[11] J. F. Drapeau and M. Farzaneh, “Ice accumulation characteristics on Hydro-Quebec H.V insulators,” 6th Int'l. Workshop on the Atmospheric Icing of Structures, Budapest, Hungary, pp. 225–230, 1993.
[12] I. Fofana, M. Farzaneh, H. Hemmatjou, and C. Volat, “Study of discharge in air from the tip of an icicle,” IEEE Trans. Dielectr. Electr. Insul., Vol. 15, No. 3, pp. 730–740, 2008.
0
0.2
0.4
0.6
0.8
1
1 1.05 1.1 1.15 1.2 1.25 1.3Lea
kage
cur
rent
(A
)
Time (S)
Flashover moment
IEEE Transactions on Dielectrics and Electrical Insulation Vol. 21, No. 6; December 2014 2627
[13] C. Volat and M. Farzaneh, “A simple axisymmetric model for calculation of potential distribution along ice-covered post station insulators during a melting period,” IEEE Conf. Electr. Insul. Dielectr. Phenomena (CEIDP), pp. 232–235, 2008.
[14] C. Volat and M. Farzaneh, “Three-dimensional modeling of potential and electric-field distributions along an EHV ceramic post insulator covered with ice — Part I: simulations of a melting period,” IEEE Trans. Power Delivery, Vol. 20, No. 3, pp. 2006–2013, 2005.
[15] C. Volat and M. Farzaneh, “Three-dimensional modeling of potential and electric-field distributions along an EHV ceramic post insulator covered with ice — Part II: Effect of air gaps and partial arcs,” IEEE Trans. Power Delivery, Vol. 20, No. 3, pp. 2014–2021, 2005.
[16] C. Volat, Modélisation phsysique et numérique par la méthode des éléments finis de frontière de la distribution du potentiel et du champ électrique le long d'un isolateur standard de poste 735 kv recouvert de glace, Ph.D. Dissertation, University of Quebec in Chicoutimi, Canada, 2002.
[17] M. Farzaneh and J. Kiernicki, “Flashover performance of IEEE standard insulators under ice conditions,” IEEE Trans. Power Delivery, Vol. 12, No. 4, pp. 1602–1613, 1997.
[18] M. Farzaneh, C. Volat, and J. Zhang, “Role of air gaps on AC withstand voltage of an ice-covered insulator string,” IEEE Trans. Dielectr. Electr. Insul., Vol. 13, No. 6, pp. 1350–1357, 2006.
[19] S. Farokhi and M. Farzaneh, “Multiple-arc propagation over an ice surface,” Proc. Elect. Insul. Conf., pp. 309–312, 2011.
[20] M. Farzaneh and W. A. Chisholm, “Effects of ice and snow on the electrical performance of power network insulators,” in in Chapter 7, Atmospheric Icing of Power Networks Atmospheric Icing of Power Networks, pp. 269–325, 2008.
[21] W. A. Chisholm, K.G. Ringler, C.C. Erven, M.A. Green, O. Melo, Y. Tam, O. Nigol, J. Kuffel, A. Boyer, I.K. Pavasars, F.X. Macedo, J.K. Sabiston and R.B. Caputo, “The cold-fog test,” IEEE Trans. Power Delivery, Vol. 11, No. 4, pp. 1874–1880, 1996.
[22] J. F. Drapeau, M. Farzaneh, R. C. M. Roy, and J. Zhang, “An experimental study of flashover performance of various post insulators under icing conditions,” Proc. Conf. Electr. Insul. Dielectr. Phenomena (CEIDP), Victoria, BC, Canada, 2000, pp. 359–364.
[23] M. Farzaneh and O. T. Melo, “Flashover performance of insulators in the presence of short icicles,” Int'l. J. Offshore Polar Eng., Vol. 4, No. 2, pp. 112–118, 1994.
[24] M. Farzaneh and W.A. Chisholm, Insulators for Icing and Polluted Environments, IEEE Press series on Power Engineering, IEEE/John Wiley, New York, p. 680, 2009.
[25] H. Akkal, C. Volat, and M. Farzaneh, “Improving electrical performance of ehv post station insulators under severe icing conditions using modified grading rings,” IEEE Trans. Dielectr. Electr. Insul., Vol. 20, No. 1, pp. 221–228, 2013.
[26] S. Taheri, M. Farzaneh, and I. Fofana, “Influence of air gaps on the DC withstand voltage of ice-covered UHV insulators,” IEEE Conf. Electr. Insul. Dielectr. Phenomena (CEIDP), pp. 745–748, 2012.
[27] C. Tavakoli, Dynamic Modeling of AC Arc Development on Ice Surfaces, Ph.D. Dissertation, University of Quebec in Chicoutimi, 2004.
[28] IEEE std 1783, “IEEE Guide for test methods and procedures to evaluate the electrical performance of insulators in freezing conditions,” 2009.
[29] M. Farzaneh, C. T. Baker, A. Bernstorf, K. Brown, W. A. Chisholm, C. de Tourreil, J. F. Drapeau, S. Fikke, J. M. George, E. Gnandt, T. Grisham, I. Gutman, R. Hartings, R. Kremer, G. Powell, L. Rolfseng, T. Rozek, D. L. Ruff, D. Shaffner, V. Sklenicka, R. Sundararajan, and J. Yu, “Insulator icing test methods and procedures a position paper prepared by the ieee task force on insulator icing test methods,” IEEE Trans. Power Delivery, Vol. 18, No. 4, pp. 1503–1515, 2003.
[30] D. C. Jolly, “Contamination flashover, Part I: Theoretical Aspects,” IEEE Trans. Power App. Syst., Vol. 91, No. 6, pp. 2437–2442, 1972.
[31] Z. Zhang, X. Jiang, C. Sun, J. Hu, and H. Huang, “Study of the influence of test methods on DC pollution flashover voltage of insulator strings and its flashover process,” IEEE Trans. Electr. Insul., Vol. 17, No. 6, pp. 1787–1795, 2010.
[32] W. Sima, F. Guo, Q. Yang, and T. Yuan, “Calculation of the arc velocity along the polluted surface of short glass plates considering the air effect,” Energies, Vol. 5, No. 12, pp. 815–834, 2012.
[33] S. Farokhi, M. Farzaneh, and I. Fofana, “Experimental investigation of the process of Arc propagation over an ice surface,” IEEE Trans. Dielectr. Electr. Insul., Vol. 17, No. 2, pp. 458–464, 2010.
[34] I. Ndiaye, M. Farzaneh, and I. Fofana, “Study of the development of positive streamers along an ice surface,” IEEE Trans. Dielectr. Electr. Insul., Vol. 14, No. 6, pp. 1436–1445, 2007.
[35] M. Farzaneh and J. Zhang, “A Multi-arc model for predicting AC critical flashover voltage of ice-covered insulators,” IEEE Trans. Dielectr. Electr. Insul., Vol. 14, No. 6, pp. 1401–1409, 2007.
[36] A. Nekahi and M. Farzaneh, “Excitation temperature determination of an arc formed over an ice surface using optical emission spectroscopy,” IEEE Trans. Dielectr. Electr. Insul., Vol. 18, No. 6, pp. 1829–1834, 2011.
[37] W. Chisholm, “Insulator leakage distance dimensioning in areas of winter contamination using cold-fog test results,” IEEE Trans. Dielectr. Electr. Insul., Vol. 14, No. 6, pp. 1455–1461, 2007.
[38] X. Wei, Z. Jia, Z. Sun, W. Liao, Y. Qin, Z. Guan, Z. Xu, and X. Peng, “Study of anti-icing performance of insulator strings bottom-coated with semiconductive silicone rubber coating,” IEEE Trans. Dielectr. Electr. Insul., Vol. 19, No. 6, pp. 2063–2072, 2012.
Shamsodin Taheri obtained the B.Sc. degree in electrical engineering from the University of Mazandaran, Iran in 2006 and completed the Master degree in 2009 at Iran University of Science and Technology (IUST). He obtained the Ph.D. degree in electrical engineering at the Université du Québec
à Chicoutimi (UQAC), Canada in 2013. From 2013 to 2014, He worked at Saskpower (Technical Service & Research department), Saskatchewan, Canada. Since 2014 he is assistant professor at Université du Québec en Outaouais, Gatineau, Qc, Canada. He is author/co-author of more than 20 scientific publications. His main research interests include power system, renewable energy, high voltage, numerical modeling and transformers.
Masoud Farzaneh (M'83-SM'91-F’07) is Director-founder of the International Research Center CENGIVRE, Chairholder of the CIGELE NSERC/Hydro-Quebec/UQAC Industrial Chair and of the INGIVRE Canada Research Chair related to power transmission engineering in cold climate regions. He authored or co-authored more than 500 technical papers, and 18 books/ book chapters. Prof. Farzaneh has so far trained more than 100 postgraduate students and postdoctoral fellows.
Actively involved with CIGRÉ and IEEE, he is Convenor of CIGRE WG B2.44 on coatings for protection of overhead lines during winter conditions, and member of the Executive Committee of CIGRE Canada. He is currently President of IEEE DEIS, and member of the Editorial Board of IEEE Transactions on Dielectrics and Electrical Insulation. He is Fellow of IEEE, Fellow of The Institution of Engineering and Technology (IET) and Fellow of the Engineering Institute of Canada (EIC). His field of research encompass high voltage and power engineering including the impact of cold climate on overhead transmission lines. His contributions and achievements in research and teaching have been recognized by the attribution of a number of prestigious prizes and awards at national and international levels.
Issouf Fofana (M´05-SM’09) received the electro-mechanical engineering degree in 1991 from the University of Abidjan (Côte d’Ivoire), and the Master and Ph.D. degrees from the Ecole Centrale de Lyon – France in 1993 and 1996 respectively. He was a postdoctoral researcher in Lyon in 1997, and, from 1998 to 2000, at the Schering Institute of High Voltage Engineering Techniques, University of Hanover, Germany. He was a Fellow of the
Alexander von Humboldt Stiftung from November 1997 to August 1999. He joined the Université du Québec à Chicoutimi (UQAC), Quebec, Canada as an Associate Researcher in 2000, and is now Professor there. Dr Fofana has held the Canada Research Chair, tier 2, of insulating liquids and mixed dielectrics for electrotechnology (ISOLIME), since 2005. He is registered as a professional engineer in the province of Quebec, and is currently a member of the Executive and Technical Committees of the IEEE CEIDP and member of the International Advisory Committee of the IEEE ICDL. He is a member of the ASTM D27 Task Group to develop a test method for partial discharge inception voltage. He has authored/co-authored over 200 scientific publications and holds 3 patents.