the covered response ultimatum game
TRANSCRIPT

SFB Discussion Paper B-416
The Covered Response Ultimatum Game
by
KLAUS ABBINK, ABDOLKARIM SADRIEH & SHMUEL ZAMIR
February 1999
AbstractWe report an experiment on the covered response ultimatum game, in which the proposer is not informed aboutthe responder’s reaction to an unequal offer. In this game, no education of proposers is possible. A controlexperiment with informed proposers was also conducted. We observe high rejection rates with covered re-sponse. These are explained by responders’ resistance to unfairness. But the rejection rates are lower than in thecontrol group, due to the lacking possibility of educative punishment. Proposers in the open response treatmenttest responders’ propensity to reject by making more unequal offers. We conclude that both resistance to unfair-ness and educative punishment are determinants of behaviour, but neither is sufficient on its own.
KeywordsUltimatum bargaining, fairness, punishment, experimental economics
JEL Classification CodesC78, C91, C92, D82
AcknowledgementsThe authors thank the teams of the RatioLab at the Hebrew University of Jerusalem and the Laboratorium fürexperimentelle Wirtschaftsforschung at the University of Bonn for their aid in collecting the data, and GaryBornstein, Bernd Irlenbusch, Bettina Kuon, Reinhard Selten, and seminar participants in Berlin, Haifa, Meißen,and Paris for helpful comments. Support by the Deutsche Forschungsgemeinschaft through theSonderforschungsbereich 303, by the German-Israeli Foundation ! GIF !, by the European Union through theTMR programme ENDEAR, and by the Land Nordrhein-Westfalen is gratefully acknowledged.
Authors
Klaus Abbink Abdolkarim Sadrieh Shmuel ZamirLaboratorium für experimentelle Wirtschaftsforschung
Universität BonnAdenauerallee 24-42, 53113 Bonn, Germany
phone: 49-228-73-9192fax: 49-228-73-9193
Dept. of StatisticsThe Hebrew University of JerusalemMt. Scopus, 91905 Jerusalem, Israel
phone: 972-2-5883305fax: 972-2-5825748
1
I. Introduction
In the well-known ultimatum game, one player (the proposer, male pronouns) offers a second
player (the responder, female pronouns) a division of a fixed cake. The responder can either
accept or reject. If she accepts, the proposed division is implemented, if she rejects, both
receive nothing. The subgame perfect equilibrium is straightforward: the responder will not
reject any positive offers, since even the smallest positive payoff is better than receiving zero. In
anticipation of this, the proposer will not offer more than the smallest money unit. The responder
will accept. Under common knowledge of rationality, the proposer will grab virtually the whole
cake for himself.
Subjects’ behaviour, however, is different. A huge experimental literature starting with
GÜTH, SCHMITTBERGER, and SCHWARZE (1982) has focused on this simple model of bar-
gaining, and in almost all studies dramatic deviations from the subgame perfect prediction are
observed1. Typically, responders do turn down small offers, and proposers offer substantial
amounts of money, very often up to an equal division of the cake.
Why do responders reject when this just means leaving money on the table? Obviously, such
behaviour is not rational, if subjects are concerned about own payoffs only and the game is only
played once. Thus, a natural approach to explain rejections in the ultimatum game is to assume
that for some reason responders prefer receiving nothing to receiving little. Such preference
could be based on the fact that rejection creates an allocation in which the proposer also receives
nothing. This approach is related to a fairness argument: Responders are willing to pay the price
of receiving nothing because of some inherent resistance to unfairness, in the language of
THALER (1988).
However, if we look at the experimental results, it is striking that, although responders give up
money they could have taken, they are in the end much better off than in subgame perfect
equilibrium play, at least if we consider the population of responders as a whole. So, is there a
different kind of rationality at work - maybe some form of population rationality, as WINTER
and ZAMIR (1996) suggest? Because responders reject small offers, proposers better not make
them. Thus, responders in total earn more than in subgame perfect equilibrium. Could it be that
it is not fairness, but some kind of monetary self-interest that drives them? In other words, the
fundamental question we investigate in this paper is: Do responders reject because they want to
earn more or do they earn more because they want to reject?
This question reflects a dispute that has entered the scene in the recent years. The hypothesis that
it is a kind of self-interest that drives subjects’ behaviour is supported by authors who apply
adaptive learning dynamics to the ultimatum game (GALE, BINMORE, and SAMUELSON, 1995,
1 Overviews over the literature on ultimatum experiments are given by GÜTH (1994), ROTH (1995), andCAMERER and THALER (1995).
2
ROTH and EREV, 19952). They argue that, since rejections of small offers cause smaller losses
for the responder than for the proposer, proposers learn faster not to make small offers than the
responders learn to accept them. Simulations of such models of adaptive learning provide a
rationale for experimental results. The surprising feature of these models is that responders are
reluctant to accept small offers, even though they only respond to their own success, and have no
preference for any kind of fairness.
ABBINK, BOLTON, SADRIEH, and TANG (1996) find that the reported data fit of these models
does not allow general conclusions about second mover motivations and learning. To analyse
how learning mechanisms and punishment motivation are connected, the authors use the
uncertain reward game in which the proposer is either punished or rewarded by a rejection, but
this is private information to the responder. Since both treatments of that study are identical with
respect to the players’ information on own payoffs3, reinforcement learning models predict the
same results. The experiment, however, shows significantly more rejections when the responder
knows that the proposer is punished by the rejection than when she knows that he is rewarded.
Thus, adaptive learning alone cannot explain actual ultimatum game behaviour. Obviously,
some concern about the proposer’s payoff is involved in the responder’s decision making.
Simulations of an adaptive learning model using the uncertain reward game suggest that the
learning mechanism mimics a punishment motivation of the responder agents. Therefore, the
adaptive learning model predictions fit the data well in the punishment treatment, but
overpredict rejection rates in the reward treatment.
BOLTON (1991), RABIN (1993), BOLTON and OCKENFELS (1997), and FEHR and SCHMIDT (1998)
develop the second line of explanation. In these fairness utility models, subjects are concerned
about their own payoff and the “fairness” of the outcome. Although fairness is modelled in
different ways, the individuals’ resistance to unfairness in all cases is a disutility of unfair
outcomes. Standard game theoretical methods are then applied to games in which players have
such modified utility (or motivation) functions. A remarkably good fit of their models’
predictions to a wide range of different experimental data is found. The authors conclude that the
observed behaviour is driven by fairness considerations of responders. The subjects in these
models, however, are concerned about fairness only in a static manner.4 Dynamic considerations
of decision making, that motivate punishment either as a response to history (reciprocity) or as
an investment for future payoffs (educative punishment), are not modelled.
In this paper, we introduce the covered response ultimatum game which allows us to separate
static from dynamic motives across treatments. The simple modification we apply to the
2 For a refinement of the learning model see EREV and ROTH 1998.3 The payoff structure for the proposer is identical except in one end node. But, since the payoff of this end node isnot reported to him, he cannot distinguish between the two treatments. The responder’s payoffs are not affected bythe treatment variable.4 GNEEZY and STOLER (1998) show that in a one-shot situation, social punishment behaviour can be observednext to personal revenge.

3
ultimatum game is that in one treatment (the covered response treatment) the responder’s
decision is not reported to the proposer immediately, while in a second treatment (the open
response treatment) it is. Hence, rejections observed in the covered response treatment cannot be
explained by educative punishment, whereas the fairness utility models cannot explain
differences across the two treatments. The former is true because the proposer cannot be
educated by rejections, since he does not observe the rejections until after the last decision has
been made in the experiment. The latter holds because the payoff and the strategic structure in
both treatments is identical, therefore fairness utility models would predict the same rejection
rates in both treatments. The experimental results reported in this paper suggest that behaviour is
motivated both by resistance to unfairness as well as by educational punishment, but neither
explanation is sufficient on its own.
II. Hypotheses
As mentioned, our covered response ultimatum game provides a qualitative test of the under-
lying hypotheses of the static fairness utility models and the dynamic approaches. We now put
the two main hypotheses we test in the present study more specifically. The first hypothesis,
which we call the hypothesis of resistance to unfairness, specifies the motivational assumptions
underlying the fairness utility models. In these models, dynamic considerations are irrelevant.
Only the final outcome matters for the players. They have no preferences for the distribution of
the feedback information.
H1: The hypothesis of resistance to unfairness
Responders are exclusively motivated by their own payoff and the final outcome.
We will therefore observe no difference in rejection rates between the covered and
the open response treatment.
The second hypothesis addresses an educational motive by responders in the ultimatum game.
Responders punish proposers in order to teach them not to behave unfairly in future. They utilise
the fact that proposers face a much greater damage after a rejection than responders. Proposers
are therefore thought to be influenced towards more equal more generous offers by punishment.
As a population, on average, the responders benefit from the punishments.
H2: The hypothesis of educative punishment
Responders are exclusively motivated by their own payoff and the payoff of their
own population: they reject unfair offers in order to educate the population of pro-
posers to offer more generously. We will therefore observe no rejections in the cov-
ered response treatment and high rejection rates in the open response treatment.

4
Note that according to this hypothesis responders educate for the sake of the responder
population as a whole: The education need not affect a particular proposer for later occasions
when the same proposer and responder meet again. It is known that educative motivations are
relevant even if it is impossible to build up a reputation that pays back in future play, since a
second encounter of the same pair of players is excluded. Arguments in this line have been used
in video-taped group discussions in a one-shot experiment on a trust game conducted by
JACOBSEN and SADRIEH (1996).
The covered response ultimatum game separates the two hypotheses in the sense that rejections
in the covered response treatment can be explained by H1 but not by H2. Observing more
rejections in the open than in the covered response treatment, however, can be explained by H2
but not by H1.
Both hypotheses do not rule out one another. It might be the case that both motivations are
relevant determinants of behaviour. Thus, our design is subtractive: In the open response
treatment, both motivations might be relevant. The covered response treatment removes the
educative motive from the game. We can interpret the rejection rate in the covered response
treatment as the basic rate of resistance to unfairness. The difference in rejection rates is then the
part added by the motive of educative punishment.
III. Model and Procedure
To simplify data analysis, we use a reduced version of the ultimatum game, similar to what
BOLTON and ZWICK (1995) introduced as the cardinal ultimatum game, or what GALE,
BINMORE, and SAMUELSON (1995) refer to as the ultimatum minigame. In our game, the
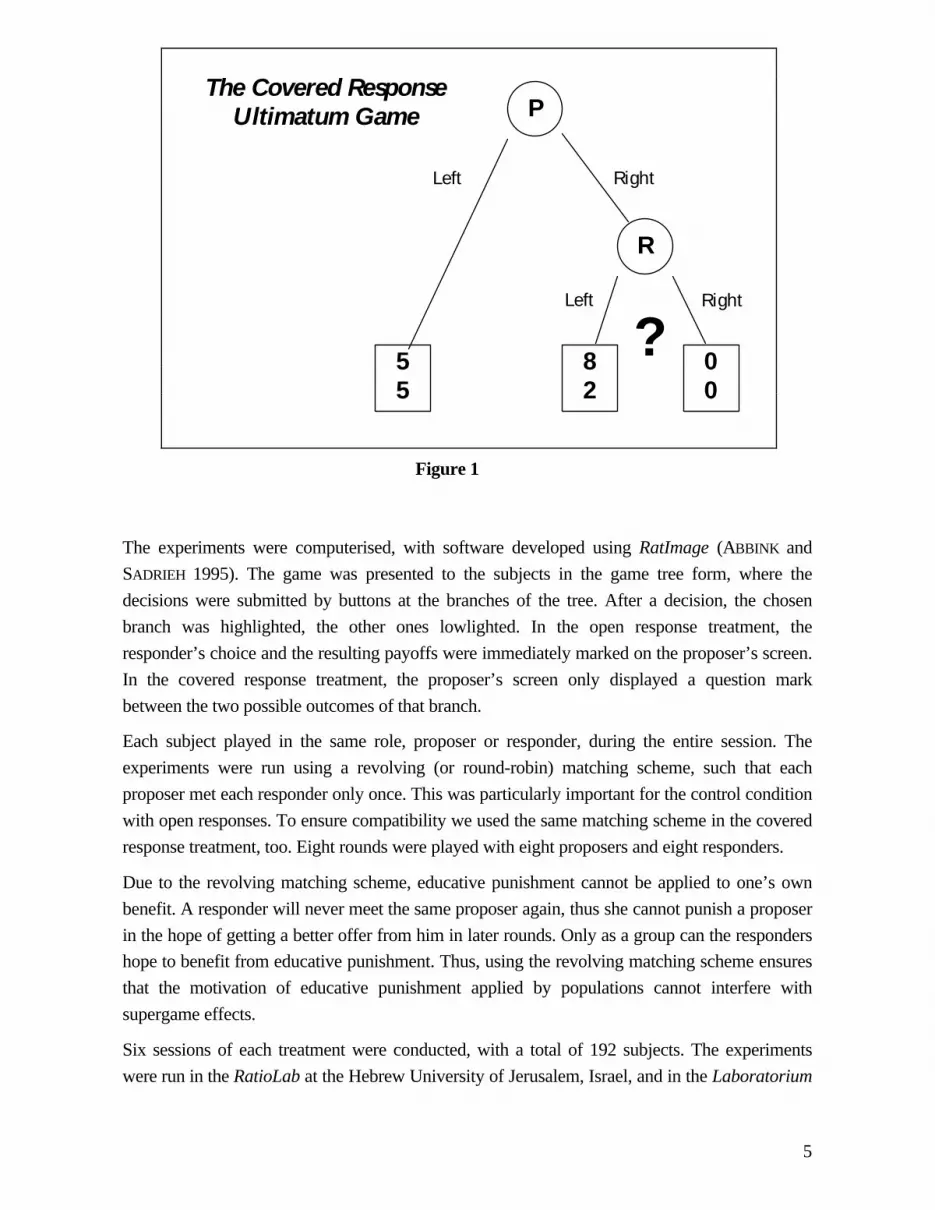
proposer is restricted to two alternatives: the equal split (5,5) or a division favouring himself
(8,2). The responder cannot reject the equal split. She can, however, choose to reject the unequal
offer, in which case both players receive nothing.
Compared to the standard ultimatum game, the reduced version used here allows simpler data
analysis. All relevant data appears in one number for each role: subjects’ behaviour is expressed
in proposer equal offer rates and responder rejection rates only. Previous experimental studies
(BOLTON and ZWICK 1995, ABBINK, BOLTON, SADRIEH, and TANG 1996) have shown that the
reduced form ultimatum game captures the most relevant ultimatum game characteristics.
The game tree of the game we used in the experiments is depicted in figure 1. It is the same for
the open and the covered response treatment. The difference between the treatments is that in the
covered response condition the responder’s choice was not reported to the proposer. Only after
the complete session, proposers in the covered response treatment were informed about their
earnings. From this information, they could derive how many times they were punished, but not
when and by whom. During the sessions, however, no such attribution could be made.
5
Figure 1
The experiments were computerised, with software developed using RatImage (ABBINK and
SADRIEH 1995). The game was presented to the subjects in the game tree form, where the
decisions were submitted by buttons at the branches of the tree. After a decision, the chosen
branch was highlighted, the other ones lowlighted. In the open response treatment, the
responder’s choice and the resulting payoffs were immediately marked on the proposer’s screen.
In the covered response treatment, the proposer’s screen only displayed a question mark
between the two possible outcomes of that branch.
Each subject played in the same role, proposer or responder, during the entire session. The
experiments were run using a revolving (or round-robin) matching scheme, such that each
proposer met each responder only once. This was particularly important for the control condition
with open responses. To ensure compatibility we used the same matching scheme in the covered
response treatment, too. Eight rounds were played with eight proposers and eight responders.
Due to the revolving matching scheme, educative punishment cannot be applied to one’s own
benefit. A responder will never meet the same proposer again, thus she cannot punish a proposer
in the hope of getting a better offer from him in later rounds. Only as a group can the responders
hope to benefit from educative punishment. Thus, using the revolving matching scheme ensures
that the motivation of educative punishment applied by populations cannot interfere with
supergame effects.
Six sessions of each treatment were conducted, with a total of 192 subjects. The experiments
were run in the RatioLab at the Hebrew University of Jerusalem, Israel, and in the Laboratorium
P
R
00
82
55
The Covered ResponseUltimatum Game
Left Right
Left Right
?
6
für experimentelle Wirtschaftsforschung at the University of Bonn, Germany. In a two-country
experiment, the fact that the subjects in different countries are drawn from distinct subject pools
must be taken into account. Differences in behaviour might arise from country-specific cultural
environments, but also from a different composition of the subject pools with respect to educa-
tional background, gender, age, majors of study, and others. In fact, in the four country study by
ROTH, PRASNIKAR, OKUNO-FUJIWARA, and ZAMIR (1991), especially the Israeli subjects’ be-
haviour was slightly different from that in the other countries. In Jerusalem, lower offers and a
higher tendency to accept low offers were observed in the ultimatum game. Although the study
involves only few independent observations, we must be aware of the possibility of subject pool
differences. We controlled for this by splitting the two treatments between the two locations
evenly. Three sessions of each treatment were run in each laboratory. Thus, even if subject pool
differences exist, they cannot be in conflict with treatment differences.
All subjects were volunteers and were only given monetary incentives. The sessions started with
an introductory talk of about 10 minutes. The written instructions that were handed out to the
subjects are reproduced in the appendix. To ensure that the instructions were equivalent in both
countries, although the sessions were conducted in the local language of each country, the
instructions were first written in English. They were then translated into each local language by
a member of the local laboratory team. In the next step, another team member translated the
translation back into English, without seeing the original English text. This procedure was
repeated until the back-translation and the original text had converged. Convergence, however,
was reached rather quickly, since a very neutral and technical phrasing was used. The same
method was applied to the screen output, which was also displayed in the local language of each
country.
The social composition of the two subject pools was similar, since both laboratories are located
in social science buildings. Both subject pools mainly consisted of students of social sciences.
The exchange rates of points to cash were adjusted in the two countries in a way that total
earnings were comparable, in terms of teaching assistants’ average hourly wage rates at each
location. The exchange rate of DM 0.50 (roughly US-$ 0.33 at that time) per point was used in
Bonn, and NIS 0.75 (about US-$ 0.25) was used in Jerusalem. Since the experiments were short
(about 30-45 minutes in total), the resulting payoffs were on average well above the typical
student’s per hour wage.
III. Results
First, we focus on the responder behaviour. We begin with the analysis of aggregate rejection
rates over the sessions.
7
III.1 Responder Rejection Rates
Table 1 shows the average overall rejection rates (rejected unequal offers to total unequal offers)
in the six sessions of each treatment, ordered from the lowest to the highest. The Jerusalem
sessions are marked with a cross, the Bonn sessions with an asterisk.
Table 1. Average rates of rejected unequal offers in each session (in percent)
covered 6.5+ 17.6* 22.7+ 26.1* 31.0* 31.3+ ∅=22.5open 10.0+ 20.0* 40.0* 43.5* 50.0+ 80.0+ ∅=40.6
The rejection rates show that, even when the response is not reported to the proposer, almost one
quarter of all unequal offers are turned down. This is clear evidence for responders’ resistance to
unfairness that is entirely independent of all considerations of monetary self-interest. Responders
obviously cannot punish proposers in the covered response treatment - not even as a group - in
order to receive higher payoffs later. Thus, the relatively high average rejection rate (22.5%) is
evidently motivated by negative emotions towards unfair actions or distributions. Responders
are willing to pay a price solely to soothe their anger concerning the proposer’s greed. The
disutility of unfair outcomes in fairness utility can be interpreted as a formalisation of such an
emotional component.
However, fairness utility models do not explain a different aspect of our data. There is a
significant difference in the rejection rates of the two treatments. The average rejection rates of
the open response condition are about 75% higher than those of the covered treatment. The
difference is significant with a p-value of 0.051, according to the Mann-Whitney U-test applied
to the average rates of rejection in sessions. The extent to which more rejections are observed in
the open response treatment must be attributed to the visibility of the rejection. The difference
caused by visibility could be based on the fact that visibility turns rejection into an act of
reciprocal punishment. Since visibility allows that the reciprocation can uniquely be ascribed to
the reciprocating subject, the connection between punisher, the reason for punishment, and the
addressee of the punishment becomes unambiguous. This - in a second step of reasoning -
allows for an immediate perception of the educational goal of punishment by the proposers.
In this sense, visibility enables a responder to educate a proposer in an attempt to educate the
group of proposers as a whole. Obviously, proposers, who assume to be faced with a group of
responders that strictly reject any unfair proposals, will tend to switch to more equal split offers.
A similar type of behaviour is reported by WINTER and ZAMIR (1996). An attempt to educate the
group of proposers in fact is well in line with the hypothesis of population rationality put
forward in that work.

8
III.2 Does Behaviour Change Over Time?
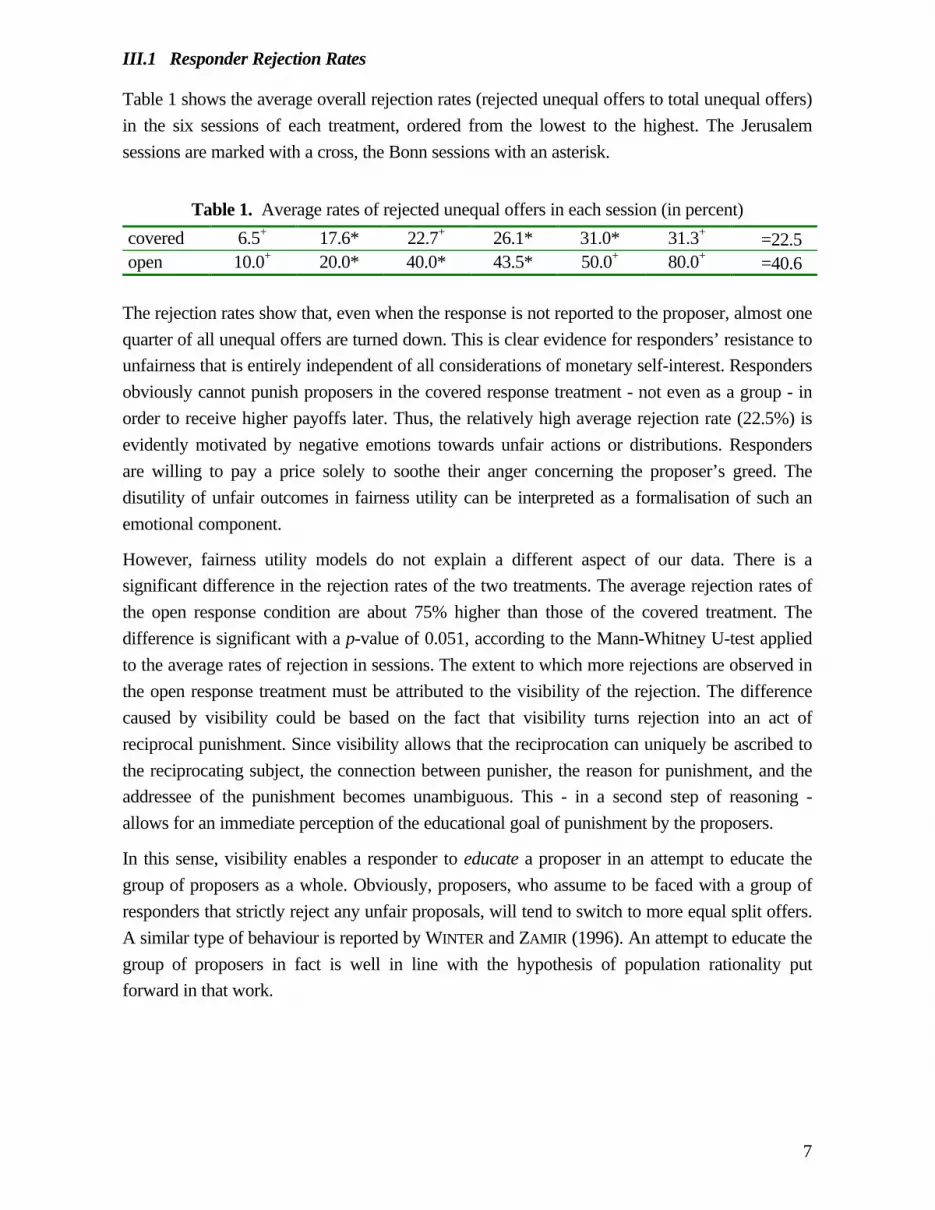
Figure 2 shows the aggregate rejection rates over the eight rounds of the experiment. It is
consistent with the hypothesis of educative punishment that the differences between the rejection
rates across treatments diminish towards the end of the session: in the last two rounds, when
educative punishment makes little or no sense, almost no difference between the treatments can
be observed. The fact that average rejection rates get closer to one another is mainly due to the
tendency of the rejection rates in the open response treatment to fall over time. From the first to
the second half of a session (four rounds each), the aggregate rejection rate falls from 39.8% to
29.1% in the open response treatment. The decrease is significant at p = 0.015, according to the
Wilcoxon matched pairs signed rank test, applied to the difference of rejection rates between the
first and the second half of the experiment in the six independent sessions. In contrast, the
rejection rates in the covered response treatment fall only slightly (from 24.2% to 21.4%), and
the decrease is not significant. The corresponding numbers for the single sessions are shown in
the following table 2.
Table 2. Rejection rates in the first and the second half of the experiment
Open treatment Covered treatment
Session Rounds1-4
Rounds5-8
∆ Rounds1-4
Rounds5-8
∆
1*2*3*4+
5+
6+
0.440.180.440.520.820.18
0.430.210.400.430.750.07
!0.01+0.03!0.04!0.09!0.07!0.11
0.380.330.190.200.290.13
0.230.290.170.250.330.00
!0.15!0.04!0.02+0.05+0.04!0.13
AverageAggregate
0.430.40
0.380.29
!0.05!0.11
0.250.25
0.210.21
!0.04!0.04
*= Bonn session += Jerusalem session
This result, together with the result that average rejection rates over the complete sessions in the
covered response treatment are significantly lower than those in the open response treatment,
leads to the following conjecture: Responders’ rejection rates in ultimatum games consist to a
certain extent of rejections due to resistance to unfairness, and to some degree of rejections
motivated by educative punishment. It seems that the fairly stable rate of rejections in all rounds
of the covered response treatment reflects some kind of basic rate of rejections due to resistance
to unfairness in our subject pool. The higher rates of rejection in the early rounds of the open
response treatment appear to incorporate some amount of rejections motivated by educative
9
punishment in addition to the basic rate of rejections due to resistance to unfairness. Towards the
end of the sessions under the open response condition, the added rate of rejections motivated by
educative punishment decreases, leading to the observed decrease in the difference between the
total rejection rates of the two treatments.
Figure 2
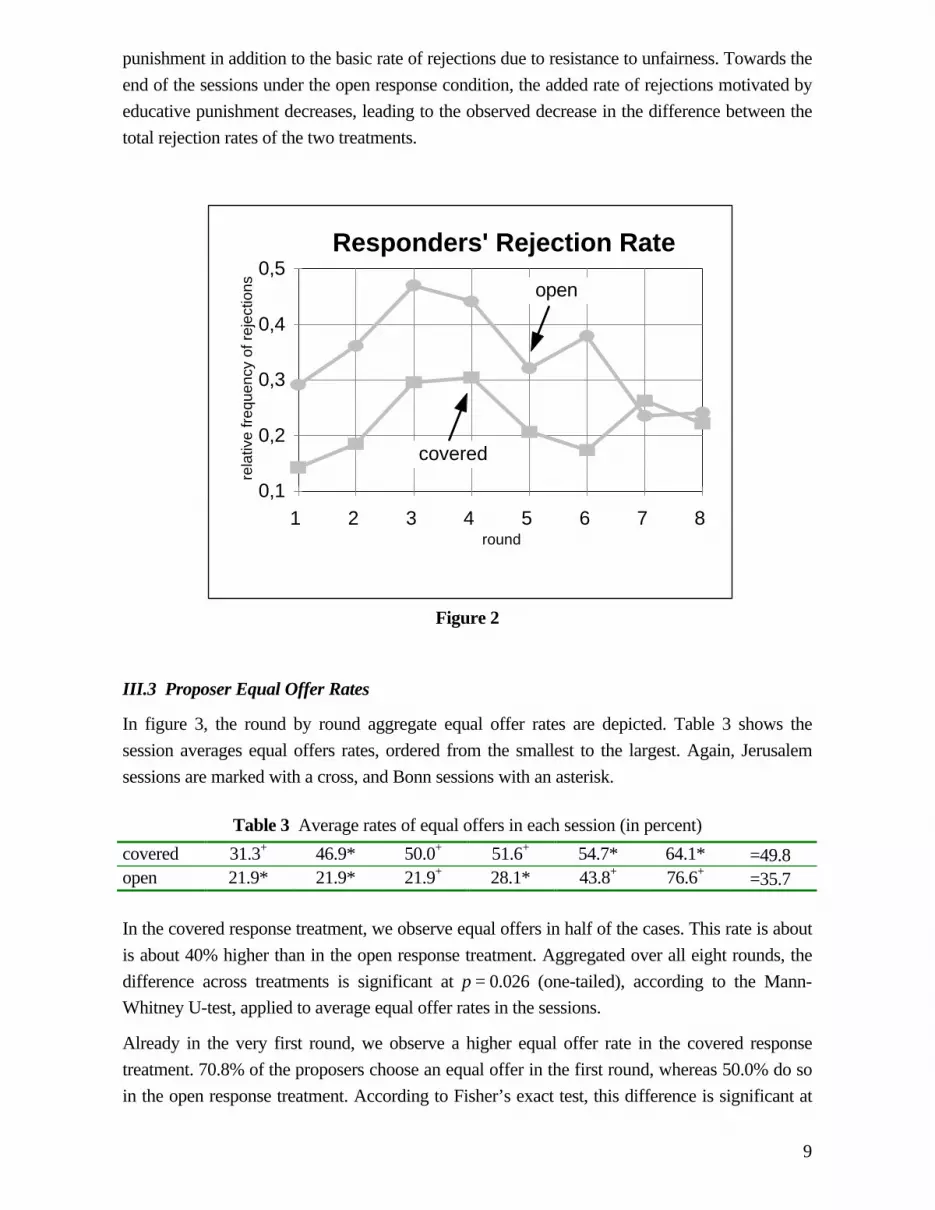
III.3 Proposer Equal Offer Rates
In figure 3, the round by round aggregate equal offer rates are depicted. Table 3 shows the
session averages equal offers rates, ordered from the smallest to the largest. Again, Jerusalem
sessions are marked with a cross, and Bonn sessions with an asterisk.
Table 3 Average rates of equal offers in each session (in percent)
covered 31.3+ 46.9* 50.0+ 51.6+ 54.7* 64.1* ∅=49.8open 21.9* 21.9* 21.9+ 28.1* 43.8+ 76.6+ ∅=35.7
In the covered response treatment, we observe equal offers in half of the cases. This rate is about
is about 40% higher than in the open response treatment. Aggregated over all eight rounds, the
difference across treatments is significant at p = 0.026 (one-tailed), according to the Mann-
Whitney U-test, applied to average equal offer rates in the sessions.
Already in the very first round, we observe a higher equal offer rate in the covered response
treatment. 70.8% of the proposers choose an equal offer in the first round, whereas 50.0% do so
in the open response treatment. According to Fisher’s exact test, this difference is significant at
0,1
0,2
0,3
0,4
0,5 re
lativ
e fr
eque
ncy
of r
ejec
tions
1 2 3 4 5 6 7 8 round
Responders' Rejection Rate
open
covered
10
p = 0.019 (one-tailed). Note that the individuals’ equal offers are independent in the very first
round of the experiment.
Figure 3
It is interesting that the equal offer rates in the covered response treatment are significantly
higher than in the open treatment, although the rejection rates of unequal offers are lower. It
seems plausible that the high equal offer rates in the covered response treatment are due to a type
of risk avoidance of the proposers. If the proposer makes an unequal offer, his payoff can vary
between 0 and 8, depending on the responder’s choice. In contrast, he is guaranteed a payoff of 5
when making an equal offer. Thus, if the proposer believes that there is a positive probability for
some responders to reject the unequal offer, the payoff on the right branch is uncertain, with an
unknown probability.
To explain the discrepancy in proposers’ first round behaviour across treatments, the following
behavioural hypothesis seems suitable: Subjects proposing in the open response treatment tend
to test responders’ propensity to reject by selecting the unequal offer branch. Learning from
success or failure, however, is completely impossible for proposers in the covered response
treatment. It seems that the lack of feedback increases the tendency to avoid risk and leads to the
significantly higher equal offer rates in the entire session in the covered response treatment.
0,1
0,2
0,3
0,4
0,5
0,6
0,7
0,8
rela
tive
freq
uenc
y of
equ
al o
ffers
1 2 3 4 5 6 7 8 round
Proposers' Equal Offer Rate
covered
open

11
III.4 Is Educative Punishment Effective?
Given that responders in the open response treatment use punishment as a means of
education, the question arises whether their attempt is successful, in the sense that in the long
run, proposers tend to shy away from the unequal offer because of the expectation of a
punishment. If this is the case, then we should observe an increase of equal offer rates in
those proposer populations in which rejection rates are highest. For each session, we look at
rejection rates in the first half of the experiment and the change of equal offer rates from the
first to the second half. We compute the correlation of these two measures over the sessions.
If educative punishment is effective, then a tendency for high first half rejection rates to be
followed by high increases in equal offer rates should be observed.
Figure 4
Figure 4 shows that in fact, there is a strong correlation in the predicted direction. The greater
the responders’ reluctance to accept unfair offers, the greater is the rise in the frequency of equal
offers with time. The Spearman rank correlation coefficient of rs = 0.93 is significantly different
from zero at ∀ = 0.05 (one-tailed). Thus, high frequencies of rejections correlate to higher
increases in equal offer rates.
We now examine whether the positive correlation between rejection rates and the change in
equal offer rates can be detected on individual level. To see this, we check each round in which a
proposer switches from a preceding round’s unequal to a current round’s equal offer. We count
how often the equal offer was made after the last round’s unequal offer was rejected, and
-0,25
-0,15
-0,05
0,05
0,15
0,25
0,35
Cha
nge
in E
qual
Offe
r R
ates
0 0,1 0,2 0,3 0,4 0,5 0,6 0,7 0,8 0,9 1 First Half Rejection Rates
Proposers' Reaction to Rejectionsin the open treatment

12
compare this to the frequency of equal offers following an accepted unequal offer. If educative
punishment were successful, then we should observe systematically more switches after
punishments than after accepted unequal offers.
Figure 5
Figure 5 shows that educative punishment is indeed effective on the individual level. Obviously,
observing a rejection, i.e. being punished, influences the proposers’ behaviour. Proposers’ pro-
pensities to choose the equal offer is rather low if their unequal offer in the last round was ac-
cepted (relative frequency 11.4%). But, if punished, their tendencies to switch is almost four
times higher (relative frequency 44.3%). This is consistent with the hypothesis that proposers in
the open response treatment attempt to test the probability of rejection and switch to the equal
offer if that probability is perceived as high.
The observed pattern of switches points in the same direction in all six sessions of the open
response treatment. Table 4 shows the frequencies of switches after punishments and after
accepted unequal offers. The last column shows the difference between the relative frequencies
of switches. In all six sessions this measure has a positive value. Thus, a switch occurs relatively
more often after punishments than after accepted unequal offers. The Wilcoxon matched-pair
sign test rejects the null hypothesis that a switch is equally likely after punishment as after an
accepted unequal offers with at p = 0.016 (one-tailed).
0
20
40
60
80
100
120
140 Proposers' Switches to the Equal Offer
79
35
16
140
switchafterreject
switchafter
accept
rejectsround 1-7
switch to equal offersignificantly morelikely after rejection
educativepunishment iseffective
acceptsround 1-7
13
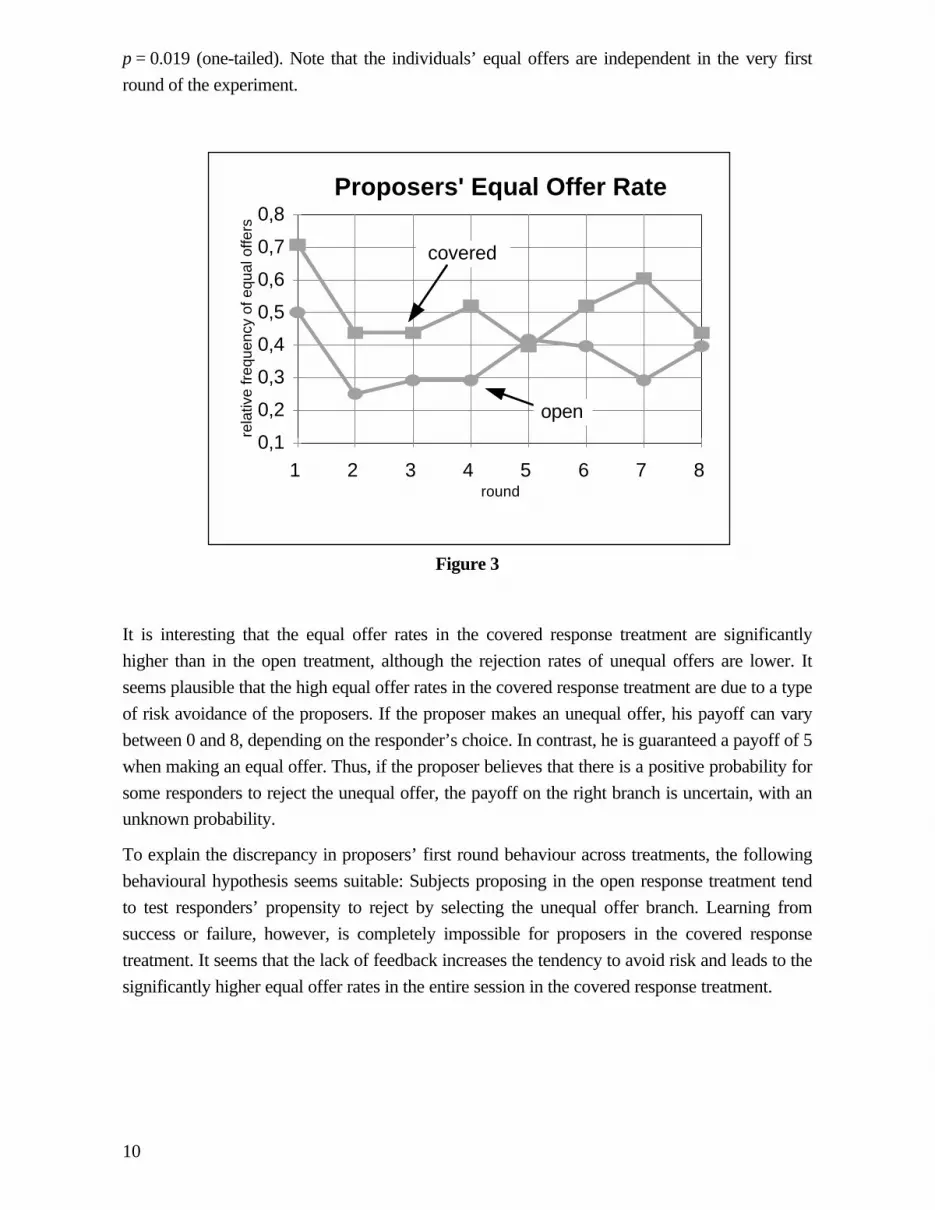
Table 4. Frequency of switches from the unequal of the equal offer
Session Switch afterRejection
(1)
RejectionsRounds 1-7
(2)
Switch afterAccepted offer
(3)
Accepted offersrounds 1-7
(4)
Difference inrel. frequency(1)/(2)-(3)/(4)
123456
7258112
17101817125
323413
24332617337
+0.29+0.14+0.16+0.24+0.58+0.32
Σ 35 79 16 140 +0.33
After having switched to an equal offer, proposers often switch back. Of all equal offers, 46%
are followed by an unequal offer. Thus, though proposers do react to punishment, they also
show a strong tendency to switch back to the unequal offer. This implies that high rejection rates
are necessary for a sustained educative effect. Interestingly, the frequency of switching from the
equal to the unequal offer is almost the same in both treatments: under the covered response
condition we observe a relative frequency of 47%.
The results show that proposers in fact tend to react to punishment in a manner that is favourable
to the responders. If responders anticipate such behaviour, it can be reasonable for them as a
group to reject unequal offers. Of course, when applying punishment as a means of education,
responders are in a social dilemma situation. Due to the revolving matching scheme of the
experiment, no responder can profit from her own punishment. She can only benefit from other
responders’ social reasoning, and others will benefit from her punishment. The revolving
matching scheme may reduce educational motives in behaviour, but it does not seem to
eliminate them.
III.5 Is Educative Punishment Profitable?
We have found evidence that educative punishment is effective in the sense that proposers are
influenced towards making more equal offers, after having observed rejections. However, since
rejections are costly for a responder, the effectiveness of educative punishment does not
immediately imply that such behaviour is profitable for responder populations. In this section,
we analyse how rejection rates and responder profits are distributed over the populations.
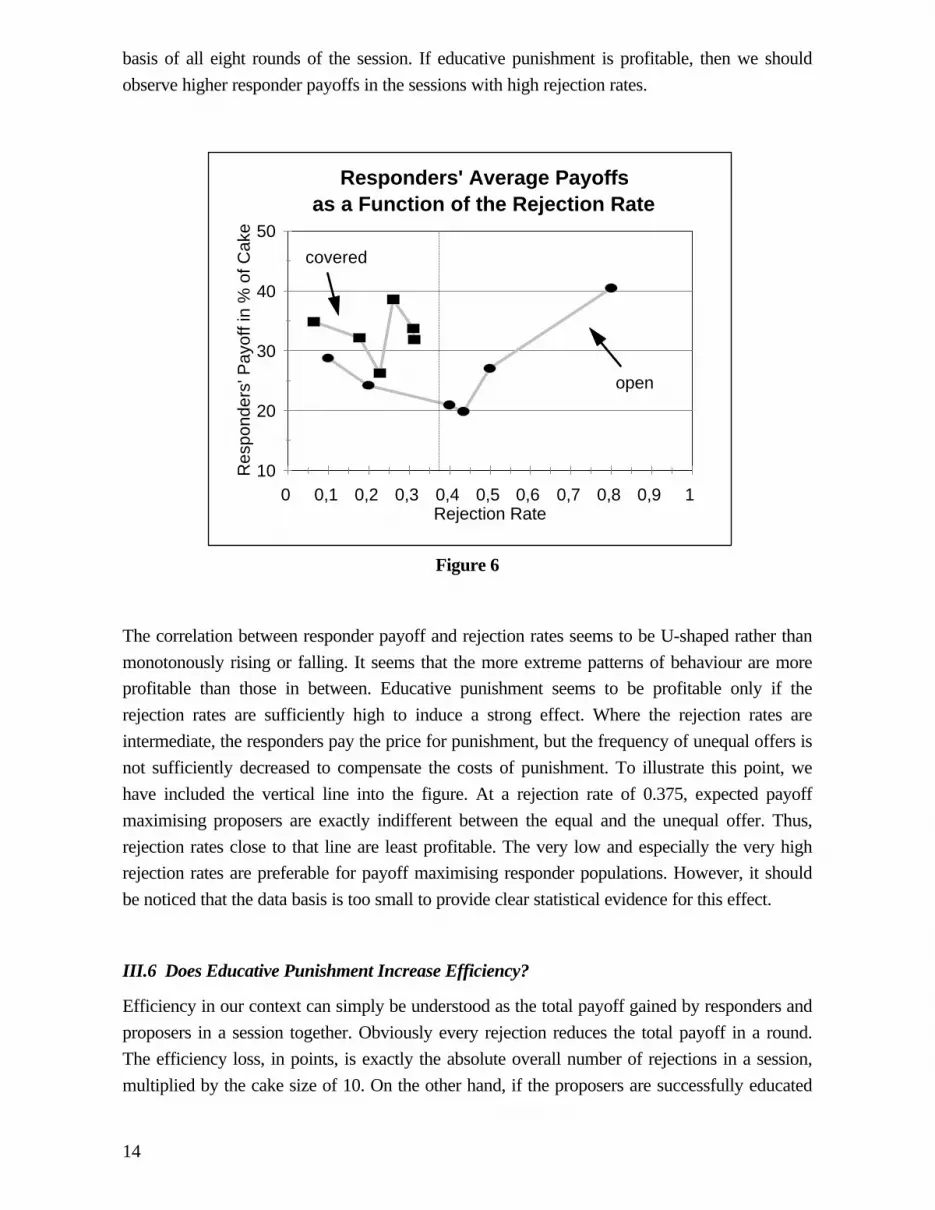
Figure 6 shows the relationship between the rejection rates in a session and the average
responder payoff (in per cent of the cake) in that session. The numbers are computed on the
14
basis of all eight rounds of the session. If educative punishment is profitable, then we should
observe higher responder payoffs in the sessions with high rejection rates.
Figure 6
The correlation between responder payoff and rejection rates seems to be U-shaped rather than
monotonously rising or falling. It seems that the more extreme patterns of behaviour are more
profitable than those in between. Educative punishment seems to be profitable only if the
rejection rates are sufficiently high to induce a strong effect. Where the rejection rates are
intermediate, the responders pay the price for punishment, but the frequency of unequal offers is
not sufficiently decreased to compensate the costs of punishment. To illustrate this point, we
have included the vertical line into the figure. At a rejection rate of 0.375, expected payoff
maximising proposers are exactly indifferent between the equal and the unequal offer. Thus,
rejection rates close to that line are least profitable. The very low and especially the very high
rejection rates are preferable for payoff maximising responder populations. However, it should
be noticed that the data basis is too small to provide clear statistical evidence for this effect.
III.6 Does Educative Punishment Increase Efficiency?
Efficiency in our context can simply be understood as the total payoff gained by responders and
proposers in a session together. Obviously every rejection reduces the total payoff in a round.
The efficiency loss, in points, is exactly the absolute overall number of rejections in a session,
multiplied by the cake size of 10. On the other hand, if the proposers are successfully educated
10
20
30
40
50 R
espo
nder
s' P
ayof
f in
% o
f Cak
e
0 0,1 0,2 0,3 0,4 0,5 0,6 0,7 0,8 0,9 1 Rejection Rate
Responders' Average Payoffsas a Function of the Rejection Rate
covered
open
15
by high early rejection rates to increase the number of equal offers, the total number of rejections
will drop, since equal offers are not rejected. Hence, if the effect of educative punishment is
strong enough, then high rejection rates in the beginning of a session need not necessarily lead to
less efficiency than in a session with a constant moderate rate of unequal offers and rejections.
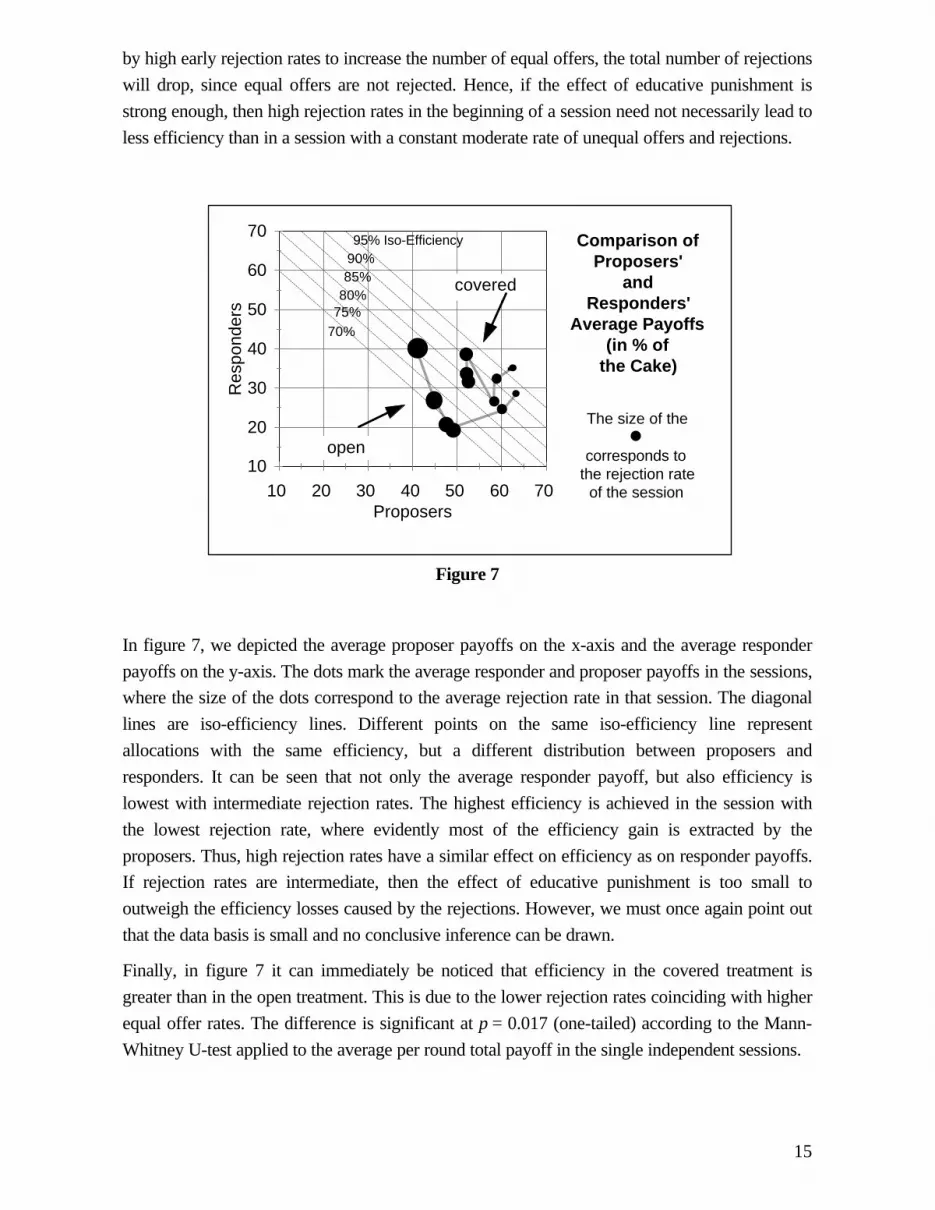
Figure 7
In figure 7, we depicted the average proposer payoffs on the x-axis and the average responder
payoffs on the y-axis. The dots mark the average responder and proposer payoffs in the sessions,
where the size of the dots correspond to the average rejection rate in that session. The diagonal
lines are iso-efficiency lines. Different points on the same iso-efficiency line represent
allocations with the same efficiency, but a different distribution between proposers and
responders. It can be seen that not only the average responder payoff, but also efficiency is
lowest with intermediate rejection rates. The highest efficiency is achieved in the session with
the lowest rejection rate, where evidently most of the efficiency gain is extracted by the
proposers. Thus, high rejection rates have a similar effect on efficiency as on responder payoffs.
If rejection rates are intermediate, then the effect of educative punishment is too small to
outweigh the efficiency losses caused by the rejections. However, we must once again point out
that the data basis is small and no conclusive inference can be drawn.
Finally, in figure 7 it can immediately be noticed that efficiency in the covered treatment is
greater than in the open treatment. This is due to the lower rejection rates coinciding with higher
equal offer rates. The difference is significant at p = 0.017 (one-tailed) according to the Mann-
Whitney U-test applied to the average per round total payoff in the single independent sessions.
10
20
30
40
50
60
70 R
espo
nder
s
10 20 30 40 50 60 70 Proposers
covered
open
Comparison ofProposers'
andResponders'
Average Payoffs(in % of
the Cake)
The size of the
corresponds tothe rejection rate
of the session
95% Iso-Efficiency90%85%
80%75%
70%

16
IV. Summary and Conclusions
We conducted an experiment using a simple ultimatum game. In the covered response treatment,
the responder’s choice was reported to the proposer, while it was not in the open treatment.
Rejection rates in the covered response treatment - with an average of 23.3% - were
considerable. Since rejections cannot have been motivated by educative punishment in the
covered response treatment, we conclude that the high rejection rates in these sessions are due to
the responders’ inherent resistance to unfairness. This is in line with the fairness utility models
as suggested by BOLTON (1991), RABIN (1993), BOLTON and OCKENFELS (1997), and FEHR and
SCHMIDT (1998).
We, however, also observed a significantly higher rate of rejections in the open response
treatment than in the covered response treatment. This difference cannot be explained by the
fairness utility models mentioned. Hence, we conclude that rejections in the open response
treatment are not only motivated by responders’ resistance to unfairness, but also by educative
punishment. Educative punishment in this setting, in which each responder met each proposer
only once, means that the group of responders, as a whole, attempts to influence the behaviour
of the group of proposers, as a whole, in direction of equal offers. Educative punishment
motivation, however, cannot account for the high rejection rates in the covered response
treatment, since educating proposers who do not see the rejection is impossible.
Given the results of the experiment, we conjecture that responders’ rejection in ultimatum
bargaining is in part motivated by a resistance to unfairness, and in part by educative
punishment. We find support for this conjecture in the dynamics of rejection behaviour. The
average per round rejection rates in the open response treatment decrease towards the end of the
experiment. In the last rounds, in which educative punishment makes little or no sense, these
rates approach the average rates of rejection of the covered response treatment, which are have
no clear time trend. This suggests that there is a basic rate of rejections in ultimatum game
behaviour, due to the responders’ resistance to unfairness. This basic rate corresponds to the rate
of rejections in the covered response treatment and in the last rounds of the open response
treatment. The excess of the rejection rates over the basic rate in the early rounds of the open
response treatment can seemingly be attributed to educative punishment.
We hypothesise that proposers in early rounds of the open treatment “test” responders’ reactions
to unequal offers. This would explain the significantly higher number of unequal first round
offers in the open compared to the covered response treatment. Additionally, there is strong
evidence that educative punishment is effective. The higher the rejection rates in the first half of
the experiment, the more do proposers change their behaviour towards equal offers.
Furthermore, proposers switch to equal offers significantly more often after rejected than after
accepted unequal offers of the previous round. There is no clear evidence that educative
punishment is profitable for responder groups, but it seems that the more extreme patterns of
17
behaviour (either very low or very high rejections) are more profitable than the intermediate
ones.
All in all, the experiment reported suggests that both the educative punishment approach and the
fairness utility approach explain behaviour in ultimatum bargaining to some extent. Neither
approach, however, seems completely satisfactory on its own. Future research should focus on a
conciliatory synthesis which takes both aspects of behaviour into account.
References
ABBINK, Klaus, Gary E BOLTON, Abdolkarim SADRIEH, and Fang-Fang TANG (1996): Adaptive
Learning versus Punishment in Ultimatum Bargaining. SFB Discussion Paper B-381,
University of Bonn.
ABBINK, Klaus, and Abdolkarim SADRIEH (1995): RatImage - Research Assistance Toolbox for
Computer-Aided Human Behavior Experiments. SFB Discussion Paper B-325, University
of Bonn.
BOLTON, Gary E (1991): A Comparative Model of Bargaining: Theory and Evidence. American
Economic Review, 81:5, 1096-1135.
BOLTON, Gary E, and Axel OCKENFELS (1997): ERC - A Theory of Equity, Reciprocity and
Competition. Working paper, PennState University and University of Magdeburg.
BOLTON, Gary E, and Rami ZWICK (1995): Anonymity versus Punishment in Ultimatum
Bargaining. Games and Economic Behavior, 10, 95-121.
CAMERER, Colin, and Richard H. THALER (1995): Anomalies - Ultimatums, Dictators and
Manners. Journal of Economic Perspectives. 9:2, 209-219.
EREV, Ido, and Alvin E. ROTH (1998): Predicting How People Play Games: Reinforcement
Learning in Experimental Games with Unique, Mixed Strategy Equilibria. American
Economic Review, 88:4, 848-882.
FEHR, Ernst, and Klaus M. SCHMIDT (1998): A Theory of Fairness, Competition, and
Cooperation. How to Account for Fair and Unfair Outcomes. Working Paper, University of
Zürich and University of Munich.
GALE, John, Kenneth G BINMORE, and Larry SAMUELSON (1995): Learning to be Imperfect:
The Ultimatum Game. Games and Economic Behavior, 8, 56-90.
GNEEZY, Uri, and Avraham STOLER (1998): Why Punish? Norms and Revenge in an
Experimental Game. Working paper, University of Haifa and University of Tel Aviv.

18
GÜTH, Werner (1995): On Ultimatum Bargaining Experiments - A Personal Review. Journal of
Economic Behavior and Organization, 27, 329-344.
GÜTH, Werner, R. SCHMITTBERGER, and B. SCHWARZE (1982): An Experimental Analysis of
Ultimatum Bargaining. Journal of Economic Behavior and Organization, 3, 367-388.
JACOBSEN, Eva, and Abdolkarim SADRIEH (1996): Experimental Proof for the Motivational
Importance of Reciprocity. SFB Discussion Paper B-386, University of Bonn.
RABIN, Matthew (1993): Incorporating Fairness into Game Theory and Economics. American
Economic Review, 83, 1281-1302.
ROTH, Alvin E. (1995): Bargaining Experiments. In John Kagel and Alvin E. Roth (eds):
Handbook of Experimental Economics. Princeton University Press.
ROTH, Alvin E., Vesna PRASNIKAR, Masahiro OKUNO-FUJIWARA, and Shmuel ZAMIR (1991):
Bargaining and Market Behavior in Jerusalem, Ljubljana, Pittsburgh, and Tokyo. American
Economic Review, 81, 1068-1095.
ROTH, Alvin E., and Ido EREV (1995): Learning in Extensive Form Games: Experimental Data
and Simple Dynamic Models in Intermediate Term. Games and Economic Behavior, 8,
164-212.
THALER, Richard H. (1988): The Ultimatum Game. Journal of Economic Perspectives, 2, 195-
206.
WINTER, Eyal, and Shmuel ZAMIR (1996): Experimenting Ultimatum Bargaining with Virtual
Players. Working Paper, Hebrew University of Jerusalem.

19
Appendix A: The Written Instructions
Player Types:There are two types in the experiment: player 1 and player 2.After the introduction, each participant draws one of 16 cards.The drawn card defines the terminal number of the participant.The terminal number determines the participant's type for the whole experiment.
Structure:The experiment consists of eight rounds.In each round 8 pairs of participants are formed:
each pair with one player 1 and one player 2.In every round, every player 1 meets a different player 2, and vice versa.Thus, no participant meets the same participant a second time.The participants are not allowed to speak with each other during the experiment.
Decisions:Each round begins with player 1 choosing one of two alternatives: Left or Right.Player 2 is informed about the choice of player 1.If player 1 chooses Left, the round ends.If player 1 chooses Right, player 2 chooses one of two alternatives: Left or Right;
player 1 is not informed about the choice of player 2;then the round ends.
Profits in Points:
Player 1 Player 2 Player 1 receives Player 2 receiveschooses Left has no choice 5 5
chooses Right chooses Left 8 2chooses Right chooses Right 0 0
The Question Mark:If player 1 chooses Right, he will only see a question mark on the screen: since he will
not be informed about the choice of player 2, he will neither know his own profit,nor the profit of player 2.
After the last round of the experiment all participants will be informed of their totalprofits, but the players 1 will not be informed of the value of each received ?separately.
Exchange Rate:Each point earned in the experiment is equivalent to 50 pfennigs / 75 Agorot.
20
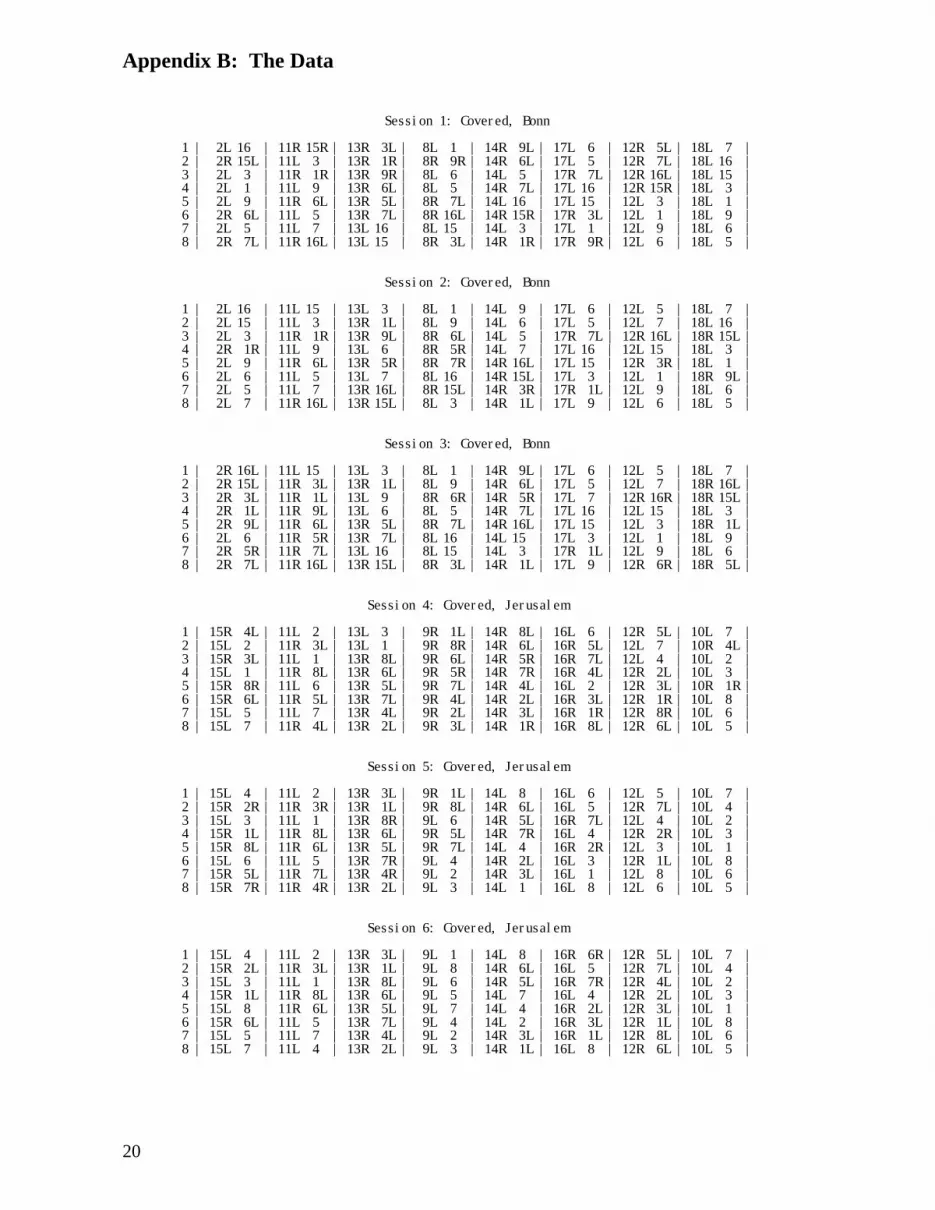
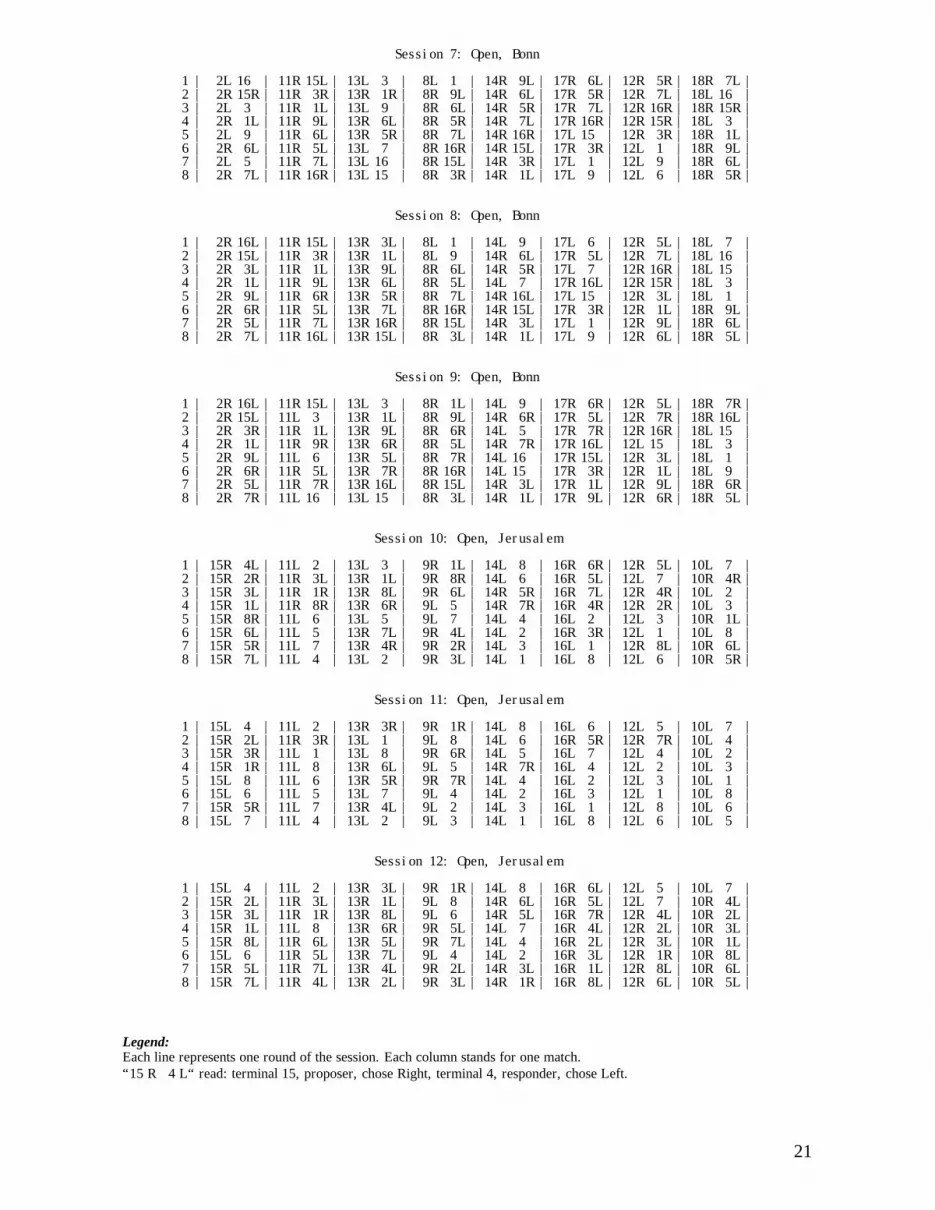
Appendix B: The Data
Session 1: Covered, Bonn
1 | 2L 16 | 11R 15R | 13R 3L | 8L 1 | 14R 9L | 17L 6 | 12R 5L | 18L 7 |2 | 2R 15L | 11L 3 | 13R 1R | 8R 9R | 14R 6L | 17L 5 | 12R 7L | 18L 16 |3 | 2L 3 | 11R 1R | 13R 9R | 8L 6 | 14L 5 | 17R 7L | 12R 16L | 18L 15 |4 | 2L 1 | 11L 9 | 13R 6L | 8L 5 | 14R 7L | 17L 16 | 12R 15R | 18L 3 |5 | 2L 9 | 11R 6L | 13R 5L | 8R 7L | 14L 16 | 17L 15 | 12L 3 | 18L 1 |6 | 2R 6L | 11L 5 | 13R 7L | 8R 16L | 14R 15R | 17R 3L | 12L 1 | 18L 9 |7 | 2L 5 | 11L 7 | 13L 16 | 8L 15 | 14L 3 | 17L 1 | 12L 9 | 18L 6 |8 | 2R 7L | 11R 16L | 13L 15 | 8R 3L | 14R 1R | 17R 9R | 12L 6 | 18L 5 |
Session 2: Covered, Bonn
1 | 2L 16 | 11L 15 | 13L 3 | 8L 1 | 14L 9 | 17L 6 | 12L 5 | 18L 7 |2 | 2L 15 | 11L 3 | 13R 1L | 8L 9 | 14L 6 | 17L 5 | 12L 7 | 18L 16 |3 | 2L 3 | 11R 1R | 13R 9L | 8R 6L | 14L 5 | 17R 7L | 12R 16L | 18R 15L |4 | 2R 1R | 11L 9 | 13L 6 | 8R 5R | 14L 7 | 17L 16 | 12L 15 | 18L 3 |5 | 2L 9 | 11R 6L | 13R 5R | 8R 7R | 14R 16L | 17L 15 | 12R 3R | 18L 1 |6 | 2L 6 | 11L 5 | 13L 7 | 8L 16 | 14R 15L | 17L 3 | 12L 1 | 18R 9L |7 | 2L 5 | 11L 7 | 13R 16L | 8R 15L | 14R 3R | 17R 1L | 12L 9 | 18L 6 |8 | 2L 7 | 11R 16L | 13R 15L | 8L 3 | 14R 1L | 17L 9 | 12L 6 | 18L 5 |
Session 3: Covered, Bonn
1 | 2R 16L | 11L 15 | 13L 3 | 8L 1 | 14R 9L | 17L 6 | 12L 5 | 18L 7 |2 | 2R 15L | 11R 3L | 13R 1L | 8L 9 | 14R 6L | 17L 5 | 12L 7 | 18R 16L |3 | 2R 3L | 11R 1L | 13L 9 | 8R 6R | 14R 5R | 17L 7 | 12R 16R | 18R 15L |4 | 2R 1L | 11R 9L | 13L 6 | 8L 5 | 14R 7L | 17L 16 | 12L 15 | 18L 3 |5 | 2R 9L | 11R 6L | 13R 5L | 8R 7L | 14R 16L | 17L 15 | 12L 3 | 18R 1L |6 | 2L 6 | 11R 5R | 13R 7L | 8L 16 | 14L 15 | 17L 3 | 12L 1 | 18L 9 |7 | 2R 5R | 11R 7L | 13L 16 | 8L 15 | 14L 3 | 17R 1L | 12L 9 | 18L 6 |8 | 2R 7L | 11R 16L | 13R 15L | 8R 3L | 14R 1L | 17L 9 | 12R 6R | 18R 5L |
Session 4: Covered, Jerusalem
1 | 15R 4L | 11L 2 | 13L 3 | 9R 1L | 14R 8L | 16L 6 | 12R 5L | 10L 7 |2 | 15L 2 | 11R 3L | 13L 1 | 9R 8R | 14R 6L | 16R 5L | 12L 7 | 10R 4L |3 | 15R 3L | 11L 1 | 13R 8L | 9R 6L | 14R 5R | 16R 7L | 12L 4 | 10L 2 |4 | 15L 1 | 11R 8L | 13R 6L | 9R 5R | 14R 7R | 16R 4L | 12R 2L | 10L 3 |5 | 15R 8R | 11L 6 | 13R 5L | 9R 7L | 14R 4L | 16L 2 | 12R 3L | 10R 1R |6 | 15R 6L | 11R 5L | 13R 7L | 9R 4L | 14R 2L | 16R 3L | 12R 1R | 10L 8 |7 | 15L 5 | 11L 7 | 13R 4L | 9R 2L | 14R 3L | 16R 1R | 12R 8R | 10L 6 |8 | 15L 7 | 11R 4L | 13R 2L | 9R 3L | 14R 1R | 16R 8L | 12R 6L | 10L 5 |
Session 5: Covered, Jerusalem
1 | 15L 4 | 11L 2 | 13R 3L | 9R 1L | 14L 8 | 16L 6 | 12L 5 | 10L 7 |2 | 15R 2R | 11R 3R | 13R 1L | 9R 8L | 14R 6L | 16L 5 | 12R 7L | 10L 4 |3 | 15L 3 | 11L 1 | 13R 8R | 9L 6 | 14R 5L | 16R 7L | 12L 4 | 10L 2 |4 | 15R 1L | 11R 8L | 13R 6L | 9R 5L | 14R 7R | 16L 4 | 12R 2R | 10L 3 |5 | 15R 8L | 11R 6L | 13R 5L | 9R 7L | 14L 4 | 16R 2R | 12L 3 | 10L 1 |6 | 15L 6 | 11L 5 | 13R 7R | 9L 4 | 14R 2L | 16L 3 | 12R 1L | 10L 8 |7 | 15R 5L | 11R 7L | 13R 4R | 9L 2 | 14R 3L | 16L 1 | 12L 8 | 10L 6 |8 | 15R 7R | 11R 4R | 13R 2L | 9L 3 | 14L 1 | 16L 8 | 12L 6 | 10L 5 |
Session 6: Covered, Jerusalem
1 | 15L 4 | 11L 2 | 13R 3L | 9L 1 | 14L 8 | 16R 6R | 12R 5L | 10L 7 |2 | 15R 2L | 11R 3L | 13R 1L | 9L 8 | 14R 6L | 16L 5 | 12R 7L | 10L 4 |3 | 15L 3 | 11L 1 | 13R 8L | 9L 6 | 14R 5L | 16R 7R | 12R 4L | 10L 2 |4 | 15R 1L | 11R 8L | 13R 6L | 9L 5 | 14L 7 | 16L 4 | 12R 2L | 10L 3 |5 | 15L 8 | 11R 6L | 13R 5L | 9L 7 | 14L 4 | 16R 2L | 12R 3L | 10L 1 |6 | 15R 6L | 11L 5 | 13R 7L | 9L 4 | 14L 2 | 16R 3L | 12R 1L | 10L 8 |7 | 15L 5 | 11L 7 | 13R 4L | 9L 2 | 14R 3L | 16R 1L | 12R 8L | 10L 6 |8 | 15L 7 | 11L 4 | 13R 2L | 9L 3 | 14R 1L | 16L 8 | 12R 6L | 10L 5 |
21
Session 7: Open, Bonn
1 | 2L 16 | 11R 15L | 13L 3 | 8L 1 | 14R 9L | 17R 6L | 12R 5R | 18R 7L |2 | 2R 15R | 11R 3R | 13R 1R | 8R 9L | 14R 6L | 17R 5R | 12R 7L | 18L 16 |3 | 2L 3 | 11R 1L | 13L 9 | 8R 6L | 14R 5R | 17R 7L | 12R 16R | 18R 15R |4 | 2R 1L | 11R 9L | 13R 6L | 8R 5R | 14R 7L | 17R 16R | 12R 15R | 18L 3 |5 | 2L 9 | 11R 6L | 13R 5R | 8R 7L | 14R 16R | 17L 15 | 12R 3R | 18R 1L |6 | 2R 6L | 11R 5L | 13L 7 | 8R 16R | 14R 15L | 17R 3R | 12L 1 | 18R 9L |7 | 2L 5 | 11R 7L | 13L 16 | 8R 15L | 14R 3R | 17L 1 | 12L 9 | 18R 6L |8 | 2R 7L | 11R 16R | 13L 15 | 8R 3R | 14R 1L | 17L 9 | 12L 6 | 18R 5R |
Session 8: Open, Bonn
1 | 2R 16L | 11R 15L | 13R 3L | 8L 1 | 14L 9 | 17L 6 | 12R 5L | 18L 7 |2 | 2R 15L | 11R 3R | 13R 1L | 8L 9 | 14R 6L | 17R 5L | 12R 7L | 18L 16 |3 | 2R 3L | 11R 1L | 13R 9L | 8R 6L | 14R 5R | 17L 7 | 12R 16R | 18L 15 |4 | 2R 1L | 11R 9L | 13R 6L | 8R 5L | 14L 7 | 17R 16L | 12R 15R | 18L 3 |5 | 2R 9L | 11R 6R | 13R 5R | 8R 7L | 14R 16L | 17L 15 | 12R 3L | 18L 1 |6 | 2R 6R | 11R 5L | 13R 7L | 8R 16R | 14R 15L | 17R 3R | 12R 1L | 18R 9L |7 | 2R 5L | 11R 7L | 13R 16R | 8R 15L | 14R 3L | 17L 1 | 12R 9L | 18R 6L |8 | 2R 7L | 11R 16L | 13R 15L | 8R 3L | 14R 1L | 17L 9 | 12R 6L | 18R 5L |
Session 9: Open, Bonn
1 | 2R 16L | 11R 15L | 13L 3 | 8R 1L | 14L 9 | 17R 6R | 12R 5L | 18R 7R |2 | 2R 15L | 11L 3 | 13R 1L | 8R 9L | 14R 6R | 17R 5L | 12R 7R | 18R 16L |3 | 2R 3R | 11R 1L | 13R 9L | 8R 6R | 14L 5 | 17R 7R | 12R 16R | 18L 15 |4 | 2R 1L | 11R 9R | 13R 6R | 8R 5L | 14R 7R | 17R 16L | 12L 15 | 18L 3 |5 | 2R 9L | 11L 6 | 13R 5L | 8R 7R | 14L 16 | 17R 15L | 12R 3L | 18L 1 |6 | 2R 6R | 11R 5L | 13R 7R | 8R 16R | 14L 15 | 17R 3R | 12R 1L | 18L 9 |7 | 2R 5L | 11R 7R | 13R 16L | 8R 15L | 14R 3L | 17R 1L | 12R 9L | 18R 6R |8 | 2R 7R | 11L 16 | 13L 15 | 8R 3L | 14R 1L | 17R 9L | 12R 6R | 18R 5L |
Session 10: Open, Jerusalem
1 | 15R 4L | 11L 2 | 13L 3 | 9R 1L | 14L 8 | 16R 6R | 12R 5L | 10L 7 |2 | 15R 2R | 11R 3L | 13R 1L | 9R 8R | 14L 6 | 16R 5L | 12L 7 | 10R 4R |3 | 15R 3L | 11R 1R | 13R 8L | 9R 6L | 14R 5R | 16R 7L | 12R 4R | 10L 2 |4 | 15R 1L | 11R 8R | 13R 6R | 9L 5 | 14R 7R | 16R 4R | 12R 2R | 10L 3 |5 | 15R 8R | 11L 6 | 13L 5 | 9L 7 | 14L 4 | 16L 2 | 12L 3 | 10R 1L |6 | 15R 6L | 11L 5 | 13R 7L | 9R 4L | 14L 2 | 16R 3R | 12L 1 | 10L 8 |7 | 15R 5R | 11L 7 | 13R 4R | 9R 2R | 14L 3 | 16L 1 | 12R 8L | 10R 6L |8 | 15R 7L | 11L 4 | 13L 2 | 9R 3L | 14L 1 | 16L 8 | 12L 6 | 10R 5R |
Session 11: Open, Jerusalem
1 | 15L 4 | 11L 2 | 13R 3R | 9R 1R | 14L 8 | 16L 6 | 12L 5 | 10L 7 |2 | 15R 2L | 11R 3R | 13L 1 | 9L 8 | 14L 6 | 16R 5R | 12R 7R | 10L 4 |3 | 15R 3R | 11L 1 | 13L 8 | 9R 6R | 14L 5 | 16L 7 | 12L 4 | 10L 2 |4 | 15R 1R | 11L 8 | 13R 6L | 9L 5 | 14R 7R | 16L 4 | 12L 2 | 10L 3 |5 | 15L 8 | 11L 6 | 13R 5R | 9R 7R | 14L 4 | 16L 2 | 12L 3 | 10L 1 |6 | 15L 6 | 11L 5 | 13L 7 | 9L 4 | 14L 2 | 16L 3 | 12L 1 | 10L 8 |7 | 15R 5R | 11L 7 | 13R 4L | 9L 2 | 14L 3 | 16L 1 | 12L 8 | 10L 6 |8 | 15L 7 | 11L 4 | 13L 2 | 9L 3 | 14L 1 | 16L 8 | 12L 6 | 10L 5 |
Session 12: Open, Jerusalem
1 | 15L 4 | 11L 2 | 13R 3L | 9R 1R | 14L 8 | 16R 6L | 12L 5 | 10L 7 |2 | 15R 2L | 11R 3L | 13R 1L | 9L 8 | 14R 6L | 16R 5L | 12L 7 | 10R 4L |3 | 15R 3L | 11R 1R | 13R 8L | 9L 6 | 14R 5L | 16R 7R | 12R 4L | 10R 2L |4 | 15R 1L | 11L 8 | 13R 6R | 9R 5L | 14L 7 | 16R 4L | 12R 2L | 10R 3L |5 | 15R 8L | 11R 6L | 13R 5L | 9R 7L | 14L 4 | 16R 2L | 12R 3L | 10R 1L |6 | 15L 6 | 11R 5L | 13R 7L | 9L 4 | 14L 2 | 16R 3L | 12R 1R | 10R 8L |7 | 15R 5L | 11R 7L | 13R 4L | 9R 2L | 14R 3L | 16R 1L | 12R 8L | 10R 6L |8 | 15R 7L | 11R 4L | 13R 2L | 9R 3L | 14R 1R | 16R 8L | 12R 6L | 10R 5L |
Legend:Each line represents one round of the session. Each column stands for one match.“15 R 4 L“ read: terminal 15, proposer, chose Right, terminal 4, responder, chose Left.