dielectric behaviour of polluted porcelain insulators
TRANSCRIPT

Dielectric behaviour of polluted porcelain insulators
F.V.Topalis, I.F.Gonos and I.A.Stathopulos
Abstract: The dielectric behaviour of polluted porcelain insulators is investigated by means ofexperimental tests and simulation methods. The elaboration of the experimental results, using wellknown mathematical models of polluted insulators, leads to the identification of the arc constants. Itwas found out that the arc constants are independent of the insulator type and of the experimentalpollution procedure (salt fog or solid layer cool fog method). This allows the formulation of ageneralised simulation model of polluted insulators. The critical parameters for the flashover (voltage,current and gradient) are computed by means of the developed model, using only the geometricdimensions of the insulator, the pollution severity and the arc constants. Different types of porcelaininsulators are investigated and the variation of the critical parameters upon the density of thepollution layer is determined. The influence of the geometrical dimensions and of the shape of theinsulator to the critical parameters is also investigated. Furthermore, analytical relations are defined,between the computed critical parameters and the salt deposit density as well as the dimensions, theshape and the type of the insulator.
1 Introduction
A major problem of insulation systems is the accumulationof airborne pollutants due to natural, industrial or evenmixed pollution, during the dry weather period and theirsubsequent wetting, mainly by high humidity. This problemwas the motivation for the installation of a test station toperform laboratory tests on artificially polluted insulators.The experiments carried out, using either the salt fogmethod or the solid layer cool fog method, gave numerousexperimental data (maximum withstand voltage againstpollution, ratio between leakage distance and minimumflashover voltage against pollution, maximum withstandsalinity at a given applied voltage, leakage current, etc.) forseveral insulator types.
The experimental results permitted a highly accurateevaluation of the arc constants of the insulator by means ofa mathematical procedure. It has been proved that thecomputed values of the arc constants are independent ofthe insulator type and the kind of pollution.
Although the mentioned experiments are indispensablefor the study of the insulator behaviour under pollution,they take a long time. For this reason, it would be very use-ful to predict the performance of insulators under pollutionconditions, with a satisfactory accuracy, using analyticalexpressions according to the polluted insulator model.
2 Mathematical model
The most simple model [1, 2] for the explanation and theevaluation of the flashover process of a polluted insulatorconsists of a partial arc spanning over a dry zone and the
© IEE, 2001
IEE Proceedings online no. 20010258
DOI: 10.1049/ip-gtd:20010258
Paper first received 30th June 1999 and in revised form 20th July 2000
The authors are with the National Technical University of Athens, Departmentof Electrical and Computer Engineering, High Voltage Laboratory, 9 IroonPolitechniou Str., GR 157 80 Zografou, Athens, Greece.
IEE Proc.-Gener. Transm. Distrib., Vol. 148, No. 4, July 2001
resistance of the pollution layer in series (Fig. 1). Theapplied voltage U across the insulator is expressed as
where x is the length of the arc, L is the leakage distance ofthe insulator and I is the leakage current. The resistance raper unit length of the arc is defined as
where A and n are the arc constants. On the other hand,the resistance rp per unit length of the pollution layer is
where Deq is the equivalent diameter of the polluted insula-tor and σs is the surface conductivity, which is given [3] forthe equivalent salt deposit density C (ESDD), by
σs is obtained in Ω–1 and rp in Ω/cm, for C expressed in mg/cm2. The equivalent diameter Deq of the insulator, which isexpressed in centimetres, is defined [4] as
Fig.1 Equivalent circuit of polluted insulator
269
where F is the form factor of the insulator:
D(,) is the diameter of the insulator, varying across itsleakage length L.
At the critical condition, when the partial arc is devel-oped into a complete flashover, the current I obtains itscritical value Ic which is given by
where Dm is the maximum diameter of the insulator disc. Aand n are the arc constants. Furthermore, the above equa-tion results in the following formula, according to eqn. 3:
The respective critical value ,c of the arc length x is given[5] as
At the critical condition, eqn. 1 becomes:
where K is the coefficient of the pollution layer resistancewith consideration of the current concentration at the arcfoot point. In the case of cap-and-pin insulators a simpli-fied form of K is given [6] as
where R is the radius of the arc foot, given by [7]
and according to eqn. 8:
In the case of stab-type insulators, K is defined [6] asfollows:
where N is the number of sheds. Substituting the values of ra, rp, Deq, Ic, ,c in eqn. 10,
results in the following formula for the critical voltage Uc:
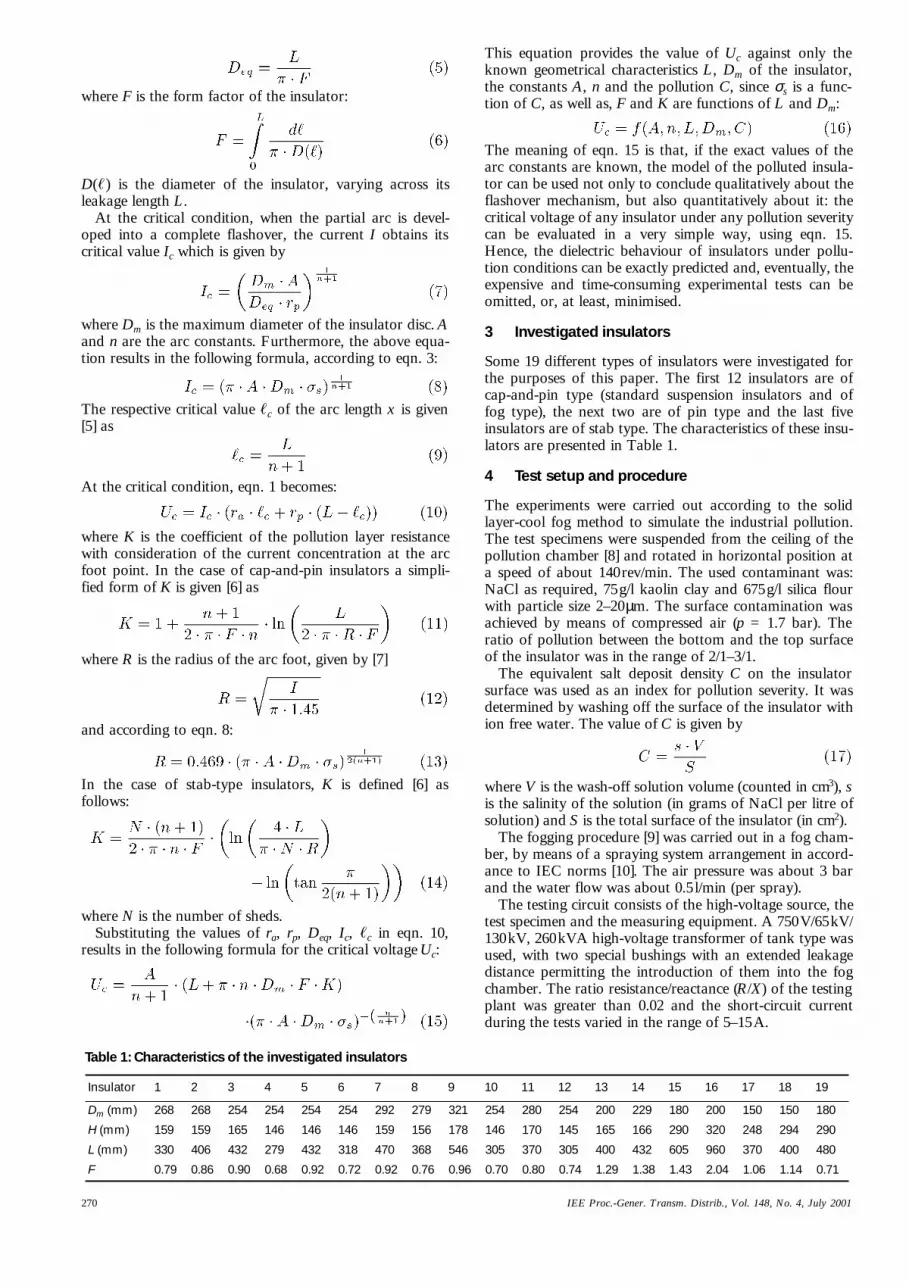
Table 1: Characteristics of the investigated insulators
Insulator 1 2 3 4 5 6 7 8 9 10 11 12 13 14 15 16 17 18 19
Dm (mm) 268 268 254 254 254 254 292 279 321 254 280 254 200 229 180 200 150 150 180
H (mm) 159 159 165 146 146 146 159 156 178 146 170 145 165 166 290 320 248 294 290
L (mm) 330 406 432 279 432 318 470 368 546 305 370 305 400 432 605 960 370 400 480
F 0.79 0.86 0.90 0.68 0.92 0.72 0.92 0.76 0.96 0.70 0.80 0.74 1.29 1.38 1.43 2.04 1.06 1.14 0.71
270
This equation provides the value of Uc against only theknown geometrical characteristics L, Dm of the insulator,the constants A, n and the pollution C, since σs is a func-tion of C, as well as, F and K are functions of L and Dm:
The meaning of eqn. 15 is that, if the exact values of thearc constants are known, the model of the polluted insula-tor can be used not only to conclude qualitatively about theflashover mechanism, but also quantitatively about it: thecritical voltage of any insulator under any pollution severitycan be evaluated in a very simple way, using eqn. 15.Hence, the dielectric behaviour of insulators under pollu-tion conditions can be exactly predicted and, eventually, theexpensive and time-consuming experimental tests can beomitted, or, at least, minimised.
3 Investigated insulators
Some 19 different types of insulators were investigated forthe purposes of this paper. The first 12 insulators are ofcap-and-pin type (standard suspension insulators and offog type), the next two are of pin type and the last fiveinsulators are of stab type. The characteristics of these insu-lators are presented in Table 1.
4 Test setup and procedure
The experiments were carried out according to the solidlayer-cool fog method to simulate the industrial pollution.The test specimens were suspended from the ceiling of thepollution chamber [8] and rotated in horizontal position ata speed of about 140rev/min. The used contaminant was:NaCl as required, 75g/l kaolin clay and 675g/l silica flourwith particle size 2–20µm. The surface contamination wasachieved by means of compressed air (p = 1.7 bar). Theratio of pollution between the bottom and the top surfaceof the insulator was in the range of 2/1–3/1.
The equivalent salt deposit density C on the insulatorsurface was used as an index for pollution severity. It wasdetermined by washing off the surface of the insulator withion free water. The value of C is given by
where V is the wash-off solution volume (counted in cm3), sis the salinity of the solution (in grams of NaCl per litre ofsolution) and S is the total surface of the insulator (in cm2).
The fogging procedure [9] was carried out in a fog cham-ber, by means of a spraying system arrangement in accord-ance to IEC norms [10]. The air pressure was about 3 barand the water flow was about 0.5l/min (per spray).
The testing circuit consists of the high-voltage source, thetest specimen and the measuring equipment. A 750V/65kV/130kV, 260kVA high-voltage transformer of tank type wasused, with two special bushings with an extended leakagedistance permitting the introduction of them into the fogchamber. The ratio resistance/reactance (R/X) of the testingplant was greater than 0.02 and the short-circuit currentduring the tests varied in the range of 5–15A.
IEE Proc.-Gener. Transm. Distrib., Vol. 148, No. 4, July 2001

The test specimens were suspended from the ceilingisolated from their suspension wire rope by means of a discinsulator’s chain. They were energised from the high-voltage source on their lower part via a 3m section of a180mm2 ACSR bundle conductor, to simulate the dielec-tric field encountered on a transmission line, and weregrounded via a 75Ω measuring resistance.
The voltage was applied to the insulator when theconductivity reached maximum and was increased continu-ously until flashover. The layer conductivity was indirectlychecked: the insulator resistance was repeatedly (every 5minutes) measured during the wetting using a 2.5kVMegger. At the beginning of the wetting the obtainedresistance values are very high, rapidly decreasing so that in3–40 minutes the measured resistance is very low, andremains thereafter practically constant. It is obvious thatthis lowest resistance value depends on the salt depositdensity, as predicted from eqn. 4. The duration of thewetting, in order to reach the maximum layer conductivity,is not constant. It depends on the temperature differencebetween pollution layer and fog, the contaminant composi-tion and the humidity in the test chamber.
The surface conductivity of the polluted insulator isdetermined by measuring the highest peak value of theleakage current [11]. The voltage drop across a measuringresistance, caused by the leakage current was measured andrecorded by means of an oscilloscope as well as of anarrangement that registers on paper the leakage currentpeak value.
5 Test results and analysis
5.1 Critical voltage of polluted insulators Both the values of voltage and current were measuredduring the voltage increase, as well as at the instant of onecycle just before flashover. The values of the above quan-tities at the moment are called further on critical. Theexperimental results concerning the critical voltage of acap-and-pin suspension insulator and a disc insulator of fogtype (columns 10 and 5 of Table 1, respectively), are shownin Fig. 2.
The tests were carried out on several types of singlesuspension insulators and were extended to an area ofcontamination values, which seems to cover the pollutionestimated to dominate at several heavily polluted sites inGreece.
Fig.2 Critical voltage for insulators No.5 and No.10 against ESSD Measurements: (i) s fog-type(ii) cap-and-pin ——— model
IEE Proc.-Gener. Transm. Distrib., Vol. 148, No. 4, July 2001
It has been proved that the RMS value of critical voltageUc (in kV) depends on the equivalent salt deposit density C(in mg/cm2) according to
where Kc is a linear function of the insulator leakage dis-tance L (in cm), according to
The exponent m seems to depend on the insulator form. Itsvalue for usual porcelain cap-and-pin suspension insulatorsis in the range of 0.325 ± 0.009 with C given in mg/cm2
5.2 Determination of the arc constants Using the analytical expressions, which are based on thepolluted insulator model, the most important factor is thedetermination of the arc constants A and n. The use of thecalculated values [12] for steady arc in air between copperelectrodes (A = 63, n = 0.76) gives inconsistent resultscompared with the experiments. The elaboration of thedata available in the literature shows that the real values ofconstants A and n, in the case of thin pollution layers, arein the range of 50–400 and 0.3–1, respectively [4, 12, 13].The identification of these constants seems to be a verydifficult task, due to the fact that the determination of theheating effects in the pollution layer is very complicated[12].
The experimental data (Uc against C) and the geometriccharacteristics (Dm, L, F) of the tested insulators were putin eqn. 15, thus resulting a system of 84 of equations withunknowns the arc constants A and n:
This system of equations, with unknowns the arc constantsA and n was solved using the least square method. Therequirement is the minimising of the expression:
The solution of this system is:
The experimental results show that the values:
are independent of the insulator type and the experimentalpollution procedure. These values give very consistentresults compared to the experiments. The calculatedUc-values from eqn. 15, using A and n as determinedabove, show a relative divergence from the measuredUc-values between 1.7% and 1.0% (Fig. 2). Furthermore,the predicted Uc-values for several other disc insulatorswere compared to measured values. Results from theseinsulators had not been used in the evaluation of A and n.This comparison was also very satisfactory; e.g. thepredicted Uc-values for disc insulators of fog type divergefrom the measured values between –1.9% and 2.8%.
6 Application of the mathematical model
The developed mathematical model was applied to the 19insulators of Table 1, using the determined values of thearc constants in eqn. 23. The curves of the calculated criti-cal voltage Uc and critical current Ic for 3 typical insulatorsare presented in Fig. 3.
271

The validity of the model was verified by comparing thecomputer results with measurements found in the literaturebesides the already presented experimental results. Fig. 4shows a comparison of the model and experimental data[14] for the cap-and-pin insulator No.4. It can be seen thatthere is a good correlation between the model and themeasurements at every surface conductivity. Fig. 5 showssimilar results obtained for the pin-type insulator No.14.The correlation between the model and the measurements[15] is also good at any contamination severity. Thecomparison of model and experiments [16] for the stab-type
Fig.3 Critical voltage Uc and critical current Ic for insulatoprs No.1, No.13and No.18 against ESSD C
Fig.4 Uc against σs for cap-and-pin insulator No.4 ——— model experiment [14]
Fig.5 Uc against ESSD C for pin-type insulator No.14 ——— model experiment [15]
272
insulator No.19 in Fig. 6 is quite satisfactory, especially atlight contamination. Measurements of Uc against surfaceconductivity σs [14] for the stab-type insulator No.15 arecompared with the model in Fig. 7. On the other hand,experimental results [16] obtained for the same insulator,are also presented in this Figure after conversion of theESDD values in surface conductivity ones. The correlationis still good given that the computed curve passes throughthe experimental ones.
The computations show that the variation of the criticalparameters Uc and Ic upon the ESDD C follow the analyt-ical expression of the power function
where a, b, e and f are always positive. Further investiga-tion permits the evaluation of these coefficients and expo-nents and the determination of simplified analyticalexpressions giving their dependence upon the dimensions ofthe insulators:
Exponent b of Uc = a·C–b: The exponent b seems to beindependent of the insulator dimensions (L and Dm),changing its value only with the type (F) of the insulator: itsvalue lies between 0.32 and 0.33 for cap-and-pin insulators,0.35 and 0.37 for stab-type insulators and 0.31 and 0.32 forpin-type insulators.
Fig.6 Uc against ESSD C for stab-type insulator No.19 ——— model experiment
Fig.7 Uc against σs for stab-type insulator No.15 ——— model Experiments: – –– – [14] – –s– – [16]
IEE Proc.-Gener. Transm. Distrib., Vol. 148, No. 4, July 2001

Coefficient a of Uc = a·C–b: The coefficient a is a functionof the geometrical characteristics L, Dm and F of the insula-tor (Fig. 8) and therefore of the type of the insulator. Theuse of curve-fitting methods does not lead to a simplemathematical relation between a and Dm or a and F.Unlike, the following relation between a and L is deter-mined:
Eqn. 25 means that the critical voltage increases linearlywith the increase of the leakage distance, given that theexponent b is independent of the insulator dimensions, as itis found above.
Exponent f of Ic = e·Cf: The exponent f of Ic seems to beconstant and independent of the dimensions (L and Dm)and even the type (F) of the insulator. Its value was foundequal to 0.719.
Coefficient e of Ic = e·Cf: The coefficient e is a functionof the geometrical characteristics (L and Dm) of the insula-tor and therefore of the type (F) of the insulator. The rela-tion between e and L or e and F is not a simplemathematical formula. However, the relation between thecoefficient e and the diameter Dm of the insulator is linear(Fig. 9), independently of the insulator type, according tothe formula
This means that the critical current increases linearly withthe increase of the diameter of the insulator, given that the
Fig.8 Coefficient a of Uc = a·C–b against leakage distance L cap-and-pin s stab-type
Fig.9 Coefficient e of Ic = e·Cf against diameter Dm cap-and-pin s stab-type
IEE Proc.-Gener. Transm. Distrib., Vol. 148, No. 4, July 2001
exponent f is constant and independent of all the dimen-sions and even the type of the insulator as it is foundabove.
7 Conclusions
The elaboration of the experimental data leads to the iden-tification of the arc constants, which are used in thepolluted insulator model. The use of the derived values ofthe arc constants allows not only the qualitative but alsothe quantitative description of the dielectric behaviour ofpolluted insulators, providing the users of insulators with apolluted insulator model of general application. The appli-cation of the mathematical model to different types of insu-lators shows a satisfactory agreement between thecomputed results and the experimental ones.
The variation of the critical voltage follows the form ofthe power function in both cases, mathematical and experi-mental. The respective analytical forms are almost identi-cal. The experimentally determined relation between thecritical voltage and ESDD differs slightly from the calcu-lated one.
The validity of the developed model, independently ofthe type of the insulator, allows the determination of thecritical voltage, using only the geometrical characteristics ofthe insulator and the distribution of the pollution layer.The distribution of contaminants and consequently, theevaluation of local layer conductivity can be obtained bymeans of special measurements.
The quantitative description seems to be very significant,given that the exact knowledge of the arc constants allowsthe accurate prediction of the behaviour of insulators inpolluted environment. It is expected that complicatedexperiments for the estimation of this behaviour can bedrastically reduced or even eliminated. The informationthat can be obtained by means of the proposed method isvery useful in the dimensioning of the insulation of the elec-tric power overhead lines.
8 References
1 OBENHAUS, F.: ‘Fremdschichtueberschlag und Kriechweglaenge’,Deutsche Elektrotechnik, 1958, 4, pp. 135–137
2 ALSTON, L.L., and ZOLEDZIOWSKI, S.: ‘Growth of dischargeson polluted insulation’, IEE Proc., 1963, 110, (7), pp. 1260–1266
3 XAVIER, R.J., and RAO, Y.N.: ‘Study of surface conductivity andE.S.D.D. on contaminated porcelain insulating surfaces’. Presented at5th international symposium on High voltage engineering, Braunsch-weig, 1987, Paper 51.12, Vol. II
4 RENYU, Z., DEHENG, Z., and ZHICHENG, G.: ‘A study on therelation between the flashover voltage and the leakage current of natu-rally or artificially polluted insulators’. Presented at 4th internationalsymposium on High voltage engineering, Athens, 1983, Paper 46.01,Vol. II
5 RIZK, F.A.M.: ‘Mathematical models for pollution flashover’, Elec-tra, 1981, 78, pp. 71–103
6 THEODORAKIS, G., TOPALIS, F., and STATHOPULOS, I.:‘Parameter identification of the polluted insulator model’. Proceedingsof international symposium on Simulation and modelling, Lugano,1989, pp. 103–106
7 WILKINS, R.: ‘Flashover voltage of high voltage insulators with uni-form surface pollution films’, IEE Proc., 1969, 116, (3), pp. 457–465
8 ATSONIOS, G., KATSIBOKIS, G., PANOS, G., and STATHOPU-LOS, I.: ‘Salt fog tests on pin type insulators in the PPC research cen-tre’. Proceedings of international symposium on High technology in thepower industry, Lugano, 1987, pp. 72-76
9 IKONOMOU, K., KATSIBOKIS, G., KRAVARITIS, G., andSTATHOPULOS, I.: ‘Cool fog tests on artificially polluted insula-tors’. Presented at 5th international symposium on High voltage engi-neering, Braunschweig, 1987, Paper 52.13, Vol. II
10 International Electrotechnical Commission: ‘Artificial pollution testson high-voltage insulators to be used on a.c. systems’. IEC 60507,1991-04, Switzerland, 1991
11 VERMA, M.P., HEISE, W., LIPHEN, H., LUXA, G.F., and SCH-REIBER, H.: ‘The criterion for pollution flashover and its applicationto insulation dimensioning and control’. CIGRE Report, 1978, 33-09
273

12 DANIS, J.: ‘A stochastic pollution flashover model’. Presented at 4thinternational symposium on High voltage engineering, Athens, 1983,Paper 46.12, Vol. II
13 GHOSH, P.S., and CHATTERJEE, N.: ‘Polluted insulators flashovermodel for ac voltage’, IEEE Trans. Dielectr. Electr. Insul., 1995, 2, (1),pp. 128–136
14 ZHICHENG, G., and RENYU, Z.: ‘Calculation of DC and ACflashover voltage of polluted insulators’, IEEE Trans. Electr. Insul.,1990, 25, (4), pp. 723–729
274
15 SUNDARARAJAN, R., SADHUREDDY, N.R., and GORUR,R.S.: ‘Computer-aided design of porcelain insulators under pollutedconditions’, IEEE Trans. Dielectr. Electr. Insul., 1995, 2, (1), pp. 121–127
16 RENYU, Z., DEHENG, Z., and BINGYUAN, Z.: ‘The effect of arcbridging between sheds on the flashover performance of polluted stabtype support insulators’. Presented at 4th international symposium onHigh voltage engineering, Athens, 1983, Paper 46.05, Vol. II
IEE Proc.-Gener. Transm. Distrib., Vol. 148, No. 4, July 2001