eighth great plains wildlife damage control workshop proceedings
TRANSCRIPT

This is a legacy archive publication from the former Intermountain Research Station (INT) or Rocky Mountain Forest and Range Experimental Station (RM). The content may not reflect current scientific knowledge, policies, or practices.
This PDF may have been generated by scanning the original printed publication. Errors identified by the OCR software have been corrected; however, some errors may remain.
Rocky Mountain Research StationPublications
www.fs.fed.us/rm/publicationswww.treesearch.fs.fed.us
Questions or problems? Please email us: [email protected]

,
~ United States ~)) Department of ~ Agriculture
Forest Service
Rocky Mountain Forest and Range Experiment Station
Fort Coli ins, Colorado 80526
General Technical Report RM-154
Eighth Great Plains Wildlife Damage Control Workshop Proceedings
April 28·30, 1987 Rapid City, South Dakota
Uresk, Daniel W.; Schenbeck, Greg L.; Cefkin, Rose, technical coordinators. 1988. Eighth Great Plains wildlife damage control workshop proceedings. General Technical Report RM-154. Fort Collins, CO: U.S. Department of Agricuiture, Forest Service, Rocky Mountain Forest and Range Experiment Station; 231 p. [Listed also as Publication No. 121, Lincoln, NE: Great Plains Agricultural Council.]
Abstract
These proceedings consist of more than 40 presented papers on damage caused by many different animals. Panel presentations that followed two special sessions--one on prairie dogs and related small mammals and another on ways to enhance waterfowl production--are also included. In addition to information on mechanical and chemical control methods, the ecosystem processes involved are considered.
Keywords: Prairie dogs, waterfovrl, coyot:=s, rodents, bird repellents, predacides, rodenticides
Pesticide Precautionary Statement
This publication reports research involving pesticides. It does not contain recommendations for their use, nor does it imply that the uses discussed here have been registered. All uses of pesticides must be registered by appropriate state and/ or federal agencies before they can be recommended.
CAUTION: Pesticides can be injurious to humans, domestic animals, desirable plants, and fish or other wildlife-if they are not handled or applied properly. Use all pesticides selectively and carefully. Follow recommended practices for the disposal of surplus pesticides and pesticide containers.
!Pt~~~# FOLLOW THE LABEL
U.S. D!rUTM!NT OF AG~ICUlTUR!
NOTE: Mention of a trade name or proprietary product does not constitute a guarantee or warranty of the product by the U.S. Department of Agriculture and does not imply its approval to the exclusion of other products that may also be available.

USDA Forest Service General Technical Report RM-154
Eighth Great Plains Wildlife Damage Control Workshop Proceedings
April 28-30, 1987 Rapid City, South Dakota
Technical Coordinators:
Daniel W. l.Jresk, Rocky Mountain Forest and Range Experiment Station Greg L. Schenbeck, Nebraska National Forest Rose Cefkin, Rocky Mountain Forest and Range Experiment Station
January 1988
Sponsor:
Great Plains Agricultural Council, Wildlife Resources Committee
In cooperation with:
USDA Forest Service, Rocky Mountain Forest and Range Experiment Station USDA Forest Service, Nebraska National Forest USDA, Animal and Plant Health Inspection Service, Animal Damage Control South Dakota Cooperative Fish & Wildlife Research Unit South Dakota Department of Game, Fish & Parks South Dakota Department of Agriculture National Park Service

Preface
More than 200 people attended the Eighth Great Plains Wildlife Damage Control Workshop in Rapid City, South Dakota. The workshop brought together field technicians, managers, administrators, researchers, educators, students, legislators, and extension and industry representatives to further technology and information transfer. In addition to a general session on damage caused by many different animals, two special sessions were held: (1) prairie dog management and control, and (2) predator management and control to enhance waterfowl production. Both of these topics are currently high-interest issues on the northern Great Plains, the site of this workshop. Each of these sessions consisted of individual presentations followed by panel/audience discussions. A well-attended field trip to review black-tailed prairie dog management on the Buffalo Gap National Grassland and Badlands National Park brought the workshop to a close. These proceedings document this workshop.
Rapid publication of these proceedings was facilitated largely by the excellent efforts of the authors (and the typists!) in preparing the manuscripts, most of which we received camera-ready. Since papers are, essentially, being printed as received, each contributor is responsible for the accuracy of his or her paper; opinions expressed by the authors may not necessarily reflect the policy of the U.S. Department of Agriculture.
ii
We extend our thanks to Steve Denison, Robert Hodorff, and Lisa Nold for technical and operations assistance during symposium sessions. Shary Kennedy and Susan Scott graciously typed final drafts of many manuscripts. We appreciate the time and effort spent by personnel of various sponsoring agencies in making this workshop a success.
Finally, we would like to express appreciation to the Rocky Mountain Forest and Range Experiment Station, Rapid City, SD; the Rapid City Chamber of Commerce; and to the Nebraska National Forest, for being excellent workshop hosts.
We believe the proceedings of this workshop will serve as a valuable vehicle for continued improvement in the effectiveness, soundness, and professionalism of the field of wildlife damage control and management. It is our hope that the success of this workshop will provide further incentive for the Great Plains Agricultural Council to continue its promotion of similar workshops in the future.
Daniel W. Uresk, Chairman
Greg Schenbeck, Co-Chairman

Contents
Pref'ace: Daniel w. Uresk and Greg L. Sehenbeek
OVERVIEW
Welcome f'rom the Great Plains Agricultural Colmcil Robert L. Storeh
South Dakota--Its History, Land, and Wildlif'e Chuek Post
An Overview of' the South Dakota Animal Damage Alvin L. MiUer
ADC in the u.s. Department of' Agriculture Gerald J. Fiehtner
Control PrograJll ••••••••••••••••••••••.••.•••••••••••••••
Current and Future Status of' Rodenticides Steve Palmateer
and Predacides .••...•.•••.•.•.....•..•.......••.•.••.••..•.•
PRAIRIE DOGS AND RELATED SMALL MAMMALS
Page ii
l
3
8
12
16
Demography and Population Dynamics of' Prairie Dogs •••••••••••••••••••••••••••••••••••••••••••••••••••• 18 John J. Hoogland, Diane K. Angell, James G. Daley, and Matthew C. Radeliffe
Control of' Ecosystem Processes by Prairie Dogs and Other Grassland Herbivores James K. Detling and April D. Whieker
23
A Statistical Model of' Expansion in a Colony of' Black-Tailed Prairie Dogs ••••••••••••••••••••••••••••• 30 R. P. Cineotta, D. W. Uresk, and R. M. Hansen
White-Tailed Prairie Dog Ecology in Wyoming ••••••••••••••••••••••••••••••••••••••••••••••••••••••••••• 34 George E. Menkens, Jr., Brian J. Miller, and Stanley H. Anderson
Prairie Dog Overpopulation: Value Judgement or Ecological Reality? ••••••••••••••••••••••••••••••••••• 39 Kirsten Krueger
Ef'f'icacy of' Def'erred Grazing in Reducing Prairie Dog Reinf'estation Rates •••••••••••••••••••••••••••••• 46 Kelly A. Cable and Robert M. Timm
Management of' Prairie Dog Populations in Wind Cave National Park •••••••••••••••••••••••••••••••••••••• 50 Riehard W. Klukas
An Evaluation of' Shooting and Habitat Alteration f'or Control of' Black-Tailed Prairie Dogs ••••••••••••• 53 Craig J. Knowles
Rodenticidal Ef'f'ects of' Zinc Phosphide and Strychnine on Nontarget Species •••••••••••••••••••••••••••• 57 Dan~el w. Uresk, Rudy M. King, Anthony D. Apa, Miehele S. Deiseh, and Raymond L. Linder
Ef'f'icacy of' Aluminum Phosphide f'or Black-Tailed Prairie Dog and Yellow-Faced Pocket Gopher Control •••• 64 P. Rodger Moline and Stephen Demarais
Laboratory Trial of' Chlorophacinone As a Prairie Dog Toxicant ••••••••••••••••••••••••••••••••••••••••• 67 Daryl D. Fisher and Robert M. Timm
Relevant Characteristics of' Zinc Phosphide ~sa Rodenticide ••••••••••••••••••••••••••••••••••••••••••• 70 Rex E. Marsh
Comparative Toxicity of' Strychnine to Eight Species of' Ground Squirrels ••••••••••••••••••••••••••••••• 75 George H. Matsehke, Carolyn L. Fordham, Susan C. Hurlbut, and Riehard M. Engeman
Arthropod Consumption by Small Mammals on Prairie Dog Colonies and Adjacent Ungrazed Mixed Grass Prairie in Western South Dakota ••••••••••••••••••••••••••••••••••••••••••••••••••••••••• 81
W. Agnew, D. w. lf.resk, a:nd R. M. Hansen
Small Mammals: Pests or Vital Components of the Ecosystem? 88 Carolyn Hull Sieg
Historical and Present Status of the Black-Footed Ferret •••••••••••••••••••••••••••••••••••••••••••••• 93 Dean E. Biggins and Max H. Sehroeder
A Field Habitat Model for Black-Footed Ferrets •••••••••••••••••••••••••••••••••••••••••••••••••••••••• 98 Brian J. Miller, George E. Menkens, and Stanley H. Anderson
A Novel Strategy for Pocket Gopher Control •••••••••••••••••••••••••••••••••••••••••••••••••••••••••••• 103 Miehae Z E. R. Godfrey
Rodent Damage to Various Annual and Perennial Crops of India and Its Management ••••••••••••••••••••••• 108 Ranjan Advani
iii

PANEL: PRAIRIE DOG MANAGEMENT AND CONTROL Greg L. Sahenbeak, Moderator
Involving the Public in Prairie Dog Management on the Nebraska National Forest •••••••••••••••••••••••• 113 George Probasao
Legislative Review of Prairie Dog Statutes •••••••••••••••••••••••••••••••••••••••••••••••••••••••••••• 115 Lyndell Peterson
Politics, Prairie Dogs, and Ghe Sportsman ••••••••••••••••••••••••••••••••••••••••••••••••••••••••••••• 117 Jon Sharps
Prairie Dog Control--A Regulatory Viewpoint ••••••••••••••••••••••••••••••••••••••~•••••••••••••••••••• 119 Dennis C. Clarke
A Chronology of Prairie Dog Control Operations and Related Developments in South Dakota ••••••••••••••• 121 Rew Hanson
Endangered Species Considerations in Prairie Dog Management ••••••••••••••••••••••••••••••••••••••••••• 123 Max Schroeder
WATERFOWL
Duck Nest Success and Predators in North Dakota, South Dakota, and Montana: The Central Flyway Study •• 125 Michael A. Johnson, Thomas C. Hinz, and Thomas L. Kuck
Predator Management To Increase Duck Nest Success ••••••••••••••••••••••••••••••••••••••••••••••••••••• 134 Harold A. Doty and Anthony J. Rondeau
Duck Nest Success on South Dakota Game Production Areas ••••••••••••••••••••••••••••••••••••••••••••••• 140 S. Gay Simpson
Increasing Waterfowl Production on Points and Islands by Reducing Mammalian Predation ••••••••••••••••• 146 John T. Lokemoen, Richard W. Sahnaderbeck, and Robert 0. WoodWard
Bullsnake Predation on Waterfowl Nests on Valentine National Wildlife Refuge, Nebraska •••••••••••••••• 149 Saott S. Glup and Leonard L. MaDaniel
Overwater Nesting by Ducks: A Review and Management Implications ••••••••••••••••••••••••••••••••••••• 153 Stephen H. Bouffard, David E. Sharp, and Carol C. Evans
Distribution and Impact of Canada Goose Crop Damage in East-Central Wisconsin ••••••••••••••••••••••••• 159 James W. Heinriah and Saott R. Craven
Should Ducks Be Frightened? ••••••••••••••••••••••••••••••••••••••••••••••••••••••••••••••••••••••••••• 160 William K. Pfeifer and Steven D. Fairaizl
The Lure Crop Alternative • . . • . • . . • • • • • • • • • • • . • • • • . • • • . • • • • . • • • • • • • • • • • • • . • • • • . . • • • • • • • . • • . • • • • • . • • . • • • 163 Steven D. Fairaizl and William K. Pfeifer
PANEL: PREDATOR MANAGEMENT AND CONTROL TO ENHANCE WATERFOWL PRODUCTION Jim Salyer, Moderator
Control of One Native Animal Species To Benefit Another Native Species •••••••••••••••••••••••••••••••• 169 John T. Lokemoen
Policy and Goals of the State of South Dakota ••••••••••••••••••••••••••••••••••••••••••••••••••••••••• 172 Gay Simpson
Policy and Goals on National Wildlife Refuges ••••••••••••••••••••••••••••••••••••••••••••••••••••••••• 173 Len MaDaniels
Policy and Goals of the U.S. Fish and Wildlife Service •••••••••••••••••••••••••••••••••••••••••••••••• 174 Harold Doty
Policy and Goals in the Private Sector •••••••••••••••••••••••••••••••••••••••••••••••••••••••••••••••• 176 Riak Warhurst
OTHER WILDLIFE
Decoying Coyotes with Dogs •••••••••••••••••••••••••••••••••••••••••••••••••••••••••••••••••••••••••••• 179 Gary J. Rowley and DeLyle Rowley
Field Study--Steel Versus Lead in Aerial Hunting •••••••••••••••••••••••••••••••••••••••••••••••••••••• 182 Duane Bernstein and David Nelson
Aerial Hunting Takes Sheep-Killing Coyotes in Western Montana ••••••••••••••••••••••••••••••••••••••••• 184 Guy Connolly and Bart W. O'Gara
iv
Importance of Attractant Qualities for Improving a New Coyote Delivery System ••••••••••••••••••••••••• 189 Steven M. Ebbert and Daniel B. Fagre
Field Evaluation of Olefactory Attractants and Strategies Used To Capture Depredating Coyotes ••••••••• 195 George E. Graves and Major L. Boddicke~
Cougar Predation on Livestock in New Mexico, January 1983 Through June 1984 ••••••••••••••••••••••••••• 205 Gary A. Littauer and Ronald J. White
Snaring as a Beaver Control Technique in South Dakota ••••••••••••••••••••••••••••••••••••••••••••••••• 212 Jerry Riedel
Consider Using Electric Powered Fences for Controlling Animal Damage •••••••••••••••••••••••••••••••••• 215 Robe~t E. Steger
Fencing Methods To Control Big Game Damage to Stored Crops in Wyoming ••••••••••••••••••••••••••••••••• 217 John F. SchneidmilZer
Kansas Wildlife Damage Reporting System ••••••••••••••••••••••••••••••••••••••••••••••••••••••••••••··· 222 Bart L. Hettenback
Results of a Bird Damage Survey of Kansas Feedlots •••••••••••••••••••••••••••••••••••••••••••••••••••• 225 Charles Lee
Control Methods for Objectional Roosts of Purple Martin8 •••••••••••••••••••••••••••••••••••••••••••••• 228 AZbe~t E. Bivings, IV
WILDLIFE D.AMA.GE CONTROL WORKSHOP • o a •••••••••••••••••••• o ••••••••• o • o •••••••••••••• a o o • o • • • • • • • • • • • • • • • 2 30
Workshop Committee Panel Chairpersons Poster Session Exhibitors
v


Welcome from the Great Plains Agricultural Council1
Robert L. Storch2
On behalf of the Great Plains Agricultural Council and other sponsoring agencies, I want to welcome you to the 8th Great Plains Wildlife Damage Control Workshop. From the very first session that was held in 1973 at Manhattan, Kansas, this workshop has consistently enjoyed a high level of success, and we believe this year's effort will be no exception. Being approximately a year and a half since the last workshop in San Antonio, we were initially concerned about the amount of interest that would be shown in this year's workshop. However, in looking at the number and quality of the papers that are identified in the program's agenda and considering the number of people who are here today, it is obvious our concerns were unfounded and interest in the Great Plains workshop remains high.
At this time, I would like to recognize those who have contributed significantly to the planning and organization of this year's workshop. First I want to acknowledge Ardell Bjugstad, project leader for the Forest Service research unit here in Rapid City, for being instrumental in bringing the workshop to South Dakota. Ardell has also arranged for much of the financial assistance that is so necessary for a meeting of this size. Dan Uresk, who is a member of Ardell's staff, and the rest of the program committee have spent a considerable amount of time planning and organizing this year's workshop. If you will look at the inside cover of the program agenda, you will see the list of all individuals and agencies responsible for this workshop, and I want to thank each of those individuals and their employing agencies for their participation and support.
I believe it's appropriate to say a few words about the Great Plains Agricultural Council. The Council is made up of selected agencies of the U.S. Department of Agriculture and the Cooperative Extension Services of the Land Grant Universities in the 10 Great Plains states. Its present organization dates back to 1946, however, its roots go back to the 1930's. The purpose of the Council is to provide an organization for effective cooperation
1Presented at the Eighth Great Plains Wildlife Damage Control Workshop, Rapid City, South Dakota, April 28-30, 1987.
2Robert L. Storch is Forest Supervisor, Nebraska National Forest, Chadron, Nebraska.
and coordination in responding to current and emerging issues of importance to Great Plains agriculture. In fulfilling its mission, the Council provides a forum for technology transfer and cooperation on activities that effect the natural resources of the Great Plains. Six committees perform much of tl•e Council's work, and relative to this workshop, the Wildlife Committee is the sponsoring entity.
The agenda for the next two days is full. There are topics ranging from crop depredation to control and management of rodent and predator damage. However, in addition to the subject areas that have been traditionally covered at previous workshops, we have also included topics dealing with predator management and control as they relate to waterfowl production. Waterfowl managers across the Northern Plains continue to be active in this area and the program committee felt that the technicians and researchers involved in this form of wildlife management should be given the opportunity to share their knowledge with us. We're confident that this will add a new dimension to our program. We hope that you agree.
If I may, I would like to take a few minutes to philosophize with you. During the last several years I have been responsible for the administration of several units of the National Forest System here in South Dakota and Nebraska. From my observations, I can say the Northern Great Plains, like many other regions, is in a state of change. In agriculture, we see change. On many economic fronts, change is the norm rather than the exception, This is also true in the area of natural resource management. In my line of work, in the management of the National Forest System, more and more of the public are expressing their needs and concerns and requesting involvement in the decision making process. We, in the Forest Service, find ourselves in a position of closely scrutinizing every management decision that has the potential of affecting the public. We also are being required to review decisions made in the past to determine if those decisions remain in the best interest of the public today. I believe this increase in public involvement in natural resource management is the sign of the times, as well as, a sign of the future, especially when public funds and/or lands are involved. Now, how does all this relate to wildlife damage management and control? Again, I speak first hand. The amount of public inquiries on items such as predator and rodent

management on National Forest System lands has grown substantially. As a result, the decisions I make today are made following more deliberation than those I made when I first arrived on the job. Accordingly, I would recommend that agencies and personnel involved in wildlife damage management and control closely monitor their programs to ensure these programs are adequately responding to the needs and concerns of the public.
The monitoring and evaluation of the wildlife damage programs on the National Forest System is vitally important. To assist us with this task, we use the Wildlife Society's recent Position Statement on wildlife damage control. It is used as a guide and an evaluation tool. I believe this position statement provides an excellent basis for evaluating ongoing ADC programs. I also strongly believe this approach is supported by the majority of the American public. I will not take time to review the individual points identified in this Position Statement, however, I encourage those of you
2
involved in wildlife damage programs to familiarize yourselves with it.
In closing, I call your attention to the excellent papers that open the workshop this morning. I want to highlight a couple of them that are specific to the State of South Dakota. The presentation by Chuck Post will describe the diversity of this state in terms of the land, the wildlife, and its people. From this you will acquire the appreciation of the complexity of the issues dealing with wildlife damage management and control that are occurring In Al Miller's overview of the ADC program in South Dakota, you will see a very complete program. A program that not only consists of a successful statewide network, but one that has multi-agency involvement and is strongly committed to research.
Again, I welcome you to this workshop and hope it will provide a valuable learning experience to you. I know it will be for me. Thank you.
South Dakota-Its History, Land, and Wildllfe1
Chuck Post
South Dakota, dub lOR tub, waa naed for the Dakota, or Sioux Indians who lived in this region before the white .an cae. In addition to the Sioux, two other tribes lived in the area before the white man. The Arikara built peraanent hoaes and raised crops while the Cheyenne lived mostly by hunting. The wandering Sioux were hunters and warriors who moved from place to place following the great herds of bison.
In 1862 all the land that was drained by the Mississippi River system was clai.ed for France. South Dakota was included because the waters of the Missouri River system flow into the Mississippi.
The French-canadian explorers, Francois and Louis Verendrye were the first white .en known to have visited the state. In 1743 the brothers buried a lead plate near the site of Ft. Pierre to prove they had been here. School children found the plate in 1913.
In 1762, France gave Spain the land and in 1800 Spain ceded it back to France. In 1803 the United States acquired South Dakota as part of the Louisiana Purchase.
In 1781, Pierre Dorion, a Frenchman, arrived in the lower James River Valley near what is now Yankton in the far southeastern part of the state. He was the first white man to permanently settle in present day South Dakota. The American explorers Lewis and Clark crossed the state on their way west in 1804, and again on their return in 1806. Their reports attracted .any fur traders to the area. A French fur trader Joseph La Framboise, established a trading post in 1817 at the junction of the Missouri and Bad rivers where Fort Pierre now stands. This was the first permanent settlement in the region.
The first important Indian encounter occurred in 1823, when the Arikara attacked a trading party led by General Ashley. The federal government sent an army detachment to punish the tribe. The Sioux joined in crushing the Arikara.
1 Paper presented at the Eighth Great Plains
Wildlife Damage Control Workshop, Rapid City, South Dakota, April 28~30, 1987.
2chuck Post is Information and Education
Supervisor, South Dakota Department of Game, Fish, and Parks, Pierre, South Dakota.
3
Tbe arrival of the Yellowstone at what is now Fort Pierre, in 1831 proved that steamboats could travel up the Missouri River. This develo~t brought new fur traders to the region. Soon the number of fur bearing animals began to decrease, and the trade had almost ended by the 1850's.
Agricultural settlement began in 1856, when pioneers from Iowa and Minnesota came to an area near the present day Sioux Falls to raise crops.
In 1861 Congress created Dakota Territory. It consisted of present day South and North Dakota, and parts of Montana and Wyoming.
In 1874 Colonel George Custer led a military expedition into the Black Hills. He was to investigate reports of gold in the mountains. The soldiers discovered gold near the present day town of Custer, and the news brought the first rush of prospectors to the area in 1875. After discovery of the Great Homestake Lode in 1876, thousands of miners flocked to the Black Hills. Deadwood, the center of placer mining operations, becaae a notorious wide-open mining town that echoed the names of Calamity Jane and Wild Bill Hickok.
The invasion of the Sioux Indian lands by the prospectors and other white men caused a series of Indian uprisings led by Crazy Horse and Sitting Bull. In 1876 Crazy Horse surrendered, Sitting Bull escaped into Canada, and all the Indians left the Black Hills. The Indians agreed to give up the Black Hills region, and most of the Sioux surrendered their arms and settled on reservations west of the Missouri River.
The discovery of gold and building of railroads speeded settlement during the 1870's and 1880's. In 1889 South Dakota became a state. The population at the time numbered about 300,000.
Little development took place in the first few years due to severe drought. However, the early 1900's brought rapid progress. Thousands of homesteaders poured in and by 1900 400,000 people lived in the state. By 1930 the population grew to 683,000.
The 1930's began with the worse drought and grasshopper plague ever experienced in the state. The drought, accompanied by dust storms lasted for 10 years, except for some relief in 1932 and 1935.
After 1940, high farm prices and plentiful rain brought prosperity back to South Dakota.
South .. Dakota is full of distance. It has miles of fertile farm land and grassy, windswept prairie that stretch as far as the eye can see. Pastures cover more than half the state, and fields of crops take up most of the rest of the land. The state ranks among the leaders in the production of corn, rye, oats, spring wheat, flax seed, hay and a variety of grass seeds. South Dakota is also a leading beef-cattle state. Farmers raise livestock on large ranches on the western plains and on smaller farms in the east. The rich soil in the eastern section supports an abundance of crops, part of which are used for livestock feed.
The southeast corner of the state contains the most fertile soils, and it is here farmers raise corn, soybeans and other cereal grains. Most of the eastern part of the state is flat except for river valleys and coteaus. The middle section and most of the western part of the state is referred to as the Great Plains. The land is generally flat but broken by deep river valleys and buttes. In the far west there are the rugged, granite mountains of the Black Hills. This region has towering rocks and forests of pines and spruce. The Black Hills are well known as a tourist attraction, and for rich mineral deposits and lumber.
The fertile soil is the state's greatest natural resource. The state also has rich mineral deposits, and some forest resources consisting mainly of ponderosa pine, spruce and cottonwoods.
The glacial till that covers much of the state east of the Missouri River produces loamy soils, nearly black in color. Much of the soil west of the Missouri River consists of eroded shale.
The Black Hills provides most of the state's mineral wealth. The vein of gold ore discovered at Lead in 1876 has reserves of more than 14,000,000 tons. The ore contains some silver. The Black Hills area also has beryl, feldspar, columbite-tantalite, gypsum, iron ore, limestone, lithium, clays and mica. Uranium deposits lie chiefly in the southern end of the Black Hills.
Forests cover about 2,000,000 acres, mostly in the Black Hills. The trees include ponderosa pine, aspen, spruce and cedar. Cottonwoods can be found along the rivers and creeks in the rest of the state.
4
The Missouri River crosses the middle of the state and drains all but the northeast corner. Its western tributaries include the Grand, Moreau, Cheyenne and White rivers. The James, Big Sioux and other smaller rivers join the Missouri in the east.
The natural lakes in the northeast part of the state were formed during the Ice Age, when drainage water was dammed up behind glacier-piled earth.
The Missouri, once a wild and muddy river, has since been tamed by four South Dakota dams--oahe, one of the largest earthen dams in the world, near Pierre; Big Bend at Ft. Thompson; Ft. Randall at Pickstown and Gavins Point near Yankton. Huge reservoirs have now been created behind each of these dams.
The abundance of game on the pra1r1e before the encroachment of the white man's civilization staggers the imagination. The prairie grasses never grew to a climax vegetation because the numbers of buffalo were so great.
Today, it's difficult to grasp the tremendous influence the buffalo had on the life history of many species. The prairie dog, antelope, wolf and grasshoppers flourished with the buffalo. Deer, rabbits and sharptail grouse maintained, at best, a precarious existence. Only in the Black Hills and along the heavily timbered river bottoms did the whitetail deer succeed. The mule deer, because of his preference for precipitous terrain and badland areas, was able to hold his own, but elsewhere, through the thousands of square miles of rolling prairie, the mule and whitetail deer were found in limited numbers. Deer became the dominant big game animal only after the buffalo was gone, but deer were abundant only briefly before they too were decimated by the hunters.
The buffalo herds which ranged from Texas to Montana and from the Mississippi River to the Rocky Mountains numbered between 65 and 70 million animals at their peak.
"I have seen herd after herd stretching over a distance of eighty miles, all tending in the same direction •.• " wrote Deb. R. Keim, a pioneer writer, of the vast herds.
Migrating ducks and geese darkened the skies. Sharptail grouse were found extensively, until land use changes caused the prairie chickens to flourish, replacing the sharptails. Elk, deer, quail, bear, turkeys, antelope, Audubon's bighorn sheep, wolves, mountain lions--call the roll--they were all here.
Before 1800 South Dakota's antelope were estimated to exceed 700,000. No estimate we know of has been made on the other wildlife, which also flourished.

The philosophy of a hundred years ago was one of nearly complete freedom. The land was free, the game was free and thought to be inexhaustible, and nearly every man was a law unto hi.aelf. Wildlife was needed for man to subsist, and the prairies provided it in abundance.
Perhaps it was necessary for the buffalo herds to be reduced to nothingness. Certainly agriculture and ranching could not co-exist with millions of buffalo. New land use drove the prairie chickens away, but made it possible for the pheasant to flourish.
These are things to consider. It may be easy to speculate on the rightness or wrongness of our predecessors; it may salve our consciences for our faults in the present day if we view the foibles of our fathers--it is also fruitless. History is irrevocable--only the future is worth speculation.
Beaver were the first to be capitalized upon by the fur traders, but after the demand for furs grew and the river transportation system improved, the herds of buffalo were next.
Cargoes of Missouri River steamboats came to be made up largely of beaver pelts for gentlemen's hats and buffalo hides for fashionable carriage robes. For half a century, nearly $100,000 a year went down the Missouri in the form of hides and furs.
After the Civil War, the railroads came, and with them, men like Buffalo Bill Cody and Billy Comstock who made their living supplying buffalo meat to railroad crews. Towns sprang up along the rail heads, named after places in the East, after railroad officials, and after topographical peculiarities.
The gandy-dancers must have dined like kings because the hunters took only the humps, tongues and hindquarters of the buffalo. It's estimated the Cody alone left 3 million pounds of meat to rot on the prairie.
The fate of the buffalo was nearly sealed when the major railroads were completed in 1872-73. Buffalo hunters were thrown out of jobs. The settlers continued to push west, moving the Indians before them. The Indians didn't push without resistance, though. The army showed a remarkable degree of incompetence in some of the Indian c8mpaigns, and sought other ·means for quashing the Indian threat.
Other means were available. Certain military and railroad officials believed the Indians could be subdued if they had no food, and the buffalo hunters were employed again, this time to pursue a program of relentless slaughter throughout the Missouri Valley.
5
By 1881, the job was practically completed with a great kill of buffalo on the Grand River uear LeDIIlon. During the next few years, remnants of the herd were searched out and killed.
The professional hunters were again organized as efficiently as a company of soldiers. In a large outfit, three or four hunters could kill enough animals to keep thirty or forty men busy skinning and hauling hides and meat, and running the camp. Cody alone had killed 4,280 buffalo in an 18-month period. A single firm in Glendive, Montana shipped out more than 250,000 buffalo hides, the majority of which were bought in the Dakota Territory following the Grand River kill.
The Grand River hunt virtually marked the end of the buffalo on the open range. Carcasses were left strewn over the prairie for more than ten miles near Lemmon, and later bird hunters were to wonder at the expanse of bleaching bones.
The hunt had the desired effect. Except for sporadic outbreaks, Indian resistance had been crushed efficiently. It was the first time America had seen the concept of total war carried out against a whole hostile population.
Settlers and homesteaders and "sportsmen" poured into the Dakotas, and during the period from 1865 to 1900 what had been unimaginable abundance of game became a conscience-haunting scarcity.
'l'he unremitting pressure on the game brought the Territorial Legislature to pass the first law regulating hunting in 1875.
Elk, deer and antelope fared little better than buffalo at the hands of the hunters. Elk were so nearly exterminated in South Dakota they had to be restocked from Wyoming. Nearly every cargo of buffalo hides that went out of the Dakota Territory contained pelts of other animals.
As buffalo became scarce, deer flourished, but professional hunters turned their attentions more and more to the smaller animals.
An era was dying.
As late as in the 1880's, Ernest Thompson Seton, the famed naturalist from the East, reported seeing between 8,000 and 9,000 antelope a day in the Badlands. But these days were numbered by the avarice of the market hunter and the "real quill" sportsmen and the rancher's fence.
Nor was the slaughter to be confined to big game. Anything wild that flew, crept or ran was something to be killed, either for profit or the pleasure of blood lust.

THE BLACK HILLS JOURNAL, on December 21, 1883, said:
"Some parties brought a load of grouse to town yesterday. They disposed of them readily and at a good price."
The West River country and the Black Hills weren't the only areas of the state touched by the wanton slaughter. Game had been abundant in the East River part of South Dakota, and had been killed there as heedlessly as any other place.
Settlement had brought a temporary burgeoning of the number of grouse and ·prairie chickens because of the additional food supply in the corn and grain fields. Because of this temporary increase, prairie chickens and grouse were plentiful about a decade longer than the buffalo. More intensive cultivation would eventually destroy their natural range and neeting habitat, however. ·
For almost a generation, the area of the Great Plains that included eastern Dakota was known as "the ·chicken country." During the period from 1870 to 1900, hunters had only their consciences to be their guides, and the market hunter reaped a rich harvest.
Barrels and boxes of prairie chickens consigned to game markets in Eastern cities were a common sight on depot platforms throughout the area. Millions of chickens and grouse were killed, and the settlers were indifferent to or assisted in the slaughter.
The ducks, geese, plover and brant that obscured the skies belonged in the same category.
lature had shown an awesome regenerative power, through, and even the turning of the prairies and hills into a charnel house did not entirely wipe out the game. Changing land use--the logging of the forests, building of roads and rail lines, damming streams, breaking the native sod and overgrazing with cattle--all served to destroy the habitat of wildlife. Hunters had killed the last grizzly bear in the Black Hills about 1885, and fewer than BOO buffalo remained in the United States, and most of them in captivity. The Virginia turkey was allaoa t gone.
And then nature decided to help man in the revel.
It set the stage with severe blizzards during the winter of 1880-81.
Nature's finishing blow to what man had begun brought home a sudden realization that wildlife and fish were not something merely to be exploited for the market or slaughtered needlessly. At least, this realization came home to the more intelligent members of the community.
6
By the end of the 19th century the conservation movement had begun in earnest. After the turn of the century, game laws were to become more and more stringent. And by 1909 the Department of Game, Fish and Parks was created.
Since the turn of the century, wildlife populations have had there ups and downs.
The drainage of thousands of acres of wetlands has affected waterfowl, furbearers, and other wildlife that depend on wetlands for their existence. The breaking of prairie sod has shown its influence on sharptail grouse and prairie chickens. The damming of the Missouri River has almost led to the demise of the paddlefish, and the encroachment of pine and civilization upon the Black Hills has not benefited elk and whitetail deer. But overall, South Dakota is still blessed with abundant and varied species of wildlife.
'l'he wetlands of the northeast are very critical to North American duck production. South Dakota ranks second in duck production throughout the continental United States. The northeast lakes offer some great fishing for a variety of sport fish. Snow geese build up in huge numbers in the fall at Sand Lake National Wildlife Refuge. The eastern half of the state is also home to the ringneck pheasant, Hungarian partridge, bobwhite quail, red fox, muskrat, mink, beaver, cottontail rabbits, red squirrels, and an excellent population of whitetail deer.
The Missouri River reservoir system offers some of the finest walleye fishing in the nation. And for trophy northern pike and chinook salmon, the largest reservoir on the river system, Lake Oahe,offers both. Each fall thousands of migrating Canada geese and mallard ducks stop along the river on their way south.
The western prairies are homes to the sharptail grouse, prairie chicken, mule deer and pronghorn antelope. Wild turkeys frequent the wooded river and creek bottoms and coyotes and prairie dogs can be found throughout the area. Water is at a premium in this western country, and when you find it you can bet it will be filled with largemouth bass.
The Black Hills has a variety of wildlife. The lakes and streams are trout country--browns rainbows, and brooks. Some of the large reservoirs have good walleye fishing. Whitetail and mule deer are scattered throughout the timber~d area. Rocky mountain bighorn sheep are found 1n Custer State Park, and mountain goats frequent the craggy, granite outcroppings of the high aountains. Elk herds offer hunting recreation in the fall and Custer State Park has one of the largest buffalo herds in the nation.
South Dakota is a land full of distance and variety. From its cornfields of the east to the

mountains of the west it is a land that man has sweated and toiled to put under his control. It's a land steeped in western heritage. Cowboys still saddle horses and ride the range rounding up cattle. Rodeos are as popular as football games, and once you cross the Missouri River
7
headin~ west moat everyone you see will have a Stetson on hia heada South Dakota is noted for IIBDY things. Mt. Rushmore and pheasants may be nu.bers one and two, but it's friendly people are really the .oat important asset of the state.

An Overview of the South Dakota Animal Damage Control Program1
A I v i n L . M i I I er2
Animal Damage Control in South Dakota is a very co~prehensive program. The program's objective is to reduce agr1cul:ural loss caused by predators, nuisance animals, rodents, m1gratory birds and waterfONI. It involves the cooperation of several federal, state and county agencies as wei I as landown~rs and in turn requires very close coordination of these var1ous entities in order to successfully achieve our objective. Operational control, extension services, research and educational programs are all important facets of such a comprehensive program.
An I mal Damage Control Is a vIta I progrCII'l In South Dakota because of Its direct relationship to agriculture and the agricultural economy. Agriculture Is the number one Industry In the State of South Dakota. According to a nationwide agricultural census, South Dakota ranked 5th In number of beef cattle and 5th in sheep. South Dakota also ranks among the top ten states In the production of corn for grain, oats, wheat, bar I ey, rye, f I ax seed, sunf I 0r1er seed, hay and alfalfa (see table 1 ). The vast topographical difference from one end of the state to the other accounts for a wIde diversity In agricultural practices. These same topographical differences provide a wide variety of habitat conditions that become food and shelter for our wlldl ife populations. When wlldl ife Is forced to coexist with man In his environment, problems often arise. These problems can be caused by a variety of things I Ike a disease such as rabies, the destruction of crops or the predation of I lvestock. Resolving these wlldl lfe/agricultural confl lets Is the responslbil ity of the Animal Damage Control Program In South Dakota.
The Animal Damage Control responslbil ltles are shared by a number of different agencies and organizations. Each plays an Important role In making up one of the most comprehensive
1Paper presented at the Eighth Great Plains Wildt ife Damage Control Workshop (Howard Johnson's, Rapid City, South Dakota, April 28-302 1987).
Alvin L. Miller Is Supervisor of Animal Damage Control, South Dakota Department of Game, Fish and Parks, Pierre, South Dakota.
8
Animal Damage Control programs In the nation. The South Dakota Department of Game, Fish and Parks has the largest role In this Animal Damage Control responslbil ity. This agency Is responsible for the management of alI game animals, birds, fish and furbearers within the state. Much of the animal damage problems that occur are caused by a wlldl ife species that comes under this management responslbil ity.
The Game, Fish and Parks Department has a special unit known as the Animal Damage Control section. This unit consists of a supervisor and one ass 1 stant superv f sor, one secretary, sixteen full time extension trapper special fsts, two pilots and four part time trappers. The primary responsibility of this unit Is to reduce or et lminate agricultural t osse s caused by predators, nu I sa nee an I ma I s and rodents.
The field staff are at I stationed In strategic locations so as to best serve the needs for Animal Damage Control. Workloads have changed In recent years causing an Increased need for manpower In the eastern part of the state. This need was addressed by adding one fut I time and two part time trappers (April - October) east of the Missouri River. Currently we have eleven ful I time and two part time trappers stationed In the western half of the state and five ful I time and two part time trappers stationed In the eastern half of the state. The one west river part time works from Apr f t - October. The second one serves a dua I rote. This person works two months during denn 1 ng season (Apr I I - May) then serves as rodent control special Jst August- November.

Table 1.--State rankings, South Dakota and ten leading states--1984.
ITEM UNIT 10 !S.D. Rank
CROP PRODUCTION - 1984 ---- ... ------------------ ·-- ---------------------------------------- -------------------
MIL. IOWA ILL. NEBR. IND. MINN. OHIO WISC. MICH. MO. CORN FOR GRAIN BU. 1,444.8 1. 24 7. 2 799. 3 70S. 5 689 .1 460.2 344.5 220. I 154.4 186. 3
MIL. S.D. MINN. WISC. N.D. IOWA MICH. PA. NEBH. ILL. OATS BU. 86.8 78.0 53.8 50.0 47.4 21.7 16.0 15.0 10.7 86.8
MIL. KANS. N.D. OKLA. WASH. TEXAS~ MINN. COLO. MONT. MO. ALL WHEAT BU. 431.2 284.2 190.8 160.4 150.0 12~.0 120.7 115. 3 104.7 84.1 126.0
MIL. KANS. OKLA. TEXAS WASH. COLO. MO. NEBR. IT. I.. MONT. OREG. 12 WINTER WHEAT BU. 431.2 190.8 150.0 148.8 110.4 84.1 81.0 70. 4 67.0 66.2 61.2
MIL. N.D. CALIF'. ARIZ. MONT. c~ MINN. DURUM WHEAT BU. 78.6 9. 4 7. 2 3 • 6 ____ 3. 1 1 • 6 3.1
MIL. N.D. MINN. DQ MONT. IDAHO WAS fl. COLO. GREG. UT.ll,H Nt:V. OTHER SPRING WilT. BU. 18 3. 6 103.7 61.7 34.1 24.7 11.6 4. 9 2. 8 1.8 1.2 61. 7
MIL. N.D. iDAHO Wf...Sll. :;, .f:-.J~:. MONT.
~ C.ll.i..H'. COLO. OREG. UTAH
BARLEY BU. 15 3. 7 88. 4 63.7 61.8 59 .l 3 29.0 20.2 17.4 11.6 3C. 3 MIL. s. 5~---- MIN~. N.D. GA. NEBR. OKLA. MICH. PA. N.C. S.C.
RYE BU. 10.8 6. 7 5. 4 1.8 1.3 • 7 .6 .6 .6 • 5 10.8 MIL. N.D. MINN.
FLAXSEED BU. 4. 9 • 7 1.5 MIL. KANS. NEBR. MO. ARiC MISS. TENN. ILL.~ OKLA.
SORGHUM FOR GRAIN BU. 216.8 121.6 91.8 42.5 23.7 20.8 19.7 18.6 18 .o 18.6 MIL. ILL. MINN. IND. OHIO MO. ARK. MISS. LA. NEBR. 16
SO't'BEI\NS FOR BEANS BU. 288.6 172.9 150.1 137.6 108.7 101.4 76.8 64.3 63.8 31.3 MIL. N.D. MINN. TEXAS
SUNF!.OWER SEED LBS. 2,749.9 313. 1 48.1 633.5 MIL. WISC. S~ rT•.LIF. IOWA NEBR. 110. KANS. TEXAS N.y.
ALL HAY TONS 12. B 8.1 7.9 7.9 7.5 6. 3 6.1 5. 4 5. 4 8.1 MIL. WISC. IO'f/A MINN.~ MICiL. IDAHO KANS. ILL.
ALFALFA HAY TONS 11.3 6.6 6.5 5. 7 5.1 4. 6 3.9 3. 3 3. 0 5. 7 MIL. MO. KA:>IS. N.Y. KY. . ~ O!CLA. PI\. I'EBR. TF.:~~~. 6-9
1\LL OTHER HAY 1/ TONS 5.1 2.9 2.6 2.6 2.4 2. 4 2. 4 2. 4 2. 2 2. 4 MIL. IDI\HO CM,IF'. OREG. 11/\INE wiSC. N.D. COLO. MINN. MICH. 21
POTATOES CWT. 86.6 22.8 22.7 21.4 21.4 20.6 19.2 15.5 15. 1 1.8
1/ INC!.UDP.S WILD HAY.
LIVESTOCK ON HAND - JANUARY 1, 1985
--:::~~f~:;;;~-------::~:----~: ~::--;;::;::--;~: ;:--;~~ ~ ::--~i~:;:--;z~ i ::--~: ;; :--~:~~;: T;; :; :: F :~~;:---; --::::: THAT 000 TEXAS MO. OK!./1. NEBR. JS~ ~ION1'. KANS. IOWA , • TENN. 5
HI\VE CI\LVI::D HEAD 5,586 2,000 1,993 1,808j_l.!~~ 1,513 1,512 1,305 1,161 1,050 1,627 000 TEXI<S NJ·:BR. Kr,NS, COLO. !OWl\ c:ALIF'. ILL. ARIZ. MINN. ~ 10
CATTLE ON FEED HEAD 2,310 1,880 1,530 1,000 880 598 540 419 370 L~ 355 ALL SHEEP AND 000 TEXAS CALIF. WYO. COLO. rs:o:-IN.M. UTAH MONT. OREG. IOWA 5
ALL H~~iBSAND PIGS ~~~D IO~A810 uL065 MIN~~O IND~90 I_~ MO. 538 N.C:15 OHI~15 5.0~30 KAN~60 9-10 639
DEC. 1, 1984 HEAD 14,200 5,400 4,300 4,300 3,700 3,450 2,300 1,970 ~ 1,600 1,600 000 I TEXAS MO. WISC. OKLA. ~NEBR. CAI.IF. IOWA MONT. KANS. 5-6
--~~~-~~~~-=-:~~~-----~~~~---- --~~ ~~~-- --~~~~~ ---~~~~~-- -~~ ~~~ _L_ :~~~~J _:~~~~--_:: ~ ~ ~- __ :~~~~- __ : ~ ~:~-- _: ~~ ~~------: :~~~-
The control of coyote, fox and beaver account for about 72% of our program expenditures (see table 2). Control of these three species Is usually handled directly by our Animal Damage Control staff. The nature of these animals' habits and the serious problems they cause farmers and ranchers require us to uti I ize our profess I ona I stat t in order to bring about a quick solution to the problem. A large proportion of what we consider nuisance animal problems are handled by an extension approach. These problems are caused by animals such as raccoon, skunk, mink and badger. With the exception of skunk rabies, the nature of these types of complaints are not considered as serious. Agricultural or property losses are usually not of any large amount. The nature or habits of these types of animals are such that with some minor Instruction and minimal assistance, landowners can usually solve the problems themselves.
Tab I e 2 .--Breakdown of program actfv lty and expenditure levels for FY '86.
9
N•ber Anl1118ls Species of O.plalnts Taken
Coyote 729 2, 750 Beaver 245 551 Fox 68 624 Badger 29 39 Raccoon 52 163 Skunk ___8..4 ___J__b
TOTAL 1,226 4,203
.b!.l.Ld~ $13,789
Ag. Crops $197,103
EXPENDIIUREIACTIYIJY
Residenti~Llndustrlai $7,870
lli.e..s:to.c k $453,546
Forest/Range $59,123
l::l.e.a I th/ Sat ety $10,989

The state supervised Animal Damage Control Program receives funding from three sources. In 1983 the state legislature passed a Jaw which establ !shed two sources of state revenue. A livestock census for each county In the state Is taken every four years. Based on t~is census, each county appropriates, from Its general fund, a sum equal to 4 cents on each head of cattle and 12 cents on each head of sheep within that county. This Is deposited semiannual Jy (June, November) Into an Animal Damage Control fund. This Is matched equally dol Jar for dol Jar by the Department of Game, Fish and Parks. The department's contributions are made from wlldl If~ funds generated through the sale of hunting I lcenses. The third source of revenue Is contributed by the U.S. Department of Agriculture, APHIS ADC. In 1976, Game, Fish and Parks entered Into a cooperative agreement with U.S. Fish and Wlldl lfe Service. In this agreement Game, Fish and Parks would supervise the Animal Damage Control Program within the framework of federal guldel lnes. The servIce wou I d provIde for 60~ of the program costs up to a maximum of three hundred thousand dol Iars ($300,000). On December 19, 1985 the federal Animal Damage Control duties were transferred from the Department of Interior, U.S. Fish and Wildt lfe Service to the U.S. Department of Agriculture, Animal Plant Health Inspection Service. The agreement was renegotiated with APHIS In 1986 and we continue operations under this current agreement.
This past fiscal year (July 1, 1985- June 30, 1986), revenue sources were as foJJQts; county general funds, $247,000, wildlife funds $247,000 and federal funds $300,000. Our current funding structure at lows us to provide services to every tax paying citizen In South Dakota. Each taxpayer and each sportsman who purchases a huntIng I I cense has a part In supporting the state Animal Damage Control program. We feel this funding arrangement Is not on I y unIque but probably the most appropriately distributed of any Animal Damage Control program currently conducted.
On July 1, 1986, we began to computerize alI field reports. This Is the first step In the development of a cost accountabl I lty program for each coun.ty w lth in the state. We currently have the capabll lty to provide Information, within minutes, as to man-hours spent, agriculture resource Joss, species causing the Joss, landowners name and dates of service provided for each county or trapper district. This Information, when ful Jy developed, wll I be essential In justification of continued county participation In funding the program.
10
Sheep grQiers have organ I zed themselves In an effort to assist In the state's predator control program. They have formed eight predator control districts. Seven of these districts are west of the Missouri River and one east river. They have set an assessment on sheep ranging from 5 cents to 25 cents per head. Funds collected from this assessment are used to supplement the program In several ways. Private aerial hunters are hired to hunt fox and coyotes In problem areas. Special types of equipment are purchased for state extension trappers to use In their programs. During dennlng season private trappers are often hired by the districts to assist In dennlng operations. AI I funds col Jected through the assessed surtax are under the control of the district board of directors to be spent within the dIstrIct In whIch they were co I I ected.
Big game animals such as elk and deer can cause extensive damage to livestock feed supplies during a long harsh winter. Once snow covers range forage, these animals wll I bunch and move In on hay stacks and corn plies. Much of the hay supply is spoiled by deer defecating and urinating on the feed. When situations such as this occur, Game, Fish and Parks conservation officers respond by providing feed for the deer or elk, mater I at s for fencIng 1 lvestock feed supplies or I lvestock feed to short stop these an I mal s.
U.S. Department of Agriculture, APHIS ADC has a very Important role In the State Animal Damage Control Program. In addition to providing cooperative funding for the Game, Fish and Parks state program, this agency Is responsible for control I lng damage caused by migratory birds and waterfowl. The agency oversees alI prairie dog control operations that are conducted on the various Indian reservations, including coordination of ferret surveys, monitoring bait qual lty and appl !cation rates and making various procedural recommendations to Improve control success. Technical assistance Is provided other state and federal agencies In resolving animal damage problems.
The South Dakota Department of Agriculture has a variety of responslbll ltles that contribute to the Animal Damage Control Program. The agency has the regulatory authority over the registration, distribution and use of restricted use pesticides. The department coordinates the activities of at I county weed and pest boards and Is the state enforcement agency for all weed and pest control laws. Another function of the State Agriculture Department is the operation of the state bait plant. This facti lty formulates and distributes a variety of toxic grain baits used in control I ing rodent populations within the

state. To provide far the avallabll lty of good quality bait at a competitive price Is the goal of this facll lty. Approximately 1,250,000 pounds of bait has been formulated and distributed from this plant between 1980 and 1986.
The secretary of Agriculture and another designee from that agency and the secretary of Game, Fish and Parks and his designee form an Animal Damage Control Review Committee. Their responslbll lty Is to establIsh goals and program priorities for the Animal Damage Control Section.
The U.S. Forest Service manages a major portion of publ lc use land In South Dakota. The Nebraska National Forest unit manages most of the forest lands outside of the Black Hil Is National Forest. These lands are managed for mu I tl pie use, however, I lvestock grazIng Is the primary use. Regulated grazing Is allowed under a permit system. In the mid 1970's prairie dog populations began to erupt on some of the Nebraska National Forest lands. The prairie dog population was beginning to destroy grasses necessary for I ivestock grazing. This enlarging prairie dog population soon spread to adjoining private land. The decision to address the problem was made In late 1977 and early 1978. A state law was passed during the 1978 legislative session which made Game, Fish and Parks responsible for control I ing the prairie dogs on private land adjacent to public land. This addressed the encroachment problem of prairie dogs coming off adjoining Forest Service land. A joint control program was Initiated by the Forest Service and Game, Fish and Parks Animal Damage Control Unit In 1978. By the end of the control season In the fal I of 1983, the prairie dog problem had been reduced to a mal ntenance I evel. In alI 42,340 acres of forest land and 14,250 acres of private land had been control led. Because of excel lent coordination the program was not only successful but much less costly than It may have been. Coordination assured complete control and e I I m I nated the poss I b I I i ty of continued prairie dog migration from uncontrolled areas to areas having been treated.
11
During this same time, a massive program was being planned and Initiated on the Pine Ridge Indian Reservation. Prel lmlnary estimates Indicated that prairie dogs covered an area of more than 300,000 acres on the reservation. It was by far the most serious problem in the state. Since the reservation bordered a large portion of the area that was being control led by the Forest Service and Game, Fish and Parks, it became apparent that coordination with the Pine Ridge program was necessary. Annual coordination meetings were established at which time plans for the upcoming year were formulated. Participants of these meetings Included, Bureau of Indian AffaIrs, PIne Ridge Reservati on, Rosebud Reservation, Cheyenne River Reservation, U.S. Department of Agriculture, U.S. Forest Service, Bureau of Land Management, South Dakota Department of Agriculture and Department of Game, Fish and Parks.
In 1983, PIne Ridge embarked on what was cal Jed "The Five Year Plan". This plan cal Jed for the complete control of prairie dogs on the reservation and Implementation of range renovation measures. The program was a massive undertaking but turned out to be a tremendous success. With the treatment of about 11,000 acres In 1987, along with some mop-up efforts, the prairie dogs on the reservation should be at a management level. Range renovation Is underway through such measures as deferred grazing, fencing and I lvestock water distribution. Grazing land that produced nothing more than cactus just a few years ago Is now responding with grass. With renewed emphasis on range management this land wll 1
once again produce as It once did.
What we have learned In South Dakota Is that coordination and cooperation between governmental units, professional agricultural and wll dl ife organizations and I andowners results In a very successful Animal Damage Control program. However, this success doesn't come easy. It takes a Jot of time and effort from alI cooperators to cause a program 1 Ike this to enjoy the staunch support of the beneficiaries. This support from these people, even In the face of adversity, makes the effort worthwhile and makes you feel good about yourself and the people you work with.

ADC in the U.S. Department of Agriculture1
Gerald J. Fichtner2
ADC transferred to the U.S. Department of Agriculture by Public Law 99-190. Parameters of ADC in USDA are that the program is biologically sound, environmentally acceptable, and economically feasible. Major program components are cooperative operational control, education and information, and research. The National Animal Damage Control Advisory Committee is being formed. The American Society for Testing and Materials is helping on research priorities. A line-staff organization has been put in place within the Animal and Plant Health Inspection Service in USDA.
INTRODUCTION
I'm most pleased to join you today to talk about national perspectives on animal damage control in the U.S. Department of Agriculture. As you know, USDA has only recently acquired the ADC program from the Interior Department. But the program had its beginnings at USDA, and we're very glad to have it back after a 46-year absence. ADC is alive and doing very well under the auspices of USDA's Animal and Plant Health Inspection Service. I welcome this challenge to work with you and our cooperators in animal damage control.
I've spent most of my working career in USDA's Animal Health Programs--first with Agricultural Research Service and then with APHIS after it carne into being in 1971. APHIS has its roots in the old Bureau of Animal Industry created in 1884 to combat serious animal disease outbreaks.
It was also in the 1880's that USDA first began studies to control agricultural losses caused by rcdents, birds add other wildlife. The ADC program, as we know it, carne into being with passage of the 1931 Animal Damage Control Act. Eight years later, it was transferred to Interior as part of a general realignment of agency functions during Franklin Roosevelt's era.
In recent yean~, however, it became increasingly important to the agricultural community that the ADC pro3rarn's mission should be directed towards
lpaper presented at the Eighth Great Plains Wildlife Damage Control Workshop, Howard Johnson's, Rapid City, S.D., April 28-30, 1987.
2Gerald J. Fichtner, Deputy Administrator .. Animal Damage Control, APHIS, USDA, Washington, D.C.
12
protecting U.S. Agriculture, and it was returned to USDA by Public Law 99-190 in December 1985. By April 1986, transfer of all personnel and resources had been effectively completEd.
Few would deny that depredating animals--such as blackbirds, rodents and coyotes--still present a serious threat to agricultural production. Figures developed through various studies show predators stilJ kill significant numbers of lambs born in the United States. Blackbirds, starlings and migratory waterfowl are causing increasingly significant damage to crops such as corn, small grains, rice, sunflowers, fruits and vegetables. Rodents also darnpge crops and pastures and chew up huge volumes of stored grains.
ADC is already fittinb in very well with the overall APHIS mission of "protecting American agriculture." It has become a third major program area of the Agency, the other two being Plant Protection and Quarantin~ an~ Veterinary Services.
SOME GUIDING PRINCIPLES OF APHIS
All three major programs of APHIS are dedicated to protecting crops and livestock from pests or disease, and all three involve cooperative working relationships and cost-sharing with States and the agricultural community.
Incidentally, I'm pleased to report that four Eastern States have entered into cooperative agreements with USDA. This means additional resources corning into the program in those StatES·
Unlike VS and PPQ programs, ADC is not a regulatory program. It's also different in that it has its own methods development and research facility. This gives APHIS a management role in research it hasn't had before. Except in the

area of field trials, Agricultural Research Service handles all such matters for our other programs.
All three APHIS programs are based on sound research and valid scientific criteria. I personally believe that continued research is vital to an effective and efficient ADC program in the future.
Let's turn our attention now to how USDA, APHIS, plans to manage this program. First, be assured that we're determined to implement an ADC program that is both cooperative and beneficial.
When I say "cooperative," I mean cooperative at the State, county, farm community, and individual rancher levels. We inherited more than 700 cooperative agreements from Fish and Wildlife Service. APHIS has no intention of taking over jobs already being well-handled at the State, county, and community levels. Program structures within each State will remain largely intact.
When I say "beneficial," I mean the program provides a direct public service to:
raisers of sheep, goats, poultry, hogs, and cattle
operators of gtdnaries and feedlots
growers of grains, forage, fruit, nuts, flowers, melons and timber.
In other words, our emphasis in the future
will be on protecting agriculture. You'll not see us initiating urban ADC programs; but we will cooperative, as appropriate, with ongoing urban efforts that are funded at State or local levels. Such cooperation usually takes the form of technical or advisory assistance.
Of course, we'll always respond to emergencies or situations where public safety is at risk and USDA-ADC expertise is needed to help overcome dangerous situations. And we'll continue to respond, as appropriate, to Federal or State efforts to protect endangered species.
All program efforts, however, must pass the scrutiny of being biologically sound, economically feasible, and environmentally acceptable. Applicable statutes are the National Environmental Policy Act; the Federal Insecticide, Fungicide and Rodenticide Act; and the Endangered Species Act. Also, USDA-APHis; administers various humane laws as they apply to warm-blooded animals, so we're sensitive to public concerns in that area.
The ACT program under APHIS cC'nsists of the following components:
a cooperative operational program that's responsive to needs
an applied research program that supports the operational program
13
an information/education program based on both APHIS initiatives and field services in cooperation with the Extension Service.
The Extension Service has been involved in ADC since 1914. Its aim is to help landowners and agricultural managers help themselves. Empha-sis is on prevention and control--stressing the most practical, safe, effective and humane procedures available. Extension programs are implemented primarily through county extension agents who provide demonstrations and group training for producers. It is anticipated that ADC will become more pro-active in the development and dissemination of training and informational materials structured for use witt modern day audio-visual materials.
ORGANIZATION
At the national level, ADC is headed by a Deputy Administrator's office with a small staff in downtown Washington, D.C. Our responsibility is to set program priorities and goals, help in acquiring resources for program implementation, and marshall a coalition of support necessary for program continuation and growth.
The program also has a National Technical Support Staff in nearby Hyattsville, Maryland. This small staff, under a director, has the responsibility of assuring the program's overall technical excellence.
As part of a streamlining effort, APHIS has organized the cooperative operational program under two regional directors. The program used to function under seven regional directors of Interior's Fish and Wildlife Service.
Our Eastern Director, responsible for 31 States, is headquartered in Brentwood, Tennessee. Our Western Director, responsible for 19 States, is headquartered in Denver. Primary responsibility for conduct of field program activities and management of field resources is delegated to the Regional Directors.
There's an ADC director for each State with some of the larger States having a number of district offices. In New England, however, there's one d~rector for three of the small States.
Regional and State offices and other field stations now receive administrative support services from our APHIS Field Servicing Office in Minneapolis. In theory, this allows them to concentrate their energies on the job of program management. Although therE are several advantages to this system, a complete review is needed to make resource management at the regional and State levels more effective.
The Western regional headquarters shares facilities with the Denver Wildlife Research Center, now under APHIS. Thi.s facility is the hub of most of the ADC applied research pursued in this country and several overseas locations.

The Center's nearly 100 scientists seek practical solutions to field problems:
they explore the use of repellents, attractants, surfactants, and biological controls such as reproductive inhibitors
they investigate coyote behavior and predator-prey population dynamics
they examine toxicants, developing guidelines for their safe use in the natural environment and performing studies needed for EPA registration.
One of their most perplexing projects has to do with finding a safe toxicant for blackbirds that is environmentally safe. But don't expect instant results.
We're now in the process of reassessing our ADC research priorities. You'll see more effort going into applied research. We must put more effective tools into the hands of the operational side of the program.
The ADC Supply Depot at Pocatello, Idaho, continues to formulate and distribute baits, traps, and toxicant supplies needed by the ADC program. The director of this facility reports to the director of the National Technical Support Staff in Hyattsville, Maryland.
SPECIAL PROJECTS
We've begun an internal training program to increase the professional and managerial competence of all ADC personnel in a variety of program activities. Our initial efforts will be concentrating on:
technical training
executive/managerial and supervisory training
techniques to enhance the exchange of knowledge between regions, States, and cooperators and the agricultural community
Recognizing a general need for highly trained staff, our Hanagement Team has recommended an intensive two-year program to train newly recruited employees for eventual supervisory positions.
The first class of 20 highly qualified men and women will begin training under specialized individual development plans. These plans are designed to give each trainee a broad range of technical and supervisory training in both the Eastern and Western Regions, according to the trainee's prior professional background and needs.
14
INFORMATION
We also plan to design, develop and implement a nationwide automated data systEm that'll greatly expand our data base related to ADC. Specific needs are now being assessed before proceeding with the purchase and modification of computer software to meet our unique requirements. Once in place, this computer system should become an invaluable tool for making management decisions and for the rapid dissemination of information. The system will be designed to interface with other important data bases within USDA.
SPECIAL GROUPS
To assist in program management, a Management Team for ADC has been developed. Members include the Deputy Administrator, Associate and Assistant Deputy AdministratorE, the two Regional Directors, and Directors of the Denver Wildlife Research Center and the National Technical Support Staff.
This Team takes a direct hand in recommending policy and direction for ADC operations, research, education, and related matters and, hopefully, become stakeholders in program and resource management policy.
At the Department level, an Intra-departmental Policy Committee has been formed. Its members include top officials of Agricultural Research Service, Cooperative State Research Service, Economic Research Service, Extension Ser~ice, Forest Service, and APHIS. Our APHIS Administrator is Chairman. This Committee helps delimit the roles of various USDA agencies in ADC, and it influences the direction of ADC's cooperative operational programs and research.
Recently, the USDA intra-agency committee asked the American Society for Testing and Materials to assist in rEassessing the program's research priorities. ASTM has agreed to review past, present, and proposed ADC-related research. It will prepare a summary review and provide us with recommendations on a continuing basis. To accomplish this, ASTM has established an ADC Task Force Group. The Group will have broad representation from the scientific community.
Of great importance is the recent approval to establish a Secretary's Advisory Committee on ADC with representatives from environmental groups, agricultural groups, and the academic-scientific community. Now that the preliminaries are completed, we can begin selecting about 20 such members. With one exception, members will come from private or non-Federal organizations. Congress has indicated that Fish and Wildlife Service should also be represented. This group will advise the Secretary of Agriculture on ADC operational and research questions and--more importantly--serve as a public forum.
There will be no mysteries about what we're doing or how we're going about it.

CONCLUSION
In summary, USDA has inherited an ADC program which has several good things going, including a clear mission, personnel who are competent and have high morale and good cooperative relationships with Federal, State and industry. We're taking steps to enhance:
1. a high level of professional performance,
15
2. increase information, and
3. seek outside expertise.
In a few years, I hope that you and the public you serve will have every reason to be proud of the legacy you built as part of APHIS's role of "protecting American agriculture."

Current and Future Status of Rodenticides and Predacides1
Steve Palmateer2
I appreciate the opportunity to convey the current and future status of rodenticides and predacides at this workshop. According to the computer, the Agency has 2,888 products classified as vertebrate control agents. The Federal Insecticide, Fungicide, and Rodenticide Act tends to clump all vertebrate pesticides as rodenticides. This includes fish toxicants such as TFM; bird toxicants and repellents such as Starlicide and Avitrol; dog repellents such as lemongrass oil; bat toxicants and repellents such as naphthalene; commensal rodent toxicants such as warfarin, diphacinone, bromadiolone, brodifacoum, and red squill; field use rodenticides for many species (e.g., prairie dogs, ground squirrels) using pesticides such as 1080, strychnine, zinc phosphide; predacides such as 1080 and sodium cyanide; and animal browsing repellents such as thiram and putrescent whole egg solids.
I will not attempt to list all the currently registered vertebrate toxicants as Ray Matheny accomplished this task in 1980 at the Ninth Vertebrate Pest Conference in Fresno, California. The only major changes to Ray Matheny's list are the deletion of DDT as a bat toxicant (voluntarily cancelled by the Centers for Disease Control in March 1987), and the addition of Bromathalin, alphachlorohydrin, bromadiolone, brodifacoum and cholecalciferol.
The status of Fumarin is uncertain at this time as the only manufacturer of technical Fumarin has declined to support the registration with the necessary generic data. Therefore, the generic data requirements will be the responsibility of the registrants of end-use products.
Approximately 200 of the Warfarin/Prolin registrants successfully satisfied the data call-in issued in October of 1981. At this writing there are two registrants who have satisfied the generic data requirements for Warfarin, and six more companies have repackaged these products.
In the next £iscal year there are no Registration Standards scheduled primarily for vertebrate pesticides. However, there are two Standards that have been issued recently that have some vertebrate claims on the label (Mesurol and Lindane).
1 Paper presented at the 8th Great Plains
Damage Control Workshop. (Rapid City, SD, April 28-30~ 1987).
Steve Palmateer is a Biologist, Environmental Protection Agency, Washington, DC.
16
PREDACIDES
At the present time the Agency has only one active experimental use permit (EUP) for a predacide. This is a 1080-treated single dose bait for the control of the Arctic Fox on Kiska Island, Alaska. The EUP allows for up to 50,000 lOBOtreated meat baits to be broadcast on the outer perimeter of the 69,000 acre island during the winter, when the fox is stressed for food. The artificially introduced fox is a predator of the Aleutian Canada Goose and has completely eradicated all of the geese from the Island. The Department of the Interior felt it could not reintroduce the goose until the fox was completely eliminated from the Island. The experiment apparently was a success, as during the January 1987 census there were no foxes detected. The EUP allowed for an additional 50,000 1080 baits to be applied if any foxes had been detected. When the EUP was proposed by Interior it was their expressed intention to use the information gleaned from this experiment to support a section 3 application for registration of a 1080 bait to control the Arctic fox on more than 30 other islands in the Aleutian chain.
The EUP for single dose 1080 baits for coyotes that prey on livestock has expired. A final report is due in May 1987.
The agency has three pending "me-too" registration applications for the Livestock Protection Collar (Montana Department of Livestock, Wyoming Department of Agriculture, and Rancher's Supply of Alpine, Texas). The Wyoming and Montana applications are pending completion of final administrative details. Rancher's Supply requires revised labels and a monitoring plan.
The administrative Law Judge has not issued a decision on the use of the M-44 on National Wildlife Refuges to protect endangered species. Since there was a restriction placed by an Administrative Law Judge against the use of M-44's on National Wildlife Refuges, a Subpart D hearing was required to modify that order. When the Judge makes a Recommended Decision, the final decision has to be made by the Administrator. Two State Conservation Departments have also expressed interest in using the M-44 to control coyotes that prey on game species. This use will also require a Subpart D hearing.
The Agency has pending applications for registration from the Montana Department of Livestock and the Wyoming Department of Agriculture for labels for strychnine-treated eggs to control rabid skunks. Since this is a cancelled use for strychnine, a Subpart D hearing was required.

Before the Administrator will reconsider a cancellation order he must determine that ( 1) the applicant has submitted substantial new evidence that may materially affect the cancellation order which was not available to the Administrator at the time of cancellation, and (2) such evidence could not, through the exercise of due diligence, have been discovered by the parties to the cancellation or suspension proceeding prior to the issuance of the final order. The Administrator determined that Wyoming and Montana did submit substantial new evidence and hearings were held in Billings, Montana and Washington, DC. A decision has not yet been reached in that case.
Montana and Wyoming have also committed themselves to supply toxicology and wildlife safety data to the Agency to support their applications for registration.
FIELD USE RODENTICIDES
It is my perception that the people attending this workshop are very interested in the data call-ins on zinc phosphide, 1060, and strychnine, and I will quickly outline the status of these pesticides.
In June 1982, the Agency issued the Zinc Phosphide Registration Standard which also included a data call-in. In September 1984, the Agency suspended most of the section 3 registrations, including all those with prairie dog claims, for failure to satisfy the data requirements. It is important to note that at this time the Agency had suspended the use of strychnine for prairie dog control. Therefore, only Colorado had a vertebrate pesticide (1080) for prairie dog control. Through the administrative hearing process, the Agency lifted the zinc phosphide suspensions of products with "prairie dog use" only claims. Since that time many of the zinc phosphide end-use products have successfully completed all the data requirements and have been reregistered.
However, none of the technical zinc phosphide manufacturers have satisfied all the data requirements and are subject to suspension. The main problem has been the whole body residue test and acute toxicity to freshwater fish.
1080
In November 1985, the Agency issued a call-in of data for 1080 for all intrastate products and the one Oregon special local need product. California responded with 36 applications for registration and Colorado with two. The county of Klamath Falls was not required to submit a section 3 application but was required to commit to supplying the data. Klamath Falls County did agree to supply the data and submitted revised labels. Nevada declined to respond, and its intrastate products were administratively withdrawn.
1 7
In December 1986, both California and Colorado submitted data to support their pending registrations. At this writing the data are being reviewed, and a decision is pending completion of this data review.
STRYCHNINE
In October 1983, the agency issued notice that it was going to cancel many uses of strychnine, including Microtus and all species of prairie dogs. This notice (FR Vol. 48, No. 203) was mailed to all strychnine registrants and required many label modifications and served notice that ground squirrel data would be called in.
Several registrants and other persons felt they were adversely affected by the cancellation notice and requested a hearing. After a long protracted negotiated settlement, the Agency revised the prairie dog and Microtus cancellation. A notice of the revised cancellation notice and required label modifications was published in the Federal Register on March 4, 1987 (FR Vol. 52, No. 42). The Agency will mail a copy of this notice to all strychnine registrants in the near future. At this time the Agency is being sued by the Defenders of Wildlife, et al., to cancel all uses of strychnine. The major reason being offered for the lawsuit is that the Agency is not carefully following the mandates of the Endangered Species Act.
The Agency called in the strychnine wildlife safety-efficacy data in August 1984 and issued a general data call-in for all strychnine products in October 1986. In addition to requiring the general product chemistry, residue chemistry, environmental fate, and toxicology, the Agency requested considerable efficacy and wildlife safety data. It is hoped that much of the strychnine data being generated to support the registration of the pending applications for strychnine-treated eggs to control rabid skunks will be useful for some of the generic strychnine data. This is also dependent on whether the owners of these data will allow its use by other registrants.
As for the future, there are several new chemicals pending with the Agency which are slated for rodent control. While most of these new rodenticides are being proposed for commensal rodents and other vertebrate pests for use in and around homes, it is expected that they will eventually be used for field rodents. I cannot elaborate on the exact nature of these new chemicals as they do not have patents at this time and the manufacturers are entitled to confidentiality.

Demography and Population Dynamics of Prairie Dogs1
2 3 4 John L. Hoogland , Diane4
K. Angell , James G. Daley , and Matthew C. Radcliffe
Abstract.--For the last 14 years, we have been studying the sociobiology, demography, and population dynamics of blacktailed prairie dogs (Cynomys ludovicianus) in Wind Cave National Park, South Dakota. Our study colony covers 6.6 hectares (16 acres) and has not expanded during the period of research; in late spring of each year the colony contains a mean + SD of 133 + 29 adults and yearlings and 81 + 33 juveniles. We have discovered four surprising aspects of the demography and populations dynamics of prairie dogs. (1) Mortality during the first year is approximately 50% for both sexes. Those males that survive the first year can live as long as 5 years, and females that survive the first year can live as long as 7 years. (2) Litter size ranges from 1 to 6, the mean + SD is 3.05 + 1.08, and the mode is 3. (3) Although individuals of both sexes usually defer first breeding until the second year, 9% of females and 3% of males first produce offspring as yearlings. (4) Infanticide is the major source of juvenile mortality, accounting for the partial or total demise of 51% of all litters born. In the most common type of infanticide, lactating females kill the unweaned offspring of their sisters and daughters.
INTRODUCTION
Black-tailed prairie dogs (Cynomys ludovicianus) are large (600-1200 grams), diurnal, colonial, harem-polygynous rodents of the squirrel family (Sciuridae) (King 1955; Koford 1958; Smith 1958; Tileston and Lechleitner 1966; Foltz and
1Paper presented at the Eighth Great
Plains Wildlife Damage Control Workship [Rapid City, South Dakota, April 28-30, 1987]2
John L. Hoogland is Assistant Professor of Wildlife Biology, Appalachian Environmental Labpratory, The University of· Ya3yland, Frostburg, MD.
Diane K. Angell is a graduate student in the Department of Biology, Brown
4University, Providence, RI. James G. Daley and Matthew C.
Radcliffe are graduate students at the Appalachian Environmental Laboratory, The University of Maryland, Frostburg, MD.
1 8
Hoogland 1981). At Wind Cave National Park, Hot Springs, South Dakota, prairie dogs breed in February and March, and juveniles first emerge from their natal burrows in May and June (King 1955; Hoogland and Foltz 1982). Colony residents live in contiguous family groups called coteries (King 1955), which typically contain one adult c~ 2 years old) male, 3-4 adult females, and several yearling and juvenile offspring. Coterie members restrict all foraging and other activities to a clearly defined, vigorously defended coterie territory. Litter size, juvenile growth rate, survivorship during the first year, age of first reproduction, and pregnancy rate all seem to be affected by the availability of food (Garrett et al. 1982). Estrous females usually copulate exclusively with the adult male in the home coterie (Hoogland and Foltz 1982), and inbreeding is rare (Hoogland 1982a; Foltz and Hoogland 1983). Females within a colony synchronize their breeding, and synchronization within coteries is also evident (Hoogland 198la). The mean+ SD gestation period for prairie dogs is 34.8 + 0.7 days (N = 32; range= 34-37), and the mean+ SD time between parturition and the first emergence of weaned juveniles is 43.4 ± 3.5 days (N = 17; range =
38-50) (Hoogland 1985a).

Disadvantages of coloniality for individual prairie dogs include increased aggression and increased ectoparasitism by fleas and lice (Hoogland 1979a). To offset these costs, there may be only one benefit of prairie dog coloniality: increased protection from predators such as coyotes (Canis latrans), badgers (Taxidea taxus), bobcats (Lynx rufus), golden eagles (Aquila chrysaetos), prairie falcons (Falco mexicanus), and various buteo hawks (Buteo sp~King 1955; Hoogland 198la). Prairie dogs in large colonies not only detect predators more quickly than do dogs in smaller colonies, but also spend less time scanning for predators (Hoogland 1979b, 198la). The dense coloniality of prairie dogs which has evolved in response to most predators has evidently left the dogs especially vulnerable to another predator: the black-footed ferret (Mustela nigripes) (Hoogland 198la, 1982b). Ferrets do not prey heavily on prairie dogs now since the ferrets are so rare, but may have been important in regulating prairie dog numbers for most of the prairie dogs' evolutionary history (Hoogland 1982b).
Nepotism, the preferential treatment of genetic relatives (Alexander 1974; Sherman 1980), is pronounced among prairie dogs. For example, individuals are less likely to fight with, and more likely to interact amicably with, kin than with nankin (Hoogland 198lb; Hoogland 1986). Further, prairie dogs with living kin within earshot are more likely to give an alarm call in response to a predator than are dogs without such kin (Hoogland 1983a).
Here we report our findings that are relevant to the demography and population dynamics of prairie dogs.
METHODS
Our study colony, inhabited for at least the last 35 years and possibly much longer, is approximately 500 meters x 130 meters (6.6 hectares). Most of this colony is surrounded by trees, but there is room for potential expansion at the south end. The colony is gridded into 15.2 m x 15.2 m squares with garden stakes, and burrows are marked with Ritchey Cattle Eartags mounted on clothesline wire (Hoogland 1977). The nearest other colony to the study colony is approximately 0.7 kilometers away.
For permanent identification, pra1r1e dogs are marked in the ear with numbered National Band and Tag Fingerling Tags (Hoogland 1979a). Each eartag usually remains with the dog until its death, but tags are sometimes lost during vicious fights. For this reason, one numbered tag is placed in each ear; since 1975, only five dogs, including all four offspring from one litter, have lost both eartags. Using prairie dogs of known age for comparison, we have recently devised a method for placing individual dogs of unknown age into one of three age classes (Hoogland and Hutter 1987). Through eartagging, observation, and an electrophoretic analysis of blood samples, maternal, sibling, and
19
putative paternal genetic relationships have been determined for all young weaned at the study colony since 1975 (968 young from 317 litters) (Foltz and Hoogland 1981; Hoogland and Foltz 1982; Hoogland 1986).
For visual identification from a distance, we use Nyanzol-D fur dye from J. Belmar Inc (King 1955; Hoogland 1979a). Males are marked with numbers under 50, and females are marked either with numbers above 50 or with gross markers such as stripes and blotches. Dogs marked with Nyanzol-D can be identified with binoculars from distances over 300 meters.
Observations are made from three 5-meter high observation towers positioned at the periphery of the study colony. From before the first copulation in mid-February until the last juvenile has been eartagged and colormarked in June, all three towers are manned from early in the morning before any dogs emerge until late in the afternoon when all dogs have immerged for the night.
RESULTS
Variation in population size. --The number of adults and yearlings in April at the study colony has ranged from a low of 92 in 1985 to a high of 216 in 1975, with a mean+ SD of 132.5 + 29.3. The number of weaned juve~iles has ranged from a low of 4 in 1975 to a high of 133 in 1986, with a mean± SD of 80.7 + 33.0. As expected, the number of weaned juveniles seems to vary inversely with the number of adults and yearlings. In other words, prairie dogs at the study colony typically produce more offspring when colony size (the number of adults and yearlings) is low, and fewer offspring when colony size is high (Hoogland, in preparation). Within a coterie, the number of weaned offspring also varies inversely with the number of adults and yearlings (Hoogland 198lb).
Variation in physical area of colony.--Even though the number of prairie dogs foraging aboveground at the study colony has ranged from 92 in April of 1985 to 252 in May of 1981, the physical area occupied by the dogs has remained EXACTLY THE SAME for fourteen c.onsecutive years. Further, despite dramatic fluctuations in the number of dogs within a coterie, most of the coterie territories at the study colony have remained exactly the same for fourteen consecutive years. Increases in the size of the home coterie territory usually occur only after expansion into an adjacent coterie territory in which all the females have disappeared.
Variation in number of burrow entrances.--When we mapped the study colony in May of 1975, there were 1,591 burrow entrances (Hoogland 1977). While the prairie dogs typically excavate several new burrow systems each year, others disappear from lack of use. The result is that the number of burrow entrances has remained remarkably constant, varying by fewer than 10 entrances from one year to the next (Hoogland, unpublished).

Longevity.--For males at the study colony, survivorship during the first year has ranged from 13/36 = 36% in 1984 to 34/43 = 79% in 1980, with a mean + SD of 51% + 16%. Males that survive the first year commonly live to be 3 or 4. Only 9 males have lived as long as 5 years.
For females at the study colony, survivorship during the first year has ranged from 13/41 = 32% in 1978 to 27/39 = 69% in 1980, with a mean+ SD of 56% + 13%. Females that survive the first year commonly live to be 4, 5, or even 6. Only 12 females have lived as long as 7 years.
Age of first reproduction.--ln general, individuals of both sexes do not first reproduce until February-March of the second year (King 1955; Hoogland and Foltz 1982). Although approximately 40% of females first copulate as yearlings, only 20 /213 = 9% of yearling females have successfully weaned a litter. Many females do not first wean a litter until 3 or 4 years old. Mainly because of infanticide (see below), the mean+ SD percentage of adult females that weans a litter each year is only 47% + 14% (range= 30% in 1976 to 73% in 1986). Only-7/216 = 3% of yearling males have successfully sired offspring.
Litter size.--Litter size at first juvenile emergence among prairie dogs at the study colony ranges from 1 to 6, with a mean ± SD of 3.05 ± 1.08 (N = 311 litters); we have no information about litter size at birth. The most common litter sizes at first juvenile emergence are 2 (19%), 3 (38%), and 4 (26%). As predicted from ecological theory (Williams 1957; Sherman and Morton 1984), the relationship between female age and litter size at first juvenile emergence is curvilinear: litter sizes of 3- and 4-year old females are larger than litter sizes of younger and older females (Hoogland, in preparation). The relationship between male reproductive success and age may also be curvilinear.
Variation in sex ratio at weaning.--For all young weaned at the study colony each year~ the percent of males has varied from 31/74 = 42% in 1985 to 55/93 = 59% in 1983, with a mean + SD of 53% + 6%. We have no information about the sex ratio at birth.
Dispersal and immigration.--In general, pra1r1e dog females at our study colony remain in the natal coterie territory for their entire lifetimes (Hoogland 1982a; see also Garrett 1982). Those rare females that do disperse usually leave the study colony entirely.· Only 3 females have successfully transferred from the natal coterie into another coterie within the study colony. Since 1975, only 5 females have immigrated into the study colony from somewhere on the outside and then weaned offspring. None of these females was recruited into an established coterie territory. Three of these immigrants lived at the periphery of the study colony, and the other two evicted females from established coterie territories and then moved into these vacated territories.
20
Yearling males at the study colony typically disperse from the natal coterie territory approximately 12-14 months after weaning (Hoogland 1982a; seealso Garrett 1982). These young males sometimes disperse to other coteries within the study colony, but other times leave the study colony entirely in search of another colony. Occasionally males remain in the natal coterie territory for a second year: almost invariably, these males delay sexual maturity until the third year. Although the peak of dispersal by yearling males occurs in May, June and July, a second peak occurs in February, just before the onset of the breeding season. Older males also disperse after one or two years in the same coterie, probably to avoid inbreeding with their daughters (Hoogland 1982a). Whereas younger males disperse both intra- and inter- colonially, older males seem to restrict almost all of their movements to the study colony, and most of these older males disperse to adjacent coteries. Since 1975, only 14 males have immigrated into the study colony from somewhere on the outside and successfully sired offspring there.
Infanticide.--Infanticide, the killing of juvenile conspecifics (Sherman 1981; Hausfater and Hrdy 1984), is the major source of preweaning and postweaning juvenile mortality at the study colony, accounting for the total or partial demise of 51% of all litters born. Infanticide occurs in four different contexts (Hoogland 1985a, in preparation), as summarized below.
In Type I infanticide, female immigrants from somehere on the outside move into an established coterie territory in late spring or early summer, evict the resident females there, and then kill the recently weaned offspring. This is the rarest type of infanticide, mainly because female immigrants are so rare, and accounts for the elimination of 1% of all litters born.
In Type II infanticide, females abandon their offspring shortly after parturition and allow other coterie members to kill and cannibalize them. The details and possible reasons are poorly understood for Type II infanticide, which accounts for the elimination of 13% of all litters born.
As noted above, most dispersals by young males occur in May and June, just before or just after the weaning of juveniles. When a yearling male is successful in entering a new coterie. all the unweaned or weaned juveniles typically disappear within a few days. Male invaders presumably kill the juveniles that disappear (Type III infanticide): maimed carcasses were found aboveground after six invasions, and actual killings were observed twice. Type III infanticide accounts for the total or partial elimination of 7% of all litters born.
Type IV infanticide is the most extraordinary, since it involves the killing by lactating females of the offspring of close kin (mother, daughter, sister, aunt, niece, etc.) within the home coterie. Type IV infanticide is also the most common, accounting for the total or partial elimination of 30% of all litters born. Lactating females may kill

and cannibalize nondescendant juvenile kin in order to obtain sustenance necessary for the weaning of their own litters, or they may kill to remove future competitors from themselves and their offspring. Type IV and other types of infanticide observed at the study colony do not result merely from possible overcrowding, since infanticides were also observed at two other colonies at Wind Cave, both of which were young and expanding.
DISCUSSION
Here we have summarized those findings of our study that pertain to the demography and population dynamics of black-tailed prairie dogs at Wind Cave National Park, South Dakota. These findings have direct relevance to those situations in which management and control of prairie dogs might be considered necessary. To further investigate management of prairie dogs, one of us (Radcliffe) has initiated research to determine how quickly prairie dog colonies return to initial size after an artificial reduction of 90%. Another of us (Daley) has begun to examine the effects of colony size and artificial reduction on genetic variation within and between prairie dog colonies. All of us are continuing to investigate infanticide: if we can better understand why prairie dogs regularly kill 51% of all offspring born and those conditions which encourage such infanticide, then perhaps it will be possible to devise effective methods of management which capitalize on infanticide and which do not require shooting or poisoning.
LITERATURE CITED
Alexander, Richard D. 1974. The evolution of social behavior. Annual Review of Ecology and Systematics 5: 325-383.
Foltz, David W., and John L. Hoogland 1981. Analysis of the mating system of the blacktailed prairie dog (Cynomys ludovicianus) by likelihood of paternity. Journal of Mammalogy 62: 706-712.
Foltz, David W., and John L. Hoogland. 1983. Genetic evidence of outbreeding in the blacktailed prairie dog (Cynomys ludovicianus). Evolution 37: 273-281.
Garrett, Monte G. 1982. Dispersal of black-tailed prairie dogs (Cynomys ludovicianus) in Wind Cave National Park, South Dakota. M.S. thesis, Iowa State University, Ames, Iowa.
Garrett, Monte G., William L. Franklin, and John L. Hoogland. 1982. Demographic differences between an old and a new colony of black-tailed prairie dogs (Cynomys ludovicianus). American Midland Naturalist 108: 51-59.
Grady, Ronald M., and John L. Hoogland. 1986. Why do male prairie dogs (Cynomys ludovicianus) give a mating call? Animal Behaviour 34: 108-112.
21
Hausfater, Glen, and Sarah B. Hrdy, Editors. 1984. Infanticide. Aldine Publishers, Hawthorne, New York.
Hoogland, John L. 1977. The evolution of coloniality in white-tailed and black-tailed prairie dogs (Sciuridae: Cynomys leucurus and C. ludovicianus). Ph.D. dissertation, The University of Michigan, Ann Arbor, Michigan, xiii + 292 pages.
Hoogland, John L. 1979a. Aggression, ectoparasitism, and other costs of pra1r1e dog (Sciuridae: Cynomys spp.) coloniality. Behaviour 69: 1-35.
Hoogland, John L. 1979b. The effect of colony size on individual alertness of pra1r1e dogs (Sciuridae: Cynomys spp.). Animal Behaviour 27: 394-407.
Hoogland, John L. 198la. The evolution of coloniality in white-tailed and black-tailed prairie dogs (Sciuridae: Cynomys leucurus and C. ludovicianus). Ecology 62: 252-272.
Hoogland, John L. 198lb. Nepotism and cooperative breeding in the black-tailed prairie dog (Sciuridae: Cynomys ludovicianus). In: Richard D. Alexander and Donald W. Tinkle, editors. Natural Selection and Social Behavior. Chiron Press. Pages 283-310.
Hoogland, John L. 1982a. extreme inbreeding.
Prairie dogs avoid Science 215: 1639-1641.
Hoogland, John L. 1982b. The black-footed ferret and the evolution of prairie dog coloniality: reply to a comment by Powell. Ecology 63: 1968-1969.
Hoogland, John L. 1983a. Nepotism and alarm calling in the black-tailed prairie dog (Cynomys ludovicianus). Animal Behaviour 31: 472-479.
Hoogland, John L. 1983b. Black-tailed prairie dog coteries are cooperatively breeding units. American Naturalist 121: 275-280.
Hoogland, John L. 1985a. Infanticide in pra1r1e dogs: lactating females kill offspring of close kin. Science 230: 1037-1040.
Hoogland, John L. 1985b. Sociobiology of the black-tailed prairie dog (Sciuridae: Cynomys ludovicianus). National Geographic Society Research Reports 1978: 353-363.
Hoogland, John L. 1986. Nepotism in pra1r1e dogs varies with competition but not with kinship. Animal Behaviour 34: 263-270.

Hoogland, John L., and David W. Foltz. 1982. Variance in male and female reproductive success in a harem-polygynous mammal, the black-tailed prairie dog (Sciuridae: Cynomys ludovicianus). Behavioral Ecology and Sociobiology 11: 155-163.
Hoogland, John L., and Janice M. Hutter. 1987. Aging live prairie dogs from molar attrition. Journal of Wildlife Management, in press.
King, John A. 1955. Social behavior, social organization, and population dynamics in a black-tailed prairiedog town in the Black Hills of South Dakota. Contributions from the Laboratory of Vertebrate Biology of The University of Michigan 62: 1-123.
Koford, Carl B. 1958. and blue grama.
Prairie dogs, whitefaces, Wildlife Monographs 3: 1-78.
22
Sherman, Paul W. 1980. The meaning of nepotism. American Naturalist 116: 604-606.
Sherman, Paul W., and Martin L. Morton. 1984. Demography of Belding's ground squirrels. Ecology 65: 1617-1628.
Smith, Ronald E. 1958. Natural history of the prairie dog in Kansas. Miscellaneous Publications 16, Museum of Natural History of The University of Kansas, Lawrence, Kansas.
Tileston, J.V., and R.R. Lechleitner. 1966. Some comparisons of the black-tailed and whitetailed prairie dogs in north-central Colorado. American Midland Naturalist 75: 292-316.
Williams, George C. 1957. Pleiotropy, natural selection, and the evolution of senescence. Evolution 11: 398-411.

Control of Ecosystem Processes by Prairie Dogs and Other Grassland Herbivores1
James K. Detling2 and April D. Whicker3
Abstract.--Black-tailed pra1r1e dogs in the mixed-grass prairie at Wind Cave National Park, South Dakota, create habitat patches characterized by altered species composition, lower standing crops of plants, but higher forage quality. Native wildlife species such as bison, pronghorn, and elk preferentially feed on these prairie dog colonies and likely derive nutritional benefits from doing so.
INTRODUCTION
The impact of animals on ecosystem functioning received limited attention in older ecological literature. However, more recently, plant-animal interactions, particularly herbivory, have received widespread attention (Harper 1977, Crawley 1983, Strong et al. 1984). Herbivores in most ecosystems remove a very small amount (<10%) of plant production (Chew 1974), but in grass-lands, estimates of 30 to 50% removal of aboveground net primary production are common (Wiegert and Evans 1967, Lacey and Van Poollen 1981, McNaughton 1985). Although amount of plant production removal is an indication of the effect that animals may have, it does not fully explain the complex interactions that herbivores have with their environment. Herbivores can influence rates of primary production, nutrient cycling, structural
1Paper presented at the Eighth Great Plains Wildlife Damage Control Workshop. Rapid City, South Dakota. April 28-30, 1987.
Manuscript preparation was funded in part by NSF Grant No. BSR-84-06660.
2James K. Detling is Senior Research Scientist, Natural Resource Ecology Laboratory, and Associate Professor of Range Science, Colorado State University, Fort Collins, Colo.
3April D. Whicker is Research Associate, Natural Resource Ecology Laboratory, Colorado State University, Fort Collins, Colo.
23
change, and decomposition which, in turn, may affect behavior and nutritional ecology of other animals. Our research focuses on prairie dogs as native herbivores in grassland ecosystems, and also addresses some fundamental questions regarding herbivory.
Prairie dogs are often viewed as pests in western rangelands. As a result, much prairie dog research has focused on their potential as competitors with cattle (Koford 1958, Hansen and Gold 1977, O'Meilia et al. 1982, Collins et al. 1984, Uresk 1985). Such studies have described prairie dog diets and have indicated how their activities change composition of plant communities. Although there have been comprehensive studies on prairie dog behavior and ecology (Clark 1986), their role as herbivores in natural ecosystems has received little attention.
Our research has been conducted on black-tailed prairie dogs (Cynomys ludovicianus) in the mixed-grass prairie at Wind Cave National Park, South Dakota. We have studied structure and function of plant populations and communities on and off prairie dog colonies, and the influence of prairie dog activity on distribution, behavior, and community composition of such diverse animals as bison and nematodes. We have also measured prairie dog-induced changes in the physical environment. This review summarizes our work in a population, community, and ecosystem context.

PRAIRIE DOG-PLANT INTERACTIONS
Plant Population Parameters
Morphological and physiological changes often occur in intensively grazed plants. For example, plants grazed by domestic herbivores are often shorter and more prostrate than ungrazed individuals (Hickey 1961). Grazing-induced changes in morphology sometimes quickly disappear following release from grazing (Quinn and Miller 1967), or they may persist, indicating genetic differentiation into distinct ecotypes.
We have investigated differences in populations of western wheatgrass (Agropyron smithii) from an intensively grazed prairie dog colony and from within a large, permanent grazing exclosure (Detling and Painter 1983, Detling et al. 1986). Sod blocks containing western wheatgrass were collected on and off prairie dog colonies and were transplanted to a common greenhouse environment. After nine months, significant morphological differences persisted in plants from the two populations. Plants from the prairie dog colonies had more tillers per plant, fewer leaves per tiller, smaller leaves, higher bladejsheath ratios and were more prostrate than plants from ungrazed populations. The polymorphism and persistence of these characteristics suggested that these populations were genetically distinct. Grazing has apparently modified the selection pressures and competitive balance that existed in the ungrazed populations, thereby causing a shift in dominance to an ecotype that may be more grazing resistant or, because of its shorter stature, be less intensively grazed.
Several responses of the two ecotypes to simulated grazing were also compared (Detling and Painter 1983). Photosynthetic rates were similar and partial defoliation equally enhanced net photosynthesis in the remaining leaves in the two populations. However, perhaps because of greater photosynthetic rates of leaf blades than sheaths, and greater bladejsheath.ratios in th7 prairie dog. colony population, net pr1mary product1on (relative to undefoliated plant~) ~as . essentially unaffected by defol1at1on 1n plants from the prairie dog colony, but decreased by 20% following defoliation of exclosure plants. Therefore, although they are less productive, these "grazing morphs" may be more resistant to subsequent grazing than those plants seldom grazed.
24
Another response to grazing is increased accumulation of silica in leaves of grasses. It has been suggested (McNaughton et al. 1985), based on studies in the African savanna, that this may be a defense against herbivores, because silica decreases digestibility and palatability and promotes tooth wear (Van Soest 1982). We (Brizuela et al. 1986) found silicon concentrations were consistently higher in tillers of ~ smithii and Schizachyrium scoparium from heavily grazed prairie dog colonies than from lightly grazed areas. However, repeated defoliation did not increase silicon concentration. Thus higher whole tiller concentrations from colony plants may be explained by higher silicon concentrations in leaf blades compared to sheaths {Cid 1985) and the higher blade/sheath ratios in on- versus offcolony plants (Detling and Painter 1983).
In general, as plants mature their nutritive value declines (Van Soest 1982). However, grazing removes aging leaves and may stimulate growth of new tissue, which usually has a higher nitrogen concentration and greater digestibility than that of an ungrazed plant (McNaughton 1984). Part of our research at Wind Cave involved examination of the effect of prairie dog colonization and grazing on plant nutrient dynamics (Coppock et al. 1983a). A prairie dog colony was divid7d i~to three ages, or states of colon1zat1on: (a) an older area, colonized more than 25 yr, (b) a young area, occupied 3:8 yr, and (c) a recently (<2 yr) colon1zed edge. The (d) uncolonized prairie was used as a baseline, control site. During the growing season, live material of six grass species (three cool season species and three warm season species), a composite of forb species, and a dwarfshrub, Artemesia frigida, were collected monthly in each site and analyzed for nitrogen concentration and digestibility.
In general, shoot nitrogen concentrations were lowest in plants from the uncolonized grassland, and increased with the length of time an area had been occupied. Similar results for western wheatgrass were also observed (Krueger 1986). On an average, cool season grasses had higher nitrogen concentrations throughout the season than did warm season species for each state of colonization. Digestibility of grasses followed a pattern similar to nitrogen concentration: digestibility declined as the season progressed; grasses from the uncolonized area had lower digestibilities than those from the edge or young colony; cool season grasses were more digestible than warm season ones. These

results indicate that prairie dogs have a directional effect on plant nutrition and positively influence forage quality by their grazing.
Plant Community Parameters
When prairie dogs invade an area, they crop the vegetation to a height of a few centimeters and maintain it in that state. This can create microclimatic changes within the canopy and soil. Archer and Detling (1986) observed significant increases in soil temperature and as great or greater soil moisture content on prairie dog colonies as off. These abiotic changes can directly influence such things as rate of microbial activity, nutrient cycling, plant water balance, and plant production. These effects can further change the microhabitat, and thus the plant community. Cause and effect rapidly become obscured, but it is clear that grazing, directly or indirectly, modifies either the competitive balance of plants within the colony or modifies the environment such that some plants are better adapted than others.
Following occupation by prairie dogs, overall canopy height decreases and grasses are replaced by forbs. In one of our research colonies, the mean canopy height decreased 62% in the first two years of colonization, and changed little thereafter (Archer et al. 1987). Change in canopy structure can be achieved in several ways: (1) plants that are clipped repeatedly never reach full growth; (2) genetically determined taller morphs are replaced by grazing tolerant, shorter, prostrate ecotypes of the same species (Detling and Painter 1983); and (3) the plant community changes such that many of the taller species are replaced by shorter species (Koford 1958, Coppock et al. 1983a, Archer et al. 1987).
These same factors may contribute to concomitant decreases in standing crop following colonization. In one site, the greatest peak live standing crop (190 gjm2) was found in uncolonized prairie, where grasses comprised 85% of the biomass (Coppock et al. 1983a). Similar biomass levels were found in the oldest portion of the colony; however, less than 3% of that was grasses. The grassdominated young area of the colony only had about one-third the live standing crop as the uncolonized area. However, there was a greater proportion of live material relative to standing dead in the colonized areas compared to the uncolonized prairie. Because prairie dogs are continually clipping the vegetation, very little of it matures and dies; thus,
25
standing dead material does not accumulate in large quantities. As a result, the amount of material that eventually falls to the ground as litter is reduced, and bare ground increases (Coppock et al. 1983a). For example, Archer (et al. 1987) found that rapid changes occurred in the first two years following colonization, but by the third year, bare ground had stabilized at 35% (compared to -10% initially) and litter cover had decreased to less than 10% (-20% initially) .
Change in plant species composition after prairie dog occupation has been widely noted (Osborn and Allen 1949, King 1955, Koford 1958, Bonham and Lerwick 1976), but its rate of change has not been documented in detail. In separate colonies, Coppock et al. (1983a) and Archer et al. (1987) studied the rate of plant species change, replacement, and diversity. The rate of change, controlled in part by grazing pressure of prairie dogs and other herbivores, initial community composition, soil type, and weather, varied between colonies, but the trends were similar. In the most recently colonized areas {<2 yr), there was little change in plant species composition relative to uncolonized prairie. In areas of the colonies that had been impacted more than 3 yr, shifts in plant dominance and composition had begun {Coppock et al. 1983a) or had rapidly progressed (Archer et al. 1987). The dominant species in the uncolonized prairie, the midgrasses, were replaced by shortgrasses and annual forbs. Species diversity was highest in parts of the colonies occupied an intermediate length of time. Diversity in the oldest portions of each colony declined to levels similar to the uncolonized prairie due to the final dominance by a few species of forbs or dwarf shrubs.
PRAIRIE DOGS AND INTERACTIONS WITH OTHER ANIMALS
Thus far we have considered prairie dog interactions with the aboveground vegetation; however, prairie dogs are also creating patches within the ecosystem that modify densities, foraging patterns, and nutritional dynamics of other animals.
Prairie Dogs and Ungulates
Free-ranging populations of native grassland ungulates within Wind Cave National Park include about 350 bison, 60 pronghorn, and 400 elk. Early observations suggested that bison and pronghorn

were frequently associated with prairie dog colonies (King 1955, Koford 1958). More recently, Wydeven and Dahlgren (1985) reported summer use of prairie dogs colonies by bison, elk, and pronghorn. our research has verified that there is selection for prairie dog colonies by both bison and pronghorn, and that this may incur some nutritional advantage to animals that feed on colonies (Coppock et al. 1983b, Krueger 1986, Vanderhye 1985).
In conjunction with studies on plant response to colonization, Coppock et al. (1983a,b) also investigated the parkwide selection of bison for prairie dog colonies, the pattern of use by bison within a colony, and the relationship between that and the dynamics of the plant communities on and off colonies. The park consists of approximately 6% prairie dog colonies, 74% uncolonized grassland, and 20% coniferous forest. If animals randomly use whatever habitat they encounter, the frequency of observations of those animals on a habitat will approximate the proportion of that habitat in the park. Our results showed that bison predominately use the grasslands and prairie dog colonies and, in summer, the use of colonies was much higher than would be expected by chance alone.
On an extensively studied colony, bison preferred specific sites for various activities (Coppock et al. 1983b). Over the growing season, bison used the (a) younger, grass-dominated portion of the colony for both grazing and resting (3.0 and 2.7 times expected, respectively), the (b) edge primarily for grazing (2.5 times expected), and the (c) forb/dwarf shrub-dominated older areas for resting (2.5 times expected). The amount of time spent resting on the edge of the colony and feeding in the oldest part of the colony was essentially random. They used the adjacent uncolonized prairie only 20% of the expected time for either activity, indicating that this area was avoided in preference for the colony. Similar utilization patterns have been observed on other colo~ies (Krueger 1986).
Although bison are relatively nonselective feeders (Schwartz and Ellis 1981), at least on the scale of a bite, they can choose the habitat in which they prefer to feed. When possible, an animal would be expected to feed in the most favorable locations, such as where nutrient levels and availability of the forage are high. As discussed earlier, prairie dogs modify grasslands such that plant material from colonies has a
26
greater live to dead ratio (albeit lower standing crop), a higher crude protein (nitrogen) level, and a greater digestibility than from the uncolonized prairie, and this all implies greater nutrition per bite. The moderately impacted grass-dominated areas of the colonies are especially representative of these features. Thus, it seems reasonable to assume that prairie dogs have modified the environment making it a favorable feeding and resting habitat for other animals.
Vanderhye (1985) investigated nutritional benefits accrued to bison by selectively feeding on colonies by using Swift's (1983) model to simulate weight gains based on dietary information. Diet quality data were varied according to measured on and off colony values. Various patterns of colony usage, including random, typical, none, and 100%, were simulated. Averaged across all available studies, typical bison use of colonies during the growing season was estimated at 39% and random use was 12%. The model output suggested that if mature cows randomly use the colonies for feeding, they will gain an additional 2 kg ( 7% of seasonal weight gain) of body weight compared to not feeding on colonies at all. Typical usage of colonies confers an additional 5 kg (18%) weight gain. For yearling bison, randomly feeding on colonies could add 4 kg (14%) of body weight and typical use could add 13 kg (46%) beyond the gain expected when they avoid grazing on colonies altogether. The nutritional advantages are only realized from June through August when differences in forage quality between on- and off- colonies are maximal.
Elk (Wydeven and Dahlgren 1985) and pronghorn (Krueger 1986) also preferentially use prairie dog colonies. Krueger (1986) found that although both bison and pronghorn preferentially used colonies in summer, their location of use within the colonies differed. While bison preferentially used the grass-dominated areas, 57-97% of the pronghorn feeding on colonies were on the forb-shrub dominated centers. Within a preferred feeding area of the colony, there was a high dietary overlap between bison and prairie dogs and between pronghorn and prairie dogs. However, rather than competing for forage, the relationship between bison and prairie dogs seemed to be mutually positive, and between pronghorn and prairie dogs it was mostly neutral (Krueger 1986).

Prairie Dogs and the Belowground Ecosystem
Much of the plant system's dynamics occurs belowground and prairie dogs may influence the belowground responses of both plants and animals. It has been estimated that most of the energy flow in grassland systems occurs belowground (Coleman et al. 1976) and soil invertebrates, largely nematodes, may consume as much or more plant biomass as cattle on the mixed grass prairie (Smolik 1974). Because the root system provides a link for transport of materials from the soil to the shoot system, factors which affect the root system generally influence the aboveground plant dynamics as well.
Grazing typically reduces root biomass (Schuster 1964) because of reduced production and reallocation of -material from roots to the regrowing aboveground shoots. There is marked decline in total root biomass from off prairie dog colonies to older parts of the colonies. In one study (Ingham and Detling 1984), soil cores were taken monthly from beneath A. smithii and s. scoparium on a heavily-impacted section of the colony and in uncolonized prairie. Roots and nematodes were extracted from the cores. The seasonal mean root biomass from the colony was 70-80% of that off the colony, and total nematode densities were 45% higher on the colony than off. Nematode densities may reflect changes in soil microclimate or soil or plant chemistry caused by grazing. Annual net root production (ANRP) on the colony was about 60% of that off the colony; however, the percent of ANRP that nematodes consumed was estimated as 2.5x higher on the colony as off. Therefore, combining lower root production, higher nematode densities, and total consumption of roots on the colonies indicates a substantial impact and amount of energy and material flow occurring belowground.
Some Management Implications
As part of natural ecosystems, prairie dogs enhance certain features of the vegetation and create favorable habitat patches for other animals. Thus, in situations such as those described above for Wind cave National Park, the presence of a limited number of prairie dog colonies scattered throughout the native grassland may improve the health and increase the diversity of other wildlife species. However, extensive utilization of prairie dog colonies by large herds of ungulates such as bison may accelerate changes in the vegetation via increased consumption rates and soil disruption and compaction by trampling and wallowing. This can reduce suitabil-
27
ity of these sites for both bison and prairie dogs. Other research at Wind Cave National Park has shown that extensive bison utilization of such areas can be reduced by creating additional suitable bison habitat with controlled burns (Coppock and Detling 1986). It is necessary, however, to conduct the burns sufficiently far from prairie dog colonies that the burned areas will not provide additional habitat for rapid expansion of prairie dog colonies.
Caution should be exercised when extrapolating from the results of our studies in natural areas managed for wildlife preservation to rangelands managed for livestock production. While prairie dogs likely improve forage quality for cattle on rangelands just as they do for bison at Wind Cave National Park, it must be remembered that the areas with the enhanced forage quality have a lower total amount of forage available for consumption by livestock. Futhermore, it is common for significant portions of prairie dog colonies to be dominated by forbs, dwarf shrubs, or grass species which are unpalatable to livestock. Thus the increased forage quality in areas of colonies still dominated by grasses comes at the expense of a sizeable reduction in total available grass forage. While this may not be a problem when managing for wildlife populations at densities well below the carrying capacity of the land, it is a potentially larger problem in ranching operations in which livestock are maintained at levels closer to the carrying capacity.
Another consideration in managing for prairie dogs is one of scale. Much of our rangeland is divided into paddocks or pastures, and the amount of land available to cattle or other livestock is often not as extensive as that available to bison and other ungulates in parks such as Wind Cave. Therefore, it is conceivable that large proportions of individual paddocks may be covered by prairie dog colonies, thus reducing available forage far more than was observed in our studies in a natural area (Coppock et al. 1983a,b; Coppock and Detling 1986; Krueger 1986). Management policies for both domestic animals and prairie dogs should consider a number of factors including how much area is confined or available, animal densities, range condition and trend, opportunities for habitat selection, season of usage, and potential patterns of interactions.

FUTURE RESEARCH
Our research suggests that prairie dogs create unique patches of biological activity within grassland ecosystems. This patch structure is dramatically different from the surrounding grasslands, the behavior of other animals is modified by the presence of the patches, and changes in certain patch characteristics proceed in a fairly regular pattern through time.
Our current research is directed at further understanding some of the key ecosystem processes that determine the rates of structural and functional changes. We know that grazing by prairie dogs and associated herbivores decreases plant standing crop; however, does this necessarily imply decreases in net primary production? New green material with high nutritive value is being continually produced during the growing season on colonies, but are the rates of nitrogen (or other essential minerals) turnover and cycling different from those in uncolonized areas? Does extensive and preferential use colonies by several species of ungulates contribute to nutrient imports onto colonies via feces and urine, or is there a net offtake of nutrients? What happens when grazers are removed? How do other mobile herbivores, such as grasshoppers, respond to a patch structure that varies in time and space? At what point does a colony or part of a colony senesce, and do processes change or reverse? Answers to these questions are important for understanding the interactions of prairie dogs and their environment, and the role of herbivory as an influential moderator of ecosystem dynamics.
LITERATURE CITED
Archer, s. and J. K. Detling. 1986. Evaluation of potential herbivore mediation of plant water status in a North American mixed-grass prairie. Oikos 47:287-291.
Archer, s., M. G. Garrett, and J. K. Detling. 1987. Rates of vegetation change associated with prairie dog (Cynomys ludovicianus) grazing in North American mixed-grass. Vegetacio (in press).
Bonham, c. D. and A. Lerwick. 1976. Vegetation changes induced by prairie dogs on shortgrass range. Journal of Range Management 29:221-225.
28
Brizuela, M.A., J. K. Detling, and M. S. Cid. 1986. Silicon concentration of grasses growing in sites with different grazing histories. Ecology 67:1098-1101.
Chew, R. M. 1974. Consumers as regulators of ecosystems: an alternative to energetics. Ohio Journal of Science 74:359-370.
Cid, M. S. 1985. Effects of grazing exposure history and defoliation on silicon concentration of Agropyron smithii. Thesis. Colorado State University, Ft. Collins, Colorado.
Clark, T. W. 1986. Annotated Prairie Dog Bibliography: 1973-1985. Montana BLM Wildlife Technical Bulletin No. 1. Billings, Montana.
Coleman, D. c., R. Andrews, J. E. Ellis, and J. S. Singh. 1976. Energy flow and partitioning in selected man-managed and natural ecosystems. Agro-Ecosystems 3:45-57.
Collins, A. R., J. P. Workman, and D. W. Uresk. 1984. An economic analysis of black-tailed prairie dog (Cynomys ludovicianus) control. Journal of Range Management 37:358-361.
Coppock, D. L. and J. K. Detling. 1986. Alteration of bison and black-tailed prairie dog grazing interaction by prescribed burning. Journal of Wildlife Management 50:452-455.
Coppock, D. L., J. K. Detling, J. E. Ellis, and M. I. Dyer. 1983a. Plant-herbivore interactions in a North American mixed-grass prairie I. Effects of black-tailed prairie dogs on intraseasonal aboveground plant biomass and nutrient dynamics and plant species diversity. Oecologia 56:1-9.
Coppock, D. L., J. E. Ellis, J. K. Detling, and M. I. Dyer. 1983b. Plant-herbivore interactions in a North American mixed-grass prairie II. Responses of bison to modification of vegetation by prairie dogs. Oecologia 56:10-15.
Crawley, M. J. 1983. Herbivory: The Dynamics of Animal-Plant Interactions. University of California Press, Berkeley. 437pp.
Detling, J. K., E. L. Painter, and D. L. Coppock. 1986. Ecotypic differentiation resulting from grazing pressure: evidence for a likely phenomenon. pp 431-433 in Rangelands: A Resource under Siege. Joss, P. J., P. W. Lynch, and o. B. Williams, eds. Australian Academy of Science. Canberra.
Detling, J. K. and E. L. Painter. 1983. Defoliation responses of western wheatgrass populations with diverse histories of prairie dog grazing. Oecologia 57:65-71.

Hansen, R. M. and I. K. Gold. 1977. Blacktail prairie dogs, desert cottontails, cattle trophic relations on shortgrass range. Journal of Range Management 30:210-214.
Harper, J. L. 1977. Population Biology of Plants. Academic Press, London.
Hickey, W. c. 1961. Growth form of crested wheatgrass as affected by site and grazing. Ecology 42:173-176.
Ingham, R. E. and J. K. Detling. 1984. Plant-herbivore interactions in a North American mixed-grass prairie III. Soil nematode populations and root biomass on cynomys ludovicianus colonies and adjacent uncolonized areas. Oecologia 63:307-313.
King, J. A. 1955. Social behavior, social organization, and population dynamics in a black-tailed prairie dog town in the Black Hills of South Dakota. Contributions from the Laboratory of Vertebrate Biology No. 67. University of Michigan, Ann Arbor. 123pp.
Koford, c. B. 1958. Prairie dogs, whitefaces, and blue grama. Wildlife Monographs No. 3. 78pp.
Krueger, K. 1986. Feeding relationships among bison, pronghorn, and prairie dogs: an experimental analysis. Ecology 67:760-770.
Lacey, J. R. and H. w. Van Poollen. 1981. Comparison of herbage production on moderately grazed and ungrazed western ranges. Journal of Range Management 34:210-212.
McNaughton, S. J. 1984. Grazing lawns: animals in herds, plant form, and coevolution. American Naturalist 124:863-886.
McNaughton, s. J. 1985. Ecology of a grazing ecosystem: the Serengeti. Ecological Monographs 55:259-294.
McNaughton, s. J., J. L. Tarrants, M. M. McNaughton, and R. H. Davis. 1985. Silica as a defense against herbivory and a growth promoter in African grasses. Ecology 66:528-535.
O'Meilia, M. E., F. L. Knopf, and J. C. Lewis. 1982. Some consequences of competition between prairie dogs and beef cattle.. Journal of Range Management 35:580-585.
29
Osborn, B. and P. F. Allan. 1949. Vegetation of an abandoned prairie-dog town in tall grass prairie. Ecology 30:322-332.
Quinn, J. A. and R. v. Miller. 1967. A biotic selection study utilizing Muhlenbergia montana. Bulletin of the Torrey Botanical Club 94:423-432.
Schuster, J. L. 1964. Root development of native plants under three grazing intensities. Ecology 45:63-70.
Schwartz, c. c. and J. E. Ellis. 1981. Feeding ecology and niche separation in some native and domestic ungulates on the shortqrass prairie. Journal of Applied Ecology 18:343-353.
Smolik, J. D. Nematode Studies at the Cottonwood Site. US/IBP Grassland Biome Tech. Rep. No. 251. Ft. Collins, Colorado.
Strong, D. R., J. H. Lawton, and T. R. E. Southwood. 1984. Insects on Plants: Community Patterns and Mechanisms. Harvard University Press. Cambridge. 313pp.
Swift, D. M. 1983. A simulation model of energy and nitrogen balance for free-ranging ungulates. Journal of Wildlife Management 47:620-645.
Uresk, D. w. 1985. Effects of controlling black-tailed prairie dogs on plant production. Journal of Range Management 38:466-468.
Van Soest, P. J. 1982. Nutritional Ecology of the Ruminant. O&B Books, Corvallis, Oregon.
Vanderhye, A. V. R. 1985. Interspecific nutritional facilitation: Do bison benefit from feeding on prairie dog towns? Thesis, Colorado State University, Ft. Collins, Colorado.
Wiegert, R. G. and F. c. Evans. 1967. Investigations of secondary productivity in grasslands. pp 499-518 in Secondary Productivity in Terrestrial Ecosystems:Principles and Methods. Vol II. K. Petrusewicz, ed., (Warszawa: Panstwowe Wydawnictwo Naukowe).
Wydeven, A. P. and R. B. Dahlgren. 1985. Ungulate habitat relationships in Wind Cave National Park. Journal of Wildlife Management 49:805-813.

A Statistical Model of Expansion in a Colony of Black-Tailed Prairie Dogs1
R.P. Cincottaz• a, D.W. Uresk•, and R.M. Hansenz
Abstract.-- To predict prairie dog establishment in areas adjacent to a colony we sampled: (1) VISIBILITY through the vegetation using a target, (2) POPULATION DENSITY at the colony edge, (3) DISTANCE from the edge to the potential site of settlement, and (4) % FORB COVER. Step-wise regression analysis indicated that establishment of prairie dogs in adjacent prairie was most likely to occur when an area was near a densely populated colony edge with high visibility through the vegetation.
INTRODUCTION
In order to control black-tailed prairie dog (Cynomys ludovicianus) colony expansion, managers must be aware of the environmental conditions that promote the establishment of prairie dogs in previously unoccupied areas. Since the mid-1950's, environmental and biological factors linked to colony expansion have been studied and reasons for the growth of black-tailed prairie dog colonies have been suggested (King 1955, Koford 1958, Smith 1958, Garret and Franklin 1982, Uresk 1985, Knowles 1985a). The objective of our study was to test a set of hypothesized variables [(1) POPULATION DENSITY at the colony edge, (2) VISIBILITY through the vegetation, (3) DISTANCE from colony edge, (4) %FORB COVER], suggested through prior research of prairie dog ecology, as predictors of black-tailed prairie dog town expansion.
1 Presented April 29, 1987 in the poster session during the Eighth Great Plains Wildlife Damage Control Workshop, Rapid City, South Dakota. 2Range Science Department, Colorado State University, Fort Collins, CO 80523. 3 Present address: Department of Anthropology, State University of New York at Binghamton, Binghamton, NY 13901. •Research Biologist, USDA-Forest Service, Rocky Mountain Forest and Range Experiment Station, Rapid City, South Dakota 57701.
30
STUDY AREA AND METHODS
Field work was conducted during a 3 yr. study (1981-83) of prairie dog colony expansion in Badlands National Park, southwestern South Dakota. The study site was a colony of approximately 12 ha. located along the northern boundary of the Park. The colony was located on land formerly grazed by livestock. A large component of shortgrasses, especially buffalo grass (Buchloe dactyloides), was present in the mixed-grass type vegetation characteristic of the area (see Agnew et al. 1985 for a detailed description of fauna and flora of prairie dog colonies in Badlands N.P.)
Four variables were chosen with which to predict establishment of prairie dogs in adjacent uncolonized areas. These potential areas were mapped and marked in a grid system of 25 m. grid squares. In 120 grid squares (1981-82: 55 samples; 1982-83: 65 samples) beyond the edge of the prairie dog colony, we measured: (1) VISIBILITY through the vegetation using a 1 m. x 1 m. target observed within each grid square, (2) POPULATION DENSITY of prairie dogs at the nearest edge of the colony using the number of active burrows as an indicator of population numbers, (3) DISTANCE from the edge to the potential site of settlement, and (4) % FORB COVER using estimates from ten randomly placed plots (20 em. x 50 em.) in each grid. The target mentioned in (1) was bright orange with fifty, equally spaced 2 em. white squares.
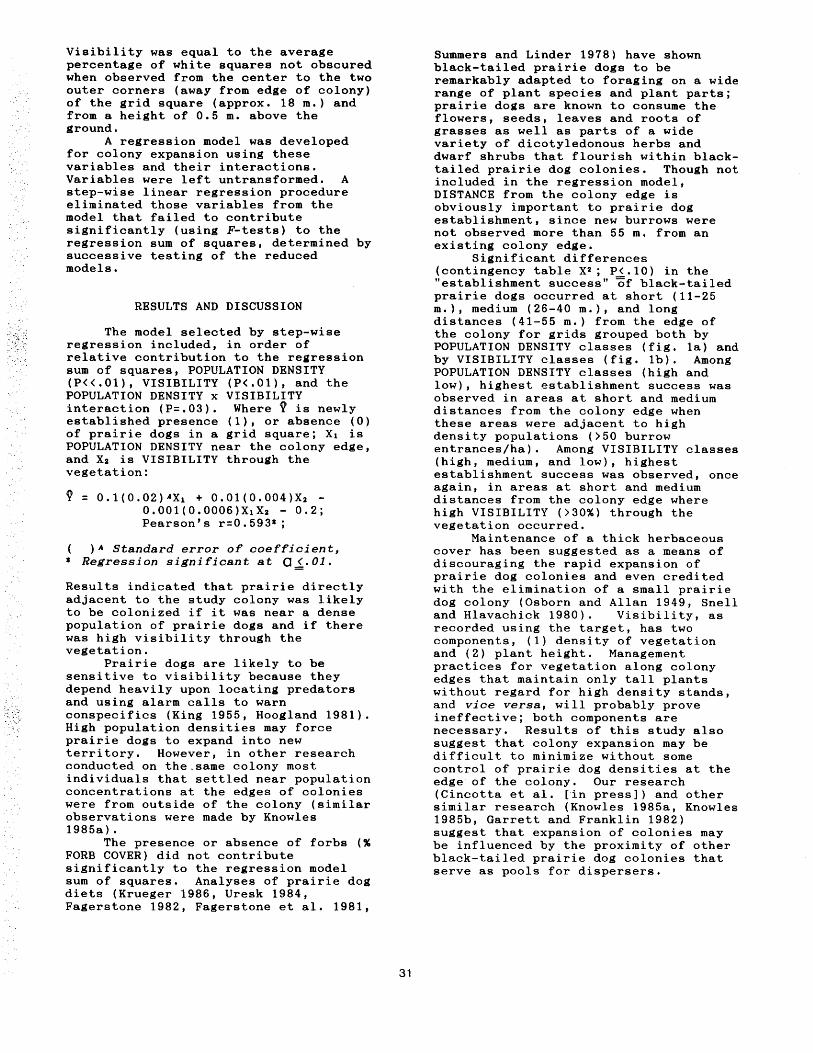
Visibility was equal to the average percentage of white squares not obscured when observed from the center to the two outer corners (away from edge of colony) of the grid square (approx. 18m.) and from a height of 0.5 m. above the ground.
A regression model was developed for colony expansion using these variables and their interactions. Variables were left untransformed. A step-wise linear regression procedure eliminated those variables from the model that failed to contribute significantly (using F-tests) to the regression sum of squares, determined by successive testing of the reduced models.
RESULTS AND DISCUSSION
The model selected by step-wise regression included, in order of relative contribution to the regression sum of squares, POPULATION DENSITY (P<<.01), VISIBILITY (P<.01), and the POPULATION DENSITY x VISIBILITY interaction (P=.03). Where Y is newly established presence (1), or absence (0) of prairie dogs in a grid square; X1 is POPULATION DENSITY near the colony edge, and Xz is VISIBILITY through the vegetation:
Y: 0.1(0.02)AXt + 0.01(0.004)Xz -0.001(0.0006)XtXz - 0.2; Pearson's r=0.593*;
)A Standard error of coefficient, * Regression significant at 0 ~· 01.
Results indicated that prairie directly adjacent to the study colony was likely to be colonized if it was near a dense population of prairie dogs and if there was high visibility through the vegetation.
Prairie dogs are likely to be sensitive to visibility because they depend heavily upon locating predators and using alarm calls to warn conspecifics (King 1955, Hoogland 1981). High population densities may force prairie dogs to expand into new territory. However, in other research conducted on the.same colony most individuals that settled near population concentrations at the edges of colonies were from outside of the colony (similar observations were made by Knowles 1985a).
The presence or absence of forbs (% FORB COVER) did not contribute significantly to the regression model sum of squares. Analyses of prairie dog diets (Krueger 1986, Uresk 1984, Fagerstone 1982, Fagerstone et al. 1981,
31
Summers and Linder 1978) have shown black-tailed prairie dogs to be remarkably adapted to foraging on a wide range of plant species and plant parts; prairie dogs are known to consume the flowers, seeds, leaves and roots of grasses as well as parts of a wide variety of dicotyledonous herbs and dwarf shrubs that flourish within blacktailed prairie dog colonies. Though not included in the regression model, DISTANCE from the colony edge is obviously important to prairie dog establishment, since new burrows were not observed more than 55 m. from an existing colony edge.
Significant differences (contingency table xz; P~.10) in the "establishment success" of black-tailed prairie dogs occurred at short (11-25 m.), medium (26-40 m.), and long distances (41-55 m.) from the edge of the colony for grids grouped both by POPULATION DENSITY classes (fig. 1a) and by VISIBILITY classes (fig. 1b). Among POPULATION DENSITY classes (high and low), highest establishment success was observed in areas at short and medium distances from the colony edge when these areas were adjacent to high density populations (>50 burrow entrances/ha). Among VISIBILITY classes (high, medium, and low), highest establishment success was observed, once again, in areas at short and medium distances from the colony edge where high VISIBILITY (>30%) through the vegetation occurred.
Maintenance of a thick herbaceous cover has been suggested as a means of discouraging the rapid expansion of prairie dog colonies and even credited with the elimination of a small prairie dog colony (Osborn and Allan 1949, Snell and Hlavachick 1980). Visibility, as recorded using the target, has two components, (1) density of vegetation and (2) plant height. Management practices for vegetation along colony edges that maintain only tall plants without regard for high density stands, and vice versa, will probably prove ineffective; both components are necessary. Results of this study also suggest that colony expansion may be difficult to minimize without some control of prairie dog densities at the edge of the colony. Our research (Cincotta et al. [in press]} and other similar research (Knowles 1985a, Knowles 1985b, Garrett and Franklin 1982) suggest that expansion of colonies may be influenced by the proximity of other black-tailed prairie dog colonies that serve as pools for dispersers.

a. toes-.--
·~j I1J I1J 801 Ill u u 701 :J P=.02 rll
601 [-! z 501 ll:l t :I: 401 I1J H
..J 301 Ill < 201 [-! Ill ll:l 101
01 11-25 ..
1982 l 1983
PO?UL.ATIOII DENSITY AT COLONY EDGE G LO~ IS] HIGH
P=.03
26-40 .. 41-55 w
b. 100I.---------1-9B_2 _a:_19_B_3 --------,
VISIBILITY THROUGH VEGETATION
901 [Z) LOW rs:sJ IIEDIUiot [2! HIGH
P=.06 801
11-25 .. 26-40 .. 41-55 II
DISTANCE FROM COLONY EDGE
Figure 1.--The observed percentage of ESTABLISHMENT SUCCESS of prairie dogs in uncolonized grid squares adjacent to a colony. Squares were classed by the level of: a.) POPULATION DENSITY at the nearest colony edge, and b.) VISIBILITY through the vegetation. P-values represent the probability of homogeneity within the distance class (contingency table xz ).
ACKNOWLEDGEMENTS
This study was sponsored by a research grant from the National Park Service (Contract No. CX1200-1-B035) and logistic support from the US Forest Service Forest and Range Experiment Station at Rapid City, South Dakota. We wish to thank Superintendent Gil Blinn, Chief Ranger Lloyd Kortje, District Ranger Mike Glass and the staff of Badlands National Park for their assistance during the study, as well as to the US Forest Service technical staff for their assistance. Deborah Paulson and Bill Agnew assisted in data collection.
32
LITERATURE CITED
Agnew, W., D.W. Uresk, and R.M. Hansen. 1985. Flora and fauna associated with prairie dog colonies and adjacent ungrazed mixed-grass prairie in western South Dakota. J. Range Manage 39(2):135-139.
Cincotta, R.P., D.W. Uresk, and R.M. Hansen. in press. Demography of prairie dog populations reoccupying sites treated with rodenticide. Great Basin Naturalist 47(2).
Fagerstone, K.A., H.P. Tietjen, and 0. Williams. 1981. Seasonal variation in the diet of black-tailed prairie dogs. J. Mamm. 62:820-824.
Fagerstone, K.A. 1982. A review of prairie dog diet and its variability among animals and colonies. Pages 178-184 In R.M. Timm and R.J. Johnson, edi£ors. Proceedings: fifth Great Plains wildlife damage control workshop. Institute of Agriculture and Natural Resources, University of Nebraska, Lincoln, Nebraska.

Garrett, M.G. and W.L. Franklin. 1982. Prairie dog dispersal in Wind Cave National Park: possibilities for control. Pages 185-198 In R.M. Timm and R.J. Johnson, edito~i. Proceedings: fifth Great Plains wildlife damage control workshop. Institute of Agriculture and Natural Resources, University of Nebraska, Lincoln, Nebraska.
Hoogland, J.L. 1981. The evolution of coloniality in white-tailed and black-tailed prairie dogs (Sciuridae: G.Yn9.~Y.~. !. .. ~.:Y..9.:Y. .. !:.:Y.~ and G.· ludovicianus). Ecology 62:252-272.
King, ·····j··:··A"·:···T§.!fff:····social behavior, social organization, and population dynamics in a black-tailed prairie dog town in the Black Hills of South Dakota. Contributions from the Lab. of Vert. Biol., No. 67, University of Michigan, Ann Arbor, Michigan.
Knowles, C.J. 1985a. Observations on prairie dog ( gy~..Q.~Y.~. !. .. '::1..4..2 .. Y.! . .9..J~.~'::l..~.) dispersal in Montana, USA. Prairie Nat 17(1):33-39.
Knowles, C.J. 1985b. Population recovery of black-tailed prairie dogs following control with zinc phosphide. J. Range Manage. 39(3) :249-251.
Koford, C.B. 1958. Prairie dogs, whitefaces, and blue grama. Wildl. Monogr. No. 3.
Krueger, K. 1986. Feeding relationships among bison, pronghorn, and prairie dogs: an experimental analysis. Ecology 67(3):760-770.
Osborn, B. and P.F. Allan. 1949. Vegetation of an abandoned prairiedog town in tall grass prairie. Ecology 30:322-332.
Smith, R.E. 1958. Natural history of the prairie dog in Kansas. University of Kansas, Museum of Nat. Hist. and State Biol. Surv., Lawrence, Kansas.
Snell, G.P., and B.D. Hlavachick. 1980. Control of prairie dogs --the easy way. Rangelands 2(6):239-240.
Summers, C.A., and R.L. Linder. 1978. Food habits of the blacktailed prairie dog in western South Dakota. J. Range Manage 31:134-136.
Uresk, D.W. 1984. Black-tailed prairie dog food habits and forage relationships in western South Dakota. J. Range Manage 37:325-329.

White-Tailed Prairie Dog Ecology In Wyoming1
2 George E. Menkens, Jr.
Brian J. Miller2
and 3 Stanley H. Anderson
Abstract .--White-tailed prairie dog populations and habitats were studied on six towns in Wyoming. Habitats and habitat structure varied greatly both within and between towns. Prairie dog populations on each town were found to fluctuate by more than 50% between consecutive years. Prairie dog density was not significantly related to burrow density indicating that burrow density was not a useful predictor of population density.
INTRODUCTION
Although white-tailed prairie dog (Cynomys leucurus) ecology has been studied, most studies concentrated on various aspects of behavioral ecology (e.g., Hoogland 1979, 1981) or reproduction (Bakke and Brown 1967). Only two (Tileston and Lechleitner 1966; Clark 1977) dealt with population ecology. Even though aspects of white-tailed and black-tailed prairie dog (Cynomys ludovicianus) ecology may be similar (e.g., Clark et al. 1971), their life histories differ significantly (Tileston and Lechleitner 1966; Campbell and Clark 1981; Clark et al. 1982; Hoogland 1979, 1981). Knowledge of these differences are important in designing and implementing white-tailed prairie dog management programs.
In this paper we discuss the results of our study on the population and habitat ecology of white-tailed prairie dogs in two areas of Wyoming. We compare and contrast these data to similar data from the literature for black-tailed prairie dogs. We also discuss aspects of white-tailed prairie dog ecology that may be important in their management.
1Paper presented at the Eighth Great Plains Wildlife Damage -control Workshop, Rapid City South Dakota, April 28-30, 1987.
2 George E. Menkens, Jr. and Brian J. Miller are Graduate Assistants. Wyoming Cooperative Fish and Wildlife Research Unit, University of Wyoming, Laramie, WY.
3 Stanley H. Anderson is Leader of the Wyoming Cooperative Fish and Wildlife Research Unit, University of Wyoming, Laramie, WY.
34
STUDY AREA AND ANIMALS
We collected data on white-tailed prairie dog populations and habitats from six towns, three near Laramie, WY, and on three subcolonies of a prairie dog complex near Meeteetse, WY, in the Big Horn Basin. Both sites are on rolling plains interrupted by low hills and buttes (Bailey 1980). The study areas are in the Wyoming Basin Province (Bailey 1980) and are dominated by sagebrush (Artemesia spp.), greasewood (Sarcobatus spp.), wheatgrass (Agropyron spp.), and rabbitbrush (Chrysothamnus spp.). Plant species lists for all study sites are in Collins and Lichvar (1984, 1986). Study site elevations range from 2100 to 2200 m. Average monthly temperature ranges from 4 to 11 C, with average annual precipitation ranging from 125 to 350 mm (Bailey 1980). Cattle are grazed at varying rates on all grids.
White-tailed prairie dogs are large (800-1500 g), diurnal ground squirrels that inhabit high mountain basins in the Rocky Mountains of Colorado, Utah, and Wyoming (Hall 1981). They are social, and are found living in towns of various sizes, densities, and habitat characteristics. The white-tailed prairie dog's social system is similar to that of the Wyoming ground squirrel (Spermophilus elegans). It is not as complex as the social systems of the black-tailed and Gunnison's prairie dogs (Cynomys gunnisonii) (Michener 1983). Female white-tails are relatively sedentary. Juvenile males are the primary dispersing class, with dispersal occurring soon after initial emergence. Both sexes breed first as one year olds (Bakke and Brown 1967).
~~ite-tailed prairie dogs hibernate during the winter (Harlow and Menkens 1986; Bakke and Nahorniak 1986) and follow the typical ground

squirrel emergence and immergence patterns. Adult males emerge in late February or early March (Bakko and Brown 1967; Clark 1977) with adult females emerging 2-3 weeks later. Breeding occurs soon after female emergence (Bakko and Brown 1967). Juveniles emerge in late May or early June, 5-7 weeks post-partum (Tileston and Lechleitner 1966; Bakko and Brown 1967). Immergence follows the opposite pattern. Adult males become sedentary and immerge during August, followed by adult females (mid-August to early September) and then juveniles (up until October) (Tileston and Lechleitner 1966; Clark 1977).
MATERIAL AND METHODS
Prairie dog populations were studied from 1983-1986 in Laramie and from 1984-1986 in Meeteetse. Habitat data were collected for all three years in Meeteetse, and for the years 1983-1985 in Laramie.
On each town, a grid (9 to 13 ha in size) was established for trapping and vegetation sampling. Prairie dogs were live trapped twice a year (June and August) for five days each month. They were individually ear tagged, and released. Chapman's unbiased version of the Lincoln-Petersen estimator (Seber 1982; Menkens 1987) was used to estimate population size. Percent cover by grass, forbs, subshrubs (mostly Artemesia frigida), and shrubs was estimated using point intercept sampling (Barbour et al. 1980) at 30 random points on each grid. Shrub density and height was estimated using line intercept techniques (McDonald 1980). Large scale (i.e., town wide) topographic variation was estimated from 1:100000 scale maps using a modification of Menkens and Anderson (1987). Small scale topographic variation (i.e., within grid variation) was estimated using a modified Robel Pole (Robel et al. 1970). All burrows greater than 10 em diameter were censused in 1983 (Laramie grids) or 1984 (Meeteetse grids), total burrow density on all grids was estimated in 1986 by randomly sampling approximately 50% of the grid.
RESULTS AND DISCUSSION
Habitat
White-tailed prairie dog towns vary from being flat to those whose topographic heterogeneity index value is greater than 75% (Menkens 1987). Large scale topographic variation results because individual towns may contain hills that rise up to 20 m or more above the surrounding prairie. Towns may also be dissected by large gullies. The magnitude of large scale topographic diversity in white-tailed towns contrasts with the lack of such variation in black-tailed towns. Black-tailed prairie dogs seem to be limited to sites of less than 5% slope (Tileston and Lechleitner 1966; Knowles 1982)
35
Spatial variation in habitat variables, particularly shrub characteristics and topographic features, results in significant differences in inter- and intra-town habitat structural diversity (Tileston and Lechleitner 1966; Clark 1977; Menkens 1987). Shrub densities on towns range from a median of 0.0 to 3100 shrubs/ha and shrub height ranges from a median of 22 to 35 em (Menkens 1987). Using our measure of within grid topographic variation, topographic diversity between towns ranges from 39 to 120%. Significant inter-town differences in topographic· diversity results from the presence of small hills and gullies on some grids. The presence of many large maternity mounds (Clark 1977; Flath and Paulick 1979) on some grids but few on others, also contributes to topographic differences.
The degree of intra-town habitat diversity on white-tailed towns contrasts with the apparent lack of such diversity on black-tailed prairie dog towns. In addition to only inhabiting flat sites, black-tailed prairie dogs greatly modify the vegetation (and thus its structure) on their towns by clipping it to a short height and actively maintain this low stature (Tileston and Lechleitner 1966; Hoogland 1979; Coppock et al. 1983). White-tails do not visibly modify their habitats to the same degree. Because extensive vegetation modification by black-tails results in distinct town boundaries permitting easy delineation of towns from aerial photographs (Cheatheam 1973; Dalsted et al. 1981), it is possible to concentrate management efforts in well defined areas. Lack of visible habitat modification by white-tails, combined with their dispersed, uneven distribution throughout the habitat (Tileston and Lechleitner 1966; Clark 1977) makes town boundary delineation difficult. If white-tailed prairie dog management is to include poisoning, a knowledge of town boundaries is critical because incomplete treatment may lead to rapid recovery approaching pre-treatment population levels (e.g., Matschke et al. 1982; Knowles 1986). Boundary delineation may be accomplished using techniques and environmental features such as ground checking and mapping of the peripheral burrows, the use of gross topo~raphic features (e.g., perennially flowing creeks, very steep slopes, etc.), and extensive soil barriers (e.g., alkaline soils, perpetually moist, or very sandy soils).
Since black-footed ferrets (Mustela nigripes) live on prairie dog towns, search techniques need to take into account habitat. The high degree of structural diversity, and prairie dog's dispersed populations will influence design and performance of nocturnal ferret searches on white-tailed towns (see Clark et al. 1984 for a description of this technique). While spotlight beams may extend up to several hundred meters on black-tailed towns; shrubs, tall grass, and hills and

gullies on white-tailed towns will greatly reduce the light's effective distance. Reduced sighting distance requires that more effort be expended on a town in order to obtain full search coverage. A lower limit of 10 burrows/ha has been recommended for defining town boundaries when conducting black-footed ferret searches (Forrest et al. 1985).
During this study, burrow densities changed significantly over time on only two towns while population densities changed on all but one (Table 1). On five of six towns, no apparent correlation existed between population and burrow densities (Menkens 1987). We also examined the relationship between population and burrow densities using linear regression on the pooled town population and burrow data for the first and last year of study. In both analyses (Table 1), the slope of the regression line was not significantly different from zero. These results also show that no significant relationship exists between burrow density and white-tailed prairie dog density. Although King (1955) did not explicitly test this relationship for black-tails, he reached the same conclusion. Thus burrow density on a town is not a reliable or useful predictor of either white-tailed or black-tailed prairie dog density.
Population Fluctuations
~~ite-tailed prairie dog populations fluctuate greatly within towns (Clark 1977; Menkens 1987) (Table 2). The magnitude of temporal variation in density exhibited in this town (Table 2) is typical of the remaining five towns in this study (Menkens 1987). It can be seen that between year density changes can approach 50% or more. These changes are not predictable from habitat variables, climatic parameters, or from the previous year's density (Menkens 1987).
Density fluctuations have two impacts on management and control of white-tailed prairie dogs. First, they suggest that with potentially high reproductive output along with possibly high immigration rates (Menkens 1987), white-tails could recover from poisoning campaigns as rapidly (1-2 years) as do black-tails and Wyoming ground squirrels (Matschke et al. 1982; Knowles 1986). White-tailed prairie dog populations that have been nearly eradicated by epizootics of sylvatic plague (Yersinia pestis) have returned to pre-dieoff levels within four to five years (Barnes 1982).
The second effect of density fluctuations on white-tailed prairie dog management is that
Table 1.--Results of regressions exatnining the relationship between total prairie dog density and burrow density. BLM-13A grid excluded from the first regression because its burrow density was estimated whereas complete censuses were performed on the remaining grids in the first year of each study. All grids were included in the analysis of the final year's data. All population densities except Goulds differ significantly between the first and last year of the study. Burrow densities differ significantly between the first and last year of the study - for the Nunn and Pitchfork towns only. Burrow density in burrows/ha, prairie dog density in prairie dogs/ha. (from Menkens 1987).
Town
Bath Nunn Pitchfork Gould 91
Bath Nunn Pitchfork Gould 91 BLM-13A
First Year of Study (1983 or 1984)
Burrow Density Prairie Dog Density
106.3 205.4 65.3
106.0 84.7
Prairie Dog Density= 3.77 + 0.09 *Burrow Density r 2 =47 .0 F=2.66 p < 0.05
Prairie Dog r 2 =32.1
1986
107.2 ± 13.9 154.4 ± 28.2 80.8 ± 13.1 88.9 ± 17.4 72.0 ± 13.1
137.0 ± 21.7
density - 23.3 F=1.89
36
.11 *Burrow Density p < 0.05
9.1 21.8 4.3
17.1 18.4
15.3 7.6
12.3 20.9 9.9 2.0
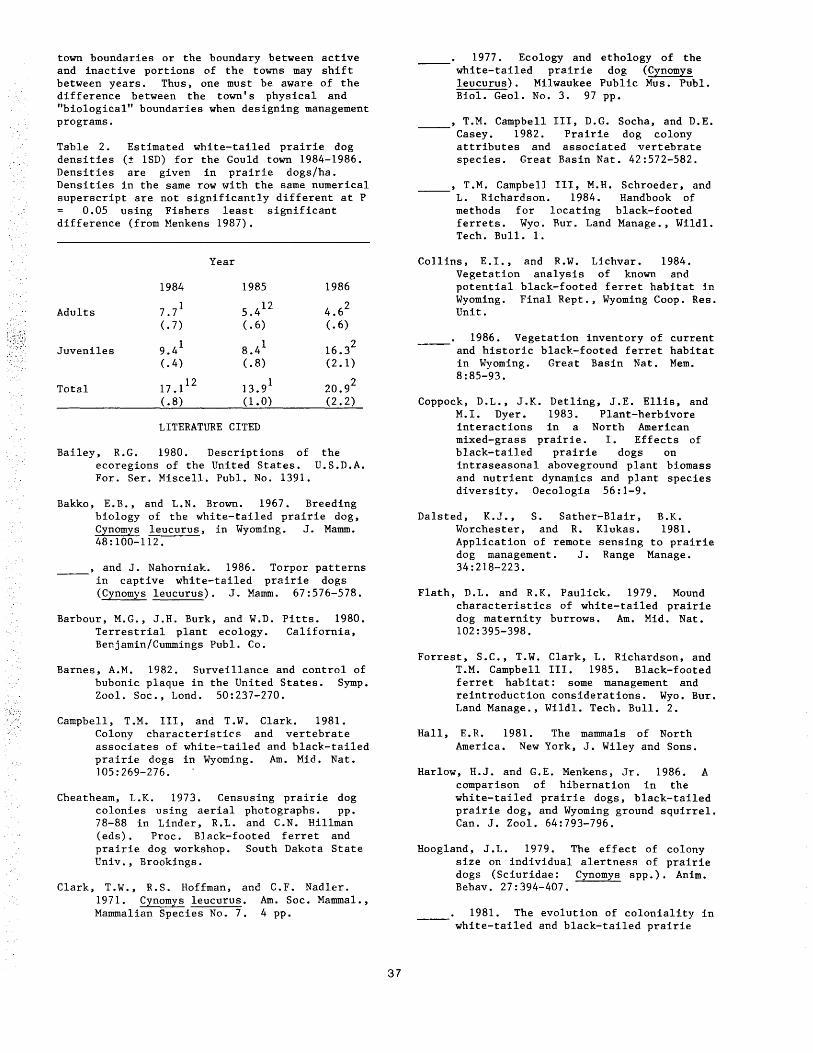
town boundaries or the boundary between active and inactive portions of the towns may shift between years. Thus, one must be aware of the difference between the town's physical and "biological" boundaries when designing management programs.
Table 2. Estimated white-tailed prairie dog densities (± 1SD) for the Gould town 1984-1986. Densities are given in prairie dogs/ha. Densities in the same row with the same numerical superscript are not significantly different at P
0.05 using Fishers least significant difference (from Menkens 1987).
Year
1984 1985 1986
Adults 7.71 5.412 4.6
2
(. 7) (. 6) (. 6)
Juveniles 9.41
8.41
16.32
(. 4) (. 8) (2 .1)
Total 17.112
13.91
20.92
(. 8) (1.0) (2.2)
LITERATURE CITED
Bailey, R.G. 1980. Descriptions of the ecoregions of the United States. U.S.D.A. For. Ser. Miscell. Publ. No. 1391.
Bakko, E.B., and L.N. Brown. 1967. Breeding biology of the white-tailed prairie dog, Cynomys leucurus, in Wyoming. J. Mamm. 48: 100-112.
, and J. Nahorniak. 1986. Torpor patterns in captive white-tailed prairie dogs (Cynomys leucurus). J. Mamm. 67:576-578.
Barbour, M.G., J.H. Burk, and W.D. Pitts. 1980. Terrestrial plant ecology. California, Benjamin/Cummings Publ. Co.
Barnes, A.M. 1982. Surveillance and control of bubonic plaque in the United States. Symp. Zool. Soc., Lond. 50:237-270.
Campbell, T.M. III, and T.W. Clark. 1981. Colony characteristics and vertebrate associates of white-tailed and black-tailed prairie dogs in Wyoming. Am. Mid. Nat. 105:269-276.
Cheatheam, L .K. 1973. Censusing prairie dog colonies using aerial photographs. pp. 78-88 in Linder, R.L. and C.N. Hillman (eds). Proc. Black-footed ferret and prairie dog workshop. South Dakota State Univ., Brookings.
Clark, T.W., R.S. Hoffman, and C.F. Nadler. 1971. Cynomys leucurus. Am. Soc. Mammal., Mammalian Species No. 7. 4 pp.
37
1977. Ecology and ethology of the white-tailed prairie dog (Cynomys leucurus). Milwaukee Public Mus. Publ. Biol. Geol. No. 3. 97 pp.
, T.M. Campbell III, D.G. Socha, and D.E. Casey. 1982. Prairie dog colony attributes and associated vertebrate species. Great Basin Nat. 42:572-582.
, T.M. Campbell III, M.H. Schroeder, and L. Richardson. 1984. Handbook of methods for locating black-footed ferrets. Wyo. Rur. Land Manage., Wildl. Tech. Bull. 1.
Collins, E.I., and R.W. Lichvar. 1984. Vegetation analysis of known and potential black-footed ferret habitat in Wyoming. Final Rept., Wyoming Coop. Res. Unit.
1986. Vegetation inventory of current and historic black-footed ferret habitat in Wyoming. Great Basin Nat. Mem. 8:85-93.
Coppock, D.L., J.K. Detling, J.E. Ellis, and M.I. Dyer. 1983. Plant-herbivore interactions in a North American mixed-grass prairie. I. Effects of black-tailed prairie dogs on intraseasonal aboveground plant biomass and nutrient dynamics and plant species diversity. Oecologia 56:1-9.
Dalsted, K.J., S. Sather-Blair, B.K. Worchester, and R. Klukas. 1981. Application of remote sensing to prairie dog management. J. Range Manage. 34:218-223.
Flath, D.L. and R.K. Paulick. 1979. Mound characteristics of white-tailed prairie dog maternity burrows. Am. Mid. Nat. 102:395-398.
Forrest, S.C., T.W. Clark, L. Richardson, and T.M. Campbell III. 1985. Black-footed ferret habitat: some management and reintroduction considerations. Wyo. Bur. Land Manage., Wildl. Tech. Bull. 2.
Hall, E. R. 1981. The mammals of North America. New York, J. Wiley and Sons.
Harlow, H.J. and G.E. Menkens, Jr. 1986. A comparison of hibernation in the white-tailed prairie dogs, black-tailed prairie dog, and Wyoming ground squirrel. Can. J. Zool. 64:793-796.
Hoogland, J.L. 1979. The effect of colony size on individual alertness of prairie dogs (Sciuridae: Cynomys spp.). Anim. Behav. 27:394-407.
1981. The evolution of coloniality in white-tailed and black-tailed prairie

dogs (Sciuridae: Cynomys leucurus and C. ludovicianus). Ecology 62:252-272.
King, J.A. 1955. Social behavior, social organization, and population dynamics in a black-tailed prairie dog town in the Black Hills of South Dakota. Univ. Michigan Contrib. Lab. Vert. Biol. 67:1-123:
Knowles, C.J. 1982. Habitat affinity, populations, and control of black-tailed prairie dogs on the Charles M. Russel National Wildlife Refuge. Unpubl. Ph.D. Dissertation, Univ. Montana.
1986. Population recovery of ---black-tailed prairie dogs following control
with zinc phosphide. J. Range Manage. 39:249-251.
Matschke, G.H., K.A. Fagerstone, N.D. Halstead, G.K. LaVoie, and D.L. Otis. 1982. Population reduction of Richardson's ground squirrel with zinc phosphide. J. Wildl. Manage. 46:671-677.
McDonald, L.L. 1980. Line intercept sampling for attributes other than cover and density. J. Wildl. Manage. 44:530-533.
Menkens, G. E., Jr., and S.H. Anderson. 1987. Nest site characteristics of a
predominantly tree nesting population of g eagles. J. Field Ornithol. 58:22-25.
1987. Temporal and spatial variation in white-tailed prairie dog (Cynomys leucurus) populations and life histories in Wyoming. Unpubl. Ph.D. Dissertation, Univ. Wyoming, Laramie.
Michener, G.R. 1983. Kin identification, matriarchies, and the evolution of sociality in ground-dwelling sciurids. pp. 528-572, in Eisenberg, J.F. and D.G. Kleiman (eds), Recent advances in the study of mammalian behavior. Spec. Publ. Amer. Soc. Mamm. 7.
Robel, R.J., J.N. Briggs, A.D. Dayton, and L.C. Hulbert. 1970. Relationships between visual obstruction measurements and weight of grassland vegetation. J. Range Manage. 23:295-297.
Seber, G.A.F. 1982. abundance and Griffen, London.
The estimation of animal related parameters.
506 pp.
Tileston, J.V., and R.R. Lechleitner. 1966. Some comparisons of the black-tailed and white-tailed prairie dogs in north-central Colorado. Am. Mid. Nat. 75:292-316.

Prairie Dog Overpopulation: Value Judgement or Ecological Reality?1
Kirsten Krueger 2
Abstract.--The subject of pra1r1e dog (Cynomys ludovicianus) overpopulation is complex, and judgements of overpopulation may not be based on prairie dog population size or density. Caughley's (1981) model of animal overpopulation is applied here to prairie dogs to clarify the basis for a judgement of overpopulation in each of several cases. There are ecological components to all such cases, but a purely ecological judgement of overpopulation requires much more information than is currently available. However, defensible management of prairie dog systems is a goal, and time-honored but flawed assumptions are never an adequate substitute for results derived from thorough, scientific studies of prairie dog systems as a basis for management actions.
INTRODUCTION
A general model delineating four classes of overpopulation was proposed by Caughley (1981) to clarify the ecological and nonecological values upon which judgements of overpopulation are based. In this paper I use Caughley's model as a framework for a discussion of prairie dog (Cynomys ludovicianus) overpopulation, within which I evaluate the reasons for such judgements in each of several cases. A purely ecological (class 4) judgement of overpopulation applies where prairie dogs cause a change in the typical dynamics and interactions of the plant-animalsoil system, and its structural and functional properties, to the extent that the system approaches or exceeds its boundaries, and is significantly altered from its initial condition. While all classes of overpopulation involve some ecological components, the three remaining classes subsume conflicts where the primary values (e.g., social and economic values) responsible for a judgement of overpopulation are nonecological.
CONFLICTS WITH HUMAN INTERESTS: CLASS !.OVERPOPULATION
Socio-economic values associated with human interests, such as the maintenance of public
1Paper presented at the Eighth Great Plains Wildlife Damage Control Workshop, Rapid City, South Dakota, April 28-30, 1987.
2Kirsten Krueger is Graduate Research Assistant, Natural Research Ecology Laboratory and Department of Zoology, Colorado State University, Fort Collins, Colo.
39
health or healthy rangelands, dominate the public attitude toward prairie dog management. The two most frequently cited problems, plague (Yersinia pestis) transmission and competition with livestock for forage, have questionable significance based on available data. The human cases resulting from plague are so few as to be of no direct ecological consequence. [For example, 3.8% of 105 human plague cases in the United States, 1974-1980, were associated epidemiologically with f. gunnisoni and none with f. ludovicianus (Barnes 1982).] Prairie dogs are extremely susceptible to plague, and outbreaks among them are self-limiting (Barnes 1982). Prairie dog mortality typically exceeds 99% during plague epizootics (Cully 1986, Barnes 1982), after which the disease recedes or moves on, and normally does not regenerate for several years (Barnes 1982).
Recent evidence (Barnes 1982, Quan 1981) indicates that humans must go out of their way to contract plague from prairie dogs. Humans are thought to be incidental to the rodent-to-flea plague cycle because "ample exposure" to the disease during large-scale outbreaks among rodents in 1976 in Colorado produced no human cases (Quan 1981). Plague acquired from prairie dog sources normally results from direct contact with an infected animal rather than the bite of a prairie dog plague flea (Opisocrostis spp.), since the fleas rarely bite humans (Barnes 1982). In addition, the Plague Division of the Center for Disease Control currently has no evidence of prairie dog transmission of plague to livestock (Quan, pers. commun.).
Despite this evidence, the social value of a plague-free human population is undeniable, and prairie dogs are viewed as a threat in the

western and southwestern states, where plague is endemic. However, judgements of overpopulation that are tied to this social value have no ecological basis, and prairie dog population sizes or densities may be largely irrelevant.
On rangelands, economic values seem to be the basis of overpopulation judgements because prairie dogs are viewed as competitors of livestock for forage. While this competition claim (Merriam 1902) is almost as old as ecology itself, it is unsupported by the empirical evidence. Recent examinations of the assumptions, methods, and results of animal competition studies have discredited conclusions asserting the presence and importance of competition in nature (Wiens 1977; Connell 1980, 1983; Strong 1983). These developments have important implications for the prairie dog-livestock conflict. Evidence such as simple prairie dog diet studies (see Fagerstone 1982) or studies of diet similarity or ecological overlap between prairie dogs and livestock (e.g., Hansen and Gold 1977) is now regarded as inadequate to demonstrate competition. More rigorous data are required. For example, a fundamental question where competition is suspected is whether or not the particular plant-animal-soil system shows stable population dynamics or whether unpredictable fluctuations are characteristic. Competition is expected more often under stable, equilibria! conditions where populations fluctuate in a density-dependent manner and where the food resource, in this case, is limiting. In such a system a negative interaction must be demonstrated among putative competitors. In addition, data must be obtained on spatio-temporal scales appropriate to the system and the question. Even when all these conditions are satisfied, competition may act only intermittently due to natural fluctuations in both biotic and abiotic components of the system. Thus, it is no simple matter to gather adequate data to convincingly demonstrate competition.
No such data exist for any prairie doglivestock system, but O'Meilia et al. (1982) and Uresk and Bjugstad (1983) have addressed the interaction question with controlled field experiments. Their results suggest that prairie dog-livestock competition did not occur during their studies. For example, Uresk and Bjugstad (1983) reported higher peak standing crop on prairie dog-only than cattle-only treatments, and also that cattle plus prairie dog treatments had a higher peak standing crop than cattle-only treatments. This indicated that prairie dogs were not responsible for limiting cattle food supplies. Furthermore, O'Meilia et al. (1982) reported no significant differences in steer weight gain in pastures with and without prairie dog grazing, despite reduced herbage availability in pastures containing prairie dogs.
In fact, field experiments (Krueger 1986) and simulation modeling (Vanderhye 1985) have shown mutualistic interactions between prairie dogs and another large ruminant [bison (Bison bison)] and suggest the potential for a positive
40
relationship between pra1r1e dogs and cattle under certain spatio-temporal and habitat conditions.
Clearly, the direct and indirect effects of prairie dogs on livestock are not uniformly negative and could be positive in some situations. However, the potential for competitive interactions cannot be dismissed because previous results have been inconclusive, and may be especially great where livestock are maintained at unstably high densities for protracted periods, under spatially restricted conditions.
From the evidence reviewed above, judgements of overpopulation in cases of prairie doglivestock conflicts do not appear to be examples of actual or potential class 4 ecological problems. Here, prairie dogs are assumed to be responsible for decreased revenues, but the assumption is unsupported. Although O'Meilia et al. (1982) indicated that the market value of steers grown on pastures with prairie dogs was somewhat less than that of steers grown on pastures without prairie dogs in their study, this conclusion stems from a logical flaw in their analysis. Their major result of no significant differences in weight gains between steers on pastures with and without prairie dogs showed differences in steer weights between the two groups to be statistically indistinguishable. Consequently, it is inappropriate to discuss the two groups as distinct, in market value or other comparisons. The unsupported assumption that pra1r1e dogs are responsible for decreased revenues is itself based on prior unsupported ecological assumptions related to competition, although the potential for economic losses due to competition is certainly real, and the potential for competition sometimes high. As in the case of prairie dogs and plague, prairie dog population sizes or densities may be unrelated to economically motivated but ecologically unsupported judgements of overpopulation in prairie dog-livestock interactions, based on current evidence.
REDUCTION OF PREFERRED SPECIES: CLASS 2 OVERPOPULATION
Class 2 overpopulation applies where pra1r1e dogs reduce densities of their plant and animal associates preferred by man, especially livestock forage species. Although this is an example of an indirect class 1 problem, it is directly a class 2 concern and therefore addressed here.
Recent studies have reported significant declines in the number of perennial species on prairie dog towns (Lerwidk 1974) and in the grass:forb ratio on portions of dog towns (Bonham and Lerwick 1976, Coppock et al. 1983, Krueger 1986), under combined ungulate-prairie dog grazing. Uresk and Bjugstad (1983) reported a slight (6%) decline in grass production on a prairie dog versus cattle grazing treatment. In

addition, Agnew et al. (1986) found fewer small rodent species on prairie dog towns than on undisturbed mixed-grass prairie, and concluded that prairie dog activities negatively affect rodents associated with the dense vegetation of uncolonized mixed-grass prairie.
In contrast, a number of studies have reported enhancement of prairie dog associates, including increases in plant cover, density (Uresk and Bjugstad 1983, Koford 1958, Bonham and Lerwick 1976), species diversity (Coppock et al. 1983, Bonham and Lerwick 1976), forage nitrogen concentration (Coppock et al. 1983, Krueger 1986) and digestibility (Coppock et al. 1983). Some animal species also show a positive response to prairie dogs. For example, Agnew et al. (1986) found increased densities of deer mice (Peromyscus maniculatus), grasshopper mice (Onychomys leucogaster), and bird densities and diversities on prairie dog towns. O'Meilia et al. (1982) reported increased small mammal and arthropod biomass on dog towns. Clark et al. (1982), Hansen and Gold (1977), and Uresk and Bjugstad (1983) found that prairie dogs improved habitat for any animals that are benefited by holes or short or sparse vegetation, such as burrowing owls (Athene cunicularia) and other birds, desert cottontails (Sylvilagus audubonii), rattlesnakes (Crotalis viridis), and other prairie dog predators.
While the depression or enhancement of preferred prairie dog associates can involve complex ecological interactions, these changes have not been shown to constitute class 4 problems. Nor are the changes uniformly negative. Judgements of class 2 overpopulation seem motivated by conflicts of economic values with putative monetary losses presumed due to prairie dog preemption of livestock forage. Like prairie dog-livestock competition, there is still no direct evidence to verify the assumption that where prairie dogs reduce the densities of livestock forage species, these reductions negatively affect lifestock or cause decreased revenues. The potential for negative ecological and economic effects from prairie dog reductions of livestock forage species is certainly real, and especially large where pasture size is limited and livestock densities maintained at high levels over protracted periods. However, without the necessary ecological evidence, class 2 economic judgements will continue to be based on unsupported economic and ecological assumptions. Prairie dog densities or numbers may again be largely irrelevant.
"FOR THEIR OWN GOOD": CLASS 3 OVERPOPULATION
No examples of the class 3 argument, that prairie dogs harm themselves by being too numerous or densely populated for their own good, have been reported. A class 3 argument would likely be invoked only where prairie dogs enjoy
41
"protected" status, as in a national park or privately owned nature preserve.
In the absence of sufficient scientific study, and where population levels were presumed high, density-dependent effects such as rodent stress syndrome (Vaughan 1978) could be invoked to support the argument that individual pra1r1e dogs were suffering from overpopulation. It is unknown whether prairie dogs are susceptible to stress syndrome, but considerable evidence suggests that some rodent species possess population self-regulatory mechanisms involving densitytolerant aggressive genotypes and densityintolerant dispersing genotypes (Vaughan 1978). In theory, prairie dog populations with these genotypes would be capable of density selfregulation and could potentially avoid the negative effects of rodent stress syndrome. Another argument, that of high ectoparasite load per individual (Hoogland 1979, 1981), could also be invoked to support a class 3 claim, but its ecological correlate, namely decreased predation risk per individual, compensates for negative effects of ectoparasites in prairie dogs (Hoogland 1981).
Thus, there is no current evidence to show that prairie dogs suffer as a direct result of high numbers or densities of conspecifics. Further study is needed to determine whether and when class 3 overpopulation applies to prairie dogs.
POTENTIAL ECOLOGICAL CRISIS: CLASS 4 OVERPOPULATION
A case of class 4 overpopulation will likely have socio-economic and political ramifications, but the judgement itself is based on purely ecological considerations. A class 4 judgement applies where prairie dog numbers or densities cause a change in the typical dynamics and interactions, and the structural and functional properties of the system, to the extent that the system approaches or exceeds its boundaries and is significantly altered from its initial condition. The information needed to define cases of class 4 overpopulation thus includes a knowledge of typical population dynamics and interactions of system components and how they vary, the location and character of system boundaries, and their relation to increases in prairie dog numbers and densities. None of this information is currently available for any prairie dog system.
Nonetheless, some theoretical possibilities exist. First, prairie dog populations may exhibit point or oscillatory equilibria! dynamics, at one or more stable levels, or their population densities might fluctuate in a stochastic manner (fig. 1) (Caughley 1981, Noy-Meir 1975, May and Reddington 1981, Sinclair 1981). Interactions among system components, such as plants and herbivores, may be tightly coupled and stable (fig. 2), unstable, or loosely coupled

w A N U> z 0 D r-; <( _j :::> u. c 0 n.
TIME
Figure 1.-- Types of population dynamics: (A) stable point equilibrium, (B) stable cycle; (C) chaotic flux (adapted from May 1981).
(Caughley 1981, May and Beddington 1981, Noy-Heir 1981, Sinclair 1981). Populations of plants and animals may fluctuate stably within system boundaries (fig. 3a) or above (fig. 3b) or below these thresholds (Noy-Meir 1981, Sinclair 1981). An upswing in prairie dog population densities or numbers may push the system to a breakpoint (May 1977) [perhaps a common occurrence in vegetationherbivore systems (Noy-Meir 1981) and especially anticipated if prairie dogs were an ecological keystone species], beyond which the system either cannot return to its ground state (May and Beddington 1981, Walker 1981), or can return only with significant external input. If the system bounds are not exceeded, the components of the system would be expected to recede over time to equilibrium levels or to levels of stochastic flux within the original system boundaries. Alternatively, if the system bounds are exceeded due to a prairie dog population upswing, the structural and functional components of the original system are expected to shift to a condition that no longer constitutes the ground state. Rather, some alternate state is assumed. The system itself may contain several alternate states (fig. 4) (May and Beddington 1981,
w N CJ)
z 0
~ _J :::> a 0 a.. L---------------
TIME Figure 2.--Tightly coupled stable interaction
between plant community (- - -) and herbivore population (----) (adapted from Sinclair 1981).
42
A
8
TlME Figure 3.--(A) Region within which an herbivore
population will return to the same equilibrium position; (B) herbivore population flux above upper threshold of system (adapted from Sinclair 1981).
Sinclair 1981) into which the shift may occur. Or the shift might be to a state outside the original system (fig. 5). Theorists speculate that these shifts will probably be deleterious, leaving the new system potentially irreversibly degraded (Noy-Meir 1981, May and Beddington 1981). Obviously, massive research efforts will have to be undertaken before class 4 overpopulation is understood for even one prairie dog system.
MANAGEMENT OF PRAIRIE DOG OVERPOPULATION
Although management of overpopulation will vary in each case according to the land-use goals and predominant values that have defined the type of overpopulation, the incorporation of ecologically defensible actions in management plans
Figure 4.--Theoretical system containing two alternate states (after Noy-Meir 1975).

Figure 5.--Theoretical system undergoing shift to state outside original system, indicated by arrow leaving system domain (dish) (adpated from Holling 1973).
could enhance their success and facilitate the achievement of land-use goals.
For example, in cases of class 1 and 2 overpopulation, where prairie dogs appear to be in conflict with economic land-use goals, managers need to determine whether prairie dogs are actually causing economic problems by first studying the relevant ecological interactions closely. There is a critical need for correctly executed and interpreted studies of putative competition. Replicated field experiments at the appropriate local scale (Wiens 1986) represent the best way to demonstrate prairie dog-livestock competition. Experimental results can then be used to demonstrate related economic effects. Where prairie dogs are not implicated in economic and ecological declines, managers must suspect livestock as major contributors to such declines (Schenbeck 1986). Livestock densities are often held at unstably high levels (Noy-Meir 1981), which put the system at risk of long-term deteriorations, fluctuations or even state shifts. Prairie dogs may simply amplify a preexisting livestock-generated problem. Efforts to control prairie dogs where livestock are the primary offenders will not solve ecological problems and may increase rather than ease the land user's economic (Collins et al. 1984) and ecological burdens. However, where prairie dogs or prairie dogs and livestock are definitely responsible for depressed yield and income or are pushing the system toward its boundaries, prairie dogs must be reduced in a cost-effective manner and livestock densities concurrently reduced as well (Schenbeck 1986; see also Uresk et al. 1982, Snell and Hlavachick 1980, Snell 1985). In this way, long-term deteriorations or violent fluctuations in the system are avoided, and economic and ecological stability are promoted (Noy-Meir 1981).
In class 1 cases where plague is a concern, the self-limiting nature and transmission characteristics of the disease (Barnes 1982, Quan 1981) support a hands-off management policy. Because
43
plague will come and go unpredictably through prairie dog populations, and because prairie dog populations themselves may have unpredictable dynamics, the most ecologically and economically sensible approach seems to be simply avoiding contact with plague-infested populations and plague-killed carcasses, rather than launching expensive eradication campaigns against prairie dogs or plague, since these campaigns normally have limited, short-term success (e.g., Barnes et al. 1972). However, where large human populations are in constant contact with plagueinfested prairie dogs, continuous plague eradication campaigns may be the only viable management option given prevailing social values and concerns.
In cases of class 2 overpopulation, managers must first recognize that the inherently dynamic nature of ecological systems will inevitably result in some changes in the abundance of plant and animal associates of prairie dogs. Local extinction of some of these species might even occur as a normal event (Sinclair 1981). In general, reduction of a few plant species in an array of food types does not constitute grounds for a declaration of overabundance (Sinclair 1981). Furthermore, a "play-safe" policy that is too conservative in its estimates of permissible abundance for prairie dogs and their plant or animal associates may encourage the loss of resistant and resilient genotypes (Noy-Meir 1981) among these species, as well as declines in overall system resistance (Walker 1981). Where prairie dog reduction of preferred species is suspected, efforts similar to those required to demonstrate competition will be needed to demonstrate the role of prairie dogs in any such reductions, and whether there are any significant associated economic effects. As long as the changes in densities of prairie dog associate populations do not constitute prairie dog-induced class 4 overpopulation, or have proven economic significance, a management program that encourages maintenance of resistant and resilient genotypes and maintenance of system resistance is preferable to economically (Collins et al. 1984) and ecologically indefensible programs that potentially endanger the system and bankrupt the land owner over a period of years.
If class 3 overpopulation were demonstrated, managers necessarily would have to reduce prairie dog densities or numbers in accord with the prevailing (social) value behind this type of judgement, namely, the prevention of suffering among prairie dogs.
Examples of class 4 overpopulation are currently theoretical but have abundant socioeconomic and political implications for any cases empirically demonstrated in the future. The ecological consequences of a state shift caused by class 4 overpopulation are manifold and potentially long-lived, deleterious, and irreversible. Management of class 4 cases will likely be directed toward avoiding the potentially devastating consequences of a state shift into an

· .. ··.
irretrievably degraded system and may be accomplished by reductions of densities or overall numbers of prairie dogs or other species responsible for pushing the system toward its limits. The fact that some class 1 and class 2 cases exhibit elements of class 4 overpopulation emphasizes the need for research on prairie dog population dynamics, the interactive dynamics of the components of prairie dog systems, and the location of system-specific boundaries in relation to these dynamics and interactions. These results would help managers recognize whether and when an ecological crisis might actually be at hand and help distinguish class 4 situations from the more prevalent but less critical class 1 and class 2 cases.
Clearly, socio-economic values and assumptions that are disconnected from the ecological realities of prairie dog systems can be the basis for flawed and indefensible judgements of overpopulation, as well as costly errors in management. In management plans, long-accepted assumptions are not adequate substitutes for results from thorough studies of prairie dog systems. Managers must use the knowledge gained from such studies to simultaneously promote socio-economic and ecological values and defensible prairie dog management over the long run so that land-use goals can be achieved.
LITERATURE CITED
Agnew, W., D.W. Uresk, and R.M. Hansen. 1986. Flora and fauna associated with prairie dog colonies and adjacent ungrazed mixed-grass prairie in western South Dakota. J. Range Manage. 39:135-139.
Barnes, A.M. 1982. Surveillance and control of bubonic plague in the United States. Symp. Zool. Soc. Lond. 50:237-270.
Barnes, A.M., L.J. Ogden, and E. G. Campos. 1972. Control of the plague vector, Opisocrostis hirsutis, by treatment of prairie dog (Cynomys ludovicianus) burrows with 2% carbaryl dust. J. Med. Entomol. 9:330-333.
Bonham, C.D., and A. Lerwick. 1976. Vegetation changes induced by prairie dogs on shortgrass range. J. Range Manage. 29:221-225.
Caughley, G. 1981. Overpopulation. p. 7-19. In Problems in management of locally abundant wild mammals (P.A. Jewell, S. Holt, and D. Hart, eds.). Academic Press, New York.
Clark, T.W., T.M. Campbell, III, D. G. Socha, and D. E. Casey. 1982. Prairie dog colony attributes.and associated vertebrate species. Great Basin Nat. 42:572-582.
Collins, A.R., J.P. Workman, and D.W. Uresk. 1984. An economic analysis of black-tailed prairie dog (Cynomys ludovicianus) control. J. Range Manage. 37:358-361.
Connell, J.H. 1983. Diversity and the coevolution of competitors, or the ghost of competition past. Oikos 35:131-138.
44
Connell, J.H. 1983. On the prevalence and relative abundance of interspecific competition: Evidence from field experiments. Am. Nat. 122:661-696.
Coppock, D.L.; J.K~ Detling, J.E. Ellis, and M.I. Dyer. 1983. Plant-herbivore interactions in a North American mixed-grass prairie. I. Effects of black-tailed prairie dogs on intraseasonal aboveground biomass and nutrient dynamics and plant species diversity. Oecologia 56:1-9.
Cully, J.F., Jr. 1986. A model to explain the maintenance of sylvatic plague in a simple rodent community. Abstract, 1 p., 12th Meeting, Guild Rocky Mountain Population Biologists, September 26-28, 1986, University of Colorado Mountain Research Station, Gothic, Colo.
Fagerstone, K.A. 1982. A review of prairie dog diet and its variability among animals and colonies. pp. 178-184. In Proceedings, 5th Great Plains Wildlife Damage Control Workshop, October 13-15, 1981 (R.M. Timm and R.J. Johnson, eds.), University of Nebraska, Lincoln.
Hansen, R.M., and I.K. Gold. 1977. Black-tailed prairie dogs, desert cottontails and cattle trophic relations on shortgrass range. J. Range Manage. 30:210-213.
Hoogland, J.L. 1979. Agression, ectoparasitism, and other possible costs of prairie dog (Sciuridae, Cynomys spp.) coloniality. Behaviour 69:1-34.
Hoogland, J.L. 1981. The evolution of coloniality in white-tailed and black-tailed prairie dogs (Sciuridae Cynomys leucurus and C. ludovicianus). Ecology 61:252-272.
Kelso~ L.H. 1939. Food habits of prairie dogs. USDA Circular No. 529.
Koford, C.B. 1958. Prairie dogs, whitefaces and blue grama. Wildlife Monograph 3.
Krueger, K. 1986. Feeding relationships among bison, pronghorn and prairie dogs: An experimental analysis. Ecology 67:760-770.
Lerwick, A.C. 1974. The effects of the blacktailed prairie dogs on vegetative composition and their diet in relation to cattle. M.S. thesis. Colorado State University, Fort Collins.
May, R.M. 1977. Thresholds and breakpoints: Ecosystems with a multiplicity of stable states. Nature 269:471-477.
May, R.M., and J.R. Beddington. 1981. Notes on some topics in theoretical ecology in relation to the management of locally abundant populations. p. 205-216. In Problems in management of locally abundant wild mammals (P.A. Jewell, S. Holt, and D. Hart, eds.). Academic Press, New York.
Merriam, C.H. 1902. The prairie dog of the Great Plains. p. 257-270. In Yearbook of the Department of Agricultur~ 1901. U.S. Government Printing Office, Washington, D.C.
Noy-Meir, I. 1975. Stability of grazing systems: An application of predator-prey graphs. J. Ecol. 63:459-481.
Noy-Meir, I. 1981. Responses of vegetation to the abundance of mammalian herbivores. p. 233-246. In Problems in Management of locally abundant wild mammals (P.A. Jewell, S. Holt, and D. Hart, eds.). Academic Press, New York.
O'Meilia, M.E., F.L. Knopf, and J.C. Lewis. 1982. Some consequences of competition between prairie dogs and beef cattle. J. Range Manage. 35:580-585.
Quan, T.J. 1981. Yersinia pestis. p. 1240-1247. In The prokaryotes (M.P. Starr, H. Stolp, ~G. Truper, A. Balows, and H.G. Schlegel, eds.). Springer-Verlag, Berlin.
Schenbeck, G.L. 1986. Black-tailed prairie dog management on the northern Great plains. p. 28-33. In Proceedings, 7th Great Plains Wildlife Damage Control Workshop, December 3-5, 1985 (D.B. Fagre, ed.). Texas A&M University, College Station.
Sinclair, A.R.E. 1981. Environmental carrying capacity and the evidence for overabundance. p. 247-257. In Problems in Management of locally abundant wild mammals (P.A. Jewell, S. Holt, and D. Hart, eds.). Academic Press, New York.
Snell, G.P. 1985. Results of control of prairie dogs. Rangelands 7:30.
Snell, G.P., and B.D. Hlavichick. 1980. Control of prairie dogs--the easy way. Rangelands 2:239-240.
Strong, D.R. 1983. Natural variability and the manifold mechanisms of ecological communities. Am. Nat. 122:636-660.
45
Uresk, D.W., J.G. MacCracken, and A.J. Bjugstad. 1982. Prairie dog density and cattle grazing relationships. p. 199-201. In Proceedings, 5th Great Plains Wildlife Damage Control Workshop, October 13-15, 1981 (R.M. Timm and R.J. Johnson, eds.). University of Nebraska, Lincoln.
Uresk, D.W., and A.J. Bjugstad. 1983. Prairie dogs as ecosystem regulators on the northern high plains. p. 91-94. In Proceedings, 7th North American Prairie Conference, August 4-6, 1980. Southwest Missouri State University, Springfield.
Vanderhye, A.V.R. 1985. Interspecific nutritional facilitation: Do bison benefit from feeding on prairie dog towns? M.S. thesis. Colorado State University, Fort Collins.
Vaughan, T.A. 1978. Mammalogy. Saunders College Publishing, Philadelphia, Pa.
Walker, B.H. 1981. Stability properties of semiarid savannas in southern African game reserves. p. 57-67. In Problems in Management of locally abundant wild mammals (P.A. Jewell, S. Holt, and D. Hart, eds.). Academic Press, New York.
Wiens, J.A. 1977. On competition and variable environments. Am. Sci. 65:590-597.
Wiens, J.A. 1986. Spatial scale and temporal variation in studies of shrubsteppe birds. p. 154-172. In Community ecology (J. Diamond and T.J.-case, eds.). Harper & Row Publishers, New York.

Efficacy of Deferred Grazing in Reducing Prairie Dog Reinfestation Rates1
Kelly A. Cable2 and Robert M. Timm3
Abstract.--Population growth of black-tailed pra1r1e dogs (Cynomys ludoyicianus) was studied in 1985 and 1986 at 20 prairie dog towns on short- and mixed-grass rangeland in western Nebraska, to determine the efficacy of 2 years deferred (May 1 -Sept. 1) grazing in reducing population growth rates following population reduction. In 1985, population growth measures on deferred sites were not significantly different from grazed sites, perhaps due to drought conditions. In 1986, natality and population growth (% increase in animals) were significantly lower on deferred sites than on sites grazed by livestock. Deferred sites studied both years showed significant reductions in 1986 active area: 4 of 5 deferred sites decreased in size; 6 of 8 grazed sites increased in size. Results of this study suggest that deferred grazing may be effective in r~ducing reinfestation rates of prairie dogs following control, given favorable vegetative growth conditions.
INTRODUCTION
Historically a target of control efforts, prairie dog populations have been increasing since the institution of restrictions on the use of principal rodenticides in 1972 (Fagerstone 1982, Knowles 1982) and the cessation of federal animal damage control (ADC) activities aimed at prairie dogs. Legal control techniques typically employed to reduce prairie dog populations include poison bait application, fumigation, and shooting. Although these methods ~ay result in immediate population reduction, they frequently do not produce a long term decrease in animal numbers for a particular site unless applied regularly. Repopulation of treated prairie dog colonies has
1Paper presented at the Eighth Great Plains Wildlife Damage Control Workshop [Rapid City, S.D., April 28-30, 1987].
2Kelly A. Cable received her M.S. degree in Forestry, Fisheries & Wildlife at the University of Nebraska-Lincoln in May 1987.
3Robert M. Timm is Extension Vertebrate Pest Specialist and Associate Professor in the Dept. of Forestry, Fisheries & Wildlife at the University of Nebraska-Lincoln.
46
been a recurring problem. On western U.S. Forest Service lands, retreatment of treated colonies appears to be necessary at least every 3 years (Schenbeck 1982). The necessity of frequent retreatment, and the cost of such control methods, have sparked interest in developing other methods of prairie dog population regulation or control. This paper presents the results of a study evaluating the efficacy of 2 years of deferred (May 1 - Sept. 1) livestock grazing in reducing reinfestation rates of black-tailed prairie dogs (Cynomys ludoyicianus) on short- and mixed-grass rangeland in western Nebraska.
BACKGROUND
In recent years, there has been increasing interest in potential ecological relationships between prairie dog population growth and large ungulate grazing. The establishment and growth of prairie dog towns appears to be favored by intensive cattle grazing (Knowles 1982). Apparently, prairie dogs thrive best in shortgrass habitats, or mid- and tall-grass areas which receive heavy livestock use. Knowles (1982) suggests that prairie dogs probably cannot maintain towns in mixed-grass habitat without the influence of large ungulate grazing, except if
sites have inherently low productivity. It is theorized that the prairie dog's visual predator detection system is aided by the maintenance of short vegetation; additionally, it is possible that prairie dogs in taller vegetation may undergo some stress factor, or may have a reduction in natality brought about by nutritional shortages or social pressures (Snell and Hlavachick 1980).
The initial work investigating prairie dog -livestock grazing relationships suggests that the removal of livestock grazing from prairie dog towns may allow enough of a release from grazing pressure to result in a response from the vegetation. The increased vegetative growth, or response, appears to have a negative impact on prairie dog populations. Knowles (1982) observed that of 3 prairie dog towns (mixed-grass range) where cattle grazing had not occurred for 7 to 10 years, one town was inactive, and two were greatly reduced in siz.e. Uresk and Bjugstad ( 1983) observed a reduction in active burrow densities when cattle were excluded from pastures with prairie dogs, which they attributed to the occurrence of taller vegetation. Uresk, et al. (1982) found that burrow densities in southwestern South Dakota on sites grazed by cattle increased at twice the rate of sites not grazed. An ungrazed exclosure on a town in mixed-grass appeared to contain a prairie dog population that was heavily dependent on immigrants to maintain animal numbers (Knowles 1982).
In an uncontrolled test, a 110 acre prairie dog town in Barber County, Kansas (25 inches average annual rainfall) was reduced to 12 acres in size following 4 successive seasons of deferred (June - August) livestock grazing (Snell and Hlavachick 1982). Located on a range site with the potential for mid-grasses, only short-grasses were observed prior to deferral, due to poor range condition. Snell and Hlavachick attribute vegetative recovery to dormant rootstock present. After 8 years, this town was 0.2 acres in size (Anonymous 1984).
Recent work in mixed-grass range of western South Dakota suggests that vegetative response to a release in grazing pressure may occur at a very slow rate. Uresk (1985) found that controlling prairie dogs did not result in a positive increase in forage production after 4 years. Uresk and Bjugstad (1983) suggest that total exclusion from herbivores (cattle and prairie dogs) for 9 or more years may be required to increase forage production when range is in a low condition class. Because of the observed slow vegetative recovery, it was theorized that· any potential vegetative response to deferred livestock grazing in western Nebraska might be aided by concurrently reducing prairie dog grazing pressure through population reduction.
MElli ODS
Twenty and 18 prairie dog towns were used as study sites in 1985 and 1986, respectively. All
47
of the sites were located in the short- and mixedgrass rangeland of western Nebraska (14 - 17 inches average annual precipitation). Deferral of livestock grazing was during the period of May 1 to Sept. 1; landowners were permitted to winter pasture livestock or hay deferred pastures Sept. -April. Cooperating landowners reported a range of 4 to 15 acres per animal unit month (AUM) livestock stocking rate on grazed pastures.
All of the sites had reduced prairie dog densities (1.5 - 10.9 adults/ha) through one or a combination of 3 methods applied within 2 years of the onset of the study: shooting, poison bait application, or fumigation. Three measures of population growth (increase in animal density, % increase in animals, and pup:adult ratio) were based on visual population censuses conducted in spring and late summer. Pup:adult ratio was treated as an indication of natality, and was based on the spring census. Increase in animal density and % increase in animals were based on growth in terms of the difference between the number of adult prairie dogs present on sites in spring, and the total number of prairie dogs present in late summer. These 2 population growth measures incorporate but do not discriminate between natality, immigration, emigration, and survivorship during that period. Town areas (ha) were measured in June of each year by mapping the outermost active prairie dog burrows.
RESULTS AND DISCUSSION
In 1985, no significant differences were found between treatments for any of the population growth measures (see Table 1). In 1986, 2 of the 3 population growth measures were lower for the deferred treatment than for the grazed treatment. Pup:adult ratio and % increase in animals were significantly lower on deferred sites than on sites grazed by livestock (P>t=0.06 and P>t=0.02, respectively). Statistical comparisons of population growth measures between years of the study are probably not valid, because environmental conditions affecting prairie dog populations varied considerably. However, examination of mean growth values (Table 1) reveals that all 3 population growth measures increased from 1985 to 1986 on grazed sites, whereas all growth measures decreased on deferred sites. Precipitation received at study sites did not differ significantly between treatments, but did differ between study years (P>Itl=0.001). 1985 was a dry year in the Nebraska Panhandle, and some study sites received as little as 55% of the normal rainfall. 1986 was a much wetter year, with many study sites receiving normal or slightly above average rainfall.
Change in town size is a growth measure of interest to landowners, who may equate extent of damage with extent of colony area. However, change in town size does not necessarily reflect degree of damage to rangeland vegetation, which may vary with prairie dog density, and does not necessarily reflect other measures of population

Table 1.--Population growth values.
PQ~Ylat1QD grQHth measyr~ Year
Increase in animal density 1985 Increase in animal density 1986
Increase in animal density 1985 Increase in animal density 1986
% Increase in animals 1985 % Increase in animals 1986
% Increase in animals 1985 % Increase in animals 1986
Pup:Adult ratio 1985 Pup:Adult ratio 1986
Pup:Adul t ratio 1985 Pup :Adult ratio 1986
1n = deferred 2a = grazed
growth. Active areas of sites ranged from 0.4 to 20.3 ha. Active areas for deferred treatment sites decreased significantly from 1985 to 1986 (P>t=0.07): 4 of the 5 deferred treatment sites used in both years of the study decreased in area inhabited by prairie dogs, with a mean decrease on the 4 declining towns of 49%, and mean overall change in size of the deferred treatment towns of -37%. Conversely, 6 out of 8 grazed sites increased in active area (P>t=0.04), with a mean increase on the 6 expanding towns of 42%, and mean overall change in size of grazed treatment towns of +25%.
A decrease in area inhabited by pra1r1e dogs does not necessarily imply a decrease in prairie dog numbers or density: town contraction may result in a net increase in density. One study site decreased 51% in active area from 7.2 ha in 1985 to 3.5 ha in 1986. However, number of spring adult prairie dogs increased from 12 (1.7 adults/ha) in 1985 to 21 (6 .0 adults/ha) in 1986, a net increase in animals of 43% and a net increase in density of 253%. Knowles (1982) observed a 47% increase in acreage over a 2 year period, with a concurrent decline in density of 30.6 to 19.6 prairie dogs/ha. Knowles noted the change in density appeared to be correlated (r2=0.85) with precipitation: two dry years occurred with low vegetative production, and the prairie dogs expanded into adjacent, abandoned areas. Rainfall would not appear to be the sole controlling factor in western Nebraska, because precipitation did not differ significantly between expanding and nonexpanding towns. However, the combined influence of rainfall and livestock grazing on vegetation may have contributed to changes in town area. Low 1985 precipitation and livestock grazing and trampling would tend to result in low height and density of grazed-site vegetation, and encourage expansion by prairie
N
8 8
12 9
8 8
12 9
8 8
12 9
48
Trt. X s.n. Rang~
n1 9.9 9.7 0.0 - 26.9 D 6.6 6.6 0.0 - 17.2
a2 5.7 4.6 1.6 13.8 G 8.9 4.5 3.3 - 17 .o
D 148.8 88.4 0.0 - 259.0 D 87 .o 80.9 0.0 - 242.0
G 152.6 97.3 82.0 416.0 G 179.6 88.3 67.0 - 363.0
D 2.2 1.0 1.0 - 3.7 D 1.4 0.9 0.1 - 2.4
G 1 • 8 1.1 o.o - 4.2 G 2.1 0.9 0.7 - 3.8
dogs into adjacent areas. Absence of livestock grazing on deferred sites, in combination with high 1986 precipitation, may result in greater vegetative height and density on deferred sites, and discouragement of prairie dog expansion.
Visual observations on deferred treatment sites suggest that as town area contracts, prairie dog activities become less generally distributed across colonies, and clumps, or centers of activity result. These clumps of prairie dogs appear to be separated by relatively taller, sparse vegetation.
MANAGEMENT IMPLICATIONS
Results from this study suggest deferred grazing may be an effective management tool in reducing prairie dog reinfestation rates. The efficacy of deferred grazing in the mixed- and short-grass rangeland of western Nebraska would appear to be heavily dependent on rainfall. Below average rainfall would appear to limit vegetative response to a release from grazing pressure, and result in prairie dog population growth rates similar to those seen on sites with higher grazing pressure. The efficacy of deferred grazing would also be expected to vary with the natural productivity capacity of specific sites.
Within the constraints of the study (i.e. town size 0.4- 20.3 ha; 1.5- 23.6 adults/ha), colony size and initial prairie dog density would not appear to reduce the efficacy of deferred grazing in reducing population growth rates of prairie dogs. However, large towns and prairie dog densities more typical of uncontrolled towns were not studied. The ability of high prairie dog densities to limit potential vegetative response to removal of livestock grazing pressure may

exist. If so, the application of deferred grazing is probably most efficacious as a method of reducing population growth when applied soon after population reduction.
LITERATURE CITED
Anonymous. 1984. Good-bye, prairie dog town! Beef 21{4):67-68.
Fagerstone, K.A. 1982. A review of prairie dog diet and its variability among animals and colonies. p. 178-184. ln Proc. Fifth Great Plains Wildlife Damage Control Workshop, [Lincoln, Neb., Oct. 13-15, 1981]. R.M. Timm and R.J. Johnson, eds., Univ. of Nebraska.
Knowles, C.J. 1982. Habitat affinity, populations, and control of black-tailed prairie dogs on the Charles M. Russell National Wildlife Refuge. Ph.D. thesis, Univ. Mont. 171 pp.
49
Schenbeck, G.L. 1982. Management of black-tailed prairie dogs on the National Grasslands. p. 207-213. ln Proc. Fifth Great Plains Wildlife Damage Control Workshop, [Lincoln, Neb., Oct. 13-15, 1981]. R.M. Timm and R.J. Johnson, eds., Univ. of Nebraska.
Snell, G.P., and B.D. Hlavachick. 1980. Control of prairie dogs: the easy way. Rangelands 2(6):239-240.
Uresk, D.W. 1985. Effects of controlling blacktailed prairie dogs on plant production. J. Range Mgt. 38(5):466-468.
Uresk, D.W., and A.J. Bjugstad. 1983. Prairie dogs as ecosystem regulators on the Northern High Plains. p. 91-94. ~Seventh North American Prairie Conference Proc., Aug. 4-6, 1980, s.w. Missouri State Univ., Springfield.
Uresk, D.W.; J.G. MacCracken; and A.J. Bjugstad. 1982. Prairie dog density and cattle grazing relationships. p. 199-201. In Proc. Fifth Great Plains Wildlife Damage Control Workshop, [Lincoln, Neb., Oct. 13-15, 1981]. R.M. Timm and R.J. Johnson, eds., Univ. of Nebraska.

Management of Prairie Dog Populations in Wind Cave National Park1
Richard W. Klukas2
Abstract.--Since the late 1920's there have been periodic control programs on black-tailed prairie dogs in Wind Cave National Park. The most recent control effort, which began in 1982, resulted in the reduction of total dogtown acreage from 2,000 to 750 acres. Recent studies carried out within the park have provided managers with more soundly based justification for carrying out control programs. The same information also points to the importance of maintaining prairie dog populations at or above certain minimum levels and the need for integrating this control program with several of the other resource management programs being carried out in the area.
INTRODUCTION
In 1903 the United States Congress established Wind Cave as a 10,840 acre national park. The area was set aside due to its cave resources and for the potential which it held as a reintroduction site for species such as elk, bison and pronghorn. Additional lands were added to the park over time so that by 1946 its boundaries encompassed roughly 28,000 acres.
As the park grew its ungulate herds (bison, elk and antelope) were allowed to increase in size. The earliest wildlife management activities centered on regulating bison and elk herd sizes and controlling predator species such as coyotes and bobcats. Black-tailed prairie dogs (Cynomys ludovicianus) were also considered to be in need of regulation as evidenced by sketchy accounts and records in park files dating back to the 1920's and 1930's. In those early years management of wildlife populations deemed-to be in need of control was based largely on instinctive reactions, and trial and error experiences. In recent years the development of ecological concepts and understandings, as well as their application, has led not only to a tolerance of the prairie dog but to an appreciation of its role in maintaining a dynamic natural setting for other native plants and animals.
1 Paper presented at the 8th Great Plains Damage Control Workshop. (Rapid City, SD, April 26-30. 1987) 0
~Richard W. Klukas is a research biologist at Wind Cave National Park, Hot Springs, South Dakota
50
These new insights and a vastly improved attitude toward prairie dogs would not have come about were it not for a considerable number of recent studies which have been recently conducted both within Wind Cave and adjacent areas. The primary purpose of Lhis paper is to discuss some of this recent work and describe a possible future course for the management of black-tailed prairie dogs in Wind Cave National Park.
RESEARCH FOCUSED ON MANAGEMENT QUESTIONS
Most prairie dog studies in the park have been conducted by graduate and post-graduate researchers. In nearly all cases the immediate study goals of these persons were not focused on answering questions that were of concern to managers. Nevertheless their work often produced information that allowed for important insights far beyond what was anticipated. Such findings will be discussed later in this paper. The National Park Service however, has carried out studies which dealt primarily with problems and questions perceived to be critical to the establishment of a suitable prairie dog management program. These studies were carried out through research contracts or by park personnel.
With respect to the prehistoric occurrence of dogtowns, Carlson (1986) and White (1986) determined that prairie dog colonies have been present on lands within the park for at least the past several thousand years. In addition, White speculated that dogtowns appear to have contracted, expanded or were abandoned or recolonized depending on major shifts in climate.
Garrett and Franklin (1982) studied movements of prairie dogs (immigration) to determine the extent that prairie dogs from the park might contribute to the establishment and growth of towns on lands beyond its boundaries.

Garrett and Franklin (1982) in addition experimented with visual barriers as a means of reducing, halting or directing the expansion of dogtowns.
Garrett and Franklin (1983) and later Klukas (unpublished) used Diethylstilbestrol (DES) to determine if prairie dog population management could be achieved by limiting natality. Population regulation through use of smoke bombs, rim and center fire rifles and zinc phosphide was also tested by park personnel. Among all the approaches to control that were tested, that involving the use of zinc phosphide treated baits proved most effective and practical.
OTHER STUDIES RELATING TO PRAIRIE DOGS
The earliest prairie dog research carried out in Wind Cave was a study on behavioral and life history characteristics by J. A. King in 1955. J. Hoogland came to the park in the mid 1970's to explore more fully the behavioral characteristics of blacktails and continues at present in that pursuit. King and Hoogland have uncovered a substantial body of information of importance to other researchers (i.e. ecologists, behaviorists, geneticists, etc.) as well as to those interested in the management of prairie dog populations (King 1955, Hoogland 1979, 1981, 1985).
Coppock was among the first of many ecologists who was able to enhance their investigations through use of information obtained from earlier studies by King and Hoogland (Coppock, et al, 1983). Coppock and associates' determination that prairie dogs were affecting bison grazing patterns led to a number of subsequent related studies by fellow graduate students and staff of the Natural Resources Ecology Laboratory at Colorado State University. Among the findings of this group were that: prescribed fire can be used to reduce bison grazing activities on dogtowns (Coppock and Detling 1986); and that summer grazing of dogtowns by bison offered significant nutritional advantages (Ravndal 1985). These and various other findings of no less significance are described more fully in another paper to be presented at this workshop by James Detling and April Whicker (see: Control of Ecosystem Processes by Prairie Dogs and Other Grassland Herbivores).
While many of the above behavioral and ecological studies were being carried out by visiting researchers the National·Park Service was undertaking studies to determine the importance of prairie dogs as a food source for predators. During the period 1975 to p_resent 38 prairi.e dog predations were observed and recorded. Although six predator species contributed to this total only the coyote, with 17 predations (45%), appeared to demonstrate somewhat of a reliance on the prairie dog as a dietary subsistence item. A concurrent study on coyote food habits by Franklin et al (in writing) appears to verify this assumption.
51
MANAGEMENT CONSIDERATIONS
The array of research findings referred to so briefly above have generated a considerable body of information which can be utilized in a number of ways within Wind Cave National Park. Interpretation based on new information on prairie dog behavior, and natural history and the role of prairie dogs as a key component of the ecosystem can be upgraded and enriched for presentation to the public.
This same information, viewed from a different perspective, can be applied to the improvement of Wind Cave's prairie dog management program. Modifications of the current program can be guided by a number of important considerations brought to light by recent research. Some of those which seem to be most relevant are as follows:
1. Prairie dog colonies on park lands have varied in size, number and importance through a good por~ tion of the post-Pliestocene period.
2. There are significant interactions between prairie dogs and associated plants and animals. These interactions include not only modifications of feeding, growth, and behavioral characteristics but may be of evolutionary significance as well.
3. Natural predation of prairie dogs does not occur with enough frequency to exert a controlling influence on any but the smallest sized colonies. With the possible exception of the badger there appears to be no predator species which is strongly reliant on the prairie dog as a food source.
4. There are no practical, indirect or non-toxic approaches to control of prairie dog populations that alone can fulfill all the requirements for accomplishing such within the park.
5. Fire can be used to stimulate the growth of dogtowns as well as to temporarily halt their rate of growth or to even reduce their size. Prescribed burns immediately adjacent to dogtowns can enhance dogtown expansion by reducing the height and density of bordering ground cover. Fires on areas removed from dogtowns will significantly reduce ungulate use of colony sites. UndeJ such conditions prairie dogs must on their own accomplish the reduction of ground cover required for expansion into uncolonized areas.
6. High populations of elk, bison and perhaps pronghorn, along with absence of fire and less than normal precipitation during the plant growing season provide optimal conditions for expansion of dogtowns.
The above considerations in concert imply that there is a need for modification of the park's current prairie dog management program. A revised program should clearly demonstrate a recognition of the essential role of prairie dogs in catalyzing or promulgating many important ecological and evolutionary processes. Control of prairie dog colony

sizes and locations needs to be reconsidered. The current program calls for reducing total acreage to 700 acres and limiting the number of colonies to five. A more flexible or dynamic approach would appear to be justified by the considerations discussed above. Colony sites which have been unoccupied for decades should be allowed to grow to their former size when recolonized. Other colonies which have been occupied for many decades could be depopulated for a period long enough to permit the return of a ground cover more typical of uncolonized areas. Total acreage should be allowed to fluctuate between 700 to 1200 acres and numbers of active colonies could be as high as ten.
The long interval between the most recent reduction (1982-1986) of total colony acreage and the previous such effort (mid-1950's) was perhaps the most important factor contributing to the unprecedented recent high level of dogtown acreage (2,000+ acres) within the park. Future efforts to control the size and locations of colonies should be carried at intervals no longer than five years. In all forthcoming management plans it will also be necessary to consider the use of indirect (prescribed fire and ungulate herd size reduction) as well as direct (zinc phosphide and rifles) control measures.
Current and future research efforts will likely provide information that will point to the need for further refinements and modifications in the prairie dog management program. Experiences gained in managing prairie dogs over many decades and information obtained from recent intensive research efforts point to the necessity of viewing prairie dog management as a dynamic, ever evolving but never static, program.
LITERATURE CITED
Carlson, D. D. 1986. Effects of pra1r1e dogs on mound soils. Thesis. South Dakota State University, Brookings, South Dakota
Coppock, D. L., J. E. Ellis, J. K. Detling, and M. I. Dyer. 1983. Plant herbivore interactions in a North American mixed-grass prairie II. Responses of bison to modification of vegetation by prairie dogs. Oecologia 56:10-15
Coppock, D. L. and J. K. Detling. 1986. Alteration of bison and black-tailed prairie dog grazing interaction by prescribed burning. Journal of Wildlife Management 50:452-455.
Garrett, M. G. and W. L. Franklin. 1982. Prairie dog dispersal in Wind Cave National Park: possibilities for control. Proceedings Fifth Great Plains Wildlife Damage Control Workshop: 185-198.
Garrett, M. G. and W. L. Franklin. 1983. Diethylstilbestrol as a temporary chemosterilant to control black-tailed prairie dog populations. Journal Range Management 36(6):753-756.
Hoogland, J. L. 1979. Agression, ectoparsitism and other possible costs of prairie dog coloniality. Behavior 69:1-35.
Hoogland, J. L. 1981. Nepotism and cooperative breeding in black-tailed prairie dog. p. 283-310 In:R. D. Alexander and D. W. Twinkle (eds.) Natural Selection and Social Behavior. Chiron Press, New York.
Hoogland. J. L. 1985. Infanticide in prairie dogs: lactating females kill offspring of close kin. Science 230:1037-1040.
King, J. A. 1955. Social behavior, Social organization and population dynamics on a blacktailed prairie dog town in the Black Hills of South Dakota. Contrib. Lab. Vertebr. Biol. 67., University of Michigan, Ann Arbor, Michigan.
Ravndal, V. A. 1985. Interspecific nutritional facilitation:Do bison benefit from feeding on prairie dog towns" Thesis, Colorado State University, Ft. Collins, Colorado.
White, E. M. 1986. Changes in prairie dog mound soil properties with increasing age. In:Final Report to National Park Service, Order Number PX1560-5-0117. 15 p.

An Evaluation of Shooting and Habitat Alteration for Control of Black-Tailed Prairie Dogs1
Craig J. Kno~les2
Abstract. - Shooting at h,ro incipient black-tailed pralrle c:iog (C;ynomys ludovicianus) c::>lonies remove~ from 12.8 to 17.3 prairie dogs/ha with reduction of adults averaging 69%. Habitat was physically altered in a ;;ortion of one prairie dog colony and activity levels between treated and non-treated areas dio not shm\ any consistent differences.
Introduction
Research on prairie dog (Cynomys .§.£_.) control is usually directed towards the use of toxicants. Toxicants such as zinc phosphide, when properly applied, are considered efficacious (Tietjen 1976). Shooting of prairie dogs, because of its sporting value, has often been suggested as an alternative form of control. Recreational shooting of prairie dogs has been a part of a Bureau of Land Management (BLM) pra1r1e dog management program in north-central Montana for several years now (USDI BLM 1982). Aside from anecdotal accounts there is little information on the population consequences of shooting on prairie dog numbers.
Habitat alteration of pra1r1e dog colonies has also been considered as an alternative method of control. Fagerstone et al. (1977) treated a prairie dog colony with 2,4-D to alter plant species composition but found no effect on pra1r1e dog activity levels. Snell and Hlavachick (1980) and Snell (1985) reported pra1r1e dog numbers to decline following initiation of a deferred grazing system. In this case, increased vegetative cover was thought to result in increased predation. Physical treatment of a pra1r1e dog colony to provide hunting advantages to predators may be a useful control technique in certain situations.
The purpose of this study was to examine the effects of shooting and habitat alteration on black-tailed prairie dog colonies on the Charles M. Russell National Wildlife Refuge in north-central Montana. ·
1 Paper presented at the Eighth Great Plains
Wildlife Damage Control Workshop. [Rapid City, SD, April 28-29 1987].
2craig J. Knowles is a wildlife ecologist,
FaunaWest Wildlife Consultants, Boulder, Mont.
53
Study Area and Methods
This study was conducted on the Charles M. Russell National Wildlife Refuge in north-central Montana from 1978 to 1980. The Refuge was typified by rough, broken country interspersed with rolling prairie. Prairie dog colonies on the Refuge were restricted to the shrub-grassland and grassland habitats located on broad level ridge tops or on bottomlands of the major drainages. The management goal of the Refuge for prairie dogs at the time was to control the size of certain pra1r1e dog colonies but not to exterminate them.
Shooting as a control technique was evaluated at two colonies (Colony A - 5.9 ha, and Colony B - 1.4 ha). Shooting was conducted in the last half of June 1978 using a 0. 22 caliber rifle while in 1979 shooting started in mid-May and continued until early August using a 0.22 caliber magnum rifle. Shooting in Colony A was generally from a portable blind while shooting at Colony B was from a pit dug into a ridgeside overlooking the colony. Notes were made as to the beginning and ending times of a shooting period, number of shots taken, and number of prairie dogs deemed hit. Population surveys were made prior to, and immediately after shooting both years plus one additional survey in June 1980. Visual counts of prairie dogs were made five times at IS-minute intervals on each of three different morning or evening activity periods. The largest of the 15 counts was then selected as the count that most closely approximated the actual number of prairie dogs (Knowles 1986). Percentage reduction of prairie dogs was based on adults since the pre-treatment survey period in 1978 and the shooting period in 1979 occurred during a period of juvenile emergence.
During the summer of 1978, a 2-ha area of a 24.6-ha colony received a habitat alteration treatment designed to provide more hiding cover for mammalian predators and perches for raptors. About one dozen piles of driftwood logs from Fort

Peck Reservoir, were placed in the treated area. Several freshly cut ponderosa pine (Pinus ponderosa) were dragged into the treated area and numerous small (0.5 m high, 1-2 m long) rock piles were placed in the colony. In addition, 10, 4.3 m telephone poles were placed in the treated area as raptor perches. In the fall of 1978, 18 depressions (0.3 m deep) and ~ounds (0.5 m high) were made with a bulldozer. In early May 1979, 40 bales of old hay were also placed in the treated area. Change in horizontal visibility as a result of this treatment was determined with a cover board (see Knowles et al. 1982). Efficacy of the habitat alteration was measured by plugging with soil 100 burrows in each the treated and non-treated sections of the colony. Burrows were examined 48 hr later making note of the number of burrows opened.
Results and Discussion
Approximately 17 pra1r1e dogs per hectare were removed by shooting at Colonies A and B in 1978 (table 1). In 1979, a similar number of pra1r1e dogs were removed from Colony A but considerably less were taken at Colony B as a result of an already reduced population. Percent reduction in adult prairie dogs for 1978 and 1979 were 67 and 62 for Colony A, and 46 and 100 for Colony B, respectively (table 2). Estimated density of all surviving prairie dogs in 1978 and 1979 were 8.8 and 5.6/ha at Colony A, and 10.0 and 0. 7 /ha at Colony B, respectively. Only one juvenile prairie dog remained in Colony B in 1979 after 6.1 hr of shooting effort. Densities during these two years at two untreated colonies where pra1r1e dogs were trapped and marked (Knowles 1982) were estimated at 30.6 and 8.3/ha in 1978, and 24.6 and 19.3/ha in 1979.
Table 1. removed 1979.
Colony
Shooting effort and at Colonies A and B
Hours Dogs Year at colony Shots hit
Colony A 1978 22.8 503 99 1979 36.4 239 102
Colony B 1978 17.5 217 23 1979 6.1 30 16
prairie dogs in 1978 and
Dogs removed/ha
16.8 17.3
17.0 12.8
54
Table 2. -- Maximum number of adult pra1r1e dogs present pre and post-shooting at Colonies A and B from 1978 to 1980.
Colony
A B
1978 pre
66 15
post
22 8
1979 pre
45 3
post
17 0
1980 post
28 6
Both treated colonies showed strong population recovery trends in 1980 in the absence of shooting (table 2). Immigration into Colonies A and B probably augmented the population in all years as both colonies were located along a dirt road 1.0 and 2.8 km from a 100-ha colony (see Knowles 1985 concerning the relationship of roads to prairie dog dispersal). This was certainly the case for Colony B during the shooting period in 1979 and in June 1980. In the latter case, 6 adult prairie dogs were present when, at most, only one of these could have been a survivor from the previous year. The adult population in Colony A in 1980 was 42% of the 1978 pre-treatment population.
Effort levels between years were not comparable as shooting strategies changed. In 1978, the standard 0.22 rifle which was used for shooting caused only moderate wariness in the prairie dogs and allowed for many shots to be made at ranges where accuracy was poor (5.9 shots/prairie dog). In 1979, the 0.22 magnum used for most of the shooting increased accuracy greatly but resulted in increased wariness in the prairie dogs ( 2. 3 shots/prairie dog). The BLM (USDI BLM 1982) estimated that with an average of 725 hunter days per year expended on shooting prairie dogs in Phillips County, Montana, 100,500 rounds of ammunition were fired resulting in the removal of 10,050 prairie dogs from about 400 ha.
Both Colonies A and B, which were established prior to 1973, were expanding before initiation of this study. Shooting appeared to be effective at lowering prairie dog densities to less than 6/ha and negating colony expansion. This was accomplished with only a moderate level of effort. In the case of the smaller colony, shooting appeared capable of removing all prairie dogs. Portions of both colonies were inactive during 1979 and 1980. However, by 1984, Colony A had expanded to 140% of its 1978 size and Colony B had expanded by 90%. In another small colony on the Refuge, 12 prairie dogs were removed by shooting in the spring of 1975. The three remaining prairie dogs were eliminated by natural causes by late fall of that year. This colony site had not been re-colonized by 1984 (year of last survey). Lewis et al. (1979) thought 10 -20 prairie dogs were needed to start a colony.

Possibly the reduction of prairie dogs below a certain threshold number may have a negative population consequence (Allee's Principle, Allee et al. 1949) because fewer pra1r1e dogs are available to watch for predators (Hoogland 1981) and keep the vegetation clipped around burrows.
Stockrahm (1979) reported on population structure of two colonies thought to be heavily shot at and two rece1v1ng little human exploitation. She found fewer males, smaller litters, and a low percentage of breeding among yearling females at the colonies that received heavy shooting. The latter two findings were opposite of what was expected (principle of inversity, Errington 1946), and she thought disruption of the social system might be responsible.
Shooting as a management program to contain specific pra1r1e dog colonies (especially incipient colonies) may be effective if properly administered and a large number of shooting enthusiasts are available. A major advantage of this control technique would be its low cost, since labor and equipment are supplied on a voluntary basis. The following suggestions may make such a program more effective. 1) Shooting during spring while females are pregnant or lactating (March - May, see Knowles 1987), would have the greatest impact on the population with the least effort. 2) Use of accurate small caliber rifles are preferred to larger caliber guns. 3) Use of blinds (especially if entered at sunrise) reduces the wariness of prairie dogs, although prairie dogs ultimately learn to respond to the noise of guns. Additional research is needed to determine the effectiv~ness of this control technique on a management basis, and to evaluate its impact on non-target wildlife species using prairie dog colonies.
Horizontal visibility in the habitat alteration experiment was reduced from 89% to 78% in the treated portion of the colony. No consistent differences in activity levels were noted between the treated and non-treated sections (table 3). However, my general impressions in April of 1979 were that few prairie dogs were present in the treated area and that some prairie dogs moved into the treated area during the spring dispersal perivd. I was unable to visit this colony in April of 1980 to make comparable observations. The physical change of the treated portion of the colony did not appear to deter prairie dogs from using the area. Prairie dogs were frequently seen on top of rock or log piles and to use burrows under the raptor perches. A greater reduction in horizontal visibility was probably needed to truly impact prairie dogs. Elsewhere on the Refuge, prairie dogs were found to exist in areas with visibility values as low as 67%. Immigration into the treated area may also have served to equalize activity levels between sections of the colony.
55
Table 3. -- Number of burrows opened 48 hr after plugging 100 burrows each in the treated and non-treated portions of the colony receiving habitat alteration.
1978 1979 1980 June June Aug. Oct. June Aug.
Trt. 33 59 18 10 36 18
Non-trt. 37 55 31 15 40 23
American Kestrels (Falco sparverius) were the only raptors seen using the perches. The treated section of the colony was heavily used by Mountain Bluebirds (Sialia currucoides) and Mourning Doves (Zenaida~oura) which probably served to attract the Kestrels. Golden Eagles (Aguila chrysaetos) and Red-tailed Hawks (Buteo jamaicensis) were observed in the area but not in the colony. Northern Harriers (Circus cyaneus) hunted the colony in 1979 but they did not use the perches nor could they be considered a predator of prairie dogs. I did not observe any mammalian predators making use of the obstacles, although a Refuge employee did observe a bobcat (Felis rufus) hiding at the edge of the treated section.
Had the habitat alteration treatment been applied to the entire colony to reduce chances of immigration into the treated area, results of this experiment might have been different. It may be possible that more than two years are needed for predators to become accustomed to the treatment and learn to take advantage of it. Another major problem with the habitat alteration was its unnatural appearance. The Refuge quickly removed the experiment with termination of this study. Other forms of habitat alteration such as deferred grazing (Snell and Hlavachick 1980, and Snell 1980) may be more easily applied, more effective, and lack any negative aesthetic properties such as my experiment.
Acknowledgments
Research was funded by the U.S. Fish and Wildlife Service, Refuge Division. At the time of the study, the author was a research assistant, Montana Cooperative Wildlife Research Unit, University of Montana, Missoula 59812. The author wishes to thank Dr. B. O'Gara for technical advice and guidance in all phases of this study, and S. Gieb, R. Gumtow, P. Knowles, S. Schmidt, D. Schuster, and C. Stoner for field assistance.

Literature Cited
Allee, W .C., Schmidt. ecology. 837pp.
A.E. Emmerson, 0. Park, and K.P. 1949. Principles of animal
W.B. Saunders Co., Philadelphia.
Errington, P.L. populations. 221-245.
1946. Predation and vertebrate Quart. Rev. Biol. 21:144-177,
Fagerstone, K.A., H.P. Tietjen, and K. LaVoie. 1977. Effects of range treatment with 2,4-D on prairie dog diet. J. Range Manage. 30:57-60.
Hoogland, J.L. 1981. The evolution of coloniality in white-tailed and black-tailed prairie dogs {Sciuridae, Cynomys leucurus and C. ludovicianus). Ecology 62:252-272.
Knowles, C.J. 1982. Habitat affinity, populations, and control of black-tailed prairie dogs on the Charles M. Russell National Wildlife Refuge. Ph.D. Dissertation, Univ. Montana, Missoula, 171 pp.
Knowles, C.J. 1985. Observations on pra1r1e dog dispersal in Montana. Prairie Nat. 17:33-40.
Knowles, C.J. 1986. Population recovery of black-tailed prairie dogs following control with zinc phosphide. J. Range. Manage. 39:249-251.
Knowles, C.J. 1987. Reproductive ecology of black-tailed prairie dogs in Montana. Great Basin Nat. 47{2) In Press.
Knowles, C. J~. C.J. Stoner, and S.P. Gieb. 1982. Selective use of black-tailed pra1r1e dog towns by mountain plovers. Condor 84:71-74.
Lewis, J.C., E.H. Mclvain, R. McVickers, and B. Peterson. 1979. Techniques used to establish and limit prairie dog towns. Proc. Okla. Acad. Sci. 59:27-30.
Snell, G.P. 1985. Results of control of prairie dogs • Rangelands 7:30.
Snell, G.P., and B. D. Hlavachick. 1980. Control of prairie dogs - the easy way. Rangelands 2:239-240.
Stockrahm, D.M.R.B. 1979. Comparison of population structure of black-tailed prairie dog towns in southwestern North Dakota. M.S. Thesis, Univ. North Dakota, Grand Forks, 103 pp.
Tietjen, H. P. 1976. Zinc phosphide its development as a control agent for black-tailed prairie dogs. U.S.D.I., U.S. Fish Wildl. Serv. , Spec. Sci. Rep. Wildl. 195, Washington, D.C., 14pp.
USDI Bureau of Land Management. 1982. Black-tailed prairie dog control/management in Phillips Resource Area. Programatic environmental assessment. BLM Lewistown District, Phillips Resource Area, Malta, Montana. 40pp.
Rodenticidal Effects of Zinc Phosphide and Strychnine on Nontarget Species1
Daniel W. Uresk, Rudy M. King, Anthony D. 2 Apa, Mlchele S. Deisch, and Raymond L. Linder
Abstract.--When three rodenticide treatments--zinc phosphide (prebaited) and strychnine (both with and without prebait)--were evaluated, zinc phosphide was the most effective in reducing active burrows of prairie dogs; but, it also resulted in a reduction in deer mouse densities. One month after treatment, counts of fecal pellets of eastern cottontails were greater on areas treated with strychnine without prebait than on sites treated with zinc phosphide. Eight months after treatment, no differences could be detected among rodenticides for either leporid. Horned lark densities were reduced 61% on sites treated with strychnine only.
INTRODUCTION
Rodenticides have been used for prairie dog control on the Great Plains since the late 1800's (Merriam 1902). Most recent prairie dog control programs on federal, state, and private lands consist of poisoning prairie dogs with zinc phosphide on rolled oats after prebaiting with rolled oats (Schenbeck 1962). However, for more than 70 years, little effort has been made to evaluate rodenticide impacts on nontarget animals. Recently there has been some concern about the effects of zinc phosphide on nontarget animals. Bell and Dimmick (1975) reported that zinc phosphide was not hazardous to red fox (Vulpes fulva), gray fox (Urocyon cinereoargenteus), or great horned owls (Bubo virginianus). Kit fox (Vulpes macrotis) survived after feedings on kangaroo rats (Dipodomys sp.) killed with zinc phosphide (Schitoskey 1975). Matschke et al. (1983) reported no mortality among
1 Paper presented at the 8th Great Plains Damage Control Workshop. (Rapid City, SD, April 28-30~ 1987).
Uresk and King are Research Biologist and Biometrician, respectively, with the Rocky Mountain Forest and Range Experiment Station, Rapid City, S. Dak., in cooperation with the South Dakota School of Mines and Technology; the Station's headquarters is in Fort Collins, in cooperation with Colorado State University. Apa and Deisch were graduate research assistants, and Linder, now retired, formerly Unit Leader, South Dakota Cooperative Fish and Wildlife Research Unit, South Dakota State University, Brookings. Partial funding of this study was provided by National Agricultural Pesticide Impact Assessment Program (NAPIAP).
57
nontarget animals when zinc phosphide-treated grain bait was broadcast to control Richardson's ground squirrels {Spermophilus richardsonii).
Strychnine, used for prairie dog control since the late 1800's (Merriam 1902), has been reported to present secondary hazards to nontarget animals (Schitoskey 1975, Hegdal et al. 1981). Wood (1965) reported that densities of five rodent species fluctuated independently over a 2-year period after an area was poisoned with strychnine-treated oats. Birds were killed by surface application of steamrolled oats treated with strychnine for control of Richardson's ground squirrels (Hegdal and Gatz 1977). No detrimental effects were observed on other rodents or mammalian predators.
To augment the limited information, this investigation was undertaken to compare zinc phosphide and strychnine for effects on nontarget small mammals and birds.
STUDY AREA
The study area was approximately 13 km south of Wall on the Buffalo Gap National Grasslands and Badlands National Park in west-central South Dakota. Climate was semiarid-continental and was characterized by cold winters and hot summers. The average annual precipitation, based on climatological information over a 12-year period (1972-1963) from the weather station at Cedar Pass Visitor Center, Badlands National Park, was 40 em. Most precipitation fell during the growing season as highintensity thundershowers, which produced a wide range of amounts and intensities of rain for any given location. The mean annual temperature was 10 °C, ranging from -5 °C in January to 26 °C in July.

Soils developed primarily from sedimentary deposits of clay, silt, gravel, and volcanic ash (Raymond and King 1976). Steep gullies, s3arp ridges, flat-topped buttes, pinnacles that are partly covered with vegetation, and upland grasslands characterize much of the landscape in the Badlands. Gently sloping grasslands on the National Grasslands made up the major portion of the study area.
The dominant grasses were blue grama (Bouteloua gracilis), buffalograss (Buchloe dactyloides), needleleaf sedge (Carex eleocharis), and western wheatgrass (Agropyron smithii). Scarlet globemallow (Sphaeralcea coccinea), prostrate bigbract verbena (Verbena bracteata), Patagonia Indianwheat (Plantago patagonica), and prairie dogweed (Dyssodia papposa) were the major forbs.
The Badlands National Park area was grazed by bison (Bison bison), pronghorn (Antilocapra americana), and mule deer (Odocoileus hemionus) throughout the year. Cattle on the National Grasslands grazed the area from mid-May to the last of October each year. Stocking levels varied depending upon moisture and available forage. Pronghorn and mule deer grazed the grasslands throughout the year.
METHODS
Eighteen study sites were established on 15 prairie dog colonies that ranged in area from approximately 12 ha to 263 ha. Nine sites were untreated and 9 sites were treated with the rodenticides zinc phosphide (prebaited) and strychnine, with and without prebaiting; thus, each rodenticide treatment had 3 control and 3 treated sites. The 3 rodenticide treatments were clustered into 3 separate groups in an attempt to m1n1m1ze the possibility that a nontarget animal would be exposed to more than one rodenticide. Clusters were approximately 13 and 16 km apart. Zinc phosphide treatments were applied to sites in the Badlands National Park because of administration constraints against the use of strychnine in such areas. The other 2 treatment groups, strychnine with and without prebaiting with steam-rolled oats, were assigned randomly to the 2 remaining clusters on the National Grasslands.
Steam-rolled oats from the U.S. Fish and Wildlife Service's Pocatello Supply Depot were used for both prebait and carrier. A 2.0%3by weight active zinc phosphide ·and 1.5% Alcolec S adhesive were applied to the oats. Strychnine alkaloid was applied to the oats as 0.5% by weight. Nontreated oats were applied as prebait for zinc phosphide and
3The use of the name Alcolec S (American Lecithin Co., Inc.) is for the benefit of the reader; such use does not constitute an official endorsement or approval of any service or product by the U.S. Department of Agriculture to the exclusion of others that may be suitable.
58
for 1 of the strychnine treatments during September 20-21, 1983, on prairie dog colonies (Uresk et al. 1986). Active rodenticides on steam-rolled oats were applied during September 22-24, 1983. These rodenticide treatments resulted in active prairie dog burrows being reduced 95% with zinc phosphide, 83% with strychnine (prebaited), and 45% with strychnine only (Uresk et al. 1986).
Pretreatment counts for small mammals and birds were taken on all sites 1 week before application of rodenticides. Posttreatment sampling on all sites began on the fourth day after rodenticides were applied.
Small rodents were sampled on each of the 18 sites before and after treatment. Sixty-four Sherman live traps (23 x 9 em) were arranged within a grid design with 10-m spacings on each site. Each trap session consisted of 1 night of prebaiting followed by 4 consecutive nights of trapping. All traps were examined for mammals each morning. Traps closed by prairie dogs through the day were reopened in the late afternoon on all sites. A mixture of peanut butter and rolled oats was used for bait in the batting-lined traps. Heavy wire was placed over each trap and inserted into the ground, to reduce disturbance by weather, large herbivores, and prairie dogs. Captured rodents were identified as to species and assigned a unique number by toe amputation. Relativ~ density estimates were obtained as the number of unique animals captured on each site by trap session.
Fecal pellets were used as an index of abundance for the eastern cottontail (Sylvilagus floridanus) and white-tailed jackrabbit (Lepus townsendii~ on all 18 sites (Overton 1971). Thirty 1-m circular plots, spaced 30 m apart, were permanently established along transects (0.8 km) on each site. Fecal pellets were collected preand post-rodenticide treatment 1 month and 8 months following treatment. Data were analyzed as mean number of pellets per site.
Avian populations were counted on the 18 study sites by using a modified transect method (Emlen 1971, 1977; Rotenberry 1962). Eighteen permanent strip transects, 1 per site, 605 m long and 61 m wide (approximately 4.9 ha), were established. Surveys were conducted on 4 consecutive days before and after rodenticide treatment in a different site order each day. Survey teams started one-half hour after sunrise and continued for approximately 4-5 hours; average walking time was 25-40 minutes per transect. All birds within each transect were identified visually or by vocalization, including birds flying through the transect during the census. Data were averaged over the 4 days by species, and mean numbers of birds per site were used in statistical analyses.
STATISTICAL EVALUATION
The approach chosen to assess the effect of each rodenticide was to compare the change between pretreatment and posttreatment observations on each
treated group (cluster) of sites with the change observed on the respective control sites. When a significant correlation existed between pretreatment and posttreatment observations~ analysis of covariance was used to estimate change as the posttreatment observation adjusted for the amount by which the pretreatment observation differed from the pretreatment mean. That is~
z~ Y .. - b(Xi. -X) 1] J
where zii is the adjusted observation for the j-th site in the i-th treatment group~ Yi. is the posttreatment observation~ xi. is the prJtreatment observation~ X is the mean Jf pretreatment observations~ and b is the regression coefficient. If correlation between pretreatment and posttreatment observations was nonsignificant~ change was estimated simply as
zij = Yij - xij
and the analysis was based on an interaction between time and treatment as the indicator of a significant change due to treatment (Green 1979). Unless indicated otherwise~ the statistical package for the social sciences (SPSS) was used to produce the statistical calculations (Nie et al. 1975~ Hull and Nie 1981).
Once the form of the change variable (Z .) was chosen, contrasts between treated and respective control groups were formed as c1 = z1 - z2' c2 z3 - z4' and c3 = z5 - z6' where z1 represents the estimated average cfiange on the zinc phosphide sites, z2 the estimated average change on the respective control sites, and so on for the prebaited strychnine and strychnine only treatments. If significant individual treatments effects were observed, comparisons among the rodenticides were produced by forming the contrasts c
4 = c 1 - c
2, c
5 = c
1 - c
3, and c6 = c 2 - c 3 •
Randomization procedures were used to estimate the statistical significance of the various contrasts (Edgington 1980, Romesburg 1981). These procedures do not rely on the normality assumption inherent in standard analysis of variance testing techniques; rather, they provide a general framework incorporating separate but similar analyses depending on the outcome of tests for significant correlation between pretreatment and posttreatment observations, common regression slopes among treatment groups, and homogeneous variance among treatment groups. A test statistic, t = C./Sqrt [Var C.], was computed for each contrast (C.) and significance level estimated using randomiz~tion procedures based on 10,000 random permutations of the data pairs (Xi'' Y .. ) among the treatment groups. Variance Jf a 1 tontrast was computed as the sum of the variances of the means in the contrast, with individual variances computed based on the covariance and homogeneous variance assumptions appropriate for the particular variable.
Because omission of any effect due to poisoning, especially for the nontarget species, was considered more serious than the potential incor-
59
rect declaration of a significant treatment effect~ Type II error protection was produced by testing each contrast individually. However, except when heterogeneous variance was present and therefore no overall test was available, some Type I error protection was afforded by testing individual contrasts only after first observing a significant (P = 0.10) overall test of treatment differences using analysis of variance or covariance (Carmer and Swanson 1973). Individual contrasts were considered biologically significant at P = 0.25. Although admittedly unconventional, for the number of sites available for study, this significance criterion produces a power (probability of detecting a true difference) of approximately 0.75 for a contrast twice as large as its standard error. This was considered a reasonable combination of Type I and Type II error protection for this study (Carmer 1976, Salsburg 1985).
RESULTS
Small Rodents
Six rodent species were captured on the 18 sites: deer mouse (Peromyscus maniculatus), northern grasshopper mouse (Onychomys leucogaster), thirteen-lined ground squirrel (Spermophilus tridecemlineatus), western harvest mouse (Reithrodontomys megalotis), Ords kangaroo rat (Dipodomys ordii), and hispid pocket mouse (Perognathus hispidus). Deer mice were the only rodent captured in sufficient numbers to be used for statistical comparisons; however, no significant reductions (P = 0.363) were observed among treatments. Relative densities of deer mice changed 79% from 5.8 to 1.2 unique animals, following the zinc phosphide treatment (table 1).
Leporids
No differences were found in the adjusted fecal pellet means of the eastern cottontail between control and treated sites for zinc phosphide and strychnine without prebait (P = 0.812 and P = 0.655, respectively, table 2). Areas treated with strychnine (prebait) showed an increase (P = 0.031) in adjusted mean number of fecal pellets. However, no differences were found between treated and control sites for fecal densities 8 months after prairie dogs had been poisoned (table 2).
Higher numbers of fecal pellets of white-tailed jackrabbits were observed (P = 0.088) on •he zinc phosphide sites versus control (table 3). No differences in jackrabbit abundance were found between control and treated sites on areas treated with strychnine with (P = 0.725) and without prebaiting (P = 0.683). However, 8 months after rodenticides were applied, whitetail jackrabbit fecal pellet counts were not different between treated and control sites (P = 0.431).
Birds
Application of zinc phosphide for black-tailed prairie dog control did not significantly reduce

..
Table I.--Relative densities of deer mice (unique animals/768 trap nights ± standard error) for pretreatment and posttreatment on treated and control sites for each rodenticide. Variances were heterogeneous and pretreatment data were used to adjust posttreatment means by covariance analysis. Adjusted posttreatment data had homogeneous variances.
Treatment Pretreatment Posttreatment Adjusted effect 1
Prebait: Zinc phosphide Treated 8.3 ± 2.6 1.3 ± 0.7 Control 4.0 ± 2.0 2.3 ± 0.9 -4.6 ± 2.7
Strychnine Treated 1.9 ± 1.0 0.7 ± 0.7 Control 9.0 ± 3.2 7.0 ± 4.0 0.3 ± 2.7
Prebait: Strychnine Treated 8.7 ± 1.5 3.7 ± 1.9 Control 18.0 ± 3.1 12.3 ± 4.9 -0.9 ± 2.7
1Adjusted effects were not significant (P of contrasts was not determined.
0.363); therefore, statistical significance
Table 2.--Average pellet counts (mean/30 m2 ± standard error) of eastern cottontail for pretreat
ment and posttreatment on treated and control sites for each rodenticide. Variances were homogeneous and pretreatment data were used as covariate to adjust posttreatment means.
Significance Adjusted effect level (control 8 mo. after
Adjusted effect1 1 treatment2 Treatment Pretreatment Posttreatment vs. treated) Prebait:Zinc phosphide
Treated 17 ± 6 8 ± 7 13.1 1 Control 158 ± 133 32 ± 30 3.9 ± 0.812 -4.6 ± 13.9
Strychnine Treated 31 ± 13 16 ± 15 Control 183 ± 109 54 ± 19 -7.5 ± 13.1 0.655 20.2 ± 13.9
Prebait:Strychnine Treated 102 ± 22 25 ± 14 Control 296 ± 97 30 ± 16 34.0 ± 13.4 0.031 15.1 ± 13.9
~Randomization test used for testing differences between pairs of adjusted means. Adjusted effects were not significant {P = 0.260); therefore, statistical significance of
contrasts was not evaluated.
2 Table 3.--Average pellet counts (mean/30 m ± standard error) of white-tailed jackrabbits for pretreatment and posttreatment on treated and control sites for each rodenticide.
Significance Adjusted effect level (control 8 mo. after
effect1 2 treatment3 Treatment Pretreatment Posttreatment Adjusted vs. treated) Prebait:Zinc phosphide
Treated 9 ± 7 43 ± 31 Control 72 ± 40 16 ± 12 90.4 ± 46.3 0.088 70.0 ± 41.6
Strychnine Treat eel 11 ± 2 5 ± 2 Control 24 ± 18 22 ± 12 -5.0 ± 9.0 0.683 18.7 ± 41.6
Prebait:Strychnine Treated 34 ± 24 42 ± 17 Control 69 ± 58 49 ± 8 28.0 ± 60.1 0.725 37.7 ± 41.6
1Posttreatment minus pretreatment was used to adjust data since covariance model was not signi~icant (P = 0.502) and variances were heterogeneous.
~ndomization test used for testing differences between pairs of adjusted means. Posttreatment minus pretreatment was used to adjust data since covariance model was not
significant (P = 0.450). Adjusted effects were not significant (P = 0.431); therefore, statistical significance of contrasts was not evaluated.
60

numbers of horned lark (Eremophilia alpestris) (P = 0.974, table 4). When strychnine was applied without prebait, horned larks were significantly reduced (P = 0.114). Strychnine with prebaiting also had apparent effects on horned lark densities (P = 0.124). Comparisons among rodenticides showed no differences with zinc phosphide compared to strychnine only and strychnine with prebait, P = 0.256 and P = 0.267, respectively. Strychnine comparisons were not different (P = 0.964).
Because individual bird species densities were highly variable, 15 species of birds were grouped to determine treatment effects among rodenticides (table 5). Overall test among treatments was significant (P = 0.025). Ground feeding birds
showed no differences between control and treated sites in adjusted relative densities on zinc phosphide (P = 0.431), prebaited strychnine (P = 0.360), and strychnine (P = 0.364) treatment areas. A comparison among rodenticides showed differences between zinc phosphide with strychnine (P = 0.228), and zinc phosphide with prebait strychnine (P = 0.223). Higher densities of birds were observed on the zinc phosphide-treated sites.
DISCUSSIONS AND CONCLUSIONS
Zinc phosphide as a prairie dog control agent, was associated with reduced densities (79%) of deer mouse, a nontarget species; however, the effect was
Table 4.--Relative densities of horned lark (mean number/4.9 ha ± standard error) for pretreatment and posttreatment on treated and control sites for each rodenticide. Pretreatment data were different (P = 0.043) among rodenticides, and analysis was conducted on posttreatment minus pretreatment data.
Significance Adjusted level (control
1 Treatment Pretreatment Posttreatment effect vs. treated) Prebait: Zinc phosphide
Treated 17 ± 6 22 ± 7 Control 12 ± 5 21 ± 8 0.3 ± 9.3 0.974
Strychnine Treated 12 ± 9 2 ± 1 Control 22 ± 12 17 ± 6 -15.2 ± 9.3 0.114
Prebait: Strychnine Treated 30 ± 8 6 ± 3 Control 67 ± 20 20 ± 2 -14.6 ± 9.3 0.124
1Randomization test used for testing differences between pairs of adjusted means.
Table 5.--Relative densities of total ground-feeding birds (mean number/4.9 ha ± standard error) for pretreatment and posttreatment on treated and control site for each rodenticide. Correlation was noi significant (P = 0.248). Analysis was conducted on posttreatment minus pretreatment data.
Significance Adjusted level (control
2 Treatment Pretreatment Posttreatment effect vs. treated) Prebait: Zinc phosphide
Treated 31 ± 6 53 ± 12 Control 24 ± 8 38 ± 16 15.0 ± 12.9 0.431
Strychnine Treated 18 ± 12 4 ± 2 Control 25 ± 13 20 ± 10 -16.9 ± 12.9 0.364
Prebait: Strychnine Treated 31 ± 6 7 ± 2 Control 72 ± 18 24 ± 4 -17.2 ± 12.9 0.360
1Avian species that showed no differences individually or grouped: Sharp-tailed Grouse (Tympanuchus phasianellus), Killdeer (Charadrius vociferus), Mourning Dove (Zenaida macroura), Northern Flicker (Colaptes auratus), Says Phoebe (Sayornis phoebe), Black-billed Magpie (Pica pica), American Crow (Corvus brachyrhynchos), Mountain Bluebird (Sialia currucoides), American Robin (Turdus migratorius), Water Pipit (Anthus spinoletta) migrant, European Starling (Sturnus vulgaris), Vesper Sparrow (Pooecetes gramineus), Savannah Sparrow (Passerculus sandwicbensis), Chestnut-collared Longspur (Calcarius ornatus), Western Meadowlark (Sturnella neglecta).
2Randomization test used for testing differences between pairs of adjusted means.
61

not statistically significant because of high variability in densities. Strychnine with or without prebait was not associated with significant reductions in deer mouse densities. This finding is contrary to the 86% reduction in rodent populations reported by Wood (1965) 1 month after treatment with strychnine.
Pellet counts have been used to measure relative abundance of rabbit numbers in various habitats (Vorhies and Taylor 1933; Arnold and Reynolds 1943; Westoby and Wagner 1973; MacCracken and Hansen 1982). Conde (1982) compared the abundance of pygmy rabbits (Sylvilagus idahoensis) and black-tailed jackrabbits (Lepus californicus) by strip census with fecal pellet counts and showed a good correlation between the 2 methods. In this study, eastern cottontail fecal pellet counts after treatment were greater on strychnine-prebaited sites than on other treated sites. This may be attributable to the slightly rougher terrain of the strychnine area, offering a more suitable habitat for cottontails (Flinders and Hansen 1975). However, 8 months after treatment in this study, eastern cottontails showed no differences among rodenticide treatments. White-tailed jackrabbit abundance was higher on areas treated with zinc phosphide immediately after treatment. This flat and open area is preferred by the white-tailed jackrabbits. In addition, western wheatgrass, a major food item of white-tailed jackrabbits, was more abundant on zinc phosphide sites compared to the other rodenticide-treated areas (Flinders 1971). Eight months later, in our study, white-tailed jackrabbit abundance was not different among rodenticide treatments. The 3 rodenticides did not negatively affect either eastern cottontails or white-tailed jackrabbits.
Effect of strychnine on some bird species has been documented by several investigators. Rudd and Genelly (1956) stated that hazards of strychnine application in the field were much higher for waterfowl than for upland game birds such as Gray partridge (Perdix perdix), ring-necked pheasant (Phasianus colchicus), quail (Odontophorinae), sharp-tailed grouse (Tympanuchus phasianellus), and prairie chicken (Tympanuchus sp.). Hegdal and Gatz (1977) reported that there was a significant hazard to some seed-eating birds, which included horned larks, mourning doves (Zenaida macroura), and blackbirds (Emberizinae). They also stated that vesper sparrows (Pooecetes gramineus) and western meadowlarks (Sturnella neglecta) were affected but to a lesser extent. Tietjen (1976) and Matschke et al. (1983) reported no significant mortality for nontarget seed-epting birds with application of zinc phosphide, but additional tests were recommended.
Horned larks in this study decreased in relative density on areas treated with strychnine and prebait strychnine. However, zinc phosphide showed no effects. The time of rodenticide application during the fall could have influenced the number and species of birds affected. Weather conditions can affect the movements of migrant birds as well as resident birds during the time when rodenticides are applied. Ground-feeding birds individually or as a
62
group excluding horned larks showed no response to the 3 rodenticide treatments. Many of the groundfeeding birds were beginning to group in certain areas because of inclement weather during posttreatment measurements. This increased variability between and among sites may have contributed to the lack of significant effects of rodenticide treatment for ground-feeding birds as a group. A comparison of rodenticides showed greater effects on birds with both strychnine treatments and less with zinc phosphide.
ACKNOWLEDGEMENTS
Special thanks is given to Deborah D. Paulson for computer analyses and reviews of several drafts and data collection. Thanks are also extended to the South Dakota Department of Game, Fish and Parks for providing vehicles, equipment, and personnel for rodenticide application; Nebraska National Forest and Badlands National Park for assisting with rodenticide application and for providing study areas.
LITERATURE CITED
Arnold, J. F., and H. G. Reynolds. 1943. Droppings of Arizona and antelope jack rabbits and the "pellet census." J. Wildl. Manage. 7:322-327.
Bell, H. B., and R. W. Dimmi~k. 1975. Hazards to predators feeding on prairie voles killed with zinc phosphide. J. Wildl. Manage. 9:816-819.
Carmer, S. G. 1976. Optimal significance levels for application of the least significant difference in crop performance trials. Crop Sci. 16:95-99.
Carmer, S. G., and M. R. Swanson. 1973. An evaluation of ten pairwise multiple comparison procedures by Monte Carlo methods. J. Amer. Statis. Assoc. 68(341):66-74.
Conde, L. L. 1982. Comparative ecology of pygmy rabbits and blacktailed jackrabbits in southcentral Idaho. M.S. Thesis. Brigham Young Univ., Provo, Utah (Unpublished). 30 p.
Edgington, E. S. 1980. Randomization tests. Marcel Dekker, Inc., New York. 287 p.
Emlen, J. T. 1971. Population densities of birds derived from transect counts. Auk 88:323-342.
Emlen, J. T. 1977. Estimating breeding season bird densities from transect counts. Auk 94:455-468.
Flinders, J. T. 1971. Diets and feeding habits of jackrabbits with a shortgrass ecosystem. Ph.D. Diss. Colorado State Univ., Fort Collins (Unpublished). 75 p.
Flinders, J. T., and R. M. Hansen. 1975. Spring population response of cottontails and jackrabbits to cattle grazing shortgrass prairie. J. Range Manage. 28:290-293.
Green, Roger H. 1979. Sampling design and statistical methods for environmental biologists. Section 4.1. John Wiley and Sons, New York. 257 p.

Hegdal, P. L., and T. A. Gatz. 1977. Hazards to seedeating birds and other wildlife associated with surface strychnine baiting for Richardson's ground squirrels. EPA report under Interagency Agreement EPA-IAG-D4-0449.
Hegdal, P. L., T. A. Gatz, and E. C. Fite. 1981. Secondary effects of rodenticides on mammalian predators. p. 1781-1793. In: J. A. Chapman and D. Pursley, eds. The Worldwide Furbearer Conference Proceedings. 2056 p.
Hull, C. H., and N. H. Nie. 1981. SPSS UPDATE 7-9. New procedures and facilities for releases 7-9. McGraw-Hill Book Co., New York. 402 p.
MacCracken, J. G., and R. M. Hansen. 1982. Herbaceous vegetation of habitat used by black-tail jackrabbits and nuttal cottontails in southeastern Idaho. The Amer. Midland Nat. 107:180-184.
Matschke, G. H., M. P. Marsh, and D. L. Otis. 1983. Efficacy of zinc phosphide broadcast baiting for controlling Richardson's ground squirrels on rangeland. J. Range Manage. 36:504-506.
Merriam, D. 1902. The prairie dog of the Great Plains. p. 257-270. In: Yearbook of the United States Department of Agriculture, Gov. Print. Off., Washington, D.C.
Nie, N. H., C~ H. Hull, J. G. Jenkins, K. Steinbrenner, and D. H. Bent. 1975. SPSS: statistical package for the social sciences. 2nd ed. McGraw-Hill, New York. 675 p.
Overton, W. s. 1971. Estimating the numbers of animals in wildlife populations. p. 403-455. In: R.N. Giles, Jr., ed. Wildlife management techniques. 3rd ed. The Wildl. Soc., Washington, D.C. 633 p.
Raymond, W. H., and R. U. King. 1976. Geologic map of the Badlands National Monument and vicinity, west-central South Dakota. U.S. Geol. Survey. Map I-934.
Romesburg, C. 1981. Randomization tests. Resource Evaluation Newsletter. p. 1-3. Tech. Article 1. USDI-BLM, Denver, Fed. Cntr., Denver, Colo.
63
Rotenberry, J. T. 1982. Birds in shrubsteppe habitat, p. 307-309. In: D. E. Davis, ed. CRC handbook of census methods for terrestrial vertebrates. CRC Press, Inc. Boca Raton, Fla. 397 p.
Rudd, R. L., and R. E. Genelly. 1956. Pesticides: their use and toxicity in relation to wildlife. Calif. Fish and Game Bull. No. 7. 208 p.
Salsburg, D. S. 1985. The religion of statistics as practiced in medical journals. The Amer. Stat. 39:220-223.
Schenbeck, G. L. 1982. Management of black-tailed prairie dogs on the National Grasslands, p. 207-217. In: R. M. Timm and R. J. Johnson, eds., Fift~Great Plains Wildl. Damage Control Workshop. Proc. Oct. 13-15, 1981. Univ. Nebraska, Lincoln. 299 p.
Schitoskey, F. 1975. Primary and secondary hazards of three rodenticides to kit fox. J. Wildl. Manage. 39:416-418.
Tietjen, H. P. 1976. Zinc phosphide--Its development as a control agent for black-tailed prairie dogs. U.S. Dept. Int., Fish and Wildl. Serv. Spec. Sci. Rep.--Wildl. 195. 14 p.
Uresk, D. W., R. M. King, A. D. Apa, and R. L. Linder. 1986. Efficacy of zinc phosphide and strychnine for black-tailed prairie dog control. J. Range Manage. 39:298-299.
Vorhies, C. T., and W. P. Taylor. 1933. The life histories and ecology of jackrabbits (Lepus alleni) and (Lepus californicus) spp., in relation to grazing in Arizona. Ariz. Agric. Exp. Sta. Tech. Bull. 49:471-587. ·
Westoby, M., and F. H. Wagner. 1973. Use of a crested wheatgrass seeding by blacktailed jackrabbits. J. Range Manage. 26:349-352.
Wood, J. E. 1965. Response of rodent populations to controls. J. Wildl. Manage. 29:425-427.
Efficacy of Aluminum Phosphide for Black-Tailed Prairie Dog and Yellow-Faced Pocket Gopher Control1
2 P. Rodger Moline and Stephen Demarais
Abstract. The efficacy of aluminum phosphide was tested on a total of 300 active black-tailed prairie dog (Cynomys ludovicianus) mounds and 68 active'yellow-faced pocket gopher (Pappogeomys cascanops) tunnels during June-August, 1986 on the southern Great Plains in Lubbock County, Texas. Efficacy of aluminum phosphide was higher than controls (P < 0.001) for both species. Efficacy was higher for black-tailed prairie dogs (94.7- 96.0%) than for pocket gophers (61.5-85.7%). Soil porosity and moisture appeared to influence efficacy for yellow-faced pockec gophers.
INTRODUCTION
Black-tailed prairie dogs (Cynomys ludovicianus) and yellow-faced pocket gophers (Pappogeomys castanops) can be nuisances to ranchers, farmers, and urban dwellers on the southern Great Plains. However, in spite of the significant effects prairie dogs have on forage availability (Hansen and Gold 1977), short-term benefits of prairie dog control to cattle grazing may be limited (Klait and Rein 1978). Based on animal unit gains, control of prairie dogs in South Dakota using toxic bait may not be econom1cally feasible (Collins et al. 1984).
Additional justification for control of prairie dogs and/or pocket gophers involves public healch (Collins ec al. 1984) and damage to agricultural crops (Chase et al. 1982), urban gardens, and landscapes. Pocket gophers can cover up to one-fourth of che ground surface with mounds and castings in one year (Turner 1973).
Aluminum phosphide is a commercially available burrow fumigant (Phostoxin, Degeshe
1 Paper presented at the Eighch Great
Plains Wildlife Damage Control Workshop, Rapi~ City, S. D., April 28-30, 1987.
P. Rodger.Moline and Stephen Demarais are Graduate Research Assistant and Research Scientist, respectively, in che Range and Wildlife Managemenc Department, Texas Tech Unive3sity, Lubbock.
Reference to crade name does not imply endor~ement.
Boggess, E. K. 1979, Aluminum phosphide for prairie dog control. Unpublished report. Kansas State University, Cooperative Extension Service, Garden City.
64
3 Co., Inc.) that emits hydrogen phosphide gas. Initial field tests of aluminum phosphide for control of black-tailed prai~ie dogs in Kansas indicated an efficacy of 80% • The efficacy of aluminum phosphide for control of yellow-faced pocket gophers has not been reported. We evaludted the efficacy of aluminum phosphide for control of black-tailed prairie dogs and yellow-faced pocket gophers on the southern Great Plains.
This research was supported by the Graduate School and the Department of Range and Wildlife ~~nagement, Texas Tech University. We thank D. B. Wester for statistical amvice and L. M. Smith, E. G. Bolen, and J. K. Jones, Jr. for manuscript review. This is publication T-9-476 of the College of Agricultural Sciences, Texas Tech University.
METHODS
The study was conducted during June -August, 1986, on 80 ha of the Texas Boys Ranch, located approximately 10 km northeast of Lubbock, Lubbock County, Texas. The shortgrass prairie vegetation on the study area is dominated by blue grama (Bouteloua gracilis) and buffalograss (Buchloe dactyloides). Mean annual precipitation is 46 em (Blackstock 1979). The study area was grazed by cattle until 3 months before treatment.
Two trials were conducted for each species, with a treatment area and a control area assigned randomly within each ·trial. Two trials were conducced during June 1986 on one contiguous black-tailed prairie dog colony that was arbitrarily delineated into 4 20-ha sampling units. One trial on yellow-faced pocket gophers was conducted on arbitrarily delineated control and treatment areas during June, 1986. The second trial on yellow-faced pocket gophers consisted
of 2 separate control and treatment populations sampled during August, 1986.
The trials on black-tailed prairie dogs and the first trial on yellow-faced pocket gophers were located in Estacado clay loam, a friable, moderately alkaline, dark brown clay loam 36 em thick. The second trial on yellow-faced pocket gophers was located in Midessa fine sandy loam, a friable, moderately alkaline, brown sandy loam about 18 em thick.
Six uniformly located soil samples were collected within each trial site at a depth of 45 em. Soil moisture and porosity were calculated because these variables affect gas diffusion (McClean 1981) and may affect efficacy of a fumigant such as aluminum phosphide. Soil moisture and porosity were estimated using drying oven and water displacement techniques, respectively.
Occupancy of each burrow was established prior to sampling. All prairie dog mounds in each sampling unit were filled with soil and numbered. Pocket gopher tunnels were opened and numbered. Attempts were made to open only one tunnel per pocket gopher burrow system. A pocket gopher tunnel was considered discrete from other burrow systems if it was in an area with fresh mounds and/or earth plugs (Reid et al. 1966) which was spatially separated from other similar areas of activity. Occupancy of mounds and tunnels was determined 2 days later by checking for opening and closure, respectively.
Active burrows were treated with 2 3-gram pellets of aluminum phosphide. The openings of all active prairie dog mounds were plugged with plastic trash bags containing 5-10 kg of soil. The plastic-bag plug was covered with loose soil. One pocket gopher tunnel opening in each burrow system was plugged with loose soil piled onto a cardboard plug.
Seven days after treatment all burrows were checked for activity using the same methods used to determine pretreatment occupancy. Efficacy was calculated using the following formula: Efficacy = 100 x [(No. of Pretreatment Active Burrows - No. of Posttreatment Active Burrows) - No. of Pretreatment Active Burrows]. Efficacy was compared between aluminum phosphide treatment and control within each trial using a chi-square test.
RESULTS ~ID DISCUSSION Three hundred black-tailed prairie dog
mounds and 68 yellow-faced pocket gopher tunnels were sampled.· Efficacy of aluminum phosphide treatment was higher than controls (P 0.001) for both species (Table 1). Efficacy was higher for prairie dogs (94.7-96.0%) than for pocket gophers (61.5-85.7%).
Although toxic gases have been used for vertebrate pest control for many years, there is relatively little efficacy data available from controlled experiments (Elias et al. 1983). Our 94.7-96.0% efficacy results exceed the 80% control of black-tailed prairie dogs
65
using tluminum phosphide in dry soils in Kansas The Kansas results were only an approximation because burrows were not tested for activity prior to treatment. We found no reports on control of yellow-faced pocket gophers using aluminum phosphLae, but results exceeded Miller's (1954) generalization that best control of "gophers" with "gases" ranges from 50-60%.
Table 1. Results of application of aluminum phosphile to active black-tailed prairie dog mounds and yellow-faced pocket gopher tunnels in the southern Great Plains, June-August, 1986.
Active Pre- Post-
treatment treatment Efficacy Species N N %
Black-tailed Prairie Dogs
~ Treatment 75 3 96.0 Treatment B 75 4 94.7 Control A 75 69 8.0 Control B 75 65 13.3
Yellow-faced Pocket Gophers b
21 3 85.7 Treatment ~ Treatment B 13 5 61.5 Control A 21 21 o.o Control B 13 13 0.0
bSee text. Efficacy of treatment higher than respective
control (P < 0.001).
a
Various biological and chemical controls have been used against prairie dogs and pocket gophers. Grazing deferment reduced prairie dog populations in Kansas (Suell and Hlavachick 1980) and South Dakota {Uresk et al. 1982). Opinions vary as to the impact coyotes have on pocket gopher and prairie dog populations (Snell and Hlavachick 1980, Baroch and Poche 1985). Herbicide treatment reduced forbs and resulted in an 87% decline in northern pocket gopher (Thomomys talpoides) populations 1 year after treatment (Keith et al. 1959). Herbicide treatment failed to reduce black-tailed prairie dog populations in Montana because the animals switched from a diet of forbs to grasses (Fagerstone et al. 1977). Toxic baits can b~ up to 100% effective in controlling pocket gophers (Baroch and Poche 1985) but may not be economically feasible (Collins et al. 1984).
Soil moisture and porosity may affect the efficacy of burrow fumigants (McClean 1981). Diffusion rate, the main factor influencing spread of aluminum phosphide gas through rabbit burrows (Oliver and Blackshaw 1979), is related to both soil moisture and porosity. Increased soil moisture would positively affect the rate of aluminum phosphide diffusion and thus its efficacy by increasing the rate of gas generation (Oliver and Blackshaw 1979) and

reducing the amount of air-filled pore space (McClean 1981). A greater relative loss of gas into the surrounding pore spaces, resulting in decreased efficacy, would be expected in soils with greater porosity. The efficacy of aluminum phosphide was lower in the second trial on yellow-fac~d pocket gophers (Table 1). The positive impact of higher soil moisture apparently was negated by the greater soil porosity in the second trial (Table 2).
Our results indicate that alumiuum phosphide is a highly effective burrow fumigant for black-tailed prairie dogs and yellow-faced pocket gophers. Additional research is needed concerning the effect of soil moisture and porosity on efficacy. The cost effectiveness of aluminum phosphide control of burrowing rodents needs to be evaluated relative to other management alternatives, particularly in urban environments.
Tabl~ 2. Soil porosity (%) and moisture (%) at 45 em depth at the time of treatment with aluntinum phosphide.
Porosity Hoistur~
Species N X ± SE X ± SE
Black-tailed Prairie Dogs
Treatment A 3 49.1 ± 0.5 3.3 ± 0.2 Treatment B 3 48.5 ± 0.5 4.5 ± 0.9 Control A 3 47.2 ± 1.0 4.1 ± 0.4 Control B 3 48.2 ± 1.7 4.7 ± 0.5
Yellow-faced Pocket Gophers
Treatment A 3 49.1 ± 0.5 3.3 ± 0.2 Treatment B 3a 63.7 ± 0.3 22.2 ± 2.0 Control A 3 47.2 ± 1.0 4.1 ± 0.4 Control B 3a 63.7 ± 0.3 22.2 ± 2.0
Data for treatment B and Control B represent 3 samples collected randomly over both areas.
LITERATURE CITED
Baroch, J., and R. M. Poche. 1986. Preliminary field evaluation of a new formulation of Rozol (chlorophacinone) bait against pocket gophers in Colorado. Proc. Great Plains Wildl. Damage Control Workshop 7:138-144.
Blackstock, D. A. 1979. Soil survey of Lubbock County, Texas. United States of Agric., Soil Conserv. Serv. 105pp.
Chase, J. D., W. E. Howard, and J. T. Roseberry. 1982. Pocket gophers. Pages 239-255 in J. E. Chapman and G. A. Feldhamei: eds. Wild mammals of North America: biology, management and economics. The Johns Hopkins Univ. Press, BaltiD1ore, Md. ll46pp.
66
Collins, A. R., P. Workman, and D. W. Uresk. 1984. An economic analysis of black-tailed prairie dog (Cynomys ludovicianus) control. J. Range Manage. 37:358-361.
Elias, D. J., P. J. Savarie, D. J. Hayes, and M. W. Fall. 1983. A simulated burrow system for laboratory evaluation of vertebrate control fumigants. Proc. Vertebr. Pest Control and Manage. Materials 4:226-230.
Fagerstone, Y.. A., H. P. Tietjen, and G. K. LaVoie. 1977. Effects of range treatment with 2,4-D on prairie dog diet. J. Range Manage. 30:57-60.
Hansen, R. M., and I. K. Gold. 1977. Black-tailed prairie dogs, desert cottontails and cattle trophic relations on shortgrass range. J. Range Manage. 30:210-214.
Keith, J. 0., R. M. Hansen, and A. L. Ward. 1959. Effects of 2,4-D on abundance and foo~s of pocket gophers. J. Wildl. Manage. 23:137-145.
Klait, L. E., and D. He in. 1978. Vegetative differences among active and abandoned towns of black-tailed prairie dogs. J. Rang~ Manage. 31:315-317.
McClean, G. s. 1981. Factors influencing the composition of respiratory gases in mammal burrows. Comp. Biochem. Physiol. 69(A):373-380.
Miller, M. A. 1954. Poison gas tests on gophers. Calif. Agric. 8:7,14.
Oliver, A. J., and D. D. Blackshaw. 1979. The dispersal of fumigant gases in warrens of the European rabbit, Oryctolagus cuniculus (L.). Aust. Wildl. Res. 6:39-55.
Reid, V. H., R. M. Hansen, and A. L. Ward. 1966. Counting mounds and earth plugs to census mountain pocket gophers. J. Wildl. ~~nage. 30:327-334.
Snell, G. P., and B. D. Hlavachick. 1980. Control of prairie dogs - the easy way. Rangelands 2:239-240.
Turner, G. T. 1973. Effects of pocket gophers on the range. Pages 51-61 in G. T. Turner, R. M. Hansen, V. H.~eid, H. P. Tietjen, and A. L. \-lard, eds. Pocket gophers and Colorado mountain rangelands. Colorado State Univ. Exp. Station Bull. 554S. Fort Collins, Co. 90pp.
Uresk, D. W., J. G. MacCracken, and A. J. Bjugstad. 1982. Prairie dog density and cattle grazing relationships. Proc. Great Plains Wildl. Damage Control Workshop 5:199-201.

Laboratory Trial of Chlorophacinone As a Prairie Dog Toxicant1
Daryl D. Fisher2 and Robert M. Timm3
Abstract.--A laboratory trial was conducted to investigate the efficacy and secondary toxicity of chlorophacinone oats as a prairie dog toxicant. Bait containing 0.0025% chlorophacinone killed 29 of 31 prairie dogs when offered in 25 gram amounts daily for 6 days. Five of 6 domestic ferrets died of anticoagulant poisoning when fed 4 of these toxicant-killed prairie dogs over 8 days. Chlorophacinone may not be an acceptable prairie dog toxicant due to this potential secondary hazard.
INTRODUCTION
In numerous places throughout their range, black-tailed prairie dog (Cynomys ludoyicianus) populations have been increasing in recent years. While these increases may have multiple causes, some authorities point to increased restrictions on the use of toxicants, including the 1972 Presidential Executive Order which limited toxicant use on public 1 ands (Fagerstone 1982). In western Nebraska, prairie dog populations may have increased as much as 60% fran 197 0 to 1980 (Nebraska Game and Parks, unpubl. data).
Prairie dogs' feeding activities can alter the vegetative composition of rangeland plant communities, resulting in reduced forage productivity (Hansen and Gold 1977). While it is generally believed that prairie dogs and 1 ivestock can compete for forage, the amount of competition may vary from site to site (Fagerstone 1982) and from year to year. There are few studies that document the economic impact of these rodents on rangeland.
1Paper pr~sented at the Eighth Great Plains Wildlife Damage Control Workshop [Rapid City, S.D., April 28-30, 1987].
2Daryl D. Fisher is IPM Extension Assistant at the Panhandle Research and Extension Center, University of Nebraska, Scottsbluff, Neb.
3Robert M. Timm is Extension Vertebrate Pest Specialist and Associate Professor in the Dept. of Forestry, Fisheries & Wildlife at the University of Nebraska-Lincoln.
67
Despite the absence of such economic assessments, many landowners believe prairie dog control to be desirable. The most cost-effective and practical method of rapidly reducing prairie dog populations is by application of toxic grain bait. Zinc phosphide and strychnine are the only active ingredients presently used in federally registered prairie dog baits (Jacobs 1983). Two fumigants, aluminum phosphide and gas cartridges, are currently available for burrow fumigation. The higher cost and relatively non-selective action of fumigants makes them a viable control option only on small areas or as a follow-up to toxic grain bait treatment.
The efficacy of strychnine and zinc phosphide baits is variable and often control results are not as successful as desired (Holbrook and Timm 1985). •Poor success of toxicant use against prairie dogs often results from such causes as failure to prebait, alternate food resources, weather changes during bait application, and repeated use of toxicants on bait-shy populations. Further, concerns have been raised about the potential hazard of currently-registered toxicants to non-target species, particularly the endangered black-footed ferret (Mustela nigripes). Clearly, alternative prairie dog toxicants are needed.
The purpose of this study was to investigate, in the laboratory, the potential of the anticoagulant chlorophacinone as a prairie dog toxicant. We wanted to find an appropriate bait concentration, determine its effectiveness against prairie dogs, and investigate its secondary toxicity.

BAIT FORMULATION
We live-trapped wild black-tailed pra1r1e dogs from Morrill County, Nebraska. They were weighed, dusted with the insecticide Sevin, and housed in individual metal cages. We fed them Wayne Rodent Blox (Wayne Pet Food Division, Continental Grain Co., Chicago, Ill.) ad 1 ib. and gave them watermelon or sugar beet slices as a source of moisture. We offered the animals untreated crimped oats daily while we acclimated them to the laboratory. Only animals which accepted oats were used in subsequent trials.
To determine the lowest effective bait concentration, we formulated chlorophacinone at three concentrations, 0.01%, 0.005%, and 0.0025% active ingredient (a.i.). Two percent chl orophacinone concentrate (RoZol Dry Concentrate, Chempar Products, New York) was suspended in corn oil and the solution mixed with crimped oats, by hand, until it appeared to be mixed evenly.
Twenty-four pra1r1e dogs which had readily consumed untreated oats were randomly assigned, eight to each of the 3 bait formulation& Twentyfive grams of the respective bait formulation was offered to each prairie dog daily, for 6 consecutive days. The amount of treated oats remaining was recorded daily for each animal. The laboratory chow was not available during the 6 day baiting, while the water source continued to be offered. Following the six days of baiting, the prairie dogs were returned to their laboratory rodent chow and water source diet. They were observed for 21 days or until death occurred. Carcasses of all anticoagulant-killed prairie dogs were frozen upon death. The identity of each prairie dog was maintained throughout the trial.
Each of the bait formulations tested caused total mortality of the test animals. The lowest concentration (0.0025% a.i.) was chosen for further evaluation. Additional dosed prairie dogs were needed to provide sufficient numbers of poisoned prairie dogs for testing of secondary toxicity. Twenty-three additional prairie dogs were offered the 0.0025% bait concentration, following the same procedure as outlined above. Twenty-one prairie dogs died of anticoagulant poisoning while 2 survived beyond the 21-day observation period. The animals which died as a result of the 0.0025% treatment had consumed dosages between 1.3 and 5.5 mg/kg. Of the surviving animals, one consumed relatively little of the treated oats (0.4 mg/kg), while the other consumed a greater quantity than did 17 other test animals which subsequently died.
SECONDARY TOXICITY
Any toxicant that is to be newly registered for prairie dog control will necessarily undergo detailed scrutiny concerning potential non-target hazards. The potential presence of the endangered black-footed ferrets in prairie dog towns
68
underscores this concern. We chose domestic ferrets (Hustela putorius) as surrogate test animals for our secondary toxicity evaluation.
Eight dome.stic ferrets, 4 of each sex, were housed individually in metal cages. Purina Cat Chow and water were available ad lib. during acclimation to the 1 aboratory.
One male and one female ferret were randomly chosen to serve as controls. All ferrets were given 3 thawed, untreated prairie dog carcasses, one every other day, to condition them to eating prairie dogs. In order to more quickly induce feeding behavior, we had to partially skin the rodent carcasses. The skin on the thawed prairie dogs was sliced along the belly, and peeled off one side, to expose underlying tissue, taking care not to cut into the abdominal cavity. This procedure was followed on all subsequent prairie dog carcasses offered to all ferret&
Fall owing this conditioning regime, we gave each treatment ferret 4 prairie dog carcasses poisoned with 0.0025% chlorophacinone bait, one every other day, while the control ferrets received 4 unpoisoned carcasses. The consumed portions of each treated prairie dog were noted as it was removed from the ferret cage. The Cat Chow diet was not available to the ferrets during the period when prairie dog carcasses were offered.
The ferrets were returned to the Cat Chow diet following removal of the last treated prairie dog. Ferrets were then observed for 30 days, or until death occurred. Five of the 6 treatment ferrets died of anticoagulant poisoning, as verified by veterinary necropsy. Internal hemorrhaging was found in the neck and thoracic region in each of the poison-killed ferrets. We observed that all ferrets fed on internal organs as well as muscle tissues of the prairie dogs during the treatment phase. Toxicological analyses of ferret and prairie dog tissues are being conducted, and these results will be published elsewhere.
DISWSSION
Chl orophacinone-treated oats were found to be an effective prairie dog toxicant at 0.0025% a.i., a concentration lower than that in chlorophacinone baits currently registered for use against pocket gophers and commensal rodent& Fran this standpoint, it would appear that this compound could provide a useful al terna ti ve to strychnine and zinc phosphide. Bait shyness should not be a problem when using an anticoagulant, and there should be no need to prebait. However, more than one field application may be necessary to insure that sufficient bait would be present to be eaten over a number of days. Alternatively, the bait could be made available in weather-resistant bait stations, which would be advantageous especially when attempting to prevent prairie dog town expansion at town perimeters or across property lines.

The secondary toxicity of chlorophacinone to domestic ferrets consuming poisoned prairie dogs, at the dosages we tested, indicates that this compound may not be acceptable. On the basis of our study, we believe it would be unwise to use chlorophacinone baits at these dosages against prairie dogs, unless black-footed ferrets are proven absent from the treatment area and it can be demonstrated that potential secondary toxicity poses no significant hazard to other non-target populations.
We do not automatically conclude, however, that all anticoagulants are unsuitable as prairie dog toxicants because of potential secondary hazard. Other compounds may be metabolized differently by prairie dogs and may be of differing toxicity to non-target species. We believe that because of their potential value in cost-effective control, other anticoagulants should be evaluated for prairie dog control.
ACKN CWLEDGEMENTS
We thank R.M. Case and R. Poche for review of an earlier draft of this paper. Cooperation of the staff of the University of Nebraska Panhandle Research and Extension Center is appreciated. We thank S. Kamble for assistance in obtaining funds to conduct this work. This research was funded in part by Pesticide Impact Assessnent
funds made available to the University of Nebraska by USDA.
LITERATURE CITED
Fagerstone, K.A. 19 82. A review of pra1r1e dog diet and its variability among animals and colonies. p. 178-184 • .In Proc. Fifth Great Plains Wildlife Damage Control Workshop, [Lincoln, Neb., Oct. 13-15, 1981]. R.M. Timm and R.J. Johnson, eds., Uni v. of Nebraska.
Hansen, R. M. and L K. Gold. 1 977. Bl acktai 1 prairie dogs, desert cottontails and cattle trophic relations on shortgrass range. J. Range Manage. 30(3):210-214.
Holbrook, H.T. and R.M. Timm. 1985. Comparisons of strychnine and zinc phosphide in prairie dog control. p. 73-79. .In Proc. Eastern Wildl. Damage Cont. Conf., [Raleigh, No. Carolina, Sept. 22-25, 1985]. P. T. Bramley, ed.
Jacobs, W.W. 1983. Pesticides federally registered for control of terrestrial vertebrate pests. p. G1-G29. .In Prevention and Control of Wildlife Damage, Great Plains Agricultural Council and Nebraska Cooperative Extension Service, R.M. Timm, ed.

Relevant Characteristics of Zinc Phosphide As a Rodenticide1
Rex E. Marsh2
Abstract.--Zinc phosphide has a long history of use and remains an important rodenticide for both commensal and select field rodents. A long list of significant characteristics contributes to its relative safety to nontarget species. It is zinc phosphide's relative safeness to humans, most livestock, and nontarget wildlife that has kept it in vogue. A most relevant and highly proclaimed characteristic is its general lack of potential secondary hazard to predators and scavengers. Poor or inconsistent efficacy on certain field rodents is a major shortcoming that can, in part, be compensated for by prebaiting. Zinc phosphidets favorable characteristics support its continued use, and its future prospects appear good.
INTRODUCTION
Zinc phosphide has a relatively long history of use as a rodenticide, and over time its characteristics concerning efficacy, safety and hazards, and environmental associations have been observed and studied. Zinc phosphide has many good characteristics and is widely used for rodent control around the world. Much of its popularity is due to its relatively low cost, although its efficacy is often not as high as is desirable. Its favorable characteristics generally outweigh its shortcomings.
Zinc phosphide was thought to have been first synthesized by Marggraf in 1740 (Wood and LaWall 1926). It was first used as a rodenticide in 1911 to control field rodents in Italy and later in other European countries (Chitty 1954, Freeman et al. 1954, Schoof 1970). Zinc phosphide's use became more extensive during and following World War II.
EARLY USE
Although mentioned in our literature as early as 1935, it appears not to have been used in the United States m~ch before 1939-40 (Munch et al. 1936, Garlough 1941, Schoof 1970). Its use
1Paper presented at the Eighth Great Plains Wildlife Damage Control Workshop (Rapid City, South Dakota, April 28-30, 1987).
2Rex E. Marsh is a Specialist in Vertebrate Ecology in the Department of Wildlife and Fisheries Biology, University of California, Davis, Calif.
70
expauded during World War II when thallium sulfate and imported rodenticides like strychnine and red squill were __ difficult to obtain in adequate quantities. In this country zinc phosphide was first used for the control of commensal rats and mice and shortly thereafter was explored for field rodents.
In 1942 Joseph Keyes evaluated zinc phosphide in extensive field studies involving 58 tons of squirrel bait used in a 5-county area of California (Kalmbach 1942). In May 1942 Doty (1945) commenced studies of its use for the control of rats in the sugarcane fields of Hawaii. It was also early evaluated for vole control in eastern apple orchards.
IMPORTANT CHARACTERISTICS
Zinc phosphide has many good characteristics that sustain its continued use. Many of these are highly relevant to field rodent control as well as commensal rodent control. The following are the most significant of the favorable characteristics:
1. A broad-spectrum rodenticide. 2. Reasonably economical. 3. Relatively safe to humans. 4. Versatile for bait formulations. 5. Relatively slow acting. 6. Reasonably well accepted by many, but not
all, target species. 7. No genetic resistance has developed. 8. No acquired tolerance develops. 9. Selectivity protects some nontarget species.
10. Potential secondary hazards are minimal. 11. Can be used in a manner that minimizes
hazards to most nontarget species.

12. Not accumulative in animal tissues to any degree.
13. Detoxifies in the primary target animal carcass over time.
14. Decomposes in the bait form and in the environment, reducing long-term potential hazard and contamination.
15. Translocation in plants minimal or nonexistent. 16. Residue tolerances are established for some
crops. 17. Adequately stable when stored under dry condi
tions (i.e., good shelf-life). 18. Only moderately toxic on an mg/kg basis when
compared to some other rodenticides. 19. Generally a good past safety record.
CURRENT USES
In the United States zinc phosphide is used for the control of commensal rodents (house mice, Norway and roof rats), but its use is relatively limited according to most estimates, as anticoagulant rodenticides make up 95% of the baits used for these species.
In agriculture, zinc phosphide finds much greater use for field rodent control, especially for control of rats (Rattus spp.), voles, ground squirrels, prairie dogs, and cotton rats. To a lesser extent it is used for woodrats, pocket gophers, nutria, muskrats, and moles. It has also been evaluated on jackrabbits.
Many, like myself, are not overjoyed by zinc phosphide's effectiveness, at least for some species; however, because of its other good characteristics, it is often used when other rodenticides are inappropriate for some reason or where alternatives are unavailable.
SPECIES SUSCEPTIBILITY
Zinc phosphide is considered a broad-spectrum rodenticide and is used worldwide to control a wide number of native and introduced pest rodent species. LD50 values exist for some 22 rodent species; however, it is used for a far greater number of pest rodent species than is suggested by the published LD50 values. For the most part, the LD50 values for rodents fall between 10 and 40 mg/kg. The nutria has been found the most susceptible of the pest rodent species (LD5o 5.6) (Hood 1972). Voles, genus Microtus, are also quite sensitive to zinc pho~phide with LD50 values for four separate species ranging from 12.4 to 18.0 mg/kg.
The desert kit fox (Vulpes macrotis arsipus) has an LD50 of 93 mg/kg, and the introduced mongoose (Herpestes auropunctatus) in Hawaii has an LD50 of 82 mg/kg (Keith et al. 1987), indicating that neither of these species is very sensitive to zinc phosphide. It is generally thought that mammalian predators are not very susceptible to zinc phosphide, and this in part is due to its emetic action. However, there are few precise LD50 values
71
established for this group of animals.
Several avian species, particularly geese, are very susceptible in the range of 7.5 to 12.0 mg/kg, but most other bird species tested are less susceptible. Caution is advised when making generalizations concerning susceptibility, as considerable variation between species exists--even closely related species.
BAIT TYPES
The versatility of zinc phosphide as a rodenticide is evident by the type of bait formulations and grooming toxicants that are prepared. Whole or crimped grain baits are generally used for voles, ground squirrels, prairie dogs, and rats in agricultural situations, although cereal-based pelleted baits are marketed for the same purposes. Various meal and pelleted baits are used for the control of commensal rodents. Zinc phosphide is sometimes used in grains and incorporated with melted paraffin to form moisture-resistant solid bait blocks, and weather-resistant pelleted baits of other types are also marketed. Chunk or bait cakes are another form of solid baits used in Pakistan (Smythe and Khan 1980).
Perishable baits of fresh fruit, such as apples, oranges, and bananas, and vegetables, including tomatoes, sweet potatoes, cabbage, corn, and carrots, are sometimes used for such species as rats, voles, nutria, and jackrabbits. Fresh or canned meat and fish are used in Norway rat control. Concentrates are sold for preparing perishable-type baits.
Zinc phosphide concentrations used in baits vary greatly throughout the world, from 1 to 15% active ingredient, and this, again, demonstrates its versatility (Gratz 1973). In the U.S. it is generally used at a 1 or 2% concentration in cereal baits.
In Russia zinc phosphide has been explored as a foliar spray for microtine rodents (e.g., Microtus and related species) much the way we have used endrin and chlorophacinone as foliar sprays. The Russians have also used it as a rodent repellent for acorns destined for planting.
As a grooming toxicant, it is used as a tracking powder for house mice (Marsh 1972). It has also been evaluated in a grease base and placed at burrow entrances for rabbit control in Bangladesh (Poche et al. 1979).
WEATHERABILITY
Because zinc phosphide breaks down under wet and acid conditions, it was early thought that rapid decomposition occurred under field situations (Garlough and Spencer 1944, Doty 1945). Evidence to the contrary indicates that zinc phosphide can take a relatively long time to significantly detoxify under field conditions even when

subject to moderate rainfall (Elmore et al. 1943, Hayne 1951, Guerrant and Miles 1969). This belief that zinc phosphide breaks down rapidly when exposed to rainfall still persists and has been responsible, in part, for accidental bird losses that resulted from inadequate precautions being taken.
Physical erosion may account for most of the decrease in the toxicity of weathered baits over an extended period of time when baits are protected from rainfall.
TOXICITY TO HUMANS
Accidental poisonings of an occupational nature are rare (Haynes 1982). Stephenson (1967) reported that over a period of 48 years (1917-1965), 26 fatalities were attributed to zinc phosphide poisoning in humans; of these, 18 (70%) were suicides and 3 were murders. The fact that zinc phosphide baits are grayish-black in color and have an odor that is not particularly pleasant may contribute to few accidental ingestions. An emesis action may occur in humans from ingesting zinc phosphide, and such elimination may assist in reducing fatalities. Early characteristics of poisoning are nausea, vomiting, abdominal pain, chest tightness, excitement, and a chilly feeling. If vomiting occurs within an hour after ingestion, the chances of surviving are improved. The garlic-like smell of phosphine on the breath or vomitus of the patient is common.
POOR AND/OR INCONSISTENT EFFICACY
With species such as the California ground squirrel (Spermophilus beecheyi), the control results are often very inconsistent and erratic for reasons that seem to defy an ability to identify them, or at least all of them. It is not uncommon to have control vary from 25 to 75% for ground squirrels even on the same ranch in different years, or on adjacent ranges in the same year at the same time period. While some lack of uniform squirrel control is also experienced even with the best of acute toxicants (e.g., 1080 and strychnine), generally the reduced control can be attributed to known factors. Variabilities seen with 1080, for example, are usually very much less than with zinc phosphide.
Rarely do we achieve much better than 75 to 80% squirrel control with zinc phosphide under the best of control-conditions, whereas with 1080 under similar conditions, 85 to 98% control is not uncommon.
Prebaiting, of course, can significantly improve efficacy of zinc phosphide for ground squirrels and prairie dogs just as it can with other acute toxicants. Prebaiting is often recommended, although one prebaiting may increase the cost of control by as much as 80%. In some situations, the additional cost of prebaiting may make control uneconomical.
72
As the same principles apply to target as well as nontarget animals, it remains unclear whether prebaiting significantly increases the hazards to certain nontarget species.
Repeated annual use over a long period of time often decreases efficacy. This has been observed in ground squirrel and vole control in California. This is due, in part, to bait shyness resulting from previous sublethal exposures. However, there seem to be other contributing factors, possibly a more discriminating population evolves. This diminished efficacy resulting from long-term use is very real, and frequently the only solution to regain reasonable control is to switch to another rodenticide.
POTENTIAL NONTARGET PRIMARY HAZARDS
Domestic mammals are rarely endangered by properly placed bait (Ingram 1945, Chitty 1954). However, fowl are highly susceptible, and there are a number of instances of chickens (Hare and Orr 1945) and domestic geese being killed where bait was accessible to unconfined, free-roaming poultry (Bubien et al. 1970).
Incidental nontarget wildlife losses are infrequent and usually involve few animals. Exceptions generally involve other seed-eating rodent species occupying the same habitat. Of the game species, geese, which are more susceptible than most target rodent species, may be the most vulnerable of all wild bird species at risk from primary poisoning (Marsh 1985). Goose mortality has occurred in the past where adequate precautions were not taken. Such past mistakes now provide a basis for specific precautionary measures. Potential hazard to ducks and pheasants (Hayne 1951, Collins 1966) has foundation, although incidental kills in the U.S. are few and relatively minor.
SECONDARY POISONING MINIMAL
Secondary poisoning of dogs and cats is not nearly as likely with zinc phosphide as with 1080 or strychnine, although the hazards of the latter two are often exaggerated. Nonetheless, on rare occasions dogs and cats have consumed poisoned rodents and died (Chitty 1954, Storer and Jameson 1965, White and Vonesch 1970, Stowe et al. 1977). Srinath (1977) mentions losses of cats and pigs in India due to secondary poisoning. Another atypical case of secondary poisoning occurred to chickens on a poultry farm in India where the birds were seen pecking at rat carcasses. About 10 chickens died as a result (Christopher et al. 1982).
Studies by a number of researchers of hazards to confined nontarget wildlife reveal minimal hazards. Siberian ferrets, a close relative of black-footed ferrets, survived the feeding of five zinc phosphide-poisoned rats, although some blood chemistries were altered (Hill and Carpenter 1982).

Zinc phosphide-poisoned prairie dogs fed to five mink for 30 days resulted in no visible symptoms of intoxication (Tietjen 1976). Coyotes receiving multiple feedings of zinc phosphidepoisoned jackrabbits showed no visible symptoms (Evans et al. 1970). Schitoskey (1975) demonstrated that kit foxes survived repeated feedings of kangaroo rats killed with massive doses of zinc phosphide. Red and gray foxes survived feedings of zinc phosphide-killed voles with no mortality (Bell and Dimmick 1975). Domestic cats and mongooses were not poisoned when fed rats poisoned with zinc phosphide (Doty 1945). Bald eagles and black vultures were not poisoned when fed zinc phosphide-killed nutria (Tietjen 1976). Those knowledgeable of rodenticides generally agree that secondary hazards to wild predators are minimal (Hegdal et al. 1980).
FUTURE PROSPECTS
There are several major shortcomings of zinc phosphide that influence its use. Relatively poor initial bait acceptance occurs in some species such as ground squirrels and prairie dogs, and serious bait and toxic shyness results from sublethal exposures in most all rodents. These contribute to the most significant shortcoming: the lack of a high degree of control effectiveness. A number of methods are thus used to overcome these shortcomings including prebaiting, microencapsulation of the active ingredient, improved bait formulations, reducing available alternate food, and better timing of application. But none of these improves efficacy to the degree that zinc phosphide could be called highly efficacious for certain field rodents. In spite of this, zinc phosphide will remain a viable rodenticide or alternate rodenticide because of its general safety.
Because of its favorable characteristics, the future of zinc phosphide will probably be good, and it will undoubtedly play about the same role in field rodent control as in the past decade. If, however, we should lose strychnine or 1080 for specific uses in controlling field rodents, then the use of zinc phosphide bait would increase substantially. Only the development of a new safer, more effective, and equally economical rodenticide would diminish the future use of zinc phosphide baits for field rodents.
LITERATURE CITED
Bell, H.B., and R.W. Dimmick. 1975. Hazards to predators feeding on prairie voles killed with zinc phosphide. J. Wildl. Manage. 39(4):816-819.
Bubien, M.Z., A. Magot, and P. Delatour. 1970. Frequence des intoxications des animaux en Pologne. (Frequency of poisoning of animals in Poland.) Bull. Soc. Sci. Vet. Med. Camp. (Lyons) 72(2):167-173.
73
Chitty, D., Ed. 1954. Control of Rats and Mice. Clarendon Press, Oxford. 305 p.
Christopher, M.J., G.H. Philip, K.R. Purushotham, and R. Ramamurthi. 1982. Incidence of secondary poisoning with zinc phosphide in a poultry farm. Rodent Newsletter (India) 6(1):4.
Collins, B.D. 1966. The effects on wildlife from Norway rat control using zinc phosphide bait. Calif. Dept. of Agric. Bull. 55(3):139-141.
Doty, R.E. 1945. Rat control on Hawaiian sugarcane plantations. Hawaiian Plant. Rec. 49:71-239.
Elmore, J.W., and F.J. Roth. 1943. Analysis and stability of zinc phosphide. Assn. of Official Agric. Chemists J. 26:559-564.
Evans, J., P.L. Hegdal, and R.E. Griffiths, Jr. 1970. Methods of controlling jackrabbits. Proc. Vertebr. Pest Conf. 4:109-116.
Freeman, R.B., C. Elton, P.R. Leslie, R.M. Ranson, J. Rzoska, and H.V. Thompson. 1954. p. 25-146 In Control of Rats and Mice, Vol. 1 (D. Chitty, ed.). 305 p.
Garlough, F.E. 1941. Poisons and their application in control of rats and mice. Pests 9(2): 15-19.
Garlough, R.E., and D.A. Spencer. 1944. Control of destructive mice. Conserv. Bull. USDI No. 36. 37 p.
Gratz, N.G. 1973. A critical review of currently used single-dose rodenticides. Bull. World Hlth. Org. 48:469-477.
Guerrant, G.O., and J.W. Miles. 1969. Determination of zinc phosphide and its stability in rodent baits. Assn. of Official Agric. Chemists J. 52:662-666.
Hare, T., and A.B. Orr. by zinc phosphide.
1945. Poultry poisoned Vet Rec. 57:17.
Hayes, W.J., Jr. 1982. Pesticides Studied in Man. Williams & Wilkins, Baltimore. 672 p.
Hayne, D.W. 1951. Zinc phosphide: its toxicity to pheasants and effect of weathering upon its toxicity to mice. Mich. Agric. Expt. Sta. Quar. Bull. 33(4):412-425.
Hegdal, P.L., T.A. Gatz, and E.C. Fite. 1980. Secondary effects of rodenticides on mammalian predators. p. 1781-1793 In Worldwide Furbearer Conf. Proceedings, Vol. III (J.A. Chapman and D. Pursley, eds.) [Frostburg, Md., Aug. 3-11, 1980] 2056 p.

Hill, E.F., and J.W. Carpenter. 1982. Responses of Siberian ferrets to secondary zinc phosphide poisoning. J. Wildl. Manage. 46(3): 678-685.
Hood, G.A. 1972. Zinc phosphide--a new look at an old rodenticide for field rodents. Vertebr. Pest Conf. 5:85-92.
Ingram, P.L. 1945. Zinc phosphide poisoning in a calf. Vet. Rec. 57:103-104.
Kalmbach, E.R. 1942. Quarterly Narrative Report, Wildlife Research Laboratory, Denver, Colo. (July-Sept. 1942). 3 p.
Keith, J.O., D.N. Hirata, and D.L. Espy. 1987. Control of mongoose predation on endangered Hawaiian birds. Progress Report, USDA, APHIS, Denver Wildlife Research Center. 16 p.
Marsh, R.E. 1972. Recent developments in tracking dusts. p. 60-62 In Proc. Rodent Control Conf. (J.E. Brooks, ed.): New York State Dept. of Health [Glens Falls, N.Y., Oct. 18-20, 1972].
Marsh, R.E. 1985. Techniques used in rodent control to safeguard nontarget wildlife. p. 47-55 In Trans. of the Western Section of The Wildlife Society Annual Meeting (W.F. Laudenslayer, Jr., ed.) [Monterey, Calif., Jan. 25-26, 1985]. 93 p.
Munch, J.C., F.E. Garlough, and J.C. Ward. 1936. Bioassay of rodenticides. J. Amer. Pharm. Assn. 25:744-746.
Poche, R.M., P. Sultana, Y. Mian, and E. Haque. 1979. Studies with zinc phosphide on Bandicota bengalensis (Gray) and Rattus rattus (Linnaeus) in Bangladesh. Bangladesh J. Zool. 7(2):117-123.
74
Schitoskey, F., Jr. 1975. Primary and secondary hazards of three rodenticides to kit fox. J. Wildl. Manage. 39(2):416-418.
Schoof, H.F. 1970. Zinc phosphide as a rodenticide. Pest Control 38(5):38, 42-44.
Smythe, W.R., and A.A. Khan. 1980. An effective zinc phosphide bait cake for field rodents. Pest Control 48(9):28, 30, 32.
Srinath, D. 1977. Present situation of rodent menace in Mizoram. Rodent Newsletter (India) 1:9-11.
Stephenson, J.B.P. 1967. Zinc phosphide poisoning. Arch. Environ. Health 15:83-88.
Storer, T.I., and E.W. Jameson, Jr. of field rodents in California. Sci., Univ. Calif., Circ. 535.
1965. Control Div. Agric.
50 p.
Stowe, C.M., R. Nelson, R. Werdin, G. Fangmann, P. Fredrick. G. Weaver, and T.D. Arent. 1977. Zinc phosphide poisoning in dogs. JAVMA 173(3):270.
Tietjen, H.P. 1976. Zinc phosphide--its development as a co~trol agent for black-tailed prairie dogs. U.S. Fish and Wildl. Service, Spec. Rept. Wildl. 195. 14 p.
Wlrite, R.C., and R.J.K. Vonesch. 1970. Sudden death in cats. Vet. Rec. 87:731.
Wood, G.B., and C.H. LaWall. 1926. United States Dispensatory, Twenty-first Ed. J.B. Lippincott Co., Philadelphia, Penn.

Comparative Toxicity of Strychnine to Eight Species of Ground Squirrels1
George H. Matschke2, Carolyn L. Fordham3, Susan C. Hurlbut4, Richard M. Engeman5
Abstract.--The toxicity of 3 strychnine bait concentrations, 0.20%, 0.35%, and 0.50%, was evaluated on 8 species of ground squirrels (Spermophilus ~). Significant species-specific differences were evident in the relative toxicity of strychnine in our tests.
INTRODUCTION
The Environmental Protection Agency {EPA) completed a special review of strychnine as a rodenticide in September, 1983, and issued the PD-4 strychnine position document (EPA, 1983). The rationale for regulating strychninecontaining products was given and the studies required for the determination of the reregistration of strychnine bait formulations for ground squirrel control were listed.
The potential hazard of primary poisoning to nontarget mammals and to seed eating birds was of special concern to EPA. Thus, to reduce nontarget hazards, EPA proposed lowering strychnine concentrations from the currently registered 0.35% and 0.50% strychnine to 0.20%. Evaluation of the efficacy of the 0.20% strychnine bait through laboratory toxicity studies was essential to determine the need for testing under field conditions.
Data are presented in this report on laboratory studies on the comparative toxicity of 0.20%, 0.35%, and 0.50% strychnine on 8 species of ground squirrels (Matschke 1985a, b, c, Matschke et al. 1987&, !, f, ~' h): Species tested were the Columbian ground squirrel (S erma hilus columbianus), Franklin's ground squirrel Spermophilus franklini), golden-mantled
1 Paper presented at the Eighth Great Plains Wildlife Damage Control Workshop, Rapid City, South Dakota.
2 George Matsch~e is a Research Biologist with USDA/APHIS/ADC, Denver Wildlife Research Center, Denver, Colo.
3 Present address: Environmental Science and Engineering, 7332 South Alton Way, Suite H-1, Englewood, Colo.
4 Present address: Environmental Science and Engineering Ecology, Colorado School of Mines~ 1500 Illinois St., Golden, Colo.
Richard Engeman is a Statistician with USDA/APHIS/ADC, Denver Wildlife Research Center, Denver, Colo.
75
ground squirrel (Spermophilus lateralis), Richardson's ground squirrel (Spermophil us richardsonii), rock squirrel (Spermoph'ilus variegatus), thirteen-lined ground squirrel (Spermophilus tridecemlineatus), Townsend's ground squirrel (S erma hilus townsendii), and Uinta ground squirrel Spermophilus armatus).
PROCEDURE
Ground squirrel procurement and care
Ground squirrels of both sexes were trapped in Montana (Columbian, golden-mantled, and Uinta), North Dakota (Franklin's), Colorado (Richardson's, rock, and thirteen-lined), Idaho (Townsend's), and South Dakota (thirteen-lined). Each ground squirrel was dusted with pyrethrum powder for flea control, and housed individually in steel cages (40.6 x 24.1 x 18.0 em), except that rock squirrels were housed individually in stainless steel cages (61.0 x 45.5 x 23.0 em). The animal room was maintained at about 210 C on a 12-h light-dark cycle (0600-1800 h light, 1800-0600 h dark). Squirrels were fed flaked barley, pelleted rodent laboratory chow (Ralston Purina Company6), and tap water (ad libitum).
Bait Formulation
Strychnine alkaloid (CAS No. 57-24-9) was purchased from Pocatello Supply Depot (PSD), Pocatello, Idaho, and assayed at 98% technical. Strychnine baits were formulated with steamedcrimped oats according to the procedures established by the (PSD) (Pocatello Supply Depot, n.d.). A sham-treated bait was formulated in the same manner with all the ingredients except strychnine. All strychnine concentrations were assayed by a procedure developed by the Denver Wildlife Research Center (unpublished) and reported as percent active ingredient. Only baits that assayed within ~10 percent of the
6 Reference to trade names does not imply U.S. Government endorsement.

desired concentrations, 0.20%, 0.35%, and 0.50%, were used for testing.
Testing Procedures
For each species, the number of ground squirrels tested per strychnine concentration and sex are given in Table 1.
On the day before testing, the ground squirrels were fasted beginning at 1600 h. The next morning (day 1), each ground squirrel in each strychnine treatment group received strychnine bait, and each ground squirrel in the control group received sham-treated bait. Bait was presented in aluminum dishes (8.2 em diameter x 3.9 em deep) fastened to the cages with metal springs. Spilled bait was caught in pans placed beneath the cages. Following presentation of test baits, the animal room was locked and entry denied until 1500 h or 1600 h the same day. Upon reentry, mortality was recorded, dishes and pans were removed from the cages of those ground squirrels that died, and remaining bait was weighed. At 0700 h the next morning (day 2), any additional mortality was recorded, dishes and pans were removed, and the remaining bait was weighed. Each survivor was given additional bait of the strychnine concentration initially received, and each control squirrel received additional sham-treated bait. Entry to the room was denied until 0700 h the next morning (day 3), when the day 2 procedure was repeated.
At 0700 h the next morning (day 4), mortality was recorded, dishes and pans were removed, and remaining bait was weighed. Survivors were given flaked barley and rodent laboratory chow, and were observed twice daily for 14 days. Records for each animal were kept on daily strychnine or control bait consumption, total bait consumption, mg of strychnine consumed per kg of body weight7 (day 1), and mortality.
Data Analyses
For each species, differences in consumption among the 3 strychnine bait concentrations and the sham-treated oait on day 1 and between the 2 sexes were analyzed by a 2-factor analysis of variance. Comparisons of mg/kg consumption of strychnine among the 8 species for the 3 strychnine concentrations also were analyzed as a 2-factor analysis of variance. If treatment or interaction effects were significant in the ANOVA, Duncan's Multiple Range Test was used to determine which individuals means were significantly different from others.
RESULTS
Mortality
The 0.20% concentration was 100% efficacious when consumed by 3 (Franklin's, Richardson's, and thirteen-lined) of the 8 species (Table 2), and the 0.35% concentration was 100% efficacious when consumed by 6 (Columbian, Franklin's, goldenmantled, thirteen-lined, Townsend's, and Uinta) of the 8 species. The 0.50% concentration was 100% efficacious when consumed by 6 (Columbian, golden-mantled, Richardson's, rock, thirteenlined, and Uinta) of the 8 species, and 90% or more efficacious to all 8 species. Most mortality occurred during the first 24-h feeding period for all 3 bait concentrations, with 94-97% of all squirrels dying during this period.
Bait Consumption
Consumption by ground squirrels that consumed 0.20% strychnine bait and died ranged from 0.40 to 2.18 g on day 1 (Table 3); consumption
7 All mg/kg calculations are based on the assayed concentration of the strychnine baits.
Table 1. Sex of ground squirrels tested per species, number of ground squirrels tested per strychnine bait concentration, and total number of ground squirrels tested per species.
Number of squirrels per strychnine Sex bait concentration Total
Species M/F 0.20% 0.35% 0.50% 0.0% tested
Columbian 40/40 20 20 20 20 80 Thirteen-
lined 40/40 20 20 20 20 80 Richardson's 40/40 20 20 20 20 80 Franklin's 40/40 20 20 20 20 80 Golden-
mantled 40/40 20 20 20 20 80 Uinta 40/40 20 20 20 20 80 Townsend's 31/45 19 19 19 19 76 Rock 35/45 20 20 20 20 80
76

Table 2. Percent of ground squirrel mortality observed for each strychnine bait concentration.
Percent strlchnine bait concentration 0.20 0.35 0.50 0.0
Species N1% Mortality N %Mortality N %Mortality N %Mortality
Columbian 13 65 20 100 20 100 0 0 Thirteen-
1 i ned 20 100 20 100 20 100 0 0 Richardson's 20 100 19 95 20 100 0 0 Franklin's 20 100 20 100 18 90 0 0 Golden-
mantled 17 85 20 100 20 100 0 0 Uinta 18 90 20 100 20 100 0 0 Townsend's 18 95 19 100 18 95 2 10 Rock 16 80 18 90 20 100 0 0
1 N = Number of ground squirrels that died.
Table 3. Mean strychnine bait consumption and mg/kg intake of strychnine for ground squirrels that died.
Species Amount of bait
given (g) Mean strlchnine bait consumed {g) - Dal 1 Mean strlchnine intake (mg/kg) - Dal 1
0.20% 0.35% 0.50% 0.0% 0.20% 0.35% 0.50%
Columbian s1 1.86~0.142 1.23~0.25 1.37+0.20 Thirteen-
1 i ned s1 0.46+0.08 0.26+0.07 0.35+0.08 Richardson's 10 0.44+0.09 0.35+0.07 0.19"+0.06 Franklin's 10 o.11Io.1o o.61Io.o9 0.35~0.06 Golden-
mantled 6 0.98+0.14 0.83+0.09 0.50+0.06 Uinta 6 1.47+0.15 1.04"+0.12 1.00"+0.09 Townsend's 10 0.40+0.06 0.17+0.03 0.26+0.04 Rock 15 2.18~0.37 1.41~0.14 0.94~0.13
~ Control given 10 g of sham-treated bait. Mean ~SE.
by survivors ranged from 0.00 to 5.58 g on day 1 (Table 4). Bait consumption by ground squirrels that consumed 0.35% strychnine bait and died ranged from 0.17 to 1.41 g on day 1 (Table 3); consumption by survivors ranged from 0.03 to 2.63 g on day 1 (Table 4). Consumption by ground squirrels that consumed the 0.50% strychnine bait and died ranged from 0.19 to 1.37 g on day 1 (Table 3); consumption by survivors was 0.0 g on day 1 (Table 4). On days 2 and 3, survivors on all 3 strychnine bait concentrations continued to consume bait Consumption by ground squirrels that consumed the 0.0% strychnine bait and survived ranged from 3.51 to 10.47 g on day 1 (Table 4).
Consumption by survivors of strychnine treated bait for the entire 3-day test averaged 10.56 g, 11.04 g, 13.34 g, and 19.56 g for the Columbian, golden-mantled, rock, and Uinta ground squirrels, respectively.
77
7 .82~1.62 7 .82~1.62 13 .46~1. 74
5.48+0.85 6. 35+ 1. 54 14.30+3.35 3.67+0.62 3.99"+0.08 3.57"+1.08 3.18+0.39 5 .47~0. 77 4.92"+0.80
8.58+1.24 13.67+1.52 11.66+1.40 11.15"+1. 28 12 .55"+1.50 18.36"+1.84
2.73+0.64 3.92"+0.54 2.59"+0.49 5.76"+0.93 7 .01"+1.21 6.90~0.61 6.97~0.86
Two control animals (Townsend's) that consumed the 0.0% bait died during the 14 day posttreatment period, possibly because of environmental stress. Neither of the 2 treated Townsend's squirrels died during this time period. Sham-treated bait consumption by controls for the entire 3-day test averaged 26.48 g, 20.45 g, 11.58 g, 18.42 g, 32.28 g, 16.32 g, and 19.81 g for the Columbian, Franklin's, golden-mantled, Richardson's, rock, Townsend's, and Uinta ground squirrels, respectively. Because all 60 thirteen-lined ground squirrels on treated bait died on day 1, further testing of the 20 control animals ceased after the first 24-h feeding period.
Data Ana lyses
There was a significant difference among the treatment means for bait consumption (Table 5)

Table 4. Mean strychnine bait consumption and mg/kg intake of strychnine for ground squirrels that survived.
Amount Species of bait Mean str chnine bait consumed Mean str~chnine intake ~mg/kg) - Da.z:: 1
given (g) 0.20 0.35% 0.50% 0.20% 0.35% 0.50%
Columbian s1 3.64,:'.:0.28 8.55,:'.:0.24 13.37,:'.:1.18 Thirteen-
51 1 i ned 3.51+0.05 Richardson • s 10 0.03,:'.:0.00 5.4i+0.48 0.0,:'.:0.00 Franklin's 10 0.0,:'.:0.00 6.52~0.47 0.0,:'.:0.00 Golden-
mantled 6 3. 07+1. 05 3.93+0.27 25.19+8.72 Uinta 6 5.58+0.40 6.45"+0.14 30.41"+0.16 Townsend's 10 o.oo+o.oo 0.0,:'.:0.00 5.98"+0.43 0.00 0.0,:'.:0.00 Rock 10 2.96::E0.77 2.63,:'.:1.77 10.47::E0.34 8.58,:'.:2.10 10.86,:'.:6.34
1 Control given 10 g of sham-treated bait. 2 Mean + SE.
Table 5. Treatment means for strychnine bait consumption on day 1 separated by Duncan's Multiple Range Test.
Strychnine Mean grams of bait consumed2 bait
concentration Thirteen- Golden-% Columbian Lined Richardson's Franklin's mantled Uinta Rock
0.00 8.55 a1 3.51 a 3.51 a 5.47 a 6.52 a 3.93 a 10.47 a 0.20 2.45 b 0.46 b 0.45 b 0.71 b 1.29 b 1.88 b 2.33 b 0.35 1.23 c 0.26 b 0.34 b 0.52 b 0.83 be 1.04 c 1.54 c 0.50 1.37 c 0.35 b 0.19 b 0.27 b 0.47 c 1.00 c 0.94 c
1 Means with no letter in common are significantly different, at an experimental-wise error rate of 0.05.
2 ANOVA was not performed on data from the Townsend's ground squirrel due to negative consumption values.
for each species. The response was not uniform for the 8 species (excluding Townsend's8), except that the ground squirrels consumed significantly more of the control bait than of the strychnine-treated baits. No significant differences were found among the 3 strychnine concentrations for the Franklin's, Richardson's, and thirteen-lined. However, significant differences in bait consumption occurred among the 0.20%, 0.35%, and 0.50% concentrations for the remaining 4 species. The Columbian, rock, and Uinta consumed significantly more of the 0.20% concentration than the 0.35% and 0.50% concentrations. The golden-mantled consumed significantly more of the 0.20% concentration
8 ANOVA was not performed on data from the Townsend's ground squirrel due to negative consumption values.
78
than the 0.50% concentration; however, no significant difference in consumption occurred between the 0.20% and 0.35% concentrations, or between the 0.35% and 0.50% concentrations for this species.
~ Analysis of the mg/kg of strychnine intake data among the 8 ground squirrel species that died on day 1 revealed highly significant interspecific variability (p = 0.0005). The results from separating the interaction means with Duncan's multiple range test are presented in Table 6. These results, plus the plot of the interaction means in Fig. 1, clearly indicate that the pattern of mg/kg strychnine consumed across concentrations is different among the 8 species. For 2 species (Richardson's and rock), mg/kg of strychnine consumed is fairly constant for all 3 concentrations. For 4 species (Columbian, thirteen-lined, Townsend's, and

Table 6. Mean1 intake of strychnine {mg/kg) for concentration and species of a11,ima 1 s that died on day 1.
Concentration Mean {%) Species Marta 1 ity (mg/kg) Letter
0.2 Columbian 12 7.10 d e f g 0.35 Columbian 20 7.82 d e f 0.5 Columbian 20 13.46 b 0.2 Frankl in 20 3.19 g 0.35 Franklin 18 5.78 e f g 0.5 Frankl in 14 5.27 e f g 0.2 Golden-mantled 17 8.58 c d e 0.35 Golden-mantled 20 13.67 b 0.5 Golden-mantled 19 11.66 b c 0.2 Richardson's 20 3.67 f g 0.35 Richardson's 19 3.99 f g 0.5 Richardson's 20 3.57 g 0.2 Rock 16 7.01 e f g 0.35 Rock 18 6.90 e f g 0.5 Rock 20 6.92 e f g 0.2 Townsend's 18 3.92 f g 0.35 Townsend's 17 2.75 g 0.5 Townsend's 17 5.76 e f g 0.2 Thirteen-1 ined 20 5.48 e f g 0.35 Thirteen-lined 16 6.35 e f g 0.5 Thirteen-lined 16 14.29 b 0.2 Uinta 18 11.26 b c d 0.35 Uinta 20 12.55 b 0.5 Uinta 20 18.36 a
1 Means with a common Letter were not significantly different at the 0. 05 level of significance using Duncan's Multiple Range Test.
Uinta), mg/kg of strychnine consumed increased with increasing concentration, while for the remaining 2 species (Franklin's and goldenmantled), the mg/kg strychnine consumed was highest at the 0.35% concentration.
DISCUSSION
Our laboratory tests indicate that 3 species (Franklin's, Richardson's, and thirteen-lined) may be effectively controlled at the 0.20% or lower strychnine concentration. Four species (Columbian, golden-mantled, Townsend's, and Uinta) may be effectively controlled at strychni-ne concentrations between 0.20% and 0.35%. One species (rock) may be effectively controlled at strych~ine concentrations between 0.35% and 0.50%. Further research will be required on all species to determine the minimum strychnine concentration that will cause 100% marta 1 ity.
Reducing the concentration of strychnine in the bait is one way to reduce the amount of toxic substance presented. Another way would be to reduce the quantity of bait applied per burrow entrance. The current directions for applying strychnine bait call for the placement of 1
79
tablespoon (12 g) per burrow entrance. Twelve g of bait may be excessive in view of the quantity of bait consumed by the 8 ground squirrel species. Two of the 8 species (Thirteen-lined and Townsend's) consumed no more than 1.72 g, suggesting that 2 g (1/2 teaspoon) of bait per burrow entrance may be sufficient. Four of the 8 species (Franklin's, golden-mantled, Richardson's and Uinta) consumed no more than 3.5 g, suggesting that 4 g (1 teaspoon) of bait per burrow entrance may be sufficient. For the Columbian and rock squirrel, reductions to 6 g of bait per burrow entrance may be possible, as the highest intake for a ground squirrel that died was 6.42 g.
Because survivors of 4 species (Columbian, golden-mantled, rock, and Uinta) continued to consume treated bait throughout the 3-day test period, we conclude that bait aversion did not occur under laboratory conditions. For 2 of these species (golden-mantled and Uinta), treated bait consumption by survivors equaled that of controls over the 3-day test period. While for the other 2 species (Columbian and rock), treated bait consumption by survivors was almost half the consumption by control animals.

Uinta
18
16
-.E:. C)
14 "Q)
~ Columbian
>. "0 0 12 en -0 C)
~ 10 ..... Q) 1: ·c:
.E:. 0 8 >. ... -en -0 6 C)
E
4
2 ~----------~----------.-----. 20% .35% .50%
Bait Concentration
Figure 1.--Mean intake of strychnine (mg/kg) by concentration interaction for the animals that died on day 1.
The variable toxicity of strychnine to different species of ground squirrels is a function of phYsiological variability. The observed mg/kg of strychnine intake varied significantly among the species, and within a species, certain individuals appeared to be resistant to strychnine toxicity. Furthermore, the mg/kg intake of strychnine was constant for
80
some species regardless of concentration, while for others, a sharp increase or decrease in mg/kg of strychnine consumed was observed at higher concentrations. Because of these differences among species, bait concentrations should be established in the laboratory before being used in the field.
LITERATURE CITED
Environmental Protection Agency. 1983. Strychnine Position Document, PD 4. 57pp.
Matschke, G. H. 1985a. Efficacy of strychnine for controlling Columbian ground squirrels, Fish and Wildlife registrations 6704-57, 6704-58. Final Report - Work Unit 902.31. 15 pp. • 1985b. Efficacy of strychnine for controlling Richardson's ground squirrels, Fish and Wildlife registrations 6704-57, 6704-58. Final Report - Work 902.31. 15 pp . . 1985c. Efficacy of strychnine for controlling thirteen-lined ground squirrels, Fish and Wildlife registrations 6704-57, 6704-58. Final Report - Work Unit 902.31. 17 pp.
-----,C. L. Fordham, and S. C. Hurlbut. 1987d. Strychnine-laboratory efficacy study, -Franklin's ground squirrel. Final ReportWork Unit 902.31. 21 pp.
-----, -----, and -----. 1987e. Strychninelaboratory efficacy study~ golden-mantled ground squirrel. Final Report- Work Unit 902.31. 21 pp .
-----,-----, and -----. 1987f. Strychninelaboratory efficacy study, rock ground squirrel. Final Report- Work Unit 902.31. 22 pp.
-----, -----, and -----. 1987~. Strychninelaboratory efficacy study, Townsend's ground squirrel. Final Report- Work Unit 90 2 . 31. 21 p p .
-----, -----, and -----. 1987h. Strychninelaboratory efficacy study: Uinta ground squirrel. Final Report- Work Unit 902.31. 19 pp.
Pocatello Supply Depot. n.d. Confidential Statement of Formulation. 1 pp.

Arthropod Consumption by Small Mammals on Prairie Dog Colonies and Adjacent Ungrazed Mixed Grass Prairie in Western South Dakota1
2 3 W. Agnew , D. W. Ur~sk ,
and R. M. Hansen
Abstract: The percentage of arthropods and plants in the diets of seven small rodents captured on prairie dog colonies and adjacent mixed grasslands were estimated by microhistological techniques. Arthropod composition over the two year study averaged 51% and 37% on prairie dog colonies and mixed grasslands, respectively. Composition of arthropods on prairie dog colonies was greater during the summer than in late spring or late summer. Conversely, arthropods made up a considerably smaller percentage of small mammal diets in the summer on mixed grasslands. Nearly twice as many small mammals, excluding prairie dogs, were trapped on prairie dog colonies than on the adjacent mixed grasslands. Prairie dog colonies favor insectivorous rodent species. Prairie dogs, in creating habitat for insectivorous small mammals, may indirectly reduce localized arthropod outbreaks.
INTRODUCTION
The black-tailed prairie dog (Cynomys ludovicianus) originally inhabited prairies from southern Canada to Mexico and from the eastern foothills of the Rocky Mountains to the tallgrass prairie (Hall 1981). Prairie dog colonies may occupy large areas of rangeland. A single prairie dog colony occupied about 64,750 square kilometers in Texas (Merriam 1902).
Because pra1r1e dog feeding and burrowing activities conflict with the interests of livestock producers and some assume that prairie dogs influence the habitat for wildlife (Merriam 1902, Uresk et al. 1981, Hansen and Gold 1977), control of prairie dog populations has become a common practice (Merriam 1902, Uresk and Bjugstad 1983, Collins eta!. 1984). However, little or no information is available on small rodents or arthropods inhabiting prairie dog colonies or the impact of prairie dog control on associated fauna. The objectives of this study were to compare small
1 Paper presented at the 8th Wildlife Damage Control Workshop. (Rapid City, SD, April 28-30, 1987) 2
W. Agnew is Environmental Engineer, Trapper Minin§ Inc., Box 187, Craig, CO 81626.
D. W. Uresk is Research Biologist, USDA Forest Service, Rocky Mountain Forest and Range Experiment Station, SD School of Mines, Rapid City, SD 51401.
R. M. Hansen is Professor, Department of Range Science, Colorado State University, Fort Collins, CO 60523.
81
rodents, small rodent diets, vegetation, and arthropod populations on and off prairie dog colonies and provide baseline information on potential non-target impacts from prairie dog control programs.
STUDY AREA AND METHODS
The study area was located in Badlands National Park in west central South Dakota, 80 km east of Rapid City and 13 km southwest of Wall. The climate is semiarid-continental and is characterized by cold winters and hot summers. The average annual precipitation for the area is 40 em, most of which falls as high-intensity thunderstorms during the growing season (April-September). Snowfall accumulations average 62 ern per year. Mean annual temperature is 10°C, ranging from -5°C in January to 26°C in July.
Soils are primarily sedimentary deposits of clay, silt, gravel and volcanic ash (Raymond and King 1976). The landscape includes steep gullies, sharp ridges, flat-topped buttes, spires, and pinnacles that are partly covered with vegetation and upland areas of mixed-grass prairie. Gently sloping mixed-grass sites are scattered throughout the area and are the major sites occupied by prairie dogs. The elevation of the study sites ranged from 820 m to 900 m. The study area was neither farmed nor grazed by domestic livestock but portions have been grazed and farmed in the past. Native ungulates inhabiting the area are American bison (Bison bison), pronghorn (Antilocapra americana), mule deer (Odocoileus hemionus), and white-tailed deer (0. virginianus). -

The dominant grasses of the area are western wheatgrass (Agropyron smithii), blue grama (Bouteloua gracilis), buffalograss (Buchloe dactyloides), needleleaf sedge (Carex eleocharis), needle and thread (Stipa ~), and green needlegrass (Stipa viridula). Scarlet globemallow (Sphaeralcea coccinta), American vetch (Vicia americana), lanceleaf sage (Salvia reflexa), and prairie sunflower (Helianthus-petiolaris) are the most abundant forbs; fringed sage (Artemisia frigida) is the dominant shrub.
Small rodents, vegetation, and macroarthropods were sampled in 1981 and 1982. Six permanent 80-by 80-m (0.64 ha) study sites were selected for sampling small rodent and macroarthropod densities and composition and vegetation characteristics. Three sites were established on prairie dog colonies and 3 sites on mixed-grass prairie adjacent to each prairie dog colony. The mixed-grass prairie sites were 200 to 1,000 m from the prairie dog colonies. Soils were fine, _montmorillonitic, mesic Aridic Argiustolls of the Norrest-Blackpipe (silty clay loam) and Nunn (loam) series. Prairie dog colonies selected had similar burrow densities.
Estimates of small rodent (not including prairie dogs) densities were evaluated on unique captures from live trapping. Sixty-four Sherman live traps, spaced at 10-m intervals, were arranged in a grid design on each site. The grids were arranged so that a 10-m border of similar habitat surrounded each trapping grid. Trapping began in May and continued at 3-week intervals through September of each year. Each sample period consisted of 1 night of prebaiting followed by 4 consecutive nights of trapping. A mixture of peanut butter and rolled oats was used both inside and outside the traps to attract small rodents. Rodents were removed from the traps, identified as to species, assigned a unique number by toe amputation, then released at the capture site.
Fecal pellets were collected from small mammals captured in Sherman live traps, placed in paper envelopes and dried. The pellets were combined for each site by species and trap session. The arthropod composition in·the diets was based on 40 points and 40 fields per sample (Flake 1973). The percentage of plants in rodent feces was estimated by the microhistological technique of Sparks and Malechek (1968). Invertebrates were identified by examining composite samples by species in a petri dish at 20 power magnification and plant identification at 100 power magnification.
Ground dwelling macroarthropods were sampled by using 15 x 15-cm metal can pitfall traps (Rogers et al. 1978). Forty-nine cans were buried flush with the soil surface in a grid at 10-m spacing on each site. Pit traps were set for 4 consecutive nights at three-week intervals. Wooden lids were used to cover the traps and removed when trapping was initiated. Macroarthropods were removed, classified and counted. Actual numbers per .1 hectare as reported were based on the area pitfall traps represented on each site and converted to the
82
hectare fraction (1/10 ha). Although this technique may underestimate less mobile arthropods and larvae (Thomas and Sleeper 1977) and flying arthropods, adequate results can be obtained for most species captured (Gist and Crossley 1973, Baars 1979).
Total plant canopy cover (2-dirnensional) and annual aboveground biomass were estimated. Plant canopy cover was estimated in 150, 20 by 50-ern quadrats placed at 1-m intervals along 3, 50-m line transects at each site. Line transects were spaced 20 m apart. Canopy cover was visually estimated into 6 cover classes (Daubenmire 1959). Sampling was conducted in June (late spring), July (summer), and August (late summer) during 1981 and 1982. Abovegrou~d biomass was calculated by harvesting 18, 1/8-rn circular plots each year at peak plant production on each site. In addition to sampling on grazed areas, small wire exclosures were established on prairie dog colonies and mixed grass sites in 1982 to determine the increased plant biomass with no grazing.
Factorial analyses of variance (Nie et al. 1975) were used to compare abundance of small rodents captured. One-way analyses of variance examined differences within year and treatment. Two-way analyses of variance included year by treatment. Paired T-tests were used for total percent canopy cover. Chi-square and Spearman's rank order correlation coefficient (Snedecor and Cochran 1973) were used to compare macroarthropods. Type I error level at a = 0.05 was adapted for all tests unless stated otherwise.
RESULTS AND DISCUSSION
Small Rodents
Small rodent abundance was greater on pra1r1e dog colonies than on mixed-grass sites (table 1). However, rodent species richness was higher (P < 0.01) on mixed-grass prairie sites than on the prairie dog colonies. Similar results were reported by O'Meila et al. (1982) in Oklahoma. Decreased plant canopy cover, mulch cover, biomass and vegetation height on prairie dog colonies influenced inhabitation by some small rodent species. Small rodents captured, in decreasing order of abundance, were deer mice (Peromyscus maniculatus), northern grasshopper mice (Onychomys leucogaster), prairie voles (Microtus ochrogaster), thirteen-lined ground squirrels (Spermophilus tridecemlineatus), western harvest mice (Reithrodontomys megalotis), hispid pocket mice (Perognathus hispidus), and house mice (~us musculus). The abundance of small rodents did n~vary significantly among seasons except for northern grasshopper mice.
Diet Analysis
Arthropods and plants (including seeds) were the major foods of rodents captured during the study (table 2). Arthropods represented 51% of small rodent diets on prairie dog colonies and 37% of rodent diets on mixed grass prairie sites. Arthro-

1 Table 1.--Mean abundance (numbers/1000 trap nights) by years of small mammals on prairie dog colonies and on adjacent mixed grass prairie sites without prairie dogs in western South Dakota during 1981 and 1982.
1981 1982 Species Prairie Dog Mixed Grass Prairie Dog Mixed Grass
Colonies Prairie Colonies Prairie
deer mouse 17 ± 2a 8 ± 3b 41 ± 6c 10 ± 3b northern grasshopper mouse 11 ± 2a 4 ± 9b 13 ± 3a 2 ± 6b prairie vole 0 ± oa <1 ± 1a 0 ± oa 15 ± 20 thirteen lined ground squirrel <1 .1a 6 20 <1 .07a 5 b ± ± ± ± .9b
oa b oa western harvest mouse 0 ± 1 ± .4b 0 ± 3 ± .9b hispid pocket mouse 0 ± oa 1 ± .5 0 ± oa 2 ± .7 house mouse <1 ± .07a <1 ± -.07a <1 ± .07a 0 ± oa
Total 26a 20b 54c 37d
1Means within a row with the same superscript are not significantly different at (P < 0.01).
'Dible 2. H!IKI percentage of arthropoda ll1d wgetation in ti-e diets of aeven IIMll rodente by aeuon on pr-airie d~ colonies ani a::ljacent mix~graas pr-airie sites in western South Dslcota duri.~ 1981 ard 1982.
Stmner Late St.mrer Late S£!!!!8 Prnne Dog COlon1ea Hi:l«!dti"aas Pi'atne Dog COlon1ea MiXed tf ass
Vegetation Pi'a1r1e Dog Co[ontes MIXed Q-aas
Year Arthropod Vegetation Arthropod Vegetation Arthropod Vegetation deer lll:lUIIe
Arthropod Arthropod Vegetation ArthroE Vegetation
1981 36.5 63.5 52.2 47.8 66.3 33.7 31.8 68.2 61.3 38.7 32.0 68.0 1982 15.3 84.7 53.3 46.7 51.8 48.2 13.0 87.0 55.4 44.6 78.9 21.1 /werage 25.9 74.1(1) 52.8 47.2(2) 59.1 40.9(3) 22.4 77.6(4) 58.4 41.6(5) 55.5 44.5(6)
northern graasropper lll:lUSe
1981 48.8 51.2 56.0 44.0 82.5 17.5 42.2 57.8 45.8 54.2 58.2 41.8 1982 34.0 66.0 81.1 18.9 79.5 20.5 71.2 28.8 63.4 36.6 Average 41.4 58.6(7) 68.6 31.4(8) 81.0 19.0(9) 56.7 43.3(10) 60.8 39.2(1!)
pr-airie vole 0.0 100.0 1.6 98.4 1981
1982 17.0 83.0 19.8 80.2 44.3 55.7 Average 8.5 91.502) 10.7 89.3(13)
thirteen lined grourd squirrel
33.4 66.6 51.8 48.2 32.0 68.0 1981 29.7 70.3 1982 .8 99.2 65.8 34.2 49.5 50.5 Average 17.1 82.9(14) 58.8 41.2(15) 40.8 59.2(16)
western harvest IIDUSe 1981 79.0 21.0 15.0 85.0 77.8 22.2 1982 6.5 93.5 16.5 83.5 20.1 79.9 /werage 42.8 57.207) 15.8 84.2(18) 49.0 51.009)
hispid pocket TOOUse 26.5 73.5 3.3 %.7 45.9 54.1 1981
1982 1.0 99.0 2.4 97.6 /werage 2.2 97 .8(20) 24.2 75.8(21)
house TOOUse 1981 0.0 100.0 9.5 90.5 1982 Average
(1) % seeds 1s 42 .4 (2) % seeds 1s 22.6 ()) % seeds 1s 34.0 (4) % seeds 1s 56.0 (5) % seedS lS J0.2 (6) % seeds lS 34.0 (7) % seeds 1s 35.0 (8) % seeds is 25.0 (9) % seeds is 15.2 (10) % seeds is 25.6 (11) % seErls is 29.2 (12) % seeds is 15.0 (13) % seeds is 19.8 (14) % seErls is 48.8
(15) % seeds is 16.6 (16) % seeds is 43.2 (17) % seeds is 51.6 (18) % !leeds is 59.6 (19) % seErls is 32.8 (~) % seeds is 87.8 (21) % seeds is 68.3
pods were consumed in'the greatest quantity during the summer of 1981 on prairie dog colonies (fig. 1). During the same sample period, arthropod composition was at a low on adjacent mixed grasslands. Arthropod composition on mixed grasslands was highest in the late summer of 1982 while arthropod composition on prairie dog colonies was lowest during the late spring of 1982. Generally, composition of arthropods during the late spring and late summer sampling periods were similar between prairie dog colonies and mixed grasslands, however arthropod composition on prairie dog
83
colonies increased significantly during the summer sampling period and decreased on mixed grasslands. Sieg et al. (1986) reported peak consumption of arthropods by deer mice occurri~g in the summer and the lowest consumption in the spring on bentonite mine spoils in Montana.
The most common arthropods in the diets of small rodents were of the orders Coleoptera, Hymenoptera, and Orthoptera (table 3). Johnson (1961) and Flake (1973) also reported the importance of these arthropods in small rodent diets in Idaho and Colorado, respectively.

The high proportion of arthropods consumed in this study (particularly prairie dog colonies) is related to the high density of carnivorous and omnivorous rodents occupying the area and is consistent with several studies (Johnson 1961, Whitaker 1966, Flake 1973, Hansen 1975, Hingtgen and Clark 1984, Sieg et al. 1986).
N u M B E R s
80
70
60
160
ARTHROPOD
81 COLONIES 81 MIXED GRASS
82 COLONIES 82 MIXED GRASS
LATE SPRING SUMMER LATE SUMMER
MACROARTHROPODS
LATE SPRING SUMMER LATE SUMMER
Figure 1.--Percent arthropod composition found in small mammal feces and mean abundance (numbers/.1 ha) of macroarthropods by season on prairie dog colonies and on adjacent mixed grass prairie without prairie dogs in western South Dakota during 1981 and 1982.
84
Table 3.--Composition of major arthropods found (%) in small rodent feces on prairie dog colonies and mixed grass prairie sites in western South Dakota during 1981 and 1982.
Arthropod Taxa Acari Araneida Coleoptera Coleoptera larvae Diptera Hemiptera Hymenoptera Lepidoptera larvae Orthoptera Unknown
Prairie Dog Colonies
0.6 3.2
61.2 0.0 0.2 0.0
16. 1 8.2 9.5 1.0
100.0
Mixed-Grass Prairie
0.0 3.3
37.9 0.3 0.0 0.3
25.4 7.5
20.9 4.4
100.0
Plants were consumed in greater quantity on mixed grass prairie sites having greater numbers of herbivorous small rodents. Composition of plant matter increased on prairie dog colonies from 1981 to 1982 while arthropod composition increased on mixed grasslands during the same period.
In 1981, vegetation standing crop averaged 1,024 kg/ha and 1,644 kg/ha on prairie dog colonies and mixed grasslands, respectively without cages. In 1982, the average production increased to 1,235 kg/ha and 3,177 kg/ha on prairie dog colonies and mixed grass sites. The increase in production was attributed to an increase in the amount of precipitation in 1982 (69%) over the same period in 1981. Precipitation in 1981 was 96% of normal. The average aboveground biomass in 1982 under wire exclosures was 1822 kg/ha (48% increase compared to outside exclosures) and 3111 kg/ha (2% decrease) on prairie dog colonies and mixed grass sites, respectively.
The increased plant biomass in exclosures on prairie dog colonies is not surprising as many studies have documented that prairie dogs clip vegetation in order to maintain an unimpeded watch for predators (Hall 1955, Koford 1958, Tileston 1961, Agnew 1983, Agnew et al. 1986). Plant canopy cover on mixed-grass prairie sites was significantly greater in late spring and late summer of 1982 compared to that on prairie dog colonies (fig. 2). Cover values were similar during 1981 and in summer 1982.
Macroarthropods
Macroarthropods are a dynamic but poorly understood component of the rangeland ecosystem (Hewitt et al. 1974). Macroarthropod captures on prairie dog colonies and mixed grasslands were highly variable throughout 1981 and 1982.
Borror and DeLong (1971) reported macroarthropod distribution as species specific and highly variable between localities. O'Meilia et al. (1982) reported macroarthropod biomass was three times greater on areas without prairie dogs than on adjacent prairie dog colonies. Total macroarthropod densities in this study slightly favored mixed grasslands.

Macroarthropod numbers/.! ha ranged from 156 in the late spring to 45 in the late summer in 1981 on prairie dog colonies (fig. 1). In 1982, the densities remained relatively constant at 61 in the late spring and summer, then declined to 52 in the late summer. Macroarthropods on mixed grass prairie sites ranged from 132 in the late spring trapping period to 50 in the summer and 79 in the late spring of 1981. This was the only instance where macroarthropod densities were greater(P < .05) in the late summer than the late spring or summer periods. In 1982, the abundance of macroarthropods ranged from a high of 107 in late spring to a low of 60 in the late summer. Total macroarthropod numbers for summer and late summer sample periods during both years were similar, however, overall macroarthropod taxa composition and abundance was quite different between sites (table 4).
A significant decrease in the number of macroarthropods captured in late spring 1982 may be related to above normal winter and spring moisture. Mills (1952) and Atkins (1978) reported that precipitation can act as a direct cause of insect mortality. Insect eggs and small larvae can be permanently washed from their host plants by heavy rain or may drown in saturated soils. Many other authors (Huddleston et al. 1975, Lavigne and Campion 1978, Thomas 1979) stressed the importance of reliable precipitation in the reproductive success of insects and for herbage production and subsequent food availability.
Sieg et al. (1986) reported an increase in arthropod consumption by deer mice during periods
80
70
60
50
% 40
30
20
0
LATE SPRING
~ 81 COLONIES Dft 81 MIXED GRASS
~ 82 COLONIES li 82 MIXED GRASS
SUMMER LATE SUMMER
Figure 2.--Seasonal canopy cover of plants on prairie dog colonies and on adjacent mixed grass prairie without prairie dogs during 1981 and 1982.
85
Table 4.--Mean (±SE) abundance (numbers/.! ha) of macroarthropods on prairie dog colonies and on adjacent mixed grass prairie sites without prairie dogs in western South Dakota during 1981 and 1982.
Macroarthropod taxa 1
Class Insecta Hymenoptera Formicidae Coleoptera Histeridae Coleoptera Carabidae Coleoptera Tenebrionidae Orthoptera Gryllidae Diptera Coleoptera Chrysomelidae Orthoptera Acrididae Coleoptera Meloidae Lepidoptera Coleoptera Silphidae Hemiptera Reduviidae
Class Arachnida Aranedia Lycosidae Aranedia Thomisidae Aranedia Clubionidae Acarina Araneida Theridiidae Araneida Loxoscelidae
Class Crustacea Isopoda
Class Chilopoda
Class Diplopoda Total
Prairie dog colony
± 28 ± 10
8 4 2 1 2
112 48 39 ± 18 ±
8 ± 5 ± 3 ± 2 ± <1 1 ± <1 1 ± < 1
<1 ± <1 <1 ± <1
19 ± 6 5 ± 5 2 ± <1 2 ± 1 2 ± 2 1 ± 1
< 1 ± <1
<1 ± <1
<1 ± <1 267
(I:=33)
Mixed grass prairie
137 ± 27 14 ± 5 14 ± 3 21 ± 5 19 ± 5 12 ± 6 <1 ± <1 16 ± 6 <1 ± <1
7 ± 2 5 ± 2 2 ± 2
36 ± 7 <1 ± <1
2 ± <1 14 ± 6
1 ± <1 <1 ± <1
2 ±
<1 ± <1
0 295
(I:=36) 1Macroarthropods representing <1 per .1 ha
include: Coleoptera Cocciellidae, Coleoptera Scarabaeidae, Hemiptera Lygaeidae, Coleoptera Curculionidae, Hymenoptera, Araneida Gnaphosidae, Hymenoptera Mutillidae, Hemiptera Anthocoridae, Hymenoptera Sphecidae, Coleoptera, Coleoptera Cerambycidae, Coleoptera Elateridae, Coleoptera Cinindelidae, Coleoptera Melyridae, Odonata, Phalangida.
of decreased moisture and plant production. Similarly, in this study, small rodents on prairie dog colonies increased arthropod consumption during periods of below normal precipitation, however, arthropod consumption decreased during periods of below normal precipitation on mixed grass prairie sites.
Higher than normal precipitation may have negatively impacted macroarthropod densities in 1982, however, the lower number of macroarthropods reported is also related to the near two fold increase in small rodents on pra1r1e dog colonies and mixedgrass prairie sites.
Ants were the most commonly trapped macroarthropod on both treatments (table 4). Ant densities varied greatly between years and throughout the growing season, on and off of prairie dog colonies.
Ant abundance in late spring was higher (P < .01) on both prairie dog colonies and mixed grass sites in 1981 when compared to 1982. Other commonly trapped macroarthropods were beetles (Coleoptera), crickets and grasshoppers (Orthoptera), spiders (Araneida), flies (Diptera), butterflies and moths (Lepidoptera) and mites (Acarina). Macroarthropods trapped less frequently include true bugs (Hemiptera), daddy-long-legs (Phalangida), millipedes (Diplopoda), dragonflies (Odonata), saw bugs (Isopoda), and centipedes (Chilapoda).
The rank order of macroarthropod taxa on the two treatments was positively (P < 0.1) correlated (r = .68) for the two years. This indicates that composition (ranking) based on numbers of captures was somewhat correlated between the two treatments.
CONCLUSION
Prairie dogs act as ecosystem regulators by maintaining short-grass plant associations with less cover, lower vegetation height and production. These vegetative features, combined with high burrow densities, provide quality habitat for some species of small rodents, such as deer mice and grasshopper mice. However, vegetative manipulation by prairie dogs negatively impacts rodent species associated with dense vegetation of mixed-grass sites. The influence prairie dog activity has on the diets of small rodents inhabiting prairie dog colonies is evident in the greater percentage of arthropod fecal composition and the higher densities of insectivorous and omnivorous small rodents on prairie dog colonies. Yearly and seasonal differences in macroarthropod densities can be attributed to precipitation variations and associated vegetation changes and to increased small rodent densities.
Although the role of prairie dogs as ecosystem regulators is not fully accessed, these results indicate that prairie dogs influence small mammals, arthropods, and vegetation. Prairie dog control programs can influence the vegetation successional patterns on prairie dog colonies and create mixed grass plant associations. Associated prairie dog control impacts will also influence small rodents and arthropods common on prairie dog colonies.
LITERATURE CITED
Agnew, W. 1983. Flora and fauna associated with prairie dog ecosystems. M.S. Thesis, Colorado State Univ., Ft. Collins.
Agnew, W., D. W. Uresk, and R. M. Hansen. 1986. Flora and fauna associated with prairie dog colonies and adjacent ungrazed mixed grass prairie in western South Dakota. J. Range Manage. 39:135-139.
Atkins, M. D. 1978. Insects in perspective, 1st ed. Macmillan Pub., NY.
Baars, M. A. 1979. Catches in pitfall traps in relation to mean densities of carabid beetles. Oecologia 42:25-46.
86
Borror, D. J., and D. M. DeLong. 1971. An introduction to the study of insects, 3rd ed. Holt, Rinehart and Winston, Inc., NY.
Collins, A. R., J. P. Workman, and D. W. Uresk. 1964. An economic analysis of prairie dog (Cynomys ludovicianus) control. J. Range Manage. 37:358-361.
Daubenmire, R. 1959. A canopy cover method of vegetational analysis. Northw. Sci. 33:43-65.
Flake, L. P. 1973. Food habits of four species of rodents on a shortgrass prairie in Colorado. J. Mammal. 54:636-647.
Gist, C. S., and D. A. Crossley. 1973. A method for quantifying pit-fall trapping. Env. Ent. 3:951-952.
Hall, E. R. 1955. Prairie dog. Handbook of the mammals of Kansas. Univ. Kansas Misc. Publ., Mus. Natur. Hist. 7:87-69.
Hall, E. R. 1981. The mammals of North American, 2nd ed. John Wiley and Sons, N.Y.
Hansen, R. M. 1975. Plant matter in the diet of onychomys. J. Mammal. 56:530-531.
Hansen, R. M., and I. K. Gold. 1977. Blacktail prairie dogs, desert cottontails and cattle trophic relations on shortgrass range. J. Range Manage. 30:210-214.
Hewitt, G. B., E. W. Huddleston, R. J. Lavigne, D. M. Ueckert, and J. G. Watts. 1974.
·Rangeland entomology. Soc. Range Manage. Sci. Series 2:127.
Hingtgen, T. M., and W. R. Clark. 1984. Impact of small mammals on the vegetation of reclaimed land in the northern Great Plains, J. Range Manage. 37:438-441.
Huddleston, E. W., R. A. Shaw, and M. V. Riggs. 1975. Insect population dynamics studies of the Pantex Site, 1972. U.S. International Program, Grassland Biome, Tech. Rep. No. 280. Nat. Res. Ecol. Lab. Colo. St. Univ., Fort Collins. 44 p.
Johnson, D. R. 1961. The food habits of rodents on rangelands of southern Idaho. Ecology 42:407-410.
Koford, C. B. 1958. Prairie dogs, whitefaces, and blue grama. Wildl. Monogr. 3.
Lavigne, R. J., and M. K. Campion. 1978. The effect of ecosystem stress on the abundance and biomass of carabidae (Coleoptera) on the sortgrass prairie. Environ. Entomol. 7:88-92.
Merriam, C. J. 1902. The prairie dog of the great plains. USDA Yearb. 1901:257-270.
Mills, H. B. 1952. Weather and climate. U.S. Dept. Agr. Yearb. 1952:422-429.
Nie, N. H., C. H. Hall, J. G. Jenkins, K. Steinbrenner, and D. H. Bent. 1975. SPSS:statistical package for the social sciences. 2nd ed. McGraw-Hill, Pub. NY.
O'Meilia, N. E., F. L. Knopf, and J. C. Lewis. 1982. Some consequences of competition between prairie dogs and beef cattle. J. Range Manage. 35:580-585.
Raymond, W. H., and R. U. King. 1976. Geologic map of the Badlands National Monument and vicinity, west-central South Dakota. U.S. Geol. Survey. Map I-934.
Rogers, L. E., N. Woodley, J. K. Sheldon, and V. A. Uresk. 1978. Darkling beetle populations (Tenebrionidae) of the Hanford Site in

southcentral Washington. Battelle-Northwest. PLN-2465. Richland, WA 108 p.
Sieg, C. H., D. W. Uresk, and R. M. Hansen. 1966. Seasonal diets of deer mice on bentonite mine spoils and sagebrush grasslands in southeastern Montana. Northw. Sci. 60:61-69.
Snedecor, G. W., and W. G. Cochran. 1973. Statistical methods. 6th ed. Iowa State Univ. Press, Ames.
Sparks, D. R., and J. C. Malecheck. 1966. Estimating percentage dry weight in diets using a microscope technique. J. Range Manage. 21:264-265.
Thomas, B., Jr., and E. L. Sleeper. 1977. The use of pitfall traps for estimating the abundance of arthropods, with special reference to the Tenebrionidae (Coleoptera). Ann. Ent. Soc. Amer. 70:242-248.
Thomas, B., Jr. 1979. Patterns in the abundance of some tenebrionid beetles in the Mojave desert. Environ. Entomol. 8:566-574.
87
Tileston, J. V. 1961. Comparison of white-tailed prairie dog town with a black-tailed prairie dog town in north-central Colorado. M.S. Thesis, Colorado State Univ., Fort Collins.
Uresk, D. W., J. G. MacCracken, and A. J. Bjugstad. 1961. Prairie dog density and cattle grazing relationships. p. 199-201. In: Fifth Great Plains Wild!. Damage Control Workshop. Proc. Oct. 13-15, 1981. Univ. Nebraska, Lincoln.
Uresk, D. W., and A. J. Bjugstad. 1983. Prairie dogs as ecosystem regulators on the Northern High Plains. p. 91-94. In: Seventh North Amer. Prairie Conference, Aug. 4-6, 1960. Southwest Missouri State Univ., Springfield.
Whitaker, J. 0. 1966. Food of Mus musculus, Peromyscus maniculatus bairdi, and Peromyscus leucopus in Vigo County, Indiana. J. Mammal. 47:473-466.

Small Mammals: Pests or Vital Components of the Ecosystem1
2 Carolyn Hull Sieg
ABSTRACT.--Small mammals regarded as "pests" should not be viewed separately from other components in the ecosystem. Small mammals have significant influences on vegetation and soils, exert predatory pressure on other animals, and provide food for predators. Future management efforts should include consideration of these diverse influences.
Careful evaluation of the role of small mammals and their relationships with their environment is necessary to fully appreciate the impact of control programs on the ecosystem. Small mammals regarded as "pests" should not be viewed separately from other components in the ecosystem. Rather, small mammals must be viewed in terms of their interrelationships with other components. Alteration of small mammal communities through control programs influence other components and ultimately the whole system.
Small mammal influences may be grouped as those effects on (1) vegetation, (2) soils, and (3) other animals. Vegetative influences may include effects on primary productivity, plant species composition, and decomposition rates of plant materials. Small mammals influence both physical and chemical properties of soils. Small mammals prey on insects and occasionally other small mammals, provide a prey base for carnivores, and modify their environments in such a way as to provide habitat for other animals.
INFLUENCES ON VEGETATION
Researchers have proposed various ways in which small mammals interact with plant communities. The main interactions can be categorized as those relating to primary productivity, plant species composition, plant stature and reproduction, and decomposition rates of plant materials.
1Paper presented at the 8th Wildlife Damage Control Workshop, April 26-30, 1987, in Rapid City, South2Dakota.
Sieg is Wildlife Biologist with the Rocky Mountain Forest and Range Experiment Station, Rapid City, South Dakota, in cooperation with the South Dakota School of Mines and Technology. The Station's headquarters is in Fort Collins, in cooperation with Colorado State University.
88
Primary Production Small mammal herbivores may consume as much as
60% (Migula et al. 1970) to 80% (Taylor and Loftfield 1942) of the total annual primary plant production. They may have localized, large-scale impacts on primary productivity during population explosions. However, the effect of direct consumption of plants by herbivores must be evaluated in terms of what portion of the primary production is actually available to the animal. Estimates of herbage consumption by small mammals ranged from <1% in northern shortgrass and midgrass sites to as much as 20% in desert grasslands (French et al. 1976). Harris (1971) estimated that 0.17-5.01% of the net primary production was transferred to the rodent trophic level. Hayward and Phillipson (1979) concluded that the impact of small mammal consumption on net or available primary production is negligible in most systems.
Light grazing by small mammals may stimulate plant production. For example, moderate grazing by voles (Microtus oeconumus and M. middendorffit) increased production of two plant species by stimulating new shoot growth (Smirnov and Tokmakova 1971, 1972). Regrowth of rye grass (Lolium perenne) that had been grazed by hispid cotton rats (Sigmodon hispidus) was faster than regrowth of grass that had been mechanically clipped (Howe et al. 1982). The authors speculated that either a biochemical agent in saliva or the specific manner of tissue removal by the cotton rats stimulated regrowth of the rye grass.
Plant Species Composition
Small mammals have been credited with changing plant community composition and species distribution. Rodents and rabbits have been cited as major agents responsible for range destruction (.Taylor 1936). Other authors (e.g., Smith 1940) viewed the presence of these small mammals as a symptom of poor range condition, rather than a cause. Small mammals have been credited with assisting in the control of undesirable plants. Plant communities in Montana, Utah, and Nevada were altered by extensive damage to

big sagebrush (Artemisia tridentata) during cyclic population peaks of voles (Microtus~.) (Mueggler 1967, Frischknecht and Baker 1972). Control of pocket gophers (Thomomys talpoides) in western Colorado resulted in an increase of perennial forbs (Turner 1969); grass and sedge densities were higher in areas where gophers were present in Utah (Ellison and Aldous 1952). However, small mammal herbivory may also reduce densities of plants viewed as "beneficial" by land managers. Selective grazing by meadow mice (Microtus californicus) kept the habitat open and increased plant species diversity; when mice were excluded grasses increased and became dominant (Batzli and Pitelka 1970).
Small mammals can also alter plant community composition and species distribution by consuming and caching seeds. Rodents have been blamed for poor establishment of seeded plants and large scale failures of tree crops (Smith and Aldous 1947, Gashweiler 1970). Small mammals can further influence plant community composition by heavily grazing or damaging plants, and thus reducing their ability to produce seeds (Batzli and Pitelka 1970). Severe grazing by montane meadow mice (Microtus montanus) and deer mice (Peromyscus maniculatus) decreased biomass and seed production of cheatgrass (Bromus tectorum) in eastern Washington (Pyke 1986)-.-----
Seed caching activities can alter plant distribution by either increasing or decreasing survival of plants. The harvest and storage of grass seeds by meadow mice was estimated to reduce seed fall of preferred food plants by 70% in some areas in California (Batzli and Pitelka 1970). Yet, dispersal of seeds by small mammals can result in increased germination and survival. Seeds are often moved to better germination sites and seeds that normally have a "clumped" distribution pattern (as below the parent plant) are often scattered, or consumed, resulting in less dense stands (Reichman 1979). West (1968) estimated that 50% of the bitterbrush (Purshia tridentata) and 15% of the ponderosa pine (Pinus ponderosa) plants in central Oregon resulted from rodent seed caches. Consumption of wild oats (Avena fatua) and wild barley {Hordeum leporinum) seeds by meadow mice and house mice (Mus musculus) reduced densities of these two plants~ 62% and 30%, respectively, allowing for increases in plant size and seed production of wild barley, Italian ryegrass (Lolium multiflorum), and bromegrasses (Bromus mollis and B. diandrus) {Bachert and Jain 197~
Some organisms may be dependent on small mammals for seed or spore.dispersal. Truffles and other hypogeous fungi depend on mammal and invertebrate mycophagy for spore dispersal {Fogel and Trappe 1978). Small mammals may serve as effective agents in the dispersal of mycorrhizal fungi and nitrogen-fixing bacteria. Viable nitrogen-fixing bacteria, yeast, and spores of mycorrihizal fungi all survived passage through the digestive tracts of forest rodents captured in western Oregon (Li et al. 1986). These results suggest that small mammals can innoculate recently disturbed soils, as after fires (Li et al. 1986) and in mined areas (Sieg et al. 1986). In this manner, pioneering small mammals
89
may help initiate plant succession and increase survival of new plants.
The rate of plant succession may be affected by small mammal burrowing and feeding activities. Prairie dog mounds disrupt grass associations and provide bare soil for the invasion of lower successional plants. Pocket gopher mounds provide bare soil on which secondary plant succession may begin (Larrison 1942), thereby increasing the diversity of plants (Laycock 1958). Investigations following the Mount St. Helens eruption suggest that northern pocket gophers (Thomomys talpoides) may be an important agent in determining succession in volcanically disturbed areas. Pocket gophers bring pre-eruption soils to the tephra surface; plant survival on the pocket gopher mounds has exceeded survival on adjacent areas (Anderson and MacMahon 1985). Selective herbivory by small mammals can also alter plant successional rates. Rodents may aid in the recovery of overgrazed grasslands by selectively grazing on "weedy" plant species (Gross 1969). Grazing by California ground squirrels (Spermophilus becheyi) decreased the abundance of filaree (Eroduim botrys) and lupine (Lupinus bicolor) on Californian grasslands, while smooth bromegrass, a grass of higher successional stage than the forbs, increased (Horn and Fitch 1942).
Decomposition of Plant Materials
Small mammals can influence the rate of decomposition of organic materials by adding green herbage and excrements to the litter layer and by reducing the particle size of vegetative material. They are more efficient in effecting the mineralization of organic matter than either insects or ungulates (Galley et al. 1975). As much as 58% of the total herbage harvested by small mammmals on a shortgrass prairie was not consumed (Scott et al. 1979). These "wastage" activities may be important in accelerating decomposition rates of plant materials. Green plant material that becomes litter decomposes more rapidly that brown plant material (Grant and French 1960). Voles affect decomposition rates by altering microclimatic conditions in the litter layer and by deposition of excrements and vegetative cuttings into litter layers, which increases microorganism growth (Zlatin and Kodashova 1974). Reduction of particle size of living and dead vegetative material by small mammals also increases decomposition rates.
INFLUENCES ON SOILS
Soil structure and chemical composition are affected by the activities of small mammals. Soil structure is largely influenced by burrowing activities. Burrowing and the addition of feces and urine to the soil influence soil chemical composition through changes in nutrient and mineral cycling rates and pathways.
Soil Structure
Soil structure may be altered as small mammals burrow, bringing large quantities of mineral soil

to the surface. Pocket gophers are reported to excavate 18 metric tons of soil material per hectar per year (Hole 1981). Abaturov (1966) estimated that mole burrows covered 36% of woodland ground surface, which resulted in increased soil porosity and drainage, and altered soil water holding capacities. Pocket gophers tended to increase porosity and lower bulk density of soils in a subalpine grassland in Utah (Laycock and Richardson 1975). However, in seeded mountain ranges in Utah (Julander et al. 1959), pocket gopher activity packed the soil surface, lowered infiltration rates, and decreased available soil moisture.
Mima mound microrelief is another modification of the physical structure of the environment that has been attributed to small mammals. These mounds are characterized by a lower bulk density, less soil structure, and increased water permeability compared with neighboring undisturbed soil (Ross et al.1968). Soil mounds resulting from small mammal burrowing are strongly heated, and the surface crust that rapidly forms prevents evaporation. As a result, at depths of 5-20 em the water content of the soil under mounds is 7-8% higher than that at corresponding depths in virgin soil (Zlatin and Kodashova 1974).
Chemical Composition
The most significant role of small mammals may be their effect on the chemical composition of soils, particularly the addition and incorporation of nitrogen (Taylor 1935). Soil chemical composition can be altered by the addition of small mammal excreta and by the upward displacement of nutrients through the soil profile. Feces and urine add to the organic matter content in soils, increase available nitrogen levels, and possibly influence the growth of Azotobacter (Kucheruk 1963 [cited in Hayward and Phillipson 1979]). Greene and Reynard (1932) estimated that the average kangaroo rat (Dipodomys spectabilis) burrow contained 2 kg of nitrate. Small mammals influenced the nitrogen flux on shortgrass prairies more than any other vertebrate, but less than either belowground or aboveground invertebrates (Woodmansee et al. 1978).
The concentration of other minerals may also be influenced by small mammal activities. High concentrations of soluble calcium, magnesium, and bicarbonate were reported in kangaroo rat burrows by Greene and Reynard (1932). Mole (Talpa europea) burrowing returned large quantities of leached calcium and magnesium to the zone of intense plant root activity (D~nesman 1967). Older prairie dog mound soils had higher pH values, and phosophorous values equal or greater than adjacent nonmound soils (Carlson and White 1987).
INFLUENCES ON OTHER ANIMALS
Small Mammals as Predators
Small mammals function as secondary consumers in the ecosystem by preying on invertebrates and on other mammals, which may have direct impacts on prey
90
populations and indirect influences on primary production. Insectivorous species may exert a regulatory effect on invertebrate populations; small mammals consumed a high percentage of invertebrate populations in nearly all grassland sites studied by French et al. (1976). Carnivory has been shown to influence prey species densities. Hayward and Phillipson (1979) estimated that weasels (Mustela nivalis) consumed as much as 14% of the small mammal production, resulting in a reduction in the impact of small mammals on the rest of the ecosystem.
Secondary consumption may indirectly influence primary production. Plant consumption by invertebrate herbivores may be reduced by the insectivorous feeding habits of small mammals. Destruction of large numbers of larch sawfly larva by shrews was reported by Buckner (1964). Small mammal predation may serve to reduce invertebrate species that are themselves predators of phytophagous insects. Field mice (Apodemus sylvaticus) were responsible for a 50% reduction in an overwintering population of Hymenopteran cocoons (Obtrel et al. 1978). Interactions between insectivorous mammals and their food sources have received less attention than the interactions of small animals with primary production food sources, and therefore the extent to which invertebrate populations are regulated by insectivory is largely speculative.
Small Mammals as Prey
Small mammals serve as a food supply for a large number of predators and can exert significant influence on predator population cycles. Small mammals, especially rodents, are characterized by high productivity rates, and thus, even at relatively low densities, are an important source of food for predators. Densities of small mammals can have profound impacts on the reproductive potential of some predators. For example, the proportion of tawny owls (Strix aluco) that bred each year in England varied from 0 to 80%, according to the number of mice and voles present (Southern 1970). Several authors have documented cases where population levels of predators can be traced to small mammal densities. For example, population declines in black-tailed jackrabbits (Lepus californicus) induced significant decreases in numbers of coyotes (Canis latrans) in northwestern Idaho and southern Idaho (Clark 1972) and kit foxes (Vulpes macrotis) in western Utah (Egoscue 1975). Raptors, such as the great-horned owl (Bubo virginianus), may increase as much as five-fold during years of high densities of snowshoe hares in Alberta (Mcinvaille and Keith 1974). Further, population outbreaks of small mammals can induce predators to switch from preferred prey, thus reducing predation on some game species (Leopold 1933).
Small Mammals as Home Builders
Small mammals also influence other animals and arthropods by altering the environment in ways that provide habitat for other species. For example, bird densities and species richness were higher on prairie dog towns than on adjacent mixed-grass communities in South Dakota (Agnew et al. 1986).

Prairie dog burrows provide nest sites and escape cover for burrowing owls (Athene cunicularis), prairie rattlesnakes (Crot~iridis viridis), and a variety of small mammals and arthropods (Costello 1969). Mounds made by moles (Scalopus spp.) become habitats of such animals as arthopods, amphibians, and reptiles (Hole 1981).
SUMMARY
Management decisions to control small mammals usually stem from perceived negative values associated with the offending species. However, as managers increasingly focus on ecosystem management, the positive role of small mammals on vegetation, soils, and other animals may be of interest. Further, public interest in a diversity of habitats and animals should induce managers to balance animal control efforts with efforts to maintain diversity in ecosystems. Small mammals can have significant influences on vegetation and soils, exert predatory pressure on insects and other mammals, and also provide food for other predators. It appears that small mammals fill important and perhaps indispensible roles in ecosystem function. They are interconnected in complex ways with other biotic and abiotic components of the ecosystem, and future management efforts should focus on these relationships to a greater extent than in the past.
LITERATURE CITED
Abaturov, B. D. 1968. Importance of the digging activity of the mole (Talpa euorpaea ~.) on soil cover and vegetation in broadleaf-fir forest. Pedobiologia 8:239-264.
Agnew, W., D. W. Uresk, and R. M. Hansen. 1986. Flora and fauna associated with prairie dog colonies and adjacent ungrazed mixed-grass prairie in western South Dakota. J. Range Manage. 39:135-139.
Anderson, D. C., and J. A. MacMahon. 1985. Plant succession following the Mount St. Helens volcanic eruption: facilitation by a burrowing rodent, Thomomys talpoides. Am. Midl. Nat. 114:62-69.
Batzli, G. 0., and F. A. Pitelka. 1970. Influence of meadow mouse populations on California grassland. Ecology 51:1027-1039.
Bochert, M. I., and S. K. Jain. 1978. The effect of rodent seed predation on four species of California annual grasses. Oecologia 33:101-113.
Buckner, C. H. 1964. Metabolism, food capacity and feeding behavior in four species of shrews. Can. J. Zool. 42:259-279.
Carlson, D~ C., and E. M. White. 1987. Effects of prairie dogs on mound soils. Soil Sci. Soc. Am. J. 51:389-393.
Clark, F. W. 1972. Influence of jackrabbit density on coyote population change. J. Wild!. Manage. 36:343-356.
Costello, D. F. 1969. The prairie world. Thomas Y. Crowell Co., New York.
Dinesman, L. G. 1967. Influence of vertebrates on primary production of terrestrial communities,
91
p. 261-266. InK. Petrusewica (ed.). Secondary productivity-of terrestrial ecosystems. Warsaw, Poland.
Egoscue, H. J. 1975. Population dynamics of the kit fox in western Utah. Bull. So. Calif. Acad. Sci. 74:122-127.
Ellison, L., and C. M. Aldous. 1952. Influence of pocket gophers on vegetation of subalpine grassland in central Utah. Ecology 33:177-186.
Fogel, R., and J. M. Trappe. 1978. Fungus consumption (mycophagy) by small animals. Northw. Sci. 52:1-31.
French, N. R., W. E. Grant, W. Grodzinski, and D. M. Smith. 1976. Small mammal energetics in grassland ecosystems. Ecol. Monogr. 46:201-220.
Frischknecht, N. C., and M. F. Baker. 1972. Voles can improve sagebrush rangelands. J. Range Manage. 25:415-425.
Gashweiler, J. S. 1970. Further study of conifer seed survival in a western Oregon clear cut. Ecology 51:849-854.
Golley, F. B., K. Petrusewicz, and L. Ryszkowski (eds). 1975. Small mammals: their productivity and population dynamics. Cambridge University Press, London.
Grant, W. E., and N. R. French. 1980. Evaluation of the role of small mammals in grassland ecosystems: A modeling approach. Ecol. Model. 8:15-37.
Greene, R. A., and C. Reynard. 1932. The influence of two burrowing rodents, Dipodomys spectabilis and Neotoma albigula, on desert soils in Arizona. Ecology 13:73-80.
Gross, J. E. 1969. The role of small herbivorous mammals in the functioning of the grassland ecosystem. p. 268-278. In R. L. Dix and R. G. Biedleman (eds). The grassland ecosystem: A preliminary synthesis. Range Sci. Dept. Sci. Ser. No. 2, Colorado State University, Fort Collins, CO.
Harris, L. D. 1971. A precis of small mammal studies and results in the grassland biome. p. 213-240. InN. R. French (ed). Preliminary analysis or-structure and function in grasslands. Range Sci. Dept. Sci. Ser. No. 10. Co. State Univ., Fort Collins, CO.
Hayward, G. F., and J. Phillipson. 1979. Community structure and functional role of small mammals in ecosystems. p. 136-211. In Stoddard, D. M. (ed). Ecology of small mammals. Chapman and Hall, London.
Hole, F. D. 1981. Effects of animals on soil. Geoderma 25:75-112.
Horn, E. E., and H. S. Fitch. 1942. Interrelations of rodents and other wildlife of the range. The San Joaquin Experimental Range. Univ. Calif. Exp. Sta. Bull. 663:96-129.
Howe, J. G., W. E. Grant, and L. J. Folse. 1982. Effects of grazing by Sigmodon hispidus on the regrowth of annual rye-grass (Lolium perenne). J. Mammal. 63:176-179.
Julander, 0., J. B. Low, and 0. W. Morris. 1959. Influence of pocket gophers on seeded mountain range in Utah. J. Range Manage. 12:219-224.
Larrison, E. J. 1942. Pocket gophers and ecological succession in the Wenas region of Washington. Murrelet 23:34-41.

Laycock, W. A. 1958. The initial pattern of revegetation of pocket gopher mounds. Ecology 39:346-351.
Laycock, W. A., and B. Z. Richardson. 1975. Longterm effects of pocket gopher control on vegetation and soils of a subalpine grassland. J. Range Manage. 26:458-462.
Leopold, A. 1933. Game management. Scribner, New York.
Li, C. Y., C. Maser, Z. Maser, and B. A. Caldwell. 1986. Role of rodents in forest nitrogen fixation in western Oregon: another aspect of mammal-mycorrhizal fungus-tree mutualism. Great Basin Nat. 46:411-414.
Mcinvaille, W. B., Jr., and L. B. Keith. 1974. Predator-prey relations and breeding biology of the great-horned owl and red-tailed hawk in central Alberta. Can. Field Nat. 88:1-20.
Migula, P., W. Grodzinski, A. Jasinske, and B. Muialek. 1970. Vole and mouse plagues in south-eastern Poland in the years 1945 - 1967. Acta Theriol. 15:233-252.
Mueggler, W. F. 1967. Voles damage big sagebrush in southwestern Montana. J. Range Manage. 20:88-90.
Obtrel, R., J. Zejida, and V. Holisova. 1978. Impact of small rodent predation on an overcrowded population of Diprion pini during winter. Folia Zool. 27:97-110.
Pyke, D. A. 1986. Demographic responses of Bromus tectorum and seedlings of Agropyron spic~o grazing by small mammals: occurrence and severity of grazing. J. Ecology 74:739-754.
Reichman, 0. J. 1979. Desert granivore foraging and its impact on seed densities and distributions. Ecology 60:1085-1092.
Ross, B. A., J. R. Tester, and W. J. Breckenridge. 1968. Ecology of mima-type mounds in northwestern Minnesota. Ecology 49:172-177.
Scott, J. A., N. R. French, and J. W. Leetham. 1979. Patterns of consumption in grasslands. p. 89-105. InN. R. French (ed). Ecological Studies 32. -perspectives in grassland ecology. Col. State Univ., Fort Collins.
Sieg, C. H., D. W. Uresk, and R. M. Hansen. 1986. Seasonal diets of deer mice on bentonite mine spoils and sagebrush grasslands in southeastern Montana. Northwest Sci. 60:81-89.
92
Smirnov, V. S., and S. G. Tokmakova. 1971. Preliminary data on the influence of different numbers of voles upon the forest tundra vegetation. Ann. Zool. Fenn. 8:154-156.
Smirnov, V. S.,. and S. G. Tokmakova. 1972. Influence of consumers on natural phytocenoses' production variation. p. 122-127. In Wielgolaski, F. E., and T. Rosswall (eds). Tundra Biome. Proceedings of the IV International Meeting on the Biological Productivity of Tundra. Leningrad, Russia.
Smith, R. A. 1940. The effect of overgrazing and erosion upon the biota of the mixed-grass prairie of Oklahoma. Ecology 21:381-397.
Smith, C. F., and S. E. Aldous. 1947. The influence of mammals and birds in retarding artificial and natural reseeding of coniferous forests in the United States. J. Forestry 45:361-369.
Southern, H. N. 1970. The natural control of a populations of Tawny owls (Strix aluco). J. Zoology 147:197-285.
Taylor, W. P. 1935. Some animals relations to soils. Ecology 16:127-136.
Taylor, W. P. 1936. Some effects of animals on plants. Sci. Monthly 43:262-271.
Taylor, W. P., and J. V. G. Loftfield. 1942. Damage to range grasses by the zuni pra1r1e dog. U.S. Dept. Agr. Bull. No. 1227:16.
Turner, G. T. 1969. Responses of mountain grassland vegetation to gopher control, reduced grazing, and herbicide. J. Range Manage. 22:377-383.
West, N. E. 1968. Rodent influenced establishment of ponderosa pine and bitterbrush seedlings in central Oregon. Ecology 49:1009-1011.
Woodmansee, R. G., J. L. Dodd, R. A. Bowman, F. E. Clark, and C. E. Dickinson. 1978. Nitrogen budget of a shortgrass prairie ecosystem. Oecologia 34:363-376.
Zlatin, R. E., and K. S. Kodashova. 1974. The role of animals in the biological cycle of the forest-steppe ecosystem. Science Publ. House, Moscow.

Historical and Present Status of the Black-Footed Ferret1
Dean E. Biggins2 and Max H. Schroeder3
Abstract.--The black-footed ferret (Mustela nigripes) was once widely distributed in the Great Plains and intermountain valleys of North America, its range overlapping the combined ranges of several species of prairie dogs (Cynomys spp.). Most life cistory information has been obtained from studies of ferrets in southwestern South Dakota (1964-1974) and studies near Meeteetse, Wyoming (1981-present). The ferret's nearly complete dependence on prairie dogs was documented in both study areas. The recent collapse of the Meeteetse population of ferrets due to an outbreak of canine distemper underscores the threat posed by this disease, but reductions of prairie dogs by man and other diseases are also potentially harmful. Eighteen animals are being held for captive breeding, no free-ranging ferrets have been located, and species recovery seems dependent on captive propagation and releases.
INTRODUCTION
The black-footed ferret (Mustela nigripes) is a member of the family Mustelidae. The long, slender animals weigh 650 to 1400 grams; adult males are about 47% heavier than adult females (Anderson et al. 1986). The historic range of the black-footed ferret was coextensive with the combined ranges of the black-tailed prairie dog (Cynomys ludovicianus), the white-tailed prairie dog (C. leucurus), and Gunnison's prairie dog (C. gunnisoni). The black-footed ferret is nearly totally dependent on the prairie dog ecosystem, and any prairie dog management program potentially affects the ferret's welfare. The black-footed ferret is now perhaps North America's rarest mammal. We review the ferret's historic distribution and abundance, summarize more recent developments, and present perspectives on the animal's future.
lpaper presented at the Eighth Great Plains Wildlife Damage Control Workshop, Rapid City, South Dakota, April 28-30, 1987. 2u.s. Fish and Wildlife Service, National Ecology Center, 1300 Blue Spruce Drive, Fort Collins, Colorado 3u.s. Fish and Wildlife Service, Region 6, P. 0. Box 25486, Denver Federal Center, Denver, Colorado 80228
93
HISTORIC DISTRIBUTION AND ABUNDANCE
Audubon and Bachman introduced the black-footed ferret to the scientific world in 1851, although Indians of several Great Plains tribes were already familiar with the animal (Clark 1976). Some authors have implied or categorically stated that the ferret was always uncommon, although others (e.g., Henderson et al. 1969, Hillman and Carpenter 1980) have qualified their remarks by pointing out the difficulties of finding ferrets even when they are known to be present. Evidence suggesting historical rarity includes use of ferret parts in Indian ceremonies (Fortenberry 1972), the relatively late discovery of the ferret, and the paucity of reports and specimens. However, our experiences with ferrets near Meeteetse, Park County, Wyoming, support the implication by Linder et al. (1972) that ferrets were seldom reported simply because they are fossorial, nocturnally active, and thus difficult to observe. The ferret population in Park County was the largest known for the species, yet few residents had ever seen one and they were not "discovered" until 1981. Researchers usually had to locate ferrets using high-intensity spotlights, equipment unavailable to the natives and early settlers of the Great Plains.
Some early records of the black-footed ferret came from trappers. Such records are sparse, but the American Fur Company received
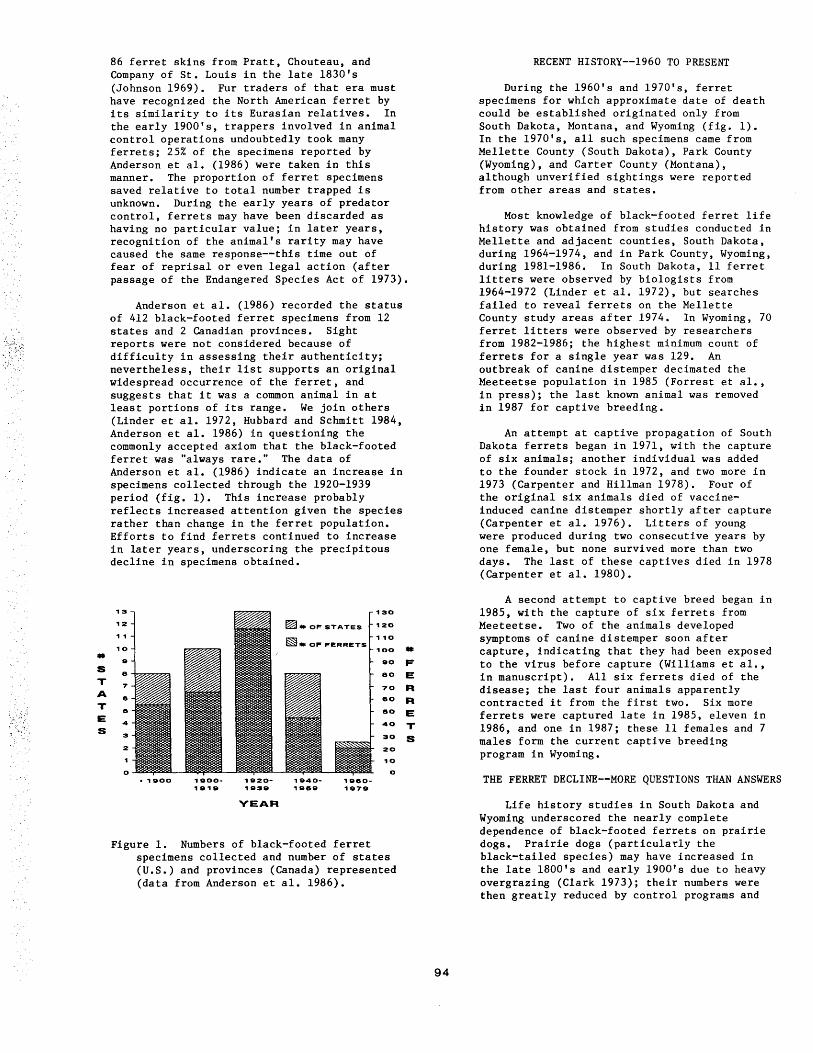
• s T A T E s
86 ferret skins from Pratt, Chouteau, and Company of St. Louis in the late 1830's (Johnson 1969). Fur traders of that era must have recognized the North American ferret by its similarity to its Eurasian relatives. In the early 1900's, trappers involved in animal control operations undoubtedly took many ferrets; 25% of the specimens reported by Anderson et al. (1986) were taken in this manner. The proportion of ferret specimens saved relative to total number trapped is unknown. During the early years of predator control, ferrets may have been discarded as having no particular value; in later years, recognition of the animal's rarity may have caused the same response--this time out of fear of reprisal or even legal action (after passage of the Endangered Species Act of 1973).
Anderson et al. (1986) recorded the status of 412 black-footed ferret specimens from 12 states and 2 Canadian provinces. Sight reports were not considered because of difficulty in assessing their authenticity; nevertheless, their list supports an original widespread occurrence of the ferret, and suggests that it was a common animal in at least portions of its range. We join others (Linder et al. 1972, Hubbard and Schmitt 1984, Anderson et al. 1986) in questioning the commonly accepted axiom that the black-footed ferret was "always rare." The data of Anderson et al. (1986) indicate an increase in specimens collected through the 1920-1939 period (fig. 1). This increase probably reflects increased attention given the species rather than change in the ferret population. Efforts to find ferrets continued to increase in later years, underscoring the precipitous decline in specimens obtained.
13 130
12 ~-OF STATES 120
1 1 ~ • OF FERRETS
110
10 100
" QO
8 eo
7 70
e eo
6 eo
4 40
3 30
2 20
10
0 0 • 1QOO 1QOO- 1SI20- 1SI40- 1SieO-
1Q1Q 1SI3Q 1SI6Q 1Q7Q
YEAR
Figure 1. Numbers of black-footed ferret specimens collected and number of states (U.S.) and provinces (Canada) represented (data from Anderson et al. 1986).
• F E R R E T s
94
RECENT HISTORY--1960 TO PRESENT
During the 1960's and 1970's, ferret specimens for which approximate date of death could be established originated only from South Dakota, Montana, and Wyoming (fig. 1). In the 1970's, all such specimens came from Mellette County (South Dakota), Park County (Wyoming), and Carter County (Montana), although unverified sightings were reported from other areas and states.
Most knowledge of black-footed ferret life history was obtained from studies conducted in Mellette and adjacent counties, South Dakota, during 1964-1974, and in Park County, Wyoming, during 1981-1986. In South Dakota, 11 ferret litters were observed by biologists from 1964-1972 (Linder et al. 1972), but searches failed to reveal ferrets on the Mellette County study areas after 1974. In Wyoming, 70 ferret litters were observed by researchers from 1982-1986; the highest minimum count of ferrets for a single year was 129. An outbreak of canine distemper decimated the Meeteetse population in 1985 (Forrest et al., in press); the last known animal was removed in 1987 for captive breeding.
An attempt at captive propagation of South Dakota ferrets began in 1971, with the capture of six animals; another individual was added to the founder stock in 1972, and two more in 1973 (Carpenter and Hillman 1978). Four of the original six animals died of vaccineinduced canine distemper shortly after capture (Carpenter et al. 1976). Litters of young were produced during two consecutive years by one female, but none survived more than two days. The last of these captives died in 1978 (Carpenter et al. 1980).
A second attempt to captive breed began in 1985, with the capture of six ferrets from Meeteetse. Two of the animals developed symptoms of canine distemper soon after capture, indicating that they had been exposed to the virus before capture (Williams et al., in manuscript). All six ferrets died of the disease; the last four animals apparently contracted it from the first two. Six more ferrets were captured late in 1985, eleven in 1986, and one in 1987; these 11 females and 7 males form the current captive breeding program in Wyoming.
THE FERRET DECLINE--MORE QUESTIONS THAN ANSWERS
Life history studies in South Dakota and Wyoming underscored the nearly complete dependence of black-footed ferrets on prairie dogs. Prairie dogs (particularly the black-tailed species) may have increased in the late 1800's and early 1900's due to heavy overgrazing (Clark 1973); their numbers were then greatly reduced by control programs and

conversion of prairies to croplands. Sylvatic plague, a disease that may have been introduced into North America (Eskey and Haas 1940) also can cause massive prairie dog dieoffs (Barnes 1982). The ferret decline may be related to an overall decline in prairie dogs, but ferrets have decreased proportionately more than their prey, suggesting involvement of other factors.
Disease and genetic problems could have been influential in the ferret decline. Studies of black-footed ferrets from Meeteetse revealed the population has low levels of genetic variation (O'Brien et al., in press), indicating a possible genetic bottleneck at some time in the past. The combination of maladies suffered by captive ferrets from the Mellette County, South Dakota population also was suggestive of inbreeding (Carpenter et al. 1981). The extreme susceptibility of the black-footed ferret to canine distemper became evident during the first experiences with captive ferrets from South Dakota. A modified live virus vaccine that was sufficiently attenuated for use on European ferrets (Mustela putorius) produced fatalities in black-footed ferrets (Carpenter et al. 1976). Erickson's (1973:159) suggestion that "the hazards of exposure of the highly sensitive black-footed ferret to canine distemper virus may be substantial" proved prophetic when the Meeteetse population was devastated by the disease in 1985. Blood tests conducted on other carnivores present in the study area showed that some coyotes (Canis latrans) and badgers (Taxidea taxus) had been exposed to canine distemper virus, which suggests a broader scale epizootic with many potential routes for interspecific transmission.
An incomplete understanding of disease, genetics, small population biology, and habitat loss allows synthesis of a wide variety of scenarios to explain how black-footed ferret numbers were reduced to their present level. In the process of considering possibilities, questions such as the following seem relevant:
1. Did prairie dog reductions fragment ferret habitat (i.e., prairie dog towns) sufficiently to create small, insular subpopulations of ferrets, each with greatly increased risk of "chance extinction" (Harris et al., in press) resulting mostly from the ferret's characteristically large seasonal fluctuation in numbers?
2. Did prairie dog reductions result in sufficient fragmentation of ferret habitat to isolate remaining black-footed ferrets, leaving subpopulations that would become inbred?
95
3. Is hypersensitivity of black-footed ferrets to canine distemper a result of inbreeding?
4. Did the black-footed ferret historically have to cope with canine distemper epizootics?
5. Does a discontinuous distribution of black-footed ferret populations offer protection from extincton due to a canine distemper epizootic by providing barriers against intraspecific transmission of the disease?
6. Would a large, geographically continuous population of ferrets be better able to survive a distemper epizootic through reinvasion by survivors?
7. What role does interspecific transmission of canine distemper play in the dynamics of the disease?
On the other hand, the explanation for the decline of ferrets is not necessarily as complex as implied above. If settlement of the Great Plains exposed the ferret to a new disease with which it had not evolved, then the ferret might have been taken to the verge of extinction regardless of prairie dog reductions, population isolation, or genetic problems. Canine distemper has become increasingly suspect in the ferret decline, but the Meeteetse case history is the only documentation of the disease in free-ranging black-footed ferrets; its impact on other ferret populations is unknown.
THE FUTURE
The black-footed ferret has little chance for recovery without an agressive program of captive propagation. The immediate goal must be preservation of the gene pool; without that, there are no future options. If all future populations of black-footed ferrets are produced from the present captive animals, genetics will be a major concern (Ballou, in press). A comprehensive effort to locate more ferrets is imperative, with the primary objective of increasing genetic variation in the captive population. A prerequisite for reintroduction of ferrets is maintenance of complexes of prairie dog colonies as ferret habitat. The prospect for successful reintroduction of ferrets would be enhanced by (perhaps depends on) a better understanding of factors that placed the ferret in its current status.
Potential problems with genetics, disease, and available habitat imply that some level of perpetual management action will be needed to ensure persistence of reintroduced populations. A possible management strategy

could include maintenance of several captive populations in addition to the reestablished wild populations, exchange of animals between populations (Brussard, in press), a program for monitoring wild populations, and use of releases and transplants to rapidly rebuild any population reduced by diseases or other catastrophes.
After the ill-fated experience with South Dakota ferrets, Carpenter et al. (1981:746) suggested that ferret recovery faced "more formidable obstacles than previously envisioned." That statement clearly remains appropriate after the Meeteetse case history. Nevertheless, an impressive array of resources and expertise has been assembled to address problems of ferret recovery, and, with good fortune, the black-footed ferret may yet be returned from the brink of extinction.
LITERATURE CITED
Anderson, Elaine, Steven C. Forrest, Tim W. Clark, and Louise Richardson. 1986. Paleobiology, biogeography, and systematics of the black-footed ferret, Mustela nigripes (Audubon and Bachman), 1851. Great Basin Nat. Mem. 8:11-62.
Ballou, Jonathan D. In press. Considerations of inbreeding and outbreeding depression in the captive propagation of black-footed ferrets (Mustela nigripes). In U. Seal et al., eds., Proceedings of the-workshop on Captive Propagation of Black-footed Ferrets, 13-15 August 1986, Laramie, Wyoming. Yale Univ. Press.
Barnes, Allan M. 1982. Surveillance and control of bubonic plague in the United States. Symp. Zool. Soc. London No. 50:237-270.
Brussard, Peter F., and Michael E. Gilpin. In press. Demographic and genetic problems associated with small population size with special reference to the black-footed ferret (Mustela nigripes). In U. Seal et al., eds., Proceedings of the-workshop on Captive Propagation of Black-footed Ferrets, 13-15 August 1986, Laramie, Wyoming. Yale Univ. Press.
Carpenter, James W., Max J. G. Appel, Ray C. Erickson, and Meliton N. Novilla. 1976. Fatal vaccine-induced canine distemper virus infection in black-footed ferrets. J. Amer. Vet. Med. Assoc. 169:961-964.
Carpenter, James W., James D. Davidson, Meliton N. Novilla, and Jimmy C. M. Huang. 1980. Metastatic, papillary cystadenocarcinoma of the mammary gland in a black-footed ferret. J. Wildl. Dis. 16:587-592.
96
Carpenter, James W., and Conrad N. Hillman. 1978. Husbandry, reproduction, and veterinary care of captive ferrets. Proc. Amer. Assoc. Zoo. Vet., Knoxville, Tenn. 1979:36-47.
Carpenter, James W., Meliton N. Novilla, and Hans E. Kaiser. 1981. Neoplasia and other disease problems in black-footed ferrets: implications for an endangered species. Pages 739-746 in H. E. Kaiser, ed. Neoplasms: comparative pathology of growth in animals, plants, and man. Raven Press, New York.
Clark, Tim W. 1973. Prairie dogs and black-footed ferrets in Wyoming. Pages 88-101 in R. L. Linder and C. N. Hillman, eds.--Proc. Black-footed Ferret and Prairie Dog Workshop, South Dakota State University, Brookings.
1976. The black-footed ferret. Oryx --XIII: 27 5-280.
Erickson, Ray C. 1973. Some black-footed ferret research needs. Pages 153-164 in R. L. Linder and C. N. Hillman, eds. -Proc. Black-footed Ferret and Prairie Dog Workshop, South Dakota State University, Brookings.
Eskey, C. R., and V. H. Haas. 1940. Plague in the western part of the U.S. U.S. Public Health Bull. No. 254. 83 pp.
Forrest, Steven C., Dean E. Biggins, Louise Richardson, Tim W. Clark, Thomas M. Campbell III, K. A. Fagerstone, and E. Tom Thorne. In press. Population attributes for the black-footed ferret (Mustela nigripes) at Meeteetse, Wyoming, 1981-1985. J. Mammal.
Fortenberry, Donald K. 1972. Characteristics of the black-footed ferret. U.S. Fish and Wildl. Serv. Resour. Publ. 109. 8 pp.
Harris, Richard B., Tim W. Clark, and Mark L. Shaffer. In press. Estimating extinction probabilities for isolated black-footed ferret populations. In U. Seal et al., eds., Proceedings of~he Workshop on Captive Propagation of Black-footed Ferrets, 13-15 August 1986, Laramie, Wyoming. Yale Univ. Press.
Henderson, F. Robert, Paul F. Springer, and Richard Adrian. 1969. The black-footed ferret in South Dakota. South Dakota Dept. Game, Fish and Parks Tech. Bull. No. 4. 37 pp.
Hillman, Conrad N., and James W. Carpenter. 1980. Masked mustelid. Nature Conservancy News, March-April:20-23.

Hubbard, John P., and C. Gregory Schmitt. 1984. The black-footed ferret in New Mexico. Final report to BLM, Sante Fe, New Mexico, under BLM Contract No. NM-91.-CTl-7 to Dept. Game and Fish, Sante Fe, and under New Mexico Dept. Game and Fish Proj. FW-17-R.
Johnson, D. 1969. Returns of the American Fur Company, 1835-1839. J. Mammal. 50:836-839.
Linder, Raymond L., Robert B. Dahlgren, and Conrad N. Hillman. 1972. Black-footed ferret--prairie dog interrelationships. Pages 22-37 in Symposium on Rare and Endangered Wildlife of the Southwestern United States, New Mexico Dept. Game and Fish, Sante Fe.
97
O'Brien, Stephen J., Janice S. Martenson, Mary A. Eichelberger, E. Tom Thorne, and Frank Wright. In press. Biochemical genetic variation and molecular systematics of the black-footed ferret, Mustela nigripes. In U. Seal et al., eds., Proceedings of the-Workshop on Captive Propagation of Black-footed Ferrets, 13-15 August 1986, Laramie, Wyoming. Yale Univ. Press.
Williams, Elizabeth S. 1987. Summary of the disease survey of carnivores near Meeteetse, Park County, Wyoming, 1985-1986. Unpubl. report to U.S. Fish and Wildl. Serv., National Ecol. Center. 15 pp.
Williams, Elizabeth S., E. Tom Thorne, Max J. G. Appel, and David W. Belitsky. In manuscript. Canine distemper in black-footed ferrets (Mustela nigripes) in Wyoming.

A Field Habitat Model for Black-Footed Ferrets1
Brian J. Miller 2
George E. Menkens 2
Stanley H. Anderson 3
Abstract.--We present a model to compare pra1r1e dog complexes with known black-footed ferret habitat. The model assumes: 1) black-footed ferret populations require prairie dog colonies for survival, 2) prairie dog colonies can accommodate an additional black-footed ferret for each approximate 50 hectare increase in size, 3) a higher percentage of overall area covered by prairie dogs can accommodate more black-footed ferrets. We list four biological variables. They are: 1) total hectares in prairie dog colonies, 2) percent of total complex inhabited by prairie dogs, 3) intercolony distance, 4) an estimate of burrow density per hectare. In addition, two non-biological parameters are included. They are development potential and land ownership patterns. The model can provide an initial critique of a prairie dog complex for a black-footed ferret search or as a reintroduction site.
INTRODUCTION
Black-footed ferrets (Mustela nigripes) appear to depend on prairie dogs (Cynomys spp.) for food and shelter. Of 310 museum specimens listed by Anderson et al. (1986), only six were collected outside prairie dog range. Biggens et al. (1985) reported telemetered ferret location highly correlated with prairie dog towns.
In South Dakota, 91% of black-footed ferret diet was prairie dog (Sheets et al., 1969). In Meeteetse, a food habit study showed 87% of black-footed ferret scats . contained prairie dog remains (Campbell et al., 1987). Powell et al. (1985) estimated a caloric intake of 110-130 Kcal per day, and speculated a ferret would kill one prairie dog a week during winter. A female raising a litter would have to increase her rate of predation. Observations by Paunovich and Forrest (pers. comm.) indicated a female with a
1 . Paper presented at Eighth Great Plains
Wildlife Damage Control Workshop. Rapid City, S.D. April 28-30, 1987.
2 Brian J. Miller and George E. Menkens, Jr.
are graduate assistants with the Wyoming Cooperative Fish and Wildlife Research Unit, University of Wyoming, Laramie, Wyoming.
3 Stanley H. Anderson is leader of the Wyoming Cooperative Fish and Wildlife Research Unit, University of Wyoming, Laramie, Wyoming.
98
litter of five may have been killing .6 prairie dogs per day. Therefore, any area containing prairie dogs can be considered black-footed ferret habitat.
In this paper we present a model which evaluates pra1r1e dog complexes where black-footed ferrets were known to occur i.n Wyoming. A prairie dog complex is defined as a group of individual prairie dog colonies. The biological parameters follow the outline of the habitat suitability index (Houston et al., 1986). It differs from that model in four ways. Our model uses four biological variables instead of five, we use simple linear relationships, we have added two non-biological parameters, and our model can be calculated rapidly without the use of a pocket computer.
The model can serve two functions. First it is a relatively inexpensive method to search for undiscovered populations of black-footed ferrets. Second, our model provides a rapid method for initial identification of prairie dog complexes to be considered for more extensive study as reintroduction sites. A model that could then be applied to these screened sites is the black-footed ferret habitat suitability index of Houston et al. (1986).
The data upon which our model is based comes from two black-footed ferret populations, one in South Dakota on a black-tailed prairie dog (Cynomys ludovicianus) complex, and the

other from the Meeteetse population located on a white-tailed prairie dog (Cynomys leucurus) complex. Because our model is based on data from both ferret populations, we believe that it can be useful throughout the original black-footed ferret range.
MODEL BACKGROUND
Ferrets are solitary. Females display smaller home ranges than males (Biggins et al., 1985; Richardson et al. in press) with one male home range typically overlapping the ranges of several females. Within a sex, however, there is little spatial or temporal overlap (D. Biggins, pers. comm.), a pattern typical of mustelids (Powell, 1979).
The Meeteetse prairie dog complex has prairie dog densities varying from 2 to 20 per hectare (Menkens unpubl. data). At maximum Black-footed ferret densities in Meeteetse, Forrest et al. (1985) estimated an adult ferret occupied about 50 hectares of prairie dog habitat. This relationship was constant whether calculated over individual colonies or over the entire complex. The 50 hectares of habitat per ferret therefore appears to be a linear relationship. The black-footed ferrets at the Meeteetse site existed on a complex of 18 colonies ranging from 12.5 hectares to 1302 hectares in s:f.ze (Forrest et al., 1985). The total prairie dog acreage was 2790 with a mean intercolony distance of 0. 9 km. (Forrest et al., 1985).
The black-footed ferret model therefore makes the following assumptions:
1) black-footed ferret populations require prairie dog colonies for survival
2) prairie dog colonies can accommodate an additional black-footed ferret for each approximate 50 hectare increase in size
3) a higher percentage of overall area covered by prairie dogs can accommodate more black-footed ferrets
MODEL DEVELOPMENT
We used four biological parameters for evaluation of prairie dog complexes. They are: 1) total hectares prairie dog colonies, 2) percent of complex area inhabited by pra:l rie dogs, 3) intercolony distance within the complex, and 4) burrow density. These variables are sufficient to evaluate a prairie dog colony or complex for a black-footed ferret search effort. If the purpose of the evaluation is to investigate potential reintroduction sites, two non-biological variables are added: 1) development potential, and 2) land ownership patterns.
Total hectares occupied by prairie dog colonies can be calculated from accurate mapping of the prairie dog complex. This variable assumes the larger the prairie dog colonies in the complex) the greater the potential for a viable black-footed ferret population. On
99
black-tailed prairie dog colonies in South Dakota, Hillman et al. (1979) recommended a 12 hectare minimum colony size for individual black-footed ferrets, and a 40 hectare minimum for females with a litter. In Meeteetse, the maximum black-footed ferret density was one black-footed ferret for every 50 hectares over 2800 hectare area (Forrest et al., 1985). The smallest prairie dog colony supporting an individual black-footed ferret was 12 hectares, and the smallest colony supporting a litter was 50 hectares (Forrest et al., 1985).
Percentage of the total complex area in prairie dog colonies assumes the greater the percent area occupied by prairie dogs, the better tpe black-footed ferret habitat. Percent area occupied by prairie dog colonies can be calculated by drawing a polygon around the colonies comprising the complex, and calculating the area inside the polygon. Total area of prairie dog colonies (variable 1) is divided by the area of the polygon to calculate this variable. The Meeteetse prairie dog complex has about 22% of the total area occupied by prairie dogs (Houston et al., 1986), and the South Dakota site has about 1.7% of its area inhabited by prairie dogs (Hillman et al., 1979).
The third variable is average intercolony distance. We assume that smaller intercolony distances lead to higher quality black-footed ferret habitat. Large intercolony distances may make intercolony travel and dispersal more difficult (MacArthur and Wilson, 1967). Intercolony distance is about .9 km. at the Meeteetse site (Forest et al., 1985), and about 2.4 km. at the Mettetse County site in South Dakota (Hillman et al., 1979). Intercolony distance can be calculated by measuring the shortest boundary distance between colonies on a map.
The fourth variable is burrows per hectare. Black-footed ferret habitat quality is affected by the density of both prairie dogs and their burrows. There is no rapid technique to estimate prairie dog density since populations fluctuate (Menkens, 1987). Our model therefore accepts the presence of prairie dogs as sufficient. We can, however, count the pra:lrie dog holes. Burrow densities are not a reliable indicator of prairie dog density (Menkens et al. in press; King, 1955), but burrow density is an important part of the prairie dog ecosystem for the black-footed ferret. They provide the ferret with shelter, and allow escape from predators. Selected plots can be sampled, and the burrow numbers averaged. The prairie dog complex can be classed into one of six categories of burrow density per hectare.
If a site is being evaluated for a search effort, these four biological variables are sufficient. If it is being considered for reintroduction of captive raised black-footed
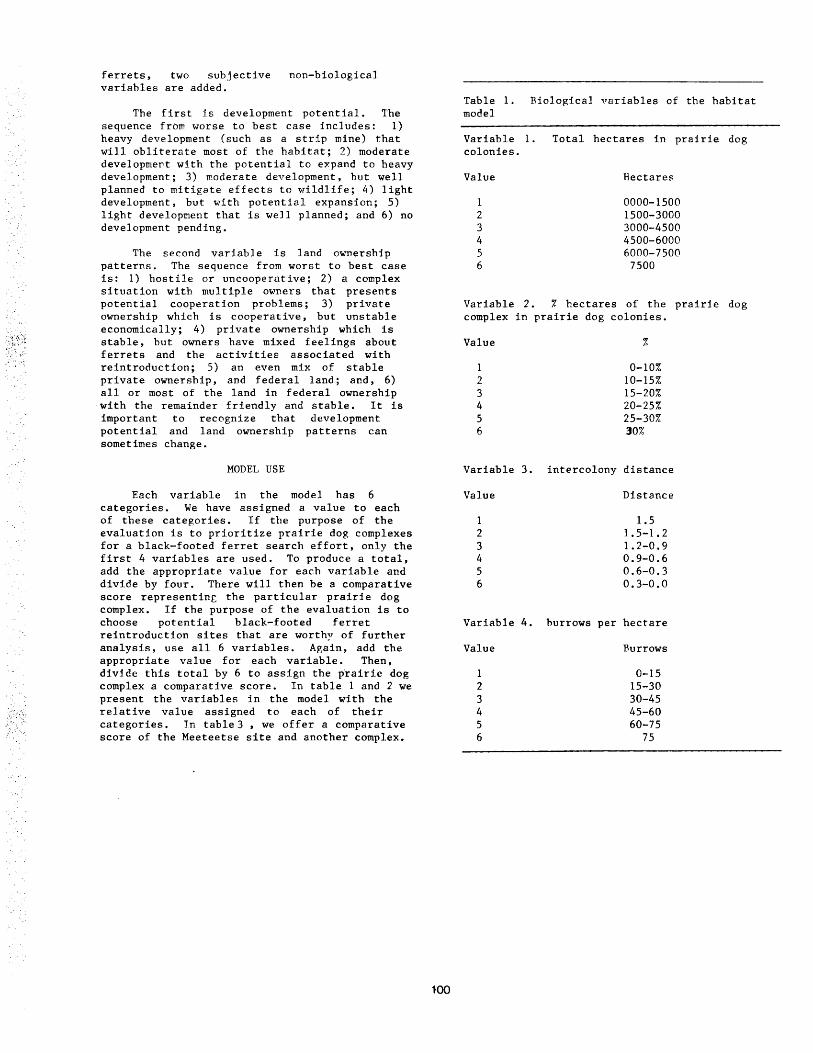
ferrets, two subjective variables are added.
non-biological
The first is development potential. The sequence from worse to best case includes: 1) heavy development (such as a strip mine) that will obliterate most of the habitat; 2) moderate developme~t with the potential to expand to heavy development; 3) moderate development, but well planned to mitigate effects to wildlife; 4) light development, but with potential expansion; 5) light development that is well planned; and 6) no development pending.
The second variable is land ownership patterns. The sequence from worst to best case is: 1) hostile or uncooperative; 2) a complex situation with multiple owners that presents potential cooperation problems; 3) private ownership which is cooperative, but unstable economically; 4) private ownership which is stable, but owners have mixed feelings about ferrets and the activities associated with reintroduction; 5) an even mix of stable private ownership, and federal land; and, 6) all or most of the land in federal ownership with the remainder friendly and stable. It is important to recognize that development potential and land ownership patterns can sometimes change.
MODEL USE
Each variable in the model has 6 categories. We have assigned a value to each of these categories. If the purpose of the evaluation is to prioritize prairie dog complexes for a black-footed ferret search effort, only the first 4 variables are used. To produce a total, add the appropriate value for each variable and divide by four. There will then be a comparative score representing the particular prairie dog complex. If the purpose of the evaluation is to choose potential black-footed ferret reintroduction sites that are worthy of further analysis, use all 6 variables. Again, add the appropriate value for each variable. Then, divide this total by 6 to assign the p·rairie dog complex a comparative score. In table 1 and 2 we present the variables in the model with the relative value assigned to each of their categories. In table3, we offer a comparative score of the Meeteetse site and another complex.
100
Table 1. Biological variables of the habitat model
Variable 1. Total hectares in prairie dog colonies.
Value Hectares
1 0000-1500 2 1500-3000 3 3000-4500 4 4500-6000 5 6000-7500 6 7500
Variable 2. % hectares of the prairie dog complex in prairie dog colonies.
Value %
1 0-10% 2 10-15% 3 15-20% 4 20-25% 5 25-30% 6 30%
Variable 3. intercolony distance
Value Distance
1 1.5 2 1.5-1.2 3 1.2-0.9 4 0.9-0.6 5 0.6-0.3 6 0.3-0.0
Variable 4. burrows per hectare
Value Burrows
1 0-15 2 15-30 3 30-45 4 45-60 5 60-75 6 75

Table 2. Non-biological variables of the habitat model LITERATURE CITED
Variable 5. development potential
Value
1 heavy development 2 moderate development with potential
3
4
5
6
expansion moderate development well planned for wildlife light development with potential
expansion light development well planned for
wildlife no development pending
Variable 6. land ownership patterns
Value
1 2
3
4
5
6
hostile complex ownership situation with
potential problems private ownership is cooperative, but unstable economically stable private ownership, but owners reluctant or unsure mix of stable private ownership and federal land most or all federally owned
Table 3. Application of the model to the Meeteetse site, and a prairie dog complex in southwestern Wyoming on which a black-footed ferret skull was located.
Meeteetse would score: Variable
1 2 3 4 5 6
Value
2 4 4 4 5 5
The score for the first 4 variables would be 3.5. The score for all 6 variables would be 4.0.
The complex in southwestern Wyoming would score as follows:
Variable Value
1 1 2 5 3 4 4 2 5 2 6 2
The comparative score for the first 4 variable would be 3. The comparative score using all 6 variables would be 2.7.
101
Anderson, E., S.C. Richardson. biogeography, black-footed (Audubon and Nat. Mem. p.
Forrest, T.W. Clark, and L. 1986. Paliobiology,
and systematics of the ferret, Mustela nigripes
Bachman), 1851. Great Basin 11.
Biggins, D.E., M. Schroeder, S. Forrest, and L. Richardson. 1985. Movements and habitat relationships of radiotagged black-footed ferrets. In: Black-footed Ferret Workshop Proceedings, Laramie, Sept. 18-19, 1984. S.H. Anderson and D.B. Inkley (eds) Wyoming Game and Fish Dept., Cheyenne.
Campbell, T.M., T.W. Clark, L. Richardson, S.C. Forrest, and B. Houston. in press. Am. Midl. Nat.
Forrest, S.C., T.W. Clark, L. Richardson, and T.M. Campbell. 1985. Black-footed ferret habitat: Some management and reintroductio considerations. Wyo. BLM Wildl. Tech. No. 2. 49 pp.
Hillman, C.N., R.L. Linder, and R.B. Dahlgren. 1979. Prairie dog distributions in areas inhabited by black-footed ferrets. Am. Midl. Nat. 102:185-187.
Houston, B.R., T.W. Clark, and S.C. Minta. 1986 Habitat suitability index model for the black-footed ferret: A method to locate transplant sites. Great Basin Nat. Mem. p. 99.
King, J.A. 1955. Social behavior, social organization, and population dynamics in a black-tailed prairie dog town in the Black Hills of South Dakota. Univ. of Michigan Contrib. Lab. Vert. Biol. 67:1-123.
MacArthur, R. and E.O. Wilson. 1967. The Theory of Island Biogeography. Princeton Univ. Press, Princeton. 186 pp.
Menkens, G. E. 1987. Temporal and spatial variation in white-tailed prairie dog (cynomys leucurus) populations and life histories in Wyoming. Unpubl. Ph.D. Dfssertation, Univ. Wyomfng, Laramie.
Menkens, G.E., B.J. Miller, and S.H. Anderson. in press. White-tailed prairie dog ecology in Wyoming. Eighth Great Plains Wildlife Damage Control Workshop, April 28-30, 1987, Rapid City, S.D.
Powell, R.A. 1979. Mustelid spacing patterns: Variations on a theme by Mustela. Zeit. Tierpsychol. 50:153-156.
Powell, R.A., T.W. Clark, L. Richardson, and S.C. Forrest. 1985. Black-footed ferret (Mustela nigripes) energy expenditure and prey requirements. Biol. Conserv. 25 pp.

Richardson, L., T.W. Clark, S.C. Forrest, and T.M. Campbell. in press. Winter ecology of the black-footed ferrets at Meeteetse, Wyoming. Am. Midl. Nat.
Sheets, R.G. and R.L. Linder. 1969. Food habits of the black-footed ferret (~ustela
102
nigripes) in South Dakota. Proc. South Dakota Acad. Sci. 48:58-61.
Sheets, R.G., R.L. Linder, and R.B. Dahlgren. 1972. Food habits of two litters of black-footed ferrets in South Dakota. Am. Midl. Nat. 87:249-251.

A Novel Strategy for Pocket Gopher ControP
Michael E. R. Godfrey2
Abstract. Current techniques for the control of pocket gophers use traps, fumigants or toxic baits. Trapping and fumigation are labor intensive and seldom effective in giving more than short-term relief. Toxic baiting usually uses baits that are rapidly degraded and although the resident gopher may be killed the burrow system is frequently reoccupied very rapidly and little long-term control is achieved. The use of persistent baits that remain toxic and acceptable to the gophers for an extended period may result in more effective long-term control.
INTRODUCTION
Pocket gophers are major pests of agriculture and forests throughout extensive areas of the United States of America. Three species dominate, the Northern Pocket Gopher (Thomomys talpoides) in the Pacific Northwest, the Valley Pocket Gopher (Thomomys bottae) in the Southwest and the Plains Pocket Gopher (Geomys bursarius) east of the Rocky Mountains.
The damage attributed to gophers is as diverse as the range of habitats they occupy. They destroy the root systems of fruit trees in orchards throughout the Northwest, they are a major cause of reforestation failures in the western states (Barnes 1973, Tunberg et al 1984), and are serious pests of agriculture, particularly sprinkler-irrigated alfalfa, where more than 440 gophers per ha have been recorded (Tickes 1983).
Significant reductions in yield of fruit and alfalfa occur and harvest machinery may suffer extensive damage from hitting gopher mounds. Irrigation systems, underground power and telephone cables and home gardens may also be destroyed by gophers (Stewart and Baumgartner 1978).
!Paper presented at the Eighth Great Plains Wildlife Control Workshop, Rapid City, South Dakota, April 28-30, 1987.
2Michael E. R. Godfrey is Director, Research & Development, J. T. Eaton & Company, 1393 E. Highland Road, TwinSburg, Ohio 44087
103
Barnes (1973) reported that up to 67% of planted ponderosa pine seedlings may be destroyed while Ronco (1970) found 4 - 54% annual mortality in spruce seedlings and 3 - 30% mortality on contorta pine. Gophers may cause the complete failure of plantations (Barnes 1973, 1974, Canutt 1970, Capp 1976, Crouch 1971).
The burrow system created by a single gopher may cover half a hectare with burrows ranging from just below the surface to over 60 em deep. Gophers are normally solitary except during the breeding season but will rapidly invade an unoccupied system (Stewart and Baumgartner 1978, Tunberg et al 1984). One other characteristic of note is that gophers store food in nests or other enlarged chambers (Stewart and Baumgartner 1978) and these food caches may be eaten by other gophers that invade the burrow system following the death or disappearance of the original occupant (Tunberg et al 1984).
CONTROL STRATEGIES
Many different strategies have been used in attempts to control the various species of pocket gophers. However, many of the methods are only effective in specific locations or conditions and no method gives consistent long term control (Tunberg et al 1984). Mortality of at least 75% is necessary to give any degree of long term relief (Barnes 1973) and 90% mortality has been suggested as necessary before a significant long-term reduction in damage is Obtained (Capp 1976).

Cultural Practices and Exclusion
In limited areas where intensive maintenance is possible exclusion may be feasible to ~rotect a valuable crop. A barrier at least 60 em ~nto the ground is necessary. Alternati~ely, c:op.rotation may be of some benefit by creat~ng per~od1c unfavorable conditions but this too is a method of very limited applicability (Case 1983, Tickes 1983,). A band of cereal grain grown as a perimeter to an alfalfa field may be effective as a
barrier if the enclosed field is cleared of all resident gophers. Flood irrigation may also be effective in some areas but has very limited applicability (Case 1983).
Trapping
Trapping is only effective with very low population densities due to the number of traps needed to catch all the gophers present and the return visits inherently necessary in a trapping program. It is extremely slow and time consuming although it is a widely used technique in forest operations (Barnes 1973), due largely to a lack of more efficient methods able to be used in cut-over areas. It is often not cost effective either (Tickes 1983).
Fumigation
several fumigants are registered for use in gopher control. However, they are not effective in sandy or dry soils where the gas may rapidly dissipate (Case 1983, Stewart and Baumgartner 1978 ) and, again, in all but low density popuiations the time and cost of using this control method is prohibitive. Smoke cartridges may be useful in indicating the extent of a particular burrow system however.
Toxic Baiting
The use of toxic baits for the control of pocket gophers has been practiced for many years but often with only inconsistent or limited success. various formulations of baits containing strychnine have been the most widely used with zinc phosphide and first generation anticoagulants.used to a more limited extent, either on loose gra~n or in pellets (Case 1983, Canutt 1970, Handley 1978, Marsh 1987, Tickes 1983,). Wheat, milo and oats are the major ingredients in most baits although just about every type of grain has been used either alone or in various mixtures. Some products are not registered for use in all states and others have various restrictions on their use such as a limit to hand application only. (Case 1983, Marsh 1987, Tickes 1983,).
With the use of acute toxicants the rapid onset of symptoms may cause poison shyness or tolerance may develop reducing the level of control achieved (Anthony et al 1984, Case 1983, Tickes 1983, Tickes et al 1982,). Further, not all
104
gophers potentially exposed to the poison may be able to find sufficient bait to kill them (Tickes 1983). The bait may be mixed or covered with soil and go unnoticed as the runway is extended or filled during foraging (Tickes 1983). In areas of high humidity and excessive moisture treated grain baits often become damp, caked or mouldy which reduces their palatability (Barnes et al 1985, Marsh and Pleese 1960, Ray 1978). Conversely, bait spilled on the ground during application can create a hazard to ground feeding birds (Case 1983).
Baits are usually applied by hand, using probes or other means of getting the bait into the burrow, or through the use of mechanical burrow builders. Hand baiting is much faster than trapping but is still too slow to allow adequate treatment of extensive areas (Barnes 1973), particularly if several return visits are necessary to maintain an acceptable level of control. The burrow builder is sUbstantially faster allowing large areas to be treated but its use may be restricted by soil conditions, topography and obstructions (Barnes 1973) and some skill is required to operate the equipment well (Tickes 1983). Dry soil will crumble preventing the formation of a satisfactory burrow and obstructions such as rocks and stumps may limit the accessible area, a common situation in reforestation programs. Further, the artificial burrows may expedite reinvasion by gophers or other rodents and may even expand the infested area so that the end result may be worse than the original situation.
The selection of the toxicant to use with a burrow builder is also limited. The first generation anticoagulants are not considered to be suitable for use in small pellets or as loose grain at the current toxin loadings as the gopher must eat too much over too great a distance to receive a lethal dose (Marsh 1987). This may be overcome, however, by formulating the baits at a higher strength thereby reducing the amount of bait necessary to be lethal. There has been interest in using anticoagulants for some time, however, due to the numerous desirable characteristics inherent with their use. The availability of the second generation materials was thought to overcome some of the problems found with earlier materials, especially the relatively large quantity of bait that had to be consumed over several days. Unfortunately, these compounds have not been markedly more successful when used experimentally in field trials than many of the older products (Kaukeinen and Rampaud 1986, Poche' 1986).
These various shortcomings in the techniques available to control pocket gophers have been recognized for a long time and numerous studies have been made to overcome them. The use of larger, more durable baits is an approach that has received a lot of attention. Cardboard or plastic tUbes filled with various grain and paraffin mixtures and several different toxicants have been evaluated in numerous studies as a way to get a larger amount of toxicant to a gopher at a single site. These studies gave some indication of the

potential of this strategy of concentrating a largE amount of toxicant in one bait (Tunberg et al 1984). Solid paraffin and grain blocks of various sizes have also been evaluated on numerous occasions, particularly by Howard and Marsh (Lee 1986, Marsh 1987, Tunberg et al 1984). These paraffined baits are more moisture resistant than conventional baits and so remain acceptable for some time. Consequently, they contain ample bait for multiple feedings and they remain fresh so that invading animals may also find and eat enough bait to receive a lethal dose (Lee 1986). Tunberg et al (1984) had up to 4 gophers killed by a single bait over a 40 day period. Thus, not only may the initial level of control be improved but the use of persistent baits may also help control gophers in systems missed when the bait was applied, or new invaders from untreated areas (Lee 1986), a problem frequently identified (Capp 1976, Couch and Frank 1979, Tunberg et al 1984). Marsh (1987) found that because of the delayed death when anticoagulants were used in durable baits the gopher often ate all the bait and so none was left for others. Attempts to slow down the feeding so that some bait remained were largely unsuccessful. Wood chips, sand, pea gravel, hard plastic or salt were used in the baits but were discontinued as some animals would refuse the baits. Placing baits in plastic bags was not successful either as some gophers ejected the bags from their burrows although they were well accepted in laboratory trials (Lee 1986). Lee (1986) found that pocket gophers readily accepted the paraffin baits and mortalities up to 100% were achieved in her trials. Almost invariably the gophers died underground too thus reducing the risk of secondary poisoning.
If acute toxicants are used the blocks can be small as little bait is needed to be lethal to any gopher eating the bait. However, if anticoagulants are used the baits need to be large as the gopher will eat a substantial amount of the bait before dying. Baits of about 100 g are large enough to kill the resident gopher and still have some bait left for later invaders. It is also apparent that gophers are able to move baits of this size to their food caches (Tunberg et al 1984) which may increase the probability of them being found and fed upon subsequently.
Following on from this extensive background of research J. T. EATON & COMPANY. INC. have formulated a bait containing the anticoagulant diphacinone and shaped it for ease of placement in gopher burrows. It weighs about 110 g and therefore is large enough to ki~l the resident gopher and still remain in sufficient quantity to be lethal to a subsequent invader.
In our own studies an initial pen trial with four juvenile northern pocket gophers indicated that they would readily accept the paraffin blocks. All four died within seven days. Although alternative food was continuously available the gophers ate over 90% of the bait offered indicating that the baits were well accepted.
105
In a field study in early June, a time not usually suitable for treatment as there is often little apparent sign of gopher activity, substantial population reductions occurred. Two orchard blocks totalling about 6 ha were treated. These areas would have been trapped otherwise as the soil was unsuitable for the use of burrow builders. As the orchard was regularly irrigated, only mounds 2 or 3 days old were apparent and many other gophers may have been active but not recorded as their burrow systems were not located. At each identified active system only one half of a 100 g paraffin bait block was placed in each end of the main burrow after it was opened with a shovel. The burrow was then closed. Two weeks later each plot was reassessed by recording the number of active mounds. Every burrow system identified as active at the reassessment was then rebaited and assessed again a further two weeks later.
Gross reductions of 50% and 69% in the number of obviously active mounds were recorded following the first bait application and overall reductions of 77% and 88% were recorded after the second application.
Due to the effects of regular irrigation it is most likely that numerous complete systems were not detected and therefore not baited but could have been recorded in the post poisoning assessments. Thus the assessed mortality is likely to be substantially less than occurred in the gophers which were actually exposed to the baits. Further, the treated areas were relatively small with large perimeters and migration of gophers from untreated adjacent areas prObably occurred. In normal control operations these areas would also have been treated.
The bait applications were done by totally inexperienced orchard workers who readily accepted the technique but who could have missed some systems. Thus, it is reasonable to assume that applications during the more preferred poisoning seasons of spring and fall with experienced applicators would yield significantly better results. Further, results from comparable adjacent areas which were heavily trapped yielded population reductions of only about 20%.
In retrospect, substantially more bait should have been placed in each opened burrow. Whereas only a total of 100 g was placed in each identified system the use of a whole block placed in each exposed end of the burrow may have resulted in even better control by ensuring that more bait was available for gophers occupying the burrow following the death of the original occupant.
Later trials have indicated that these baits withstand weathering for over two months while remaining acceptable and toxic.
The use of a new product,"EATON'S ANSWER for the Control of Pocket Gophers", was effective in controlling gophers in a situation where other techniques were ineffective. The product has been improved from the baits used in the initial trials

and now provides a persistent bait which will be acceptable and effective against gophers that invade the system sometime after the original occupant has died.
ACKNOWLEDGMENTS
I wish to acknowledge the valuable discussions I have had with many researchers, particularly Leonard Askham of Washington State University, Pullman, and Rex Marsh of University of California, Davis. I am also very grateful for the assistance of James Brainard III of Washington State University Tree Fruit Research Center, Wenatchee, for his sUbstantial assistance with the laboratory and field trials of the •Eaton's Answer• baits. The superintendent and staff of the w.s.u. Tree
Fruit Research Center in Wenatchee assisted with the provision of facilities and typing and the Manager and staff of the Columbia River Orchard Foundation provided the trial area and assistance with the field work. I am most grateful.
LITERATURE CITED
Anthony, R. M., G. D. Lindsey, and J. Evans. 1984. Hazards to golden~antled ground squirrels and associated secondary hazard potential from strychnine for forest pocket gophers. Proc. Vert. Pest Conf., Univ. of Calif., Davis, 11: 25 -31.
Barnes, V. G., Jr. 1973. Pocket gophers and reforestation in the Pacific Northwest: A problem analysis. U. s. Dept. Interior, Fish and Wildlife Service, Washington D.C., Special Science Report, Wildlife No. 155, 18 p.
Barnes, v. G., Jr. 1974. Response of pocket gopher populations to silvicul~ural practices in central Oregon. Proc. of Symp. on Wildlife and Forest Management in the Pacific Northwest, Black, H. c., Ed., Oregon State University, Corvallis, 167-175.
Barnes, v. G., Jr., R. M. Anthony, K. A. Fagerstone, and J. Evans. 1985. Hazards to grizzly bears of strychnine baiting for pocket gopher con~rol. Wildl. Soc. Bull., 13:552-558.
Black, H. c. 1970. Animal damage to forest regeneration in the ponderosa pine region of Oregon and Washington. Regeneration of Ponderosa Pine Symposium, Oregon State University. 105-117.
106
Canutt, P. R. 1970. Pocket gopher problems and control practices on national forest lands in the Pacific Northwest region. Proc. Vert. Pest Conf., Univ. of Calif., Davis, 4:120-125.
Capp, J. C. 1976. Increasing pocket gopher problems in reforestation. Proc. vert. Pest Conf., Univ. of Calif., Davis, 7:221-228.
Case, R. M. 1983. Pocket Gophers. Prevention and Control of Wildlife Damage, Timm, R. M. Ed., Great Plains Agricultural Council Wildlife Resources Committee and Nebraska Cooperative Extension Service, Univ. of Nebraska, Lincoln, Bl3-B26.
Crouch, G. L. 1969. Animal damage to conifers national forests in the Pacific Northwest region. u.s. Forest Service, Res. Bull. PNW-28. 13 p.
on
Crouch, G. L. 1971. Susceptibility of Ponderosa, Jeffrey and Lodgepole pines to pocket gophers. Northwest Sci. 45 (4):252-256.
Crouch, G. L., and L. R. Frank. 1979. Poisoning and trapping pocket go_t>hers to protect conifers in northeastern Oregon. u.s. Forest Service, Res. Bull. PNW-261. 8 p.
Kaukeinen, D. E., and M. Rampaud. 1986. A review of brodifacoum efficacy in the u.s. and worldwide. Proc. Vert. Pest Conf., Univ. of Calif., Davis, 12: 16-50
Lee, L. L. 1986. Laboratory and field studies of behavioral and population responses of pocket gophers (Thomomys spp.) to durable baits. Ph.D. thesis in Ecology, Graduate Division, Univ. of Calif., Davis, 115 p.
Marsh, R. E., and L. F. Plesse. 1960. Semipermanent anticbagulant baits. State of California, Department of Agriculture Bulletin, 49 (3):195-197.
Marsh, R. E. 1987~ The role of anticoagulant rodenticides in pocket gopher control. Animal damage management in Pacific Northwest forests (proceedings), Spokane, Washington. March, 1987. 164 p.
Poche', R. M. 1986. The status of bromadiolone in the United States. Proc. Vert. Pest Conf., Univ. of Calif., Davis, 12: 6-15.
Ray, v. 1978. Responses of pocket gophers (Thomomys ~) to baiting with strychnine oats plus attractant in polyethylene bags. Tech. Rep. Pocket Gopher 042-4102/78/84. Centralia, WA: Weyerhaeuser Company, Western Forestry Research Center, 5 p.

Ronco, F. 1970. Shading and other factors affect survival of planted Englemann spruce seedlings in central Rocky Mountains. u. s. Forest Service, Rocky Mountain Forest and Range Experiment Station, Research note, RM-163 p.
Stewart, w. L. and D. M. Baumgartner. 1978. Pocket gopher control. Washington State University Cooperative Extension Service booklet. EM4389. 17 p.
Tickes, B. R. 1983. Gopher control in alfalfa. Proc. 13th Con£. Alfalfa Symp., Cooperative Extension, Univ. of Calif., 68-71.
107
Tickes, B. R., L. K. Cheath, and J. L. Stair. 1982. A comparison of selected rodenticides for the control of the common valley gopher (Thomomys ~). Proc. Vert. Pest Conf., Univ. of Calif., Davis 10: 201-204.
Tunberg, A. D., w. E. Howard, and R. E. Marsh. 1984. A new concept in pocket gopher control. Proc. Vert. Pest Con£., Univ. of Calif., Davis, 11: 7-16.

Rodent Damage to Various Annual and Perennial Crops of India and Its Management1
Ranjan Advani 2
Abstract.--The results of about 12 years' study deals with rodent damage to several annual and perennial crops of India including cereal, vegetable, fruit, plantation and other cash crops. The rodent species composition in order of predominance infesting different crops and cropping patterns percent damages and cost effectiveness of rodent control operations in each crop and status of rodent management by predators are analysed.
INTRODUCTION
Rodents, as one of the major important vertebrate pests (Advani, 1982a) are directly related to the production, storage and processing of the agricultural crops and their eventual utilisation by man and its livestock for food, fibre and protection. In India, where malnutrition and starvation are best known to exist due to disparity between human population and available food, the rodents eat about 10 percent of agricultural production. Moreover, as India is situated in tropical and subtropical regions of the "vorld with green vegetation available throughout the year, the turn over rate of rodents is much faster than other biomes of the world. In the world, rodents are responsible for the annual loss of about 33 million tones of stored cereals and rice alone (WHO, 1974).
In some of the crop fields with important crops in North India, reduction in rodent populations through integrated pest management techniques yielded cost return ratios to the extent of 1:900 (vegetables, Advani and Mathur, 1982), 1:247 (wheat, Advani, et Gl 1982) 1:220 (stored grains, Prakash et al 1981). To bring down the rodent populations-at low level, control operations for six continuous crop seasons ( t1vo/year) are necessary (Advani, et al 1987) in cereal and vegetable crops. However~hitherto no authentic and quantified information exists for other crops like maize, rice, barley, sugarcane, all tuberous and fruit crops, arecanut, oil palm, etc. w~ereas, some
1 h h . . Paper presented at t e 8t W1ldl1fe Damage Control Workshop (Rapid City, SD, April 28-30, 1987).
2sr. Public Health Sanitarian, Bureau of Pest
Control, Dept. of Health, City of New York, NY. Correspondence address: 80-06 47th Avenue, Apt. SA, Elmhurst, NY 11373.
108
attempts and preliminary investigations in cocoa and coconut crops yielded information that pods and nuts 1vorth of rupees 500 and 650 respectively can be saved when one rupee is spent on trapping of rodents in the plantations (Advani, 1982b).
The damage magnitude and association of various rodent species with their respective crops studied so far, are presented.
METHODS
The results presented in this communication mostly pertain to the studies conducted in twelve villages near Jodhpur (Rajasthan, North India) and eight villages in Kasaragod (Kerala) and Mangalore (Karnataka, South India). The population ecology and dynamics of rodents were studied after Pral.;:ash ( 1975) , ·whereas, the assessment of damages by rodents to different annual crops were evaluated after Greaves et al (1977). For damage assessment in the coconut-an~cocoa crops (perennial), methodology of Williams (1971, 1974) was follmved. Control operations were carried out after Prakash (1977).
RESULTS AND DISCUSSION
Vegetable crops
In Rajasthan, studies in tivelve vegetable crops in twelve villages, showed predominance of Indian desert gerbil, Meriones hurrianae; Indian gerbil, Tatera indica and Soft-furred field rat, Rattus meltada in the infested crop fields. The small field mouse, Mus booduga and a gerbil, Gerbillus gleadmvi were also damaging the vegetables mainly tomato and brinjal. The rodent damage to various crops ranged from 4.1 to 19.9 percent, the average being 8.7 percent (Advani and Mathur, 1982). As a result of trapping, control and other management practices, rodent populations reduced by 92.5%. The rodent damage also declined by 91.9 percent and the production of crops increased (on an average) by 7 percent per hectare. The cost benefit ratio of rodent control work was 1:900 (in rupees).

Chilly
Chilly is a main crop of the farmers of Rajasthan and is exported to neighbouring states in India and to middle-east Arab countries. The average rodent damage to this crop was 18.8, 11.48, 27.85 and 25.74 percent at sowing vegetative growth, maturity and threshing stages respectively (manuscript). As a result of continuous management practices, the relative rodent damage reduced by 89.89, 77.60, 85.79 and 83.5 percent respectively to these four stages of growth. This increased the production by about 16.1 quintals/ha, the cost benefit ratio being 1:571 (in rupees). Along with three predominant rodents, M. hurrianae, T. indica and R. meltada; the Bust rat, Golunda -elliOti qujerati, and Indian palm squirrel, Funarnbulus pennanti were also captured in higher numbers from the crop fields. In several cases, the ~ hurrianae were found to thrive upon chilly in storage as exhibited by their stomach contents.
Wheat
In three varieties of wheat, Desi (local), Kharchia (salt tolerant) and Kalyansona (hybrid) the average rodent damage was quantified to be 18.66, 21.28 and 16.29 percent respectively (Advani et al 1982). The cost benefit ratio Obtained after tWO yearS I \vOrk On rodent peSt management practices was, 1:247. T. indica predominated the Kalyansona and Kharchia varieties of crops, whereas, M. hurrianae infested the Desi variety, in more relative abundance. Third ---species, R. meltada which has shown its preference for wheatcrop in field as lvell as storage (Rana and Advani 19 81) also occurred in noderate densities. Along with rodents sl1re1v, suncus murinus sindensis, hitherto known as insecti vorc;u:s,- 1ras also found to feed upon wheat (Advani and Rana, 1981).
Millet
About 90 percent farmers of the Rajasthan state depend upon millet (summer-rainfed crop) for their family needs. Out of seven species infesting millet, M. hurrianae, T. indica, R. meltada and G. ellTOti were four-major rodents infesting this crop (Advani 1982b). The damage inflicted \vas about 15.0, 7. 6 and 20.1 at sowing, vegetative, growth and harvesting stage. Management of about 90 percent of rodent populations resulted into cost: return ratio of 1:267 (Advani et at 1981).
Oil seeds
About 8 percent of rodent fauna captured during five years• studies (1977 to 1981) in twelve villages in Rajasthan, was found to infest oil seed crops, mainly Sarson (Advani, 1982a). R. meltada, ~ pennanti, G. ellioti 1vc.re three main pests besides hro predominant gerbils, infesting this crop. The percent damage was 5.5, 6.09, 10.8 at sowing, growth and harvesting stages respectivesly. In Gujarat, about 50 percent of ground nut was being damaged by the field rodents (B.D. Rana personal communication).
Coconut
109
Rodent damage at a level of 28.5 percent was evaluated in West coast variety of the coconut (Advani, 1982b) in Western Ghat biome of South India. IN the hybrids DxT, TxD) and Laccadive variety it was ranging from 10.2 to 20.5 percent. The House rat, Rattus rattus was the predominant rodent species occurring in about 70 percent of relative abundance. This species is a major pest of stored grains in houses and godowns in Rajasthan (Prakash et at, 1981), 1vith the highest average litter-size (6.60~0.10) among all rodents and the 27.03/young ones/female annual productivity rate (Rana et al 1982). Among other species, the Field mous~ Mus booduga and the Bandicoot rats, Bandicota bengalensis, Bandicota indica and Indian gerbil, Tatera indica cuvieri were also captured from nurseries of coconut. To the inflorescence of coconut, the Western ghat squirrels, Funarnbulus tristriatus also damages in higher magnitudes. In a single instance about 250 male flowers and capsules 1vere plucked by a single animal in one hour. Regular trapping of rodents with local traps for four months reduced the damage by over 76 percent, resulting into return of Rs. 650 when only one rupee was spent on labor and cost of trap. In Lal<:shadweep, as much ~ million coconuts worth of 35 lalms rupees are damaged per year (Whitaker and Bhasker, 1978 Shah & Subiah 1978). The estimated loss to coconut crop is about 55 percent in Minicoy island (Advani, 1984b) and 35 percent in Car Nicobar groups of islands in Bay of Bengal (Advani, Unpublished data).
Cocoa
A heavy damage (75 percent) can be seen by rodents in any of the farmers• fields having cocoa plantations (Advani, 1982b). With predominance of Rattus rattus and Western ghat squirrel, FunamblllUs~riatus, three mammalian species, like Long-tailed tree mouse Vandeleuria oleracea; a fruit bat, Cynopterus sphinx and House shre1v, Suncus murinus 1vere also collected in rodent traps. The Indian flying fox, Pteropus qiganteus also damages cocoa pods besides coconut, banana guava, grapes ets. Regular trapping of rodents and bats in cocoa plots resulted in cost benefit ratio of about 1:500 in plantations near Kasaragod, increasing the productivity by more than ten times per ha.
Forest plantations
In Rajasthan (North India), due to debarldng of stems and roots of important trees like Albizzia lebbek, Prosopis cineraria and Acacia tortilis by rodents (mainly Cutch rock rat, Rattus c. cutchicus), heavy mortality amoung plants is observed (Prakash, 1975) . Similar damages 1vere also observed in A. tortalis plantations in Jaisalmer and in P. -juliflora in Great Renn of Cutch (Prakash~1977) in Gujarat state. Treatment 1rith Zinc Phosphide 2%) could reduce rodent population by about 88 percent in t1vo years.
Grasslands and Fodder crops
Nine rodent species with preponderance of gerbils, infest grasslands in the Western Rajasthan

biome (Advani 1982c), In monsoon season, rodents damage inflorencence. They feed upon stems, seeds and roots of the predominant grasses (Cenchrus spp., Lasiurus sindicus) grown for livestock, causing great loss in the productivity of grasslands and in turn affect the milk production of region, which is source of income for about 50 percent of tl1e i..dlabitants of arid. zame. The annual forage feed requirements of gerbils at the density of 400 to 470/hectare, is about 1,040 kg/ha compared with an annual forage production of this range land of only 1,210 kg/ha. (Prakash, 1977).
Soil erosion and desertification
The extensive burrow systems of the desert gerbils and murids as well as their high numbers (14,000/100x100m plot), is a great danger for soil conservation in Rajasthan. By tunnelling the gerbils excavate 61,500 kg soil in a day per km2 in crop fields and 10,43,800 kg soil/day/ km2 in uncultivated lands (Sharma and Joshi, 1975). Thus they uproot seeds of almost all cereal and vegetable crops.
Destruction to other crops and storage
The results of some studies conducted in a small area for a short term period are tabulated in the Table (1). Under storage conditions in rural complexes in Rajasthan, regular six monthly rodent trapping and control work resulted in saving of grains worth of Rs. 220 when only one rupee was spent (Prakash et al 1981).
Table 1.--Rodent damage to various crops: results compiled on the basis of short term studies in India
Crop Damage propensity Source
Cotton 57'/o Panchabhavi and Thimmiah 1975
Groundnut 1-4"/o Srivastava, 1966 12-31 kg/acre Bindra & Sagar, 1968
Coconut 3-17'/o Srivastava, 1966
Betel nut 20"/o Valsala, 1958
Sugarcane 65-97 kg/ha Bindra and Sagar,1968 loss 66.50 Rs/ha Gupta et al 1971.
Tea bushes upto 50"/o Veeraraghavan, 1966 (roots)
Barley 3-12"/o Srivastava, 1968
Paddy 6-9"/o Srivastava, 1968 1,400 kg Spillett, 1968 (Storage)
Sorghum 6"/o Srivastava, 1966
110
Rodent pest management by predators
In regulating the rodent numbers predators play an important decisive role. Ho~ever, pa:a~lel annual breeding cycles and reproduct1on capab1l1ty of predators decide their effectiveness in controlling rodents. Reptiles, birds and mammals are some of the major vertebrates predating upon rodents in India. In North India, two species of lizards, Varanus bengalensis and ~ griseus Jconieczyni are bigger and powerful as well as.fast running reptiles to manage the rodent populat1ons on the ground as well as trees. Hmrever, due to their diurnal activity patterns, they can only predate upon diurnal rodents like Indian desert gerbil, Meriones hurrianae, Bush rat, Golunda ellioti qujerati and the Indian palm squirrel, Funambulus pennanti. ~ pennanti remains.were. collected in the stomach contents along 1n th b1rds, lizards, fishes, beetles, crabs and snakes (Minton, 1966).
Snakes have been found to be promising agents in regulating the rodent numbers to a certain extent (Whitaker and Advani, 1983). Prakash (1962) listed some snake predators as the Rat snake, Ptyas mucosus; the Earth snake, Lytorhynchus paradoxus; five species of Coluber; the.sand snakes, ~ johni, E. conicus; the Kra1ts, Bungarus caeruleus, B. sindan~, the Cobra, .N~ja naja and the Viper, Echis car1nata. In add1t1on . to these, Minton (1966) reported that Sphalerosph1s archarius also feeds upon the rodents. Whereas, Whitaker and Bhaskar (1978) found that Pythons regulate rat populations effectively.
Among birds, recently Jain and Advani (1982) fm.nd that arout 66 percent of the fecal contents of mrl, Athene brama had remains (bones, skulls, hairs etc) of Mus spp. on an yearly basis. Shikra, Accipitar badius; Tawny eagle, Aguila rapax, Merlin, Falco chicguera and Kestrel Falco tinnuncu~re some of other bird species feeding upon rodents (Prakash 1975).
Predation by mammals like Long-eared hedge hog, Hemiechinus auritus collaris (krishna and Prakash 1960), the Indian false vampire bat, Megaderma lyra lyra (Advani, 1981; Advani and Makwana 1981). Asiatic jackal, canis aureus; foxex, Vulpes bengalensis and ~ vulpus pusil~a; Jungle cats, Felis libyca and ~ chaus prater1 and mongoose, Herpestes edwaraii are known to regulate rodent populations to some extent (Prakash, 1975).
ACKNOWLEffiEMENTS
The author is grateful to Indian Council of Agricultural Research (ICAR) for providing facilities to undertake these studies at Central Arid Zone Research Institute, Jodhpur and Central Plantation Crops Research Institute, Kasaragod. Thanks are also due to Director, Zoological Survey of India, Calcutta. Thanks are due to my wife, Shweta for typing this manuscript carefully.

LITERA'l;URE CITED
Advani, R. 1981. Seasonal fluctuations in the feeding ecology of the Indian false vampire, Megaderma lyra lyra (Chiroptera: Megadermatidae in Rajasthan. Zeit. angewandte Zool. 46:90-93.
Advani, R. 1982a. Vertebrate pest problems in the Indian desert and their biotoxicological management. Sci. Rev. 1:87-118.
Advani, R. 1982b. Ecology, Status and post natal development of the Black rat, Rattus rattus (Linnaeus) in the plantation crops in Sahyadri tract. Proc. Plant. Crop. Syn. (626-632).
Advani, R. 1982c. Patterns of rodent infestation in the grassland habitat of the Rajasthan desert. Zeit. angewandte Zool. 70 (145-151).
Advani, R. 1984a. Ecological analysis of small mammal populations and their status in the crop ecosystem of the Indian desert. Zeit. angewandte Zool. ]1:1-20.
Advani, R. 1984b. Ecology, biology and control of Blackrat, Rattus rattus in Minicoy Island. J. Plantation Crops 12:11-16.
Advani, R. and Makwana, S.C. 1981. Composition and seasonal occurence of animal remains in the roosting habitat of Megaderma lyra lyra in Rajasthan. Zeit. angewandte Zool. 68:175-181.
Advani, R. and Mathur, R.P. 1982. Experimental reduction of rodent damage to vegetable crops in Indian villages. Agroecosyst. 8:39-45.
Advani, R. Prakash, I. and Mathur, R.P. 1981. Rodent control in Jodhpur. Ind. Farming, 32: 9-11.
Advani, R. Prakash, I. and Mathur, R.P. 1982. Assessment of damage by rodents to standing 1-1heat crop in a desert village complex. Zeit. angewandte Zool. 69: 257-266.
Advani, R., Prakash I. and Mathur, R.P. 1987. Reduction in rodent populations through intermittent control operations in the cropping ecosystem of the Indian desert. Thirteenth Vertebrate Pest Conf., Monterey, Calif. (In press).
Advani, R. and Rana, B.D. 1981. Food of the House shre~v, Suncus murinus sindensis in the Indian desert. Acta Theriol. 26:133-134.
Bindra, O.P. and Sagar, P. 1968. Study on losses to 1vheat, groundnut and sugarcane crops by the field rats in Punjab. Proc. Intl. Syn. Bionom. Contr. Rodents. Kanpur. 28: 31.
111
Greaves, J.H., Chaudry, M.A., Khan, A.A. 1977. Pilot rodent control studies in rice fields in Sind using five rodenticides. Agroecosystems 3:119-130.
Gupta, K.M. Singh, R.A. and Mushra,_ S.C. 1971. Economic loss due to rat attack on sugarcane in Uttar Pradesh. Proc. Internat. Symp. Bion, Control of Rodents Kanpur (1968): 17-13.
Jain, A.P. and Advani, R. 1984. Winter food of the spotted owlet, Athene brama in Rajasthan. J. Bombay nat. Hist. Soc. (In press).
Krishna, D. and Prakash, I 1960. Hedgehogs of the desert of Ra-jasthan. Pt-3. Food in nature. Proc. Raj. Acad. Sci. 7:60-72.
Minton, S.A. 1966. A contribution to the herpetology of West Pakistan. Bull. Arner. Mus. nat. Hist. 134:27-184.
Panchabhavi, I.S. and Thimmiah, G. 1975. Rats damage to green cotton bolls at Dharwar. Curr. Res. 4:13-14.
Prakash, I. 1962. .Ecology of the gerbils of the Rajasthan desert , India. Mammalia 26:311-33.
Prakash, I. 1975. The population ecology of the rodents of the Rajasthan desert, India. In Rodents in Desert Environment (Ed.I. Prakash and P.K. Ghosh) W. Junk Dv. Publ. House: 75-116.
Prakash. I. 1977. Rodent Pest Management: Principles and practices. Monograph. No. 4, CAZRI, Jodhpur, 1-28.
Prakash, I. Advani, R. and Mathur, RP. 1981. Population dynamics of rodents in rural residential environment in response to control operations. Proc. Worksh. Post Harvest Tech. and Prevention of Food Losses, N. Delhi (In Mimeo).
Rana, BD. and Advani, R. 1981. Food composition of the Metad. Rattus meltada pellidior in Western Rajasthan. Acta Theriol Bialowieza 26:129-132.
Rana, BD. Advani, R. and Soin B.K. 1982. Reproduction/biology of the House rat,Rattus rattus rufescens in the Indian desert. Zeit. angew. Zool. 70:141-151.
Shah, D.R. and SUbiah K.S. 1978. Notes on rodent control in Lakshwadweep islands with rodafarin (warfarin) wax blocks. Pestology 2:36-42.
Sharma, V.N. and Joshi, M.C. 1975. Soil excavated by desert gerbil, Meriones hurrianae (Jerden ) in Shekhawati region of Rajasthan desert. Ann. Arid. Zone, 14:268-273.
Spillet, J.J. 1968. The ecology of the Lesser bandicoot rat in Calcutta, J. Bombay Nat. Hist. Soc., 1-223.

Srivastava, A.S. 1966. A new method for estimation of damage to field crops by rats. Labdov J. Sci. Tech. 4:197-200.
Srivastava, A.S. 1968. Rodent control for increased food production. Rotary Club of Kanpur, of Kanpur, West, 152 pp.
Valsala, PG. 1958. Pests of arecanut and their control. Coco. Bull. 12:13-16.
Veeraraghavan, P. 1966. Weak bushes on tea gardens. Plant. Chron. (Madras) 61:195-196.
W.H.O. 1974. Ecology and control of rodents of public health importance. WHO Tech. Rep. Series No. 553, 42 pp.
112
Whitaker, R. and Advani, R. 1983. Preliminary field study on snakes as agents of management of rodent populations. Ind. Forest. 109:417-419.
Whitaker, R. and Bhaskar, S. 1978. Rodent control in the Lakshadweep islands, Rodent Newsl. 2:1.
Williams, J.M. 1971. Rat damage to coconuts in Fiji. Part 1. Assessment of damage. PANS 20:379-391.
Williams, J.M. 1974. Rat damage assessment and control in cocoa. Fiji Agr. J. 35:15-25.

Involving the Public in Prairie Dog Management on the Nebraska National Forest1
z George Probasco
Scoping is the formal name for a process designed to identify public issues and incorporate public values into the decision making process for management of public lands. Scoping ensures that a public agency, in this case the Nebraska National Forest, will identify important issues and develop alternative management strategies for projects in full public view. Scoping has specific and fairly limited objectives: (a) to identify the affected public and agency concerns; (b) to facilitate an efficient analysis of the environmental impacts; (c) to define the issues and alternatives that will be examined in detail; and (d) to make sure that the analysis and documentation adequately address the relevant issues. Scoping should lay a firm foundation for the agency decision making process. If all the necessary information for formulating policies and making rational choices has been considered then the agency will be able to make sound and prompt decisions that will usually satisfy the public.
The scoping process began on the Nebraska National Forest when the Prairie Dog Management Interdisciplinary Team (ID Team) was appointed by the Forest Supervisor. The ID Team reviewed existing information obtained through previous public involvement efforts for earlier management decisions. Following this analysis the Team then put together a brochure for distribution to the public in order to gain further input about prairie dog management on the Nebraska National Forest. The brochure was titled "Issue Identification for Prairie Dog Managemento" It was mailed out in September 1986 and comments were due in the Supervisor's Office by December 1, 1986.
Over 200 documents containing comments about prairie dog management were received by the Forest. Comments were received from a wide variety of people with the following affiliations: academic/extension, business/industry, concerned citizen, environmentalist, government (local, State, and Federal), grazing permittee, grazing association, landowner, natural resource group; professional society, prairie dog shooter, and others.
The ID Team spent several weeks during the months of December 1966, January and February
l 0 . Talk presented at the oth Great Plalns Damage Control Workshop. (Rapid City, SD, April 28-30~ 1987).
George Probasco is Assistant Planner, U.S. Forest Service, Chadron, NE.
113
1987, analyzing and summarizing the public response to the brochure. The first step in the process was to go through all the response documents (response forms, letters, documented telephone calls or conversations, petitions) line by line and highlight all the opinions and values, along with the underlying reasons. Following that the ID Team went through the comments again and looked for similar themes among those comments. Comments with similar themes were then grouped into a category defined by the subject matter of the comments. The first grouping yielded 35 individual subject categories. The Team then reviewed the categories to see if some could be combined further. This second grouping yielded 24 categories. I have chosen six of the high interest categories to discuss at this workshop.
DISTRIBUTION AND MANAGEMENT OF ACTIVE PRAIRIE DOG COLONIES
One common opinion is that prairie dog colonies on public land should not be located close to private lands. Another opinion is that prairie dog colonies should be placed in areas unsuited for livestock grazing or where there will be minimum impact on livestock grazing. Other opinions dealing with the distribution of active colonies differ because some people think active colonies should be consolidated in specific areas while others think active colonies should be scattered out more. The thought was also offered that it is impossible to maintain a specified size and distribution of active colonies. Some people also think that active colonies should be treated periodically to control overcrowding; however, another opinion questions whether treating the perimeter of an active colony will decrease prairie dog dispersal or slow colony expansion. There was one suggestion for establishing a large prairie dog area between the Badlands National Park and the White River, then eliminate prairie dogs elsewhere.
COST-EFFECTIVENESS OF PRAIRIE DOG MANAGEMENT
Opinions for this subject were so numerous and varied that subcategories were created to adequately descibe it.
Cost and Benefits
There was concern that the costs and benefits of managing or maintaining a prairie dog population are not being thoroughly and accurately evaluated. There was also concern that a cost-benefit analysis should be conducted for different levels of prairie dog populations.

Cost-effectiveness
There were many, varied opinions dealing with cost-effectiveness. These comments range from cost~ffectiveness of the prairie dog management program to specific parts of the management program such as range management, ro~enticides, and shooting.
Comments ranged from what it costs the public to retain active prairie dog colonies, to how costly it is to control prairie dog colonies through vegetation manipulation, to the cost of rodenticides, to how money could be saved by cutting out black-footed ferret surveys.
Economic Analysis
The concern here was that economic analysis be conducted by qualified economists using scientific techniques.
Benefit·s
The opinion was advanced that the value of prairie dog shooting to the economy, if properly managed, is equal to that of livestock grazing.
Social and Economic Impacts of Black-footed Ferret Re-introduction
Comment was made that the full social and economical impacts of black-footed ferret re-introduction need to be disclosed.
EFFECTIVENESS OF LIVESTOCK GRAZING PRACTICES IN CONTROLLING PRAIRIE DOG POPULATIONS
Opinions for this subject ranged from believing that range management practices don't help control prairie dog populations to believing that range management practices will control prairie dog populations.
114
PRAIRIE DOG SHOOTING
The opinions for this subject ranged from using shooting to control prairie dog populations to not using shooting since it will not control prairie dog populations. Other comments were that recreational shooting should be encouraged and prairie dog populations increased to support this use while others believe that the present prairie dog population is adequate for sport shooting.
USE OF RODENTICIDES
Opinions for this subject ranged from the need to eliminate the use of rodenticides to the need to use rodenticides since that is the only proven method of prairie dog control.
THREATENED AND ENDANGERED SPECIES CONSIDERATIONS
The opinions for this subject ranged from the need to manage for black-footed ferret habitat to the need not to worry about black-footed ferret habitat since one has not been seen for 10 to 15 years and there are none in the area.
Information gained from this public involvement effort will be used in formulating a set of alternatives to deal with pr~irie dog management on the Nebraska National Forest. The environmental effects of these alternatives will be estimated and the results presented to the Forest Management Team. This Team will evaluate the alternatives based on the estimated effects and select a preferred alternative. This preferred alternative will be released to the public for final review and comment. Following this final review by the public, the proposed management direction contained in the preferred alternative will be added to the Forest Plan by amending it. That management direction will be the guide for managing prairie dogs on the Nebraska National Forest for the next ten to fifteen years.

Legislative Review of Prairie Dog Statutes1
Lyndell Peterson2
If I follow my normal pattern in pursuing this subject I will probably make at least half of you mad before the afternoon is over. Within that framework I am going to share with you one of my wife's viewpoints, and that is anger is not a true emotion. You're angry either because you are ashamed or afraid or something, you aren't just mad because you want to be mad.
To philosophize for just a bit before I get into some details about legislation, one of the things I want to share with you is this: Regardless of what you think about your role in life, one of the things that makes it possible for you to be here in the condition that you are in is the fact that man pursues an activity that is designed to imbalance nature in his favor. So, no matter how much of a purist you may think you are, you have benefited from some of that activity--so don't forget it. The other thing I want to share with you is that you are here because we have a system of government that provides for values to have money allocated for supporting them, giving many of you a job. I had a similar job when I was a county extension agent. But if you fail to recognize that, then just reflect back on whatever perception you have of the evolu·tion of mankind and think about the time when your ancestors were sitting around in a cave grunting at each other and chasing their dinner with a stick. When they got to where they could not catch any more dinner, they moved their territory and might run into another group of people who thought that was their territory. And the first thing you know, you either had a war or you figured out a way to get along.
The legislature is a modern version of a system that allows us to get along and bring our values together, sort them out, and establish ground rules under which we function. As we imbalance nature in our favor and apply our values through the legislature and congress, one prevailing value is that most of us will go to war for our right to own property. Yet there are times when our point of view functions in such a way that we say this process should provide us authority and power over somebody else's property as long as nobody exercises that same authority over ours. My philosophy is that you should not seek from government any power over another person that you do not wish to abide by yourself. Within that framework then, one of the principles I have applied in the legislative process
1Talk presented at the 8th Great Plains Damage Control Workshop. (Rapid City, SD, April 28-30' 1987).
2Lyndell Peterson is a South Dakota State Senator, Rapid City, SD.
115
is that everybody in a democratic society is entitled to access that svstem. In other words. one's point of view, idea, value is entitled to be injected into the legislative system; and, I have faith enough here in South Dakota that the 105 people who meet every year represent enough of our societal values so that the right answer will come out.
It is on that basis then that I function; this consistently has caused Game and Fish people, Forest Service people, Fish and Wildlife people, and others to regard me as their enemy. At the same time, it turns out that there are some private landowners trying to make a living from the imbalancing of nature on that land who think, "By golly, Peterson is all right." There are others who, because maybe they think they have risen above this process of imbalancing nature in their favor, take off from a very safe vantage point, because they have nothing to risk, and criticize the people I am trying to represent.
During my time in the legislature (my first session started in 1977) I have been a sponsor of or have generated amendments on legislation dealing with a number of subjects that related to the subject we are talking about here today. The first was an amendment to the Endangered Species Act of South Dakota that (1} took out the right of the Game and Fish Department to acquire land and aquatic habitat for endangered species; (2) put in a provision that the Game and Fish Department has a responsibility to control prairie dogs on private land adjacent to public lands when the infestation is coming from public lands to private lands; and (3) specified that control should be done at no cost to the landowner. The Game and Fish attorney at that time just about went through the roof of the Capitol Building. When he accosted me in the hall after that amendment was adopted he said, "What in the hell do you think you are doing? Do you realize you just cost us a million dollars?" And I said, "Who in the hell do you think has been paying the bill up to now?" The private landowner who happens to be unfortunate enough to live next to Badlands National Park or other federal lands that are being managed for something other than making a living. Well, that little amendment stayed on and it is a part of South Dakota law.
Later on I got involved with Jon Sharps here and his Vulpes velox--the swift fox. It happened we were on friendly terms in that situation. We were trying to make it possible for a situation to develop whereby Jon and ranchers working together could attempt to establish some swift fox in prairie dog areas. I might tell you that that is where the breeding stock for his poodles came from, but be

that as it may. Did we get that legislation through, Jon? No, not entirely. We did not get into business. The citizens expected some results from the initial amendment, and it was not happening. In order to move the Game and Fish outfit forward a little bit--I think it was the next year--we put an amendment on the bounty bill for predators, and I think South Dakota is the only state in the nation where prairie dogs are listed as predators. But that tied them together with the money that was being spent on predator control, and the first thing you know we had Game and Fish people out there working with private landowners to control prairie dogs when they were coming over from the park and different places.
Then, as we moved along we adopted the State Weed and Pest Law, which Dennis Clarke will talk about, and that kind of brought prairie dogs in. We had an old law on prairie dogs that nobody used, but it allowed for forming prairie dog control districts with the new Weed and Pest Law now in place.
116
The most recent legislation was passed this year, this session; it separated the two components and viewed the relationship of county weed and pest boards to federal land. And, in those cases where noxious weeds or pests existed on federal lands but the weed and pest board could not get cooperation from the land management agency, the Weed and Pest Board could automatically refer the enforcement notice to the State Attorney General, who could deal with the federal land manager. The idea behind that is that somewhere along the line private citizens who essentially volunteer to serve on a weed and pest board should not spend their money to fight the government. The government ought to be the people who are performing up to the letter of the law rather than be the problem, as it is in some cases. In all of this legislation up to now, with the exception of the Weed and Pest Law adoption, there has always been a polarization of people in such a way that somebody managed to interpret what was being done as though all of Mother Nature was being raped and somebody was throwing down the entire value system of our country and was tearing us apart. It has been an interesting process, and I do not think we have wrecked anything too badly yet.

Politics, Prairie Dogs, and the Sportsman1
Jon Sharps2
I would like to speak to you today about potential economic and biological values of prairie dogs. When I refer to prairie dogs throughout my talk, I'm referring only to the prairie dogs on the National Grasslands Systems in western South Dakota. Prairie dogs have great economic potential to sportsmen and the general public and also act as ecosystem regulators to grassland plant and animal communities, and as such, could enhance both potentials if managed differently.
According to South Dakota Department of Game, Fish and Parks, sportsmen spent about 46,000 hunter days shooting prairie dogs in western South Dakota last year; and I might add, this is a conservative estimate. Sportsmen spent an estimated average of $70 a day for a total of about 3.2 million dollars which was returned to the general economy. In addition, prairie dogs on the biological side are extremely important because they provide habitat for a host of avian and mammalian prey and predator species.
In 1978 the Forest Service and the Department of Game, Fish and Parks embarked on a campaign to virtually eliminate the prairie dogs from the National Grasslands. The Wall Ranger District and the Fall River Ranger District bore the brunt of this campaign. This decision was political and was brought about by the complaints of livestock permittees to the Forest Supervisor, State Legislature and to the Secretary of the Department of Game, Fish and Parks. The result of that campaign is the current Prairie Dog Management Plan. In my opinion, this decision and resultant plan was and is wrong when one considers that the permittee's represent only 2% of the livestock industry in South Dakota.
When one weighs the economic and biological values of prairie dogs against livestock grazing --which, I might add, is only one aspect of the approved multiple use concept on the grasslands--one is hard put to find justification for the large-scale reduction of prairie dog towns that took place. For example, in 1978 there were approximately 43,000 acres of prairie dog towns on the Buffalo Gap National Grasslands. This is roughly equal to about 6% of those grasslands. Currently there are only about 4,200 acres of dog towns remaining, which amounts to a 90% reduction from
1Talk presented at the 8th Great Plains
Damage Control Workshop. (Rapid City, SD, April 28-302 1987).
Jon Sharps is Owner of A-1 Kennels, Boxelder, SD.
117
that 1978 level. This roughly equates to about 0.2% of prairie dog towns left on National Grasslands.
Subsequent studies have shown that assumptions made by land and wildlife managers and the political advocates of prairie dog annihilation were wrong. Those assumptions were that if you got rid of the prairie dogs you would increase forage and livestock production. Let me give you some examples. It takes around 300 prairie dogs to consume as much forage as one, 1,000-pound cow, which is somewhere around 32 pounds of forage a day. If you were to eliminate all prairie dogs from a grazing area you would only gain about 4.4% to 8% more forage for livestock, which would not be biologically or economically feasible.
In looking further into the economics of prairie dog control, it has been found that it costs approximately $17 per acre, or around $3 per prairie dog, to get them poisoned. These figures are from an ongoing control program on the Pine Ridge Indian Reservation. They are using zinc phosphide as a control agent, and the overall cost of that program is $6.2 million and is scheduled to run five years. All things considered, I do not believe it will be economically justifiable when you consider prairie dogs repopulate at about a 30% annual rate; at least they have in the initial control area. You will have to treat the area every three years or so to maintain that kill ratio. This is with a 95% kill ratio using zinc phosphide. Studies have also shown that controlling prairie dogs did not increase forage produced whether or not cattle were allowed to graze. Results indicated that reduced livestock grazing may be required to increase forage production. It is well known and documented that prairie dogs are more abundant in areas heavily grazed by cattle than in areas where cattle are excluded. Further, plant production has increased more on areas grazed by prairie dogs only than by cattle plus prairie dogs.
All the evidence I have been able to gather suggests sportsmen and the general public have been sold a bill of goods regarding the current philosophy of prairie dog management. The cost ratio of control programs does not equate when compared to potential economic and biological benefits. This is particularly true when you consider that the primary benefactor of the current control program is the livestock permittee and the loser is the general public to whom the land belongs. The sportsman segment of the general public is the greatest loser along with the small businessman who depends on the sportsman's dollars as a part of his living. Another big loser because of the current management

system is the wildlife ecosystem. Very little . consideration is given to state and federally l~sted endangered species in my opinion. Indeed, ~ne g~ts the impression they hope no endangered spec~es w~ll be found because it might upset the management system.
As a true part of the multiple use c~ncept as described in the Forest Plan and by the various laws and rules authorizing that plan, I believe prairie dog towns could be increased to provide for recreation and enjoyment of the general public without harming the livestock industry. I would suggest a minimum increase of 1.8% of prairie dog towns which
could be located equally throughout the Grasslands System or where the public can have easy access to them. Biological considerations for other species should also be considered in this increase. This increased level would provide around 13,000 acres of prairie dog towns and would bring in around $4.2 million annually to the general South Dakota economy, again assuming that $70 per day are' spent by sportsmen. I believe it is past time to recognize and manage the prairie dog for all the valuable parts it plays in the ecological scheme of things. And it is certainly past time to stop foolishly spending our tax and sportsmen's dollars on a program designed to make us all lose.
118

Prairie Dog Control-A Regulatory Viewpoint
Dennis c. Clarke
Prairie dogs and their control are complex issues. At this conference we've heard numerous speakers discuss a wide variety of topics concerning the organism's effect on range and man's attempts to deal with those effects. It appears one could make a case for or against the prairie dog depending on his own particular situation and experience. While the organism is a natural part of the prairie ecosystem, it may not be a desirable inhabitant of a livestock producers range when its population goes unchecked.
This leads to conflict. The prairie dog becomes a biopolitical issue. On one hand it evolved with the prairie ecosystem, as have grasshoppers, but when it competes too directly for a resource man needs to support his portion of the food chain, it may become an unwelcome member of a particular grassland community. Regulation of its populations may be necessary. It is my assignment, in the next few minutes to discuss the philosophy and mechanism we in South Dakota use to accomplish this end.
Whenever an introduced or endemic plant or animal species that has the potential to cause economic loss inhabits land to the degree that it poses a threat to the infested land itself, neighboring lands or the resource as a whole, it becomes a concern of society in general. The offending plant or animal may need to be controlled to reduce or remove the threat. Most landowners and managers are good stewards of the land. They recognize organisms that have the potential to adversely affect their land's productivity. They further recognize that even if their own personal value system allows for the presence of what many people feel are undesirable plants or animals, they must control them to keep from imposing their values on those held by society as a whole.
Unfortunately, not everyone acts in 8 manner felt to be indicative of a good steward of the land. Society has long recognized this. It has passed laws that require the control of plants and animals that have the potential to cause adverse economic impact and/or general resource deterioration even if a landowner is not so inclined. These laws are in force in some form or another in virtually every state in the nation and, we can probably say, every country
1Talk presented at the 8th Great Plains Damage Control Workshop. (Rapid City, SD, April 28-30, 1987).
2Dr. Dennis C. Clark is State Weed and Pest Coordinator, South Dakota Dept. of Agriculture, Pierre, SD.
119
in the world. Only the plants and animals that are regulated and the method of obtaining compliance with the regulatory requirements varies from place to place.
Normally legislation that allows society to control undesirable organisms does so by declaring them a public nuisance. Commonly the statutes involved outline the criteria for determining what organisms are considered to be nuisance candidates and the procedure to be followed in controlling offending infestations. Often times plant and animal control requirements are in different statutes. South Dakota has seen fit to combine the regulatory mechanisms for both in one law. The state's present Weed and Pest Statute was enacted in 1983. As written, the statute enables County Weed & Pest Boards, with direction from the State Weed & Pest Control Commission and coordination and assistance from the State Department of Agriculture, to take action to control nongame birds, insects, and rodents - pests - in a systematic, organized manner.
One of the Commission's first orders of business after the legislation went into effect in January, 1984, was to designate prairie dogs as a statewide pest, an aetion that was clearly part of the intent of the state legislature.
This action was felt necessary because prairie dog populations had expanded during the mid and late 1970's to the point where an estimated 730,000 acres were infested, covering about 3% of the state's hay, range, and pasture lands. This infestation level was estimated to be costing producers about 3.5 million dollars annually in direct losses and a total of nearly 10 million dollars when both direct and indirect losses were considered.
Clearly action was needed to check the spread of prairie dogs and decrease their effect in areas where they had virtually taken over large tracts of range.
Since the early 1980's a combination of factors have been effective in reducing the infested acreage. Federal and state agencies became active on lands they control. At the same time, counties using the Weed and Pest Boards as a local coordinating and regulatory base, organized programs and educated landowners in control techniques. County Boards have used resources available through the Cooperative Extension Service, Animal Damage Control and the Department of Agriculture to assist with building viable control programs. These efforts have reduced the prairie dog infestation level to what we estimate is about 200,000-250,000 acres that have not been treated.

To motivate landowners who have not responded to educational and voluntary control requests many of the County Weed and Pest Boards are now entering the enforcement phase of prairie dog control programs. The State Weed & Pest Control Commission defines control to mean that an infestation has been treated so that it no longer poses a threat to neighboring lands. It does not mean eradication.
To "force" control, two avenues are available to a county:
1. Protective operation = state enforcement. 2. Remedial action = county enforcement.
Both processes are similar in mechanics. Statutory language ensures that landowners receive due process through notification of
120
control requirements and specific time allowances for voluntary compliance with written control orders. Only after results have not been forthcoming through initial enforcement steps do county boards or the Department of Agriculture have the authority to control an infestation at the landowner's expense.
If you are interested in the actual mechanics of an enforcement, I would be most happy to discuss it with you at some other time. At this point, suffice it to say, the system has been effective and met the need of controlling prairie dogs in some instances where it was determined to be in the best interest of protecting the resource and the rights of adjoining landowners.

...
A Chronology of Prairie Dog Control Operations and Related Developments in South Dakota1
Rew Hanson2
The black-tailed prairie dog is a South Dakota native with a long history of controversy regarding its activities and control. The first organized efforts in prairie dog control date back to 1914 but little information was recorded until 1919 with some county operations and the passing of a rodent control law by the South Dakota Legislature. Nine west river counties reported treating a total of 398,000 acres of prairie dogs in 1920.
These early programs were organized on a county by county basis involving the board of county commissioners, the county agent and the Bureau of Biological Survey, USDA. The county had the option of purchasing strychnine oat bait at $8 per bushel FOB Minneapolis or mixing their own strychnine oat bait according to the Bureau's formula for about $4 per bushel. It was also their option to contract or hire crews to do the baiting or to set up cooperative or community programs where individuals did their own baiting. In either case, the Bureau provided training, direction and demonstrations on bait preparation, application procedures and other technical aspects of control. After implementation, the supervision of the project was usually delegated to the county agent who became the key figure in that control effort.
A summary of prairie dog control programs conducted in the five counties of Haakon, Fall River, Pennington, Jackson, and Butte during 1922 provides some fiscal perspective. Approximately 150,000 acres were poisoned for the first time and some 20,000 acres were repoisoned for a total of 170,000 acres. They used 1255 bushels of strychnine oat bait at $4.00 per bushel which amounts to $5,020. The average applicator baited 75 acres of infested land per day and his iabor was worth $3 per day or 4~ per acre. Labor costs for the 170,000 acres were $6,810 plus bait at $5,020 for a total of $11,830 or about 7~ per acre. Carbon bisulphide was sometimes used in cleanup and its cost was figured at 1~ per burrow treated.
This same year, 1922, a Reservation wide survey on the Pine Ridge Indian Reservation indicated at least 140,000 acres of prairie dogs. Organized prairie dog control programs continued through the twenties on private, state, federal and Indian
1 Talk presented at the Rth Great Plains Damage Control Workshop. (Rapid City, SD, April 28-30~ 1987).
Hanson is State Director of APHIS, ADC, Pierre, SD.
121
lands and by 1930 the prairie dog population had been reduced to widely scattered small towns.
Also in 1930, the Bureau of Biological Survey moved its offices from Rapid City to Mitchell and established the first central bait mixing plant. Hard times and the dust bowl of the thirties saw these small prairie dog populations grow large. Organized prairie dog control programs, utilizing some of the Federal emergency work programs during the thirties, were successful in achieving control once more. This overall effort probably had prairie dog populations at the lowest level to date.
By 1940, the prairie dog population in South Dakota had again reached a stage where colonies were small and usually consisted of a few acres each. Also in 1940 the Bureau of Biological Survey was transferred from the Department of Agriculture to the Department of Interior and became the Fish and Wildlife Service. By 1945, there had been a general increase in prairie dog infestations throughout the District (North Dakota, South Dakota and Nebraska).
By 1950, operational use of 1080 oats under the direct supervision of Predator and Rodent Control personnel was the standard prairie dog control procedure, although strychnine bait was still used by many private landowners. From the late forties to the mid fifties, 20,000 to 50,000 acres per year were treated.
From 1955 to 1965, prairie dog populations were kept at management levels. In 1965 some 25,000 acres were treated and the policy on pre-control surveys for black-footed ferrets was established. From 1965 to 1971, up to 31,000 acres were treated per year and in 1968, prairie dog acreage in South Dakota was estimated at 61,000 acres.
In 1972, Executive Order #11643, in effect stopped the use of toxicants on federal lands and by federally funded programs. Prairie dog control efforts were on hold through 1975. In 1973, a questionnaire to land owners and operators on the Pine Ridge Indian Reservation indicated some 32,000 acres of prairie dogs.
In 1976, zinc phosphide oats became the prescribed prairie dog bait for use on federal lands and in federal programs, and some 30,000 acres were treated per year through 1979. The South Dakota Department of Agriculture reported 730,000 acres of prairie dogs in the state in 1980. In 1981, the prairie dog acreage on the Pine Ridge Indian Reservation peaked at near 300,000 acres.

During the years 1980 through 1984, a total of 997,000 acres were baited in South Dakota. 464,000 of these acres were on the Pine Ridge Indian Reservation. During 1985 and 1986, 329,000 acres were baited in South Dakota and 240,000 of these acres were on the Pine Ridge Indian Reservation.
A recap of the 85 and 86 control programs on the Pine Ridge Indian Reservation show that operational costs averaged $6.90 per acre for the two year period. Pre-control surveys for blackfooted ferrets came to $0.98 per acre which brings the total field cost to $7.86 per acre. Except for one zone of some 5,000 acres that did not get baited properly in 1986, the degree of control achieved for the two years averaged over 92%.
Recommended criteria for efficient and consistent control of Prairie dogs: Allow at least 2 years since the last baiting. September and October is the prime time for baiting in South Dakota but can be August to November. Use good quality bait and pre-bait. Exercise proper application, 1 heaping teaspoonful splashed on firm, bare soil at each mound. Do not exceed 10 days between pre-bait and baiting. Require that 95% or more of the mounds are baited. Minimize disturbances after baiting. Keep control areas blocked together. Coordinate control efforts with adjacent areas.
12 2
Carbonbisulphide, calcium cyanide, gas cartridges, and aluminum phosphide are fumigants that have been used for cleanup. Gas cartridges and aluminum phosphide are currently registered for such use. Spring is the recommended period of use due to the desirable soil moisture level and that the prairie dogs are concentrated in the fewest burrows. The use of fumigants represent the most labor intensive and the most expensive control tool.
In the long term, range management is critical. Good to excellent range provides the best protection from prairie dogs and the best return to the owner.
We have seen elevated pra1r1e dog populations in South Dakota about every 15 years from 1920 to 1980, separated by intervening lows. We are now approaching the ensuing low. I am sure you recognize the many social, economic, political, biological and climatic conditions that have influenced these fluctuations, but I think Noble Buell, a former District Agent here iu South Dakota got to the heart of it when he said "As control succeeds, human concern diminishes, therefore, control is self limiting."

Endangered Species Considerations In Prairie Dog Management1
Max Schroeder2
Past managemen-t of the pra1r1e dog has more often than not resulted in the reduction of prairie dog ecosystems upon which one endangered species, the black-footed ferret, depends. This species and over 400 other species found in the United States and its Territories are currently protected by the Endangered Species Act. The current Endangered Species Act had its start in 1964. At that time, the Bureau of Sport Fisheries and Wildlife selected a committee of individuals to determine which animal species in the United States were threatened or endangered with extinction. These individuals, with the help of some 300 other persons and organizations, compiled the first tentative list of rare and endangered wildlife. The black-footed ferret was listed at that time as one of 135 endangered species. In June 1965, the ferret was accorded protection by the Assistant Secretary for the Fish and Wildlife Service, through a policy that recognized the black-footed ferret as an endangered species closely associated with and believed dependent on the prairie dog for food and shelter. This policy stated that while the Department of the ~nterior has a responsibility for protecting the black-footed ferret, it was also responsible for the control of animals that were considered significantly detrimental to the best interest of man.
To satisfy these responsibilities, protecting the ferret and suppressing prairie dogs, the policy required that before any toxic bait was made available for prairie dog control by the Bureau of Sport Fisheries and Wildlife, the Bureau would conduct investigations of any prairie dog towns proposed to be treated to determine that they were not at that time occupied by black-footed ferrets. The first systematic surveys done in response to the policy were conducted by the Fish and Wildlife Service in August 1965 on the Pine Ridge Indian Reservation in South Dakota. This first policy was followed in 1966 by the Endangered Species Preservation Act which directed the Secretary of the Interior to carry out a program to protect, restore, and propagate selected species of native fish and wildlife. This was followed in 1969 by the Endangered Species Conservation Act. This act expanded the land acquisition authority of the 1966 act, better defined the authorities granted in the 1966 act, and authorized the Secretary to develop a list of species subject to extinction.
1Talk presented at the Rth Great Plains Damage Control Workshop. (Rapid City, SD, April 28-30 1987).
2Max Schroeder is Black-footed Ferret Coordinator, U.S. Fish & Wildlife Service, Denver, CO.
123
In 1973, the current Endangered Species Act was enacted. This is a much stronger and more comprehensive statute than either the 1966 or 1969 documents. This Act has been amended several times, including the most recent amendment in 1982, and directs the Secretaries of the Interior and Commerce to, among other things, develop a list of species that are in danger of extinction and to carry out programs for the conservation of listed species. The Secretary of Commerce delegated this authority to the National Marine Fisheries Service, which is responsible for the list of marine species when they are at sea. The Secretary of the Interior has delegated the authority for marine species when on shore and all other listed species to the Fish and Wildlife Service. Programs for the conservation of listed agencies include provisions to provide a means to conserve the ecosystem upon which the endangered and threatened species depend; to take appropriate steps to achieve the goals of the various treaties and conventions listed within Section 2(a) of the Act; and to encourage the States and other interested parties to develop and maintain conservation programs that meet national and international standards. Several sections of the Act have special considerations for endangered species recovery. These could impact prairie dog management, since prairie dogs are the major prey species of the endangered black-footed ferret.
Section 4 of the Act directs the Fish and Wildlife Service to determine whether a species is endangered or threatened because of any of several factors. Some of these include present or threatened destruction, modification, and curtailment of habitat or range; overutilization of a species for commercial, sporting, recreational, scientific, or educational purposes; the effects of disease or predation upon the species; the inadequacies of existing regulatory mechanisms for the species, or other natural or manmade factors that may affect its continued existence. Within this section is a mechanism for (1) listing the various species subject to endangerment throughout the world, and (2) also developing recovery plans for each listed species.
Section 6 of the Endangered Species Act provides that the Fish and Wildlife Service may enter into a cooperative agreement with a State agency to conserve resident endangered species. The Service may enter into a cooperative agreement with any State which establishes and maintains an adequate and active program for the conservation of any endangered or threatened species. Through Section 6 agreements, the Service is authorized to provide financial assistance and to assist States in the de-

velopment of programs for the conservation of endangered or threatened species.
Section 7 is interesting when considering the management of prairie dogs. Section 7(a}{1} of the Act states that the Service and all Federal agencies shall utilize their authorities to carry out programs for the conservation of endangered or threatened species. Section 7(a}{2} further requires that Federal agencies, in consultation with and without the assistance of the Service, ensure that any action that they authorize, fund, or carry out is not likely to jeopardize the continued existence of any endangered or threatened species, or result in the destruction or adverse modification of a species' critical habitat. If a Federal agency plans any activity in an area involving prairie dog habitat, that agency should contact the Service's field office that is responsible for the site on
124
which they plan the activity. If the Service informs the agency that black-footed ferrets could occur in the project area, then surveys for black-footed ferrets may be necessary. These surveys would.be carried out by the agency proposing the action.
Standardized survey techniques and data that are gathered on each project site, draft blackfooted ferret survey guidelines for compliance with the Endangered Species Act. These guidelines are currently being used by the Fish and Wildlife Service field offices in Grand Island, Nebraska; Salt Lake City, Utah; Grand Junction, Colorado; Helena, Montana; and Region 2 in Albuquerque, New Mexico. These surveys are used to aid Federal agencies to ensure that no actions that they fund, authorize, or carry out are likely to jeopardize the continued existence of the black-footed ferret.

Duck Nest Success and Predators in North Dakota, South Dakota, and Montana: The Central Flyway Study1
Michael A. Johnson, Thomas C. Hinz, and Thomas L. Kuck2
Abstract.--Data on duck nest success and the distribution and abundance of nest predators were obtained from nine study areas in North Dakota, South Dakota and Montana. Success rates were extremely low due to predation and duck production over much of the region may be insufficient to maintain populations.
INTRODUCTION
Numerous studies during the past 20 years have produced estimates of duck nest success in the Prairie Pothole Region (PPR) of the United States. Recently, Northern Prairie Wildlife Research Center (NPWRC) compiled data from many of these studies into a 15,000-record database for use in a mallard (Anas platyrhyncos) recruitment model (Cowardin et ar:-1983 and Johnson et al. 1986). This model is designed to allow managers to evaluate the effectiveness of various management options for improving mallard recruitment. However, two major deficiencies exist in the data base (Klett et al. in press). Although most ducks (>90%) in the PPR nest on private lands (Hochbaum and Bossenmaier 1965, and Cowardin and Johnson 19833), most studies contributing to the data base were conducted on public lands managed for wildlife production. Also, most of the data were obtained from relatively few study areas and there is little comparable information for large portions of the Dakota•s and Montana (Klett et al. in press). Additionally, although predation is a major factor limiting duck nest success (Cowardin 1985), few nesting studies have produced concurrent information on which to assess predator populations (Sargeant 1983)4.
1paper presented at the Eighth Great Plains Wildlife Damage Control Workshop, Rapid City, South Dak~ta, April 28-30, 1987.
Michael A. Johnson is Supervisor, Migratory Game Bird Management, North Dakota Game & Fish Department, Bismarck. Thomas C. Hinz is Migratory Bird Biologist, Montan·a Department of Fish, Wildlife and Parks, Billings. Thomas L. Kuck is Regional Supervisor, Ducks Unlimited, Aberdeen, South Dakota.
3cowardin, L.M. and D.H. Johnson. 1983. A predictive model to guide management or acquisition of waterfowl habitat. Unpublished report. U.S. Fish & Wildlife Service, Northern Prairie Wildlife Res~arch Center, Jamestown, North Dakota.
Sargeant, A.B. 1983. Personal communication. Northern Prairie Wildlife Research Center. Jamestown, North Dakota.
125
This paper presents data collected during a oneseason study designed to obtain estimates of duck nest success by habitat type and estimates of predtor populations for nine study areas in North Dakota, South Dakota and Montana. Emphasis was placed on obtaining nest success records for habitats not specifically managed for wildlife in areas with little or no previous duck nest data. Duck nest data were collected to improve the ability of the NPWRC Mallard Model to evaluate management alternatives for increasing duck recruitment in the Central Flyway. Both nest and predator data complement that obtained in Canada during the study of stabilized duck hunting regulations (Greenwood et a l • i n press) •
ACKNOWLEDGEMENTS
This study was a cooperative venture which required the help and assistance of many individuals and agencies. The study was designed and directed by the Duck Recruitment Subcommittee of the Central Flyway Waterfowl Technical Committee which included H. Funk, T. Hinz, J. Hyland, M. Johnson (Chairman) T. Kuck and H. Miller. The study was jointly funded by the ten state wildlife agencies represented by the Central Flyway Council. Portions of this study were financed with Pittman-Robertson funds. The Wildlife Management Institute generously handled financial and accounting logistics. Field work was organized and conducted by the following: North Dakota Game and Fish Department, M. Johnson, D. Orthmeyer, J. Harber and D. Timpe; South Dakota Cooperative Wildlife Research Unit, R. Linder, E. Keyser, R. Libra, K. Shea, C. Olawsky, B. Wangler, M. Kintigh, D. Beck and H. Browers; Montana Cooperative Wildlife Research Unit, J. Ball, S. Sovey, R. Bennett and A. Hetrick. Carnivore track

searches were conducted by U.S. Fish and Wildlife Service Animal Damage Control field personnel in Montana and North Dakota and by Game, Fish and Parks Extension Trappers in South Dakota. NPWRC, Jamestown, NO, provided much assistance, direction and equipment. L. Cowardin demonstrated the need for this work to the Central Flyway Council and Technical Committee and with D. Johnson provided guidance in study design and implementation. T. Klett and R. Greenwood developed and provided the study manuals and data forms used in the nesting study. A. Sargeant designed, helped direct and provided data analysis of the predator surveys. NPWRC keypunched the data and T. Schaffer compiled and produced computer summaries. The Office of Migratory Bird Management (FWS) provided color infrared aerial photographs of the study transects and NPWRC made black and white enlargements for use as field maps. Private landowners in all three states generously allowed study teams access to their land. Many others also provided field assistance, equipment and help. We express our sincere appreciation to all who contributed to this study.
METHODS
Data were obtained on and near nine Fish & Wildlife Service air/ground comparison transects (Martinson and Kaczynski, 1967) located in North Dakota, South Dakota and Montana (fig.1). Transects were selected because of their proximity to areas with limited duck nest success data. Each transect study area was three miles wide and ranged from 12
Figure 1.--The Prairie Pothole Region of the United States and Canada with locations of 1983 air/ ground transect study areas and Mayfield mallard nest success estimates for South Dakota, North Dakota and Montana (this study) and Manitoba, Saskatchewan and Alberta (Greenwood 1987)5.
5Greenwood, R.J. 1987. Personal communication. Data on file Northern Prairie Wildlife Research Center, Jamestown, NO.
126
to 36 miles in length. Because the Morgan and Plentywood transects in Montana lie directly on the U.S. -Canadian border all work was conducted on the southern one-half of these transects.
Field crews were instructed to find as many duck nests as possible in each of seven basic habitat types (grassland, hayland, planted cover, cropland, rights-of-way, wetlands and odd areas) during each search of each transect. Habitat classifications follow those of Cowardin et al. (1985) except for planted cover, which we defined as idled stands of grass or grass/legume mixtures such as nesting cover provided on many state and federal wildlife areas (Ouebbert et al. 1981). Emphasis was placed on finding nests on private lands and habitats not specifically managed for wildlife. If specific habitat types were not present or landowner permission could not be obtained, searches were conducted on substitute areas nearby. Procedures for searches, marking nests, and determining the stage of incubation, species and nest fate followed those described by Higgins et al. (1977) and Klett et al. (1986). Odd areas such as rock piles, brush clumps or fence rows were searched on foot or (in North Dakota) with a boom-type drag mounted on an ATC.
Searches were conducted between the hours of 0600 and 1400 from May 2 through July 10. The date of first search on each transect was as follows: May 2 - Madison, Sharon, lsmay; May 9 - Hosmer, Streeter; May 16 - Parkston, Plaza; May 17 - Morgan; May 26 -Plentywood. Each transect was searched three times at approximately 21-day intervals. The Sharon transect was searched a fourth time in an attempt to find additional nests.
A nest was defined as a hollow scrape containing one or more eggs. Nest success was calculated using the Mayfield method (Klett et al. 1986) and a standard exposure period of 34 days for all species. A successful nest was one in which one or more eggs hatched. Unsuccessful nests were classified as destroyed due to predation, agricultural practices, weather or other factors or abandoned. Because of the difficulties in making a positive determination from remains at a nest, no attempt was made to identify the species of predator which destroyed a nest (Sargeant 1983)6. Nests not revisited to determine fate, abandoned due to investigator influence or damaged by search operations were not included in nest success calculations.
Predator species targeted for assessment on each transect were badger (Taxidea taxus), coyote (Canis latrans), Franklin•s ground squirrel (Spermoph~ frankl1nii), long-tailed weasel (Mustela frenata), raccoon (Procyon lotor), red fox (Vulpes vulpes), striped skunk (Mephitis mephitis), American crow (Corvus brachyrhynchos), and black-billed magpie (Plea pica). Surveys conducted were: 1) line transect counts of crows and magpies, 2) livetrapping of Franklin•s ground squirrels, 3) carnivore track
6op. cit.

counts, and 4) recording of predator sightings. All predator data (except predator sightings) were collected on a 10 mile long predator survey area that extended one-half mile on each side of the center transect road. This area included 40 quarter-section (160 acre) sample areas. Predator sighting data was collected wherever the crews were working on or near the air/ground transects.
Line transect counts of crows and magpies were made by driving the center transect road of the predator survey portion of each study transect on at least three days of each nest search period. Stops were made at the midpoint of each quarter section sample unit to count all crows and magpies seen within a 1/8 mile half-circle radius of the vehicle during a 1-minute period. Data for two adjoining quarter section sample units (one on each side of the road) were usually obtained at each vehicle stop point. In addition to these data, investigators recorded presence or absence of each species in each quarter section sampl~ unit as detected visually or by call, both while driving the transect road and while stopped. Most surveys were conducted during midday, after nest searching was completed, on days when weather conditions were favorable (conditions were specified).
livetrapping of Franklin•s ground squirrels was conducted in early July and consisted of setting four livetraps in each of five "best" sites with brushy or dense vegetation along each linear mile of the predator survey areas. Traps were baited with canned sardines. Trapping sites were no closer than 220 yds. from each other and traps at a site were no closer than 20 yds. from each other. Traps were set at one site along each linear mile in early morning and checked and moved to another site (at least 100 yards away) the next morning. Trapping was conducted on five consecutive days unless interrupted by bad weather in which case trapping resumed when suitable conditions returned. All ground squirrels caught were marked with dye (to determine if recaptures were made) and then released unharmed at the capture sites. livetrapping surveys were not accomplished on the Morgan and Ismay transects.
Carnivore track counts involved an individual searching for tracks of fox, coyote, skunk, badger and raccoon on each of the 40 quarter-section sample units where trespass was permitted on each predator survey area. One search was conducted on each of the air/ground transects as time permitted during mid-May to late June. The investigators were instructed to spend up to 0.5 hour on each quartersection sample unit examining "best" sites for tracks of each speciei. Investigators categorized abundance of tracks and recorded length of small and large canid tracks for reference in assessing canid track identification. Track survey data is expressed as the percent of quarter-section sample units on which tracks were observed.
Study personnel kept daily records of numbers of places on each transect where one or more individuals of specified predator species were seen. Observations made on all portions of the transects were included but most were from the 10 mi. long
127
predator survey areas, because investigators spent most time there. All personnel working with nest search crews were asked to independently supply this information everyday they worked on a transect and to record the amount of time spent on the area and their major work activity. A place where a predator was observed was defined as a 160-yd. diameter area (about 5 acres).
RESULTS
The number of acres of each habitat type searched during all searches are shown in table 1. Because some fields were only searched once, while others were searched up to four times, the number of acres searched represents the combined total of the acres searched during all searches.
A total of 678 nests of 10 duck species was found during the study (tables 1 and 2). Nests of bluewinged teal (Anas discors) were most frequently found (41 percent) followed by gadwall (A. strepera) (19 percent), mallard (15 percent) and Northern pintail (A. acuta) (13 percent). Northern shoveler (~ clypeata), lesser scaup (Aythya affinis), American wigeon (Anas americana), greenwinged teal (~ crecca), ruddy duck (Oxyura jamaicensis) and redhead (Aythya americana) comprised the remaining 15 percent of the nests found.
Thirty-eight percent of all nests were found in grassland habitats (49 percent of the acres searched) (table 1). Grassland habitats contained 57 percent of the nests in Montana (78 percent of the areas searched), 50 percent in South Dakota (43 percent of the acres searched) and 27 percent in North Dakota (25 percent of the acres searched). Planted cover which totaled only six percent of the acreage searched contained 21 percent of the nests. Although cropland comprised 20 percent of the acreage searched it contained only four percent of the nests found.
The distribution of nests among habitats by species is shown in table 2. Mallards nests were found most frequently in right-of-ways (29 percent), grassland (25 percent), and planted cover (23 percent). Most gadwall nests (41 percent) were found in planted cover. All other species (except redheads and ruddy ducks) were most common in grassland habitats. Pintails nested more frequently in cropland than any other species and less frequently in planted cover than the other dabblers.
Nest fate was determined for 625 of the 678 nests found (table 3). Overall, 72 percent of the nests did not hatch. The percent of successful nests was higher in Montana (45 percent) than in the Dakotas (24 percent each). Predation accounted for 90 percent of all unsuccessful nests with predators destroying 69 percent of the nests in each of the Dakotas and 49 percent in Montana. Predation rates were highest on the Madison transect in South Dakota (79 percent) and lowest on the Ismay transect in Montana (17 percent).

. -
Table 1.--Number of acres searched (A) and nests found (N) by habitat type during three nest searches! on air/ground transects in South Dakota, North Dakota and Montana, 1983.
State Planted Right-and Grassland Hal:land Cover Cro~land Other of-wat Wetland Total
A Transect A N N A N A N A N A N A N A N South Dakota Hosmer 1,359 2 486 2 0 0 537 1 95 0 288 3 84 0 2,849 8 Madison 555 38 160 8 267 18 270 1 30 0 148 7 143 6 1, 573 78 Parkston 870 41 470 11 0 0 241 3 16 5 278 12 184 4 2,059 76 Subtotal 2,784 81 I, 116 21 267 18 1,048 5 141 5 714 22 411 10 6,481 162 North Dakota Streeter 912 30 312 9 240 21 955 7 204 26 337 30 15 1 2,975 124 Sharon 879 4 300 2 559 17 1,350 4 166 8 575 19 223 2 4,052 56 Plaza 971 72 407 17 440 63 12 420 9 142 17 444 24 20 5 3,844 207 Subtotal 2,762 106 1,019 28 1,239 lOl 3, 725 20 512 51 1,356 73 258 8 10,871 387 Montana Ismay 1,979 10 312 1 0 0 0 0 15 1 33 0 113 2 2,452 14 Plentywood 1,176 46 771 4 235 26 442 4 9 4 42 4 21 6 2,696 94 Morgan 4,686 17 0 0 0 0 170 1 1 3 22 0 59 0 4,938 21 Subtotal 7,841 73 1,083 5 235 26 612 5 25 8 97 4 193 8 10,086 129 Total 13,387 260 3,218 54 1,741 145 5,385 30 678 64 2,167 99 862 26 27,438 678
1 Four searches were conducted on the Sharon transect.
Table 2.--Number of nests found by species and habitats on air/ground transects in South Dakota, North Dakota, and Montana, 1983.
Planted Grassland Hayl and Cover Cropland
S~ecies (13,387) (3!218) (1!741) (5,385) Mallard 25 9 23 3 Gadwall 32 11 52 1 Wigeon 8 0 3 0 G-w Teal 2 0 0 0 B-w Teal 119 22 46 7 Shoveler 24 3 11 0 Pintail 38 9 8 19 Redhead 0 0 0 0 L. Scaup 12 0 2 0 Ruddy 0 0 0 0 Total 260 54 145 30
Five percent of the nests were destroyed by agri-cultural operations, while abandonment, weather and other factors caused the loss of only 2 per-cent of the nests.
Mayfield nest success estimates were calculated from 654 nests of the 678 nests found. Nests for which fates were not known contributed daily survival rate data to the Mayfield nest success calculations (Klett et al. 1986).
The number of successful nests and Mayfield nest success estimates for all nests are shown for each habitat and transect in table 4. Average nest success of all ducks was 11.5 percent in North Dakota, 11.4 percent in South Dakota and 17.5 percent in Montana. Average nest success rates were highly variable between transects ranging from 14 (Hosmer) to 42 (Ismay) percent. Average nest success estimates were highest in hayland (22 percent) and planted cover (19 percent) and lowest in cropland (3 percent). Nest success in grassland was 13 percent.
128
Acres searched in ( ).
Right-Other of-way Wetland Total (678) (2,167) (862) (27,438)
5 29 5 99 11 19 3 129 1 0 0 12 1 0 0 3
33 42 9 278 7 2 1 48 4 7 1 86 1 0 0 1 1 0 4 19 0 0 3 3
64 99 26 678
Average nest success was highest in planted cover in North Dakota (19 percent) and in hayland in South Dakota (30 percent) and Montana (62 percent).
Nest success estimates by species and transect are presented in table 5. Mallards and pintails had the lowest nesting success (7 percent). Mallard nest success ranged from 3 percent on the Madison and Streeter transects to 26 percent on the Morgan transect. Pintail nest success ranged from zero (Hosmer) to 60 percent (Morgan). Blue-winged teal success averaged 13 percent ranging from 2 (Hosmer) to 100 percent (Ismay). Gadwall and wigeon had overall success rates of 22 and 25 percent, respectively. Mallard nest success averaged 4.7 percent in North Dakota, 5.4 percent in South Dakota and 18.9 percent in Montana.
Line transect surveys indicated that neither crows or magpies were common on the study transects. Although magpies were known to occur on some of the areas, none were tallied on any of the line transect

Table 3.--Fate of duck nests found on air/ground transects in South Dakota, North Dakota, and Montana, 1983. Percent of total shown in ( ).
State and Number Number Destro~ed Number Predator Agriculture Transect Successful Weather Other Abandoned Total
South Dakota Hosmer 1 5 1 0 0 1 8 Madison 15 61 0 1 0 0 77 Parkston 19 33 5 0 1 1 59 Subtotal 35 (24) 99 (69) 6 (4) 1 (tr) 1 (tr) 2 (1) 144 North Dakota Streeter 19 81 11 4 0 1 116 Sharon 10 39 5 0 0 0 54 Plaza 57 130 4 0 0 1 192 Subtotal 86 (24) 250 ( 69) 20 (6) 4 (!) 0 (-) 2 ( tr) 362 Montana Ismay 8 2 0 1 0 1 12 Plentywood 34 48 2 0 1 2 87 Morgan 11 8 1 0 0 0 20 Subtotal 53 (45) 58 (49) 3 ( 3) 1 (!) 1 (1) 3 (3) 119 Total 174 ( 28) 407 (65) 29 (5) 6 (tr) 2 (tr) 7 (1) 625
tr = <1%
Table 4.--Number of successful duck nests and Mayfield success! by habitat for air/ground transects in
nest
South Dakota, North Dakota, and Montana, 1983.
State and
Transect Grassland
N % Hayl and N %
Planted Cover N %
Cropland N %
Other N %
Rightof-way N %
Wetland N %
Total N %
South Dakota Hosmer Madison Parkston Subtotal North Dakota Streeter Sharon Plaza Subtotal Montana Ismay Plentywood Morgan Subtotal Total
0 <1 5 6
11 22 16 11
3 7 1 30
19 13 23 12
6 52 16 11 10 36 32 19 71 13
0 3 4 29 4 39 8 30
3 40 1 28 2 4 6 12
1 100 3 58
4 62 18 22
6 17
6 17
3 6 4 11
28 29 35 19
11 22
11 22 52 19
0 2 0 19 0 <1 0 2
1 5 0 6 0 2 1 3
1 <1 0 4 1 1 2 3
1 9 1 9
4 9 3 21 2 9 9 11
1 100 1 3 1 <1 3 4
13 10
1 15 0 <1 2 8 3 4
5 8 1 1 4 10
10 6
0 3
0 3 13 6
0 <1 1 46 1 5
0 2 0 1 2 26 2 10
0 3 2 26
2 16 5 10
1 4 15 7 19 19 35 11
19 9 10 8 57 15 86 12
8 42 34 14 11 24 52 17
174 12
1 Average Mayfield nest success estimates for habitats and transects is weighted by exposure period and daily mortality rate.
.,.
surveys. Crows were detected on seven of the nine study areas but were not abundant anywhere (table 6). No crows were found on the Plaza or Ismay transects. Madison had the highest occurrence rate with crows being detected on an average of only 1.1 percent of the sample plots and on an average of 2.2 percent of the quarter sectioR sample units.
Traps for Franklin's ground squirrels were set during a total of 1394 24-hour trap periods on seven transects. The number of trap-days on each transect were as follows: Hosmer-199, Madison-200, Parkston-200, Plaza-200, Sharon-200, Streeter-199 and Plentywood-196. A total of five Franklin's ground
129
squirrels were captured; one on the Sharon transect and four on the Streeter transect. No animals were captured more than once.
Tracks of five carnivores were found on all transects surveyed except in two cases (table 7). Coyote tracks were not found on the Sharon transect in eastern North Dakota and raccoon tracks were not found on the Morgan transect in north-central Montana. Red fox tracks were found on more than 40 percent of the sample units on all transects except Morgan (17 percent). Red fox tracks were found most frequently on transects in North Dakota. Badger tracks were present on all transects and were more frequent on the Streeter

Table 5.--Number of ducks nests found (N), number of successful nests (S) and Mayfield nest success (%)1 on air/ground transects in South Dakota, North Dakota, and Montana, 1983.
South Dakota North Dakota ~ntana Plenty- All
Hosmer Madison Parkston Streeter Sharon Plaza Isma:t Wood ~r~an% Transects S~cies ~ FJ !) !: FJ s !: FJ !) !: FJ s !ll ~ FJ !) !Ill frS% FJ s %
Mallard 5 1 12 15 1 3 6 0 12 21 2 3 4 0 4 29 5 6 3 1 16 14 7 18 2 1 26 99 18 7
Gadwall 0 2 2 100 3 1 24 22 5 18 6 1 6 66 23 24 1 0 3 25 10 24 4 2 37 128 44 22
Wigeon 0 0 0 - 0 - 0 - 4 1 14 4 2 100 2 1 10 2 1 30 12 5 26
G-W Teal 0 1 0 0 0 - 0 - 1 1 100 1 0 0 0 0 0 0 3 1 33
B-W Teal 1 0 2 53 12 10 53 15 22 59 10 10 42 8 8 52 15 15 4 4 100 14 5 14 0 - - 278 69 13
Shoveler 0 2 0 0 1 0 4 9 0 2 2 0 0 22 6 17 0 - 10 3 10 2 0 2 48 9 8
Pintail 2 0 0 5 0 4 10 2 2 13 2 9 1 0 3 24 4 6 2 1 17 21 8 5 8 6 60 86 23 7
Redhead 0 0 - 0 - 0 - 0 - 0 0 0 1 0 0 1 0 0
L. Scaup 0 0 - 0 - 0 - 0 - 9 3 14 0 8 5 2 1 4 19 4 9
Rudd:t 0 0 - 3 - 100 0 - 0 - 0 0 0 0 3 1 100
Total 8 1 4 78 15 7 76 19 19 124 19 9 56 10 8 207 57 15 14 8 42 94 34 14 21 ll 24 678 174 12
1 Average Mayfield nest success estimates for transects and species is weighted by exposure period and daily mortality rate.
Table 6.--Average percentage of 1/8 mile radius half-circle sample plots and 160 acre sample units on which crows were detected during line transect counts along a 10 mi predator survey route on air/ground study transects in South Dakota, North Dakota and Montana, 1983.
State No. and Surveys
Transect Conducted South Dakota Hosmer 6 Madison 9 Parkston 9 North Dakota Streeter 9 Sharon 9 Plaza 9 Montana Ismay 7 Plentywood 9 Morgan 9
% Plots With Crows
0.0 1.1 0.8
0.3 0.3 0.0
0.0 1.1 0.0
% 160A Sample Units With Crows
0.8 2.2 1.7
0.3 0.6 0.0
0.0 1.1 0.3
(82 percent) and Plentywood (74 percent) transects. Coyote tracks were uncommon except on Streeter (47 percent) and Plentywood (42 percent). Raccoon tracks were common on all transects in the Dakotas (found on 35 to 79 percent of the sample units) but in Montana raccoons occurred only on the Plentywood (16 percent) transect. Striped skunk were also common, with tracks occurring on 36 to 95 percent of all sample units except for the Madison transect (5 percent).
130
Table 7. Percentage of !-section sample units on each 10 mi transect where tracks of specified carnivores were found during a single search conducted during May or June in South Dakota, North Dakota and Montana, 1983
State No.Sample and Units
Transect Searched South Dakota Hosmer 40 Madison 40 Parkston 34 North Dakota Streeter 40 Sharon 40 Plaza 39 Montana Morgan 36 Plentywood 19 Ismay
Red Strpd. Badger Coyote Raccoon Fox Skunk
17 22 50
82 17 18
53 74
7 2 9
47 0 5
14 42
35 67 79
65 40 55
0 16
42 45 59
57 88 69
17 58
44 5
47
42 70 36
69 95
Data on the occurrence of long-tailed weasels and additional data on Franklin•s ground squirrels and magpies were obtained from observation of these species during 2993 investigator hours during 581 investigator days. The results are expressed as an observation rate (the average number of places per day per investigator hour where field personnel saw individuals of each species) (table 8). Franklin•s ground squirrels were observed on the Parkston,
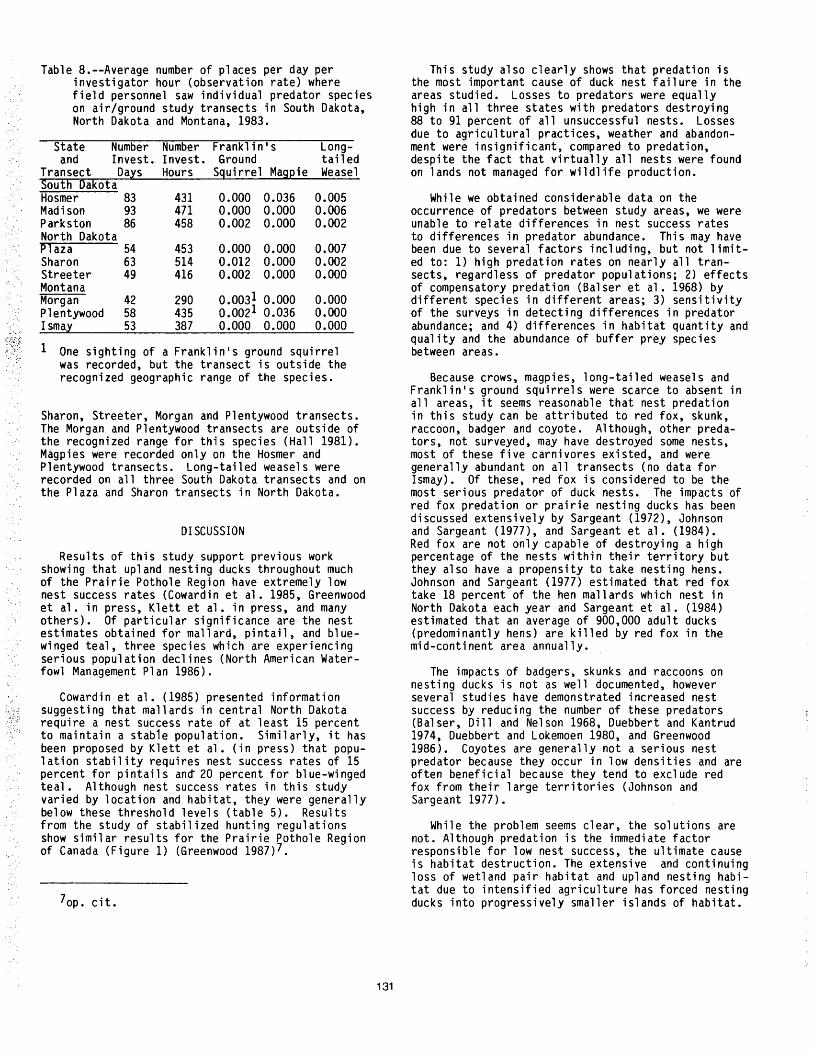
Table B.--Average number of places per day per investigator hour (observation rate) where field personnel saw individual predator species on air/ground study transects in South Dakota, North Dakota and Montana, 1983.
State Number Number Franklin•s Long-and Invest. Invest. Ground tailed
Transect Days Hours Squirrel Magpie Weasel South Dakota Hosmer 83 431 0.000 0.036 0.005 Madison 93 471 0.000 0.000 0.006 Parkston 86 458 0.002 0.000 0.002 North Dakota Plaza 54 453 0.000 0.000 0.007 Sharon 63 514 0.012 0.000 0.002 Streeter 49 416 0.002 0.000 0.000 Montana
0.0031 0.000 Morgan 42 290 0.000 Plentywood 58 435 0.0021 0.036 0.000 Ismat 53 387 0.000 0.000 0.000
1 One sighting of a Franklin•s ground squirrel was recorded, but the transect is outside the recognized geographic range of the species.
Sharon, Streeter, Morgan and Plentywood transects. The Morgan and Plentywood transects are outside of the recognized range for this species (Hall 1981). Magpies were recorded only on the Hosmer and Plentywood transects. Long-tailed weasels were recorded on all three South Dakota transects and on the Plaza and Sharon transects in North Dakota.
DISCUSSION
Results of this study support previous work showing that upland nesting ducks throughout much of the Prairie Pothole Region have extremely low nest success rates (Cowardin et al. 1985, Greenwood et al. in press, Klett et al. in press, and many others). Of particular significance are the nest estimates obtained for mallard, pintail, and bluewinged teal, three species which are experiencing serious population declines (North American Waterfowl Management Plan 1986).
Cowardin et al. (1985) presented information suggesting that mallards in central North Dakota require a nest success rate of at least 15 percent to maintain a stab1e population. Similarly, it has been proposed by Klett et al. (in press) that population stability requires nest success rates of 15 percent for pintails an~ 20 percent for blue-winged teal. Although nest success rates in this study varied by location and habitat, they were generally below these threshold levels (table 5). Results from the study of stabilized hunting regulations show similar results for the Prairie Pothole Region of Canada (Figure 1) (Greenwood 1987)7.
lop. cit.
This study also clearly shows that predation is the most important cause of duck nest failure in the areas studied. Losses to predators were equally high in all three states with predators destroying 88 to 91 percent of all unsuccessful nests. Losses due to agricultural practices, weather and abandonment were insignificant, compared to predation, despite the fact that virtually all nests were found on lands not managed for wildlife production.
While we obtained considerable data on the occurrence of predators between study areas, we were unable to relate differences in nest success rates to differences in predator abundance. This may have been due to several factors including, but not limited to: 1) high predation rates on nearly all transects, regardless of predator populations; 2) effects of compensatory predation (Balser et al. 1968) by different species in different areas; 3) sensitivity of the surveys in detecting differences in predator abundance; and 4) differences in habitat quantity and quality and the abundance of buffer prey species between areas.
Because crows, magpies, long-tailed weasels and Franklin•s ground squirrels were scarce to absent in all areas, it seems reasonable that nest predation in this study can be attributed to red fox, skunk, raccoon, badger and coyote. Although, other predators, not surveyed, may have destroyed some nests, most of these five carnivores existed, and were generally abundant on all transects (no data for Ismay). Of these, red fox is considered to be the most serious predator of duck nests. The impacts of red fox predation or prairie nesting ducks has been discussed extensively by Sargeant (1972), Johnson and Sargeant (1977), and Sargeant et al. (1984). Red fox are not only capable of destroying a high percentage of the nests within their territory but they also have a propensity to take nesting hens. Johnson and Sargeant (1977) estimated that red fox take 18 percent of the hen mallards which nest in North Dakota each year and Sargeant et al. (1984) estimated that an average of 900,000 adult ducks (predominantly hens) are killed by red fox in the mid-continent area annually.
The impacts of badgers, skunks and raccoons on nesting ducks is not as well documented, however several studies have demonstrated increased nest success by reducing the number of these predators (Balser, Dill and Nelson 1968, Duebbert and Kantrud 1974, Duebbert and Lokemoen 1980, and Greenwood 1986). Coyotes are generally not a serious nest predator because they occur in low densities and are often beneficial because they tend to exclude red fox from their large territories (Johnson and Sargeant 1977).
While the problem seems clear, the solutions are not. Although predation is the immediate factor responsible for low nest success, the ultimate cause is habitat destruction. The extensive and continuing loss of wetland pair habitat and upland nesting habitat due to intensified agriculture has forced nesting ducks into progressively smaller islands of habitat.

~ . •,
These same islands of cover are also prime areas of predator use (Cowardin, Sargeant and Duebbert 1983) Potentials for dealing with high predation rates on public lands managed for waterfowl production have been discussed by Sargeant and Arnold (1984). However, a relatively small percentage of the total waterfowl population in the Prairie Pothole Region currently nests on these managed areas. While it is important to make dedicated wildlife areas produce to their fullest potential (Duebbert and Lokemoen 1980), it can also be a very costly proposition to do so (Lokemoen 1984). It seems reasonable to direct additional work at improving duck nest success on the private lands where a large percentage of ducks nest (Hochbaum and Bossenmaier 1965 and Cowardin and Johnson 19838) and to continue to work diligently at maintaining waterfowl habitat on both public and private lands.
Some waterfowl biologists argue that once a series of good water years returns to the prairies, ducks will flourish. Unfortunately, good water conditions will attract ducks to many areas of the Prairie Pothole Region where they cannot successfully reproduce because of lack of secure nesting cover and high predation rates (Cowardin et al. 1985). Others believe that restrictive hunting regulations will improve the status of ducks. While harvest strategies which increase the survival of hens can be beneficial, regulations which simply reduce hunting opportunity and the harvest of drakes do not effectively address the problem facing prairie nesting ducks. In our opinion, the continuing trend of decreasing habitat and the increasing tmpacts of predators will override any potential long term benefits which can be derived from 1mproved water conditions and reduced hunting mortality.
We agree with Sargeant et al. (1984) that in the immediate future, managers seem to have two broad choices, either coping with or reducing high levels of predation. Predator reduction can take several forms: direct control such as trapping, poisoning {currently not permitted) and shooting or indirect control such as more liberal hunting and trapping seasons, altering predator habitats and encouraging alternative competitive species {e.g. coyotes vs. red fox). Regulations which currently protect red fox and encourage the taking of coyotes in North Dakota and South Dakota are detrimental to prairie nesting ducks. These options all have considerable biological, social, economic and moral implications.
Coping with high predation rates entails relatively expensive management options such as electric fences, islands and nest structures (Lokemoen 1984). If the current decline in duck numbers is to be resolved, managers in each area of the prairie pothole region will need to carefully evaluate their local situations and employ management activities which are most efficient in improving production. For example, in areas with low predation rates, production can be improved simply by attracting addi-
Bop. cit.
132
tional breeding pairs and providing attractive nesting cover. In areas with high predation rates, managers will need to improve nest success by intensive control of predators or by separating nesting ducks from predators-using a variety of techniques.
The NPWRC mallard recuritment model will be a valuable tool in making these management decisions. The data collected in this study is now incorporated into the model and has improved its accuracy in predicting the impacts of various management options. The Central Flyway Council has used the model for this purpose (Cowardin et al. 19849) and has incorporated the results into a Central Flyway Mallard Management Plan which provides a set of guidelines designed to maintain a huntable supply of mallards. Other agencies will need to undertake a similar approach if they are to make informed decisions regarding management and preservation of prairie nesting ducks.
LITERATURE CITED
Balser, D.S., H.H. Dill, and H.K. Nelson. 1968. Effect of predator reduction on waterfowl nesting success. J. Wildl. Manage. 32:699-682.
Cowardin, L.M., D.S. Gilmer, and C.W. Shaiffer. 1985. Mallard recruitment in the agricultural environment of North Dakota. Wildl. Monogr. 92. 37 pp.
Cowardin, L.M., and D.H. Johnson. 1979. Mathematics and mallard management. J. Wildl. Manage. 43(1):18-35.
Cowardin, L.M., D.H. Johnson, A.M. Frank, and A.T. Klett. 1983. Simulating results of management actions on mallard production. Trans. North Am. Wildl. Nat. Resour. Conf. 48:257-271.
Cowardin, L.M., A.B. Sargeant, and H.F. Duebbert. 1983. Problems and potentials for prairie ducks. Naturalist 34(4):4-11.
Duebbert, H.F., E.T. Jacobson, K.F. Higgins, and E.B. Podoll. 1981. Establishment of seeded grasslands for wildlife habitat in the prairie pothole region. U.S. Fish and Wildl. Serv. Sci. Rep. 234. 21 pp.
Duebbert, H.F., and H.A. Kantrud. 1974. Upland duck nesting related to land use and predator reduction. J. Wildl. Manage. 38:257-265.
Duebbert, H.F., and J.T. Lokemoen. 1980. High duck nest success in a predator reduced environment. J. Wildl. Manage. 44:428-437.
Greenwood, R.J. 1986. Influence of striped skunk removal on upland duck nest success in North Dakota. Wildl. Soc. Bull. 14:6-11.
Greenwood, R.J., A.B. Sargeant, D.H. Johnson, L.M. Cowardin, and T.L. Shaffer. In press. Mallard nest success and recruitment in prairie Canada. Trans. N. Am. Wildl. Conf. 52:
9op. cit.

Hall, E.R. 1981. The mammals of North America. John Wiley and Sons, New York, NY. 2 vols. 1271 pp.
Higgins, H.F., L.M. Kirsch, H.F. Duebbert, A.T. Klett, J.T. Lokemoen, H.W. Miller, and A.D. Kruse. 1977. Construction and operation of cable-chain drag for nest searches. U.S. Fish and Wil dl • Serv., Wi 1 dl . Leafl • 512. 14 pp.
Hochbaum, H.A., and E.F. Bossenmaier. 1965. Waterfowl research-accomplishment, needs objectives. Trans. N. Am. Wildl. Nat. Resour. Conf. 30:222-229.
Johnson, D.H., and A.B. Sargeant. 1977. Impact of red fox predation on the sex ratio of prairie mallards. U.S. Fish and Wildl. Serv. Wildl. Res. Rep. 6. 56 pp.
Johnson, D.H., L.M. Cowardin, and D.W. Sparling. 1986. Evaluation of a mallard productivity model. pp. 23-29 in J. Verna, M.L. Morrison and C.J. Ralph ed:-Wildlife 2000. Modeling habitat relationships of terrestrial vertebrates. The University of Wisconsin Press, Madison, Wi.
Klett, A.T., H.E. Duebbert, C.A. Faanes, and H.F. Higgins. 1986. Techniques for studying nest success of ducks in upland habitats in the Prairie Pothole Region. U.S. Fish & Wildl. Serv. Resour. Publ. 158. 24 pp.
133
Klett, A.T., T.L. Shaffer, and D.H. Johnson. In press. Duck nest success in the Prairie Pothole Region of the United States. Jour. Wil dl • Manage.
Lokemoen, J.T. 1984. Examining economic efficiency of management practices that enhance waterfowl production. Trans. North Am. Wildl. Nat. Resour. Conf. 49:584-607.
Lokemoen, J.T., H.A. Doty, D.E. Sharp, and J.E. Neaville. 1982. Electric fences to reduce mammalian predation on waterfowl nests. Wildl. Soc. Bull. 10:318-323.
Martinson, R.K., and C.F. Kaczynski. 1967. Factors influencing waterfowl counts on aerial surveys, 1961-66. Spec i a 1 Sci. Rept. Wil dl • No. 105. U.S. Fish and Wildl. Serv. 78 pp.
North American Waterfowl Management Plan. 1986. U.S. Fish and Wildlife Serv. Washington, D.C. 33 pp.
Sargeant, A.B., and P.M. Arnold. 1984. Predator management for ducks on waterfowl production areas in the Northern Plains. Proc. Vertebr. Pest Conf. 11:161-167.
Sargeant, A.B., S.H. Allen, and R.T. Eberhardt. 1984. Red fox predation on breeding ducks in midcontinent North America. Wildl. Monogr. 89. 41 pp.

Predator Management To Increase Duck Nest Success1
2 3 Harold A. Doty and Anthony J. Rondeau
Abstract.--Operational programs of seasonal predator management to increase duck production may be economically feasible. Mammalian predators of nesting ducks and their eggs were reduced in numbers on selected areas of west central Minnesota during the nesting seasons 1982-86. Where predators were removed, nest success averaged 30% while nest success on nearby untreated habitat was 10%.
INTRODUCTION
Nesting failures by wild ducks in the midcontinental prairie wetland region are mainly the result of mammalian predation on eggs and nesting females. The separation of predators from duck nest habitats via natural barriers has resulted in higher reproduction by upland nesting ducks (Duebbert et al. 1983). The simulation of reduced predation conditions to increase waterfowl production on areas of treatment have been attempted over time in several locations through various mechanical procedures and techniques.
The Mid-Continent Waterfowl Management Project (MCWMP) of the U.S. Fish and Wildlife Service (FWS) initiated a pilot predator management operation in 1982 in three western Minnesota counties in an effort to increase duck nest success without cover management changes. In this project we tried to increase duck nest success on trial areas or zones through prescribed methods of predator removal during a series of nesting seasons.
Wildlife managers and administrators are often confronted with questions of cost-benefit ratios. We have addressed this aspect of a seasonal predator management program. The operational expenditures of this trial effort were documented and were linked to data from previously reported investigations along with our findings. ·This resulted in our estimated
1Paper presented at eighth Great Plains wildlife damage control workshop (Rapid City, S.D. ~pril 27-30, 1987).
Harold A. Doty is a Wildlife Biologist, U.S. Fish and Wildlife Service, Fergus Falls, Minn.
3 Anthony J. Rondeau is a Biological Technician, U.S. Fish and Wildlife Service, Fergus Falls, Minn.
134
cost of new ducks (recruits) that we believe were produced. The projections are necessarily subject to change as additional data are compiled and examined. In the interim, they offer a point of reference.
INFORMATION REVIEW
The manipulation of upland vegetation has not provided consistent protection of duck nests from terrestrial predators. Cowardin and Johnson (1979) concluded that predator reductions (in waterfowl nesting habitats) combined with cover management are more effective for increasing recruitment than cover management alone. Idle seeded grasslands on most FWS Waterfowl Production Areas (WPAs) provide nest cover that is attractive to ducks. They also provide habitat conditions which favor relatively high populations of Franklin's ground squirrels (Spermophilus franklinii) locally. This species was identified as a nest predator by Sowls (1948) but has not often been recognized as an especially important threat to duck nests. More recently it was found that inside electric barrier fences designed primarily to exclude larger mammalian predators, the depredation of duck nests by Franklin's ground squirrels could rise to damaging levels (Lokemoen et al. 1982). During a study of Franklin's ground squirrels in North Dakota, Choromanski and Sargeant (1982) found that about 50 adults inhabited 286 acres of dense nest cover on a WPA. They concluded that substantial losses of duck production could be inflicted as the ground squirrels made extensive movements through the dense cover.
In eastern North Dakota and western Minnesota the list of mammalian predators of ducks and their eggs is long. In addition to Franklin's ground squirrels the list includes badgers (Taxidea taxus) (Duebbert 1969), mink (Mustela vison) (Eberhardt 1973 and Sargeant et al. 1973)

raccoons (Procyon lotor) (Greenwood 1982), striped skunks (Mephitis mephitis) (Greenwood 1986), and red fox (Vulpes vulpes) (Johnson, D. H. and A. B. Sargeant 1977). The latter investigators determined that 18% of female mallards (Anas platyrhychos) are killed annually in North Dakota by red foxes, generally while the ducks are attending nests on upland sites. When Sargeant et al. (1984) conducted an extensive study of red fox predation on breeding ducks they found that the average fox family used 3.8 rearing dens during the denning season. Among 1,432 rearing dens they examined, the single den with the remains of the most individual ducks (n=67) was discovered in June, 1970 on the J. Clark Salyer National Wildlife Refuge (NWR), North Dakota. That refuge was formerly named the Lower Souris Refuge where E. R. Kalmbach identified red fox as a predator of ducks. In a very prophetic observation Kalmbach (1938) noted that red fox appeared in 1937 as a predator on the refuge and warned that it would become a factor of concern if its numbers increased.
Concern for the security of duck nests from depredation led to the initiation of a field study in 1934 (Kalmbach 1937) by the U.S. Biological Survey, predecessor of the FWS. He reported that egg destruction by crows (Corvus brachyrhynchos) occurred in 31% of duck nests found during 1934-35 in Saskatchewan and Alberta, respectively. In 1936 Kalmbach (1938) found that 30% of duck nests on Lower Souris Refuge were destroyed by skunks but less than 2% were damaged by crows, which were not numerous in that relatively treeless area. The overall rate of observed duck nest success was 54%. He also noted that in the winter of 1936-37, 423 skunks were trapped and removed to determine if that action would influence duck production. During the 1937 nesting season where the skunk removal had taken place only 7% of discovered duck nests (n=566) were destroyed by skunks and the observed nest success increased to 69%.
Another effort to influence duck nest success, more than 20 years after the Lower Souris Refuge study, was conducted during 1959-64 on the Agassiz NWR in northwest Minnesota (Balser et al. 1968). At Agessiz NWR duck nest success doubled and duckling production increased 60% on the predator reduction treatment areas. To reach the desired level of predator reduction, strychnine eggs, livetraps, steel traps, and Conibear traps were used.
The Minnesota Department of Natural Resources investigated the effect of predator removal on ring-necked pheasants (Phasianus colchicus) reproductive success on an area in southern Minnesota during 1960-62 (Chesness et al. 1968). Predators were removed from the area with livetraps, steel traps, shooting, and by den treatment with poison-gas cartridges. They found that intensified predator removal increased nest success on the trapped area
135
during each successive year while nest success on the untrapped area remained low. That study demonstrated that predation was an important factor limiting pheasant nest success and production. They recommended that predator removal continue throughout the pheasant nesting season where predators were numerous.
In 1967-71 the South Dakota Department of Game, Fish and Parks conducted a program of predator reduction (Trautman et al. 1973). During that program, Duebbert and Kantrud (1974) observed duck nesting near Hosmer, South Dakota, and found that duckling production was over four times greater in the area where predators were removed than where they were not (22.0 vs. 4.8 ducklings/hectare). Eighty-five percent of the predator removal effectiveness was attributed to poisoning, 10% to trapping, and 5% to shooting. Mallard pairs on the area near Hosmer increased sixfold from 7 to 43 pairs/mi 2 during 1970-72 when predator reduction was most effective (Duebbert and Lokemoen 1980).
Sargeant et al. (1984) reported that an effective program to reduce predation on nesting waterfowl would have to include reduction of red fox populations. Regarding the relatively high numbers of red fox in the eastern prairie wetland region, they felt that the demise of coyote (Canis latrans) populations had permitted expansion of red fox populations. Current knowledge of the impact that coyotes have on nesting ducks is limited, but recent evidence indicates that coyotes have less impact on upland nesting ducks than red foxes (A. B. Sargeant and S. H. Allen, unpubl. data).
Red fox densities may be suppressed, eliminated, or excluded in much of the western United States where coyotes dominate. In some locations where coyotes are especially abundant they, too, can cause a substantial reduction in duck nest success. A predator reduction program was directed at coyotes (taken mainly by aerial gunning), raccoons, and ravens (Corvus corax) on a segment of the Malheur NWR, Oregon in 1986 (David G. Paullin, personal communication, 1-15-87). The purpose of that activity was to enhance the production of greater sandhill cranes (Grus canadensis) by reducing predation losses but it also increased duck nest success. Apparent nest success on the predator reduction area was 82% for dabbling ducks and 100% for diving ducks while the comparative rates from areas of the refuge without predator reduction were 25% and 67%, respectively.
Another program pertaining to predator removal took place in Alaska during the spring of 1986. A nesting colony of Pacific black brant (Branta nigricans) near the Tutakoke River suffered disasterous nest losses in 1984 and 1985 when nest success was about 3% and 6%,

respectively. With the removal of Arctic fox (Alopex lagopus) during the spring and summer of 1986, brant nest success rose to 83% (Anthony and Sedinger 1987).
Implications
The preceding review along with a host of unpublished data could provide waterfowl production managers with sufficient evidence to proceed with organized programs of predator management. Extremely large numbers of wild ducks can, under proper man-made or natural conditions, be supported on relatively small units of habitat with intensive management. In the absence of nest destruction by predators, small tracts of attractive nest cover can yield several thousand ducklings per acre (Duebbert et al. 1983). While it may be unrealistic to strive for that level of success on intensively
.. ~ ..
0 1 2 3
Miles
~- Waterfowl Production Areas
:-·-·-·-·-·-·-·-·-·-·-·· r·J OTTERTAIL CO.
i i i i i i Fergus Falls
[---~---·-·-l.~~~~~~.J. -~~~~~!~-~~:_.
·.
N
t Seasonal
Predator Management Units
Solberg .. I
Figure 1.--Field activity areas.
136
managed habitats, it does illustrate that the upper limits of duck production are sufficiently high to justify relatively large expenditures.
THE AREA AND PROCEDURES USED
Seasonal predator management was conducted annually in April through June, 1982-86. Predator removal by trapping took place on three similar sized units of land, identified as Mineral, Pomme de Terre, and Solberg (fig. 1). These areas were in Otter Tail, Grant, and Douglas counties, Minnesota. They are on the eastern fringe of the prairie pothole region (Stewart and Kantrud 1973) and just east of the Agassiz Lake plain.
Trapping was done in close proximity to roads which bound nearly all sections of land. Major private land (about 90% of the area) usage was for cash crops, mainly corn, soybeans, oats, barley, wheat, and buckwheat. The presence of pasture and hayland was uncommon. ~TAs
constituted about 6% of the 142-square-mile area in the predator management units. Within the three units, there were about 121-square-miles of uplands which could be used by terrestrial predators and concurrently provide nest sites for dabbling ducks. About 3.6% of the uplands were situated on WPAs where the predominant condition was idle grassland.
In 1982 and 1983 livetraps were used exclusively to remove striped skunks and Franklin's ground squirrels. In the initial year, trapping took place only on the public and private lands in the Mineral unit. Predator reduction on privately-owned lands was conducted with the permission of landowners and was restricted to removals of striped skunks and Franklin's ground squirrels throughout the 1982-86 period. In 1983 the Pomme de Terre unit was added. In 1984 the Solberg unit was included along with procedures for the removal of additional species of predators. On all WPAs mechanical traps and wire snares were used to take red fox and raccoons; incidental captures of badgers and mink also occurred. On one WPA, strychnine-treated milo seed was used in ground squirrel burrows. Numbers of animals taken were recorded except for undiscovered Franklin's ground squirrels which consumed treated milo in their burrows. During 1985 and 1986 the program was continued as in 1984 except that treated milo and snares were not used. Shooting was rarely used to take predators and that action was confined to WPA lands. Dispatched animals were either shot or injected with a euthanasic drug and were disposed of daily in sanitary landfills. Road-killed predators were also noted and included in the records of known removals.

Table 1.--Areas of treatment and numbers of predators removed.
Sg,uare miles Individuals(n) removed Franklin Red
3 Area 1 2 Striped ground fox
Year treated UEland Other skunk sguirrel adult Raccoon 1982 47 36
_1_1_ 79 27 -0- 0
1983 92 76 16 157 69 0 0 1984 142 121 21 270 53 22 61 1985 142 121 21 263 60 15 40 1986 142 121 21 266 118 27 53 Total 565 475 90 1035 327 64 154
1 2
Estimated to be springtime habitat for skunks, fox, and raccoons.
3 Includes areas of deep marsh, lake, river, roads, and residential. 37 pups were transported and released alive on public lands at a distance
and additionally 28 pups were dispatched near dens. Note - 5 mink and 15 badgers removed during the period.
Seasonal predator management was conducted in a manner that would approximate an operational program. Young persons with wildlife profession backgrounds were hired for 3-month periods annually and learned trapping techniques and routines through on-the-job training. Field operations required the equivalent of 3-person months in 1982, 6 in 1983, and 12 per season during 1984-86.
Annually (1979-82) during early May, surveys were conducted to record indicated pairs of breeding ducks in the tri-county area (fig. 1). Blue-winged teal (Anas discors), mallards, gadwalls (!. strepe~ Northern pintails, (A. acuta), Northern shovelers (A. clyEeata), and green-winged teal (!. crecca) were found to be the most common species of upland nesting dabbling ducks on the areas where predator management was conducted. Systematic nest searching with motor vehicles and chain drags (Klett et al. 1986) was done each year, 1979-86, mainly in the idle grassland fields on WPAs. Nest success was calculated via the Mayfield method (Miller and Johnson 1978).
Predator Population Reduction
About 80% of all striped skunk captures occurred by mid-May each year. The overall average annual take was slightly above 2 animals/mi2 of habitable uplands (table 1). That density of striped skunks was very comparable to the population reported by Greenwood et al. (1985) on a study area in southeast North Dakota. The capture and removal of Franklin's ground squirrels, raccoons, and especially red fox was very likely much less effective or complete than
137
appeared to be the case with striped skunks. A trap density of about 2 livetraps/mi 2 may have been insufficient to significantly reduce Franklin's ground squirrel numbers. The procedure of containing our trapping of raccoons and red fox on WPA uplands probably reduced our effectiveness in reducing their numbers throughout the treated units. Raccoons were taken as easily with livetraps as with steel traps. The number captured and released unharmed on private lands (n=255) during 1982-86 exceeded the number (n=l54) taken on WPAs (table 1). Red fox adults were not known to enter livetraps and the tracks of surviving animals were present at all times on each of the three units.
The predator removal procedures used during this seasonal predator management trial were labor intensive and 78% of the $229/mi2 annual expenditures were attributed to labor (table 2). Methods to reduce the cost of operation during the 1984-86 period would only have been possible by reducing labor costs or by holding those costs constant while increasing the area of treatment. The cost of striped skunk and Franklin's ground squirrel removal only during 1982-83 was only a few dollars less/mi2 than the total cost of the expanded seasonal predator management routine used in the 1984-86 period.
Table 2.--0perational trial expenses, 1984-86.
Item Labor and administration Vehicles, fuel, and upkeep Durable equipment Expendable supplies
Total
Average annual costs/mi2
$178 30
5 16
$229

Duck Nest Success
The composition by species of discovered nests was 74% blue-winged teal, 17% mallards, 4% gadwalls, 3% Northern shovelers, 2% Northern pintails, and a trace of green-winged teal. This was similar to the species composition as determined during the surveys of indicated breeding pairs. On non-treated WPA grassland our measure of nest success for 361 nests was 10% with minor variations during 1980-86 (table 3). For mallards this would represent about 22% hen success when estimates of renesting are considered (Cowardin and Johnson 1979). With the reduction of skunks and ground squirrels in 1982-83 our records of duck nests (n=S7) indicated 21% nest success. When predator management procedures were intensified during 1984-86, nest success was 33% among 487 nests.
We took liberty with some parts of our data and borrowed from others in estimating duck production. We made some assumptions: (1) the dabbling duck population on treated and non-treated areas in the prairie habitat zone was 40 pairs/mi2 as found during our breeding pair surveys, (2) our observation of 8.8 eggs hatched per successful nest was representative, (3) the 54% duck survival rate used by Lokemoen (1984) was applicable to this area, and (4) mallard hen success as described by Cowardin and Johnson (1979) was used in our treatment of mixed dabbler nest data (table 4). By this process we would predict an increase in new recruits (increase in fledged ducks) through seasonal predator management. Some increases in nest success (table 3) and estimated production (table 4) were noted during the 1982-83 period but substantial additional increases were recorded in the 1984-86 period. In this latter period red fox, raccoons, badgers, and mink were added to the list of predators to remove from WPAs and that change probably accounted for the increased nest
Table 3.--Duck nest success with and without seasonal predator removal in WPA grassland nest cover, 1980-86.
Nest Daily Percent nest Nests exposure survival success
Treatment _1&.. dal:s rate mean 95% CL No predator removal 1980-86 361 3810 0.9320 10 7-13
Action /Ill 57 664 0.9533 21 12-36
Action 112 2 487 6652 0.9669 33 28-38
1 Striped skunk and Franklin's ground squirrel removal on public and private land in 1982-~3.
Same as previous action plus added removal on FWS lands of red fox, raccoons, and incidental badgers and mink.
138
success. Our highest estimated annual number of ducks fledged/mi 2 (n=95) (table 4) was 52 more than our estimate for the 1980-86 period (n=43) where no predator management was used. With an annual/mi 2 expenditure of $229 (table 2), the cost-benefit ratio for this specific form of predator management could be expressed as $4.40 for each new recruit. This does not, of course, include the costs of land acquisition and management.
Table 4.--Estimates of production from dabbling duck nesting data.
Production estimates Eer mi 2 /l:ear
Treatment 1 Rate of Clutches of Fledged
hen success e~ss hatched ducks No predator removal 1980-86 .22 9 43
Action Ill .39 16 76
Action lf2 .so 20 95
1Treatments were the same as described in table 3.
CONCLUSION
Our goal to increase the rate of duck nest success by reducing nest losses to predators was achieved in spite of some procedural shortcomings. It can be surmised that several other species of wildlife were concurrently benefitted during their reproductive periods. Added benefits to other game and nongame wildlife reproduction, and consequential sport hunting or nonconsumptive uses can often be equated to economic benefits for resource agencies and user groups. The effectiveness of future programs to reduce mammalian predators of upland nests and birds during springtime might become more efficient over time. Additional procedures and experience gained could also increase outputs while limiting program costs.
ACKNOWLEDGMENTS
Field assistance was provided by F. L. Bengston, E. C. Cleary, T. S. Collins, E. G. Dornfeld, A. W. Drechsel, M. J. Gleason, J. P. Hanson, B. J. Johnson, W. R. Julsrud, L. R. Kuester, C. W. Lee, C. R. Madsen, N. A. Marx, E. L. McLaury, E. C. Nelson, R. D. Ogden, L. G. Peterson, J. L. Piehl, E. D. Rockwell, M. A. Spoden, R. D. Walvatne, R. S. Wetzel, and J. F. Wolowitz. Technical advice on tabular and statistical concerns were provided by T. L. Shaffer. We also thank K. F. Higgins and R. B. Oetting for their reviews and assistance with the manuscript.

LITERATURE CITED
Anthony, R. M. and J. S. Sedinger. 1987. Productivity in a brant colony improves with removal of arctic foxes. USDI Fish and Wildlife Service, Research Information Bulletin No. 87-7.
Balser, D. S., H. H. Dill, and H. K. Nelson. 1968. Effect of predator reduction on waterfowl nesting success. J. Wildl. Manage. 32(4):669-682.
Chesness, R. A., M. -M. Nelson, and W. H. Longley. 1968. The effect of predator removal on pheasant reproductive success. J. Wildl. Manage. 32(4):683-697.
Choromanski, J. and A. B. Sargeant. 1982. Gray gophers and prairie ducks. North Dakota Outdoors 45(2):6-9.
Cowardin, L. M. and D. H. Johnson. 1979. Mathematics and mallard management. J. Wildl. Manage. 43(1):18-35.
Duebbert, H. F. 1969. High nest density and hatching success of ducks on South Dakota CAP land. Trans. N. Am. Wildl. Conf. 34:218-228.
and H. A. Kantrud. 1974. Upland duck -----nesting related to land use and predator
reduction. J. Wildl. Manag~. 38(2):257-265. and J. T. Lokemoen. 1980. High duck
nesting success in a predator-reduced environment. J. Wildl. Manage. 44(2):428-437. , J. T. Lokemoen, and D. E. Sharp. 1983.
-----Concentrated nesting of mallards and gadwalls on Miller Lake Island, North Dakota. J. Wildl. Manage. 47(3):729-740.
Eberhardt, R. T. 1973. Some aspects of minkwaterfowl relationships on prairie wetlands. Prairie Naturalist 5(2):17-19.
Greenwood, R. J. 1982. Nocturnal activity and foraging of prairie raccoons (Procyon lotor) in North Dakota. Am. Midl. Nat. 107(2):238-243. , A. B. Sargeant, and D. H. Johnson. 1985.
-----Evaluation of mark-recapture for estimating striped skunk abundance. J. Wildl. Manage. 49(2):332-340.
1986. Influence of striped skunk -----removal on upland duck nest success in
North Dakota. Wildl. Soc. Bull. 14 (1): 6-11.
139
Johnson, D. H. and A. B. Sargeant. 1977. Impact of red fox predation on the sex ratio of prairie mallards. USDI FWS Wildl. Res. Rpt. 6 Wash. D.C. 56 pp.
Kalmbach, E. R. 1937. Crow-waterfowl relationships in the prairie Provinces. Trans. N. Am. Wildl. Conf. 2:380-392.
1938. A comparative study of nesting -----waterfowl on the Lower Souris Refuge,
1936-37. Trans. N. Am. Wildl. Conf. 3:610-623.
Klett, A. T., H. F. Duebbert, C. A. Faanes, and K. F. Higgins. 1986. Techniques for studying nest success of ducks in upland habitats in the prairie pothole region. USDI Fish and Wildlife Service/Resource Publ. 158.
Lokemoen, J. T., H. A. Doty, D. E. Sharp, and J. E. Neaville. 1982. Electric fences to reduce mammalian predation on waterfowl nests. Wildl. Soc. Bull. 10(4):318-323.
1984. Examining economic efficiency of -----management practices that enhance
waterfowl production. Trans. N. Am. Wildl. Conf. 49:584-607.
Miller, H. W. and D. H. Johnson. 1978. Interpreting the results of nesting studies. J. Wildl. Manage. 42(3):471-476.
Sargeant, A. B., G. A. Swanson, and H. A. Doty. 1973. Selective predation by mink, Mustela vison, on waterfowl. Am. Midi. Nat. 89(1):208-214. , S. H. Allen, R. T. Eberhardt. 1984.
-----Red fox predation on breeding ducks in mid continent North America.. Wildl. Mono. 89:1-41.
Sowls, L. K. 1948. The Franklin ground squirrel (Citellus franklinii) and its relationship to nesting ducks. J. Mamm. 29:113-137.
Stewart, R. E. and H. A. Kantrud. 1973. Ecological distribution of breeding waterfowl populations in North Dakota. J. Wildl. Manage. 37:39-50.
Trautman, C. G., L. F. Fredrickson, and A. V. Carter. 1973. Relationships of red foxes and other predators to populations of ring-necked pheasants and other prey, 1964-71. S. D. Dep. Game, Fish Parks. P-R Proj. Rep., W-75-R-15. 158 pp. Multilith.

Duck Nest Success on South Dakota Game Production Areas1
S. Gay Simpson2
Abstract - Duck nesting success was studied on South Dakota Game Production Areas in 1985 and 1986. Mayfield success rates for all species combined were 28.0 and 28.4 percent, respectively. Predators were responsible for nearly 90 percent of nest failures. Results from lake Albert Island and Hogsback served to demonstrate potential for intensive management to increase duck nesting success.
INTRODUCTION
Increasing recruitment rates of upland nesting ducks, especially of mallards (Anas platyrhynchos), is a top priority in the Central Flyway. Funds have recently become available from private organizations such as Ducks Unlimited to attain this goal through habitat enhancement and intensive management. To estimate current nest densities and success and thus assess management potential on Game Production Areas (GPAs), the South Dakota Department of Game, Fish and Parks (SDGFP) initiated duck nesting studies in spring, 1985, and continued the work in 1986.
With the recent increased interest in improving nest success and recruitment of prairie nesting ducks, interest in high production potential of islands and other areas inaccessible to predators also increased. High densities of nesting ducks on islands were reported by Duebbert 1966, Newton and Campbell 1975, Duebbert et al. 1983, Browne et al. 1983, and Lokemoen et al, 1984. Drewein and Fredrickson (1970) reported high densities of nesting mallards on a 7.7 ha island in Lake Albert in Kingsbury County, South Dakota (Fig. 1). The island is owned by SDGFP, as is a 21 ha peninsula known as the Hogsback, which extends into the lake from the west shore. Nest searches were conducted on the island and Hogsback to determine nest density and success, to determine whether any changes in nest density had occurred on the island since 1967, and to evaluate suitability of the Hogsback.for intensive management.
lPaper presented at the Eighth Great Plains Wildlife Damage Control Workshop, Rapid City, South Dakota, April 28-30, 1987.
2S. Gay Simpson is Migratory Bird Specialist for the South Dakota Department of Game, Fish and Parks, Pierre, South Dakota.
140
Studies were funded by the South Dakota Department of Game, Fish and Parks. Professional Aides T. Leif, J. Lange and B. Carlson collected data. I acknowledge the assistance of P. Mammenga, D. Limmer and K. Higgins, and the Conservation Officers in counties where searches were conducted.
STUDY AREAS
Searches were conducted on 19 and 24 GPAs in 13 counties of east-central and north-eastern South Dakota in 1985 and 1986, respectively (fig. 1). Areas were selected by: ease of dragging, management potential and preference of local Conservation Officers.
Lake Albert is a 1764 ha, deep open lake located in northeast Kingsbury and southeast Hamlin counties of South Dakota (fig. 1). Lake Albert Island, located in the southern portion of the lake, is partially wooded but contains an open flat of 3.6 ha dominated by stinging nettle (Urtica procera) and containing patches of western snowberry (Symphoricarpos occidentalis), woods rose (Rosa woodsii) and gooseberry (Ribes sp.). The Hogsback has steep wooded banks and an upland with interspersion of grasses and the same shrubs as occur on the island.
METHODS
Game Production Areas were searched by dragging 48 m of 1.9 mm chain between four-wheel drive vehicles and/or all-terrain vehicles. Search procedures were those described by Higgins et al. (1977). Areas not suitable for vehicular travel were searched on foot. First searches were conducted from 16 May through 16 July. Selected areas were searched a second time between 23 June and 24 July. Area of fields searched was measured using a polar planimeter and aerial photographs
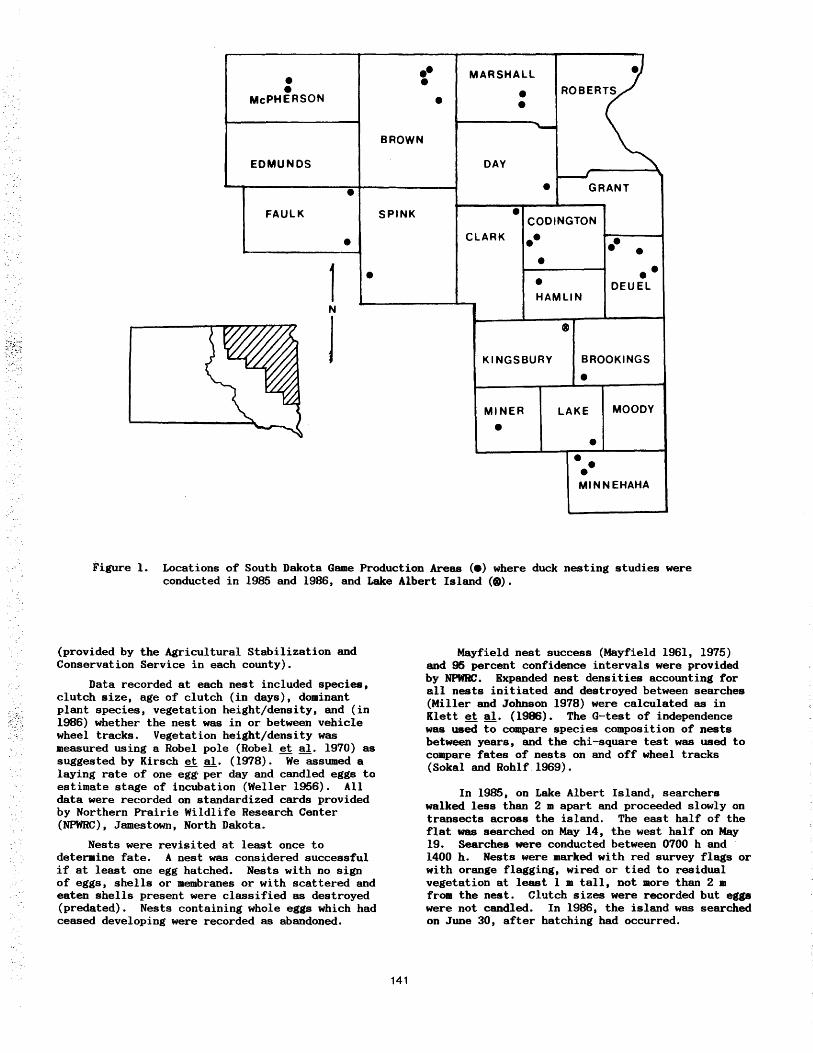
• • McPHERSON
EDMUNDS
FAULK
1 N
J
•
• •
•• •
BROWN
SPINK
• MARSHALL
• •
DAY
• • GRANT
CLARK
CODINGTON
•• • • • • HAMLIN
• ••
DEUEL
KINGSBURY BROOKINGS
• MINER
• LAKE MOODY
• • • • MINNEHAHA
Figure 1. Locations of South Dakota Game Production Areas (e) where duck nesting studies were conducted in 1985 and 1986, and Lake Albert Island(®).
(provided by the Agricultural Stabilization and Conservation Service in each county).
Data recorded at each nest included species, clutch size, age of clutch (in days), dominant plant species, vegetation height/density, and (in 1986) whether the nest was in or between vehicle wheel tracks. Vegetation height/density was measured using a Robel pole (Robel et al. 1970) as suggested by Kirsch et al. ( 1978). We assumed a laying rate of one eg~ per day and candled eggs to estimate stage of incubation (Weller 1956). All data were recorded on standardized cards provided by Northern Prairie Wildlife Research Center (NPWRC), Jamestown, North Dakota.
Nests were revisited at least once to determine fate. A nest was considered successful if at least one egg hatched. Nests with no sign of eggs, shells or membranes or with scattered and eaten shells present were classified as destroyed (predated). Nests containing whole eggs which had ceased developing were recorded as abandoned.
141
Mayfield nest success (Mayfield 1961, 1975) and 95 percent confidence intervals were provided by NPWRC. Expanded nest densities accounting for all nests initiated and destroyed between searches (Miller and Johnson 1978) were calculated as in Klett et al. (1986). The G-test of independence was used to compare species composition of nests between years, and the chi-square test was used to compare fates of nests on and off wheel tracks (Sokal and Rohlf 1969).
In 1985, on Lake Albert Island, searchers walked less than 2 m apart and proceeded slowly on transects across the island. The east half of the flat was searched on May 14, the west half on May 19. Searches were conducted between 0700 h and 1400 h. Nests were marked with red survey flags or with orange flagging, wired or tied to residual vegetation at least 1 m tall, not more than 2 m from the nest. Clutch sizes were recorded but eggs were not candled. In 1986, the island was searched on June 30, after hatching had occurred.

The Hogsback was searched on 28 May, 1985, with 48 m of 1.9 mm chain drawn between vehicles. Nests were marked with flagging as on the island. Clutch sizes were recorded and eggs were candled to determine stage of incubation (Weller 1956). Nest locations were recorded on an aerial photograph obtained from the Agricultural Stabilization and Conservation Service. Fate of nests was recorded as on Game Production Areas. Mayfield nests success was calculated based on an average age of nests when found of 10 days, using the method of Johnson and Klett (1985). The Hogsback was not searched in 1986.
RESULTS
Game Production Areas
We located 200 nests on 302 ha in 1985, and 206 nests on 786 ha searched in 1986. Of the nests located each year, approximately 35 percent were found in laying stages, 55 to 65 percent in incubation, and the remainder pipping or hatched.
Species composition (table 1) was significantly different between years (G = 25.51, 6 d.f., pi 0.01). The difference was due to an increase in the proportion of the sample comprised of mallards (21.2 percent in 1986 compared to 7.7 percent in 1985) and a decrease in northern shovelers (!. clypeata) from 8.5 to 1.9 percent. Blue-winged teal (!. discors) comprised the majority of nests located both years and northern pintail (!. acuta), American wigeon (!. americana) , and lesser scaup (~ affinia) remained unchanged at less than 3 percent of the sample each.
Expanded nest density in 1986 was 0.43 nests per ha, compared to 1.21 nests per ha in 1985. Only ''normal" nests were used when calculating
nest success. The remaining nests were not used because they were: not relocated, .totally or partially destroyed i~ the search, or found predated during searches. Mayfield nest success was 28.4 percent for all species combined in 1986 (table 1), just very slightly higher than in 1985. Although Mayfield nest success rates for mallard (0.317), gadwall (0.380) and shoveler (0.574) in 1986 were more than double the 1985 rates (table 1), the increase was statistically significant only for gadwalls (X2 = 8.50,1 d.f., ~ <0.01). Increased sample size of mallards in 1986 probably enhanced Mayfield estimates for that species. Sample sizes for pintails, wigeon, shoveler and scaup were too small both years to provide accurate estimates of nest success, as indicated by 95 percent confidence limits ranging from 0 to 3355 percent (table 1).
Predation was responsible for 87 percent and 88 percent of nest failures in 1985 and 1986, respectively. Attempts were made to identify species of predators responsible for destruction of nests, based on visual evidence, predator sightings and sign, and information from local Conservation Officers. In 1986, skunks were implicated by evidence present at nine destroyed nests, and a ground squirrel at one. Active fox dens were present on nearly all GPAs searched (Conservation Officers, personal communications), and red fox were observed on two of the GPAs during nest searches. One badger (Tax idea taxus) burrow and four northern barrier (Circus cyaneus) nests were located on nest searches, and skunk and raccoon tracks were common. Evidence of hen mortality was found at one nest in 1985, and at three nests in 1986.
Nest success on GPAs was not independent of position of the nest with respect to vehicle tracks (n=l95, X2 = 31.8, 1 d.f. ~ <0.01). Proportionately more nests in or between wheel
Table 1. Species Composition and Mayfield Success Rates of Duck Nests on Game Production Areas in Northeastern South Dakota in 1985 and 1986.
1985 1986 95% 95%
Mayfield Confidence Mayfield Confidence S2ecies N (%} Success Limits N (%) Success Limits
----------%-------------- ----------%-------------Mallard 14(7.7) 15.4 (3.5-61.6) 39(21. 2) 31.7 (18.1-56.1) Gadwall 28(15.5) 16.2 (6.6-38.7) 29(15. B) 38.0 (21.6-66.1) Wigeon 1(0.5) 1.7 (0. 0-2581. 3) 1(0.5) 2.4 (0.0-2057.4) B.W. Teal 117(64.6) 37.5 (27.7-50.7) 105(57.1) 25.8 (17.6-37.8) N. Shoveler 15(8.3) 21.8 (6.1-74.0) 4(2.2) 57.4 (18.6-171.1) N. Pintail 5(2.8) 1.0 (0.0-75.0) 5(2.7) 6.0 (0.2-133.6) L. Scaup _1(0.5) 2.4 (0.0-2057.4) _1(0.5). ___L_! (0.0-3355.2)
All 181 28.0 184 28.4
142

tracks were destroyed by predators, suggesting predators use the vehicle tracks as travel lanes.
Lake Albert Island
In 1985 one great-horned owl was seen on Lake Albert Island when nest searching began. We located 63 mallard nests (table 2). Only three were found in the wooded portion of the island, which was not systematically searched; the remainder were found in the 3.6 ha field of nettle. Nest density in the field was 17.5 nests per ha.
We relocated only 44 (70 percent) of the 63 mallard nests on 21 June, and found three nests not located on earlier searches (table 2). Mayfield nest success was 43.2 percent. Fifteen nests (31.9 percent) were abandoned. In four abandoned nests where original clutches numbered 4, 6, 8 and 11, we found 11, 6, 13 and 10 eggs, respectively, at abandonment. Six nests (12.8 percent) were destroyed by predators. Remains of one hen were found near her nest.
We found eight nests on the Hogsback: five blue-winged teal, two gadwall and one mallard. Only three nests were relocated (mallard and gadwall), and all three were destroyed by predators. Cattle destroyed markers of all the teal nests.
In 1986, we located 38 nests on the island (table 2). Of those, 13 were successful (34.2 percent), eight were abandoned (21.1 percent) and 17 were destroyed (44.7 percent). Remains of hens were found at two nests and egg remains ascribed to raccoon activity were found at one nest. In addition, about 30 uneaten eggs were found scattered in the vegetation in an area approximately 8 m in diameter.
Table 2. Numbers and Fates of Mallard Nests on Lake Albert Island in Kingsbury County, South Dakota, in 1985 and 1986.
Nests Found Nests Relocated Successful (%) Abandoned (%) Destroyed (%) Mayfield Success
1985
.63 47 26 (55.3) 15 (31.9)
6 (12. 8) 43.2%
1986
38
13 (34.1) 8 (21.1)
17 (44.7)
1 0nly one search was conducted in 1986. No Mayfield nest success estimate was calculated.
143
DISCUSSION
Game Production Areas
Habitat conditions varied across the study area and between years. In 1986, both May pond counts and duck breeding populations in South Dakota increased significantly over 1985 levels (Novara 1986). Observed changes between years in nest densities and species composition on GPAs could be attributed in part to these changes in habitat conditions.
Species composition may Have been biased by timing of nest searches, which began in mid~ay. Klett et al. (1986) indicated that if only a single search were possible, late May would be optimal for mallard, blue-winged teal and all species combined. Of 69 fields searched only once, only seven were searched in late May. Of 20 fields search twice, 14 were searched in late May and again in mid-to-late June.
Estimates of Mayfield nest success on GPAs agreed closely with estimates from similar studies conducted by the U.S. Fish and Wildlife Service (USFWS) on Waterfowl Production Areas (WPAs) in the same region in 1984 and 1985. 3 •4 That is, nest success on public lands "managed" for wildlife was approximately 30 percent for all species combined.
The primary cause of nest failure on GPAs was predation. The impact of mammalian predators on upland nesting ducks is well documented (Cowardin et al. 1983, Greenwood 1986, Higgins 1977, Johnson and:Sargeant 1977, and others). Identification of predators responsible for destruction of nests from nest site inspection is difficult at best, and far from an exact science (Greenwood, personal communications). I used all available evidence, knowledge of local Conservation Officers, and the experience of one employee to infer which predators had the greatest impact on GPAs. As noted in the aforementioned studies, striped skunk, red fox and raccoon were primary predators.
3Rabenberg, M. J. 1984. First year report: nest dragging study, Waubay Wetland Management District. 24pp. Unpubl. report. Waubay Wetland Management District, USDI Fish and Wildlife Service, Waubay, South Dakota.
4 , 1985. Second year report: nest dragging study, Waubay Wetland Management District. 4lp. Unpublished report. Waubay Wetland Management District, USDI Fish and Wildlife Service, Waubay, South Dakota.
Use of vehicle tracks as travel lanes by predators was first suspected by L. Kirsch at NPWRC. Fresh sand spread in vehicle tracks on one study area in North Dakota showed higher use by red fox and striped skunk than plots located as far as possible from vehicle paths (NPWRC, unpublished data). Based on the relatively simple approach taken in my study, nest searching with vehicles may significantly reduce probability of survival of nests adjacent to or between vehicle tracks.
Lake Albert Island
Number, density and distribution of mallard nests on Lake Albert Island in 1985 were all comparable to those reported by Drewein and Fredrickson (1970). Those authors did not report fate of nests but noted no evidence of predation and only three abandoned clutches found during searches. Apparent nest success was lower on Lake Albert Island in 1985 (55 percent) and 1986 (34.2 percent) than the 60 to 90 percent reported as typical for island nesting dabbling ducks by Deubbert et al. (1983). In 1985, abandonment was the major cause of nest failure on Lake Albert Island, accounting for 71 percent of unsuccessful clutches. Duebbert et al. (1983) found no difference in rates of abandonment between years when searches we.re conducted during and after the breeding season, leading them to conclude that abandonment was due to natural behavioral interactions or physiological responses rather than investigator disturbance. In 1986, nest searching was delayed until well after peak hatching. Abandonment accounted for a lower proportion of failed nests (table 2), but increased predation was the primary cause.
The chief benefit of islands for upland nesting ducks is protection from mammalian predators (Townsend 1966, Duebbert 1982, Hines and Mitchell 1983). Lake Albert Island was trapped, through not intensively, each spring from 1980 through 1986. Occasional raccoon and striped skunk were removed. There is a red fox denning site on the island, and red fox were evicted from the island one spring. In spite of the annual (albeit limited) trapping effort on the island, predation by mammals was evident both years. Raccoon, woodchuck (Marmots ~) or mink (Mustela vison) were probably responsible for nest failures in 1986.
CONCLUSIONS
The North American Waterfowl Management Plan (1986) identified recruitment in prairie nesting ducks as the top priority problem facing waterfowl managers today. While duck nest success on GPAs far surpassed that on private lands (Johnson et
144
al. these proceedings), the impact of predation on GPAs was great, especially for some areas and species. Even in 1986, a year of excellent habitat conditions, predation left duck nest success far below potential on GPAs. Intensive management (eg. nest structures, predator-free nesting islands, predator exclusion fences and predator removal) will be necessary to increase nest success and enhance duck recruitment on GPAs.
Lake Albert is well suited for intensive management. Potential production from successful nests on Lake Albert Island in 1985 was 265 ducklings. Brood rearing habitat in the area is in excellent condition due to high water levels and flooding of low-lying areas. Thorough trapping on Lake Albert Island is clearly justified.
Excellent nesting cover but low nest success on the Hogsback peninsula led SDGFP and Ducks Unlimited to construct a predator exclusion fence across the base of the peninsula in the fall of 1986. If high nest densities on the nearby island are one cause of observed abandonment, providing alternative secure nesting cover may allow more hens to nest successfully. Although nothing is known about duckling survival on Lake Albert, recruitment, survival and homing, or immigration are evidently adequate to maintain the population. I hypothesize an increase in nest density on the Hogsback over time as a result of predator exclusion.
LITERATURE CITED
Browne, P.M., D.A. Duffus and R.W. Boychuk. 1983. High nesting density of ducks on an island in Saskatchewan. Can. Field-Nat. 97(4):453-454.
Cowardin, L.M., A.B. Sargeant and H.F. Duebbert. 1983. Problems and potentials for prairie ducks. Naturalist 34:4-11.
Drewein, R.C. and L.F. Fredrickson. 1970. High density mallard nesting on a South Dakota island. Wilson Bull. 82(1):95-96.
Duebbert, H.F. 1966. Island nesting of the gadwall in North Dakota. Wilson Bull. 78:12-25.
Duebbert, H.F. 1982. Nesting of waterfowl on island in Lake Audubon, North Dakota. Wildl. Soc. Bull. 10:232-237.
---------' J.T. Lokemoen, and D.E. Sharp. 1983. Concentrated nesting of mallards and gadwalls on Miller Lake Island, North Dakota. J. Wildl. Manage. 47:729-740.
Greenwood, R.J. 1986. Influence of striped skunk removal on upland duck nest success in North Dakota. Wildl. Soc. Bull. 14:6-11.
Higgins, K.F. 1977. Duck nesting in intensively farmed areas of North Dakota. J. Wildl. Manage. 41:232-242.

Riggins, K.F., L.M. Kirsch, H.F. Duebbert, A.T. Klett, J.T. Lokemoen, H.W. Miller, and A.D. Kruse. 1977. Construction and operation of cable-chain drag for nest searches. U.S. Fish and Wildl. Serv., Wildl. Leaflet 512, 14pp.
Hines, J.E., and G.J. Mitchell. 1983. Gadwall nest-site selection and nesting success. J. Wildl. Manage. 47:1063-1071.
Johnson, D.H., and A.T. Klett. 1985. Quick estimates of success rates of duck nests. Wildl. Soc. Bull. 13:51-53.
_________ , and A.B. Sargeant. 1977. Impact of red fox predation on the sex ratio of prairie mallards. U.S. Fish and Wildl. Serv. Wildl. Res. Rep. 6. 56pp.
Johnson, M.A., T.C. Hinz and T.L. Kuck. 1987. Duck nest success and predators in North Dakota, South Dakota and Montana: The Central Flyway Study. Eighth Great Plains Wildlife Damage Control Workshop: Proceedings. In press.
Kirsch, L.M., H.F. Duebbert, and A.D. Kruse. 1978. Grazing and haying effects on habitats of upland nesting birds. Trans. North Am. Wildl. and Nat. Resour. Conf. 43:486-497.
Klett, A.T., H.F. Duebbert, C.A. Faanes and K.F. Higgins. 1986. Techniques for studying nest success of ducks in upland habitats in the Prairie Pothole Region. USDI Fish and Wildlife Service Res. Publ. 158. Washington, D.C.
145
---------' R.F. Duebbert, and D.E. Sharp. 1984. Nest spacing, habitat selection and behavior or waterfowl on Miller Lake Island, North Dakota. J. Wildl. Manage. 48(2):309-321.
Mayfield, H. 1961. Nesting success calculated from exposure. Wilson Bull. 73:255-261.
1975. Suggestions for calculating nest success. Wilson Bull. 87:456-466.
Miller, H.W., and D.H. Johnson. 1978. Interpreting the results of nesting studies. J. Wildl. Manage. 42:471-476.
Newton, I., and C.R.G. Campbell. 1975. Breeding of ducks at Loch Leven, Kinross. Wildfowl 26:83-103.
Robel, R.J., J.N. Briggs, and A.D. Dayton and L.C. Hulbert. 1970. Relationships between visual obstruction measurements and weight of grassland vegetation. J. Range. Manage. 23:295-297.
Sokal, R.R., and F.J. Rohlf. 1981. Biometry. Second edition. 859p. W.H. Freeman and Co., San Francisco, Calif.
Townsend, G.H. 1966. A study of waterfowl nesting of the Saskatchewan River delta. Can. Field-Nat. 80:74-88.
U.S. Department of Interior, Fish and Wildlife Service. 1986. Waterfowl breeding population survey for South Dakota and North Dakota. 6p. USDI Fish and Wildlife Service, Washington, D.C.
Weller, M.W. 1956. A simple field candler for waterfowl eggs. J. Wildl. Manage. 20:111-113.

Increasing Waterfowl Production on Points and Islands by Reducing Mammalian Predation1
John T. Lokemoen 2, Richard W. Sc2naderbeck3, and Robert 0. Woodward
Abstract.--On 12 points, with electric predator barriers, there were 0.84 duck nests per acre with a hatching rate of 60%. On 12 control points, there were 0.23 nests per acre with a hatching rate of 8%. On 9 islands where predators were removed, there were 851 nests in 1986 with 87% nest success. In 1984 and 1985, before predators were controlled, these islands contained 52 nests with 8% nest success. The management cost to produce hatched young on treated points was $7.13 compared with $0.33 for each hatched young on islands.
INTRODUCTION
Recent studies of mallard (Anas platyrhynchos) mortality (Sargeant et al. 1984), hen success (Cowardin et al. 1985), and brood survival (Talent et al. 1983) have indicated severe losses of hens, eggs, and young to mammalian predators. As a result, biologists interested in managing breeding waterfowl have shown increased interest in regulating predation.
A study of waterfowl management methods (Lokemoen 1984) concluded that predator management was the most cost-effective technique to increase waterfowl production. Islands, where nests were separated from mammalian predators, were particularly beneficial to breeding waterfowl but islands were expensive to construct.
In this study we tried to create "safe nesting islands" for breeding waterfowl without using expensive construction methods. We used fences with electric wires to deter predators from points. These types of fences have been shown to reduce predator movement into nesting habitats (Forester 1975, Lokemoen et al. 1982). Also we attempted to increase waterfowl production on existing islands by removing mammalian predators. The point study areas were located in east-central North Dakota and the island study sites in northeastern North Dakota.
1Paper presented at the Eighth Great Plains Wildlife Damage Control Workshop held at Howard Johnsons (Rapid City, South Dakota on April 28-30, 1987).
2John T. Lokemoen, Biologist, and Robert ,woodward, Biological Technician, U.S. Fish and Wildl~fe Service, Jamestown, N.D.
Richard W. Schnaderbeck, Biologist, U.S. Fish and Wildlife Service, Devils Lake, N.D.
146
METHODS
Five treated points were studied in 1985 and 7 in 1986. A similar number of control points located nearby contained no fences or predator control.
To create "safe nesting islands" we built wire fences across the base of points using 18 gauge l-inch mesh poultry netting. The fence extended 5.5 feet above ground level (AGL) and 1 foot below ground level. The top 1 foot of the fence extended outward at a 45° angle. Fences extended into the lake 50-150 feet to water 2 feet deep. Two energized electric wires off-set 2.5 inches and 5.0 inches from the fence were placed on the outside of the fence 4 feet AGL. Another energized wire was placed 2.5 inches above the top of the poultry netting.
Mammalian predators were trapped within the fenced point exclosures using 220 conibear traps set in boxes. Sardines and dead fish were placed inside the boxes as bait. On 2 points, size 1.5 leg-hold traps were set to capture mink (Mustela vison). An average of 3.8 conibears and 0.5 leg-hold traps were set at each point. An average of 8 trips were made to each treated point to remove trapped predators and maintain the fence.
On islands, predators were removed after the ice melted in spring. Islands were walked to flush and shoot red fox (Vulpes vulpes) and traps and snares were set to remove other predators. An average of 3-110 conibears, 2-220 conibear traps, and 3 snares were set at each island. Predators were removed from 7 islands in the spring of 1986, and from 2 islands in Stump Lake during the springs of 1985 and 1986. An average of 4 trips were made to each island.

All treated points, control points, and islands were searched for waterfowl nests 2-4 times during the nesting season. Nest searches involved 2-6 people walking abreast and pulling weighted ropes or riding all terrain vehicles and pulling a 5/16" chain to flush waterfowl hens and locate nests (Higgins et al. 1977). Each nest was marked with a flag when found and nests were revisited to determine fate and count hatched eggs. Nest success was determined by the modified Mayfield method (Johnson 1979). Nest numbers, nest success, and the number of young hatched were compared between treated and control points and at islands before and after predator control.
Costs of ducklings were estimated by dividing the annual management expenses for establishment and maintenance by the number of young ducks hatched. Cost estimates were the same as those used by Lokemoen et al. (1984). Labor costs were set at $6.50 per hour and transportation costs at $0.33 per mile. All costs were prorated for the life of the practice using the Water Resources Council standard amortization rate of 0.08875.
RESULTS AND DISCUSSION
Paired Point Comparisons
Treated points contained 280 nests with 60% nest success compared with 39 nests and 8% nest success on control points (Table 1). An average of 128.8 young hatched during each of the 2 years on the treated points compared to 2.4 young hatched per control point. Gadwalls (Anas strepera) comprised 39% of the total nests on points, blue-winged teal (Anas discors) 25%, mallards 11%, and pintails (Anas acuta) 10%.
Predation on control points in central North Dakota was severe and few waterfowl nesting attempts were successful. Electric barriers plus predator control greatly benefited duck nesting success but did not fully stop predation. Several hens were killed by raptors and eggs were destroyed by American crows (Corvus brachyrhynchos), which fences do not det~ggs were also destroyed by mink and raccoon (Procyon lotor), some of which swam around the fence and were not captured in traps.
The species composition of 47 predators captured on points included raccoon 40%, striped skunk (Mephitis mephitis) 32%, red fox 21%, mink 2%, and Franklin's ground squirrel (Spermophilus franklinii) 4%.
147
Table 1.--Number of nests, nest success and nest density on treated (T) points with predator barriers and on control (C) points in central North Dakota, 1985 and 1986.
Nests Total No. of per Nest young
Year N Acres nests acre sue. (%} hatched 1985 T 5 149 112 0.75 55 571
c 5 65 16 0.25 11 18 1986 T 7 184 168 0.91 63 975
c 7 102 23 0.23 5 11 Total T 12 333 280 0.84 60 1546 or c 12 167 39 0.23 8 29 avg.
Island Comparisons
The number of nests found on islands increased from 52 before predator control to 851 after predator control (Table 2). Nest success rose from 8% before predator removal to 87% after predator removal. An average of 790.6 young were hatched on each island in 1986 after predator control compared to 4.7 young hatched per island in 1984 and 1985 before predator control.
The density of waterfowl nests increased rapidly from 0.7 to 11.8 nests per acre after predators were removed from islands. On the 2 large islands in Stump Lake, nest densities increased from 0.2 nests per acre in 1984 to 13.3 nests per acre in 1986, a 66.5-fold increase.
Mallards and gadwalls formed 93% of the island nesting population. These 2 species also initiated 93% of the nests on Miller Lake Island, North Dakota (Duebbert et al. 1983). A few blue-winged teal, northern pintail, and lesser scaup (Aythya affinis) also nested on the islands.
After predator control was initiated, most nest losses on islands were attributed to mink or crows. A total of 18 predators were captured on the 9 islands in 1986. The species composition of predators captured on ·the 9 islands was 44% red fox, 39% mink, 11% raccoon and 6% striped skunk. Red fox and mink were more frequently captured on islands compared to points and striped skunk and raccoon were less frequently captured.
Duck Production Costs
The average total cost of each fence was $5,964.96, which yields an annual cost of $650.18 when amortized over 20 years. This expense plus an estimated $267.75 yearly cost of fence maintenance and predator removal resulted in a total annual cost of $917.93 for each fenced point (Table 3). By dividing the total annual cost by the total annual production we obtain a cost of $7.13 for each young hatched.

The estimated cost to hatch a duckling on an island was $0.33. This cost was lower than the cost of ducklings hatched on points because there were no construction expenses and islands had higher nest densities and success. Major island expenses were transportation and labor involved in visiting islands for predator removal.
The cost per young would decline if the number of successful nests on the treated points and islands increased. Numbers of nesting ducks might increase because of homing by successful hens and their young (Sowls 1955). Nest success might also rise if managers increase trapping effectiveness.
These data were obtained during 2 field seasons and must be considered preliminary. The results indicate, however, that the 2 management schemes can be highly effective. The response of ducks to predator-reduced nesting environments was rapid and production was greatly enhanced in the first year. Estimated costs of hatched young were comparable to or lower than fledged young costs estimated by others.
ACKNOWLEDGMENTS
The authors thank G. A. Swanson and A. B. Sargeant who reviewed the manuscript. We also appreciate field help provided by National Wildlife Refuge personnel.
Table 2.--Number and success of duck nests found on 9 islands in 1984 and 1985 before predator control and ~n 1986 after predator control near Devils Lake, North Dakota.
Before After No. Nest No.
Island Size of sue. of Name (a.) nests (%) nests North Salt 10 14 3 1651 Sheep 2 14 2 481 McHugh 6 2 38 31 Minnewaukan 5 5 10 191 Pelican 1 2 2 19 211 Pelican 2 2 4 19 311 Calderwood 5 3 45 341 Stump 1 25 5 2932 Stump 2 . 15 3 2372
Total or average 72 52 8 851
1Predator control conducted only in 1986. 2Predator control conducted in 1985 and 1986.
Nest sue. (%) 61 86 36 88 94 94 83 97 95
87
148
Table 3.--Estimated annual cost in dollars for management applications and for each duckling hatched on treated points and on islands with predator control in central North Dakota 1984-1986.
Activity Points Annual Expenses
Construction(fence) 1 650.18 (None) Transp. ( 400 mi) $132.00 (184 mi) Labor (12 hrs) 2 78.00 (25 hrs) 2 Supplies (5 traps) 7.75 (8 tra~s) Other (materials) 50.00 (Boat) Tot. annual costs 917.93 Avg. no. yg. hatched 128.8 Cost/yg. hatched 7.13
1costs amortized over 20 years. 2costs amortized over 10 years.
LITERATURE CITED
Islands
00.00 $60.72 162.50 11.63 25.83
260.68 790.6
0.33
Cowardin, L. M., D. S. Gilmer, and C. W. Shaiffer. 1985. Mallard recruitment in the agricultural environment of North Dakota. Wildl. Monogr. 92. 37 pp.
Duebbert, H. F., J. T. Lokemoen, and D. E. Sharp. 1983. Concentrated nesting of mallards and gadwalls on Miller Lake Island, North Dakota. J. Wildl. Manage. 47:729-740.
Forester, J. A. 1975. Electric fencing to protect sandwich terns against foxes. Biol. Conserv. 7:85.
Higgins, K. F., L. M. Kirsch, J. T. Lokemoen, H. W. Miller, and A. D. Kruse. 1977. Construction and operation of cable-chain drag for nest searches. U.S. Fish and Wildl. Service Wildl. Leaflet 512. 14 pp.
Johnson, D. H. 1979. Estimating nest success: The Mayfield method and an alternative. Auk. 96:651-661.
Lokemoen, J. T., H. A. Doty, D. E. Sharp, and J. E. Neaville. 1982. Electric fences to reduce mammalian predation on waterfowl nests. Wildl. Soc. Bull. 10:318-323.
Lokemoen, J. T. 1984. Examining economic efficiency of management practices that enhance waterfowl production. Trans. North Am. Wildl. and Nat. Resour. Conf. 49:584-607.
Sargeant, A. B., S. H. Allen, and R. T. Eberhardt. 1984. Red fox predation on breeding ducks in midcontinent North America. Wildl. Monogr. 89. 41 pp.
Sowls, L. K. 1955. Prairie ducks. Stackpole Co., Harrisburg, Pa. 193 pp.
Talent, L. G., R. L. Jarvis, and G. L. Krapu. 1983. Survival of mallard broods in southcentral North Dakota. Condor 85:74-78.

Bullsnake Predation on Waterfowl Nests on Valentine National Wildlife Refuge, Nebraska1
Scott S. Glup2 and Leonard L. McDaniel3
Abstract: Bullsnake (Pituophis melanoleucus) predation on upland nesting ducks was monitored on Valentine National Wildlife Refuge (NWR) from 1982-86. The fate of 1,999 duck nests of 9 species was observed under different treatments of land use and control of potential nest predators. Maximum potential levels of bullsnake depredation are masked by nest destruction by mammalian species; bullsnake nest depredation rates were >65% where mammalian predators were controlled, >40% without predator control and <4.0% where both mammalian and reptilian predators were controlled and/or excluded. Duck nest densities were dramatically increased where predator control was accomplished in undisturbed nesting cover.
INTRODUCTION
The major environmental factors contributing to positive waterfowl production include a complex of quality wetlands, dense nesting cover and rigid control of potential nest predators (Duebbert and Lokemoen, 1980). Extensive degradation of habitat is limiting the reproductive potential of waterfowl over their breeding range. Improving the productivity of remaining habitat is one means to counter the downward population trend of waterfowl.
In the early 1970's, a major change in management of wetlands and upland nesting cover was initiated on Valentine NWR. Seven lakes totalling 950 ha were mechanically dewatered and chemically treated to improve water quality by elimination of carp (Cyprinus carpio) infestations. Annual livestock grazing was reduced from 42,000 animal use months (AUMs) to approximately 13,000 AUMs by 1983. Timing of grazing treatments was used to create and maintain tall warm season grass species for nesting cover. Documentation of the response of waterfowl to the change in management direction has been monitored.
Ladd (1969) documented that the sub-irrigated meadows are the primar~ sites selected by upland nesting ducks on Valentine NWR. Nesting studies carried out during 1970-72 and 74 on 1,260 ha documented that average upland duck nest densities
1Paper presented at the Eighth Great Plains Wildlife Damage Control Workshop, Rapid City, S.D., April 28-30, 1987.
2scott S. Glup, Range Technician, Waubay NWR, Waubay, S.D.
3Leonard L. McDaniel, Refuge Manager, Valentine NWR, Valentine, NE
149
in undisturbed cover (0.6/ha) were double that found in disturbed cover. A greater disparity between undisturbed and disturbed cover nest densities was documented during 1978-82 on 1,658 ha. This information substantiated that upland nesting ducks preferentially selected nesting cover that had been undisturbed for two or more years over disturbed cover (0.8 vs. 0.2 nests/ha). Average mallard (Anas platyrhynchos) nest densities were eight times greater in cover that was undisturbed for two or more years than in any other cover treatment. Since 1980, "preferred" nesting cover increased from 9 to 41% of the total meadow classified priority management for upland nesting waterfowl.
Management strategies to increase waterfowl production on Valentine NWR by improving wetland quality and upland nesting cover have been dampered by excessive nest predation. Sargeant and Arnold (1984) listed the badger (Taxidea taxus), coyote (Canis latrans), Franklin's ground squirrel (sperffiophilus frankinii), mink (Mustela vison), raccoon (Procyon lotor), red fox (Vulpes vulpes) and striped skunk~hitis mephitis) as predator species having the greatest impact on duck production. Except for the Franklin's ground squirrel and red fox, these predator species occur and have been documented as predators on duck nests on Valentine NWR. Teer (1964) documented longtailed weasel (Mustela frenata) depredation on eggs of blue-winged teal (A. discors). Longtailed weasels were documented preying on both eggs and nesting hens in our studies; however, depredations were infrequent, localized and easily controlled. Imler (1945) documented the bullsnake as a major predator of duck nests in the Nebraska Sandhills. Snake predation on waterfowl nests has been reported by others (Aldrich and Endicott 1984 and Wheeler 1984); however, the magnitude of its impact upon production is seldom addressed.

Summarized are the preliminary results of efforts to increase waterfowl production by removal and/or exclusion of potential waterfowl nest predators. Emphasis is placed on bullsnake depredations and their control during 1982-86.
Fort Niobrara-Valentine NWR Complex staff and, in particular, refuge volunteers G. Ackerman, S. Kinnison, T. Krumwiede and R. Wingenroth provided field assistance. Appreciation is extended toM. Lindvall, J. Matthews, N.I. Peabody and L. Schroeder who reviewed and provided constructive comments and also J. Edwards who typed the manuscript.
STUDY AREA AND METHODS
Valentine NWR is located in the north central portion of the Nebraska Sandhills, 16 km south of Valentine, Nebraska. The refuge totals 28,955 ha including approximately 4,000 ha of marsh and shallow lakes, 20,000 ha of sand and choppy sand sites and 5,000 ha of sub-irrigated meadows.
Control of nest predators was initiated in 1982 on Habitat Unit (H.U.) 18C2; an island which was reduced from 27 to 4 ha during the 5-year study period by rising water levels of the Marsh Lakes. In 1985, control efforts were expanded to the Marsh Lakes proper which includes 930 ha of wetlands, 540 ha of meadow and 2,050 ha of sand and choppy sand sites. Documentation of the mainland control effort was concentrated in H.U. 21B-18Cl; a 40 ha area of undisturbed nesting cover where duck production potential was high. Duck nests were located and monitored within the parameters of Klett et al. (1986), Reardon (1951) and Imler (1945).
Force account mammalian control activities were conducted during March-May to remove resident predators (Roy and Dorrance 1985) which remained after the opportunity for harvest was available to recreational hunters and trappers. Conibear, live and leg-hold traps as qescribed by Johnson (1983), Wade (1983), Boggess (1983), Knight (1983) and Henderson (1983) were used to capture mammalian predators. Drift fence traps were eced to capture bullsnakes (Imler 1945 and Buford 1983), but, the entrance of the funnel opening into the trap was reduced to 25 mm in diame~er to minimize capture of non-target species. Electrical fencing (Lokemoen et al. 1982) UES
used from 1982-84 to prevent mammalian pred<'-i:ors from gaining access to H.U. 18C2 via dike; however, it was discontinued in 1985 because of inundation of the dike by high water. In March of 1985-86, coyotes were removed by aerial hunting (Wade 1978).
RESULTS AND DISCUSSION
A total of 1,999 upland duck nests including 7 dabbling and 2 diving duck species were monitored during 1982-86. In 1983-84, Glup (1986) found
150
that the nest densities were greater (P<0.0810) in undisturbed cover (1.3 nests/ha) than in grazed cover (0.5 nests/ha). Also extensive duck nest destruction occurred in all cover treatments. Coyotes and bullsnakes destroyed 68% of all nests under observation and 96% of all nests destroyed by predators.
Duck nest destruction by mammalian predators was significantly less in areas where control techniques were applied as compared to areas where control was not carried out. The percentage of nests destroyed by mammalian predators other than coyotes and number of these predators taken both increased after intensive coyote control was initiated (table 1). In the absence of mammalian predation, bullsnake depredations increased to >65%. Thus compensating for nest depredations that otherwise would have been incurred by mammalian species (fig. 1).
Table 1. Potential mammalian predators removed prior
Species Coyote Other1
to and during the nesting season. 1982 1983 1984 1985
1 56 33 175 6 33 20 43
1986 82 56
1other includes raccoon, skunk, mink and badger.
Bullsnake nest predation is generally subtle, occurring over a period of time. Bullsnakes consume 1-5 eggs pe~ visit. Rarely did we document cold eggs in abandoned nests being taken. Also, spoiled eggs in nests being incubated were not taken by bullsnakes. During 1982-85, 110 bullsnakes were removed from H.U. 18C2. Twenty-eight were captured in duck nests consuming or attempting to consume eggs, and in seven instances the hens were
No Predator Control (754)
Mammal Only Control (58)
Predator Control (1' 187)
i¥¥*i- Nests destroyed by bullsnakes.
10
,--, 60 65
~ _ Successful nests in which one or1
more ~ eggs were removed by bullsnakes.
~- Nests destroyed by coyotes. UJJCD- Nests destroyed by mammals other than
coyotes.
Figure 1. Percent duck nests depredated comparing three predator control management strategies.
1? - Information lost in a residential fire.

. -~ .- ,•
still on the nests. Bullsnake predation is not limited to eggs, small ducklings may also be taken. In 1985, a 122 em bullsnake was observed and photographed that had captured a nesting green-winged teal (~ crecca).
Imler (1945) reported that of 274 duck nests under observation on Crescent Lake NWR, bullsnakes completely destroyed 114 (45%) besides taking eggs from many other nests. Bullsnake depredation does not always result in termination of the nest (fig. 1). Although nesting attempts may be defined as successful, clutch sizes are reduced. The mean number of eggs hatched from 345 blue-winged teal nests was 9.6 per normal nest and 6.1 per nests depredated by bullsnakes. Whereas, for 202 mallard nests, 8.2 eggs hatched per normal nest and 6.0 eggs hatched per depredated nest.
Bullsnakes present differential rates of predation on early and later nesting species or individuals depending upon the timing bullsnakes emerge from hibernacula (fig. 2). Glup (1986) found a statistically significant linear decrease (R2 = 0.9246, P<O.OOOl) in nest success during the 1983-84 nesting seasons. During 1985-86, average bullsnake depredation rates on mallards were considerably less than later nesting gadwall (A. strepera) and bluewinged teal (table 2).--
60 60
1J50 ~
so
.u
a- "1:::1
i40 40 ~
...-l
...-l
~ 30
.~ til ...-l
~ 20 (.)
~ ~
10
Figure 2. Date bullsnakes emerged from hibernacula in relationship to mallard and blue-winged teal nesting chronology 1983-86.
co •r-f ~
•r-f
30~ Ill .u Ill (!)
20z ~
10
151
Table 2. Average bullsnake predation rates for duck nests under observation 1985-86.
% 7. Bullsnake Bull snakes
Species Nests Depredation Destroyed
Mallard 249 12.5 7.6 Blue-winged
teal 426 34.0 22.3 Gadwall 114 33.0 19.0
Bullsnakes have generally been considered sedentary in nature (Imler 1945, Fitch 1949 and Parker and Brown 1980), but, Fox (1986) reported activity ranges of 4-17 ha for bullsnakes on Crescent Lake NWR. Telemetry studies on Crescent Lake NWR substantiated that bullsnakes do not communally den in the Nebraska Sandhills, but, rather individually use pocket gopher (Geomys bursarius) burrows extensively throughout the year. Therefore, limiting present known options of bullsnake control to intensive trapping.
A total of 658 bullsnakes were captured with 1,242 m of drift fence traps in 1985. In 1986, 786 bullsnakes were captured with 2,985 m of fence. Population densities of bullsnakes on Valentine NWR are unknown; however, the number of bullsnakes captured exceeded duck nests located on the study area where intensive predator control was initiated in 1985. A trapping effort of 7.5 m of drift fence traps per 0.4 ha reduced bullsnake depredation on duck nests by 217. and nest destruction by 127. (Table 3).
Table 3. Bullsnake control and waterfowl pro-ductivity -- H.U. 21B-18Cl.
Bullsnakes Bullsnake Depredation Capturedl Duck Nests 7. Nests 7. Nests
Year 11 fl7na tl tl 7ha Depredated Destroyed
1985 409 10.1 194 4.8 49 27 1986 319 7.9 146 3.6 28 15
lDoes not include hatchlings .
Greater success in reducing duck nest depredation by bullsnakes was achieved in H.U. 18C2. Bullsnakes gain access to this island from the mainland by swimming less than 100 m. Predator control activities were intitiated on H.U. 18C2 in 1982; however, bullsnake numbers and depredations were not suppressed until intensive trapping was accomplished on the adjacent mainland during 1985-86 (table 4).
The management strategy applied to H.U. 18C2 during the five years provided an environment favoring mallard production. From 1982-86, mallard nests increased from 13 to 114 while blue-winged teal nests decreased from 117 to 31. Low return rates of blue-winged teal (Sowls 1955) evidently prevented them from responding similarly to mallards even though high nest success was achieved (table 4).
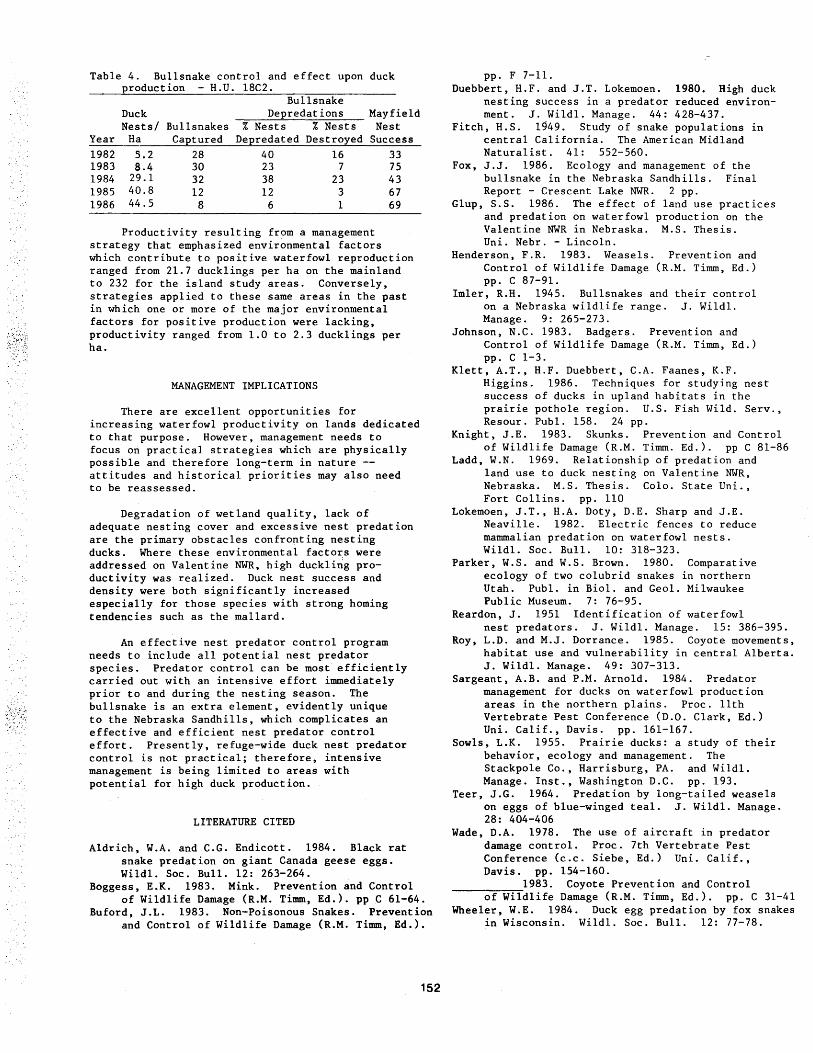
Table 4. Bullsnake control and effect upon duck production - H.U. 18C2.
Bull snake Duck Depredations Mayfield Nests/ Bull snakes % Nests % Nests Nest
Year Ha Captured Depredated Destroyed Success 1982 5.2 28 40 16 33 1983 8.4 30 23 7 75 1984 29.1 32 38 23 43 1985 40.8 12 12 3 67 1986 44.5 8 6 1 69
Productivity resulting from a management strategy that emphasized environmental factors which contribute to positive waterfowl reproduction ranged from 21.7 ducklings per ha on the mainland to 232 for the island study areas. Conversely, strategies applied to these same areas in the past in which one or more of the major environmental factors for positive production were lacking, productivity ranged from 1.0 to 2.3 ducklings per ha.
MANAGEMENT IMPLICATIONS
There are excellent opportunities for increasing waterfowl productivity on lands dedicated to that purpose. However, management needs to focus on practical strategies which are physically possible and therefore long-term in nature -attitudes and historical priorities may also need to be reassessed.
Degradation of wetland quality, lack of adequate nesting cover and excessive nest predation are the primary obstacles confronting nesting ducks. Where these environmental factors were addressed on Valentine NWR, high duckling productivity was realized. Duck nest success and density were both significantly increased especially for those species with strong homing tendencies such as the mallard.
An effective nest predator control program needs to include all potential nest predator species. Predator control can be most efficiently carried out with an intensive effort immediately prior to and during the nesting season. The bullsnake is an extra element, evidently unique to the Nebraska Sandhills, which complicates an effective and efficient nest predator control effort. Presently, refuge-wide duck nest predator control is not practical; therefore, intensive management is being limited to areas with potential for high duck production.
LITERATURE CITED
Aldrich, W.A. and e.G. Endicott. 1984. Black rat snake predation on giant Canada geese eggs. Wildl. Soc. Bull. 12: 263-264.
Boggess, E.K. 1983. Mink. Prevention and Control of Wildlife Damage (R.M. Titnm, Ed.). pp C 61-64.
Buford, J.L. 1983. Non-Poisonous Snakes. Prevention and Control of Wildlife Damage (R.M. Timm, Ed.).
152
pp. F 7-ll. Duebbert, H.F. and J.T. Lokemoen. 1980. High duck
nesting success in a predator reduced environment. J. Wildl. Manage. 44: 428-437.
Fitch, H.S. 1949. Study of snake populations in central California. The American Midland Naturalist. 41: 552-560.
Fox, J.J. 1986. Ecology and management of the bullsnake in the Nebraska Sandhills. Final Report - Crescent Lake NWR. 2 pp.
Glup, S.S. 1986. The effect of land use practices and predation on waterfowl production on the Valentine NWR in Nebraska. M.S. Thesis. Uni. Nebr. - Lincoln.
Henderson, F.R. 1983. Weasels. Prevention and Control of Wildlife Damage (R.M. Timm, Ed.) pp. c 87-91.
Imler, R.H. 1945. Bullsnakes and their control on a Nebraska wildlife range. J. Wildl. Manage. 9: 265-273.
Johnson, N.C. 1983. Badgers. Prevention and Control of Wildlife Damage (R.M. Timm, Ed.) pp. c 1-3.
Klett, A.T., H.F. Duebbert, C.A. Faanes, K.F. Higgins. 1986. Techniques for studying nest success of ducks in upland habitats in the prairie pothole region. U.S. Fish Wild. Serv., Resour. Publ. 158. 24 pp.
Knight, J.E. 1983. Skunks. Prevention and Control of Wildlife Damage (R.M. Timm. Ed.). pp C 81-86
Ladd, W.N. 1969. Relationship of predation and land use to duck nesting on Valentine NWR, Nebraska. M.S. Thesis. Colo. State Uni., Fort Collins. pp. 110
Lokemoen, J.T., H.A. Doty, D.E. Sharp and J.E. Neaville. 1982. Electric fences to reduce mammalian predation on waterfowl nests. Wildl. Soc. Bull. 10: 318-323.
Parker, W.S. and W.S. Brown. 1980. Comparative ecology of two colubrid snakes in northern Utah. Publ. in Biol. and Geol. Milwaukee Public Museum. 7: 76-95.
Reardon, J. 1951 Identification of waterfowl nest predators. J. Wildl. Manage. 15: 386-395.
Roy, L.D. and M.J. Dorrance. 1985. Coyote movements, habitat use and vulnerability in central Alberta. J. Wildl. Manage. 49: 307-313.
Sargeant, A.B. and P.M. Arnold. 1984. Predator management for ducks on waterfowl production areas in the northern plains. Proc. 11th Vertebrate Pest Conference (D.O. Clark, Ed.) Uni. Calif., Davis. pp. 161-167.
Sowls, L.K. 1955. Prairie ducks: a study of their behavior, ecology and management. The Stackpole Co., Harrisburg, PA. and Wildl. Manage. Inst., Washington D.C. pp. 193.
Teer, J.G. 1964. Predation by long-tailed weasels on eggs of blue-winged teal. J. Wildl. Manage. 28: 404-406
Wade, D.A. 1978. The use of aircraft in predator damage control. Proc. 7th Vertebrate Pest Conference (c.c. Siebe, Ed.) Uni. Calif., Davis. pp. 154-160.
___________ 1983. Coyote Prevention and Control of Wildlife Damage (R.M. Timm, Ed.). pp. C 31-41
Wheeler, W.E. 1984. Duck egg predation by fox snakes in Wisconsin. Wildl. Soc. Bull. 12: 77-78.

Overwater Nesting by Ducks: A Review and Management lmplications1
Stephen H. Bouff~d2 David E. Sharp
4 Carol C. Evans
Abstract.--Nest success of overwater duck nests is generally higher than nests in upland sites. A review of the literature indicated that the major factors limiting success of overwater nests were fluctuating water levels, nest parasitism, predation, and human disturbance. Regional patterns of the occurrence of these factors could not be discerned. General management guidelines for improved recruitment and reduced nesting female mortality are suggested.
INTRODUCTION
Waterfowl that nest over water, including most species of diving ducks, will be the focus of this revieN. Man-made nesting structures placed overwater have improved nest success and production of several species of dabbling ducks, but are not within the scope of this review. Therefore, our objectives were to review representative nesting studies and compile information regarding limiting factors that have been suggested for overwater nesting ducks. Based on these factors, general management guidelines to improve recruitment and reduce nesting female mortality of overwater nesting waterfowl are presented.
LIMITING FACTORS
On a comparative basis, fluctuating water levels during the nesting season can be more disruptive to overwater nesters than to upland nesters. Nest success of overwater nests is often high (>50%), but have been reduced to 10%
1Paper presented at the Eighth Great Plains Wildlife Damage Control Workshop. (Rapid City, South Dakota, April 28-30, 1987).
2stephen H. Bouffard, Biologist, u.s. Fish and W~ldlife Service, Pocatello, Idaho.
David E. Sharp, Waterfowl Specialist, U.S. Fish ~nd Wildlife Service, Laurel, Maryland.
Carol C. Evans, Range Management Consultant, Western Range Service, Elko, Nevada.
153
or less by fluctuating water levels (C. C. Evans and D. E. Sharp, unpubl. data). While some upland nests in low-lying areas may be susceptible to flooding, nearly all overwater nests are affected by water level fluctuations. Water level changes, as little as 10-15 em over a few days, may be sufficient to cause adverse effects. Low levels reduce the water barrier and allow easier access by mammalian predators into the marsh, and thus increase the susceptibility of eggs, nesting females, and broods to predation (Stoudt 1971). Female diving ducks may be more susceptible to predation than dabbling ducks when low levels isolate nests, because they have more difficulty getting airborne from dry surfaces than water. Low water levels can also result in increased egg parasitism or nonbreeding (Olson 1964). High water can inundate nest cover (Joyner 1975) and (Mendall 1958). If residual cover is flooded early in the nesting season, females :nay be forced to nest in lower quality sites or forego breeding entirely. Nests in flooded residual cover are more susceptible to avian predators (Joyner 1975). Record high water levels at Ruby Lake National Wildlife Refuge (NWR), Nevada, flooded nesting cover in 1984-85. During this period, canvasbacks (Aythya valisineria) and redheads (A. americana) were found to have a reduced breedinig effort, lower nest success, and an increase in the incidence of egg parasitism by redheads (C. C. Evans, unpubl. data).

The incidence of parasitic egg laying is generally confined to overwater nests and upland nests that are close to water (Joyner 1975}. Although several species of ducks are known to lay eggs in the nests of other ducks, this type of parasitic behavior is most commonly reported for redheads and ruddy ducks (Oxyura jamaicensis}. In some areas, ~cidence of paras1t1c egg laying on overwater nests can be very high, as Wel'ler (1959) trapped 13 different redheads at a single canvasback nest. Host clutch sizes are usually reduced by egg displacement that can occur when parasitic females attempt to lay eggs in a nest with the host female present. Olson (1964) reported an average of 15.4 redhead eggs in canvasback nests, while host eggs averaged 3.9. A large number of parasitic eggs may also reduce host clutch size by suppressing ovulation, or may cause the host to abandon the nest (Weller 1959}.
Predation can limit productivity of overwater nesting waterfowl (Table 1}. Nesting overwater restricts access by most mammals especially canids and skunks (Mephitis mephitis} which are major predators of upland nests and nesting females. Sargeant et al. (1984} found that diving ducks were taken by red foxes (Vulpes vulpes} less frequently during the nest1ng per1od than dabbling ducks. In North Dakota nest success of mallards (Anas platyrhynchos} nesting overwater. ~igher than those nest1ng in upland sites (Krapu et al. 1979}. Mink (Mustela vison} and raccoons (Procyon 1 otor) , whl ch """'irel ess hampered by water, are maJor predators of overwater nests and nesting females (Eberhardt and Sargeant 1977, Sayler 1985,}. Predation by gulls and corvids is not similarly affected by a water barrier, but seems to be more affected by visual obstruction of vegetation than mammalian predators. Most avian predation occurs when nesting females are not attending the nest (Dwernychuk and Boag 1972a, Bourget 1973}. Waterfowl nesting near larid. colonies can have both positive and negative effects on nest success. Nesting near colonies of terns and small gulls can increase nest success as larids keep corvids out of the colony, thus reducing loss of waterfowl eggs. However, this benefit can be offset by gull predation on ducklings (Dwernychuk and Boag 1972b}, as large gulls can prey on both eggs and ducklings.
Quality and quantity of the vegetation used for nesting can affect the vulnerability of nests to predation. Nesting cover conceals nests from visual-oriented predators, such as birds. Dwernychuk and Boag (1972a} found an inverse relationship between amount of cover and number of eggs lost from simulated nests. Where cover was thinned by flooding, 67% of the over·,ater nests were destroyed by gulls, while in an adjacent marsh not similarly affected by flooding, only 4% of the overwater nests were
154
lost to gulls (Joyner 1975}. Conversely, for scent-oriented predators, cover functions as a physical barrier that reduces search speed and efficiency. Bowman and Harris (1980} found no difference in proportion of partially and totally concealed nests found by raccoons in laboratory tests. However, the raccoons found fewer nests when the cover was spatially complex. Where predator populations are low, nest success can be high even ~'ii th 1 ow quality cover (Steel et al. 1956}. Where predator populations are high, dense, good quality cover will not provide sufficient protection from predation (Stoudt 1982, Krasowski and Nudds 1986}. Much of this problem is the result of the concentration of both predators and prey into smaller and smaller islands of habitat. Agricultural activities and changes in the natural predator COhllnunity, including a reduction or elimination of wolves (Canis~} and coyotes (C. latrans}, have allow~~s and raccoons to 1 ncrease their ranges and densities (Stoudt 1982}.
Iii gh density overwater nesting cover functions to provide protection from predation, egg parasitism, human disturbance and effects of wind or waves. Preferences by overwater nesters for species composition and density of nesting cover has been found to vary among areas. High density nesting by canvasbacks and redheads at Ruby Lake NWR were found hardstem bulrush (Scirpus acutus} with d~nsities of 300-430 stems of res1dual cover per m (S. H. Bouffard, unpubl. data}.
Distribution of nest cover is also important. Female diving ducks usually nest near patches of open water. Steel et al. (1956} found 97% of all diving duck nests were within 14m of open water. At Ruby Lake NWR the mean distance from diving duck nests to open water was 7.5m (S. H. Bouffard, unpubl. data). High interspersion of nesting cover with open water increases the area available to nesting ducks. Weller and Spatcher (1965} recommended a 50:50 ratio of open water:emergent vegetation. At Ruby Lake NWR prime nesting areas were composed of 53% emergent vegetation, 31% open water, and 16% upland. Canvasback nest densities at Ruby Lake NWR are generally high, often exceeding those of the Prairie Pothole Region of southern Prairie Canada. Olson (1964) speculated that selection of small ponds or open water areas within areas of prime nesting cover by nesting canvasbacks reduced parasitism; searching the peripheral cover of small ponds and openings by parasitic redheads was not cost effective in terms of time and energy expenditures.
Human disturbance can have adverse impacts on recruitment of overwater nesting waterfowl. Detrimental effects of human activity on nesting have been reported by Jahn and Hunt (1964} and Keith (1961) and on broods by Beard (1953). Mendall (1958} documented increased waterfowl

Table 1. Comparison of nest success of overwater nests among several studies from various locations in North America.
Species
Ruddy duck Redhead
Mallard Canvasback
Canvasback Redhead Canvasback Canvasback Redhead Ruddy duck Canvasback Redhead Ruddy duck Canvasback R1ng-necked duck
Redhead Canvasback Redhead Ruddy duck Canvasback Redhead Redhead and ruddy duck
Ruddy duck Redhead Ruddy duck Redhead Canvasback
Redhead
Location1
!A
NO MB(potholes)
(large marsh)
AB
SK
ME(1st nests) (renests)
PQ OR ID
MT or
cA
NV(Ruby Lake NWR)
Date Percent
Nest Success2
1939+ A A
1974-77 M
1959-61 A A
1977-80 A A
1961-72 A 1952-65 A
A A
1952-65 A A A
1971-75 A 1943-55 A
A
1969-72 M 1942,46-47 A 1949-51 A
A A
1960-61 A 1967 A 1968 A 1952 A
A 1957 A
A
1972,77-83 M 1984-85 M 1972,77-83 M 1984-85 M
73 56-73
54 21 29 67 50 45 36 52 64 65 52 60 44 70 61 93 43 85 56 67 15 Ioo 74 32 45 69 88 69 13,10 68 5,20
L1 mi ti ng3 Factors Source
1,2 Low 1941a 1 Low 1941b
2 Krapu et al. 1979 1,2,4,5 Olson 1964
2,4 Sayler 1985 2,4 1,2,4,7 Stoudt 1982 1,4,5 Sm1th 1971
2,4,5 Stoudt 1971
5 Sugden 1978 2,3 Mendall 1958
None All1ston 1979 .2,6 Er1ckson 1948
Steel et al. 1956
6,7 Lokemoen 1966 None Mckn1ght 1974 6
2 R1enecker and Anderson 1960
2,6,7,8 s. R. Bouffard, C. C. Evans, and D. E. Sharp, Unpubl. data
1state/Province abbreviations: IA = Iowa; NO = North Dakota; MB = Manitoba; AB = Alberta; SK ~ Saskatchewan: ME = Maine; PQ = Quebec; OR = Oregon; ID = Idaho; MT = Montana; UT = Utah; CA = ~alifornia; NV = Nevada.
Nest success calculations: A = apparent nest success; M = Mayfield nest success. 3Limiting factors (not in order of importance): 1=nest desertion; 2=water level fluctua
tion; 3=predation; 4=mammalian predation; 5=avian predation; 6=parasitism; ?=human disturbance; 8=inclement weather.
155

production follo~ing a closure of boating on Moosehorn NWR. Studies in the early 197o•s at Ruby Lake NWR prompted a closure of boating during peak nesting of canvasbacks and redheads (USFWS 1976). Flushing females off nests by humans can increase vulnerability of the eggs to avian predators.
It has been shown that fish can have negative impacts on waterfowl recruitment. Fish, nesting female ducks, and ducklings function as predators of macroinvertebrates. Macroinvertebrates are necessary for egg production in ducks and growth of ducklings. Reduction of invertebrate numbers by fish and its negative impact on waterfowl production and distribution has been reported (Eriksson 1979, Eadie and Keast 1982, Pehrsson 1984). Carmichael (1983} documented dietary overlap of introduced game fish and diving ducks at Ruby Lake NWR. Canvasback clutch size at Ruby Lake NWR is lower than other marshes (Bouffard 1983} and canvasback duckling growth rates are slower than reported elsewhere (80-90 days to fledging: S. H. Bouffard, unpubl. data}. This suggests that impacts of competition by fish may be occurring.
Review of several studies revealed that water fluctuation, predation and disturbance were important limiting factors in the west, in the pothole area and in the northeast (Table 1}. Nest parasitism was a common limiting·· factor in the pothole area and in the west where redheads and ruddy ducks were common (Table 1). Overall, we concluded that differences in factors affecting nest success ~ere site specific, and that no regional patterns existed.
Management Implications
When water control is possible, the maintenance of relatively stable marsh levels during the nesting season (April-June} is the single most important management practice for increasing recruitment. During the nesting season water levels should not fluctuate more than 10-15 em. Slowly dropping levels are preferable to rising levels. After nests have hatched, water levels can be allowed to fluctuate with the natural regime, or with desired management objectives.
Vegetation management should be directed at maintaining derise, but highly interspersed cover, with 30-50% open water to 50-70% emergent nesting cover ratio. The assimilation of local information on nest success and cover utilization is fundamental in developing sound vegetation management practices, because the density and species of emergent vegetation used for nesting varies among areas. Manipulation of vegetation by water level control may involve
156
trade-offs related to the incompatability of maintaining stable levels during the nesting season.
Various management practices can be used to manipulate cover: water interspersion. Of these, fire should be used cautiously. At Ruby Lake NWR, 2 years were necessary for the residual nest cover to return to its preburn density; no overwater nests were found in burned areas during the 2 years (S. H. Bouffard, unpubl. data}. Bray (1984} found similar recovery rates for residual nest cover in Utah. Therefore, we suggest that burning can be used as a management tool, but should be used sparingly and in small blocks.
Fishing, boating, and other recreational activities should be curtailed on nesting marshes from April through August. Nesting females have been shown to be extremely sensitive to human disturbance during nesting. Although limited information exists on the impact of disturbance on duckling survival, preliminary information suggests that important brood areas should also be protected from high levels of human intrusion (D. E. Sharp, unpubl. data}. Overwater nesters are particularly vulnerable to these types of disturbances because of their dependence on aquatic habitats for nesting, feeding, and brood rearing.
Fish have been shown to compete with waterfowl for food and have negatively affected waterfowl populations. The presence of fish increases the demand for fishing and introduction of bait fish-farming which increase human disturbance. Fish should not be introduced into marshes that are prirnari ly managed for waterfowl.
Predator control has been shown to be cost effective and has increased recruitment of upland nesting waterfowl (Balser et al. 1968, Deubbert and Lokemoen 1980, Lokemoen 1984}. Predator control increased egg hatch rates and improved chick survival of whooping cranes (Grus americana) at Grays Lake NWR (Drewien et a~985). Practices that exclude predators from ground nesting birds, such as electric fences (Lokemoen et al. 1982) have not been tested for diving ducks. Where predation has been shown to limit diving duck production, we recommend that carefully designed studies that evaluate predator exclusion or removal be initiated before extensive predator control programs are implemented.
Management guidelines that we propose are general concepts designed to improve production and reduce the effects of factors limiting recruitment of overwater nesting ducks. These practices may not complement efforts to improve production of upland nesting waterfowl, other

wildlife species, or for management of wintering or migration areas. Wetland managers will have to tailor these concepts to specific areas using local information and integrate management practices for overwater nesting waterfowl with other wildlife objectives. Finally, we strongly recommend that managers carefully design and execute a biologically sound monitoring program to evaluate management practices that are imp 1 emented.
Acknowledgements
We thank B. Blohm, S. Kelly, c. Peck, and C. Smith for providing editorial suggestions and R. Cummins for preparation of the final draft of this manuscript.
LITERATURE CITED
Alliston, w. G. 1979. The population ecology of an isolated nesting population of redheads (Aythya americana). Ph.D. Thesis. Cornell Un1v., Ithaca, NY.
Balser, D. S., H. H. Dill, and H. K. Nelson. 1968. Effect of predator reduction on waterfowl nesting success. J. Wildl. Manage. 32:669-682.
Beard, E. B. 1953. The importance of beaver in waterfowl management at the Seney National Wildlife Refuge. J. Wildl. Manage. 17(4):398-436.
Bouffard, S. H. 1983. Canvasback and redhead productivity at Ruby Lake National Wildlife Refuge. Cal-Neva Wildl. Trans.:84-90.
Bourget, A. A. 1973. Relation of eiders and gulls nesting in mixed colonies in Penobscot Bay, Maine. Auk 90:809-820.
Bowman, G. B., and L. o. Harris. 1980. Effect of spatial heterogeneity on ground-nest depredation. J. Wildl. Manage. 44:806-813.
Bray, M. P. 1984. An evaluation of heron and egret marsh nesting habitat and possible effects of burning. Murrelet 65:57-59.
Carmichael, R. W. 1983. Feeding ecology and aspects of the biology of largemouth bass, rainbow trout, b~own trout, and relict dace and the dietary overlap of largemouth bass and rainbow trout with canvasback and redhead ducks at Ruby Marsh, Nevada. M.S. Thesis. Oregon State Univ., Corvallis.
157
Drewien, R. C., S. H. Bouffard, D. D. Call, and R. A. Wonacott. 1985. The whooping crane cross-fostering experiement: The role of animal damage control. Proc. Second East. Anim. Dam. Cont. Conf. 2:7-13.
Duebbert, H. F., and J. T. Lokemoen. 1980. High duck nesting success in a predatorreduced environment. J. Wildl. Manage. 44:428-437.
Dwernychuk, L. W. and D. A. Boag. 1972a. How vegetative cover protects duck nests from predation. J. Wildl. Manage. 36:955-958.
, and • 1972b. Duck nesting in --associa"'fi'Orlwith gulls - an ecological
trap? Can. J. Zool. 50:559-563.
Eadie, J. M., and A. Keast. 1982. Do goldeneye and perch compete for food? Ocecologia 55:225-230.
Eberhardt, L. E., and A. B. Sargeant. 1977. Mink predation on prairie marshes during the waterfowl breeding season. p. 33-43 in R. L. Phillips and C. Jonkel, eds. Proc.-,r975 Predator Symp. Univ. Mont., Missoula.
Erickson, R. C. 1948. Life history and ecology of the canvas-back Nyroca valisineria (Wi1son), in southeastern Oregon. Ph.D. Thesis. Iowa State Coll., Ames.
Eriksson, M. 0. G. 1979. Competition between fish and goldeneyes Bucephala clangula (L) for common prey. Ocecolog1a. 41:99-107.
Jahn, L. R., and R. A. Hunt. 1964. Duck and coot ecology and management in Wisconsin. Wise. Conserv. Dep. Tech. Bull. 33.
Joyner, D. E. 1975. Duck nest predation by gulls in relation to water depth. Condor 77:339-341.
Keith, L. B. 1961. A study of waterfowl ecology on small impoundments in southeastern Alberta. Wildl. Monogr. 6.
Krapu, G. L., L. G. Talent, and T. J. Dwyer. 1979. Marsh nesting by mallards. Wildl. Soc. Bull. 7:104-110.
Krasowski, T. P., and T. D. Nudds. 1986. · Microhabitat structure of nest sites and
nesting success of diving ducks. J. Wildl. Manage. 50:203-208.
Lokemoen, J. T. 1966. Breeding ecology of the redhead duck in western Montana. J. Wildl. Manage. 30:668-681.

• 1984. Examining economic efficiency of --management practices that enhance waterfowl
production. Trans. N. Am. Wildl. Nat. Resource Conf. 49:584-607.
• H. A. Doty, D. E. Sharp, and J. E. ~eaville. 1982. Electric fences to reduce
mammalian predation on waterfowl nests. Wildl. Soc. Bull. 10:318-323.
Low, J. B. 1941a. Nesting of the ruddy duck in Iowa. Auk. 58:506-517.
. 1941b. The ecology and management of the --redhead, Nyroca americana (Eyton) in Iowa.
Iowa Stat~ege J. Sc1. 16:90-92.
McKnight, D. E. 1974. Dry-land nesting by redheads and ruddy ducks. J. Wildl. Manage. 38:112-119.
Mendal 1, H. L. 1958. The ring-necked duck in the Northeast. Univ. of Maine Bull. 60( 16).
Olson, o. P. 1964. A study of canvasback and redhead breeding populations nesting habits and productivity. Ph.D. Thesis. Univ. of Minn., Minneapolis.
Pehrsson, 0. 1984. Relationship of food to spatial and temporal breeding strategies of mallards in Sweden. J. Wildl. Manage. 48:322-339.
Rienecker, w. C., and W. Anderson. 1960. A waterfowl nesting study on Tule Lake and Lower Klamath National Wildlife Refuges, 1957. Calif. Fish Game 46:481-506.
Sargeant, A. B., S. H. Allen, and R. T. Eberhardt. 1984. Red fox predation on breeding ducks in midcontinent North America. Wildl. Monogr. No. 89.
158
Sayler, R. D. 1985. Brood parasitism and reproduction of canvasbacks and redheads on the Delta Marsh. Ph.D. Dissertation, Univ. of North Dakota, Grand Forks.
Smith, A. G. 1971. Ecological factors affecting waterfowl production in the Alberta Parklands. u.s. Fish and Wildl. Serv. Resour. Pub. 98.
Stoudt, J. H. 1971. Ecological factors affecting waterfowl production in the Saskatchewan Parklands. u.s. Fish Wildl. Serv. Resour. Pub. 99 •
• 1982. Habitat use and productivity of --canvasbacks in southeastern Manitoba, 1961-
72. u.s. Fish and Wildl. Serv. Spec. Sci. Rep. Wildl. No. 248.
Sugden, L. G. 1978. Canvasback habitat use and production in Saskatchewan Parklands. Can. Wildl. Serv. Occ. Pap. No. 34.
U.S. Fish and Wildlife Service. 1976. Environmental impact assessment - effect of power boating on management at Ruby Lake National Wildlife Refuge. U.S. Fish and Wildlife Serv., Portland, OR.
Weller, M. W. 195"9. Parasitic egg laying in the redhead (Aythya americana) and other North American Anatidae. Ecol. Monogr. 29:333-365.
, and C. E. Spatcher. 1965. Role of ----,;abitat in the distribution and abundance of
marsh birds. Iowa St. Univ. Agric. and Home Econ. Exp. Sta. Spec. Rep. No. 43.

Distribution and Impact of Canada Goose Crop Damage in East-Central Wlsconsin1
James W. Heinrich and Scott R. Craven2
ABSTRACT: Near Horicon marsh, in east-central Wisconsin, increasing fall concentrations of Canada geese (Branta canadensis) have produced many opportunities, and a few difficult problems. The problem of crop depredations has plagued the Horicon area since the mid-1960's and has resulted in many changes in goose management in Wisconsin.
A lack of basic data on the attitudes and concerns of Horicon area farmers hindered resolution of the crop depredation issue. In 1985 the Wisconsin Canada Goose Survey was conducted to address this need. A random sample of the 5,960 area farmers received the questionnaire in the mail early in 1986. Two more mailings encouraged those who had not responded to make their opinions known. Eightytwo percent of the sample ultimately returned a usable survey. This reflects responses from 11% of the area's farm population.
lpaper presented at the Eighth Great Plains Wildlife Damage Control Workshop. [Rapid City, S.D., April 28-30, 1987].
2James W. Heinrich, Research Assistant, Dept. of Wildlife Ecology, University of Wisconsin-Madison and Horicon District Supervisor, USDA-APHIS-Animal Damage Control, Waupun, Wisconsin.
Scott R. Craven, Extension Wildlife Specialist, Department of Wildlife Ecology, University of Wisconsin-Madison.
159
Generalizing from the survey data, Horicon area farmers perceived a 1.6 million dollar loss to Canada geese in 1985, mainly in alfalfa, winter wheat, and standing corn. The farmers did not feel that they were able to prevent unacceptable losses, even with the help of propane cannons and other abatement devices supplied by the agencies. They felt that changes in hunting laws and the managed increase in goose numbers had increased their crop losses. The farmers of east-central Wisconsin said that there are too many geese, and they called for a reduction in the flock.
The concerns of Wisconsin's farmers need to be addressed before further growth in the Mississippi Valley Population of Canada geese is approved. The survey results suggested that economic incentives for goose management could make the flock more attractive to farmers. If the value of the flock warrants it, these should be considered. In 1986 we began to examine the economic benefits that the Canada goose flock brings to east-central Wisconsin. Survey information from the local business community, the tourists who came to view the geese, and goose hunters will allow a better assessment of the economic impact of MVP Canada geese in east-central Wisconsin.

Should Ducks Be Frightened?1
William K. Pfeifer and Steven D. Fairaiz1 2
Abstract.--The most common method of resolving waterfowl depredations to small grains is to scare ducks using mechanical scare devices or pyrotechnics. Scaring techniques, however, cause waterfowl to damage, by trampling, up to twice the amount of grain consumed. Conditions such as weather, harvest stage, cultural techniques, farm equipment, length of damage season, availability of alternative feeding sites, and waterfowl population could combine to increase trampling losses. These conditions should be evaluated to determine if large scale scaring projects may actually increase damages to small grains.
INTRODUCTION
Waterfowl depredations to small grains,wheat and barley have been a chronic and common problem in North Dakota since the 1930's. The problem occurs when large concentrations of southerly migrating waterfowl move into an area of unharvested grain and begin feeding. The practice ofswathing, cutting grain into windrows to dry before harvesting, instead of straight combining increases the susceptibility of the small grain to waterfowl depredations.
Depredations w~re identified in the 1950's as being a limiting factor in waterfowl production (Munro and Gollop 1955). As a result, the U.S. Fish and Wildlife Service (FWS) began a large scale project to scare ducks from unharvestedsmall grain fields. Various combinations of mechanical scare devices and pyrotechnics were used to frighten ducks. Waterfowl proved easy to frighten using the usual scare devices, but a question arose as to whether this project would increase or decrease damages.
METHODS
Data were collected over a five-year period, 1975-1980, and evaluated to determine if a state-
1 Paper presented at the Eighth Wildlife Damage Control Workshop, Rapid City, South Dakota, April 28-30, 1987.
2william K. Pfeifer is a retired State Supervisor of the Animal Damage Control Program, U.S. Fish and Wildlife Service, Bismarck, North Dakota. Steven D. Fairaizl is the Staff Biologist for the Animal Damage Control Program, USDA, APHIS, in Reno, Nevada.
160
wide scaring project would reduce losses to small grain farmers caused by waterfowl. Observations were made by field personnel to record the number of days ducks were in a field, the number of fields damaged in an area and to estimate trampling losses. These data were used to evaluate the effectiveness of the project to reduce losses in an area.
A large quantity of scare devices were built, collected and distributed throughout the state. Mechanical scaring devices and pyrotechnics used in this study were: propane exploders, black plastic flags, firearms, 15mm flare pistols, racket bombs, whistle bombs, noise bombs, cracker shells and M-80 type bird bombs. Exploders and pyrotechnics were purchased from a national distributor and flags were built by YACC crews according to specifications established by the FWS (Duncan 1979). Approximately $10,000 of Animal Damage Control (ADC) operational and maintenance funds were expended each year for the purchase and construction of this equipment.
All of these devices were built or purchased by August 1 of each year. Mechanical scaring devices and pyrotechnics were distributed to farmers through ADC field stations and National Wildlife Refuge offices in North Dakota. Farmers were issued equipment after providing information on location of complaint, bird species involved and type of crop damaged. Farmers were also required to sign a liability release before bird bombs were issued. Farmers were not required to obtain a Federal Scare Permit.
ADC personnel conducted demonstrations throughout the state in which scare devices were provided, installed and waterfowl frightened from a field. The demonstration was also used to train neighboring farmers in waterfowl hazing techniques.
RESULTS AND DISCUSSION
In 77 percent of the complaints reported between 1975-1980, ducks were allowed to feed in a field for two days or less before being observed by the landowner or ADC personnel. Mechanical scare devices or pyrotechnics were utilized to frighten the birds from a field. The birds would then select and start feeding in another field and the sequence would be repeated. In 1980, near Devils Lake, ND, a flock of ducks was frightened nine times in a 20-day period. The results were nine irate landowners and a great deal of damage to nine fields due to trampling, feeding and contamination by defecation. In the Mud Lake area during 1979, five complaints were received concerning the same flock of birds over a ten-day period. During 1978 in the Kulm area, approximately 80 complaints were received involving four flocks of ducks in a 20-day period. In some cases, ducks had only alighted in a field before being frightened while, in other cases, ducks were in the field one to two days (Duncan and Zahn, pers. comm.).
In situations such as these, observations indicated waterfowl cause more damage to small grains by trampling than by eating. Sugden and Goerzen (1979) indicated ducks trample twice the amount of grain consumed and that most trampling damage occurs before a field is 30 percent utilized. Moving ducks every two days or less results in maximum trampling damages.
Observations from this study indicated there were several factors which should be considered before a large scale scaring project is implemented. We found that the critical element for success of such a project was the presence of an acceptable alternative feeding site into which ducks could be chased. If an acceptable alternative feeding site did not exist, the scaring project produced limited results because ducks simply continued to enter and cause extensive damage, by trampling, to additional unharvested fields. Observations indicated the most common alternative feeding sites were harvested grain fields, also called stubble fields. Early in the damage season when the harvest is less than 50 percent complete, few stubble fields or alternative feeding sites existed.
The long range weather forecast should be carefully examined to determine the extent that harvest may be delayed. This harvest delay determined the lengtrr of the damage season. Observations indicated that in years with a damage season longer than 30 days, harvest was minimal and scaring techniques produced limited results due to a lack of available alternative feeding sites. Scaring techniques did produce good results in short damage seasons, especially if the short damage season overlapped with waterfowl hunting season.
Observations indicated that scaring small bunches of birds may concentrate waterfowl in an
161
area undiscovered by the landowner resulting in severe damages in a short period of time. Population surveys were used to monitor numbers of birds in an area, locate waterfowl concentrations and to record damage sites not previously reported.
Local cultural practices should be identified before a scaring project is initiated. For example, areas in which chisel plowing is predominant will produce better results from scaring projects than will areas in which molboard plowing is dominant because chisel plowing leaves more stubble and waste grain exposed. Areas which have a high incidence of grain dryers will have a shorter harvest season and, subsequently, a shorter damage season which will increase the effectiveness of scaring techniques.
Analysis of these factors indicated that the lack of alternative feeding sites, an extended damage season, a high population of ducks in the area during the damage season and local cultural practices could combine to reduce the effectiveness of a scaring project by encouraging waterfowl to feed in additional unharvested fields. By feeding in a large number of unharvested fields, ducks cause a great deal of trampling damage in an area. Large scale scaring projects can be effective, however, during a short damage season and if local agricultural practices produce an alternative feeding site.
Obviously, scaring ducks will not cause as much damage to an individual field as allowing the birds to feed unmolested in that field for the duration of the damage season. The benefits to the entire area, however, are diminished when birds are moved from one unharvested field to another every few days because combined trampling losses will increase. Scaring projects would, therefore, produce good results in individual fields, but less overall damage would occur in an area if the birds were allowed to feed in the originally selected field, thereby eating previously trampled grain. Unfortunately, no landowner will willingly accept damages over an extended period of time in the interest of an overall reduction of damages in the area because his individual losses would be high.
When the situation exists of an extended damage season, lack of alternative feeding sites and an unwillingness on the part of the landowners to accept high losses, a large scale scaring project may, in fact, cause more damage than it prevents. In this situation, it may be advantageous to utilize an alternative method of control whereby a lure crop is purchased and waterfowl allowed to feed in an unharvested field of their choice. Waterfowl from adjacent areas are encouraged to use the lure crop through the use of scare devices placed to protect nearby fields. By allowing waterfowl to concentrate and feed in one field for the duration of the damage season, overall losses in the surrounding area can be reduced.

LITERATURE CITED
Duncan, Michael J. 1979. The Use of Plastic Flags for Controlling Waterfowl Damage in Small Grains. U.S. Fish and Wildlife Service, Bismarck, ND. lp. (unnumbered publication).
Duncan, Michael J. and K. Zahn. 1980. U.S. Fish and Wildlife Service, Bismarck, ND, pers. comm.
162
Munro, D.A. and J.B. Gollop. 1955: Canada's place in flyway management. Trans. N. Am. Wildl. and Nat. Resour. Conf. 20:118-125.
Sugden, Lawson G. and D.W. Goerzen. 1979. Preliminary measurements of grain wasted by field feeding mallards. Canadian Wildlife Service, Progress Notes. 5pp.

The Lure Crop Alternative1
Steven D. Fairaizl and William K. Pfeifer2
Abstract.--Lure crops are proposed as an alternative to scaring waterfowl. The lure crop works on the principle of permitting waterfowl to feed undisturbed for the duration of the damage season in an unharvested field of their choice thereby utilizing trampled grain. Waterfowl from adjacent areas are encouraged to use the lure crop through the use of scaring devices placed in protected fields. General criteria for implementation of a lure c~op project and specific criteria for lure crop purchases are presented. Factors contributing to a successful lure crop and problems which reduced lure crop effectiveness are identified. Benefit/ cost analysis of lure crops was completed.
INTRODUCTION
The conflict between waterfowl and North Dakota farmers was recognized around 1905 when the prairies were plowed and seeded. The problem escalated in 1936 when the marshes of Lower Souris National Wildlife Refuge were restored. By 1939 an estimated 200,000 ducks were present on the refuge and severe depredations to shocked grains occurred (Hammond 1961). Numerous isolated instances of depredations, such as these, occurred in the early 1900's but not until the mid-1940's did they generally become widespread. The problem intensified during the war years because of an inadequate supply of ammunition, fewer people hunting less than in normal times, gas, tire and auto rationing, shortage of farm help during the harvest season, cultivation of increased acreages of marginal and submarginal lands, and the rising prices of commodities (Day 1944).
Literature reviews indicated waterfowl depredations to small grains were caused primarily by one or more of the following factors: delayed spring planting, reduced plant growth rate, or wet fall weather conditions. The agricultural practice of swathing grain, instead of straight combining, increased the vulnerability of crops to waterfowl damage.
1Paper presented at the Eighth Wildlife Damage Control Workshop, Rapid City, South Dakota, April 28-30, 1987.
2steven D. Fairaizl is the Staff Biologist for the Animal Dam~ge Control Program, USDA, APHIS, in Reno, Nevada. William K. Pfeifer is the retired State Supervisor of the Animal Damage Control Program, U.S. Fish and Wildlife Service, Bismarck, North Dakota.
163
Depredations continued into the 1950's when the problem was termed a limiting factor in waterfowl management (Munro and Gollop 1955). An antiduck sentiment began developing in the North Dakota agricultural community and farmers threatened to take matters into their own hands. For example, organizations such as the Souris Duck Control Association were formed to deal with the depredation problem. This organization advocated compensatory legislation, duck sterilization, population reductions and wetland drainage. In an attempt to curb these threats, the U.S. Fish and Wildlife Services (FWS), in the 1950's, began scaring ducks from unharvested small grain fields (Hammond 1950)~ Scaring produced limited results in the early part of the damage season or during severe damage seasons because alternative feeding sites into which birds could be chased were minimal. Furthermore, scaring birds from field to field caused inefficient food utilization and increased trampling damages.
Scaring was supplemented by feeding stations established on refuges. The stations worked well in reducing depredations as long as weather conditions allowed vehicle access to maintain a sufficient daily food supply. These two techniques were extensively utilized until the early 1970's.
Due to the limited effectiveness of these projects, the agricultural community requested a study of new approaches for resolution of the problem. Consequently, a three-year lure crop pilot study was established in 1975 to be tested in Bottineau, Nelson and Ramsey Counties of North
3Hammond, M.G. 1950. Waterfowl damage and control measures, lower Souris refuge and vicinity 1950. Unpublished report. U.S. Fish and Wildlife Service.

Dakota. In subsequent years the study was expanded to include the entire state and extended until three years of usable data had been collected.
The basic concept of the lure crop technique was to purchase the crop in a field which had been selected by the birds and where a feeding pattern had been established, thereby allowing birds to congregate and feed undisturbed. Waterfowl feeding in surrounding small grain fields were induced into the lure crop and allowed to feed until the damage potential passed. This process increased feeding efficiency and reduced trampling.
In 1975 and 1978 the project was funded at the $300,000 level. The 1976, 1977, 1979 and 1980 projects had an operational budget of $125,000 to $150,000. From 1975 to 1978 complete expenditures of annual funds did not occur for the following reasons: (1) populations of mallards and pintails, the species which are responsible for most depredations, were low in some counties during harvest; (2) heavy rains in southern Canada delayed harvest and slowed migration into North Dakota; (3) refuge feeding programs kept ducks from entering fields outside the refuge boundary; (4) warm, dry weather allowed for an early harvest; (5) landowners were unwilling to sell a crop to FWS; and (6) an increase of straight combining and grain dryers reduced the length of time the grain was susceptible to waterfowl damage.
During 1979 and 1980 a combination of late spring planting and fall rains produced severe depredations which resulted in numerous opportunities for lure crop purchases and data collection.
METHODS
Lure Crop Purchase
Beginning in early August ground and aerial surveys were conducted to monitor the build-up in local waterfowl populations. Field observations were initiated after a concentration of several hundred field-feeding ducks were located or a complaint received. Data were gathered on numbers and species of birds in the area, length of time birds had been feeding in the field, distance birds were coming to feed, harvest and weather conditions, and land ownership. After contacting the landowner, the options of purchasing the grain as a lure crop field4 or providing extension services for scaring the ducks were discussed.
Animal Damage Control (ADC) personnel had the responsibility for purchasing and releasing lure crop fields and personnel of the Agricultural
4For the purpose of this report, the term "lure crop field" implies ownership of grain only, not ownership of land.
164
Stabilization and Conservation Service (ASCS) appraised the selected field for yield and acreage. The value of the crop was determined by the current inbound elevator price minus the shipping charges. During the 1979 grain handlers' strike, lure crop contracts were based on Minneapolis or Duluth prices rather than the suppressed prices at local elevators. The contract was then completed and the area posted as a "LURE CROP". Adjacent landowners were advised how to scare birds from their unharvested fields into the lure crop.
The lure crop was released when harvest operations in the surrounding area were 75-80 percent complete and the weather conditions became favorable for resuming harvest. All lure crops were released and scaring devices placed in the field prior to the opening of waterfowl hunting season. This procedure prevented a large kill on opening day and allowed hunting by local sportsmen to resolve, by scarin& any later complaints which arose. Upon release of the field, observations were made on the amount and condition of the rema1n1ng grain. If mechanically possible, the landowner was required to harvest the lure crop. Salvaged grain was sold at a local elevator, the amount received deducted from the original contract price, and the difference paid to the farmer. If the field was not harvestable, $5 per acre was deducted from the contract price in lieu of normal harvesting costs. Some salvaged grain was of feed grade quality and was not accepted at the local elevator. In these cases, FWS stored this grain on a nearby National Wildlife Refuge for wildlife feed and the farmer received the full contract price.
In 1979 two harvested fields were rented and baited. Grain was trucked into the field, spread into windrows, and decoys added to attract ducks. Under a special contract, the landowner received a fee of between $250-$350, depending on field size, for the use of his field. Baited fields were released ten days prior to the opening of hunting season in compliance with federal hunting regulations.
Evaluation Procedures
Characteristics of lure crop fields and daily observations were recorded on two separate data sheets. The lure crop data sheet was completed at the time of purchase and daily observation forms were completed each time the field was visited.
During 1979 and 1980, 30 lure crops were selected for evaluation based on the following criteria: (1) expected to hold a minimum of 2,000 ducks; (2) available for sampling before more than two days damage occurred; (3) regular shape and uniformity with respect to yield; and (4) subject to daily observation without disturbing the feeding ducks.
Upon release, lure crops purchased in 1979 were divided into damaged and undamaged strata based on field observations. In fields where

damage was 100 percent, no stratification was possible. Within each stratum, grain kernels from 20 six-inch-square samples were collected. In 1980, samples were also taken at the time of purchase and only ten samples were collected from each stratum or from the total field. These samples were used to determine the extent of damage caused by ducks feeding in a lure crop field.
RESULTS
Total costs of the North Dakota lure crop pilot project incurred from 1975-1980 totaled $289,493.95 (Table 1). Relatively dry weather conditions during the years 1975-1978 resulted in the purchase of one lure crop in 1976 and six in 1978. Late spring planting and fall rain, however, resulted in severe depredations and the
purchase of 34 lure crops in 1979 and 21 in 1980. Between 1976 and 1980, 16 barley, 24 spring wheat and 20 durum crops were purchased (Table 2). During 1979, two harvested fields were rented and baited (Table 3).
The 1979 and 1980 evaluation was designed to measure the amount of damage caused by ducks feeding in a lure crop, quantify trampling damage, and calculate a benefit/cost ratio. In the lure crops used for this evaluation, damage caused by feeding ducks ranged from 2-100 percent in barley fields, 43-100 percent in wheat fields and 52-100 percent in durum fields. In 47 percent of evaluated fields grain damage was 100 percent because ducks ate and trampled all available grain, making harvest mechanically impossible. All of this damage was attributable to ducks because weather conditions cleared and adjacent fields were harvested.
Table 1. Summary of North Dakota Lure Crop Expenditures from 1975 to 1980
Year
1975 1976 1977 1978 1979 1980
Totals Averages
Barley Total Average
No. of Lure Crops Purchased Acres
Net Cost of Lure Crops
Administrative Costs
Evaluation Costs
0 0 0 0 **$30,000.00 1 35 $5,502.50 * ** 0 0 0 0 ** 6 180 19,157.52 * 0
34 1,020 90,542.21 $28,519.00 0 21 778 86,058.22 24,714.50 5,000.00 62 2,013 $201,260.45 $53,233.50 $35,000.00 10 336 $33,543.41 $8,872.25 $5,833.33
*Administrative costs of $8,100 in 1976 and $14,500 in 1978 were taken from operational Animal Damage Control funds. **The 1975 $30,000 appropriation was spent between September 1975 and May 1977.
Table 2. Summary of North Dakota Lure Crops Purchased from 1975 to 1980
No. of Size Yield Total Fields (Acres) (Bu/Acre) Cost/Bu Payment Reductions
16 576.0 688.9 $40.19 $56,020.18 $9,502.10 36.0 43.1 2.51 3,501.26 593.88
Spring Wheat Total 24 629.37 836.42 92.00 87,519.40 5,111.97 Average 26.22 34.85 3.83 3,646.64 213.00
Durum Total 20 572.8 682.8 89.19 80,127.62 8,392.68 Average 28.6 34.1 4.46 4,006.38 419.63
Table 3. Summary of 1979 North Dakota Baited Fields
Total Expenditures
$30,000.00 5,502.50
0 19,157.52
119,061.21 115,772.72
$289,493.95 $48,248.99
Net Payment
$46,518.08 2,907.38
82,407.43 3,433.64
71,734.94 3,586.75
Size Grain Deposited County (Acres) Cost (Bu)
Benson so $250.00 400
Burke 185 350.00 80
Total 235 $600.00 480
Average 118 $300.00 240
165
:'·.
The damage factor used to quantify trampling losses was defined as the total damage, which included trampling and eating, caused by ducks, divided by the amount of grain eaten by ducks. Thus the damage factor is D= ~ where T=amount of grain lost to harvest by trampling and E= amount of grain eaten.
Studies conducted by Hammond (1961), Sugden and Georzen (1979) and observations from the 1979 lure crop project were used to estimate damage factors in the following example. Based on a consumption rate of 115g/bird/day (Sugden 1979), an average 1979 lure crop yield of 35 bu/a and life of 30 days, and the observation that birds were scared from unharvested fields about every two days (Duncan and Zahn, pers. comm.), the following conclusions were drawn: For field sizes of 10-50 acres and flock sizes of 100-10,000 birds, damage factors would range from 2.5-3.15 for barley. In fields with 1,000 ducks, which is the average number in a lure crop field at the time of purchase, the damage factor would be 3. This means that if a lure crop had not been purchased in this area, the dollar value of damage to small grain would have been three times as great as the purchase cost.
Data on the amount of total damage caused by ducks were used to calculate the benefit/cost ratio. Costs were defined as the amount of funds expended on personnel, logistics, equipment, administration and field purchases. Benefits were defined as the dollar value of total damage ducks would have caused without a lure crop field. By dividing the total losses due to depredations (92,027.05) by the net cost of the fields plus administrative costs ($137,654.38) and multiplying by a damage factor of 3, a benefit/cost ratio of 2:1 was calculated for the North Dakota lure crop pilot project.
The number of complaints a lure crop field prevented were estimated by two methods. First, 62 complaints produced the purchase of 60 lure crops and two baited fields. The depredating flocks associated with these lure crops produced an additional 85 complaints before the fields could be purchased. Therefore, a total of 147 complaints were actually resolved by lure crop purchases. Secondly, 30 complaints could have potentially been resolved by the purchase of each lure crop field. This estimate is based on data which indicated that in 77 percent of the reported complaints, ducks were allowed to feed in a field for two days or less. These data are substantiated by the following field observations. In the Mud Lake area during 1979, five complaints were received concerning the same flock of birds over a ten-day period. On the 11th day a lure crop field was acquired and complaints ceased. During 1978 in the Kulm area, approximately 80 complaints were received involving four flocks of ducks in a 20-day period. In some cases, ducks had only alighted in a field before. being frightened while in other cases ducks were in the field one to two days (Duncan and Zahn, pers. comm.).
166
Based on a 60-day damage season and the observation that ducks generally are not allowed to spend more than two days in a field before being frightened, a depredating flock could damage 30 fields. Therefore, a minimum of 147 and a maximum of 1,860 complaints were resolved by the purchase of 60 lure crops and the rental of two baited fields. These data indicated that the purchase of a lure crop stopped all waterfowl depredation complaints in the surrounding area.
Effective range of the lure crops extended to a maximum of five miles based on daily observations of the distance birds traveled from the roost to the field. However, the roost being utilized by ducks was located less than one mile from the field in 78 percent of the lure crops. In several cases, ducks switched roosts to a wetland less than a mile from the lure crop field. These observations indicated lure crops with adjacent wetlands were preferred. In one extreme case, a Nelson county lure crop field attracted, on a daily basis, a flock of ducks 16 miles from Stump Lake. The fidelity of ducks for a selected undisturbed feeding site was indicated by many observations of ducks flying over several miles of swathed grain fields to feed in a lure crop.
The number of days a lure crop was utilized by ducks ranged from 0-48. Fields with zero days usage resulted from preselection, by ADC personnel, of a lure crop field. Ducks appear to have their own criteria for feeding site selection and attempts to preselect alternative sites and attract ducks into those fields failed. Several reasons existed which explain the low number of days of utilization. First, some lure crop fields contained an insufficient food supply and a large number of ducks rapidly consumed all available grain. Second, numerous alternative feeding sites were available. Third, vehicular or human harassment disrupted the waterfowl feeding pattern. Fourth, fields purchased late in September could be utilized by ducks for only a short time before being released prior to the opening of waterfowl hunting season. However, ducks could be held for an entire 60-day damage season when allowed to select their own feeding sites and feed undisturbed, given that a large enough lure crop was purchased.
Ducks will often select another swathed field as a feeding site after abandoning a lure crop. This presented two management options. The first was to purchase a replacement lure crop near the original, which produced very limited results. Ducks often required two to three days to select another permanent feeding site and in the process damaged numerous surrounding fields. The second option involved hauling supplemental grain into the original field. This method could not be used in years when fall rains prevented vehicle access to the field.
The percentages of standing, swathed and harvested fields were determined within a threemile radius of all lure crops purchased from

1976-1980. These data revealed that lure crops were purchased when harvest was 0-85 percent complete. These data were based on small grain only; row crops, such as sunflowers, were excluded. An examination of the relationship between harvest conditions and lure crop effectiveness indicated that all lure crops purchased after the harvest was 50 percent complete could not effectively hold ducks due to the abundance of alternative feeding sites.
The percentage of fall-plowed fields within a three-mile radius of all lure crops was recorded. This revealed that in 88 percent of the lure crops purchased, less than 25 percent of the surrounding fields had been tilled. Fall plowing is defined in this study to be any agricultural practice which results in all available grain being removed. Harvested fields which were tilled once were classified as "harvested fields" because available grain remained, allowing these fields to be used as alternative feeding sites. Fall plowing conditions at the time of purchase ranged from 0-30 percent completed and averaged 13 percent. In 1980, additional data collected from 13 lure crops revealed the amount of fall plowing averaged 10 percent at the time of purchase and 18 percent when lure crops were released. These data indicate that during the damage season, only an additional 8 percent of the surrounding fields were plowed. Data analysis revealed no statistical relationship between fall plowing and lure crop effectiveness.
Hills were a component of 55 percent of the lure crops and 65 percent of the 172 surrounding fields surveyed. Data analysis indicated lure crops did not have a higher probability of having a hill than any of the other surrounding fields. These data imply that hills were not a factor used by ducks when selecting a feeding site.
Grain consumption approached 100 percent in 34 percent of the lure crops. Statistically no relationship existed between the percentage of grain eaten and the effectiveness of a lure crop field. For example, one completely consumed lure crop was ineffective in preventing depredations because the birds abandoned the lure crop and damaged many of the surrounding swathed fields. Conversely, in one lure crop only a small percentage of grain was consumed before the field was released. However, that field was effective in preventing any further depredations in the surrounding area. Factors such as number of days a lure crop was utili~ed, population size, yield, size of field and alternative feeding sites determined the extent of grain consumption.
Population counts revealed 89 percent of the lure crops contained 2,500 birds or more at the time of purchase or shortly thereafter. In the remaining 11 percent of the fields, population levels were below 500 when purchased and never exceeded 2,500.
Size of lure crops ranged from 6-75 acres and averaged 30 acres. Based on bird use days,
167
the optimum size of lure crops ranged from 18-42 acres. The number of days depredations were occurring before the purchase of a lure crop ranged from 0-14. In 93 percent of the lure crops, depredations were occurring eight days or less before purchase. Some of this delay was due to the logistics of completing the lure crop agreement.
The following conditions produced optimum results: (1) harvest operations in the surrounding area were 20 percent or less done, (2) at least 2,500 birds were present in field at time of purchase, (3) an adjacent roost, (4) field size between 20-45 acres, and (5) a sufficient amount of grain to hold birds but not an excess which would result in grain spoilage.
An extremely unusual situation developed in 1980 when an all-time record 30 inches of pr·ecipitation occurred during August and September, completely flooding most small grain fields in the northeast quarter of the state. Under these conditions, thousands of highly preferred alternative feeding sites became available and birds could not reliably be attracted and held on a lure crop. Furthermore, inundation results in grain quality deterioration and prevents mechanical access to the field for harvesting. Under these conditions there was no potential for grain harvest and purchase of additional lure crops could not be justified.
Comparative efficiency studies of lure crops versus baited fields were attempted in 1979 and 1980. In 1979, two harvested small grain fields were rented and baited. The first field successfully held 10,000 ducks for 12 days. The second field was rented when the harvest was approximately 60 percent complete and resulted in limited success because of an inability to hold ducks. The 1980 study was aborted because fall rains prevented vehicle access to the prearranged field. This example indicates that when wet conditions restrict access, feeding stations would have limited value in preventing depredations.
Mechanical scaring devices were not as effective as lure crops during the early part of the damage season. Most fields in the depredation area at this time contained either standing or swathed grain both of which are acceptable feeding sites for ducks, but neither are acceptable to the farmer. During the 1980 damage season, harvest in the Devils Lake area was only 40 percent complete when waterfowl hunting season opened. Therefore, during the entire damage season, in this area, alternative feeding sites into which ducks could be scared were practically nonexistent.
DISCUSSION
Analysis of field observations and data collected from the 62 lure crops revealed the following combination of factors produced successful lure crops: (1) resolution of all complaints within a 78.5 square-mile area, (2) lure crops of a sufficient size (50-100 acres) prevented

depredations throughout a 60-day damage season, (3) lure crops which were capable of supporting a minimum population of 2,500 birds were most successful, (4) lure crops purchased early in the damage season when the harvest was less than 50 percent complete were most successful, and (5) with a benefit/cost ratio of 2:1 lure crops proved cost effective.
Several problems were noted which reduced lure crop effectiveness: (1) when fall rains flooded fields or when the harvest reached 50 percent completion, numerous highly preferred feeding sites were created and ducks could not be reliably held in the lure crop; (2) in years with an extended damage season, small lure crops were quickly consumed allowing ducks to enter and damage surrounding fields; (3) lure crops which sustained a high percentage of damage at the time of purchase, were not able to hold birds for the duration of the damage season; (4) lure crops preselected before damage occurred failed because ducks could not reliably be forced into the field; and (5) lure crops which had a small population at the time of purchase did not exceed 2,500 birds during the damage season and were not cost effective. The following factors were investigated and subsequently shown to have no effect on lure crop efficiency: the number of days of use, grain consumption, presence of hills, and fall plowing.
Analysis of the factors contributing to a successful lure crop resulted in establishment of general and specific criteria. The general criteria for implementation of a lure crop project in a state were: (1) the presence of a bird species which can be scared from field to field easily, quickly, and can be prevented from returning; (2) the ability to attract birds to a lure crop and keep them from surrounding fields; (3) a large concentration of birds must exist in the depredation area; (4) crops must be vulnerable to depredations at the time bird concentrations build up; (5) the potential for a long damage season should exist; and (6) damage must be greater than that caused by eating.
Specific criteria established for lure crop purchase were: (1) a minimum of 2,500 ducks must be present in the surrounding area; (2) during a 30-day damage season, lure crops should be no more than 50 acres in size but a 60-day damage season may require the purchase of 100 acres; (3) the number of alternative feeding sites must be minimal; and ·(4) damage to the field at the time of purchase must be minimal, thereby creating the potential to hold ducks for the duration of the damage season.
168
This study indicated lure crops were uniquely suited to North Dakota for the following reasons: (1) lure crops were used only for ducks, geese, and cranes, species which were easily frightened and cause more ·damage by trampling than eating; (2) only small grain which was especially susceptible to rampling was used for lure crops; (3) when fall rains delayed harvest, acceptable alternative feeding sites into which birds could be scared were minimal; (4) the agricultural practice of swathing compounded trampling; and (5) the latitude of North Dakota is such that a delayed small grain harvest coincides with waterfowl migration.
Field observations delineated circumstances under which lure crop purchases should cease. First, a lure crop should not be purchased when weather conditions result in grain deterioration and prevent harvest. Second, when the harvest reaches 50 percent completion supplemental techniques become more effective. Third, lure crops should not be purchased within two weeks of the opening of waterfowl hunting season because creating large artificial concentrations of waterfowl is not desirable at that time.
Baited fields and mechanical scaring devices were ineffective in controlling waterfowl depredations early in the damage season for the following reasons: (1) fall rains prevented mechanical access, (2) numerous alternative feeding sites existed, and (3) preselection of waterfowl feeding sites was ineffective.
LITERATURE CITED
Day, A.M. 1944. Control of waterfowl depredations. Trans. N. Am. Wildl. and Nat. Resour. Conf. 9:281-287.
Duncan, Michael J. and K. Zahn. 1980. U.S. Fish and Wildlife Service, Personal Communication.
Hammond, Merle C. 1961. Waterfowl feeding stations for controlling crop losses. Trans. N. Am. Wildl. and Nat. Resour. Conf. 26:67-78.
Munro, D.A. and J.B. Gallop. 1955. Canada's place in flyway management. Trans. N. Am. Wildl. and Nat. Resour. Conf. 20:118-125.
Sugden, Lawson G. 1979. Grain consumption by mallards. Wildl. Soc. Bull. 7(1):35-39.
Sugden, Lawson G. and D.W. Goerzen. 1979. Preliminary measurements of grain wasted by field feeding mallards. Canadian Wildlife Service, Progress Notes. 5pp.

Control of One Native Animal Species To Benefit Another Native Species
John T. Lokemoen2
This paper expresses my feelings on the topic of controlling one native animal species (small carnivores) for the benefit of another native species (waterfowl). The relationship between the predator and prey has always been an interesting one. During much of man's experience with wildlife, predators were generally feared and persecuted. It was almost universally agreed that killing predators resulted in larger game populations, which man wanted for food or sport.
These basic beliefs were seriously challenged by several authors in the 1930's and 1940's. Errington studied bobwhite quail in Wisconsin and Iowa and devoted many years to muskrat research in Midwest marshes. Errington became a strong believer that game animal numbers were a reflection of habitat quality. Early in his career Errington {1934) concluded that predators only preyed on bobwhite quail that were surplus to the carrying capacity of the habitat. Errington {1942) pointed out that some birds renested, and that helped compensate for loss to predators. In later papers Errington noted that muskrats suffered severe mortality, but suggested that most of the animals that died would have died anyway because of population pressures or other reasons. Other authors believed the predation on nests was a biological safeguard because it extended the nesting season so all birds would not be killed by a catastrophic storm. Kalmbach {1937) theorized that if crows had not destroyed nests then something else would.
The primary thought that dominated Errington's papers was that predation is a natural force that affects prey but has little significance for prey populations. He advised against extreme attitudes on the subject of predator control on behalf of waterfowl. During this same period Edminster (1939), Bump et al. (1947), and Crissey and Darrow {1949) were studying ruffed grouse in the eastern United States. These biologists concluded that ruffed grouse egg success increased where predators were controlled, but the fall population of ruffed grouse did not increase. Crissey and Darrow (1949) saw a temporary increase in ruffed grouse numbers on Valcour Island where predators were moved, but a slump in the population occurred when disease occurred two years later. About this same time other
1Talk presented at the 8th Great Plains Damage Control Workshop. (Rapid City, SD, April 28-302 1987).
John T. Lokemoen is Wildlife Biologist, Northern Prairie Wildlife Research Center, Jamestown, ND.
169
authors were pointing out that bounty payments on predators resulted in few increases to game numbers.
In total, the above-named authors had an important influence on the theory regarding predation. The papers published by these people produced a philosophy dominant in the 1950's and 1960's that controlling predators was ineffective in benefitting game populations. Game populations were thought to be primarily affected by habitat. The attitudes generated by the studies of the 1930's and 1940's probably reached a peak in the early 1970's when the Leopold (1964) and Cain et al. {1972) reports were issued. These reports examined predator and rodent control programs of the U.S. Department of Interior and resulted in bans on techniques for controlling predators such as the use of strychnine poisons. In most of the areas of the United States habitat management became the primary practice of the game manager. Predator control was seldom used. It seemed that only the first tenet of the Leopold report, which stated "all native animals are resources of inherent interest and should be cared for," was remembered. The second tenet, which said that local population control is an essential part of management where species cause significant damage to other resources, crops, or human health or safety, was forgotten.
Habitat management is indeed a primary tool of the game manager. If managers could dictate the pattern of food, cover, and water in the Dakotas, the resulting ecosystem would be naturally productive of wildlife, and there would be less concern for other management options such as predator control, disease control, bag limits, or shooting hour limits. However, this is not a viable option, and management practices have to be primarily applied intensively on the few acres of land that wildlife people control.
In the eastern Dakotas management of waterfowl by wetland protection alone has not been effective in increasing duck populations. Where wetlands exist Cowardin and Johnson (1979) estimated that the mallard population on unmanaged areas was decreasing at a rate of 2% yearly. In a managed situation with wetland and planted nesting cover, the population of mallards was increasing about 12% annually. Where there was a combination of wetlands, planted cover, and predator control, the mallard population increased at a rate of 263% annually. In eastern North Dakota, Johnson and Sargeant (1977) ~~lculated
that 10 to 20% of the mallard hen population was killed by red foxes each spring. This loss may be more mallards than are killed by hunters in the fall.

In any discussion of predator management as a tool, the following four major arguments are presented against the use of control: 1} Removing predators has little effect on reproductive success; and, even if reproductive success does increase, the population is held in check by other factors. 2) Reducing numbers of predators upsets the delicate natural balance. 3) Predators are necessary to remove the weak and diseased and thereby maintain healthy survivors. 4) If predators were removed small animals would increase abundantly.
In rebuttal to point 1}, several studies have reported increases in game populations as a result of predator management. At Agassiz National Wildlife Refuge, Balser et al. {1968) found increased duck production on that part of the refuge where predators were removed. In California, Gladding et al. (1945) studied the Dunes Lake Club, where valley quail increased greatly when there was a reduction in grazing, increased feeding, and predator control. When predator control was stopped, the quail population slumped almost to zero. On a 100 square mile area in South Dakota where red fox, striped skunk, badgers, and raccoons were controlled, pheasant population averaged 132% higher. Population of ducks on that 10 square mile block rose from about 7 pairs of mallards per square mile to some 44 pairs of mallards per square mile. The population increase was probably a reflection of production one year, and homing of those hens and their young the next year.
In regard to Errington's comment that predators take only prey that is surplus to the population, Lack commented that all Errington's figures showed is that predators took more bobwhite quail when they were abundant than when they were scarce.
Point 2), the balance of nature concept, we often see perpetuated by popular magazines; scientists have called this idea a myth, with good reason. Ehrlich and Birch {1967) pointed out that even in natural situations animal populations undergo dynamic periodic, seasonal, and even daily changes. At a particular site one population may increase greatly or become extinct within a short period. In the Dakotas, for instance, the prairie chickens were introduced to the states as breeding birds, rose to high populations, and declined to near zero in the last 100 years. In this paper I was supposed to talk about the effect on natural predators. However, it is difficult to list the natural complement of predators because several, such as the red fox and raccoon, are new or much increased over pristine conditions. Several species, such as the grizzly bear and plains wolf, are gone, and new ones, including rats, cats, and dogs, have been added.
Point 3) states that the predators take the weak, injured, or diseased, but it might be more accurate to say predators take animals that are vulnerable. In the eastern Dakotas, the animals that are vulnerable are the hens that put nests in narrow shelterbelts, fence rows, and the like where red fox and striped skunk routinely patrol.
170
In conclusion, I believe it is reasonable to affect one population of animals negatively to benefit another. We live in a highly altered environment in which habitats and wildlife change daily. Wildlife managers must be allowed to manipulate all aspects of the environment if they are to have a strong impact on managed animal populations. If managers are limited in the management tools they can use, they will be severely limited in results achieved. When predator control is accomplished it should be done with the following constraints: 1} Predators should not be reduced on large areas that are natural and contain vegetation or animals that were there when man arrived. 2) There should not be any use of hit-or-miss bounty systems. I think we know that the bounty system as applied in the past is not effective in benefitting game populations. 3) Predators should not be controlled where an endangered species might be affected negatively.
Intensive management would have to be practiced on selected areas containing good habitat. Upland nesting waterfowl is an excellent group to manage because it responds well to intensive management. To increase waterfowl production, predator management used to take place only for a short time of the year, mid-March to early July. From previous studies only three animals were responsible for most of the upland nest losses--red fox, striped skunk, and raccoon--so we probably need to apply predator management to only these species. Predator management may have to be different from the forms it has taken in the past. Animals may have to be livetrapped and moved, excluded by fencing, or deterred by chemicals.
LITERATURE CITED
Balser, D. S., G. H. Dill, and H. Nelson. 1968. Effect of predator reduction on waterfowl nesting success. J. Wildl. Manage. 32:669-682.
Bump, G., R. W. Darrow, F. C. Edminster, and W. F. Crissey. 1947. The ruffed grouse life history, propagation, and management. 915 p. New York Cons. Dept.
Cain, S. A., J. A. Kadlec, D. L. Allen, R. A. Cooley, M. H. Hornocker, A. S. Leopold, and F. H. Wagner. 1972. Predator control - 1971: Report to the Council on Environmental Quality and the Department of the Interior by the Advisory Committee on Predator Control. 207 p. Univ. of Mich. Press, Ann Arbor.
Cowardin, L. M., and D. H. Johnson. 1979. Mathematics and mallard management. J. Wildl. Manage. 43:18-35.
Crissey, W. F., and R. W. Darrow. 1949. A study of predator control on Valcour Island. New York State Cons. Dept., Div. Game and Fish. Research Series 1. 28 p.
Duebbert, H. F., and J. T. Lokemoen. 1980. High duck nesting success in a predator-reduced environment. J. Wildl. Manage. 44:428-437.
Edminster, F. C. 1939. The effect of predator control on ruffed grouse populations in New York. J. Wildl. Manage. 3:345-352.

Ehrlich, P. R., and L. C. Birch. 1967. The "balance of nature" and "population control." American Naturalist 101:97-107.
Errington, P. L. 1934. Vulnerability of bob-white populations to predation. Ecology 15:110-127.
Errington, P. L. 1942. On the analysis of productivity in populations of higher vertebrates. J. Wildl. Manage. 6:165-181.
Gladding, B., D. M. Selleck, and F. T. Ross. 1945. Valley quail under private management at the Dune Lakes Club. California Fish and Game 31:166-183.
171
Johnson, D. H., and A. B. Sargeant. 1977. Impact of red fox predation on the sex ratio of prairie mallards. 56 p. USDI Fish and Wildlife Service Wildlife Research Report No. 6.
Kalmbach, E. R. 1937. Crow-waterfowl relationships. USDA Bureau of Biological Survey Circular No. 433.
Leopold, A. S. 1964. Predator and rodent control in the United States. Trans. N. Am. Wildl. and Nat. Resource Conf. 29:27-47.

: .. '.
Policy and Goals of the State of South Dakota1
Gay Simpson2
I am to address the policy of the Department of Game, Fish and Parks toward predator control and management in relation to waterfowl. Waterfowl has always had a high priority with the state of South Dakota. As a state agency, we could have said "let the Feds do it," but we did not take that approach (1} because South Dakota is a production state, lying where it does on the northern end of the Central Flyway, and (2} because we have a healthy population of waterfowl hunters. We sell about 40,000 duck stamps annually. The Department has recognized the importance of waterfowl to the state and its hunters and consequently has given waterfowl a higher priority than it might otherwise have had.
This priority for waterfowl in the state of South Dakota has recently been reinforced, primarily through participation in the Central Flyway. The Central Flyway Council adopted the Central Flyway Mallard Management Plan in July of 1984. By vote in Council, the state of South Dakota endorsed that plan. The plan's primary goal is to increase mallard recruitment. Clearly, the state has committed itself along these lines.
What are we doing and what is the policy? There is no Department-wide policy at this time. As a state agency we are somewhat committed to multiple species management, as is reflected on the lands we manage. They contain a variety of habitat manipulations that are not beneficial to waterfowl. A good example is the tree plantings undertaken in our pheasant restoration effort. We go out onto a native prairie and plant tree belts that may be very good winter cover for pheasants but are also handy dandy homes for some very effective duck predators. We are adding a new element to that part of the landscape, changing the odds for nesting ducks by providing habitat for new members of the community. Thus we have programs within the Department of Game, Fish and Parks that are nearly at cross-purposes with the fairly narrow goal of increasing waterfowl recruitment.
I was requ~sted to write a five-year program plan when I was hired by the Department of Game, Fish and Parks. In that plan, I recommended the following approach to meet our objectives with waterfowl: Choose those game production areas (GPA's) where waterfowl production potential is extremely
1 Talk presented at the 8th Great Plains
Damage Control Workshop. (Rapid City, SD, April 28-302 1987).
Gay Simpson is Waterfowl Biologist, South Dakota Game, Fish and Parks Department, Pierre, SD.
172
high and max1m1ze (not merely optimize) duck production on those areas, while optimizing elsewhere. Predator exclusion or control would be one element in management to maximize waterfowl production. This approach would not have to be all-encompassing, and would allow continued multi-species management on many areas. To date the five-year plan has received no endorsement or implementation authority from the Department.
The approach of the state with regard to managing furbearers (predators} is through its hunters and trappers. I'm not certain what the past situation was in South Dakota, but I get the impression from Conservation Officers that it hasn't been very long since these "critters" were called varmints in the state, and attempts to manage them as furbearers have been recent. We currently have furbearer seasons that are not what you would expect if the aim were to increase duck nest success in general. We have greater expanses of nesting cover that allow the birds to disperse. West River, the fox, raccoon and badger seasons are open year-round. East River, where those predators are a problem, those seasons are not year-round. In fact, the fox season ends February 28, the raccoon and badger on March 31, just prior, of course, to the time when taking those animals from GPA's might be beneficial for hen survival and nest success. At present, because we do have strong recreational and economic interests in furbearers (trappers and predator hunters), the Department of Game, Fish and Parks has a "de facto" policy of not controlling predators on state lands in spring to increase duck nest success, except behind predator-exclusion fences and on Lake Albert Island. Of course, there aren't too many people who are going to be interested in trapping fox after the value of the fur decreases.
We at Game, Fish and Parks are clearly not on track with a cohesive policy from the Secretary or the Division Director toward controlling predators. Our ADC group program, which you heard quite a bit about yesterday, has a comprehensive approach, but it is one that is not integrated with the duck recruitment program within the state. So we have some progress to make. There are some connections yet to be made. While recreational trapping during prime fur seasons will do little to make our GPA's safer for nesting hens in spring, we can utilize our own Department's ADC expertise in applying predator control on selected GPA's where we have reason to believe it will be effective. Such an integrated approach will be absolutely necessary if South Dakota is to meet its objectives under the Central Flyway Mallard Management Plan.

Policy and Goals on National Wildlife Refuges1
Len McDaniels 2
The information that I am to present is the National Wildlife Refuge policy in regard to predator control. One of the goals of the National Wildlife Refuge System is to perpetuate the migratory bird resource. Since 1983 the policy of animal control on National Wildlife Refuges is to assess the effects of predation on breeding ducks; and, if predators are compromising waterfowl production, controls may be implemented. However, in reading the manual for policy on predator control, I found there are a lot of "hoops" to jump through before starting a predator control program.
Several alternatives of predator control need to be considered. These include: (1) Environmental manipulation, such as eliminating predator den sites, but, primarily manipulation through habitat management. According to the refuge manual, habitat must be adequate for migratory birds to meet the objectives established for a particular refuge. (2) Live trapping and transfer of predators. This requires a lot of effort and only transfers the problem elsewhere. (3) Public or recreational harvest of predators. This practice is conducted at the wrong time of the year to keep predators away from duck nests. I have noticed that recreational harvest of predators makes remaining predators more "trap-wise" requiring extra effort to control. (4) Non-lethal repellants. (5) Physical and mechanical barriers, i.e., electric fencing. (6) Lethal reduction by trapping and shooting. (7) Lethal reduction with chemicals. Toxicants are prohibited on all National Wildlife Refuges for bird and animal control. However, there are specific exceptions usually involving endangered species like the whooping crane or Aleutian goose. In the late sixties 1080 drop baits were dropped from an airplane to eliminate arctic foxes on several islands in Alaska to enhance production of Aleutian geese. During the 70's and early 80's, refuge people from Alaska attempted and in several instances did eliminate arctic foxes from islands without lethal chemicals. However it was a very labor-intensive project. Yesterda; we heard they are again using lethaL chemicals to control the arctic fox to raise Aleutian geese.
Approved plans are required for all predator control alternatives with the exceptions of live trapping and transfer, use of physical barriers, and
1 Talk presented at the 8th Great Plains Damage Control Workshop. (Rapid City, SD, April 28-30' 1987).
2Len McDaniels is Refuge Manager, Valentine National Wildlife Refuge, Valentine, NE.
173
repellants. All approved predator control plans are required to meet NEPA guidelines. One must discuss the proposed alternative or mode of action as well as all alternatives. Lethal control of predators is to be conducted on a site-specific basis and not on a wide-range population reduction basis. Control efforts cannot be implemented without coordination with research and development, and local state conservation agency. This basically summarizes the manual policy on predator control on National Wildlife Refuges.
Since working at Valentine Refuge I have generated a few ideas of my own on predator control and migratory bird production. One can identify major predators and control those species; however, another predator species will attempt to replace them. I wonder just how many predator species are actually available to destroy duck nests. I also believe that ducks, for some peculiar reason, are subject to excessive predation as compared to upland nesting of sharptails and pheasants. We identified coyotes and bullsnakes as our major nest predators on Valentine Refuge. When we reduced coyotes, bullsnakes became the major predator, eating the duck eggs that coyotes were no longer eating. Controlling coyotes without controlling bullsnakes did not reduce overall predation on duck nests.
We have areas on the Valentine Refuge with high waterfowl nesting densities, and it is surprising how few or small the predators can be and still devastate hatching success. A den of weasels in an area of high nest density can greatly reduce nesting success. The problem with long-tailed weasels occurs in mid-June, about the time young weasles become active outside the den. Trapping weasels is not a problem as long as we know they are present. But, in most cases dense cover makes it almost impossible to detect them. By the time you discover you have a weasel problem and find them, it is generally too late to implement control measures-the damage has already been done.
It seems that nest destruction never stops; if it is not one predator then it is another. Considering present land use I am sure that in the future the only way to go is by intensive management; that is, if we are to get duck populations up to objective levels that are on the books today. The only way to achieve high duck populations under existing land usage is to attract high duck nesting densities and keep predators away from them.

Policy and Goals of the U.S. Fish and Wildlife Service1
Harold Doty2
A recent memo out of our regional office says that we shall refer to this subject as seasonal predator managemGnt. You know it covers a lot of other terms; we used to call it predator control and so on. But going back to the origins of pr~dator management in this country, we generally thln~ of protecting domestic crops, be it trees or gra1ns or sheep or cattle.
If you turn in another direction_and lo~k towards Europe, you can see many centur1es of lnvolvement in use of the land. There game is a product of the land and is owned by the landowner. They refer to game as their property and handl~ it as such .. In some places it is managed out of ex1stence, and :n others it is highest on their agenda for product1on. Predators of game, if landowners want to raise game, are considered vermin. They are not given the time of day or words of praise. It gets down to standard approach and is not even talked about; landowners decided centuries ago that the vermin would be removed so that they could raise the pheasant or cottontail or whatever they want to raise.
I think back to the philosophy of the balance of nature a popularized conundrum during the youth of most of us here and maybe at Northern Prairie Wildlife Research Center, where I worked from 1968 through 1984. In the early years (1960's) most of the people there had grown up with that philosophy and teachings, and it was rather a shock t~ see what was occurring with duck nesting out there ln the real world. It was a significant shock to see the overall effects on nesting. By 1973 there was a consensus at that station that it was something that had to be reckoned with in one way or another if we were going to preserve or enhance waterfowl production. We have not come to the point of European game management, although that may be arriving on the East Coast and other areas east of here.
There are some more recent papers describing our written policies in the U.S. Fish and Wildlife Service. I am just going to read a few quotes from some of these. 'The one April 11, 1983 states, "It shall be the policy of the U.S. Fish and Wildlife Service to appraise the effects of predation on breeding waterfowl on service lands. In those circumstances, where it is determined that waterfowl
1Talk presented at the 8th Great Plains Damage Control Workshop. (Rapid City, SD, April 28-30,_ 1987).
ZHarold Doty is a Wildlife Biologist, U.S. Fish and Wildlife Service, Fergus Falls, MN.
174
production objectives are being compromised because of predation of waterfowl, their eggs or their young and other reasonable efforts have proven unsuccessful the service may implement predator management. This policy is to be implemented as a site specific application when definite results are desired not for the rangewide reduction of predator populations." The paper I gave yesterday is an early step into that realm of working not only on our lands but neighbors' lands. We have roughly two to three farms per square mile in that western Minnesota area. So we work with a lot of private landowners.
When appropriate, improvement of waterfowl nesting habitat is to be performed before the application of predator management and shall be continued during predator management activities. Jumping ahead to June 11, 1985, our previous director in Washington, Robert Jantzen, said that predator management " ... should be used to increase waterfowl production on refuges and WPAs where predators are a problem." I took that out of context, but that was his statement and it still stands. Now there is another restriction. States must be consulted on assessments in predator/waterfowl relationships and should concur with any proposed management strategy on service lands. That has led us to the environmental assessments, and I have two draft copies here. One refers to this Midcontinent Project, another refers to the Wetlands Management Districts of western Minnesota. These are still draft copies and they are not accepted. They are getting heavier each time they are rewritten. They have been reviewed and comments have come in from such groups as the Humane Society of the United States. With comments both pro and con, both sides of the question are represented, I do not know how that will be resolved, yet. The Refuge Management Manual in June, 1985, states, "The policy of the U.S. Fish and Wildlife Service is to aggressively implement predator management in those circumstances where determination has been made that waterfowl production objectives are being compromised due to predation."
A recent waterfowl nesting study out of the Northern Prairie Center dealt with the Canadian prairies during the five-year standardized hunting regulations period on waterfowl, and also some extensive examinations of breeding habitat. Twentyseven people, divided into five crews worked for three full years and covered a lot of prairies in Canada. Ray Greenwood out of the research center and Al Sargent rode herd over this project. The end result was that predation there is almost as bad as in North Dakota and western Minnesota. The old philosophy that our ducks all come out of Canada is not going to hold up. The headline of this news

article says, "Ducks losing shrinking habitat areas to predators." So it is the same old story wherever we have looked. Here is another one that describes the data in Canada and the United States, and finds them comparable. The overall conclusion is that the odds are against the hens hatching a successful nest. The North American Waterfowl Management Plan came out in May 1986 and was slightly vague on this predator management thing; but, if you read carefully you can, on pages 25 and 26, come up with some specifics.
Referring to Fish and Wildlife Service or Dedicated Lands for Waterfowl Production, the Plan calls for improving duck recruitment on such lands. A variety of management techniques should be considered to reduce the effects of agricultural practices and predation on nesting ducks and their eggs. The desired result is to achieve a nest hatching success of SO% by 1995. Now, I checked into that and they are not talking about just observed or apparent nest success--they are talking about May field nest success. And, if that is a goal that is stated correctly, we are really going to ~ave to confront predators on a wide scale or at least in some good habitat areas.
It has been determined that coyotes without young pups kill fewer sheep. So possibly a fox without pups kills fewer ducks. Al Sargent's data suggest that fox do not overkill. They will kill up to a ten-day supply of meat (keep it in the larder,
175
so to speak) cached, and after that point they know where the ducks are nesting in their home range but do not necessarily kill them. This finding is based on research done nearly 20 years ago on Arrowwood Refuge in North Dakota. Other thoughts in predator management are aversion agents, which have gone through quite a lot of research without a lot of success; scent scramblers and aromatics which Ken Higgins has suggested from time to time; and other kinds of vegetation barriers, possibly. We have not found anything yet that keeps predators away from nests effectively for a very long period of time. Here is another thought--sound barriers. Maybe it holds something for the future; we do not know. Other kinds of research dealing with the biology of the species may be important; for example, removing litters from red foxes on home ranges and maintaining a pair there without young to feed. Habitat manipulations of other kinds are also suggested. There are probably other things that could be done in the way of intensive game management. I was looking at one of these brochures just yesterday on guard dogs. It may be a wild thought, but guard dogs may be trained to protect Waterfowl Production Areas. If we could find the right kind of dog with the right attitude and train it properly, then provided dog food, water and shelter, theoretically it could take care of the place. This would keep almost all of the predator management critics happy while enhancing waterfowl production. There could be other wild thoughts but that is just one of them. I am going to let it go at that point.

Policy and Goals in the Private Sector1
Rick Warhurst2
Today I am supposed to talk about policy and goals for predator management and control to enhance waterfowl production in the private sector. The private sector includes a wide array of interests. Each of you probably has a particular opinion. You have already observed some different thinking, some different languages, in reference to predator control from previous panel members. If you extrapolate that over the whole United States population, which would be the private sector, it would include a wide array of interests and thoughts.
In addition, there are a lot of different organizations, many wildlife conservation organizations. Obviously there are many different kinds of thinking, objectives, interests, etc., all having their own specific ideas on the subject. If you were to talk to John Grandy, of the United States Humane Society, you would probably get a different answer than I would give. Even though John did some work with waterfowl and knows waterfowl biology, his answer, I am sure, concerning control of predators to raise ducks would be much different than if you talked to Len McDaniels about the subject. I did not question some of the various other wildlife organizations, such as the National Wildlife Federation, Audubon Society, or the Sierra Club and others with which you are familiar, concerning their policy as it concerns predator control to enhance waterfowl production. I am not sure what their philosophies are completely. Maybe they do not have policies or philosophies or goals. However, I do not think they would be as enthused about controlling predators to raise ducks as some of us are about the subject.
Ducks Unlimited (D.U.) has a membership of 600,000, and all the habitat enhancement and development work that occurs, and all the money that is raised comes from those 600,000 people, which is a pretty small number when compared to the population of the whole United States. Our membership, which is primarily made up of duck hunters and people interested in seeing large numbers of ducks or waterfowl, has shown that they are willing to put their money up fFont so that they can enjoy the benefits of the sport of waterfowling and a wildlife legacy.
1 Talk presented at the Rth Great Plains
Damage Control Workshop. (Rapid City, SD, April 28-30 1987).
2Rick Warhurst is Regional Biologist, Ducks Unlimited, Bismarck, ND.
176
Of course, that is why back in 1937 when Ducks Unlimited was founded there were men with ample financial means and foresight enough to realize that unless something was done by the private sector, particularly in Canada, there was not going to be a waterfowl legacy. They had come through the severe drought of the 30's and had observed the skies that once were blackened with ducks dwindle to a scant remnant of ducks migrating up and down the flyways. These men could see there were not going to be any ducks in the future unless actions were taken quickly. Hence D.U. was established. So D.U. has put their money to work on the ground in the development of wetland habitats. Through the years D.U. has followed a singleness of purpose concept, the enhancement and development of habitat so that there would be production habitat for waterfowl. In recent years we have begun working on wintering areas and in most recent years, since 1985, working on migration habitat (MARSH Program). But still the main emphasis for Ducks Unlimited is in the waterfowl production country. Yesterday, in the paper I presented, I covered a wide array of projects, show_ing a lot of slides of some of the different kinds of projects we've built. We have used many different techniques and methods to separate predators from waterfowl nests, waterfowl nesting hens, and eggs.
Ducks Unlimited does not have a policy on predator control or predator management. We attempt to analyze a specific management area and to determine what is the limiting factor or factors for waterfowl production on that area; such as, a lack of secure nesting cover, or brood water, or a combination of these types of things. Then we address our project development to overcome that limiting factor so that waterfowl production can reach its maximum capacity or ultimate production potential on this particular management area. Again, our project attempts to address the factors limiting waterfowl production on the proposed project site. The development of proper habitat and the expansion of habitat has been the aspect which D.U. has stressed most during its fifty years. We have attempted to restore or create new or otherwise enhance waterfowl production habitat, particularly wetland habitat. Restoration of wetlands is an example of the types of production habitat improvement projects that D.U. develops. Yesterday I showed several slides of some of the twelve hundred acres D.U. has of wetland habitat restored in west-central Minnesota in cooperation with Midcontinent Waterfowl Management Program. That project also included restoring or reseeding 3,000 acres of upland nesting cover. Other D.U. projects involve installing water control structures

on various marshes which no longer produce as a result of a lack of water level control capability, severe infestation with rough fish, or if water levels have been too high in the area wetland too long. A planned drawdown of the wetland is utilized to restore high productivity and diversity to the marsh. We install control structures to facilitate drawdown of water and to allow more intensive management of the wetland.
Ducks Unlimited has developed projects in areas where there are fewer egg-eating predators or a different predator base, such as the West River country of the Dakotas and eastern Montana. Yesterday I mentioned some results concerning some of our brood counts on a few of the West River projects. They do produce ducks. These wetlands are not in what is considered prime prairie pothole country, but when water is available in the West River country, those wetlands do produce ducks. They produce ducks at an equal rate or better than some of the areas that we consider prime duck production pothole country.
We also create islands to separate predators from waterfowl nests either by separating peninsulas from the mainland with electric fences or physical excavations. We often build nesting islands. I showed a slide yesterday of a scraper sitting in the water at Katy's Lake in Montana after breaking through the ice, so building islands is not always nice and easy. It can be very expensive. Definitely electric fences are cheaper to construct; however, they do have a great deal of manpower maintenance requirements. For this reason we prefer, if it is possible, to cut off a peninsula to create a permanent island.
The use of artificial nesting structures is another method that we have tried to decrease waterfowl nest predation. You would think everyone would agree that nesting structures are a good idea, but that is not true. Within the U.S. Fish and Wildlife Service there are different philosophies concerning the use of artificial nesting structures. Some say they are not natural, they do not look good out there on the landscape. Ducks Unlimited is, I guess, trying to produce ducks, so within reason, we do not care how they look, if I can be so blunt. We want to produce ducks; we want to restore waterfowl populations to acceptable numbers--numbers with which sportsmen can be satisfied. and that are
satisfactory to the general public. Gay Simpson mentioned to me this morning that some of the local folks up in Alaska in the Chugach National Forest region are not real happy with the idea of hazing brown bears away from the artificial goose nesting structures D.U. constructed and placed in the forest's wetlands to enhance production of the Dusky Canada Geese. Brown bears have become a major predaredator of the nesting geese. Nest success has fallen to very low levels. Hopefully the nest structures will provide predator-free nesting sites for the Duskys.
Again, the private sector includes a wide array of interests and a wide array of different thoughts and philosophies concerning predators. Just what is
177
a predator? Some people would say a fox is just as important as a duck. It comes down to what our personal values are.
Hal Doty and Gay mentioned the North American Waterfowl Plan. It was signed May 1986, by the Prime Minister of Canada and our U.S. governmental officials. Ducks Unlimited is one of the first organizations to become involved with this and support the North American Waterfowl Management Plan. I mentioned yesterday that Ducks Unlimited has constructed some 3,200 development projects in Canada and in the U.S., including some 2,000,000 acres of wetland and waterfowl habitat that has been improved and enhanced for waterfowl production. One of the important aspects of this North American Plan is that it sets specific goals for different populations of waterfowl, and it also defines goals for habitat needs and habitat acquisitions.
Point number two of the specific Recommendations Section for Future Actions (p. 27) suggests that protection and improvement of over 1,000,000 additional acres of mallard and pintail breeding habitat in the pothole area of the north-central U.S. are also needed. That is a lot of acreage, especially in light of the fact, that for 50 years D.U. has been developing projects, and we have enhanced just a little over 2,000,000 acres. Over 1,000,000 more acres are needed. It's a big challenge. Ducks Unlimited has pledged over 550 million dollars over the next 15 years as a m1n1mum for meeting these habitat needs. We have challenged some of the other wildlife organizations, to put it in the words of Dale Whitesell, our former executive vice president, "to put their money where their mouth is" so to speak--to get behind this Plan and to give their support monetarily to expand the habitat base for waterfowl and waterfowl production.
In summary, we do not b~:~ve a poJ icy and goal for predator management in Ducks Unlimited to control predators to enhance waterfowl production. We try to examine the limiting factor for waterfowl production on a proposed project site and address our project development to overcome this weakness to allow the specific management area to produce more waterfowl. If a lack of secure nesting habitat is the limiting factor, we address that by trying to develop electric fence cutoffs or electric fence exclosures, or constructing nesting islands to attempt to improve waterfowl production. The management of our projects withiri the United States is the responsibility of the cooperating agency. For example, if we develop a cooperative project with the South Dakota Department of Game, Fish and Parks, a Project Management Plan is submitted by the Game, Fish and Parks to us prior to D.U. contracting for development of the project. If we are both in agreement with the plan, the project is developed. The implementation of that plan is the responsibility of the Game and Fish Department. What about some of those predators out there on the islands and peninsulas that get trapped there after you get it fenced? Each year, just after ice out, the managing agency personnel clean off the islands or the various peninsulas. Ducks Unlimited does not have the personnel to do that. Again the cooperating agency

does the management. They remove predators from the islands and points.
I have tried to emphasize that in the private sector there are a lot of different interests and a wide array of philosophies. Some of the people may
178
not agree with our D.U. philosophy. Six hundred thousand people who are members of Ducks Unlimited contribute very substantially, and would like to see more waterfowl. We are willing to do whatever it takes to insure that waterfowl legacy for my children, your children and future generations.

Decoying Coyotes with Dogs1
Gary J. Rowley2 and DeLyle Rowley3 ' 4 '
Abstract.--Decoy dogs, used in conjunction with a predator call or coyote howl, are an effective technique to reduce coyote depredation on domestic sheep ranges during the spring and summer when coyotes are highly territorial and aggressively protect their young and den area. Trained decoy dogs, when chased by coyotes, return to their owner bringing the coyotes into shooting range. The type of dogs used successfully for this work is discussed.
INTRODUCTION
Professionals in Animal Damage Control (ADC) have used dogs (Canis familiaris) as a technique in controlling predation by coyotes (Canis latrans) for many years. Denning dogs are used in locating coyote dens (Wade 1978) and aid in destroying the pups; greyhounds hunt by sight, pursue, capture, and kill the coyote (Wade 1973), and hounds are used similar to greyhounds, but trail by scent <Duffey 1964, Hawthorne 1980). The use of decoy dogs in ADC operations started in the mid to late 1960's. Decoy dogs lure coyotes by provoking the defensive and den guarding behavior of coyotes by intruding in their territory and natal area.
Food and energy demands of adult coyotes steadily increase from estrus to weaning. Subsequently predation to livestock, particularly sheep and goats,
1Paper presented at the Eighth Great Plains Wildlife Damage Control Workshop, Howard Johnson's, Rapid City, S.D. April 28-30, 1987
2Gary J. Rowley, District Supervisor, USDA - APHIS - ADC, Craig, Colorado.
3DeLyle Rowley, District Supervisor, USDA - APHIS - ADC, Montrose, Colorado.
4Gary J. Rowley and DeLyle Rowley are credited as forerunners instrumental in development, employment, and use of decoy dogs in operational ADC programs.
179
also increases. Established territories and den sites are highly defended and protected (Kleiman and Brady 1978). Intruding canid species, particularly domestic dogs, are agressively attacked by coyotes in an effort to provide protection to their young. This display of defensive behavior is effectively used as a strategy to control depredating coyotes.
The use of decoy dogs in reducing coyote predation has many applications and can be successfully used in any habitat and terrain. It is one of the most effective and efficient means of selective coyote damage control during the late spring and summer grazing seasons.
APPLICATION
Adult coyotes normally hunt at night and early morning and return mid-morning to the den to feed their offspring (Young and Jackson 1951). Vocalization of adult coyotes is easily instigated at this time. Imitating a coyote howl by a person's voice or using a predator call encourages a response from the coyote(s). This response can be used for triangulation in estimating the coyote(s) location.
Approach the den site cautiously and select a "stand" location. It is very important to select oa place where the wind is blowing directly from the den to the stand. This favorable wind direction provides an olfactory advantage to the decoy dogs in detecting the scent of the coyote(s) and a disadvantage to the

coyote(s) in detecting the shooter sitting on the stand. 1be use of 1 decoy dog has been successful, but 2 provide the best results. However, the use of 3 or more dogs appears to reduce success. It is speculated that the presence of 3 or more dogs may increase intimidation and decrease aggression in the coyote(s).
Once the stand is selected and the shooter is in position, reproduce a coyote howl. Usually, the coyote(s) respond with a return howl and come to investigate the sound. Immediately after hearing the coyote(s) howl, the decoy dogs respond and sprint toward the approaching coyote(s). After visually locating the coyote(s), the decoy dogs will begin to chase it. Coyote(s) will normally respond by barking as a warning to the encroaching decoy dogs. This barking also acts as a stimulus and encourages other coyotes near the area to investigate the disturbance. In some cases, the coyote(s) will become frightened when confronting the decoy dogs and retreat. However, frequently the retreating coyote(s) stops, holds its ground, reverses the dominance, and begins to chase the dogs. It is common tor the decoy dogs and coyote(s) to exchange dominance during the chase. During this time, the shooter should be patient, restrict movement, and remain out of sight. With increased experience, decoy dogs learn not to chase coyote(s) for long distances before returning.
When the decoy dogs begin to return to the stand the coyote(s) will pursue, and their aggression and attacks intensify. Fights occasionally occur if the coyote(s) captures the dog. In very aggressive attacks, coyote(s) appear to be less cautious as full attention is given to the decoy dogs. This provides the shooter an advantage. When using decoy dogs from the start of denning season to late summer when the pups disperse, it is not unusual for more than 2 adult coyotes to appear and join in the chase. The authors have witnessed up to 6 adult coyotes attacking the.decoy dogs in one location.
Most of the time when the decoy dogs return to the stand the coyote<s> will be following. Very often the decoy dogs will successfully lure the coyote(s) within 10 yards of the stand. The use of a shotgun accompanied with a rifle is recommended. Often the coyotes concentration on the decoy dog is so great that they pay no attention to the shooting. If escape occurs, encourage
180
the decoy dogs to pursue and in conjunction reproduce a coyote howl. Occasionally the fleeing coyote<s> will stop, show aggression and resume chasing the decoy dogs and provide the shooter with another attempt.
Infrequently, the coyote(s) refuse to evoke a chase and will only respond to the decoy dogs for a short distance from the den site. A possible explanation for this behavior is that the coyote(s) are at their extreme distance from the den site. If this is suspected, select a closer stand, approach cautiously and prevent the coyote(s) from visually detecting the shooter.
BREEDS OF DOGS
No one breed of dog is specifically used in developing decoy dogs. It is the dog's individual characteristics, qualities and training which dictates the success. Usually medium sized dogs (25-50 pounds> with medium build are best suited. Color or physical appearance of dogs has little or no relative effect on coyotes. Short-haired dogs are preferred in summer due to the heat factor.
•rhe more common breeds of dogs the authors have successfully used are: McNabb shepherds, Border collies, Australian shepherds, Norwegian elkhounds, and wirehaired terriers. A few of the hound breeds and large terriers have developed into excellent decoy dogs, but the majority tend to be too aggressive.
TRAINING
Preferred attributes and traits required ot a dog for consideration as a prospective decoy dog are few. Proper training and experience are imperative in developing a successful dog. Basic characteristics needed in selecting a candidate dog are: (a) one that likes to hunt, (b) one that will free range within 400 to 500 yards, and (c) one that possesses a small amount of aggressiveness. Start the training by familiarizing the dog with a trapped or snared coyote to encourage assertiveness and build confidence. Have the dog accompany the trainer when calling and denning and allow the dog to free range. Accustom the dog with rifle and shotgun fire but avoid muzzleblast by restricting the shooting when the dog is very close

or directly in front. Once a dog becomes "gun shy", it is useless.
ACKNOWLEDGMENTS
The authors are grateful to all USDA - APHIS - ADC personnel in Utah, Colorado, and California who, through the years, have provided improvement and training suggestions. A special thanks to H. Alan Foster, State Director, USDA - APHIS - ADC, Grand Junction, Colorado, and George E. Graves, Wildlife Biologist, USDA - APHIS - ADC, Lakewood, Colorado, for their assistance in writing this manuscript and for providing helpful editorial comments. We also wish to thank Barbara Dillard and Joyce Brown for typing the draft and final manuscript.
LITERATURE CITED
Duffey, D.M. 1964. Coyote hounds in Texas. Outdoor Life. 134: 118-122.
181
Hawthorne, D.W. 1980. Wildlife damage and control techniques. Pages 411-439 in S.D. Schemnitz, ed. Wildlife management techniques manual. The Wildlife Society. Washington, D.C.
Kleiman, D.G., and C.A. Brady. 1978. Coyote behavior in the context of recent canid research: problems and perspectives. Pages 163-188 in M. Bekoff, ed. Coyotes biology, behavior, and management. Academic Press. New York, N.Y.
Wade, D.A. 1973. Control of damage by coyotes and some other carnivores. Colo. State Univ. Coop. Ext. Serv. Bull. 482a, Fort Collins. 16pp.
_____ . 1978. Coyote damage: a survey of its nature and scope, control measures and their application. Pages 347-368 in M. Bekoff, ed. Coyotes biology, behavior, and management. Academic Press. New York, N.Y.
Young, S.P., and H.H.T. Jackson. 1951. The clever coyote. Wild!. Manage. Institute. Washington, D.C. 4llpp.
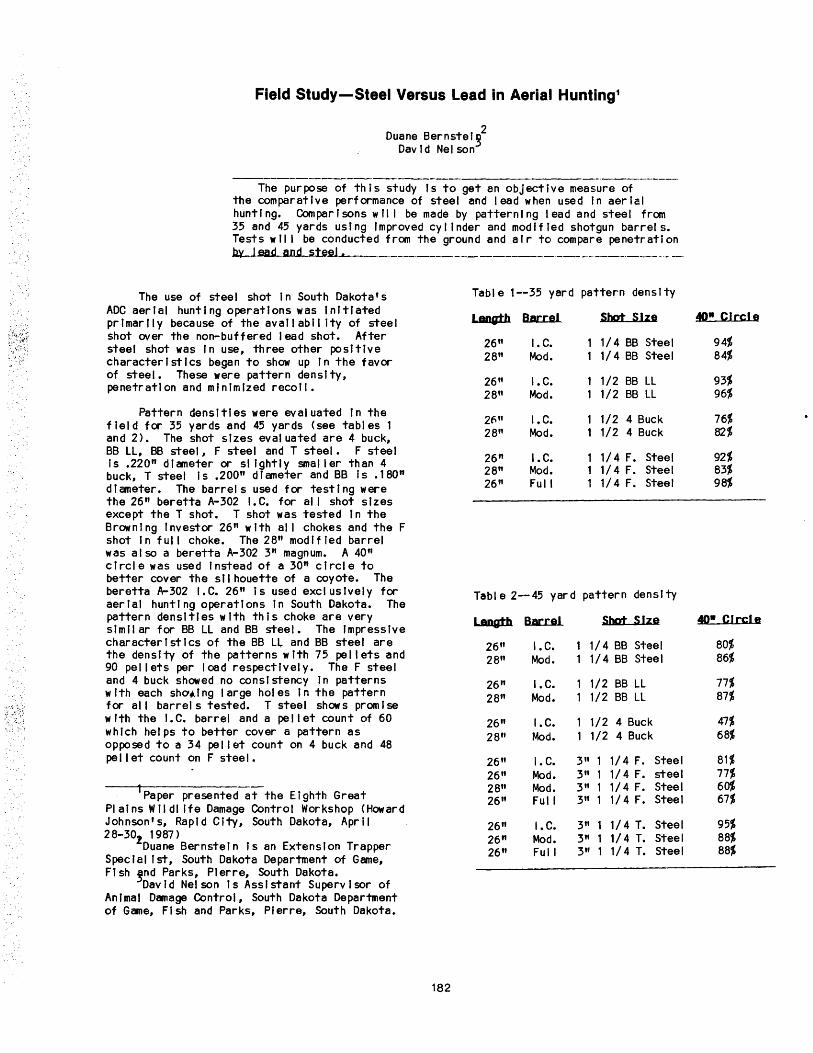
Field Study-Steel Versus Lead in Aerial Hunting1
2 Duane Bernstel~ David Nelson
The purpose of this study Is to get an objective measure of the comparative performance of steel and lead when used In aerial hunting. Comparisons wll I be made by patterning lead and steel from 35 and 45 yards using improved cyl lnder and modified shotgun barrels. Tests wll I be conducted from the ground and air to compare penetration by I ead and steel • --------------------------------
The use of steel shot in South Dakota's ADC aerial hunting operations was Initiated primarily because of the avallabll lty of steel shot over the non-buffered lead shot. After steel shot was In use, three other positive characteristics began to show up In the favor of steel. These were pattern density, penetration and minimized recoil.
Pattern densities were evaluated In the field for 35 yards and 45 yards (see tables 1 and 2). The shot sizes evaluated are 4 buck, BB LL, 88 steel, F steel and T steel. F steel Is .220" dlaneter or slightly smaller than 4 buck, T steel Is .200" d I aneter and BB Is • 180" dlaneter. The barrels used for testing were the 26" beretta A-302 I. C. for all shot sizes except the T shot. T shot was tested In the Browning Investor 26" with all chokes and the F shot In full choke. The 28" modified barrel was at so a beretta A-302 3" magnum. A 40" c I rei e was used Instead of a 30" c I rete to better cover the silhouette of a coyote. The beretta A-302 1. C. 26" Is used excl us I vel y for aerial hunting operations In South Dakota. The pattern densities with this choke are very similar for BB LL and BB steel. The Impressive characteristics of the BB Ll and BB steel are the density of the patterns with 75 pel lets and 90 pellets per load respectively. The F steel and 4 buck showed no consistency In patterns w lth each sho•.J ng I arge hoi es In the pattern for all barrel s tested. T steel shows promIse w lth the I. C. barrel and a pe II et count of 60 which helps to better cover a pattern as opposed to a 34 pelt et count on 4 buck and 48 pel let count on F steel.
Paper presented at the Eighth Great Plains Wlldl lfe Damage Control Workshop <Howard Johnson's, Rapid City, South Dakota, April 28-30 1987)
!Duane Bernstein Is an Extension Trapper Special tst, South Dakota Department of Game, Fish ~nd Parks, Pierre, South Dakota.
David Nelson Is Assistant Supervisor of Animal Damage Control, South Dakota Department of Game, Fish and Parks, Pierre, South Dakota.
182
Table 1--35 yard
Lang:th Bm:l:al
26" I. C. 28" Mod.
26" I. C. 28" Mod.
2fi" I. C. 28" Mod.
26" I. C. 28" Mod. 26" Full
Tab I e 2--45 yard
LaDgth B.m:r:n
26" I. C. 28" Mod.
26" I.C. 28" Mod.
26" I.C. 28" Mod.
26" I. C. 26" Mod. 28" Mod. 26" Full
26" I.C. 26" Mod. 26" Full
pattern densIty
Shot Size
1/4 BB Steel 1/4 BB Steel
1/2 BB LL 1/2 BB LL
1/2 4 Buck 1/2 4 Buck
1/4 F. Steel 1/4 F. Steel 1/4 F. Steel
pattern densIty
Sbot Size
1/4 BB Steel 1/4 BB Steel
1/2 BB LL 1/2 BB LL
1/2 4 Buck 1/2 4 Buck
3" 1/4 F. Steel 3" 1/4 F. steel 3" 1/4 F. Steel 3" 1/4 F. Steel
3" 1/4 T. Steel 3" 1/4 T. Steel 3" 1/4 T. Steel
4011 Circle
94% 84%
93% 96%
76% 82%
92% 83% 98%
4011 Circle
80% 86%
77% 87%
47% 68%
81% 77% 60% 67%
95% 88% 88%

Renetratlon evaluation was done at 35 yards and the number of pellets that exited the coyote on a broadside shot were counted (see table 3). With the operational use of BB LL and BB steel from the aircraft, penetration seems to be s I m I I ar a I so.
Table 3.--Aenetratlon of coyote at 35 yards
N•ber Pellets Shot Size Through Co.yote Par Load
BB Steel 5 90 BB LL 7 75 F Steel 5 48 B Buck 0 34
The 1 1/4 oz. BB steel 2 3/ 4" 1 oad has a mild recoil which Is also desirable to many aerial gunners. The 1 1/4 oz. 3" magnum F shot and T shot resemble the record of 1 1/2 oz. BB LL at least to our shoulder nerve endings.
Two concerns that have been voiced regarding the use of steel shot In aerial hunting operations are a super tight pattern and the time lag between the time a coyote dies on his feet and the time to which he real fzes It and tips over.
The tight pattern Is the result of a short ·shot string (see table 4). A20 fodt length of 48" brOtJn wrapping paper was fastened to a fence and shot strings were measured at 60 mph. The BB steel does not string out 1 ike lead therefore It Is essentially hitting the ground at the same time and showing a tight pattern on the ground below the airplane.
183
Table 4.--Shot String, 35 yards at 60 miles per hour.
1/4 BB Steel, 4 feet 1 Inch, or 49 inches 1/2 BB LL, 5 feet 4 Inches, or 64 Inches 1/2 4 Buck, 5 feet 9 Inches, or 69 Inches
F Steel, 5 feet 6 inches, or 66 inches
Shot StrIng was a +15" I onger w lth BB LL than 88 Steel. F Steel was a +17" I onger than BB Steel. 4 Buck was a +20" I onger than 8B Steel.
As far as the time lag problem, 8B steel again resembles 88 LL in that It seems In order to gain good penetration we have to sacrifice knock-down power. If a coyote Is centered In the "tl ght" and "dense" B8 steel pattern at reasonable range, there Is no time Jag- he Is done. If caught on the edge of the pattern, the coyote can be ventilated good enough for a lethal hit but wll I cover some ground before it tips over. If working In heavy cover or on more than one coyote, It Is possible to lose valuable time working a coyote that tips over just as the next pass Is being made or It tips over In heavy cover and Is not spotted. Neither of these two concerns are real Jy a problem to the aerial gunner that is adept in hitting a coyote with other shot loads because If he can center the coyote In the pattern the shot string Isn't needed to help him hit the coyote and there are enough pel lets on target so there wIll be no "I ag time" to tr p over.
This Is not a scientific study but only a field evaluation of steel shot since we are already using It in our aeri~l hunting operation by our own choice.

...
Aerial Hunting Takes Sheep-Killing Coyotes in Western Montana1
Guy Connolly and Bart W. O'Gara2
Abstract.--This paper reports limited data to document that depredating coyotes were shot from a helicopter in western Montana in 1976. Coyotes marked themselves by puncturing diphacinone-filled collars on the necks of sheep they attacked. Subsequently, 11 coyotes were shot from a helicopter on 3 ranches where collared sheep had been attacked. Six coyotes contained diphacinone and thus were confirmed as having recently attacked or fed on collared sheep.
INTRODUCTION
The Federal-Cooperative Animal Damage Control program (hereafter called ADC program)3 uses a variety of lethal methods to protect livestock from predators. During 1971-76 the ADC program in 13 western states killed 429,437 coyotes, of which 28.5% were shot from aircraft. Aerial hunting expanded significantly after the 1972 ban on predacidal uses of chemical toxicants (Executive Order 11643 and related EPA actions). The numbers of coyotes shot from aircraft increased from approximately 6,100 in Fiscal Year 1971 to 33,600 in FY 1976 (Evans and Pearson 1980; USDI 1979:29). The 1976 figure includes some 9,700 coyotes taken from fixed-wing airplanes, and 23,900 from helicopters. Since 1976, aerial hunting has continued to be important for protecting livestock, but rising costs of helicopter operation have led the program to rely more on fixed-wing planes and less on helicopters. In FY 1985 the ADC program in 15 western states took approximately 15,900 coyotes
1Paper presented at the Eighth Great Plains Wildlife Damage Control Workshop [Rapid City, SD, April 28-30, 1987].
2Guy Connolly is Wildlife Research Biologist, USDA-APHIS, Animal Damage Control program, Denver Wildlife Research Center, Bldg. 16 -- Federal Center, Denver, CO 80225. Bart W. O'Gara is Wildlife Research Biologist, U.S. Fish and Wildlife Service and Leader, Montana Cooperative Wildlife Research Unit, University of Montana, Missoula, MT 59812.
3The ADC program, formerly managed by the U.S. Department of Interior, Fish and Wildlife Service, was transferred on December 19, 1985 to the U.S. Department of Agriculture, Animal and Plant Health Inspection Service.
184
from fixed-wing aircraft and 13,400 from helicopters.4
The ADC program directs control as selectively as possible to the depredating individual or local depredating population (USDI 1979). However, there are few data to quantify the effectiveness of commonly used methods in taking particular individual coyotes that may be killing livestock at a particular place and time. This paper provides data to establish that aerial hunting on selected ranches in western Montana took coyotes known to have recently killed sheep, or fed on coyote-killed sheep, on these ranches. The data were produced in conjunction with studies of sheep neck collars containing diphacinone, a slow-acting toxicant that served as a chemical marker between time of dosing and time of death for coyotes that punctured collars during attacks on sheep.
METHODS
The toxic collar, or livestock protection collar, is a novel method to kill coyotes that prey on sheep and goats (fig. 1). When coyotes attack collared livestock and puncture the collars, they receive an oral dose of toxic liquid (McBride 1974). Several toxicants have been used experimentally. The present study with diphacinone collars has been reported in detail elsewhere (Connolly 1976, 1979; Connolly et al., 1976, 1978). It is summarized here to establish that the slow-acting toxicant served to mark coyotes that attacked or fed on collared sheep, so that these individuals could be identified later if taken by other control methods.
4Unpublished ADC program records.

Figure 1.--A 35-pound lamb with diphacinonefilled collar. Only 1 of the 2 collar packets is visible.
Diphacinone, 2-(diphenylacetyl)-lH-indene-1,3(211)-dione, is an anticoagulant rodenticide used since the 1950s. It acts by blocking the formation of prothrombin in the liver by competitive inhibition of vitamin K. When formulated in propylene glycol and administered to nonfasted, captive coyotes with a syringe in a single oral dose to the back of the mouth, the LDso with 95 percent confidence limits was 0.6 (0.3 to 1.2) mg/kg. Times to death ranged from 6 to 17 days for 16 captive or wild coyotes (Savarie et al., 1979).
Sheep neck collars made of polyvinylchloride were filled with 5% aqueous suspension of diphacinone (50 mg active ingredient/ml). This commercial formulation, "Suspension Vampiricida Difenadiona",was purchased from Motomco, Inc., Clark, NJ. Three different collar configurations were used. Each collar had either 2 or 4 toxicant packets of various sizes. Depending on the number and size of packets, each collar contained 50 to 200 ml of toxic liquid, or 2.5 to 10 grams of active ingredient.
Diphacinone collars were pen-tested by releasing captive coyotes into 1-hectare (2.5-acre) enclosures with collared sheep. Four collars containing 5% diphacinone were punctured by captive coyotes; all 4 coyotes died. Three other coyotes present in the pens during these tests also died after participating in attacks or feeding on dead, collared lambs. Four more coyotes died after they punctured collars containing lower concentrations of diphacinone. For all 11 coyotes that died in pen tests of diphacinone collars, times to death averaged 8 days (range 4-13 days). Each coyote exhibited normal behavior until 1-2 days before it died.
185
Body tissues from 11 coyotes dosed by collars and 13 other coyotes dosed by researchers were analyzed after death for diphacinone residues. All livers and most muscle samples contained measurable amounts of diphacinone (Connolly 1979; Savarie et al., 1979).
Following pen tests that showed diphacinone collars to be lethal to attacking coyotes, field tests were conducted on 14 western Montana ranches in 1976. The Eight Mile Ranch (O'Gara et al., 1983) near Florence, Montana was the main study area. Collared lambs were placed in fenced pastures where coyote predation had recently occurred or was expected. Average pasture size was 209 acres (n = 23 pastures, range 5 to 816 acres). The number of collared lambs per pasture varied from 1 to 29 but was usually 4 to 10. Some pastures also contained uncollared ewes or wethers, since larger groups of sheep seemed more attractive to coyotes. Adult sheep were not collared because coyotes usually selected lambs. While collared sheep were in the field, other sheep on each ranch were moved away or penned at night to protect them from coyotes.
Collared and uncollared sheep were checked daily for evidence of predation. Each dead or injured sheep was examined for characteristic wounds inflicted by predators and for other evidence relating to cause of death. Sheep carcasses were removed each morning.
Other methods of coyote control were used concurrently with collars on some ranches. The principal technique used by the ADC program was aerial hunting from a turbocharged Bell 47 helicopter. An ADC employee used a 12-gauge semiautomatic shotgun with BB shot to shoot all coyotes seen during flights over ranches where predation had occurred. Coyote carcasses were recovered so that liver and hip muscle samples could be preserved for diphacinone residue analysis. Sampling was limited to coyotes taken on or near ranches where collars had been punctured by coyotes within the previous 20 days. Based on recorded times to death, as reported earlier, it was assumed that all coyotes puncturing diphacinone collars would disappear from the population within 20 days. We also assumed that all coyotes puncturing collars would exhibit measurable diphacinone residues until they died.
In addition to coyotes taken by helicopter, 1 coyote was caught in a snare and another was shot from the ground. The latter animal was taken by a rancher near the carcass of a freshly killed, collared lamb.
Diphacinone in coyote tissues was analyzed by the methods of Bullard et al., (1976) as modified (Connolly et al., 1976). Presence of diphacinone was interpreted as evidence that the coyote was a depredating individual. Pen studies had shown that coyotes could be poisoned either by attacking collared lambs and puncturing collars or by scavenging contaminated lambs killed

Table !.--Background data and diphacinone residues for 13 coyotes removed from ranches where sheep collars containing diphacinone were punctured by coyotes in 1976.
Coyotes taken Diphacinone (ppm) Number of collars Uncollared1 Sample Date of Hip Eunctured & Dates sheeE killed number death Liver Muscle
Eight Mile Ranch CR-C12 ND3 ND3 3 (3/24, 3/25, 3/25) 13 est. 3/26
1 (5/8) 81 CR-C3 5/28 0.9 ND CR-C4 5/28 ND ND
1 (5/29) 82 CR-CS 5/29 ND ND CR-C6 5/29 2.3 ND CR-C7 5/29 ND ND
1 (5/29) 64 CR-C8 6/1 ND ND CR-C9 6/1 ND ND
1 (5/29) 53 GEC 2, 3 6/13 7.3 0.7
DP ranch 1 (9/24) 0 GEC 4, 5 9/28 1.3 2.6
GEC 6, 7 9/28 1.9 1.6
GB ranch 2 (9/29, 9/29) 4 NR5 GEC 8, 9 10/3 1.4 0.9
RL ranch 1 (9/5) 1 GEC 10, 112 9/5 6.0 NS6
1Total for 20 days before coyote was taken. 2coyote #CR-Cl was found in a snare on 4/3; estimated date of death was
3/24-3/28. GEC 10, 11 was shot by a rancher. Others were shot from ADC program helicopter.
3ND = not detected; less than 0.1 ppm. 4Three more collared lambs were missing and presumed killed. Collars
were not available to check for punctures. SNR = not recorded. Approximately 40 lambs were killed from late June
to late September. 6Ns = muscle not sampled. Stomach contained 114.2 ppm.
by other coyotes, but coyote-killed sheep rarely were scavenged on the Eight Mile Ranch. Of 105 carcasses left in the field and checked daily for feeding, only 4 instances of coyote feeding on 1-day-old carcasses were recorded (O'Gara et al., 1983). Prompt cleanup of collared lamb carcasses minimized their availability to scavenging coyotes and there was no other known source of diphacinone on the study areas. For these reasons, we think the diphacinone-positive coyotes recovered in this study dosed themselves by attacking rather than scavenging collared lambs.
186
RESULTS AND DISCUSSION
Thirteen coyotes were taken within 20 days after diphacinone collars had been punctured (Table 1). Six of 11 coyotes shot from a helicopter contained diphacinone and thereby were confirmed as having attacked or fed upon collared lambs in the previous 20 days. As described above, there is ample reason to regard the diphacinone-positive animals as depredating individuals.
All of the diphacinone-negative coyotes came from the Eight Mile Ranch where only a few

of the sheep killed by coyotes had collars (Table 1). Coyotes could have attacked many sheep on this ranch without encountering collared sheep, which were pastured separately from the main ranch flocks. In addition, helicopter collections were biased against animals that punctured collars because some of them would have died before aerial hunting took place. Coyotes may have been collected for 20 days after collars had been punctured, but the average time to death was undoubtedly much shorter. Therefore, the documented proportion of depredating individuals (6/11 or 55%) among coyotes taken by helicopter is regarded as a minimum estimate. The true proportion of sheep killers probably was higher.
The coyote taken by snare (CR-Cl) was negative, but the animal shot near a freshly-killed collared lamb (GEC 10, 11) contained diphacinone. The concentration found in its stomach (114 ppm, Table 1) was the highest level ever recorded in our laboratory from a coyote. We speculate that this animal punctured the collar within 1 hour before it was shot.
Ranchers and ADC specialists ordinarily cannot identify depredating individual coyotes. Except on rare occasions when coyotes are observed and shot while attacking livestock, the removal of depredating individuals can only be inferred if predation stops after a particular coyote or group of coyotes has been taken. Such inferences are uncertain at best. The approach illustrated in this paper offers a more rigorous way to document the removal of depredating individuals.
The practical solution to coyote depredation is removal or exclusion of all coyotes from immediate localities where depredation is occurring or expected to occur. The limited results reported here support this concept, as they show that coyotes taken by helicopter near sheep flocks included individuals preying on those flocks.
As noted previously, these data were produced during efficacy tests of diphacinone sheep collars. If the study had been conducted specifically to measure the selectivity of aerial shooting for depredating individual coyotes, larger numbers of sheep would have been collared and the collars would have contained a nontoxic marker rather than a toxicant. The approach developed in this paper also could be used to study other methods of coyote removal, alone or in combination.
ACKNOWLEDGEMENTS
This study was conducted by the Denver Wildlife Research Center, Montana Cooperative Wildlife Research Unit, and Montana ADC program. Sheep losses were monitored primarily by K. Brawley, J. Munoz, and D. Johannsen. These colleagues also collected tissue samples from coyotes that were
187
shot from helicopters by J. Lewis and R. McBride. Substantial contributions in the field also were made by R. Griffith and R. Severson. Diphacinone residues were analyzed by I. Okuno. Special thanks are extended to the cooperating ranchers. M. Fall, P. Savarie, W. Rightmire, and R. Nass provided helpful comments on the manuscript.
LITERATURE CITED
Bullard, R. W., R. D. Thompson, and G. Holguin. 1976. Diphenadione residues in tissues of cattle. J. Agricultural and Food Chemistry 24(2):261-263.
Connolly, Guy E. 1976. Field tests of diphacinone in the toxic collar for selective control of sheep-killing coyotes. Supplement to Final Progress Report to EPA, Agreement No. IAG-06-0910. 23 p. U.S. Fish and Wildlife Service, Denver Wildlife Research Center, Denver CO.
Connolly, Guy E. 1979. Diphacinone residues in tissues from animals exposed to diphacinone toxic collars. pp. 42-47. In The Toxic Collar for Selective Removal-of Coyotes that Attack Sheep. Fourth, Fifth, and Sixth Progress Reports under EPA Experimental Use Permit No. 6704-EUP-14. 47 p. U.S. Fish and Wildlife Service, Denver Wildlife Research Center, Denver, CO.
Connolly, G. E., R. Sterner, P. Savarie, R. Griffith, D. Elias, M. Garrison, B. Johns, and I. Okuno. 1976. The toxic collar for selective control of sheep-killing coyotes. Final Progress Report to EPA, Agreement No. IAG-D6-0910. 132 p. U.S. Fish and Wildlife Service, Denver Wildlife Research Center, Denver, CO.
Connolly, G. E., R. E. Griffiths, Jr., and P. J. Savarie. 1978. Toxic collar for control of sheep-killing coyotes: A progress report. p. 197-205. In Proceedings:Eighth Vertebrate Pest Conference. [Sacramento, Calif., March 7-9, 1978] 269 p. Vertebrate Pest Conference, c/o Control and Eradication, Department of Food and Agriculture, 1220 N Street, Sacramento, CA 95814.
Evans, G. D., and E. W. Pearson. 1980. Federal coyote control methods used in the western United States, 1971-77. Wildlife Society Bull. 8(1):34-39.
McBride, Roy T. 1974. Predator protection collar for livestock. U.S. Patent No. 3,842,806. Registered, U.S. Patent Office, Washington, D.C.
O'Gara, B. W., K. C. Brawley, J. R. Munoz, and D. R. Henne. 1983. Predation on domestic sheep on a western Montana ranch. Wildlife Society Bull. 11(3):253-264.

Savarie, P. J., D. J. Hayes, R. T. McBride, and J. D. Roberts. 1979. Efficacy and safety of diphacinone as a predacide. p. 69-79. In Avian and Mammalian Wildlife Toxicology. ASTM Special Technical Publication 693, 103 p. American Society for Testing and Materials, Philadelphia, PA.
188
U.S. Department of the Interior. 1979. Final environmental impact statement, U.S. Fish and Wildlife Service's mammalian predator damage management for livestock protection in the we·stern United States. 789 p. U.S. Fish and Wildlife Service, Washington, D.C.

Importance of Attractant Qualities for Improving a New Coyote Delivery System1
Steven M. Ebbert2 and Daniel B. Fagre3
Abstract---Changes in effectiveness and nontarget species selectivity of a new system for delivering ingestible substances to coyotes (Canis latrans) were examined by systematically varying odor type and quantity used to attract coyotes to the device. The new delivery system's efficacy was comparable to the M-44 in our tests in south Texas. A synthetic lure improved the effectiveness of the delivery system when applied in amounts of 0.10 cc or 0.50 cc. Varying odor type did not increase the incidence of desirable coyote behavior, such as biting, but did increase rates of visitation.
INTRODUCTION
A new system for delivering certain types of ingestible substances to coyotes was developed recently based on studies of coyote behavioral responses to chemical odors. The Coyote Lure Operative Device (CLOD) was devised to take advantage of vigorous licking and chewing behaviors of coyotes responding to certain odors (Marsh et al. 1982). The intensity and duration of licking, biting, and pulling by captive coyotes increased when specific odors were applied to some bite-sized objects and combined with sweet tastes (Fagre et al. 1981).
The CLOD system (Marsh et al. 1982) is an integration of several components. A synthetic coyote attractant is applied to a sealed polyethylene bulb mounted over an acrylic stem and base. The CLOD is
1 . . h Paper presented at the E1g th Great Plains Wildlife Damage Control Workshop. [Rapid City, South Dakota, April 26-29, 1987]2
Steven M. Ebbert is a Graduate Research Assistant with the Texas Agricultural Experiment Station, College Stati~n, Tex.
Daniel B. Fagre is an Assistant Professor, Department of Wildlife and Fisheries Sciences, Texas A&M University, College Station, Tex.
189
anchored to a metal stake driven into the ground. A sweetened syrup mixture, which can contain many types of active ingredients, is sealed inside the protective plastic bulb until the bulb is punctured. Coyotes are attracted to the CLOD by the synthetic attractant, and are exposed to the syrup mixture only after biting the bulb. The sweet taste of the syrup increases the likelihood of rapid consumption by coyotes. The CLOD is designed to prevent many nontarget species from being exposed to the syrup mixture. A hard stem inside the bulb is designed to prevent the CLOD from being crushed and/or broken open if trampled by ungulates.
This new delivery system for ingestible substances has potential as a coyote damage control method for toxicants or reproductive inhibitors, but also could deliver oral vaccines, biochemical markers, or combinations of these. If successful, the CLOD system may lead to greater flexibility in dealing with coyote damage problems.
Despite the potential of the CLOD system, there have been no comprehensive field tests involving high rates of coyote interaction with CLODs. South Texas has high coyote densities suitable for such field tests (Linhart and Knowlton 1975, Knowlton et al. 1986). As presently designed, the CLOD system depends upon odor stimuli to attract coyotes to the device and elicit specific behavioral

responses. Odor type and intensity are known to be important for attracting coyotes to scent stations (Bullard et al. 1983) and could be important in eliciting specific behaviors. Coyote behavioral responses also may be a reflection of odor type (Bullard et al. 1983). The CLOD is effective only if specific behaviors (biting, pulling, licking) are elicited from coyotes. Development of the system was based upon specific responses to w-u lure by captive coyotes. As part of our efforts to evaluate and improve the new delivery system, we investigated the influence of odor intensity and type on the effectiveness and species selectivity of the CLOD, and compared the CLOD with another delivery device, the M-44.
STUDY AREAS
CLODs and M-44s were evaluated on several large properties in the Rio Grande Plains Region of southwest Texas. These properties had various coyote densities and previous intensities of predator control. In these tests, the rates of device visitation and types of behavioral responses directed to the devices were determined for coyotes and other animals by use of a modified scent station survey method (Turkowski et al. 1979).
MATERIALS
Delivery Systems
CLOD bulbs are low-d~nsity polyethylene 20-ml vials (R-vials , Tofunetics Co., San Jose, Calif.) used for storing biological samples and solutions (Marsh et al. 1982). These bulbs are filled with a 19:1 (by weight) corn syrup and powdered sugar mixture. The bulb mouths are trimmed to fit over stems with bases made of acrylic resin. The stems and bases, or cores, are drilled and tapped to screw onto bolts welded to 12 X 3/4-in angleiron stakes. The stake is driven into the ground and anchors the CLOD.
M-44s are spring-loaded devices that forcibly eject sodium cyanide into or near a coyote's mo~th when a baited capsule holder is pulled by the coyote. Ingestion of the cyanide is not deliberate. M-44s are widely used in Texas in efforts to control depredation by coyotes. The M-44 capsule holders were wrapped with 1 x 12-in red felt strips and boiled in paraffin. Plastic capsules containing
4use of product names does not imply
endorsement.
190
sodium cyanide are usually inserted into these metal capsule holders, but in our tests, no cyanide capsules were used. Instead of capsules, rubber stoppers were inserted in the tops of the M-44s to prevent moisture and foreign matter from affecting ejector mechanisms.
Attractants
Four different attractants were tested: "W-U lure", "Mast's #6", "Carman's Canine Distant Call Lure" (CDCL), and "Abbreviated Synthetic Fermented Egg" (SFE DRC-6503). Three levels of the w-u lure were used in one test. CLODs and M-44s with no attractant were included in some tests to determine coyote and nontarget animal responses to device appearance.
W-U (Western Regional Research Center and the University of California-Davis) lure is a synthetic attractant that elicits biting and licking behavior from captive coyotes. The CLOD system was developed as a result of observing coyote responses to some chemical components of w-u lure. When applied to a bite-sized object and combined with a sweet taste, w-u lure has elicited vigorous biting and pulling from captive coyotes for as long as 10 min (Fagre et al. 1980). w-u lure is synthetic, s~ its constituents are known and remain constant between production batches. For these reasons, w-u lure was chosen as the standard attractant used with CLODs in our tests.
Mast's #6 is a commercially available fetid bait commonly used by animal damage control personnel in southwest Texas as a trap and M-44 attractant (Turkowski et al. 1979' 1983) •
CDCL is a commercially available canid attractant. It has been evaluated as a coyote attractant in captive trials and in the field in several states. In an extensive study (Turkowski et al. 1979, 1983) in four states, CDCL was superior to 4 of the 6 other attractants tested. A similar unpublished study in Texas showed CDCL's superior agility to attract coyotes to scent stations •
Abbreviated SFE (DRC-6503) is a coyote attractant developed for the U.S. Fish and Wildlife Service West-wide coyote
5Martin, David. J., and Daniel B. Fagre. 1986. Field evaluation of a synthetic coyote attractant. Texas Chapter of The Wildlife Society Annual Meetings [Kerrville, Tex., Apr. 3-5, 1986].

abundance survey; it is a synthetic alternative to the more variable Fermented Egg Product (Bullard et al. 1978). The excellent attractant qualities of abbreviated SFE are well-documented (Bullard et al. 1978, 1983; Turkowski et al. 1979, 1983).
METHODS
Stations consisting of a 3-ft-diameter circle of sifted earth were established every 1/3-mile on alternate sides of ranch roads. A single experimental treatment (device/lure combination) was placed within each smoothed circle. The assignment of treatments to stations was randomized within each group of treatments. All stations were examined each · morning and signs of animal activity were recorded. Coyote responses to odors at scent stations have been described by Turkowski et al. (1979) and Bullard et al. (1978, 1983). The device was only re-placed if bitten (CLOD), pulled (M-44), or disturbed in a manner that might affect subsequent visitation. CLOD deliveries were usually characterized by severely torn or punctured bulbs with little or no syrup remaining. It was assumed an M-44 delivery would have happened if the ejector was triggered and there was definite animal sign within the 3-foot circle. If replacement was necessary, the same device type was replaced at the station and the same type and quantity of attractant was applied. Tests lasted an average of 6 days.
Response rates to treatments were calculated two ways. Treatment visitation rates were derived by dividing the number treatment stations visited by each species by the total number of station nights for that treatment. A station night is 1 treatment at 1 station for 1 night. Rates of behavior (such as ingestion rates) were calculated using the number of ingestions presumed to have occurred for each species divided by the number of visits by that species.
The first 2 tests were designed to determine the CLOD's potential for delivering ingestible substances to free-ranging coyotes by comparing visitation and delivery rates of CLODs and M-44s. w-u lure and Mast's #6 were used on CLODs and M-44s on a 10,000-acre private wildlife ranch and a 15,000-acre State Wildlife Management Area (WMA). The private ranch had continuing efforts to control predator damage using M-44s, snares, steel traps, and by shooting from the air and ground. On the WMA, there was no attempt to control predator populations or hinder their movements. However, on this property a few coyotes were killed each year by
191
hunters. CLODs and M-44s without attractant also were used as controls on these properties. A total of 102 stations was established at the private ranch and 72 stations at the WMA.
In the test of odor intensity, 4 levels of w-u lure were applied to CLODs at 108 scent stations on a 70,000-acre livestock ranch to determine the influence of lure amount on coyote visitation and ingestion rates. The lure was diluted with acetone to maintain the same liquid volume while changing only the amounts of W-U lure applied to the devices. Acetone was chosen as the diluent because it rapidly vaporizes and leaves little residue (less than 0.001%), which minimizes possible interaction with the w-u lure. The 4 lure levels were: no lure and 0.50 cc of acetone, 0.02 cc lure and 0.48 cc acetone, 0.10 cc of lure and 0.40 cc acetone, and 0.50 cc of lure with no acetone.
After the optimum quantity of w-u lure was determined, other attractants were evaluated with CLODs for their ability to elicit appropriate coyote behaviors. A t~st was designed to determine responses of coyotes and nontarget animals to 2 commercially available lures and a different synthetic lure. CDCL, Mast's #6, and abbreviated SFE w5re selected. In previous field tests , these 3 attractants were effective at drawing coyotes to survey scent stations and eliciting specific behavioral responses, such as biting and pulling. On each CLOD, 0.5 cc of attractant was applied.
RESULTS
Field Evaluation of CLODs
After 780 station nights at the first test site (the private ranch) with predator control, overall coyote visitation rate was 4% (35) and device activation rate was 1.5% (12) (table 1). Significantly (P < 0.05) more coyote visits were recorded for stations with devices treated with w-u lure than Mast's #6. No significant differences for rates of coyote visits or deliveries were observed between the CLOD and the M-44.
In contrast to the ranch with predator control, coyote visitation was 41% (160) on the second study site (the WMA) without predator control after 390 station nights (table 2). This visitation rate was 10 times greater than the rate at the ranch with predator control. Also, 100 incidents of CLOD or M-44 activations by coyotes occurred at the WMA. Devices treated with w-u lure received signifi-

Table 1.--Frequency of coyote visits and deliveries to coyotes by treatme£ts after 780 station nights at the ranch with predator control .
VISITS DELIVERIES
ATTRACTANT CLOD M-44 Total CLOD M-44 Total
w-u Lure 7 10 17 4 4 8 Mast's #6 9 4 13 0 3 3 Control 1 4 5 0 1 1
Total 17 18 35 4 8 12
1Each device/attractant combination had 130 replications.
Table 2.---Frequency of coyote visits and deliveries to coyotes by treatme£ts after 390 station nights at the WMA without predator control •
VISITS DELIVERIES ----------------------- ----------------------
ATTRACTANT CLOD M-44 Total CLOD M-44 Total
w-u Lure 33 35 68 24 26 50 Mast's #6 27 24 51 21 15 36 Control 28 13 41 12 2 14
Total 88 72 160 57 43 100
1Each device/attractant combination had 65 replications.
cantly (P < 0.05) more visits and resulted in more deliveries to coyotes than controls or devices treated with Mast's #6. Although there were no significant differences, more coyote visits and deliveries to coyotes were recorded by CLODs than M-44s.
Coyote responses to CLODs often appeared vigorous. Frequently, bulbs were pulled completely off the cores and pieces of the plastic component were found several yards from stations. Occasionally, stakes were pulled up several inches or completely removed from stations. Other coyote activities directed at the devices, such as rubbing and rolling, digging, defecating and urinating were indicated frequently more at CLODs than M-44s.
Odor Intensity Test
After 520 station nights, the number of stations receiving coyote visits was approximately equal for CLODs treated with 0.10 cc (13%) and 0.50 cc (12%) of w-u
192
lure. Coyote visitation was slightly more for the 0.10 cc treatment during the first and second exposure nights, but the 0.50 cc level elicited more biting and chewing by coyotes. Coyote visitation rate was equal (4% each) for 0.02 cc treatments and controls.
Stations with the 0.10 cc and 0.50 cc levels received significantly (P < 0.05) more coyote visits than the 0.02 cc level and controls. However, the coyote ingestion rates were not significantly different for the two groups. It was decided to continue to apply 0.50 cc of w-u lure and other attractants to CLODs and M-44s in future tests.
Odor Type Test
CDCL and w-u lure were more attractive and resulted in a greater number of deliveries to coyotes than did Mast's #6 and abbreviated SFE (table 3). CDCL did as well as w-u lure at attracting coyotes to stations and was equally effective at eliciting coyote behaviors neces-

Table 3.---Frequency of coyote visits and deliveries to coyotes by treatments 1 after 400 station nights at the WMA •
LURE VISITS DELIVERIES
CDCL 31 13 w-u 24 10 Mast's 16 7 SFE 10 4
Total 81 34
1Each device/attractant combination had 100 replications.
sary for deliveries of the syrup mixture within the CLOD (table 3). No qualitative differences were noted for coyote behaviors elicited by these 2 attractants. However, CLODs treated with CDCL were visited by a greater variety of animals than were CLODs treated with w-u lure. Additionally, 3 deliveries to raccoons (Procyon lotor) were recorded at CDCL treated CLODs but no deliveries to raccoons were indicated for w-u lure treated CLODs during the same test.
DISCUSSION
CLODs have significant potential as a new delivery system because syrup mixture doses were effectively delivered to coyotes in these tests. Data indicated CLODs worked as well on the ranch (table 1) and better on the WMA than the M-44s (table 2). Therefore, CLODs are not inherently aversive to coyote populations, even those targeted by control programs. Because effectiveness and selectivity of CLODs werecomparatively better than for the M-44 device, the CLOD merits further attention and development.
The W-U lure proved to be a highly effective coyote attractant when used with M-44s and CLODs. More deliveries occurred with W-U lure than Mast's #6 because it attracted more coyotes to scent stations and elicited essential responses. Ratios of ingestions to visits for either device were similar for each odor. Additionally, the w-u lure appears to be more selective for coyotes since there were fewer nontarget wildlife visits to, and deliveries by, devices treated with w-u lure.
Coyote visitation rates differed greatly between the ranch with a predator control program and the WMA, possibly because of a lower coyote density and/or because coyotes on the ranch were inhibit-
193
ed from approaching the devices or attractants. In either case, when coyotes visited stations, the probability of them puncturing CLODs and ingesting the contents were similar to those on the WMA, the area not subject to predator control.
The effectiveness of w-u lure when used with a CLOD was greatest at the 0.50 cc level, not only because it was most effective in attracting coyotes to stations over a 5-day period, but also because it had a greater probability of ingestion. However, the 0.10 cc level of w-u lure was effective for a few days. Lesser amounts were ineffective. In other tests5 1.0 cc seemed repellent to some coyotes and visitation rates increased over several days as the lure dissipated. Bullard et al. (1982) concluded that odor quantity influenced a synthetic lure's attractiveness, and Turkowski et al. (1983) also found that abbreviated SFE was more effective at lower levels.
Apparently, both odor intensity and type are important attributes for attracting coyotes to devices, but in our tests, did not affect the probability of inducing deliveries to coyotes during visits. This is reaffirmed by the odor type test. If the lure was highly attractive, it worked well with the CLOD. One synthetic attractant (W-U) was more effective than another (SFE). One fermented trap attractant (CDCL) was more effective than another (Mast's #6). Although rates of coyote visitation and ingestion were similar for CDCL and w-u lure, species selectivity differed. The CDCL attracted more nontarget wildlife, which is undesirable both from the standpoint of potentially affecting other wildlife and reducing the CLOD's delivery rate to coyotes. At this time, w-u lure appears to be an excellent choice to use with the CLOD system in south Texas.
The CLOD system has many possible advantages over the M-44 device. CLODs have no moving parts and do not rely upon precise manufacturing to function properly. Unlike with leg-hold traps or M-44 devices, the angle iron stakes may be driven into hard ground, soft mud or sand to securely anchor the CLOD without risking malfunction of the device. The CLOD system's simplicity may make it more reliable.
Because CLODs need directed, specific, and persistent behavioral responses from coyotes to deliver active ingredients, other wildlife may be at less risk of exposure to the active ingredients. Generally, an upward pull on the M-44 capsule holder is necessary to trigger an M-44, whereas this type of distur-

bance alone would not be sufficient to activate a CLOD. The CLOD's bulb must be bitten hard enough to cause a puncture before the mixture is exposed. Incidental investigation of M-44s by other animals may have a higher probability of springing M-44s, resulting in nontarget deliveries or making devices inoperable when approached by coyotes.
The M-44 device depends upon a forcible delivery mechanism, which probably causes an aversion to the device or odor used if the coyote survives. The CLOD system, however, relies upon voluntary ingestion of the sweet syrup and so it can be used with substances needing multiple deliveries to be effective. Once punctured, the syrup in the CLOD insures ingestion by coyotes, but other wildlife, such as felids, may not respond as positively to very sweet tastes (Boudreau and White 1978).
Furthermore, the dosage of active ingredients inside CLODs may be calibrated so complete ingestion of the mixture is needed to achieve the desired effect. Several times in the field it was noted rodents and lagomorphs had successfully gnawed through the plastic bulb but apparently ingested very little of the contents. If the plastic-dipped device and synthetic odor is not perceived by animals as a potential food item, it generally may be less attractive to wildlife than other control methods.
Finally, the active ingredients are sealed inside a plastic bulb which minimizes external contamination. Undisturbed CLODs are easily removed from the field intact, and this facilitates retrieval of chemicals used in coyote control efforts.
SUMMARY
The CLOD system warrants further research development as an additional delivery system to use for coyote management. If odors can attract coyotes, the CLOD's design will encourage further interaction. Further improvements may be accomplished by varying the CLOD's physical aspects, such as size, ·shape, and structure.
LITERATURE CITED
Boudreau, M. c., and T. D. White. 1978. Flavor chemistry of carnivore taste systems. p. 102-128 in R. w. Bullard, ed. Flavor chemistry of
194
animal foods, American Chemical Society, Washington, D. C. 175pp.
Bullard, R. w. 1982. Wild canid associations with fermentation products. Industrial Engineering Chemical Products Research Development, 21(4) :646-655.
Bullard, R. w., s. A. Shumake, D. L. Campbell, and F. J. Turkowski. 1978. Preparation and evaluation of a synthetic fermented egg coyote attractant and deer repellent. Journal Agricultural Food Chemistry, 26 (1) :160-163.
Bullard, R. W., F. J. Turkowski, and S. R. Kilburn. 1983. Response of freeranging coyotes to lures and their modifications. Journal of Chemical Ecology, 9(7) :877-888.
Fagre, D. B., B. A. Butler, W. E. Howard, and R. Teranishi. 1980. Behavioral responses of coyotes to selected odors and tastes. Worldwide Furbearer Conference Proceedings, 967-983.
Fagre, D. B., w. E. Howard, and R. Teranishi. 1981. Development of coyote attractants for reduction of livestock losses. p. 319-326 in Wildlife-Livestock Relationships Symposium [Coeur d'Alene, Idaho, March 15-16, 1980].
Knowlton, F. F., L. A. Windberg, and c. E. Wahlgren. 1986. Coyote vulnerability to several management techniques. p. 165-175 in Proceedings Seventh Great Plains Wildlife Damage Control Workshop. [San Antonio, Tex., December 3-5, 1985].
Linhart, s. B., and F. F. Knowlton. 1975. Determining the relative abundance of coyotes by scent station lines. Wildlife Society Bulletin, 3:119-124.
Marsh, Rex E., Walter E. Howard, Sheila M. McKenna, Barbara Butler, and Douglas A. Barnum. 1982. A new system for delivery of predacides or other active ingredients for coyote management. p. 229-233 in Proceedings Tenth Vertebrate Pest Conference. [Monterey, Calif., February 23-25, 1982] University of Calif., Davis.
Turkowski, F. J., M. L. Popelka, and R. W. Bullard. 1983. Efficacy of odor lures and baits for coyotes. Wildlife Society Bulletin, 11(2) :136-145.
Turkowski, F. J., M. L. Popelka, B. B. Green, and R. W. Bullard. 1979. Testing the responses of coyotes and other predators to odor attractants. p. 255-269 in Test Methods for Vertebrate Pest Control and Management Materials, ASTM STP 680. American Society for Testing and Materials, Philadelphia, Penn.

Field Evaluation of Olfactory Attractants and Strategies Used To Capture Depredating Coyotes1
George E. Graves2 and Major L. Boddicker3
Abstract.--Forty-five experimental and commercial olfactory attractants (lures) were tested under field conditions over a 30-month period to evaluate attractiveness to coyotes, elicited behaviors, and responses with lethal and simulated lethal coyote capture devices. The top 7 lures evaluated in spring and summer test periods that produced the highest simulated coyote capture rates with trap rings, M-44 heads, and break-away snares were WU 15-20%, Sheep Liver Extract, and (Carman•s) Canine Distance Call Lure; (Carman•s) Final Touch, Rotten Meat Odor, and TMAD 10%; and Estrous Urine Fractions, respectively.
INTRODUCTION
Behavioral responses that experimental and commercial coyote and carnivore olfactory attractants (lures) elicit to coyotes have been· conducted in controlled experiments using captive coyotes (Ti11111 et al. 1975, 1977, 1978, Fagre et al. 1981a, 1981b, 1983, Kruse and Howard 1983, Scrivner et al. 1984, 1985, 1987). Skepticism as to the validity and aoolication of these results to wild coyotes has been expressed by rese~rchers and field personnel (Teranishi and Howard 1986). An extensive and quantifiable field evaluation of experimental lures with actual applications with leghold traps, M-44•s, and cable snares was needed.
Turkowski et al. (1983) suggested several factors that could cause variation in predator responses to attractants. These factors included weather elements, ambient temperature, length of lure exposure, seasonal periods, and individual coyote behavior. The purpose of this project was to test some of these factors and develop a transportable, productive, and cost effective method of selective coyote control. The approach was to evaluate, by field tests, delivery materials and strategies, lure formulations, mechanisms
1 Paper presented at the Eighth Great Plains Wildlife Damage Control Workshop, [Rapid City, S.D., April 28-30, 1987].
2 George E. Graves, MS Candidate in Wildlife Biology, Colorado State University, Fort Collins, Colo., and Wildlife Biologist, USDA-APHIS-ADC, Lakewood, Colo.
3 Major L. Boddicker, Ph.D., owneroperator of Rocky Mountain Wildlife Enterprises, LaPorte, Colo.
195
and chemicals to increase the probability of capturing coyotes and other predators. The objective was to determine which lures increased the efficacy and selectivity of leghold traps, M-44 sodium cyanide (NaCN) ejectors, snares, and other control devices under field conditions.
STUDY AREA
Investigators (4) selected non-overlapping study sites that had viable coyote populations and a history of livestock/coyote interactions. Fall and winter data were collected on sites and elevations normally used as sheep (Ovis aries) wintering areas. The sites consisted primarily of short-grass prairies between elevations of 1364-1818 m with blue grama (Bouteloua gracilis) the dominant vegetation. Lower montane regions, primarily composed of cedar (Juni erus spp.), pine (Pinus spp.), and sagebrush Artemisia spp.) vegetation from elevations of 1515-2576 m were also used. Spring and summer data were gathered from sites where sheep normally lambed and ranged during summer. Sites including short-grass prairies, lower montane, montane (mainly composed of Pinus spp.), subalpine (Picea and Abies spp.), and alpine areas of north-central and eastern Colorado were utilized.
METHODS
The study was conducted between 1 Nov. 1982 and 25 Aug. 1985. Data were collected on combinations of lures and capture devices during fall, winter, spring, and summer of each year. Each test period consisted of a minimum of 20 days of field applications within a season and a minimum of 30 treatment sites. A treatment site was

.·· .•
defined as the placement of 1 lure with 1 capture device type at 1 location. Treatment sites were inspected approximately every 2 days (weather permitting). Data were collected on standardized data sheets.
Coyote capture devices were categorized as 1 etha 1 and s imul a ted 1 etha 1 • Letha 1 devices used in the fall and winter (FW) test periods included leghold traps, M-44 NaCN ejectors, and cable snares. Leghold traps (usually 2 per treatment site) were placed in the soi 1 , anchored, and covered to mimic standard practice following Boddicker (1980) and Hawthorne (1980). A capture was recorded if an animal was caught and held or caught but escaped before investigator arrived. Tracks and hair were evaluated to determine the species of escaped animals. Procedures used with M-44 NaCN ejectors were those prescribed by Beasom (1974), Shult et al. (n.d.), and Boddicker (1979). A capture was recorded if the M-44 NaCN ejector head was pulled whether or not an animal was recovered. Sign, such as tracks and teeth indentations on the head, was used to confirm the species. M-44 ejectors and NaCN capsules used were manufactured by and purchased from the M-44 Safet~ Predator Control Company, Inc., Midland, Texas . Commercial cable snares, made from 0.16-cm twisted steel cable, were placed in locations that camouflaged their presence and near coyote trails and travelways. Cable snares were set following procedures prescribed by DeZarn (1984). A capture was recorded if an animal was caught and held or caught and escaped before investigator arrived.
Simulated lethal devices were utilized in the spring and summer (SS) test periods to maintain maximum opportunity for coyote-device interactions. Simulated lethal devices used were trap rings, M-44 heads only, and break-away snares. Trap rings were made from 1.25-cm cross sections of 15.0-cm diameter plastic pipe and placed in the ground in the same manner as were leghold traps. A simulated capture was recorded if an animal stepped inside 1 or both rings. M-44 heads, wrapped in hemp, but without beeswax or paraffin, were staked 8 em above the ground by 20-penny nails placed through the head area that normally contained the NaCN capsule. A capture was recorded if the head was pulled upwards 2.5 em or more from set height; head pulled out of soil, chewed, and dropped; or if the head was removed from the site. Break-away snares designed by G. Stewart, consisted of a 30-cm loop of 0.04-cm braided steel wire with a copper clip replacing the base ferrule. Break-away snares were placed using the same procedures as cable snares. Captures were recorded when snares were broken by an animal.
A standardized volume of approximately 0.5 ml of each candidate lure was presented on a
4 Mention of manufacturer and trade names does not constitute endorsement by the U.S. Government.
196
neutral material that varied with the device used. Lures evaluated with leghold traps and trap rings were placed directly on cotton q-tips, bleached bones, cow chips, grass tufts, animal fur, or feathers. Lures were placed upwind and directly behind the leghold traps or trap rings so an investigating animal would usually pass over the trap when exploring the lure. Removal of used delivery materials from the study site reduced contamination.
When used with cable and break-away snares, lure was presented in plastic vials elevated approximately 1.25 m from ground level. Vials were suspended by cotton string and attached to brush and other supports. Placement was intended to force animals to pass through the snare(s) in their attempt to investigate the lure. Lures were placed directly to the head of M-44 NaCN ejectors and M-44 heads.
Experimental lures (EL•s) evaluated in the study (table 1) were those developed by R. Teranishi, USDA, Research Leader Food Quality, Western Regional Research Laboratory, ARS, Albany, Calif., and associates. Trimethylammonium Decanoate (TMAD) and WU (a mixture of acids,
Table I.--Experimental lures evaluated in the study.
Experimental olfactory attractants (lures)
Trimethylammonium Decanoatel Rotten Meat Odor2 Synthetic Calf Crap3 Synthetic Porcupine Hair4 Sheep Liver Extract4 Estrous Urine Fractions4 wu5 WU Acids4
Designation
TMAD RMO sec SPH SLE EUF wu WU Acids
1 Two formulations of TMAD were mixed by the pri nc i pa 1 invest i gator and eva 1 ua ted . One part TMAD mixed with 99 parts pork lard (PL) to formulate TMAD 1%. One part TMAD mixed with 9 parts PL to formulate TMAD 10%.
2 One part RMO mixed with 9 parts PL. 3 Two formulations of SCC lure were
tested. Equal portions of SCC mixed with liquid lanolin and designated as sec (this formulation was mixed by R. Teranishi). The other formulation, designated as sec +sugar, was mixed at a ratio of 4 parts sec plus 1 part sugar.
4 SPH, SLE, EUF, and WU Acids were used as received from R. Teranishi.
5 Four formulations of WU were mixed by the principal investigator and evaluated. One part WU mixed with 99 parts PL to formulate WU 1%. One part WU mixed with 9 parts PL to formulate WU 10%. Four parts WU 10% mixed with 1 part sugar to formulate WU 10% +sugar. One part WU mixed with 5-7 parts PL to formulate WU 15-20%.
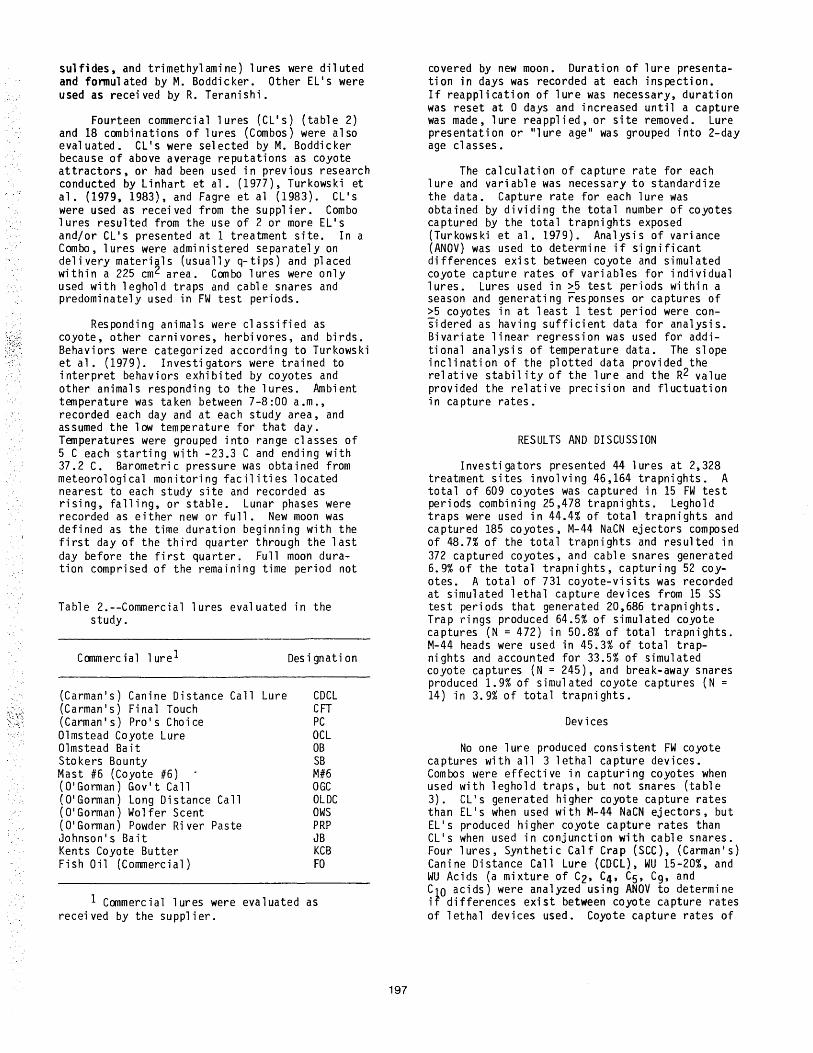
sulfides, and trimethylamine) lures were diluted and formulated by M. Boddicker. Other EL's were used as received by R. Teranishi.
Fourteen commercial lures (CL's) (table 2) and 18 combinations of lures (Combos) were also evaluated. CL's were selected by M. Boddicker because of above average reputations as coyote attractors, or had been used in previous research conducted by Linhart et al. {1977), Turkowski et al. {1979, 1983), and Fagre et al (1983). CL's were used as received from the supplier. Combo lures resulted from the use of 2 or more EL's and/or CL's presented at 1 treatment site. In a Combo, lures were administered separately on delivery materials (usually q-tips) and placed within a 225 cm2 area. Combo lures were only used with leghold traps and cable snares and predominately used in FW test periods.
Responding animals were classified as coyote, other carnivores, herbivores, and birds. Behaviors were categorized according to Turkowski et al. (1979). Investigators were trained to interpret behaviors exhibited by coyotes and other animals responding to the lures. Ambient temperature was taken between 7-8:00 a.m., recorded each day and at each study area, and assumed the low temperature for that day. Temperatures were grouped into range classes of 5 C each starting with -23.3 C and ending with 37.2 C. Barometric pressure was obtained from meteorological monitoring facilities located nearest to each study site and recorded as rising, falling, or stable. Lunar phases were recorded as either new or full. New moon was defined as the time duration beginning with the first day of the third quarter through the last day before the first quarter. Full moon duration comprised of the remaining time period not
Table 2.--Commercial lures evaluated in the study.
Commercial lure1
(Carman's) Canine Distance Call Lure (Carman's) Final Touch (Carman's) Pro's Choice Olmstead Coyote Lure Olmstead Bait Stokers Bounty Mast #6 (Coyote #6) (O'Gorman) Gov't Call (O'Gorman) Long Distance Call (O'Gorman) Wolfer Scent (O'Gorman) Powder River Paste Johnson's Bait Kents Coyote Butter Fish Oil (Commercial)
Designation
CDCL CFT PC OCL OB SB M#6 OGC OLDC ows PRP JB KCB FO
1 Commercial lures were evaluated as received by the supplier.
197
covered by new moon. Duration of lure presentation in days was recorded at each inspection. If reapplication of lure was necessary, duration was reset at 0 days and increased until a capture was made, lure reapplied, or site removed. Lure presentation or 11 1 ure age 11 was grouped into 2-day age classes.
The calculation of capture rate for each lure and variable was necessary to standardize the data. Capture rate for each lure was obtained by dividing the total number of coyotes captured by the total trapnights exposed (Turkowski et al. 1979). Analysis of variance (ANOV) was used to determine if significant differences exist between coyote and simulated coyote capture rates of variables for individual lures. Lures used in >5 test periods within a season and generating responses or captures of >5 coyotes in at least 1 test period were considered as having sufficient data for analysis. Bivariate linear regression was used for additional analysis of temperature data. The slope inclination of the plotted data provided the relative stability of the lure and the R2 value provided the relative precision and fluctuation in capture rates.
RESULTS AND DISCUSSION
Investigators presented 44 lures at 2,328 treatment sites involving 46,164 trapnights. A total of 609 coyotes was captured in 15 FW test periods combining 25,478 trapnights. Leghold traps were used in 44.4% of total trapnights and captured 185 coyotes, M-44 NaCN ejectors composed of 48.7% of the total trapnights and resulted in 372 captured coyotes, and cable snares generated 6.9% of the total trapnights, capturing 52 coyotes. A total of 731 coyote-visits was recorded at simulated lethal capture devices from 15 SS test periods that generated 20,686 trapnights. Trap rings produced 64.5% of simulated coyote captures (N = 472) in 50.8% of total trapnights. M-44 heads were used in 45.3% of total trapnights and accounted for 33.5% of simulated coyote captures (N = 245), and break-away snares produced 1.9% of simulated coyote captures (N = 14) in 3.9% of total trapnights.
Devices
No one lure produced consistent FW coyote captures with all 3 lethal capture devices. Combos were effective in capturing coyotes when used with leghold traps, but not snares (table 3). CL's generated higher coyote capture rates than EL's when used with M-44 NaCN ejectors, but EL's produced higher coyote capture rates than CL's when used in conjunction with cable snares. Four lures, Synthetic Calf Crap (SCC), (Carman's) Canine Distance Call Lure (CDCL), WU 15-20%, and WU Acids (a mixture of C2, C4, C5, C9, and C10 acids) were analyzed using ANOV to determine if differences exist between coyote capture rates of lethal devices used. Coyote capture rates of
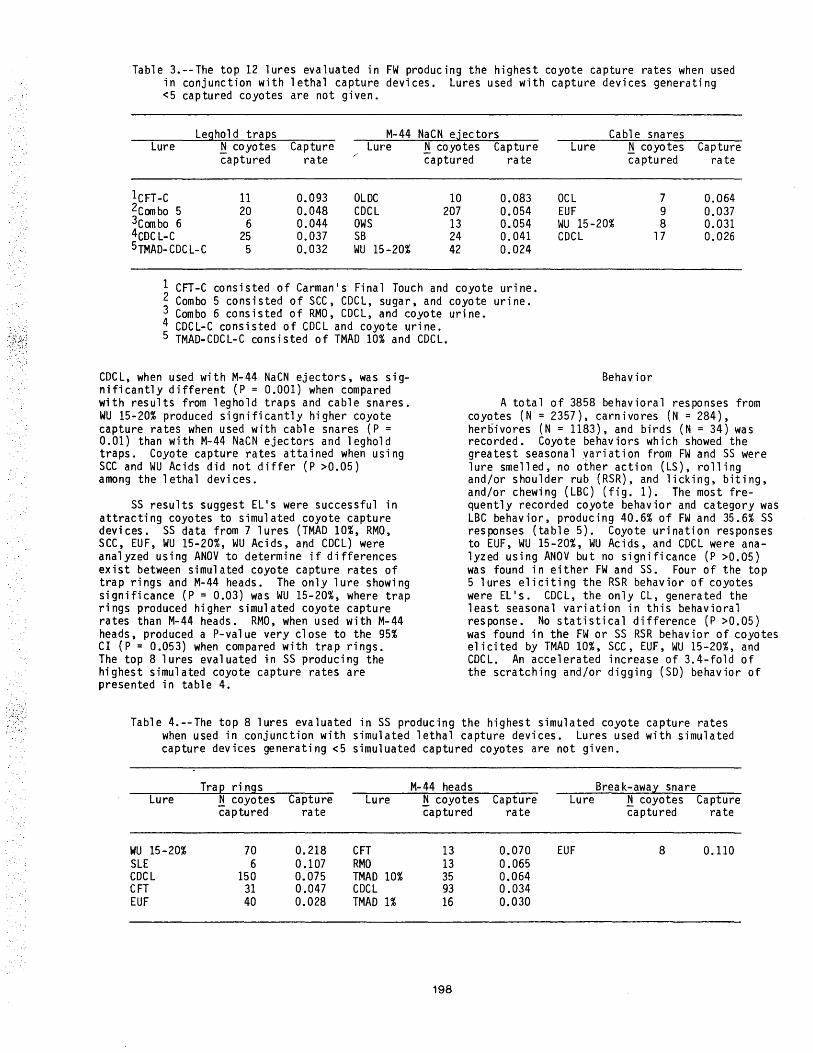
Table 3.--The top 12 lures evaluated in FW producing the highest coyote capture rates when used in conjunction with lethal capture devices. Lures used with capture devices generating <5 captured coyotes are not given.
Leghol d traEs M-44 NaCN ejectors Cable snares Lure !:! coyotes Capture Lure !:! coyotes Capture Lure !:! coyotes Capture
captured rate captured rate captured rate
leFT -C 11 0.093 OLDC 10 0.083 OCL 7 0.064 2combo 5 20 0.048 CDCL 207 0.054 EUF 9 0.037 3combo 6 6 0.044 ows 13 0.054 wu 15-20% 8 0.031 4coc L-C 25 0.037 SB 24 0.041 CDCL 17 0.026 5TMAD-CDCL-C 5 0.032 wu 15-20% 42 0.024
1 CFT-C consisted of Carman's Final Touch and coyote urine. 2 Combo 5 consisted of sec, CDCL, sugar, and coyote urine. 3 Combo 6 consisted of RMO, CDCL, and coyote urine. 4 CDCL-C consisted of CDCL and coyote urine. 5 TMAD-CDCL-C consisted of TMAD 10% and CDCL.
CDCL, when used with M-44 NaCN ejectors, was significantly different (P = 0.001) when compared with results from leghold traps and cable snares. WU 15-20% produced significantly higher coyote capture rates when used with cable snares (P = 0.01) than with M-44 NaCN ejectors and leghold traps. Coyote capture rates attained when using SCC and WU Acids did not differ (P >0.05) among the lethal devices.
SS results suggest EL's were successful in attracting coyotes to simulated coyote capture devices. SS data from 7 lures (TMAD 10%, RMO, sec, EUF, wu 15-20%, wu Acids, and CDCL) were analyzed using ANOV to determine if differences exist between simulated coyote capture rates of trap rings and M-44 heads. The only lure showing significance (P = 0.03) was WU 15-20%, where trap rings produced higher simulated coyote capture rates than M-44 heads. RMO, when used with M-44 heads, produced a P-value very close to the 95% CI (P = 0.053) when compared with trap rings. The top 8 lures evaluated in SS producing the highest simulated coyote capture rates are presented in table 4.
Behavior
A total of 3858 behavioral responses from coyotes (N = 2357), carnivores (N = 284), heroivores (N = 1183), and birds (N = 34) was recorded. Coyote behaviors which showed the greatest seasonal yariation from FW and SS were lure smelled, no other action (LS), rolling and/or shoulder rub {RSR), and licking, biting, and/or chewing (LBC) (fig. 1). The most frequently recorded coyote behavior and category was LBC behavior, producing 40.6% of FW and 35.6% SS responses (table 5). Coyote urination responses to EUF, WU 15-20%, WU Acids, and CDCL were analyzed using ANOV but no significance (P >0.05) was found in either FW and SS. Four of the top 5 lures eliciting the RSR behavior of coyotes were EL's. CDCL, the only CL, generated the least seasonal variation in this behavioral response. No statistical difference (P >0.05) was found in the FW or SS RSR behavior of coyotes elicited by TMAD 10%, sec, EUF, wu 15-20%, and CDCL. An accelerated increase of 3.4-fold of the scratching and/or digging (SD) behavior of
Table 4.--The top 8 lures evaluated in SS producing the highest simulated coyote capture rates when used in conjunction with simulated lethal capture devices. Lures used with simulated capture devices generating <5 simuluated captured coyotes are not given.
TraE rings M-44 heads Brea k-awa~ snare Lure !:! coyotes Capture Lure !:! coyotes Capture Lure !:! coyotes Capture
captured rate captured rate captured rate
wu 15-20% 70 0.218 CFT 13 0.070 EUF 8 0.110 SLE 6 0.107 RMO 13 0.065 CDCL 150 0.075 TMAD 10% 35 0.064 CFT 31 0.047 CDCL 93 0.034 EUF 40 0.028 TMAD 1% 16 0.030
198

LURE SMELLED, NO OTHER ACTION
ROLLING AND/OR SHOULDER RUB
LICKING, BITING AND/OR CHEWING
(LS) (RSR)
EUF
WU Acids CDCL
(LBC) CFT EUF
wu 1--J'---\J 5-20%
Fall, Winter Test Periods (FH)
TMAD 10%
CDCL
EUF CDCL r------r-t-------=:::1
Sprin~, Summer Test Periods (SS)
Figure 1.--Fall, winter (FW) and spring, summer (SS) seasonal variations of lure elicited coyote behaviors. Data provided in pie charts are from the comparison of 6 lures only; TMAD 10%, EUF, WU 15-20%, WU Acids, CDCL, and CFT.
FW LS behavior rates: TMAD 10%=0.006 WU 15-20%=0.007 CDCL=0.003 EOF =0.009 WU Acids =0.011 CFT =0.010
FW RSR behavior rates: TMAD 10%=0.000 WU 15-20%=0.000 CDCL=O.Ol6 EUF =0.005 WU Acids =0.001 CFT =0.000
FW LBC behavior rates: TMAD 10%=0.000 WU 15-20%=0.020 CDCL=0.037 EUF =0.009 WU Acids =0.018 CFT =0.007
SS LS behavior rates: TMAD 10%=0.011 WU 15-20%=0.014 CDCL=0.006 EUF =0.008 WU Acids =0.008 CFT =0.013
SS RSR behavior rates: TMAD 10%=0.001 WU 15-20%=0.003 CDCL~0.020 EUF =0.009 WU Acids =0.002 CFT =0.011
SS LBC behavior rates: TMAD 10%=0.036 WU 15-20%=0.040 CDCL=0.032 EUF =0.010 WU Acids =0.016 CFT =0.031
Behavior rates are calculated by dividing the number of behavioral responses by the total number of presentations (or trapnights).
coyotes was generated. in SS when comparing with FW. ANOV showed that Synthetic Porcupine Hair (SPH}, TMAD 10%, WU Acids, CDCL, and (Carman's) Final Touch (CFT) significantly (P <0.05} elicited the SD behavior more often in SS than in FW. Seven of 8 EL's increase the elicited LBC behavior of coyotes in SS while WU Acids decrease. Two of 3 CL's demonstrate a decrease of the LBC behavior in SS, but CFT produced higher LBC behaviors in SS.
EUF, WU 15-20%, WU Acids, and CDCL provided sufficient LBC behavior data for ANOV. FW coyote
19.9
LBC behaviors from CDCL and WU Acids showed to be significantly higher than in SS, but no difference (P >0.05) was found between seasons for LBC behavior elicited by EUF and WU 15-20%. EUF, WU 15-20%, WU Acids, and CDCL were analyzed using ANOV to determine if the FW LBC behavior was different among individual lures. The same lures, with the addition of CFT, were analyzed from SS. ANOV results indicate no statistical differences (P >0.05} between LBC behaviors elicited in FW, but a difference was found in SS. CFT produced significantly higher LBC behaviors of coyotes than the other 4 lures (P = 0.004).

Table 5.--Coyote behavfor response rates and seasonal ratios of experimental and superior commercial lures.
Lure 2Presentations 3Behavior rate seasonal ratio
TMAD 1% TMAD 10% RMO sec SPH EUF wu 15-20% WU Acids CDCL CFT SB
199/1012 1188/1854 180/1045 814/2126 169/711 101/2114
2410/1592 1520/2564 5228/4767 411/861 783/661
4Ls Urine
5:23 0:0 5:11 0:2
11 :23 0:0 4:17 1:1 6:18 0:3
30:8 4:9 7:14 5:9
11:8 4:9 3:6 2:7
10:38 0:17 3:2 0:0
Defee 5Rs 6so 7LBC
0:1 0:1 0:9 0:21 0:1 0:10 1:20 0:36 0:1 0:3 6:9 0:22 0:2 0:4 0:10 0:17 0:0 0:10 0:13 0:13 3:3 5:9 5:12 4:9 0:1 0:3 0:10 20:40 0:1 1:2 1:10 18:16 0:3 16:20 2:23 37:31 0:2 0:10 0:24 7:30 0:0 6:2 2:0 31:12
1 SLE, WU 1%, WU 10%, WU 10% +sugar, and SCC +sugar were not listed in Table 5 due to low presentation in FW and/or SS test periods.
2 Sum of seasonal presentation. FW data is given first followed by SS data. 3 Behavior rate seasonal ratio is calculated by dividing coyote responses by
presentations and multiplying by 1000 to give behavior responses per 1000 presentations. FW rates are presented first in the ratio followed by SS rates.
4 LS (lure smelled, no other action) was recorded if the coyote had entered the treatment site and approached the lure delivery material within a distance of no less than 30 em without being captured.
5 RSR = rolling and/or shoulder rub. 6 SD = scratching and/or digging. 7 LBC = licking, biting, and/or chewing.
Predator control techniques are most effective with lures which elicit either sniffing (lure smelled) or licking, biting and/or chewing response, and least effective with lures that elicit the rolling and/or shoulder rub (Scrivner et al. 1987). Coyote behavior required for efficient use of leghold traps and snares should be a compelling interest which interrupts other activities in which the coyotes are engaged, lowering coyote's normal caution, evoking approach, and ensuring interaction with the control device. The exhibited coyote behavior, which most likely represents the above list, was categorized into the LS behavior. All EL's evaluated in both seasons (FW and SS), except for EUF and WU Acids, generated higher LS coyote behaviors in SS. CL's generating the highest LS behavior and satisfying criteria for SS use with leghold traps and snares were CDCL and CFT. Turkowski et al·. (1979, 1983) and Fagre et al. (1983) found similar results in testing CDCL with wild and captive coyotes respectively. In comparing CDCL with TMAD, Fagre et al. (1983) recorded higher coyote summer visit rates for CDCL. The results of this evaluation found the opposite in that TMAD 1% and 10% generated higher LS behavior rates than CDCL.
Ideal lures used with M-44 NaCN ejectors should elicit the LBC behavior of coyotes (Timm et al. 1977), possess the compelling holding interest properties, and be selective and highly
200
attractive to coyotes during all seasons (Fagre et al. 1983). Results from lure evaluations conducted by Fagre et al. (1983) and Scrivner et al. (1984) found no lures that consistently elicited all behavioral properties required for M-44 NaCN ejectors in all seasons. EL's evaluated in this study meeting the above criteria and exhibiting high SS LBC behaviors of coyotes were WU 15-20%, TMAD 10% and 1%, Rotten Meat Odor (RMO), and SCC. However, lures producing consistent LBC behaviors of coyotes in all seasons (FW and SS) were WU Acids and CDCL. Turkowski et al. (1979) found the same results for CDCL and listed it as a superior coyote lure consistently eliciting the LBC behavior during all seasons.
Temperature
ANOV found no significance (P >0.05) between FW temperature ranges of coyote capture rates for EUF, WU 15-20%, WU Acids, CDCL, and Stokers Bounty (SB). However, SS data for the same lures were analyzed, and results found that WU Acids was the only lure that showed significant differences (P = 0.003) in simulated coyote capture rates and temperature ranges. The temperature range of 10.0 - 15.0 C produced higher simulated coyote capture rates than other temperature ranges. Lures producing high simulated coyote capture rates in SS at high temperatures (21.1 -26.1 C) were TMAD 10%, and SB. Lures producing high coyote capture rates in FW at low ambient

.07
r.::I.06 H
~.05 r.::l p:: ~.04
~ u.o3 ~ H ~-02 0 u
.01
.00 D
.04
~ H
~ .03 ~ p::
~ ~ .02 u ~ H 0 .01 >< 0 u
.oo A
. 06
~
~ .05
~ .04 :::::> . E-t ~ .03 u
~ .02 0
~ u .01
TMAD 10%
, .. ,,. ,.~··
E
B c
,... ,. ,.
.~~·· ,.·
'·~·· , .· "".· , .. ·· , .· ~···
F G H
TEMPERATURE RANGE
wu 15-20%
, , \
"" ' \ ' \
\
, , \ , \ , ... \
"'· '·· ... ' '
D E F G H I J
TEMPERATURE RANGE
Canine Distance Call Lure (CDCL) /---' , \
· .. , \ ,·/·.
' ' ·· .. ' ... ,_ ,·. · .. ' \
' '
I
' '
K
.oo~~--~--~----~--~--------~~-----A B C D E F G H I J K
TEMPERATURE RANGE
98.1% 98.6%
90.3% 92.7%
8.2% 26.9%
201
r.::l H
~ r.::l p:: :::::> H
~ u r.::l H 0 >< 0 u
r.::l H
.04
.03
.02
.01
.oo
.04
~ .03
~ H
~ .02 u r.::l H 0 i5 . 01 u
~ H
.121
~ .06 ~
~ H
~ 04 u· ~ H 0 i5 .02 u
B
A B
Estrous Urine Fractions (EUF)
c D E F G H
TEMPERATURE RANGE
WU Acids ,..._ I ' .. ··. -~ '
I '\ •. \ ,. ·.
\ \
\
\
\ \
' ' '---c D E F G H I
TEMPERATURE RANGE
Stokers Bounty (SB) ...... ·. '
·. ' ·. ' ..... \
·.. \
. ' · .. \
· .. \ · .. \
··.\
J
·~
\ ~-,·.
K
"· "' .oo~~--~--~--------~~--~--~~~·-.,~ ABC DE F G HI J K
TEMPERATURE RANGE
WlJ Acids FW WU Acids ss CDCL FW CDCL ss SB FW SB ss

• 175
. 1Xl ~ E-< ;2 . 125 ~ ~ 0
. ltD E-< e;: u c ~
.075 E-< 0 >< .09J w 0 u E
.025 A
.an 1-2 3-4 5-6 7-8 9-10 11-12 13-14 1S-16
LURE AGE IN DAYS
Figure 3.--FW coyote capture rates of WU 15-20%, WU Acids, EUF, and CDCL plotted against lure age. W=WU 15-20%, A=WU Acids, E=EUF, and C=CDCL.
temperatures ( -23.3 to -18.3 C) were WU 15-20%, CDCL, and SB.
Bivariate linear regression analysis was conducted on TMAD 10%, CDCL, EUF, WU 15-20%, WU Acids, and SB data from FW and SS to determine stability of coyote capture and simulated capture rates of temperature gradients (fig. 2). FW analysis suggest that the temperature fluctuation had very little effect on WU 15-20%, CDCL, and SB in attracting coyotes. SS regression analysis for TMAD 10%, EUF, WU 15-20%, WU Acids, CDCL, and SB indicate a varying degree of stability and that simulated coyote capture rates decreased as temperature increased. However, TMAD 10% exhibited a positive slope and simulated coyote capture rates increased as temperature increased. Regression analysis for TMAD 10% provided a R2 value of 98.6% which suggests very little fluctuation and precision in simu~ated coyote capture rates. In comparing 1 ures with avera 11 annua 1 stability of capture rates, (FW and SS), EUF, WU 15-20%, and CDCL appear to be broad based and least affected by changes in temperatures.
Lure Age
FW test periods produced 8 lure age classes with 28.1% of ceyotes {N = 52) being captured in the 5-6 day lure age class, followed by 25.9% {N = 48) captured in the 3-4 day lure age class. ANOV was conducted to determine if a difference exists between coyote capture rates and lure age classes. Three lures were evaluated from FW, and no significant difference {P >0.05) was found between capture rates of coyotes and lure age classes for WU 15-20%, WU Acids, and CDCL. Capture rates from WU 15-20%, EUF, WU acids, and CDCL were plotted against lure ages {fig. 3). A 3 point running average was applied to the mean in an effort to reduce graphic fluctuations.
202
SS results generated 11 lure age classes with 28.8% of simulated coyote captures {N = 119) from the 1-2 day age class. ANOV results of WU 15-20%, WU Acids, and CDCL data show no difference {P >0.05) between simulated coyote capture rates and lure age classes. Simulated coyote capture rates from SCC, CDCL, EUF, WU 15-20%, and WU Acids were plotted against lure age classes (fig. 4) after applying a 3 point running average to the mean rates. All lures illustrate a pattern of (a) increase, {b) leveling off, and (c) decrease of simulated coyote capture rates, with EUF, SCC, and WU Acids exhibiting prolonged patterns of b.
Lunar Phase and Barometric Movements
No statistical differences (P >0.05) were found for lunar phase and barometric movements of lures, suggesting that these 2 variables have little relative effect on attractiveness of lures to coyotes or coyote selectivity. Although ANOV found no significant relationship between FW barometric movements for lures and capture rates of coyotes, an overall trend was apparent. The FW rising and falling barometric categories consistently generated higher coyote capture rates than did the stable barometric movement. These trends were not evident in SS.
SUMMARY AND CONCLUSION
The probability of eliminating a specific depredating coyote is increased by optimizing the interaction of coyote behavior, chemicals, capture devices, and lures. Forty-five experimental and commercial lures were evaluated in the field to increase the efficacy and selectivity of leghold traps, M-44 NaCN ejectors, snares, and other control devices. A total of

.AD
fLI ~ .175 ~ w .1!0 ~ ~
~ .125 u fLI ~ .m 0 >< 0 u j::l
.075 fLI ~
i .em
H Cl) .025
.(III
c
E w A
s
1-2 7-8 9-10
LURE AGE IN DAYS
11-12 13-14 1.>-16
Figure 4.--SS simulated coyote capture rates of SCC, WU 15-20%, EUF, WU Acids, and CDCL plotted against lure age. S=SCC, W=WU 15-20%, E=EUF, A=WU Acids, and C=CDCL.
609 coyotes were captured in 15 FW test periods containing 25,478 trapnights. The top 9 lures representing the highest coyote capture rates when used in conjunction with (a) leghold traps, (b) M-44 NaCN ejectors, and (c) cable snares were (Carman•s) Final Touch Combo (CFT-C), Combo 5, and Combo 6; (O•Gorman) Long Distance Call (OLDC), (Carman•s) Canine Distance Call Lure (CDCL), and (O•Gorman) Wolfer Scent (OWS); Olmstead Coyote Lure (OCL), Estrous Urine Fractions (EUF), and WU 15-20% respectively. A total of 731 coyotes responded to simulated coyote capture devices from 15 SS test periods consisting of 20,686 trapnights. The top 7 lures producing the highest simulated coyote capture rates when evaluated with (a) trap rings, (b) M-44 heads, and (c) break-away snares were WU 15-20%, Sheep Liver Extract (SLE), and CDCL; (Carman•s) Final Touch (CFT), Rotten Meat Odor (RMO), and TMAD 10%; and EUF respectively.
EL•s produced the widest seasonal variance in individual elicited behaviors of coyotes, while the superior CL•s educed somewhat consistent seasonal coyote behaviors. Ambient temperature is considered to be the most influential weather variable regarding lure attractiveness to coyotes and efficacy of capture devices. Analysis of lunar phase and barometric movement data suggests these variables have little influence in the attractiveness of lures to coyotes and efficacy of capture devices. Lure age suggests that certain EL•s and CL•s produce a short-time limit in coyote attractiveness, while others are effective up to and beyond 2 weeks in FW and SS.
EL•s worked efficiently with leghold traps, snares, and M-44 NaCN ejectors in a well planned and delivered program, year round. CL•s used in
203
conjunction with EL•s were also effective in year round applications of control devices.
CL•s and EL•s elicited different behaviors at different seasons in different coyotes, and the behaviors can be predicted. This makes all of the cL•s and EL•s potentially valuable when coupled with the optimum equipment and placement. The key is to be able to evaluate the depredation situation, present and prescribe the proper lure, optimum equipment, location, and arrangement of equipment to produce the maximum probability of removing depredating coyotes.
ACKNOWLEDGMENTS
The authors express gratitude to J. Green and associates, USDA-ARS-US Sheep Experiment Station, Dubois, Idaho, for administrating the funding. We are also grateful to B. VanSant for his data tabulation expertise, and to G. Stewart, R. Hane, and R. Teague for gathering field data and enduring inhospitable weather conditions. R. Teranishi and the USDA, Western Regional Laboratory, ARS, Albany, California, are thanked for providing the experimental lures used in the evaluation and for assisting in obtaining the funding for the project. We are grateful to the Colorado State University Cooperative Extension Service and Department of Fishery and Wildlife Biology, Colorado State University, for granting time and university facilities to conduct this field research. K. Miller deserves thanks for his technical support in organization of raw data and computer analysis. A special thanks to P. Vohs, Denver Wildlife Research Center (DWRC), for his editorial comments and suggestions, and to F. Powe, DWRC, for typing the final manuscript.

. . . ~
LITERATURE CITED
Beasom, S. L. 1974. Selectivity of predator control techniques in south Texas. J. Wildl. Manage. 38:837-844.
Boddicker, M. L. n.d. (1979). Predator damage control - a state of the art and condition. Colo. State Univ. Ext. Serv., Dep. of Fish. and Wildl. Biol., Colo. State Univ., Fort Collins. 162 pp.
1980. Managing Rocky Mountain furbearers. Colo. Trappers Assoc. 176 pp.
DeZarn, D. 1984. Modern snaring explained. Spearman Publishing and Printing. Sutton, Nebr. 92 pp.
Fagre, D. B., B. A. Butler, W. E. Howard, and R. Teranishi. 1981a. Behavioral responses of coyotes to selected odors and tastes. Pages 966-983 in J. A. Chapman and D. Pursley, eds. Worldwide furbearer conference proceedings, Frostburg, Md.
-----, W. E. Howard, and R. Teranishi. 1981Q. Development of coyote attractants for reduction of livestock losses. Pages 319-326 in Proceedings of the wildlife-livestock relationship symposium, Coeur d'Alene, Idaho.
-----, -----, D. A. Barnum, R. Teranishi, T. H. Shultz, and D. J. Stern. 1983. Criteria for the development of coyote lures. Pages 265-277 in D. E. Kaukeinen, ed. Proc. fourth vertebr. pest control and manage. materials symp., Monterey, Calif.
Hawthorne, D. W. 1980. Wildlife damage and control techniques. Pages 411-439 in S. D. Schemnitz, ed. Wildlife management~echniques manual. 4th ed. The Wildl. Soc., Washington, D.C.
Kruse, S.M., and W. E. Howard. 1983. Canid sex attractant studies. J. Chern. Ecol. 9:1503-1510.
Linhart, S. B., G. J. Dasch, J. D. Roberts, and P. J. Savarie. 1977. Test methods for determining the efficacy of coyote attractants and repellents. Pages 114-122 in W. B. Jackson and R. E. Marsh, eds. Test methods for vertebrate pest control and management materials, ASTM STP 625. Am.
204
Soc. for Testing and Materials, Monterey, Ca 1 if.
Scrivner, J. H., W. E. Howard, and R. Teranishi. 1984. Aldehyde volatiles for use as coyote attractants. Pages 157-160 in D. 0. Clark, ed. Proc. eleventh vertebr.pest conf., Da v is , C a 1 i f. , , 1985. The use of diglyme as an odor-attractant solvent. J. Wildl. Manage. 49:519-521. , , 1987. Effectiveness of a 1 ure ca 11 ed "coyote contra 1." Wi 1 dl . Soc. Bull. 15:272-274.
Shult, M. J., C. W. Ramsey, and W. G. Klussmann. n.d. (1974?). Using the M-44 in coyote control. Texas Agric. Ext. Serv., The Texas A&M Univ. system. MP-1181. 11 pp.
Teranishi, R., and W. E. Howard. 1986. Coyote attractants. Sid Research Digest, Winter 1986:4-6.
Timm, R. M., G. E. Connolly, W. E. Howard, W. M. Longhurst, R. Teranishi, E. L. Murphy, and R. S. Harris. 1975. Coyotes respond to fractions of coyote urine. Sci. of Biol. J. 1:87-89.
-----, W. E. Howard, M. W. Monrow, R. Teranishi, and E. L. Murphy. 1977. A method for evaluating coyote scent baits. Pages 151-156 in W. B. Jackson and R. E. Marsh, eds. Test methods for vertebrate pest control and management materials, ASTM STP 625. Am. Soc. for Testing and Materials, Monterey, Calif.
-----, N. L. Gates, and W. E. Howard. 1978. "Progress in identification of coyote scent baits." Annual meeting WRCC-26, San Angelo, Texas, Aug. 23-24. 5 pp.
Turkowski, F. J., M. L. Popelka, B. B. Green, and R. W. Bullard. 1979. Testing the responses of coyotes and other predators to odor attractants. Pages 255-269 in J. R. Beck, ed. Vertebrate pest control-and management materials, ASTM STP 680, Am. Soc. for Testing and Materials, Sacramento, Calif.
-----,-----,and R. W. Bullard. 1983. Efficacy of odor lures and baits for coyotes. Wildl. Soc. Bull. 11:136-145.

Cougar Predation on Livestock in New Mexico, January 1983 Through June 19841
Gary A. Littauer and Ronald J. White2
Abstract: A telephone survey was conducted in which the objective was to obtain information from the entire population of livestock producers in New Mexico who had losses to cougars (Felis concolor) in 1983 and the first six months of 1984. A total of 103 ranchers reported losses in 1983 and 60 reported losses in the first six months of 1984. Verified (by examination of kills) losses of sheep and lambs to cougars totaled 1,202 in 1983 and 525 in the first half of 1984. Verified losses of cattle and calves totaled 230 in 1983 and 102 in the first half of 1984. Suspected losses (not verified) of sheep and cattle were similar in number to verified losses. Other verified livestock losses reported were 3 goats and 4 colts in 1983, and 25 goats and 2 colts in the first half of 1984. The value of reported losses to cougars in 1983 was at least $125,000 (producer-verified losses) and may have been as much as $220,000 (when suspected losses are included). The data suggested statewide cougar predation losses are substantially underrepresented by the passive reporting system used by the New Mexico Department of Game and Fish (NMDGF). Respondents reported a total of 217 cougars that were taken to control predation on livestock in the 18 months covered by the survey; 49% were reportedly taken on sport hunting tags suggesting that sport hunting has been a major method used by ranchers to address cougar predation problems.
INTRODUCTION
In 1983 a bill was introduced to the New Mexico State legislature to remove the cougar from the list of game animals protected under the authority of the New Mexico Department of Game and Fish (NMDGF). Hearings were held by the New Mexico House Agriculture Committee and the Consumer and Public Affairs Committee to receive public input on the bill. Considerable polarization of viewpoints between representatives of various sportsmen and trapping organizations and members of the livestock industry on
lPaper presented at the Eighth Great Plains Wildlife Damage Control Workshop [Rapid City, South Dakota, April 28-30, 1987].
2Gary A. Littauer, Wildlife Management Specialist, and Ronald J. White, Director, Division of Agricultural Programs and Resources, New Mexico Department of Agriculture, New Mexico State University, Las Cruces. (Mr. Littauer is currently employed by the U.S. Department of Agriculture, Animal and Plant Health Inspection Service, Animal Damage Control Program, Las Cruces, New Mexico).
205
one hand, and environmental groups on the other, established the controversial nature of the bill.
Concerns were voiced by some members of sportsmen groups that cougars were causing excessive adverse impacts on big game populations. Ranchers claimed cougars were causing intolerable losses of livestock and that existing legal remedies to control the problem were inadequate. They indicated some ranchers may not always report cougar predation problems to the NMDGF and may handle their own cougar predation problems. Environmental groups believed little was known about the status of cougar populations in New.Mexico and requested that no cougars be killed until adequate knowledge was available to assure that cougar populations could safely withstand human-caused mortality. The NMDGF reported the status of cougar populations in New Mexico was largely unknown.
As a result of the hearings, the committees concluded inadequate information existed to make

a decision on the bill. House Memorial 42 (HM 42) was passed requesting the NMDGF to study the status of cougar populations and the cougar predation problem. As part of its effort to respond, the NMDGF requested New Mexico Department of Agriculture (NMDA) assistance in developing a response to HM 42. NMDA conducted a survey of ranchers to determine the extent of cougar predation on livestock. This paper describes the methodology and results of the survey.
We thank D. Gerhardt, C. Hayes, and M. Owens of the U.S. Department of Agriculture/ New Mexico Agricultural Statistics Service (USDA/NMASS) for help in survey and questionnaire design and for use of telephone services. T. Stephenson and G. Aldrich assisted with telephone interviews. R. Owens and J. Knight provided suggestions on questionnaire design and reviewed earlier drafts of this manuscript. V. W. Howard also reviewed the manuscript. We also thank the county extension agents, Animal Damage Control (ADC) specialists of the cooperative ADC program between NMDA and the USDA-Animal and Plant Health Inspection Service (APHIS) and the ranchers who cooperated to provide names and information for the survey.
METHODS
A list of ranchers with cougar predation problems was developed by soliciting names from (1) ADC specialists in the cooperative ADC program; (2) county extension agents; and (3) ranchers as they were contacted in the survey. The goal of this effort was to attempt to contact every rancher in New Mexico who had experienced cougar predation problems in calendar year 1983 or in the first six months of 1984. Although every impacted rancher was probably not contacted, the effort should have provided a minimum estimate of the extent of cougar predation problems during the specified periods. The major advantage of this survey methodology was reduced sampling error. Since the goal was to obtain information from the entire population (i.e., all ranchers with cougar problems), normal sampling problems were eliminated.
Attempts were made to contact each rancher on the list by telephone, in person, or by mail. Telephone interviews were conducted by NMDA personnel and personnel of the USDA/NMASS. Questions were asked to obtain information on the following subjects:
1. The number and class of livestock lost to cougars in 1983 and in the first half of 1984 that the rancher, his or her employees, or government agency personnel verified by personal examination of the carcasses.
206
2. The number and class of suspected but unverified livestock lost to cougars in each of the above time periods.
3. The county of the rancher's enterprise where cougar losses were experienced.
4. The number of cougars killed to control predation on livestock in 1983 and in the first half of 1984.
5. The number of cougars killed for depredation control that were taken on sport hunting tags.
6. The names and telephone numbers of additional ranchers who may have experienced cougar problems.
7. Other comments.
When telephoning was near completion in late July 1984, notices were printed in newsletters of the New Mexico Cattle Growers' Association, New Mexico Wool Growers, Inc., New Mexico Farm and Livestock Bureau, and in the New Mexico Stockman magazine. The notices requested affected ranchers who had not been contacted to contact NMDA by September 1, 1984.
A list of 209 names was developed for contacting in the survey. Twenty-six ranchers could not be reached by telephone or in person. These 26 producers were mailed a questionnaire with a letter asking them to either complete the questionnaire and return it, or to call NMDA toll-free with their information before September 1, 1984.
Respondents in the survey were assured their individual responses would be held confidential and only totals, averages, and percentages would be used in the report.
USDA/NMASS (personal communication) provided economic data used to estimate livestock values.
RESULTS
A total of 114 ranchers in 17 counties (Fig. 1) reported losing one or more head of livestock to cougars during the 18 months covered by the survey; 103 reported experiencing losses in 1983 and 60 reported losses for the first half of 1984. Forty-nine ranchers reporting losses to cougars in 1983 also had losses in the first half of 1984.
No contact was made with the 26 ranchers who were mailed questionnaires. Sixty-eight ranchers reported they either had no losses, or they were unaware of any losses to cougars during the specified periods. One rancher refused to answer specific questions although he indicated experiencing losses to cougars.

Sheep Losses
Information obtained on sheep losses to cougars is summarized in Table 1. In 1983, about 50% of the ranchers with losses and 33% of the verified losses were in Lincoln County. Eddy County contained nearly half (48%) of the total verified sheep losses but contained only 18% of the ranchers with losses. Consequently, Eddy County experienced the highest mean number lost per rancher. The number of verified losses per affected rancher in the survey ranged from 1 to 306 indicating high variability among ranchers. Over 25% of the total verified sheep and lamb losses in 1983 were reported by one rancher in the survey.
Southeastern New Mexico contained the majority of known cougar predation problems on sheep; nearly 97% of the total verified losses of sheep and lambs occurred in southeastern counties (Chaves, Otero, Lincoln, and Eddy). We located only three sheep ranchers in northern New Mexico who suffered losses to cougars. Figure 1.--New Mexico counties with reported
livestock losses to cougars in 1983 or the first six months of 1984.
Table 1.--Summaries of sheep and lamb losses to cougars in New Mexico reported by ranchers for 1983 and the first half of 1984.
Calendar Year 1983
Total No. of No. of Ranchers Sheep & Lambs Mean No. Lost
County With Losses Lost Per Rancher
_y_l V+S 2 _y_ V+S _y_ V+S
Harding 1 1 15 15 15 15 San Miguel 1 1 14 14 14 14 Santa Fe 1 1 8 8 8 8 Chaves 4 5 184 606 46.0 121.2 Otero 2 2 5 5 2.5 2.5 Lincoln 14 18 395 904 28.2 50.2 Total Dollar Value3 Eddy _2 _Q 581 728 116.2 121.3 v V+S Statewide 28 34 1202 2280 42.9 67.1 $55,833 $105,742
First Half of 1984
Chaves 2 2 88 338 44.0 169.0 Lincoln 6 9 216 468 36.0 52.0 Total Dollar Value Eddy --.!± --.!± 221 326 55.3 ____tl_,2 v V+S Statewide 12 15 525 1132 43.8 75.5 $24,671 $52,583
1v = losses reportedly verified by examination of carcasses. 2v + S = verified losses plus losses that were suspected but not verified by
examination of carcasses. 3value of lambs was $45.09 per head based on assumed average weight of 90 lbs.
per head and average price of $50.00 per 100 lbs. (USDA/NMASS). Average 1983 inventory value of adult sheep was $47.50 per head (USDA/NMASS).
207

Sheep losses in the first half of 1984 were proportionately similar (on a temporal basis) to losses in 1983. Forty-three percent of the ranchers experiencing verified losses in 1983 experienced losses in the first six months of 1984. Total losses (verified plus suspected) in the first half of 1984 were 44% of those reported for 1983. The mean number of sheep lost per rancher also was similar between 1983 (x=43) and the first half of 1984 (x=44). The same counties where the majority of losses occurred in 1983 also experienced losses in 1984.
Cougars caused more losses of adult sheep than of lambs; 63% of the total verified losses of sheep and lambs for the 18 months was of
adult sheep; 64% of the dollar value of those losses was in adult sheep.
Cattle Losses
Data obtained on cattle losses to cougars is summarized in Table 2. Numbers of cattle losses were substantially less than sheep losses but dollar values were higher. The value of verified cattle losses was nearly 24% greater than the value of verified sheep losses in 1983.
Cattle losses as determined by the survey also were distributed more widely than sheep losses in 1983, occurring in 12 counties (as
Table 2.--Summaries of cattle losses to cougars in New Mexico reported by ranchers for 1983 and the first half of 1984.
Grant Hidalgo Socorro Catron Sierra Luna Dona Ana Harding Union Colfax Lincoln Eddy Rio Arriba Chaves Statewide
Grant Hidalgo Socorro Catron Sierra Dona Ana Colfax Lincoln Eddy Harding San Miguel Rio Arriba Statewide
No. of Ranchers With Losses
V I V+S 2 17 17
3 4 5 5
11 12 11 11
1 1 1 1 1 2 1 1 1 2 5 6 4 4
1 _1_
61 68
9 9 3 3 2 4 7 9 5 6 1 1 1 1 3 4 3 5
1 1
_1_ 34 45
Calendar Year 1983 Total No. of
Cattle Lost
_y_ 78 17 24 37 36
1 6 2 1 1
16 11
230 First 22 10
2 32 15
1 1
14 5
102
V+S 93 33 37 60 60
4 20
8 1 2
32 28
2 _ll_ 391 Half
44 10 32 62 25
3 5
34 16
4 2
_3 240
Mean No. Lost Per Rancher _3_ V+S 4.6 5.5 5.7 8.3 4.8 7.4 3.4 5.0 3.3 5.5 1 4 6 20 2 4.0 1 1 1 1 3.2 5.3 2.8 7.0
3.8 of 1984
2.4 3.3 1.0 4.6 3.0 1 1 4.7 1.7
3.0
2 _11 __
5.8
4.9 3.3 8.0 6.9 4.2 3 5 8.5 3.2 4 2 _3_ 5.3
Total Dollar Value3 ----~V___ V+S $68 988 $116.349
Total Dollar Value3
V V+S $30.826 $71.495
1v =losses reportedly verified by examination of carcasses. 2v + S = verified losses plus losses that were suspected but not verified by
examination of carcasses. 3value of calves was $293.00 per head based on 1983 price per 100 lbs. of $65.20
and assumed average weight of 450 lbs. at marketing (USDA/NMASS). Value of cows and yearlings assumed equal to average 1983 inventory value of $340 per head (USDA/NMASS)
208
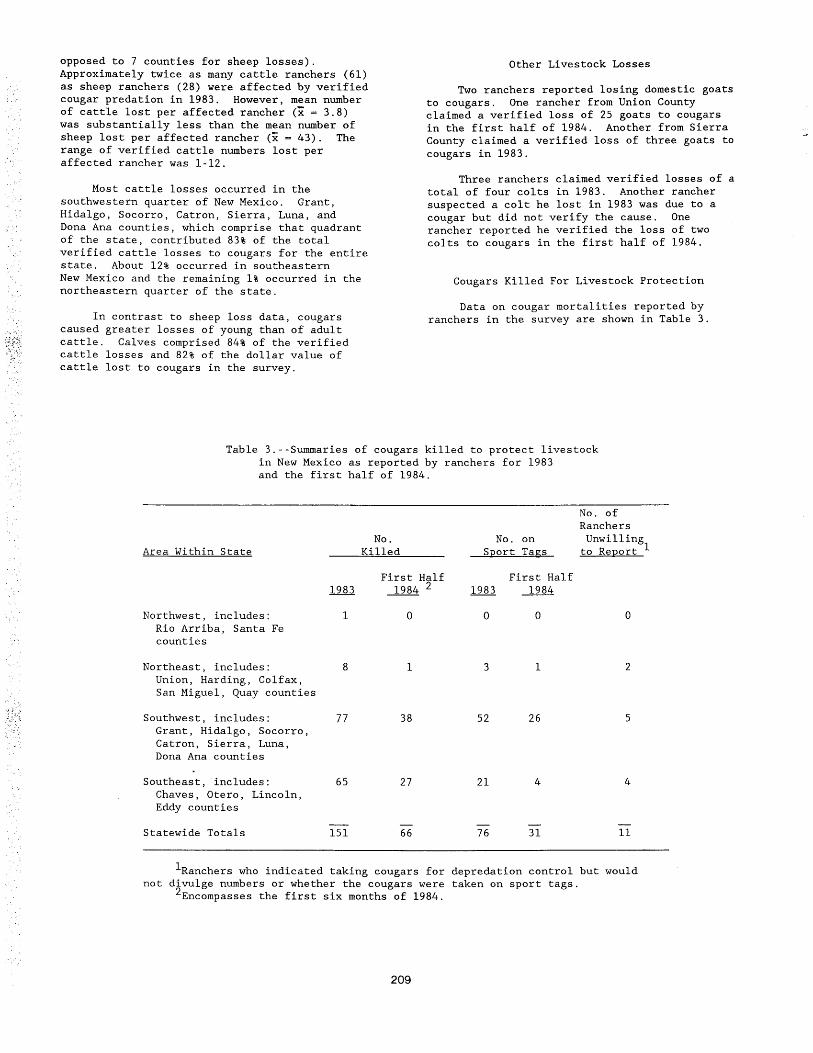
opposed to 7 counties for sheep losses). Approximately twice as many cattle ranchers (61) as sheep ranchers (28) were affected by verified cougar predation in 1983. However, mean number of cattle lost per affected rancher (x = 3.8) was substantially less than the mean number of sheep lost per affected rancher (x = 43). The range of verified cattle numbers lost per affected rancher was 1-12.
Most cattle losses occurred in the southwestern quarter of New Mexico. Grant, Hidalgo, Socorro, Catron, Sierra, Luna, and Dona Ana counties, which comprise that quadrant of the state, contributed 83% of the total verified cattle losses to cougars for the entire state. About 12% occurred in southeastern New Mexico and the remaining 1% occurred in the northeastern quarter of the state.
In contrast to sheep loss data, cougars caused greater losses of young than of adult cattle. Calves comprised 84% of the verified cattle losses and 82% of the dollar value of cattle lost to cougars in the survey.
Other Livestock Losses
Two ranchers reported losing domestic goats to cougars. One rancher from Union County claimed a verified loss of 25 goats to cougars in the first half of 1984. Another from Sierra County claimed a verified loss of three goats to cougars in 1983.
Three ranchers claimed verified losses of a total of four colts in 1983. Another rancher suspected a colt he lost in 1983 was due to a cougar but did not verify the cause. One rancher reported he verified the loss of two colts to cougars in the first half of 1984.
Cougars Killed For Livestock Protection
Data on cougar mortalities reported by ranchers in the survey are shown in Table 3.
Table 3.--Surnrnaries of cougars killed to protect livestock in New Mexico as reported by ranchers for 1983 and the first half of 1984.
Area Within State
Northwest, includes: Rio Arriba, Santa Fe counties
Northeast, includes: Union, Harding, Colfax, San Miguel, Quay counties
Southwest, includes: Grant, Hidalgo, Socorro, Catron, Sierra, Luna, Dona Ana counties
Southeast, includes: Chaves, Otero, Lincoln, Eddy counties
Statewide Totals
No. Killed
First Half 1983 1984 2
1 0
8 1
77 38
65 27
151 66
No. of Ranchers
No. on Unwilling S£ort Tag;s to Re2ort 1
First Half 1983 1984
0 0 0
3 1 2
52 26 5
21 4 4
76 31 11
1Ranchers who indicated taking cougars for depredation control but would not divulge numbers or whether the cougars were taken on sport tags.
2Encompasses the first six months of 1984.
209

About 53% of cougars killed to protect livestock were taken in southwestern New Mexico while 42% were taken in southeastern New Mexico. In total, 95% of the reported cougars killed were taken in the southern half of the state. Approximately half (49%) of the cougars killed to protect livestocl. were reportedly taken on sport hunting tags. Eleven ranchers indicated they killed cougars for depredation control but would not divulge numbers.
DISCUSSION
Surveys of farmers and ranchers to quantify predation losses have been criticized as being potentially inaccurate. Producers seldom perform necropsies on dead animals, whereas necropsies are performed in biological damage assessment studies. Instead, producers often determine the cause of death by observation of the carcass and the site where the carcass is located. Doubtful cases or missing animals may be attributed as losses to the most likely cause based on experience or the circumstances at the time. For example, if the weather has been comfortable, missing lambs would not be attributed to the effects of cold, damp temperatures. Thus, more judgement is involved with ranchers' determinations of losses than in biological assessments. This factor must be considered in evaluating survey data. We attempted to resolve this problem by specifically requesting numbers of losses verified by examination of kills, as distinguished from suspected losses due to circumstantial evidence.
DeLorenzo and Howard (1977) reported that losses of sheep and lambs to predators, verified by trained biologists using radio telemetry on a range lambing operation in New Mexico, were similar to losses reported by the rancher on questionnaire surveys in two previous years. Gee et al., (1977) reported on results of a survey conducted by USDA to estimate sheep and lamb losses to predators and other causes in the western United States and provided the following observation: "Too few ranches have been included in biological damage assessment studies to permit generalization as to overall loss levels which could be statistically compared with those of the producer surveys conducted for this study. The most that can be observed so far is that the loss levels found on the few damage assessment ranches and those reported by surveyed produc~rs appear to be generally compatible." These studies suggest rancher surveys can provide acceptable data on livestock losses to predators.
Although this type of survey cannot determine the accuracy of the response information, some general impressions were obtained by the senior author who conducted telephone interviews with approximately one-third of the respondents. Most of these ranchers would not attribute unknown losses to cougars. Many ranchers reported a number of
210
cougar-caused losses that were verified, and implied they may have experienced other losses to cougars, but were not willing to classify them as suspected losses. These responses indicated the ranchers did not exaggerate reported losses to emphasize the importance of their problems.
A few ranchers did not know the extent of their losses to cougars, but due to circumstantial evidence, believed they had suffered losses. Achieving smaller calf crops in pastures they knew were frequented by cougars compared to calf crops obtained in pastures not considered to be habitat for cougars is an example of circumstantial evidence suggesting losses to cougars. Although these ranchers could have classified these as estimated "suspected" losses to cougars, we did not include this information to remain conservative in our estimate of total statewide losses.
We located only one rancher with cougar-caused losses in northwestern New Mexico. Approximately one-third of that quadrant is Indian reservations and we did not attempt to contact them. Therefore, losses in that quadrant may be underrepresented in survey totals.
Suspected sheep losses were nearly equal in number (1685) to verified losses (1727) in the 18-month period covered by the survey. Similarly, suspected cattle losses (299) were approximately equal to verified losses (332) reported over the same period. This information suggests ranchers only verify about half of the losses they may experience.
Certain individual sheep ranchers suffered substantially greater economic losses than individual cattle ranchers. The greatest individual loss reported by a sheep rancher was about $14,000 for verified losses in 1983 while the greatest verified cattle loss reported by an individual was about $4,000. Economic losses were not evenly distributed among ranchers suffering cougar predation problems.
Evans (1983) reported a 10-year average (1973-82) of 11.2 ranchers in New Mexico reporting cougar depredation incidents to the NMDGF. Evans reported the average total statewide value of annual livestock losses to cougars was $29,500. NMDA's survey, however, indicated the statewide value of losses in 1983 was at least $125,000 (verified losses) and may have been $220,000. These data suggested the passive reporting system (using unsolicited reports) of the NMDGF underrepresented actual losses by as much as 87%.
This survey provided m1n1mum estimates because all ranchers with livestock losses to cougars may not have been surveyed. The range of estimated dollar losses caused by depredating cougars in the first half of 1984 was consistent with 1983 suggesting economic losses for 1983

and 1984 would have been similar had we obtained data for all of 1984.
Our estimates of economic losses by ranchers because of cougar depredations do not include various indirect costs including extra management practices, veterinarian bills, and predator control. Therefore, our estimates underrepresent the adverse financial impact of cougars on affected ranchers. For example, one respondent suffered no losses of livestock, but owned two high-valued horses that were attacked by a cougar. This individual reportedly spent approximately $8,000 on horse stalls solely for protection against cougars. These types of costs are not included in the total dollar loss estimates.
Approximately 50% of the cougars that ranchers reported were taken for controlling predation in 1983 and the first half of 1984 were taken on sport hunting tags. This suggested that ranchers relied heavily on licensed sport hunting to address cougar predation problems. Therefore, reduction of sport hunting seasons may adversely impact the ability of some ranchers to control cougar predation problems when they rely on cougar hunting guides with licensed sport hunters to take problem cougars.
The NMDGF recommended the New Mexico State Legislature appoint a study group to examine
211
various mitigation alternatives, including compensation of ranchers for losses, in addressing cougar predation problems. Although it is unknown whether 1983 and the first half of 1984 are "average" years with regard to cougar predation problems in New Mexico, the results of this survey provide an indication of the potential funding requirements for compensation of losses.
LITERATURE CITED
DeLorenzo, D. G., and V. W. Howard, Jr. 1977. Evaluation of sheep losses on a range lambing operation without predator control in southeastern New Mexico. New Mexico
··- State Univ., Agr. Exp. Sta. Res. Rep. 341. 13 p.
Evans, W. 1983. The cougar in New Mexico -biology, status, depredation of livestock, and management recommendations. New Mexico Dep. Game and Fish, Response to House Memorial 42 of the New Mexico State Legislature. 40 p.
Gee, K. C., S. Magleby, W. R. Bailey, L. Gum, and L. M. Arthur. 1977. Sheep and lamb losses to predators and other causes in the western United States. Nat. Res. Econ. Div., Econ. Res. Ser., U.S. Dep. Agr. Agr. Econ. Rep. No. 369. 41 p.

Snaring as a Beaver Control Technique in South Dakota1
2 Jerry Riedel
Abstract.--Methods used for alleviating beaver damage include suggestions on farm management, extension trapping, and direct control. Direct control Is utilized in the majority of the complaints with snaring constituting the most often used control technique.
The region of responslbll ity for my animal damage control work in South Dakota is the ten counties In the northeast corner3ot the state, encompassing 7,184 square miles. Geographic features Include the glacial produced Lakes Region, Coteau Hil Is, two rivers, numerous streams and draInages, all four types of wetlands, and farm and pasture land.
The Lakes Region lncl udes 257 natural lakes total lng approximately 198,000 acres of water (Anonymous, 1973). The shorel lnes are surrounded with various species of deciduous trees which provide good beaver habitat.
The Coteau Hil Is Is a rough highland extending from the N~rth Dakota border southward for about 200 miles. This highland forms a "hogsback" approximate! y 25 mi I es wide with an elevation of over 2,000 feet above sea I eve I (Schel I, 1968). Wooded coulees rise above the streams coming down the eastern side of these hll Is. These drainages feed into larger streams as they reach the fIats.
On the flats there are gentle rol I ing hil Is and level farm country that is intersected by the Little Minnesota River and the Sioux River
1Paper presented at the Eighth Great Plains Wlldl lfe Damage Control Workshop (Rapid City, South2 Dakota, Apr fl 2 8-30, 1987 >.
Jerry Riedel Is Extension Trapper, Department of Game, Fish and Parks, Watertown, so 3Anonymous- 1973, South Dakota Geographic Names~ Brevet Press, Sioux Fal Is, South Dakota
Schel 1, Herbert S. 1968. History of South Dakota, University of Nebraska Press, Lincoln, NE.
212
along with the Twin Brooks, Whetstone, Yel lowbanks, and other various smaller tributaries. AI I these features add much diversity to the region whll eat the same time making It very suitable for beaver and very susceptible to beaver damage.
I divide my beaver damage problems into three categories: cutting, flooding, and eroding. From a total of the last 500 beaver complaints worked on 46 per cent were from the cutting of trees and corn (of which 94 per cent involved trees). Also 46 per cent of the complaints Involved the beaver control I lng water levels by either preventing the flow from going downstream, or the flooding of the upstream. Beaver eroding earthen structures such as road grades, railroad beds, sewage lagoons, and stream and lake banks totaled 8 per cent of the total complaints.
The geographic and the damage diversity necessitates various approaches to solving beaver damage problems. on 4 per cent of the total complaints I have suggested changes In farm management practices. For example, I have recommended the use of woven wIre or electric fencing around a shelterbelt or cornfield for beaver exclusion. I have recommended the use of an electric fence to prevent beaver from repairing a torn hole In the dam. Lowering the water level with the use of an Instal led trickle tube can be another form of farm management. Screening or wrapping of individual trees is another example. However, these methods give on I y temporary rei let at best.
Approach method two Is the extension approach. I handle approximately 10 per cent of the complaints In this manner. I wll I assist In locating a private trapper to do the control work or wll I give Individual Instructions to private trappers or to the complalnee.

The approach I use most often on beaver damage Is direct control, where I eradicate the beaver myself. For my direct control work I use the snare the most often. I take approximately 95 per cent of ~ beaver In snares, about 3 per cent of the beaver are taken with leghold traps, one per cent are trapped w lth bodygr Ips, • 5 per cent are taken In I lve traps and .5 per cent are shot. Snares are very effective on beaver and have the advantage In that they are quite versatile and are quick and easy to use. With snares you do not scare or spook the beaver and the nontarget catches are just about nonex I stent.
For the snare Itself I prefer a 36 inch length of 7x7 3/32 Inch cable, a Gregerson swivel and either a Hoffman or Gregerson lock. An S-hook attaches the snare to a second swivel on a four foot length of chain which rotates around the anchoring stake. The short snare and second swivel on the chain wfl I help prevent the snare from being kinked or frayed after a catch is made. Wire wll I bend and break and should not be used for anchorIng a snare.
I use two different types of stakes. A three foot length of 3/8 inch rod is used for firm soils such as sod or partially frozen ground, and a three foot length of 3/4 Inch diameter pipe is used for soft or spongy ground. Where available I wfl I attach my chain to a tree or other immovable structures that are present for a means of anchoring the catch.
To support the snares a length of bal lng wire 14 Inches long fs crimped and wrapped on the snare near the swivel. The other end of the bal fng wire Is then attached to a support stick, placed upright fn the ground. There should only be 4 to 6 inches of slack left fn the baling wire allowing the snare to pul I tight quickly. The bal lng wire Is I lght enough to allow flexlbll lty for centering the snare fn Its exact setting position, but yet Is strong enough to support the suspended snare.
The Imitation castor mound has been the most productive snare set for me. It offers good eye appeal as wei I as having the attractabll ity from th.e odor of the 1 ure. If possible I select a sl lghtly elevated bank as this adds to the visibll lty of this set. Wind direction Is also very Important when selecting a location for this set. I've caught many beaver on eye appeal alone but the success is much greater when the wind carries the odor of the I ure to the beaver. In making the set sf fck up the bank with mud and build a smal I mound about 2 to 3 Inches high with mud, and sticks, leaves or grass. Dead branches are used for guide sticks and are pushed into the mud about 6 inches apart and angl lng away from the bank.
213
Build this fence about 2 feet out along the shorel lne on each side from the center of the castor mound. ThIs w I I I prevent the beaver from working the set from the sides. This fence Is more or I ess V-shaped w Jth an openIng at the point of the V being one foot or more out Into the water directly In front of the castor mound. This opening Is then guarded with a snare. Beaver I Ike the security of the water so by having the snare in the water Instead of on shore you wll I catch the beaver that normally won't leave the security of the water. But most Importantly, by keeping this much distance between the snare and the I ure the beaver will have to go Into the snare to get close enough to the lure to satisfy their curiosity. Keeping the snare off the bank w II I al so el lm I nate nontarget raccoons.
The snare Is set with a 9 to 10 Inch noose with only about 2 Inches of the snare being under water. If there Ts a high population of muskrats or waterfowl present the snare can be I owered another Inch or two to I et these animals swim through without pul I I ng the snare down. However, the higher you can keep the bottom of the noose the quicker It tightens on the beaver. This el lmlnates the bulk of pulled snares by beaver as wei I as I eg or ta I I catches.
During rainy weather the lure Is placed In open plastic containers or covered with a 4x4 Inch sheet of plastic and Incorporated Into the castor mound. This prevents the lure from being diluted or being washed away. However, most of the time a dead stick is used to collect an amount of lure about equal to the size of a honey bee and Is simply placed on the castor mound. I might also mention rainy and windy nights are generally not as productive as "fair weather" nights. I bel leve the beaver's activity fs somewhat reduced during bad weather and they are a I so more hes f tan+ f n work 1 ng I ured sets. The sets are relured after every catch, and ff the lure was not covered, they are relured after every rain. During the hot summer months lure is added about every third day, ff st f I I needed.
For lure I prefer dried, ground castor with enough glycerine added to form a paste. As a backup I ure I use ground castor with an I se of I and cottonwood bud oil as additives. I add 1/2 of a tablespoon of each of the oils to an equfval ent of two baby food jars full of castor and again add glycerine to form a paste. Either I ure works well all year w lth the castor and oils mixture showing a significantly higher catch rate on a set that has already taken beaver over relurlng with straight castor. During the hot summer months beaver lose some of their curiosity to lures and beaten up 2 year old beaver may shy completely away from a castor based I ure.

Bait sets for beaver are most productive In early spring and again In late fal 1. However. this set seems to provide more Interest to younger beaver. and Is usually not productive on any beaver during the summer months. If there Is evidence of trees being currently used for food durIng the summer the set wIll work. otherwise assume the beaver are feeding on aquatic vegetation. For the batt set. as with the castor mound set. I prefer keeping the snare In the water with only an Inch or two of the snare under water. The batt Is also placed In the water. This Is accomplI shed by using natura I I y formed bays. or by fencIng; thus allowing the beaver only one way Into the batt. For bait I prefer green soft wood varieties such as cottonwood, poplar, or willow. The bait branches are from pencil-sized to wrist-sized and are placed In a floating pile with the bark removed from the ends of some of the top most branches. Corn, even when bel ng uti I !zed by beaver makes a poor baIt due to dIsturbance by raccoons, muskrats, waterfowl and squirrels. Castor may be used at this set but I generally prefer not luring the bait sets as It wll 1 add variety from the castor mound set.
also snare any narrow "bottleneck" In the stream that narrows the waterway the beaver are using. Some fencing to help guide the beaver may be necessary and agaIn keep a II but 2 Inches of the snare suspended above water. This Is a very productive set and no I ure shout d be used.
Trails leading over dams are also good, especially In a multi-dam colony. I keep the snare In the water by fencing In front of the trail on the top of the dam, or most often In the trail on the bottom side of the dam where the trail meets the water as this requires less fencIng.
Trails leading to the upland are also set but these trails are normally active only In the fal I of the year. Again the snare Is placed In the water at the head of th.e trafl as thIs wIll avoid deer and raccoon. If the snare Is used over dry ground suspend the snare about 1 I 4 Inch off the ground and shorten the noose size down to about 8 Inches.
214
I wIll usua I I y make 6 to 8 snare sets per colony us r ng a comb r nat! on of the sets I have mentioned. Like other trapping, best results come from a variety and/or variation of sets. It Is helpful to get as many beaver as possible In the first two nights before they get shy and/or lose Interest In the lure.
If beaver lose Interest In the lures a hole may be punched In the dam and guarded w lth a leghold. Keeping the hole smal I, about 6 Inches wide and 3 Inches deep, Is enough to get the beaver's Interest but yet keeps the beaver centered on the set In their attempt to repair the dam. I place the trap for a front foot catch so the trap Is placed about 2 Inches off center and no more than 3 Inches under water. For animal damage control work where the entire colony must be removed the trap placement for the hind foot catch can be too variable due to the various sizes of the beaver. By September the young of the year are assisting with dam repair and any trap set for a hind foot catch on an adult w fll miss these smaller beaver. Another set for I ure shy beaver J s open J ng the dam and placing some dead branches on the bank a few· yards upstream from the dam and guard these branches with a snare or leghold. The beaver will often times attempt to use these branches for repairing the dam.
In summary, the methods as mentioned are the methods I have used during my 14 1/2 years of animal damage control work. It Is my wish with this paper to share the methods that work for me In hopes some w I II be appl icabl e for you. The more methods that are available to, and used by the Individuals responsible for animal damage complaint work the more efficient we wll I be In al lev fating the problems that have been created by either man or animal.

Consider Using Electric Powered Fences for Controlling Animal Damage1
2 Robert E. Steger
The use of electronics in animal damage control is not new. The use of amplified frequencies or sound has been widely used for controlling insects, rats, and other kinds of animals. Recent innovations for uses of electric powered fences are being recognized. Animals heretofore managed by expensive predacides or physical barriers are being managed with electric powered barriers. For example, caterpillars are being economically managed in New Zealand with the use of one electrical wire slightly above ground level. This application is being made possible because electric powered fences are 1) economical; 2)effective; 3) provide flexibility; and 4) are relatively easy to install.
An economic comparison of electrical powered fence to conventional fencing reveals that the electrical fence is only one-third to one-half the cost of the conventional kind. Both labor and material requirements are reduced.
In regards to efficiency, the electrical powered fence is more efficient than conventional fencing for some animals. Animals such as coyotes, buffalo, elk, moose and others may be only partially controlled by conventional fencing and may even find a challenge in tearing it up. Whereas, these same animals become very afraid of electrical fences.
Specially designed structures such as two parallel fences of a few wires on each (one or two) can restrain deer from damaging high-value crops. A slight deviation of this, the fence constructed on an angle (leaning) with the ground has been effective in controlling some animals, especially those capable of jumping.
The modification of a conventional fence with electrical powered attachments can often increase the effectiveness of an existing conventional structure. The control of coyote predation has been shown to be most effective in both Texas and Arizona studies by adding electrical wires, one slightly above ground level
1 Paper presented at the Wildlife Damage Con-
trol Workshop in Rapid City, South Dakota, April 28-29' 1987.
2Robert E. Steger, Ph.D., Public Relations, Twin Mountain Supply Co., Inc., San Angelo, Texas.
215
offsetting the conventional net wire fence and one near the top of the fence.
Flexibility is an added feature of electrical fencing. The fencing components can usually be salvaged with some ease if one decides to change the fencing arrangement or design, especially if this is included in the plan at the onset.
The ease of construction is another feature of electrical powered fencing. Most people can construct these fences following some instructions. While bracing is a critical part of the fencing design, it requires almost as much of a structure as conventional fencing. A new bracing assembly is available that is engineered to give a strong, professional-appearing brace or corner. Complete, step-by-step instructions are included to explain how to build these braces.
Ease of construction may be a relative term, however. There are some places that are remote and sufficiently rugged that this may be the only feasible way to construct a fence.
Many new ideas are being implemented into features for electrical fencing as more technology is applied. Some specific features include:
1) The application of voltage and amperage capabilities of energizers to the corresponding requirements of the animal. The early day Americanmade energizers were low amperage (usually less than 1 amp) and produced approximately 2,000 volts or less. Also, the energy was dissipated when an animal touched the fence. Hence, the animals tended to lunge into the fence and tear up the structure. The New Zealand type of energizers produce a pulsating current (approximately 1 per second). The voltage and amperage on the larger units that are commonly used for wildlife are relatively high (up to 100+ amps) with an operating voltage of 4,000 to 6,000 volts. The length of pulse is short enough to give a health safety factor when delivering a tremendous charge.
Cattle, horses, and swine have relatively low tolerances for electrical shock and can be controlled with approximately 2,000 volts. Sheep and goats require 3,000 or more volts. Deer and elk have hollow hair to provide some insulating effect and usually require 4,000 volts or more for dependable control. Coyotes are quite sensitive to electricity, but often require the higher voltage range of 4,000 volts or more to discourage their

desires for a lamb dinner. Not only are these higher voltages required, but it must be delivered with adequate amperage to assure this maximum delivery under all conditions and at all times.
2) Assurance that the energizer is working at top performance at all times has been a problem in the past. Proper and adequate grounding (earthing) was a difficult thing to determine. Also, shorting of the energized wire to an unintentional ground was also a problem. The new PEL Series 5 energizers have done much to reduce these problems. They are equipped with lights that indicate inadequate grounding or shorts on the fence. This self-monitoring allows one to check the energizer to determine if the fence is working properly.
The application of round fiberglass rod posts with holes drilled through the post offer the most trouble-free fence possible. These durable posts do not shatter when being driven and a rock is encountered. Nor do they become brittle over time, heat or extreme cold, but they are self-insulating. Thus the wires will not be knocked out of insulators
216
and cannot be shorted due to touching a post that may ground it.
3) Animal behavioral characteristics are being studied to help in reducing the amount of barrier needed to ·control animals. One wire, at a 1011 height is adequate to control white-tailed deer movements into seeded or otherwise treated areas, for example. No doubt other animals have critical zones that can be capitalized upon.
If the resource manager can determine the cause of why animals cross a fence and may help in the application of the fencing need. Animals usually cross fences to 1) obtain something to eat or drink, or 2) to join other animals.
One must remember that the electrical powered fence is a mental barrier rather than a physical barrier. Some physical barrier must be applied for jumping animals. Thus, the fence must be in constant operating order to be effective. Many animals such as cattle and deer can tell if the fence is working, even without actually touching the fence.

Fencing Methods To Control Big Game Damage to Stored Crops in Wyoming1
John F. Schneidmiller2
Abstract.--Fighting damage to stored crops by big game animals is both costly and time consmning. Fencing ~thods are the most suitable means to prevent big game damage to stored crops. Experimentation in fencing ~thods is ongoing to find the best and most cost effective solution to this problem.
Ever since the beginning of time, when early man figured out how to put a seed in the ground to produce food, he realized that more could be produced than could actually be used. At that time, if he could store these crops, they would be available to him for future use. These stored crops, however, were made available to all sorts of critters. Among these critters are what we now call the big game animals. Mule deer (Odocoileus hernionus), white-tailed deer (Odocoileus virginianus), pronghorn antelope (Antilocapra americana), elk (Cervus canadensis), and moose (Alces alces) are the big game animals which I will be referring to in this presentation.
Private landowners seem willing to take care of most of the problems associated with ranching. However, many of these landowners feel they should not be responsible for depredation by big game animals that are managed and protected by a state agency (Strickland 1976) • Wyoming, as is true with numerous other states, is responsible for these damages caused by big game animals. Monetary compensation to the landowner is for the value of standing or stored crops as required by Wyoming law. Almost all damage in Wyoming occurs on private or leased lands. Big game damage to crops and compensation to landowners are sometimes emotional problems between landowners and the hunting public.
The State of Wyoming is divided into seven game supervisor districts. Within these seven supervisor districts are forty-six game warden districts. In Wyoming, the Game Warden is charged with the responsibility for wildlife damage within his warden district. In each game supervisor district, there is one Damage Control Warden who
1 Paper presented at the Eighth Great Plains Wildlife Damage Control Workshop, in Rapid City, South Dakota, April 28-30, 1987.
2 John F. Schneidmiller is Damage Control Warden, Game Division Supervisory District III, Wyoming Game and Fish Department, Buffalo, Wyoming.
217
is responsible for the storage of equipment and suwlies and sane of the actual damage prevention and investigation, and Department pa~nt recomnendation of landowner damage claims. Each game supervisor district has a budget for purchasing damage prevention materials and equipment. This budget is awroved by the Wyoming Game and Fish Corctni.ssion. Materials and equipnent are stored in each Game Warden District as well as at a central location within the Game SUpervisor District. Materials and equipment are dispersed from these locations to landowners having big game damage problems.
There are many different ~thods of control! ing damage to stored crops. The most effective ~ns of protecting stored crops is our physical presence at the stackyards. The second most effective ~thod of protecting stored crops is various types of barriers, such as fences. We have experimented with many different barriers and each will be explored within this paper.
THE IAW
Under Wyoming law, it is the responsibility of the Game and Fish Department to investigate damage complaints and to recommend to the Oommission fair and awropriate compensation to the landowner. It is at the sole discretion of the Commission whether or not to allow or reject any damage claim or portion thereof. Wyoming Statute 23-1-901 (Wyoming Game and Fish Department 1985) describes the action the landowner and the Department must take when damage has occurred:
"Any landowner, lessee or agent whose property is being damaged by any of the big game animals of this state shall not later than fifteen (15) days after the damage is discovered by the owner of the property or the representative of the owner, report the damage to the nearest game warden, damage control warden, supervisor or corrmission member.

(ThP lcmdownPr must) " .•• pr~-""'Pnt ~ w=•ri fjPil
r]aim for the n;unagPR to thP Wylll"1i n(J r'..rl~ ."'nil Fish Depnrt.rrPnt not JatPr 1-h~n Rix1-y <60) days aftpr the dn~gP or l nst. i tPm of rl.=!rr~ttJP is ciiRC'OVPred. The c· J -"lim sh;•] ] S['(:''C i fy t hP dnl1\3ge and annunt c 1 a ifl'lPCi ••••
ThP rlepartment shall consider the r•l.=Lims hasf'd upon n ne..:rri pt ion of t.hP 1 i VPRtllC'k d-"lmr:tgp(J or ki lJed by a trophy rJamP anirtli'il, the damaged lann, growing cultivr.tf'iJ rrops, st.ored rr·ops r RPPt'i crop"! 1 i mprnvPfl~Pnt s nnd extraordinary damage to grass. r:'l.=~irnc; shall be investigatPrl hy the department .:md rej~ted. or a]lowP.<l within ninety (q0) Clays aftPr suhmi.s~=;jon •••• No awnrd sh.-il .l hf-• a llowf'iJ to any landowner who hr~R not pF"rmittPd hunting on his property during the aut-hnrizi=>(l hunting seasonR •••. "
In genPra 1, the J anrlowner, in .=~ L i.J'TlP 1 y manner, rep:>rts the damctge to the l')t:-partn~Pnt. DPpnrtment pt=>rsonnel 11\ef?'t with the l.'lnrlowner, invest igat.e the daJ'l'lo'lgP, and ookf> recort111Pnd.=~t ions as to the level of rompPnRation, if any. The ronrni ssion then ae!ts up::>n tlriR r~OJTfTlPndat ion anrl level of compPnsation.
msT
Tt is no sf'>C'ret that thP pn:.sent economirtrends of today have sevPrPJy depreRc;f~] the agricultural r.ormltlnity. As a result· .. , landfJWilers -"lre less t..olerant of b:ig gal"!le darnnge anrl ri"'("OI)ni 7,-. t.h~=> rotPnt ial of receiving ~ompensat ion for r-rop dam'lge as making np sOf'!lf:' of their lossPs.
T"'lam'!ge rontrol eostR h'iVP eqna lly increased for the Depart:rrlPnt. WP now fnrni sh l'Tl"th:=•riAls to prPVPnt or nis~ourage fi-"l~ge to storPf~ rrn~ by hig game, and the landowner furnj shes the l -=lhor for the constn1ction of stad<yarnR. ('(.Y>£.lf"rr~tjon between ]-"lndownPrS nnn the De~rt.ment h-"lc; anrl i R irrproving.
Tahle 1.--lq76-1985 Df>erand
C'oRtR are hr0~Pn Clown intn thrpe ')~nerAl •·Ate<J0rieP =
The l.andowner r:•oup:>n (Byment program wr~c; P~t~hl i c;hed hy the Wyomin•J l.f?'Ji~-<11t11r._. to rornp=>nsate the l rlnCJoWnPr for fnrarjp ('f1ngnTfle0 hy rle~=>r and r~nt P l np=- 1 e<J-"l 11 y h"' rvPRf A(l nn deedP«.::t 1-"lm. ThiR in<•f>ntivP prngrFlm wr+R initirlh:>fl tn stimul-"ltP h.=.rvest- nn privrltP J:-H11l wh,::..rp <~rlJn;:uJP wr~-.:~
orrnrring Ann is i'l VrlllJ;::lhle JT\rlnrlgPrrv::.nt trvd. P;=;JynpntR frnll) J q715 t-hrnugh 1 Q7Q W<"rP 1"[);-V~<-" .:.t- $t:'j. ()!)
per r()nrnn. Tn l9RO, -m i n• ·r·P.~Re nf ~~. ()0 n=-·r c~oupon W-"lc; implPJnPntPil hy ]PI)jsl.=~1- iw:·· .-wtin;•. No rompE"nS-"l t jon i s JTli'tdP f,-,,- t hosP rl n i IT~ l ~ hr~rvpsted on stat-e nr fe<lPral V'ln•~ r··oni- r·n 11 ,.:.CJ hy thec;e J -"lnnownprs nor is r·omf.-w=-ns_,t inn m=u~P fnt· hi IJ ga.lllf' -"lni~ls nthPr th;m iieer And -"lnh=>lnnr .... Tdhl•' 1 sh0Ws t hP 1 n-ye-"l r trPml, l q7n-1 qR I), ()f t hr_,. - . nnmhPr of dPPr An(l e~nb=> lnrv:> 1FlnrlownPr rnqp:m~ ,~e(f~, thP perc-Pnt:'lgPs of r•n•trnn..: rf"(]f¥'1T1P(~ hy l rtndownpr~ and thp tot-"ll iln llA r ~m--111nt [~."! id nnt- hy t-he OPpartment (Wv. f;alTlP .=:ln'~ F'j Rh DenArf-nlPnt 1 q76 thr()ngh 1985) . ..._
~8 thP st rPSS o.f h~ rn PC'nnnm i (" t-i Tne'S f i 1f: 1? t"
into the .;.1grir-ultnral C(1Jrmnnity, ran(•hPrR ;:mil farmen;:; nndPrst~ndah1y start l()(1ki ng for addit.j onA l sonrrP~ of ·i Jlr()Jlll?. A 1 though they sPP the game anima 1 as hoth a snu:r~e of foon ~nn, -"lR ·"'~ fringA benefjt of bving with the dninv=d s, they .::\]so view them ns An addf'>d som:<:'P of rf>VPnue. ~~ land()WJ)ers hecome famil i<'~r with the prrl(~Pss of ef"ll'l'lPPnSation for big game nanHgP I they rt l so hPrt'lfl1P
TOC>rP aware thf>se Addf'>d revenues are not-. difficuH to ohtain. A feeling of comp1-"lcPncy c;:.n ~Pt in -"lnd for this re-"lson, a ~t-rjct damn(Je i nvPRh'Jat ]or, pr~esR has been i.mplPmf"'nteCJ hy thP OPp=! rtn'!Pnt. HnwPvPr, in thP ll'laj()rity of rasPs, this 11:-"ngthy ann C'OJT"{I) ir-At.Pd pr()('PRR lS nnt r.omp]Ptffi AS t·hp 1 andnwnPr Flnrl Department p=-rsnnnP l rParh <'In agreeJTY"'nt ()n the Amnnt nf c·ompensat inn to ~ pAid, And thP Cnmmjc;sion -"lgrPPR.
Ant_elope I.andownPr CournnR ReCJPPilffl, PercentagP ()f Coup:ms ReCJPflfllf"d, and Tot·;=;J] Do liar Arrount P.::t id hy T'lP.p;:~ rtment.
% DEER % ANTEIJ)PE 'IYJI'AL # 'T'OTAL DEER mnPONs t:.nUPONS OOUPONS EXPEND.
YFAR ronPON~ REDEF.l'-U'n ANTEIDPE RF.DEEMED REDEEMED m DEP'r. 1976 43, 9q1 40% 39,216 60% 83,107 $415,5~ 1977 38/914 3n% 35,527 55% 74,441 $172,205 197R 14,864 11% 13,719 52% 68,603 $343,015 1979 30{ l!l51 27% 24,717 48% 55,268 $276,~40 1980 30,888 28% 24,80] 43% 51),nR9 $445,1)12 1981 34,247 29% 34,888 51% 69,115 $553,0AO 1982 18,066 25% 42,696 55% 80,762 $64n,096 1983 42,118 25% 54,241 59% 96,159 .<;.770, 072 1984 '37,692 30% 46,747 41% 84,419 $675,512 1985 14,833 29% 39,169 40% 74,002 $592,016
218
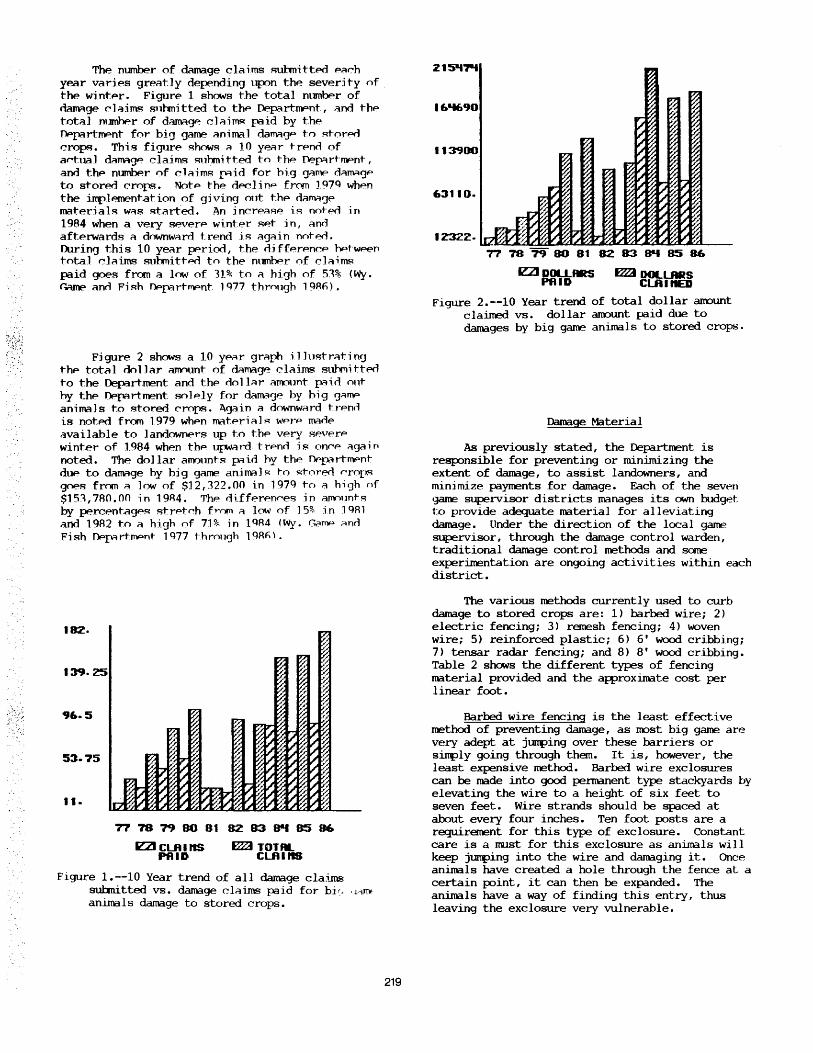
The number of damage claims submitted Pa~h ye.ar varies great] y depending upon the seved ty of the wint.Pr. Figure 1 shows the total number of rlarMge f'laims sul-mjtted to thP Depart.tnPnt, .::ind thf'> t.ota] numl1Pr of darM.ge clnims paid by t.he Df'>parttnPnt for bic:J game r~nima 1 damagP tn storf'>O cro~. This figure shows t=t 10 yer~r trf"nn of af"tual dnmagP claims suhmi tted to thP Dep::trhtlPnt, and thP nlll'lli:>P.r of c 1 aims paid for hi g c:JnnlP dnm:~gF· to storM crops. NotP the d~linP from JQ7Q when the irrplement .at ion of giving out thP da~gematerials w.-=ts start"ed. An increase is not-f'>d in 1984 when a very severP winter set in, ano afterwards a downwnrd trend is agnin not eO. During this 10 year period, the djfferencP hPtw~P total claims st.InnittPCl to the numher of claims paid goes from a low of 31% to a high of 51% (Wy. f'YlJnE> anrl Fish f)pp:=~rtl'TlPnt 1 Q77 through 1 QRfl).
Figure 2 shows a 10 yf."n r graph i 1 J m;t rt=tt i nlJ thP total dollt=tr arrnunt of damage claims suhfllittffi to the Dep3rtment and thf." dollt=tr t=trrnunt {\"'id ont hy the DPpartment. solely for damarJe by hig gt=~I11P animals t.o stored crops. ~gain a downward tn="nr1 is not:Pd from 1979 whPn materia]~ werP mrtneavailable to landowne-rs up to thP very Rf>'.'f"rP
winter of 1.<}84 when thP tlp\'ard tn=-nrl is onf"e nga·in noted. The dollar amounts paid hy the f)ppi"ltTI11Pnt duP to dt=trMge hy big game anima] s to storecl ,...rops goes from a ]ow of $12,322.00 in 197Q to a high nf $151,7AO.OO ·in 19R4. ThP tii.fferen,..es in a.nnunh:~ by percPnt~gps strPt~h fr~ ~ law of 15~ in 1QA1 and 19A2 to a high of 71% _in 1 QA4 IWy. (".,c~TnP .:4nn Fish J)F:>prt rtJnPnt 1 Q77 through 1 qRfl) •
182.
53-75
11-
77 78 79 80 81 82 83 sat 85 86
IZ2I C~l ns m::i TOTAL PAID C~IIIS
Figure 1.--10 Year trend of all damage claims sul:mitted vs. damage claims paid for bi(, q,;Jllf
animals damage to stored crops.
219
1611690
113'900
63110.
12322-~~~~~~~~~~~~~---77 78 79 80 81 82 83 oaf 85 86
IZ2I DOLLARS f2Zd DOLLARS PAID CLAinED
Figure 2.--10 Year trend of total dollar am::>unt claimed vs. dollar anount paid due to damages by big game animals to stored crops.
Danage Material
As previously stated, the Department is responsible for preventing or minimizing the extent of damage, to assist landowners, and minimize payments for damage. Each of the seven ~ supervisor districts manages its own budget to provide adequate material for alleviating damage. Under the direction of the loca 1 game supervisor, through the damage control warden, traditional damage control methods and some experimentation are ongoing activities within each district.
The various methods currently used to curb damage to stored crops are: 1 ) barbed wire; 2) electric fencing; 3) rernesh fencing; 4) woven wire; 5) reinforced plastic; 6) 6' wood cribbing; 7) tensar radar fencing; and 8) 8' wood cribbing. Table 2 shows the different types of fencing material provided and the approximate cost per 1 inear foot.
Barbed wire fencing is the least effective method of preventing damage, as most big game are very adept at jumping over these barriers or sinply going through them. It is, however, the least expensive method. Barbed wire exclosures can be made into gcxxl permanent type stackyards by elevating the wire to a height of six feet to seven feet. Wire strands should be spaced at about every four inches. Ten foot posts are a requirement for this type of exclosure. Constant care is a must for this exclosure as animals will keep jumping into the wire and damaging it. Once animals have created a hole through the fence at a certain point, it can then be expanded. The animals have a way of finding this entry, thus leaving the exclosure very vulnerable.

Electric fencing is about as effective as barbed wire in that most big game animals simply jt~~Ip over the barrier. It is most effective in preventing antelope damage as antelope prefer not to jurrp, but rather attenpt to go through or under fences. Two to four electrically charged strands can be incorporated into the exclosure to keep animals from nosing between the strands and then jumping through, gaining entry to the stored crop inside.
Remesh fencing in the six foot height is very effective with most big game animals as they willnot attempt to jump over this. We have in the past used 5' remesh, however, with deep snow conditions animals will more readily attempt to j1..mp into or over this fence. The added one foot of height seems to be the solution to this problem. Some type of posts I!RlSt be used with this protection. It can be used for permanent or terlp)rary stackyards depending ~n the need. The main drawback for remesh wire is that it is very difficult to handle.
Woven wire used in pennanent stackyards is the method we have found to provide the best
1rot.ection on a long tenn basis, for all types of rops from big game damage. Pennanent stackyards
<:tre often an improvement to the landowners property, a benefit to his operation and effective 1.n preventing stored crop damage. They do, however, require considerable labor by the landowner to build. Thirty-nine inch woven wire may be substituted for 4 7 inch, as the need dictates. The wire is installed in combination with barbed wire. One strand of barbed wire is then placed six inches from the ground, then six inches above this j s the 4 7 inch or 39 inch woven wire, followed at six inch intervals by three to four more strands of barbed wire, to a total of six and a half or seven feet in height. Ten foot posts are required for this exclosure.
Reinforced Plastic is a temporary type of crop protection and is very easy to install. It is sirrply a 10 foot wide sheet of polyurethane plastic, 100 feet long, stretched over the desired crop and anchored down every 3-4 feet for the length of plastic sheeting. However, it is a very expensive material to use.
Wood cribbing may be both a terrplrary and pennanent type of fencing and has been used by the Department for longer than any other type of fencing. It is Constructed with 1"x4"x6' boards for deer fence and 1"x4"x8' lengths for elk fencing. Four strands of 11 1/2 ga. galvanized wire are used to tie the boards together. A fencing machine is required to keep the proper distance between boards and to twist the wire around each board. The fencing can be made in any desired length, however experience has proven that
220
15 foot lengths are the easiest to determine quantity needed, handling of that material, and ease of installation. It should be constructed in advance at a slack period when a crew can be assembled to do the work. A rather large area is also required to store the finished product as they are large and bulky. When installing, this fencing is considered difficult to handle. If cared for properly by the landowner, these pane] s will last several seasons.
Tensar Radar Fencing is a plastic type fence protection. We are experimenting with this material to evaluate its effectiveness and cost for big game damage control. It is both terrp::>rary and pennanent in nature and very easy to install . At the present time, only two of these stackyards are in use in Wyoming. One is 7 feet in height and the other utilizes two 4 foot lengths laced t~ether. Posts are needed with this protection with the plastic fencing being stapled right to the posts. At first, ~ concern was noted as to the extreme low temperatures experienced in Wyaming. However reports received from field personnel have stated that no trouble has been experienced at -25 degrees below zero. It is considered very expensive to inst~ll.
Table 2 shows the different types of fencing and how they c()f'('{lare as to size, cost, weight, ease of handling, SUH?Ort needed, terrporary or permanent type exclosure and the cost per linear Eoot.
CONCLUSION
It is not our intention to dictate t..o each and every landowner what type of ma.terial is to be used by him in the protection of his stored crops. Each situation is different and nrust be handled on =J rase by case basis. However, the quest for finding economical and logical solutions to minimize damage is an ongoing challenge. Cooperation is a nust between landowners and Depart:lrent employees if successful solutions are to be reached.
Damage prevention and compensation for damage by big game is very expensive. These expenses come under three general headings of: 1) damage materials (which are now provided by the Department with very good results. However, due to budgetary constraints, distributing these materials is a slow process), 2) landowner coUfX>n payment program (a valuable management tool for the Department and a good incentive program for the landowner to harvest surplus game animals), and 3) damage claims (claims filed against the Department correspond directly to the severity of winter conditions).

...
Table 2.--1986 Fencing Costa
EX'I'RA ~Y(Jl OJST/ ~It«; SIZE OOfn' WEIGifi' HANDLIOO SUPIUn' PERMANENT LINFAR Fr.
Barbed 1300' $30/ 60 lb./ Hedit.n Posts Permanent $.02/ft. Wire roll roll needed
Electric 660' $36/ 15 lb./ Easy Posts TeflllOrary $.19/ft.* Fence roll roll needed
Remesh 6'x150' $54/ 250 lb./ Difficult Posts Both $.36/ft. roll roll needed
W::Jven 39"x330' $131 200 lb./ Difficult Posts Pennanent $.44/ft. Wire roll roll needed 6 112' high
Reinforced 10' x100' $130/ 30 lb./ Quick & None Tarp:>rary $1.30/ft. Plastic sheet sheet easy
6' hbod 6'x15' $11 w/o labor 250 lb. Difficult Posts may Both $1.47/ft. cribbing $22 w labor be needed w/labor
Tensar Radar 7'x164' $285/ 100 lb./ Easy & quick Posts may Both $1. 74/ft. Fence roll roll be needed
8' hbod 8'x12' $14 w/o labor 250 lb. Difficult Posts may Both $2.33/ft. Cribbing $28 w/labor be needed w/labor
*Includes insulators and charger cost &JURCE: Demaree, John R. 1986. Personal correspondence. Wy. Game and Fish Department. Laramie.
There is 1 ittle that can be done to alter the am:>unt paid out by the Department for landowner coupons. However, ongoing experimentations as to t.he various and best solutions to stop depredatioL to stored crops can and will have a direct effect nn the aroount of actual dollars paid out by the Department on damage claims. It is the intention nf the Wyoming Game and Fish Department to seek out and find solutions to the damage problems created by big game animals through fencing ~thods. With the help and cooperation from private landowners, we will find solutions to the p-oh h-""m.s of damage.
LITERATURE CITED
Anonynnus. 1977. Annual Rep:>rt. Wy.Gameand Fish Dept. Cheyenne. 96w.
1978. Annual Rep:>rt. Wy. Game and Fish Dept. Cheyenne. 102fP.
1979. Annual Report. Wy. Game and Fish Dept. Cheyenne. 95R?·
1980. Annual Rep:>rt. Wy. Game and Fish Dept. Cheyenne. 104R?·
1981. Armual Rep:>rt. Wy. Game and Fish Dept. Cheyenne. 133R?o
1982. Annual Rep:>rt. Wy. Game and Fish Dept. Cheyenne. 66w.
1983. Annual Rep:>rt. Wy. Game and Fish Dept. Cheyenne. 74w.
1984. Annual Rep:>rt. Wy. Game and Fish Dept. Cheyenne. 82fP.
1985. Annual Report. Wy. Game and F'ish Dept. Cheyenne. 85w.
1986. Annual Rep:>rt. Wy. Game and Fish Dept. Cheyenne. 69F{J.
221
An( "1ynnus. 1976. Statistics. Deer and Antelo~· Coupons Redeemed by Landowners. Wy. Game nnd Fish Dept. Cheyenne. 69{:.p.
1977. Statistics. Deer and Antelofe Coupons Redeemed by Landowners. Wy. Game and Fish Dept. Cheyenne. 71R?•
1978. Statistics. Deer and Antelope Coupons Redeemed by Landowners. Wy. Gam:> and Fish Dept. Cheyenne. 70R?.
1979. Statistics. Deer and Antelope Coup:ms Redeemed by Landowners. Wy. Game and Fish Dept. Cheyenne. 68R?•
1980. Statistics. Deer and Antelope Coupons Redeemed by Landowners. Wy. Game anti Fish Dept. Cheyenne. 82fP.
____ • 1981. statistics. Deer and Antelor~ Coupons Redeemed by Landowners. Wy. Game ic~n• 1
Fish Dept. Cheyenne. 87R?• 1982. Statistics. Deer and Antelope
Coupons Redeemed by Landowners. Wy. ('xune and Fish Dept. Cheyenne. 96R?.
1983. Statistics. Deer and Antelope Coupons Redeemed by Landowners. Wy. Game and Fish Dept. Cheyenne. 98R?•
1984. Statistics. Deer and Antelope Coupons Redeemed by Landowners. Wy. Game and Fish Dept. Cheyenne. 98R?•
1985. Statistics. Deer and Antelope Coupons Redeemed by Landowners. Wy. Game dnd Fish Dept. Cheyenne. 95pp.
strickland, Dale. 1976. A Literature Review of Deer Damage and Control Measures. Wildlife Technical Rep:>rt No. 4, Wy. Game and Fish Dept. 19fP.
Wy. Game and Fish Dept. 1985. Wyoming Game and Fish Laws (Revised Sept. 1985). Cheyenne. 154R?·

Kansas Wildlife Damage Reporting System1
rlart L. Hettenbach2
Abstract.--In the past several years Kansas State University's Extension Wildlife Damage Control Program and the Kansas Fish and Game agency have developed a cooperative program for reporting wildlife damage complaints. The paper will present some data collected, describe the usefulness of this data and provide some data interpretation.
INTRODUCTION
The purpose of this paper is to describe the important information that can be obtained from a simple cooperative reporting system conducted between state agencies.
In the past several years Kansas State University's Extension Wildlife Damage Control program and the Kansas Fish and Game agency have developed such a program. The standard reporting form first designed has been further improved over the past few years (fig. 1). The standardized reporting form provides us with
information such as the complainant's name, county, description of the problem, economic loss, recommended actions, and whether the problem was solved. This form is then filled out and returned to our office monthly by Wildlife Conservation Officers and County Extension Agents. Wildlife damage control volunteers receive a newsletter six times a year and report on ~ yearly basis to our office. There are approximately 200 wildlife damage control volunteers in Kansas. There are 105 County Agricultural Agents, and 60 Fish and Game personnel who participate in sending wildlife damage control reports.
COUNTY ______________ _ WILDLIFE DAMAGE COHPLAINT RECORD Month ___ _ 19
DESCRIHE PROBLEM: Species and Complainants numhers of wildlife invohed, Recommended Was Problem
Name County crop or i tern damaged, degree of fkEconomic Loss Actions Solved? damage (estimated) , contributing factors, etc. 1 2 3
--------------· =------- F••=========================~======= F============== ================ f:====z-===a:=-•~a=
Return to: F. Robert Henderson, Extension Wildlife Damage Control, Room 113, Umberger Hall, Kansas State University, Manhattan, KS 66506
*Economic Loss Rate: (Check one) 1. Nuisance; 2. $1-300; 3. $300 or more.
Cooperative Extenalon Service, Kana .. State University, Manhattan All otiYuliotul proer•m• an4 Mlterialt auilalale •ithout llitcriMiutiH eft rhe ltasit el race, color, R•tional origin, lee, or handica,.
Figure !.--Standardized reporting form used.
1Paper presented at the Eighth Great Plains Wildlife Damage Control Workshop. South Dakota School of Mines, Rapid City, April 28-30, 1987.
2Bart L. Hettenbach is a Senior in Wildlife Biology, Kansas State University, Manhattan, Kansas.
222

METHODS
These data are based on reports received and kept by Kansas State University in the Extension Wildlife Damage Control office. Once each month, the agency, county, month, species, and economic loss are entered on a Zenith computer into a DBase II file for storage on a hard disk and back-up floppy disk. After this information is entered into the computer, it can be utilized to write informative reports. Reporting individuals from the two agencies report each month even if they receive no requests regarding wildlife damage control.
Figure 2.--This pie chart indicates the percent of damage caused by the top 10 individual species in Kansas for 1986.
400
300
200
Number
100
0 Bird
$17,100
Rodent Predator
$61,050 $34,950
RESULTS
Figure 2 shows the 1986 statewide damage for Kansas and indicates which species caused the most damage. As figure 3 shows, rodents and predators caused the greatest economic loss. In 1986, of the 1,959 reports, 63% were nuisance, 31% were between $1 and $300 damage, and 6% were estimated at over $300 damage.
The data collected also show where damage is occurring in the state. Kansas is divided into five administrative Extension areas, as shown in figure 4.
KSU EXTENSION ADMINISTRATIVE UNITS
Northwest Area Northeast Area
Southwest Area South Central Area Southeast Area
Figure 4.--Kansas State University Extension administrative units.
Other
$23,700
Nuisance
1-300 dollars
300 dollars or more
Figure ).--Estimated dollars of damage which occurred in 1986.
223

':
In figure 5, beaver damage complaints have been broken down into the five KSU Extension administrative units.
Northwest
52%
Northeast
Southwest
Figure 5.--Beaver damage for 1986, divided into KSU Extension administrative units.
A few problems do exist with our reporting system. All cooperators do not report on time, and some neglect to report at all. The ones that do report regularly sometimes do not include all the information requested. The dollar estimates
224
may be low, as each respondent estimates these subjectively. The most common problem found with these reports is the lack of follow-up to determine if t~e problem was solved. Often Agency personnel assume the problem was solved since the complainant did not call back. We have checked a randomly chosen sample, and indications are that over 80% of the problems are reduced, if not solved.
SUMMARY
. The information obtained from these reporting forms indicates where in the state help is needed in educating people on the best methods of control. This kind of data also shows: (1) times of the year problems are most likely to occur; (2) changes from year to year; and (3) for research, the need for improving old control methods or finding new ones. These kinds of data are helpful to explain the extent of wildlife damage in Kansas and to help reduce wildlife conflicts with people. We realize that not all losses or complaints with wildlife are reported. However, this standardized method of reporting does indicate trends and gives a good idea as to the kinds of wildlife problems and our ability to solve or reduce these problems in Kansas.

Results of a Bird Damage Survey of Kansas Feedlots1
Charles Lee 2
Abstract.--A mail survey was conducted in the Fall of 1986 of 196 licensed Kansas feedlots to get a better idea of the extent as well as kinds of wildlife damage they experience. The results of this survey are being used in designing a research project to help feedlot operators cope with bird damage.
INTRODUCTION
Kansas currently ranks third behind Texas and Nebraska with annual fed cattle marketing exceeding 4 million cattle (Laudert 1987).
The Kansas feedlot industry is large, diverse and rapidly growing. Unfortunately, feedlots with open bunks with continuously available feed also provide starlings (Sturnus vulgaris) and several species of blackbirds (Icteridae) with an abundance of winter food. Feedlot operators report large populations of starlings from October through February. Starlings consume livestock rations, contaminate feed and water and may spread disease.
There is a need for effective and acceptable methods for dealing with these large flocks of birds so that feedlots can stay competitive with areas that do not experience bird problems.
METHODS
The Kansas Cooperative Extension Service sent a questionnaire to 196 licensed feedlots in Kansas in the Fall of 1986. Feedlots surveyed included cattle, sheep and hog operations with a one-time capacity of at least 1000 head. Feedlot operators were asked 10 questions about bird damage problems they experienced. Most questions required single, short answers, but too many allowed longer, more involved responses. This survey design has too many variables to allow statistical
1Paper presented at the Eighth Great Plains Wildlife Damage Control Workshop. South Dakota School of Mines, Rapid City, April 28-30, 1987.
2charles Lee is Extension Assistant, Cooperative Extension Service, Kansas State University, Manhattan, Kansas.
225
analysis. The results of this survey provide descriptions of current bird problems experienced by Kansas feedlots. Eighty questionnaires were returned.
RESULTS
Locations Involved
Feedlots ranging in size from 2000 to 100,000 head marketed 96.4% of the 4.2 million cattle finished in Kansas in 1986 (Laudert 1987). The 80 feedlots that responded to this survey were primarily in the southwestern and southcentral sections of Kansas (fig. 1). The capacity of the feedlots responding to this survey ranged in size from 1,000 to 100,000 head (fig. 2). Bird damage is a problem for large and small feedlots. Problems with birds were reported at 83.5% of the feedlots that responded to this survey.
0 No Damage - c S 1000 • s 1000. $5000 * > $ 5000
Figure 1.--Locations of feedlots responding to 1986 survey and amount of damage reported.
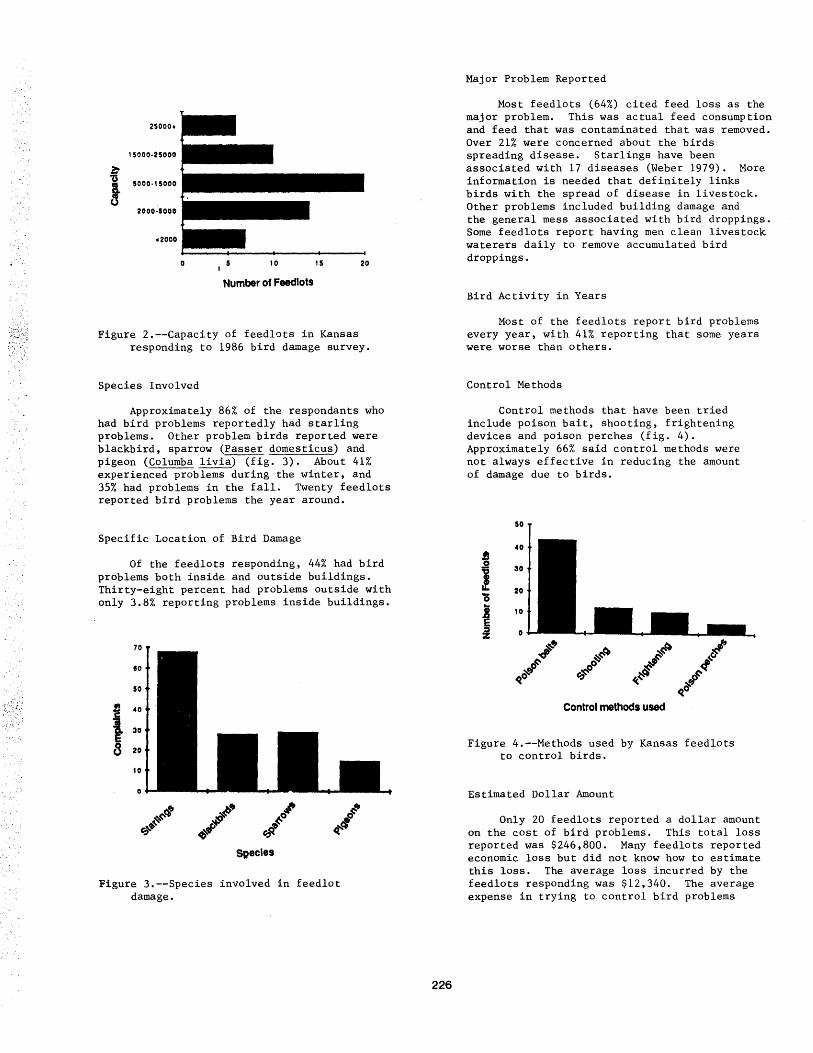
25000•
, 5000·25000
5000·15000
2000·1000
c2000
10 15 20
Number of Feedlots
Figure 2.--Capacity of feedlots in Kansas responding to 1986 bird damage survey.
Species Involved
Approximately 86% of the respondants who had bird problems reportedly had starling problems. Other problem birds reported were blackbird, sparrow (Passer domesticus) and pigeon (Columba livia) (fig. 3). About 41% experienced problems during the winter, and 35% had problems in the fall. Twenty feedlots reported bird problems the year around.
Specific Location of Bird Damage
Of the feedlots responding, 44% had bird problems both inside and outside buildings. Thirty-eight percent had problems outside with only 3.8% reporting problems inside buildings.
70
to
50
!l •o
I 30
8 20
10
~ ~>"' OJ' r:-"' ~~ ~ #~ tt-l ~'lj ~#'
Species
Figure 3.--Species involved in feedlot damage.
226
Major Problem Reported
Most feedlots (64%) cited feed loss as the major problem. This was actual feed consumption and feed that was contaminated that was removed. Over 21% were concerned about the birds spreading disease. Starlings have been associated with 17 diseases (Weber 1979). More information is needed that definitely links birds with the spread of disease in livestock. Other problems included building damage and the general mess associated with bird droppings. Some feedlots report having men clean livestock waterers daily to remove accumulated bird droppings.
Bird Activity in Years
Most of the feedlots report bird problems every year, with 41% reporting that some years were worse than others.
Control Methods
Control methods that have been tried include poison bait, shooting, frightening devices and poison perches (fig. 4). Approximately 66% said control methods were not always effective in reducing the amount of damage due to birds.
50
•o ! .!l 30
! 20 0 .. f 10
:i 0 .,-!J ~~ rf~ I'
r:- ,f itrP Do ~ e,~ '<~($ ~~ ~ Cf' q
Control methods used
Figure 4.--Methods used by Kansas feedlots to control birds.
Estimated Dollar Amount
Only 20 feedlots reported a dollar amount on the cost of bird problems. This total loss reported was $246,800. Many feedlots reported economic loss but did not know how to estimate this loss. The average loss incurred by the feedlots responding was $12,340. The average expense in trying to control bird problems
of those feedlots answering this question was $1,S73. More feedlots knew the expense of control efforts than the economic loss they incurred.
Other Wildlife Problems
Eighty-seven percent of the feedlots reported other kinds of wild animal problems. In order of importance, they were rats and mice, raccoons, coyotes, badgers and skunks.
As the feedlot industry becomes more stressed, operators are looking for ways to maximize productivity. A reliable and accurate means of measuring damage, with training in how to apply the methods and justify current control technologies is needed.
We are not going to say to anyone that we are going to solve the bird problems that feedlot operators are experiencing. We should be able to quantify damage loss and determine why current technology is not effective in reducing losses due to birds 66% of the time.
We intend to conduct research and Extension demonstrations during 1987 and 1988 on one promising idea to reduce or even prevent the loss due to birds. We will test the use of live Harris hawks (Parabuteo unicinctus) to scare off birds. The Air Force uses falcons to kill and scare birds away from airports in Britain and Canada (Blokpoel 1976). This method would be acceptable to environmentalists and may provide employment for some of our citizens.
Another idea that will be researched is the control of starlings by electrocution. This idea has been suggested in the past (Jacob 1965). The behavior of starlings liking to land on wires would seem to make this idea feasible.
We also plan to continue the evaluation of dimethyl anthranilate as a nontoxic starling repellant that can be mixed in the cattle ration (Mason 1983).
Financial support for these studies is being provided by the Kansas Livestock Association Cattle Feeders Council and individual feedlot operators. Research and Extension work will be guided by Kansas State University Department of Animal Sciences and Industry in the College of Agriculture.
227
SUMMARY
The response from the feedlot industry in Kansas indicates a need for effective control methods for bird problems around feedlots. The wildlife damage control Extension staff will evaluate current control methods and test some new ideas to prevent or reduce the economic loss associated with birds. The resulting recommendations will be written in the form of a manual for feedlot operators relating to animal damage control at feedlots. The project will be completed in the fall of 1988.
I would appreciate any suggestions or comments on this proposed research.
LITERATURE CITED
Blokpoel, H. 1976. Bird hazards to aircraft. Clarke, Irwin and Company, Limited, and Canadian Wildlife Service.
Jacob, F. c. and A. Zajane. 1965. Starling electrocution. Trans. Am. Soc. Agric. Eng. 8(4):581.
Laudert, S. B. 1987. Kansas feedlot industry facts and figures. Cattleman's Day. Cooperative Extension Service, Kansas State University, Manhattan, Kansas.
Mason, J. R., A. H. Arzt and R. F. Reidinger, Jr. 1983. Evaluation of dimethyl anthranilate as a non-toxic starling repellant for feedlot settings. Proc. Eastern Wildlife Damage Control Conf. 1:259-263.
Weber, W. J. 1979. Health hazards from pigeons, starlings 9nd English sparrows. Thomson Publications, Fresno, California.

Control Methods for Objectional Roosts of Purple Martins1
Albert E. Bivings. IV2
Abstract.--Multi-thousand bird roosts of Purple Martins (Progne subis) occasionally form in the South during the early summer (June-July). Nightly depositions of fecal material create considerable nuisance and potential health problems. Since they are federally protected migratory birds and have legions of bird-lovers trying to increase their populations, lethal controls are unlikely to be popular or even permitted. Control techniques including plastic netting (partial or complete exclusion), active scaring and modification of building schedules are discussed and evaluated. Plastic netting was observed to be the most successful long-term solution.
INTRODUCTION
Purple Martins are an extremely popular member of the swallow family. They are a common summer breeding bird throughout the South arriving often in early February (Farrand 1983). Nesting activity runs from March through July. After nesting, they begin to congregate in roosts as early as late May through as late as mid-August. Large roosts of up to 6,000-10,000 birds have been reported in June and July (James and Neal 1986). After this peak, they begin to migrate south toward their wintering grounds in Brazil (Farrand 1983).
These large aggregations of birds are often attracted to lighted structures with a quantity of sheltered small diameter rods for perching. The lights seem to allow them to feed both on a concentration of insects and for a few minutes longer than at other sites before they go to roost. The problem comes from the nightly accumulation of fecal material under these roosts which causes nuisance, morale, safety, and potential health problems (Weber 1975). Whether or not lethal control might be appropriate is a moot question. Due to the vast number of bird-lovers who admire Purple Martins and their reputation (regardless of how appropriate) as effective mosquito/insect control agents, obtaining permits for any lethal control is highly unlikely in the current political environment. Thus, the only alternatives are to scare them or exclude them from the buildings.
lpaper presented at the Eighth Great Plains Wildlife Damage Control Workshop. [U.S. Forest Service, Rocky Mountain Forest and Range Exp. Stn., Rapid City, South Dakota, April 28-30, 1987].
2Albert E. Bivings is Wildlife Biologist for U.S.D.A.-A.P.H.I.S., Animal Damage Control, Stuttgart, AR.
228
The purpose of this paper is to describe and discuss both effective and ineffective control methods for Purple Martins. Thanks are due to Messrs. M. Hoy and T. Booth for their helpful critique of this manuscript and Mrs. G. Hiryak for her assistance in the preparation.
INEFFECTIVE CONTROL MEASURES
A plethora of advertising is currently available for predator decoys, ultrasonics, and flashing lights. While a few have experienced some success, these devices generally are ineffective. Birds have essentially the same hearing range as man and ultrasonics have yet to be demonstrated to be effective on birds. Predator models (snakes, owls, etc.) that are static usually only work for a day or two if at all. Some animated models may be somewhat more effective. The same applies to loud music, rotating beacons, shiny objects, etc. Will (1985) provides a more detailed discussion of these items.
EFFECTIVE CONTROL MEASURES
Not all control measures can be expected to work or be feasible for every situation. Control methods can basically be categorized as schedule changes, exclosures, or scaring.
Schedule Changes
Some benefit can often be obtained from modification of work/building schedules. One of the simplest, yet least often tried techniques is to turn off the interior/exterior lights for the first hour after dark. While this may not move an established roost, it may well keep the birds from returning in subsequent years if begun before the birds begin to roost at a given location. Closing

all possible entrance doors and windows will also help make the location less attractive to new arrivals.
Scaring
Purple Martins respond well to traditional bird scaring devices. The combination of pyrotechnics, propane cannons and bio-acoustics using red-wing blackbird or gull tapes described by Bivings (1985) works well on most Purple Martins. Application of water from a high pressure hose to those fr~~ that are persistent combines to make a very efrective scaring program. However, scaring programs do nothing to resolve the long-term problem which is the basic attractiveness of the site to hirds.
Exclusion
There are several general methods for excluding birds from an area. Those most readily available are chemical repellents, sharp pointed projections and netting.
Chemical Repellents
These devices usually come in a paste, gel, or liquid formulation and produce a tacky surface or a "hotfoot" effect. Surfaces must be cleaned prior to application of the material. The principal problem is that they lose their effectiveness when contaminated by dust, feathers, or fecal material so they are usually good for only a few months. Also, some products may melt and run off the surfaces under hot weather conditions or may be washed off if exposed to wet weather. Application of these materials is very labor intensive and all or almost all potential roosting surfaces must be covered to be completely effective. Given these handicaps, chemical repellents do offer consistent control when properly applied.
Sharp Projections
These are strips of metal with sharp pointed wire which look like a porcupine. These prevent birds from lighting on ledges covered with this material. Like chemical repellents, this material requires a great deal of labor to install. The major limitation is the great cost of the material and installation. It is simply not economically feasible for indoor sites where large areas must be protected. In areas exposed to weather, this method may be useful to protect small areas such as ledges over a major.building entrance.
Netting
Probably the best long-term results have been obtained from the use of netting to exclude birds from roosting areas. Although netting is available made from cotton, nylon or monofilament materials, plastic netting is currently the most useful for this purpose. Several different strategies are available but most interfere with daily activities. The strategy which interferes with daily operation least is to attach netting under the
229
interior supports similar to the methods described by Pratt (1983) so that the upper rafters are not accessible. If all entry holes can be sealed, this offers excellent results. Since the materials are not exposed to the weather, currently available netting will offer a minimum of 3-5 years of service without replacement. Principal limitations are the cost of installation and modifications required if the building design presents difficulties. Another strategy is to hang netting down like a curtain to close off access to the roosting areas. While this is very effective in a building with little traffic in and out, it is a considerable problem for an aircraft hangar or an open work shed or walkway which all have considerable traffic in and out. Some success has been obtained by hanging netting in the top third of the opening and attaching light weights to the bottom to reduce blowing. Since roosting birds normally only use the very top of an opening, this is a barrier to the birds, but the people can go in and out through the bottom. Another variation is 2-inch vertical plastic strips from top to bottom. These are commonly used as thermal barriers into cold storage areas, but have been effective on birds.
CONCLUSION
Architects design structures based on aesthetics or functional efficiency. Birds subsequently find unplanned uses for these structures and we must come in after the fact and try to resolve the existing problem. Plastic netting seems to offer the best and longest lasting results. As the quality of these materials improve, I expect that this option will become even more attractive. Managers will have to choose between appropriate options to decide the magnitude of the problems caused by the birds as compared to the cost and magnitude of the problems caused by the control measures. Our job must be to provide these options along with .our assessment to assist the managers with their decision.
LITERATURE CITED
Bivings, Albert E., IV. 1985. Birds in hangarsA messy problem. Proceedings.Eastern Animal Damage Control Conference. 2:112-114.
Farrand, John, Jr., editor. 1983. The Audubon Society master guide to birding. Volume 2. 398 p. Alfred A Knopf Co., New York, NY.
James, Douglas A., and Joseph C. Neal. 1986. Arkansas birds - Their distribution and abundance. 402 p. The University of Arkansas Press, Fayetteville, AR.
Pratt, George K. 1983. An evaluation of two techniques for installing plastic netting in aircraft hangars. U.S. Air Force Technical Report DEV-TR-83-01. 33 p. Tyndall Air Force Base, FL.
Weber, Walter J. 1979. Health hazards from pigeons, Starlings and English Sparrows. 138 p. Thompson Publications, Fresno, CA.
Will, Timothy J. 1985. Air Force problems with birds in hangars. Proceedings Eastern Animal Damage Control Conference. 2:104-111.

EIGHTH GREAT PLAINS WILDLIFE DAMAGE CONTROL WORKSHOP
Workshop Committee
Daniel Uresk, Program Chairman Research Biologist USDA Forest Service Rapid City, South Dakota 57701
Greg Schenbeck, Co-chairman Wildlife Biologist USDA Forest Service Chadron, Nebraska 69337
Verne Brakke Director of Division of Regulatory Services South Dakota Dept. of Agriculture Pierre, South Dakota 57501
Dennis Clarke Supervisor of Weed & Pest Activity South Dakota Dept. of Agriculture Pierre, South Dakota 57501
Rew Hanson State Director USDA APHIS ADC Pierre, South Dakota 57501
Shary Kennedy Business Management Assistant USDA Forest Service Rapid City, South Dakota 57701
Steve Kerpan Wildlife Biologist USDA Forest Service Wall, South Dakota 57790
Richard Klukas Research Biologist National Park Service Windcave National Park Hot Springs, South Dakota 57747
Alvin Miller Animal Damage Control Supervisor SD Dept. of Game, Fish & Parks Pierre, South.Dakota 57501
Dave Nelson Assistant Animal Damage Control Supervisor SD Dept. of Game, Fish & Parks Pierre, South Dakota 57501
fl U.S. GOVERNMENT PRINTING OFFICE:1988-574-380/85071
230
Session Chairpersons
Hugh Black Wildlife Program Leader USDA Forest Service Wildlife & Fisheries Staff Washington, DC 20250
James E. Miller Wildlife & Fisheries Program Leader USDA Extension Service Washington, DC 20250
Ardell J. Bjugstad Project Leader, USDA Forest Service Rapid City, South Dakota 57701
Kieth Severson Project Leader USDA Forest Service Tempe, Arizona 85287
Tom Nicholls Asst. Regional Director USDA APHIS ADC Denver, Colorado 80225
Kenneth Higgins Assistant Unit Leader SD Cooperative Fish & Wildlife Research Unit Brookings, South Dakota 57007
F. Robert Henderson Extension State Leader Kansas State University Manhattan, Kansas 66506
Rew Hanson State Director USDA APHIS ADC Pierre, South Dakota 57501
\
Greg Schenbeck Wildlife Biologist USDA Forest Service Chadron, Nebraska 69337
Jim Salyer Senior Biologist SD Department of Game, Fish and Parks Pierre, South Dakota 57501

Poster Session
A Prairie Dog Control Program on the Fort Berthold Indian Reservation
Tom Hilken USDI Bureau of Indian Affairs New Town, North Dakota
Evaluation of Dimethyl Anthranilate as a Bird Repellent
John L. Cummings, J. Russell Mason, and Melvyn V. Garrison USDA, APHIS, ADC Denver Wildlife Research Center Denver, Colorado
F. Robert Henderson Extension State LeRder Kansas State University Manhattan, Kansas
Robert Timm Nebraska Cooperative Extension Service University of Nebraska Lincoln, Nebraska
Prairie Dog Bait Dispensers Joe Ebert 104 E. I A I Valentine, NE 69201
Elston Equipment Co. 706 N. Weber Sioux Falls, SD 57102
Hancock Trap Co. Buffalo Gap, SD 57722
Mohr's Fencing Merle Mohr P.O. Box 1295 Aberdeen SD 57401
National Animal Damage Control Association William Fitzwater 3919 Alta Monte, NE Albuquerque, NM 87110
Exhibitors
231
Reed-Joseph International Co. P.O. Box 894 Greenville, MS 38701
South Dakota Dept. of Game, Fish & Parks Animal Damage Control Steve Thompson - Rattlesnakes & Trapping Murdo, SD 57559
Twin Mountain Supply Co., Inc. P.O. Box 2240 San Angelo, TX 76902
Tru Catch Traps, Inc. P.O. Box 816 Belle Fourche, SD 57717
Wildlife Control-Margo Supplies Ltd. Site 8, Box 2, RR #6 Calgary, Alberta T2M 4L5

Rocky Mountains
Southwest
Great Plains
U.S. Department of Agriculture Forest Service
Rocky Mountain Forest and Range Experiment Station
The Rocky Mountain Station is one of eight regional experiment stations, plus the Forest Products Laboratory and the Washington Office Staff, that make up the Forest Service research organization.
RESEARCH FOCUS
Research programs at the Rocky Mountain Station are coordinated with area universities and with other institutions. Many studies are conducted on a cooperative basis to accelerate solutions to problems involving range, water, wildlife and fish habitat, human and community development, timber, recreation, protection, and multiresource evaluation.
RESEARCH LOCATIONS
Research Work Units of the Rocky Mountain Station are operated in cooperation with universities in the following cities:
Albuquerque, New Mexico Flagstaff, Arizona Fort Collins, Colorado • Laramie, Wyoming Lincoln, Nebraska Rapid City, South Dakota Tempe, Arizona
• Station Headquarters: 240 W. Prospect St., Fort Collins, CO 80526