eighth annual market monitoring report - irg rail
TRANSCRIPT
Eighth AnnualMarket Monitoring Report
March 2020
2 // 8th IRG-Rail Market Monitoring report
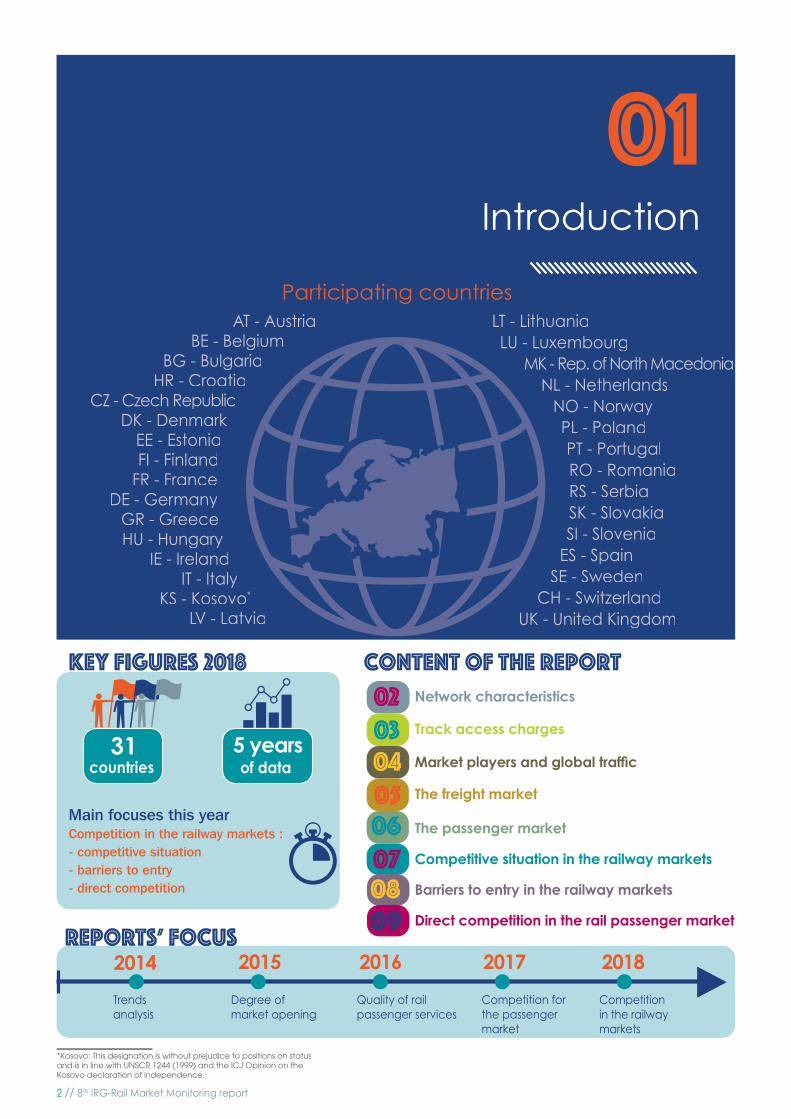
AT - AustriaBE - Belgium
BG - BulgariaHR - Croatia
CZ - Czech RepublicDK - Denmark
EE - EstoniaFI - Finland
FR - FranceDE - Germany
GR - GreeceHU - Hungary
IE - IrelandIT - Italy
KS - Kosovo*
LV - Latvia
*Kosovo: This designation is without prejudice to positions on status and is in line with UNSCR 1244 (1999) and the ICJ Opinion on the Kosovo declaration of independence.
01Introduction
02 Network characteristics
03 Track access charges
04 Market players and global traffi c
05 The freight market
06 The passenger market
07 Competitive situation in the railway markets
LT - LithuaniaLU - Luxembourg
MK - Rep. of North MacedoniaNL - Netherlands
NO - NorwayPL - PolandPT - PortugalRO - RomaniaRS - SerbiaSK - SlovakiaSI - Slovenia
ES - SpainSE - Sweden
CH - SwitzerlandUK - United Kingdom
Participating countries
0809
Barriers to entry in the railway markets
Direct competition in the rail passenger marketreports’ focusreports’ focus
Trends analysis
2014
Degree of market opening
2015
▼
2016
Quality of rail passenger services
2017 2018
Competition for the passenger market
Competition in the railway markets
KEY FIGURES 2018
Main focuses this yearCompetition in the railway markets :- competitive situation- barriers to entry- direct competition
5 yearsof data
31countries
content of the report
8th IRG-Rail Market Monitoring report // 3
IRG-Rail – A network of cooperationThe Independent Regulators Group-Rail (IRG-Rail) was established by 15 European rail regulatory bodies in June 2011. From the beginning, the objective of the group has been to establish a network of cooperation between member regulatory organizations in the railway sector. The group has expanded over the years and today includes members from 31 countries.
IRG-Rail members aim to consistently deal with regulatory challenges and rail developments across Europe. IRG-Rail acts as a platform for cooperation, sharing best practice and promoting a consistent application of the European regulatory framework. As put forward in the Group’s statutory document1, “the overall aim of IRG-Rail is to facilitate the creation of a single, competitive, effi cient and sustainable railway market in Europe”.
01 // Introduction
what we doArticle 56 (paragraph 2) of Directive 2012/34/EU states that regulatory bodies have a formal duty to monitor the si-tuation in the railway market. Market monitoring is therefore an essential task for the national regulatory bodies. It is also a vital instrument for enhancing market transparency, setting direction for the activities of regulatory bodies and encouraging market participants to develop and improve their activities.
1 https://www.irg-rail.eu/irg/about-irg-rail/general-information/1,About-the-IRG-Rail.html2 The guidelines can be found on IRG-Rail website.3 The working document can be found here [THE LINK WILL BE ADDED].4 The data can be found here [THE LINK WILL BE ADDED].5 The historical data for previous years may differ from previous report since historical data for Ireland and Serbia, when they are available, have been added.6 The perimeter of each fi gure is specifi ed in a footnote. If this is not specifi ed, the full sample is considered.
It is the responsibility of each regulatory body to gather, quality-check and submit data according to the guidelines agreed upon by the Working Group. The Working Group has developed a common template in order to ease the effort for the regulatory bodies and to ensure the comparability of the data. Data can originate from market surveys carried out by the regulatory bodies and/or national statistics as well as additional trustworthy sources.
With Ireland and Serbia participating in the data collection, 31 countries are now contributing to this Eighth Market Monitoring Report.5 However, most countries were not able to provide a full set of data. In order to ensure reliable and consistent information, this report only presents indicators for which enough data was made available. Consequently, some analyses are performed using data from a selec-tion of the participating countries. In each section of the report, key fi gures and analyses presented use a consistent sample of countries.6 Therefore, some sections may not cover all 31 countries. However, detailed information and specifi c data per country are provided in the Working Document.
The IRG-Rail Market Monitoring Working group was set up as a platform for cooperation and exchange of best practices in terms of collection and analysis of data. The group has agreed on a set of guide-lines2 for gathering railway related data. Based on the results of a yearly collection, an annual Market Monitoring Report is elaborated by the Working Group.
This is the IRG-Rail’s Eighth Market Monitoring Report and it refers to calendar year 2018, unless otherwise stated.
General aim of IRG-Rail Market Monitoring Working Group
Methodology
The Market Monitoring Report provides an annual overview of market developments and the economic conditions in the railway sector with respect to IRG-Rail member countries. The report also enables comparison over time regarding the development and competitiveness of the railway market.
The report consists of two parts. The Main Report presents results at the overall European level. The Working Document includes country specifi c data and more detailed observations among the monitored countries3. In addition, data from the graphics are available on the IRG-Rail website.4
Each Market Monitoring Report focuses on a or a number of subjects. The 2018 report concentrates on three topics: i) the competitive situation in the rail passenger and freight markets, ii) barriers to entry in the rail passenger and freight markets and iii) direct competition in the passenger market.
Content of the report
4 // 8th IRG-Rail Market Monitoring report
Network characteristics of the railway market
02
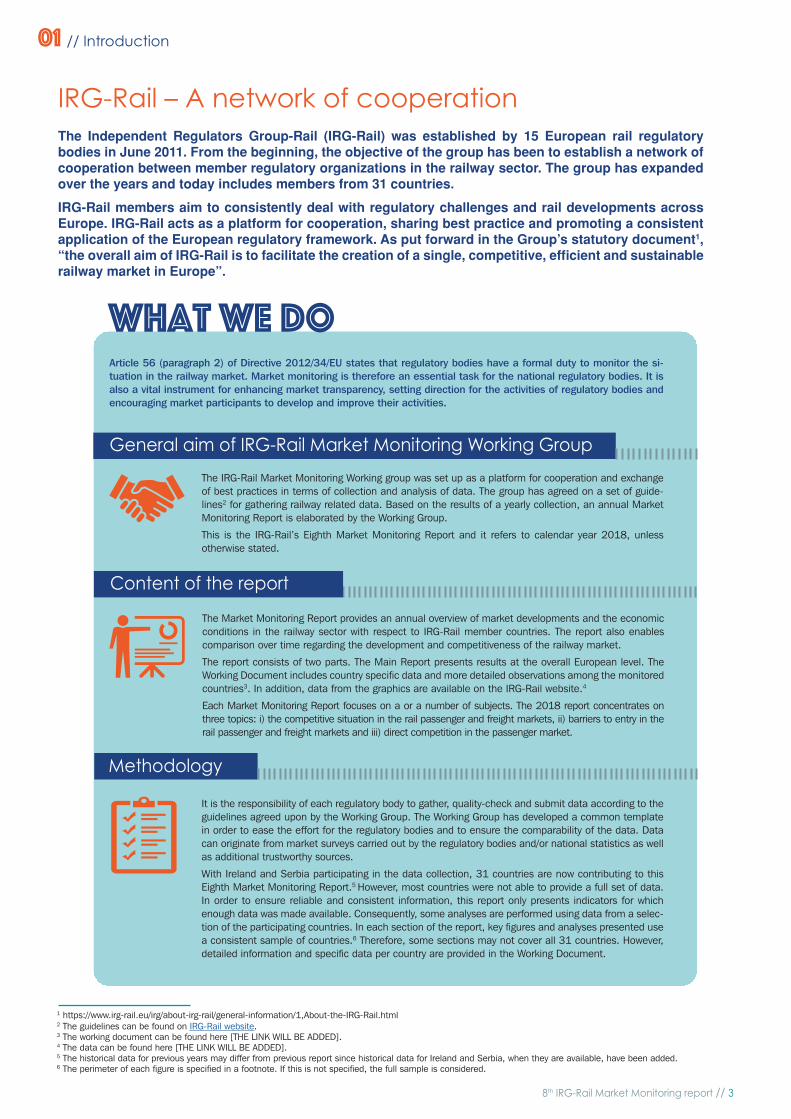
IN 2018
54trains per day per route km
Network usage intensity
81%for passenger
services
19%for freightservices
234 037 kmtotal route length
Network length
4.79 kmof lines per 100 km2
country area
4.38 kmof lines per 10,000
inhabitants
55%share of
electrifi ed route
The sample used to calculate these fi gures is specifi ed in the following pages.
3.5%Share of
high-speedroute
8th IRG-Rail Market Monitoring report // 5
European rail network
Figure 2 – Network density with regard to country area and population in 2018
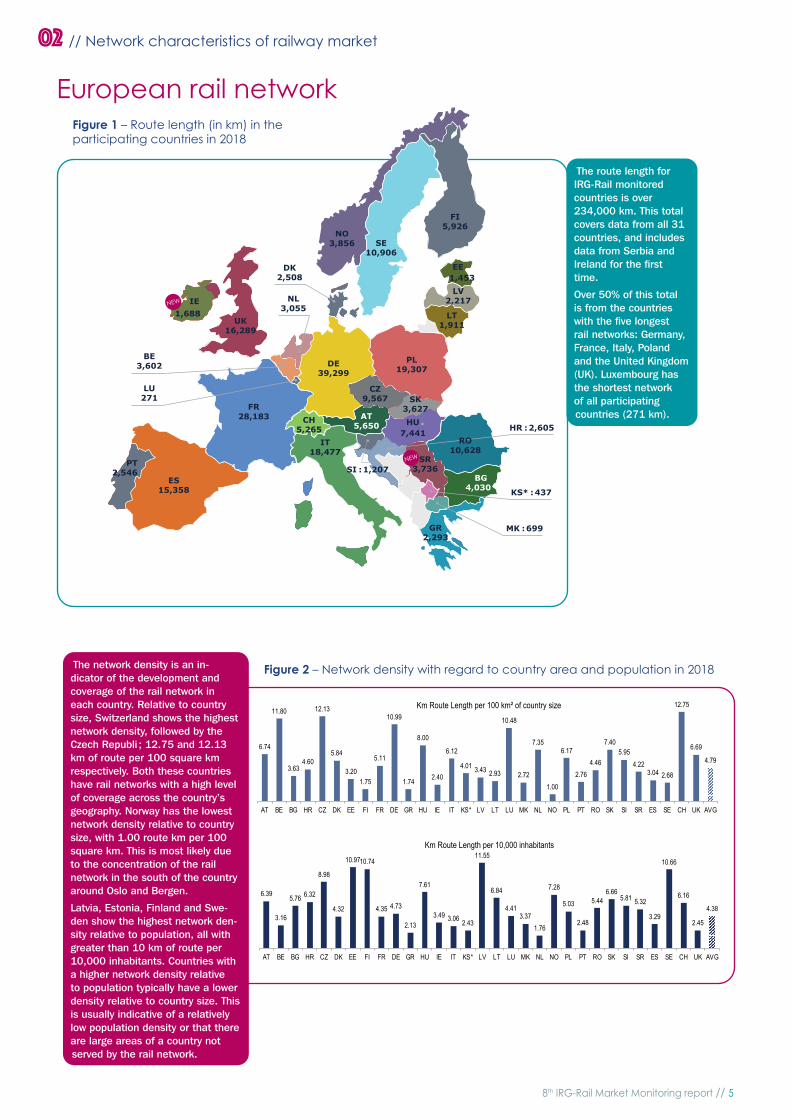
The route length for IRG-Rail monitored countries is over 234,000 km. This total covers data from all 31 countries, and includes data from Serbia and Ireland for the fi rst time.
Over 50% of this total is from the countries with the fi ve longest rail networks: Germany, France, Italy, Poland and the United Kingdom (UK). Luxembourg has the shortest network of all participating countries (271 km).
Figure 1 – Route length (in km) in the participating countries in 2018
02 // Network characteristics of railway market
The network density is an in-dicator of the development and coverage of the rail network in each country. Relative to country size, Switzerland shows the highest network density, followed by the Czech Republi ; 12.75 and 12.13 km of route per 100 square km respectively. Both these countries have rail networks with a high level of coverage across the country’s geography. Norway has the lowest network density relative to country size, with 1.00 route km per 100 square km. This is most likely due to the concentration of the rail network in the south of the country around Oslo and Bergen.
Latvia, Estonia, Finland and Swe-den show the highest network den-sity relative to population, all with greater than 10 km of route per 10,000 inhabitants. Countries with a higher network density relative to population typically have a lower density relative to country size. This is usually indicative of a relatively low population density or that there are large areas of a country not served by the rail network.
Km Route Length per 100 km of country size
Km Route Length per 10,000 inhabitants
6.74
11.80
3.634.60
12.13
5.84
3.201.75
5.11
10.99
1.74
8.00
2.40
6.12
4.01 3.43 2.93
10.48
2.72
7.35
1.00
6.17
2.764.46
7.405.95
4.223.04 2.68
12.75
6.69
4.79
AT BE BG HR CZ DK EE FI FR DE GR HU IE IT KS* LV LT LU MK NL NO PL PT RO SK SI SR ES SE CH UK AVG
6.39
3.16
5.76 6.32
8.98
4.32
10.9710.74
4.35 4.73
2.13
7.61
3.49 3.06 2.43
11.55
6.84
4.413.37
1.76
7.28
5.03
2.48
5.446.66
5.81 5.32
3.29
10.66
6.16
2.45
4.38
AT BE BG HR CZ DK EE FI FR DE GR HU IE IT KS* LV LT LU MK NL NO PL PT RO SK SI SR ES SE CH UK AVG
FI5,926
SE10,906
NO3,856
UK16,289
FR28,183
ES 15,358
PT 2,546
IE1,688
CH5,265
IT18,477
AT5,650
SR3,736
BG4,030
HR : 2,605
SI : 1,207
CZ9,567
PL19,307
DE39,299
SK3,627
LT1,911
LV2,217
EE1,453
LU271
BE3,602
NL3,055
DK2,508
KS* : 437
GR2,293
MK : 699
NEW
NEW
RO10,628
HU7,441
6 // 8th IRG-Rail Market Monitoring report
7 In this graph and the following, CAGR stands for the compound annual growth rate.8 30 countries are included in this fi gure (Serbia is missing).9 29 countries are included in this fi gure (Ireland and Serbia are missing).
Figure 4 – Overall network usage intensity (train-km per route km per day) for participating countries from 2014 to 20189
02 // Network characteristics of railway market
55% 45%54% 46%2014 2018
30 countries included
CAGR - 0,7 %
CAGR + 0.6 %
CAGR - 0.02 %
electrified
non-electrified
total
2014 2015 2016 2017 2018
124 385 125 192 125 923 127 136 127 234
106 139 105 121 104 473 103 489 103 067
230 524 230 313 230 396 230 624 230 301
electrified non-electrified
0.7
Figure 3 – Total route length and electrifi ed share (km) of participating countries
from 2014 to 2018 7, 8
Electrifi cation of the railway
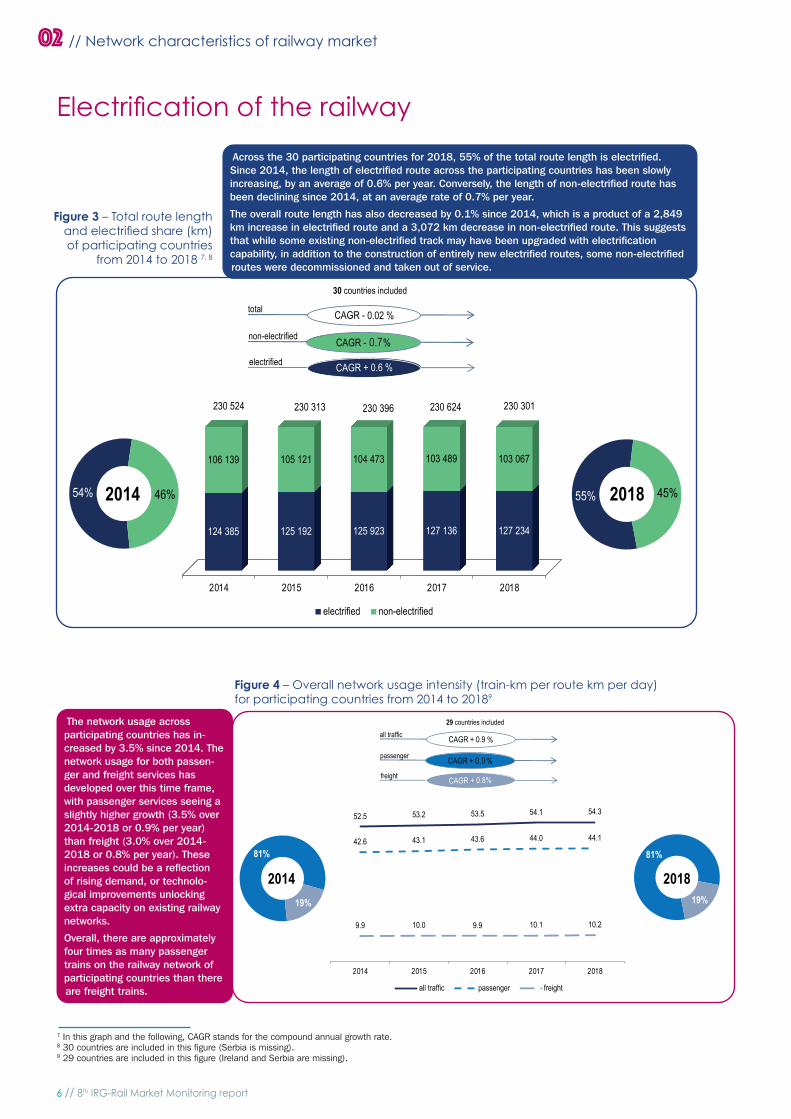
The network usage across participating countries has in-creased by 3.5% since 2014. The network usage for both passen-ger and freight services has developed over this time frame, with passenger services seeing a slightly higher growth (3.5% over 2014-2018 or 0.9% per year) than freight (3.0% over 2014-2018 or 0.8% per year). These increases could be a refl ection of rising demand, or technolo-gical improvements unlocking extra capacity on existing railway networks.
Overall, there are approximately four times as many passenger trains on the railway network of participating countries than there are freight trains.
Across the 30 participating countries for 2018, 55% of the total route length is electrifi ed. Since 2014, the length of electrifi ed route across the participating countries has been slowly increasing, by an average of 0.6% per year. Conversely, the length of non-electrifi ed route has been declining since 2014, at an average rate of 0.7% per year.
The overall route length has also decreased by 0.1% since 2014, which is a product of a 2,849 km increase in electrifi ed route and a 3,072 km decrease in non-electrifi ed route. This suggests that while some existing non-electrifi ed track may have been upgraded with electrifi cation capability, in addition to the construction of entirely new electrifi ed routes, some non-electrifi ed routes were decommissioned and taken out of service.
29 countries included
81%
19%
81%
19%
20182014
CAGR + 0,9 %
CAGR + 0.8%
CAGR + 0.9 %
freight
passenger
all traffic
52.5 53.2 53.5 54.1 54.3
42.6 43.1 43.6 44.0 44.1
9.9 10.0 9.9 10.1 10.2
2014 2015 2016 2017 2018
all traffic passenger freight
0.9
8th IRG-Rail Market Monitoring report // 7
03Track access charges (TAC)
paid by railway undertakings for the minimum access package
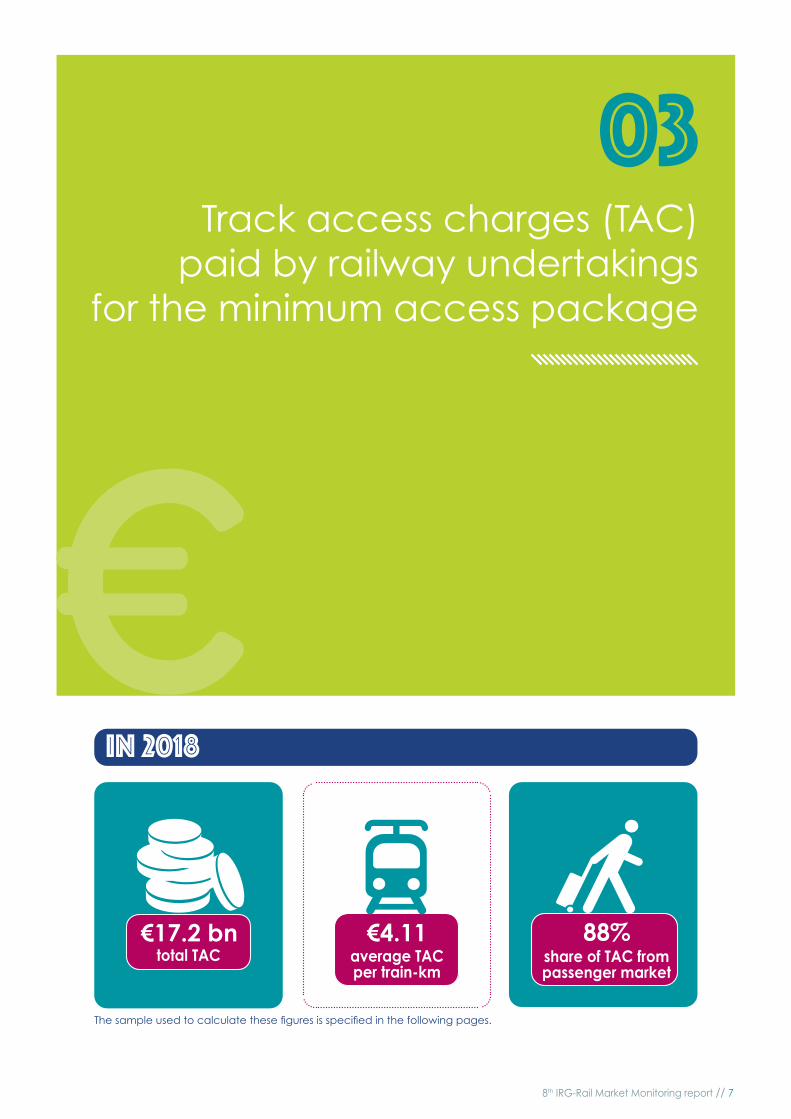
€17.2 bntotal TAC
€4.11average TAC per train-km
88%share of TAC from passenger market
IN 2018
The sample used to calculate these fi gures is specifi ed in the following pages.
8 // 8th IRG-Rail Market Monitoring report
10 Directive 2012/34/EU of the European Parliament and of the Council.11 27 countries are included in this fi gure (Estonia, Kosovo, Serbia and Switzerland are missing).12 24 countries are included in this fi gure (Estonia, Ireland, Kosovo, Republic of North Macedonia, Serbia, Sweden and Switzerland are missing).
03 // Track access charges (TAC) paid by railway undertakings for the minimum access package
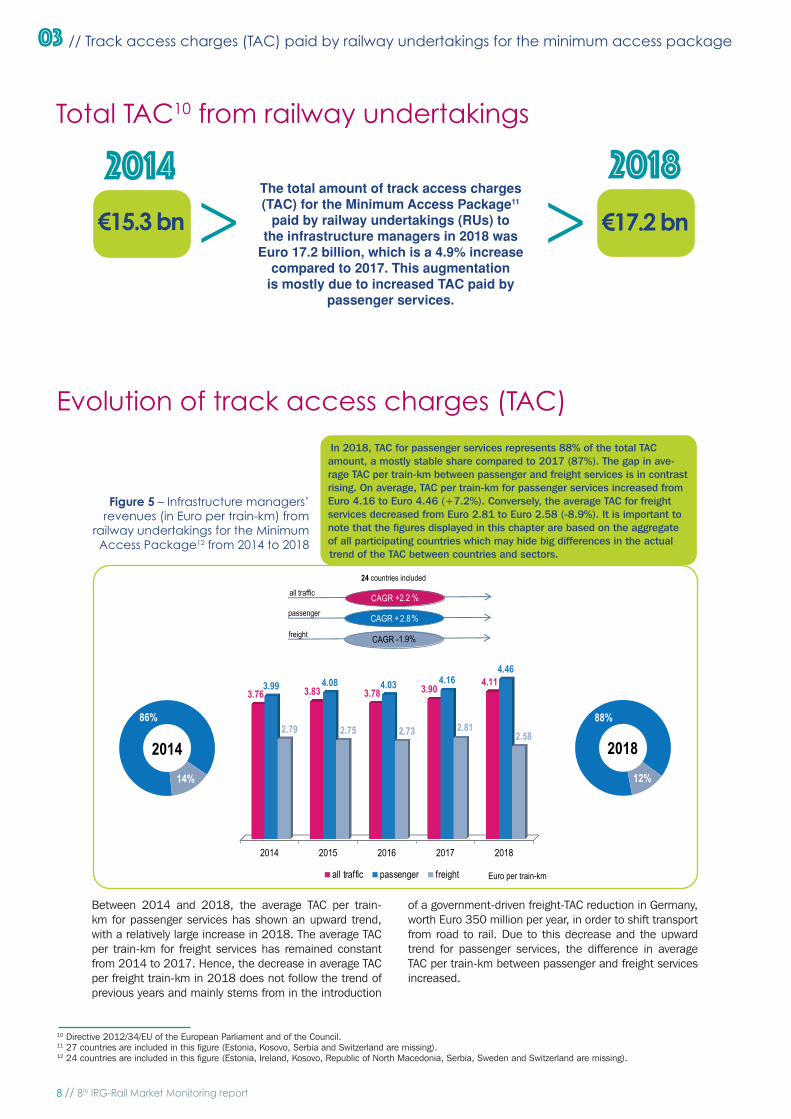
In 2018, TAC for passenger services represents 88% of the total TAC amount, a mostly stable share compared to 2017 (87%). The gap in ave-rage TAC per train-km between passenger and freight services is in contrast rising. On average, TAC per train-km for passenger services increased from Euro 4.16 to Euro 4.46 (+7.2%). Conversely, the average TAC for freight services decreased from Euro 2.81 to Euro 2.58 (-8.9%). It is important to note that the fi gures displayed in this chapter are based on the aggregate of all participating countries which may hide big differences in the actual trend of the TAC between countries and sectors.
Figure 5 – Infrastructure managers’ revenues (in Euro per train-km) from
railway undertakings for the Minimum Access Package12 from 2014 to 2018
Evolution of track access charges (TAC)
€17.2 bn€15.3 bn
The total amount of track access charges (TAC) for the Minimum Access Package11
paid by railway undertakings (RUs) to the infrastructure managers in 2018 was
Euro 17.2 billion, which is a 4.9% increase compared to 2017. This augmentation
is mostly due to increased TAC paid by passenger services.
> >2014 2018
Total TAC10 from railway undertakings
CAGR +2.2 %all traffic
CAGR -1.9%freight
Euro per train-km
24 countries included
CAGR +2,8 %
88%
12%
86%
14%
2014 2018
passenger
2014 2015 2016 2017 2018
3.76 3.83 3.78 3.90 4.113.99 4.08 4.03 4.164.46
2.79 2.75 2.73 2.812.58
all traffic passenger freight
2.8
Between 2014 and 2018, the average TAC per train-km for passenger services has shown an upward trend, with a relatively large increase in 2018. The average TAC per train-km for freight services has remained constant from 2014 to 2017. Hence, the decrease in average TAC per freight train-km in 2018 does not follow the trend of previous years and mainly stems from in the introduction
of a government-driven freight-TAC reduction in Germany, worth Euro 350 million per year, in order to shift transport from road to rail. Due to this decrease and the upward trend for passenger services, the difference in average TAC per train-km between passenger and freight services increased.
8th IRG-Rail Market Monitoring report // 9
04Railway undertakings and global rail traffi c
IN 2018
4.5 bntrain-km
81%Passenger services:
1 and 330in each country
Between
railway untertakings
+0.8%total train-km
2014> 2018>(compound annual
growth rate)
of total train-km
The sample used to calculate these fi gures is specifi ed in the following pages.
10 // 8th IRG-Rail Market Monitoring report
LU
DK
HRSI
KS*BG
RO
HU
SK
PL
LV
EE
MK
ES
CH
PT
AT
IT
UK
FR
BEDE
GR
NL
LT
NO SE
FI
CZ
IE
SR
85
11 21
2
26
4
34
2
15
412
35
4659
330
102
48
6
12
3
15
24
1
7
18
38
43
28
14
13 The number of RUs in each country may differ a lot from those presented in this fi gure when the counting is based on the RUs’ ownership as many RUs might belong to a same group. Besides, an RU may operate in several countries, through its subsidiaries or not. The overall number of RUs in Europe can therefore not be obtained by simply summing the number of RUs across all countries.14 Note that in total these numbers exceed 100% since one RU may provide both passenger and freight services15 29 countries are included in this fi gure (Ireland and Serbia are missing).
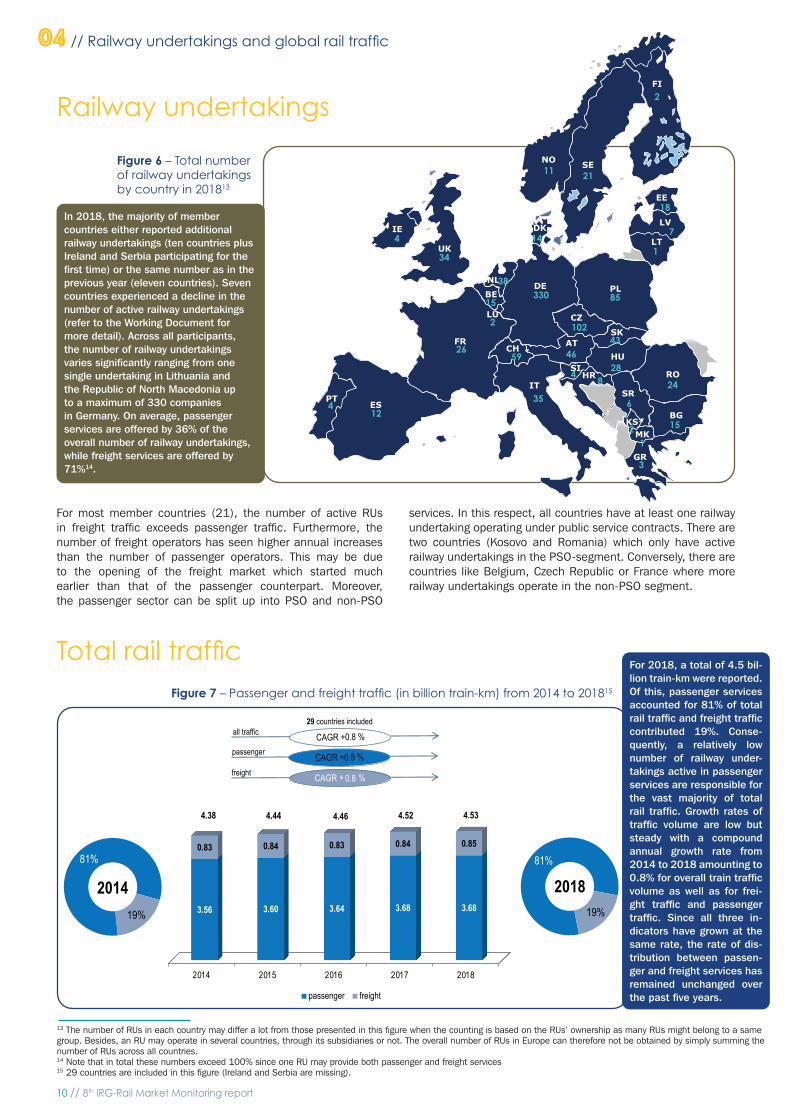
In 2018, the majority of member countries either reported additional railway undertakings (ten countries plus Ireland and Serbia participating for the fi rst time) or the same number as in the previous year (eleven countries). Seven countries experienced a decline in the number of active railway undertakings (refer to the Working Document for more detail). Across all participants, the number of railway undertakings varies signifi cantly ranging from one single undertaking in Lithuania and the Republic of North Macedonia up to a maximum of 330 companies in Germany. On average, passenger services are offered by 36% of the overall number of railway undertakings, while freight services are offered by 71%14.
04 // Railway undertakings and global rail traffi c
29 countries included
81%
19%
81%
19%
2014 2018
CAGR +0.8 %
CAGR + 0,8 %
passenger
freight
all traffic
CAGR +0.8 %
2014 2015 2016 2017 2018
3.56 3.60 3.64 3.68 3.68
0.83 0.84 0.83 0.84 0.85
4.38 4.44 4.46 4.52 4.53
passenger freight
0.8
For 2018, a total of 4.5 bil-lion train-km were reported. Of this, passenger services accounted for 81% of total rail traffi c and freight traffi c contributed 19%. Conse-quently, a relatively low number of railway under-takings active in passenger services are responsible for the vast majority of total rail traffi c. Growth rates of traffi c volume are low but steady with a compound annual growth rate from 2014 to 2018 amounting to 0.8% for overall train traffi c volume as well as for frei-ght traffi c and passenger traffi c. Since all three in-dicators have grown at the same rate, the rate of dis-tribution between passen-ger and freight services has remained unchanged over the past fi ve years.
Figure 7 – Passenger and freight traffi c (in billion train-km) from 2014 to 201815
Total rail traffi c
Railway undertakings
Figure 6 – Total number of railway undertakings by country in 201813
For most member countries (21), the number of active RUs in freight traffi c exceeds passenger traffi c. Furthermore, the number of freight operators has seen higher annual increases than the number of passenger operators. This may be due to the opening of the freight market which started much earlier than that of the passenger counterpart. Moreover, the passenger sector can be split up into PSO and non-PSO
services. In this respect, all countries have at least one railway undertaking operating under public service contracts. There are two countries (Kosovo and Romania) which only have active railway undertakings in the PSO-segment. Conversely, there are countries like Belgium, Czech Republic or France where more railway undertakings operate in the non-PSO segment.
8th IRG-Rail Market Monitoring report // 11
05The rail freight market
850 mfreight train-km
466 bnfreight net tonne-km
Freight load factor: 548 net tonne-kmper freight train-km
total market share of new
entrants in the freight market
44% €21.32
IN 2018
€cts3.71RUs’ revenue per net tonne-km
RUs’ revenue per freight train-km
The sample used to calculate these fi gures is specifi ed in the following pages.
(in net tonne-km)
12 // 8th IRG-Rail Market Monitoring report
22 countries included
CAGR +3.2 %
CAGR +2.0 %
international
national
2014 2015 2016 2017 2018
53% 52% 50% 51% 52%
47% 48% 50% 49% 48%
National International
16 Data on the modal split of freight transport in the European Union can be found on Eurostat website.17 29 countries are included in this figure for freight train-km (Ireland and Serbia are missing), 26 countries are included in this figure for freight net tonne-km (Ireland, Serbia, Estonia, Luxembourg and Republic of North Macedonia are missing).18 22 countries are included in this figure (Belgium, Estonia, Ireland, Luxembourg, Republic of North Macedonia, Norway, Slovakia, Serbia and Switzerland are missing).19 26 countries are included in this figure (Ireland, Serbia, Estonia, Luxembourg and Republic of North Macedonia are missing).
05 // The rail freight market
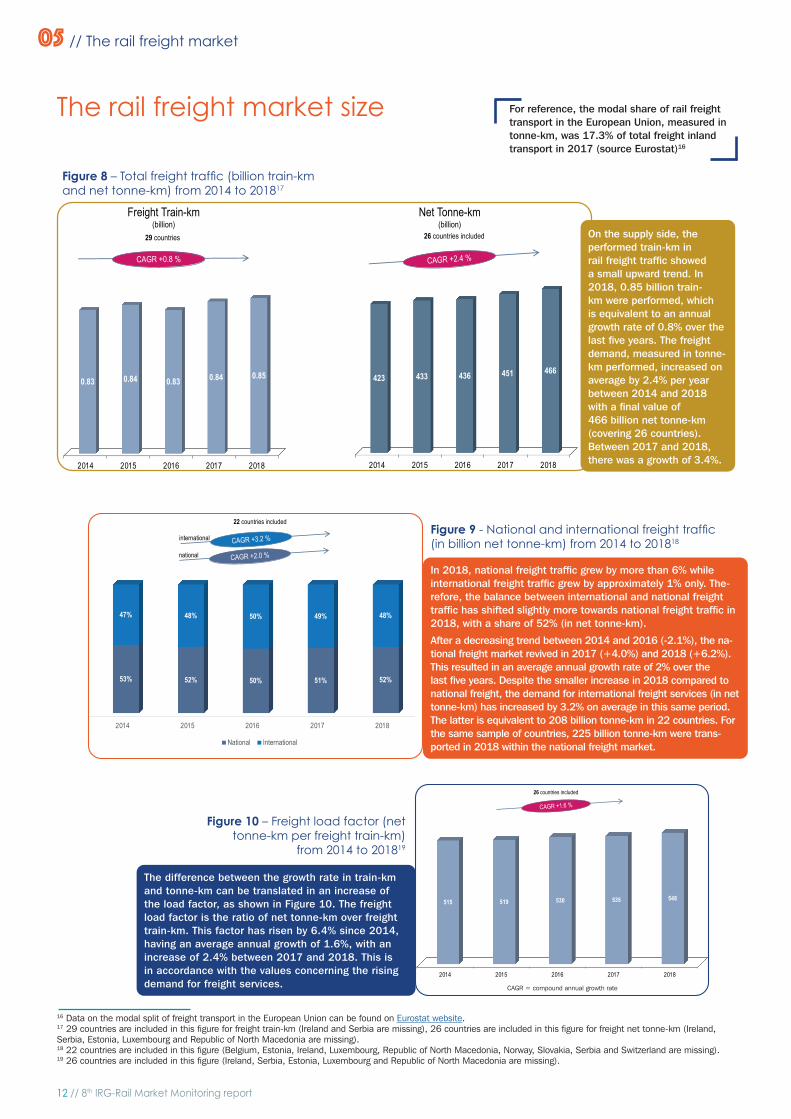
The rail freight market size
Figure 10 – Freight load factor (net tonne-km per freight train-km)
from 2014 to 201819
On the supply side, the performed train-km in rail freight traffic showed a small upward trend. In 2018, 0.85 billion train-km were performed, which is equivalent to an annual growth rate of 0.8% over the last five years. The freight demand, measured in tonne-km performed, increased on average by 2.4% per year between 2014 and 2018 with a final value of 466 billion net tonne-km (covering 26 countries). Between 2017 and 2018, there was a growth of 3.4%.
Figure 8 – Total freight traffic (billion train-km and net tonne-km) from 2014 to 201817
The difference between the growth rate in train-km and tonne-km can be translated in an increase of the load factor, as shown in Figure 10. The freight load factor is the ratio of net tonne-km over freight train-km. This factor has risen by 6.4% since 2014, having an average annual growth of 1.6%, with an increase of 2.4% between 2017 and 2018. This is in accordance with the values concerning the rising demand for freight services.
For reference, the modal share of rail freight transport in the European Union, measured in tonne-km, was 17.3% of total freight inland transport in 2017 (source Eurostat)16
Figure 9 - National and international freight traffic (in billion net tonne-km) from 2014 to 201818
In 2018, national freight traffic grew by more than 6% while international freight traffic grew by approximately 1% only. The-refore, the balance between international and national freight traffic has shifted slightly more towards national freight traffic in 2018, with a share of 52% (in net tonne-km).
After a decreasing trend between 2014 and 2016 (-2.1%), the na-tional freight market revived in 2017 (+4.0%) and 2018 (+6.2%). This resulted in an average annual growth rate of 2% over the last five years. Despite the smaller increase in 2018 compared to national freight, the demand for international freight services (in net tonne-km) has increased by 3.2% on average in this same period. The latter is equivalent to 208 billion tonne-km in 22 countries. For the same sample of countries, 225 billion tonne-km were trans-ported in 2018 within the national freight market.
26 countries included
CAGR +1.6 %
CAGR = compound annual growth rate
2014 2015 2016 2017 2018
515 519 530 535 548
CAGR = compound annual growth rate
Freight Train-km(billion)
Net Tonne-km(billion)
CAGR +0.8 %
29 countries 26 countries included
CAGR +2.4 %
2014 2015 2016 2017 2018
0.83 0.84 0.83 0.84 0.85
2014 2015 2016 2017 2018
423 433 436 451 466
8th IRG-Rail Market Monitoring report // 13
Market shares of freight railway undertakings
(based on net tonne-km)
25 countries included
2016 2017 2018
58% 57% 55%
12% 13% 13%
29% 30% 31%
Non-incumbentForeign incumbentDomestic incumbent
20 25 countries are included in this figure (Denmark, France, Ireland, Republic of North Macedonia, Serbia and Sweden are missing).21 16 countries are included in this figure (Belgium, Czech Republic, Denmark, Estonia, France, Ireland, Italy, Luxembourg, Republic of North Macedonia, Netherlands, Norway, Slovakia, Slovenia, Serbia and Switzerland are missing).
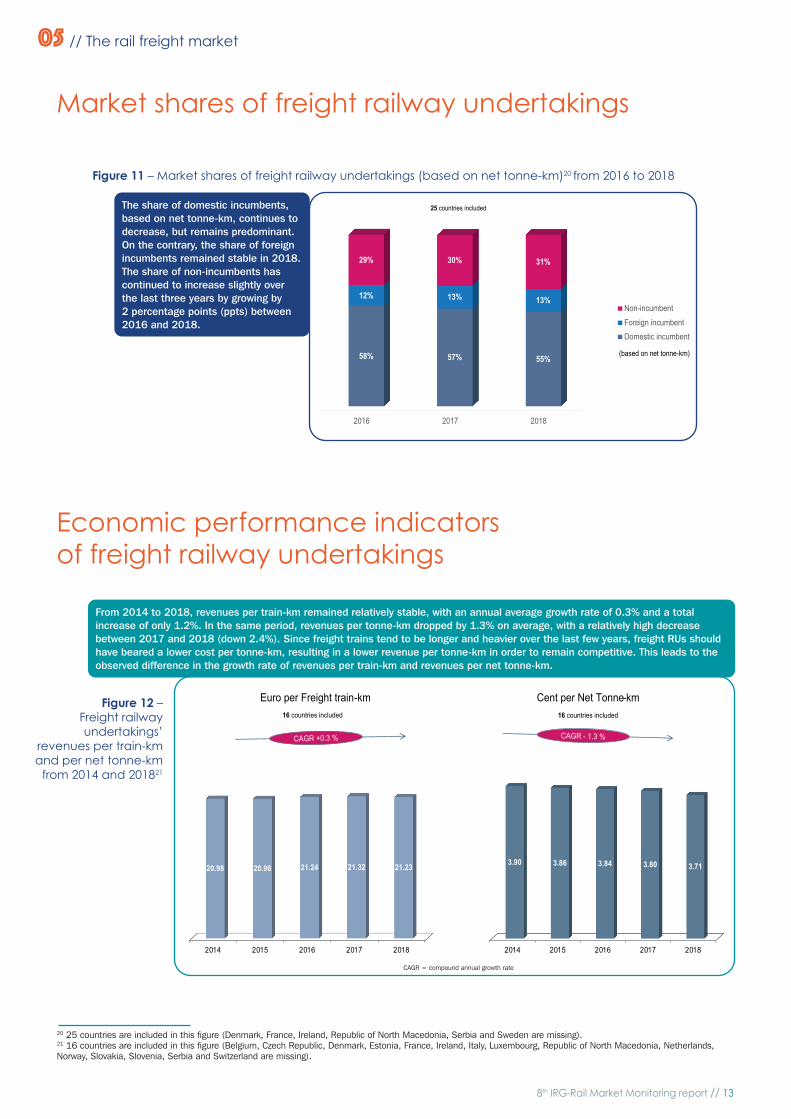
The share of domestic incumbents, based on net tonne-km, continues to decrease, but remains predominant. On the contrary, the share of foreign incumbents remained stable in 2018. The share of non-incumbents has continued to increase slightly over the last three years by growing by 2 percentage points (ppts) between 2016 and 2018.
Figure 11 – Market shares of freight railway undertakings (based on net tonne-km)20 from 2016 to 2018
05 // The rail freight market
Economic performance indicators of freight railway undertakings
Euro per Freight train-km Cent per Net Tonne-km
CAGR +0.3 % CAGR - 1.3 %
16 countries included 16 countries included
2014 2015 2016 2017 2018
20.98 20.96 21.24 21.32 21.23
2014 2015 2016 2017 2018
3.90 3.86 3.84 3.80 3.71
From 2014 to 2018, revenues per train-km remained relatively stable, with an annual average growth rate of 0.3% and a total increase of only 1.2%. In the same period, revenues per tonne-km dropped by 1.3% on average, with a relatively high decrease between 2017 and 2018 (down 2.4%). Since freight trains tend to be longer and heavier over the last few years, freight RUs should have beared a lower cost per tonne-km, resulting in a lower revenue per tonne-km in order to remain competitive. This leads to the observed difference in the growth rate of revenues per train-km and revenues per net tonne-km.
Figure 12 – Freight railway undertakings’
revenues per train-km and per net tonne-km
from 2014 and 201821
CAGR = compound annual growth rate
14 // 8th IRG-Rail Market Monitoring report
06The rail passenger market
IN 2018
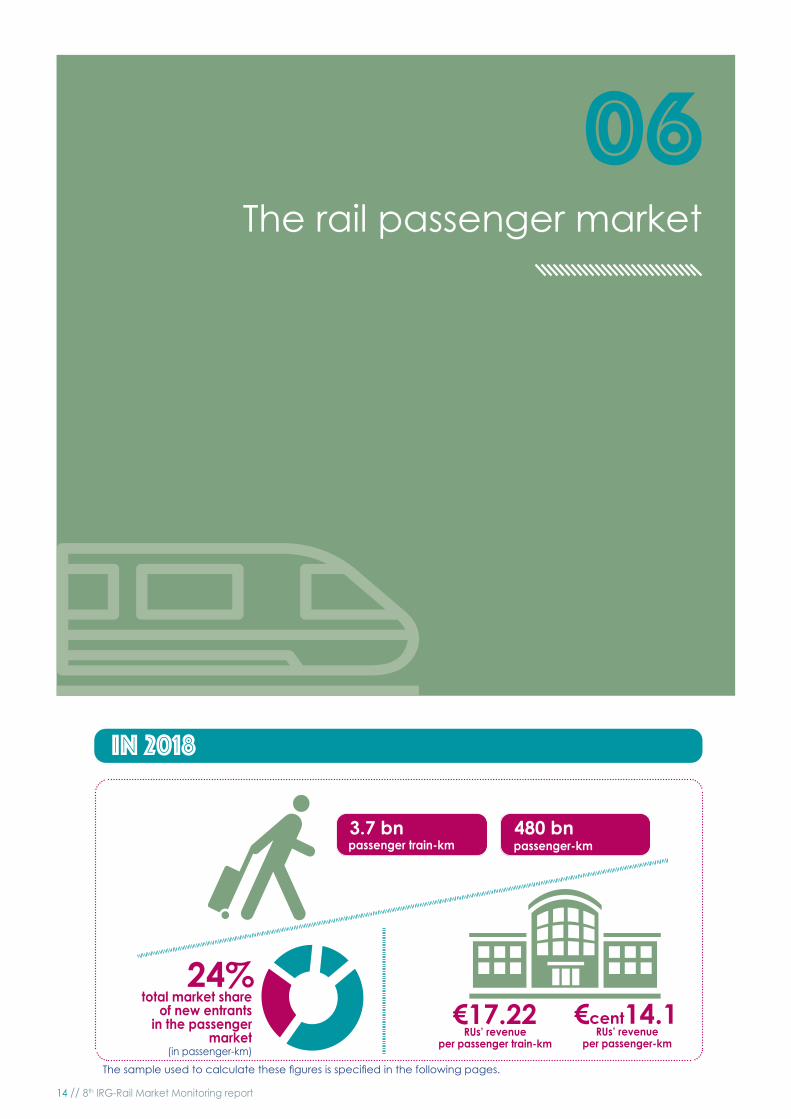
3.7 bnpassenger train-km
480 bnpassenger-km
€17.22total market share
of new entrants in the passenger
market
24%€cent14.1
RUs’ revenue per passenger train-km
RUs’ revenue per passenger-km
The sample used to calculate these fi gures is specifi ed in the following pages.
(in passenger-km)
8th IRG-Rail Market Monitoring report // 15
22 Data on the modal split of passenger transport in the European Union can be found on Eurostat website. 23 29 countries are included in this fi gure for passenger train-km (Ireland and Serbia are missing), 26 countries are included in this fi gure for passenger-km (Belgium, Estonia, Ireland, Luxembourg and Serbia are missing)24 26 countries are included in this fi gure (Belgium, Estonia, Ireland, Serbia and Luxembourg are missing).
06 // The rail passenger market
Passenger-km(billion)
Passenger Train-km(billion)
CAGR +2.3 %
26 countries included29 countries included
CAGR +0.8 %
2014 2015 2016 2017 2018
3.56 3.60 3.64 3.68 3.68
2014 2015 2016 2017 2018
437 448 458 475 480
The rail passenger market size
Figure 14 – Passenger load factor (passenger-km per passenger train-km) from 2014 to 201824
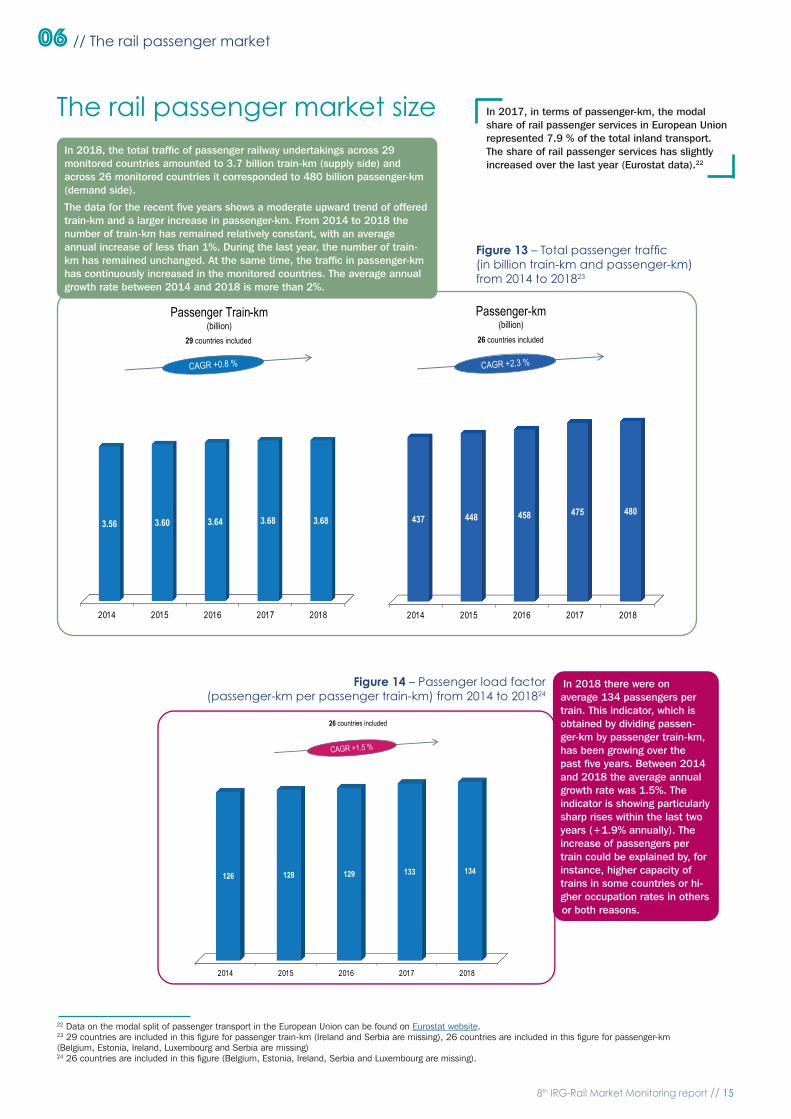
In 2018, the total traffi c of passenger railway undertakings across 29 monitored countries amounted to 3.7 billion train-km (supply side) and across 26 monitored countries it corresponded to 480 billion passenger-km (demand side).
The data for the recent fi ve years shows a moderate upward trend of offered train-km and a larger increase in passenger-km. From 2014 to 2018 the number of train-km has remained relatively constant, with an average annual increase of less than 1%. During the last year, the number of train-km has remained unchanged. At the same time, the traffi c in passenger-km has continuously increased in the monitored countries. The average annual growth rate between 2014 and 2018 is more than 2%.
Figure 13 – Total passenger traffi c (in billion train-km and passenger-km) from 2014 to 201823
In 2018 there were on average 134 passengers per train. This indicator, which is obtained by dividing passen-ger-km by passenger train-km, has been growing over the past fi ve years. Between 2014 and 2018 the average annual growth rate was 1.5%. The indicator is showing particularly sharp rises within the last two years (+1.9% annually). The increase of passengers per train could be explained by, for instance, higher capacity of trains in some countries or hi-gher occupation rates in others or both reasons.
26 countries included
CAGR +1.5 %
2014 2015 2016 2017 2018
126 128 129 133 134
In 2017, in terms of passenger-km, the modal share of rail passenger services in European Union represented 7.9 % of the total inland transport.The share of rail passenger services has slightly increased over the last year (Eurostat data).22
16 // 8th IRG-Rail Market Monitoring report
(based on Passenger-km)
27 countries included27 countries included
2016 2017 2018
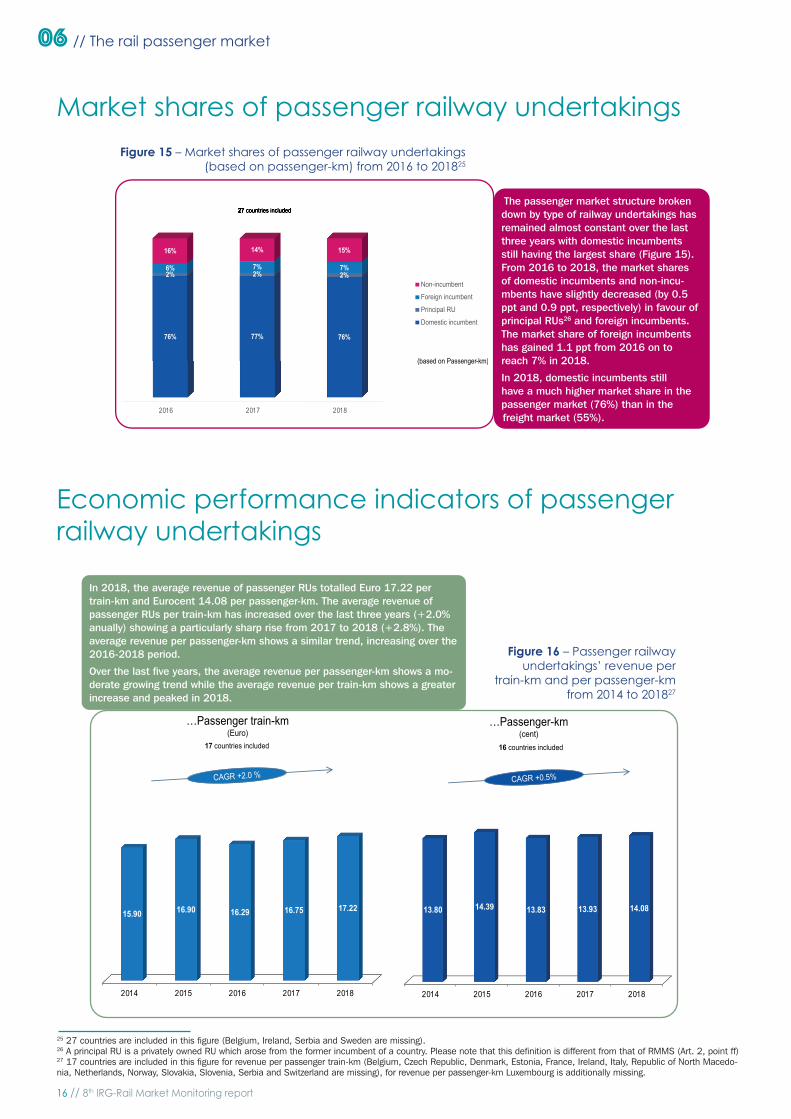
76% 77% 76%
2% 2% 2%6% 7% 7%
16% 14% 15%
Non-incumbentForeign incumbentPrincipal RUDomestic incumbent
25 27 countries are included in this fi gure (Belgium, Ireland, Serbia and Sweden are missing).26 A principal RU is a privately owned RU which arose from the former incumbent of a country. Please note that this defi nition is different from that of RMMS (Art. 2, point ff)27 17 countries are included in this fi gure for revenue per passenger train-km (Belgium, Czech Republic, Denmark, Estonia, France, Ireland, Italy, Republic of North Macedo-nia, Netherlands, Norway, Slovakia, Slovenia, Serbia and Switzerland are missing), for revenue per passenger-km Luxembourg is additionally missing.
The passenger market structure broken down by type of railway undertakings has remained almost constant over the last three years with domestic incumbents still having the largest share (Figure 15). From 2016 to 2018, the market shares of domestic incumbents and non-incu-mbents have slightly decreased (by 0.5 ppt and 0.9 ppt, respectively) in favour of principal RUs26 and foreign incumbents. The market share of foreign incumbents has gained 1.1 ppt from 2016 on to reach 7% in 2018.
In 2018, domestic incumbents still have a much higher market share in the passenger market (76%) than in the freight market (55%).
Figure 15 – Market shares of passenger railway undertakings (based on passenger-km) from 2016 to 201825
06 // The rail passenger market
…Passenger train-km(Euro)
…Passenger-km(cent)
16 countries included
CAGR +0.5%CAGR +2.0 %
17 countries included
2014 2015 2016 2017 2018
15.90 16.90 16.29 16.75 17.22
2014 2015 2016 2017 2018
13.80 14.39 13.83 13.93 14.08
In 2018, the average revenue of passenger RUs totalled Euro 17.22 per train-km and Eurocent 14.08 per passenger-km. The average revenue of passenger RUs per train-km has increased over the last three years (+2.0% anually) showing a particularly sharp rise from 2017 to 2018 (+2.8%). The average revenue per passenger-km shows a similar trend, increasing over the 2016-2018 period.
Over the last fi ve years, the average revenue per passenger-km shows a mo-derate growing trend while the average revenue per train-km shows a greater increase and peaked in 2018.
Figure 16 – Passenger railway undertakings’ revenue per
train-km and per passenger-km from 2014 to 201827
Market shares of passenger railway undertakings
Economic performance indicators of passenger railway undertakings
8th IRG-Rail Market Monitoring report // 17
07Competitive situation in the rail passengerand freight markets
INTRODUCTIONIn Article 56 (2) of directive 2012/34 EU, rail regulatory bodies (RB) have been tasked with the role of monitoring the compe-titive situation in the rail services markets. In line with RBs’ task of monitoring the markets, IRG-Rail aims in this chapter to give a general overview, from the RBs’ perspective, of the competitive situation in the three different national railway markets: PSO and non-PSO passenger markets as well as freight market.
The overview will be given on a national level for each IRG-Rail country participating in this part of the report, based on descriptions of the competitive situation that have been written by the RBs themselves. A questionnaire was diffused to IRG-Rail members asking them to (i) write a short general description of the competitive situation, (ii) mention the main entry barriers in their respective market and (iii) provide a general non-binding assessment of the competition level based on indica-tors of concentration and entry barriers, i.e. if they consider the barriers to entry in their market to generally be high or low, and if they consider the competitive situation in general to be either healthy or restricted. The considerations given to entry barriers are especially important because the existence of low entry barriers in a market can imply that high concentration in the market is not as problematic as it would otherwise be.
All participating countries were therefore also asked to provide data for the calculation of Herfi ndahl-Hirschman indexes (HHIs) and to give an overview of the actual actors participating in each market (market players) as well as assigning them to a market share-interval. A defi nition of HHIs and some precision regarding their use in relevant fi elds as well as in this Report are presented at the end of the chapter.
In what follows, an overview of the national HHI levels is presented for each railway market (passenger – PSO and non-PSO – and freight). It is, however, important to note that this overview of HHI levels is not suffi cient to conclude on the actual level of competition in these markets, and further descriptions of the markets are provided in the Working Document to give a more detailed competitive description for the different countries. Each country also has its own fact sheet in the Working Do-cument where market share intervals of the market players that have been used to calculate the HHIs can be found. Also dis-played in the following sections are the view of regulatory bodies (RBs) regarding the level of entry barriers and the healthiness of the competitive situation of their national railway markets.
18 // 8th IRG-Rail Market Monitoring report
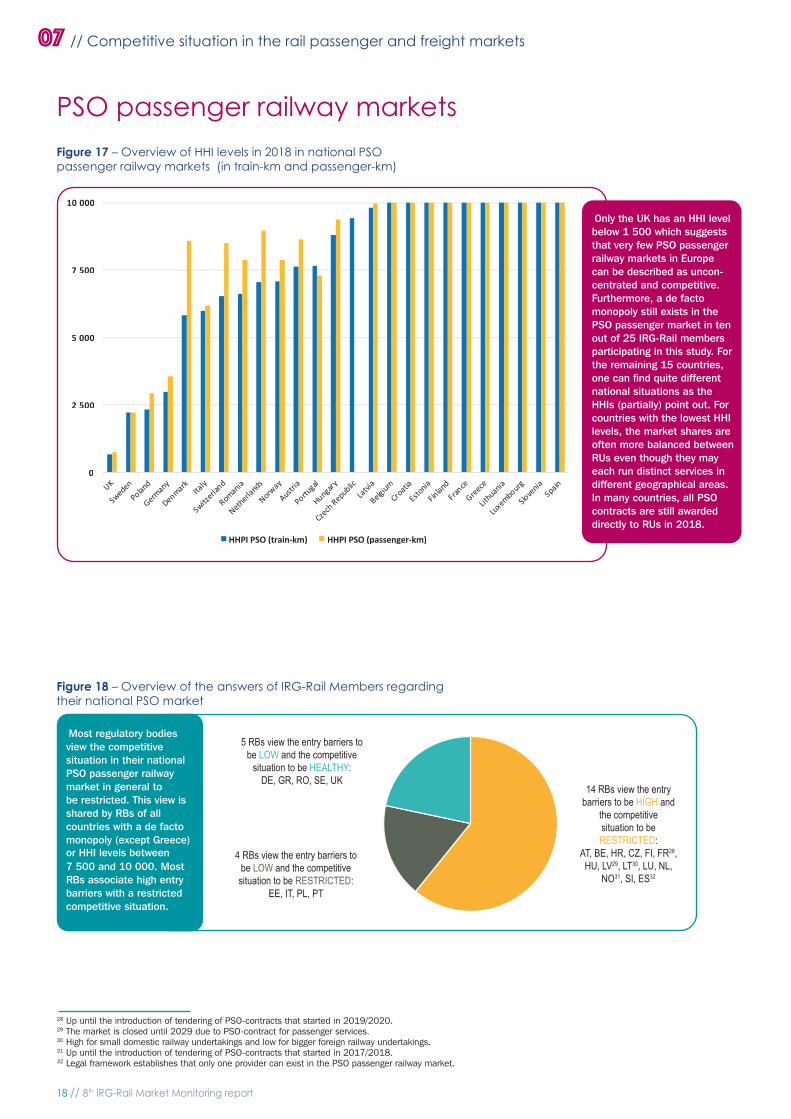
Figure 17 – Overview of HHI levels in 2018 in national PSO passenger railway markets (in train-km and passenger-km)
28 Up until the introduction of tendering of PSO-contracts that started in 2019/2020.29 The market is closed until 2029 due to PSO-contract for passenger services. 30 High for small domestic railway undertakings and low for bigger foreign railway undertakings.31 Up until the introduction of tendering of PSO-contracts that started in 2017/2018.32 Legal framework establishes that only one provider can exist in the PSO passenger railway market.
Most regulatory bodies view the competitive situation in their national PSO passenger railway market in general to be restricted. This view is shared by RBs of all countries with a de facto monopoly (except Greece) or HHI levels between 7 500 and 10 000. Most RBs associate high entry barriers with a restricted competitive situation.
Figure 18 – Overview of the answers of IRG-Rail Members regarding their national PSO market
Only the UK has an HHI level below 1 500 which suggests that very few PSO passenger railway markets in Europe can be described as uncon-centrated and competitive. Furthermore, a de facto monopoly still exists in the PSO passenger market in ten out of 25 IRG-Rail members participating in this study. For the remaining 15 countries, one can fi nd quite different national situations as the HHIs (partially) point out. For countries with the lowest HHI levels, the market shares are often more balanced between RUs even though they may each run distinct services in different geographical areas. In many countries, all PSO contracts are still awarded directly to RUs in 2018.
PSO passenger railway markets
07 // Competitive situation in the rail passenger and freight markets
0
2 500
5 000
7 500
10 000
HHPI PSO (train-km) HHPI PSO (passenger-km)
5 RBs view the entry barriers tobe LOW and the competitive
situation to be HEALTHY:DE, GR, RO, SE, UK
4 RBs view the entry barriers tobe LOW and the competitivesituation to be RESTRICTED:
EE, IT, PL, PT
14 RBs view the entrybarriers to be HIGH and
the competitivesituation to beRESTRICTED:
AT, BE, HR, CZ, FI, FR32,HU, LV33, LT34, LU, NL,
NO35, SI, ES36
14 RBs view the entrybarriers to be HIGH and
the competitivesituation to beRESTRICTED:
AT, BE, HR, CZ, FI, FR28,HU, LV29, LT30, LU, NL,
NO31, SI, ES32
5 RBs view the entry barriers tobe LOW and the competitive
situation to be HEALTHY:DE, GR, RO, SE, UK
4 RBs view the entry barriers tobe LOW and the competitivesituation to be RESTRICTED:
EE, IT, PL, PT
8th IRG-Rail Market Monitoring report // 19
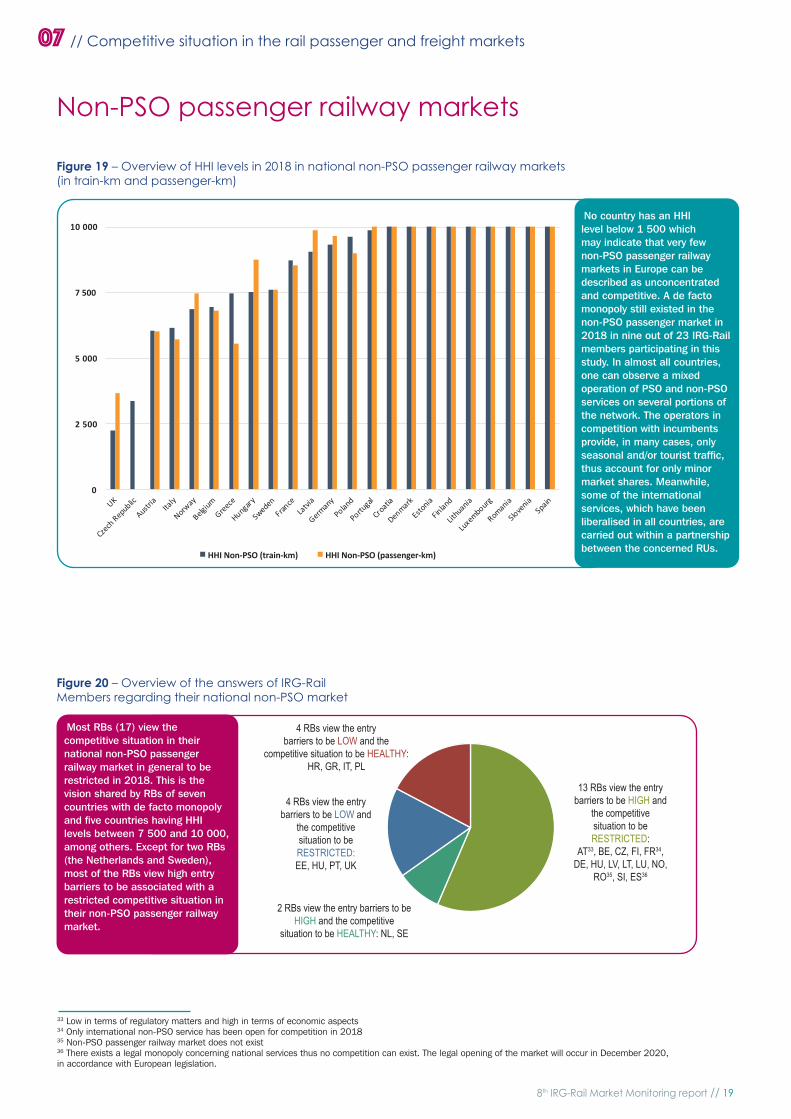
No country has an HHI level below 1 500 which may indicate that very few non-PSO passenger railway markets in Europe can be described as unconcentrated and competitive. A de facto monopoly still existed in the non-PSO passenger market in 2018 in nine out of 23 IRG-Rail members participating in this study. In almost all countries, one can observe a mixed operation of PSO and non-PSO services on several portions of the network. The operators in competition with incumbents provide, in many cases, only seasonal and/or tourist traffic, thus account for only minor market shares. Meanwhile, some of the international services, which have been liberalised in all countries, are carried out within a partnership between the concerned RUs.
Figure 19 – Overview of HHI levels in 2018 in national non-PSO passenger railway markets (in train-km and passenger-km)
Most RBs (17) view the competitive situation in their national non-PSO passenger railway market in general to be restricted in 2018. This is the vision shared by RBs of seven countries with de facto monopoly and five countries having HHI levels between 7 500 and 10 000, among others. Except for two RBs (the Netherlands and Sweden), most of the RBs view high entry barriers to be associated with a restricted competitive situation in their non-PSO passenger railway market.
Figure 20 – Overview of the answers of IRG-Rail Members regarding their national non-PSO market
33 Low in terms of regulatory matters and high in terms of economic aspects34 Only international non-PSO service has been open for competition in 2018 35 Non-PSO passenger railway market does not exist36 There exists a legal monopoly concerning national services thus no competition can exist. The legal opening of the market will occur in December 2020, in accordance with European legislation.
Non-PSO passenger railway markets
07 // Competitive situation in the rail passenger and freight markets
0
2 500
5 000
7 500
10 000
HHI Non-PSO (train-km) HHI Non-PSO (passenger-km)
4 RBs view the entry barriers to beLOW and the competitive situation
to be HEALTHY:HR, GR, IT, PL
4 RBs view the entry barriers tobe LOW and the competitivesituation to be RESTRICTED:
EE, HU, PT, UK
2 RBs view the entry barriers to beHIGH and the competitive
situation to be HEALTHY: NL, SE
13 RBs view the entrybarriers to be HIGH and
the competitivesituation to beRESTRICTED:
AT37, BE, CZ, FI, FR38,DE, HU, LV, LT, LU, NO,
RO39, SI, ES40
13 RBs view the entrybarriers to be HIGH and
the competitivesituation to beRESTRICTED:
AT33, BE, CZ, FI, FR34,DE, HU, LV, LT, LU, NO,
RO35, SI, ES36
4 RBs view the entry barriers to be LOW and the
competitive situation to be HEALTHY:HR, GR, IT, PL
4 RBs view the entry barriers to be LOW and
the competitivesituation to be RESTRICTED:EE, HU, PT, UK
2 RBs view the entry barriers to beHIGH and the competitive
situation to be HEALTHY: NL, SE
20 // 8th IRG-Rail Market Monitoring report
37 Only nine national freight markets (out of 24) have an HHI level above 5,000, versus 21 countries in both passenger markets.38 High for small domestic railway undertakings and low for bigger foreign railway undertakings39 Generally restrictive, though new entrants are progressively gaining market shares40 The entry barriers are considered as low given the large number of freight operators (more than 20). However, since most of traffic has been operated by the incumbent and its major competitors are subsidiairies of foreign incumbents, the RB considers the competitive situation as restricted.41 The freight railway market in Luxembourg is difficult to consider as an isolated national market due to its limited market size
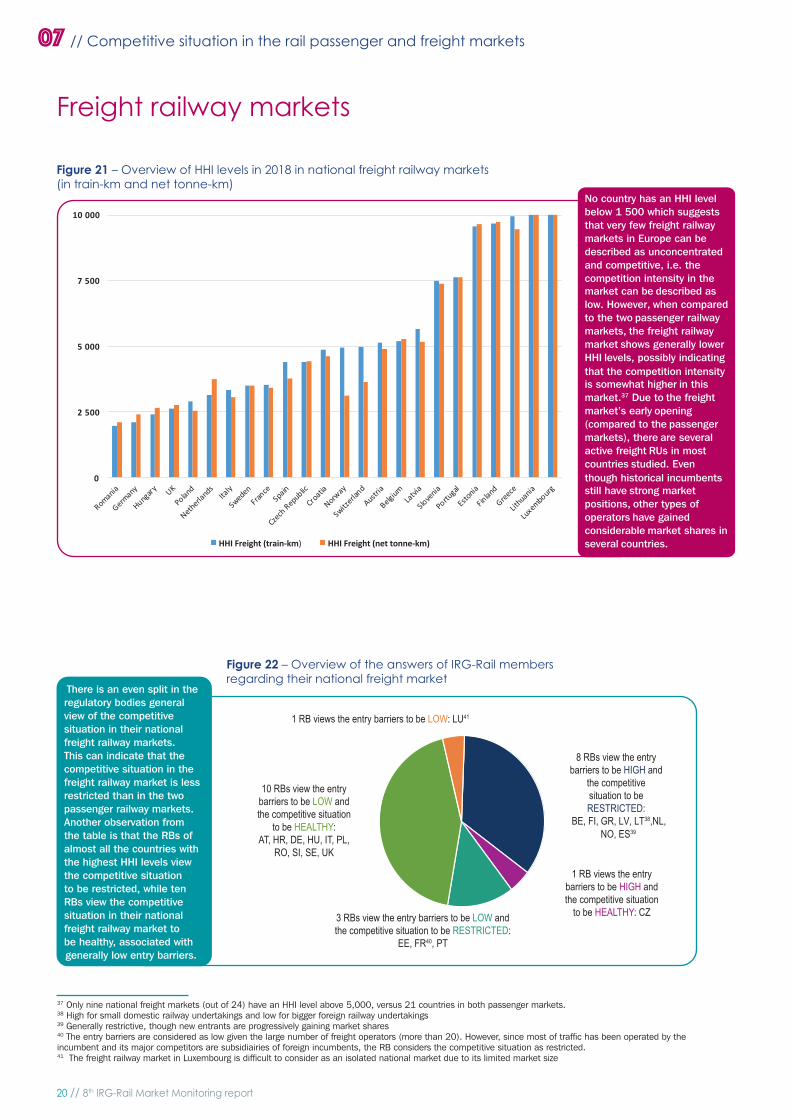
No country has an HHI level below 1 500 which suggests that very few freight railway markets in Europe can be described as unconcentrated and competitive, i.e. the competition intensity in the market can be described as low. However, when compared to the two passenger railway markets, the freight railway market shows generally lower HHI levels, possibly indicating that the competition intensity is somewhat higher in this market.37 Due to the freight market’s early opening (compared to the passenger markets), there are several active freight RUs in most countries studied. Even though historical incumbents still have strong market positions, other types of operators have gained considerable market shares in several countries.
Figure 21 – Overview of HHI levels in 2018 in national freight railway markets (in train-km and net tonne-km)
Freight railway markets
07 // Competitive situation in the rail passenger and freight markets
There is an even split in the regulatory bodies general view of the competitive situation in their national freight railway markets. This can indicate that the competitive situation in the freight railway market is less restricted than in the two passenger railway markets. Another observation from the table is that the RBs of almost all the countries with the highest HHI levels view the competitive situation to be restricted, while ten RBs view the competitive situation in their national freight railway market to be healthy, associated with generally low entry barriers.
Figure 22 – Overview of the answers of IRG-Rail members regarding their national freight market
0
2 500
5 000
7 500
10 000
HHI Freight (train-km) HHI Freight (net tonne-km)
1 RB views the entry barriers to be LOW: LU43
10 RBs view the entrybarriers to be LOW and
the competitive situationto be HEALTHY:
AT, HR, DE, HU, IT, PL,RO, SI, SE, UK
8 RBs view the entrybarriers to be HIGH
and the competitivesituation to be
RESTRICTED:BE, FI, GR, LV, LT41,
NL, NO, ES42
3 RBs view the entry barriers to be LOW andthe competitive situation to be RESTRICTED:EE, FR, PT
1 RB views the entrybarriers to be HIGH and
the competitive situationto be HEALTHY: CZ
8 RBs view the entrybarriers to be HIGH and
the competitivesituation to beRESTRICTED:
LV, LT38,NL,BE, FI, GR, NO, ES39
1 RB views the entry barriers to be LOW: LU41
10 RBs view the entrybarriers to be LOW andthe competitive situation
to be HEALTHY:AT, HR, DE, HU, IT, PL,
RO, SI, SE, UK
3 RBs view the entry barriers to be LOW andthe competitive situation to be RESTRICTED:
EE, FR40, PT
1 RB views the entrybarriers to be HIGH andthe competitive situation
to be HEALTHY: CZ
8th IRG-Rail Market Monitoring report // 21
Herfi ndahl-Hirschman Index
07 // Competitive situation in the rail passenger and freight markets
The Herfi ndahl-Hirschman Index (HHI) is an indicator that is used to measure market concentration, and can serve as an indication of the competition intensity in a given market. While HHIs have often been used in research42, they are also nowadays commonly used as a tool in competition law and economics, when assessing horizontal mergers for instance.43,44 In competition law, HHI is traditionally used together with a defi ned relevant market. It is furthermore acknowledged that HHIs alone do not give a defi nitive answer whether a competitive situation is healthy or not, and that further analysis is necessary to be able to provide more conclusive assessments. For instance, when analyzing market competition, an analysis of market concentration and market structure is usually done together with analyses of entry barriers and countervailing buyer power to see if potential competition and buyer power can cancel out the negative effects of high concentration.
The EU Commission describes their use of HHI in their guidelines45 on the assessment of horizontal mergers under the Council Regulation on the control of concentrations between undertakings, paragraph 16 :
The overall concentration level in a market may also provide useful information about the competitive situation. In order to measure concentration levels, the Commission often applies the Herfi ndahl-Hirschman Index (HHI). The HHI is calculated by summing the squares of the individual market shares of all the fi rms in the market. The HHI gives proportionately greater weight to the market shares of the larger fi rms. Although it is best to include all fi rms in the calculation, lack of information about very small fi rms may not be important because such fi rms do not affect the HHI signifi cantly. While the absolute level of the HHI can give an initial indication of the competitive pressure in the market post-merger, the change in the HHI (known as the ‘delta’) is a useful proxy for the change in concentration directly brought about by the merger.
It is important to note that in this report IRG-Rail is not intending to use HHI in the exact same way as in competition law economics. The markets that we are assessing have not been defi ned as relevant markets in the meaning of competi-tion law, as for example, they do not include an assessment of the possibility of substitution from other transport modes or distinguish between possible different customer segments in the railway market that can in of themselves constitute separate markets. It is also important to note that the competitive situation on individual railway lines in each country can vary widely and be very different from the general impression of the competition in the national railway market. Furthermore, it is quite possible that some railway markets are better described as line specifi c markets46 (point-to-point markets), something that is more elaborated on in Chapter 9 of this report. With regards to the PSO passenger railway market, where competitive tendering is becoming more common, the HHI also risks, at face value, to give the (wrong) impression that the competitive situation is worse than it actually is if there has been healthy competition for the market through tendering of PSO-contracts.
While keeping the above-mentioned caveats in mind, we do still fi nd HHIs to be a useful tool for giving a general fi rst impression of the level of competition intensity in the different national railway markets in the IRG-Rail countries. Additio-nally, HHI’s can serve as a tool to give a quick overview of the competitive situations in the different markets and give some initial observations on which differences between the markets can be identifi ed for further analysis.
For illustrative purposes, HHI is commonly used on a scale from one to 10 000, where 10 000 means that there is no competition in the market, i.e. there is a monopoly. In this report, IRG-Rail is using the following rules of thumb47 regar-ding what different levels of HHI can indicate:- HHI < 1 500 indicates an unconcentrated and competitive market- HHI 1 500 – 2 500 indicates a moderately concentrated market- HHI > 2 500 indicates a highly concentrated market
As shown in the previous sections for the different types of railway markets, very few national railway markets in this study fall below an HHI level of 1 500. We have therefore decided to defi ne additional brackets (intervals of 2 500) to divide the countries into to ease the reading of the sub-chapters in the Working Document for the different markets. The brackets that we have used for this purpose are:
For a country to be assigned into one of the brackets, only one of the two calculated HHIs for the given market is needed to be below the indicated level.
42 Jean Tirole, 1988, The Theory of Industrial Organization, The MIT Press Cambridge, Massachusetts, London, England, page 221.43 See (2004/C 31/03) - Guidelines on the assessment of horizontal mergers under the Council Regulation on the control of concentrations between undertakings.44 See U.S. Department of Justice & FTC, Horizontal Merger Guidelines § 5.3 (2010).45 See (2004/C 31/03) - Guidelines on the assessment of horizontal mergers under the Council Regulation on the control of concentrations between undertakings.46 See for instance Case No Comp/M.6150 – Veolia Transport / Trenitalia / JV.47 The rules of thumb chosen are the same as the ones used in the United States by the Department of Justice and the Federal Trade Commission (see the FTC Merger guidelines, 2010, page 19). Alternatively, the rules of thumb used by the EU Commission could also be applied; HHI < 1 000 indicates an unconcentrated and competitive market, HHI 1 000 – 2 000 indicates a moderately concentrated market and HHI > 2 000 indicates a highly concentrated market.
<2 500 2 500 -5 000
5 000 -7 500
7 500 -10 000
De facto monopoly
22 // 8th IRG-Rail Market Monitoring report
08Level of market entry
INTRODUCTIONAs mentioned in chapter 7, low barriers to entry in a market can make the problems associated with high market concentration less problematic than they would otherwise be. Low barriers to entry can indicate that there is a high potential for new entries in the market if the current incumbents decide to introduce higher prices to earn higher than normal profi ts or to operate ineffi ciently with higher costs than in a competitive situation. On the other hand, high barriers to entry, in a market with high market concentration, can indicate that the current incumbents can take price decisions without fearing future competition from potential new entrants.
To complement the HHI levels presented in chapter 7, IRG-Rail has included in this year’s Report an overview of the most commonly observed barriers to entry in the three different railway markets, as viewed by the IRG-Rail members. This was done by using a questionnaire with a pre-defi ned list of possible entry barriers that RBs had to consider when elaborating their answers. In the questionnaire, IRG-Rail adopted the defi nition used in the competition economic analysis where a barrier to entry is detected if it can hinder potential timely and suffi cient market entries.
What are barriers to market entry?
In order for a market to function in a healthy way, there must exist possibilities that current incumbents may in the near future face competition from new entrants. Many markets have at least some obstacles that set back or prevent a fi rm to enter. The concept of entry barriers plays an important role in a wide variety of competition matters. Entry barriers can decrease or entirely prevent one of the most important market mechanisms for creating healthy competition: the attraction and arrival of new competitors.
An exact defi nition of a barrier to market entry is diffi cult to produce. However, it can be said that the term in general means an impediment that makes it more diffi cult for a fi rm to enter a market.48 Barriers to market entry can be created deliberately by the incumbent(s) - called strategic or artifi cial barriers - or they can be the result of barriers that naturally exist in the market, also called structural barriers. While structural barriers are sometimes relatively easy to quantify, strategic barriers are often diffi cult to measure and/or detect.
48 OECD Policy Roundtables – Barriers to Entry – 2005, page 9.
8th IRG-Rail Market Monitoring report // 23
Types of barriers to market entry
08 // Barriers to entry in the railway markets
In general, structural barriers have to do with basic industry conditions such as cost and demand, and may for instance exist due to conditions such as economies of scale or network effects. More precisely, structural barriers to entry in a static context are represented by i) economies of scale, ii) absolute differences in costs (technical advantages) and iii) product differentiation (due to brand, reputation, etc., in other words network effects).49
Strategic barriers, in contrast, are intentionally created or enhanced by incumbent fi rms in the market, possibly for the purpose of deterring entry. These barriers may arise from behaviour such as exclusive dealing arrangements, for example. It can be much more complicated to measure the diffi culties that such behaviour can impose on potential entrants than it is to measure the height of structural barriers. Furthermore, it is not always easy to determine whether strategic behaviour should be viewed as aiming to restrict competition in the fi rst place. Some strategic behaviour may be designed to thwart competition by raising entry barriers, which can help incumbent fi rms to maintain their market shares. In other instances, however, strategic behaviour may result in the retention of market share because it is effi cient, even though it also happens to raise entry barriers.50
Some types of impediments can fall into either one of these categories, depending on the particular situation. Statutory/regulatory barriers, for example, could be considered either structural or strategic depending on whether incumbent fi rms played a role in persuading the government to create them. Similarly, sunk costs are typically structural but could be considered strategic if incumbent fi rms are responsible for creating or enhancing them, such as by integrating vertically and thereby forcing potential entrants to do the same thing.51
In its guidelines52 on the assessment of horizontal mergers under the Council Regulation on the control of concentrations between undertakings, the EU Commission gives some specifi c examples of barriers to entry in paragraph 71. It also explains the concepts of “timeliness” and “suffi ciency” in paragraph 74 and 75 respectively, that we have taken into account when building this chapter.
About the questionnaire used to collect answers
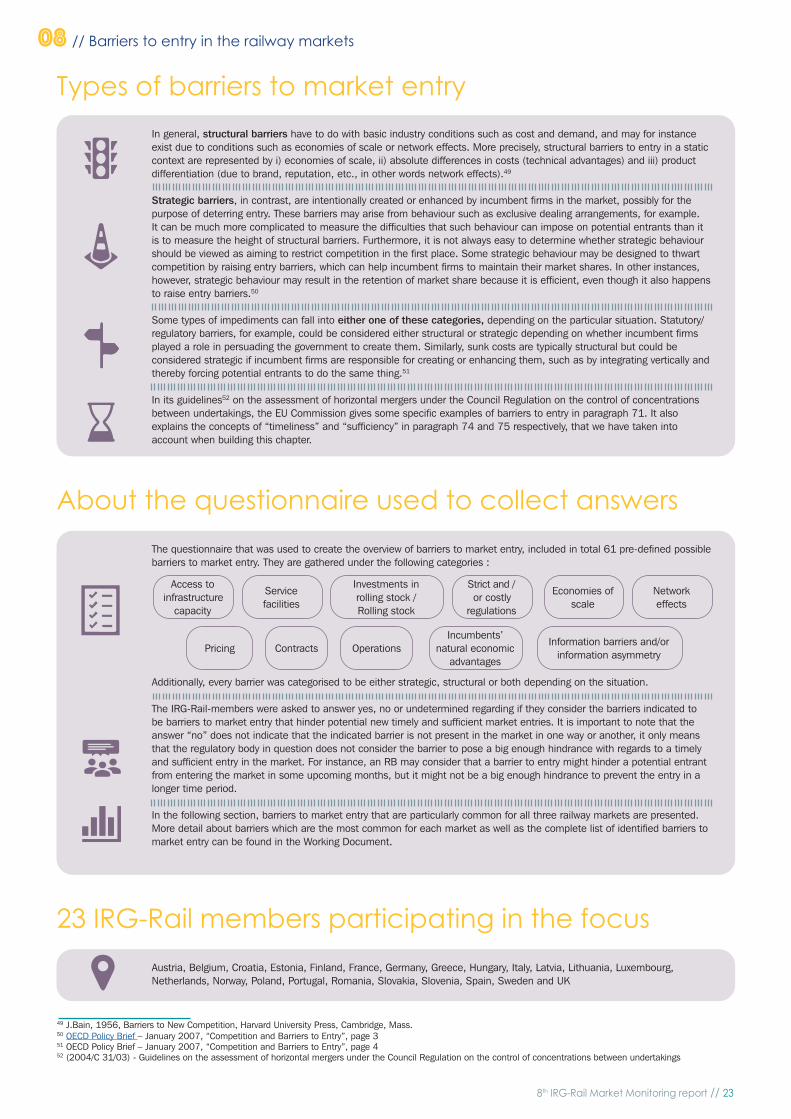
The questionnaire that was used to create the overview of barriers to market entry, included in total 61 pre-defi ned possible barriers to market entry. They are gathered under the following categories :
Additionally, every barrier was categorised to be either strategic, structural or both depending on the situation.
The IRG-Rail-members were asked to answer yes, no or undetermined regarding if they consider the barriers indicated to be barriers to market entry that hinder potential new timely and suffi cient market entries. It is important to note that the answer “no” does not indicate that the indicated barrier is not present in the market in one way or another, it only means that the regulatory body in question does not consider the barrier to pose a big enough hindrance with regards to a timely and suffi cient entry in the market. For instance, an RB may consider that a barrier to entry might hinder a potential entrant from entering the market in some upcoming months, but it might not be a big enough hindrance to prevent the entry in a longer time period.
In the following section, barriers to market entry that are particularly common for all three railway markets are presented. More detail about barriers which are the most common for each market as well as the complete list of identifi ed barriers to market entry can be found in the Working Document.
Access to infrastructure
capacity
Service facilities
Investments in rolling stock / Rolling stock
Strict and /or costly
regulations
Economies of scale
Network effects
Pricing Contracts OperationsIncumbents’
natural economic advantages
Information barriers and/or information asymmetry
23 IRG-Rail members participating in the focus
Austria, Belgium, Croatia, Estonia, Finland, France, Germany, Greece, Hungary, Italy, Latvia, Lithuania, Luxembourg, Netherlands, Norway, Poland, Portugal, Romania, Slovakia, Slovenia, Spain, Sweden and UK
49 J.Bain, 1956, Barriers to New Competition, Harvard University Press, Cambridge, Mass.50 OECD Policy Brief – January 2007, “Competition and Barriers to Entry”, page 351 OECD Policy Brief – January 2007, “Competition and Barriers to Entry”, page 452 (2004/C 31/03) - Guidelines on the assessment of horizontal mergers under the Council Regulation on the control of concentrations between undertakings
24 // 8th IRG-Rail Market Monitoring report
Barriers to market entry that are particularly common for all three types of railway markets
08 // Barriers to entry in the railway markets
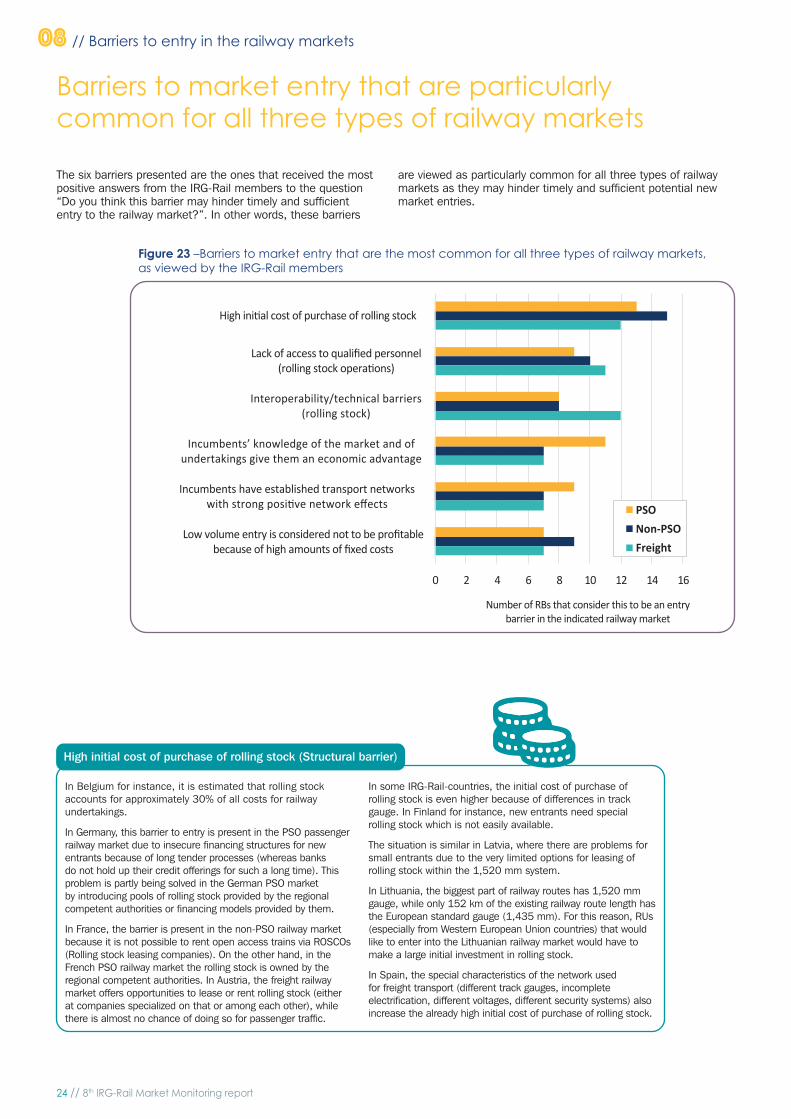
The six barriers presented are the ones that received the most positive answers from the IRG-Rail members to the question “Do you think this barrier may hinder timely and sufficient entry to the railway market?”. In other words, these barriers
are viewed as particularly common for all three types of railway markets as they may hinder timely and sufficient potential new market entries.
Figure 23 –Barriers to market entry that are the most common for all three types of railway markets, as viewed by the IRG-Rail members
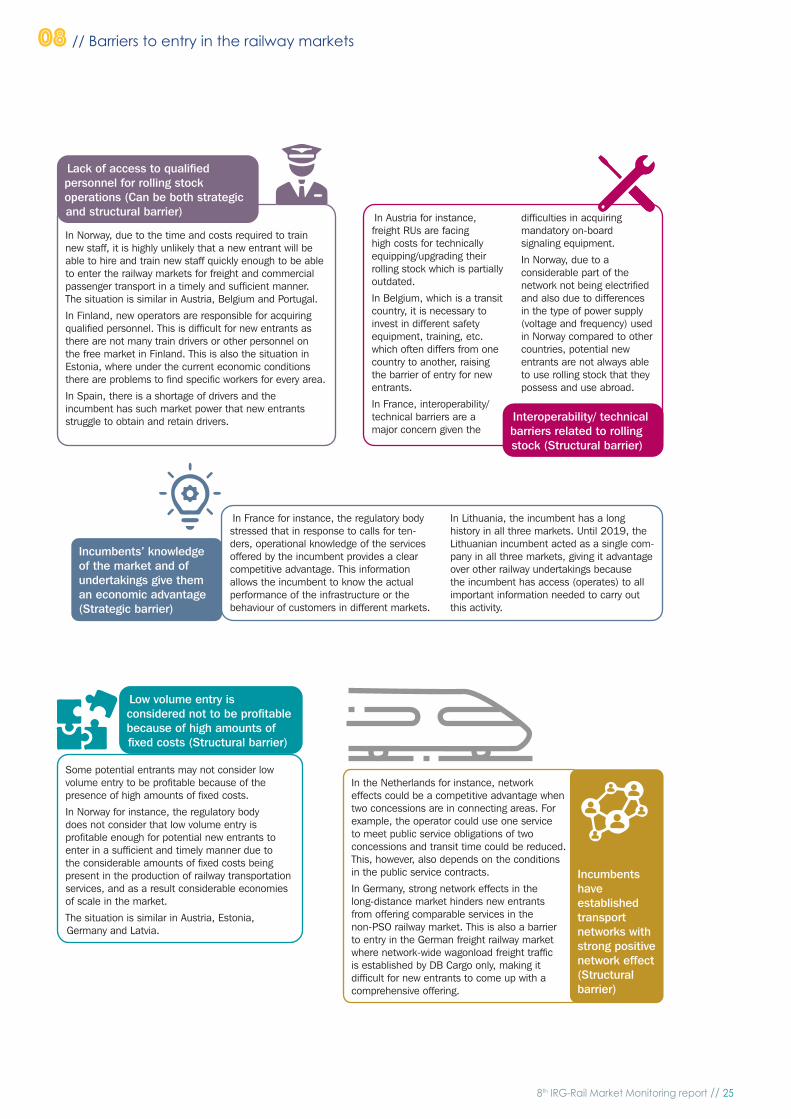
In Belgium for instance, it is estimated that rolling stock accounts for approximately 30% of all costs for railway undertakings.
In Germany, this barrier to entry is present in the PSO passenger railway market due to insecure financing structures for new entrants because of long tender processes (whereas banks do not hold up their credit offerings for such a long time). This problem is partly being solved in the German PSO market by introducing pools of rolling stock provided by the regional competent authorities or financing models provided by them.
In France, the barrier is present in the non-PSO railway market because it is not possible to rent open access trains via ROSCOs (Rolling stock leasing companies). On the other hand, in the French PSO railway market the rolling stock is owned by the regional competent authorities. In Austria, the freight railway market offers opportunities to lease or rent rolling stock (either at companies specialized on that or among each other), while there is almost no chance of doing so for passenger traffic.
In some IRG-Rail-countries, the initial cost of purchase of rolling stock is even higher because of differences in track gauge. In Finland for instance, new entrants need special rolling stock which is not easily available.
The situation is similar in Latvia, where there are problems for small entrants due to the very limited options for leasing of rolling stock within the 1,520 mm system.
In Lithuania, the biggest part of railway routes has 1,520 mm gauge, while only 152 km of the existing railway route length has the European standard gauge (1,435 mm). For this reason, RUs (especially from Western European Union countries) that would like to enter into the Lithuanian railway market would have to make a large initial investment in rolling stock.
In Spain, the special characteristics of the network used for freight transport (different track gauges, incomplete electrification, different voltages, different security systems) also increase the already high initial cost of purchase of rolling stock.
High initial cost of purchase of rolling stock (Structural barrier)
0 2 4 6 8 10 12 14 16
High initial cost of purchase of rolling stock
Lack of access to qualified personnel(rolling stock operations)
Interoperability/technical barriers(rolling stock)
Incumbents’ knowledge of the market and ofundertakings give them an economic advantage
Incumbents have established transport networkswith strong positive network effects
Low volume entry is considered not to be profitablebecause of high amounts of fixed costs
PSONon-PSOFreight
Number of RBs that consider this to be an entrybarrier in the indicated railway market
8th IRG-Rail Market Monitoring report // 25
08 // Barriers to entry in the railway markets
In Norway, due to the time and costs required to train new staff, it is highly unlikely that a new entrant will be able to hire and train new staff quickly enough to be able to enter the railway markets for freight and commercial passenger transport in a timely and sufficient manner. The situation is similar in Austria, Belgium and Portugal.
In Finland, new operators are responsible for acquiring qualified personnel. This is difficult for new entrants as there are not many train drivers or other personnel on the free market in Finland. This is also the situation in Estonia, where under the current economic conditions there are problems to find specific workers for every area.
In Spain, there is a shortage of drivers and the incumbent has such market power that new entrants struggle to obtain and retain drivers.
Lack of access to qualified personnel for rolling stock operations (Can be both strategic and structural barrier) In Austria for instance,
freight RUs are facing high costs for technically equipping/upgrading their rolling stock which is partially outdated.
In Belgium, which is a transit country, it is necessary to invest in different safety equipment, training, etc. which often differs from one country to another, raising the barrier of entry for new entrants.
In France, interoperability/ technical barriers are a major concern given the
difficulties in acquiring mandatory on-board signaling equipment.
In Norway, due to a considerable part of the network not being electrified and also due to differences in the type of power supply (voltage and frequency) used in Norway compared to other countries, potential new entrants are not always able to use rolling stock that they possess and use abroad.
Interoperability/ technical barriers related to rolling stock (Structural barrier)
In France for instance, the regulatory body stressed that in response to calls for ten-ders, operational knowledge of the services offered by the incumbent provides a clear competitive advantage. This information allows the incumbent to know the actual performance of the infrastructure or the behaviour of customers in different markets.
In Lithuania, the incumbent has a long history in all three markets. Until 2019, the Lithuanian incumbent acted as a single com-pany in all three markets, giving it advantage over other railway undertakings because the incumbent has access (operates) to all important information needed to carry out this activity.
Incumbents’ knowledge of the market and of undertakings give them an economic advantage (Strategic barrier)
Some potential entrants may not consider low volume entry to be profitable because of the presence of high amounts of fixed costs.
In Norway for instance, the regulatory body does not consider that low volume entry is profitable enough for potential new entrants to enter in a sufficient and timely manner due to the considerable amounts of fixed costs being present in the production of railway transportation services, and as a result considerable economies of scale in the market.
The situation is similar in Austria, Estonia, Germany and Latvia.
Low volume entry is considered not to be profitable because of high amounts of fixed costs (Structural barrier)
In the Netherlands for instance, network effects could be a competitive advantage when two concessions are in connecting areas. For example, the operator could use one service to meet public service obligations of two concessions and transit time could be reduced. This, however, also depends on the conditions in the public service contracts.
In Germany, strong network effects in the long-distance market hinders new entrants from offering comparable services in the non-PSO railway market. This is also a barrier to entry in the German freight railway market where network-wide wagonload freight traffic is established by DB Cargo only, making it difficult for new entrants to come up with a comprehensive offering.
Incumbents have established transport networks with strong positive network effect (Structural barrier)
26 // 8th IRG-Rail Market Monitoring report
09Direct competition in the
rail passenger market
INTRODUCTIONIn its previous Market Monitoring reports, IRG-Rail has examined the competition for the PSO passenger market, whether de jure or de facto open-access exists and the incumbents’ strategies to access rail passenger markets abroad. However, the above information does not indicate the existence and intensity of direct competition in the rail passenger market in Europe. By direct competition, we mean a competitive offer by at least two different RUs on a railway line resulting in the possibility for passengers to choose between these services. In this chapter, we therefore aim to check whether direct competition takes place in Europe, which can potentially be benefi cial for passengers.
Within this realm, a survey on the competitiveness in rail passenger transport on selected major lines was conducted in 29 IRG-Rail member countries.53 Given there may be a large number of lines where direct competition occurs, it has been agreed to limit the scope of this analysis to major lines only. The survey was conducted on the basis of data for 2018.54
53 In 2019, when the survey is conducted, there were 29 countries participating in the Market Monitoring data collection. Ireland and Serbia have joined the data collection later on.54 Data collected within the survey concern 2018. However in some countries, where there were issues retrieving data for 2018, data from 2019 were used.
8th IRG-Rail Market Monitoring report // 27
55 The survey also asked for ticket price information. However, the inconsistency of the collected data does not allow a proper analysis of this matter.
Methodology
09 // Direct competition in the rail passenger market
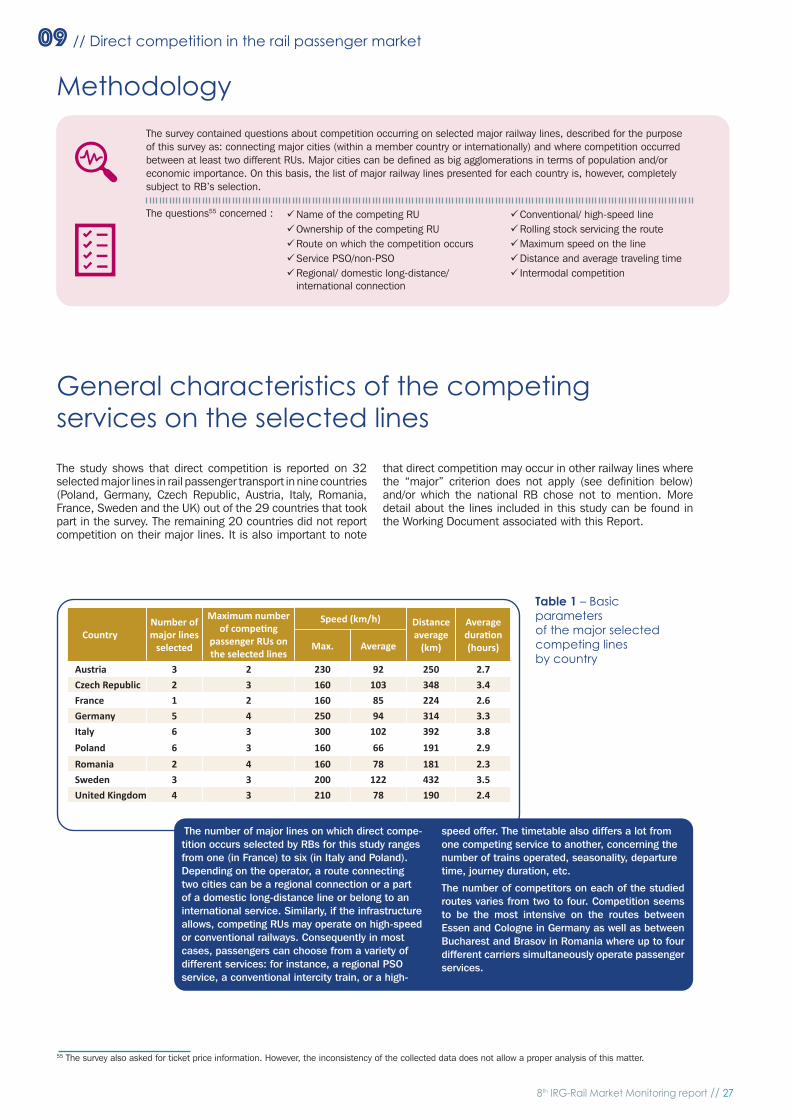
The survey contained questions about competition occurring on selected major railway lines, described for the purpose of this survey as: connecting major cities (within a member country or internationally) and where competition occurred between at least two different RUs. Major cities can be defi ned as big agglomerations in terms of population and/or economic importance. On this basis, the list of major railway lines presented for each country is, however, completely subject to RB’s selection.
The questions55 concerned :
General characteristics of the competing services on the selected lines
The study shows that direct competition is reported on 32 selected major lines in rail passenger transport in nine countries (Poland, Germany, Czech Republic, Austria, Italy, Romania, France, Sweden and the UK) out of the 29 countries that took part in the survey. The remaining 20 countries did not report competition on their major lines. It is also important to note
that direct competition may occur in other railway lines where the “major” criterion does not apply (see defi nition below) and/or which the national RB chose not to mention. More detail about the lines included in this study can be found in the Working Document associated with this Report.
Name of the competing RU Ownership of the competing RU Route on which the competition occurs Service PSO/non-PSO Regional/ domestic long-distance/
international connection
Conventional/ high-speed line Rolling stock servicing the route Maximum speed on the line Distance and average traveling time Intermodal competition
The number of major lines on which direct compe-tition occurs selected by RBs for this study ranges from one (in France) to six (in Italy and Poland). Depending on the operator, a route connecting two cities can be a regional connection or a part of a domestic long-distance line or belong to an international service. Similarly, if the infrastructure allows, competing RUs may operate on high-speed or conventional railways. Consequently in most cases, passengers can choose from a variety of different services: for instance, a regional PSO service, a conventional intercity train, or a high-
speed offer. The timetable also differs a lot from one competing service to another, concerning the number of trains operated, seasonality, departure time, journey duration, etc.
The number of competitors on each of the studied routes varies from two to four. Competition seems to be the most intensive on the routes between Essen and Cologne in Germany as well as between Bucharest and Brasov in Romania where up to four different carriers simultaneously operate passenger services.
Table 1 – Basic parameters of the major selected competing lines by country
CountryNumber of major lines
selected
Maximum number of competi ng
passenger RUs on the selected lines
Max. Average
Distance average
(km)
Average durati on (hours)
Austria 3 2 230 92 250 2.7Czech Republic 2 3 160 103 348 3.4France 1 2 160 85 224 2.6Germany 5 4 250 94 314 3.3Italy 6 3 300 102 392 3.8Poland 6 3 160 66 191 2.9Romania 2 4 160 78 181 2.3Sweden 3 3 200 122 432 3.5United Kingdom 4 3 210 78 190 2.4
Speed (km/h)
28 // 8th IRG-Rail Market Monitoring report
09 // Direct competition in the rail passenger market
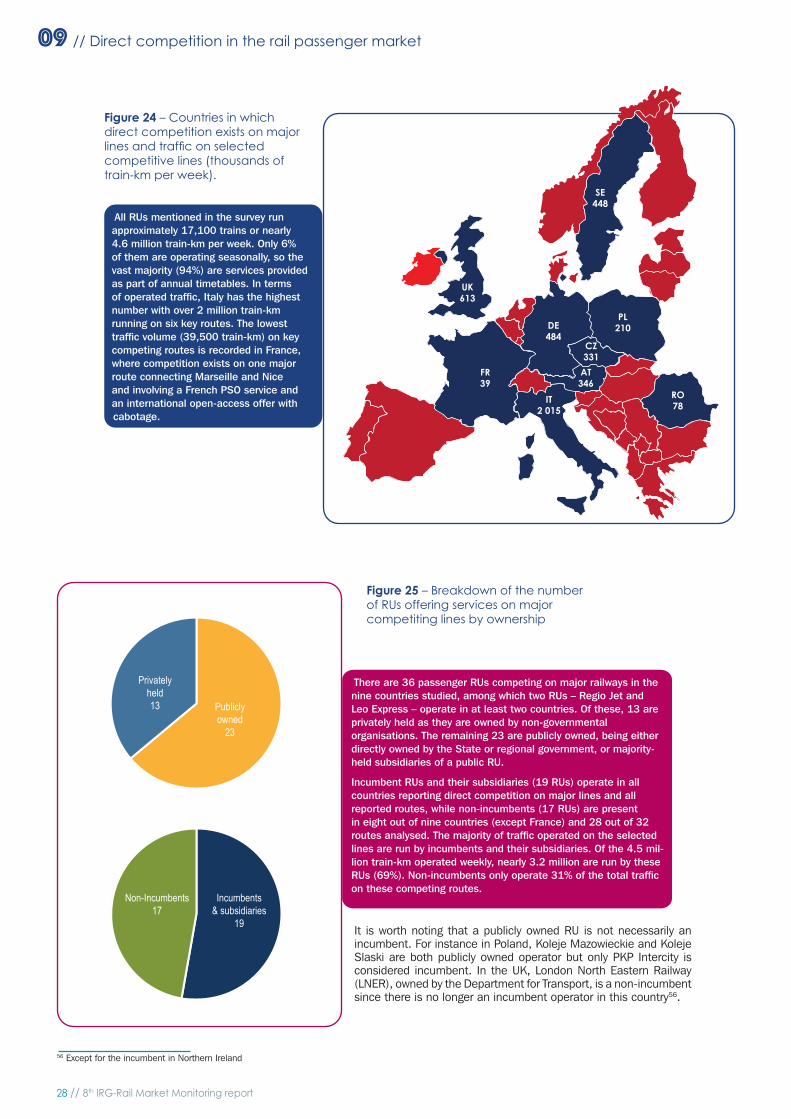
Figure 25 – Breakdown of the number of RUs offering services on major competiting lines by ownership
56 Except for the incumbent in Northern Ireland
All RUs mentioned in the survey run approximately 17,100 trains or nearly 4.6 million train-km per week. Only 6% of them are operating seasonally, so the vast majority (94%) are services provided as part of annual timetables. In terms of operated traffic, Italy has the highest number with over 2 million train-km running on six key routes. The lowest traffic volume (39,500 train-km) on key competing routes is recorded in France, where competition exists on one major route connecting Marseille and Nice and involving a French PSO service and an international open-access offer with cabotage.
Figure 24 – Countries in which direct competition exists on major lines and traffic on selected competitive lines (thousands of train-km per week).
FR39
DE484
PL210
RO78
IT2 015
UK613
SE448
CZ331
AT346
There are 36 passenger RUs competing on major railways in the nine countries studied, among which two RUs – Regio Jet and Leo Express – operate in at least two countries. Of these, 13 are privately held as they are owned by non-governmental organisations. The remaining 23 are publicly owned, being either directly owned by the State or regional government, or majority-held subsidiaries of a public RU.
Incumbent RUs and their subsidiaries (19 RUs) operate in all countries reporting direct competition on major lines and all reported routes, while non-incumbents (17 RUs) are present in eight out of nine countries (except France) and 28 out of 32 routes analysed. The majority of traffic operated on the selected lines are run by incumbents and their subsidiaries. Of the 4.5 mil-lion train-km operated weekly, nearly 3.2 million are run by these RUs (69%). Non-incumbents only operate 31% of the total traffic on these competing routes.
It is worth noting that a publicly owned RU is not necessarily an incumbent. For instance in Poland, Koleje Mazowieckie and Koleje Slaski are both publicly owned operator but only PKP Intercity is considered incumbent. In the UK, London North Eastern Railway (LNER), owned by the Department for Transport, is a non-incumbent since there is no longer an incumbent operator in this country56.
Publicly owned
23
Incumbents & subsidiaries
19
Privately held 13
Non-Incumbents17
8th IRG-Rail Market Monitoring report // 29
09 // Direct competition in the rail passenger market
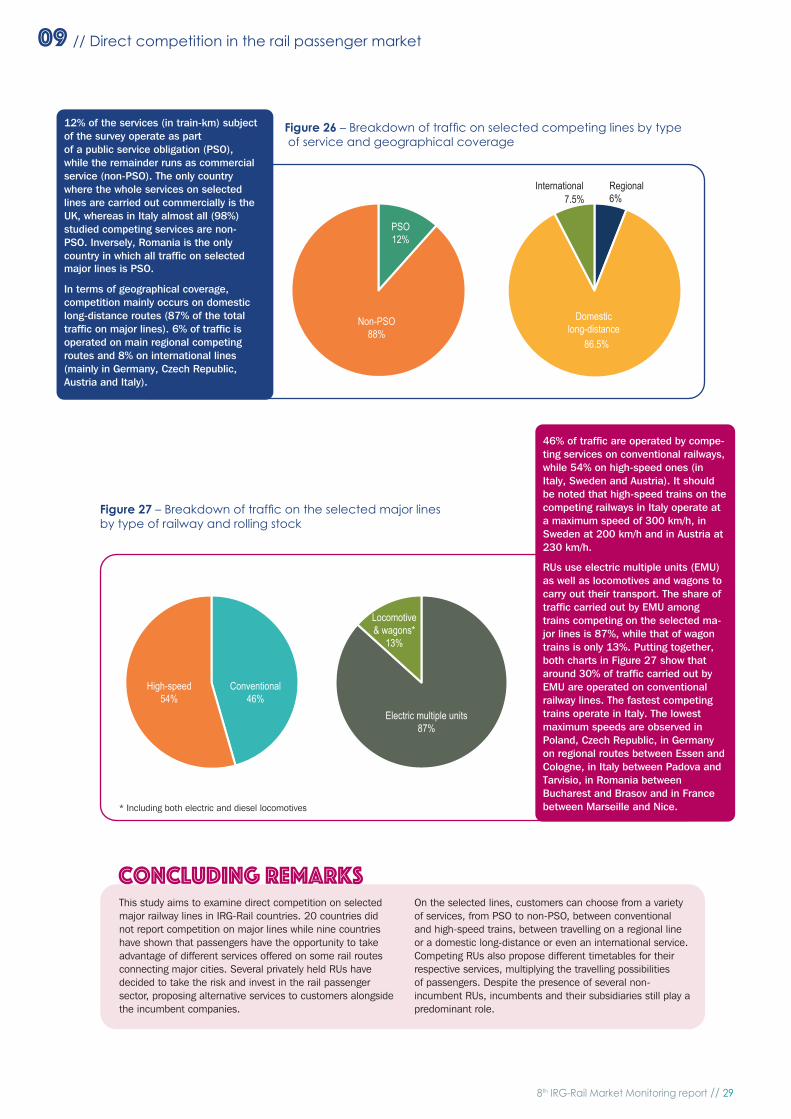
Figure 27 – Breakdown of traffi c on the selected major lines by type of railway and rolling stock
Concluding remarksThis study aims to examine direct competition on selected major railway lines in IRG-Rail countries. 20 countries did not report competition on major lines while nine countries have shown that passengers have the opportunity to take advantage of different services offered on some rail routes connecting major cities. Several privately held RUs have decided to take the risk and invest in the rail passenger sector, proposing alternative services to customers alongside the incumbent companies.
On the selected lines, customers can choose from a variety of services, from PSO to non-PSO, between conventional and high-speed trains, between travelling on a regional line or a domestic long-distance or even an international service. Competing RUs also propose different timetables for their respective services, multiplying the travelling possibilities of passengers. Despite the presence of several non-incumbent RUs, incumbents and their subsidiaries still play a predominant role.
46% of traffi c are operated by compe-ting services on conventional railways, while 54% on high-speed ones (in Italy, Sweden and Austria). It should be noted that high-speed trains on the competing railways in Italy operate at a maximum speed of 300 km/h, in Sweden at 200 km/h and in Austria at 230 km/h.
RUs use electric multiple units (EMU) as well as locomotives and wagons to carry out their transport. The share of traffi c carried out by EMU among trains competing on the selected ma-jor lines is 87%, while that of wagon trains is only 13%. Putting together, both charts in Figure 27 show that around 30% of traffi c carried out by EMU are operated on conventional railway lines. The fastest competing trains operate in Italy. The lowest maximum speeds are observed in Poland, Czech Republic, in Germany on regional routes between Essen and Cologne, in Italy between Padova and Tarvisio, in Romania between Bucharest and Brasov and in France between Marseille and Nice.* Including both electric and diesel locomotives
12% of the services (in train-km) subject of the survey operate as part of a public service obligation (PSO), while the remainder runs as commercial service (non-PSO). The only country where the whole services on selected lines are carried out commercially is the UK, whereas in Italy almost all (98%) studied competing services are non-PSO. Inversely, Romania is the only country in which all traffi c on selected major lines is PSO.
In terms of geographical coverage, competition mainly occurs on domestic long-distance routes (87% of the total traffi c on major lines). 6% of traffi c is operated on main regional competing routes and 8% on international lines (mainly in Germany, Czech Republic, Austria and Italy).
Figure 26 – Breakdown of traffi c on selected competing lines by type of service and geographical coverage
PSO12%
Non-PSO88%
Conventional46%
High-speed54%
Locomotive & wagons*
13%
Electric multiple units87%
Domestic long-distance
86.5%
International7.5%
Regional6%