eighth five year plan & annual plan - national
TRANSCRIPT
GOVERNMENT OF GUJARAT
EIGHTH FIVE YEAR PLAN1990-95
&ANNUAL PLAN
1991-92
NIEPA DC
D05S63
GENERAL ADMINISTRATION DEPARTMENT
(PLANNING)
Sachivalaya, Gandhinagar-382010
September-1990
S / ->h i
Qi6 ' t2iub. NatioT ul :.v t-,- =§ Unit,
N itionai i H: . 1 Educationtl .\
P la D n in ^ a ' d rytion
00»'v . •••* •••M« «M a<3« M * PM M» a• • M« M
MAP No.I
67 68 6 9 7 0 71 72 '' 73 7 4
24
2f
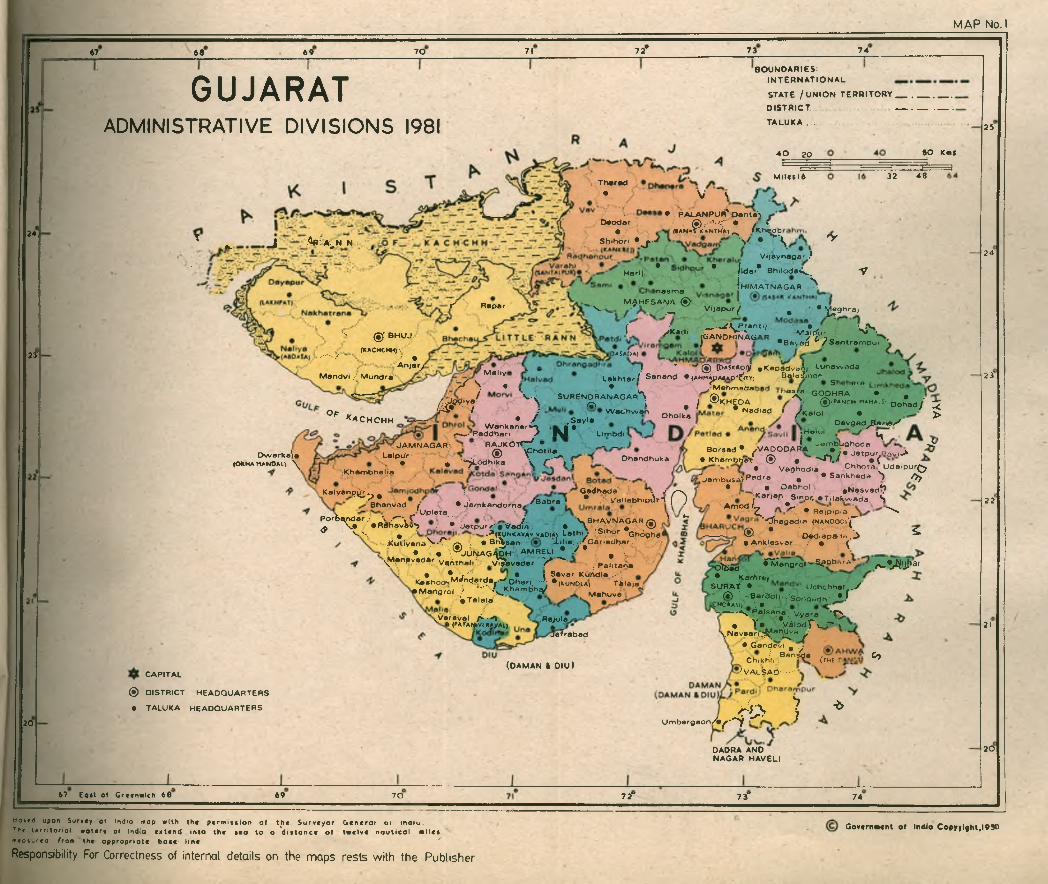
GUJARATADMINISTRATIVE DIVISIONS 1981
BOUNOARieS;INTERNATIONALSTATE / u ni on t e r r i t o r y___________DISTRICT ----------- ----------TALUKA..............
...Th«f«d
• V N
4 0 20 8 0 Km f
7 -r^ -T ^M ilc » l6 32 4 8
• • . P A iA N P U ^ O a n ta SD aodar ® r ' - < • / \• . •, (•an«5k*nth>» iKh^b
^ ^ J ^Api^A^N N : . S h .ho r, • J . v \ / * . 'S ^
V .ja y n a g a r .»
■ H a r.,/ • • . / id a r * B h , .o d a < . ^
■ I h i m a t n a g a r >M ^ H E s rN T $ >
• K R a pa r ^ ^ y „ 3 p ^ , ^ ^ - « l ^ 9 hra ,
( >.». jr-±S-?.":i'i v:.Vur ■• ■.'■? ® ‘ b h u j .(**CHCMM)V
- .... - ‘’ ■ CA n jaiy
M andvi / M u n d ra '
iy!3ic<L• B o y a ^ ^ ^ S a n t ra m p u r '.
Op'^ACHCHH
}«SAr>A)
M a liy * "
^ N • V_ / v .-^ s u r 6 n o r a n a g a r ' ^
/i'JC9'Y®- N r>, ii i ^ i ' I r W a o h w a n
• / .S a y la rW an ka n ar*-^ ■ • :
»-—• R a d d b a n y l \ l L im b d i
jC A N O H lN A G
! * ® (bASKHOiy *K a p A d va A j Lunaw ,odaL a k h ta r / S a nand • (amm^ a* ad*?Ity) B ^ ld iJ n io r• -MohmertAl
• / God I r a " ’®D h o lka
KH ED A • N a d ia d
n a ^ o g O D H R A • »> ® 'P * nch maha.S, D o h a d / 5
• / K a lo l • >
O w a rka W (OKHA MANOAI1 \ j'J A M N A G A R - ” R A J K O T T ^ • - _
LaipJr • ® >p^>otii^• • ■ '^ o d h 'k a \ r I i
K a ly a n p i^ ^ ^ I G adhada
B h anvad f • J ism ka n d o rn a
D e vgad a r ^ y
O handhu ka
rK h a m b h a lia
OflOr>OOB- . y y"'“>v/ 8 a b r a » * ' V a l la b h ip i i r ' l [ )
P o r f e ^ a r . ' V .< ^ \C ^ / V B H A V InJa G a r ^ ' *“A \ # • R a h a v a v 'j .■ • J e tp .u r / '« V a d in .: • V . W t. • ®^ 'O s : ^ .*(KUNKavavvadiA> L a th i.* '5 '™ r
'U p le t'a
■ X u liy a n a N '^ . /J \ > • B ^ ^ sa n• • M j u n a g a d h
^ .a n ^y ? » d « r v ^ rtth a l^ - • ^ -
i t T a la la
20
^^Veraval /■•>»*> (PATANtvlujyAi)
(KUNKAVAV vaDiA) L a th iy ■ *G hdgha<'i . i l ia / . /G a r ia d h a r . . '
A M R E tl • / * ■ ^ ',.V ija v a d a r ' X ^ ; , P a l.ta n a
S a va r Kuvid la .• ; ,T fc la ja j
. M ahw va '
|noioi ^^ _ • JcimbljQhoda '-iz
B o^sad • ^ V ^ O D A R A _ • , J e tp u r ^ a v i- *• KharPbhe> ® « >0./ • i• v a g h o d .a C h h p ta U d a .p u r(^
T ja m b u sa V P a d ra , • S a nkheda ^ />^• • O a b h o i, .N a s v a d t?
jK a r ja p S in pr, a r i l a k w a d a S A m o d L V .
2 . • R a ip ip la ^- ^ a o a c ^ ia (NANOOO,f
® D ^ ia p a . (-..!> ^• A n k le s v a r . • ^
• • . . j ' C ^ • I S a va r KuViK a s h o d ^ '^ « " ‘ ‘»'’< i« |-~ ' Dhart... - ’ • • ( k u nOla)
» M a n O i6 l , / - / ^ K h a m b h y
<Xiangrol-5 9 "' /s^^'Jpar
.Rajol^ ftja f ra b a d
o W d• KafrrtrfejS U R A t • ' , U c h c h h a l - . /• (S) ::;-Bara6l.../sonqodh- •/fHCMSi^: V#
- . - k ^ Palsap^ay ^ y a ra ’ T >• Y » . V i lO d r 'v ; ~ »
CAPITAL
® DISTRICT HEAD Q U ARTERS
• TALUKA h e a d q u a r t e r s
(DAMAN t OIU)
Y N a v » a n . '^ ® * 'j^ « ^ • G andevi
C h ikK li7 B ^ ^ 4 a Chli ; (iHE ^^v a l s a o -
V i'S ? ■*’Umbergaon^^*'^
OADRA AND NAGAR HAVELI
25
24
23'
22
21
20
67 Eost of G rccnw lch 66 69 70 7 2 - 73 '' 74
Bo i«d upon Survey o f Indio mop w ith the p c r m iit fo n o f t j> t S u rveyo r C icncra l o i in o iu .T^» le r r i to r io l w a te r* of Indio ex tend in to the te a to o 'd it to n e e o f tw e lve n a u t ic a l m ile i i»»o iu rcfl f rom the a p p ro p ria te b a te lin e . '
Responsibility For Correctness of internal details on the nnaps rests with the Publisher
Govcrnacnt o f Indio Copyrl9ht.l9S0
PREFACE
This publication, containing the pxx>posals for the Eighth Five Year Plan 1990- 955 and ;he proposals included in the Annual Plan 1991-92, has been prepared in accord-l- ance with the guidelines of the Planning Commission communicated under letter N od: PC/(P)l/8/l/90 of the 5th June 1990.
The proposals for the Eighth.Five Year Plan have emerged after detailed discussiconn within the sectoral departments in meetings of Steering Groups and Working Groups j. These proposals, prepared on the basis of the reports of these Steering Groups, haivee been discussed in a series of official level meetings under the Chairmanship of the Chiiefef Secretary. These proposals reflect the priorities indicated in the Approach Pap>err approved by the National Development Council in June,1990.
The proposals for the Annual Plan 1991-92 have been prepared in the context of t^6|^ draft Eighth Five Year plan and the level of outlays provided in the Annual Plan tfbrr 1990-91 and the new directions of the present Government.
Owing to the short time available it has not been possible to incorporate in tbii^ document detailed write-up for each sector and sub-sector. However, concerned depajrt*t- ments of the State Government have been advised to send these documents directly too the concerned divisions in the Planning Commission, concerned Ministries and t^ee Working Groups concerned.
A cartographic presentation of the current status of various sectors of developm^niit may be found in separate volume ^Economic Developm ent through Maps* puib> lished in September 1990.
Slonal In«.tute <>f Fduca«oua Pbpnin, a-'d
DOC. No.. .... .....
DRAFT EIGHTH FIVE YEAR PLAN 1990-95 A N D
ANNUAL PLAN 1991-92 CONTENTS
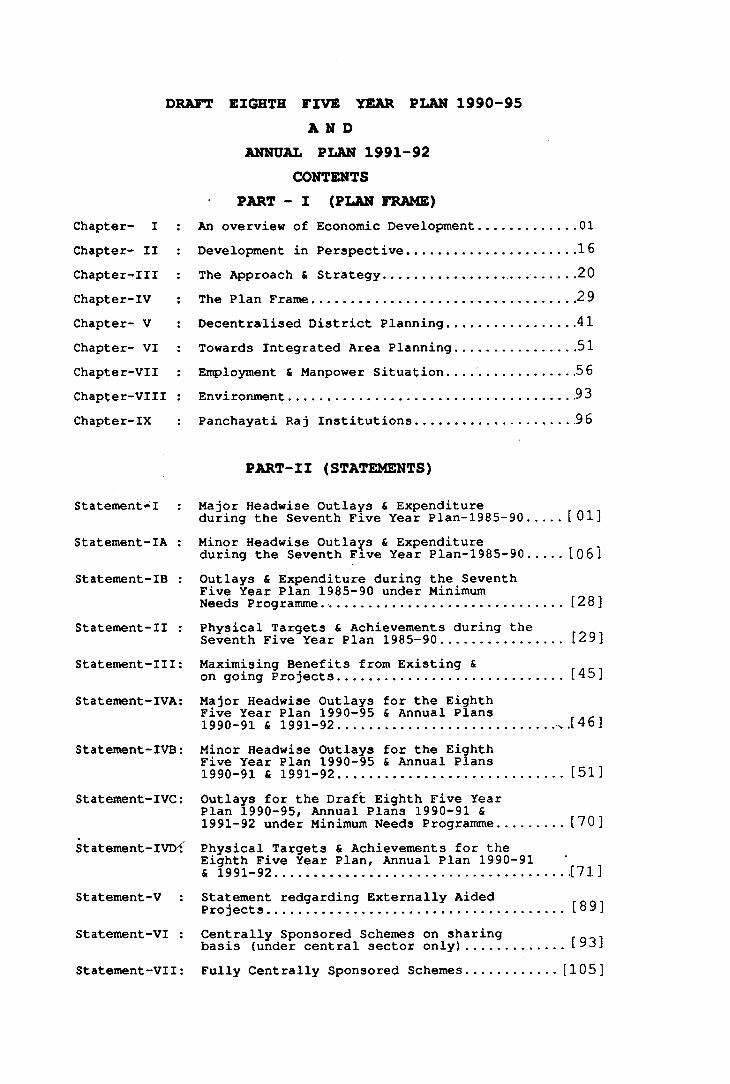
PART - I (PLAN FRAME)Chapter- I ; An overview of Economic Development.............01Chapter- II : Development in Perspective..................... 16Chapter-Ill : The i^proach & Strategy.............. . . ...... 20Chapter-IV ; The Plan Frame................................ 2 9Chapter- V : Decentralised District Planning................ 41Chapter- VI : Towards Integrated Area Planning..... ..........51Chapter-VII : Employment & Manpower Situation................ ,56Chapter-VIII : Environment................................... .93Chapter-IX : Panchayati Raj Institutions.................... 96
PART-II (STATEMENTS)Statement** I :
Statement-lA :
Statement-IB :
Statement-II :
Statement-Ill:
Statement-IVA;
Statement-IVB:
Statement-IVC:
Statement-IVDi
Statement-V :
Statement-VI :
Statement-VII:
Major Headwise Outlays & Expenditure during the Seventh Five Year Plan-1985-90Minor Headwise Outlays & Expenditure during the Seventh Five Year Plan-1985-90Outlays & Expenditure during the Seventh Five Year Plan 1985-90 under Minimum Needs Programme........................Physical Targets & Achievements during the Seventh Five Year Plan 1985-90..........Maximising Benefits from Existing & on going Projects................Major Headwise Outlays for the Eighth Five Year Plan 1990-95 & Annual Plans 1990-91 & 1991-92......................... .Minor Headwise Outlays for the Eighth Five Year Plan 1990-95 & Annual Plans1990-91 & 1991-92..........................Outlays for the Draft Eighth Five Year Plan 1990-95, Annual Plans 1990-91 &1991-92 under Minimum Needs Programme.Physical Targets & Achievements for the Eighth Five Year Plan, Annual Plan 1990-91& 1991-92..............................Statement redgarding Externally Aided Projects...............................Centrally Sponsored Schemes on sharing basis (under central sector only).......Fully Centrally Sponsored Schemes
[ 01]
1061
[28]
[29]
[45]
.[46]
[51]
[70]
.[71]
[89]
[93]105]
CHAPTER-I AN OVERVIEW OF DEVELOPMENT
AREA AMD POPULATION
1.1 GCJJARAT State has an area of 196024 Sq. kms - 5.96 percent of that of the Indian Union. Its population according to the 1981 census is 3.41 crores/ forming 4.97 percent of the Country's population and is predominantly rural - 68.90 percent. The aver age density of population is 17 4 per sq.km. The Scheduled Castes account for 7.15 percent and the Scheduled Tribes for another 14.23 percent of the total population of 3.41 crores, according to the 1981 census. The size of the main working force (1981) in the State is 109.84 lakhs. Agriculture provides employment to60.11 percent of the working population, while a further 39.89 percent are engaged in household and other occupations.
1.2 The State is divided into 19 districts. The districts are further divided into Talukas, numbering 184 in all.
LAND UTILISATION
1.3 According to the season and crop report, out of a total reporting area of 188 lakh hectares in the State, about 97 lakh hectares (51 percent) of the land is under plough.
GROWTH RATE
1.4 The State Domestic Product (SDP) of Gujarat during 1970-81 has grown at an average annual rate of 4.7 percent, as compared to 3.6 percent for the National economy. The State economy has grown at the rate of 5 percent for the period 1974-85, as against the All India average of 4.2 percent.1.5 With normal rainy seasons in the last two years of the Seventh Plan, the State economy is expected to achieve the targeted annual growth rate of 5 percent.
STRUCTURAL CHANGES IN THE ECONOMY
1.6 The rate of growth of SDP in various sectors of the economy in the last three decades is given below.
1
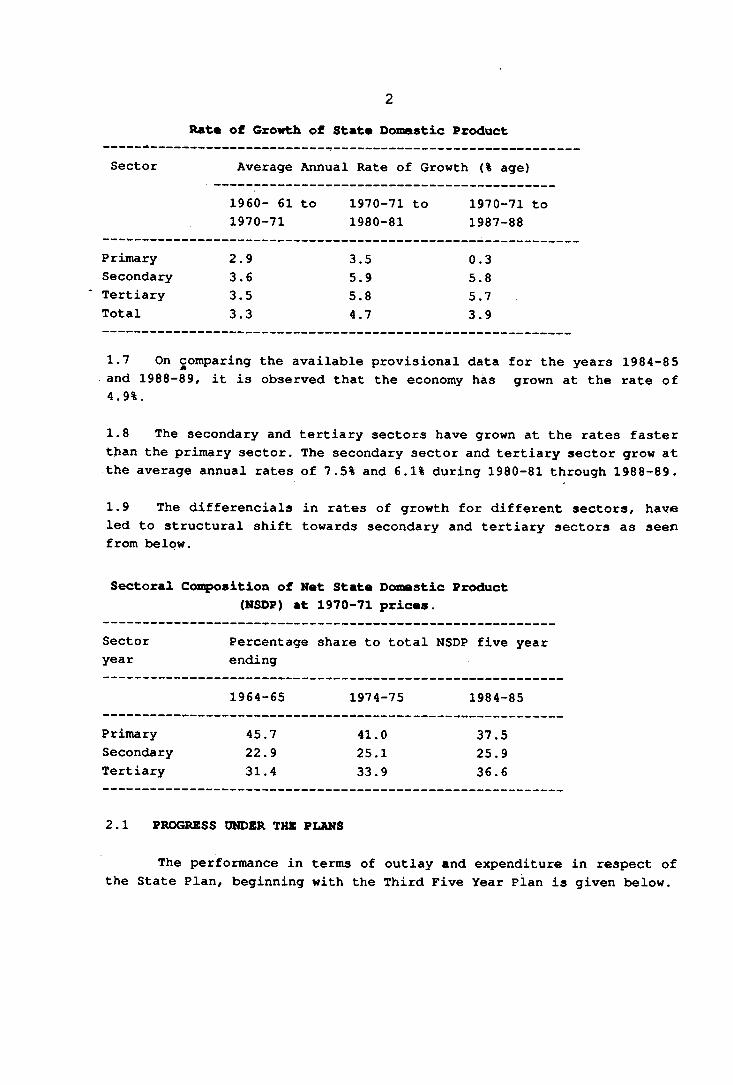
Rat* of Growth of Stattt Domestic Product
Sector Average Annual Rate of Growth {% age)
1960- 61 to 1970-71
1970-711980-81
to 1970-71 to 1987-88
Primary 2.9 3.5 0.3Secondary 3.6 5.9 5.8Tertiary 3.5 5.8 5.7Total 3.3 4.7 3.9
1.7 On comparing the available provisional data for the years 1984-8 5 and 1988-89, it is observed that the economy has grown at the rate of4.9%.
1.8 The secondary and tertiary sectors have grown at the rates faster than the primary sector. The secondary sector and tertiary sector grow at the average annual rates of 7.5% and 6.1% during 1980-81 through 1988-89.
1.9 The differencials in rates of growth for different sectors, have led to structural shift towards secondary and tertiary sectors as seen from below.
Sectoral Conposition of Net State Domestic Product(NSDP) at 1970-71 prices
Sectoryear
Percentageending
share to total NSDP five year
1964-65 1974-75 1984-85
Primary 45.7 41.0 37.5Secondary 22.9 25.1 25.9Tertiary 31.4 33.9 36.6
2.1 PROGRESS UNDER THE PLANS
The performance in terms of outlay and expenditure in respect of the State Plan, beginning with the Third Five Year Plan is given below.
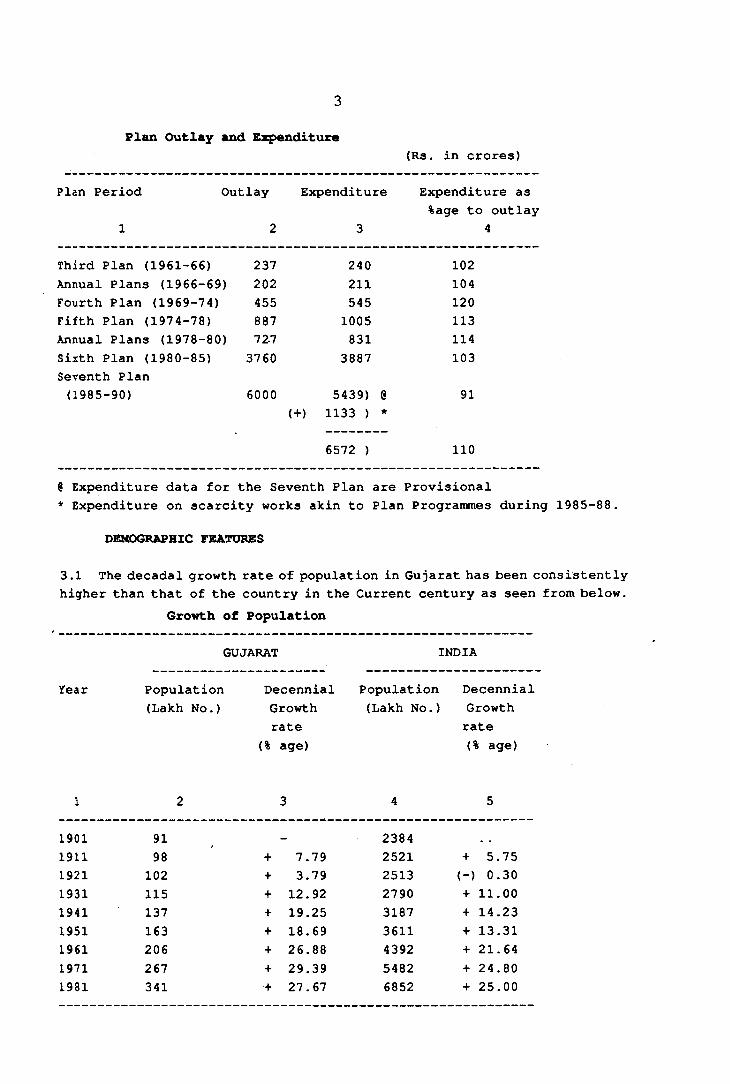
Plan Outlay and Eacpenciiture(Rs. in crores)
Plan Period Outlay Expenditure
1 2 3
Third Plan (1961-66) 237 240 102Annual Plans (1966-69) 202 211 104Fourth Plan (1969-74) 455 545 120Fifth Plan (1974-78) 887 1005 113Annual Plans (1978-80) 727 831 114Sixth Plan (1980-85) 3760 3887 103Seventh Plan(1985-90) 6000 5439) 0 91
(+) 1133 ) *
Expenditure as %age to outlay
4
6572 ) 110
0 Expenditure data for the Seventh Plan are Provisional * Expenditure on scarcity works akin to Plan Programmes during 1985-88.
DEMOGRAPHIC FEATURES
3.1 The decadal growth rate o± population in Gujarat has been consistently higher than that of the country in the Current century as seen from below.
Growth of Population
GUJARAT INDIA
Year Population Decennial Population Decennial(Lakh No.) Growth (Lakh No.) Growth
rate rate(% age) (% age)
1 2 3 4 5
1901 91 — 23841911 98 + 7.79 2521 + 5.751921 102 + 3.79 2513 (-) 0.301931 115 + 12.92 2790 + 11.001941 137 + 19.25 3187 + 14.231951 163 + 18.69 3611 + 13.311961 206 + 26.88 4392 + 21.641971 267 + 29.39 5482 + 24.801981 341 ■+ 27.67 6852 + 25.00
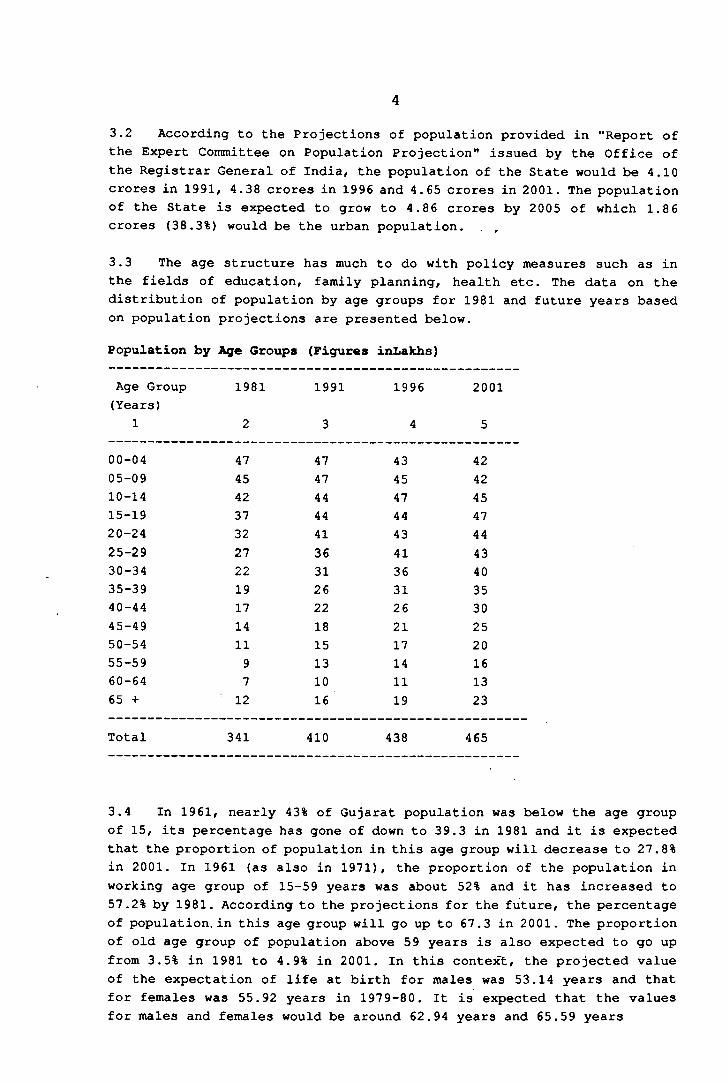
3.2 According to the Projections of population provided in "Report of the Expert Committee on Population Projection" issued by the Office of the Registrar General of India, the population of the State would be 4.10 crores in 1991, 4.38 crores in 1996 and 4.65 crores in 2001. The population of the State is expected to grow to 4.86 crores by 2005 of which 1.8 6 crores (38.3%) would be the urban population. . ,
3.3 The age structure has much to do with policy measures such as in the fields of education, family planning, health etc. The data on the distribution of population by age groups for 1981 and future years based on population projections are presented below.
Population by Age Groups (Figures inLakhs)
Age Group (Years)
1
1981
2
1991
3
1996
4
2001
5
00-04 47 47 43 4205-09 45 47 45 4210-14 42 44 47 4515-19 37 44 44 4720-24 32 41 43 4425-29 27 36 41 4330-34 22 31 36 4035-39 19 26 31 3540-44 17 22 26 3045-49 14 18 21 2550-54 11 15 17 2055-59 9 13 14 1660-64 7 10 11 1365 + ’ 12 16 19 23
Total 341 410 438 465
3.4 In 1961, nearly 43% of Gujarat population was below the age group of 15, its percentage has gone of down to 39.3 in 1981 and it is expected that the proportion of population in this age group will decrease to 27.8% in 2001. In 1961 (as also in 1971), the proportion of the population in working age group of 15-59 years was about 52% and it has increased to 57.2% by 1981. According to the projections for the future, the percentage of population, in this age group will go up to 67.3 in 2001. The proportion of old age group of population above 59 years is also expected to go up from 3.5% in 1981 to 4.9% in 2001. In this conte^, the projected value of the expectation of life at birth for males was 53.14 years and that for females was 55.92 years in 197 9-80. It is expected that the values for males and females would be around 62.94 years and 65.59 years
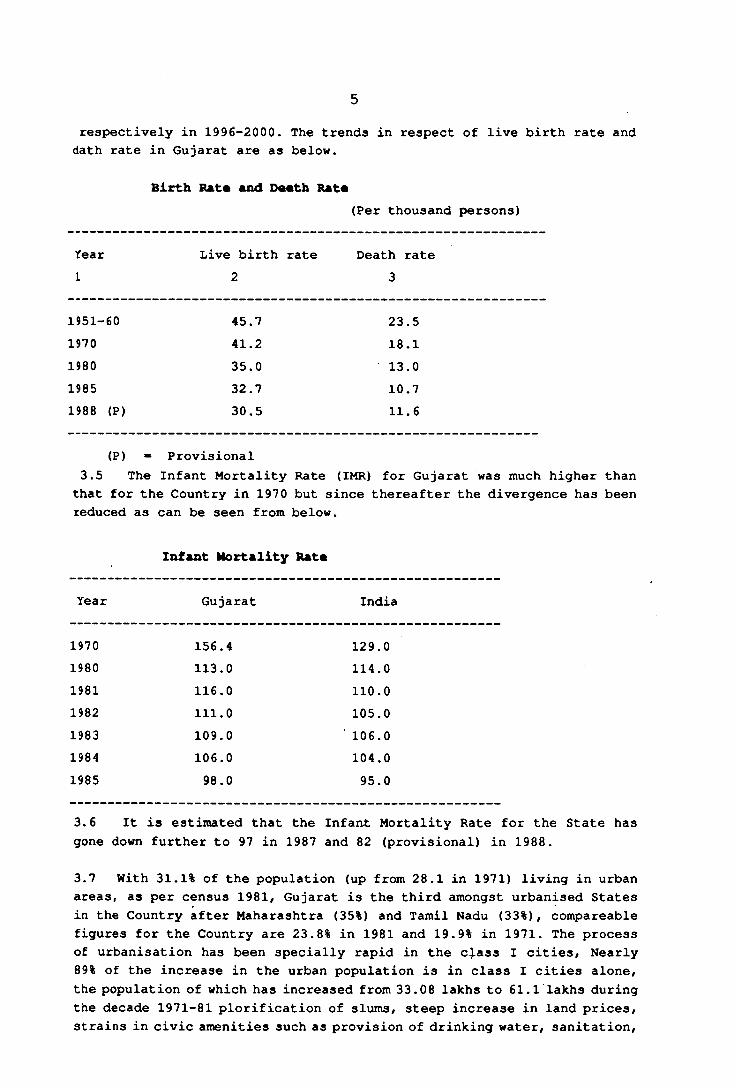
respectively in 1996-2000. The trends in respect of live birth rate and dath rate in Gujarat are as below.
Birth Rat« and Death Rat*(Per thousand persons)
Year Live birth rate Death rateL 2 3
1951-60 45.7 23.51970 41.2 18.11980 35.0 13.01985 32.7 10.71988 (P) 30.5 11.6
(P) * Provisional3.5 The Infant Mortality Rate (IMR) for Gujarat was much higher than that for the Country in 1970 but since thereafter the divergence has been reduced as can be seen from below.
Infant Mortality Rata
Year Gujarat India
1970 156.4 129.01980 113.0 114.01981 116.0 110.01982 111.0 105.01983 109.0 ■ 106.01984 106.0 104.01985 98.0 95.0
3.6 It is estimated that the Infant Mortality Rategone down further to 97 in 1987 and 82 (provisional) ii
3.7 With 31.1% of the population (up from 28.1 in 1971) living in urban areas, as per census 1981, Gujarat is the third amongst urbanised States in the Country after Maharashtra (35%) and Tamil Nadu (33%), compareable figures for the Country are 23.8% in 1981 and 19.9% in 1971. The process of urbanisation has been specially rapid in the class I cities, Nearly 89% of the increase in the urban population is in class I cities alone, the population of which has increased from 33.08 lakhs to 61.1 lakhs during the decade 1971-81 plorification of slums, steep increase in land prices, strains in civic amenities such as provision of drinking water, sanitation.
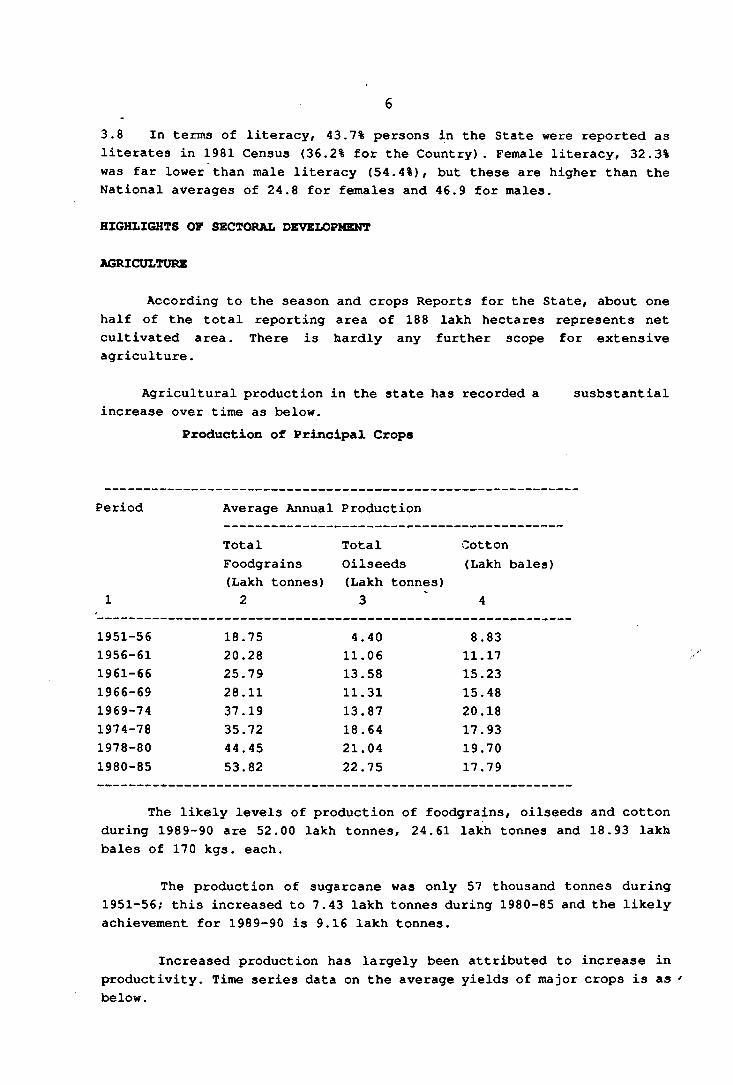
3.8 In terms of literacy, 43.7% persons in the State were reported as literates in 1981 Census (36.2% for the Country). Female literacy, 32.3% was far lower than male literacy (54.4%), but these are higher than the National averages of 24.8 for females and 46.9 for males.
HIGHLIGHTS OF SECTORAL DEVELOPMENT
AGRICULTURE
According to the season and crops Reports for the State, about one half of the total reporting area of 188 lakh hectares represents net cultivated area. There is hardly any further scope for extensive agriculture.
Agricultural production in the state has recorded a increase over time as below.
Production of Principal Crops
susbstantial
Period
1
Average Annual Production
TotalFoodgrains (Lakh tonnes) 2
Total Oilseeds (Lakh tonnes) 3
Cotton (Lakh bales)
4
1951-56 18.75 4.40 8.831956-61 20.28 11.06 11.171961-66 25.79 13.58 15.231966-69 28.11 11.31 15.481969-74 37.19 13.87 20.181974-78 35.72 18.64 17.931978-80 44.45 21.04 19.701980-85 53.82 22.75 17.79
The likely levels of production of foodgrains, oilseeds and cotton during 1989-90 are 52.00 lakh tonnes, 24.61 lakh tonnes and 18.93 lakh bales of 170 kgs. each.
The production of sugarcane was only 57 thousand tonnes during 1951-56; this increased to 7.43 lakh tonnes during 1980-85 and the likely achievement for 1989-90 is 9.16 lakh tonnes.
Increased production has largely been attributed to increase in productivity. Time series data on the average yields of major crops is as below.
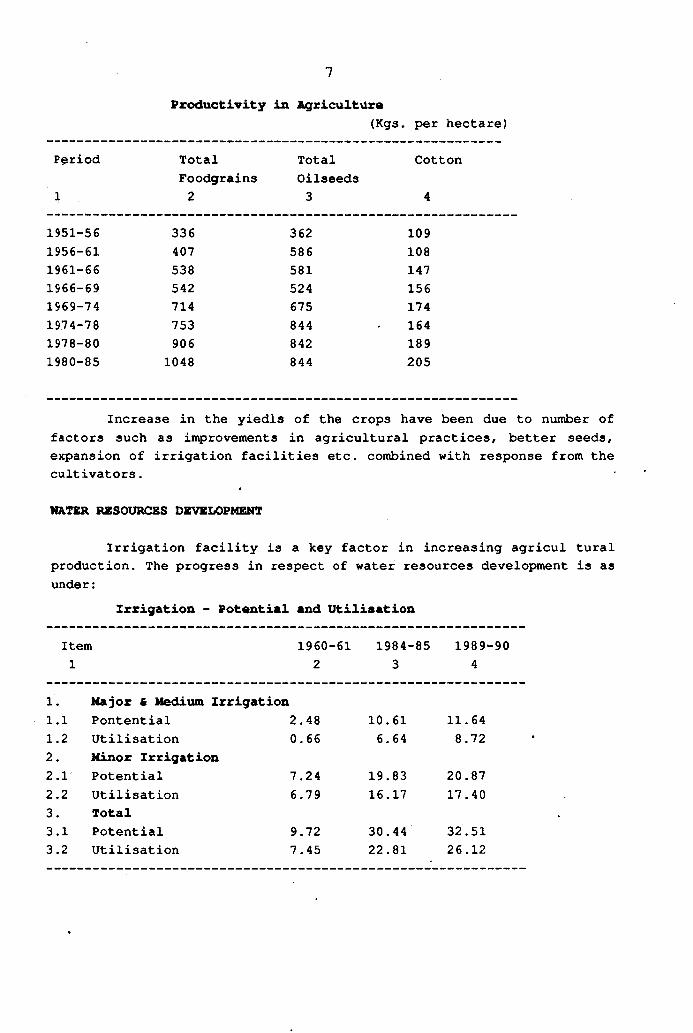
period
Productivity in Agriculture(Kgs. per hectare)
TotalFoodgrains
TotalOilseeds
Cotton
1 2 3 4
1951-56 336 362 1091956-61 407 586 1081961-66 538 581 1471966-69 542 524 1561969-74 714 675 1741974-78 753 844 1641978-80 906 842 1891980-85 1048 844 205
Increase in the yiedls of the crops have been due to number offactors such as improvements in agricultural practices, better seeds.expansion of irrigation facilities etc . combined with response from thecultivators.
WATER RESOURCES DEVELOPMENT
Irrigation facility is a key factor in increasing agricul tural production. The progress in respect of water resources development is as under:
Irrigation - Potential and Utilisation
Item 1960-61 1984-85 1989-901 2 3 4
1. Major 6 Medium Irrigation1.1 Pontential 2.48 10.61 11.641.2 Utilisation 0.66 6.64 8.722. Minor Irrigation2.1 Potential 7.24 19.83 20.872.2 Utilisation 6.79 16.17 17.403. Total3.1 Potential 9.72 30.44 32.513.2 Utilisation 7.45 22.81 26.12
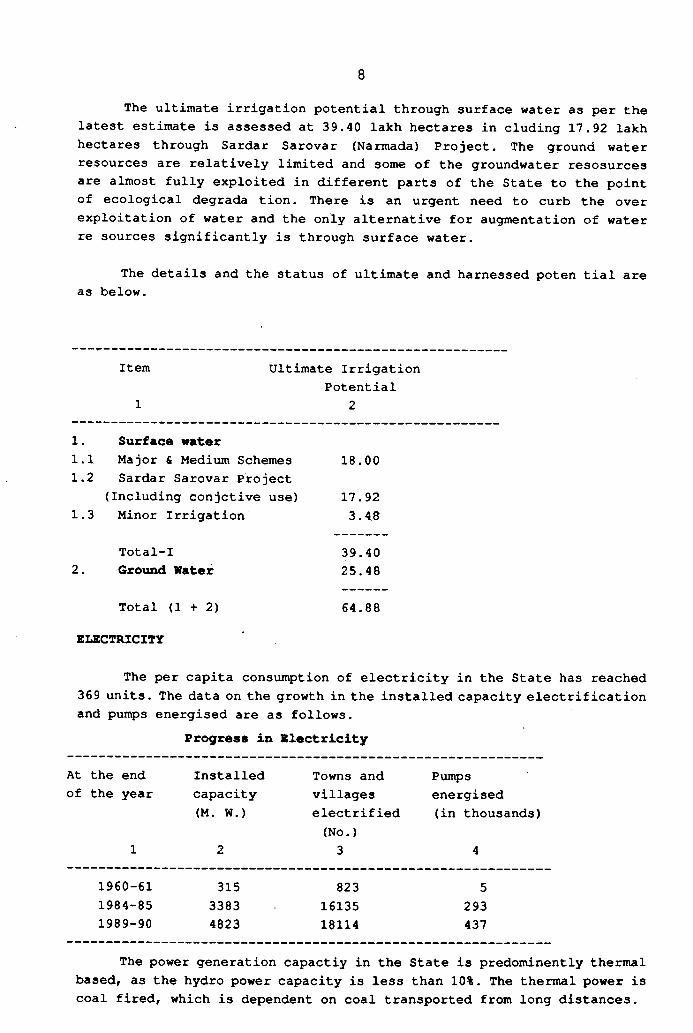
The ultimate irrigation potential through surface water as per the latest estimate is assessed at 39.40 lakh hectares in eluding 17.92 lakh hectares through Sardar Sarovar (Narmada) Project. The ground water resources are relatively limited and some of the groundwater resosurces are almost fully exploited in different parts of the State to the point of ecological degrada tion. There is an urgent need to curb the over exploitation of water and the only alternative for augmentation of water re sources significantly is through surface water.
The details and the status of ultimate and harnessed poten tial are as below.
8
Item Ultimate Irrigation Potential
2
1. Surface water1.1 Major & Medium Schemes 18.001.2 Sardar Sarovar Project
(Including conjctive use) 17.921.3 Minor Irrigation 3.48
Total-I 39.402. Ground Water 25.48
Total (1+2) 64.88
ELECTRICITY
The per capita consumption of electricity in the State has reached 369 units. The data on the growth in the installed capacity electrification and putt s energised are as follows.
Progress in Electricity
At the end of the year
1
Installed capacity (M. W.)
2
Towns and villages electrified (No.)3
Punqpsenergised(in thousands)
4
1960-61 315 823 51984-85 3383 16135 2931989-90 4823 18114 437
The power generation capactiy in the State is predominently theirmal based, as the hydro power capacity is less than 10%. The thermal power is coal fired, which is dependent on coal transported from long distances.
IMDUSTRY
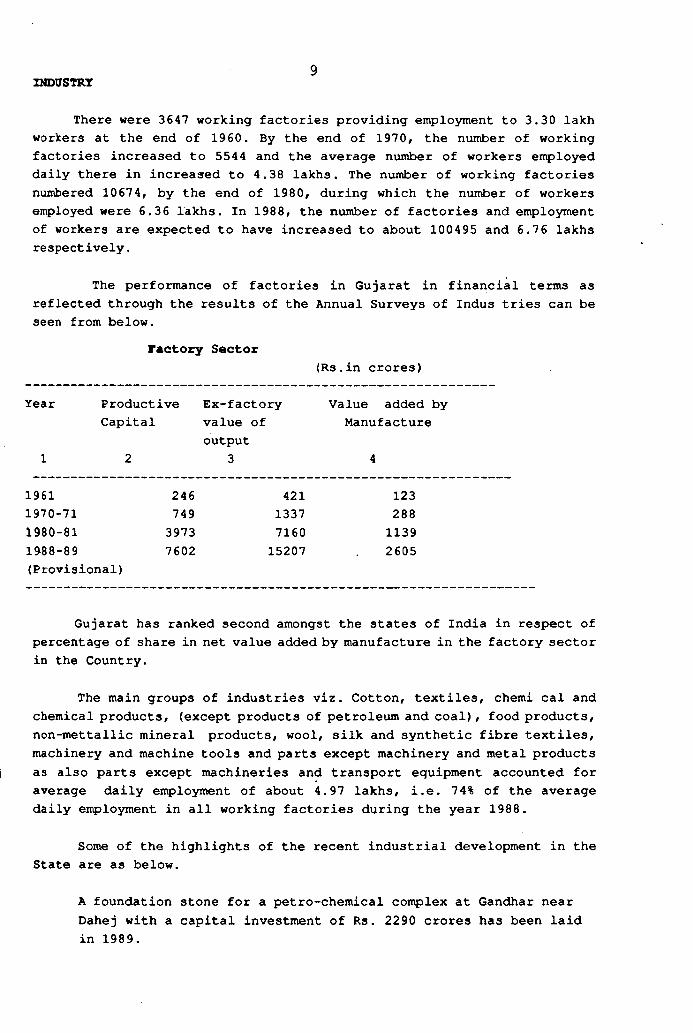
There were 3647 working factories providing employment to 3.30 lakh workers at the end of 1960. By the end of 1970, the number of working factories increased to 5544 and the average number of workers employed daily there in increased to 4.38 lakhs. The number of working factories numbered 1067 4, by the end of 1980, during which the number of workers eirployed were 6.36 lakhs. In 1988, the number of factories and employment of workers are expected to have increased to about 100495 and 6.76 lakhs respectively.
The performance of factories in Gujarat in financial terms as reflected through the results of the Annual Surveys of Indus tries can be seen from below.
Factory Sector(Rs.in crores)
Year ProductiveCapital
Ex-factory value of output
3
Value added by Manufacture
1961 2461970-71 7491980-81 39731988-89 7602(Provisional)
4211337716015207
12328811392605
Gujarat has ranked second amongst the states of India in respect of percentage of share in net value added by manufacture in the factory sector in the Country.
The main groups of industries viz. Cotton, textiles, chemi cal and chemical products, (except products of petroleum and coal), food products, non-mettallic mineral products, wool, silk and synthetic fibre textiles, machinery and machine tools and parts except machinery and metal products as also parts except machineries and transport equipment accounted for average daily employment of about 4.97 lakhs, i.e. 7 4% of the average daily errployment in all working factories during the year 1988 .
Some of the highlights of the recent industrial development in the State are as below.
A foundation stone for a petro-chemical conplex at Gandhar near Dahej with a capital investment of Rs. 2290 crores has been laid in 1989.
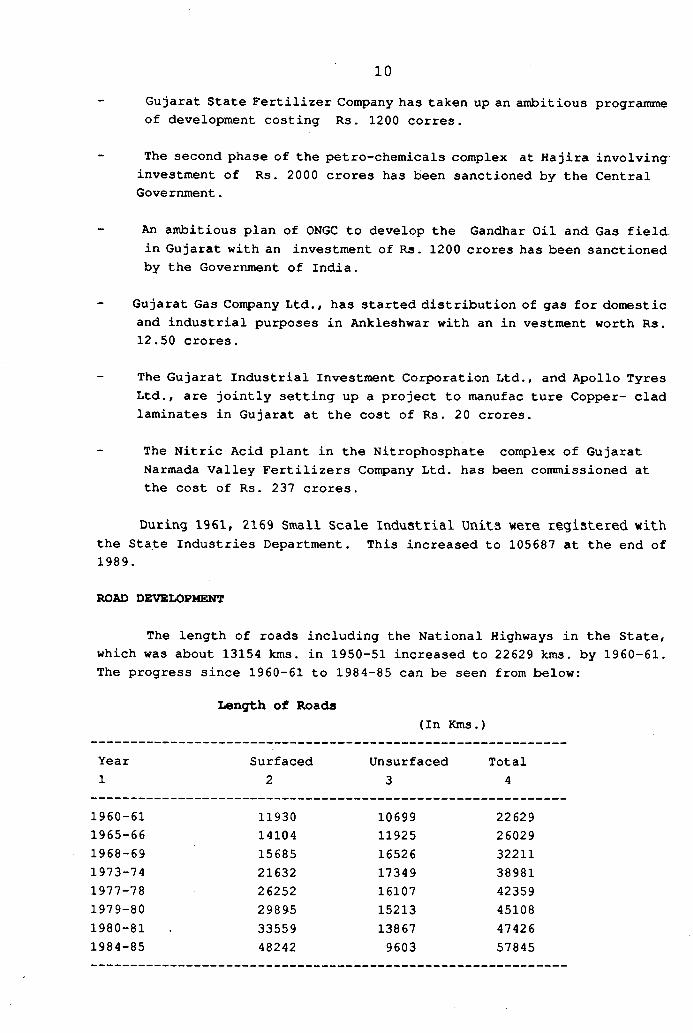
Gujarat State Fertilizer Company has taken up an ambitious programme of development costing Rs. 1200 corres.
The second phase of the petro-chemicals complex at Hajira involving investment of Rs. 2000 crores has been sanctioned by the Central Government.
An ambitious plan of ONGC to develop the Gandhar Oil and Gas field in Gujarat with an investment of Rs. 1200 crores has been sanctioned by the Government of India.
Gujarat Gas Company Ltd., has started distribution of gas for domestic and industrial purposes in Ankleshwar with an in vestment worth Rs.12.50 crores.
The Gujarat Industrial Investment Corporation Ltd., and Apollo Tyres Ltd., are jointly setting up a project to manufac ture Copper- clad laminates in Gujarat at the cost of Rs. 20 crores.
The Nitric Acid plant in the Nitrophosphate complex of Gujarat Narmada Valley Fertilizers Company Ltd. has been commissioned at the cost of Rs. 237 crores.
During 1961, 2169 Small Scale Industrial Units vere registered with the State Industries Department. This increased to 105687 at the end of 1989.
ROAD DEVELOPMENT
The length of roads including the National Highways in the State, which was about 13154 kms. in 1950-51 increased to 22629 kms. by 1960-61. The progress since 1960-61 to 1984-85 can be seen from below:
10
Length of Roads(In Kms.)
Year Surfaced Unsurfaced Total1 2 3 4
1960-61 11930 10699 226291965-66 14104 11925 260291968-69 15685 16526 322111973-74 21632 17349 389811977-78 26252 16107 423591979-80 298 95 15213 451081980-81 33559 13867 474261984-85 48242 9603 57845
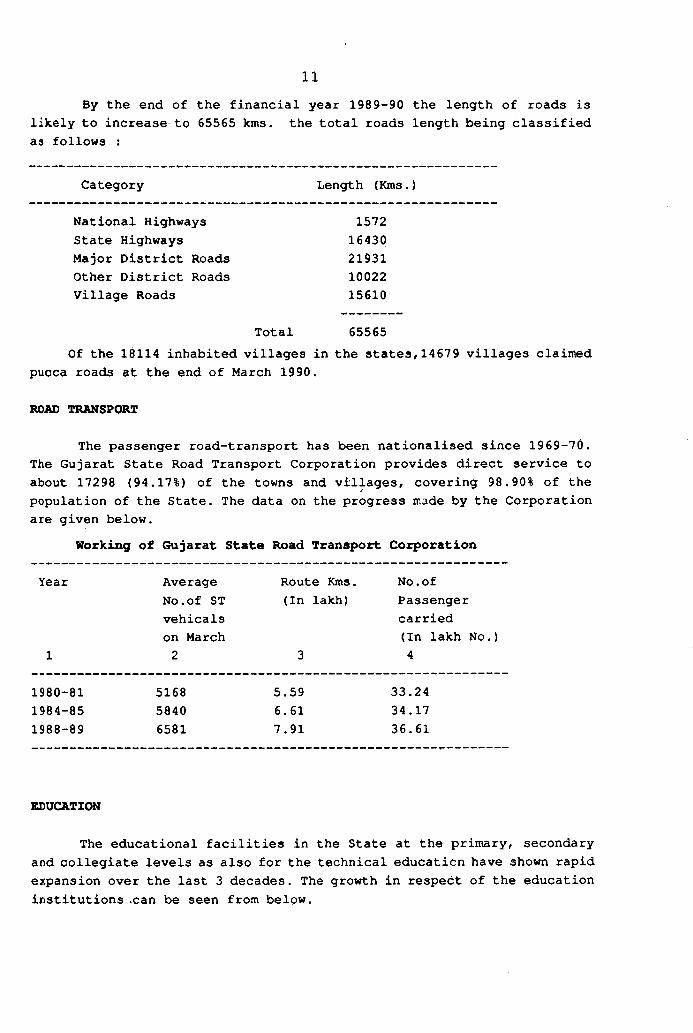
By the end of the financial year 1989-90 the length of roads is likely to increase to 65565 kms. the total roads length being classified as follows :
11
Category Length (Kms.)
National Highways State Highways Major District Roads Other District Roads Village Roads
157216430219311002215610
Total 65565Of the 18114 inhabited villages in the states,14679 villages claimed
pucca roads at the end of March 1990.
ROAD TRANSPORT
The passenger road-transport has been nationalised since 1969-70. The Gujarat State Road Transport Corporation provides direct service to about 17298 (94.17%) of the towns and villages# covering 98.90% of the population of the State. The data on the progress made by the Corporation are given below.
Working of Gujarat State Road Transport Corporation
Year Average Route Kms. No .ofNo.of ST (In lakh) Passengervehicals carriedon March (In lakh No.)
1 2 3 4
1980-81 5168 5.59 33.241984-85 5840 6.61 34.171988-89 6581 7.91 36.61
EDUCATION
The educational facilities in the State at the primary, secondary and collegiate levels as also for the technical education have shown rapid expansion over the last 3 decades. The growth in respect of the education institutions .can be seen from below.
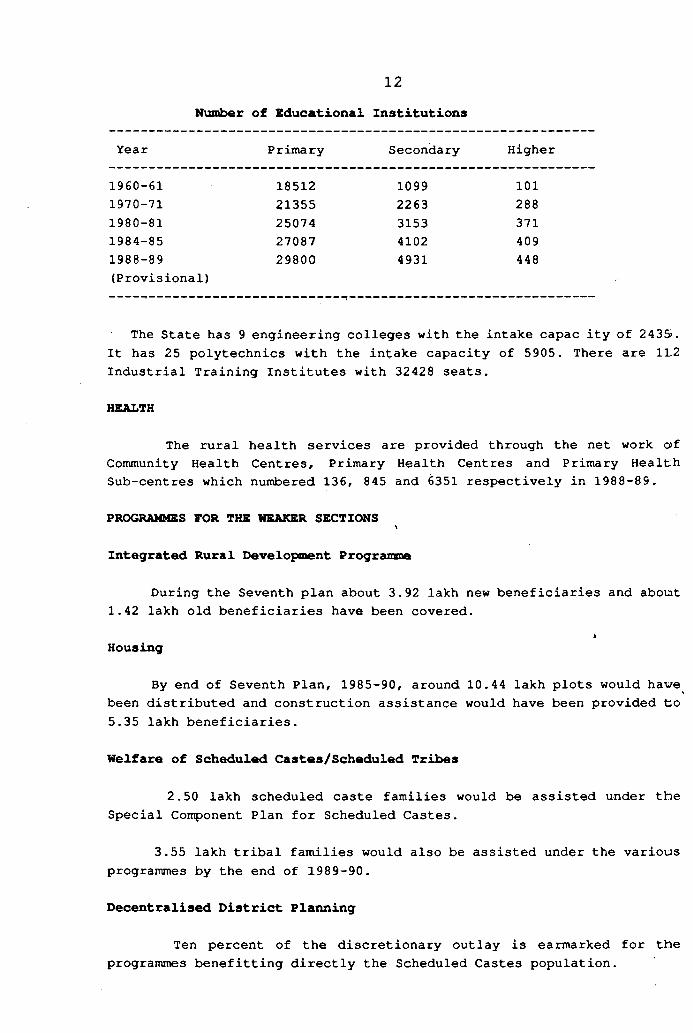
12Number of Educational Institutions
Year Primary Secondary Higher
1960-61 18512 1099 1011970-71 21355 2263 2881980-81 25074 3153 3711984-85 27087 4102 4091988-89 29800 4931 448(Provisional)
The State has 9 engineering colleges with the intake capac ity of 2435. It has 25 polytechnics with the intake capacity of 5905. There are 1L2 Industrial Training Institutes with 32428 seats.
HEALTH
The rural health services are provided through the net work o>f Community Health Centres, Primary Health Centres and Primary Health Sub-centres which numbered 136, 845 and 6351 respectively in 1988-89.
PROGRAMMES FOR THE WEAKER SECTIONS\
Integrated Rural Development PrograxntDe
During the Seventh plan about 3.92 lakh new beneficiaries and about 1.42 lakh old beneficiaries have been covered.
«Housing
By end of Seventh Plan, 1985-90, around 10.44 lakh plots would have been distributed and construction assistance would have been provided to 5.35 lakh beneficiaries.
Welfare of Scheduled Castes/Scheduled Tribes
2.50 lakh scheduled caste families would be assisted under the Special Component Plan for Scheduled Castes.
3.55 lakh tribal families would also be assisted under the various programmes by the end of 1989-90.
Decentralised District Planning
Ten percent of the discretionary outlay is earmarked for the programmes benefitting directly the Scheduled Castes population.
20 percent additiodnal discretionary outlay is allocated to economically backward talukas identified by Dr. I. G. Patel Committee.
Rs. 158.83 crores were spent during five years of the Seventh Plan.
13
Achievements upto March 1990 are indicated below.
15792 school rooms were constructed.
17040 new water supply works completed.
5619 link roads and 367 6 approach roads constructed.
1546 villages were electrified for all purposes.
LAGS AMD CONSTRAINTS
1.8 Rapid increase in population is not the only constraint impeding the growth of the economy in real terms. There are other constraints as well.
(i) The state lags behind many other States in respect of many basic amenities. A large proportion of the area of the State is backward, with 58 out of 184 talukas being prone to drought. Drought Prone Areas include 35% of the area of the State and 24% of the population. Erratic and unevenly dstributed rainfall has been causing recurrent droughts and floods, with shattering impact on agriculture, fodder and drinking water situation in the State.
(it) Gujarat is also deficient in the matter of forest cover over land; only a little above 10% of the area of the State is covered by forests as compared to 22% for the rest of the Coun try. Around 50% of the State forests are concentrated in the Southern districts of the State. The inadequacy of the forest cover continues to cause serious problems of soil erosion and silting of water reservoirs in the State.
(iii) Only 26% of the culturable areas of the State is under irrigation. Two thirds of the area under irrigation in the State is irrighated by surface wells, which are themselves dependent on rainfall. Canals,irrigate only 31% of the total irrigated area. The ultimate irrigation potential in the State, even with the Sardar Sarovar Project is not likely to exceed 52% of the cul turable areas. The effective percentage is likely to be lower if the depletion of ground water resources at the present rate of drawals in deficient areas is taken into account.
(iv) Irrigated agriculture in the State faces many problems. Water logging has begun to assume importance in some of the irrigated areas. Silting up of reservoir with the resultant loss of effective capacity of reservoirs
is an area of concern, varound water extraction in several areas has been so heavy that the draft has far exceeded recharge and consequnetly, the water table has been going down steadily at several pld*'es. Along the coastal areas of Saurashtra and Kachchh, this has caused ingress of salinity/ now assuming serious dimensions.
(v) In matter of power generation, Gujarat has to depend over whelmingly on thermal power on account of limited hydro- electric potential. Being situated far away from the coal fields, Gujarat faces many uncertainties and additional cost of transportation in respect of power generation. The concentration of generation centres in Southern and .Eastern parts of the State entails heavy line losses in carrying power over long distances to Saurashtra and Kachchh regions. Significant increase in gas based power generation is vital.
(vi) In road development also, the State with only 32 kms. of road length per 100 sq. kms. at the end of March 1988, lags behind the rest of the Country. At the end of March, 1990 nearly 3435 villages in the State were yet to be provided with all weather road connections.
(vii) Despite providirig 1000 villages every year with reliable drinking water, difficulties have arisen on account of salinity ingress, changing water table occasioned by heavy drawals of ground water in certain areas, the ittvpact of industrial pollution and as a consequence of reexirrent natural calamities in the form of droughts and floods. The problem of protected water supply in towns and the augmentation of supply to the larger urban complex es is also of enormous magnitude.
(viii) With 31% of the total population of the State living in urban areas, Gujarat has a high rate of urbanisation. The State has 255 towns with the population of nearly 106 lakhs. This rapid rate of urbanisation has resulted in serious pressure on urban land resources and has strained civic amenities such as water supply and drainage, transportation, social and recreational services.
14
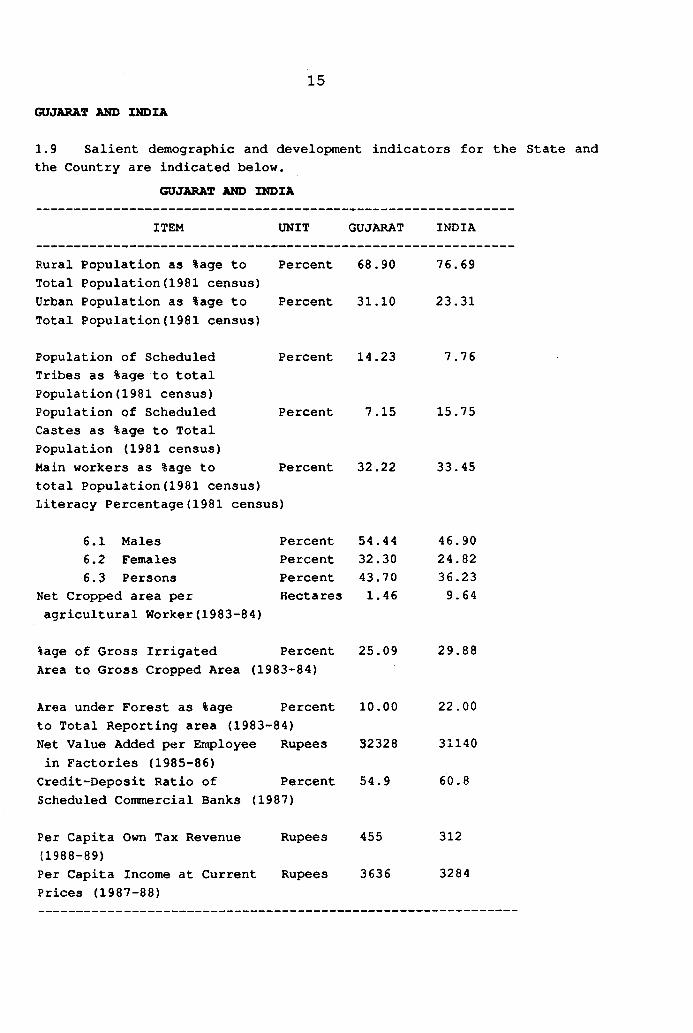
15GUJARAT AND INDIA
1.9 Salient demographic and development indicators for the State and the Country are indicated below,
GUJARAT AND INDIA
ITEM UNIT GUJARAT INDIA
Rural Population as %age to Percent 68.90 76.69Total Population(1981 census)Urban population as %age to Percent 31.10 23.31Total Population(1981 census)
Population of Scheduled Percent 14.23 7.76Tribes as %age to totalPopulation(1981 census)Population of Scheduled Percent 7.15 15.75Castes as %age to TotalPopulation (1981 census)Main workers as %age to Percent 32.22 33.45total Population (1981 census)Literacy Percentage(1981 census)
6.1 Males Percent 54.44 46.906.2 Females Percent 32.30 24,826.3 Persons Percent 43.70 36.23
Net Cropped area per Hectares 1.46 9.64agricultural Worker(1983-84)
%age of Gross Irrigated Percent 25.09 29.88Area to Gross Cropped Area (1983-84)
Area under Forest as %age Percent 10.00 22.00to Total Reporting area (1983--84)Net Value Added per Employee Rupees 32328 31140in Factories (1985-86)Credit-Deposit Ratio of Percent 54.9 60.8Scheduled Commercial Banks (1987)
Per Capita Own Tax Revenue Rupees 455 312(1988-89)Per Capita Income at Current Rupees 3636 3284Prices (1987-88)
CHAPTER II
DEVELOPMENT IN PERSPECTIVE
2.1 The proposals for the Eight Five Year Plan have been prepared in the context of level of development reached in various sectors of development during the Seventh Five Year Plan (1985- 90) . In many sectors of development such as irrigation and power, the en^hasis over the next five years, would be on the early corr^letion of on going projects. However, past performance alone has not been the only guiding factor in the formulation of these proposals. The State Government hadi commissioned a series of studies to incorporate the levels of development already reached and perespectives for the period 1990-2005. This chapter summa rises the salient features of the 15 year prespective which looks at the position that is likely to be reached at the end of the Eight, Ninth and Tenth Five Year Plans.
2.2 Perspective plans are not new to the planning process in Gujarat. A Perspective plan for the years 1974-84 was brought out in February,1972. This Perspective plan provided valuable guidlines in the formulation of Sixth and Seventh Five Year Plan. As preparatory work for the formulation of the Eighth Five Year Plan (1990-95) and by way of providing the necessary background to various Steering Groups set up for this purpose, the State Government commissioned 20 Technical papers for making systematic projections upto the year 2005. These papers cover such areas as population, agriculture, water development, industries, power and various social services. Salient features, as have been relevant for the preparation of the proposals for the Five Year Plan are given in subsequent paragraphs.
Population
2.3 It is estimated that the population of the state will grow from 341 lakhs in the year 1981 to 465 lakhs in the year 2001 and 486 lakhs in the the year 2005. The proportion of urban population is expected to increase from 31.1 % in 1981 to 39.7 % in the year 2005. The population in the age group 15-59 i.e. in labour force will rise from 188 lakhs in the year 1981 to 300 lakhs in the year 2001 and 327 lakhs in the year of 2005. It is anticipated that the exponential growth rate of total population will slow down from 2.4% inl981 to about 1.1% in the year 2005.
State Domestic Product
2.4 The State Domestic Product i.e. income generated in Gujarat is anticipated to rise from Rs.2.2 thousand crores in 1970-71 to an estimated Rs.10.1 thousand crores in 2004-05 (assuming the growth rate of 5.5 %) at 1970-71 prices. It is anticipated that the share of primary sector in
16
State Domestic Product will de crease from about 39.0 % in 1989-90 to about 31.7% in 2004-05 whille that of secondary and tertiary sectors will rise from 24.3 % to 28.6 % and from 36.7 % to 41.5 % respectively. The per capita real income at 1970-71 prices is expected to rise from Rs. 829 in 1970-71 to about Rs. 2078 in 2004-05.
Workers
2.5 It is estimated that the number of total workers will increase from1.27 crores in 1981 to about 1.74 crores by the end of Tenth Plan. The average number of daily workers in registered industries is expected to increase from estimated 7.5 lakhs in 1990 to around 10 lakhs in 2005. The total number of job seekers registered in employment exchanges is anticipated to increase from estimated 9.1 lakhs in 1990 to about 15 lakhs by the end of the Tenth Plan.
Urbanisation
2.6 The urban population is expected to increase from 106 lakhs in 1981 to 193 lakhs in the year 2005. It is anticipated that about 10 to 15 towns in the size class II of 50,000 to 1 lakh population in 1981 will shift to the Class I category with population of 1 lakh and above.
Agricultural production
2.7 It is estimated that the gross cropped area will increase from about 111 lakh hectares in 1983-84 to about 127 lakh hectares in the year 2004-05 of which about 56 lakh hectares will be under foodgrains, 17 lakh hectares under cotton and 31 lakh hectares under oilseeds. The average production of foodgrains is expected to increase from about 51 lakh tonnes in Sixth Plan to about 85 lakh tonnes by the end of Tenth Plan, that of Cotton from about 18 lakh bales to about 24 lakh bales and that of oilseeds from about 22 lakh tonnes to about 33 lakh tonnes.
Animal Husbandry
2.8 The total milk production in the State is estimated to increase from 37.28 lakh tonnes by the end of Eight Five Year Plan to about 48.67 lakh tonnes by the end of Tenth Five Year Plan'. The egg production is estimsted to increase from about 25.3 crores in 1987-88 to about 38.1 crores at the end of the Tenth Plan. The wool productilon is estimated to increase from about 2075 tonnes in 1987-88 to about 2698 tonnes in the year 2004 -05. The deficit green fodder is estimated to be of the order of 40 % to 45 % by the year 2004-05 against the estimated requirement of about 294-300 lakh tonnes.Fisheries
2.9 The marine fish production is estimated to increase from 3.28 lakh tonnes in 1987-88 to about 7.61 lakh tonnes in the year 2004-05.
17
Forest
2.10 It is estimated that the supply of fuel wood will increase from about 2 M.T. in 1984 to 5.8 M.T. by 2005 and that of poles will increase from 3.7 M.No. to 45 M.No. by 2005.
Cooperation
2.11 The projected membership of agricultural societies for 2005 comes to 66.86 lakh and that of the non-agricultural societies comes to 64.38 lakhs.
Irrigation
2.12 It is estimated that the total ultimate irrigation potential in the State including the Narmada Project is 64.88 lakh hectares of which about 33 lakh hectares would have been harnessed by the end of the Seventh Five Year Plan. It is estimated that the balance potential 32.88 lakh hectares will be created by the end of the Tenth Plan.
Power
2.13 It is estimated that the demand for power in the State will be 5018 MW and 7104 MW by the end of the Eighth and the Ninth Plans respectively. Considering the schemes sanctioned and proposed, it is estiinated that the net deficit in installed capicity would be around 986 MW and 1723 MW by the end of the Eighth and Ninth Plans respectively.
Industries
2.14 It is estimated that the niomber of registered (reporting) factories will increase from about ,10.4 thousand in 1984 to about 19.0 thousand in the year 2004-05 and the ert^loyment therein will increase from about 6.85 lakhs to 11.09 lakhs during the same period. The net value added in registered factory sector at current prices is estimated to increase from Rs.2132 crores in 1983-84 to about Rs. 8400 crores in the year 2004-05. However, as the estimates of these parameters obtained by alternative methods show considerable variation, they may need to be reviewed after the Eighth Plan. The number of Small Scale industrial units registered during the year is estimated to be around 7.1 thousand in the year 1990 and is estimated to grow to about 10.7 thousand in the year 2005.
Banking
2 . 1 5 It is anticipated that the number of banking offices would increase from about 3 . 1 thousand during 1 9 8 7 - 8 8 to about 4 . 4 thousand in the year 200 4 -O 5 , that the bank deposits would grow from about Rs. 7311 crores to Rs. 100970 crores at current prices and the credit would grow from about Rs. 4011 crores to Rs. 70679 crores over the same period.
18
Roads
2.16 The length of roads including National Highways, State Highways, major district roads, other district roads and village roads is expected to increase from estimated 65000 kms. in 1990 to about 115 thousand Icms. in the year 2001.
Education
2.17 The enrolment of children in the age groups of 6-13 years will bearound 100 % for boys and girls both by the middle of the Eighth Plan.The enrolment of the children in the age group of 6-13 years is expectedto remain in the order of 70 lakhs during Ninth and Tenth Plans. Based on current trends . The litreracy rate is expected to increase from 43.7 % in 1981 to between 63% to 68% by the end of Ninth Plan and between 69 %to 74 % by the end of Tenth Plan. The literacy rate by the end of TenthPlan for rural areas will be around 65 % and for urban areas will be around7 6 %. The female literacy rate is expected to increase from 32.3 % in 1981 to about 55 % to 61 % by the end if Tenth Plan.
Health
2.18 The birth rate and the death rate for 1986 are estimated at 32.0 and 10.4 per thousand persons per year respectively. The birth rate is expected to come down to 22.1 and the death rate will come down to 6.0 by 2005 as a result of greater and better health and medical services including family welfare programmes.
Water Supply
2.19 Highest proirity will be accorded to 'no source' villages and full coverage of all the 'no source' villages and 10 remaining towns will be achieved.
Housing
2.20 The average household size is anticipated to drop from 5.74 in 1981 to about 5.11 in the year 2005. The number of households are estimated to increase from 59.34 lakhs in 1981 to about 94.91 lakhs in the year 2005. The number of additional houses required during the Eighth, Ninth and Tenth Plan periods are estimated to be about 7.4 lakhs, 7.3 lakhs and 5.6 lakhs respectively, of which about 4.1 lakhs, 4.3 lakhs and 3.5 lakhs respectively will be needed for urban areas.
19
CHAPTER III APPROACH AND STRATEGY
3.1 The guiding principles for the formulation of the Eighth Five Year Plan 1990-95 have been approved by the National Development Council. The Eighth Plan seeks to consolidate the gains of past investment and to launch the Nation on the path of full enployment. The enphasis will be on promoting employment opportunities on a large scale and in a widely dispersed manner to absorb the backlog of .under employed and unemployed, together with increments to the labour force. This is expected to be achieved through a major shift in the planning process emphasizing democratic decentralisation, integrated local area planning and simplification of procedures. The 'Approach to the Eighth Five Year Plan' as approved by the National Development Council spells out in detail the goals, objectives, priorities and other implications of the strategy shift of objectives as well as instrumentalisation of Planning.
3.2 The Eighth Five Y6ar Plan envisages the growth rate of 5.5%. This is sought to be achieved through increased investment in rural development, concentration of investments in areas with high incidence of poverty and unemployment,encouragement of labour-intensive and energy-capital saving techniques of production. An increase in employment at the annual rate of 3% is envisaged over the next decade.
3.3 The major objectives of the Eighth Plan of the country are:-
1. A signficant increase in the generation of employment opportunities, towards fulfilling the commitment to provide the 'Right to Work.'
2. Improved productivity in agriculture through expansion of irrigation facilities, improving the productivity of rainfed agriculture in arid and semi-arid tracts.
3. Promote production of mass consumer goods through labour intensive manufacture, especially through village and cottage industries; augment infrastructural facilities for ensuring balanced industrial development with due regard for increasing efficiency in production and conservation in energy.
4. Encourage application of Science and Technology in the efforts to augment employment, protect environment and promote self-reliance.
5. Ensure a minimum standard of social services and economic infrastructure .
20
6. Develop an equitable and socially just approach towards weaker sections of the population such as Scheduled Castes, Scheduled Tribes, Backiward Classes; ensure that the talents and energies of women are utilised productively for assuring them a life of dignity and security.
7. Intensify the efforts on the containment of population growth.
8. Restructure education, health and nutrition services with a view to raise the levels of living and quality of life of the people.
9. Ensure democratic decentralisation, integrated area planning and association of local democratic institutions in the process of planning and inclementation.
3.4 In the light of these national objectives, the Approach to Development in the State would include the following;-
3.4.1 The process of social transformation is expected to be speeded up through economic decentralisation measures for social justice and removal of exploitation . The focus on investment would be shifted significantly to the development of rural areas. Among other things, this would include, providing basic necessities of life, improving productivity, together with adoption of modern Science and Technology.
3.4.2 The main elements in the strategy for achieving social transformation include provision of basic minimum needs for all approach roads to all villages, safe drinking water to every citizen in the State, access to primary school education to every child and availability of basic medical care to all sections of the population. The needs of welfare of backward classes would be kept in view prominently through consolidation and augmentation of programmes for their educational, economic and social upliftment. Special attention for development of women through augmenting the range of services will also form a part of the plan.
3.4.3 Measures for provision of foodgrairs at reasonable prices to vulnerable sections of population and encouraging continued attendance of children in primary schools through incentives in the form of foodgrains are also among the steps towards social transformation.
3.4.4 Employment promotion is among the principal objectives of the Eighth Plan. This is proposed to be achieved in a wide variety of ways. Traditional ways of providing wage employment would continue especially in the fiel<ls of afforesation, minor irrigation and provision of essential infrastructure in rural areas. The eitphasis in the Eighth Plan will mainly be on vocational training and self-employment. The new industrial policy of the State is predominently employment-oriented, with special emphasis on village and cottage industries and promotion of the tiny and small scale sector so as to ensure flow of benefits of industrilization in a widespread manner. Particular attention would also be paid to the question of revival
21
of sick units and the rehabilitation of workers rendered jobless, especially in the textile mills. Self-en^loyment in innovative areas such as diamond cut ting and polishing, jwellery making, plastics are some of the avenues through which this objective is sought to be achieved in practice.
3.4.5 Rural areas will continue to be on high priority in the matter of provision of employment. In addition to the ongoing programmes of rural development, speical programme of eitployment promotion, focusing on families below poverty line, rural artisans, and, households headed by women have been launched. A pilot project to achieve Zero level of unenployment has also been taken up in the districts of Gandhinagar and Dangs. This pilot project aims to assess the magnitude and characteristics of different categories of uneir^loyment over space and time. It will take into account such aspects as seasonal unemployment, extent of migration and other related factors. A judicious mix of public works programme, with emphasis on afforestation, land and water conservation measures and provision of basic minimum needs are the main planks of this programme. Significant augmentativon to vocational training facilities, including informal non-institutional training for skills in short supply would be among the long term measures for ensuring employment on a continued basis.
3.4.6 Balanced regional development is another important objective of Plan Development during the Eighth Five Year Plan. Gujarat has the following distinct geographical regions
Eastern Hilly Regions North Gujarat Central GujaratSaurashtra Kachchh3.4.7 Each region has its share of peculiar problems and constraints. During the Eighth Five Year Plan, programmes for regional development based on geographical, climatic, geological and other peculiarities of these regions will be formulated.
3.4.8 Measures for speedy development of Kachch, Saurashtra and North Gujarat would be initiated.
3.4.9 Reducation of disparities in development among different areas of the State requires accelerated development on areas identified as being more backward. These are
22
bDrought Prone Areas Desert Areas Tribal areasEconomically backward talukas Industirally backward areas Geographically backward areas Coastal Areas
43 talukas9 talukas
32 talukas and56 talukas10 districts10 Areas
1600 kms.
3.4.10 The Expert Committee under Dr. I. G. Patel (1982) made a comprehensive survey of levels of backwardness among the talu kas of the State and classified talukas according to their levels of backwardness in different sector and according to a conposite index. The findings of this Committee have been the basis of State policy towards identification and development of backward talukas in the State.
3.4.11 . Balanced Industrial Development has been an inportant objective in the scheme of subsidy and incentives provided by various Industrial Development Corporations with industrial estates spread over all the districts of the State has been a major instrument in decentralisation of industries. New Industri al Estates like Vapi, Ankleshwar, Halol, Vaghodia, Jhagadia etc., have attracted on a large nuxnber of new industries.
3.4.12 Guarat has a long coastal area of 1600 kms and a long land border with Pakistan in the desert and semi-desert areas of the district of Kachchh and Banaskantha.Coastal areas pose many distinct problems such as salinity ingress, damage from cyclones. But they also have many potential advantages such as large scale salt production, marine fisheries, brackish water fisheries and commercial development through ports and potential for tourism.
3.4.13 The land border across deserts and semi-deserts poses problems of security and other anti-social activities such as smuggling. Dearth of water, transport and communication and other develolpmental infrastructure impede efforts in the development of these areas. Considering the strategic iiT¥>ortance of these areas, a well thought out plan for the development of border areas should also form a part of balanced development.
3.5 KEY ELEMENTS OF DEVELOPMENT DURING THE EIGHTH PLAN
Econon^ of Gujarat :
3.5.1 The economy of Gujarat has been undergoing a structural transformation, albeit slowly. For three year period ending in 1962-63, the percentage of primary sector to the State Domestic Product Sector was 42.43% with secondary sector 25% and tertiary sector 32.6% in the three years ending 1987-88, the share of the primary sector had fallen to 24.5% while that of secondary sector and tertiary sector had increased to 30.6% and 44.9% respective ly.
Agriculture £ Water Resources ;
3.5.2 Agriculture will continue to be inportant in the years to come especially from the point of production of cotton, oil seeds, sugarcane, and tobacco. Lack of dependable sources of irrigation continue to be the biggest constraint in raising farm productivity. Nearly 26% of the culturable area of the State is under irrigation. Two thirds of the area of the irrigation under State is irrigated by wells, which depend largely
23
on rainfall. Canals irrigated only 31% of the total irrigated area. The ulti mate irrigation potential in the state will not exceed 52% of the culturable area, even with the Sardar Sarovar Project.
3.5.3 The State has recently set up a Horticulture Unit as a part of the Agricultural University System. Considering the iir ortance of fruits and vegetables, both as a supplement to diet and as a raw material for Agro Industries and for Exports, this area would be strengthened considerably. The Agricultural Exten sion Services and Social Programmes would take up horticulture on a far largest scale than hitherto.
3.5.4 Delimitation and systematic development of micro water sheds has been taken up towards the end of the Seventh Five Year Plan. With the advent of the National Watershed Programmes, this activity should gather more momentum. How well the different disciplines of agriculture, fisheries forestry, horticulture and soil conservation can be blended to work over a small area will require considerable organisational ingenuity. Equally in^ortant would be to establish a base of getting feed back on national level laboratories in respect of updating the knowledge and techniques of State level experts and extension workers in the development of micro water sheds.
Sardar Sarovar Project :
3.5.5 The importance of Sardar Sarovar Project can be seen from the fact that it would contribute to the irrigation to 18 lakh hects. Out of total ultimate potential of 64.88 lakh hects. Besides it would provide drinking water to 4720 villages and 131 urban areas of the State. The benefits of irrigation is expected to reach over 3334 villages in 62 talukas located in 12 out of 19 districts of the States. Timely completiom of these projects which causes cost and time over run would therefore be essential. This ought to be accorded a highest priority.
3.5.6 Ground water exploited through dugwells and tubewells also forms an important source of irrigation in the State. About 28 lakhs hects. out of total potential 64 lakh hects. are expect ed to be reached by these sources. However, in many areas over drawal of water has led to rapid depletion of ground water re sources and has partly contributed to salinity ingress along the coastal areas. It is necessary that measures for accelerated development of tube wells should be balanced by amelioration of adverse effects on ecology through overdrawal of ground water.
Power :
3.5.7 In the field of power, the Eighth Plan would attempt to reduce dependence of coal from coal field located far away. Gas based thermal station at Pipavav and Gandhar and Lignite based therman power station in Kachchh are among the new initia tives included in power development, as assured quantity of gas for the first two of these stations appears vital-
24
3.5.8 The gas based power stations at Gandhar and Pipavav would be taken on hand on a priority basis so as to avoid major dislocations in power supply in the near future.
Industries :
3.5.9 The current package of incentives and subsidies for Industries has been recast from the stand point of their contri bution to dispersal of Industries. Taluka, rather than District has been adopted as the prime unit for grant of location of incentives so as to achieve more balanced growth of industries, necessary means to coordinate the requirements of various ele ments of infrastructure for industrial development would be taken. This would be especially relevant with the growth centres strategy is to be pursued further.
3.5.10 Development of small scale, Cottage, Khadi & Village Industries would be given a place of pride considering their contribution to providing employment in a widely dispersed man ner.
3.5.11 Non Resident Indian Investment in Gujarat has been considerable. Various promotional measures and agencies have been set up to accelerate industrial investment by Non-Resident Indi ans. Provision of an international Airport at Ahmedabad and a Gem and Jewellery Complex wj.th bonded warehouses located next to the International Airport will considerably boost the volume and direction of investment by Non-Resident Indians and bring signif icant export earnings to the country.
3.5.12 Venture capital for aiding small scale industrialists without adequate fiancial resources is among the new initiatives. This would build on excellent industrial extension machinery in the from of INDEXTB and strong expertise available for promot ing self-enployment.
Urbanisation :
3.5.13 With 31 of the total population of the State living in urban areas, Gujarat has a high rate of urbanisation. The State has 255 towns with the population of nearly 106 lakhs. This rapid rate of urbanisation has resulted in serious pressure on urban land resources and has strained civic amenities such as water supply and drainage, transportation, social and recreational services.
3.5.14 Adequate organisational arrangements focussing on plan development of urban areas (rather than regulation of municipali ties) is called for. .
25
Decentralised District Planning :
3.5.15 Gujarat has been among the pioneering States in intro duction of Panchayati Raj in the country in 1963, three years after it was constituted as a separate State in May, 1960. Most of the District level schemes were transferred to district pan chayats with financial allocations and necessary staff, the implementation and monitoring of these schemes have been with the District Panchayats ever since.
3.5.16 Decentralised District Planning acquired a special place in November, 1980 when District Planning Boards were set up in each District. Untied funds, both by way .of grants (Discre tionary outlays) and by way of matching contributions (incentive outlays) were provided at an average of Rs. 2 crores per annxim per District. The focus of District Planning Board has largely been on provision of basic minimum needs and efforts have largely been expanded on a capital expenditure for this purpose. Over ten thousand schemes a year mainly provision of water supply, con structed of rural roads, primary schools, providing and augment ing primary health care have been among the more prominent areas of application of these funds.
3.5.17 Over the years the formula of distribution of funds to the District and from the District to the Taluka has been im proved and a sophisticated system of monitoring has also been put in place. Taluka level committees with large measure of public participation from the elected leaders is a feature of Gujarat's Decentralised District Planning.
3.5.19 Gujarat has also been successful in garnering nearly Rs. 8 crores a year by way of popular contribution towards the development programmes.
3.5.20 Distt. outlays on sectoral schemes which are allocable among Districts are shown separatley for each District within two months of the financial year so that District authorities are enabled to plan, execute and monitor such sectoral schemes. The break up of si’ch schemes for each taluka has also been provided to District level and taluka level leadership.
3.5.21 Special programmes for geographically backward areas, talukas identified as most backward, talukas with high proportion of population of educationally and other backward classes have been among devices to check the possible anomalies arising from application of a standard formula for distribution of funds.
3.5.22 It is notable that the proposals for inclusion of Eighth Plan in the state were widely discussed in seminars over 2-3 days at each District. Knowledgeable officials, elected leaders, representatives of Banking Corporations and Academicians •i'ere invited for participation in such Seminars. Similar exer cises were also done in atleast one backward taluka in each Dis trict. The suggestions were received as a result of these exer cise in almost every sphere of development. Due note has been
26
taken of these suggestions, wherever practicable in the sectoral programmes.
Associating voluntary agencies and non-'govemmental organisations
3.5.23 Gujarat has a long tradition of associating non- Governmental agencies in various spheres of public administra tion, including developmental activities and emergent situations, voluntary Agencies have played a notable part in contributing funds, assisting the Government in scarcity and flood relief through opening cattle can^s, construction of houses, providing material, for house construction, providing grass for cattle canqps, providing seeds, tractors and other h6lp in cultivation, distribution of milch cattle, providing self errployment and construction of school rooms.
3.5.24 Voluntary Agencies have long been playing an important role in social welfare work. Practically the entire effort of the State in the training and rehabilitation of the physically handi capped and mentally retarded is done by Voluntary Agencies. There are 151 agencies engaged in the task of training various catego ries and rehabilitating various physically handicapped such as blind,. orthopaedically handicapped, deaf and dumb, etc. Almost of the expenditure on this account is incurred through Voluntary Agencies.
3.5.25 A majority of Secondary schools and colleges in Gujarat are operated by non-Governmenta1 organisations. In the field of industrial training also. Voluntary Agencies-Trusts have supple mented Government's efforts notably. A large number of voca tional training institutions under TRYSEM and those operated through the Directorate of Cottage Industries are also in opera tion by non-governmental organisati6ns.
3.5.26 In the field of rural development also, the Government has been actively encouraging Volntary Agencies to participate in a wide variety of activities to supplement Government efforts. There are several recognised Voluntary Agencies and Apex organi sations undertaking such activities Afforestation and Minor irrigation (Sadguru Seva Foundation, panchmahals and Agakhan Rural Support Programme), Training and marketing (Vivekanand Research Training Institute in Kutch) and Khadi and village Industires (Saurashtra Gandhiji Graraodhyog Trust). Many of these Trusts- Societies also channelise funds from Business Houses for rural development. A notable feature of their work being cost effectiveness, local innovation and replication of successful experiments in one area to another. Non governmental organisa tions have also been engaged in the field of wasteland develop ment but the impact of work done is not yet available.
3.5.27 There are some areas of public administration where voluntary efffort is more effective than department form of administration. In the field of social defence, the work done by Jyoti Sangh is an exanple. Its record of work in the matter of suicide among young brides and other social
27
and psychological problems of married women is particularly notable. The contribu tion of Self-Employed Women's Association (SEWA) in organising the women engaged in tiny sector has been note worthy.
Planning Process:
3.5.28 Planning process will require a far larger measure of publicparticipation than hitherto. In addition to elected leaders, experts from various fields such as banks, cooperatives, academic institutions, voluntary agencies, universities etc., will have to be associated in an iricreasing measure. Gujarat had associated considerable number ofelected leaders and other experts in the process of formulation of the draft Eighth Five Year Plan.
3.5.29 However, a more broad based mechanism for reviewing and monitoring plan programmes at various levels appears necessay in the evaluation of Plan programmes; also, meaningful cooperartion from colleges and universities is called for. Bringing together experts from such disciplines as sociology, engineering, archi tecture may help to reduce the present over en^hasis on financral accounting and purely economic aspects of plan evaluation.
28
CHAPTER IV
THE PLAN FRAME
Development Strategy
4.1 By way of preparation of the Eighth Five Year Plan, the State Government prepared an Approach paper which was discussed with all Development Departments concerned and finalised in March,1989. As many as seventeen Steering Groups were set up covering all the major sectors of development such as Agricul ture. Water Resourses, Industries, Power, Urban Development, Transport and Communication and social services. By way of pro viding a long term time horizon within which to frame their proposals, the Steering Groups were also provided Technical papers indicating the perspective for the years 1990-2005 in relevent development sectors. These proposals have been prepared in the context of reports of the Steering Groups and long terms Perspectives.
4.2 The proposals contained in the reports of the Steering Groups total to Rs. 15739 crores in respect of Eighth Five Year Plan. While this is a fair estimate of the development needs of the State, available resources would not permit a plan of this magnitude. Based on the outcome of the series of official level discussion and taking into consideration the resources in sight, an Eighth Five Year Plan of the size of Rs. 10,000 crores has been drawn up.
4.3 The Plan aims to carry forward the momentum gained in the Seventh Five Year Plan. Progressive reduction of poverty, satis faction of the basic needs of the people, attainment of universal elementry education and health facilities for all were among the objectives in the Seventh Plan. The proposals aim at early com pletion of on-going projects, provisions of adequate investments for externally funded projects and investments towards reaching nationally accepted noms. In particular, the plan accords the highest priority for timely completion of the Sardar Sarovar (Narmada) Project, the life line of Gujarat.
The Planning Process
4.4 Keeping in view the importance of Decentralisation of Planning, the proposals for the Eighth Five Year Plan and the Annual Plans were discussed in detail over two or three days at each district headquarter. In addition, seminars were also held at atleast one taluka headquarter in each district to evolve suitable recommendataion for inclusion in the district plans and sectoral plans. The recommendation recieved not only cover var ious suggetions for investments from the united funds of decen tralisation district planning programme but also in respect of sectoral plans, they also include suggestions relating to the pattern of the schemes, organisational arrangements and other related matters. Suggestions from the talukas and districts have been incorporated to the extent possible keeping in view con straints of time and finance.
29
4.5 A break up of sectoral programmes by taluka has been at tempted and details of flow of funds to each taluka of each plan scheme have been identified.
Five Years of the Seventh Plan
4.6 The Seventh Plan outlay for the State was Rs. 6000 crores. The likely expenditure of the plan amounts to Rs.5439 crores.
4.7 During the first three years of the Seventh Plan, large scale drought conditions adversely affected agricultural produc tion and entitled massive expenditure in the form of the rural works, out of Rs, 1300 crores spent on relief messures during the drought years of 1985-88 over Rs. 1133 crores were spent on minor irrigation, soil and water conservation, water supply, rural roads, animal husbandary schemes, which are akin to those taken under normal plan programmes in these sectors Togather with the expenditure on such schemes, the likely expenditure of plan programmes during the Seventh Plan is likely to be Rs. 6572 crores.
Eighth Five Year Plan 1990-95 £ Annual Plan 1991-92
4.8 An outlay of Rs. 1451 crores has been provided for the Annual Plan1990-91. The proposals for the Eighth Five Year Plan amount to Rs. 10,000 crores and of the Annual Plan 1991-92 amounts to Rs. 1700 crores.
4.9 The inter sectoral distribution of the outlay has been determined on the following considerations:-
(i) To generate additional employment opportunities on a suffi ciently large scale and in a widely dispersed manner by way of moving closer to the provision of right to work.
(ii) To provide adequately for the Sardar Sarovar Project (Narmada Project)(iii)Timely and expeditious completion of on-going programmes and
projects; and especially providing adequate funds for.externally aided projects as per agreements entered into with aid giving agencies
(iv) Achieving social transformation through imporved access to basic minimum needs such as education, health, water supply, etc., especially by members of the SC/ST , women and persons living below poverty line.
(v) Balanced development,not only amongst various sectors but also among different regions of the State.
(vi) Push forward the already high levels of democratic decen tralisation achieved in the state through enhanced public partic ipation both in the decision making and in the funding of local ly significant programmes.
4.10 The proposed size of the Eighth Five Year Plan conforms to the guide line of the Planning Commission The suggested outlay of Rs. 10,000 crores is well within the norm of 80 to 85 percent of the investments in the
30
Seventh Five Year Plan- Rs.5400 crores. The Annual Plan for 1990-91 is of the size of Rs.1451 crores; the proposed size of the Annual Plan for1991-92 is Rs. 1700 crores. The proposed size works out to 17 per cent of the Five Year Plan outlay, conforming to observed levels of investment for the second year of previous Five Year Plans.
31
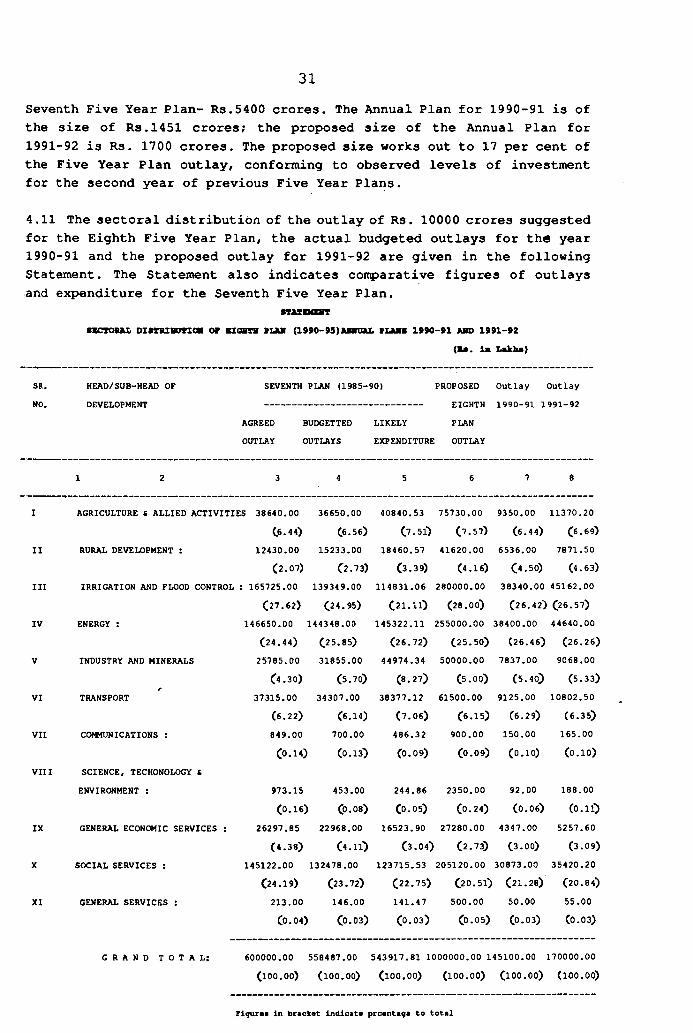
4.11 The sectoral distribution of the outlay of Rs. 10000 crores suggested for the Eighth Five Year Plan, the actual budgeted outlays for th« year1990-91 and the proposed outlay for 1991-92 are given in the following Statement. The Statement also indicates con?>arative figures of outlays and expenditure for the Seventh Five Year Plan.
njawHKst
■ECTOSAX. DISTSIBDTXGH OF KIOBTH VLM ( 1 9 9 0 - 9 5 ) A » m a P lJU lf 1 9 9 0 -9 1 JUTO 1 9 9 1 -9 2
(Bs. 1b Lakha)
SR,MO.
HEAD/SUB-HEAD OF DEVELOPMENT
SEVENTH PLAN (1985-90)
AGREEDOUTLAY
BUDGETTEDOUTLAYS
PROPOSED Outlay Outlay-------- EIGHTH 1990-91 1991-92LIKELY PLANEXPENDITURE OUTLAY
1 2 3 4 5 6 7 8
I AGRICULTURE « ALLIED ACTIVITIES 38640.00 36650.00 40840.53 75730.00 9350.00 11370.20C6.44) (6.56) (7.51) (7.57) (6.44) (6.69)
II RURAL DEVELOPMENT : 12430.00 15233.00 18460.57 41620.00 6536.00 7871.50(2.07) (2.73) (3.39) (4.16) (4.50) (4.63)
III IRRIGATION AND FLOOD CONTROL ; 165725.00 139349.00 114831.06 280000.00 38340.00 45162.00C27.62) (24.95) (21.11) (28.00) (26.42) (26.57)
IV ENERGY : 146650.00 144348.00 145322.11 255000.00 38400.00 44640.00(24.44) (25.85) (26.72) (25.50) (26.46) (26.26)
V INDUSTRY AND MINERALS 25785.00 31855.00 44974.34 50000.00 7837.00 9068.00(4.30) (5.70) (8.27) (5.00) (5.40) (5.33)
VI TRANSPORT 37315.00 34307.00 38377.12 61500.00 9125.00 10802.50(6.22) (6.14) (7.06) (6.15) (6.29) (6.35)
VII COMMUNICATIONS ; 849.00 700.00 486.32 900.00 150.00 165.00(0.14) (0.13) (0.09) (0.09) (0.10) (o.io)
VIII SCIENCE, TECHONOLOGY CENVIRONMENT : 973.15 453.00 244.86 2350.00 92.00 188,00
(0.16) (0.08) (0.05) (0.24) (0.06) Co.11)IX GENERAL ECONCWIC SERVICES : 26297.85 22968.00 16523.90 27280.00 4347.00 5257.60
(4.38) (4.11) (3.04) (2.73) (3.00) (3.09)X SOCIAL SERVICES : 145122.00 132478.00 123715.53 205120.00 30873.00 35420.20
(24.19) (23.72) (22.75) (20.51) (21.28) (20.84)XI GENERAL SERVICES : 213.00 146.00 141.47 500.00 50.00 55.00
(0.04) (0.03) (0.03) (0.05) (0.03) (0.03)
G R A N D T O T A L ; 600000.00 558487.00 543917.81 1000000.00 145100.00 :170000.00(100,00) (100.00) (lOO.OO) (100.00) (100.00) (100,00)
Figures in bracket indicat* prcantaga to total
4.12 A detailed statement showing sectoral and sub-sectoral distribution of these outlays is set out at the end of this chapter (Appendix A)
32
4.13 High priority has been given for development programmes in rural areas. The outlay on Agriculture, Rural Development, Coop eration and Irrigation amounts to 39.73 percent of the total outlay The key sectors of Irrigation and Energy account for 53.50 per cent of outlay. The share of Industries and Minerals is 5.00 per cent; Transport and Communication account for 6.97 per cent The Social and Economic services, including Decentralised Dis trict Planning, account for 23.53 per cent of the outlay. It will be seen from the percentages of investments to various sectors of development that the inter-se priority among various sectors of development have been kept at levels consistent with the past trends and with the current requirements. For exaitple,the need for investments in gasbased power generation with a quick gesta tion period accounts for the increase in investment in energy sector. Inter sectoral allocations for the Annual Plans of 1990- 91 and 1991-92 conform to the pre priorities assigned in the Eighth Five Year
4.14 The highest priority is investment for the Sardar Sarovar (Narmada) Project. The Narmada Project will bring under irriga tion 18 lakh hectares of cultivated area in 3334 villages of 62 talukas of 12 out of 19 districts of Gujarat. It will also pro vide drinking water to 4'720 villages and 131 urban areas in the State. This project will also extend to cover some parts of kachchh. North Gujarat and Saurashtra that are subject to scarci ty and have limited water resources. It is also planned to provide water by lift from the Narmada system to some of the arid areas that cannot be covered through flow irrigation. The setting up of the Sardar Sarovar Narmada Nigum Ltd., would help to channelise institutional funds for the expeditious implementation of the project.
4.15 In order to take necessary measures to satisfy the basic requirements of the people, the State Government is supplying foodgrains at subsidised rates to the weaker sections. This programme aims at providing nutrition to the economically weaker sections of the society at subsidised rates with the objectives of
(i) strengthening the hiaman capital and (ii) making direct attack on poverty. An innovative measure for providing foodgrains to parents of primary school going children to encourage regular attendence of this wards and towards reducing the levels of dropouts in schools.
4.16 The programmes of social and community services are geared to meet the basic needs of the area/people so as to irrprove the quality of life . Priority is accorded to to the programmes of providing drinking water to the villages, approach roads, basic health cover for rural ar^as, rural
areas, rural housing, elemen try education and nutrition. Special attention is being paid to the needs of women and children.
4.17 The development needs of scheduled tribes and scheduled castes are being met through the mechanism of Tribal Area Sub- Plan and the Special Component Plan for the scheduled castes. Care has been taken to provide adequate funds out of the divisi ble pool for these programmes. The programmes benefitting so cially and educationally backward classes will be accelerated.
4.18 The State has been among the pioneers in the Country in the matter of Decentralised District Planning. This programme has contributed significantly in translating local needs and aspira tions into tangible programmes of providing basic minimum needs of the population. The works taken up are primarily relating to provision of munimum needs such as rural roads, school rooms, water supply facilities, provision of basic health care, etc.. These funds are also available for upgrading rural roads, minor irrigation, tanks and other assets, Constructed during the year of scarcity so as to bring them to a productive stage. A feature of the Eighth Plan would be significantly enhanced levels of public participation in decision making and funding of local development programmes.
Key Targets of Production and Infrastructure
4.19 An additional foodgrain production potential of over 10 lakh tonnes is expected to be created during the Eighth Plan period raising the production potential level to 66.76 lakh tonnes by the end of 1994-95. The oilseed production potential level is likely to be of the order of 30.48 lakh tonnes by the end of 1994-95; in the case of cotton the target proposed for the Eighth Plan is to reach the level of 19.90 lakh bales by the end of 1994-95. The basic elements of the action strategy for in creasing crop production are:
- to increase the areas under high yieding varieties of crops from the level of 34.12 lakh hectares in 1989-90 to 37.25 lakh hectares at the end of 1994-95
- to raise the consuir^tion level of chemical fertilizers from 6.95 lakh tonnes at the end of 1989-90 to 7.75 lakh tonnes at the end of the 1994-95
- to bring an additional area of about 2.29 lakh hectares during the plan period under the soil conservation measures on watershed approach.
- transfer of technology to a large number of farmers within the shortest possible time
- to create an additional irrigation potential of 7.10 lakh hectares (including 5 lakh hectares of Narmada) as a result of major and medium
33
irrigation projects and 0.96 lakh hectares through minor irrigation works. Apart from tanks and bandharas, priority is being given to the percolation tanks and check dams which give indirect benefits by raising water levels.
- to intensify the programme of command area development through the extensive field channel works from all completed (having CCA 2000 Ha. to 10,000 Ha.) irrigation projects for fuller utilisation of potential created upto the end of the Seventh Plan and the projects under construction at present.
4.20 The installed capacity for power generation is likely to increase from 4823 MW at the end of the Seventh Plan to 6755 MW at the end of the Eighth Plan. Thus, there will be an addition of 1932 MW. to the power system. Given the rising cost of power generation and dificulties in transportation of coal over long distance, energy conservation would have to be taken up as a mass movement during the Eighth Plan. Equally significant will be planning and early completion of gas based power projects.
4.21 The net addition of 5000 kms. to the road network has been targetted to raise the total length to 68 993 kms. by the end of Eighth Plan 1994-95. It is proposed to provide pucca road links to all the remaining villages during the Eighth Plan peri od.
4.22 Under the programme of rural housing it is proposed to allot 1.5 lakhs sites during the Eighth Plan period and to pro vide construction assistance to 1.70 lakh allottees during the Eighth Plan period.
4.23 Under the massive programme of skill building and voca tional training, it is proposed to introduce additional 8000 seats in ITI courses raising the total intake capacity to 40428 seats at the end of 1994--95 (including grant in aid).
4.24 Under the Minimum Needs Programme, the targets proposed for the Eighth Plan are as under
- appointment of 15000 primary school teachers to take care of 3.07 lakh additional children in the age group 6-10 and lakh children in the age group 11-13.
- provision of safe drinking water facilities to 3200 no source villages with the ultimate objective of providing safe drinking water to all villages.
- connecting 3435 villages with pucca roads.
In the sphere of public health consolidating the measures taken up in the Seventh Plan.
34
1 i } ^ rrr~ .o IS i r~' r~“1 — l i Cr ONI Y35
- Providing construction assistance to 1.70 lakh allottees of free plots.
- accelerating the programme of environmental ixtprovement of slums to cover 4.00 lakh additional beneficieries.
by way of reducing the incidence of malnutrition augment provisions for special nutrition programmes covering children in the age group 0-6 and nursing mothers belonging to weaker sec tions of the society. In the Eighth Plan, 3.90 lakh additional beneficieries would be covered.
“ the number of integreted child development blocks (ICDS) is proposed to be increased from 127 at the end of Seventh Plan to 177 by the end of Eighth Plan. These centres provide nutritional services to children and woman alongwith a package of child and mother care services.
4.25 A Statement showing the selected physical targets proposed to be achieved by the end of Eighth Plan 1990-95, alongwith tihe targets for Annual Plan 1990-91 and 1991-92 may be seen in Appendlx~B
iub, xNan-n:)! Sysr=-..,s Unii, Nntioral h - , r ; n , t e ,f tv’ucation«|
..................
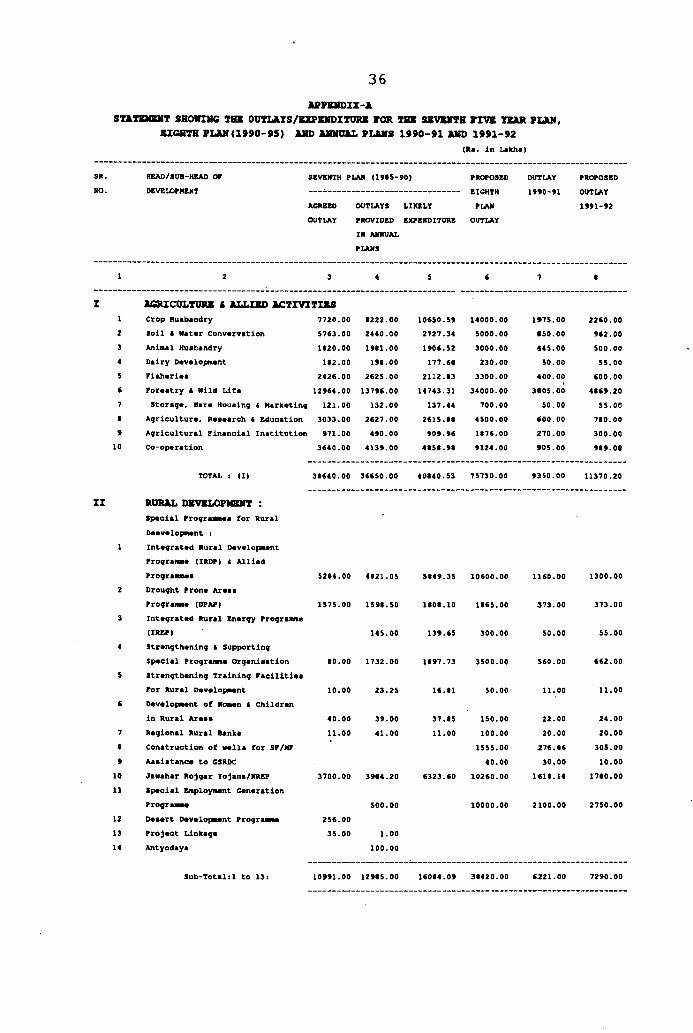
APPBMDZX’ASTJLTBNBNT SHOWIVG THB OUTIATS/BXPSIIDITUKS WOR THE SBVSHTH FIVE TKAR PLAN,
SIGHTH PLAN(1990-95) AHD AMiniAL PLAMS 1990-91 AMD 1991-92(Ra. in Lakh*)
36
SR.NO.
HEAD/SUB-HEAO OF DEVELOPMENT
SEVENTH PLAN (19t5-90)
AGREED OUTLAYS LIKELYOUTLAY PROVIDED EXPENDITURE
IN ANNUAL PLANS
PROPOSEDEIGHTHPLAN
OUTLAY
OUTLAY19S0-91
PROPOSEDOUTLAY1991-92
1 2 3 4 5 6 7 *
I A G R Z C U L T U R B C A L L Z X D AC'IIVITIXS1 Crop Huabandry 7720.00 •222.00 10650.59 14000.00 1975.00 2260.002 Soil t Natar Convervatlon 5763.00 2440.00 2727.34 5000.00 •50.00 962.003 Anlaal Huabandry 1120.00 19*1.00 1906.52 3000.00 445.00 500.004 Dairy Development 1S2.00 19*.00 177.6* 230.00 50.00 55.005 Flaherlea 2426.00 2625.00 2112.*3 3300.00 400.00 600.006 Foreatry 4 Wild Life 12964.00 13796.00 14743.31 34000.00 3*05.00 4*69.207 Storage, Dare Houalng 4 Marketing 121.00 132.00 137.44 700.00 50.00 55.00• Agriculture, Reaearch 4 Education 3033.00 2627.00 2615.** 4500.00 600.00 7*0.009 Agricultural Financial Inatltutlon 971.00 490.00 909.96 1*76.00 270.00 300.0010 Co-operation 3640.00 4139.00 4*5*.9* 9124.00 905.00 9*9.00
TOTAL : (I) 3t640.00 36650.00 40*40.53 75730.00 9350.00 11370.20
II R U R A L D B V S L O P N S M T :Special Prograanea Cor Rural Deevelopnent :
•
1 Integrated Rural Development Prograiuae (IRDP) 4 AlliedPrograamea 52*4.00 4^21.05 5*49.35 10600.00 1160.00 1300.00
2 Drought Prone AreaaPrograme (DPAP) 1575.00 159^.SO 1*0*.10 1*65.00 373.00 373.00
3 Integrated Rural Energy Progranme(IREP) 145.00 139.65 300.00 50.00 55.00
4 Strengthening 4 SupportingSpecial Progranme Organiaatlon • 0.00 1732.00 1*97,73 3500.00 560.00 662.00
5 Strengthening Training FacilitleaFor Rural Development 10.00 23.25 16.*1 50.00 11.00 11.00
C Development of Women 4 Childrenin Rural Areaa 40.00 39.00 37. *5 150.00 22.00 24.00
7 Regional Rural Banka 11.00 41.00 11.00 100.00 20.00 20.00• Conatruction of wella for SF/MF 1555.00 276.*6 305.009 Aaaiatance to GSRDC 40.00 30.00 10.0010 Jawahar Rojgar Yojana/NREP 3700.00 39*4.20 6323.60 10260.00 1«1*.14 17*0.0011 Special Employment Generation
Progranme 500.00 10000.00 2100.00 2750.0012 Deaert Development Programme 256.0013 Project Linkage 35.00 1.0014 Antyodaya 100.00
Sub-Total:! to 13: 10991.00 129*5.00 160*4.09 3*420.00 6221.00 7290.00
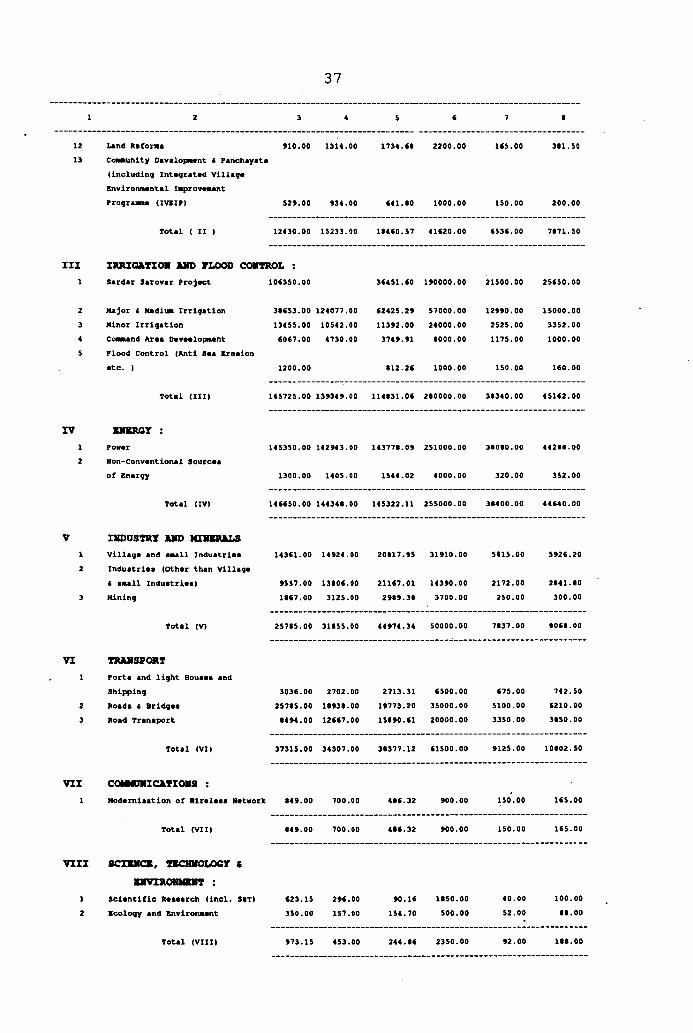
37
1 2 3 4 5 6 7 *
12 Land Raforma 910.00 1314.00 1734.60 2200.00 165.00 3*1.5013 Comunity Davalopnent C Panchayata
(Including Integrated VillageEnvironnental laprovaMentPrograMse (IVEIP) S2».00 934.00 641.ao 1000.00 150.00 200.00
Total < II ) 12430.00 15233.00 1^460.57 41620.00 6536.00 7871.50
III I R R I G X T I O M A N D F L O O D C O N T R O L :1 Sardar Sarovar Project 106350.00 36451.60 190000.00 21500.00 25650.00
2 Major < Nediw Irrigation 3S6S3.00 124077.00 62425.29 57000.00 12990.00 15000.003 Minor Irrigation 134SS.00 10542.00 11392.00 24000.00 2525.00 3352.004 Coinaand Area Deveelopnent 60C7.00 4730.00 3749.91 •000.00 1175.00 1000.00S Flood Control (Anti Sea Eroaion
etc. ) 1200.00 •12.26 1000.00 150.00 160.00
Total (III) 1«572S.00 139349.00 114^31.06 200000.00 3«340.00 45162.00
I V I N X R C Y :1 Power 14S3S0.00 142943.00 143770.09 251000.00 ato^o.oo 442*«.002 Non-Conventional Sourcea
of Energy 1300.00 1405.00 1544.02 4000.00 320.00 352.00
Total (IV> 1466S0.00 14434^.00 145322.11 255000.00 30400.00 44640.00
V I N D U S T R Y A N D K I N B R A L S1 village and amall Induatriea 14361.00 14924.00 20017.95 31910.00 5415.00 5926.202 Induatriea (Other than Village
C anall Induatriea) 9557.00 13006.00 21167.01 14390.00 2172.00 2041.^03 Mining 1S67.00 3125.00 2909.39 3700.00 250.00 300.00
Total (V) 25715.00 31^55.00 44974.34 50000.00 7*37.00 9060.00
V I TRANSPCaiT1 Porta and light Houaea and
Shipping 3036.00 2702.00 2713.31 6500.00 675.00 742.502 Roada 4 Bridgea 257tS.OO 1093^.00 19773.20 35000.00 5100.00 6210.003 Road Tranaport •494.00 12667.00 15090.61 20000.00 3350.00 3050.00
Total (VI) 37315.00 34307.00 3*377.12 61500.00 9125.00 10002.50
VI I C O M O N I C A T I C W S :1 Moderniaation of Nireleaa Network •49.00 700.00 4(6.32 900.00 150.00 165.00
Total (VII) •49.00 700.00 4(6.32 900.00 150.00 165.00
V I I I S CIK1K3, T B C H N O L O G T C
E N V Z R O N M m r :1 Scientific Reaearch (incl. S«T) 623.15 296.00 90.16 1050.00 40.00 100.002 Ecology and EnvironMnt 350.00 157.00 154.70 500.00 52.00 • •.00
Total (VIII) 973.15 453.00 244.»6 2350.00 92.00 loa.oo
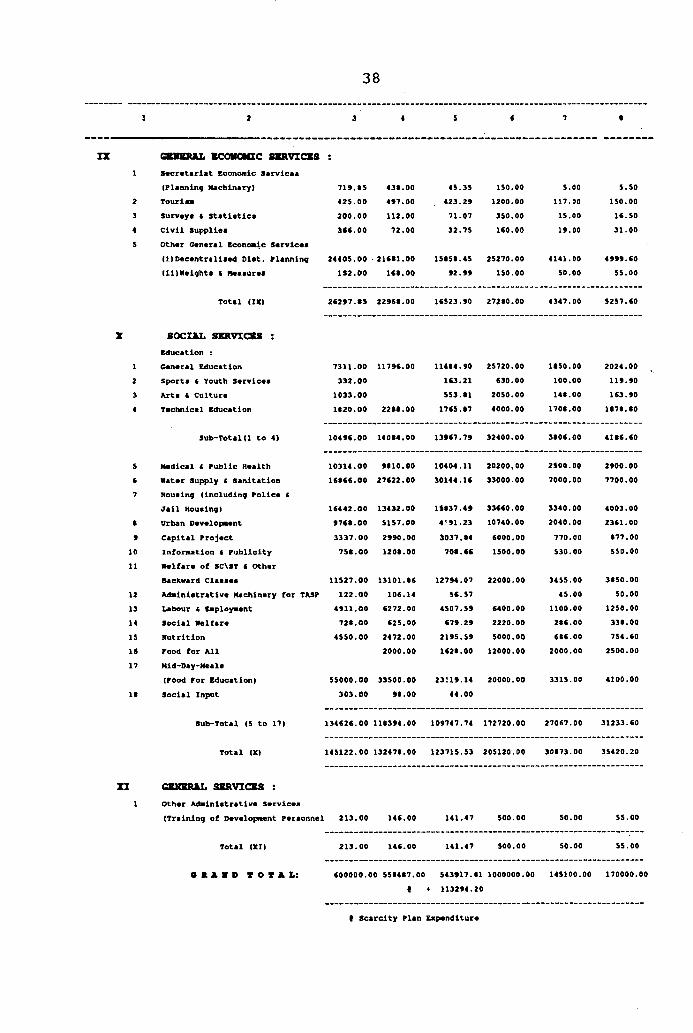
38
IX c a n n n a L s c o n o n x c s x r v z c b s
Secretariat Economic Sarvieaa(Planning Nachinary) 719.45 434.00 45.35 150.00 5.00 5.50
2 Tourism 42S.00 497.00 423.29 1200.00 117.00 150.003 Surveys C Statistics 200.00 112.00 71.07 350.00 15.00 16.504 Civil Supplies 366.00 72.00 32.75 160.00 19.00 31.005 Other General Economic Services
(1)Decentralised Dist. Planning 24405.00 21641.00 15454.45 25270.00 4141.00 4999.60(11)Heights < Measures 1S2.00 164.00 92.99 150.00 50.00 55.00
Total (IX) 26297.*S 22964.00 16523.90 27240.00 4347.00 5257.60
S O C I A L S B R V Z C B S :Education :
1 General Education 7311.00 11796.00 11444.90 25720.00 1450.00 2024,002 Sports 4 Youth Services 332.00 163.21 630.00 100.00 119.903 Arts 4 Culture 1033.00 S53.41 2050.00 144.00 163.904 Technical Education 1420.00 22M.00 1765.47 4000.00 1704.00 1474.40
Sub-Total(1 to 4) 10496.00 14044.00 13967.79 32400.00 3406.00 4146.60
Medical 4 Public Health 10314.00 9410.00 10404.11 20200,00 2SOO.OO 2900.00Water Su|H>ly 4 Sanitation 16466.00 27622.00 30144.16 33000.00 7000.00 7700.00Housing (including Police 4Jail Housing) 16442.00 13432.00 1S437.49 33660.00 3340.00 4003.00Urban Developmient 9764.00 5157.00 4'!91.23 10740.00 2040.00 2361.00Capital Project 3337.00 2990.00 3037.44 6000.00 770.00 •77.00Information 4 Publicity 754.00 1204.00 704.66 1500.00 530.00 550.00Welfare of SC\ST 4 OtherBaclcward Claases 11527.00 13101.46 12794.07 22000.00 3455.00 3450.00Administrative Machinery for TASP 122.00 106.14 56.57 45.00 50.00Labour 4 Employment 4911.00 6272.00 4507.59 6400.00 1100.00 1250,00Social Welfare 724.00 625.00 679.29 2220.00 246.00 334.00Nutrition 4550.00 2472.00 2195.59 5000.00 646.00 754.60Food for All 2000.00 1624.00 12000.00 2000.00 2500.00Mid-Day-Meals(Food For Education) 55000.00 33500.00 23U9.14 20000.00 3315.00 4100.00Social Input 303.00 94.00 44.00
Sub-Total (5 to 17) 134626.00 114394.00 109747.74 172720.00 27067.00 31233.60
Total (X) 145122.00 132474.00 123715.53 205120.00 30473.00 35420.20
X I G B M B R A L S X R V I C B S :1 other Administrative Services
(Training of Developnent Perse
Total (XI)
a K A V D T O T A L :
213.00 146.00 141,47 500.00 50.00 55.00
213.00 146.00 141.47 500.00 50.00 55.00
600000.00 554447.00 543917.41 1000000.00 145100.00 170000.00« + 113294.20
( Scarcity Plan Expenditure
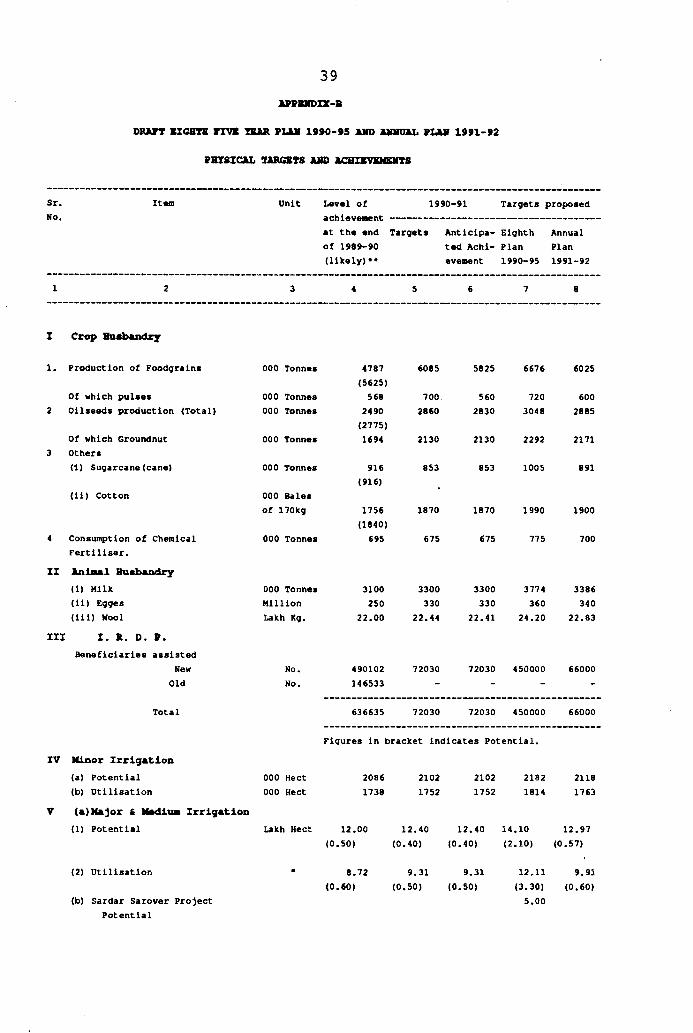
APPBMDZX-B
DRAFT KIGBTH YIVB TSAR PXJJI 1990-95 AMD AMliaAL PLUf 1991-92
PBT8ICAL XAROBTS AHD ACHIBVBMEiraS
39
Sr.No.
Item Unit Level of 1990-91 Targets proposed
at the end Targets Antlclpa- Eighth Annualof 1989-90 ted Achl- Plan Plan(likely)** evement 1990-95 1991-92
8
1 Crop IbiMbanArj
1. Production of Foodgrains
Of which pulses2 Oilseeds production (Total)
Of which Groundnut3 Others
(1) Sugarcane(cane)
(li) Cotton
4 Consumption of Chemical Fertiliser.
II AnlMl Husbandry(i) Milk(ii) Egges(iii) Wool
III I. R. D. P.Beneficiaries assisted
NewOld
000 Tonnes
000 Tonnes 000 Tonnes
000 Tonnes
000 Tonnes
000 Bales of 170kg
000 Tonnes
000 Tonnes Million Lakh Kg.
No.No.
4787(5625)5682490(2775)1694
916(916)
1756(1840)695
3100250
22.00
490102146533
6085
700.2860
2130
853
1870
675
3300330
22.44
72030
5825
5602830
2130
853
3300330
22.41
6676
7203048
2292
1005
3774360
24.20
6025
6002885
2171
891
1870 1990 1900
675 775 700
3386340
22.83
72030 450000 66000
Total
IV Minor Irrigation(a) Potential(b) Utilisation
V (a) Major C Mm U u s Irrigation(1) Potential
000 Hect 000 Hect
636635 72030 72030 450000 66000
Figures in bracket Indicates Potential.
20861738
21021752
2102
175221821814
21181763
Lakh Hect 12.00 (0.50)
12.40 12.40 14.10 12.97(0.40) (0.40) (2.10) (0.57)
(2) Utilisation
(b) Sardar Sarover Project Potential
8.72(0.60)
9.31(0.50)
9.31(0.50)
12,11 9.91(3.30) (0.60)5.00
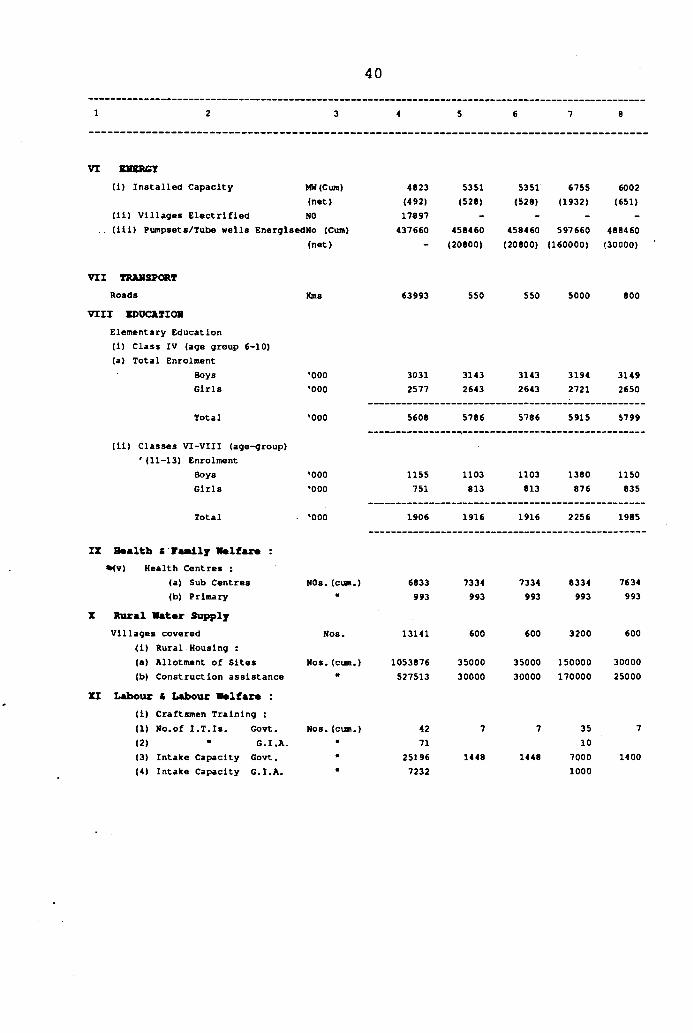
40
1 2 3 4 5 6 7 8
VI BMXRCT(i) Installed Capacity MH(Cum)
(net)4823(492)
5351(528)
5351(528)
6755(1932)
6002(651)
(11) Villages Electrified NO 17897 - - - -
VII
(ill) Pumpsets/Tube wells EnerglsedNo (Cum)(net)
; TRANSP(»IT
437660 458460(20800)
458460(20800)
597660(160000)
488460(30000)
Roads VIII BDUCATIOM
Elementary Education(1) Class IV (age group 6-10)(a) Total Enrolment
Kms 63993 550 550 5000 800
Boys '000 3031 3143 3143 3194 3149Girls '000 2577 2643 2643 2721 2650
Total
(11) Classes VI-VIII (age-group) ' (11-13) Enrolment
'000 5608 5786 5786 5915 5799
Boys '000 1155 1103 1103 1380 1150Girls '000 751 813 813 876 835
IX
Total
B«altb S raaily Ifolfan : %(v) Health Centres ;
. *000 1906 1916 1916 2256 1985
(a) Sub Centres NOs. (cum.) 6833 7334 7334 8334 7634
X(b) Primary
Rural Wat«r Supplym 993 993 993 993 993
Villages covered(1) Rural Housing :
Nos. 13141 600 600 3200 600
(a) Allotment of Sites Nos.(cum.) 1053876 35000 35000 150000 30000
XI(b) Construction assistance
Labour C Labour Walfar* :(1) Craftsmen Training :
• 527513 30000 30000 170000 25000
(1) No.of I.T.Is. Govt.(2) " G.I.A.
Nos.(cum.) » 4271
7 7 3510
7
(3) Intake Capacity Govt.(4) Intake Capacity G.I.A.
«II 25196
72321448 1448 7000
10001400
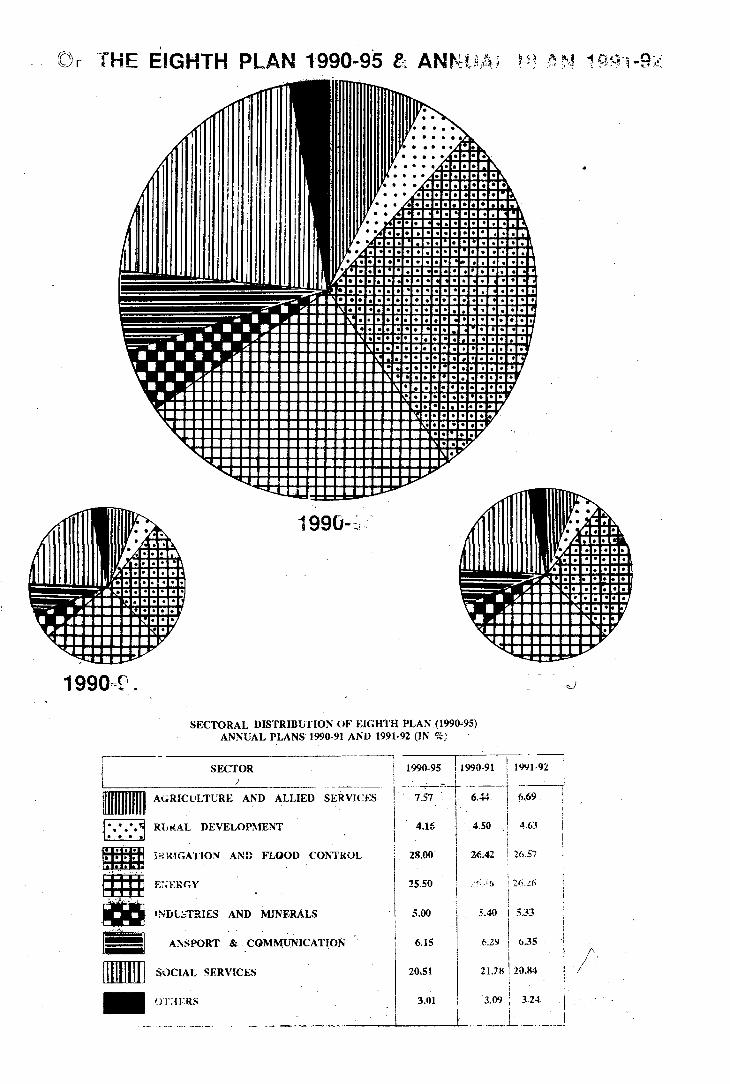
r THE EIGHTH PLAN 1990-95 & ANKllAi an,nrl
wr-.7
1990 r .
SECTORAL DISTRIBUTION OF EIGHTH PLAN (1990-95) ANNUAL PLANS 1990-91 AND 1991-92 (IN %)
11
u i a n a iauaain o n r i r
■H I
--------------------------------------- :-------------------------------jSECTOR !
/ ' 11990-95 ! 1990-91 1991-92 i
■ J
AGRICULTURE AND ALLIED SERVlCt^S ■ . 7.57 6.44 .69 !
RUkAL DEVELOPMENT 4.16 4.50 , 4.63 Ii
I^<K10ArI0N AND FLOOD CONTROL 28.00 26:421
26.57
ENERGY 25.501
i 2 6 .2 6 t 1 I
‘NDLSTRIES AND MINERALS 5.00 S.40 I 533j
ANSPORT & COMMUNICATION 6.15 6.29 6.35 i!
SOCIAL SERVICES 20.51 21.28 20.84
OI’HERS 3.01 3.09 i 3,24. I
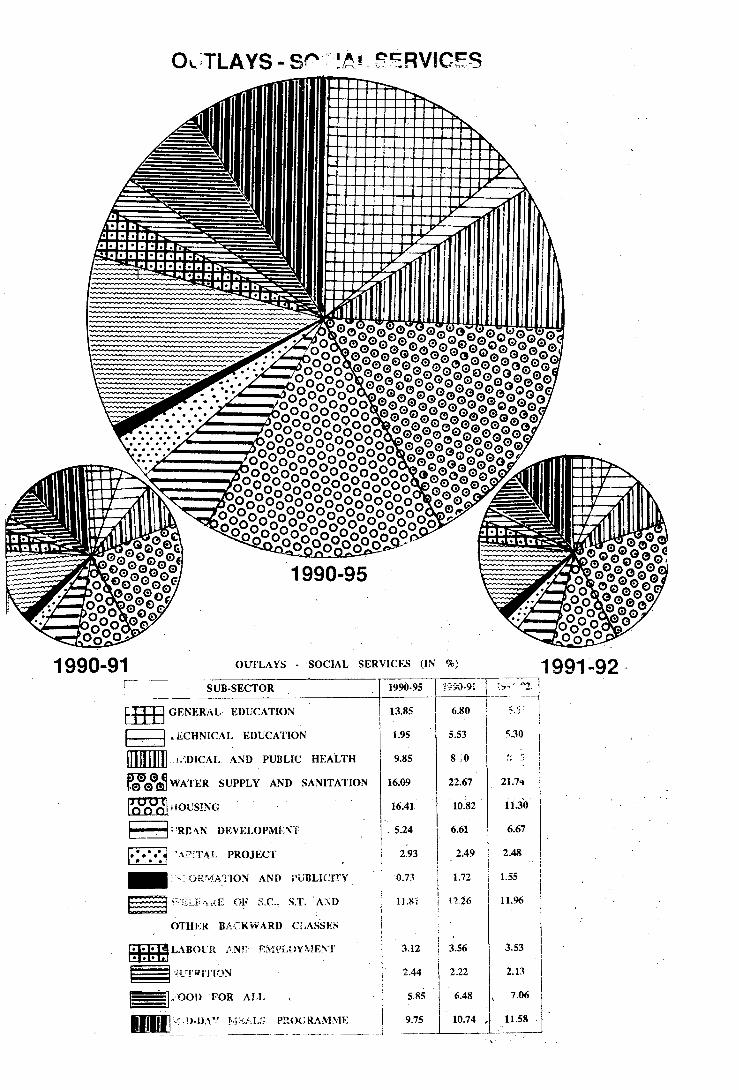
TLAYS - :AlAi pc: RVICES
1990-91 OUTLAYS - SOCIAL SERVICES (IN %) 1991 -92SUB-SECTOR
Ulllllll
GENERAL EDUCATION
.KCHNICAL EDUCATION
?,DICAL AND PUBLIC HEALTH
WATER SUPPLY AND SANITATION
jCLQlOlI* HOUSING■RDAN d e v e l o p m i;m
1990-95
;«*/«! APITA! PROJECr
V OKMATION AND PUBLICITY
OF S.C., S.T. 'AND
OTHER BACKWARD CLASSES
LABOUR ANP EMi'LJ )YMENT
JirrRiilON ,OOD FOR ALL
!>-DAV fjKALJ; PR(K;RAMME
aaataaan
ofly
13.85
I.95
9.85
16.09
16.41.
. 5.24
2.93
O.7.?
II.Si
3.12
2.44
5.85
9.75
1390-91
6.80
5.53
8 0 22.67
10.82
6.61
2.49
1.72
12.26
3.56
2.22
6.48
10.74
530
21.74
11 JO
6.67
2.48
I.55
II.96
3.53
2.13
7.06
11.58
CHAPTER - V
DECENTRALISED DISTRICT PLANNING
41
5.1 GENERAL
5.1.1. The first step in decentralization of developement activities was taken in 1963 when Panchayti Raj was ushered in the State. Many district level schemes were transferred to District Panchayats together with finacial allocations and necesssary staff. The irqplementation and monitoring of these schemes were also entrusted to the District PaVichayats. The district Collectors continued to supervise the implementation and monitoring of ' State level' schemes implemented at the district level, not transfered at the District Panchayat. There was no formal mechanism to enable suggestions from the district level with regard to the size and the coiqponent of schemes to be incorportated at the level of Head of Department.
5.1.2 Suggestions from the districts were invited with respect of district level schemes.The districts were required to submit te schemes within certain ceilings indicted to them. This method was also followed for the Five Year Plan 1978-83. A system of block level planning for full employement was also tried during this period and amounts were allocated for implementation of the Plan prepared by various Voluntary Agencies and Academic Institutions and expert bodies.
5.1.3 Decentralised District Planning, on a full-fledged scale, was introduced in the State from 14th Novembeer, 1980 with the setting up of District Planning Boards. For the first time, considerable untied fund was placed at their discretion.
5.2 COMPOSITION
5.2.1. District Planning Boards are broad based and represent various intrests adequately. The Chairman of each Planning Board is a Minister of the State. The District Collector is the Vice-Chairman and the district Panchayat President is Co- Vice-Chairman. The composition of the District Planning Board is as under :-
42
A Minister of State Government ChairmanThe District Collector Vice-ChairmanDistrict Panchyat President Co vice-CharimanTaluka Panchayat Presidentsof all taluka of the district MemberAll M.L.A.s elected from the district MemberAll M.P.s elected from the district MemberPresident of one of the Municipalitiesin the district MemberMayor of the Municipal Corporation MemberMunicipal Commissioner MemberThe President of one of the NagarPanchayats of the district MemberAn expert from a Reasearch Institute MemberA representative of the district Lead Bank MemberChairman, District Central Co-operative Bank MemberDistrict Development Officer MemberProject Administrator, Tribal Area MemberSub-Plan.A Member of the State Planning Board MemberChairman of Social Justice Committee Memberof the District.A Lady Member of Jilla Panchayat Member( to be nominated by Jilla Panchayat)District' Planning Officer Member-
SecretaryDistrictStatisticalOfficer Additional
Member-Secretary
Officer of the G.A.D (Planning Division) Observer
5.2.2. The functions of the District Planning Board are:
1. To prepare a prespective plan, five year plan and the annual plan of the district.
2. To frame specific schemes in various fields to be funded from the outlays under Decentralised District Planning.
3. To ensure maximum participation from the local bodies, the public and voluntary agencies.
4. To undertake a regular review and evalution of district level schemes and strive to remove bottlenecks in their implementation.
5.2.3. Besides the above functions, District Planning Boards alsohave certain other functions entrusted to them; prominent among them are;
moni-toring of Minimum Needs programmes in the district, identifying infrastructural support required for the family oriented programme for removal of poverty and providing adeopiate outlays for it and monitoring its progress at the disctict level.
5.2.4. The District Planning Board is assisted by three Committees:
The Executive Committee
Sub-Committee of Employment Generation
The Taluka Planning Committee
BXECUTIVB CONNITTSE
5.2.5. The Executive Planning Cmmittee is a conpact committee and includes the Collector, the District Panchayat President, the District Development Officer and the District Planning Officer, Member of Legislative Assembly and Taluka Panchayat Pramakhs.
5.2.6. The Executive Planning committee assists the District Planning Board in a number of ways. Every proposal comming up for funding from the district Planning outlays has first to be placed before the Executive Planning Comittee and scruntinized by it. This ensures that proposals coming up before the District Planning Board are in accordance with the guide-lines issued by Government from time to time. It also ensure that there is ade quate scrutiny of schemes before they come up to the District Planning Board. The Executive Planning Committee also monitors the progress of schemes, identifies bottlenecks and takes steps to remove them.
THE SX7B-C0MMITTEE FOR EMPLOIEMENT GENERATION
5.2.7. The sub-committee for Eitqployment generation is headed by the Collector and has the District Development Officer as vice- chairman. It is intended to focus attention on manpower and enployment aspects at the district level.
5.3. TALUKA PLANNING COMMITTEE
5.3.1. To formulate proposals against the distribution of discre tionary and incentive outlay eutiongst talukas, Taluka Planning committees have been constituted by District Planning Boards. Districst Planing Boards are instructed to convey the likely allotment of discretionary and incentive outlays to Taluka Plan ning Committee well in advance. Taluka Planning Committees formu late the proposals looking to the urgent need of villages within the limit of likely allocation and also to suggest priorities.
43
5.4 SBCRBTARIAT OF THE DISTRICT PLANNING BOARD
5.4.1. Each District Planning Board is provided with a small corrplement of staff headed by a District Planning Officer, who works directly under the supervision of the Collector . District Planning Officers have been provided with jeeps to enable them to visit talukas and projects funded by the District Planning Board for expediting inclementation, inspection of works, investigating complaints etc.
5.5 DISTRICT PIJOT OUTLAYS
5.5.1 The District Plan outlay has three parts viz.(1)outlays for normal district level schemes (2)discretionary outlay against which District Planning Boards can select the schemes which they consider useful having regard to local needs and (3) incentive outlay to be allocated against the funds raised by the Districts.
5.5.2. Details regarding the outlay provided for district level schems ( including discretionary and incentive outlays) out of the state plan outlays for the period of Eighth Plan 1990-95 Annual Plans, 1990-91 and1991-92 in the following table:
44
Year Total Outlay for district level schemes
State (Rs. in Crores)
planOutlays Normal
DistrictlevelSchemes
Discretionary & incent ive outlay.
Total (col.3+4)
Percentage.
1 2 3 4 5 6
1990-951990-911991-92
10000.001451.001700.00
3562.80540.30634.79
252.7041.4149.99
3815.50581.71684.77
38.1640.0940.28
5.5.3 Discretionary and incentive outlays are placed at the displsal of the District Planning Boards. They have discretion to decide on schemes of local in^ortance especially of minimum needs programme and execute them through the concerned Department or organisation. The District Planning Boards can finance projects on 100% basis from the discretionary component of the District Plan outlay, while the incentive outlay requires a matching contribution of 50, 25 or 10 percent depending upon the pattern prescribed
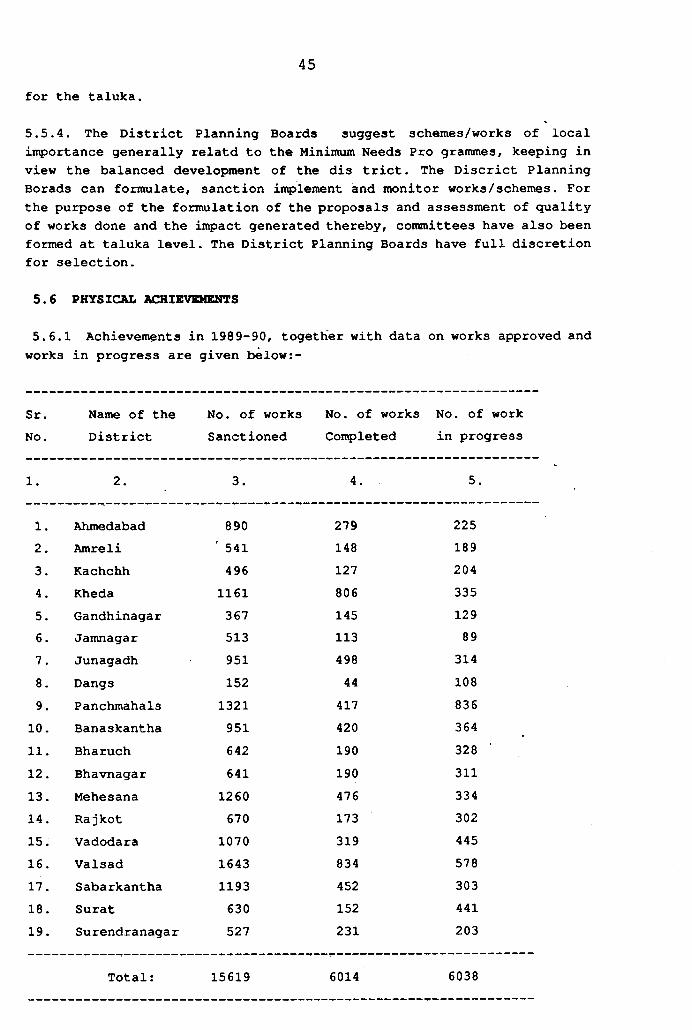
45for the taluka.
5.5.4. The District Planning Boards suggest schemes/works of local inportance generally relatd to the Minimum Needs Pro grammes, keeping in view the balanced development of the dis trict. The Discrict Planning Borads can formulate, sanction inqplement and monitor works/schemes. For the purpose of the formulation of the proposals and assessment of quality of works done and the inpact generated thereby, committees have also been formed at taluka level. The District Planning Boards have full discretion for selection.
5.6 PHYSICAL ACHIEVEKENTS
5.6.1 Achievements in 1989-90, togeth er with data on works approved and works in progress are given below:-
Sr. Name of the No. of works No. of works No. of workNo. District Sanctioned Coitpleted in progress
1. 2. 3. 4. 5.
1. Ahmedabad 890 279 2252. Amreli ' 541 148 1893. Kachchh 496 127 2044. Kheda 1161 806 3355. Gandhinagar 367 145 1296. Jamnagar 513 113 897. Junagadh 951 498 3148. Dangs 152 44 1089. Panchmahals 1321 417 83610. Banaskantha 951 420 36411. Bharuch 642 190 32812. Bhavnagar 641 190 31113. Mehesana 1260 476 33414. Rajkot 670 173 30215. Vadodara 1070 319 44516. Valsad 1643 834 57817. Sabarkantha 1193 452 30318. Surat 630 152 44119. Surendranagar 527 231 203
Total: 15619 6014 6038
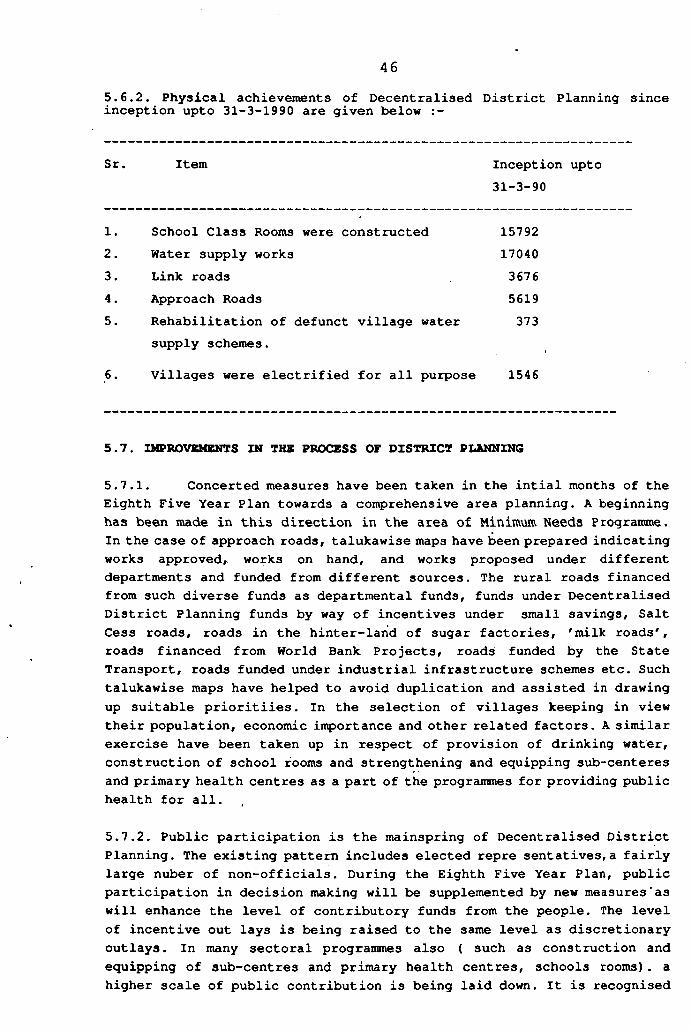
5.6.2. Physical achievements of Decentralised District Planning since inception upto 31-3-1990 are given below
46
Sr. Item Inception upto31-3-90
1. School Class Rooms were constructed 157922. Water supply works 170403. Link roads 36764. Approach Roads 56195. Rehabilitation of defunct village water 373
supply schemes.
6. Villages were electrified for all purpose 1546
5.7. IMPROVEMENTS IN THE PROCESS OF DISTRICT PLANNING
5.7.1. Concerted measures have been taken in the intial months of the Eighth Five Year Plan towards a comprehensive area planning. A beginning has been made in this direction in the area of Minimum Needs Programme. In the case of approach roads, talukawise maps have been prepared indicating works approved,, works on hand, and works proposed under different departments and funded from different sources. The rural roads financed from such diverse funds as departmental funds, funds under Decentralised District Planning funds by way of incentives under small savings. Salt Cess roads, roads in the hinter-laxid of sugar factories, 'milk roads', roads financed from World Bank Projects, roads funded by the State Transport, roads funded under industrial infrastructure schemes etc. Such talukawise maps have helped to avoid duplication and assisted in drawing up suitable prioritiies. In the selection of villages keeping in view their population, economic importance and other related factors. A similar exercise have been taken up in respect of provision of drinking water, construction of school rooms and strengthening and equipping sub-centeres and primary health centres as a part of the programmes for providing public health for all.
5.7.2. Public participation is the mainspring of Decentralised District Planning. The existing pattern includes elected repre sentatives,a fairly large nuber of non-officials. During the Eighth Five Year Plan, public participation in decision making will be supplemented by new measures‘as will enhance the level of contributory funds from the people. The level of incentive out lays is being raised to the same level as discretionary outlays. In many sectoral programmes also ( such as construction and equipping of sub-centres and primary health centres, schools rooms). a higher scale of public contribution is being laid down. It is recognised
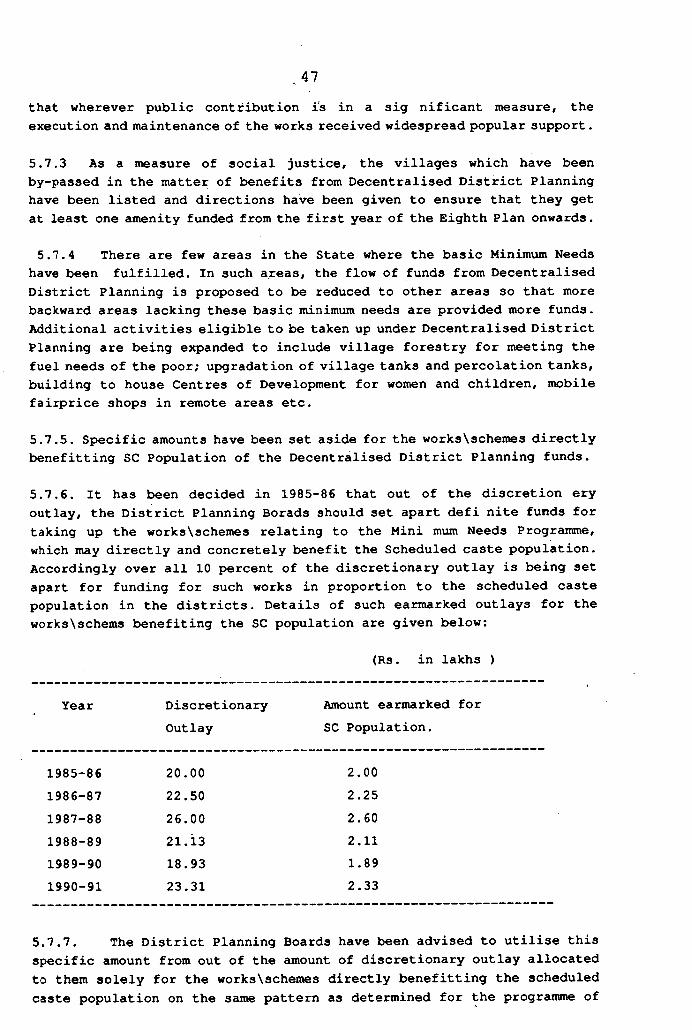
that wherever public contribution is in a sig nificant measure, the execution and maintenance of the works received widespread popular support.
5.7.3 As a measure of social justice, the villages which have been by-passed in the matter of benefits from Decentralised District Planning have been listed and directions have been given to ensure that they get at least one amenity funded from the first year of the Eighth Plan onwards.
5.7.4 There are few areas in the State where the basic Minimum Needs have been fulfilled. In such areas, the flow of funds from Decentralised District Planning is proposed to be reduced to other areas so that more backward areas lacking these basic minimum needs are provided more funds. Additional activities eligible to be taken up under Decentralised District Planning are being expanded to include village forestry for meeting the fuel needs of the poor; upgradation of village tanks and percolation tanks, building to house Centres of Development for women and children, mobile fairprice shops in remote areas etc.
5.7.5. Specific amounts have been set aside for the works\schemes directly benefitting SC Population of the Decentralised District Planning funds.
5.7.6. It has been decided in 1985-86 that out of the discretion ery outlay, the District Planning Borads should set apart defi nite funds for taking up the works\schemes relating to the Mini mum Needs Programme, which may directly and concretely benefit the Scheduled caste population. Accordingly over all 10 percent of the discretionary outlay is being set apart for funding for such works in proportion to the scheduled caste population in the districts. Details of such earmarked outlays for the worksXschems benefiting the SC population are given below:
(Rs. in lakhs )
* 47
Year DiscretionaryOutlay
Amount earmarked for SC Population.
1985-86 20.00 2.001986-87 22.50 2.251987-88 26.00 2.601988-89 21.13 2.111989-90 18.93 1.891990-91 23.31 2.33
5.7.7. The District Planning Boards have been advised to utilise this specific amount from out of the amount of discretionary outlay allocated to them solely for the worksXschemes directly benefitting the scheduled caste population on the seune pattern as determined for the programme of
Decentralised District Planning. With a view to helping the Executive Committee in getting the proposals for such works promptly and getting them properly examined, the Disctict Planning Boards have been advised to set up a small screening committee under the chairmanship of the Collector with the district Panchayat President Chairman, District Social Justice Coiranittee, District Development Officer and District Backward Class Welfare Officer as members and the District Planning Officer as the Member Secretary.
5.8. DEVELOPMENT OF GEOGRAPHICALLY BACKNARD AREAS
5.8.1. In the year 1983-84, a new feature has been added to the process of Decentralised District Planning by earmarking specific amount towards developement of special backward areas in the state, which spread over the boundaries of more than one taluka and even of more than one district. An amount Rs.0.50 crores was provided during 1983-84. Under this programme works of Water Supply, Roads, Drainage, Plantation of trees, skill formation schemes etc. as per the needs of the area are under implementa tion. During the year 1988-89 an outlay of Rs.98.78 lakhs, and Rs.l60 lakhs have been provided for the year 1989-90 for this purpose. For the year 1990-91 an outlay of Rs. 100-00 lakhs has been provided, and for 1991-92 an outlay of Rs. 100 lakhs has been proposed.
5.9. DEVELOPMENT OF BACKWARD TALUKAS
5.9.1 During the period of Sixth Plan, the Government had appointed a Committee under the Chairmanship of Dr. I.G.Patel to identify Backward Talukas and Backward areas in the State. The Government has accepted the Committee's recommandation to treat 56 Talukas identified by it as economically backward talukas. Under Decentralised District Planning, during 1987-88 it has been decided to give 20 % additional amount of discretionary outlay allocated to 56 backward talukas. The same pattern has been continued in the year 1990-91, and 1991-92.
5.10. COMMUNITY WORKS OF LOCAL IMPORTANCE
5.10.1. The present pattern of decentralised district planning in the state involves allocation of funds, -mainly under the discre tionary incentive outlays to Districts and from the District to the talukas on the basis of certain economic parameters such as population, agricultural backwardness, backwardness in irriga tion, industry and other basic minimum neeeds. A small proportion of funds not exceeding 1/3 (one third) of the allocation is permited to be retained at the district level for schemes which may have to be implemented in areas covering’ more than one talu kas for benefitting the population of more than one talukas. The size and population of the talukas widely vary in the State on account of historical, geographical and ot!her factors; so it has not been possible to involve a suitable unit of uniform popula tion for the purpose of allocation of this fund and implemanta tion of progremimes, spanning over
48
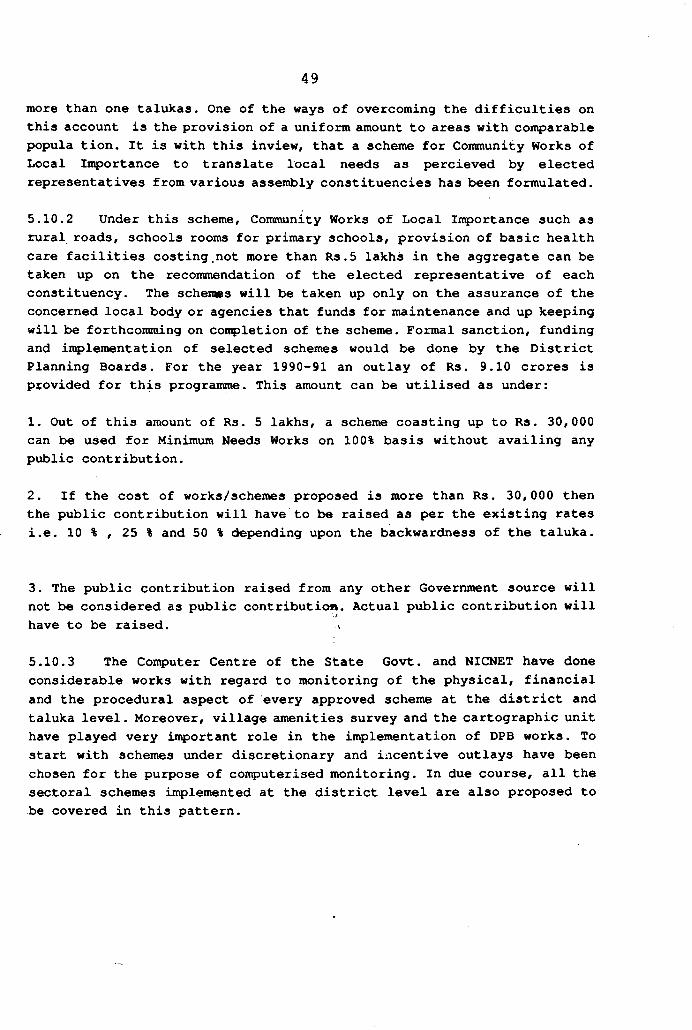
more than one talukas. One of the ways of overcoming the difficulties on this account is the provision of a uniform amount to areas with conparable popula tion. It is with this inview, that a scheme for Community Works of Local In^ortance to translate local needs as percieved by elected representatives from various assembly constituencies has been formulated.
5.10.2 Under this scheme. Community Works of Local Irrportance such as rural roads, schools rooms for primary schools, provision of basic health care facilities costing.not more than Rs.5 lakhs in the aggregate can be taken up on the recommendation of the elected representative of each constituency. The schemas will be taken up only on the assurance of the concerned local body or agencies that funds for maintenance and up keeping will be forthcomming on completion of the scheme. Formal sanction, funding and inplementation of selected schemes would be done by the District Planning Boards. For the year 1990-91 an outlay of Rs. 9.10 crores is provided for this programme. This amount can be utilised as under:
1. Out of this amount of Rs. 5 lakhs, a scheme coasting up to Rs. 30,000 can be used for Minimum Needs Works on 100% basis without availing any public contribution.
2. If the cost of works/schemes proposed is more than Rs. 30,000 then the public contribution will have to be raised as per the existing ratesi.e. 10 % , 25 % and 50 % depending upon the backwardness of the taluka.
49
3. The public contribution raised from any other Government source will not be considered as public contribution. Actual public contribution will have to be raised. .
5.10.3 The Conputer Centre of the State Govt, and NICNET have done considerable works with regard to monitoring of the physical, financial and the procedural aspect of every approved scheme at the district and taluka level. Moreover, village amenities survey and the cartographic unit have played very in^ortant role in the inclement at ion of DPB works. To start with schemes under discretionary and incentive outlays have been chosen for the purpose of con^juterised monitoring. In due course, all the sectoral schemes implemented at the district level are also proposed to be covered in this pattern.
50Outlays for the programne of Decentralised District Plazining
5.10.4 Details regarding the itemwise expenditure incurred during theSeventh Five Year Plan (1985-90) and outlay proposed for the Eighth Five Year Plan (1990-95) and in Annual Plans 1990- 91 and 1991-92 for the programmes under Decentralised District Planning are given in the following table.
( Rs. in Crores ](
Sr. Item No.
Outlay for
Seventh Plan Expedt. 1985-90
EighthPlanOutlay1990-95
AnnualPlanOutlay1990-91
Annual Plan Proposed Outlay 1991-92
1. 2. 3. 4. 5. 6.
1.Discretionary outlay 2.Incentive oytlay
99.8631.45
118.8573.25
23.316.00
23.4914.39
3.Provision for community works of local inportance.
4.Provision for dealing with problems of Spl.Backward Areas.
5.Provision for allocationto 56 Backward Talukas. 6.16
16.75
4.61
45.50 9.10 9.10
5.00 1.00 1.00
10.00 2.00 2.00
TOTAL 158.83 252.70 41.41 49.98
CHAPTER VI
TOWARDS INTEGRATED AREA PLANNING6.1 The shortcoming of a purely sectoral approach to development programme has been well recognised in Gujarat. In the early years of planning, since the setting up of the State in May, 1960, development programmes used to be drawn up by Heads of Departments in various sectors of development without much regard to the local needs and variation. The district authorities were cast in the role of implementors of programmes and had little role in the designing of programmes or suggesting modification in the operation of the programme. Whatever innovation took place in adopting such sectoral programmes to local needs was largely due to the ingenuity of field level functionaries, always vulnerable to the pools of centralization towards uniformaty and confirmity to a set- pattern for the entire State.
6.2 A certain element of flexibility was introduced in the implementation of development programmes in such fields as Agri culture. Animal Husbandry, Education, Public Health, Rural Roads. After 1963 the personnel, funds and operation of the programmes at the district level was transferred to Panchayati Raj Institu tions. Committees of knowledgable non-officials operating under the auspices of the District Panchayat and Taluka Panchayat were set up; these were assisted by erstwhile departmental officials, now placed under the administrative juridiction of the Panchay ats. Apart from inclementing the programmes, they also had a certain amount of flexibility in the matter of location, timing and other related aspects of programme of implementation.
6.3 The formation of District Planning Boards from November 1980 gave a further impetus to the process of decentralised planning. The sectoral programmes under implementation in the district were disaggregated insufficient detail show that every district could get a fair idea of the programmes under irrqplemen tation not only in that district but in other districts as well. In recent years, this information has been disaggregated even upto to the taluka level so that information about the outlays, expenditure and physical targets of sectoral schemes are suscep tible of being monitored at the district and taluka levels in the state. Specialised Committees for overseeing the Twenty Point Programme have also helped monitoring the key physical targets in respect of programmes relating to minimum needs, provision of infrasructure and poverty allevation programmes. To this extent, the rigours of centralisation in the designing and operation of development programotnes have been greatly mitigated in the State.
6.4 Conscious efforts have been taken in recent years in seve,ral fields of activity to bring about comprehensive area planning.
51
6.5 Planning of rural roads is a good exanple of such area planning. For each taluka , a detailed map has been prepared indicating, among other things, villages without road connections and the current status of the means of communication to such villages. Also shown are schemes approved, schemes under implementation and schemes under comletion from a wide variety of sources such as - departmental funds, funds from Decentralised District Planning, funds from incentives for small savings, funds from Command Area Development authorities, funds from State Transport Corporation, funds from the Salt Cess, Funds from NREP, RLEGP and J.R.Y. and counnterpart funds given by Sugar Facto ries, milk units and industrial undertakings located in remote areas and incentives for provision of infrastructure in the form of road. In each taluka, a list of villages without roads con nections has been drawn up and the sources of funds from all the above mentioned sources has been indicated year after year. This process has considerably helped officials and non-officials in Taluka Planning Committee and District Planning Boards while deciding the allocations for rural roads.It has also facilitated the funding of a part of the cost - such as earthwork under one programme such Jawahar Rojgar Yojana- or under Scarcity works and other parts such as metalling the road and provision of culverts through other sources of funds.These devices have helped to overcome problems arissing from rigid enfrastructure of various criteria governing the schemes (such as minimum labour component insisted upon in the JRY; or the criteria of distance from the village adopted in the Scarcity Works etc.) The publication of talukawise booklets and ma.ps has been a significant step in the direction of comprehensive area planning in the matter of rural roads.
6.6 Academic under-pinning for comprehensive area planning has long existed in Gujarat, particularly after detailed exercises taken up through a dozen or so academic institutions in respect of block level planning in full employment. Almost all the major Universities in the State, the Institute of Management, Gujarat Vidyapith, Operation Research Group, Vadodara participated in these exercises and drew up comprehensive plans for full employment, cutting across various sectors of development and focussing on a small area of the State, consisting of 50 to 100 villages on an average. The iitpetus to corrprehensive area plan ning also came from recommendations of a Committee under the Chairmanship of Dr. I.G.Patel to investigate into the levels of backwardness of different talukas and suggest remedial action. The implemention of the recommendation of this Committee was not confined to any one department but all development departments in the State.The current industrial policy of the State for example, is based significantly on the levels of backwardness of various talukas in the State as identified by this Committee. Similarly, the extent of public contribution required for securing matching assistance from the State Government is also dependent on the levels of backwardness as identified by this Committee.
52
6.7 The same elements of comprehensive area planning evident in the matter of rural roads can also be seen in the matter of planning for drinking water supply# construction of school rooms and in rural health facilities,
6.8 A comprehensive survey of village amenities, spanning over 70 items every year, and its publication in local language has also helped considerably in taking appropriate decision through united funds available at the district level. The list of items has been considerably expanded so also the range of enquiries with respect of each item so as to provide qualitatively superior -information to village level and taluka level planners.
6.9 Even in respect of programme implemented at the district level and the State level, elected non-officials and other experts outside the Government have a considerable say. At the t>eggining of each Five Year Plan, two or three days Seminars have been held in each district headquarters and one or two selected Taluka headc[uarters to elicit the views from a wide sp6ctr\am of non-officials in relation to various development programmes in operation in the area, including sectoral programmes administered from the district and State level. These suggestions are regu larly made available to the sectoral planners and a system of rigorous follow up has ensured that the suggestions are taken due note of in finalising and modifying existing programmes in rela tion to local needs.
6.10 In recent years, at the instance of Central Ministries, international organisations, bilateral donors and voluntary organisations, various comprehensive programmes at the districts, talukas and cluster of village level have been taken up in such areas as watershed development, development of women and chil dren, employment promotion and the like. A feature of some of these programme has been the bringing together of specialist from various deciplines to act over a limited geographical area, as has been the case in respect of watershed development programme. In the programme, expert from forestry, soil conservation, grass-land development, minor irrigation and geo-hydrology are working togeather to bring about comprehensive area development over a small geographical area as distinct from fragmented de partmentalised efforts in the past, often to the detriment of each other.
6.11 Efforts are also on hand to reduced the number of schemes of similar nature undertaken by a large number of agencies, as in the case of rural housing. There were 11 schemes with differing rates of subsidy, loans and other corrponents administered for different sections of people by different departments. Boards and Corporations. These have now been amalgamated into three schemes - one for the pooresrt sections of population, other for weaker sections such as SC/ST or agricultural labourers and third for the rest of the population. Such an avoidance of overlapping and duplication have helped in better service to various
53
segments of client population and avoid needless overhead costs of adminis tering small cpiantiim of funds through a large number of agencies.
6.12 Similar efforts would be needed in achieving a certain measure of convergence in respect of services for women and children at present these services are characterised by a high degree of departmentalism and fragmentation. Facilities for maternal and child care and care of pre-school children is under the Integrated Child Development Services operated by the Depart ment of Health. Primary and secondary schools are handled by the Department of Education; vocational training is handled by wide array of departments such as the Department of Cottage Indusa tries. Department of Rural Development, the Department of Tech nical Education and so on. The Welfare Schemes for women, such as provision of maternity benefits and pension is looked after by the Rural Labour Commissioner. Schemes for providing short term vocational training and provision of productive assets, both individually and in groups, is the concern of the Department of Rural Development under the programme of Developement of Women and Children in Rural Areas(DWCRA). In addition, an array of Developemnt Corporations for the SCs an STs, other backward classes, minorities etc., are also in operation, providing financial and other forms of assistranc^ towards raising lelvels of income of women. Traditional services such as those for orphans, the physically handicapped and other categories of women in distress continue to be handled by the Directorate of Social Defence. Coirprehensive programmes of development, including those for women and children are admininstered through Project Direc tors in Tribal Areas and for primitive groups located outside the tribal areas. Some districts have been chosen for specialised programmes for development of women and children such as the district of Banaskantha under the Samkhya programme with Dutch assistance. The Women Economic Development Corporation and the Commissionerate for the Developnvent of Women and Children has also been engaged in studies, surveys and wide ranging activii ties relating to the development of women.
6.13 There are a number of non-plan activities in this field, characterised by the sarnie features. Social Justice Committees operate in each district and taluka for prevention of atrocities on the members of the SCs and STs. Special regulations ensure that cases of untimely suicides among young married women and are investigated at' sufficiently high level in the police to ensure that there is no foul play. Measures for settling family dis putes, without taking recourse to lengthy procedures through conventional Courts are now available under Lok Adalats of which more than 300 have been held in the State in the recent years.
54
6.14 This range of services in respects of development of women and children and the wide array of agencies engaged in the field indicate the extent of problem involved and the complexities that have been taken into acount in striking a balance between the needs of specialists located in specialised agencies on the one hand and the effectiveness of op>eration by a single agency, on the other hand.
6.15 Efforts are on hand at the village level, to bring various facilities provided for women and children under one roof so that programmes of maternal and children care,pre-primary school education, vocational training for women, adult education for girls and women and other health and extension services could be located in the same premises so as to achieve a certain measure of coordination.
55
56CHAPTER -VII
EMPLOYMENT AND MANPOWER POSITION
7.1 INTRODUCTION
7.1.1 The population census 1981 registered a population of 3.41 croresfor Gujarat with a decadal growth rate of 27.7% (compared to 25% for the Country) . Gujarat has consistently recorded a higher rate of growth than that of all India during each of thedecades from 1901-1981.The annual rate of increase in State population declined from 2.6% during 1961-71 to 2.4% during 1971-81, indicating some impact of family planning programmes in arresting the expanding population.. The average annual natural increase in the population during the years (1981-86)is estimated from the results of the sanple registration scheme at the rate of 2.2%,the same may be applied to 1990-95 period of Eighth Five Year Plan till we get results of 1991 census.
7.1.2 The Expert Committee on Population projection has placed theestimates of population of Gujarat at 4.10 crores in 1991, 4.38 crores in 1996 and 4.65 crores in 2001. In the Eighth Plan period, Gujarat will have to manage a net addition of 5.6 lakh persons every year. The net addition to the population- in the age grops 15. to 59 (labour force) will be 17.79 lakh persons during the Eighth Plan.The total Labour force in the State in 1990 is about 155.55 lakhs, while during the last year of the Eighth Five Year Plan the total labour force is estimated to be at 173.29 lakhs.The new entrants during the Eighth Five Year Plan will be 17.79 lakhs and during 1991-92 will be 3.50 lakhs.
7.1.3 With 31% of its population living in urban areas, Gujarat is oneof the highly urbanised State of the Country. Urban population of the State is concentrated in large sized towns. About 50% of the urban population residing in 11 cities with a population of one lakh and above. Another 17% lives in 27 towns having population between half lakh to one lakh. The rest of the urban population is spread over 217 towns. This highconcentration of population in larjge towns has led to stress oninfrastructure, civic amenities, transportation housing particulary in the poverty pockets, slums where employment is meagre.
7.1.4 Measures for controlling high rate of growth of population of the State and growing concentration of urban population in large cities will have to be reviewed, attenpt has to be made to provide appropriate policy instruments and programmes in the Eighth Plan so that over a period of time the manpower growth and employment growth may reach to a matching point.
7.1.5 The growth of population and its diversified character different educational and skill levels lead to various complexities as well as the infrastuctural needs of training programmes and to the difficulties in
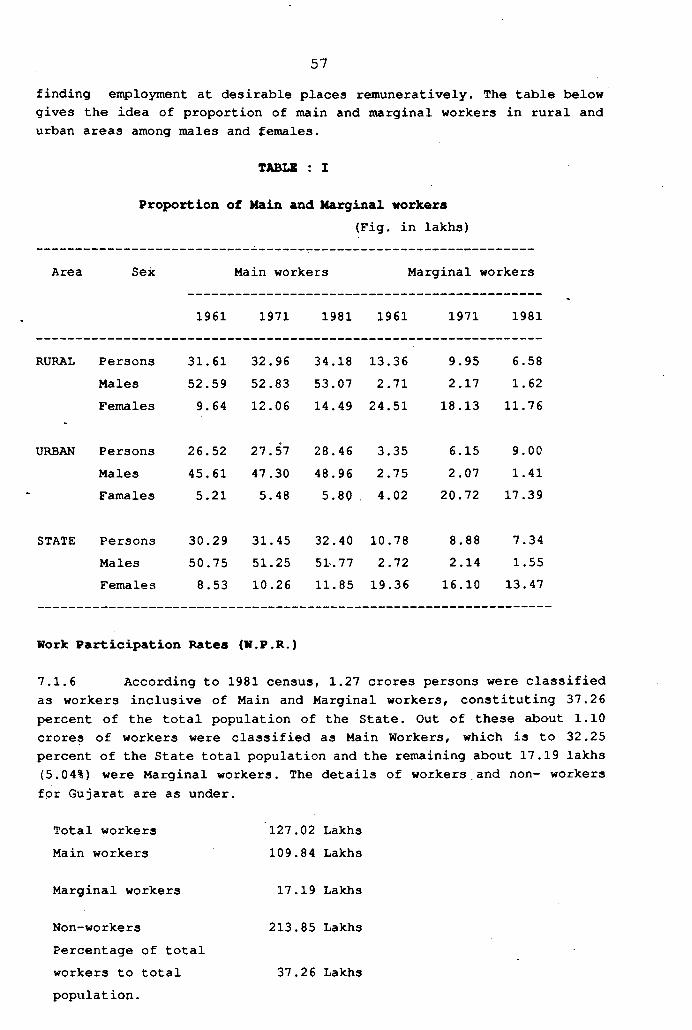
finding enployment at desirable places remuneratively. The table below gives the idea of proportion of main and marginal workers in rural and urban areas among males and females.
TABLE : I
Proportion of Main and Marginal workers(Fig. in lakhs)
57
Area Sex Main workers Marginal workers
1961 1971 1981 1961 1971 1981
RURAL Persons 31.61 32.96 34.18 13.36 9.95 6.58Males 52.59 52.83 53.07 2.71 2.17 1.62Females 9.64 12.06 14.49 24.51 18.13 11.76
URBAN Persons 26.52 27.57 28.46 3.35 6.15 9.00Males 45.61 47.30 48.96 2.75 2.07 1.41Famales 5.21 5.48 5.80 4.02 20.72 17.39
STATE Persons 30.29 31.45 32.40 10.78 8.88 7.34Males 50.75 51.25 51.77 2.72 2.14 1.55Females 8.53 10.26 11.85 19.36 16.10 13.47
Work Participation Rates (W.P.R.)
7.1.6 According to 1981 census, 1.27 crores persons were classifiedas workers inclusive of Main and Marginal workers, constituting 37.26 percent of the total population of the State. Out of these about 1.10 crores of workers were classified as Main Workers, which is to 32.25 percent of the State total population and the remaining about 17.19 lakhs (5.04%) were Marginal workers. The details of workers.and non- workers for Gujarat are as under.
Total workers Main workers
127.02 Lakhs 109.84 Lakhs
Marginal workers
Non-workers Percentage of total workers to total population.
17.19 Lakhs
213.85 Lakhs
37.26 Lakhs
Poverty and BaDplo mant
7.1.7 Poverty is one of the most critical of all the economic problems and what is more serious is, that it is a chronic problem. Poverty is a barrier between access and entitlement of the basic necessities of life of the free citizens of democratic Indep>endent country.Removal of poverty and unemployment are also the crucial conqponents of the strategy for growth with equity.In the National perspective of development poverty is planned to be eradicated and it is aimed to achieve near full en^loyment by the turn of the century. The first step to remove the barrier is to provide gainful work to atleast one member of the poverty ridden families. The efforts in this direction in the recent years, have resulted in achievements to some extent. It will, therefore, be necessary to fine-tune the poverty alleviation prograunnme.
7.1.8 The Planning Conanission has constituted an Advisory Group For poverty studies.This group is to conduct independent studies in certain specific areas especially on analysis of distribution of land and non-land assets,incidence of uneiqployment and levels of education and literacy.The recommendations of the group, when received, may form the basis for modifying programmes for eradication of poverty in the Eighth Five Year Plan.
7.1.9 Comparable estimates of incidence of poverty for the Country and State are prepared by the Planning Commission on the basis of information on household consximer expenditure collected in the quinquennial surveys conducted by the National Sanple Survey Organisation(NSSO). According to the estimates of Planning Commission the percentage of population below the poverty line in Gujarat State in 1983-84 was 24.3. Incidence of poverty in urban areas was found relatively less (17.3%) as coir ared to that in rural areas (27.6%).
Jks8«ssmant of th« Unemploymant
7.1.10 Unemployment position-As on 31st March, 1990: as many as 9.54 lakhs persons were registered as uneirqployed bn the live register of the en^loyment exchanges out of which 5.88 lakhs were educated youths. They are growing with a rate of about 50 to 56% per 5 Year Plan period.It is expected that total No. of unenqployed on live register will be 14.19 lakhs in 1995 out of which educated youths will be 8.69 lakhs which will be a serious threat to the present planning process and has to be managed by effective mot^ivation to the self-employment ventures or private sector en^loyment in small and cottage industries which are presently not so attractive to this group in coiq>arision to Govt, and public sector jobs.
58
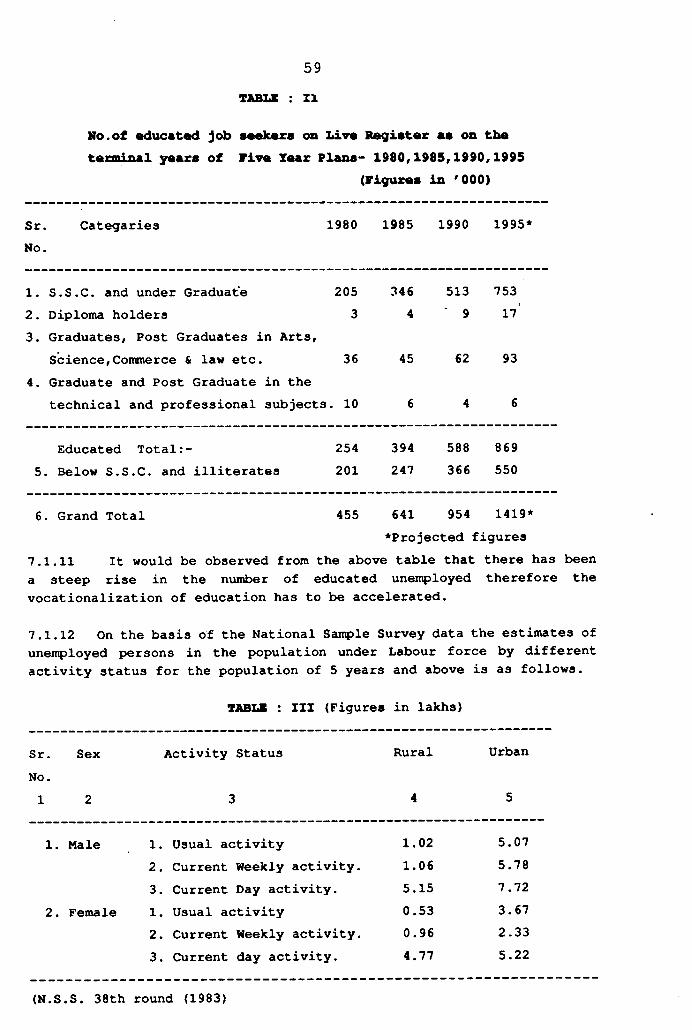
TABLE : IX59
No.of ttducated job seekars on Live Register as on the terminal years of Five Year Plans- 1980,1985,1990,1995
(Figures in '000)
Sr.No.
Categaries 1980 1985 1990 1995 ^
1. S.S.C. and under Graduate 205 346 513 7532. Diploma holders 3 4 ' 9 173. Graduates, Post Graduates in Arts,
Science,Commerce & law etc. 36 45 62 934. Graduate and Post Graduate in the
technical and professional subjects . 10 6 4 6
Educated Total 254 394 588 8695. Below S.S.C. and illiterates 201 247 366 550
6. Grand Total 455 641 954 1419*♦Projected figures
7.1.11 It would be observed from the above table that there has been a steep rise in the number of educated unemployed therefore the vocationalization of education has to be accelerated.
7.1.12 On the basis of the National Sair le Survey data the estimates of unemployed persons in the population under Labour force by different activity status for the population of 5 years and above is as follows.
TABIJI : III (Figures in lakhs)
Sr. Sex Activity Status Rural UrbanNo.1 2 3 4 5
1. Male 1. Usual activity 1.02 5.072. Current Weekly activity. 1.06 5.783. Current Day activity. 5.15 7.72
2. Female 1. Usual activity 0.53 3.672. Current Weekly activity. 0.96 2.333. Current day activity. 4.77 5.22
(N.S.S. 38th round (1983)
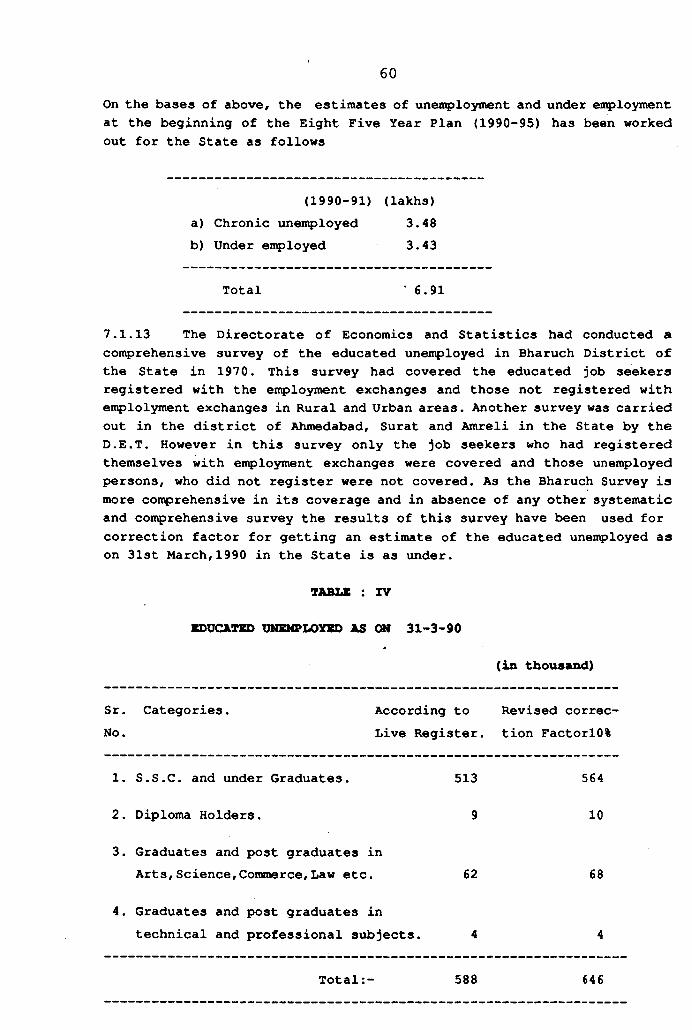
On the bases of above, the estimates of unemployment and under enqployment at the beginning of the Eight Five Year Plan (1990-95) has been worked out for the State as follows
60
(1990-91) (lakhs)a) Chronic unextployed 3.48b) Under enployed 3.43
Total ' 6.91
7.1.13 The Directorate of Economics and Statistics had conducted a coitqprehensive survey of the educated unenployed in Bharuch District of the State in 1970. This survey had covered the educated job seekers registered with the employment exchanges and those not registered with emplolyment exchanges in Rural and Urban areas. Another survey was carried out in the district of Ahmedabad, Surat and Amreli in the State by the D.E.T. However in this survey only the job seekers who had registered themselves with enployment exchanges were covered and those unemployed persons, who did not register were not covered. As the Bharuch Survey is more conprehensive in its coverage and in absence of any other systematic and comprehensive survey the results of this survey have been used for correction factor for getting an estimate of the educated unenployed as on 31st March,1990 in the State is as under.
TABLE : XV
BDUCATBD UMEMPLOYKD AS ON 31-3-90
(in thoiuiazid)
Sr. Categories. According to No. Live Register.
Revised correction Factorl0%
1. S.S.C. and under Graduates. 513 564
2. Diploma Holders. 9 10
3. Graduates and post graduates in Arts,Science,Commerce,Law etc. 62 68
4. Graduates and post graduates intechnical and professional subjects. 4 4
Total:- 588 646
7.1.14 The Director General, Err loyment and Training,Ministry of Labour, New Delhi has recently conducted a Sample Survey to ascertain the proportion of uneiqployed persons on the Live Registers of the Eir^loyment Exchanges. Xs per survey, on an average 56% of persons registered with the Employment Exhanges in Gujarat are unemployed# 32% are eitqployed and 12% are students. The total educated unenployed persons having qualification of S.S.C. and Diploma holders, Graduates and Post-graduates are 5.88 lakhs as on 31-3-1990. While 3.66 lakhs are unemployed. Against the total of 9.54 lakhs persons on Live Register as on 31-3-1990 unert^loyed estimated to be 5.34 lakhs.
7.1.15 Some insight into the magnitude of educated job seekers can also be obtained from the number of drop-outs at different levels of educattion and from the number of persons with terminal qualificattions. The number of drop-outs at the high-school stage (studied up to 7th standard but not continuing thereafter) works out to 2.33 lakhs in 1987-88. The number of students studying upto 10th but not appearing for the S.S.C. was around64,000 in 1987-88 and the number of students failing in the S.S.C. examination every year would be about 2.20 lakhs. They mostly join the list of unertployed registered or not registered.
7.1.16 One more fact of unemployment and low incomes is the number of people living below the poverty line. The Rural Development Department has conducted house-to-house surveys to estimate the number of families whose income was below Rs.6,400/- per annum. Their niunber in 1986-87 was11.47 lakhs it is estimated that families have crossed poverty line by March 1990 due to substained efforts.
7.1.17 Overall picture of unemployment is still not clear many people directly go to the employment market without getting registered with the Employment Exchanges while the enployees engage persons of various qualifications not always in appropriate jobs. Many people are pursuing studies while in jobs there may be people who are without jobs still not coming into contact of any agency. Out of a sizeable number of people coming out from educational institutions a sizeable proportion of women secure degress or diploma do not seek jobs specially after they are married. Some post-graduates in the field of engineering and medicines go for further higher studies abroad or other institutions. Statistics from the special census of Degree Holders(1971) provide to some extent a base to work out percentage of such persons seeking and not seeking work. However, this special census data is also not cortprehensive and due to considerable time-lag there are many changes in the pattern of status of these degree holders. Therefore, it is difficult to get the exact number of uneducated unenployed. A special survey is contenplated in the districts of Dangs and Gandhinagar to ascertain these facts. In the educated unenqployed also number remains constantly fluctuating.
61
7.1.18 Very wide fluctuations in the demand for employment and incomes arise in the State on account of recurrent drought. The number of persons engaged on relief works has varied from 8 lakhs to over 21 lakhs in the years of drought from 1986 to 1988. The pattern of rainfall being unpredictable, the dexnand for employment in the rural areas could be assumed at around 5 to 6 lakhs at any point of time. With 9.54 lakhs of job seekers inclusive of unskilled persons on the live register of the Eirployment Exchanges, the number of job seekers could be placed at around 15 lakhs the beginning of the Eighth Five Year Plan i.e. in the year1990-91 and 17 lakhs for the year 1991-92. However, all these job seekers are not necessarily unenployed the really unemployed are very difficult to get because even the poorest persson is busy for some time in a day hence the NSSO estimates of 6.91 or employment need of 4.99 person years.
62
7.1.19 The trends of formal sector En^loyment in Gujarat State based on EMI Reports.
Organised sector exDployment overall position
7.1.20 Total en^loyment in organised sector of economy in Gujarat State was 15.58 lakhs in 1988 which has increased from 15.13 lakhs in 1985. The position of 1990 is 16.12 lakhs as given below:
(Enployment in lakhs)
March,1985 March,1986 March,1987 March,1988 March,1989 March,1990.
15.13
(+3.9%)
15.30
(+1.12%)
15.44
(+0.9%)
15.58
- (+0.9%)
16.15
(+3.6%)
16.22
(+0.43%)
Population Bmployment ratio of organised sector March,1989
7.1.21 If we consider 198j. census population figures as base districtwise, per 1000 population employment position show many imbalances. There are only two districts that of Ahmedabad and Baroda which have formal sector employment more than 100 persons per 1000. population, only one district Gandhinagar is having 75 to 100 persons enployment per 1000 population while all other districts except Amreli,Sabarkantha and
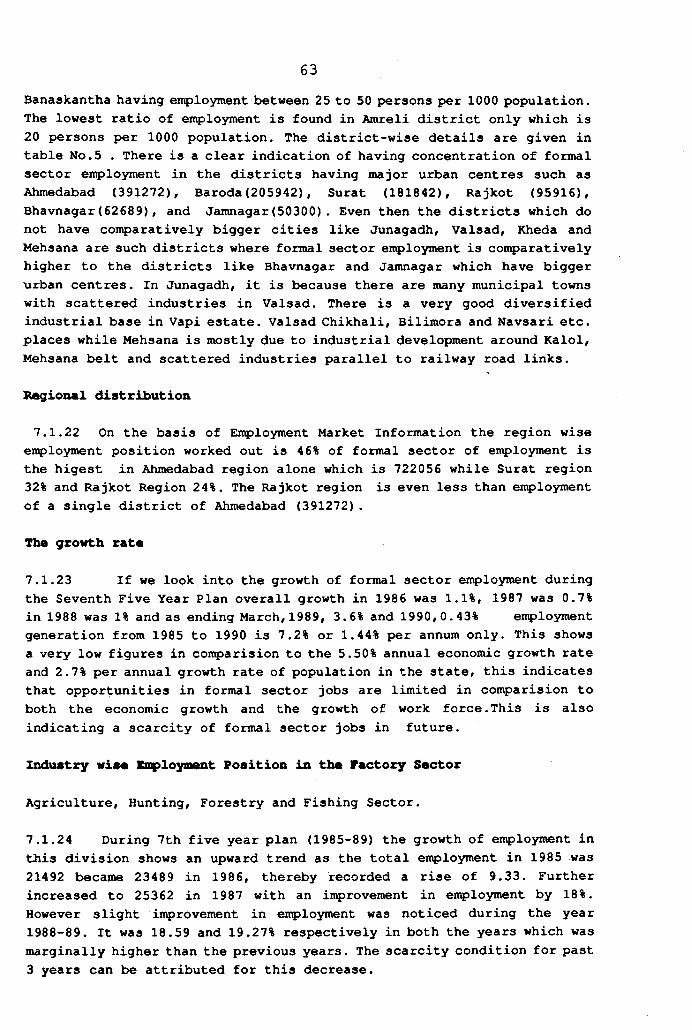
Banaskantha having enployment between 25 to 50 persons per 1000 population. The lowest ratio of employment is found in Amreli district only which is 20 persons per 1000 population. The district-wise details are given in table No.5 . There is a clear indication of having concentration of formal sector employment in the districts having major urban centres such as Ahmedabad (391272), Baroda(205942), Surat (181842), Rajkot (95916), Bhavnagar(62689), and Jamnagar(50300). Even then the districts which do not have conparatively bigger cities like Junagadh, Valsad, Kheda and Mehsana are such districts where formal sector enploj^ent is conparatively higher to the districts like Bhavnagar and Jamnagar which have bigger urban centres. In Junagadh, it is because there are many municipal towns with scattered industries in Valsad. There is a very good diversified industrial base in Vapi estate. Valsad Chikhali, Bilimora and Navsari etc. places while Mehsana is mostly due to industrial development around Kalol, Mehsana belt and scattered industries parallel to railway road links.
Begional distribution
7.1.22 On the basis of Emplo3 ent Market Information the region wise errployment position worked out is 46% of formal sector of employment is the higest in Ahmedabad region alone which is 722056 while Surat region 32% and Rajkot Region 24%. The Rajkot region is even less than employment of a single district of Ahmedabad (391272) .
Tha growth rat«
7.1.23 If we look into the growth of formal sector ert loyment during the Seventh Five Year Plan overall growth in 1986 was 1.1%, 1987 was 0.7% in 1988 was 1% and as ending March, 1989, 3.6% and 1990,0.43% ext loyment generation from 1985 to 1990 is 7.2% or 1.44% per annxam only. This shows a very low figures in coxrqparision to the 5.50% annual economic growth rate and 2.7% per annual growth rate of population in the state, this indicates that opportunities in formal sector jobs are limited in coit^arision to both the economic growth and the growth of work force.This is also indicating a scarcity of formal sector jobs in future.
Zxidustry wis« Eniployment Position in th« Factory Sector
Agriculture, Hunting, Forestry and Fishing Sector.
7.1.24 During 7th five year plan (1985-89) the growth of eniployment in this division shows an upward trend as the total enployment in 1985 was 21492 became 23489 in 1986, thereby recorded a rise of 9.33. Further increased to 25362 in 1987 with an iit¥>rovement in en sloyment by 18%. However slight in^rovement in eirqployment was noticed during the year 1988-89. It was 18.59 and 19.27% respectively in both the years which was marginally higher than the previous years. The scarcity condition for past 3 years can be attributed for this decrease.
63
Mining and Quarrying Sector
7.1.25 A constant declined was in the ertqployinent under the division of mining and quarrying as the total employment in 1985 was 19566 which came down to 19134 by recording a down fall of 2.20% in 1986. It was further reduced to 18748 (4.18%) during 1987.It showed downward trend during 1988 and 1989 by 5.11% and 5.02% respectively. The main reason for fall in the activities under this sector probably is due to more strict enforcement of enviranmental control orders inrespect of mining and quarrying.
Industry Division 2 & 3 (Manufactxiring)
7.1.2 6 The total employment provided in manufacturing division at the begining of Seventh Five Year Plan, was 589509. An insignifacant increase of 0.48% was there during 1986. A rise of 1.24% was further recorded during 1987. The ejqployment during 1988 and 1989 was declined by 0.91% of 2.09% respectively as total employment during years were 5376 and 12372 less as coir ared to the employment provided in 1985.
Industry Division and Blectri.city Gas and Water
7.1.27 The employment under this division was 38164 in 1985. It was increase by 594 (1.47%) during 1986. An increase of 4.67% was recovered during 1987. The total enploymnent has showed a considerable upward trend during 1988 and 1989 as it was increased by 4416 (11.65%) and 5632 (1.48%) as compared to the employment provided in 1985. The increase in eitqployment in this sector was due to further priority assigned to power at the same time considerable extension were under rural electrification activities.
Industry Dn.5 (Construction)
7.1.28 A steady rise was observed in eitployment generated during 7thFive year plan period as enployment provided during 1983 as 68657. There was rise of 1353 (1.97%) increase during 1986. The en >loyment furtherincreased 2542 (03.28%) duriung 1987. A steady progress employmentgeneration during 1988 and 1989 was recorded to 71199 and 72181 respectively which was 3.7% and 5.13% rise.
Industry Dn.No.7 (Transport storage and conamunication)
7.1.29 The total employment in the division was 177204 in 1985. A continuous fall in employment under this division was observed as it gone down by 6415. (-3.62) in 1985 and 9085 (-5.12%) in 1987. The eirqployment was further decreased at the rate of 2.69% during 1988 and 1.36% in 1989.The true picture of this sector may aot be reflected because most of establishments are under self employment activities having eitqployees less than 10.
64
Coomunity Social and Parsoxmal Sarvicaa
7.1.30 A study progress of employment generation in this division was observed. The employment in 1985 was 498831 was increased by 13029(2.61%) in 1986 and 26058(4.69%) in 1987.The rise was almost all double as it was increased by 40693(8.15%) in 1988 and 57293(11.48%) in 1989.
riziancial Insurazica raal astata az^ Businass Sarvica
7.1.31 The total employment in 1985 under this division was increasedby 4541 (5.58%) in 1986 and 649(0.79%) in 1987. The employment during 1988 and 1989 has further recorded an upward trend by 3753 (4.61%) and5871(+7.22%) respectively.
7.2 Baoploymant policiaa undar auccassion riva Yaar Plana
7.2.1 The major change in the strategies for en^loyment promotion has been noticed from the Fifth Five Year Plan when it was realised that percolation theory will not work in vast gaps of incomes and disparites, in our country hence direct attack on poverty is needed by providing directly means of liveli hood to the unprevelaged group of our society. There the en^hasis was given on the minimum needs of this group. The successive Sixth and Seventh Plans have adopted these schemes more specifically to help the poorest directly through Rural Development Programmes.
7.2.2 One of the prime objective of the Sixth plan (1980-85) was the progressive reduction in unexiployment in the country by achieving two major objectives.
(a) Reducing under en¥>loyment for majority of labour force.(b) Preferential treatment to labour intensive -
technologies/processes7.2.3 The emphasis was placed on self en^loyment schemes both in Agriculture, village and small industries and allied activities. The Seventh Five Year Plan was more specific to have direct attack on the poverty unerrployment and regional imbalances, Gujarat has achieved considerable progress in this regard.
7.3 A|)proach and Strategy foe tha anployment in tha Bighth riva Yaar Plan (1990-95)
7.3.1 The strategies and priorities for employment promotion in the State have followed the strategies and priorities at the National level.The Approach paper published by the Planning Commission on the Eighth Five Year Plan has recommended to reorient entire planning process to make it more eiq>loyment generation and removal of poverty in paras 5,18,19,117,128
65
(a)122 have repeatedly emphasised to introduce right to work i.e. scheme for full enqployment in rural areas as well as change in industrial and investment policies to encourage labour intensive village and cottage industries or service sector during the Eighth Five Year Plan by various financial or fiscal measures for generating more employment.
7.4 FOCUS OF BMPLOYMBNT GBNERATZON IN THE EIGHTH FIVE YEAR PLAN7.4.1 State Government has prepared proposals for the Eighth Five Year Plan keeping enployment generation in view which has been accorded high priority in allotment of more funds to such schemes which is 60% more than the Seventh Five Year Plan some important details of which are given below.
More investment has been made in the following schemes to generate more eitqployment.
1. Increasing en^loyment opportunities for unskilled persons- through wage employment schemes.
2. a) Increasing eir^loyment opportunities for skilledmanpower in industries-organised sector employment.
b)Increasing the facilities for skill acquisition in ITIs.and technical high schools through vocational training programmes.
3. Increasing en^loyment opportunities for educated technical manpower through private sector investment and incentive scheme in the field of self employment.
7.4.2 Special,Rural Development Programme like N.R.E.P.,D.P.A.P.and labourintensive programmessuch as WaterDevelopment,Forestry, Sewerageand- Water Supply, RoadsandBridges,SoilWaterConservation,CommandArea- Development, Fisheries, etc .generate sizeable eir¥>loymentopportunitiesfor unskilled persons.The Programme under village andSmalllndustries Sector with its capital out-put ratio and high employmentpotential alsohelp in a long wayinincreasing theemployment opportunities for unskilled manpower.
66
The employment opportunities generated under NREP/JRY, IRDP are given below (inclusive of Central share)
67
Year N.R.E.P. I.R.D.P.
(Lakh mandays) (No.of families covered in lakhs)
1983-84
1984-85
1985-86
1986-87
1987-88
1988-89
1989-90
133.14
99.61
69.71«
132.83
68.00
74.82
191.00*
1990-91(Targets) 135.33*
1991-92 267.00
1.74
1.60
1.55
1.01
1.48
1.30
1.02 * *
0.72
0.66
* Inclusive of Jawahar Rojgar Yojana.
** Family approach is adopted hence the overall Number of beneficiaries has reflected in less number.
7.5 ZERO UNEMPLOYMENT PROGRAMME
7.5.1 A major innovative step has been taken up for reducing unenployment to zero level.To begin with,during the year 1990-91 Gandhinagar and Dangs districts have been selected for this purpose. While details of the schemes are being worked out, an attenqpt is being made to assess the exact number of persons who are really unemployed and to assess the number of err loyment opportunities likely to be generated under the normal plan and to meet the shortfall between demand of employment and availability of it. Adequate autiount will be made available for generating full enployment to ensure that above short fall is removed. At least one person from each family is expected to be en?3loyed remuneratively in private-sector, public-sector, self-en^loyment or wage- enployment jobs.
This position of the districts will continue to be maintained during the Eigth Five Year Plan. In this direction an additional allocation of Rs.20 crores (Rs.l5 crores for Rural Development and Rs.5 crores for cottage industries) for this special employment programme during 1990-91 21crores,and the same amount for. 1991-92 and Rs.75 crores for the period of 1990-95. 3) As regards the educated persons (including technicalmanpower) while the sectoral development programmes like Crop Husbandary, Animal Husbandary, Fisheries and Forestry, Water and Power Development, Industries, Ports, Road Transport, Higher and Primary Education Housing, Sewerage and Water Supply etc. create a number of job opportunities, most of the programmes through their implementation provide sound infrastructure which indirectly results in increasing indirect employment opportunities. However, shortage in various categories of skilled and trained manhpower is being experienced despite the fact that there are number of educated job seekers on the live register. As a step towards solution to this mis-matching, number of surveys in industrial estates and area skill survey works of Vadodara, Bharuch and Mahesana are completed with a view to divert the persons coir^leting higher edducation towards vocational training. Skill acquisition programmes are being augmented through a programme for increasing skill formation for S.S.C.passed persons. Also in recent years, the scope of the self enployment programmes have been progressively widened to cover wide range of persons by introducing self employment among vocationally trained persons small business and the informal service sector. During 1990-91,a total 1.43 lakhs beneficiaries have been planned to be covered under the various self enployment schemes with a provision of 36.67 crores.
7.5.2 The new employment policy has been announced by the Government in July, 1990 to provide priority in the eirployment to local persons in the Central Public Sector Undertakings, State Public Sector Undertakings and all private industrial units set-up in the State in the following manner.
1) At-least 80% of the posts in the industrial units should be filled by local persons.
2) In Supervisory and Managerial categories at-least 50% of the posts should be filled up by local persons.
3) A new system be introduced to publish periodically full uptodate information in each Eit^loyment Exchange so that candidates can know what is their position in the Employment Exchange and how long he has to wait for the call of interivew.
4) Forming of District Employment Committees to provide a forum for discussing issues related to En^loyment Exchanges and general employment situation in the district.
68
7.6 Itew Industrial Policy
7.6.1 A new industrial policy has been declared in July,1990 which is aimed at re-orienting entire investment emnployment- oriented. The aim of the policy is to develop cottage industries, export industries and solve the problem of unenployment. The following are the salient features of this policy*
1) Government will encourage the promotion of empolyment oriented cottage and small scale industries and generate 10.OC lakhs jobs out of which 5.00 lakhs jobs will be generated during the Eighth Five Year Plan.
2) Planning of industries is being done in a way to cover more backward areas and to encourage village and handicrafts industries with following incentives.
i) Investment ceiling for cottage industries raised from Rs.35,000 to Rs.60,000.
ii) Presently 191 bankable schemes are approved. This list is added by including the schemes related to maintainance services, self en^loyment oriented and business activities also.
iii) All DICs will have a special team which will explore potentialities of each area for cottage industries for providing ext loyment locally.
iv) Govt. will organise taluka level village training programmeswherever there is a shortage.
v) Rural artisans engaged in cottage industries will get raw-materials like plastic, coal, wax, iron etc.on the lines of small industries.
vi) Government will provide marketing facilities to sell finished goods, and for purchase of raw-materials.
vii) Government will organise various marketing fares in in^ortant cities to sell handicraft items produced in cottage industries.
viii) A mobile training centre will be introduced to impart speedy and short-term training courses to rural artisans in different parts of the state.
ix) A separate cell like Indext(c) to provide services to cottage and rural industries on the lines of Indext(b).
69
x) Ceiling of the subsidy for purchasing of equipments for esting raw-materials etc. has been raised form Rs.1,000 to Rs.5,000 to help the units to improve the quality of their products.
3) Special scheme has been declared to promote the growth of electronics industries in the State.
4) Concession should be provided for sales tax to the healthy units whichwant to the take over sick units on the basis of total investment for revival of such units.
5) Special scheme to promote prestigeous Industries by 100% concession of sales tax to pioneer 100% export-oriented and prestigeous industries products.
Major Axttas for «af>loyment gexMiration in thm Stata
1) The IPCL has established one gas based petro-chemnicals con^lex in Gujarat. A new Gas based petro-chemical kcomplex in the private sector at Hajira is coming up with an investment of Rs.2500 crores. IPCL will invest 2200 crores at Vagara Bharuch district. A 100% export oriented steel project is being established at Hajira at an estimated expendit^ure of Rs.2000 crores. crores
2) A Con^any promoted by GIIC for the production of refrigerant gas has started production. The company has capital investment of Rs.28 crores and is located at Ranjitnagar in Panch Mahals District.
3) GIIC is one of the institutions which has been selected under Venture Capital Finance Scheme of the World Bank. The Scheme provides for assitance to projects based on new technology or involving higher risk.
4) The Gujarat State Financial Corporation has sanctioned loans totalling Rs.155 crores to 1841 units.
5) A Gamma Radiation project is being established in Kerala Industrial Estate at a distance of 40 kms from Ahmedabad.
6) According to a survey commissioned by the State Government, carried out through Gandhi Labour Institute, as many as 15,000 workers of the closed textile mills of Ahmedabad have come forward for alternative jobs. As per their preference the Government has prepared a special package of alternative enployment in the diamond industry, handicrafts, powrlooms handloom products, production of ready made garments and bankable scheme of cottage industries.
7) Diamond Industry has played an in^ortant part in providing employment to unemployed workers. In order to iit art training for three months and to provide employment, the foundation of a diaunond park was laid at
70
Makarpura at Baroda district with a proposed investment of Rs.lO crores.
8) With a view to give en^loyment to the unemployed mill workers, a diamond park has been started at Naroda in Ahmedabad. It envisages to provide een^loyment to 25,000 workers in this park.
9) The first Diamond Trade Centre is being established at a cost of Rs.80 c'/ores at Sachin near Surat. The centre will provide enployment to50,000 persons.
10) The Government is planning to establish a Jewellery Park in the vicinity of Ahmedabad air port as major to augment employment opportunities by increasing the production of gold ornaments and diamond or other jewelled orgaments,consequent upon abolition of the Gold Control Act.
Sardar Sarovar Projact
7.6.2 The State has taken the Sardar Sarovar Project on the top priority basis. An outlay of 215 crores is provided for the year 1990-91 the provision for Eighth Five Year Plan for this project is 1900 crores.The speedy inplementation of the project will generated not only considerable enployment due to works but due to tremandous increase in irrigated area in the command of the project area.
Substantial Zncrttasa In outlays of labour intansiv« azul aaaployiaant orlantad progranmas
7.6.3 We have discussed above the reorientation of Eighth Five Year Plan for enqployment generation.This will be more evident from outlays given for the Eighth Five Year Plan particularly for rural development, flood control power development and industrial development.Total outlay for eiq5loyroent-oriented schemes in Seventh Five Year Plan was only 3916.44 crores against which Eighth Plan provides a provision of Rs. 6253.36 crores which is almost 60% more than Seventh plan. Even in this outlay, most labour-intensive schemes like rural Development Programme which aimed at providing wage en^loyment under Jawahar Rojgar Yojana etc. has been given an increase of 347% i.e. Rs.270 crores against Rs.60 corres in the Seventh plan. For eir loyment generation power sector there will be an increase of 565% i.e. enployment of 6.52 person years against 0.98 lakhs persons years in the Seventh plan. Similarly, other employment- oriented sector like Industries which has already declared its new policy to give priority to village and cottage industries and job- oriented projects has been given a rise of 224% in outlay i.e for which an outlay of Rs.391 crores has been proposed against the outlay of Rs.l20 crores in the Seventh plan. Similarly, an increase in jobs will be 20% more i.e. generation of almost 10.00 lakhs new jobs against only 3.12 lakhs jobs was target in the Seventh Plan. Other schemes have given increase been discussed in details with the respective chapters of the plan therefore, in brief, the Govt, of Gujarat has attenqpted to take a very revolutionary step in the direction of
71
achieving full einployxnent by 2000 AD and « t-least full employment to family-wise one member during this Eighth plan period.
The Nehru Rojgar Yojan is also being considered to help the urban poor to the supplimentry employment to the similar to Jawahar Rojgar Yojana to needed rural poor.
Th« main •lements of th« general strategy for enployinent generation would be
7.6.4 1. Intensive implementation of Special Rural DevelopmentProgrammes viz. IRDP,DPAP,DDP, and Zero Unemployment Programme as the enqployment generation programmes through wage/self employment.
2. Identification of main thurst areas for development such as Narmada Project, Petro Chemical Complex near Hajira etc.and removing the bottle necks of the conomy such as shortage of power, water shortage, lack of trained manpower etc.
3. Emphasis on market coitpetitiveness in the field of high technology areas such as computer technology/electronics, plastic processing etc.
4. Increasing jobs opportunities in agriculture by augmenting irrigation potential and optimising its utilisation, encouraging multiple cropping and switchover to more labourintensive crops,introducing measures for increased productivity through labour intensive methods.
5. Exploring to the utmost the possibilities of increased income and enployment through dairying, poultry and marine and inland water fisheries and forestry.
■6. Developing basic infrastructure facilities such as road,electricity, transport both from the view point of increased employment opportunities during the construction phase and maintenance subsequently and the support these would provide for gainfual economic activity in the growth centres in the backward areas.
7. A massive shift in favour of small and cottage industries and adoption of a conscious policy of dispersal to ensure the increased flow of benefits to the more backward areas.
8. Adoption of concerted measures for encouraging self err loyment in all categories and small scale productive areas of self employment and vigorously implementing the new self employment schemes.
9. Extending training facilities for developing skills particularly for rural artisans and the educated unen^loyed.
72
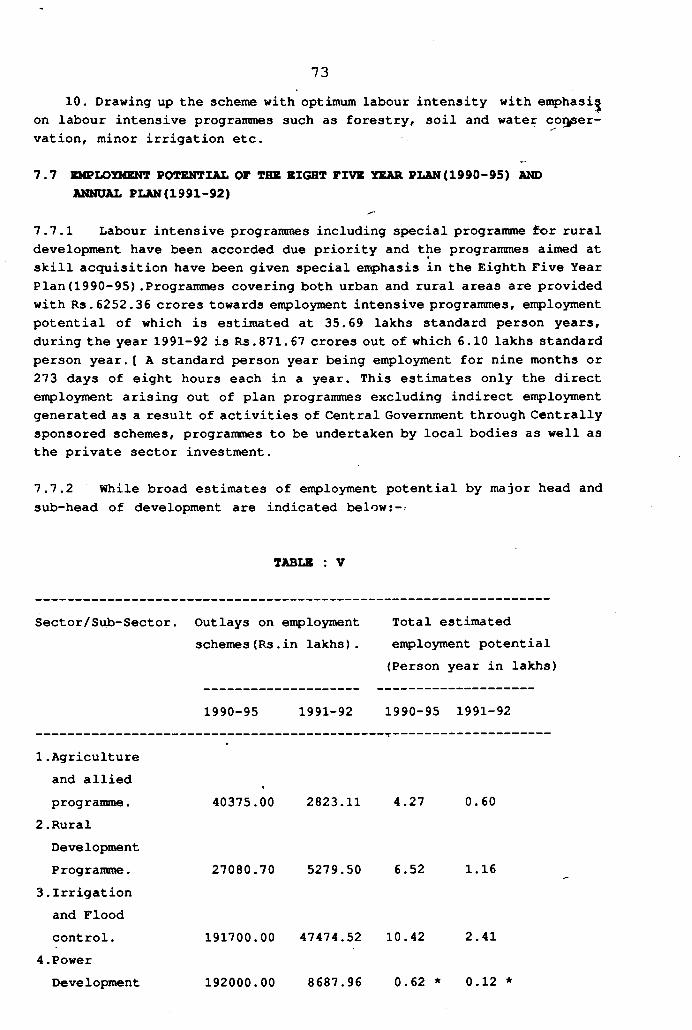
10. Drawing up the scheme with optimum labour intensity with emphasi^ on labour intensive programmes such as forestry, soil and water co^er- vation, minor irrigation etc.
7.7 EMPLOIOCENT POTENTIAL OF THB BIGHT FIVE YEikR PLAN(1990-95) AND ANNUAL PLAN(1991-92)
7.7.1 Labour intensive prograummes including special programme for rural development have been accorded due priority and the programmes aimed at skill acquisition have been given special en^hasis in the Eighth Five Year Plan(1990-95).Programmes covering both urban and rural areas are provided with Rs. 6252.36 crores towards eitployment intensive programmes, employment potential of which is estimated at 35.69 lakhs standard person years, during the year 1991-92 is Rs.871.67 crores out of which 6.10 lakhs standard person year.[ A standard person year being employment for nine months or 273 days of eight hours each in a year. This estimates only the direct eitployment arising out of plan programmes excluding indirect employment generated as a result of activities of Central Government through Centrally sponsored schemes, programmes to be undertaken by local bodies as well as the private sector investment.
7.7.2 While broad estimates of employment potential by major head and sub-head of development are indicated below
73
TABLE : V
Sector/Sub-Sector. Outlays on enqployment Total estimatedschemes(Rs.in lakhs). employment potential
(Person year in lakhs)
1990-95 1991-92 1990-95 1991-92
1.Agriculture and allied programme.
2.Rural Development Programme.
3.Irrigation and Flood control.
4 .PowerDevelopment
40375.00 2823.11 4.27 0.60
27080.70 5279.50 6.52 1.16
191700.00 47474.52 10.42 2.41
192000.00 8687.96 0.62 * 0.12 *
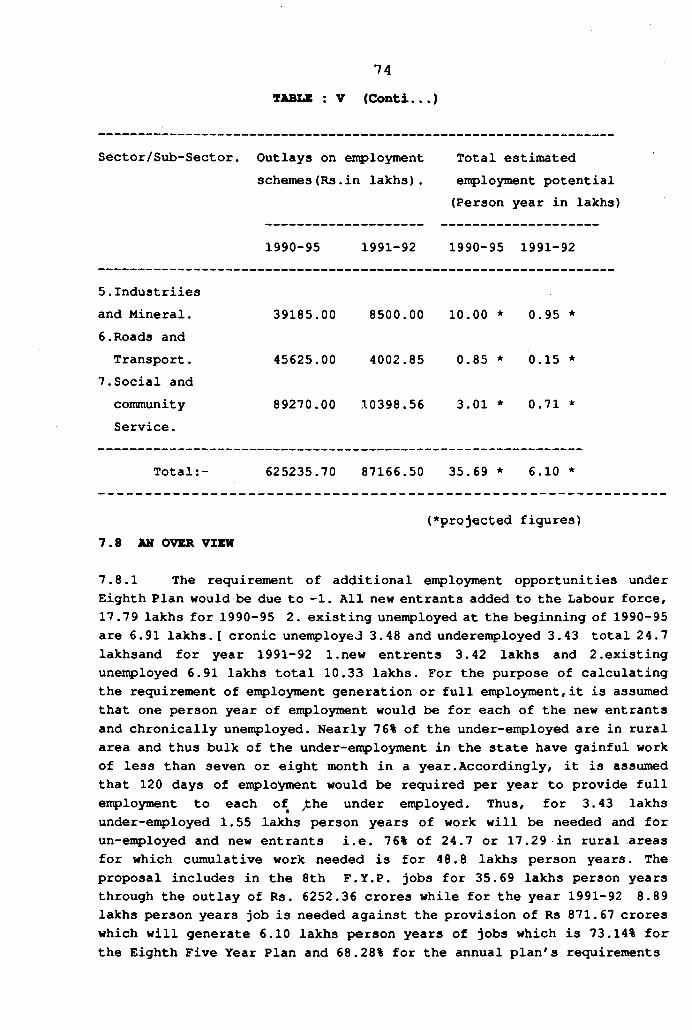
TABLB : V (Conti...)74
Sector/Sub-Sector. Outlays on en^loyn^nt Total estimatedschemes(Rs.in lakhs). employment potential
(Person year in lakhs)
1990-95 1991-92 1990-95 1991-92
5.Industriies and Mineral.6.Roads and Transport.
7.Social and community Service.
39185.00 8500.00 10.00 * 0.95 *
45625.00 4002.85 0.85 * 0.15 *
89270.00 10398.56 3.01 * 0.71 *
625235.70 87166.50 35.69 * 6.10 *
7.8 AN OVER VIEW(♦projected figures)
7.8.1 The requirement of additional enployment opportunities under Eighth Plan would be due to -1. All new entrants added to the Labour force, 17.79 lakhs for 1990-95 2. existing unen^loyed at the beginning of 1990-95 are 6.91 lakhs. [ cronic unemployeJ 3.48 and underenployed 3.43 total 24.7 lakhsand for year 1991-92 l.new entrents 3.42 lakhs and 2.existing unemployed 6.91 lakhs total 10.33 lakhs. For the purpose of calculating the requirement of enployment generation or full employment/it is assumed that one person year of employment would be for each of the new entrants and chronically unemployed. Nearly 76% of the under-eitployed are in rural area and thus bulk of the under-en^loyment in the state have gainful work of less than seven or eight month in a year .Accordingly, it is assumed that 120 days of eirqployment would be required per year to provide full employment to each of ^he under enployed. Thus, for 3.43 lakhs under-enployed 1.55 lakhs person years of work will be needed and for un-ert^loyed and new entrants i.e. 76% of 24.7 or 17.29 in rural areas for which cumulative work needed is for 48.8 lakhs person years. The proposal includes in the 8th F.Y.P. jobs for 35.69 lakhs person years through the outlay of Rs. 6252.36 crores while for the year 1991-92 8.89lakhs person years job is needed against the provision of Rs 871.67 crores which will generate 6.10 lakhs person years of jobs which is 73.14% for the Eighth Five Year Plan and 68.28% for the annual plan's requirements
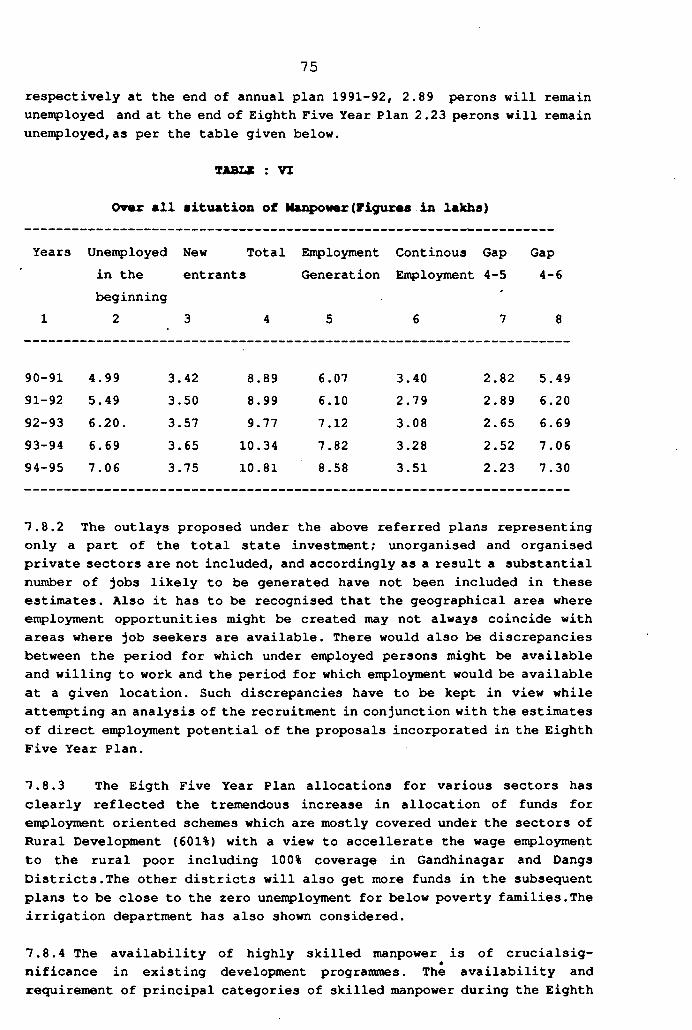
respectively at the end of annual plan 1991-92, 2.89 p>erons will remain uneitployed and at the end of Eighth Five Year Plan 2.23 perons will remain unemployed,as per the table given below.
TABLE : VI
Ovar all situation of Manpoifer(Figuxre8 in lakhs)
75
Years Unenployed New Total Eiqployment Continous Gap in the entrants Generation Enqployment 4-5beginning
1 2 3 4 5 6 7
Gap4-6
90-9191-9292-9393-9494-95
4.995.496.206.697.06
3.423.503.573.653.75
8.898.999.7710.3410.81
6.076.107.127.828.58
3.402.793.083.283.51
2.822.892.652.522.23
5.496.206.697.067.30
7.8.2 The outlays proposed under the above referred plans representing only a part of the total state investment; unorganised and organised private sectors are not included, and accordingly as a result a substantial number of jobs likely to be generated have not been included in these estimates. Also it has to be recognised that the geographical area where enployment opportunities might be created may not always coincide with areas where job seekers are available. There would also be discrepancies between the period for which under enployed persons might be available and willing to work and the period for which employment would be available at a given location. Such discrepancies have to be kept in view while attenpting an analysis of the recruitment in conjunction with the estimates of direct employment potential of the proposals incorporated in the Eighth Five Year Plan.
7.8.3 The Eigth Five Year Plan allocations for various sectors has clearly reflected the tremendous increase in allocation of funds for employment oriented schemes which are mostly covered under the sectors of Rural Development (601%) with a view to accellerate the wage employment to the rural poor including 100% coverage in Gandhinagar and Dangs Districts.The other districts will also get more funds in the subsequent plans to be close to the zero unenployment for below poverty families.The irrigation department has also shown considered.
7.8.4 The availability of highly skilled manpower is of crucialsig- nificance in existing development programmes. The availability and requirement of principal categories of skilled manpower during the Eighth
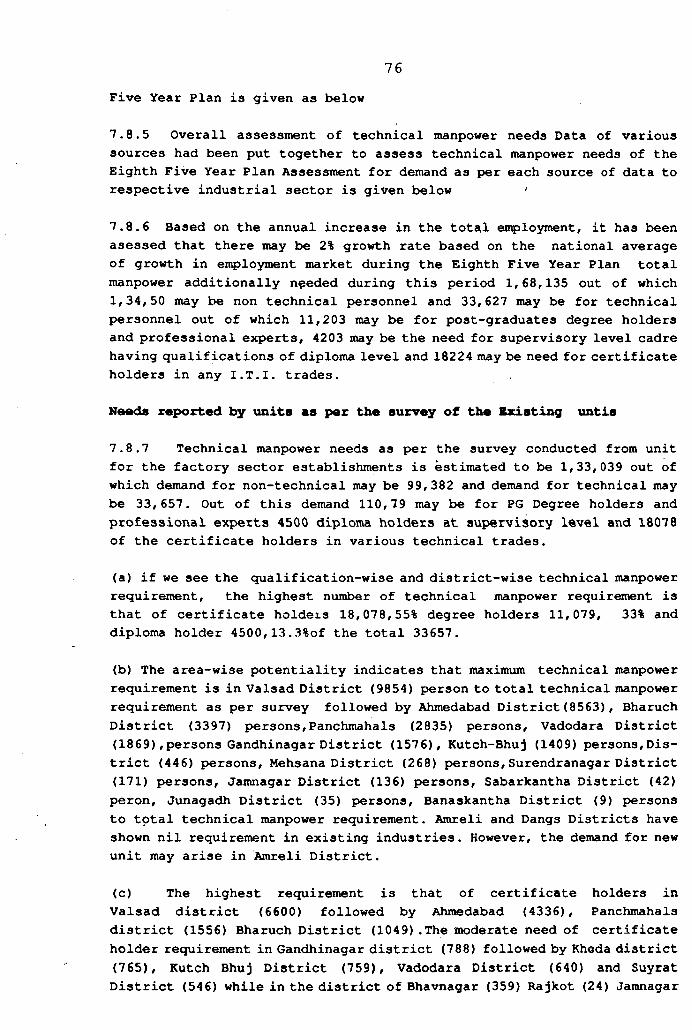
Five Year Plan is given as below
7.8.5 Overall assessment of technical manpower needs Data of varioussources had been put together to assess technical manpower needs of the Eighth Five Year Plan Assessment for demand as per each source of data to respective industrial sector is given below '
7.8.6 Based on the annual increase in the total eitployment, it has been asessed that there may be 2% growth rate based on the national average of growth in employment market during the Eighth Five Year Plan total manpower additionally needed during this period 1,68,135 out of which 1,34,50 may be non technical personnel and 33,627 may be for technical personnel out of which 11,203 may be for post-graduates degree holders and professional experts, 4203 may be the need for supervisory level cadre having qualifications of diploma level and 18224 may be need for certificate holders in any I.T.I. trades.
Neodfl reported by units as per the survey of the Existing untis
7.8.7 Technical manpower needs as per the survey conducted from unit for the factory sector establishments is estimated to be 1,33,039 out of which demand for non-technical may be 99,382 and demand for technical may be 33, 657. Out of this demand 110,79 may be for PG Degree holders and professional experts 4500 diploma holders at supervisory level and 18078 of the certificate holders in various technical trades.
(a) if we see the qualification-wise and district-wise technical manpowerrequirement, the highest number of technical manpower requirement is that of certificate holders 18,078,55% degree holders 11,079, 33% anddiploma holder 4500,13.3%of the total 33657.
(b) The area-wise potentiality indicates that maximum technical manpower requirement is in Valsad District (9854) person to total technical manpower requirement as per survey followed by Ahmedabad District(8563), Bharuch District (3397) persons,Panchmahals (2835) persons, Vadodara District (1869),persons Gandhinagar District (1576), Kutch-Bhuj (1409) persons,District (446) persons, Mehsana District (268) persons, Surendranagar District (171) persons, Jamnagar District (136) persons, Sabarkantha District (42) peron, Junagadh District (35) persons, Banaskantha District (9) persons to total technical manpower requirement. Amreli and Dangs Districts have shown nil requirement in existing industries. However, the demand for new unit may arise in Amreli District.
(c) The highest requirement is that of certificate holders in Valsad district (6600) followed by Ahmedabad (4336), Panchmahals district (1556) Bharuch District (1049).The moderate need of certificate holder requirement in Gandhinagar district (788) followed by Kheda district (765), Kutch Bhuj District (759), Vadodara District (640) and Suyrat District (546) while in the district of Bhavnagar (359) Rajkot (24) Jamnagar
76
(131) Mehsana (126) Surendranagar (118), Sabarkantha (40) Junagadh (13) Banaskantha (3) are very low. There is no requirement in Amreli and Dangs districts at all.
(d) The Industry wise technical manpower requirement in the registered factories found that manufacturing group requires the highest niomber of technical personnels, 31,762 abour 90% for 1990-95 plan while remaining require only 10% of the total.
Aasessxnant of Industrial Bxtansion Bureau.
7.8.3 A. Manpower requirements in organised sector industries is one of the inportant industrial sector providing large enployment to technical skilled as well as unskilled personnel. The development of organised sector industry is, however, govered by the industrial policy the country from time to time. Normally an industrial undertaking having investment in plan and machinery above Rs.35/- lakhs are required to obtain registration or a letter of indent from the Government. Based on this Indext (b) has worked out the data regarding future manpower requirement in the organised sector Industries as a whole industry group-wise and qualification-wise as given below.
a) It is observed that the organised sector industries will be generating eirployment potential for over total 2,37,440 people including 34,610(14,58) technical people.
b) The maximum requirement is that of certificate holders (22,780) 65.83 to total requirement for organised sector calculated by Indext(B) followed by Diploma holder (6669) 19.14% and last degree holder (5170) 14.93% to total.
c) The chemical industries including dyes etc. will be generating thelarge employment 80190 (33.77%) followed by miscellaneous engineering industries 41,800 (17.66%) and engineering industries 37,935 (15.98%) Food processing vegetable oil industry (18060) 7.71%. MettalurgicalIndustries (15750) 6.73%, Glass, Ceramic and cement industries (11,690)4.321 light engineering industries (11,440), 4.82%, electrical,electronics and tele-communication (6470) 2.72% paper, and pulp industry(4325) 1.82% and other industries (2775) 1.17%.
Manpower requirement in small-scale industries
7.8.J Entire small-scale industries are not covered under the survey,however, small scale industries having employment more than 10 and 25 have been covered under the survey Therefore, this segment has been treated separately. Assessment for this total registered unit 2169 in 1961 which rose to 97438 at the end of -1988. It has been noticed that registration
in last 5 years for SSI units had been around 37242. It has been observed
11
that each SSI unit provides employment to 5 to 6 persons in the initial stage. Based on these figures it has been estimated that total 3,25,000 manpower will be needed for manning SSI units out of which 2,60,000 may be from non- technical side leaving a clear demand 65000 for technically trained people which may include 21666 need for PG degree holders and professional degree holders, 8125 for diploma holders and 35209 for certificate holders. The figures is calculated based on the general growth rate of registration,which is expected to continue with the Seune rate as it was during 7th plan.
Training needs for self-enployment schflmas
7.8.10 The task Mission No.3 on Enploymewnt of Gujarat State for 1988- 89 in which self eir loyment scheme proposed to provide 5.00 lakh additional jobs for the year 1988-89 has recommended to cover atleast one third of the beneficiaries to be trained who adopt self enployment schemes so that their scheme may not fail in want of technical skills. The training needs of this sector in cottage industries will be 1,50,413 and for IRDP programme75,000 thus the total beneficiaries 2,25,413 will have to be trained during the 8th plan. Their training needs are comparatively single as have been imparted under the TRYSEM(Training for Rural Youth for self- enployment) which can vary from a few weeks to 6 months in tailor- made courses locally designed to suit to their needs.
Qualification-wise demand
7.8.11 The demand for the new projects are available qualification- wise. It has been noticed that in normal organisational heirarchy thus demand remained almost in the same proportion.The total technical manpower requirement according to the qualifications will be 13,500 for new projects in which 75100 (55.70) certificate holders and 3392 (29.55)diploma holder and 1990 (14.75) degree holders.
a) It is observed that the total degree holders requiresments for the new project in the 8th plan highest need is that of elctrical engineers 38.69% 770 followed by mechanical engineer (27.63%) 550, chemical engineer 280 (14.07%) instrumentation engineer 170 (8.54%) Civil engineer 120 (6.03%) electrical engineer 50 (2.51%) and coitputer engineer 40(2.01%) .
b) Dimand For Diploma holders:- It is also indicated that maximumrequirement of chemical diploma holders 1170 (29.32%) of the total Diploma holders (29.32%) of the total Diploma holders for the new project. Mechanic Diploma holders 1160(29.07%) comes second number which electrical diploma holders 1050 (26.31%) Instrumentation diploma holders 480 (12.03%)electronic diploma holders 150 (3.75%) and civil diploma 80 (2.00%) to total diploma holders.
78
c) Dimand For Certificate holders It may be further seen from the highest requirement of certificate holder in electric 1490 (19.81%) certificate holders, followed by fitters 1050 (13.96%)Mech 1030(13.69%) plant operator 840 (11.17%) Instrumentation660(8.77) Radio and TV Mech 550 (7.31%) Chemical 520 (6.91%)electronic 500 (6.64%) Boiler 360 (4.78%) Welder 270 (3.5%).Dataoperator and console operator 100 (1.32%) while fire operation 50 (066%). The demand of the certificate holders has been shown largest even more than half of the total demand.
Occupation group-irisa technical aanpowttr dmnanrt
7.8.12 From the survey conducted in various industrial groups occupationwise following picture emerges. Highest technical manpower is estimated to be in the manufacturing industries. In 59 trades total need of 317 62 personnel is projected. Trades where the need of more than 1000 ersons is there are Chemist (3644), Engineer (Mech) (1958), Supervisor (1714), Operator (1393) Turner (3097), Welder (13399) and fitter (3958).
7.8.13 The trade showing demand under these occupations above 500 to 1000 personnel are professional managers (623) Electricians* (686), Machinist(968)M Moulders (617) and Draughtsman(Civil) 505). Demand for other trades is projected below 500 which are of Engineer(Civil), Technologist' (Food),Engineer (auto) Engineer(Chem),Lab.Asstt,Bacteriologist, Technologist(Tax) Attendent, Mechanics, Grinder,Wireman, Tool Makers Drawers, Winder (Textile), Compositor, BookBinder,Blacksmith, Operator (Plastic) ,Metallurigist,Photographer, Mechanic, Armature Wender, Plumber, CutterPainter,Engineer(Instrument),Chemist(Pharmaceutical) , Electroplator,Planner,Miller,Shet Metal WorksDemand for other occupations like Agriculture,hunting Minning and Quarrying industry etc. Electricity Gas and'Water suply, construction industries, whole- sale and retail trade and restaurants and hotels. Transport storage and communication etc. mostly fall in units having less than 25 and 10 eit loyees. Therefore, the demand in these occupations reflected low in the surve which is combinedly 1895 because a very large number of establishments could not be covered under the purview of this survey. Their demand has been roughly estimated with the demand of self-employment sector.
Thm Skill«d Manpwer availability
7.8.14 As per the existing intake capacity in Technical Institutes/Training Institutes in the State if the out turn of the candidates from them is with full utilisation the total out turn will be of 21.85 lakhs includingnl4.08 lakhs candidates having S.S.C.and H.S.C. passed qualifications. The details of the same are qualifications wise, streamwise given below and other details are given in the Annexure-III.
79‘
Engineering Personnel
7.8.15 There are 9 Engineering Degree Colleges in the State with an estimated outturn of 1650 engineering graduates in 1991-92. There are 25 Polytechnics in the State with an estimated outturn of 4675 Diploatia holders in 1991-92. There were 3865 degree holders and 8181 dipldiBa holders registered on the Live Register as on 31st March,1989.
Trained personnel for Industry
7.8.16 Under the Craftsman Training Scheme there are 42 Industrial Training Institutes with 25,196 intake capacity in 53 various certificate courses. There are also 25 Mini ITI in^arting technical training to tribal youths, with 21178 intake capaicty. 71 Grant-in- aid ITIs. with intake capacity of 6620, 10 career development courses with capacity of 455 seats and 6 AVTS Institutions with capacity of 352 seats are also functioning in the State. Demand of such trained persons in various units in Gujarat State is appreciable. They have also good prospects of self enployroent.
Hedical persozinel
7.8.17 There are 7 medical colleges in the State with an estimated outturn of 794 medical graduates in 1991-92. There were 320 medical graduates in Allopathy on the live register as on 31st December, 1989. As on 31st March,1989 the number of doctors registered with Gujarat Medical Counciuls was 19,550 indicating a doctor population ratio 1:1965 as against the norms of 3000 to 3500 prescribed by the Mudaliar Committe.There is no overall shortrage of doctors but there are shortages in rural and tribal areas and in certain teaching posts.
7.8.18 There are 9 Ayurvedic colleges with an estimated outturn of 102 graduates in Ayurvedic system of medicine in 1991-91. The number of job seekers with a degree in Ayurvedic system of medical was 563 on 31st December,1989.Private pratitioner in small towns, rural areas seems one of the major otulewt for the surpluses .There are 2 injstitutions in the State offering degree courses in Pharmacy with an estimated outturn of 205 in 1991-92. There are 4 institutions offering diploma courses in Pharmacy with an estimated outturn of 312 in 1990-91 There were 147 degree holders and 150 and 425 diploma holders on live register as on 31st December, 1989.As per the survey conducted by the Indian Pharmatics Association,there were about 5000 unqualified phainnatics in the State.
%7.8.19 The training and development of Community Health Workers is a major innovation in the field of public health in rural areas.The main object of this scheme is to provide training in the basic knowledge of health,hygine and first aid treatment of minor ailments to the illerate persons in the village.This scheme is being inqplemented in the entire State and training is given in all primary health centres.About 25,550 C.H.W. have been trained by the end of 1990-91.
80
Agriculutral pttrsozmal
7.8.20 There are 4 institutions in the State with an capacity of 419 for the course of graduates in agriculture.The estimated outturn in 1990-91 is 380. The number of graduates in agriculture on the live register as on 31st December,1989 was 1060. There are 14 institutionsoffering diploma in agriculture with an estimated out turn of 430 in 1991-92. The anticipated demand of degree and diploma holders is placed at 150 and 290 respectively.The Narmada Irrigation Project is likely to push up the demand of agricultural graduates to meet the needs of agricultural development.
Anixaal Husbandry
7.8.21 There are 2 veterinary colleges in the State. The outturn in1991-92 is expected to be 223. The estimated demand of vertinary graduates and post-graduates together is estimated at 60 as against the estimated supply of 120. The demand for livestock inspectors during 1991-92 is estimated at 106, the anticipated suply would be 90.
Dairying p«rsozmttl
7.8.22 A degree course in Dairying is offered by linstitute in the State with a sanctioned intake capacity of 40 the anticipated outturn is also 40in 1990-91.The average demand of dairying personnel is estimated at 25.
Forestry Parsonnal
7.8.23 A full-fledged college for training Range Forest Officer with an intake capacity of 40 had been started at Rajpipala during 1979- 80. The anticipated supply of Range Forest Officers during 1991-92 would be 40. The estimated demand for Range Forest Officers during 1990-91 is placed at 2-0. The estimated demand for Foresters is placed at 25 against the anticipated supply of 80.The demand for Forest Guards is estimated at 32 against the suply of 120.
Taaching Pttrsonnal
7.8.24 As against the estimated supply of 4840 trained primary school teachers during the Annual Plan 1991-92 the demand is likely to be 3300. The anticipated suply of trained secondary school teachers during 1991-92 is estimated to be 4877 as against the estimated demand of 1320.The need for reduction in intake capacity of training institutions for primary and secondary school teachers is recognised
81
7.8.25 For the Eighth Five Year Plan the total manpower need for technical categories is estimated to be 51105 against 39365 capacity for degree holders and above, 84387 against the capacity of 41000,for post graduates and degree holders in science,109000 against the capacity of 212250, for degree holders in Arts Commerce and other strecuns, 27478 against the capacity of 27095 diploma and other technical courses, 101811 against the capacity of 397875 capacity of various certificate courses, while the demand for general qualifications of S.S.C. and equivalent is expected to be about 2.09 lakhs against the capacity of 15 lakhs thus if we take into account the avability of manpower including the present live register the over all demand is only 917614 against the present capacity of 21.89 lakhs educated persons will be available during the plan period.Against this demand of 9.17 lakhs the demand in the organised sector will be only 1.33 lakhs persons which is only about 14% of the demand and only about 6% of the total employment opportunities likely to be availabe. thus there is likely to be more surplus manpower in general certificates holders. Arts,Commerce and other type of general degree holders as well as people having S.S.C.and general qualifications. Therefore it may not be possible to find suitable jobs for all the manpower according to their qulaifications except in shortage catagory of occupations hence they may have to enter into the field of self en^loyment and service sector as well as private enterpreneurship in the opportunities generated through new industrial policy and investment attracted to the State. The remaining surplus force having qualfications below S.S.C. would have the option to join the wage en^loyment/self emplolyment schemes under IRDP etc.
82
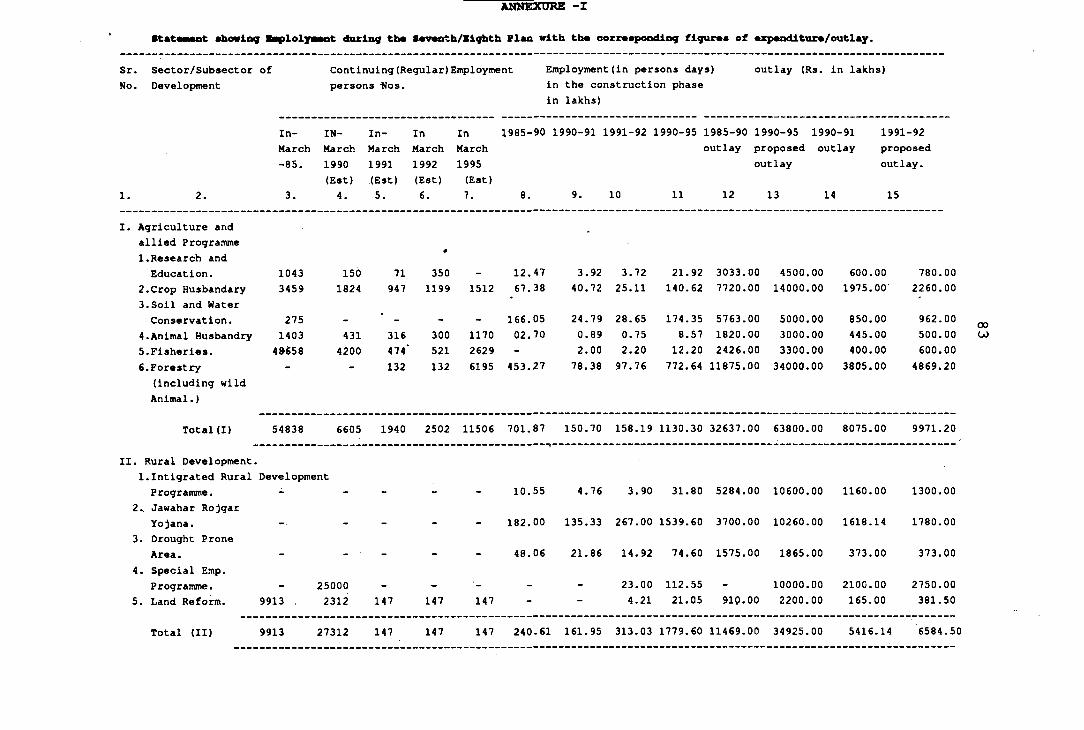
Statwent •bowing Baf>lelyMnt during th* S«vttnth/Sigbth Plan with th« oomaponding figur*« of oxpandi tun/out lay.
of Continuinq(Regular)Employment Employment(in persons days) outlay (Rs. in lakhs)
ANNEXURE -I
Sr. Sector/Subsector No. Development
Continuing(Regular)Employment persons -Nos.
Employment(in persons days) in the construction phase in lakhs)
1. 2.
In- IN- In- In In 1985-90 1990-91 1991-92 1990-95 1985-90 1990-95 1990-91 1991-92March March March March March outlay proposed outlay proposed-85. 1990 1991 1992 1995 outlay outlay.
(Est) (Est) (Est) (Est)3. 4. 5. 6. 7. 8. 9. 10 11 12 13 14 15
I. Agriculture and allied Programme 1.Research andEducation. 1043 150 71 350 - 12.47 3.92 3.72 21.92 3033.00 4500.00 600.00 780.00
2.Crop Husbandary 3.Soil and Water
3459 1824 947 1199 1512 67.38 40.72 25.11 140.62 7720.00 14000.00 1975.00 2260.00
Conservation. 275 - - - - 166.05 24.79 28.65 174.35 5763.00 5000.00 850.00 962.00 004.Animal Husbandry 1403 431 316 300 1170 02.70 0.89 0.75 8.57 1820.00 3000.00 445.00 500.00 CO5.Fisheries. 4»658 4200 474' 521 2629 - 2.00 2.20 12.20 2426.00 3300.00 400.00 600.006.Forestry - - 132 132 6195 453.27 78.38 97.76 772.64 11875.00 34000.00 3805.00 4869.20
(including wild Animal.)
Total(I) 54838 6605 1940 2502 11506 701.87 150.70 158.19 1130.30 32637.00 63800.00 8075.00 9971.20
II. Rural Development, 1.Intigrated Rural Programme.
Development10.55 4.76 3.90 31.80 5284.00 10600.00 1160.00 1300.00
2.. Jawahar Rojgar Yojana. . . 182.00 135.33 267.00 1539.60 3700.00 10260.00 1618.14 1780.00
3. Drought Prone Area. . . 48.06 21.86 14.92 74.60 1575.00 1865.00 373.00 373.00
4. Special Emp. Programme.
5. Land Reform.25000
9913 , 2312 147 147 147-
-23.004.21
112.5521.05 910.00
10000.002200.00
2100.00165.00
2750.00381.50
Total (II) 9913 27312 147 147 147 240.61 161.95 313.03 1779.60 11469.00 34925.00 5416.14 6584.5C
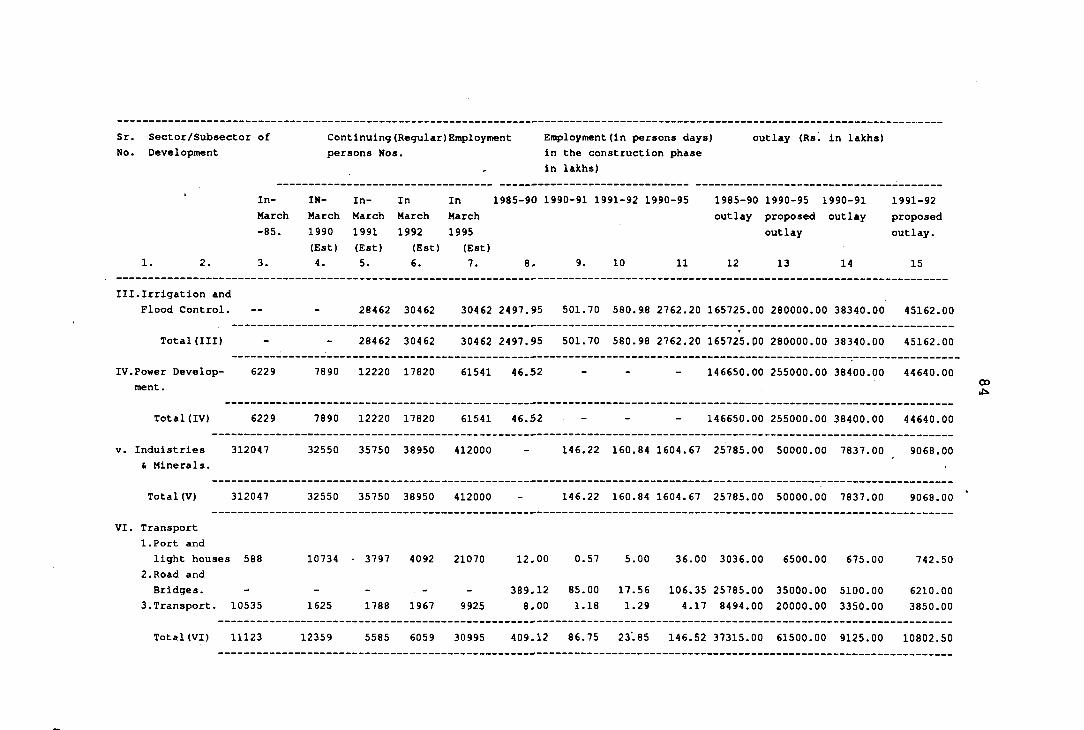
Sr. Sector/Subsector ofNo. Development
Continuing(Regular)Employmentpersons Nos.
Employment(in persons days) in the construction phase in lakhs)
outlay (Rs. in lakhs)
In- IN- In- InMarch March March March-85. 1990 1991 1992
In 1985-90 1990-91 1991-92 1990-95March1995
1985-90 1990-95 1990-91 1991-92outlay proposed outlay proposed
outlay outlay.
1. 2. 3.(Est)4.
(Est)5.
(Est)6.
(Est)7. 8. 9. 10 11 12 13 14 15
Ill.Irrigation and Flood Control. - 28462 30462 30462 2497.95 501.70 580.98 2762.20 165725.00 280000.00 38340.00 45162.00
Total(III) - - 28462 30462 30462 2497.95 501.70 580.98 2762.20 165725.00 280000.00 38340.00 45162.00
IV.Power Development.
6229 7890 12220 17820 61541 46.52 - - - 146650.00 255000.00 38400.00 44640.00
Total(IV) 6229 7890 12220 17820 61541 46.52 - - - 146650.00 255000.00 38400.00 44640.00
V. Induistries & Minerals.
312047 32550 35750 38950 412000 - 146.22 160.84 1604.67 25785.00 50000.00 7837.00 9068.00
Total(V) 312047 32550 35750 38950 412000 - 146.22 160.84 1604.67 25785.00 50000.00 7837.00 9068.00
VI. Transport1.Port and light houses
2.Road and Bridges.
3.Transport.
588
10535
10734
1625
- 3797
1788
4092
1967
21070
9925
12,00
389.128,00
0.57
85.001.18
5.00
17.561.29
36.00
106.354.17
3036.00
25785.008494.00
6500.00
35000.0020000.00
675.00
5100.003350.00
742.50
6210.003850.00
Total(VI) 11123 12359 5585 6059 30995 409.12 86.75 23.85 146.52 37315.00 61500.00 9125.00 10802.50
00
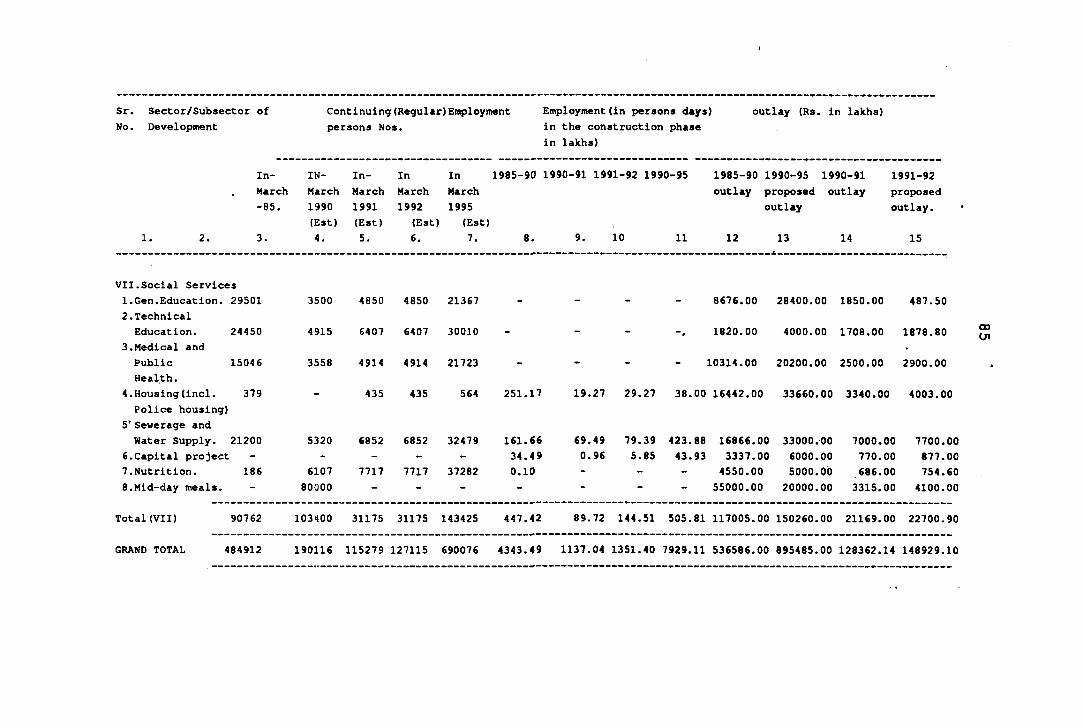
Sr. Sector/Subsector ofNo. Deve1opment
Continuing(Regular)Employmentpersons Nos.
Employment(in persons days) in the construction phase in lakhs)
outlay (Rs. in lakhs)
In- IN- In- InMarch March March March-85. 1990 1991 1992
(Est) (Est) (Est) (Est)
In 1985-90 1990-91 1991-92 1990-95March1995
1985-90 1990-95 1990-91 1991-92outlay proposed outlay proposed
outlay outlay.
1. 2. 3. 4. 5. 6. 7. 8. 9. 10 11 12 13 14 15
VII.Social Services 1.Gen.Education. 29501 3500 4850 4850 21367 8676.00 28400.00 1850.00 487.502.TechnicalEducation. 24450 4915 6407 6407 30010 . 1820.00 4000.00 1708.00 1878.80
3.Medical andPublic 15046 3558 4914 4914 21723 . 10314.00 20200.00 2500.00 2900.00Heal,th.
4.Housing(incl. 379 . 435 435 564 251.17 19.27 29.27 38.00 16442.00 33660.00 3340.00 4003.00Police housing)
5’ Sewerage andWater Supply. 21200 5320 6852 6852 32479 161.66 69.49 79.39 423.88 16866.00 33000.00 7000.00 7700.0(
6.Capital project - - - - 34.49 0.96 5.85 43.93 3337.00 6000.00 770.00 877.0<7.Nutrition. 186 6107 7717 7717 37282 0.10 - - - 4550.00 5000.00 .686.00 754.6C8.Mid-day meals. 80000 - - - - - - - 55000.00 20000.00 3315.00 4100.OC
Total(VII) 90762 103400 31175 31175 143425 447.42 89.72 144.51 505.81 117005.00 150260.00 21169.00 22700.9C
GRAND TOTAL 484912 190116 115279 127115 690076 4343.49 1137.04 1351.40 7929.11 536586.00 895485.00 128362.14 148929.1C
00Ol
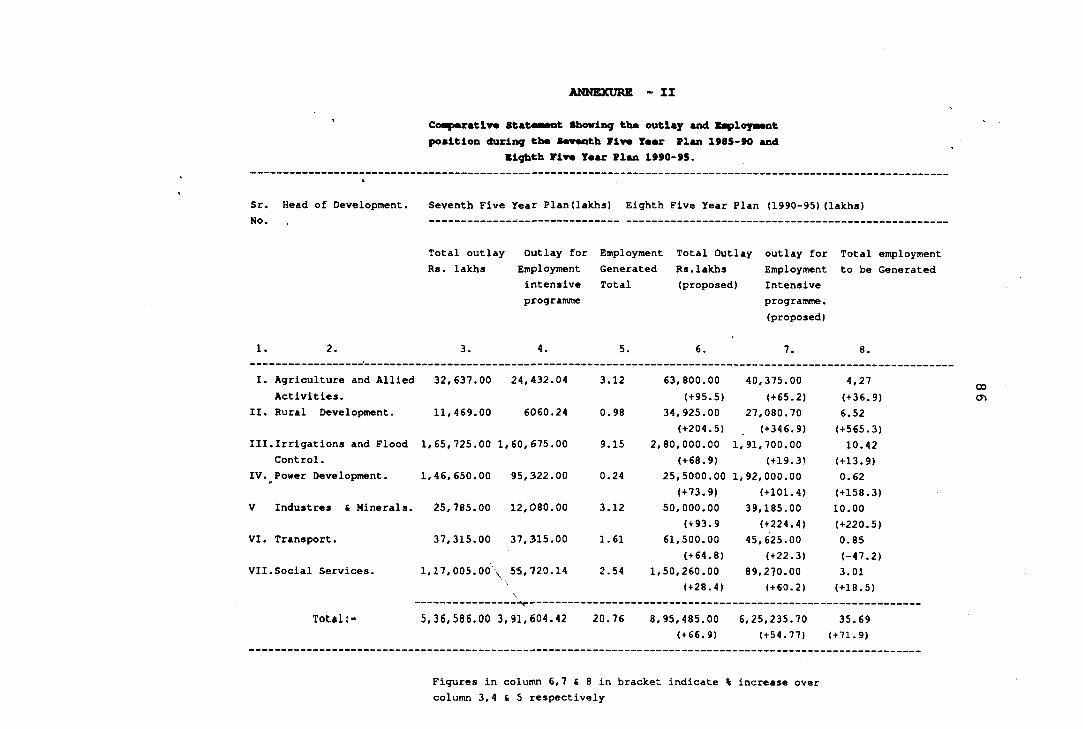
C<Mqpttratlv« StatMMnt Showing th« outlay mnd Kaployaant position during tb* amrmnth Fiv« T««r Plan 1985>90 and
lighth riv* Taar Plan 1990-95.
ANNEXURE ~ XI
Sr. Head of Development. Seventh Five Year Plan(lakhs) Eighth Five Year Plan (1990-95)(lakhs) No. . ------------ --------------- ------------------------------------
Total outlay Outlay for Employment Total Outlay outlay for Total employment Rs. lakhs Employment Generated Rs.lakhs Employment to be Generated
intensive Total (proposed) Intensiveprogramme programme.
(proposed)
1. 2. 3. 4. 5. 6. 7. 8.
I. Agriculture and Allied 32,637.00 24,432.04 3.12 63,800.00 40,375.00 4,27Activities. (+95.5) (+65.2) (+36.9)
II. Rural Development. 11,469.00 6060.24 0.98 34,925.00 27,080.70 6.52(+204.5) (+346.9) (+565.3)
Ill.Irrigations and Flood 1,65,725.00 1,60,675.00 9.15 2,80,000.00 1,91,700.00 10.42Control. (+68.9) (+19.3) (+13.9)
IV. Power Development. 1,46,650.00 95,322.00 0.24 25,5000.00 1,92,000.00 0.62(+73.9) (+101.4) (+158.3)
V Industres & Minerals. 25,785.00 12,080.00 3.12 50,000.00 39,185.00 10.00(+93.9 (+224.4) (+220.5)
VI. Transport. 37,315.00 37,315.00 1.61 61,500.00 45,625.00 0.85(+64.8) (+22.3) (-47.2)
VII .Social Services. 1,17,005.00 ^ 55,720.14 2.54 1,50,260.00 89,270.00 3.01\ (+28.4) (+60.2) (+18.5)
Total 5,36,586.00 3, 91,604.42 20.76 8,95,485.00(+66.9)
6,25,235.70(+54.77)
35.69(+71.9)
00
Figures in column 6,7 ( 8 in bracket indicate % increase over column 3,4 & 5 respectively
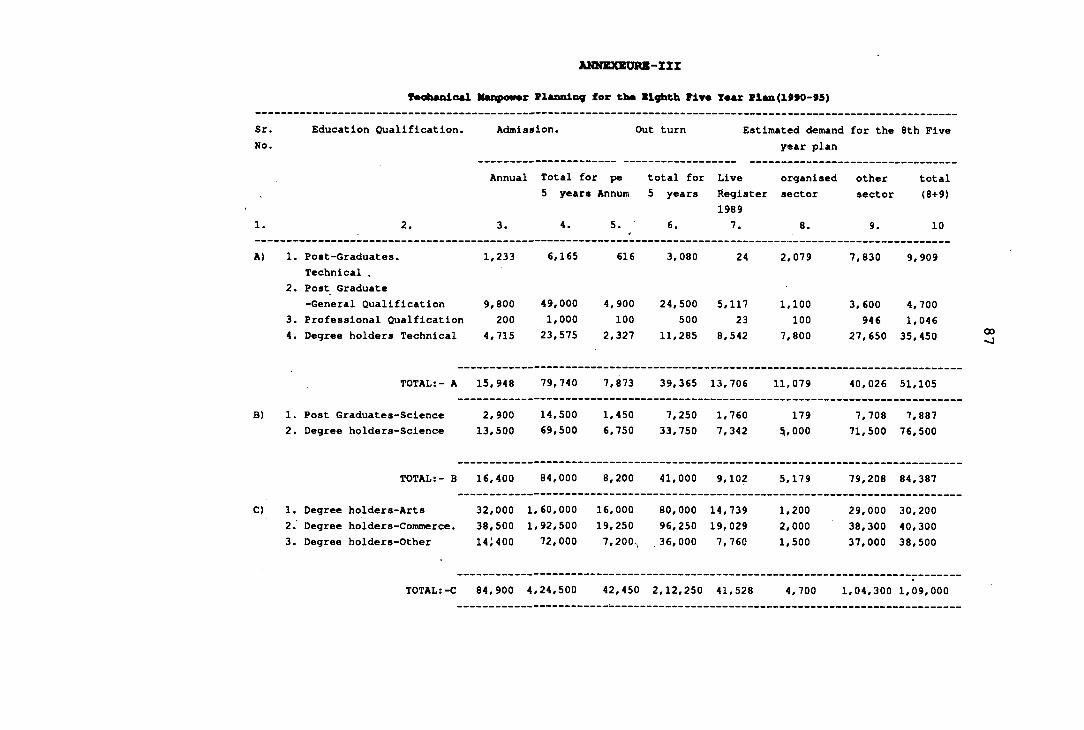
ANMEXEURB-IIZTeciianlcal Minpowr Plazming for tb* B l^th riv* Y««r Plan (1990-95)
Sr.No.
Education Qualification. Admission, Out turn Estimated demand for the 8th Five year plan
Annual Total for pe total for Live organised other total5 years Annum 5 years Register sector sector (8+9)
19891. 2. 3. 4. 5. 6. 7. 8. 9. 10
A) 1. Post-Graduates. 1,233 6,165 616 3,080 24 2,079 7,830 9,909Technical ,
2. Post Graduate-General Qualification 9,800 49,000 4,900 24,500 5,117 1,100 3,600 4,700
3. Professional Qualfication 200 1,000 100 500 23 100 946 1,0464. Degree holders Technical 4,715 23,575 2,327 11,285 8,542 7,800 27,650 35,450
TOTAL:- A 15,948 79,740 7,873 39,365 13,706 11,079 40,026 51,105
B) 1. Post Graduates-Science 2,900 14,500 1,450 7,250 1,760 179 7,708 7,8872. Degree holders-Science 13,500 69,500 6,750 33,750 7,342 5,000 71,500 76,500
TOTAL:- B 16,400 84,000 8,200 41,000 9,102 5,179 79,208 84,387
C) 1. Degree holders-Arts 32,000 1,60,000 16,000 80,000 14,739 1,200 29,000 30,2002. Degree holders-Commerce. 38,500 1,92,500 19,250 96,250 19,029 2,000 38,300 40,3003. Degree holders-Other 14^400 72,000 7,200^ .36,000 7,760 1,500 37,000 38,500
TOTAL:-C 84,900 4,24,500 42,450 2,12,250 41,528 4,700 1,04,300 1,09,000
00
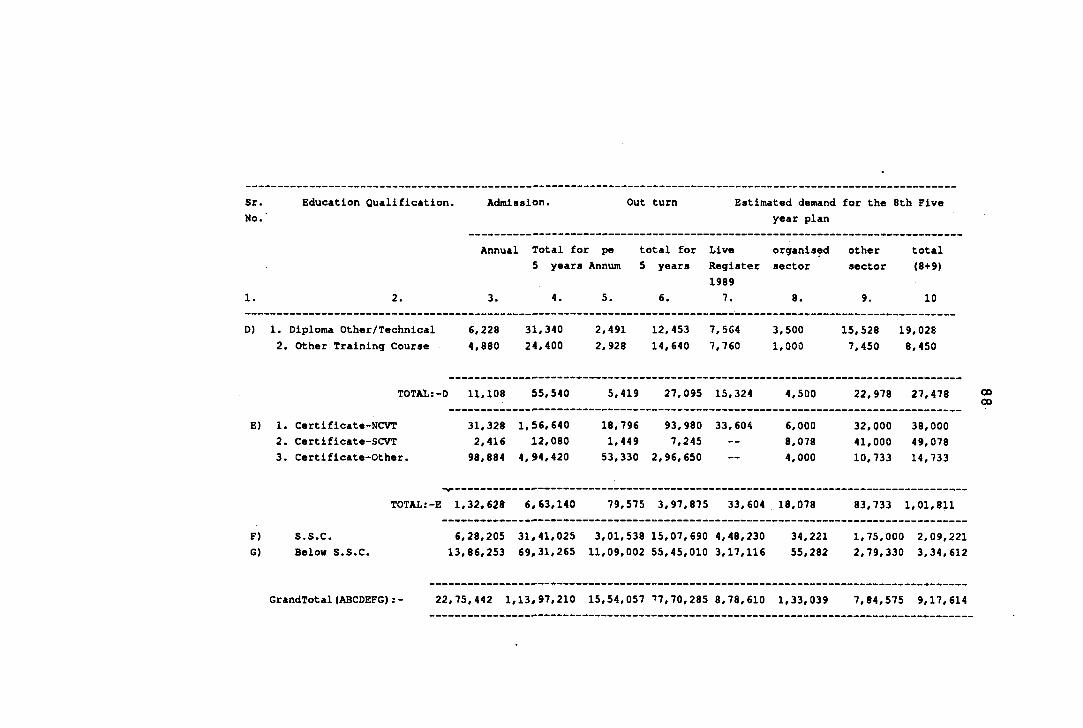
Sr.No.
Education Qualification. Admission. Out turn Estimated demand year plan
for the 8th Five
1.
Annual Total for pe total for 5 years Annum 5 years
2. 3. 4. 5. 6.
LiveRegister19897.
organisedsector
8.
othersector
9.
total(8+9)
10
D) 1. Diploma Other/Technical 6,228 2. Other Training Course 4,880
31,34024,400
2,4912,928
12,45314,640
7,5647,760
3,5001,000
15,528 19,028 7,450 8,450
T0TAI;-D 11,108 55,540 5,419 27,095 15,324 4,500 22,978 27,478
E) 1. Certificate-NCVT 31,3282. Certificate-SCVT 2,4163. Certificate-Other. 98,884
1,66,64012,080
4,94,420
18,7961,44953,330
93,9807,245
2,96,650
33,604 6,0008,0784,000
32.00041.000 10,733
38,00049,07814,733
TOTAL:-E 1,32,628 6^63,140 79,575 3,97,875 33,604 18,078 83,733 1,01,811
F)G)
S.S.C. 6,28,205 Below S.S.C. 13,86,253
31,41,02569,31,265
3,01,53811,09,002
15,07,69055,45,010
4,48,2303,17,116
34,22155,282
1,75,0002,79,330
2,09,2213,34,612
GrandTotal(ABCDEPG):- 22,75,442 1,13,97,210 15,54,057 77,70,285 8,78,610 1,33,039 7,84,575 9,17,614
0000
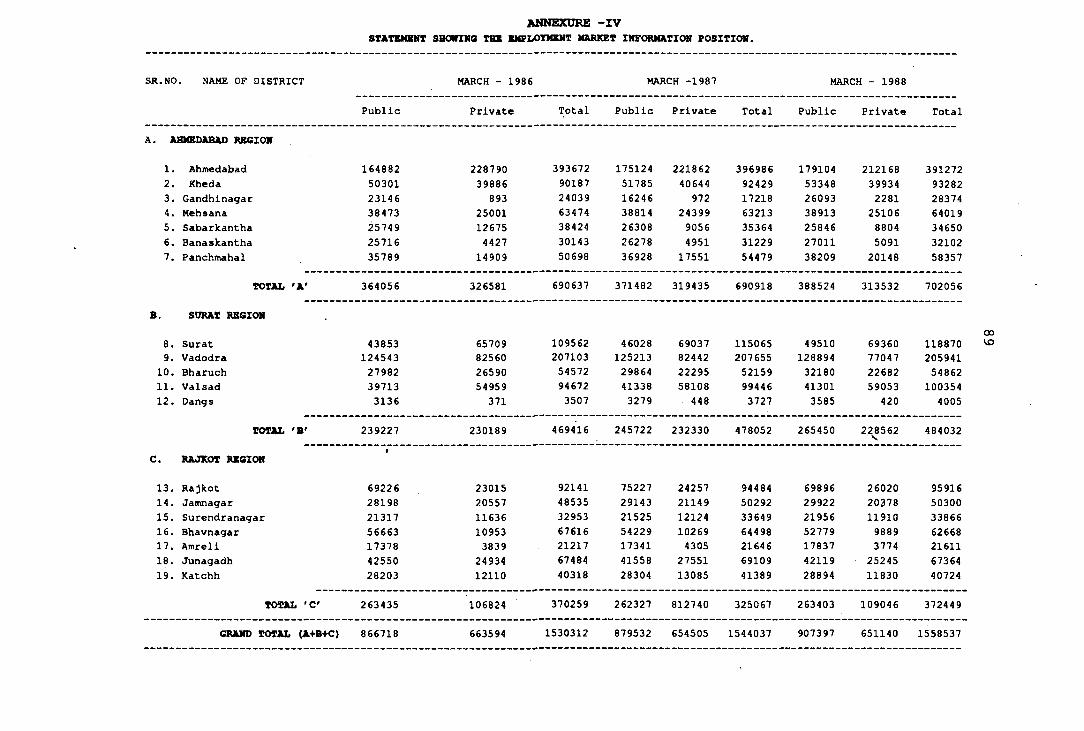
ANNEXURE - IV
STATEMENT SHOWIIIG THE KMPLOTMBNT MARKET INFORMATION POSITION.
SR. NO NAME OF DISTRICT MARCH - 1986 MARCH -1987 MARCH - 1988
Public Private Total Public Private Total Public Private Total
A. AHMEDABAO REGION
1. Ahmedabad 164882 228790 393672 175124 221862 396986 179104 212168 3912722. Kheda 50301 39886 90187 51785 40644 92429 53348 39934 932823. Gandhinagar 23146 893 24039 16246 972 17218 26093 2281 283744. Mehsana 38473 25001 63474 38814 24399 63213 38913 25106 640195. Sabarkantha 25749 12675 38424 26308 9056 35364 25846 8804 346506. Banaskantha 25716 4427 30143 26278 4951 31229 27011 5091 321027. Panchmahal 35789 14909 50698 36928 17551 54479 38209 20148 58357
TOTAL 'A' 364056 326581 690637 371482 319435 690918 388524 313532 702056
B.
8.
SDRAT REGION
Surat 43853 65709 109562 46028 69037 115065 49510 69360 1188709. Vadodra 124543 82560 207103 125213 82442 207655 128894 77047 20594110. Bharuch 27982 26590 54572 29864 22295 52159 32180 22682 5486211. Valsad 39713 54959 94672 41338 58108 99446 41301 59053 10035412. Dangs 3136 371 3507 3279 448 3727 3585 420 4005
TOTAL 'B' 239227 230189 469416 245722 232330 478052 265450 22^562 484032
C.
13.
RAJKOT REGION
Rajkot
1
69226 23015 92141 75227 24257 94484 69896 26020 9591614. Jamnagar 28198 20557 48535 29143 21149 50292 29922 20378 5030015. Surendranagar 21317 11636 32953 21525 12124 33649 21956 11910 3386616. Bhavnagar 56663 10953 67616 54229 10269 64498 52779 9889 6266817. Amreli 17378 3839 21217 17341 4305 21646 17837 3774 2161118. Junagadh 42550 24934 67484 41558 27551 €9109 42119 25245 6736419. Katchh 28203 12110 40318 28304 13085 41389 28894 11830 40724
TOTAL 'C' 263435 106824 370259 262327 812740 325067 263403 109046 372449
GRAND TOTAL (A B-fC) 866718 663594 1530312 879532 654505 1544037 907397 651140 1558537
OOVO
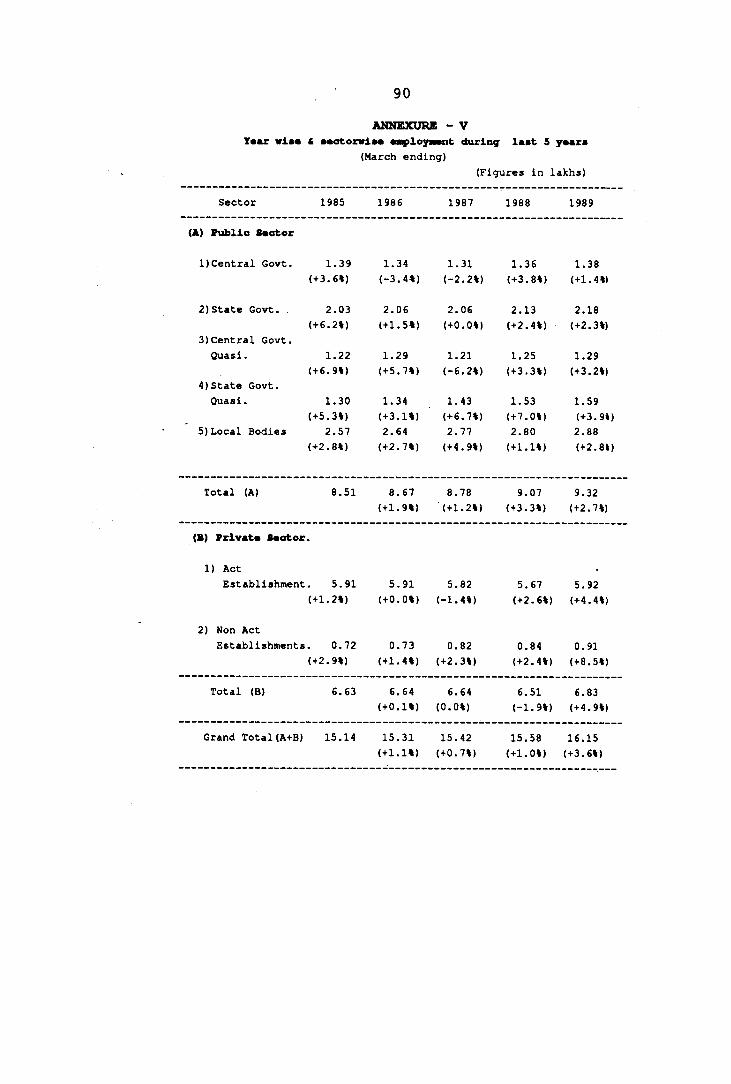
90AMNEXURE - V
T*ar wis« S MotonrlM MployMnt during last 5 y«ar«(March ending)
(Figures in lakhs)
Sector 1985 1986 1987 1988 1989
(A) Public S«otor
1)Central Govt. 1.39 1.34 1.31 1.36 1.38(+3.6%) (-3.4%) (-2.2%) (+3.8%) (+1.4%)
2)State Govt. 2.03 2.06 2.06 2.13 2.18(+6.2%) (+1.5%) (+0.0%) (+2.4%) (+2.3%)
3)Central Govt.(3uasi. 1.22 1.29 1.21 1.25 1.29
(+6.9%) (+5.7%) (-6.2%) (+3.3%) (+3.2%)4)State Govt.Quasi. 1.30 1.34 1.43 1.53 1.59
(+5.3%) (+3.1%) (+6.7%) (+7.0%) (+3.9%)5)Local Bodies 2.57 2.64 2.77 2.80 2.88
(+2.8%) (+2.7%) (+4.9%) (+1.1%) (+2.8%)
Total (A) 8.51 8.67 8.78 9.07 9.32(+1.9%) (+1.2%) (+3.3%) (+2.7%)
(B) Prlvat* 8«otor•
1) ActEstablishment 5.91 5.91 5.82 5.67 5.92
(+1.2%) (+0.0%) (-1.4%) (+2.6%) (+4.4%)
2) Non ActEstablishments 0.72 0.73 0.82 0.84 0.91
(+2.9%) (+1.4%) (+2.3%) (+2.4%) (+8.5%)
Total (B) 6.63 6.64 6.64 6.51 6.83(+0.1%) (0.0%) (-1.9%) (+4.9%)
Grand Total(A+B) 15.14 15.31 15.42 15.58 16.15(+1.1%) (+0.7%) (+1.0%) (+3.6%)
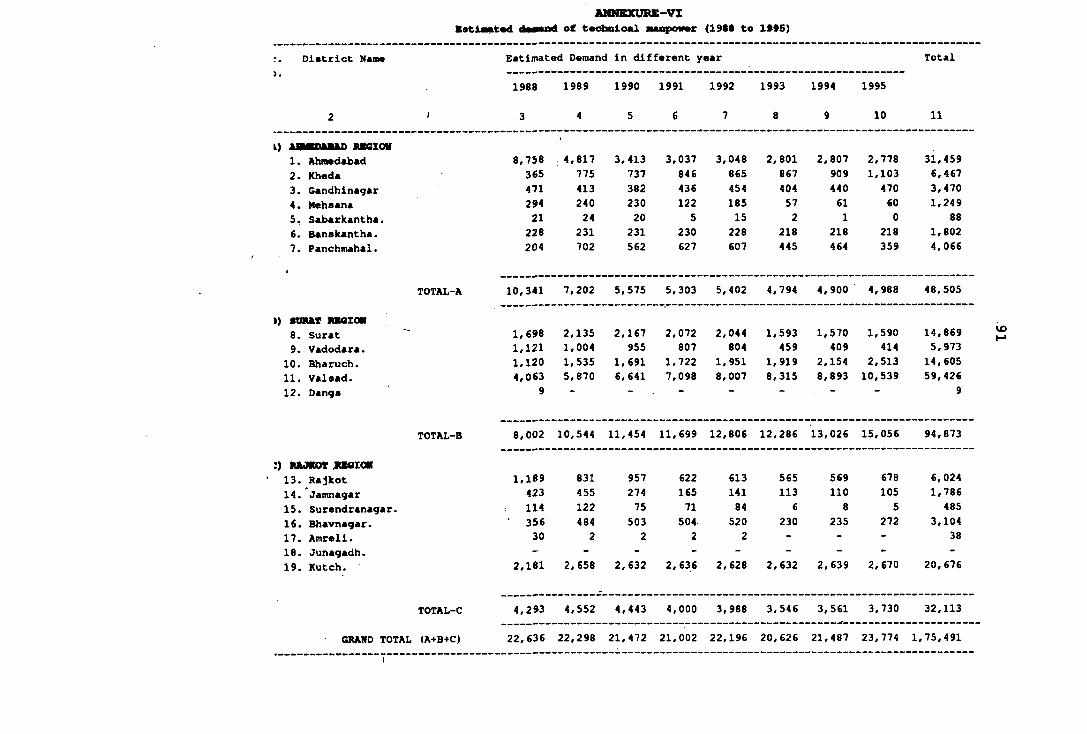
AMMEXURE-VI
Bstiaatttd dmmmod of t«ohnloAl ■■npnwr (19tt to IM S )
District Name Estimated Demand in different year Total) •
1988 1989 1990 1991 1992 1993 1994 1995
2 1 3 4 5 6 7 8 9 10 11
I) inwmi»in nczoH ■1, Ahmedabad 8,758 4,817 3,413 3,037 3,048 2,801 2,807 2,778 31,4592. Kheda 3^5 775 737 846 865 867 909 1,103 6,4673. Gandhinagar 471 413 382 436 454 404 440 470 3,4704. M«hsana 294 240 230 122 185 57 61 60 1,2495. Sabarkantha. 21 24 20 5 15 2 1 0 886. Banskantha. 228 231 231 230 228 218 218 218 1,8027. Panchmahal. 204 102 562 627 607 445 464 359 4,066
TOTAL-A 10,341 7,202 5,575 5,303 5,402 4,794 4,900 4,988 48,505
1) StnUkT lOKSIOM8. Surat 1,698 2,135 2,167 2,072 2,044 1,593 1,570 1,590 14,8699. Vadodara. 1,121 1,004 955 807 804 459 409 414 5,97310. Bharuch. 1,120 1,535 1,691 1,722 1,951 1,919 2,154 2,513 14,60511. Valsad. 4,063 5,870 6,641 7,098 8,007 8,315 8,893 10,539 59,42612. Dangs 9
■ ' ■ ■ ■ ■ ■9
TOTAL-B 8,002 10,544 11,454 11,699 12,806 12,286 13,026 15,056 94,873
:) MkJKOT JtTCIOK13. Rajkot 1,189 831 957 622 613 565 569 678 6,02414. Jamnagar 423 455 274 165 141 113 110 105 1,78615. Surendranagar. 114 122 75 71 84 6 8 5 48516. Bhavnagar. ' 356 484 503 504 520 230 235 272 3,10417. Amr«li. 30 2 2 2 2 - - - 3816. Junagadh. - - - - - - - - -19. Kutch. 2,181 2,658 2,632 2,636 2,628 2,632 2,639 2,670 20,676
TOTAL-C 4,293 4,552 4,443 4,000 3,988 3,546 3,561 3,730 32,113
GRAND TOTAL (A+B+C) 22,636 22,298 21,472 21,002 22,196 20,626 21,487 23,774 1,75,491
VO
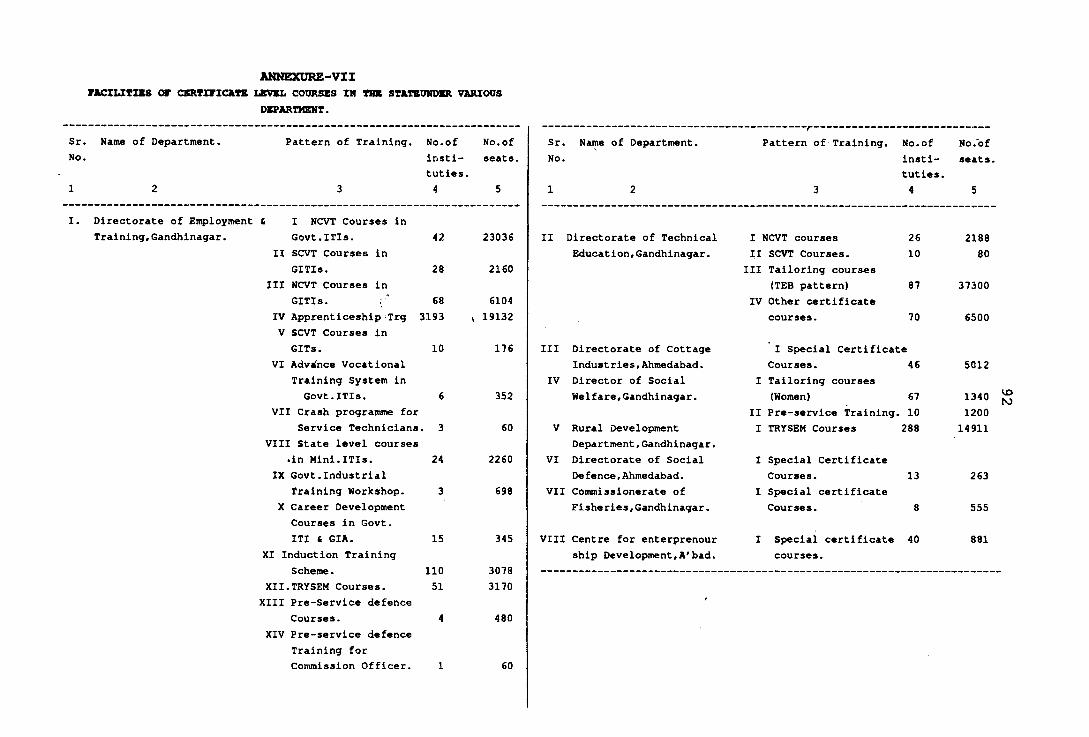
ANNEXURE-VZIrACZLITZSS at CERTZFICXTB IJBVBL COURSES IN TBB STJkTBUMDER VARIOUS
XIV Pre-service defence Training for Commission Officer. 60
DKPARTMBNT.
Sr. Name of Department. Pattern of Training. No.of No.of Sr. Name of Department. Pattern of Training. No.of No.'ofNo. insti- seats. No. insti- seats.
tuties. tuties.1 2 3 4 5 1 2 3 4 5
I. Directorate of Employment & I NCVT Courses inTraining,Gandhinagar. Govt.ITIs. 42 23036 II Directorate of Technical I 1MCVT courses 26 2188
II SCVT Courses in Educat ion,Gandhi nagar. II SCVT Courses. 10 80GITls. 28 2160 III Tailoring courses
Ill NCVT Courses in (TEB pattern) 87 37300GITIs. ; ' 68 6104 IV Other certificate
IV Apprenticeship Trg 3193 X 19132 courses. 70 6500V SCVT Courses inGITs. 10 176 III Directorate of Cottage I Special Certificate
VI Advi nce Vocational Industries,Ahmedabad. Courses. 46 5012Training System in IV Director of Social I Tailoring coursesGovt.ITIs. 6 352 Welfare,Gandhinagar. (Women) 67 1340
VII Crash programme for II Pre-service Training., 10 1200Service Technicians . 3 60 V Rural Development I TRYSEM Courses 288 14911
VIII State level courses Department,Gandhinagar..in Mini.ITIs. 24 2260 VI Directorate of Social I Special Certificate
IX Govt.Industrial De fence,Ahmedabad. Courses. 13 263Training Workshop. 3 698 VII Commissionerate of I Special certificate
X Career Development Fisheries,Gandhinagar. Courses. 8 555Courses in Govt.ITI & GIA. 15 345 VIII Centre for enterprenour I Special certificate 40 881
XI Induction Training ship Development,A'bad. courses.Scheme. 110 3078
XII.TRYSEM Courses. 51 3170XIII Pre-Service defence f
Courses. 4 480
fO
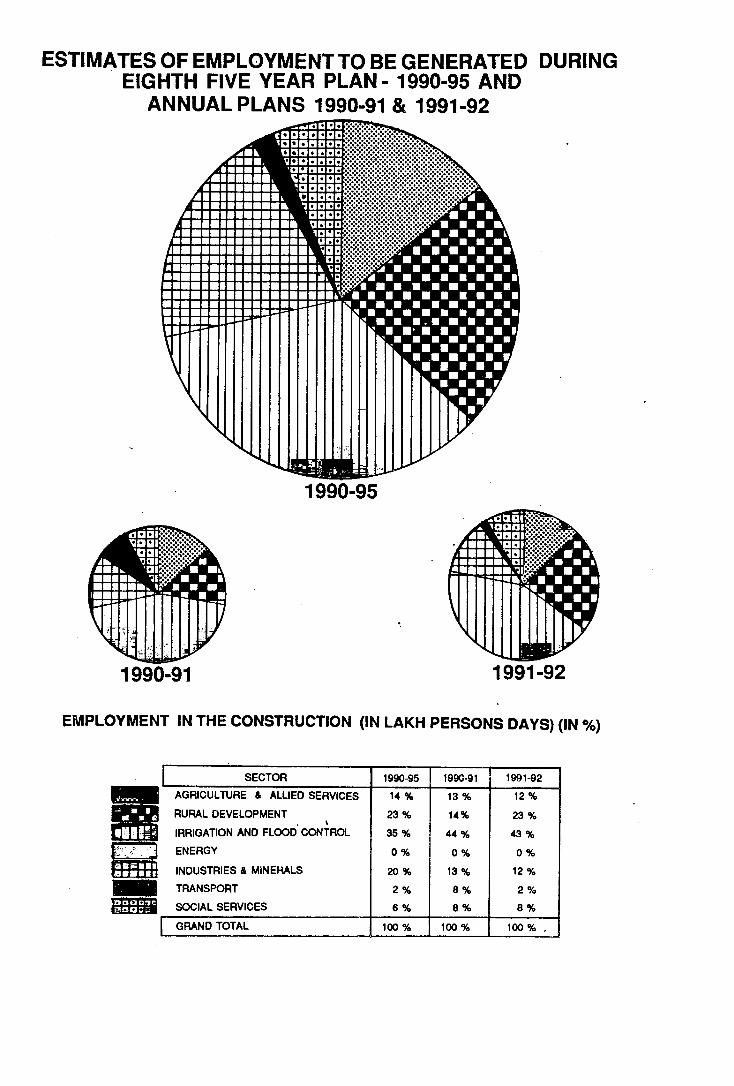
ESTIMATES OF EMPLOYMENT TO BE GENERATED DURING EIGHTH FIVE YEAR PLAN - 1990-95 AND
ANNUAL PLANS 1990-91 & 1991-92
1991-92
EMPLOYMENT IN THE CONSTRUCTION (IN LAKH PERSONS DAYS) (IN %)
SECTOR 1990-95 1990-91 1991-92
AGRICULTURE & ALLIED SERVICES 14 % 13 % 12 %
RURAL DEVELOPMENT 23 % 14% 23 %IRRIGATION AND FLOOD CONTROL 35 % 44 % 43 %ENERGY 0 % 0 % 0 %
INDUSTRIES & MINERALS 20 % 13 % 12 %
TRANSPORT 2 % 8 % 2 %SOCIAL SERVICES 6 % 8 % 8 %
GRAND TOTAL 100 % 100% 100% ,

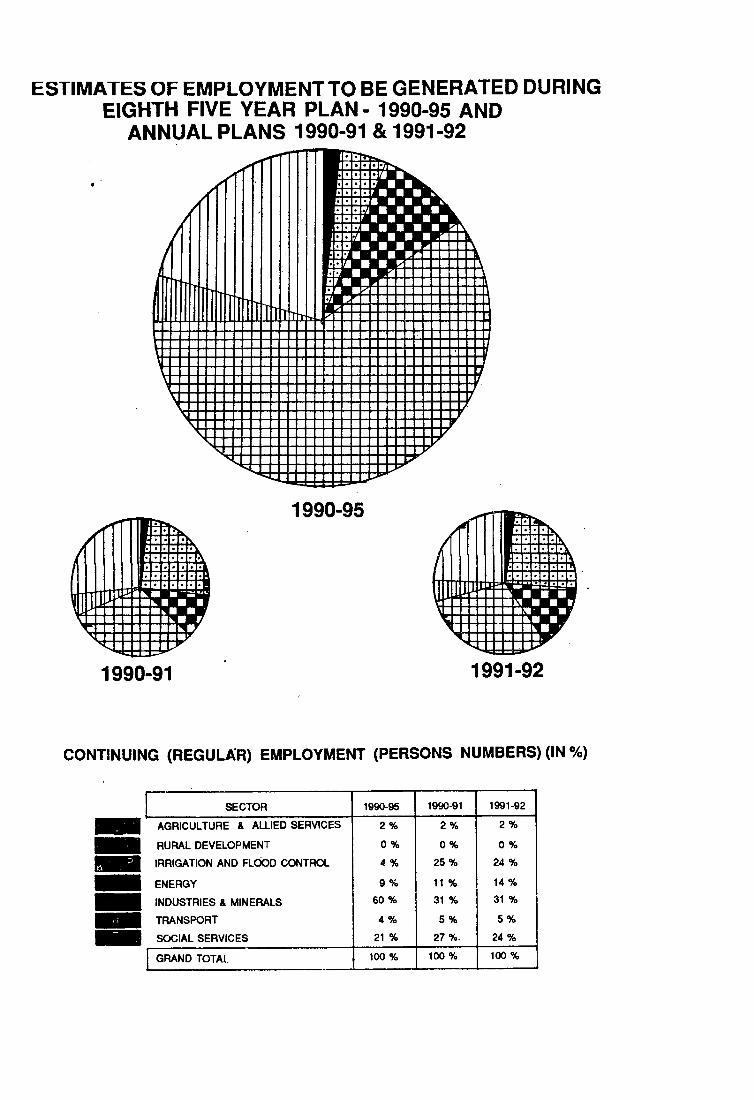
ESTIMATES OF EMPLOYMENT TO BE GENERATED DURING EIGHTH FIVE YEAR PLAN - 1990-95 AND
ANNUAL PLANS 1990-91 & 1991-92iDb _ loaaao'iS aaonorj ■ saDD& ■ ■ □Danr ■ ■ ■ oaoDa ■ ■ ■
ODBm ■ ■ ■ ■ a a w ■ ■ ■ ■ ■ iB B na ■ ■ ■ ■ laarj m m m m .miBO ■ ■ Ji m^mm sairm ■ ■ m M u m oarj ■ ■ mmmmmOR ■ ■ .»■■■■■■sr aam »»■■■■■■■■■ r i R t f H t t l l M B B B
1990-95ICkCPDBD aaaaoQ aoaooBb.ODDDDDnBODDBBDqnoaaao
B ■h'-"-
1990-91 1991-92
CONTINUING (REGULAR) EMPLOYMENT (PERSONS NUMBERS) (IN %)
SECTOR 1990-95 1990-91 1991-92
AGRICULTURE & ALLIED SERVICES 2 % 2 % 2 %
RURAL DEVELOPMENT 0 % 0 % 0 %
IRRIGATION AND FLOOD CONTROL 4 % 25 % 24 %
ENERGY 9 % 11 % 14 %
INDUSTRIES & MINERALS 60 % 31 % 31 %
TRANSPORT 4 % 5 % 5 %
SOCIAL SERVICES 21 % 27 %. 24 %
GRAND TOTAL 100 % 100 % 100 %

CHAPTER VIII ENVIRONMENT
8.1 Increased human population in the last few decades demanding development in various spheres to raise its standard of living has resulted directly or indirectly in sometimes traumatic and very often far reaching disturbances in the natural ecosystems. The controlled urban growth, construction activities such as dams, buildings and roads, encroachment on vast forest land in favour of agriculture, shifting cultivation,mining operartions, defence activities are exanples of direct onslaughts on nature. All these have contributed in a large way to the environmental eco-imbalances jeopardising the very survival of all forms of plants and animals conspicuous or inconspicuous, valuable or valueless.
8’.2 Gujarat, due to its various topographic, soil and climatic regimes, boasts of immense variety in its floral and faunal wealth. The various forest vegetational types, the scrublands, the grasslands and the sparsely vegetated deserts within the State's political boundaries support their own characteristic biological resources. Its large and medium sized rivers as also the ponds and the wet land support a rich fresh water aquatic life. The expansive estuaries and the gulfs support a variety of animal and plant forms. Unfortunately, all these ecosystems, essential for State's environmental health are under great stress and facing ecological disaster due to unproportional growth of industry in the State.
8.3 During last two decades, Gujarat has been finding itself on the threshold of an industrial explosion. Discovery of oil and its refining facilities, industrial congestion in Bombay Zone,the electrification of broad-gauge railway line between Bombay and Ahmedabad, widening and excellent maintenance of National Highway No.8 have contributed to gigantic industrial growth between Ahmedabad and Vapi region in the Gujarat State. This spread of industrialisation followed by urbanisation have encroached the most fertile alluvial soils of Gujarat rendering them sterile for any vegetational growth. Moreover this unproportional growth of industry in such a narrow corridor has resulted into variety of problems like deforestation, water logging, salinisation of soils, air pollution, water pollution and poisoning of soils through pesticides and insecticides.
8.4 The total number of industrial units in Gujarat of all sizes stood at over one lakhs. Of these around 8000 units are water based industries posing problems of water pollution. Sabarmti, Mahi, Meni, Vishwamitri, Narmada, Tapi, Ambica, Purna, Auranga, Damanganga and Kolak, all these rivers are subject to varying degrees of pollution, Sabarmati being the most polluted river. Rivers like, Meni, Amala Khadi (Broach), Kharikhat Canal (Ahmedabad) have become effluent channels. River Bhadar is worst
93
a££ected due to discharge of effluents into it by nearly 1400 dyeing and printing industries at Jetpur. The disposal of doioes tic effluent from Ahmedabad, Baroda, Surat, Nadiad, Anand, Bhav nagar, Rajkot. Jamnagar is also contributing to water pollution problems of the rivers.
8.5 Major air pollution units in Gujarat are 9 thermal power stations,15 cement plants, 6 fertiliser plants, 11 pesticides plants, carbon black plant. Refinery, Petrochemical coiqplex, 3 Soda ash plants, 2 Sodium cynide plants and other heavy chemical industries. The areas most affected by air pollution are Baroda Petro-chemical conqplexs area, 6IDC Estates are Nandesari, Ankleshwar and Vapi. The other areas are cities of Ahmedabad, Baroda and Surat. Vehicular emmisions also add to air pollution in cities in a big way.
8.6 Gujarat is also one of the leading urbanised States in India. It ranks third in Urbanisation in whole of India, Maha rashtra topping the list followed by Tamil Nadu. The population explosion in the urban areas is fully reflected in the growth of slums. These slums are deprived of basic minimum needs i. e. water supply, lavatory facilities, street lights etc. There is no proper drainage in such slum areas. In addition, facilities for disposal of sewage and solid waste are inadequate in the greater number of smaller urban settlements (municipalities and nagar panchayats) . These are the major factors responsible for environmental hazards in urban areas.
8.7 The State has a total geographical area of 1.96 lakhs sq. kms., 10 % of which is reported to be under forest. The per capita forest area in the State is 0.06 ha. which is less than half the national average of 0.13 ha. and far below the world average of 1.04 ha. In order to attain even the all India average, the State should have atleast 49.40 ha. of forest area.
8.8 The population of the State according to ,the 1981 census was 340.9 lakhs and the projected population would now exceed 400 lakhs. The live-stock population in 1982 census was 175 lakhs projected to 200 lakhs at present. Permanent pastures and grazing lands have decreased from 1.04 milion ha. in 1960-61 to about 85 lakh ha. in 1984-85. The gap between demand and supply of fodder is estixnate'd of about 8 million tonnes in a normal year. The State produces 0.13 million tonnes of fuel wood and 0.16 million cxibic metres of timber against an estimated requirement of 5.87 million tonnes of fuel wood and 0.802 million cubic metres of timber.
8.9 A study of the rainfall figures since 1960 shows that even a good rainfall zone like Vadodara has sho%m decrease in the average rainfall during the last 25 years vis-a-vis the normal rainfall. The most serious decrease in the rainfall has taken place in Panchmahals, Sabarkantha, Kheda and Bhavnagar Districts.
94
8.1C Out of 184 talukas in the State, 154 talukas were affected by scarcity at least thrice or more during the period 1965-66 ta 1974-75. In the eighties again more or less similar niirober of taluka^ were affected by scarcity. Irrigation Commission identified 60 talukas as drought prone covering 35 % of the total area of the State and 24 percent of the State's population. In several areas, ground water levels have fallen drastically owing to excessive drawal or poor recharge. In coastal areas excessive draval has facilitated the ingress of sea-water and thus rendered vast tracts saline (for instance in Junagadh District).
8.11 While on one hand we have had acute drought conditions with increased frequency, we have also the unusal spectale of serious afflictions by floods. The National Flood Commission has ranked Gujarat as the seventh State in the order of flood damage following Bihar, H. P., West Bengal, Andhra Pradesh, Orissa and Assam.
8.12 Thus it is evident that lack of fodder, fuel and drinking water and chronic droughts and floods leading to soil erosion are primarily because of lack of vegetation cover and ecological balance. In fact, rainfall itself seems to have been affected as a result of massive deforestation. The future to a large extent depends on the "greening" of Gujarat. This task cannot be left to the forest department alone. Other Government Departments, Voluntary agencies. Public Sector Undertakings, Universities, local bodies, particularly Panchayats and cooperatives; in other words, the people themselves will have to be involved in a planned massive effort. 33 % of total land area under tree cover would solve the environmental problems of the State and thus we should strive in this direction and try to achieve this goal at the earliest.
8.13 Details of schemes on hand and measures proposed in the field of preservation of ecology and environment may be found in the appropriate sectoral write-up.
95
CHAPTER - IX
PANCHAYATI RAJ INSTITUTIONS
96
INTRODUCTION :
9.1 The study team on Community Development and National Extention Service under the leadership of late Shri Balvantrai Mehta submitted its report in November, 1957. In the report, emphasis was placed on creation of three tier structure of Local Self Government from the village to the district duly organisationally linked up and intermutually coordinated and to be vested with genuine transfer of powers and responsibilities and to be provided with adequate resources either to be transferred or created for these bodies, with a further recommendation that Development Programme should be implemented through this body and the system should be evolved that it will facilitate further devolution of powers and responsibilities into them from time to time when demanded. Gujarat State was formed on 1st May, I960. On the formation of the new State, a democratic decentralisation Committee was constituted to' evolve a democratic decentralisation system for Rural Development which would cater to the local needs of the rural people, by involving people themselves in such local administration. As a result of acceptance of the recommandati is of this Committee by Government, the Gujarat Panchayats Act, 1961 was enacted. Subsequently, Panchayati Raj in three tier system/ based on democratic decentralisation principle, was introduced which started functioning in Gujarat in April, 1963.
9.1.2 Panchayati Raj was introduced in Gujarat in all the Districts of the State, except Dangs & Kutch Districts, on 1 st April, 1963. In Dangs and Kutch Districts it was introduced a little later. The three tier Panchayati Raj System is now in vogue in Gujarat. It consists of 13059 Gram Panchayats, 131 Nagar Panchayats 182 Taluka Panchayats and 19 District Panchayats covering 18,275 villages and 1,92,01,000 population which includes 55,59,000 being Scheduled Caste and Scheduled Tribe population.
Institutional FrameWork
9.2. Onder the Gujarat Panchayats Act, a three tier system of Panchayati Raj has been introduced in the State as under
Gram/Nagar Panchayats
Taluka Panchayats
District Panchayats
Gram and Nagar Phanchayats
9.3 A Gram Panchayat is constituted for revenue village or a group of revenue villages, the population of which is not less than 500 and not more than 10,000. Gram Panchayat consists of 7 to 15 members depending upon the population of the Gram. Minimum of two seats are reserved for women and one seat each for Scheduled Castes/Scheduled Tribes. In case the population of SC and ST is more, additional seatd are reserved for them in proportion of their population in the village.
9.4 Elections to Panchayats are held on the basis of adult frachise. The Sarpanch is directly elected while the Up-Sarpanch is elected by the members of the Gram Panchayat from among themselves. There are 13,059 Gram Panchayats covering 18,114 villages in the State.
Nagar Panchayats
9.5 A Nagar Panchayat is established for village/town having a populationbetween 10,000 and 25,000. Nagar Panchayat consists of 15 to 21 members of which two seats are reserved for women and one each for Scheduled Castes and Scheduled Tribes. There.are 131 Nagar Panchayats in the State.
9.6 For each Gram/Nagar Panchayat there is aa Secretary. In each GramPanchayat, Secretary of the Panchayat is also the village accountant and his designation is Talati - cum - Mantri. He works under the Gram/Nagar Panchayat. The recruitment is made by the District Panchayat which is also the competent authority for disciplinary action.
9.7 Social Justic Committee is set up for each Gram/Nagar panchayat. Itsterm is for 5 years. Persons other than panchs but belonging to SC andST and residing in village/Nagar can also be coopted on the Social Justice Committee.
9.8 For a group of villagees a Nyaya panchayat has to be constituted. Conciliation Panchas are also to be appointed for each Gram/Nagar Panchayat. The Nyaya Panchayat are empowered to try certain offences, suits and cases. The Act also provides for the execution of Decrees and orders passed by the Nyaya Panchayats. The execution of the decree is done through the Collector. No apeal lies against a decree or order passed by a Nyaya Panchayat but only revision lies to the District or Sessions Court.
Powers of Nyaya Panchayat includes following powers also-
A -Under Indian Penal Code -Trespass Sec. 447, 448.-Fouling of Water Sec. 277 -Provocation - Sec. 504, 506 -Hurt - Sec. 323 etc.
97
B -Under following Acts
-Prevention of cruelty to Animals Act, 1890
-Bombay District Vaccination Act 18 92
C -Compulsory Primary Education Act
D -Gujarat Panchayats Act 1961- Inflict penalty for
Encroachments etc.
Talulca Panchayats
9.9 The second tier of the Panchayati Raj is the Taluka Panchayat. There are 182 taluka panchayats in the State. The taluka panchayat has supervisory powers over the Gram Panchayats and it is subordinate to the District Panchayat.
%
9.10 The Taluka Panchayat consists of elected and associate members.The number of elected members of the Taluka Panchayats range from 15 to31 depending upon the rural population of the taluka. Reservation for women has been provided as also for Scheduled Castes and Scheduled Tribes.
9.11 MLAs from the talukas, the Sarpanchas and Chairmen of Gram and Nagar Panchayats in the taluka, and Mamlatdar/Mahalkari are associate members. The President and Vice President of the taluka Panchayat arew elected by the membaer elected from amongst qualified voters from the taluka. Associate members have a right to speak or take part in the proceedings but are not entitled to vote.
9.12 The Taluka Panchayat has been entrusted with the planning and execution of agricultural programmes, irrigation schemes, drinking water, village link, approch roads, establishing primary schools, etc. Taluka panchayats are err owered to impose education cess and have concurrent power to levy texes and fees leviable by Gram/Nagar Panchayats. The taluka Panchayat scrutinises the budget of Gram Panchayats and supervise their working.
9.13 The State appoints and officers of the State Service as Taluka Development Officer, who acts as an Ex-Officio Secretary of the Taluka Panchayat. and its Chief Executive Authority. Extention Officers, Gram Sevaks and Primary School Teachers, Talati- cum -Mantris letc. are also working under the Taluka Panchayats.
98
District Panchayat
9.14 The District Panchayat is at the apex of the Panchayati Raj set up. There are 19 District Panchayats having an avarage of 10 Talukas panchayats per each District. The District of Dangs and Gandhinagar consists of one talukas each District Panchayats of these districts function as Taluka Panchayats as well.
9.15 The District Panchayat consists of elected and associate members. The number of elected members in District Panchayat, range from 31 to 51 depenmding upon the size of rural population of each district.The members of district panchayat are directly elected. Reservation for women range from 3 to 5 seats in each District. SC and ST seats are reserved in proportion to their population in the district. SC and ST seats are also reserved for women as per prescribed formula. Apart from elected members, the M.Ps and M.L.A.s from the district, all Taluka Panchayat Presidents and Collector of the districts are Associate Memebers.
9.16 An Associate Member of the Panchayat can participate in the proceeding of the Panchayat of its Committees but is not entitiled to vote or become a Chairman of a Committees .An elected member of District Panchayat shall cease to be an elected member if he becomes a Member of the Parliament or of the State Legislature.
Coomi'btees of District Panchayat-
9.17 It is mandatory for a DistrictPanchayat to consitute the following committees.
- An Executive Committee
- A Social Justice Committee
- An Education Committee
- A Production and Co-opration Committbe
- A Public Health Committee
- A Public Works Committee
“ An Appeal Committee
99
A Fitiance Review Committee Functions:
9.18 The district Panchayat is an apex body in the Panchayati Raj system with powers of supervision and control over all the Panchayats functioning at its lower level i.e.Taluka and Grain/Nagar Panchayats. The various functions of districts Panchayats include constructing wells and tanks for dirinking water, establishing and maintaining of primary health centers and dispensaries; family planning , training of midwives, constructions and maintenance of roads, execution of works entrusted by Government undertaking, eductaional activities entrusted to them, preparation of plans, projects, and schemes.Promoting development of Panchayats, undertaking intehsive schemes for agricultural development inmplementation of key village schemes, rearing of stud calves, development of grass lands, poultry farming, establishing Veterinary hospitals and dispensaries, examining possiblities of village and small scale industries, aiding secondary, technical and Industrial Schools, assistance to the Social Service institutions, arranging fairs and festivals.
9.19 The Act also provides the transfer of functions of the following departmets of the Government to the District Panchayat
-Agriculture -Animal Husbandry -Co-operative Department-Cottage Industries and Small Scale Industries -Family Planning -Revenue Department-Prohibition Department. So far as Prohibition Propaganda is concerned
-District Statistical Officer -Public Health and Medical Relief -P.W.D. and Irrigation activities -Social Welfare
Constitution of Panchayats
9.20 Development Commissioner has to play importanmt role in the constitution of Panchayats. Under section 9(2) of the Gujarat Panchayats Act, he constitutes and desides area juridiction of Gram or Nagar Panchayat. He declares the constituencies and reserved seats of Taluka and District Panchayats under section 14,15,20(3) and 20(4). Moreover, he has to fix the dates of election of Presidents and vice Presidents of District Panchayats under section 67 and 77. He can nominate the members from amongst the qualified persons in case of Taluka and District Panchayat seats remining vacant in elections (section 19) . Development Commissioner can extend the term for a period of not more than one year under section 17(2) in case of Taluka and District Panchayats whenver necessary. He
100
can also decide the cases of dual membership of Gram, Taluka and District Panchayats under section 22-A. He can also report to the Chief Electoral officer regarding the filling of vacancies in case of District Panchayat under section 77(1).
Controlling Powers
9.21 (a) Development Commissioner has been vested with controlling powers to declare any seat vacant in case where the member of District Panchayat incurs disqualification under section 23 and 25.
(b) Decides the cases od appeal in cases of Taluka Panchayat when anymember is removed from membership under section 61.
(c) Has power to decide the cases of remmoval from membership in case ofDistrict Panchayat under section 73(1) & (2).
(d) He can suspend President, Vice President and Chairman of Education Committee of District Panchayat against whom any criminal proceedings in respect of an offence involving moral turpitude are instituted under section 75 (1)
(e) Can prohibit the unlawful resolutions' passed by the DistrictPauchayats under section 294 (5)
(f) He can supersede any Gram, Nagar and Taluka Panchayat for the reasons nonperforming the duties and functions entrusted to them under section 297 .
(g) He can fix the responsibilities for the loss, waste or misapplication of any money or any property of Panchayat under section 317.
'(h) He can give permission under section 322 -A for prosecution of serpanches of village panchayats for the offence.committed under section5 (2) of Anti Corruption Act and Indian Penal Code, 6(2)
ii) He accrods previous sanction to the bye-laws of Gram and Nagar Panchayats under section 324
j) He can permit District Panchayat to incure expenditure on.education and medical relief outside the jurisdiction of Panchayat under section 138
((k) He controls the setup of Gram, Nagar, Taluka and Districts Panchayats under section 203
101
Financial Powers
9.22 He releases the grants for developxnent activities to the District and also land revenue grants and other statutory grants from the special funds under section 194, 202 and for the transferred activities,
Stip«xvi80xy Powers
9.23 Development Commisssiner takes review of the various programmes to be implemented by the districts and guides them in fulfilling the targets of the schemes. He also inspects the various district, taluka gram and nagar panchayats for which he is assisted by special parties. He can call any records of any panchayat.
State Panchayat Coiincil
9.24 There is a unique provision of having a State Panchayat Council in this State. The State Council for Panchayats consists of the following members-
Chairman
(i)Minister in charge of the Department dealing with Panchayat organisation.
Vice Chairman
(ii)The Minister of State dealing with the Panchayat organisation of the State or if there is no such Minister of state, the Deputy Minister dealing with such organisations or in the absence of both such Ministers, the Parliamentary Secretary dealing with such organisation.
Members
(iii) Presidents of District Panchayats
(iv) Seven Members to be nominated by the State Government from amongest persons taking interest in the development of Panchayats. Out of these one shall be a woman and one shall be a persaon from Scheduled Caste one shall be a person from Schedued tribes if none of the members, falling under III above is beleonging to a Scheduled Tribes.
(v) Three officer to be nominated by the State Government.
(vi) Three members to be elected by the Members of the Gujatar Legislstive Assembly from amongest themselves.
102
The functions of this Council are as under
9.25 - To advise the State Government on all general questions pertainingto Panchayats.
- To advise the State Government in respect of a scheme for the trainning of Secretaries and other servants of Panchayats.
- To review the administration of Panchayats and to suggest ways of coordinating the activities of the Panchayats in the State.
>- To suggest ways and means to remove the difficulties experienced by the Panchayats in the State in their administration.
-To make suomoto recommendations to the State Government inregardto any matter dealing with the administration of the Panchayats.
-To report to the State Government on such matters which may berefferred to it by the State Government for its opinion.
Distinctive F««tur«s
9.26 The distinctive features of Panchayati Raj in Gujarat are as follows:
-A single enactment creating organically linked autonomous statutory bodies at the village, taluka and district level
- Creation of Social Justice Committee at all the three levels for securing social justice to weaker sections of the society including persons belonging to Scheduled Castes and Scheduled Tribles
- Creation of a powerful executive body at the district level
- Conferment of a special status to the Education Committee at district level
- Creation of State Council for Panchayats to advise Government on all policy matters concerning Panchayats
- Genuine transfer of powers, functions and duties in the development sphere within the district.
- Liberal transfer of funds alongwith transfer of activities
- Transfer of entire development machinery from village to district level to Pnachayati Raj bodies
103
-Built-in scheme for further devolution of power and dispersal of authority
-Transfer of certain regulatory revenue functions of Panchayati Raj bodies
- Transfer of non-gazetted staff of the Development Departments to the District Panchayats
- Power of recruitment, promotion, transfer and punishment of the staff transferred to the District Panchayat
•-Making available the services of an IAS Officer of the status of Collector to function as Chief Executive Authority for the District Panchayat
- Transfer on deputation of Class I & II officers of development departments to the District Panchayats
- Constitution of Service Selection Board at the State level and District Selection Committee at the Distt.level for recruitment and advice on service matters
- Constitution of the cadre of Talati-cum-Gram Panchayat Mantri(Village Accountant-cum-Secretary) responsible for land revenue collection and Panchayat administration'
- Statutory assignment of 100 % revenue collection to the Panchayati Raj bocies
- Powers to impose/enhance local fund and other cesses and taxes to the three levels of Panchayati Raj bodies
- Creation of non-lapsable fund for assisting weaker areas and encouraging taxation efforts and financing development activities
- Setting upto Development Commissioner's organisation at the State level for guiding supervising and controlling the Panchayati Raj Institutions
- Direct elections are provided for all the 3 levels of Panchayati Bodies and conducted under the supervision of Chief Electroal Officer.The voting age for Panchayat elections has been reduced to 18 years
- Anti-defection provisions are introduced on the lines of CentralIlegislation for Lok Sabha and Legislative Assembly members
-SC & ST representation is provided in all Panchayats. Minimum representation of one SC and ST is provided in all panchayats where there is population of these communities, in case the population is more, the representation is proportionate to the population.
104
Election of Panchayati Raj Bodies
9.27 A noteworthy function of the Panchayati Raj System in the State is that the elections at all levels are held regularly and elaborate arrangement and procedure are adopted undefr the Election Rules framed under the Gujarat Panchayats Act,1961.The State Assembly electoral rolls are also adopted for Panchgayat elections.Voting rights for electing peoples'representative in all the three tire of Panchayati Raj bodies are given to the persons of 18 years and above.
9.28 In fact, the Gujarat Governement took the bold step of giving voting right at the age of 18 years and above as far back as in 1978.
9.29 The elections to the Gram/Nagar/Taluka/District Panchayats are held by Officers independent of the Panchayat, i .e. in the case of Gram Panchayat by Deputy Collector, in the case of Nagar Panchayat by the Collector and in the case of Taluka/District Panchayats by the Chief Electoral Officer of the State.
9.30 At the Taluka and District level, political parties are also recognised and they ‘actively participate in the election. Further, the anti defection law has also been made applicabel to the Taluka and District Panchayats
Delegation of Powers
9.31 In Gujarat, a large number of State functions have been transferred to the District Panchayats and lower levels of Panchayats. These functions are transferred alongwith the staff and 100 % grant is being given to the Panchayat Bodies for proper performance of their functions. No doubt, the panchayats at present mostly depend upon the Government plan and non plan resources given to them. Nearly 90% of the income of Panchayat is from the State Government grant for function and duties transferred to them under the Gujarat Panchayats Act,1961. However, the Act also provide for raising of adequate resources by panchayats themselves too.
9*. 32 In each tier of Panchayat, a Fund has been constituted which in respect of Gram,Nagar,Taluka and District is known as Gram/Nagar/Taluka/District Fund.In this fund, the amount which is given by the State Government by way of land revenue grant, proceeds of any tax or fees inposed by the panchayat, sale proceeds of any property belonging to the panchayat, and the sums received by the panchayat from the State Government by way of different grants for transferred activities and the sums received by the Panchayats from the State Government by way of loan are being credited.
105
Financial Resources
Formation of District/Taluka Funds
9.33 As per the provisions under Section-140 and Section-120 in each district, a district funds is and. each taluka fund constituted and the following items forms the part of District Fund and Taluka Fund.
1.Taxes or fees imposed under the act.2.Sales proceeds of all dust,dirt etc.S.S'ums contricuted by State Government in case of District Fund and in case of taluka fund sum contributed by State Government or by District Panchayat.
4. Sums received by way of loans5.Sums received by way of Government or contributions.6.Income or proceeds of any property vesting in District Panchayat or Taluka Panchayat.!7The net proceeds to cess authorised under section-169 and 171 and Stamp-Duty under Section-184 and 186 as the case may be.
8A11 sums realised by way of rent, penalty, otherwise than as the amount of any kind in a Criminal Case.
Sources of Znconoa:-
9.34 As stated above, various sums received by District Panchayats and Taluka Panchayats are forming the part of District Fund or Taluka fund as the case may be. The various provisions relating to the financial resources of District Panchayats and Taluka Panchayats are as under
1.100% Land Revenue collected in the District, is assigned to the Disrtrict/Taluka/Gram and Nagar Panchayats on the basis of last three years average collection of Land Revenues. After deducting 35 % of collection for providing salaries to the Talati's and 5% for State equalisation fund the balance of 60% Land Revenue grant is distributed as follows under Section-195.
1. 50% to Gram Nagar Panchayats.2. 25% to Taluka Panchayats.3. 10% to District Panchayats.4. 7 1/2% to District equalisation fund.5. 7 1/2% to District Village encourangement fund.
106
2. Under the Provision of Section-169, 50 paise on every rupee of Land
revenue is levied as cess on land revenue.This rate of cess may be increased upto rupees two per rupee of land revenue, if so desired by District Panchayats and the cess levied under this section becomes the own fund income of District Panchayat.
3. Cess on water rate is levied at the rate of 20 paise on every rupee of water rate, leviable under the provision of Bombay Irrigation Act,187 9. This irrigation cess is levied under Section-171 and this amount as per section 175 is disbursed to the talukas through the Collector and forms a part of Taluka fund. This is supposedly used for improvement of irrigation facilities in the district and for repair of irrigation roads.
4. Under the provision of Section-186 and 184 the District Panchayat may increase the Stamp Duty at the rate not exceeding 20 per cent, and taluka panchayat may increase the rate of stamp duty not exceeding fifteen percent and this increased rate of stamp-duty collected becomes the part of District Fund and Taluka fund as the case may be.
5. Taluka Panchayat may impose the taxes and fees which are leviable by Gram or Nagar Panchayats under Section-17 8 but the rate shall not exceed more that 15 percent of the maximum rates prescribed.
6. District Panchayat may impose tax on profession, trade callings etc.under the provision of Section-187, but 50 percent of the collection isto be assigned to Gram or Nagar Panchayats.
I. Under the provision of Minor Mineral rules. Send and Quarry fees collected is to be assigned to District Panchayat and village Panchayat at the rate of 75 percent 25 percent respectively.
8. Under the Bombay Motor Vehicle Act full daily grant is payable to the District Panchayat.
9. As provided under Section 155, the function of primary educationvests in District Panchayat and 100 percent grant is paid to the DistrictPanhcayat for this purpose.
10. As provided in Section 157 the State Government functions may be transferred to the District Panchayats and the other functions which were performed by State Government may also be transferred to the District Panchayat under Section 158 for such transferred functions 100 percent grant is payable to the District Panchayat.
II.' Under the provision of section 202 Government may sanction additionalgrants to Panchayats and as such 50 % . D.A. Grant for Ex.District LocalBoard staff, 5 % Grant of the D.D.O. and his Steno's salaries, 90% of the Grant for washing allowance paid to Class-IV Servants and stationary grant £n lump is being paid to the District panchayat.
107
12. As provided under Section-200 of the Panchayat Act, 5% of the forest revenue collected by the State Government in the preceding year from within the jurisdiction of the District is placed with the respective district panchayat.
It thus forms a part of the District Fund and is to be used for specied work. For more details please see Appendix V
Gram axid Nagar Panchayats.
9.35 The Gram Panchayats are assigned 30 percent of the average of the land revenue collections of the State Collected during the pervious three years. They can also raise resources through taxes and fees such as house tax, octroi, a tax on profession, water rate and fees for various purpose- Act provides for compulsory levy of the two taxes in addition to house tax by G^am Panchayats .To compensate the loss of LR Grant to the Gram Panchayats situated in the Forest area, special provision has been made under G.P. Act for payment of grants out of the forest revenue. The Gram Panchayats are also entitled to levy village Panchayat cess not exceeding25 paise on every rupee to land revenue. The rate can be raised to 100 paise when a special work or project is undertaken by Panchayat. The income of cattle pound fee is retained by Gram Panchayat. Gram/Nagar Panchayats can also augment their resources by getting Grant-in-aid from the special funds namely District Equalisation Fund, District Gram Encouragement Fund and Loans from District Development Fund.
Taluka Panchayats
9.36 Taluka Panchayats get 15% of the average land revenue collected during the previous three years in the Taluka. Most of the Talukas get about Rs.50,000/- as revenue grants. They also get a cess on water rate and income from taxes and fees if so levied. The Taluka Panchayats are empowered to suggest to Government to increase the rate of Stamp duties (otherwise, leviable) by 15%. The Taluka Panchayats are also empowered to levy education cess on land revenue. They can also levy taxes and fees which a Gram Panchayats can levy, either by enhancing the rate upto 15% above the miximum premissible for Gram Panchayats or by levying new taxes within this limit. The Panchayat is also entitled to get the grant in aid from District Equialisation fund on certain terms and conditions prescribed by the rules. Besides these sources which constitute the 'Own Income' of the Taluka Panchayats, they receive large amounts of departmental grants for meeting the expenditure on the scheme transferred or entrusted to the District Panchayats by the State Government and which have been transferred or entrusted for implementation by the District Panchayat to the Taluka Panchayats.
108
Distzict Panchayats
9.37 The District Panchayat gets its main income from the cess on land revenue levied by the State Government at the rate of 50 paise per rupee. The District Panchayats are now given 30 paise out of this 50 paise Local Fund cess and 20 paise is retained by the State Government as Panchayats contribution towards the plan scheme 8 paise out of every fifty paise of Local Fund cess received by District Panchayats are earmarked for expenditure on primary education. The District Panchayat in the State are having their income raised from this source from about Rs.1 crore to Rs.2 crores every year. The Gujarat Panchayats Act also provides for increasing the rate of Local Fund Cess from 50 paise upto 200 paise on every rupee of land revenue collected in a particular District by the state Government . For these purposes the concerned District Panchayat has to apply to the State Government if is appears to District Panchayat that additional provision of funds is necessary for the purposes of carrying out its fundtions and the State Government if deemed proper, sanctions to such increase. The District Panchayat also gets 10 percent of the average land revenue collected di ring the previous three years in the District. They also get 5 percent of the forest revenue as fixed by the Government.
9.38 They also get grant in aid equal to the royalty raised on extraction or removal of sand murrum and kanker from areas within their jurisdction. The District Panchayats are also empowered to levy taxes and fees which a Gram Panchayat can levy either by enhancing the rate of such tax or fee upto 10% above the maximum permissible rate fixed for gram Panchayat or by leving new taxes or fees within the said limit. The District Panchayats are empowered to suggest to Government to increase the rates of stamp duties upto 20% Besides these suouces, the District Panchayat received100 % Grant in aid for meeting the expenditure on scheme or functions transferred or entrusted to them by Governmentr, The Panchayat is also entitled to get grant in aid from State Equalisation Fund for certain purposes according to the relative backwardness of the District. The fund is specially established under the provisions of the Act to minimise the Social and economic inequalities among the District.
Pinancial Powers
9.39 So far as the Gram and Nagar Panchayats are concerned, the main source of revenue is receipts from three compulsory taxes out of which the tax on house and land is compulsory and the other two taxes as the panchayat may choose to levy. The main source of revenue is receipt from octroi levied by these panchayats. So far as these panchayats are concerned amount from the State Government are not directly passed on to these panchayats for activities which have been transferred to the district panchayats and which are inplemented by the district panchayats through the subordinate panchayat including the Gram and nagar Panchayats.I
109
9.40 As regards the Taluka and pistrict Panchayat, the statute provides for transfer of State activities to the District Panchayat with a stipulation that if the District Panchayat desires to implement some such activities through the Taluka panchayat, then, it can do so with the previous approval of the State Government, but in doing so, the District Panchayat may have to transfer the funds personnel and property to the Taluka Panchayat for implementing such activities. Thus Administrative DeparePmgnts of Sachivalaya make requisite provision in their budget estimates in regard to the activities transferred to the Panchayat and after the State budget is voted by the State legislature, the requisite amounts are placed at the disposal of the district Panchayat for meeting the expenditure on such transferred activities. For activities which are implemented through the Panchayat on agency basis, the funds are provided in the State budget and are controlled by the concerned administrative departments and the necessary amount for implementing such actitivies, is passed on to the panchayats as per their requirement. Thus, the main source of income of District as well Taluka Panchayat are the Governemtn grants received in respect of transferred activities. These panchayats have also sources of their own. As for example, the assets which have passed on to these panchayats on dissolution of district level bodies like District Local Board, District School Board which have been dissolved and in whose place the District Panchayats are constituted.
110
9.41 The statute provides that out of the land revenue amount collected in area of jurisdiction of the district Panchayat during the preceeding three years, cent percent amount is passed on to the panchayat. Out ofthis cent percent amount, 35 % is to be retained by the State on accountof expenditure for pay and allowances and training of village panchayat secretaries. Out of the remaining balance,5% is being credited tonon-lapsable fund known ajs State Equalisation Fund, special grants fromwhich fund are to be made to the district panchayat for being utilised to minimise the social and economic disparity in the Districts of the State. Of the remaining balance 50% is to be distributed among Gram and Nagar Panchayats,25% is to be distributed to the Taluka Panchayat and 10% is to be distributed among the District Panchayats. In short, out of the cent percent grant, 35% is retained by Government for expenditure on account of salary and training of village panchayat secretaries and 5% are being retained in the State Equalisation Fund. Thus, 40% is retained by the State Government and the remaining 60% is passed on to the Gram/Nagar/Taluka and District Panchayats in the manner of distribution stated above.
Functions
9.42 The functions transferred to the Panchayats could broadly be devided into following categories:
1.Functions performed by Government or its officers under various statutes and statutory Rules.
2.District level, Plan Schemes "
3.Other functions#schemes and activities.
It would be interesting to study all the three categories with detailed analysis.
9.43 Statutory Functions- Statutory Functions performed by the Government under certain provisions of following Acts and Rules have been transferred to Panchayats.
i The Bombay Land Revenue Code,187 9
ii Gujarat Land Revenue Rules,1972
iii The Land Improvement Loans Act,1983
iv The Agriculturists Loans Act.1884
V The Non-Agriculturists loans Act,1928
vi The Land Improvement Loans Rules,1959
vii The Agriculturists loans Rules,1959
viii The Non-Agriculturists Loans Rules, 1959
ix The Gujarat CoToperative Societies Act,1961
X The Gujarat Co-operative Societies Rules, 1961 (i) and (ii) LandRevenue Code and Rules.
Main Revenue functions transferred (Appendix-VI) could be divided Into heads as under:-
(a) Collection of land revenue, cesses and other dues and maintenance of their accounts
(b) Permission for non agricultural use of land and imposing penalties connected therewith
Ill
(c) Maintenance of boundary marks
(d) Disposal of certain villages site and tank bed land, certain excepted minor products like kankar, Murrum, sand etc. and following water for irrigation (iii) to (viii) Tagavi Loans-
9.44 The Current policy of the Government is to provide the normal credit requirements of the farming community through institutional channels of the Co-operative. However, during conditions of scarcity and flood damage when normal facilities are not capable of being availed of Government provides disttress relief through Panchayats in rural areas limited to certain scales laid down in the Scarcity Mannual and various orders issued by the Government from time to time.
(ix) and(x) Government have transferred the following funbctions earlier discharged by the District Registrar of Co-operative Societies to District Panchayats in relation to specifild societies.
(A) Registration of Co-operative Societies(Section 9)
(B) Maintenance of Co-operative Societies Register(Section 10)
(C) To decide certain questions regarding members at the time of registration(Section 11)
(D) Amendment to Bye-Laws of Co-operative Societies(Section 13)
(E) Change of name of Co-operative Societies(Section 15)
(F) Amalgamation, transfer, division or conversion of Societies (Section 17)
(G) Cancellation registration of amalgamated divided converted Societies(Section 18)
(H) Reconstruction of Societies (section 19)
(I) Approval of partnership of Societies(Section 21)
(J) Appeal against refusing admission to membership to Societies(Section 24)
(K) Handing over records, papers and property to Co-operativeSocieties to their Secretaries as Chairman(Section 75)
(L) Calling annual general meeting or extending the period for holdingsuch meeting of Co-operative Societies (Section 77)
(M) Calling of Special General Meeting (Section 78)
112
(N) Disposal of surplus of Co-operative Societies when winded up (Section 115)
9.45 Plan Schemes:- Committee of Plan project. Study (Balwantri Mehta) Team.and the Democratic Decentralisation Cormnittee appointed by the Gujarat Government rjecommended genuine transfer of power to the Panchayati Raj Institutions, Accordingly, the most striking feature of Panchayati Raj in Gujarat has been the entrusting the District Panchayat with full executive authority with respect to the Development functions which were formerly discharged by the State Government at the District level.List of Plan Schemes transferred to the Panchayats in Gujarat indicates that almost all district level schemes have been entrusted to the Panchayats for implementation (Appendix NO VII)
9.46 The execution of about 155 Plan Schemes, from various departments is at present entrusted to the District Panchayats $s transferred activities and some more may be transferred.
9.47 Other functions- A number of non plan schemes and other ancillary functions and powers have also been transferred to the Panchayats, by the various departments of Government.
Sup«rvi8ion over other Panchayats
9.48 The District Panchayat exercises vast powers of supervision and control over the lower level panchayats. It has appellate authority over Grarti/Nagar Panchayats, power to call for records of any lower level Panchayats, power to appoint members of Gram Panchayat in case of failurer of election, removal of members and office bearers of Gram/Nagar and Taluka Panchayats, deciding disputes regarding election of President, vice President of Taluka Panchayats, supervision over revenue matters entrusted to lower panchatyats, accepting of resignation of President of Taluka Panchayat and power to suspend President and Vice- President of Taluka Panchayat. It has also appellate power in respect of taxation by lower level panchayats and scrutiny of their projects. The State Government is required to consult the District Panchayats before the supersession of any of the lower level Panchayats.
Review
9.49 Panchayati Raj in Gujarat has remained under constant observation, scrutiny, review and vigilance at all levels. The State Government has had very open policy about learning from experience.
9.50 A committee was appointed in June,1964 to suggest amendments to Gujarat Panchayats Act in the light of the experience gained during the first stage of working of Panchayati Raj Bodies. Shri Jadavji K. Modi, President, District Panchayat, Bhavnagar was the Chairman of the First such Committee which submitted its report to State Government in 1965.
113
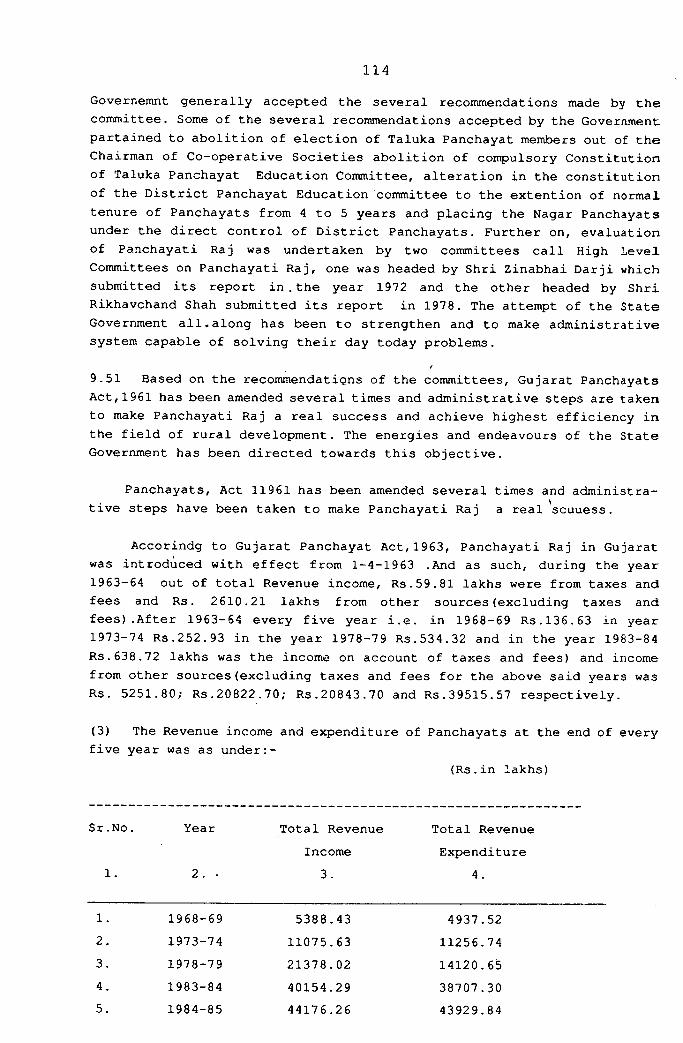
Governemnt generally accepted the several recommendations made by the committee. Some of the several recommendations accepted by the Government partained to abolition of election of Taluka Panchayat members out of the Chairman of Co-operative Societies abolition of compulsory Constitution of Taluka Panchayat Education Committee, alteration in the constitution of the District Panchayat Education committee to the extention of normal tenure of Panchayats from 4 to 5 years and placing the Nagar Panchayats under the direct control of District Panchayats. Further on, evaluation of Panchayati Raj was undertaken by two committees call High Level Committees on Panchayati Raj, one was headed by Shri Zinabhai Darji which submitted its report in . the year 1972 and the other headed by Shri Rikhavchand Shah submitted its report in 1978. The attempt of the State Government all.along has been to strengthen and to make administrative system capable of solving their day today problems.
9.51 Based on the recommendations of the committees, Gujarat Panchayats Act,1961 has been amended several times and administrative steps are taken to make Panchayati Raj a real success and achieve highest efficiency in the field of rural development. The energies and endeavours of the State Government has been directed towards this objective.
Panchayats, Act 11961 has been amended several times and administrative steps have been taken to make Panchayati Raj a real 'scuuess.
Accorindg to Gujarat Panchayat Act,1963, Panchayati Raj in Gujarat was introduced with effect from 1-4-1963 .And as such, during the year 1963-64 out of total Revenue income, Rs.59.81 lakhs were from taxes and fees and Rs. 2610.21 lakhs from other sources(excluding taxes andfees) .After 1963-64 every five year i.e. in 1968-69 Rs.136.63 in year 1973-74 Rs.252.93 in the year 1978-79 Rs.534.32 and in the year 1983-84 Rs.638.72 lakhs was the income on account of taxes and fees) and income from other sources(excluding taxes and fees for the above said years was Rs. 5251.80; Rs.20822.70; Rs.20843.70 and Rs.39515.57 respectively.
(3) The Revenue income and expenditure of Panchayats at the end of every five year was as under
(Rs.in lakhs)
114
Sr.No
1 .
Year
2 .
Total Revenue Income 3.
Total Revenue Expenditure
4 .
1 .
2 .3.4.5.
1968-691973-741978-791983-841984-85
5388.4311075.6321378.0240154.2944176.26
4937.5211256.7414120.6538707.3043929.84
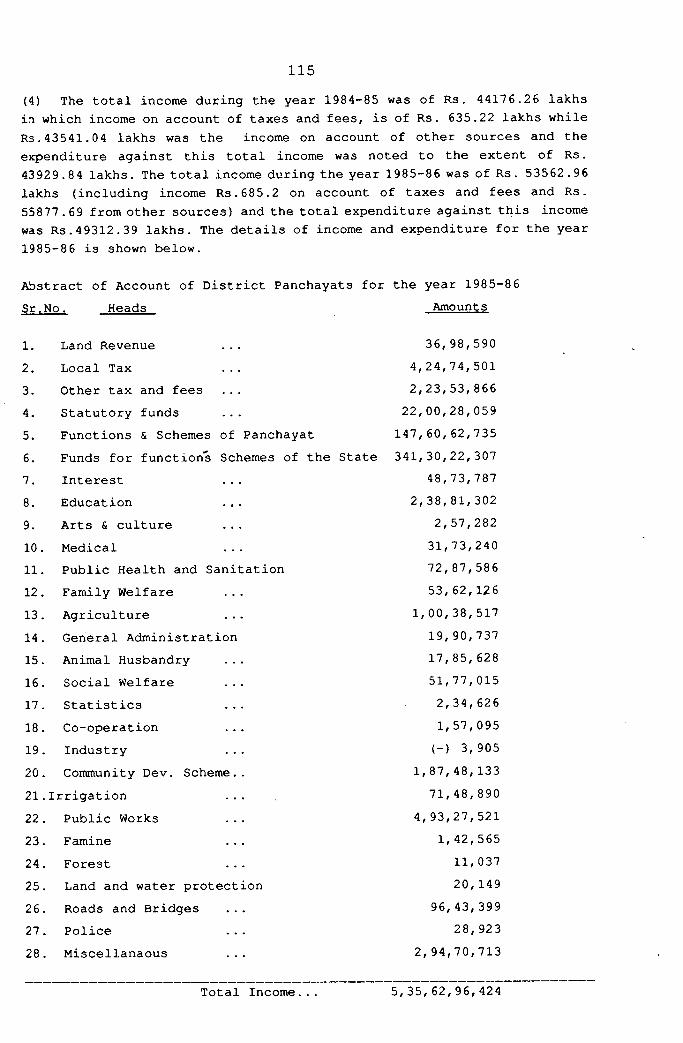
(4) The total income during the year 1984-85 was of Rs. 44176.26 lakhs in which income on account of taxes and fees, is of Rs. 635.22 lakhs while Rs.43541.04 lakhs was the income on account of other sources and the expenditure against this total income was noted to the extent of Rs. 43929.84 lakhs. The total income during the year 1985-86 was of Rs. 53562.96 lakhs (including income Rs.685.2 on account of taxes and fees and Rs. 55877.69 from other sources) and the total expenditure against this income was Rs.49312.39 lakhs. The details of income and expenditure for the year 1985-86 is shown below.
115
Abstract of Account of District Panchayats for the year 1985-86Sr.No. Heads Amounts
1. Land Revenue 36,98,5902. Local Tax 4,24,74,5013. Other tax and fees 2,23,53,8664. Statutory funds 22,00,28,0595. Functions & Schemes of Panchayat 147,60,62,7356. Funds for functions Schemes of the State 341,30,22,3077. Interest 48,73,7878. Education ... 2,38,81,3029. Arts & culture 2,57,28210. Medical 31,73,24011. Public Health and Sanitation 72,87,58612. Family Welfare 53,62,12613. Agriculture ... 1,00,38,51714. General Administration 19,90,73715. Animal Husbandry 17,85,62816. Social Welfare 51,77,01517 . Statistics 2,34,62618 . Co-operation 1,57,09519. Industry (-) 3,90520. Community Dev. Scheme.. 1,87,48,13321.Irrigation ... 71,48,89022. Public Works 4,93,27,52123. Famine ... 1,42,56524. Forest 11,03725. Land and water protection 20,14926. Roads and Bridges 96,43,39927. Police 28,92328. Miscellanaous 2,94,70,713
Total Income... 5,35,62,96,424
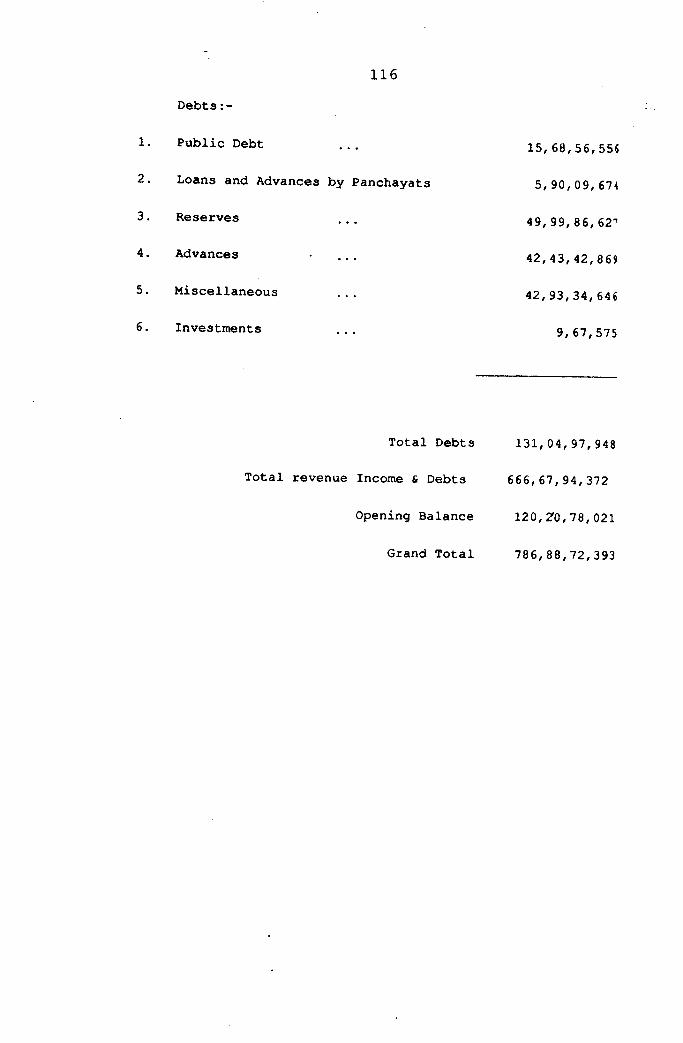
116Debts:-
1. Public Debt
2. Loans and Advances by Panchayats
3. Reserves ...
4. Advances ...
5. Miscellaneous ...
6. Investments ...
15,68,56,55«
5, 90, 09, 674
49, 99, 86, 627
42,43,42,869
42,93,34,646
9,67,575
Total Debts 131,04,97,948
Total revenue Income & Debts 666,67,94,372
Opening Balance 120, 20, 78, 021
Grand Total 786,88,72,393
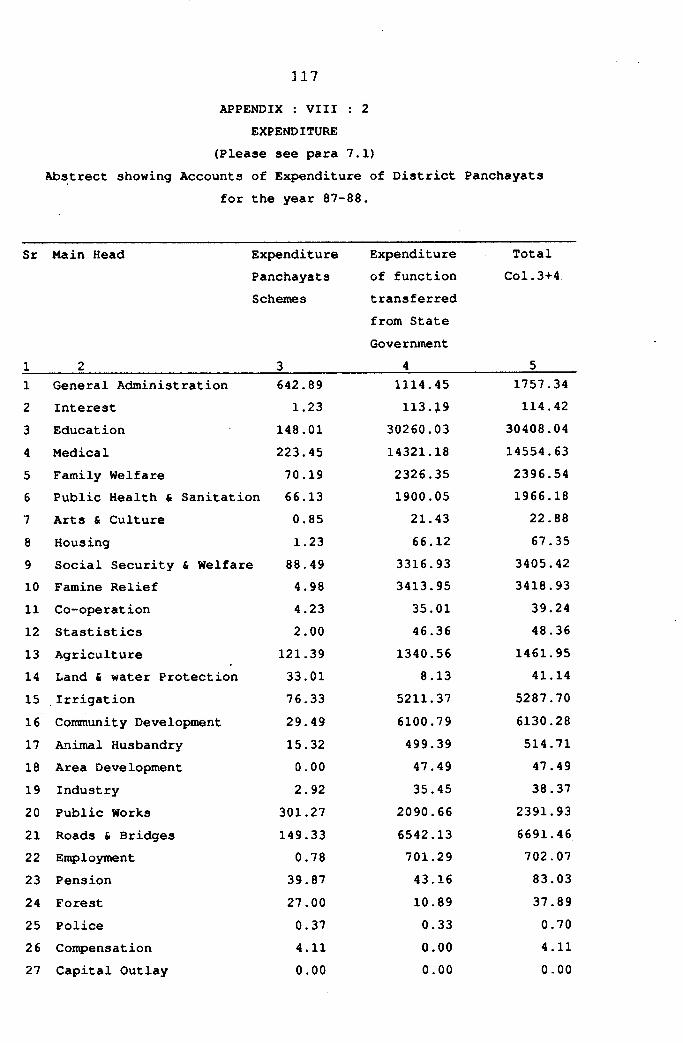
APPENDIX : VIII ; 2 EXPENDITURE
(Please see para 7.1)Abstrect showing Accounts of Expenditure of District Panchayats
for the year 87-88.
Ill
Sr Main Head Expenditure Expenditure TotalPanchayats of function Col.3+4Schemes transferred
from State Government
1 2 3 4 51 General Administration 642.89 1114.45 1757.342 Interest 1.23 113.19 114.423 Education 148.01 30260.03 30408.044 Medical 223.45 14321.18 14554.635 Family Welfare 70.19 2326.35 2396.546 Public Health & Sanitation 66.13 1900.05 1966.187 Arts & Culture 0.85 21.43 22.888 Housing 1.23 66.12 67.359 Social Security & Welfare 88.49 3316.93 3405.4210 Famine Relief 4.98 3413.95 3418.9311 Co-operation 4.23 35.01 39.2412 Stastistics 2.00 46.36 48.3613 Agriculture 121.39 1340.56 1461.9514 Land & water Protection 33.01 8.13 41.1415 Irrigation 76.33 5211.37 5287.7016 Community Development 29.49 6100.79 6130.2817 Animal Husbandry 15.32 499.39 514.7118 Area Development 0.00 47.49 47.4919 Industry 2.92 35.45 38.3720 Public Works 301.27 2090.66 2391.9321 Roads & Bridges 149.33 6542.13 6691.4622 Enqployment 0.78 701.29 702.0723 Pension 39.87 43.16 83.0324 Forest 27.00 10.89 37.8925 Police 0.37 0.33 0.7026 Condensation 4.11 0.00 4.1127 Capital Outlay 0.00 0.00 0.00
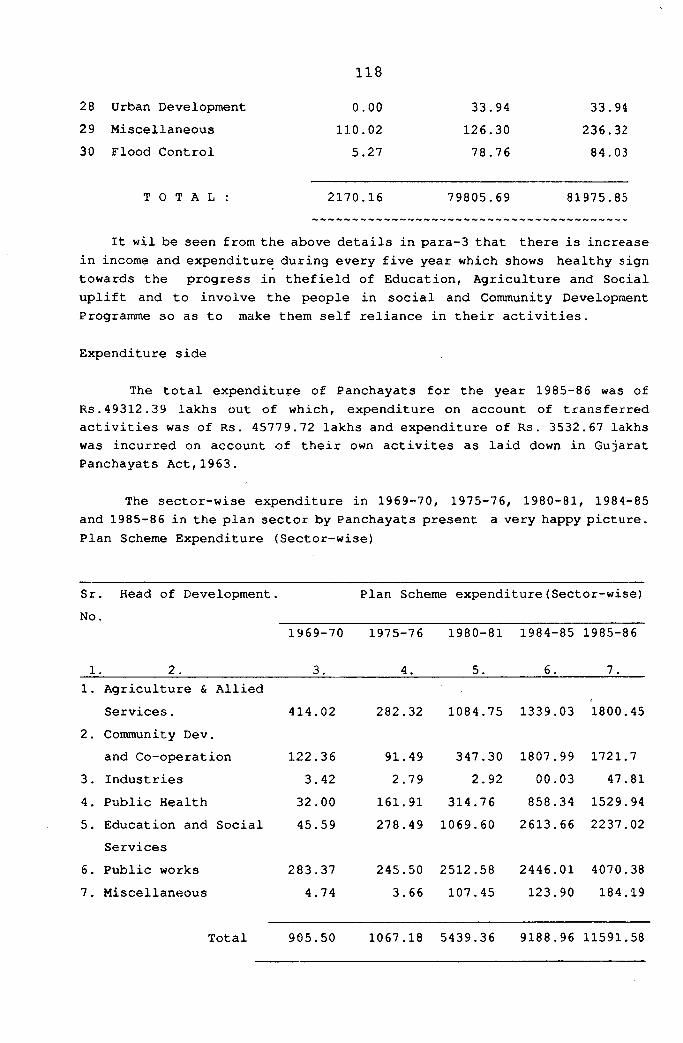
11828 Urban Development29 Miscellaneous30 Flood Control
0.00110.025.27
33.94126.3078.76
33.94236.3284.03
T O T A L : 2170.16 79805.69 81975.85
It wil be seen from the above details in para-3 that there is increase in income and expenditure during every five year which shows healthy sign towards the progress in thefield of Education, Agriculture and Social uplift and to involve the people in social and Community Development Programme so as to make them self reliance in their activities.
Expenditure side
The total expenditure of Panchayats for the year 1985-86 was of Rs.49312.39 lakhs out of which, expenditure on account of transferred activities was of Rs. 45779.72 lakhs and expenditure of Rs. 3532.67 lakhs was incurred on account of their own activites as laid down in Gujarat Panchayats Act,1963.
The sector-wise expenditure in 1969-70, 1975-76, 1980-81, 1984-85 and 1985-8 6 in the plan sector by Panchayats present a very happy picture. Plan Scheme Expenditure (Sector-wise)
Sr. Head of Development. No.
Plan Scheme expenditure (Sector-wise)
1 2.
1969-70
3.
1975-76
4.
1980-81
5.
1984-85
6.
1985-86
7 .1. Agriculture & Allied
Services. 414.02 282.32 1084.75 1339.03 1800.452. Community Dev.
and Co-operation 122.36 91.49 347.30 1807.99 1721.73. Industries 3.42 2.79 2.92 00.03 47.814. Public Health 32.00 161.91 314.76 858.34 1529.945. Education and Social 45.59 278.49 1069.60 2613.66 2237.02
Services6. Public works 283.37 245.50 2512.58 2446.01 4070.387. Miscellaneous 4.74 3.66 107.45 123.90 184.19
Total 905.50 1067.18 5439.36 9188.96 11591.58

Ixi^lexnentation of Transferred activities: -
The expenditure of Rs. 11591.58 lakhs out of total expenditure of Rs. 4 9312.37 lakhs was on account of implementation of various Schemes of Five Year Plan which comes 42% of the total expenditure. The head wise details are given in Annexure-13.
The expenditure on account of implementation of various schemes of five year Plan is shown in percentage as under
119
SrNo
Head Transferred activities Amount of Expenditure
Percentage Total Expdt.
Percentage
1 General Administration 1992.97 4.5%2 Agriculture
Animal Husbendry 1596.81 13.78% 1742.12 3.3%3 Community Development
Co-operation 1121.19 14.85% 5682.22 11.52%4 Industries 47 .81 0.41% 42.16 0.08%5 Social service &
Relief on account ofFamine 972.51 8.39% 1937.13 3.93%
S Public works 4070.38. 35.11% 3218.62 6.53%7 Misc..... 3182.28 27.46% 36690.14 74.40%
Total... 11591.58 100.00% 49312.39 100.00%
Gram and Nagar Panchayats:-
At the village level gram/nagar Panchayats activities have also increased manifold. Drinking water Supply, maintenance of village roads, street lighting contribution and maintenance of school Building etc. have become increasingly the concern of these institutions. Panchayats are anxiously comming forward to increse their resources to cope with to increasing local aspiations and felt needs.
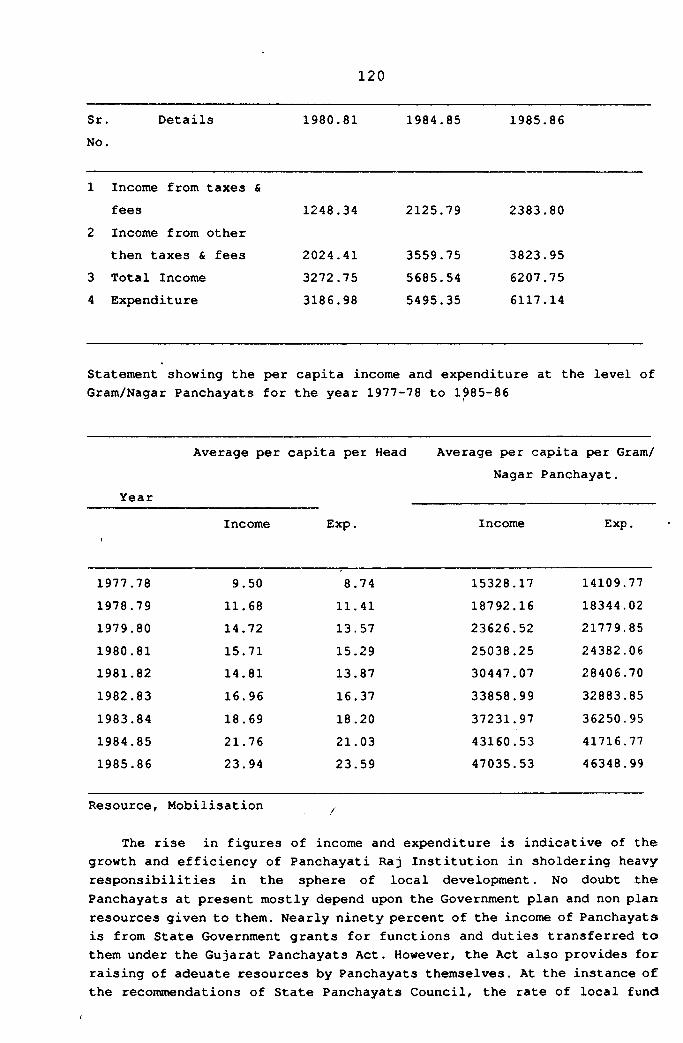
120
Sr.No.
Details 1980.81 1984.85 1985.86
Income from taxes &fees 1248.34 2125.79 2383.80Income from otherthen taxes & fees 2024.41 3559.75 3823.95Total Income 3272.75 5685.54 6207.75Expenditure 3186.98 5495.35 6117.14
Statement showing the per capita income and expenditure at the level of Gram/Nagar Panchayats for the year 1977-78 to 1985-86
Average per capita per Head Average per capita per Gram/Nagar Panchayat.
Year
-Income Exp. Income Exp.
1977.78 9.50 8.74 15328.17 14109.771978.79 11.68 11.41 18792.16 18344.021979.80 14.72 13.57 23626.52 21779.851980.81 15.71 15.29 25038.25 24382.061981.82 14.81 13.87 30447.07 28406.701982.83 16.96 16.37 33858.99 32883.851983.84 18.69 18.20 37231.97 36250.951984.85 21.76 21.03 43160.53 41716.771985.86 23.94 23.59 47035.53 46348.99
Resource, Mobilisation /
The rise in figures of income and expenditure is indicative of the growth and efficiency of Panchayati Raj Institution in sholdering heavy responsibilities in the sphere of local development. No doubt the Panchayats at present mostly depend upon the Government plan and non plan resources given to them. Nearly ninety percent of the income of Panchayats is from State Government grants for functions and duties transferred to them under the Gujarat Panchayats Act. However# the Act also provides for raising of adeuate resources by Panchayats themselves. At the instance of the recommendations of State Panchayats Council, the rate of local fund
cess was raised from 20 paise to 50 paise on every rupee of Land Revenue collected as from 1st August, 1965, so as to provide more funds to the Panchayati Raj Bodies as well as for their pain contributions.By an amendment to Gujarat Panchayats Act, brought in force from 16th April,1963 the District Panchayts have been enabled to raise the said local fund cess of 50 paisa upto 200 paise if they so desire. The Panchayats have shown considerable zeal and enthusiasm in availing themselves of the provisions to raise their various resources. Most of the District Panchayats have availed themselves of the provisions to raise stamp duty in their jurisdiction. Most of the District Panchayats have already availed themselves of the provisions of increasing the local fund cess beyond 50 paise for every rupee of land revenue. Most of the taluka Panchayats have availed themselves of the provision of raising stamp duty. All this is indicative of the keen interest of Panchayat institutions in resources mobilisation.
Control
Though the Panchayati Raj bodies are autonomous statutory Corporate bodies, adequate control mechanism is provided within the organisation as wel as from outside. The internal and external control and supervision take the place as states below
1. Audit of Account of all Panchayats. at various level, is done by the Examiner of Local Fund Accounts.
2. Annual inspection of District Panchayats, Taluka Panchayats and fewof the Gram Panchayats and Nagar Panchayats is done by the Development Commissioner. ,
3. Provision for suspension of execution of any unlawful resolutionsor orders passed by Panchayats or on behalf of them has been made in thelaw.
4. Appeals and revison against the decision of the District Panchayats lie with the Development Commissioner.
5. Reference to the Court is provided for with regard to certain specific provision connected with election etc.
6 In extreme cases, Panchayats Bodies can be superceded.
7. Execution of an unlawful resolution of Panchayats can be suspended by higher authority.
8. In case of default in emergent circumstances, there is provision for alternative enforcement by superior authority.
9. Panchayats service is subject to the control of State Government.
121
10. Panchayats are duty bound to carry out the State policy in general in performance of functions and duties assigned to them. It is also their duty to give effect to written directions of the State Government.
11. For the Welfare of Scheduled Castes and Scheduled Tribes espacialy for the removal of untouchability, directives of the State Government are obligatory. N12. In certain circumstances, the office bearers can be
suspended or removed. They are also subject to vote of no confidence and liable to be surcharged in case of causing financial loss to the institutions.
Role of Services
The question of services in Panchayati Raj is quite a complicated one because on the one hand and autonomous body needs control on its officers and on the other hand, in a developing country like ours ai local body can have the services of competent officers only if they are made available on deputation from larger cadres of State Department.In the Panchayati Raj system of Gujarat, as in most other States, the services fall into two categories,(i)Those consistuting Panchayat Service and(ii) those posted under the panchayats from the State Service . The latter category of officers are treated as on deputation to the Panchayats without any deputation allowances. The first category consists of those who were servants of the former District Local Boards, District School Boards and servants allocated from Government Departments in connection with the Governmental activities transferred to the Panchayats and the personnel recruited by the Panchayati Raj bodies themselves for their smooth working. Though disciplinary control over all these categories of personnel is retained with the Panchayati Raj Bodies, sufficient safeguards have been provided against subjective considerations under the rules framed in this behalf. An employee has been given sufficient opportunity to defend himself before any major punishment is inflicted upon him.Prior consultation with the District Panchayat Service Selection Committee for the Gujarat Panchayat Service Selection Board further ensures impartial consideratioa before major punishment is inflicated on such officials by the Panchayati. Raj Bodies.This is further ensured by keeping the appellate/revisionary powers with the Development Commissioner.Civil Service Tribunal and the State Government itself.So far as the officers on deputation to Panchayats are concerned, the Panchayat exercise day to day control over them. Though a Panchayat can institute a preliminary enquiry against any such officer,(excluding of course the District Development Officer) all other disciplinary control in respect of these officers is retained with the State Government.
The Confidential Reports of members of the Panchayat service are wrrtten by various officers under the Panchayat, as directed by the District
122
Development Officer. The Confidential reports of the Taluka Development Officer are written by the District Development officer and forwarded to the Development Commissioner.
Officers in the Panchayati Raj institutions are expected to give their advice to the Committee and to the office bearers and carry out the decisions of the Panchayat or Panchayat Committees
as the case may be. In case however a Taluka Development Officer or District Development Officer feels that a decisions is illegal, he may bring it to the notice of the District Development Officer and the Development Commissioner respectively. In fact, the Taluka Development Officer and District Development Officer have been given certain powers under the Act, to take necessary measures for speedy executution of works and schemes, to exercise supervision and control over officers under Taluka/District Panchayats including power to lay down their duties, sanction leave, write annual confidential reports etc.
Role of Gujarat Civil Services Tribiuial.
For the purpose of securing in more effective and satisfactory manner the just claims and interests of specified Civil Servants with respect of certain matters affecting their rights, the State Government has constituted a Tribunal to be called the Gujarat Civil services Tribunal. Specified Civil servants mean person who are or who have been member of the Civil Services of the State of Gujarat or the Panchayat Service but dose not include persons who are or who have been police officer.
Any Specified Civil Servant aggrieved by an original or appallote order or decision of any officer or authority other than the State Government with respect to any of the matters specified in the schedule below may within a period of ninety days from the date of such order or decision appeal to the Tribunal against such order or decision in a case when an appeal lies under law to the State Government.
Panchayat Service Recruitment Rules:
Under section 210 of Gujarat Panchayat Act, Gujarat Panchayat Service Commission has been formed for the recruitment of Class III panchayat services and under section 211 of Gujarat Panchayat Act. District Panchayat Service Commission has been formed.
Gujarat Panchayat services commission recruits candidates for appointment to district cadres after following the rules therefore.
District Panchayat Service Commission recruits clerical staff among the district cadre and inferior servants as per rules.
123
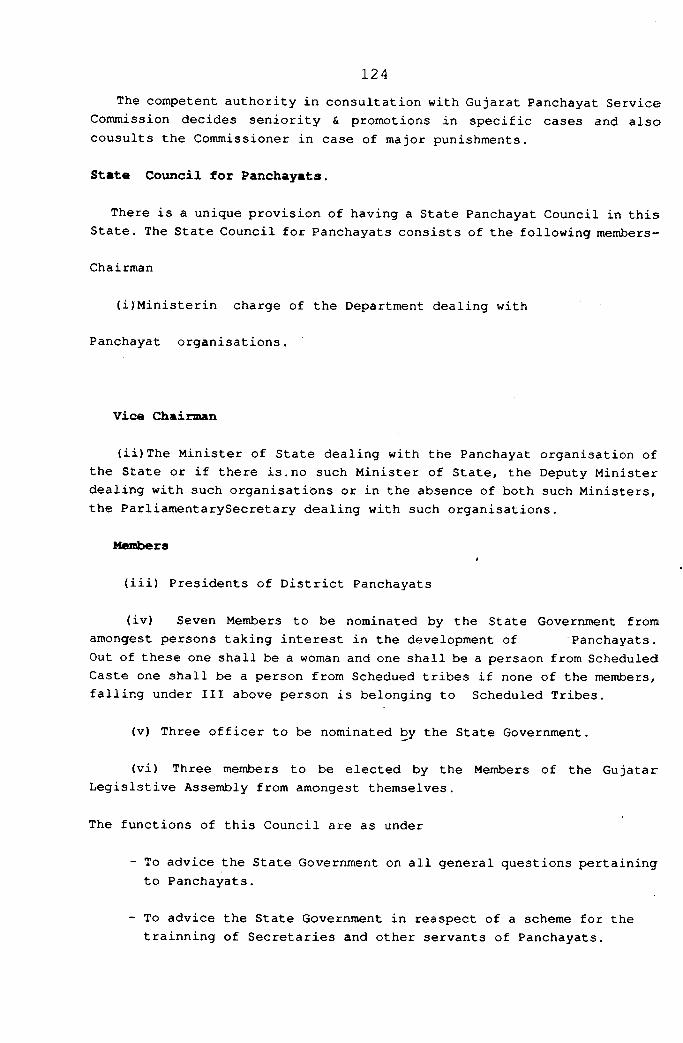
The competent authority in consultation with Gujarat Panchayat Service Commission decides seniority & promotions in specific cases and also cousults the Commissioner in case of major punishments.
State Coxincil for Panchayats.
There is a unique provision of having a State Panchayat Council in this State. The State Council for Panchayats consists of the following members-
Chairman
(i)Ministerin charge of the Department dealing with
Panchayat organisations.
124
Vice Chairman
(ii)The Minister of State dealing with the Panchayat organisation of the State or if there is.no such Minister of State, the Deputy Minister dealing with such organisations or in the absence of both such Ministers, the ParliamentarySecretary dealing with such organisations.
MembersI
(iii) Presidents of District Panchayats
(iv) Seven Members to be nominated by the State Government fromamongest persons taking interest in the development of Panchayats.Out of these one shall be a woman and one shall be a persaon from Scheduled Caste one shall be a person from Schedued tribes if none of the members, falling under III above person is belonging to Scheduled Tribes.
(v) Three officer to be nominated by the State Government.
(vi) Three members to be elected by the Members of the Gujatar Legislstive Assembly from amongest themselves.
The functions of this Council are as under
- To advice the State Government on all general questions pertaining to Panchayats.
- To advice the State Government in reaspect of a scheme for the trainning of Secretaries and other servants of Panchayats.
- To review the administration of Panchayats and to suggest ways of co-ordinating the activities of Panchayats in the State.
- To suggest ways and means to remove the difficulties experienced by the Panchayats in the State in their administration.
“To make suomuto recommendations to the State Government in regardto any matter dealing to the administration of the Panchayats.
-To report to the State Government on such matters may be refferred to it by the State Government for its opinion.
Review and axnendxnents
Panchayati Raj in Gujarat has remained under constant observation, scrutiny, review and vigilance at all levels. The State Government has had very open policy about learning from experience.
A committee was appointed in June,1964 to suggest amendments to Gujarat Panchayats Act in the light of the experience gained during the first stage of working of Panchayati Raj Bodies. Shri Jadavji K. Modi, President, District Panchayat, Bhavnagar was the Chairman of the First such Committee which submitted its report to State Government in 1965. Governemnt generally accepted the several recommendations made by the committee. Some of the several recommendations accepted by the Government pertained to abolition of election of Taluka Panchayat members out of the Chairman of Co-operative Societies abolition of compulsory Constitution of Taluka Panchayat Education Committee, alteration in the constitution of the District Panchayat Education committee to the extention of normal tenure of Panchayats from 4 to 5 years and placing the Nagar Panchayats under the direct control of District Panchayats. Further on, evaluation of Panchayati Raj was undertaken by two committees call High Level Committees on Panchayati Raj, one was headed by Shri Zinabhai Darji which submitted its report in the year 1972 and the other headed by Shri Rikhavchand Shah submitted its report in 1978. The attempt of the State Government all along has been to strengthen and to make administrative system capable of solving their day today problems.
Based on the recommendations of the committees, Gujarat Panchayats Act of 1961 has been amended several times and administrative steps are taken to make Panchayati Raj a real success and achieve highest efficiency in the field of rural development. The energies and endeavours of the State Government has been directed towards this objective.
125
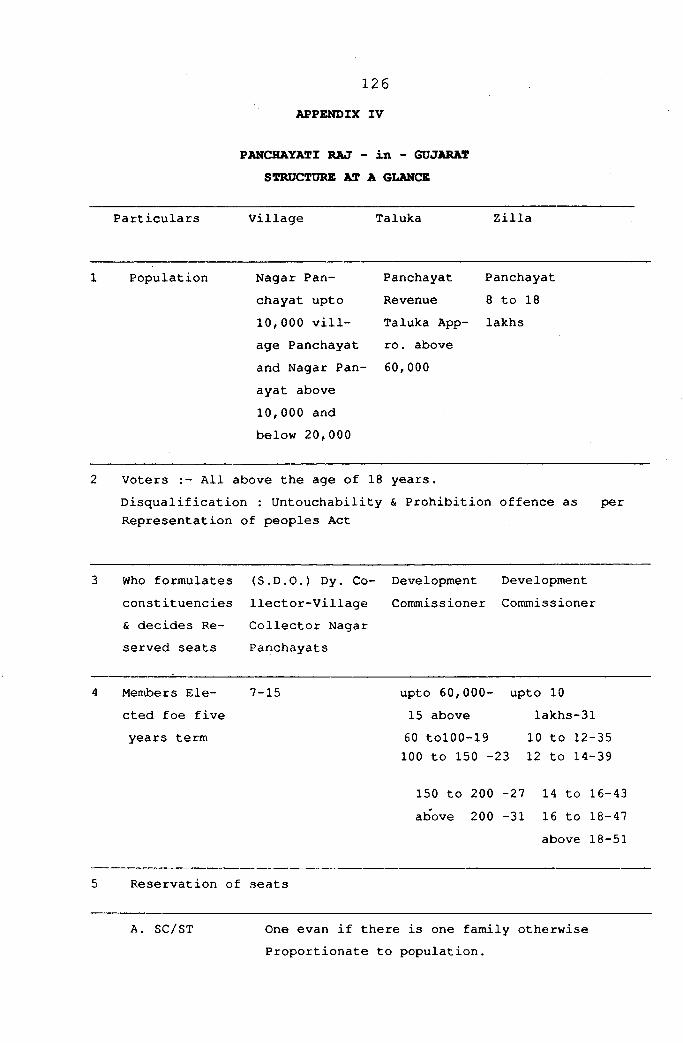
APPENDIX IV126
PANCHAYATI RAJ - in - GUJARAT STRUCTURE AT A GLANCE
P a r t i c u l a r s V i l l a g e T a l u k a Z i l l a
1 P o p u l a t i o n N a g a r P a n - P a n c h a y a t P a n c h a y a t
c h a y a t u p t o R e v e n u e 8 t o 1810.000 v i l l
a g e P a n c h a y a t
a n d N a g a r P a n -
a y a t a b o v e
10.000 a n d
b e l o w 20,000
T a l u k a A p p
r o . a b o v e
60,000
l a k h s
Voters All above the age of 18 years.Disqualification : Untouchability & Prohibition offence as perRepresentation of peoples Act
3 Who formulates (S.D.O.) Dy. Co Development Developmentconstituencies llect or- Village Commissioner Commissioner& decides Re Collector Nagarserved seats Panchayats
4 Members Ele 7-15 upto 60,000- upto 10cted foe five 15 above lakhs-31years term 60 tolOO-19 10 to 12-35
100 to 150 -23 12 to 14-39
150 to 200 -27 14 to 16-43above 200 -31 16 to 18-47
above 18-51
5 Reservation of seats
A. SC/ST One evan if there is one family otherwise Proportionate to population.
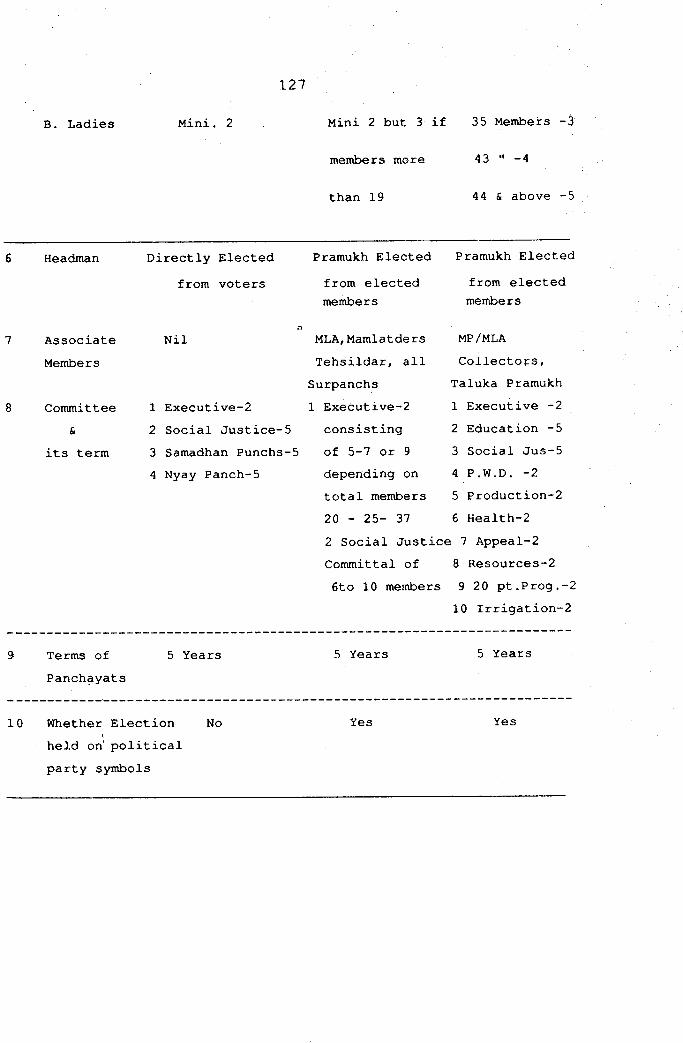
B. Ladies
127
Mini. 2 Mini 2 but 3 if 35 Members -3
members more
than 19
43 " -4
44 & above -5
6 Headman Directly Elected Pramukh Elected Pramukh Electedfrom voters from elected from elected
members members
7 AssociateO
Nil MLA, Mamlatders MP/MLAMembers Tehsildar, all Collectors,
Surpanchs Taluka Pramukh8 Committee 1 Executive-2 1 Executive-2 1 Executive -2
& 2 Social Justice-5 consisting 2 Education -5its term 3 Samadhan Punchs-5 of 5-7 or 9 3 Social Jus-5
4 Nyay Panch-5 depending on 4 P.W.D. -2total members 5 Production-220 - 25- 37 6 Health-22 Social Justice 7 Appeal-2Committal of 8 Resources-26to 10 members 9 20 pt.Prog.-2
10 Irrigation-2
Terms of 5 Years 5 Years 5 YearsPanchayats
10 Whether Election No Yes Yes\held on' political
party symbols
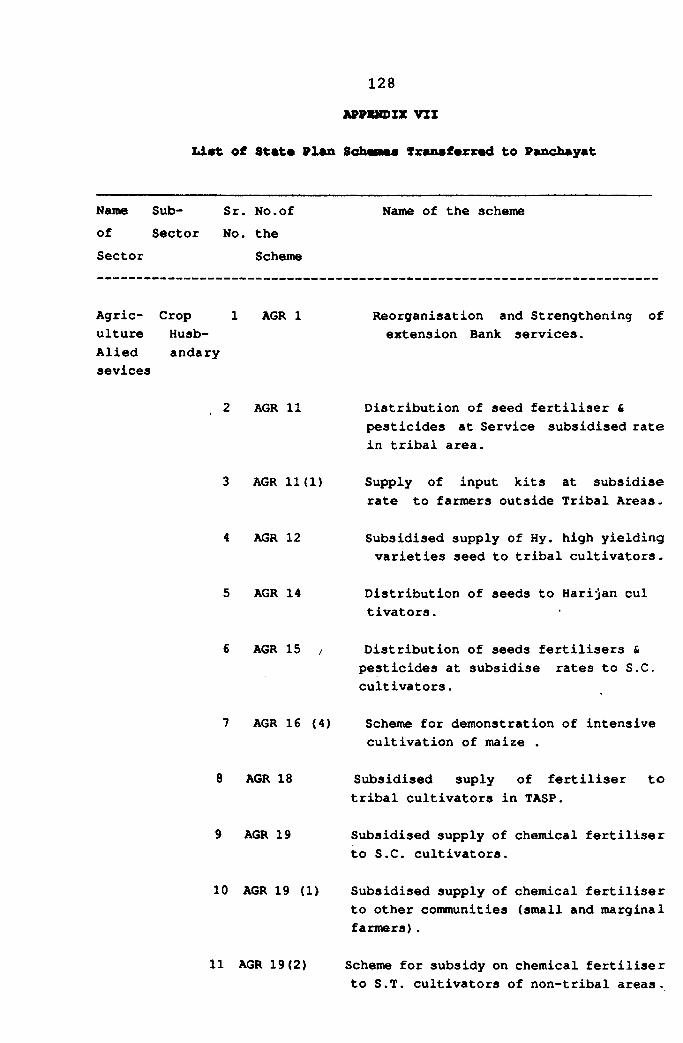
128 APPKKDIX VII
Llat of 8t«t* Pl*n Schemes Transferred to Pancheyat
Name Sub- of Sector Sector
Sr. No.of No. the
Scheme
Name of the scheme
Agric- Crop 1 ulture Husb- Alied andary sevices
AGR 1 Reorganisation and Strengthening of extension Bank services.
2 AGR 11 Distribution of seed fertiliser & pesticides at Service subsidised rate in tribal area.
3 AGR 11(1) Supply of input kits at subsidise rate to farmers outside Tribal Areas.
4 AGR 12 Subsidised supply of Hy. high yielding varieties seed to tribal cultivators-
5 AGR 14 Distribution of seeds to Harijan cul tivators.
AGR 15 Distribution of seeds fertilisers & pesticides at subsidise rates to S.C. cultivators.
7 AGR 16 (4) Scheme for demonstration of intensivecultivation of maize .
8 AGR 18 Subsidised suply of fertiliser to tribal cultivators in TASP.
AGR 19 Subsidised supply of chemical fertiliser to S.C. cultivators.
10 AGR 19 (1) Subsidised supply of chemical fertiliser to other communities (small and marginal farmers).
11 AGR 19(2) Scheme for subsidy on chemical fertiliser to S.T. cultivators of non-tribal areas.
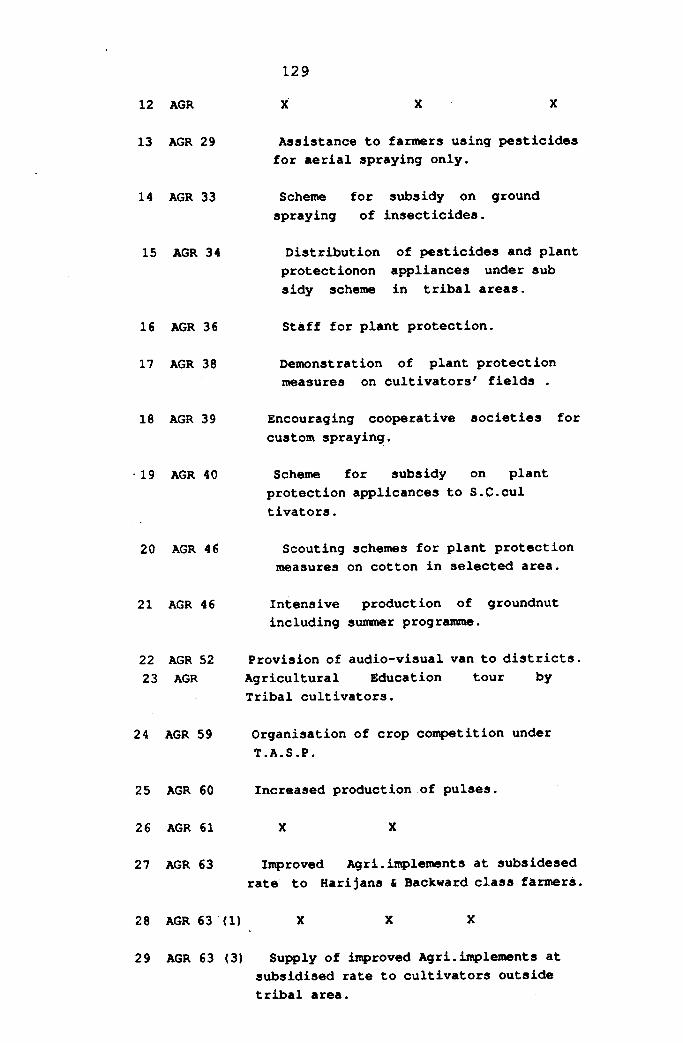
12 AGR X X X
13 AGR 29 Assistance to farmers using pesticidesfor aerial spraying only.
14 AGR 33 Scheme for siibsidy on groundspraying of insecticides.
15 AGR 34 Distribution of pesticides and plantprotectionon appliances under sub sidy scheme in tribal areas.
16 AGR 36 Staff for plant protection.
17 AGR 38 Demonstration of plant protectionmeasures on cultivators' fields .
18 AGR 39 Encouraging cooperative societies forcustom spraying.
•19 AGR 40 Scheme for subsidy on plantprotection applicances to S.C.cul tivators.
20 AGR 46 Scouting schemes for plant protectionmeasures on cotton in selected area.
21 AGR 46 Intensive production of groundnutincluding summer programme.
22 AGR 52 Provision of audio-visual van to districts.23 AGR Agricultural Education tour by
Tribal cultivators.
24 AGR 59 Organisation of crop competition underT.A.S.P.
25 AGR 60 Increased production of pulses.
26 AGR 61 X X
27 AGR 63 Improved Agri.implements at subsidesedrate to Harijans & Backward class farmers.
28 AGR 63 (1) X X X
29 AGR 63 (3) Supply of improved Agri.implements atsubsidised rate to cultivators outside tribal area.
129
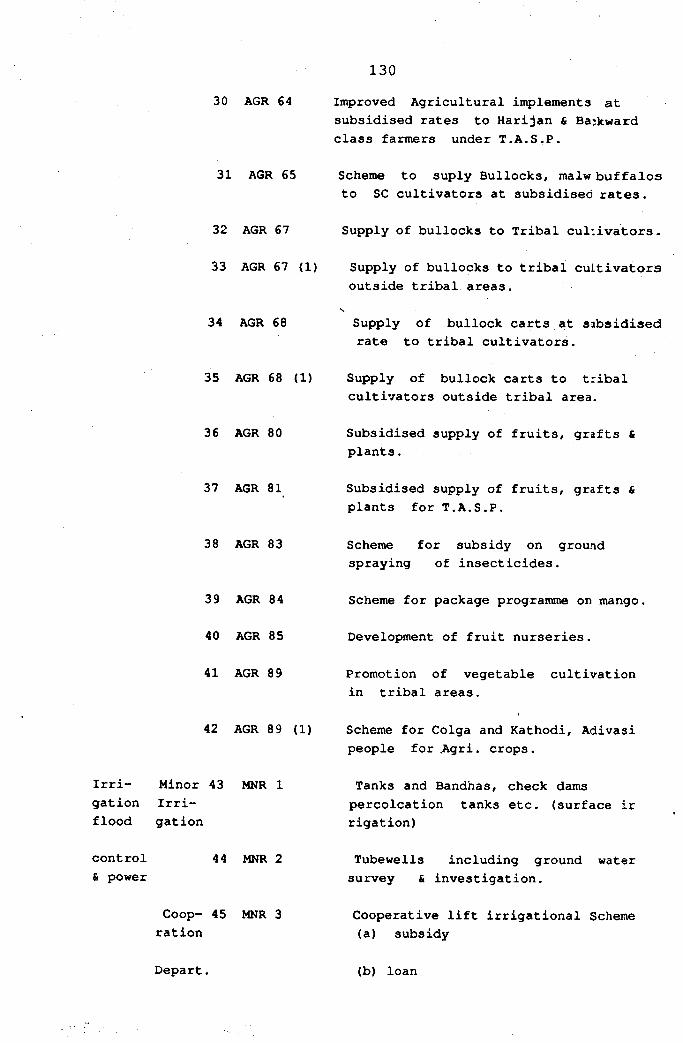
30 AGR 64 Improved Agricultural inplements atsubsidised rates to Harijan & Backward class fanners under T.A.S.P.
31 AGR 65 Scheme to suply Bullocks, malw buffalosto SC cultivators at subsidised rates.
130
32 AGR 67 S u p p l y o f b u l l o c k s t o T r i b a l c u l : i v a t o r S -
33 AGR 67 (1) Supply of bullocks to tribal cultivators outside tribal areas.
34 AGR 68 Supply of bullock carts at subsidised rate to tribal cultivators.
35 AGR 68 (1) Supply of bullock carts to tribalcultivators outside tribal area.
36 AGR 80 Subsidised supply of fruits, grafts & plants.
37 AGR 81 Subsidised supply of fruits, grafts & plants for T.A.S.P.
38 AGR 83
39 AGR 84
40 AGR 85
41 AGR 89
Scheme for subsidy on ground spraying of insecticides.
Scheme for package programme on mango
Development of fruit nurseries.
Promotion of vegetable cultivation in tribal areas.
42 AGR 89 (1)
Irri- Minor 43 MNR 1 gation Irri- flood gation
Scheme for Colga and Kathodi, Adivasi people for Agri. crops.
Tanks and Bandhas, check dams percolcation tanks etc. (surface ir rigation)
control & power
44 MNR 2 Tubewells including ground water survey & investigation.
Coop- 45 MNR 3 ration
Cooperative lift irrigational Scheme (a) subsidy
Depart. (b) loan
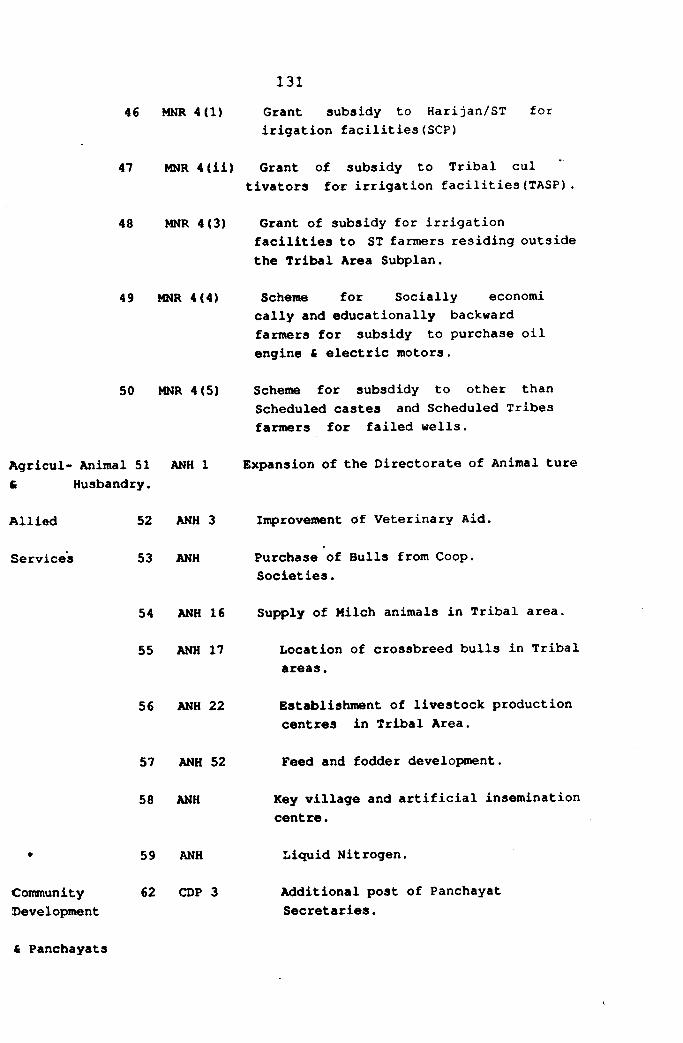
46 MNR 4(1) Grant subsidy to Harijan/ST irigation facilities(SCP)
131for
47 MNR 4(11) Grant of subsidy to Tribal cultivators for irrigation facilities(TASP) .
48 MNR 4(3)
49 MNR 4(4)
50 MNR 4(5)
Agricul- Animal 51 ANH 1 £ Husbandry.
Allied 52 ANH 3
Grant of subsidy for irrigation facilities to ST farmers residing outside the Tribal Area Subplan.
Scheme for Socially economi cally and educationally backward farmers for subsidy to purchase oil engine & electric motors.
Scheme for subsdidy to other than Scheduled castes and Scheduled Tribes farmers for failed wells.
Expansion of the Directorate of Animal ture
Improvement of Veterinary Aid.
Service’s 53 ANH Purchase of Bulls from Coop,Societies.
54 ANH 16 Supply of Milch animals in Tribal area.
55 ANH 17 Location of crossbreed bulls in Tribalareas.
56 ANH 22 Establishment of livestock production centres in Tribal Area.
57 ANH 52
58 ANH
Feed and fodder development.
Key village and artificial Insemination centre.
CommunityDevelopment
& Panchayats
59 ANH
62 CD^ 3
Liquid Nitrogen.
Additional post of Panchayat Secretaries.
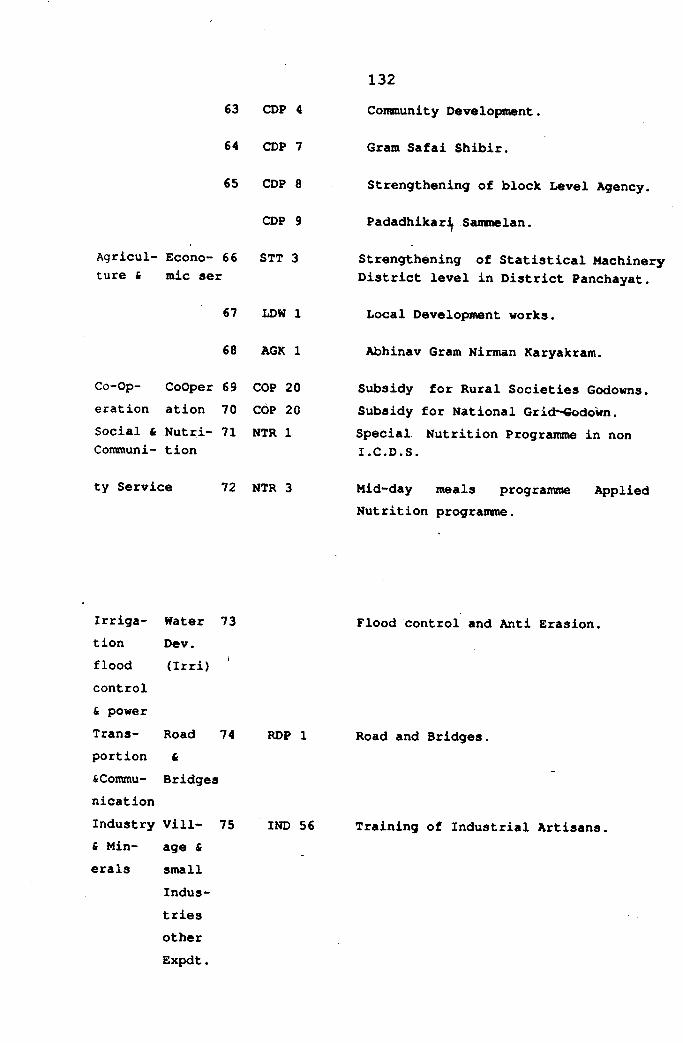
63 CDP 4
64 CDP 7
65 CDP 8
CDP 9
Agricul- Econo- 66 STT 3ture & mic ser
67 LDW 1
68 AGK 1
Co-Op- CoOper 69 COP 20eration ation 70 COP 20Social & Nutri- 71 NTR 1 Conanuni- tion
ty Service 72 NTR 3
Convnunity Develoi»nent.
Gram Safai Shibir.
Strengthening of block Level Agency.
Padadhikarj^ Saxnnielan.
Strengthening of Statistical Machinery District level in District Panchayat.
Local Development works.
Abhinav Gram Nirman Karyakram.
Subsidy for Rural Societies Godowns.Subsidy for National Grid^odown.Special Nutrition Programme in non I.C.D.S.
Mid-day meals programme Applied Nutrition programme.
132
Irrigation flood control & power Transportion 4 Communication Industry & Minerals
Water 73 Dev.(Irri)
Road 74 &
Bridges
Vill- 75 age & small Industries other Expdt.
Flood control and Anti Erasion.
RDP 1
IND 56
Road and Bridges.
Training of Industrial Artisans
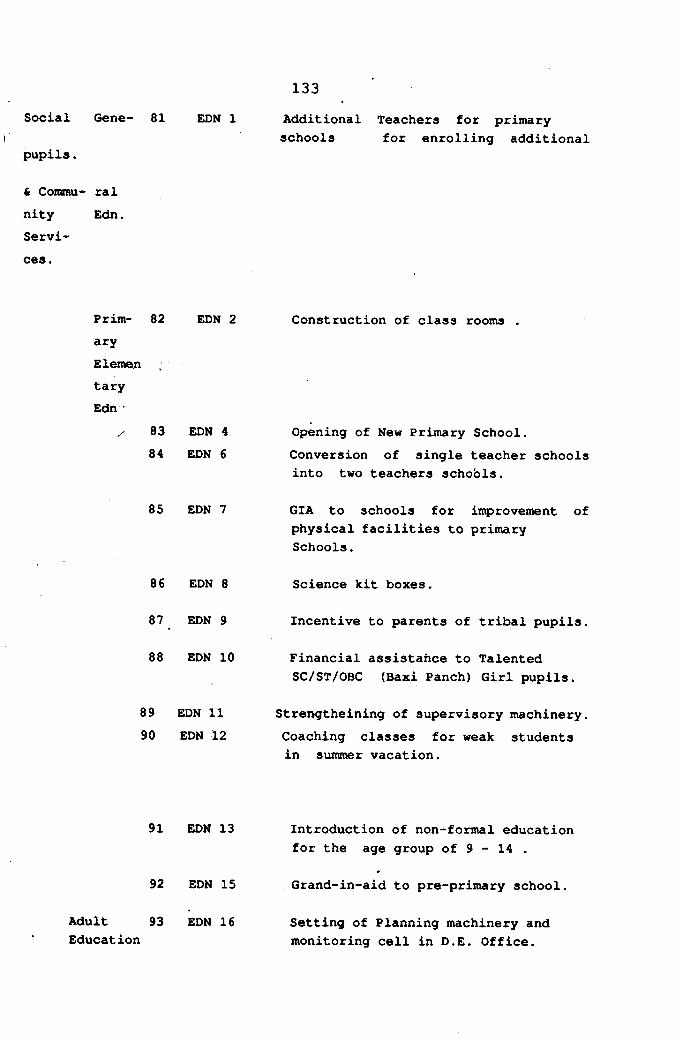
133Social Gene- 81
pupils.
EDN 1 Additional Teachers for primaryschools for enrolling additional
& Conimu- ral nity Edn, Services.
Prim- 82 EDN 2aryEleroentaryEdn •
/ 83 EDN 484 EDN 6
Construction of class rooms .
Opening of New Primary School.Conversion of single teacher schools into two teachers schools.
85 EDN 7 GIA to schools for inprovement of physical facilities to primary Schools.
86 EDN 8
87 EDN 9
88 EDN 10
89 EDN 1190 EDN 12
Science kit boxes.
Incentive to parents of tribal pupils,
Financial assistance to Talented SC/ST/OBC (Baxi Panch) Girl pupils.
Strengtheining of supervisory machinery,Coaching classes for weak students in summer vacation.
91 EDN 13
92 EDN 15
Adult 93 EDN 16 Education
Introduction of non-formal education for the age group of 9 - 14 .
Grand-in-aid to pre-primary school.
Setting of Planning machinery and monitoring cell in D.E. Office.
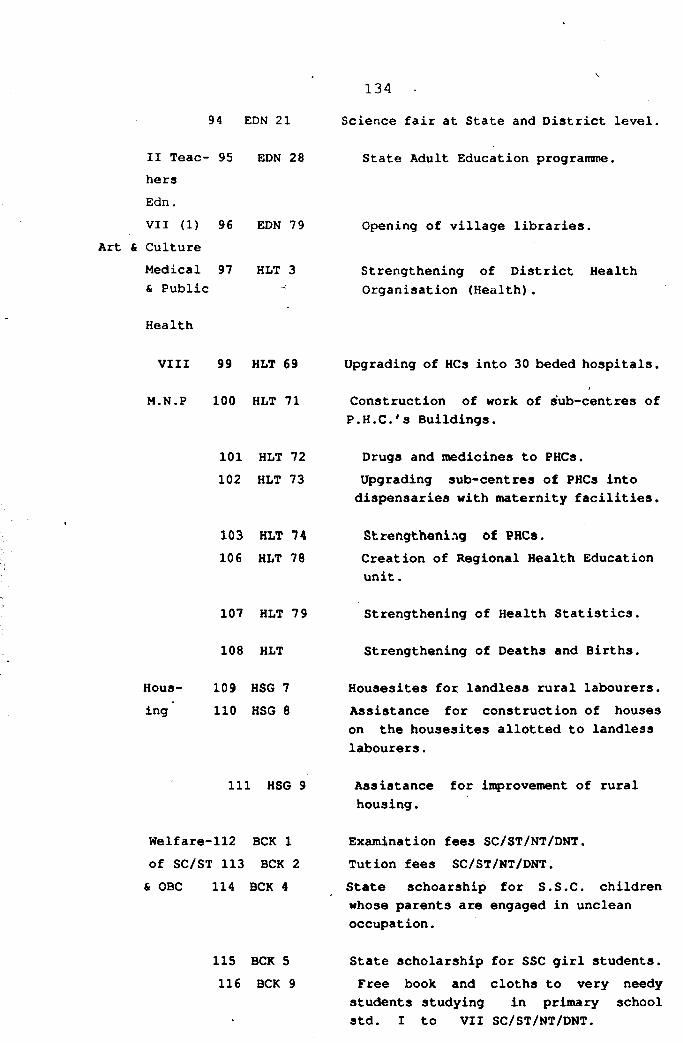
II Teac- 95 EDN 28hersEdn,VII (1) 96 EDN 79
Art & CultureMedical 97 HLT 3& Public
Health
94 EDN 21 Science fair at State and District level
State Adult Education prograirane.
134
Opening of village libraries.
Strengthening of District Health Organisation (Health).
VIII 99 HLT 69
M.N.P 100 HLT 71
101 HLT 72102 HLT 73
103 HLT 74106 HLT 78
107 HLT 7 9
108 HLT
Hous- 109 HSG 7ing‘ 110 HSG 8
111 HSG 9
Welfare-112 BCK 1 of SC/ST 113 BCK 2 & OBC 114 BCK 4
115 BCK 5116 BCK 9
Upgrading of HCs into 30 beded hospitals.
Construction of work of sub-centres of P.H.C.'s Buildings.
Drugs and medicines to PHCs.Upgrading sub-centres of PHCs into dispensaries with maternity facilities.
Strengthening of PHCs.Creation of Regional Health Education unit.
Strengthening of Health Statistics.
Strengthening of Deaths and Births.
Housesites for landless rural labourers.Assistance for construction of houses on the housesites allotted to landless labourers.
Assistance for in^rovement of rural housing.
Examination fees SC/ST/NT/DNT.Tution fees SC/ST/NT/DNT.State schoarship for S.S.C. children whose parents are engaged in unclean occupation.
State scholarship for SSC girl students.Free book and cloths to very needy students studying in primary school Std. I to VII SC/ST/NT/DNT.
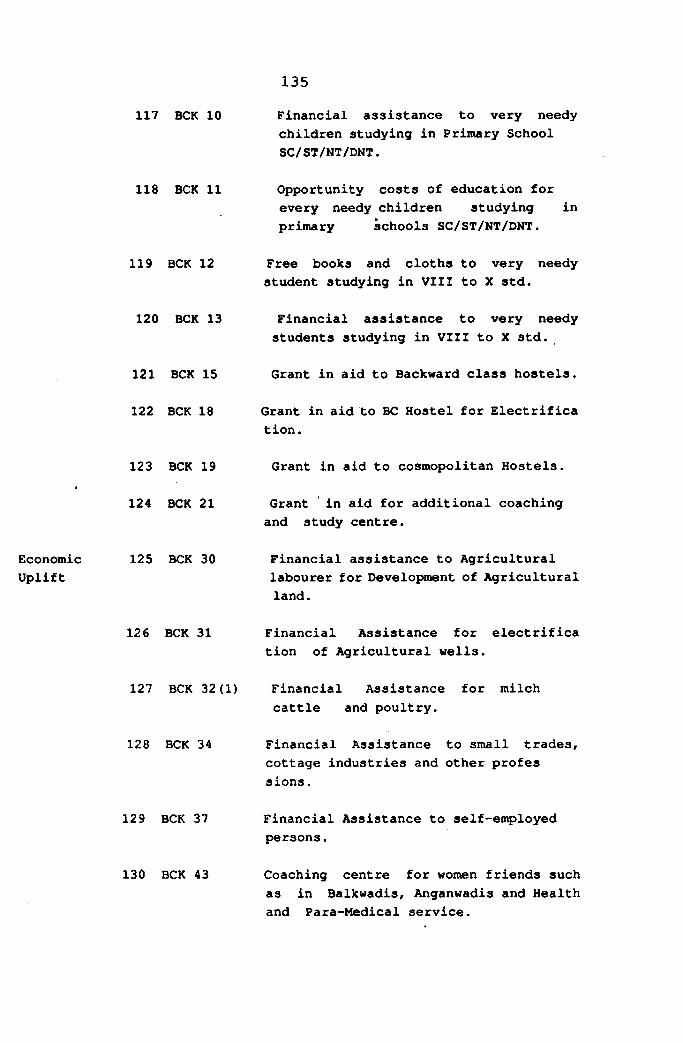
117 BCK 10 Financial assistance to very needychildren studying in Primary School SC/ST/NT/DNT.
118 BCK 11 Opportunity costs of education forevery needy children studying inprimary schools SC/ST/NT/DNT.
119 BCK 12 Free books and cloths to very needystudent studying in VIII to X std.
120 BCK 13 Financial assistance to very needystudents studying in VIII to X std.
121 BCK 15 Grant in aid to Backward class hostels,
122 BCK 18 Grant in aid to BC Hostel for Electrification.
123 BCK 19 Grant in aid to cosmopolitan Hostels.
124 BCK 21 Grant in aid for additional coachingand study centre.
Economic 125 BCK 30 Financial assistance to AgriculturalUplift labourer for Development of Agricultural
land.
126 BCK 31 Financial Assistance for electrification of Agricultural wells.
127 BCK 32(1) Financial Assistance for milchcattle and poultry.
128 BCK 34 Financial Assistance to small trades,cottage industries and other profes sions.
129 BCK 37 Financial Assistance to self-employedpersons.
130 BCK 43 Coaching centre for women friends suchas in Balkwadis, Anganwadis and Health and Para-Medical service.
135
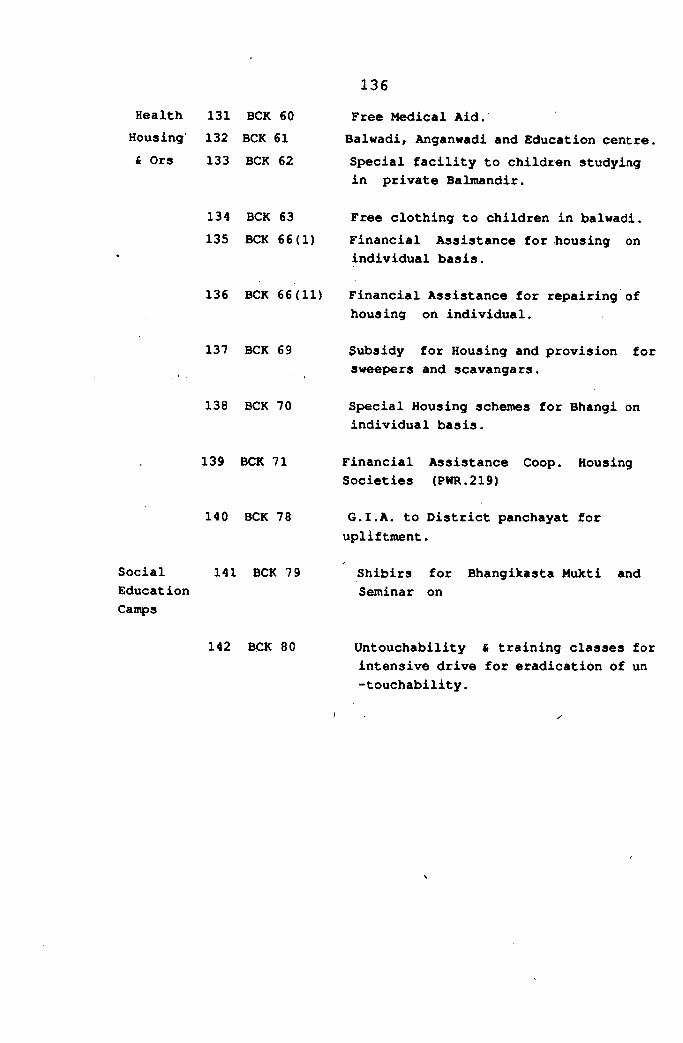
136Health 131 BCK 60Housing' 132 BCK 61& Ors 133 BCK 62
Free Medical Aid.Balwadi, Anganwadi and Education centreSpecial facility to children studying in private Balmandir.
134 BCK 63135 BCK 66(1)
Free clothing to children in balwadi.Financial Assistance for housing on individual basis.
136 BCK 66(11)
137 BCK 69
Financial Assistance for repairing of housing on individual.
Subsidy for Housing and provision for sweeF>ers and scavangars.
138 BCK 70 Special Housing schemes for Bhangi on individual basis.
139 BCK 71 Financial Assistance Coop. Housing Societies (PWR.219)
140 BCK 78 G.I.A. to District panchayat forupliftment.
Social 141 BCK 79EducationCamps
Shibirs for Bhangikasta Mukti and Seminar on
142 BCK 80 Untouchability £ training classes for intensive drive for eradication of un -touchability.

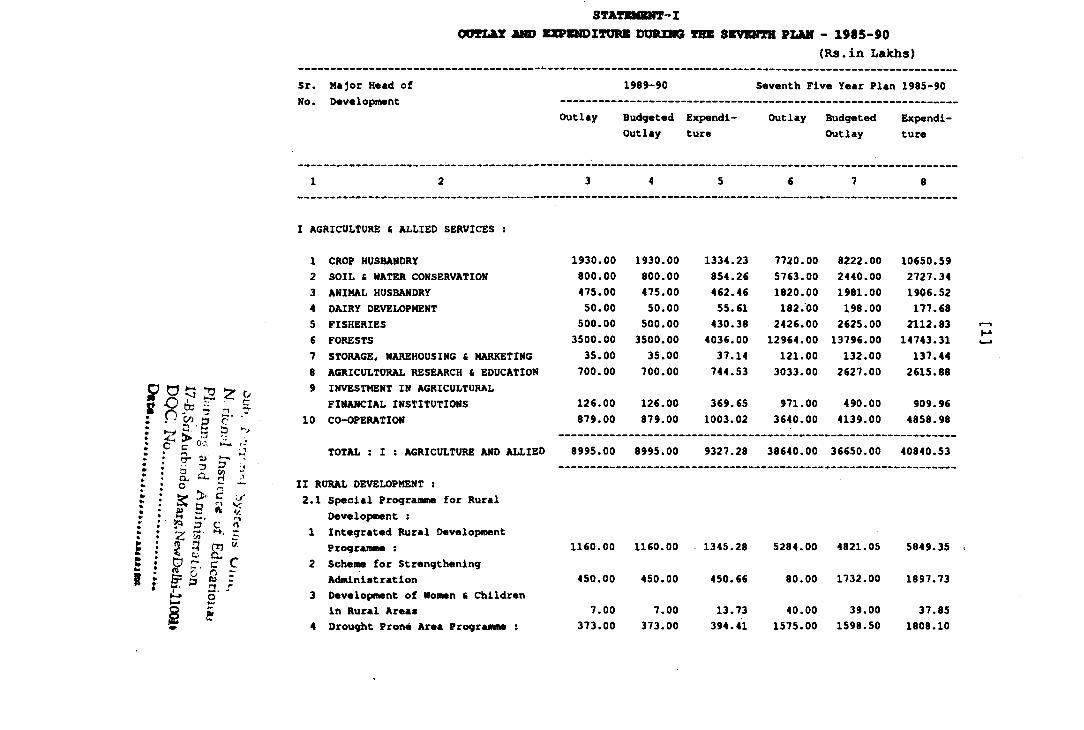
STATBIBNT-ZOOTIAT AUD SXPKMDZTOHB DXntHIG THE SEVENTH PLAN > 1985-90
(Rs.in Lakhs)Sr. Major Head of 1989-90 Seventh Five Year Plan 1985-90nOe uovvxopnionw
Outlay BudgetedOutlay
Expenditure
Outlay BudgetedOutlay
Expenditure
1 2 3 4 5 6 7 8
I AGRICULTURE & ALLIED SERVICES :
SPO ^zc
ij
^ 32: ^o ,r.gs
cc
sc001n. .o
1 CROP HUSBANDRY 1930.00 1930.00 1334.23 7720.00 8222.00 10650.592 SOIL £ WATER CONSERVATION 800.00 800.00 854.26 5763.00 2440.00 2727.343 ANIMAL HUSBANDRY 475.00 475.00 462.46 1820.00 1981.00 1906.524 DAIRY DEVELOPMENT 50.00 50.00 55.61 182.00 198.00 177.685 FISHERIES 500.00 500.00 430.38 2426.00 2625.00 2112.836 FORESTS 3500.00 3500.00 4036.00 12964.00 13796.00 14743.317 STORAGE, WAREHOUSING & MARKETING 35.00 35.00 37.14 121.00 132.00 137.448 AGRICULTURAL RESEARCH & EDUCATION 700.00 700.00 744.53 3033.00 2627.00 2615.889 INVESTMENT IN AGRICULTURAL
FINANCIAL INSTITUTIONS 126.00 126.00 369.65 971.00 490.00 909.96LO CO-OPERATION 879.00 879.00 1003.02 3640.00 4139.00 4858.98
TOTAL I I : AGRICULTURE AND ALLIED 8995.00 8995.00 9327.28 38640.00 36650.00 40840.53
II RURAL DEVELOPMENT :2.1 Special Progranune for Rural
Development :1 Integrated Rural Development
Programme :2 Scheme for Strengthening
Administration3 Development of Nomen ft Children
in Rural Areas4 Dro\ight Prone Area Programme :
1160.00 1160.00 1345.28
450.00 450.00 450.66
7.00 7.00 13.73373.00 373.00 394.41
5284.00 4821.05 5849.35
80.00 1732.00 1897.73
40.00 39.00 37.851575.00 1598.50 1808.10
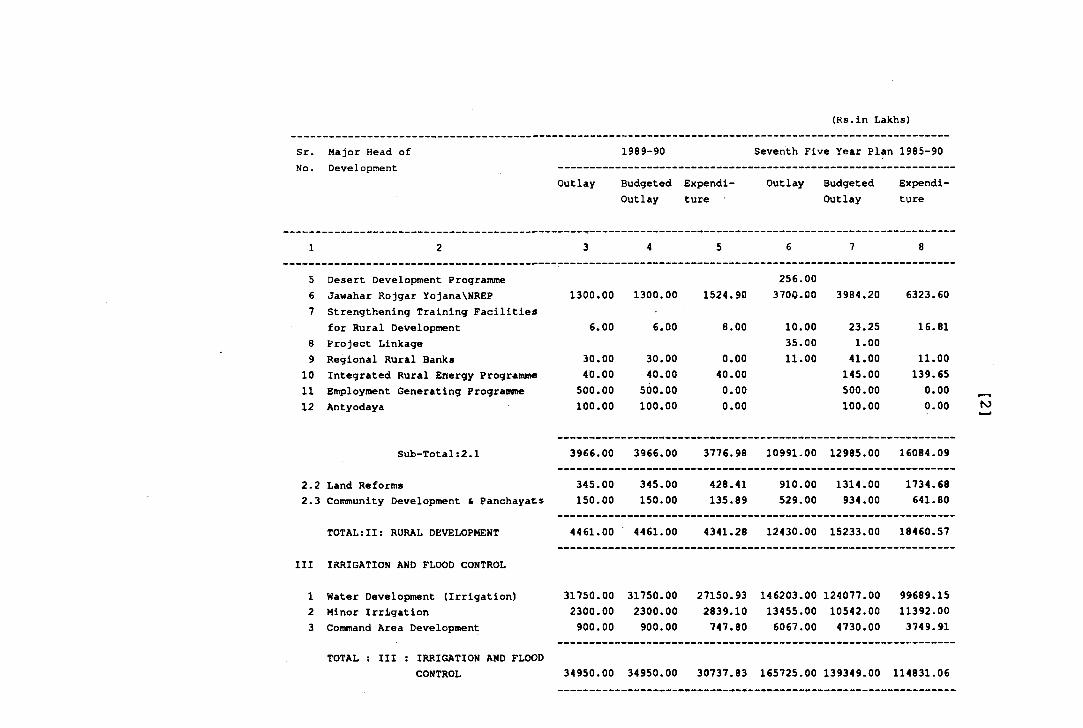
(Rs.in Lakhs)
Sr.No.
Major Head of Development
1989-90 Seventh Five Year Plan 1985-90
Outlay BudgetedOutlay
Expenditure
Outlay BudgetedOutlay
Expenditure
1 2 3 4 5 6 7 8
5 Desert Development Programme 256.006 Jawahar Rojgar YojanaVNREP 1300.00 1300.00 1524.90 3700.00 3984.20 6323.607 Strengthening Training Facilities
for Rural Development 6.00 6.00 8.00 10.00 23.25 16.818 Project Linkage 35.00 1.009 Regional Rural Banks 30.00 30.00 0.00 11.00 41.00 11.00
10 Integrated Rural Energy Programme 40.00 40.00 40.00 145.00 139.6511 Employment Generating Programme 500.00 500.00 0.00 500.00 0.0012 Antyodaya 100.00 100.00 0.00 100.00 0.00
Sub-Total:2.1 3966.00 3966.00 3776.98 10991.00 12985.00 16084.09
2.2 Land Reforms 345.00 345.00 428.41 910.00 1314.00 1734.682.3 Community Development & Panchayatis 150.00 150.00 135.89 529.00 934.00 641.80
TOTAL:II: RURAL DEVELOPMENT 4461.00 4461.00 4341.28 12430.00 15233.00 18460.57
III IRRIGATION AND FLOOD CONTROL
1 Water Development (Irrigation) 31750.00 31750.00 27150.93 146203.00 124077.00 99689.152 Minor Irrigation 2300.00 2300.00 2839.10 13455.00 10542.00 11392.003 Command Area Development 900.00 900.00 747.80 6067.00 4730.00 3749.91
TOTAL : III ; IRRIGATION AND FLOODCONTROL 34950.00 34950.00 30737.83 165725.00 139349.00 114831.06
fO
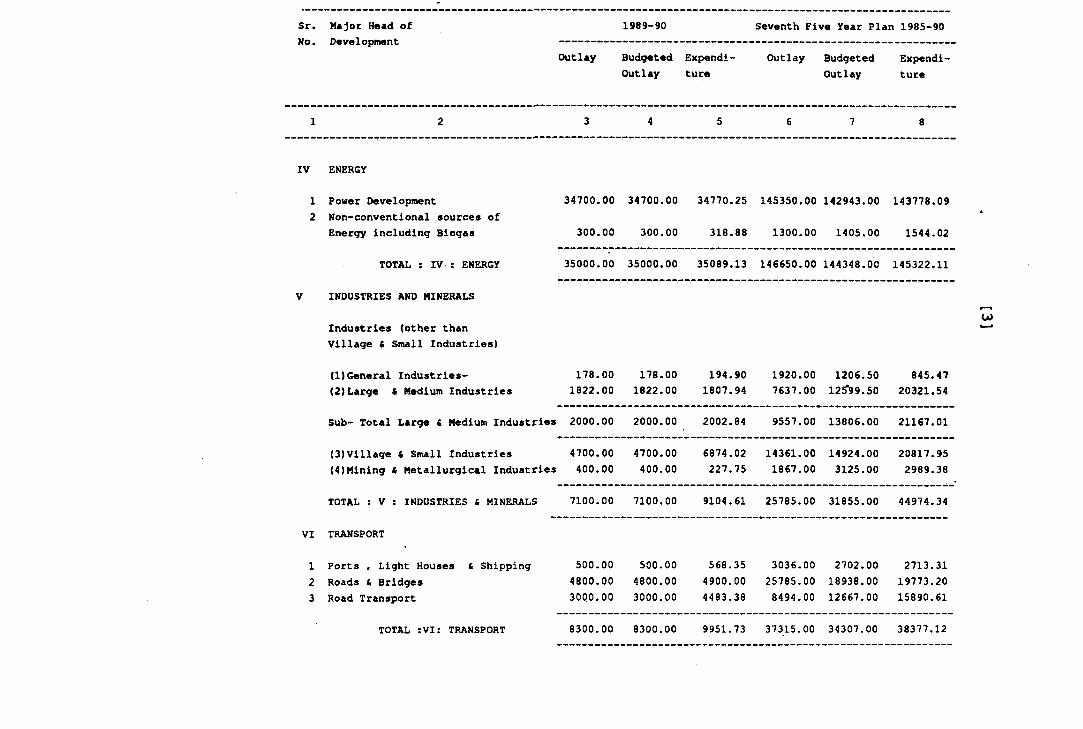
Sr. Major Head of 1989-90 Seventh Five Year Plan 1985-90No. Development
Outlay BudgetedOutlay
Expenditure
Outlay BudgetedOutlay
Expenditure
1 2 3 4 5 6 7 8
IV
1
ENERGY
Power Development 34700.00 34700.00 34770.25 145350.00 142943.00 143778.092 Non-conventional sources of
Energy including Biogas 300.00 300.00 318.88 1300.00 1405.00 1544.02
TOTAL ; IV ; ENERGY 35000.00 35000.00 35089.13 146650.00 144348.00 145322.11
V INDUSTRIES AND MINERALS
Industries (other than Village « Small Industries)
(1)General Industries- 178.00 178.00 194.90 1920.00 1206.50 845.47(2)Large i Medium Industries 1822.00 1822.00 1807.94 7637.00 12^99.50 20321.54
Sub- Total Large & Medium Industries 2000.00 2000.00 2002.84 9557.00 13806.00 21167.01
(3)Village c Small Industries 4700.00 4700.00 6874.02 14361.00 14924.00 20817.95(4)Mining S Metallurgical Industries 400.00 400.00 227.75 1867.00 3125.00 2989.38
TOTAL : V : INDUSTRIES & MINERALS 7100.00 7100.00 9104.61 25785.00 31855.00 44974.34
VI
1
TRANSPORT
Ports , Light Houses £ Shipping 500.00 500.00 568.35 3036.00 2702.00 2713.312 Roads & Bridges 4800.00 4800.00 4900.00 25785.00 18938.00 19773.203 Road Transport 3000.00 3000.00 4483.38 8494.00 12667.00 15890.61
TOTAL :VI; TRANSPORT 8300.00 8300.00 9951.73 37315.00 34307.00 38377.12
OJ
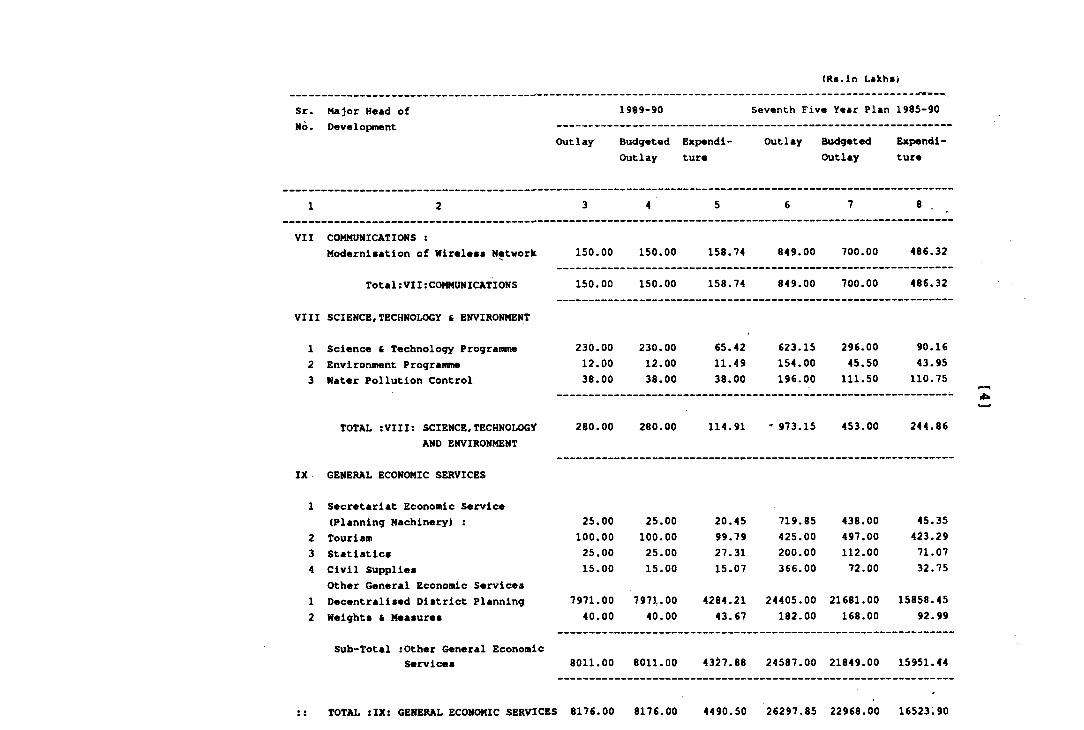
Sr. Major Head of 19«9-90
(Rs.ln Lakhs)
Seventh Five Year Plan 1985-90No. Development
Outlay BudgetedOutlay
Expenditure
Outlay BudgetedOutlay
Expenditure
1 2 3 4 5 6 7 8
VII COMMUNICATIONS :Modernisation of Wireless Network 150.00 150.00 158.74 849.00 700.00 486.32
Total:VII;COMMUNICATIONS 150.00 150.00 158.74 849.00 700.00 486.32
VIII SCIENCE,TECHNOLOGY & ENVIRONMENT
1 Science & Technology Programme 230.00 230.00 65.42 623.15 296.00 90.162 Environment Programme 12.00 12.00 11.49 154.00 45.50 43.953 Water Pollution Control 38.00 38.00 38.00 196.00 111.50 110.75
TOTAL :VIII: SCIENCE,TECHNOLOGY 280.00 280.00 114.91 " 973.15 453.00 244.86AND ENVIRONMENT
IX GENERAL ECONOMIC SERVICES
1 Secretariat Economic Service(Planning Machinery) : 25.00 25.00 20.45 719.85 438.00 45.35
2 Tourism 100.00 100.00 99.79 425.00 497.00 423.293 Statistics 25.00 25.00 27.31 200.00 112.00 71.074 Civil Supplies 15.00 15.00 15.07 366.00 72.00 32.75
Other General Economic Services1 Decentralised District Planning 7971.00 7971.00 4284.21 24405.00 21681.00 15858.452 Weights t Measures 40.00 40.00 43.67 182.00 168.00 92.99
Sub-Total :Other General EconomicServices 8011.00 8011.00 4327.88 24587.00 21849.00 15951.44
TOTAL :IX: GENERAL ECONOMIC SERVICES 8176.00 817C.00 4490.50 26297.85 22968.00 16523.90
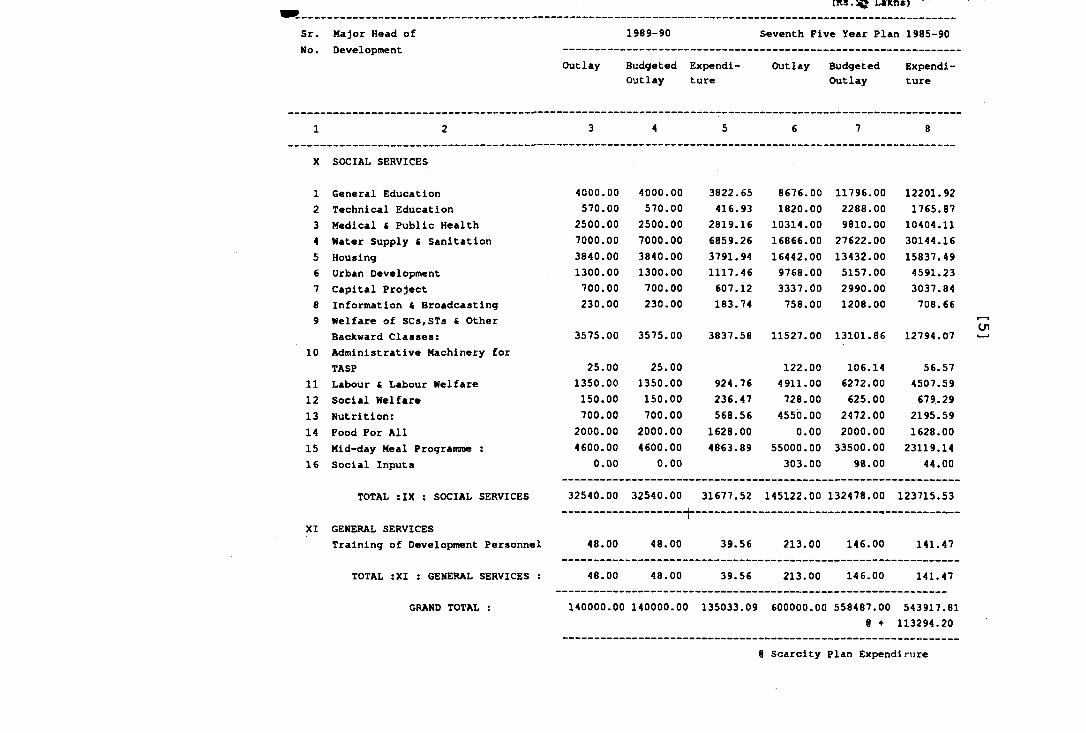
Sr. Major Head of 1989-90
(KS.3|» LlKtlS)
Seventh Five Year Plan 1985-90No. Development
Outlay BudgetedOutlay
Expenditure
Outlay BudgetedOutlay
Expenditure
1 2 3 4 5 6 7 8
X SOCIAL SERVICES
1 General Education 4000.00 4000.00 3822.65 8676.00 11796.00 12201.922 Technical Education 570.00 570.00 416.93 1820.00 2288.00 1765.873 Medical i Public Health 2500.00 2500.00 2819.16 10314.00 9810.00 10404.114 Water Supply i Sanitation 7000.00 7000.00 6859.26 16866.00 27622.00 30144.165 Housing 3840.00 3840.00 3791.94 16442.00 13432.00 15837.49e Urban Development 1300.00 1300.00 1117.46 9768.00 5157.00 4591.237 Capital Project 700.00 700.00 607.12 3337.00 2990.00 3037.848 Information fi Broadcasting 230.00 230.00 183.74 758.00 1208.00 708.669 Welfare of SCs,STs £ Other
Backward Classes: 3575.00 3575.00 3837.58 11527.00 13101.86 12794.0710 Administrative Machinery for
TASP 25.00 25.00 122.00 106.14 56.5711 Labour £ Labour Welfare 1350.00 1350.00 924.76 4911.00 6272.00 4507.5912 Social Welfare 150.00 150.00 236.47 728.00 625.00 679.2913 Nutrition; 700.00 700.00 568.56 4550.00 2472.00 2195.5914 Food For All 2000.00 2000.00 1628.00 0.00 2000.00 1628.0015 Mid-day Neal Programme : 4600.00 4600.00 4863.89 55000.00 33500.00 23119.1416 Social Inputs 0.00 0.00 303.00 98.00 44.00
TOTAL :IX ; SOCIAL SERVICES 32540.00 32540.00 31677.52 145122.00 132478.00 123715.53
XI GENERAL SERVICESTraining of Development Personnel 48.00 48.00 39.56 213.00 146.00 141.47
TOTAL :XI : GENERAL SERVICES : 48.00 48.00 39.56 213.00 146.00 141.47
GRAND TOTAL ; 140000.00 140000.00 135033.09 600000.00 558487.00 543917.81
on
8 + 113294.20
0 Scarcity Plan Expend!rure
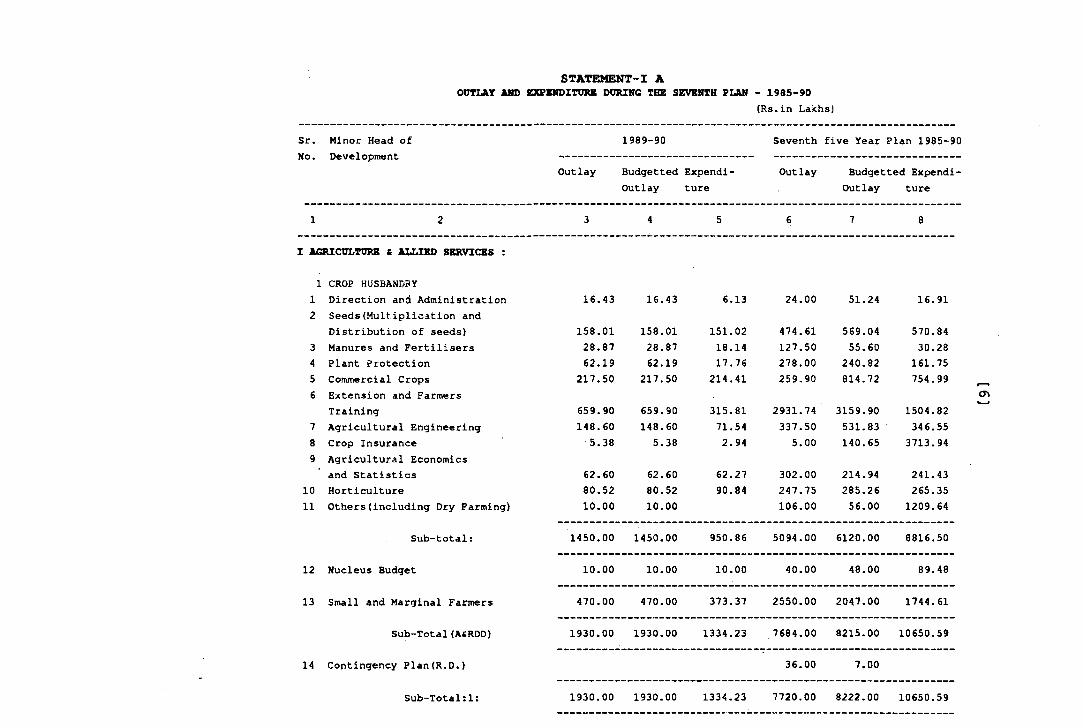
STATEMENT-I A OUTIAT AMD EXPENDITURE DURING THE SEVENTH PLAN - 1985-90
(Rs.in Lakhs)
Sr.No.
Minor Head of Development
1989-90 Seventh five Year Plan 1985-9
Outlay Budgetted Expendi- Outlay ture
Outlay Budgetted Expendi Outlay ture
1 2 3 4 5 6 7 8
I AGRICULTURE C ALLIED SERVICES :
1 CROP HUSBANDFY 1 Direction and Administration 16.43 16.43 6.13 24.00 51.24 16.912 Seeds(Multiplication and
Distribution of seeds) 158.01 158.01 151.02 474.61 569.04 570.843 Manures and Fertilisers 28.87 28.87 18.14 127.50 55.60 30.284 Plant Protection 62.19 62.19 17.76 278.00 240.82 161.755 Conunercial Crops 217.50 217.50 214.41 259.90 814.72 754.996 Extension and Farmers
Training 659.90 659.90 315.81 2931.74 3159.90 1504.827 Agricultural Engineering 148.60 148.60 7-1.54 337.50 531.83 346.558 Crop Insurance 5.38 5.38 2.94 5.00 140.65 3713.949 Agricultural Economics
and Statistics 62.60 62.60 62.27 302.00 214.94 241.4310 Horticulture 80.52 80.52 90.84 247.75 285.26 265.3511 Others(including Dry Farming) 10.00 10.00 106.00 56.00 1209.64
Sub-total: 1450.00 1450.00 950.86 5094.00 6120.00 8816.50
12 Nucleus Budget 10.00 10.00 10.00 40.00 48.00 89.48
13 Small and Marginal Farmers 470.00 470.00 373.37 2550.00 2047.00 1744.61
Sub-Total(A4RDD) 1930.00 1930.00 1334.23 7684.00 8215.00 10650.59
14 Contingency Plan(R.D.) 36.00 7.00
Sub-Total:1: 1930.00 1930.00 1334.23 7720,00 8222.00 10650.59
as
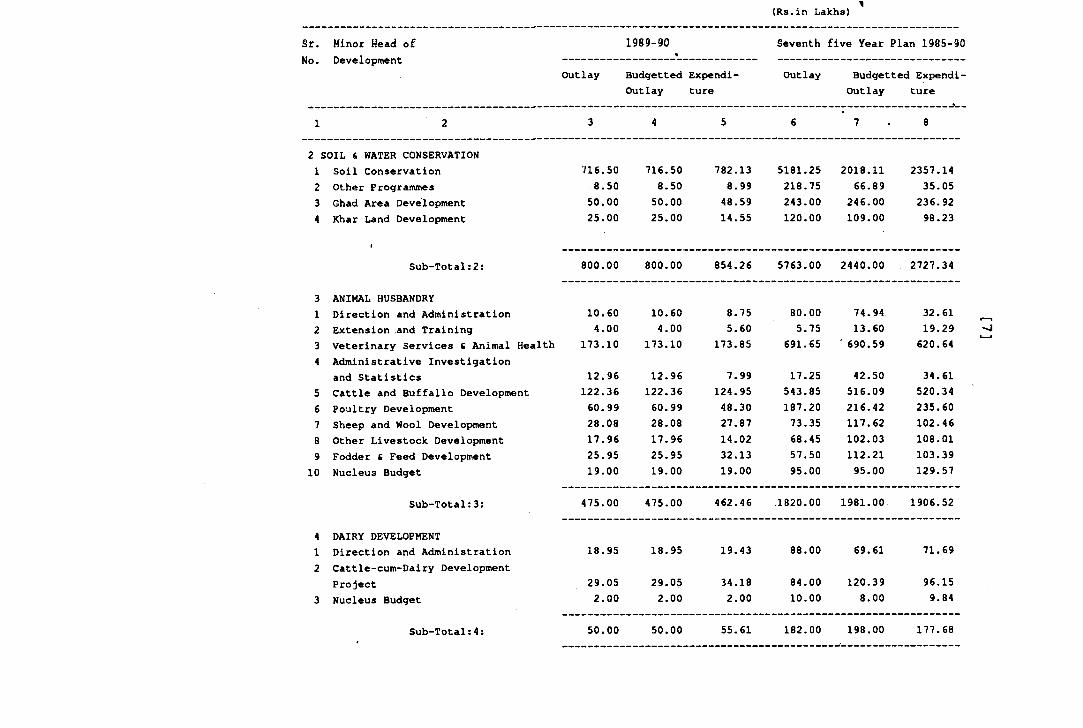
(Rs.in Lakhs)
§f. Minor Head of 1989-90 Seventh five Year Plan 1985-90No. Development
Outlay Budgetted Exj>endi- Outlay ture
Outlay Budgetted Expendi- Outlay ture
1 2 3 4 5 6 7 . 8
2 SOIL & WATER CONSERVATION1 Soil Conservation2 Other Programmes3 Ghad Area Development4 Khar Land Development
716.508.5050.0025.00
716.508.5050.0025.00
782.138.9948.5914.55
5181.25218.75243.00120.00
2018.1166.89
246.00109.00
2357.1435.05236.9298.23
Sub-Total:2: 800.00 800.00 854.26 5763.00 2440.00 2727.34
3 ANIMAL HUSBANDRY1 Direction and Administration 10.60 10.60 8.75 80.00 74.94 32.612 Extension and Training 4.00 4.00 5.60 5.75 13.60 19.293 Veterinary Services S Animal Health 173.10 173.10 173.85 691.65 '690.59 620.644 Administrative Investigation
and Statistics 12.96 12.96 7.99 17.25 42.50 34.615 Cattle and Buffallo Development 122.36 122.36 124.95 543.85 516.09 520.346 Poultry Development 60.99 60.99 48.30 187.20 216.42 235.607 Sheep and Wool Development 28.08 28.08 27.87 73.35 117.62 102.468 Other Livestock Development 17.96 17.96 14.02 68.45 102.03 108.019 Fodder & Feed Development 25.95 25.95 32.13 57.50 112.21 103.3910 Nucleus Budget 19.00 19.00 19.00 95.00 95.00 129.57
Sub-Total;3; 475.00 475.00 462.46 .1820.00 1981.00 1906.52
4 DAIRY DEVELOPMENT1 Direction and Administration 18.95 18.95 19.43 88.00 69.61 71.692 Cattle-cum-Dairy Development
Project 29.05 29.05 34.18 84.00 120.39 96.153 Nucleus Budget 2.00 2.00 2.00 10.00 8.00 9.84
Sub-Total;4: 50.00 50.00 55.61 182.00 198.00 177.68' _______ ______ ________ _______ ______
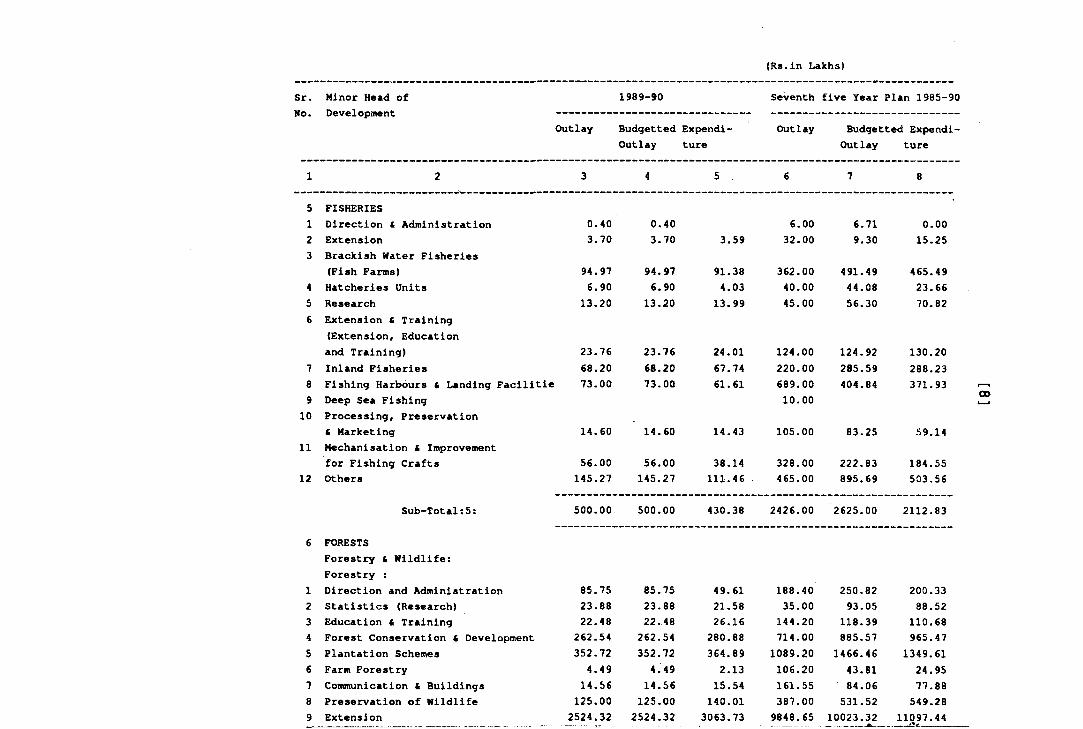
(Rs.in Lakhs)
Sr.No.
Minor Head of Development
Outlay
1989-90
BudgettedOutlay
Expenditure
Seventh
Outlay
five Year Plan 1985-91
Budgetted Expend!- Outlay ture
1 2 3 4 5 6 7 8
51
FISHERIESDirection t Administration 0.40 0.40 6.00 6.71 0.00
2 Extension 3.70 3.70 3.59 32.00 9.30 15.253 Brackish Water Fisheries
(Fish Farms) 94.97 94.97 91.38 362.00 491.49 465.494 Hatcheries Units 6.90 6.90 4.03 40.00 44.08 23.665 Research 13.20 13.20 13.99 45.00 56.30 70.826 Extension fi Training
(Extension, Education and Training) 23.76 23.76 24.01 124.00 124.92 130.20
7 Inland Fisheries 68.20 68.20 67.74 220.00 285.59 288.238 Fishing Harbours 6 Landing Facilitie 73.00 73.00 61.61 689.00 404.84 371.939
10Deep Sea Fishing Processing, Preservation fi Marketing 14.60 14.60 14.43
10.00
105.00 83.25 59.1411 Mechanisation fi Improvement
for Fishing Crafts 56.00 56.00 38.14 328.00 222.83 184.5512 Others 145.27 145.27 111.46 465.00 895.69 503.56
Sub-Total:5: 500.00 500.00 430.38 2426.00 2625.00 2112.83
6
1
FORESTSForestry & Wildlife;Forestry :Direction and Administration 85.75 85.75 49.61 188.40 250.82 200.33
2 Statistics (Research) 23.88 23.88 21.58 35.00 93.05 88.523 Education i Training 22.48 22.48 26.16 144.20 118.39 110.684 Forest Conservation fi Development 262.54 262.54 280.88 714.00 885.57 965.475 Plantation Schemes 352.72 352.72 364.89 1089.20 1466.46 1349.616 Farm Forestry 4.49 4.49 2.13 106.20 43.81 24.957 Communication & Buildings 14.56 14.56 15.54 161.55 84.06 77.888 Preservation of Wildlife 125.00 125.00 140.01 387.00 531.52 549.289 Extension 2524.32 2524.32 3063.73 9848.65 10023.32 11097.44
00
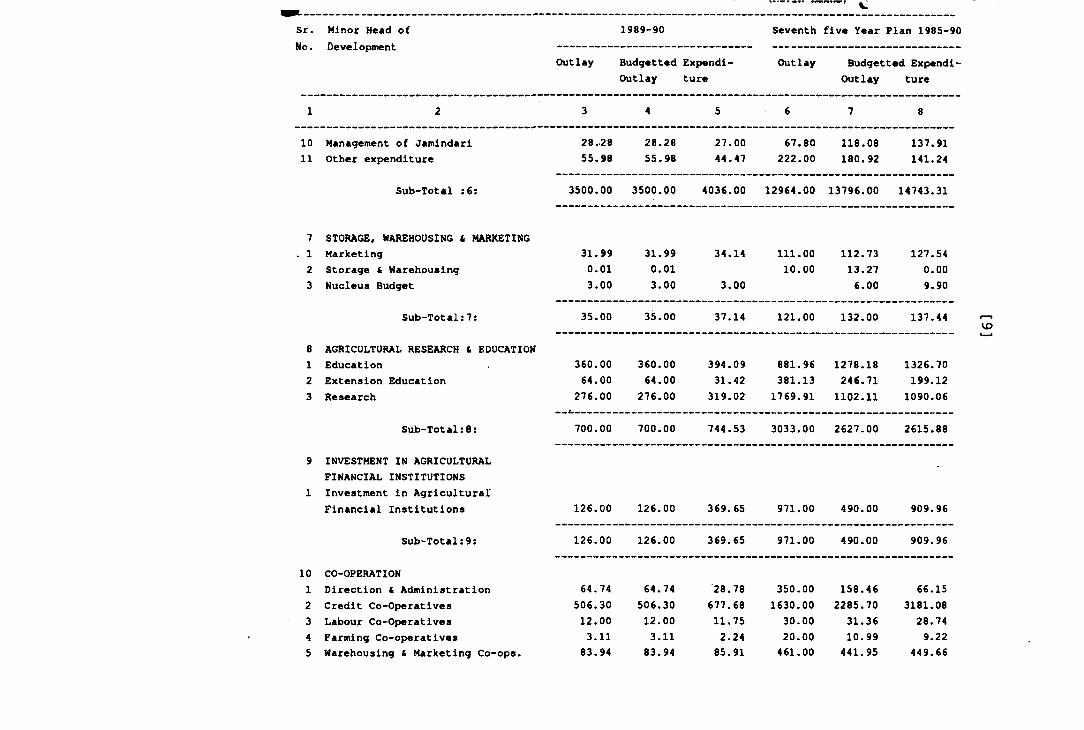
Sr.No.
Minor Head of Development
1989-90
Outlay Budgetted Expend!- Outlay ture
Seventh five Year Plan 1985-9
Outlay Budgetted Expendi Outlay ture
1 2 3 4 5 6 7 8
10 Management of Jamindari 28.28 28.28 27.00 67.80 118.08 137.9111 Other expenditure 55.98 55.98 44.47 222.00 180.92 141.24
Sub-Total :6: 3500.00 3500.00 4036.00 12964.00 13796.00 14743.31
7 STORAGE, WAREHOUSING t MARKETING. 1 Marketing 31.99 31.99 34.14 111.00 112.73 127.542 Storage & Warehousing 0.01 0.01 10.00 13.27 0.003 Nucleus Budget 3.00 3.00 3.00 6.00 9.90
Sub-Total:?: 35.00 35.00 37.14 121.00 132.00 137.44
8 AGRICULTURAL RESEARCH f, EDUCATION1 Education 360.00 360.00 394.09 881.96 1278.18 1326.702 Extension Education 64.00 64.00 31.42 381.13 246.71 199.123 Research 276.00 276.00 319.02 1769.91 1102.11 1090.06
Sub-Total:8: 700.00 700.00 744.53 3033.00 2627.00 2615.88
9 INVESTMENT IN AGRICULTURALFINANCIAL INSTITUTIONS
1 Investment in AgriculturalFinancial Institutions 126.00 126.00 369.65 971.00 490.00 909.96
Sub-Total:9: 126.00 126.00 369.65 971.00 490.00 909.96
10 CO-OPERATION1 Direction t Administration 64.74 64.74 28.78 350.00 158.46 66.152 Credit Co-Operatives 506.30 506.30 677.68 1630.00 2285.70 3181-083 Labour Co-Operatives 12.00 12.00 11.75 30.00 31.36 28.744 Farming Co-operatives 3.11 3.11 2.24 20.00 10.99 9.225 Warehousing t Marketing Co-ops. 83.94 83.94 85.91 461.00 441.95 449.66
VD
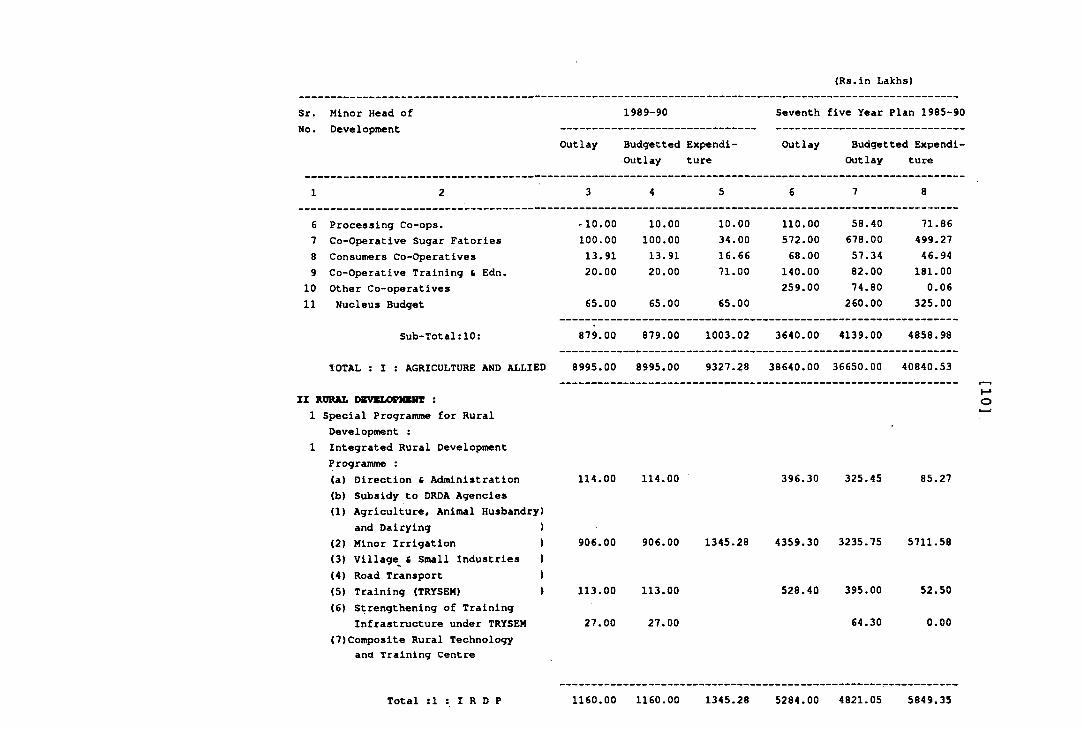
Seventh five Year Plan 1985-90
Outlay Budgetted Expendi- Outlay ture
(Rs.in Lakhs)
Sr. Minor Head of No. Developn»ent
Outlay
1989-90
Budgetted Expendi- Outlay ture
1 2 3 4 5 6 7 8
6 Processing Co-ops. ^10.00 10.00 10.00 110.00 58.40 71.867 Co-Operative Sugar Fatories 100.00 100.00 34.00 572.00 678.00 499.278 Consumers Co-Operatives 13.91 13.91 16.66 68.00 57.34 46.949 Co-Operative Training i Edn. 20.00 20.00 71.00 140.00 82.00 181.00
10 Other Co-operatives 259.00 74.80 0.0611 Nucleus Budget 65.00 65.00 65.00 260.00 325.00
Sub-Total:10: 879.00 879.00 1003.02 3640.00 4139.00 4858.98
TOTAL ; I : AGRICULTURE AND ALLIED 8995.00 8995.00 9327.28 38640.00 36650.00 40840.53
II RURAL DSVBL(»Piaarr :1 Special Programme for Rural
Development :1 Integrated Rural Development
Programme ;(a) Direction £ Administration(b) Subsidy to DRDA Agencies(1) Agriculture, Animal Husbandry
and Dairying(2) Minor Irrigation(3) Village^ t Small Industries(4) Road Transport(5) Training (TRYSEM)(6) Strengthening of Training
Infrastructure under TRYSEM(7)Composite Rural Technology
and Training Centre
Total :1 : I R D P
114.00 114.00
906.00 906.00 1345.28
113.00 113.00
27.00 27.00
396.30 325.45 85.27
4359.30 3235.75 5711.58
528.40 395.00 52.50
64.30 0.00
1160.00 1160.00 1345.28 5284.00 4821.05 5849.35
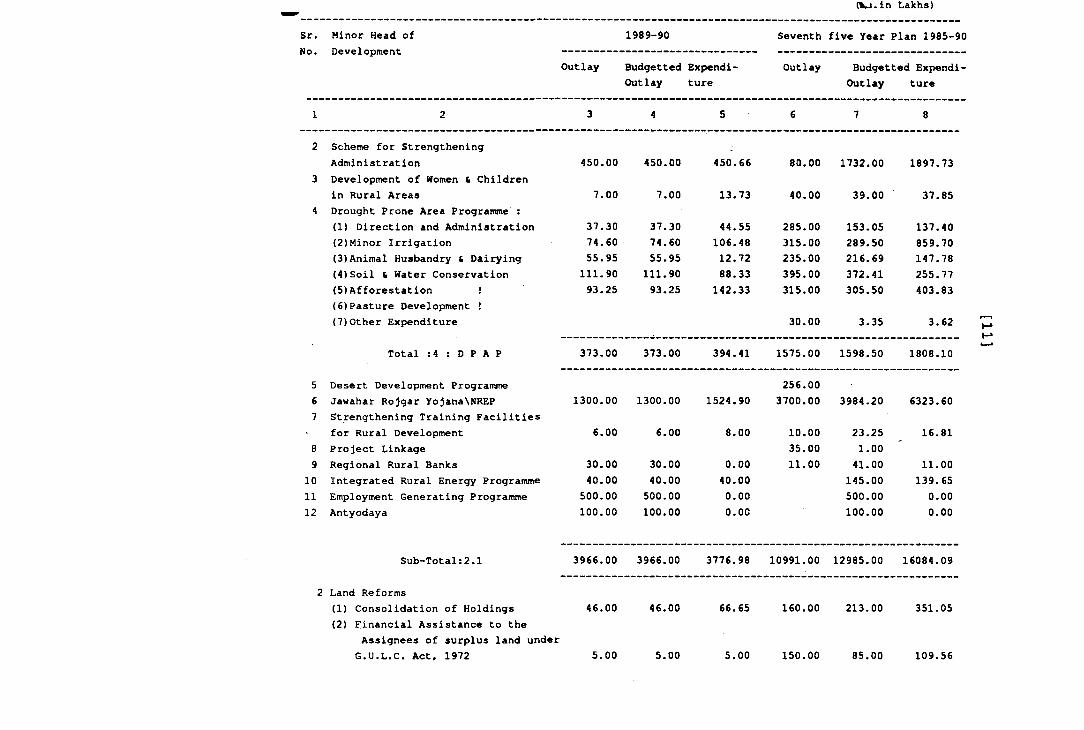
(Wi.in Lakhs)
Seventh five Year Plan 1985-90Sr.No.
Minor Head of Development
1989-90
Outlay Budgetted Expendi- Outlay Budgetted Expendl-Outlay ture Outlay ture
1 2 3 4 5 6 7 8
2 Scheme for StrengtheningAdministration 450.00 450.00 450.66 80.00 1732.00 1897.73
3 Development of Women & Childrenin Rural Areas 7.00 7.00 13.73 40.00 39.00 37.85
4 Drought Prone Area Programme ;(1) Direction and Administration 37.30 37.30 44.55 285.00 153.05 137.40(2)Minor Irrigation 74.60 74.60 106.48 315.00 289.50 859.70(3)Animal Husbandry £ Dairying 55.95 55.95 12.72 235.00 216.69 147.78(4)Soil & Water Conservation 111.90 111.90 88.33 395.00 372.41 255.77(5)Afforestation ! 93.25 93.25 142.33 315.00 305.50 403.83(6)Pasture Development !(7)Other Expenditure 30.00 3.35 3.62
Total :4 : D P A P 373.00 373.00 394.41 1575.00 1598.50 1808.10
5 Desert Development Programme 256.006 Jawahar Rojgar YojanaNNREP 1300.00 1300.00 1524.90 3700.00 3984.20 6323.607 Strengthening Training Facilities
for Rural Development 6.00 6.00 8.00 10.00 23.25 16.818 Project Linkage 35.00 1.009 Regional Rural Banks 30.00 30.00 0.00 11.00 41.00 11.00
10 Integrated Rural Energy Programme 40.00 40.00 40.00 145.00 139.6511 Employment Generating Programme 500.00 500.00 0,00 500.00 0.0012 Antyodaya 100.00 100.00 0.00 100.00 0.00
Sub-Total:2.1 3966.00 3966.00 3776.98 10991.00 12985.00 16084.09
2 Land Reforms(1) Consolidation of Holdings 46.00 46.00 66.65 160.00 213.00 351.05(2) Financial Assistance to the
Assignees of surplus land underG.U.L.C. Act, 1972 5.00 5.00 5.00 150.00 85.00 109.56
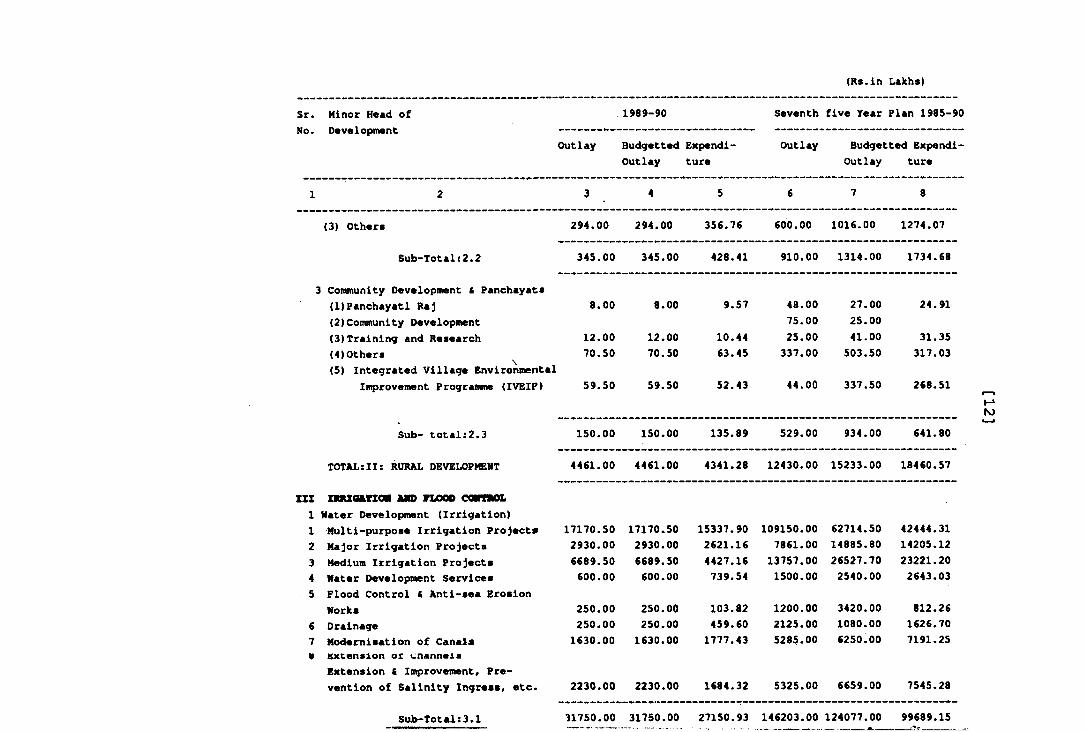
(Rs.ln Lakhs)
Sr. Minor Head of No. Development
Outlay
1989-90
Budgetted Expendl- Outlay ture
Seventh
Outlay
five Year Plan 1985-90
Budgetted Expendl- Outlay ture
1 2 3 4 5 6 7 8
(3) Others 294.00 294.00 356.76 600.00 1016.00 1274.07
Sub-Total:2.2 345.00 345.00 428.41 910.00 1314.00 1734.68
3 Community Development £ Panchayats(l)Panchayatl Raj 8.00 8.00 9.57 48.00 27.00 24.91(2)Community Development 75.00 25.00(3)Training and Research 12.00 12.00 10.44 25.00 41.00 31.35(4)Others 70.50 70.50 63.45 337.00 503.50 317.03(5) Integrated Village Environmental
Improvement Programme (IVEIP) 59.50 59.50 52.43 44.00 337.50 268.51
Sub- total:2.3 150.00 150.00 135.89 529.00 934.00 641.80
TOTAL:II: RURAL DEVELOPMEMT 4461.00 4461.00 4341.28 12430.00 15233.00 18460.57
N)
ZZZ XmZOMZOII AMD nOOO COHTMOL 1 Water Development (Irrigation)1 Multi-purpose Irrigation Project* 17170.50 17170.50 15337.90 109150.00 62714.50 42444.312 Major Irrigation Projects 2930.00 2930.00 2621.16 7861.00 14885.80 14205.123 Medium Irrigation Projects 6689.50 6689.50 4427.16 13757.00 26527.70 23221.204 Nater Development Services 600.00 600.00 739.54 1500.00 2540.00 2643.035 Flood Control « Anti-sea Erosion
Works 250.00 250.00 103.82 1200.00 3420.00 812.266 Drainage 250.00 250.00 459.60 2125.00 1080.00 1626.707 Modernisation of Canals 1630.00 1630.00 1777.43 5285.00 6250.00 7191.25« lixtension or cnannexs
Extension ( Improvement, Prevention of Salinity Ingress, etc. 2230.00 2230.00 1684.32 5325.00 6659.00 7545.28
Sub-Total:3.1 31750.00 31750.00 27150.93 146203.00 124077.00. - .
99689.15
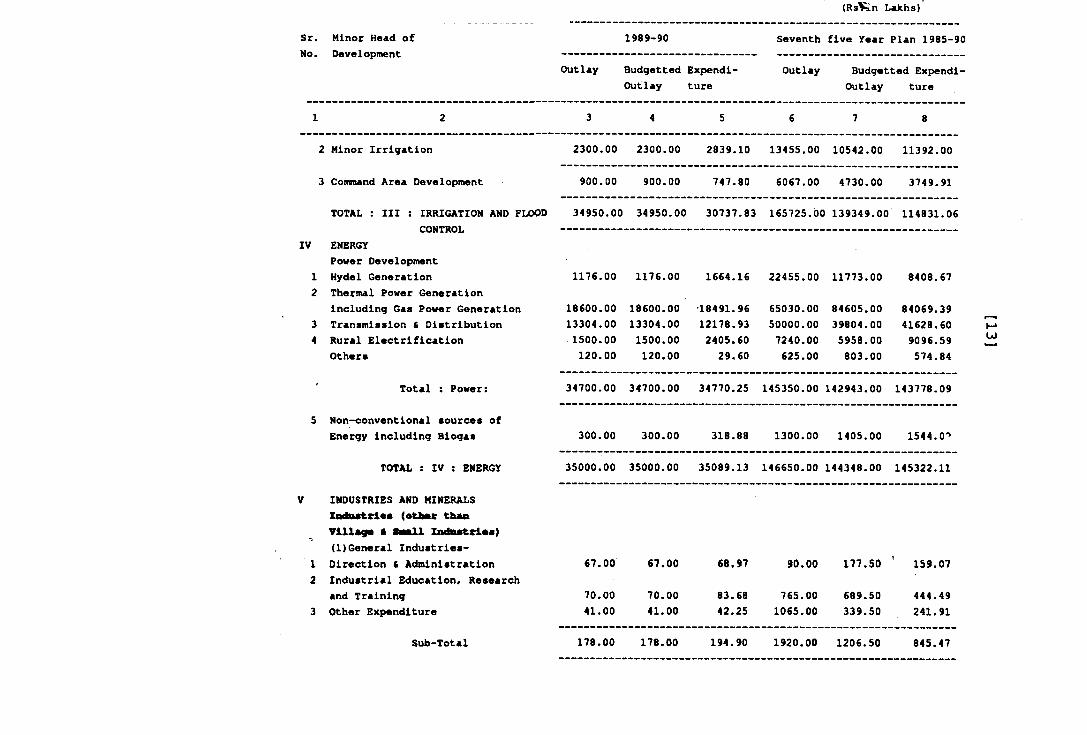
(Rs\^n Lakhs)
Sr. Minor Head ofNo. Development
1989-90 Seventh five Year Plan 1985-91
Outlay Budgetted Expendi- Outlay ture
Outlay Budgetted Expendi- Outlay ture
3 4 5 6 7 8
2300.00 2300.00 2839.10 13455.00 10542.00 11392.00
900.00 900.00 747.80 6067.00 4730.00 3749.91
34950.001 34950.00 30737.83 165725.00 139349.00 114831.06
1176.00 1176.00 1664.16 22455.00 11773.00 8408.67
18600.0013304.001500.00120.00
18600.0013304.001500.00120.00
■18491.9612178.932405.6029,60
65030.0050000.00 7240.00625.00
84605.0039804.00 5958.00803.00
84069.3941628.609096.59574.84
1 2
2 Minor Irrigation
3 Comnand Area Oevelopment
TOTAL : III ; IRRIGATION AND FLOOD CONTROL
IV ENERGYPower Development
1 Hydel Generation2 Thermal Power Generation
including Gas Power Generation3 Transmission S Distribution4 Rural Electrification
Others
Total : Power:
5 Non-conventional sources of
34700.00 34700.00 34770.25 145350.00 142943.00 143778.09
Energy including Biogas 300.00 300.00 318.88 1300.00 1405.00 1544.0->
TOTAL : IV ; ENERGY 35000.00 35000.00 35089.13 146650.00 144348.00 145322.11
V INDUSTRIES AND MINERALSZadu«trie« (otter tluaTlllaga S tiill IndastrlM)(1)General Industries-
1 Direction s Administration 67.00 67.00 68.97 90.00 177.50 ' 159.072 Industrial Education, Research
and Training 70.00 70.00 83.68 765.00 689.50 444.493 Other Expenditure 41.00 41.00 42.25 1065.00 339.50 241.91
Sub-Total 178.00 178.00 194.90 1920.00 1206.50 845.47
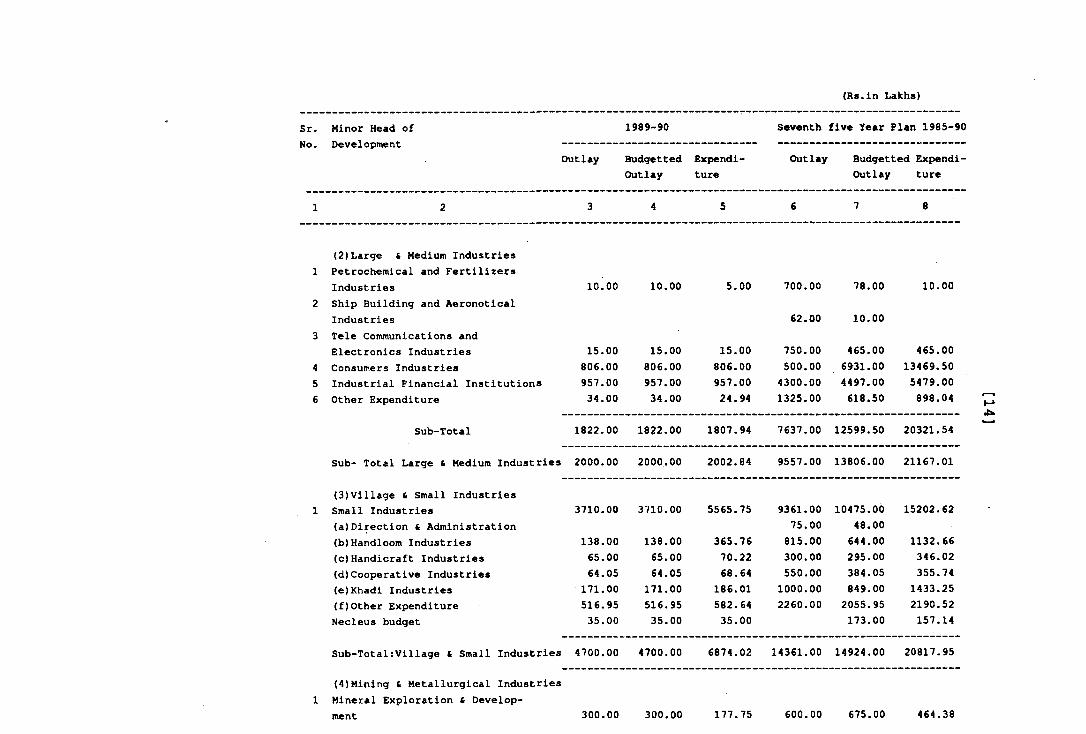
(Rs.in Lakhs)
Sr.No.
Minor Head ofDevelopment --------
Outlay
1989-90
Budgetted Outlay
Expenditure
Seventh
Outlay
five Year Plan 1985-91
Budgetted Expend!' Outlay ture
1 2 3 4 5 6 7 8
(2)Large & Medium Industries1 Petrochemical and Fertilizers
Industries 10.00 10.00 5.00 700.00 78.00 10.002 Ship Building and Aeronotical
Industries 62.00 10.003 Tele Communications and
Electronics Industries 15.00 15.00 15.00 750.00 465.00 465.004 Consumers Industries 806.00 806.00 806.00 500.00 6931.00 13469.505 Industrial Financial Institutions 957.00 957.00 957.00 4300.00 4497.00 5479.006 Other Expenditure 34.00 34.00 24.94 1325.00 618.50 898.04
Sub-Total 1822.00 1822.00 1807.94 7637.00 12599.50 20321.54
Sub- Total Large £ Medium Industries 2000.00 2000.00 2002.84 9557.00 13806.00 21167.01
(3)Village £ Small Industries1 Small Industries 3710.00 3710.00 5565.75 9361.00 10475.00 15202.62
(a)Direction i Administration 75.00 48.00(b)Handloom Industries 138.00 138.00 365.76 815.00 644.00 1132.66(c)Handicraft Industries 65.00 65.00 70.22 300.00 295.00 346.02(d)Cooperative Industries 64.05 64.05 68.64 550.00 384.05 355.74(e)Khadi Industries 171.00 171.00 186.01 1000.00 849.00 1433.25(f)Other Expenditure 516.95 516.95 582.64 2260.00 2055.95 2190.52Necleus budget 35.00 35.00 35.00 173.00 157.14
Sub-Total:Village & Small Industries 4700.00 4700.00 6874.02 14361.00 14924.00 20817.95
(4)Mining fc Metallurgical Industries1 Mineral Exploration £ Develop
ment 300.00 300.00 177.75 600.00 675.00 464.38
H*•tk
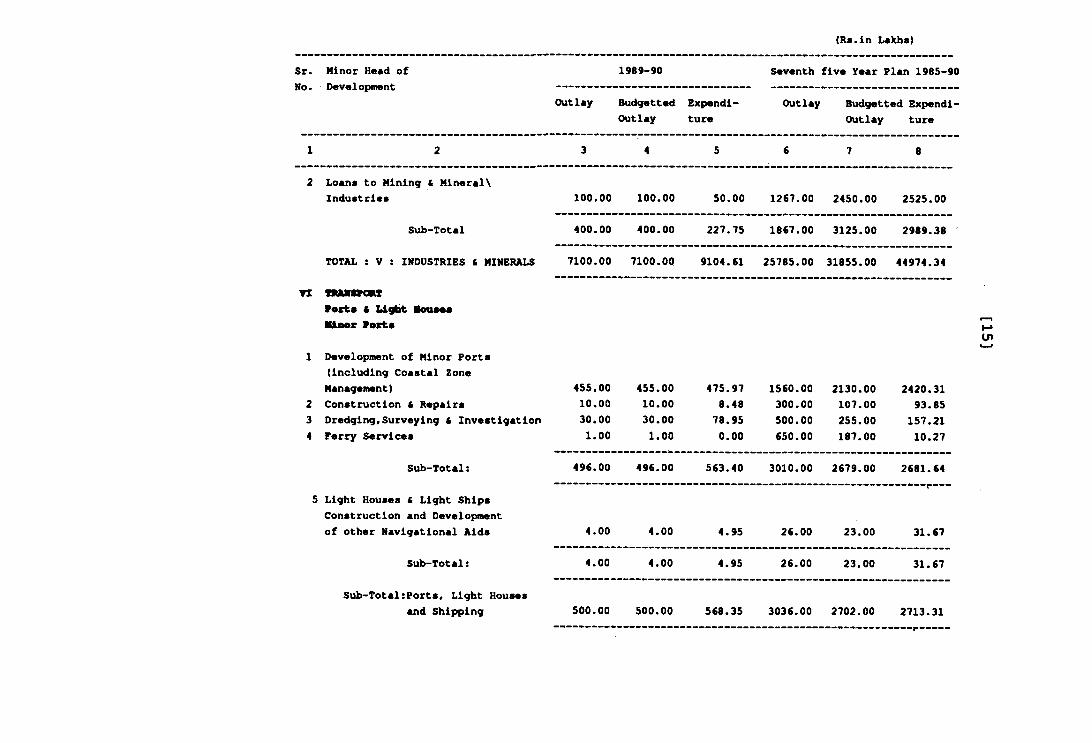
<Rs.in Lakhs)
Sr. Minor Head of 1989-90 Seventh five Year Plan 1985-90No. Development
Outlay Budgetted Expendi- Outlay ture
Outlay Budgetted Expendi- Outlay ture
1 2 3 4 5 6 7 8
2 Loans to Mining & Mineral\ Industries
Sub-Total
TOTAL : V : INDUSTRIES t MINERALS
VI fWUftPORXWwctm C Llglht Houses Miaer Verts
1 Development of Minor Ports (including Coastal Zone Management)
2 Construction i Repairs3 Dredging,Surveying i Investigation4 Ferry Services
Sub-Total:
5 Light Houses C Light Ships Construction and Development of other Navigational Aids
Sub-Total:
Sub-Total:Ports, Light Housesand Shipping
100.00 100.00 50.00
400.00 400.00 227.75
7100.00 7100.00 9104.61
1267.00 2450.00 2525.00
1867.00 3125.00 2989.38
25785.00 31855.00 44974.34
455.0010.00
30.001.00
455.0010.00
30.001.00
475.978.4878.950.00
1560.00 2130.00 2420.31300.00 107.00 93.85500.00 255.00 157.21650.00 187.00 10.27
496.00 496.00 563.40 3010.00 2679.00 2681.64
4.00 4.00 4.95
4.00 4.00 4.95
26.00 23.00 31.67
26.00 23.00 31.67
500.00 500.00 568.35 3036.00 2702.00 2713.31
U1
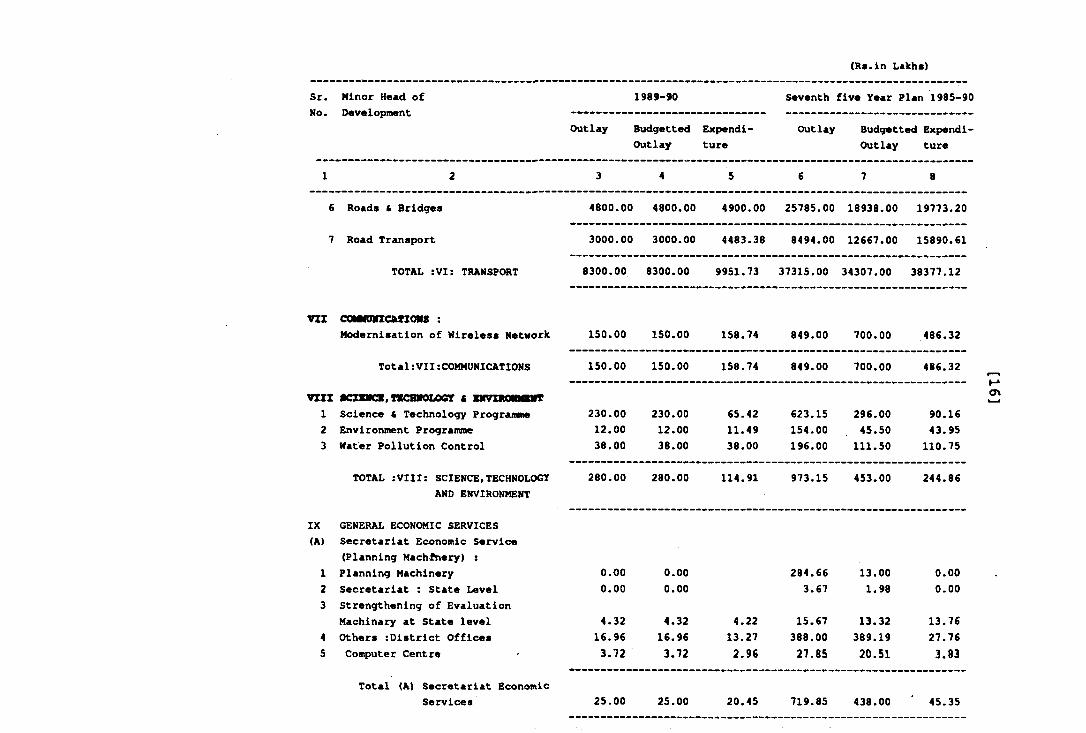
(Rs.ln Lakhs)
Sr.No.
Minor Head of Development
Outlay
1989-90
BudgettedOutlay
Expenditure
Seventh
Outlay
five Year Plan 1985-9i
Budgetted Expendi' Outlay ture
1 2 3 4 5 6 7 8
6 Roads & Bridges 4800.00 4800.00 4900.00 25785.00 18938.00 19773.20
7 Road Transport 3000.00 3000.00 4483.38 8494.00 12667.00 15890.61
TOTAL :VI: TRANSPORT 8300.00 8300.00 9951.73 37315.00 34307.00 38377.12
VIZ COMfmZCftXIOMS :Modernisation of Wireless Network 150.00 150.00 158.74 849.00 700.00 486.32
Total:VII:COMMUNICATIONS 150.00 150.00 158.74 849.00 700.00 486.32
VXIX 0CZBIICB,fBCB]fOLOCr C «MVIROm«WT1 Science ft Technology Programme 230.00 230.00 65.42 623.15 296.00 90.162 Environment Programme 12.00 12.00 11.49 154.00 45.50 43.953 Water Pollution Control 38.00 38.00 38.00 196.00 111.50 110.75
TOTAL ;VIII: SCIENCE,TECHNOLOGY 280.00 280.00 114.91 973.15 453.00 244.86AND ENVIRONMENT
IX GENERAL ECONOMIC SERVICES(A) Secretariat Economic Service
(Planning Machfnery) ;1 Planning Machinery O.CO 0.00 284.66 13.00 0.002 Secretariat : State Level 0.00 0.00 3.67 1.98 0.003 Strengthening of Evaluation
Machinary at State level 4.32 4.32 4.22 15.67 13.32 13.764 Others :District Offices 16.96 16.96 13.27 388.00 389.19 27.765 Computer Centre 3.72 3.72 2.96 27.85 20.51 3.83
Total (A) Secretariat EconomicServices 25.00 25.00 20.45 719.85 438.00 45.35
_________ _________ _________
<T\
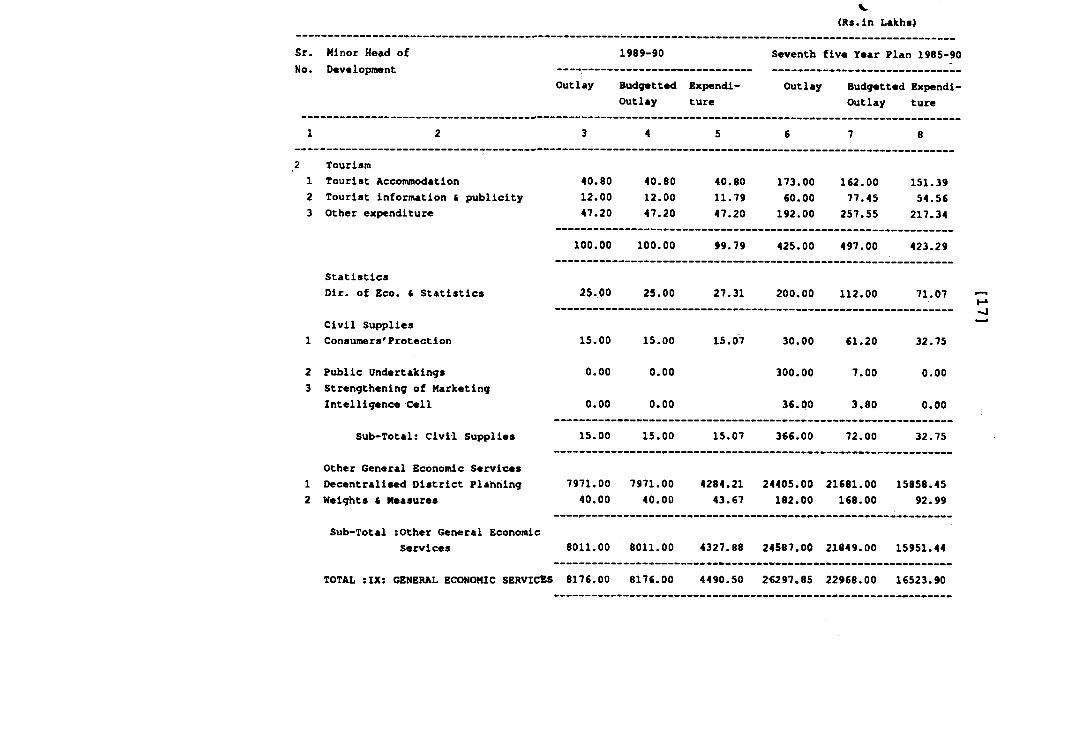
V(Rs.in Lakhs)
S r. M inor Head o f
No. Development1989-90
Outlay Budgetted Expendi- Outlay ture
Seventh five Year Plan 1985-90
Outlay Budgetted Expendl- Outlay ture
1 2 3 4 5 6 7 8
Tourism1 Tourist Accommodation 40.80 40.80 40.80 173.00 162.00 151.392 Tourist information & publicity 12.00 12.00 11.79 60.00 77.45 54.563 Other expenditure 47.20 47.20 47.20 192.00 257.55 217.34
100.00 100.00 99.79 425.00 497.00 423.29
StatisticsDir. of Eco. < Statistics 25.00 25.00 27.31 200.00 112.00 71.07
Civil Supplies1 Consumers' Protection 15.00 15.00 15.07 30.00 61.20 32.75
2 Public Undertakings 0.00 0.00 300.00 7.00 0.003 Strengthening of Marketing
Intelligence Cell 0.00 0.00 36.00 3.80 0.00
Sub-Total: Civil Supplies 15.00 15.00 15.07 366.00 72.00 32.75
Other General Economic Services1 Decentralised District Planning 7971.00 7971.00 4284.21 24405.00 21681.00 15858.452 Weights fi Measures 40.00 40.00 43.67 182.00 168.00 92.99
Sub-Total :Other General EconomicServices 8011.00 8011.00 4327.88 24587.00 21849.00 15951.44
TOTAL :IX: GENERAL ECONOMIC SERVICES 8176.00 8176.00 4490.50 2«297.85 22968.00 16523.90
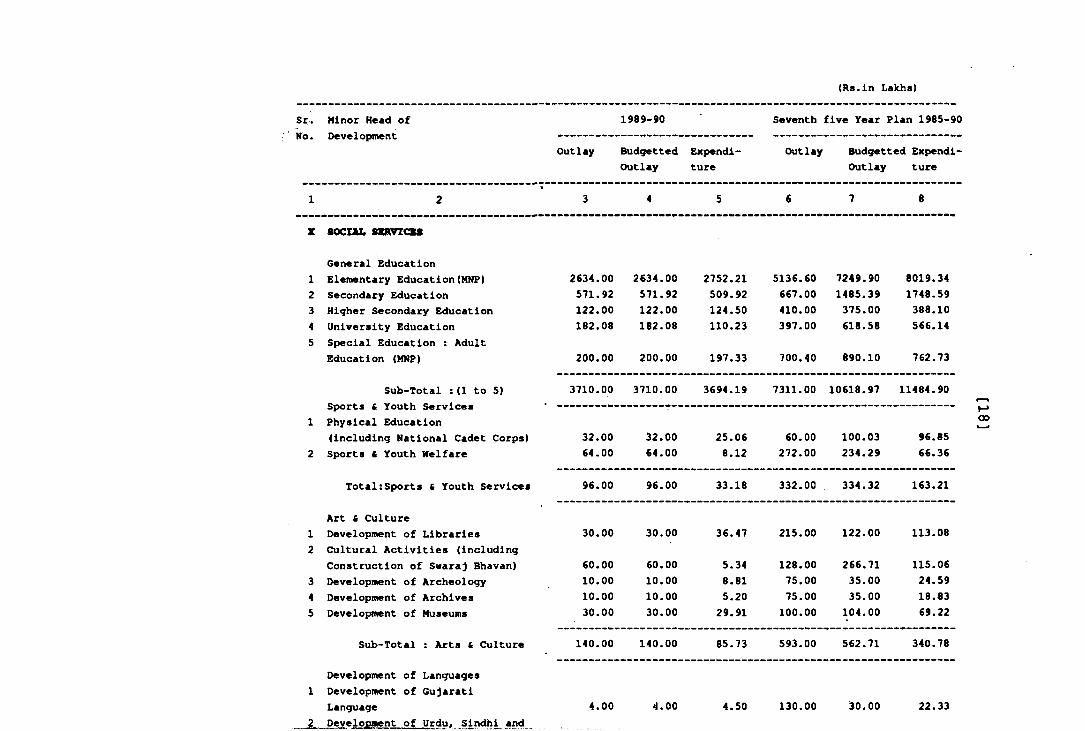
(Rs.ln Lakhs)
s r . Minor Head of Development
1989-90 Seventh five Year Plan 1985-90NO.
Outlay BudgettedOutlay
Expenditure
Outlay Budgetted Expendl- Outlay ture
1 2%
3 4 5 6 7 8
Z SOCIAL 8SKVZCXS
General Education1 Elementary Education(MNP)2 Secondary Education3 Higher Secondary Education4 University Education5 Special Education : Adult
Education (MNP)
2634.00571.9212 2 .0 0182.08
2634.00571.92122.00182.08
200.00 200.00
2752.21509.92124.50110.23
197.33
5136.60667.00410.00397.00
7249.901485-39375.00618.58
8019.341748.59388.10566.14
700.40 890.10 762.73
Sub-Total :(1 to 5) Sports S Youth Services Physical Education
3710.00 3710.00 3694.19 7311.00 10618.97 11484.90
1(including National Cadet Corps) 32.00 32.00 25.06 60.00 100.03 96.85
2 Sports & Youth Welfare 64.00 64.00 8.12 272.00 234.29 66.36
Total:Sports t Youth Services
Art 6 Culture
96.00 96.00 33.18 332.00 334.32 163.21
12
Development of Libraries Cultural Activities (including
30.00 30.00 36.47 215.00 122.00 113.08
Construction of Swaraj Bhavan) 60.00 60.00 5.34 128.00 266.71 115.063 Development of Archeology 10.00 10.00 8.81 75.00 35.00 24.594 Development of Archives 10.00 10.00 5.20 75.00 35.00 18.835 Develoi»nent of Museums 30.00 30.00 29.91 100.00 104.00 69.22
1
Sub-Total : Arts fi Culture
Development of Languages Development of Gujarati
140.00 140.00 85.73 593.00 562.71 340.78
LanguageDevelopment of Urdu* Sindhi and
4.00 4.00 4.50 130.. 00 30.00 22.33
00
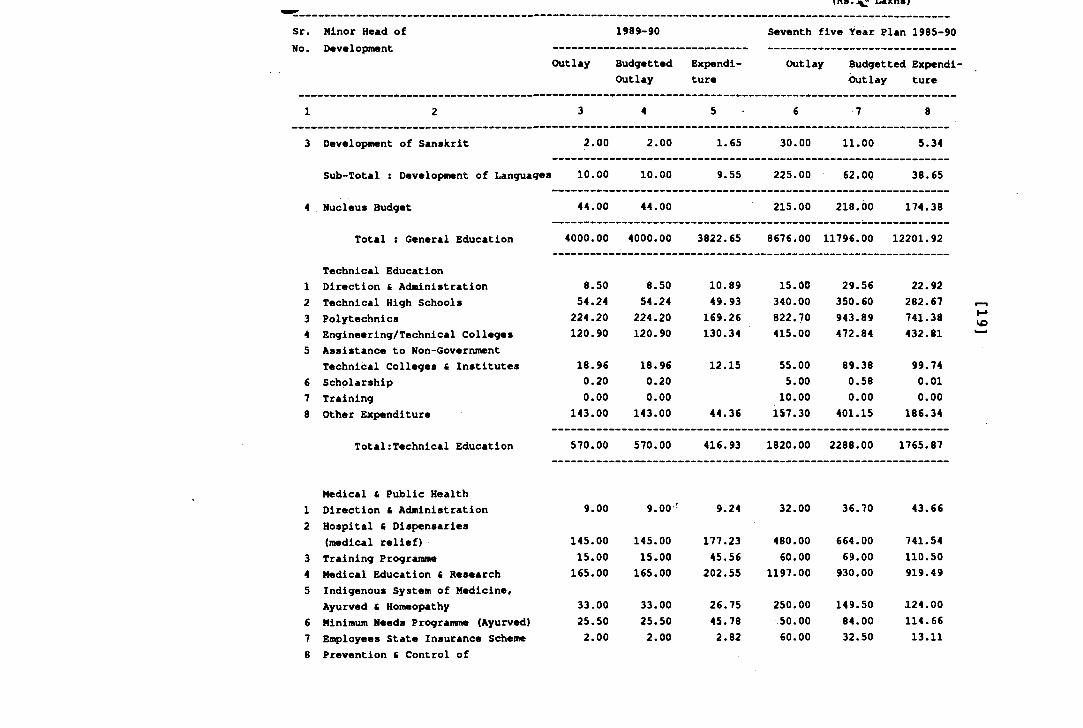
i jcnsTSr. Minor Head of No. Develoi»nent
3 Development of Sanskrit
4 Nucleus Budget
Total : General Education
Technical Education1 Direction fi Administration2 Technical High Schools3 Polytechnics4 Engineering/Technical Colleiges5 Assistance to Non-Government
Technical Colleges 6 Institutes6 Scholarship7 Training8 Other Expenditure
Total;Technical Education
Medical i Public Health1 Direction & Administration2 Hospital S Dispensaries
(medical relief)3 Training Programme4 Medical Education fi Research5 Indigenous System of Medicine,
Ayurved & Homeopathy6 Minimum Needs Progrannne (Ayurved)7 Employees State Insurance Scheme8 Prevention & Control of
Outlay
1989-90
BudgettedOutlay
Expenditure
Seventh five Year Plan 1985-90
Outlay Budgetted Expendi- Outlay ture
3 4 5 6 7 8
2.00 2.00 1.65 30.00 11.00 5.34
1 10.00 10.00 9.55 225.00 62.00 38.65
44.00 44.00 215.00 218.00 174.38
4000.00 4000.00 3822.65 8676.00 11796.00 12201.92
8.50 8.50 10.89 15.00 29.56 22.9254.24 54.24 49.93 340.00 350.60 282.67 _224.20 224.20 169.26 822.70 943.89 741.38120.90 120.90 130.34 415.00 472.84 432.81
18.96 18.96 12.15 55.00 89.38 99.740.20 0.20 5.00 0.58 0.010.00 0.00 10.00 0.00 0.00
143.00 143.00 44.36 157.30 401.15 186.34
570.00 570.00 416.93 1820.00 2288.00 1765.87
9.00 9.00 ' 9.24 32.00 36.70 43.66
145.00 145.00 177.23 480.00 664.00 741.5415.00 15.00 45.56 60.00 69.00 110.50165.00 165.00 202.55 1197.00 930.00 919.49
33.00 33.00 26.75 250.00 149.50 124.0025.50 25.50 45.78 50.00 84.00 114.662.00 2.00 2.82 60.00 32.50 13.11
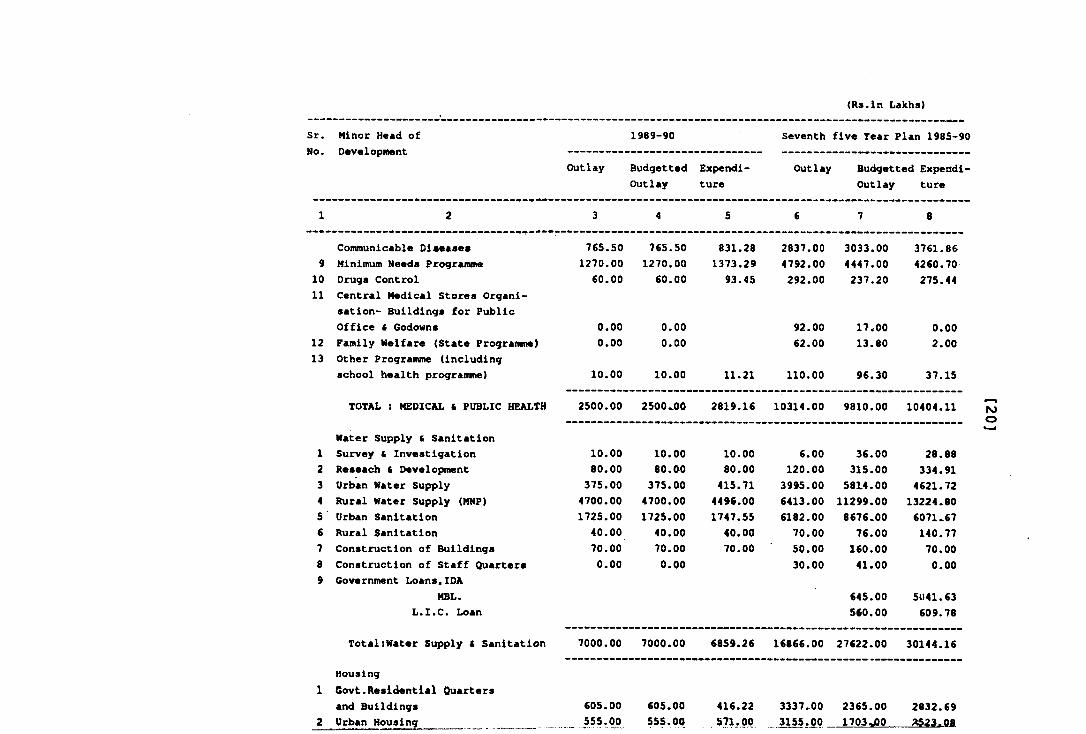
(Rs.ln Lakhs)
Sr.No.
Minor Head of Development
1989-90
Outlay Budgetted Expendi-Outlay ture
Seventh five Year Plan 1985-90
Outlay Budgetted Expend!• Outlay ture
1 2 3 4 5 6 7 8
Conununicable Diseases 765.50 765.50 831.28 2837.00 3033.00 3761.869 Minimum Needs Programme 1270.00 1270.00 1373.29 4792.00 4447.00 4260.70
10 Drugs Control 60.00 60.00 93.45 292.00 237.20 275.4411 Central Medical Stores Organi
sation- Buildings for PublicOffice fi Godowns 0.00 0.00 92.00 17.00 0.00
12 Family Welfare (State Programme) 0.00 0.00 62.00 13.80 2.0013 Other Programme (including
school health programme) 10.00 10.00 11.21 110.00 96.30 37.15
TOTAL : MEDICAL fi PUBLIC HEALTH 2500.00 2500^00 2819.16 10314.00 9810. Ot} 10404.11
Hater Supply fi Sanitation1 Survey fi Investigation 10.00 10.00 10.00 6.00 36.00 28.882 Reseach & Development 80.00 80.00 80.00 120.00 315.00 334.913 Urban Hater Supply 375.00 375.00 415.71 3995.00 5814.00 4621.724 Rural Hater Supply (MNP) 4700.00 4700.00 4496.00 6413.00 11299.00 13224.805 Urban Sanitation 1725.00 1725.00 1747.55 6182.00 8676.00 6071.676 Rural Sanitation 40.00 40.00 40.00 70.00 76.00 140.777 Construction of Buildings 70.00 70.00 70.00 50.00 160.00 70.008 Construction of Staff Quarters 0.00 0.00 30.00 41.00 0.009 Government Loans«IDA
MBL. 645.00 5U41.63L.I.C. Loan 560.00 609.78
Total:Hater Supply C Sanitation 7000.00 7000.00 6859.26 16866.00 27622.00 30144.16
Housing1 Govt.Residential Quarters
and Buildings 605.00 €05.00 416.22 3337.00 2365.00 2832.692 Urban Housing 555.00 571.00 3155.00 1703^0
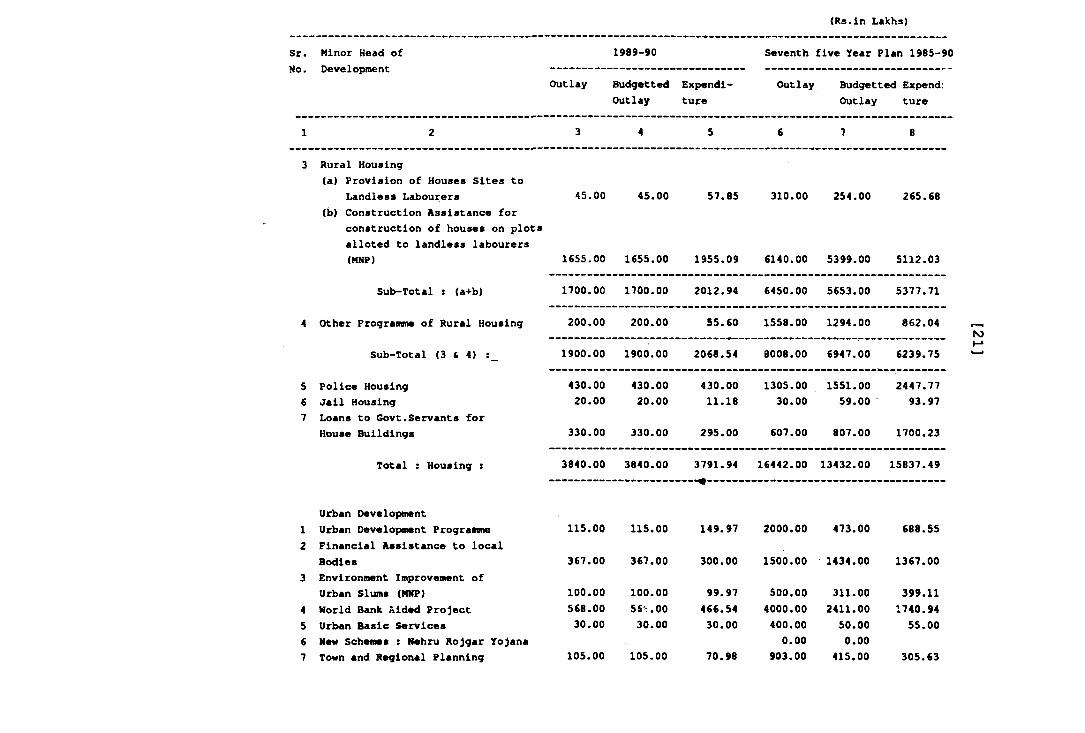
(Rs.in Lakhs)
Sr.No.
Minor Head of Development
Outlay
1989-90
Budgetted Outlay
Expenditure
Seventh
Outlay
five Year Plan 1985-90
Budgetted Expendj Outlay ture
1 2 3 4 5 6 7 8
3 Rural Housing(a) Provision of Houses Sites to
Landless Labourers 45.00 45.00 57.85 310.00 254.00 265.68(b) Construction Assistance for
construction of houses on plotsalloted to landless labourers(MNP) 1655.00 1655.00 1955.09 6140.00 5399.00 5112.03
Sub-Total : (a+b) 1700.00 1700.00 2012.94 6450.00 5653.00 5377.71
4 Other Progranane of Rural Housing 200.00 200.00 55.60 1558.00 1294.00 862.04
Sub-Total (3 & 4) 1900.00 1900.00 2068.54 8008.00 6947.00 6239.75
5 Police Housing 430.00 430.00 430.00 1305.00 1551.00 2447.776 Jail Housing 20.00 20.00 11.18 30.00 59.00 93.977 Loans to Govt.Servants for
House Buildings 330.00 330.00 295.00 607.00 807.00 1700.23
Total : Housing : 3840.00 3840.00 3791.94 16442.00 13432.00 15837.49
Urban Development1 Urban Development Programme 115.00 115.00 149.97 2000.00 473.00 688.552 Financial Assistance to local
Bodies 367.00 367.00 300.00 1500.00 1434.00 1367.003 Environment Improvement of
Urban Slums (MNP) 100.00 100.00 99.97 500.00 311.00 399.114 World Bank Aided Project 568.00 56:.00 466.54 4000.00 2411.00 1740.945 Urban Basic Services 30.00 30.00 30.00 400.00 50.00 55.006 New Schemes : Nehru Rojgar Yojana 0.00 0.007 Town and Regional Planning 105.00 105.00 70.98 903.00 415.00 305.63
NJ
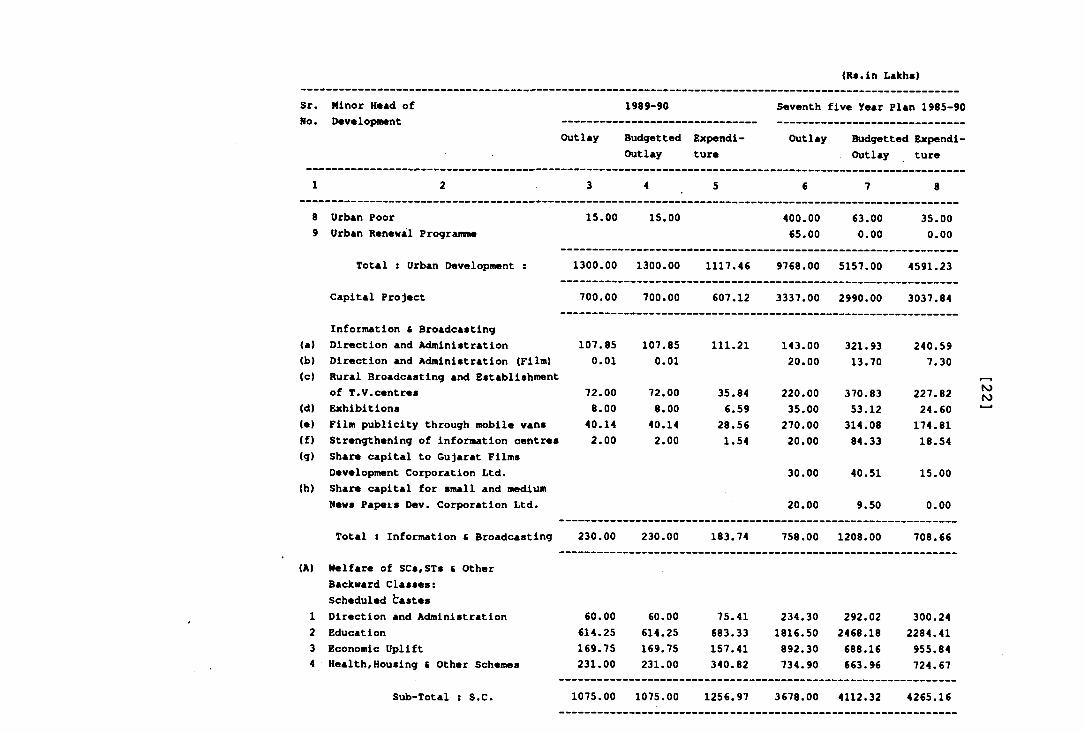
Seventh five Year Plan 1985-90
Outlay Budgetted Expend!- Outlay ture
(Rs.ln Lakhs)
Sr.No.
Minor Head of Development
Outlay
1989-90
Budgetted Expendi* Outlay ture
8
8 Urban Poor 15.00 15.009 Urban Renewal Progranme
Total : Urban Development : 1300.00 1300.00
Capital Project 700.00 700.00
Information i Broadcasting
400.0065.00
63.000.00
1117.46
607.12
9768.00 5157.00
3337.00 2990.00
35.000.00
4591.23
3037.84
(a) Direction and Administration 107.85 107.85 111.21 143.00 321.93 240.59(b) Direction and Administration (Film) 0.01 0.01 20.00 13.70 7.30(c) Rural Broadcasting and Establishment
of T.V.centres 72.00 72.00 35.84 220.00 370.83 227.82 N>ro(d) Exhibitions 8.00 8.00 6.59 35.00 53.12 24.60(e) Film publicity through mobile vans 40.14 40.14 28.56 270.00 314.08 174.81(f) Strengthening of information centres 2.00 2.00 1.54 20.00 84.33 18.54(g) Share capital to Gujarat Films
Development Corporation Ltd. 30.00 40.51 15.00(h) Share capital for small and medium
News Papers Dev. Corporation Ltd. 20.00 9.50 0.00
Total : Information fi Broadcasting 230.00 230.00 183.74 758.00 1208.00 708.66
<A) Welfare of SCs,STs & Other Backward Classes:Scheduled bastes
1 Direction and Administration2 Education3 Economic Uplift4 Health,Housing ( Other Schemes
Sub-Total : S.C.
60.00 60.00 75.41 234.30 292.02 300.24614.25 614.25 683.33 1816.50 2468.18 2284.41169.75 169.75 157.41 892.30 688.16 955.84231.00 231.00 340.82 734.90 663.96 724.67
1075.00 1075.00 1256.97 3678.00 4112.32 4265.16
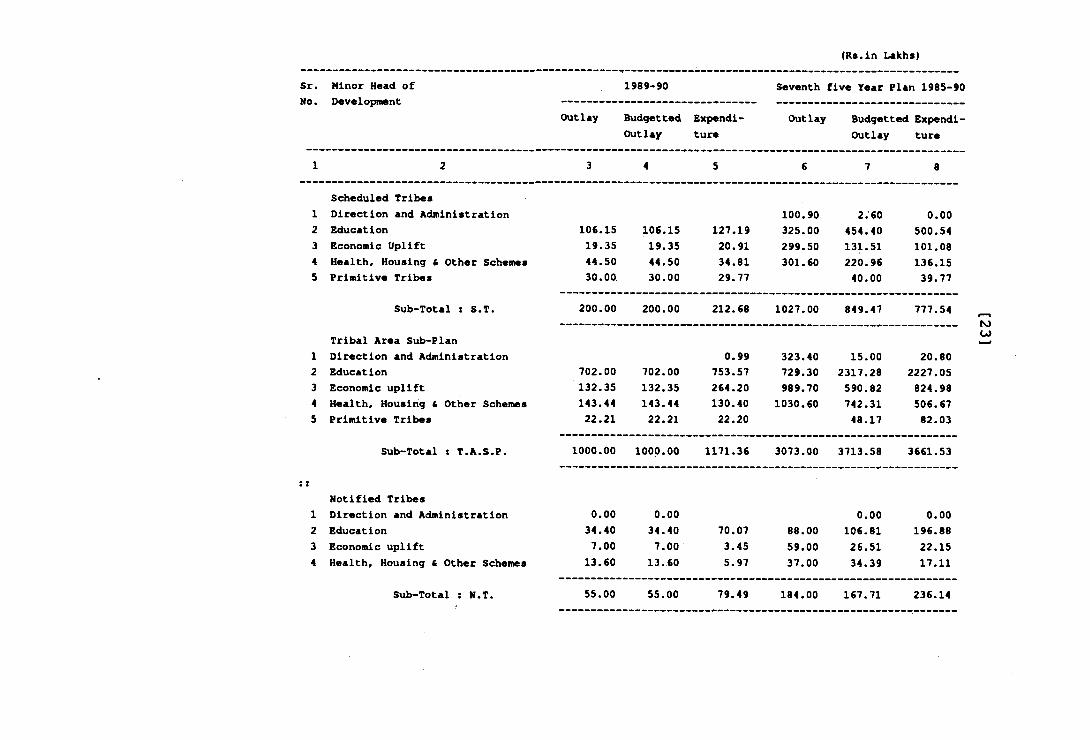
(Rs.ln Lakhs)
Sr.No.
Minor Head of Development
Outlay
1989-90
Budgetted Outlay
Expenditure
Seventh
Outlay
five Year Plan 1985-90
Budgetted Expendi- Outlay ture
1 2 3 4 5 6 7 8
Scheduled Tribes1 Direction and Administration 100.90 2.60 0.002 Education 106.15 106.15 127.19 325.00 454.40 500.543 Economic Uplift 19.35 19.35 20.91 299.50 131.51 101.084 Health, Housing & Other Schemes 44.50 44.50 34.81 301.60 220.96 136.155 Primitive Tribes 30.00 30.00 29.77 40.00 39.77
Sub-Total : S.T.
Tribal Area Sub-Plan1 Direction and Administration2 Education3 Economic uplift4 Health, Housing 6 Other Schemes5 Primitive Tribes
200 .00
702.00132.35143.4422.21
200 .00
702.00132.35143.44
22.21
212.68
0.99753.57264.20130.40
22.20
1027.00
323.40729.30989.70
1030.60
849.47
15.002317.28590.82742.3148.17
777.54
20.802227.05824.98506.6782.03
Sub-Total ; T.A.S.P. 1000.00 1000.00 1171.36 3073.00 3713.58 3661.53
Notified Tribes1 Direction and Administration 0.00 0.00 0.00 0.002 Education 34.40 34.40 70.07 88.00 106.81 196.883 Economic uplift 7.00 7.00 3.45 59.00 26.51 22.154 Health, Housing & Other Schemes 13.60 13.60 5.97 37.00 34.39 17.11
Sub-Total ; N.T. 55.00 55.00 79.49 184.00 167.71 236.14
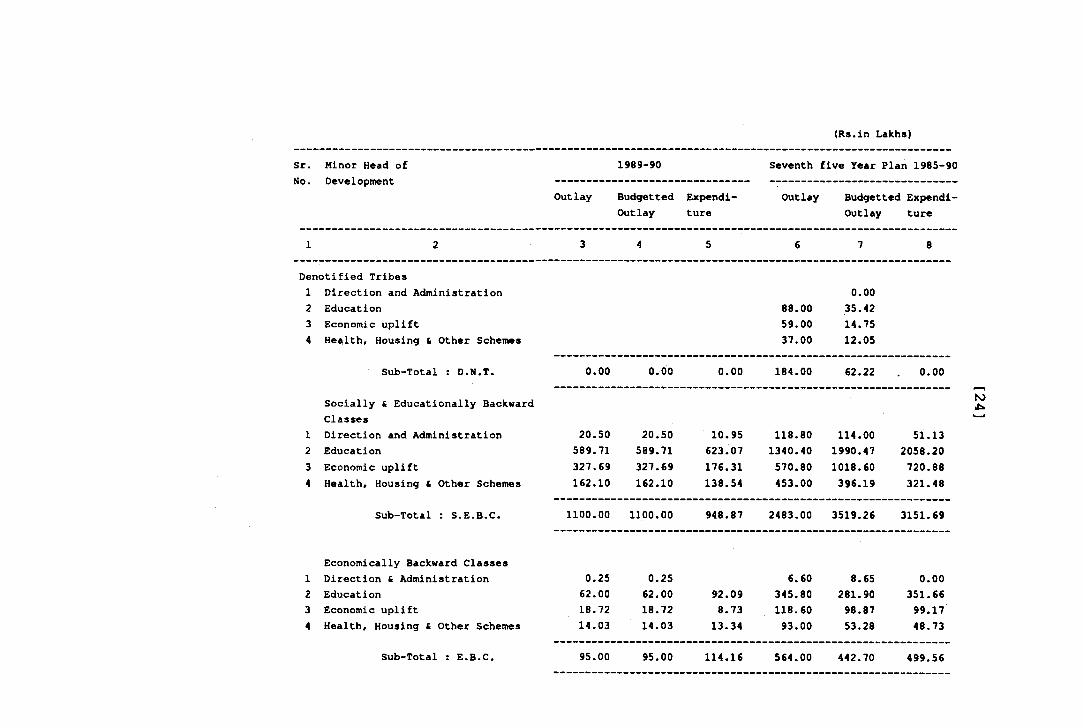
(Rs.in Lakhs)
Sr.No.
Minor Head of Development
Outlay
1989-90
Budgetted Outlay
Expenditure
Seventh
Outlay
five Year Plan 1985-91
Budgetted Expendi- Outlay ture
1 2 3 4 5 6 7 8
Denotified Tribes1 Direction and Administration2 Education3 Economic uplift4 Health, Housing £ Other Schemes
Sub-Total : D.N.T. 0.00 0.00 0.00
88.0059.0037.00
184.00
0.0035.4214.7512.05
62.22 0.00
1
Socially & Educationally Backward ClassesDirection and Administration 20.50 20.50 10.95 118.80 114.00 51.13
2 Education 589.71 589.71 623.07 1340.40 1990.47 2058.203 Economic uplift 327.69 327.69 176.31 570.80 1018.60 720.884 Health, Housing £ Other Schemes 162.10 162.10 138.54 453.00 396.19 321.48
Sub-Total : S.E.B.C. 1100.00 1100.00 948.87 2483.00 3519.26 3151.69
1Economically Backward Classes Direction £ Administration 0.25 0.25 6.60 8.65 0.00
2 Education 62.00 62.00 92.09 345.80 281.90 351.663 Economic uplift 18.72 18.72 8.73 118.60 98.87 99.174 Health, Housing £ Other Schemes 14.03 14.03 13.34 93.00 53.28 48.73
Sub-Total : E.B.C. 95.00 95.00 114.16 564.00 442.70 499.56
ro
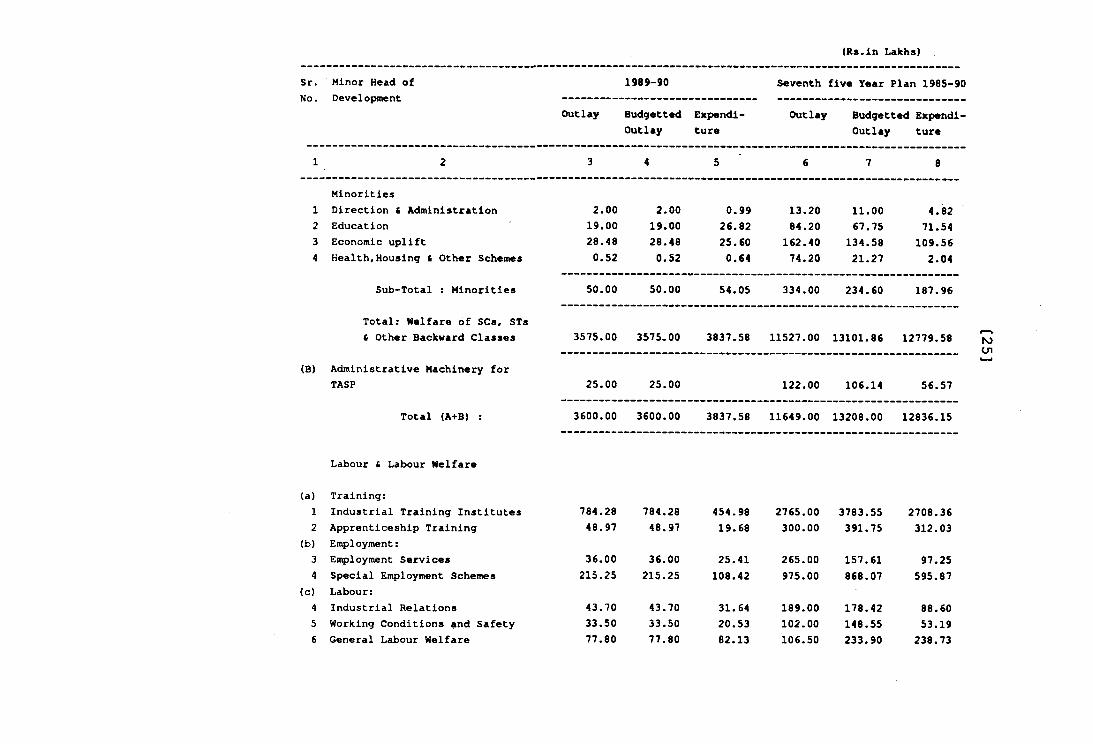
Seventh five Year Plan 1985-90
Outlay Budgetted Expendi- Outlay ture
(Rs.in Lakhs)
Sr.No.
Minor Head of Development
Outlay
1989-90
Budgetted Expendi* Outlay ture
1 2 3 4 5 6 7 8
Minorities1 Direction S Administration 2.00 2.00 0.99 13.20 11.00 4.822 Education 19.00 19.00 26.82 84.20 67.75 71.543 Economic uplift 28.48 28.48 25.60 162.40 134.58 109.564 Health,Housing C Other Schemes 0.52 0.52 0.64 74.20 21.27 2.04
Sub-Total : Minorities 50.00 50.00 54.05 334.00 234.60 187.96
Total: Welfare of SCs, STs& Other Backward Classes 3575.00 3575,00 3837.58 11527.00 13101.86 12779.58 NJtn
B) Administrative Machinery forTASP 25.00 25.00 122.00 106.14 56.57
Total (A+B) : 3600.00 3600.00 3837.58 11649.00 13208.00 12836.15
Labour £ Labour Welfare
(a) Training:1 Industrial Training Institutes2 Apprenticeship Training
(b) Employment:3 Employment Services4 Special Employment Schemes
(c) Labour:4 Industrial Relations5 Working Conditions and Safety6 General Labour Welfare
784.2848.97
36.00215.25
43.7033.5077.80
784.2848.97
36.00215.25
43.7033.5077.80
454.9819.68
25.41108.42
31.6420.5382.13
2765.00300.00
265.00975.00
189.00102.00 106.50
3783.55391.75
157.61868.07
178.42148.55233.90
2708.36312.03
97.25595.87
88.6053.19238.73
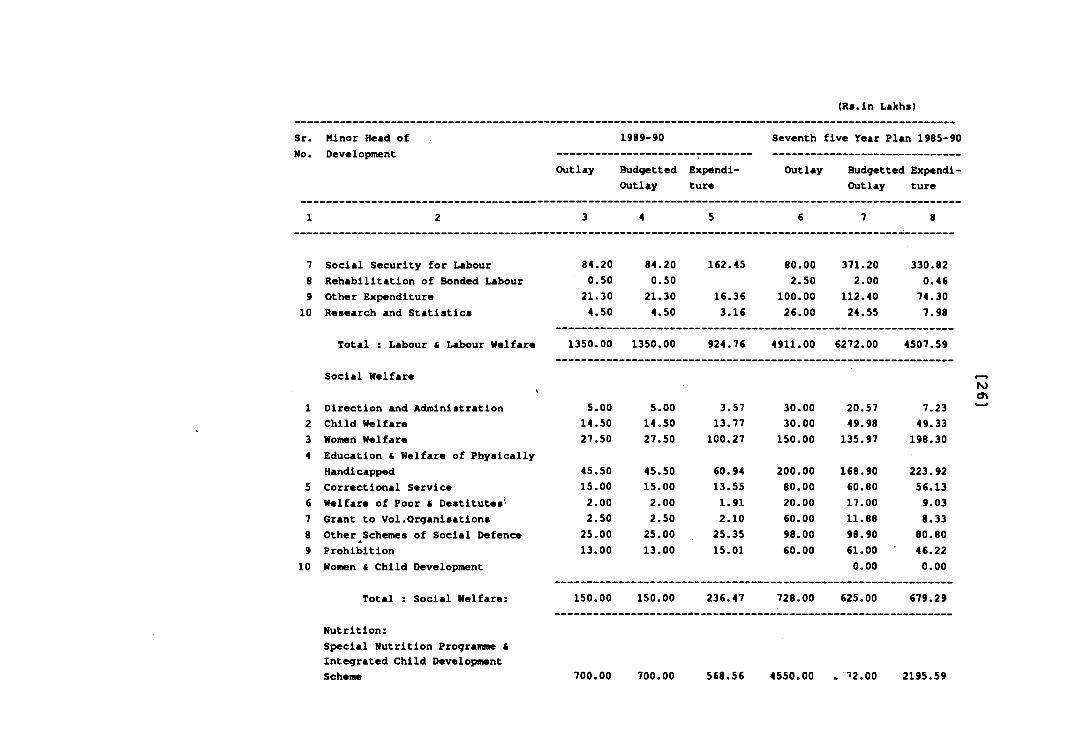
(Rs.ln Lakhs)
Sr. Minor Head of No. Development
1989-90
Outlay Budgetted Outlay
Expenditure
Seventh
Outlay
five Year Plan 1985-90
Budgetted Expendi- Outlay ture
1 2 3 4 5 6 7 8
7 Social Security for Labour 84.20 84.20 162.45 80.00 371.20 330.828 Rehabilitation of Bonded Labour 0.50 0.50 2.50 2.00 0.469 Other Expenditure 21.30 21.30 16.36 100.00 112.40 74.30
10 Research and Statistics 4.50 4.50 3.16 26.00 24.55 7.98
Total : Labour fi Labour Welfare 1350.00 1350.00 924.76 4911.00 6272.00 4507.59
Social Welfare
1 Direction and Administration 5.00 5.00 3.57 30.00 20.57 7.232 Child Welfare 14.50 14.50 13.77 30.00 49.98 49.333 Women Welfare 27.50 27.50 100.27 150.00 135.97 198.304 Education & Welfare of Physically
Handicapped 45.50 45.50 60.94 200.00 168.90 223.925 Correctional Service 15.00 15.00 13.55 80.00 60.80 56.136 Welfare of Poor i Destitutes' 2.00 2.00 1.91 20.00 17.00 9.037 Grant to Vol.Organisations 2.50 2.50 2.10 60.00 11.88 8.338 Other Schemes of Social Defence 25.00 25.00 25.35 98.00 98.90 80.809 Prohibition 13.00 13.00 15.01 60.00 61.00 46.2210 Women & Child Development 0.00 0.00
Total : Social Welfare: 150.00 150.00 236.47 728.00 625.00 679.29
ro<y\
Nutrition:Special Nutrition Programme t Integrated Child Development Scheme 700.00 700.00 568.56 2195.59
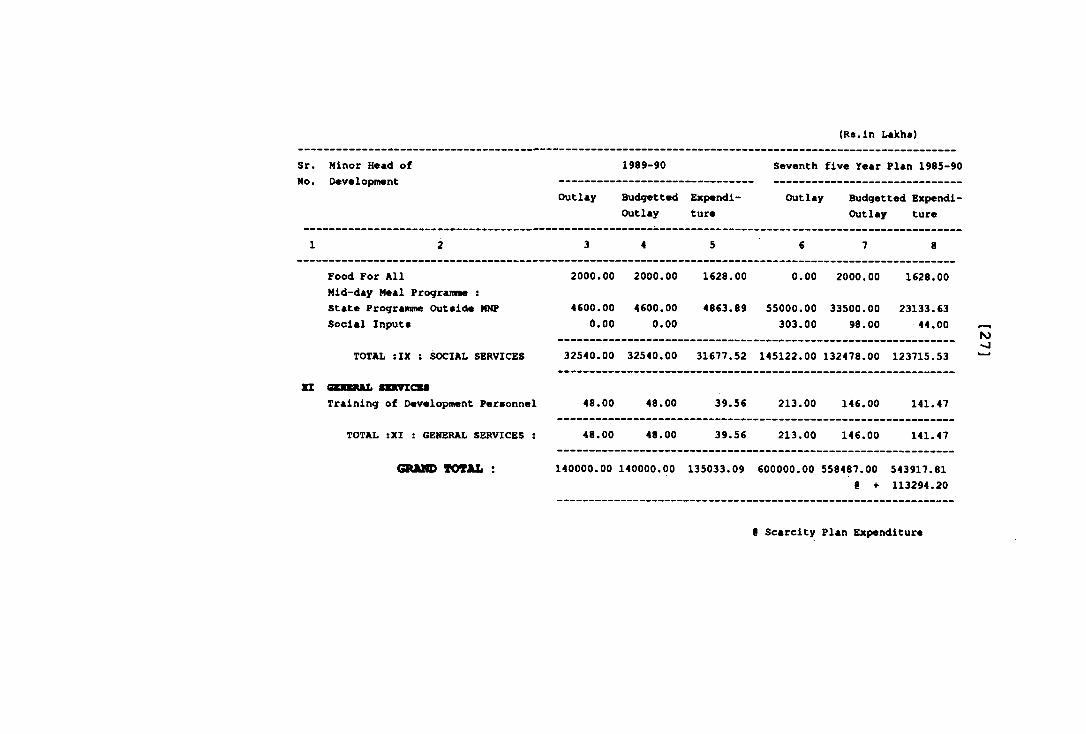
(Rs.ln Lakhs)
Sr. Minor Head of 1989-90 Seventh five Year Plan 1985-90No. Development
Outlay Budgetted Outlay
Expenditure
Outlay Budgetted Expendi- Outlay ture
1 2 3 4 5 6 7 8
Food For All 2000.00 2000.00 1628.00 0.00 2000.00 1628.00Mid-day Meal Programme :State Programme Outside MNP Social Inputs
TOTAL :IX ; SOCIAL SERVICES
zz cEmiuuc. n»vzcuTraining of Development Personnel
TOTAL :XI : GENERAL SERVICES :
GRAHD TOTAL :
4600.00 4600.00 4863.89 55000.00 33500.00 23133.630.00 0.00 303.00 98.00 44.00
32540.00 32540.00 31677.52 145122.00 132478.00 123715.53
48.00 48.00
48.00 48.00
39.56 213.00 146.00 141.47
39.56 213.00 146.00 141.47
140000.00 140000.00 135033.09 600000.00 558487.00 543917.819 * 113294.20
N)
9 Scarcity Plan Expenditure
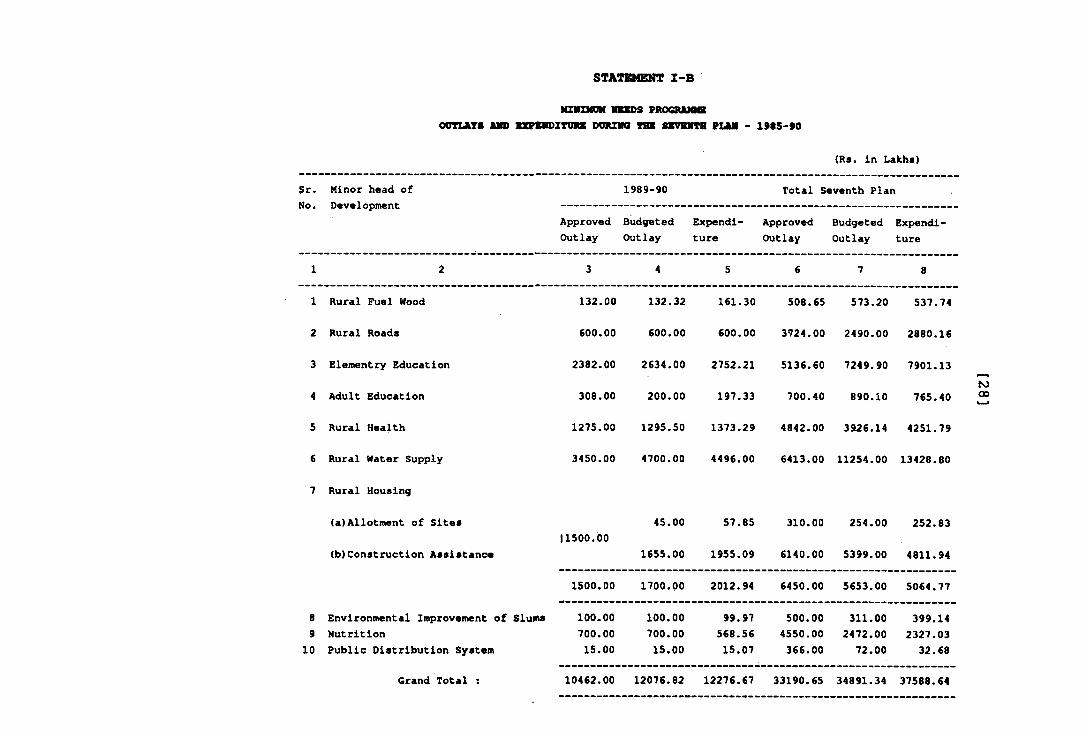
STATSaiENT Z-B
NZirZMON MKIDS PROGRANNS OOTIATS AMD SXPODZTUm DOKElfG TBB 8BVEWTH PLAM - 1985-90
(Rs. in Lakhs)
Sr.No.
Minor head of Development
1989-90 Total Seventh Plan
ApprovedOutlay
BudgetedOutlay
Expenditure
ApprovedOutlay
BudgetedOutlay
Expenditure
1 2 3 4 5 6 7 8
1 Rural Fuel Wood 132.00 132.32 161.30 508.65 573.20 537.74
2 Rural Roads 600.00 600.00 600.00 3724.00 2490.00 2880.16
3 Elementry Education
4 Adult Education
5 Rural Health
6 Rural Water Supply
7 Rural Housing
(a)Allotment of Sites
(b)Construction Assistance
8 Environmental Improvement of Slums9 Nutrition
10 Public Distribution System
2382.00 2634.00 2752.21 5136.60 7249.90 7901.13
308.00 200.00 197.33 700.40 890.10 765.40
1275.00 1295.50 1373.29 4842.00 3926.14 4251.79
3450.00 4700.00 4496.00 6413.00 11254.00 13428.80
11500.0045.00 57.85 310.00 254.00 252.83
1655.00 1955.09 6140.00 5399.00 4811.94
1500.00 1700.00 2012.94 6450.00 5653.00 5064.77
100.00 100.00 99.97 500.00 311.00 399.14700.00 700.00 568.56 4550.00 2472.00 2327.0315.00 15.00 15.07 366.00 72.00 32.68
fO00
Grand Total : 10462.00 12076.82 12276.67 33190.65 34891.34 37588.64
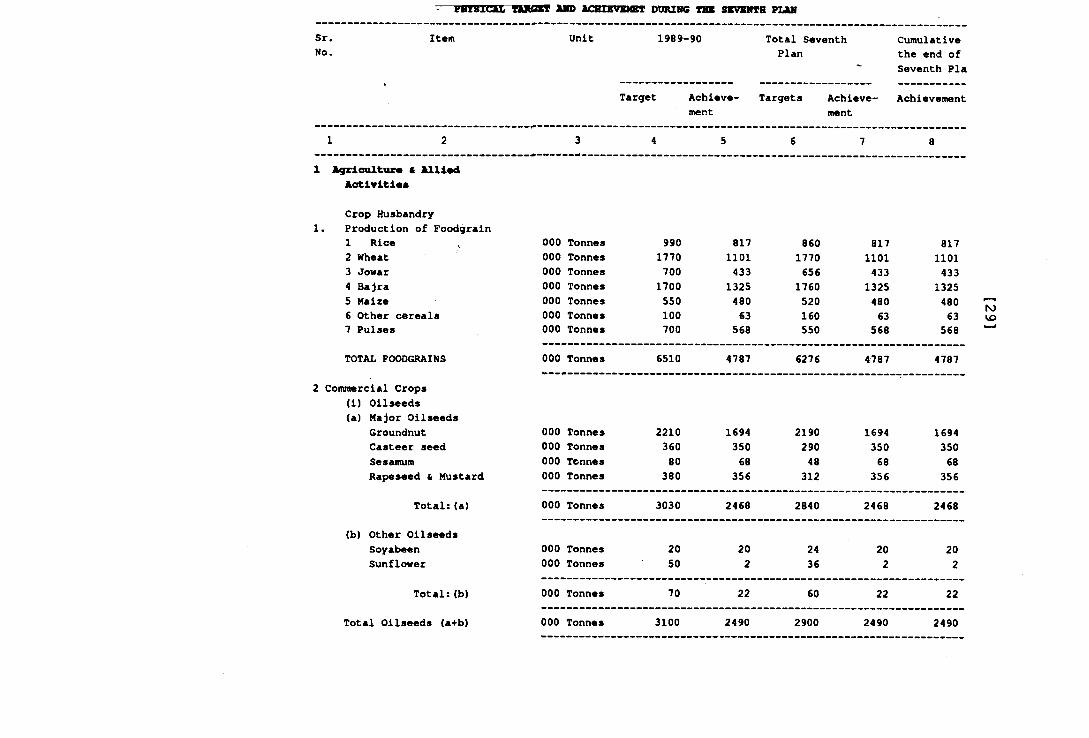
JkMD ACBZSVXMBT DDRZHG THE SSVBNTB PLAN
Sr.No.
Item Unit 1989-90 Total Seventh Plan
Cumulative the end of Seventh Pla
Target Achievement
Targets Achievement
Achievement
1 Jkgrioultur* S Allied Aotiviti**
1.Crop Husbandry Production of Foodgrain
RiceWheatJowarBajraMaizeOther cerea l at Pulses
000 Tonnes 000 Tonnes 000 Tonnes 000 Tonnes 000 Tonnes 000 Tonnes 000 Tonnes
99017707001700550100700
8171101433132548063568
86017706561760520160550
8171101433132548063
568
8171101
433132548063568
toVO
TOTAL FOODGRAINS
2 Coiranercial Crops <i) Oilseeds (a) Major Oilseeds
Groundnut Casteer seed SesamumRapeseed li Mustard
000 Tonnes 6510 4787 6276 4787 4787
000 Tonnes 000 Tonnes 000 Tennes 000 Tonnes
221036080380
169435068
356
219029048312
169435068356
169435068356
Total;(a) 000 Tonnes 3030 2468 2840 2468 2468
(b) Other OilseedsSoyabeenSunflower
000 Tonnes 000 Tonnes
2050
202
2436
202
202
Total;(b)
Total Oilseeds (a-i-b)
000 Tonnes
000 Tonnes
70
3100
222490
60
2900
222490
222490
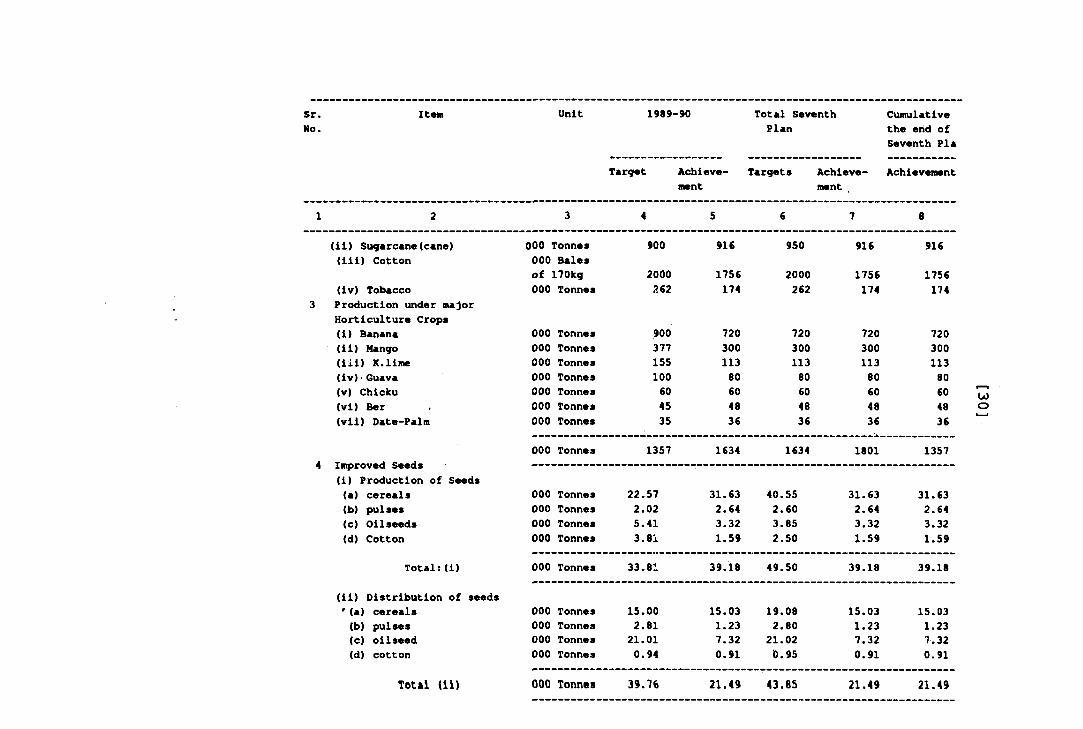
Sr.No.
Item Unit 1989-90
Target Achievement
Total Seventh Plan
Targets Achievement
Cumulative the end of Seventh Pla
Achievement
1 2 3 4 5 6 7 8
(li) Sugarcane(cane) 000 Tonnes 900 916 950 916 916(lii) Cotton 000 Bales
of 170kg 2000 1756 2000 1756 1756(iv) Tobacco 000 Tonnes 262 174 262 174 174
3 Production under majorHorticulture Crops(1) Banana 000 Tonnes 900 720 720 720 720(ii) Mango 000 Tonnes 377 300 300 300 300(ill) K.llme 000 Tonnes 155 113 113 113 113(iv)‘Guava 000 Tonnes 100 80 80 80 80(v) Chlcku 000 Tonnes 60 60 60 60 60(Vi) Ber 000 Tonnes 45 48 48 48 48(vii) Date-Palm 000 Tonnes 35 36 36 36 36
000 Tonnes 1357 1634 1634 1801 1357A Improved Seeds
(i) Production of Seeds(a) cereals 000 Tonnes 22.57 31.63 40.55 31.63 31.63(b) pulses 000 Tonnes 2.02 2.64 2.60 2.64 2.64(c) Oilseeds 000 Tonnes 5.41 3.32 3.85 3.32 3.32(d) Cotton 000 Tonnes 3.81 1.59 2.50 1.59 1.59
Total:(i) 000 Tonnes 33.81 39.18 49.50 39.18 39.18
(ii) Distribution of seeds'(a) cereals 000 Tonnes 15.00 15.03 19.08 15.03 15.03(b) pulses 000 Tonnes 2.81 1.23 2.80 1.23 1.23(c) oilseed 000 Tonnes 21.01 7.32 21.02 7.32 7.32(d) cotton 000 Tonnes 0.94 0.91 D.95 0.91 0.91
T otal ( i l ) 000 Tonnes 39.16 21.49 43.85 21.49 21.49
OJo
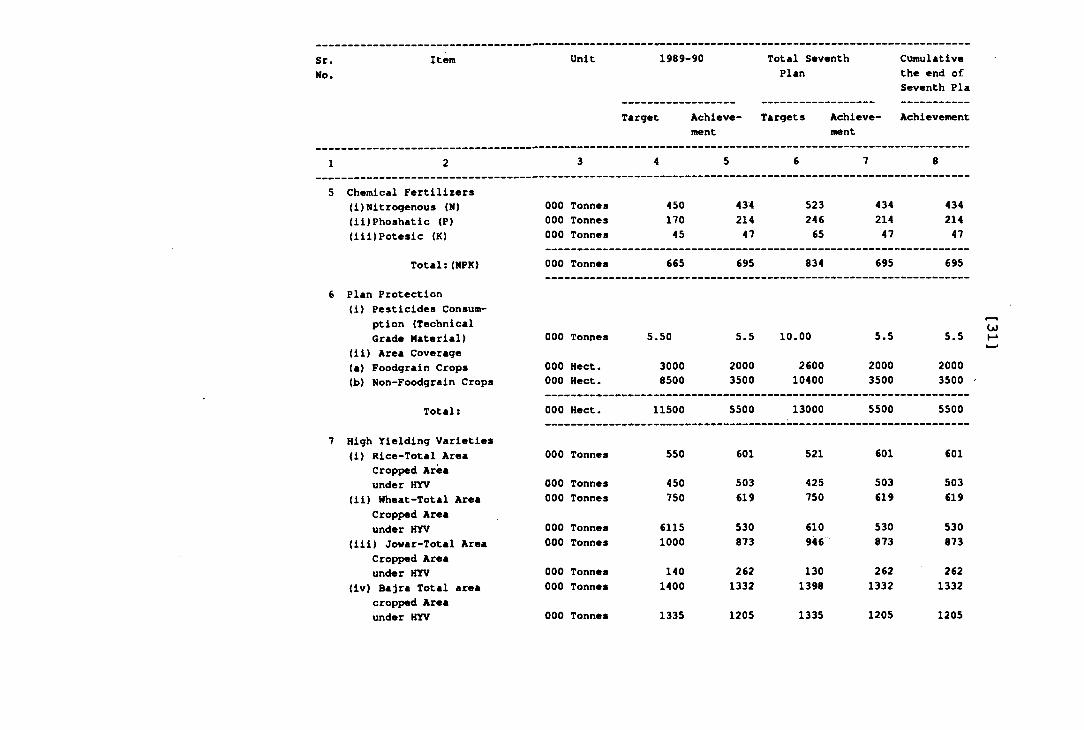
Sr.No.
Item Unit 1989-90 Total SeventhPlan
Target Achievement
Targets Achievement
Achievement
Cumulativethe end ofSeventh Pia
2 3 4 5 6 7 8
Chemical Fertilizers(i)Nitrogenous (N) 000 Tonnes 450 434 523 434 434(ii)Phoshatic (P) 000 Tonnes 170 214 246 214 214(iii)Potesic (K) 000 Tonnes 45 47 65 47 47
Total:(NPK) 000 Tonnes 665 695 834 695 695
Plan Protection(i) Pesticides Consum
ption (TechnicalGrade Material) 000 Tonnes 5.50 5.5 10.00 5.5 5.5
(ii) Area Coverage(a) Foodgrain Crops 000 Hect. 3000 2000 2600 2000 2000(b) Non-Foodgrain Crops 000 Hect. 8500 3500 10400 3500 3500
Total: 000 Hect. 11500 5500 13000 5500 5500
High Yielding Varieties(i) Rice-Total Area 000 Tonnes 550 601 521 601 601
Cropped Areaunder HYV 000 Tonnes 450 503 425 503 503
(ii) Wheat-Total Area 000 Tonnes 750 619 750 619 619Cropped Areaunder HYV 000 Tonnes 6115 530 610 530 530
(iii) Jowar-Total Area 000 Tonnes 1000 873 946 873 873Cropped Areaunder HYV 000 Tonnes 140 262 130 262 262
(iv) Bajra Total area 000 Tonnes 1400 1332 1398 1332 1332cropped Areaunder HYV 000 Tonnes 1335 1205 1335 1205 1205
CO
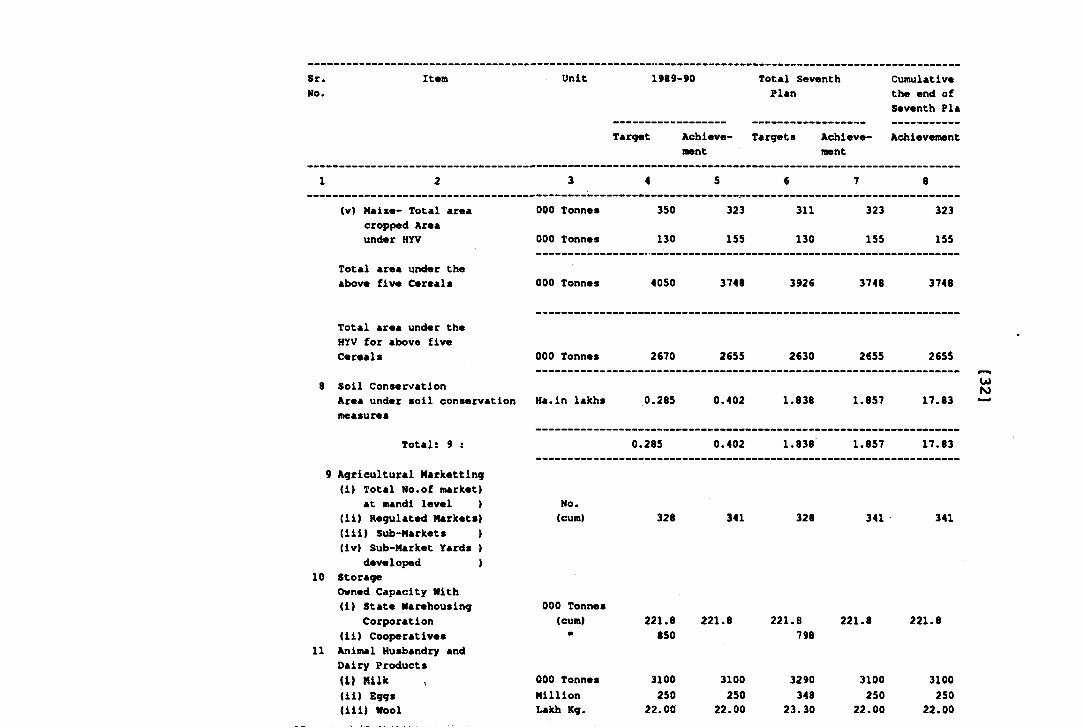
Sr.No.
Item Unit 1989-90
Target Achievement
Total Seventh Plan
Targets Achievement
Cumulative the end of Seventh Pla
Achievement
1 2 3 4 5 6 7 8
(V) Maize- Total area cropped Area under HYV
Total area under the above five Cereals
000 Tonnes
000 Tonnes
000 Tonnes
350
130
323
155
311
130
323
155
4050
323
155
3748 392€ 3748 3748
Total area under the HYV for above five Cereals
8 Soil Conservatj-onArea under soil conservation measures
Total: 9 :
9 Agricultural Marketting <i) Total No.of market)
at mandi level )(ii) Regulated Markets)(iii) Sub-Markets )(iv) Sub-Market Yards )
developed )10 Storage
Owned Capacity Nith(i) State Narehousing
Corporation(ii) Cooperatives
11 Animal Husbandry and Dairy Products(i) HiIk
(ii) Eggs(iii) Nool
000 Tonnes
Ha.in lakhs
No.(cum)
000 Tonnes (cum)
000 Topnes Million Lakh Kg.
2670
0.285
2655
0.402
2630
1.838
2655
1.857
0.285
328 341 328 341
221.8
850
3100250
22.00
221.8
3100250
22.00
221.6798
3290348
23.30
221.8
3100250
22.00
2655
17.83
0.402 1.838 1.857 17.83
341
221.8
3100250
22.00
UN>
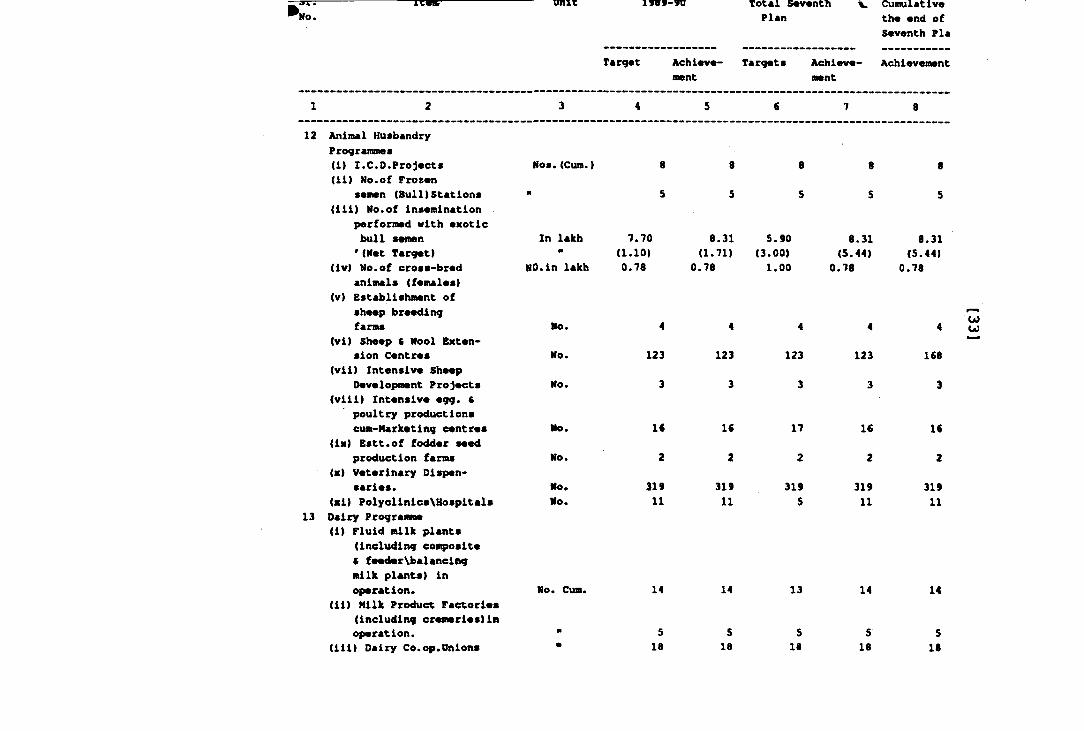
XC«Br Total S*Venth Plan
V Cumulativethe end ofSeventh Pla
Target Achieve- Targets ment
Achieve- Achievement ment
7.70 (1.10)
NO.in lakh 0.78
12 Animal Husbandry Programmes(i) I.C.O.Projects Mos.(Cum.)(ii) No.of Frozen
semen (Bull)Stations "(iii) No.of insemination
performed with exoticbull semen In lakhMNet Target)
(iv) No.of cross-bred animals (females)
(v) Establishment of sheep breedingfarms No.
(vi) Sheep fi Nool Extension Centres No.
(vii) Intensive SheepDevelopment Projects No.
(viii) Intensive egg. tpoultry productions c\im-Marketing centres No.
(ix) Estt.of fodder seedproduction farms No.
(x) Veterinary Dispensaries. Mo.
(xi) PolyelinicsXHospitals Mo.13 Dairy Programme
(i) Fluid milk plants (including composite C feeder\balancing milk plants) inoperation. No. Cum.
(ii) Milk Product Factories(including cremerieslin operation. *
(iii) Dairy Co.op.Unions *
4
123
3
1<2
31911
14
S18
8.31(1.71)
0.78
4
123
3
1«2
31911
14
518
5.90(3.00)
1 .0 0
4
123
3
17
23195
13
518
8.31(5.44)
0.78
4
123
3
16
231911
14
518
8.31(5.44)
0.78
4
168
3
1€
231911
14
518
u;
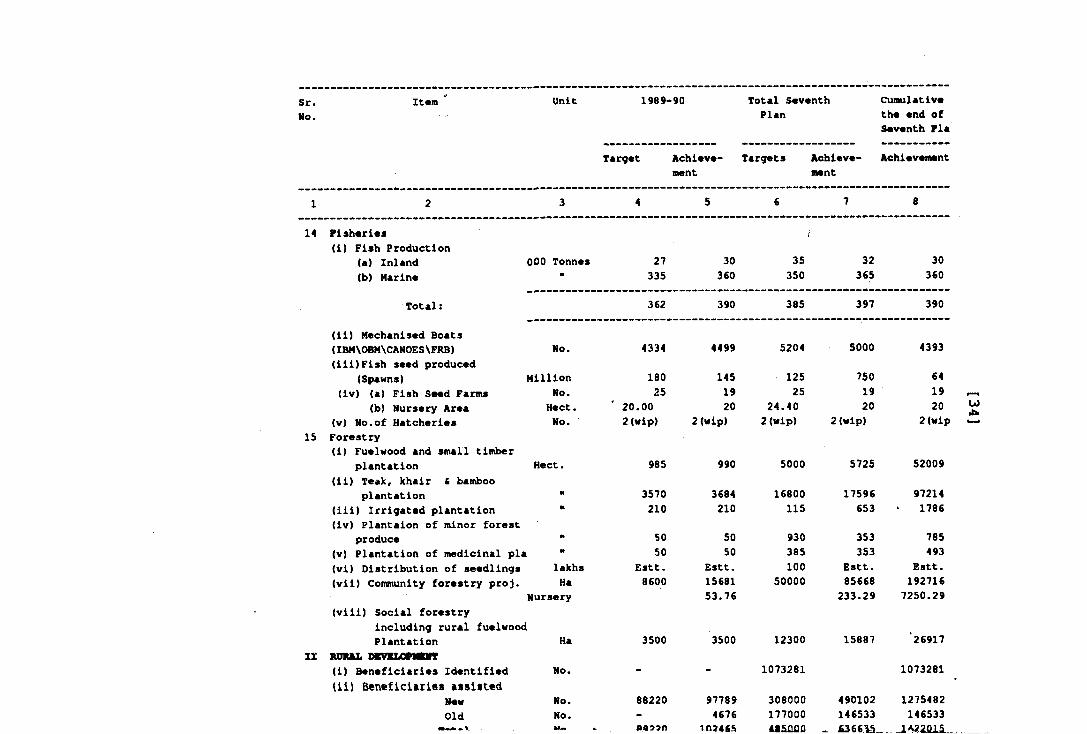
Sr.No.
Zt«m Unit 1989-90 Total Sev«nth Plan
Cumulatlvtt th« end of S«v«nth Pla
Target Achievement
Targets Achievement
Achievement
1 2 3 4 5 6 7 8
14 Pishttrl«s Ji(i) Fish Production
(a) Inland 000 Tonnes 27 30 35 32 30(b) Marine m 335 360 350 365 360
Total: 362 390 385 397 390
(ii) Mechanised Boats(IBM\OBM\CANOES\FRB) No. 4334 4499 5204 5000 4393(iii)Fish seed produced
(Spawns) Million 180 145 125 750 64(iv) (a) Fish Seed Farms No. 25 19 25 19 19
(b) Nursery Area Hect. 20.00 20 24.40 20 20(v) No.of Hatcheries No. 2 (wip) 2(wip) 2 (wip) 2 (wip) 2 (wip
15 Forestry(i) Fuelwood and small timber
plantation Hect. 985 990 5000 5725 52009(ii) Tea)(, khair fi bamboo
plantation •• 3570 3684 16800 17596 97214(Hi) Irrigated plantation n 210 210 115 653 1786(iv) Plantaion of minor forest
produce m 50 50 930 353 785(v) Plantation of medicinal pla ” 50 50 385 353 493(vi) Distribution of seedlings lakhs Estt. Estt. 100 Estt. Estt.(vii) Community forestry proj. Ha 8600 15681 50000 85668 192716
Nursery 53.76 233.29 7250.29(viii) Social forestry
including rural fuelwoodPlantation Ha 3500 3500 12300 15887 ‘26917
XX RURIL DKVILOranra(i) Beneficiaries Identified No. - - 1073281 1073281(11) Ben«ficiftries ftssiited
New No. 86220 97789 308000 490102 1275482Old No. - 4676 177000 146533 146533
M07CI ^ £26615_ 1A22015
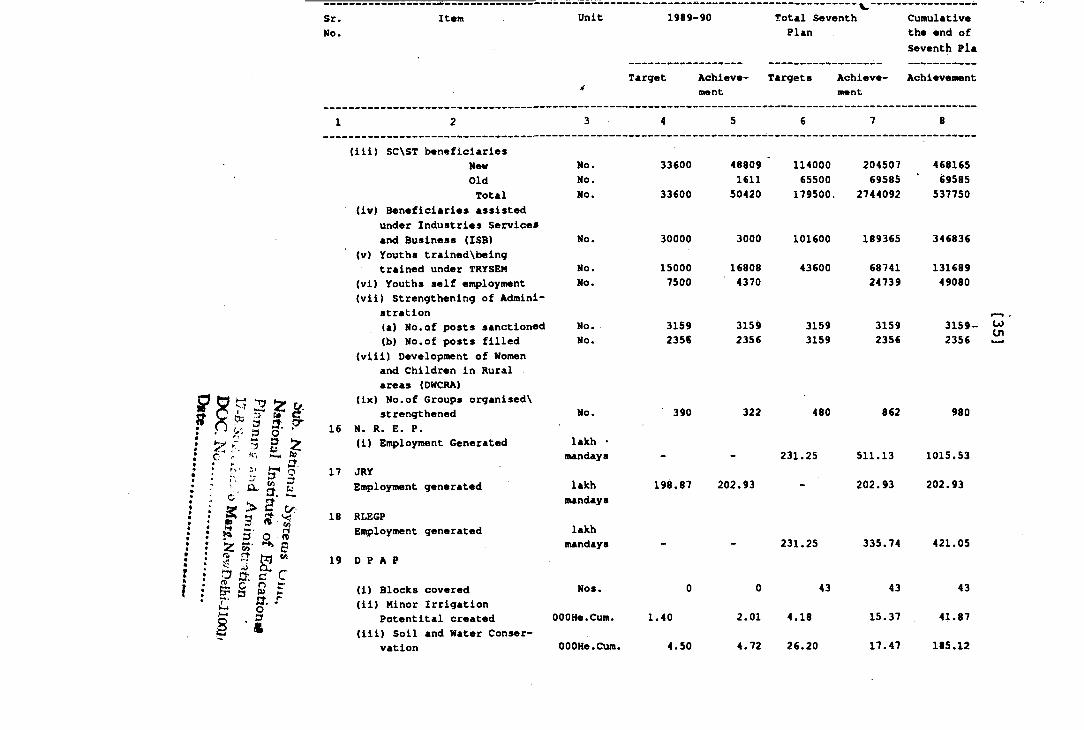
Sr.No.
Item Unit
4
1989-
Target
-90
Achievement
Total Seventh Plan
Targets Achievement
Cumulative the end of Seventh Pla
Achievement
1 2 3 4 5 6 7 8
(iii) SC\ST beneficiaries New No. 33600 48809 114000 204507 468165OldTotal
No.No. 33600
161150420
65500179500.
695852744092
69585537750
(iv) Beneficiaries assisted under Industries Services and Business (ISB) No. 30000 3000 101600 189365 346836
(v) Youths trained\being trained under TRYSEM No. 15000 16808 43600 68741 131689
(vi) Youths self employment <vii) Strengthening of Admini
stration(a) No.of posts sanctioned
No.
No.
7500
3159
4370
3159 3159
24739
3159
49080
3159-(b) No.of posts filled No. 235« 2356 3159 2356 2356
(viii) Development of Women and Children in Rural areas (OWCRA)
(ix) No.of Groups organised\ strengthened No. 390 322 480 862 980
16
17
N. R. E. P.(i) Employment Generated
JRYEmployment generated
lakh • mandays
lakh 198.87 202.93
231.25 511.13
202.93
1015.53
202.93
18
19
RLEGPEmployment generated
0 P A P
(i) Blocks covered
mandays
lakhmandays
Nos. 0 0
231.25
43
335.74
43
421.05
43(ii) Minor Irrigation
Potentital created OOOHe.Cum. 1.40 2.01 4.18 15.37 41.87(iii) Soil and Water Conser
vation OOOHe.Cum. 4.50 4.72 26.20 17.47 185.12
cn
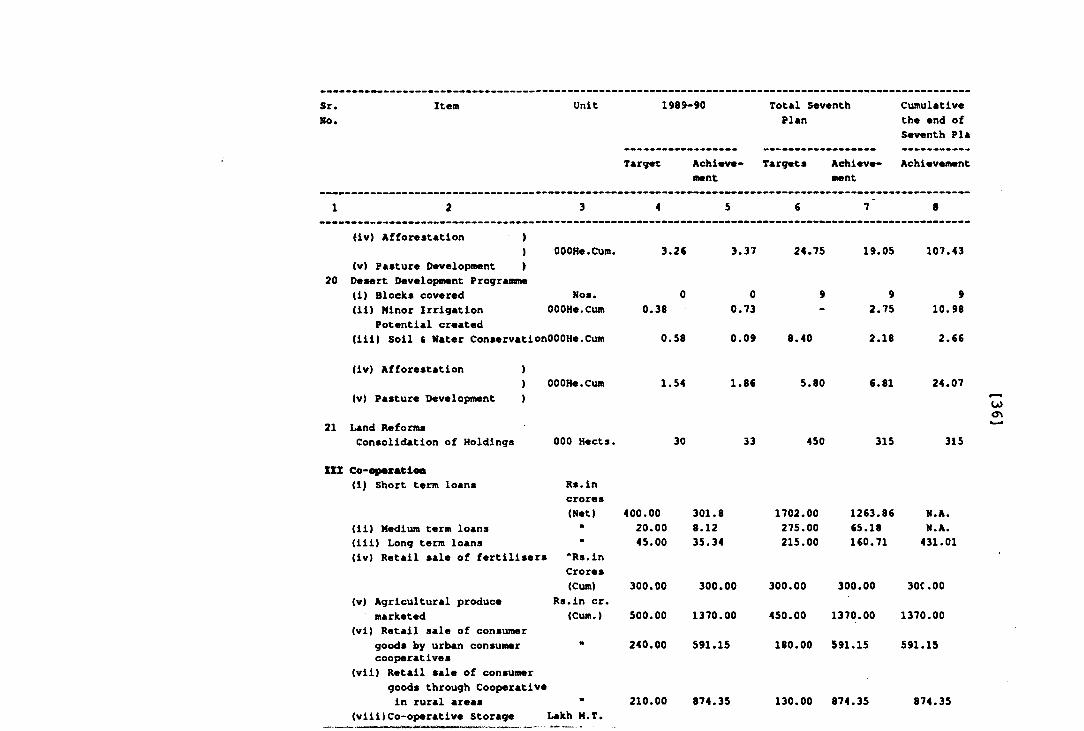
Sr,No.
Item Unit 1989-90
Target Achievement
Total Seventh Plan
Targets Achievement
Cumulative the end of Seventh Pla
Achievement
1 2 3 4 5 € 7* 8
(iv) Afforestation )) OOOHe.Cum. 3.2€ 3.37 24.75 19.05 107.43
20(v> Pasture Development )Desert Development Programme(i) Blocks covered Nos. 0 0 9 9 9(il) Minor Irrigation OOOHe.Ctim 0.38 0.73 - 2.75 10.98
Potential created (iii) Soil 4 Hater ConservationOOOHe.Cum 0.58 0.09 8.40 2.18 2.66
(iv) Afforestation )) OOOHe.Cum 1.54 1.86 5.80 6.81 24.07
21
(v) Pasture Development )
Land Reforms Consolidation of Holdings 000 Hects. 30 33 450 315 315
XXX Co-opsratloo(1) Short term loans Rs.in
crores(Net) 400.00 301.8 1702.00 1263.86 N.A.
(ii) Medium term loans ” 20.00 8.12 275.00 65.18 N.A.(iii) Long term loans ” 45.00 35.34 215.00 160.71 431.01(iv) Retail sale of fertilisers ^Rs.in
Crores(Cum) 300.00 300.00 300.00 300.00 30C.00
(v) Agricultural produce Rs.in cr. marketed (Cum.) 500.00 1370.00 450.00 1370.00 1370.00
(vi) Retail sale of consumergoods by urban consumer * 240.00 591.15 180.00 591.15 591.15cooperatives
(vii) Retail sale of consumergoods through Cooperative in rural areas ” 210.00 874.35 130.00 874.35 874.35
(viii)Co-operative Storage Lakh M.T.
to
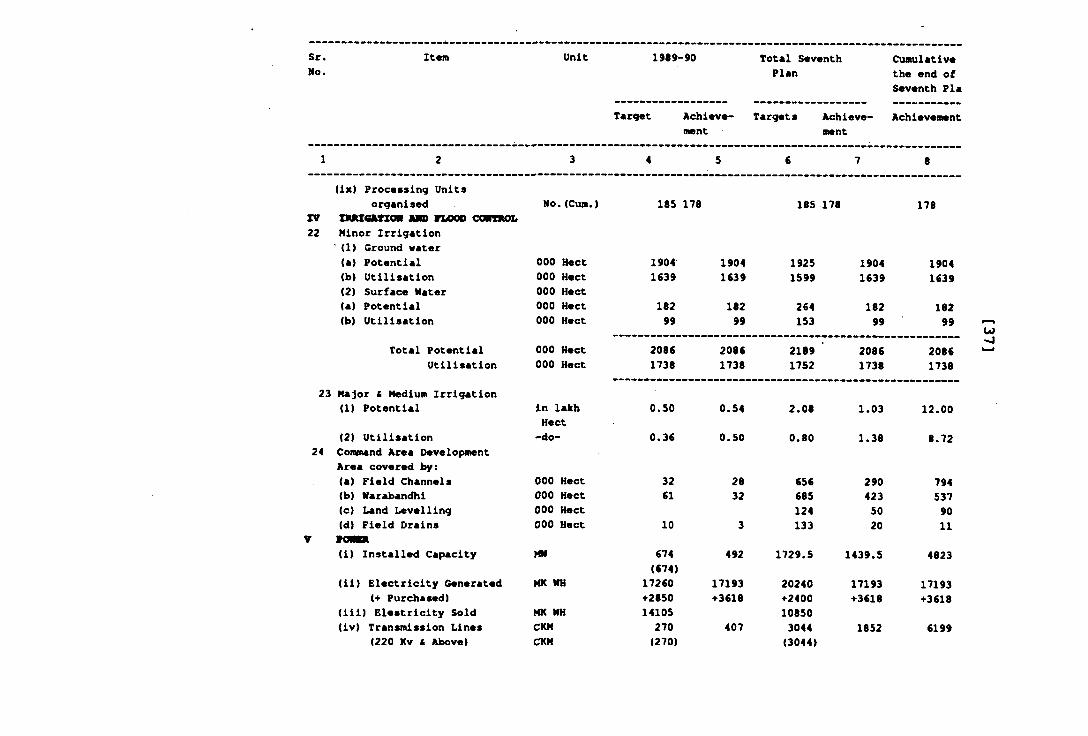
Sr.No.
Item Unit 1989-
Target
•90
Achievement
Total Seventh Plan
Targets Achievement
Cumulative the end of Seventh Pla
Achievement
1 2 3 4 5 6 7 8
(ix) Processing Units organised No.(Cum.) 185 178 185 178 178
IV22
noacurzoK m o flood cohsrolMinor Irrigation * <1) Ground water (a) Potential 000 Hect 1904 1904 1925 1904 1904(b) Utilisation 000 Hect 16 39 1639 1599 1639 1639(2) Surface Mater (a) Potential
000 Hect 000 Hect 182 182 264 182 182
(b) Utilisation 000 Hect 99 99 153 99 99
Total Potential 000 Hect 2086 2086 2189 ' 2086 2086Utilisation 000 Hect 1738 1738 1752 1738 1738
23 Major 4 Medium Irrigation (1) Potential in lakh O.SO 0.54 2.08 1.03 12.00
(2) UtilisationHect-do- 0.36 0.50 0.80 1.38 8.72
24 Coiwnand Area Development Area covered by:(a) Field Channels 000 Hect 32 28 656 290 794(b) Narabandhi 000 Hect €1 32 685 423 537(c) Land Levelling(d) Field Drains
000 Hect 000 Hect 10 3
124133
5020
9011
▼ rOMDl(i) Installed Capacity MW €74 492 1729.5 1439.5 4823
(ii) Electricity Generated MK WH(674)
17260 17193 20240 17193 17193(■f Purchased)
(iii) Elestricity Sold(iv) Transmission Lines
MK WH CKM
•• 285014105270
• 3618
407
• 2400108503044
•t-3618
1852
♦3618
6199(220 Kv t Above) CKM (270) (3044)
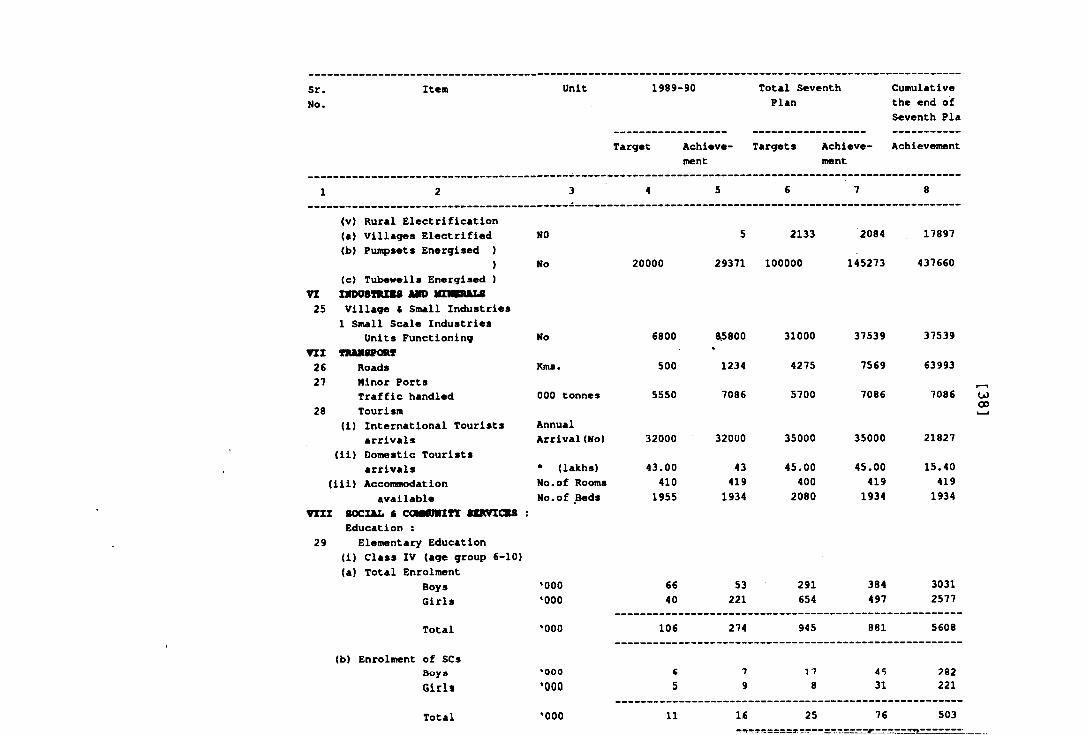
sr.No.
Item Unit 1989-90
Target Achievement
Total Seventh Plan
Targets Achievement
Cumulative the end of Seventh Pla
Achievement
1 2 3 4 5 6 7 8
(v) Rural Electrification(a) Villages Electrified(b) Pumpsets Energised )
)(c) Tubewells Energised )
V I nRKIStKZBS MID MZMDIALS25 Village & Small Industries
1 Small Scale IndustriesUnits Functioning
VIZ nuuispoRf26 Roads27 Minor Ports
Traffic handled28 Tourism
(i) International Tourists arrivals
(ii) Domestic Tourists arrivals
(iii) Accommodation available
VZZZ SOCIAL C COMIDIIZfT SERVZCB8 Education :
29 Elementary Education(i) Class IV (age group €-10) (a) Total Enrolment
Boys Girls
Total
(b) Enrolment of SCs BoysGirls
Total
NO
No
No
Kms.
000 tonnes
Annual Arrival(No)
- (laJths) No.of Rooms No.of Beds
•000•000*000
>000‘OOQ
*000
20000
5 2133 2084 17897
29371 100000 145273 437660
6800 8^800 31000 37539 37539
500 1234 4275 7569 63993
5550 7086 5700 7086 7086
32000 32000 35000 35000 21827
43.00 43 45.00 45.00 15.40410 419 400 419 4191955 1934 2080 1934 1934
66 53 291 384 303140 221 654 497 2577
106 274 945 881 5608
C 1 17 4S ?825 9 8 31 221
11 16 25 76 503
00
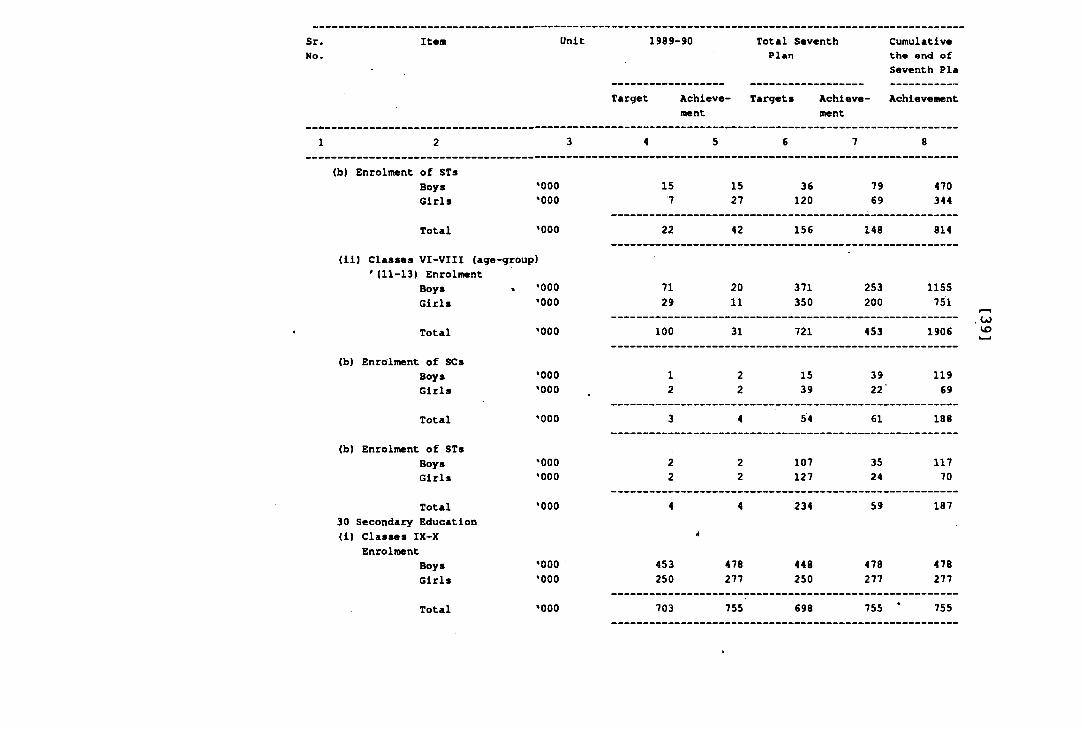
Sr.No.
Item Unit 1989-90
Target Achieve- ment
Total Seventh Plan
Targets Achievement
Ciimulative the end of Seventh Pla
Achievement
1 2 3 4 5 6 7 8
(b) Enrolment of STsBoys *000 15 15 36 79 470Girls *000 7 27 120 69 344
Total '000 22 42 156 148 814
(ii) Classes VI-VIII (age-group)' (11-13) Enrolment
Boys '000 71 20 371 253 1155Girls '000 29 11 350 200 751
Total '000 100 31 721 453 1906
(b) Enrolment of SCsBoys '000 1 2 15 39 119Girls '000 2 2 39 22 69
Total '000 3 4 54 61 188
(b) Enrolment of STsBoys '000 2 2 107 35 117Girls '000 2 2 127 24 70
Total *000 4 4 234 59 18730 Secondary Education (i) Classes IX-X
EnrolmentBoysGirls
•000•000
453250
478277
448250
478277
. U> \o
478277
Total •000 703 755 698 755 755
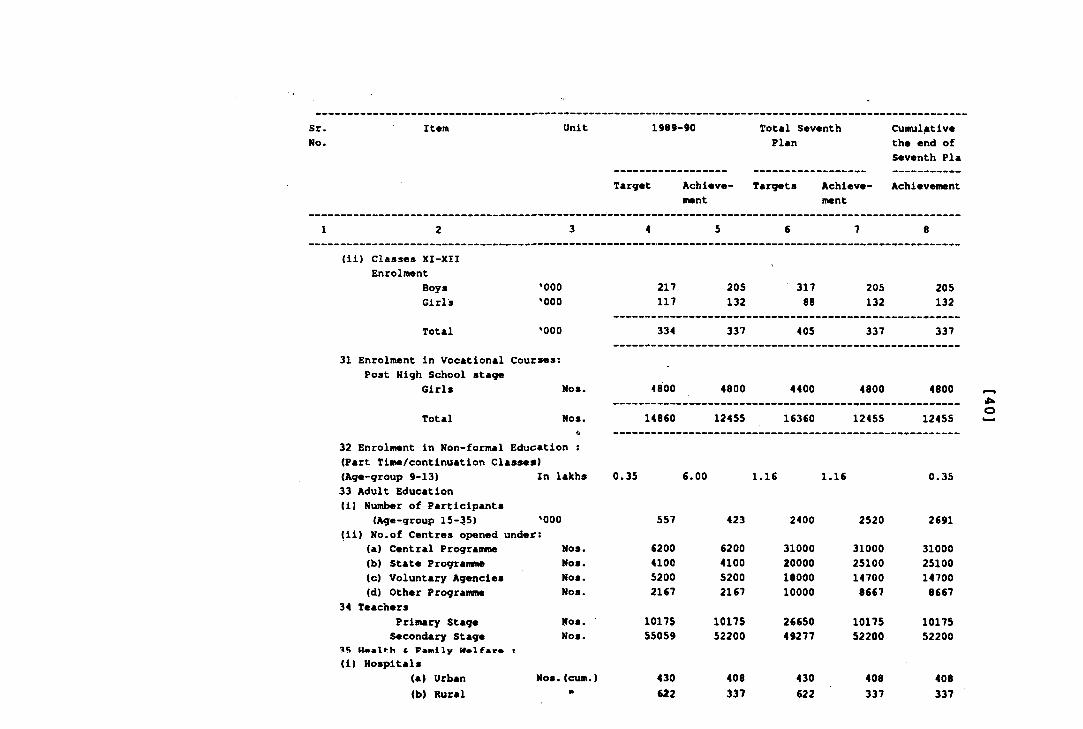
Sr.No.
Item Unit 1989>90 Total SeventhPlan
Cumulativethe end ofSeventh Pla
Target Achievement
Targets Achievement
Achievement
1 2 3 4 5 6 7 8
(ii) Classes XI-XIIEnrolment
Boys '000 217 205 317 205 205Girls '000 117 132 88 132 132
Total '000 334 337 405 337 337
31 Enrolment in Vocational Courses:Post High School stage
Girls Nos. 4800 4800 4400 4800 4800
Total Nos. 14860 12455 16360 12455 12455
32 Enrolment in Non-formal Education : (Part Time/continuation Classes) (Age-group 9-13) In la)chs 0.35 6.00 1.16 1.16 0.3533 Adult Education(i) Number of Participants
(Age-group 15-35) '000 557 423 2400 2520 2691(ii) No.of Centres opened under:
(a) Central Programme Nos. 6200 6200 31000 31000 31000(b) State Progranme Nos. 4100 4100 20000 25100 25100(c) Voluntary Agencies Nos. 5200 5200 18000 14700 14700(d) Other Progranme Nos. 2167 2167 10000 8667 8667
34 TeachersPrimary Stage Nos. 10175 10175 26650 10175 10175Secondary Stage Nos. 55059 52200 49277 52200 52200
C Pamily s(i) Hospitals
(a) Urban Nos. (c\jm.) 430 408 430 408 408(b) Rural ■ 622 337 622 337 337
•UO
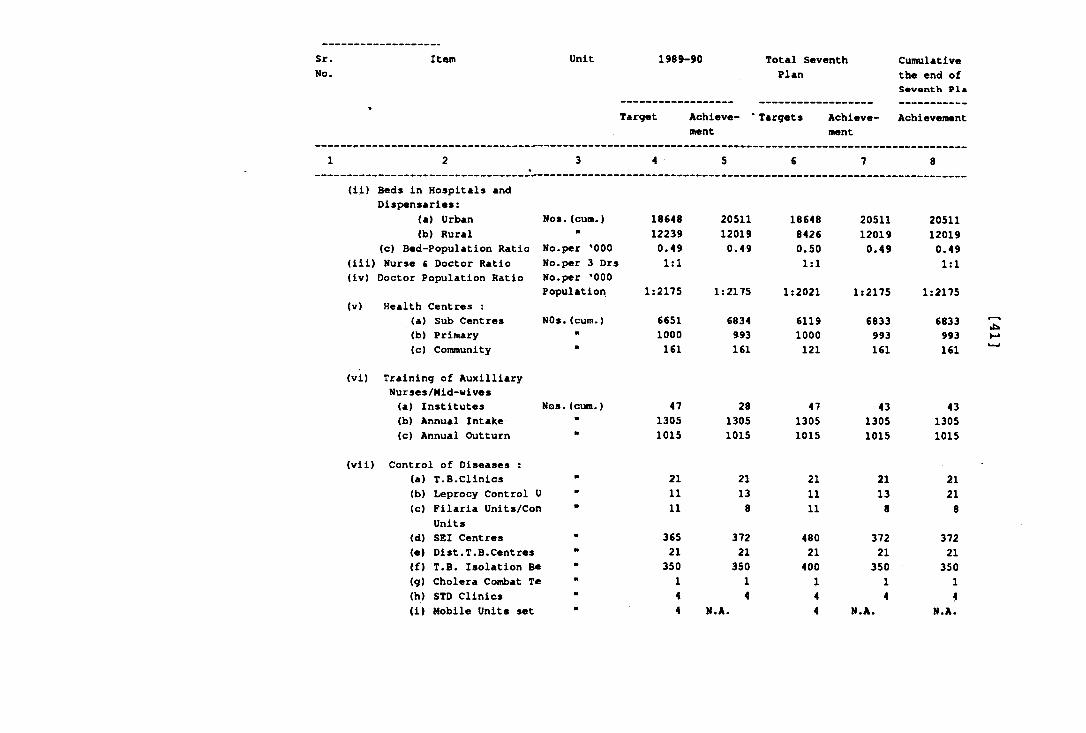
Sr.No.
Item Unit 1989-90 Total SeventhPlan
Cumulativethe end ofS«v«nth Pla
%Target Achieve- *
mentTargets Achieve
mentAchievement
1 2 3 4 5 6 7 8
(ii) Beds in Hospitals andDispensaries:
(a) Urban Nos.(cum.) 18648 20511 18648 20511 20511(b) Rural 12239 12019 8426 12019 12019
(c) Bed-Population Ratio No.per '000 0.49 0.49 0.50 0.49 0.49(iii) Nurse i Doctor Ratio No.per 3 Drs 1:1 1:1 1:1(iv) Doctor Population Ratio No.per '000
Population 1:2175 1:2175 1:2021 1:2175 1:2175(v) Health Centres ;
(a) Sub Centres NOs.(cum.) 6651 6834 6119 6833 6833 "(b) Primary " 1000 993 1000 993 993 »-*(c) Community " 161 161 121 161 161 ^
(vi) Training of AuxilliaryNurses/Mid-wives(a) Institutes Nos.(cum.) 47 28 47 43 43(b) Annual Intake ” 1305 1305 1305 1305 1305(c) Annual Outturn " 1015 1015 1015 1015 1015
(vii) Control of Diseases :(a) T.B.Clinics " 21 21 21 21 21(b) Leprocy Control U " 11 13 11 13 21(c) Filaria Units/Con • 11 8 11 8 8
Units(d) SEI Centres " 365 372 480 372 372(e) Dist.T.B.Centres " 21 21 21 21 21(f) T.B. Isolation Be 350 350 400 350 350(g) Cholera Combat Te " 1 1 1 1 1(h) STD Clinics 4 4 4 4 4(i) Mobile Units set ” 4 N.A. 4 N.A. N.A.
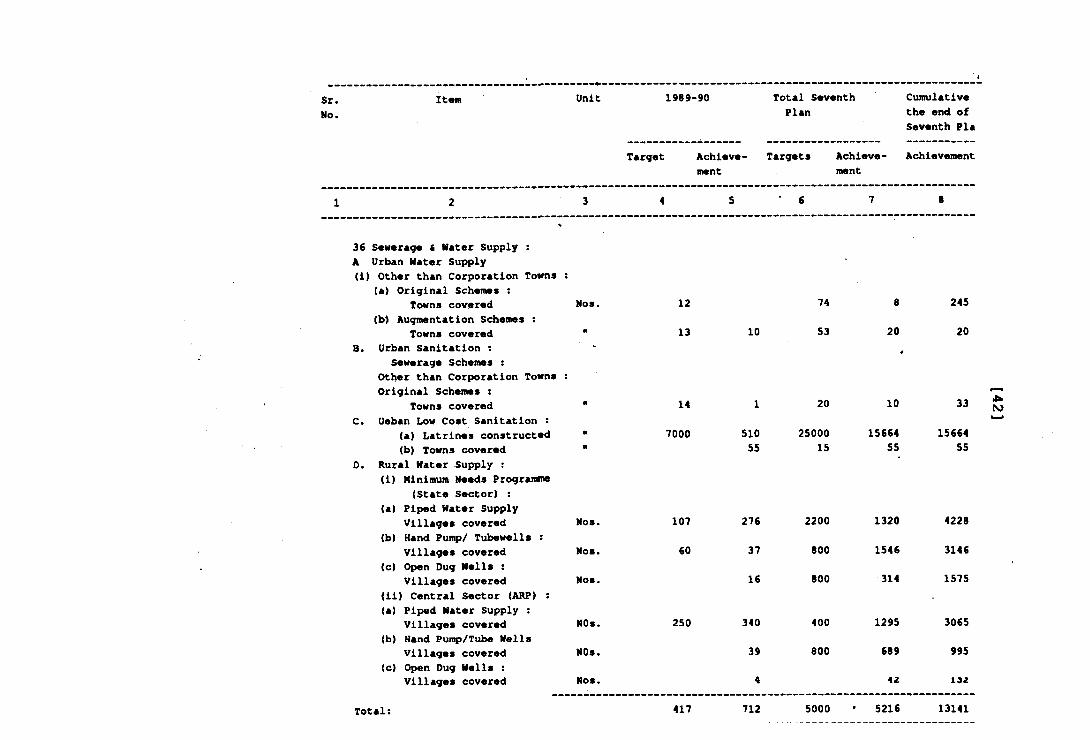
Sr. Item No.
Unit 1989-90
Target Achieve ment
1“
Total Seventh Plan
Targets Achievement
Cumulative the end of Seventh Pla
Achievement
1 2 3 4 5 6 7 8
36 Sewerage 6 Water Supply :A Urban Nater Supply(i) Other than Corporation To*ms :
(a) Original Schemes :Towns covered Nos. 12 74 8 245
(b) Augmentation Schemes :Towns covered « 13 10 53 20 20
B. Urban Sanitation :Sewerage Schemes :
Other than Corporation Towns :Original Schemes :
Towns covered m 14 1 20 10 33C. Ueban Low Cost Sanitation :
(a) Latrines constructed 7000 510 25000 15664 15664(b) Towns covered ■ 55 15 55 55
D. Rural Water Supply :(i) Minimum Needs Programme
(State Sector) :(a) Piped Water Supply
Villages covered Nos. 107 276 2200 1320 4228(b) Hand Pun^/ Tubewells :
Villages covered Nos. 60 37 800 1546 3146(c) Open Dug Wells :
Villages covered Nos. 16 800 314 1575(ii) Central Sector (ARP) :(a) Piped Water Supply :
Villages covered NOs. 250 340 400 1295 3065(b) Hand Pun^/Tube Wells
Villages covered NOs. 39 800 689 995(c) Open Dug Wells :
Villages covered Nos. 4 4 2 1 3 2
Total: 417 712 5000 5216 13141
•tkN)
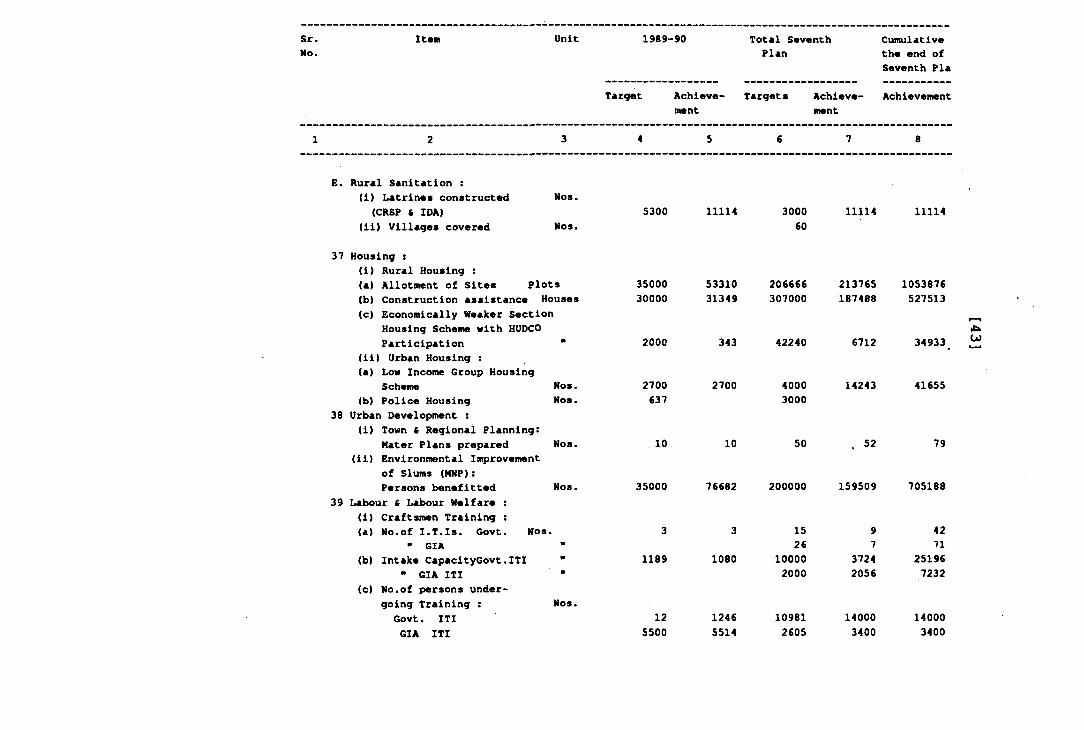
Sr.No.
It«m Unit 1989-
Target
■90
Achievement
Total Seventh Plan
Targets Achievement
Cumulative the end of Seventh Pla
Achievement
1 2 3 4 5 6 7 8
E. Rural Sanitation :(i) Latrines constructed Nos.(CRSP & IDA) 5300 11114 3000 11114 11114
(ii) Villages covered Nos. 60
37 Housing :(i) Rural Housing :<a) Allotment of Sites plots 35000 53310 206666 213765 1053876(b) Construction assistance Houses 30000 31349 307000 187488 527513(c) Economically Weaker Section
Housing Scheme with HUDCOParticipation n 2000 343 42240 6712 34933
(ii) Urban Housing :(a) Low Income Group Housing
Scheme Nos. 2700 2700 4000 14243 41655(b) Police Housing Nos. 637 3000
38 Urban Development :(i) Town & Regional Planning:
Mater Plans prepared Nos. 10 10 50 . 52 79(ii) Environmental Improvement
of Slums (MNP):Persons benefitted Nos. 35000 76682 200000 159509 705188
39 Labour & Labour Welfare :(i) Craftsmen Training :(a) No.of I.T.Is. Govt. Nos . 3 3 15 9 42
• GIA II 26 7 71(b) Intake CapacityGovt.ITI II 1189 1080 10000 3724 25196
• GIA ITI m 2000 2056 7232(c) No.of persons under
going Training : Nos.Govt. ITI 12 1246 10981 14000 14000GIA ITI 5500 5514 2605 3400 3400
•tkCO
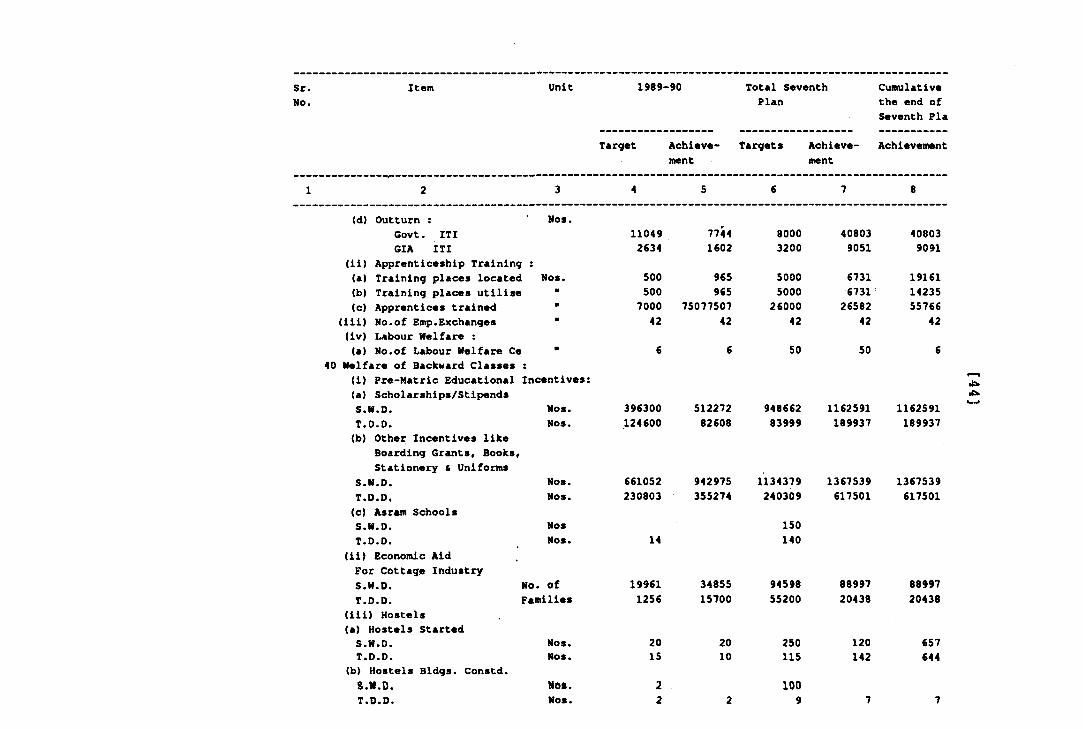
Sr. Item No.
Unit 1989*
Target
-90
Achievement
Total Seventh Plan
Targets Achievement
Cumulative the end of Seventh Pla
Achievement
1 2 3 4 5 6 7 8
(d) Outturn :Govt. ITI
Nos.11049 7744 8000 40803 40803
GIA ITI 2634 1602 3200 9051 9091(ii) Apprenticeship Training : (a) Training places located Nos. 500 965 5000 6731 19161(b) Training places utilise m 500 965 5000 6731 14235(c) Apprentices trained m 7000 75077507 26000 26582 55766
(iii) No.of Emp.Exchanges m 42 42 42 42 42(iv) Labour Welfare :(a) No.of Labour Welfare Ce m 6 6 50 50 6
40 Welfare of Backward Classes :(i) Pre-Matric Educational Incentives; (a) Scholarships/Stipends S.W.D. Nos. 396300 512272 948662 1162591 1162591T.D.D. Nos. 124600 82608 83999 189937 189937(b) Other Incentives like
Boarding Grants, Books, Stationery S Uniforms
S.W.D. Nos. 661052 942975 1134379 1367539 1367539T.D.D, Nos. 230803 355274 240309 617501 617501(c) Asram Schools S.W.D.T.D.D.
(ii) Economic Aid For Cottage Industry S.W.D. No.
NosNos.
of
14
19961 34855
150140
94598 88997 88997T.D.D. Families 1256 15700 55200 20438 20438
(iii) Hostels (a) Hostels Started S.W.D. Nos. 20 20 250 120 657T.D.D. Nos. 15 10 115 142 644
(b) Hostels Bldgs. Constd. S.H.D.T.D.D.
Not.Nos.
22 2
1009 7 7
8TMSMMMMT - ZZZ
lUOl
The details regarding statements III-A, III-B,III-C, and III-D are available in the respective sectoral material furnished separately
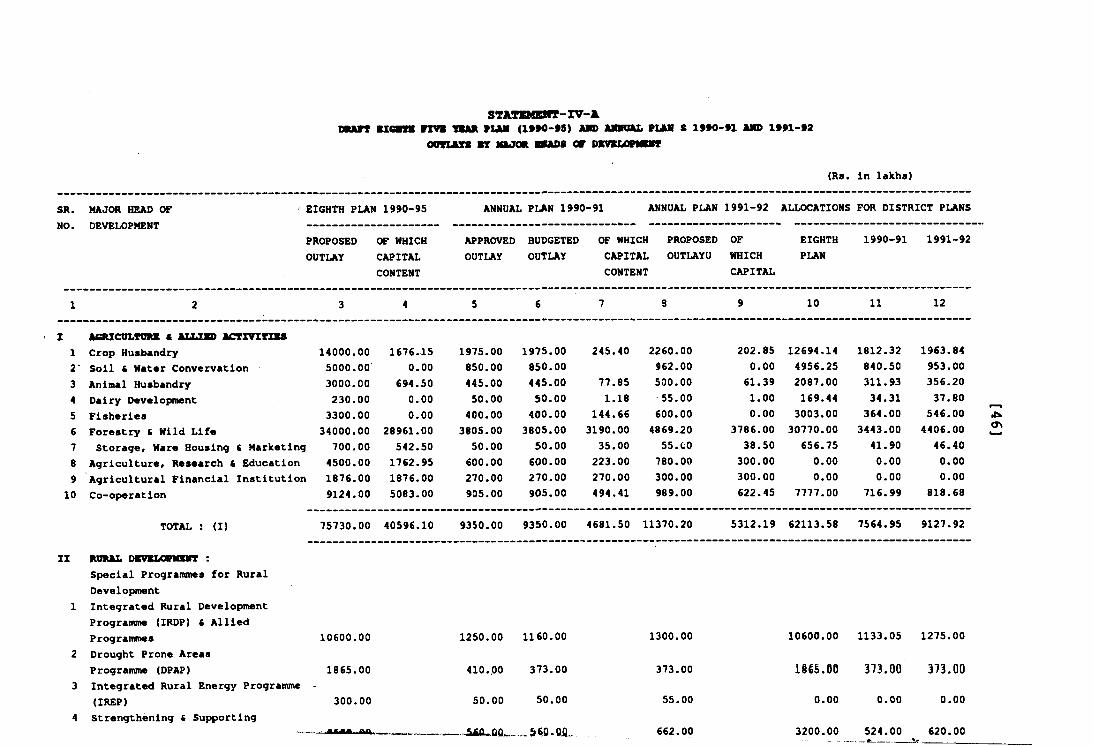
STATEMBMT-IV-ADMtff Bxoan rzvi txak »iam (i»fo*fS) m junraax. fl»h s i990>91 and 1991-»2
o o T u a n BT mJOR bbju>s or dsvslopmht
(Rs. in lakhs)
SR. MAJOR HEAD OF NO. DEVELOPMENT
EIGHTH PLAN 1990-95
PROPOSED OF WHICH OUTLAY CAPITAL
CONTENT
ANNUAL PLAN 1990-91 ANNUAL PLAN 1991-92 ALLOCATIONS FOR DISTRICT PLANS
APPROVED BUDGETED OF WHICH PROPOSED OFOUTLAY OUTLAY CAPITAL OUTLAYU WHICH
EIGHTHPLAN
1990-91 1991-92
CONTENT CAPITAL
1 2 3 4 5 6 7 8 9 10 11 12
ACRZCULTOMC S KLLTKD ACTXVZTXB81 Crop Husbandry 14000.00 1676.15 1975.00 1975.00 245.40 2260.00 202.85 12694.14 1812.32 1963.842- Soil fi Water Convervation 5000.00 0.00 850.00 850.00 962.00 0.00 4956.25 840.50 953.003 Animal Husbandry 3000.00 694.50 445.00 445.00 77.85 530.00 61.39 2087.00 311.93 356.204 Dairy Development 230.00 0.00 50.00 50.00 1.18 55.00 1.00 169.44 34.31 37.805 Fisheries 3300.00 0.00 400.00 400.00 144.66 600.00 0.00 3003.00 364.00 546.006 Forestry & Wild Life 34000.00 28961.00 3805.00 3805.00 3190.00 4869.20 3786.00 30770.00 3443.00 4406.00 ONl_47 Storage, Ware Housing ft Marketing 700.00 542.50 50.00 50.00 35.00 55.to 38.50 656.75 41.90 46.408 Agriculture, Research ft Education 4500.00 1762.95 600.00 600.00 223.00 780.00 300.00 0.00 0.00 0.009 Agricultural Financial Institution 1876.00 1876.00 270.00 270.00 270.00 300.00 300.00 0.00 0.00 0.0010 Co-operation 9124.00 5083.00 905.00 905.00 494.41 989.00 622.45 7777.00 716.99 818.68
TOTAL ; (I) 75730.00 40596.10 9350.00 9350.00 4681.50 11370.20 5312.19 62113.58 7564.95 9127.92
IX RORAL DBVKLOmBMT :Special Prograimnes for Rural Development
1 Integrated Rural Development Programme (IRDP) fi Allied Programmes
2 Drought Prone Areas Programme (DPAP)
3 Integrated Rural Energy Programme (IREP)
4 Strengthening 6 Supporting
10600.00
1865.00
300.00
1250.00 1160.00
410.00 373.00
50.00 50.00
1300.00
373.00
55.00
662.00
10600.00 1133.05 1275.00
1565.00 373.00 373.00
0.00 0.00 0.00
3200.00 524.00 620.00
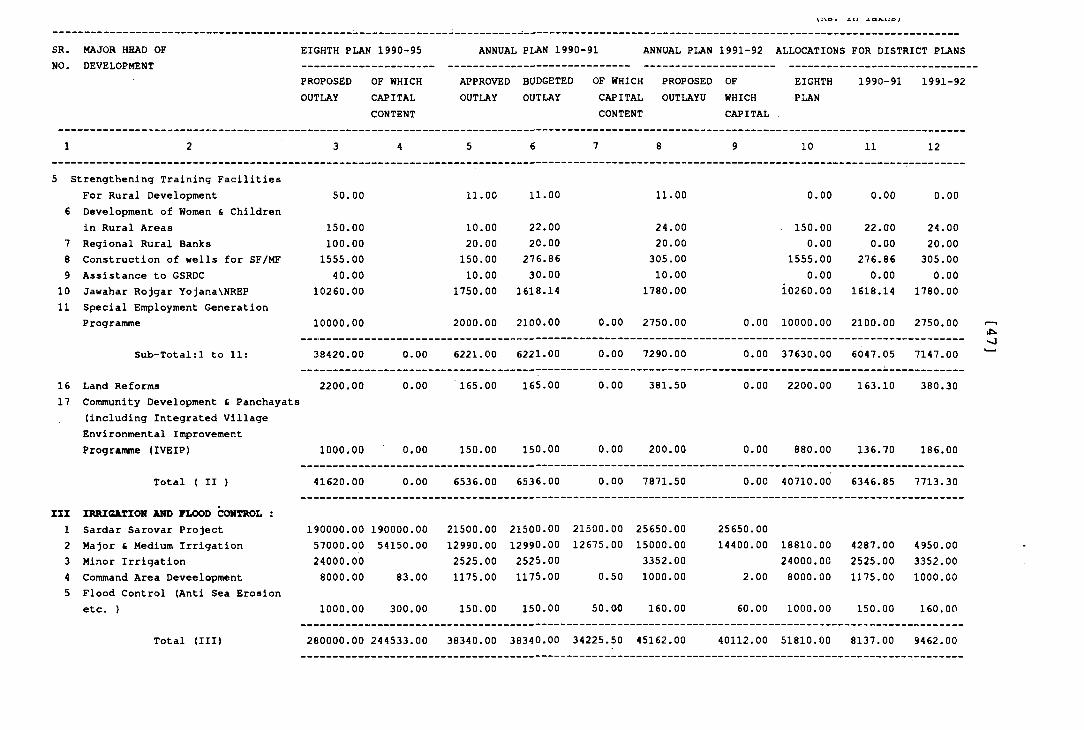
JL C3liVil0 /
SR. MAJOR HEAD OF EIGHTH PLAN 1990-95 ANNUAL PLAN 1990-91 ANNUAL PLAN 1991-92 ALLOCATIONS FOR DISTRICT PLANSNO. DEVELOPMENT
PROPOSEDOUTLAY
OF WHICHCAPITALCONTENT
APPROVED BUDGETED OF WHICH PROPOSED OUTLAY OUTLAY CAPITAL OUTLAYU
CONTENT
OFWHICHCAPITAL
EIGHTHPLAN
1990-91 1991-92
1 2 3 4 5 6 7 8 9 10 11 12
5 Strengthening Training FacilitiesFor Rural Development 50.00 11.00 11.00 11.00 0.00 0.00 0.00
6 Development of Women 6 Childrenin Rural Areas 150.00 10.00 22.00 24.00 . 150.00 22.00 24.00
7 Regional Rural Banks 100.00 20.00 20.00 20.00 0.00 0.00 20.008 Construction of wells for SF/MF 1555.00 150.00 276.86 305.00 1555.00 276.86 305.009 Assistance to GSRDC 40.00 10.00 30.00 10.00 0.00 0.00 0.00
10 Jawahar Rojgar Yojana\NREP 10260.00 1750.00 1618.14 1780.00 i 026 0 . 00 1618.14 1780.0011 Special Employment Generation
Programme 10000.00 2000.00 2100.00 0.00 2750.00 0.00 10000.00 2100.00 2750.00
Sub-Total;! to 11: 38420.00 0.00 6221.00 6221.00 0.00 7290.00 0.00 37630.00 6047.05 7147.00
16 Land Reforms 2200.00 0.00 165.00 165.00 0.00 381.50 0.00 2200.00 163.10 380.3017 Community Development & Panchayats
(including Integrated VillageEnvironmental ImprovementProgramme (IVEIP) 1000.00 0.00 150.00 150.00 0.00 200.00 0.00 880.00 136.70 186.00
Total ( II ) 41620.00 0.00 6536.00 6536.00 0.00 7871.50 0.00 40710.00 6346.85 7713.30
III IRRIGATION AND FLOOD CONTROL :1 Sardar Sarovar Project 190000.00 190000.00 21500.00 21500.00 21500.00 25650.00 25650.002 Major & Medium Irrigation 57000.00 54150.00 12990.00 12990.00 12675.00 15000.00 14400.00 18810.00 4287.00 4950.003 Minor Irrigation 24000.00 2525.00 2525.00 3352.00 24000.00 2525.00 3352.004 Command Area Deveelopment 8000.00 83.00 1175.00 1175.00 0.50 1000.00 2.00 8000.00 1175.00 1000.005 ■Flood Control (Anti Sea Erosion
etc. ) 1000.00 300.00 150.00 150.00 50.00 160.00 60.00 1000.00 150.00 160.00
Total (III) 260000.00 244533.00 38340.00 38340.00 34225.50 45162.00 40112.00 51810.00 8137.00 9462.00
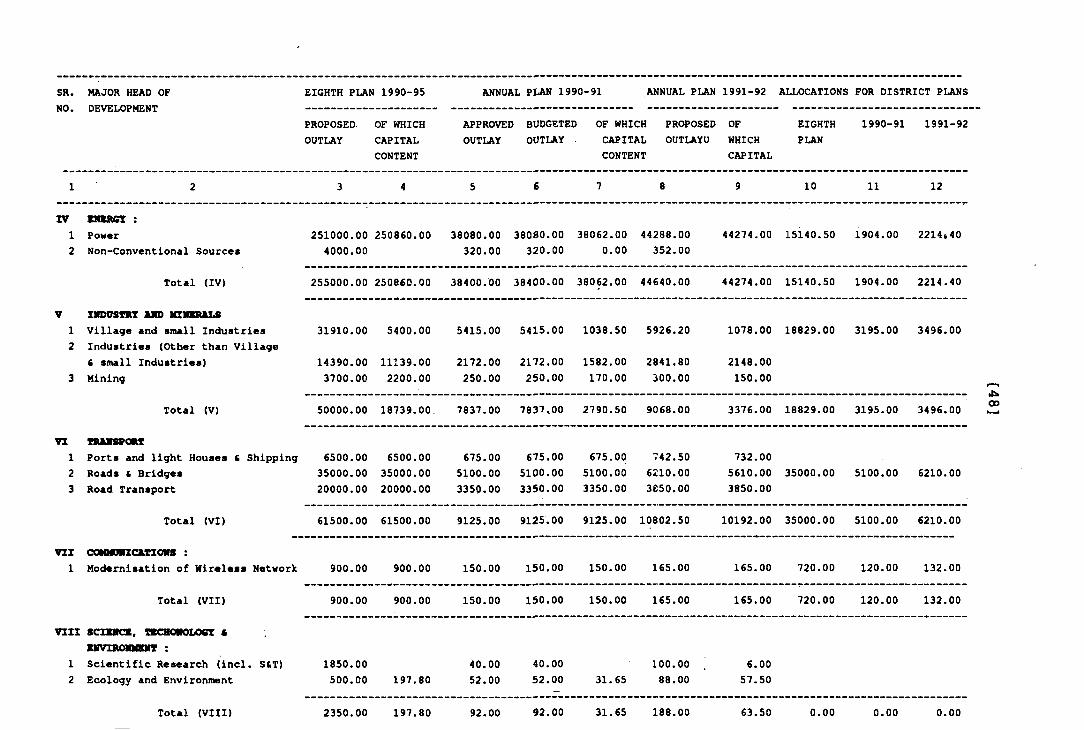
SR. MAJOR HEAD OF EIGHTH PLAN 1990-95 ANNUAL PLAN 1990-91 ANNUAL PLAN 1991-92 ALLOCATIONS FOR DISTRICT PLANS
PROPOSEDOUTLAY
OF WHICHCAPITALCONTENT
APPROVED BUDGETED OF WHICH PROPOSED OUTLAY OUTLAY • CAPITAL OUTLAYU
CONTENT
OFWHICHCAPITAL
EIGHTHPLAN
1990-91 1991-92
1 2 3 4 5 6 7 8 9 10 11 12
IV1
BMBRCT :Power 251000.00 250860.00 38080.00 38080.00 38062.00 44288.00 44274.00 15140.50 1904.00 2214*40
2 Non-Conventional Sources 4000.00 320.00 320.00 0.00 352.00
Total (IV) 255000.00 250860.00 38400.00 38400.00 38062.00 44640.00 44274.00 15140.50 1904.00 2214.40
V ZMDUSTRT AMD MZlllMa.81 Village and small Industries2 Industries (Other than Village
£ snuill Industries)3 Mining
Total (V)
VI TMUmORt1 Ports and light Houses £ Shipping2 Roads & Bridges3 Road Transport
Total (VI)
VIZ COMHOHZOITZOHS :1 Modernisation of Wireless Network
Total (VII)
31910.00 5400.00 5415.00 5415.00 1038.50 5926.20
14390.00 11139.003700.00 2200.00
50000.00 18739.00
6500.00 6500.0035000.00 35000.002 0 0 0 0 .0 0 2 0 0 0 0 .0 0
61500.00 61500.00
2172.00 2172.00 1582.00 2841.80250.00 250.00 170.00 300.00
7837.00 7837,00 2790.50 9068.00
675.00 675.00 675.00 742.505100.00 5100.00 5100.00 6210.003350.00 3350.00 3350.00 3850.00
9125.00 9125.00 9125.00 10802.50
900.00 900.00 150.00 150.00 150.00 165.00
900.00 900.00 150.00 150.00 150.00 165.00
1078.00 18829.00 3195.00 3496.00
2148.00150.00
3376.00 18829.00 3195.00 3496.00
732.005610.00 35000.00 5100.00 6210.003850.00
10192.00 35000.00 5100.00 6210.00
165.00 720.00 120.00 132.00
165.00 720.00 120.00 132.00
00
VIII SCIXMCX, IBCBONOX.OCT C BMVIROIIMBIIY :
1 Scientific Research (incl. SST)2 Ecology and Environment
Total (VIII)
1850.00500.00 197.80
2350.00 197.80
40.0052.00
92.00
40.0052.00
92.00
100.0031.65 88.00
31.65 188.00
6.0057.50
63.50 0.00 0.00 0.00
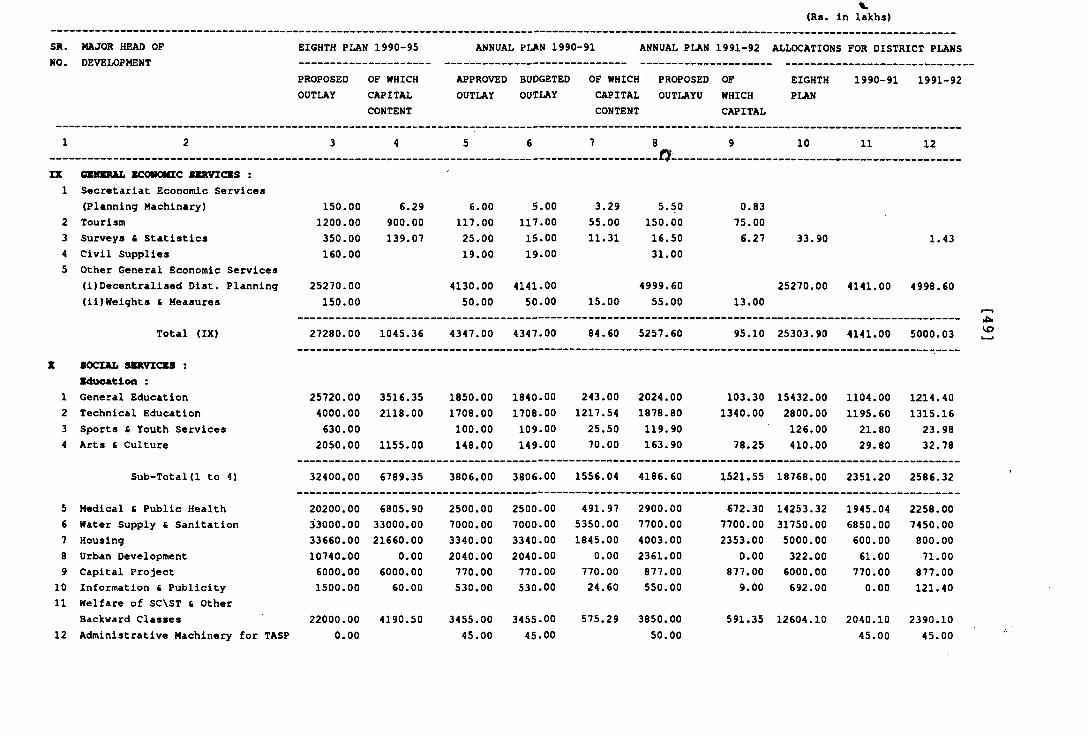
(Rs. in lakhs)
SR. MAJOR HEAD OF EIGHTH PLAN 1990-95 ANNUAL PLAN 1990-91 ANNUAL PLAN 1991-92 ALLOCATIONS FOR DISTRICT PLANSNO. DEVELOPMENT
PROPOSED OF WHICH APPROVED BUDGETED OF WHICH PROPOSED OF EIGHTH 1990-91 1991-92OUTLAY CAPITAL
CONTENTOUTLAY OUTLAY CAPITAL OUTLAYU
CONTENTWHICHCAPITAL
PLAN
1 2 3 4 5 6 7 8____n _____
9 10 11 12
IX caaaeRAL KCONoac skrvzcis :1 Secretariat Economic Services
(Planning Machinary) 150.00 6.29 6.00 5.00 3,29 5.50 0.832 Tourism 1200.00 900.00 117.00 117.00 55.00 150.00 75.003 Surveys « Statistics 350.00 139.07 25.00 15.00 11.31 16.50 6.27 33.90 1.434 Civil Supplies 160.00 19.00 19.00 31.005 Other General Economic Services
(i)Decentralised Dist. Planning 25270.00 4130.00 4141.00 4999.60 25270.00 4141.00 4998.60(ii)Weights « Measures 150.00 50.00 50.00 15.00 55.00 13.00
Total (IX) 27280.00 1045.36 4347.00 4347.00 84.60 5257.60 95.10 25303.90 4141.00 5000.03
X SOCXAL SBRVICIS : Iduoatlon :
1 General Education 25720.00 3516.35 1850.00 1840.00 243.00 2024.00 103.30 15432.00 1104.00 1214.402 Technical Education 4000.00 2118.00 1708.00 1708.00 1217.54 1878.80 1340.00 2800.00 1195.60 1315.163 Sports t Youth Services 630.00 100.00 109.00 25.50 119.90 126.00 21.80 23.984 Arts £ Culture 2050.00 1155.00 148.00 149.00 70.00 163.90 78.25 410.00 29.80 32.78
Sub-Total(1 to 4) 32400.00 6789.35 3806.00 3806.00 1556.04 4186.60 1521.55 18768.00 2351.20 2586.32
5 Medical fi Public Health 20200.00 6805.90 2500.00 2500.00 491.97 2900.00 672.30 14253.32 1945.04 2258.006 Water Supply & Sanitation 33000.00 33000.00 7000.00 7000.00 5350.00 7700.00 7700.00 31750.00 6850.00 7450.007 Housing 33660.00 21660.00 3340.00 3340.00 1845.00 4003.00 2353.00 5000.00 600.00 800.008 Urban Development 10740.00 0.00 2040.00 2040.00 0.00 2361.00 0.00 322.00 61.00 71.009 Capital Project 6000.00 6000.00 770.00 770.00 770.00 877.00 877.00 6000.00 770.00 877.00
10 Information £ Publicity 1500.00 60.00 530.00 530.00 24.60 550.00 9.00 692.00 0.00 121.4011 Welfare of SC\ST & Other
Backward Classes 22000.00 4190.50 3455.00 3455.00 575.29 3850.00 591.35 12604.10 2040.10 2390.1012 Administrative Machinery for TASP 0.00 45.00 45.00 50.00 45.00 45.00
VO
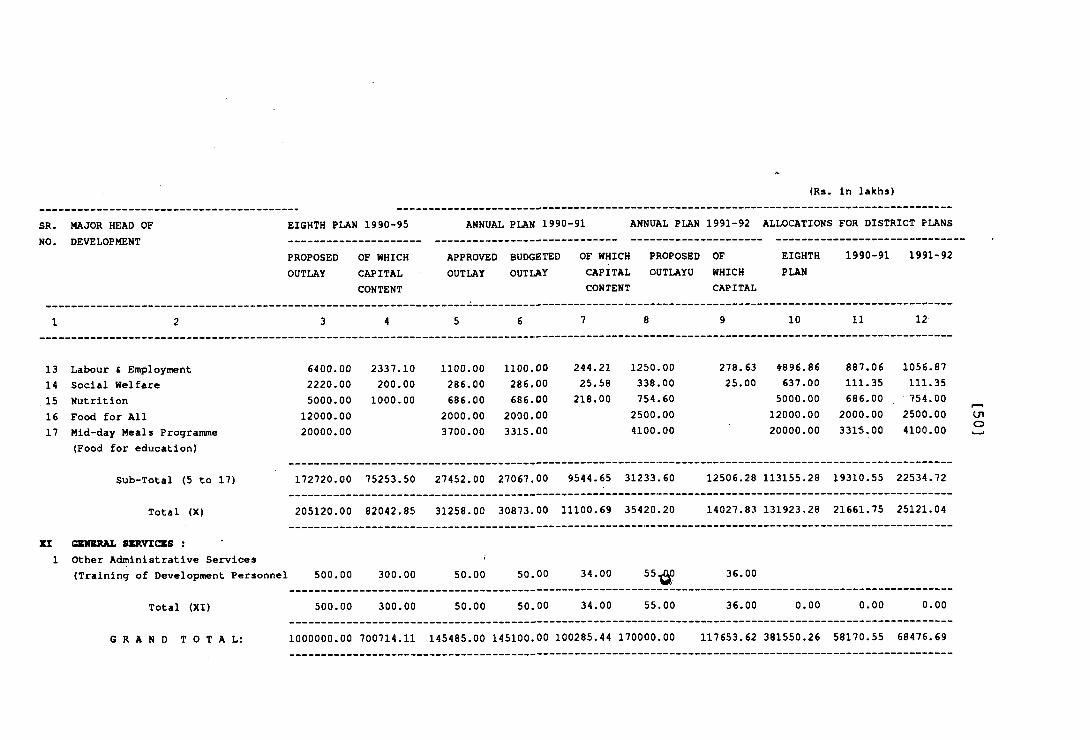
SR. MAJOR HEAD OF EIGHTH PLAN 1990-95 ANNUAL PLAN 1990-91 ANNUAL PLAN 1991-92 ALLOCATIONS FOR DISTRICT PLANS
(Rs. In lakhs)
NO. DEVELOPMENTPROPOSEDOUTLAY
OF WHICHCAPITALCONTENT
APPROVED BUDGETED OF WHICH PROPOSED OUTLAY OUTLAY CAPITAL OUTLAYU
CONTENT
OFWHICHCAPITAL
EIGHTHPLAN
1990-91 1991-92
1 2 3 4 5 6 7 8 9 10 11 12
13141516 17
Labour C EmploymentSocial WelfareNutritionFood for AllMid-day Meals Programme(Food for education)
6 4 0 0 .0 0
2220.00 5000.0012000.0020000.00
2337.10200.001000.00
1100.00286.00686.00
2000.003700.00
1100.00286.00686.002000.003315.00
244.2125.58218.00
1250.00 338.00 754.60
2500.004100.00
278.6325.00
4896.86637.005000.0012000.0020000.00
887.06111.35686.00
2000.003315.00
1056.87111.35754.002500.004100.00
Sub-Total (5 to 17) 172720.00 75253.50 27452.00 27067.00 9544.65 31233.60 12506.28 113155.28 19310.55 22534.72
Total (X) 205120.00 82042.85 31258.00 30873.00 11100.69 35420.20 14027.83 131923.28 21661.75 25121.04
XI1
GSMBRAL SERVICKS :Other Administrative Services(Training of Development Personnel 500.00 300.00 50.00 50.00 34.00 5 5 ^ 36.00
Total (XI) 500.00 300.00 50.00 50.00 34.00 55.00 36.00 0.00 0.00 0.00
G R A N D T O T A L : 1000000.00 700714.11 145485.00 145100.00 100285.44 170000.00 117653.62 381550.26 58170.55 68476.69
cno
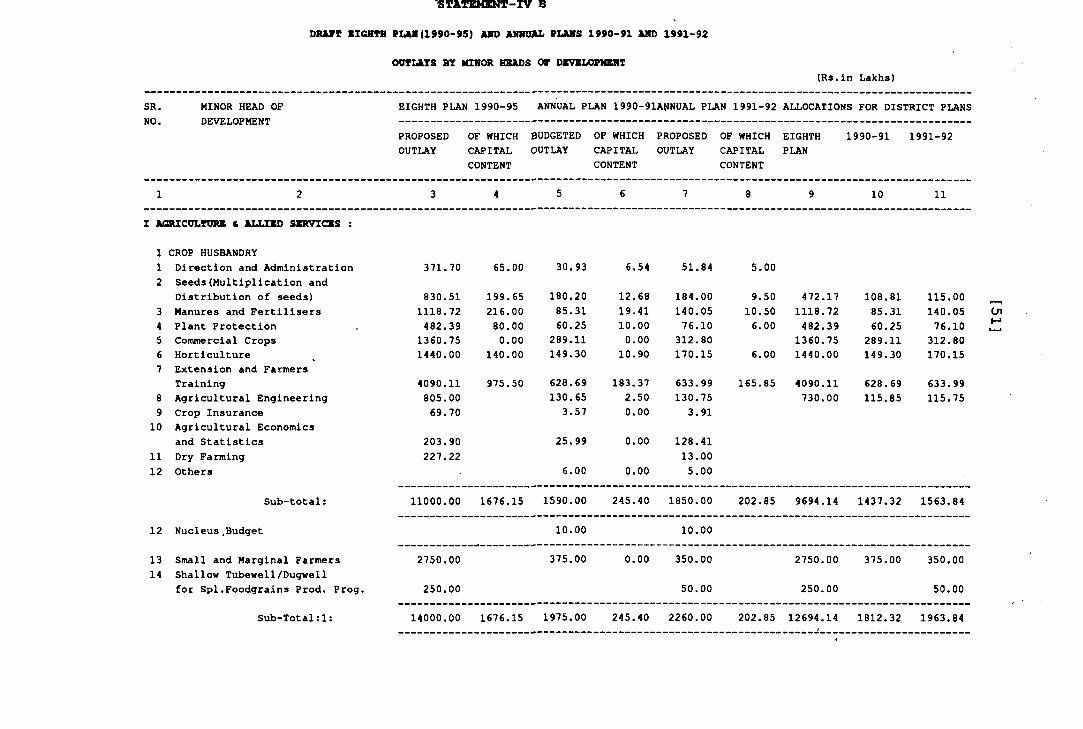
Sl'ATEMENT-lV B DRAFT II6BTH PLAM(1990-95) AND AmiDJU:. PLANS 1990-91 AND 1991-92
OUTLAYS BY MIN<» BEADS OF DKVKLOPMENT(Rs.ln Lakhs)
SR. MINOR HEAD OFni?\n?T ADlUflT'M'P
EIGHTH PLAN 1990-95 ANNUAL PLAN 1990-91ANNUAL PLAN 1991-92 ALLOCATIONS FOR DISTRICT PLANSTi\Jm Uc«Vc«liUirn£fri I
PROPOSEDOUTLAY
OF WHICHCAPITALCONTENT
BUDGETEDOUTLAY
OF WHICHCAPITALCONTENT
PROPOSEDOUTLAY
OF WHICHCAPITALCONTENT
EIGHTHPLAN
1990-91 1991-92
1 2 3 4 5 6 7 8 9 10 11
I AGRICULTORI C ALLIBD SSRVICKS :
1 CROP HUSBANDRY1 Direction and Administration2 Seeds(Multiplication and
Distribution of seeds)3 Manures and Fertilisers4 Plant Protection5 Comnvercial Crops6 Horticulture7 Extension and Farmers
Training8 Agricultural Engineering9 Crop Insurance10 Agricultural Economics
and Statistics11 Dry Farming12 Others
Sub-total:
12 Nucleus ,Budget
13 Small and Marginal Farmers14 Shallow Tubewell/Dugwell
for Spl.Foodgrains Prod. Prog.
Sub-Total:1:
371.70 65.00 30.93 6.54 51.84 5.00
830.51 199.65 180.20 12.68 184.00 9.50 472.17 108.81 115.00 fi 11118.72 216.00 85.31 19.41 140.05 10.50 1118.72 85.31 140.05 (Jl482.39 80.00 60.25 10.00 76.10 6.00 482.39 60.25 76.10 M1360.75 0.00 289.11 0.00 312.80 1360.75 289.11 312.801440.00 140.00 149.30 10.90 170.15 6.00 1440.00 149.30 170.15
4090.11 975.50 628.69 183.37 633.99 165.85 4090.11 628.69 633.99805.00 130.65 2.50 130.75 730.00 115.85 115.7569.70 3.57 0.00 3.91
203.90 25.99 0.00 128.41227.22 13.00
6.00 0.00 5.00
11000.00 1676.15 1590.00 245.40 1850.00 202.85 9694.14 1437.32 1563.84
2750.00
250.00
14000.00
10.00
375.00 0.00
1676.15 1975.00 245.40
10.00
350.00
50.00
2260.00
2750.00 375.00 350.00
250.00 50.00
202.85 12694.14 1812.32 1963.84
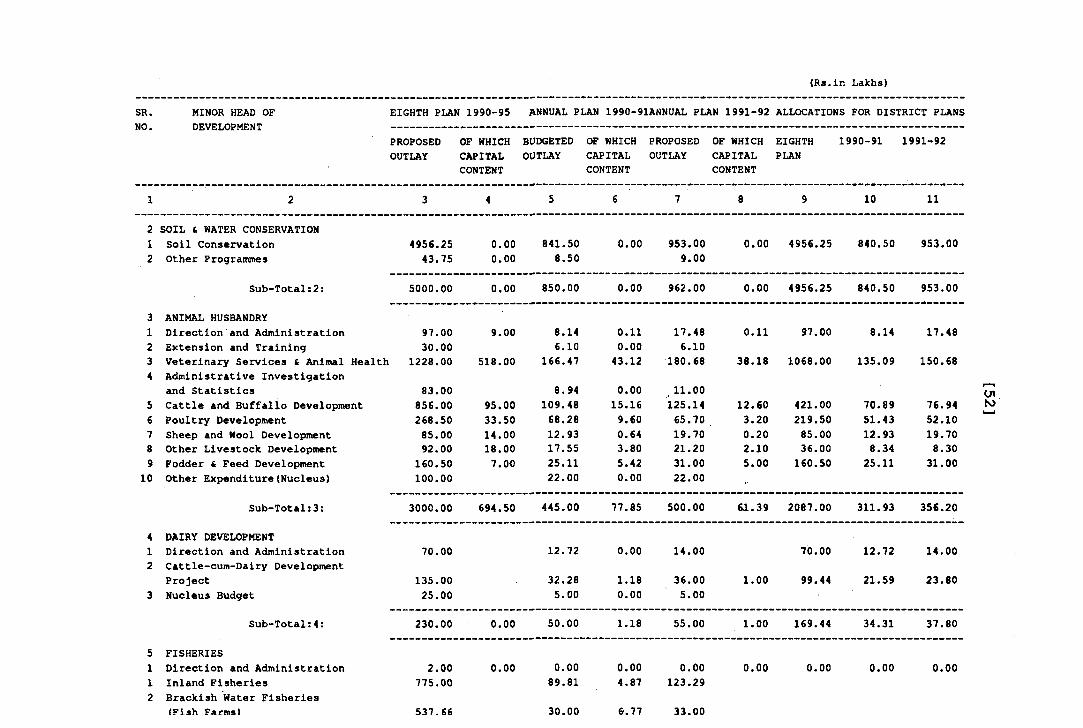
SR.MO.
MINOR HEAD OF DEVELOPMENT
EIGHTH PLAN 1990-95 ANNUAL PLAN 1990-91ANNUAL PLAN 1991-92 ALLOCATIONS FOR DISTRICT PLANS
PROPOSEDOUTLAY
OF WHICHCAPITALCONTENT
BUDGETEDOUTLAY
OF WHICHCAPITALCONTENT
PROPOSEDOUTLAY
OF WHICHCAPITALCONTENT
EIGHTHPLAN
1990-91 1991-92
1 2 3 4 5 6 7 8 9 10 11
2 SOIL & WATER CONSERVATION1 Soil Conservation 4956.25 0.00 841.50 0.00 953.00 0.00 4956.25 840.50 953.002 Other Progranunes 43.75 0.00 8.50 9.00
Sub-Total;2; 5000.00 0.00 850.00 0.00 962.00 0.00 4956.25 840.50 953.00
3 ANIMAL HUSBANDRY1 Direction and Administration 97.00 9.00 8.14 0.11 17.48 0.11 97.00 8.14 17.482 Extension and Training 30.00 6.10 0.00 6.103 Veterinary Seirvices £ Animal HealthI 1228.00 518.00 166.47 43.12 180.68 38.18 1068.00 135.09 150.684 Administrative Investigation
and Statistics 83.00 8.94 0.00 ^11.00 cn5 Cattle and Buffallo Development 856.00 95.00 109.48 15.16 125.14 12.60 421.00 70.89 76.94 ^6 Poultry Development 268.50 33.50 68.28 9.60 65.70 3.20 219.50 51.43 52.10 ^7 Sheep and Wool Development 85.00 14.00 12.93 0.64 19.70 0.20 85.00 12.93 19.708 Other Livestock Development 92.00 18.00 17,55 3.80 21.20 2.10 36.00 8.34 8.309 Fodder £ Feed Development 160.50 7.00 25.11 5.42 31.00 5.00 160.50 25.11 31.00
10 Other Expenditure(Nucleus) 100.00 22.00 0.00 22.00
Sub-Total:3: 3000.00 694.50 445.00 77.85 500.00 61.39 2087.00 311.93 356.20
4 DAIRY DEVELOPMENT1 Direction and Administration 70.00 12.72 0.00 14.00 70.00 12.72 14.002 Cattle-cum-Dairy Development
Project 135.00 32.28 1.18 36.00 1.00 99.44 21.59 23.803 Nucleus Budget 25.00 5.00 0.00 5.00
Sub-Total:4: 230.00 0.00 50.00 1.18 55.00 1.00 169.44 34.31 37.80
5 FISHERIES1 Direction and Administration 2.00 0.00 0.00 0.00 0.00 0.00 0.00 0.00 0.001 Inland Fisheries 775.00 89.81 4.87 123.292 Brackish Water Fisheries
(Fish Farms) 537.66 30.00 6.77 33.00
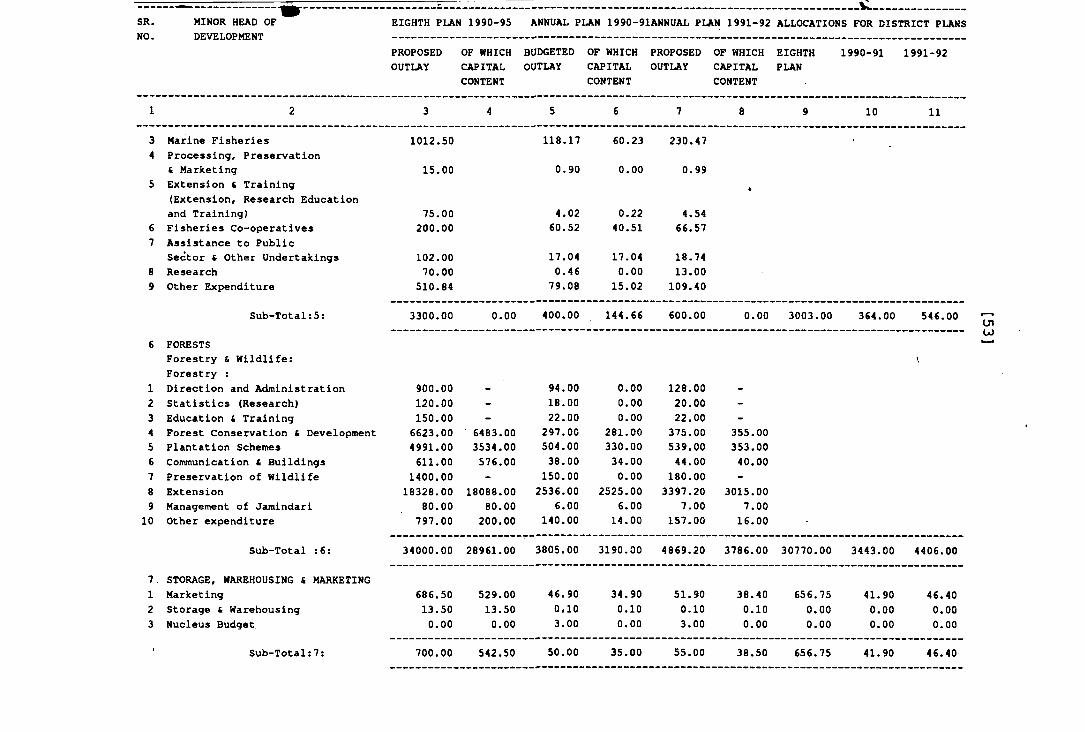
SR. MINOR HEAD OF EIGHTH PLAN 1990-95 ANNUAL PLAN 1990-91ANNUAL PLAN 1991-92 ALLOCATIONS FOR DISTRICT PLANSNO. DEVELOPMENT
PROPOSEDOUTLAY
OF WHICHCAPITALCONTENT
BUDGETEDOUTLAY
OF WHICHCAPITALCONTENT
PROPOSEDOUTLAY
OF WHICHCAPITALCONTENT
EIGHTHPLAN
1990-91 1991-92
1 2 3 4 5 6 7 8 9 10 11
3 Marine Fisheries 1012.50 118.17 60.23 230.47 -4 Processing, Preservation
( Marketing 15.00 0.90 0.00 0.995 Extension £ Training
(Extension, Research Educationand Training) 75.00 4.02 0.22 4.54
6 Fisheries Co-operatives 200.00 60.52 40.51 66.577 Assistance to Public
Sector i Other Undertakings 102.00 17.04 17.04 18.748 Research 70.00 0.46 0.00 13.009 Other Expenditure 510.84 79.08 15.02 109.40
Sub-Total:5; 3300.00 0.00 400.00 144.66 600.00 0.00 3003.00 364.00 546.00
6 FORESTSForestry & Wildlife:Forestry ;
1 Direction and Administration 900.00 - 94.00 0.00 128.00 -2 Statistics (Research) 120.00 - 18.00 0.00 20.00 -3 Education £ Training 150.00 - 22.00 0.00 22.00 -4 Forest Conservation C Development 6623.00 6483.00 297.00 281.00 375.00 355.005 Plantation Schemes 4991.00 3534.00 504.00 330.00 539.00 353.006 Communication £ Buildings 611.00 576.00 38.00 34.00 44.00 40.007 Preservation of Wildlife 1400.00 - 150.00 0.00 180.00 -8 Extension 18328.00 18088.00 2536.00 2525.00 3397.20 3015.009 Management of Jamindari 80.00 80.00 6.00 6.00 7.00 7.0010 Other expenditure 797.00 200.00 140.00 14.00 157.00 16.00
Sub-Total :6: 34000.00 28961.00 3805.00 3190.00 4869.20 3786.00 30770.00 3443.00 4406.00
7 STORAGE, WAREHOUSING & MARKETING1 Marketing 686.50 529.00 46.90 34.90 51.90 38.40 656.75 41.90 46.402 Storage & Warehousing 13.50 13.50 0*10 0.10 0.10 0.10 0.00 0.00 0.003 Nucleus Budget 0.00 0.00 3.00 0.00 3.00 0.00 0.00 0.00 0.00
• Sub-Total:7: 700.00 542.50 50.00 35.00 55.00 38.50 656.75 41.90 46.40
U)
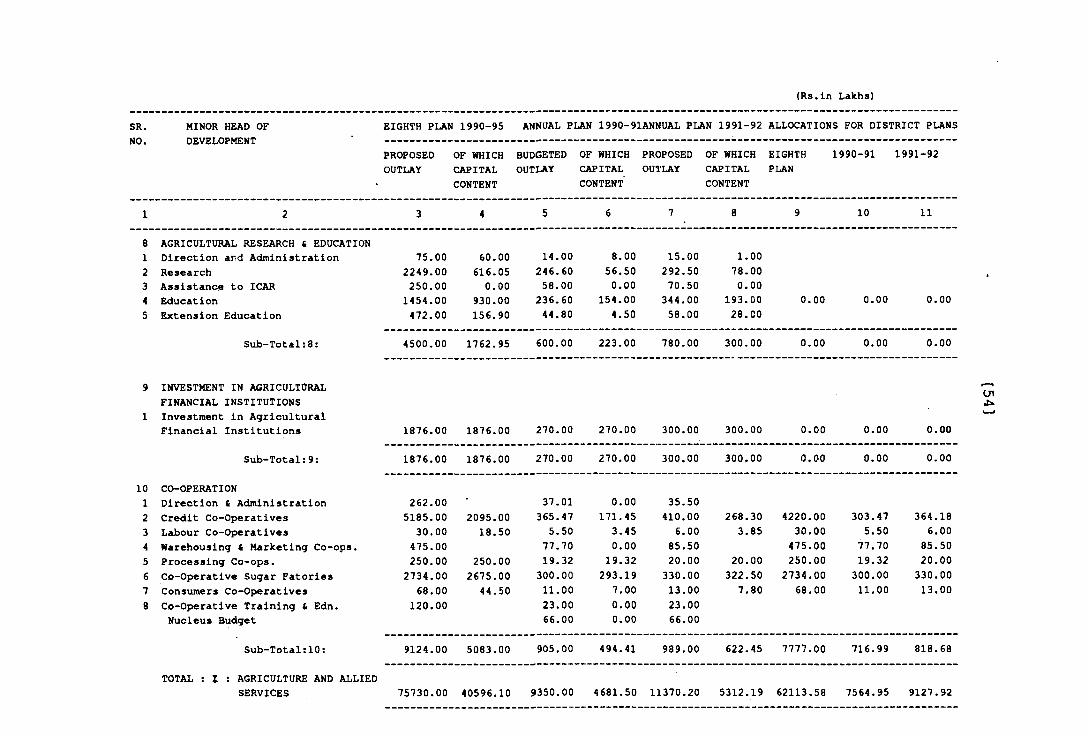
(Rs.ln Lakhs)
SR. MINOR HEAD OF EIGHTH PLAN 1990-95 ANNUAL PLAN 1990-91ANNUAL PLAN 1991-92 ALLOCATIONS FOR DISTRICT PLANSNO* DEVELiOPMENT
PROPOSEDOUTLAY
OF WHICHCAPITALCONTENT
BUDGETEDOUTLAY
OF WHICHCAPITALCONTENT
PROPOSEDOUTLAY
OF WHICHCAPITALCONTENT
EIGHTH 1990-91 1991-92 PLAN
1 2 3 4 5 6 7 8 9 10 11
81
AGRICULTURAL RESEARCH & EDUCATION Direction ard Administration 75.00 60.00 14.00 8.00 15.00 1.00
2 Research 2249.00 616.05 246.60 56.50 292.50 78.003 Assistancie to ICAR 250.00 0.00 58.00 0.00 70.50 0.004 Education 1454.00 930.00 236.60 154.00 344.00 193.00 0.00 0.00 0.005 Extension Education 472.00 156.90 44.80 4.50 58.00 28.00
Sub-Total:8: 4500.00 1762.95 600.00 223.00 780.00 300.00 0.00 0.00 0.00
INVESTMENT IN AGRICULTORAL FINANCIAL INSTITUTIONS Investment in AgriculturalFinancial Institutions 1876.00 1876.00 270.00 270.00 300.00 300.00 0.00 0.00 0.00
Sub-Total:9: 1876.00 1876.00 270.00 270.00 300.00 300.00 0.00 0.00 0.00
10 CO-OPERATION1 Direction i Administration 262.00 37.01 0.00 35.502 Credit Co-Operatives 5185.00 2095.00 365.47 171.45 410.00 268.30 4220.00 303.47 364.183 Labour Co-Operatives 30.00 18.50 5.50 3.45 6.00 3.85 30.00 5.50 6.004 Warehousing & Marketing Co-ops. 475.00 77.70 0.00 85.50 475.00 77.70 85.505 Processing Co-ops. 250-00 250.00 19.32 19.32 20.00 20.00 250.00 19.32 20.006 Co-Operative Sugar Fatories 2734.00 2675.00 300.00 293.19 330.00 322.50 2734.00 300.00 330.007 Consumers Co-Operatives 68.00 44.50 11.00 7.00 13.00 7.80 68.00 11.00 13.008 Co-Operative Training i Edn. 120.00 23.00 0.00 23.00
Nucleus Budget 66.00 0.00 66.00
Sub-Total;10: 9124.00 5083.00 905.00 494.41 989.00 622.45 7777.00 716.99 818.68
TOTAL : J : AGRICULTURE AND ALLIEDSERVICES 75730.00 40596.10 9350.00 4681.50 11370.20 5312.19 62113.58 7564.95 9127.92
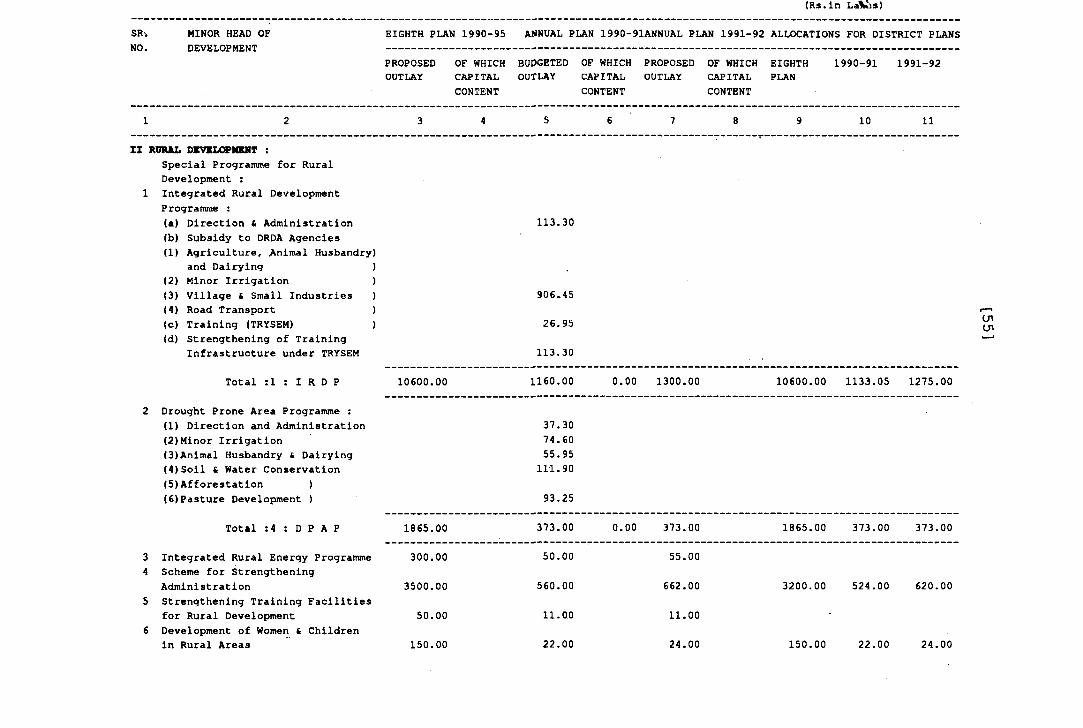
(Rs.in LaVis)
SR'.NO
MINOR HEAD OF EIGHTH PLAK 1990-95 annual PLAN 1990-91ANNUAL PLAN 1991-92 ALLOCATIONS FOR DISTRICT PLANS
PROPOSED OF WHICH OUTLAY CAPITAL
CONTENT
BUDGETEDOUTLAY
OF WHICHCAPITALCONTENT
PROPOSEDOUTLAY
OF WHICHCAPITALCONTENT
EIGHTHPLAN
1990-91 1991-92
1 2 3 4 5 6 7 8 9 10 11
II KJKkL DBVBIiOPMBNT :Special Programme for Rural Development :
1 Integrated Rural Development Programme :(a) Direction £ Administration(b) Subsidy to DRDA Agencies(1) Agriculture, Animal Husbandry
and Dairying(2) Minor Irrigation(3) Village & Small Industries(4) Road Transport(c) Training (TRYSEM)(d) Strengthening of Training
Infrastructure under TRYSEM
Total :1 : I R D P
2 Drought Prone Area Programme ;(1) Direction and Administration(2)Minor Irrigation(3)Animal Husbandry & Dairying(4)Soil £ Water Conservation(5)Afforestation )(6)Pasture Development )
Total ;4 ; D P A P
3 Integrated Rural Energy Programme4 Scheme for Strengthening
Administration5 Strengthening Training Facilities
for Rural Development6 Development of Women t Children
in Rural Areas
10600.00
1865.00
300.00
3500.00
50.00
150.00
113.30
906.45
26.95
113.30
1160.00 0.00 1300.00
37.3074.6055.95111.90
93.25
373.00
50.00
560.00
11.00
22.00
0.00 373.00
55.00
662.00
11.00
24.00
10600.00 1133.05 1275.00
1865.00 373.00 373.00
3200.00 524.00 620.00
150.00 22.00 24.00
cncn
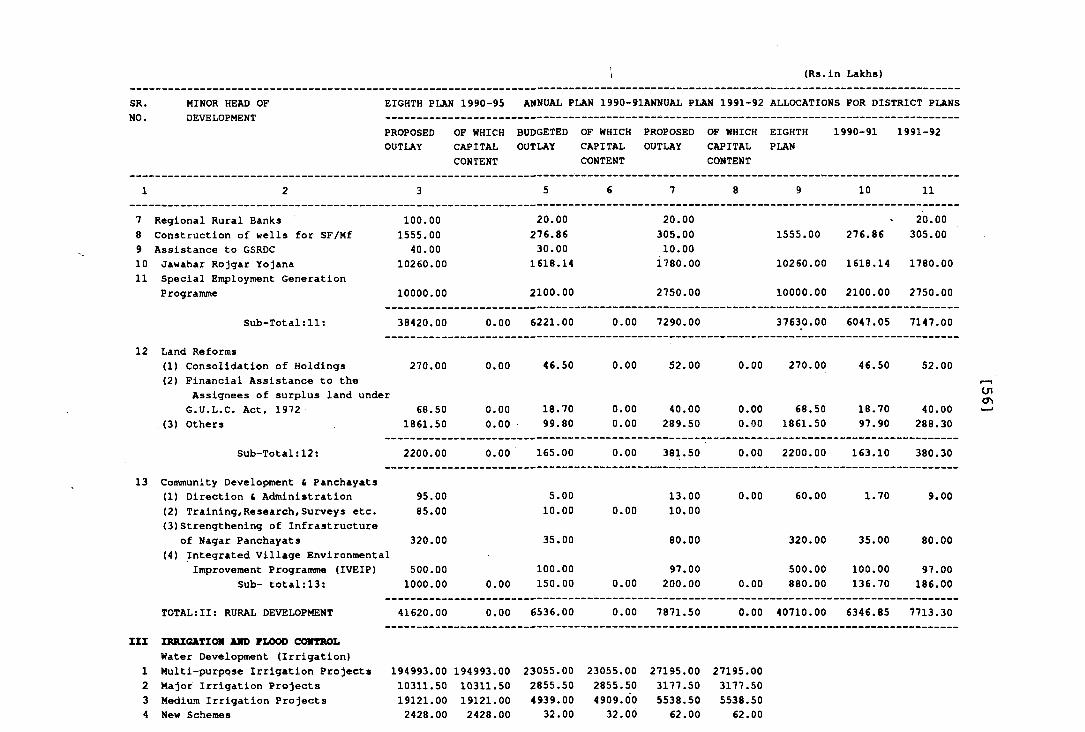
SR. MINOR HEAD OF EIGHTH PLAN 1990-95 ANNUAL PLAN 1990-91ANNUAL PLAN 1991-92 ALLOCATIONS FOR DISTRICT PLANS
i (Rs.ln Lakhs)
nw. UE.VCiijUfnE.W iPROPOSEDOUTLAY
OF WHICHCAPITALCONTENT
BUDGETEDOUTLAY
OF WHICHCAPITALCONTENT
PROPOSEDOUTLAY
OF WHICHCAPITALCONTENT
EIGHTHPLAN
1990-91 1991-92
1 2 3 5 6 7 8 9 10 11
7 Regional Rural Banks 100.00 20.00 20.00 20.008 Construction of wells for SF/Mf 1555.00 276.86 305.00 1555.00 276.86 305.009 Assistance to GSRDC 40.00 30.00 10.0010 Jawahar Rojgar Yojana 10260.00 1618.14 1780.00 10260.00 1618.14 1780.0011 Special Employment Generation
Programme 10000.00 2100.00 2750.00 10000.00 2100.00 2750.00
Sub-Total:11: 38420.00 0.00 6221.00 0.00 7290.00 37630.00 6047.05 7147.00
12 Land Reforms(1) Consolidation of Holdings 270.00 0.00 46.50 0.00 52.00 0.00 270.00 46.50 52.00(2) Financial Assistance to the
Assignees of surplus land underG.U.L.C. Act, 1972 68.50 0.00 18.70 0.00 40.00 0.00 68.50 18.70 40.00
(3) Others 1861.50 0.00 99.80 0.00 289.50 0.00 1861.50 97.90 288.30
Sub-Total:12: 2200.00 0.00 165.00 0.00 381.50 0.00 2200.00 163.10 380.30
13 Community Development & Panchayats(1) Direction & Administration 95.00 5.00 13.00 0.00 60.00 1.70 9.00(2) Training,Research,Surveys etc. 85.00 10.00 0.00 10.00(3)Strengthening of Infrastructure
of Nagar Panchayats 320.00 35.00 80.00 320.00 35.00 80.00(4) Integrated Village Environmental
Improvement Programme (IVEIP) 500.00 100.00 97.00 500.00 100.00 97.00Sub- total:13; 1000.00 0.00 150.00 0.00 200.00 0.00 880.00 136.70 186.00
TOTAL:II: RURAL DEVELOPMENT 41620.00 0.00 6536.00 0.00 7871.50 0.00 40710.00 6346.85 7713.30
III IRRIGATION AMD FUOOD COMTROLHater Development (Irrigation)
1 Multi-purpose Irrigation Projects 194993.00 194993.00 23055.00 23055.00 27195.00 27195.002 Major Irrigation Projects 10311.50 10311.50 2855.50 2855.50 3177.50 3177.503 Medium Irrigation Projects 19121.00 19121.00 4939.00 4909.00 5538.50 5538.504 New Schemes 2428.00 2428.00 32.00 32.00 62.00 62.00
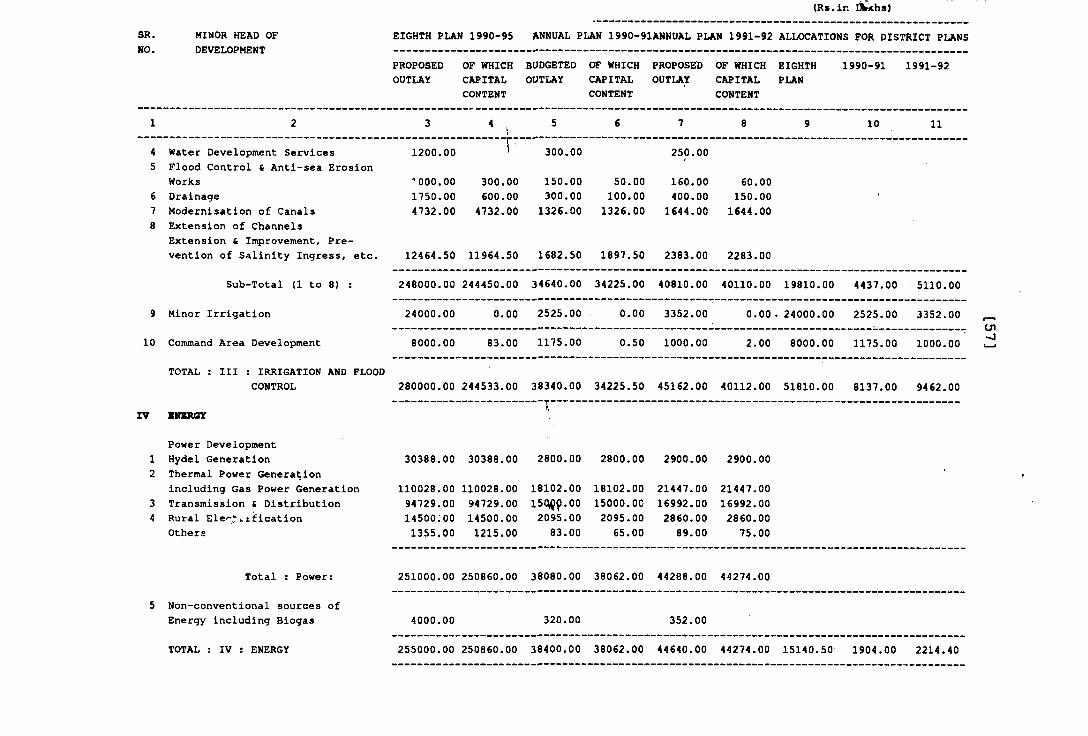
SR. MINOR HEAD OF EIGHTH PLAN 1990-95 ANNUAL PLAN 1990-91ANNUAL PLAN 1991-92 ALLOCATIONS FOR DISTRICT PLANS
(Rs.ln I]^hs)
NO. DEVELOPMENTPROPOSEDOUTLAY
OF WHICHCAPITALCONTENT
BUDGETEDOUTLAY
€»• WHICHCAPITALCONTENT
PROPOSEDOUTLAY
OF WHICHCAPITALCONTENT
EIGHTHPLAN
1990-91 1991-92
1 2 3 < S 5 6 7 8 9 10 11
45
678
Water Development Services Flood Control & Anti-sea Erosion Works DrainageModernisation of Canals Extension of Channels Extension & Improvement, Prevention of Salinity Ingress, etc.
1200.00
'000.001750.004732.00
12464.50
r
300.00€00.004732.00
11964.50
300.00
150.00300.00 1326.00
1682.50
50.00100.001326.00
1897.50
250.00
160.00 400.00
1644.00
2383.00
60.00150.001644.00
2283.00
-
Sub-Total (1 to 8) : 248000.00 244450.00 34640.00 34225.00 40810.00 40110.00 19810.00 4437.00 5110.00
9 Minor Irrigation 24000.00 0.00 2525.00 0.00 3352.00 0.00 . 24000.00 2525.00 3352.00
10 Command Area Development 8000.00 83.00 1175.00 0.50 1000.00 2.00 8000.00 1175.OQ 1000.00
TOTAL : III : IRRIGATION AND FLOOD CONTROL 280000.00 244533.00 38340.00 34225.50 45162.00 40112.00 51810.00 8137.00 9462.00
IV BHERGY
12
34
Power Development Hydel Generation Thermal Power Generation including Gas Power Generation Transmission £ Distribution Rural Ele 'i’ .ification Others
30388.00
110028.0094729.0014500.00 1355.00
30388.00
110028.0094729.0014500.00 1215.00
2800.00
18102.0015C I .002095.0083.00
2800.00
18102.0015000.002095.0065.00
2900.00
21447.0016992.002860.00 89.00
2900.00
21447.0016992.002860.00 75.00
'
Total : Power: 251000.00 250860.00 38080.00 38062.00 44288.00 44274.00
5 Non-conventional sources of Energy including Biogas 4000.00 320.00 352.00
TOTAL ; IV : ENERGY 255000.00 250860.00 38400.00 38062.00 44640.00 44274.00 15140.50 1904.00 2214.40
cn
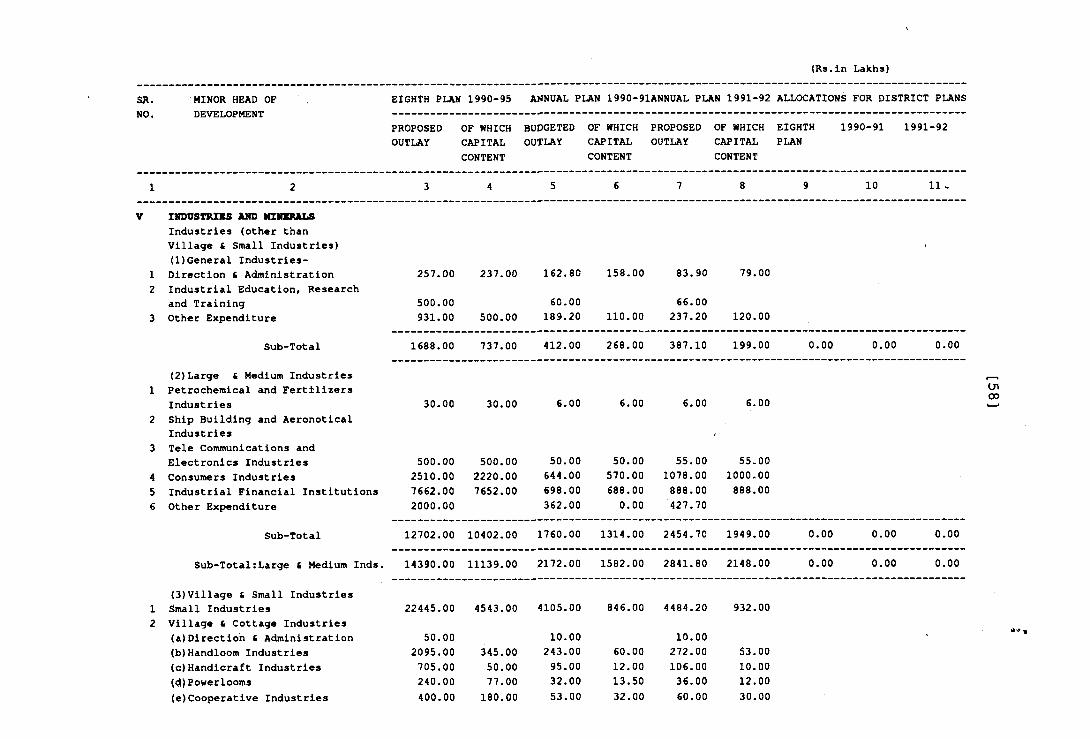
SR. MINOR HEAD OF EIGHTH PIAN 1990-95 ANNUAL PLAN 1990-91ANNUAL PLAN 1991-92 ALLOCATIONS FOR DISTRICT PLANS
(Rs.in Lakhs)
NO. DEVELOPMENTPROPOSEDOUTLAY
OF WHICHCAPITALCONTENT
BUDGETEDOUTLAY
OF WHICHCAPITALCONTENT
PROPOSEDOUTLAY
OF WHICHCAPITALCONTENT
EIGHTHPLAN
1990-91 1991-92
1 2 3 4 5 6 7 8 9 10 11 .
V INDUSTRIBS AMD MIIIBRALSIndustries (other thanVillage £ Small Industries)(1)General Industries-
1 Dlrection £ Administration 257.00 237.00 162.80 158.00 83.90 79.002 Industrial Education, Research
and Training 500.00 60.00 66.003 Other Expenditure 931.00 500.00 189.20 110.00 237.20 120.00
Sub-Total 1688.00 737.00 412.00 268.00 387.10 199.00 0.00 0.00 0.00
(2)Large £ Medium Industries1 Petrochemical and Fertilizers
Industries 30.00 30.00 6.00 6.00 6.00 6.002 Ship Building and Aeronotical
Industries <3 Tele Communications and
Electronics Industries 500.00 500.00 50.00 50.00 55.00 55.004 Consumers Industries 2510.00 2220.00 644.00 570.00 1078.00 1000-005 Industrial Financial Institutions 7662.00 7652.00 698.00 688.00 888.00 888.006 Other Expenditure 2000.00 362.00 0.00 427.70
Sub-Total 12702.00 10402.00 1760.00 1314.00 2454.70 1949.00 0.00 0.00 0.00
Sub-Total:Large £ Medium Inds. 14390.00 11139.00 2172.00 1582.00 2841.80 2148.00 0.00 0.00 0.00
(3)Village £ Small Industries1 Small Industries 22445.00 4543.00 4105.00 846.00 4484.20 932.002 Village £ Cottage Industries
(a)Direction £ Administration 50.00 10.00 10.00(b)Handloom Industries 2095.00 345.00 243.00 60.00 272.00 53.00(c)Handicraft Industries 705.00 50.00 95.00 12.00 106.00 10.00(d)Powerlooms 240.00 77.00 32.00 13.50 36.00 12.00(e)Cooperative Industries 400.00 180.00 53.00 32.00 60.00 30.00
cn00
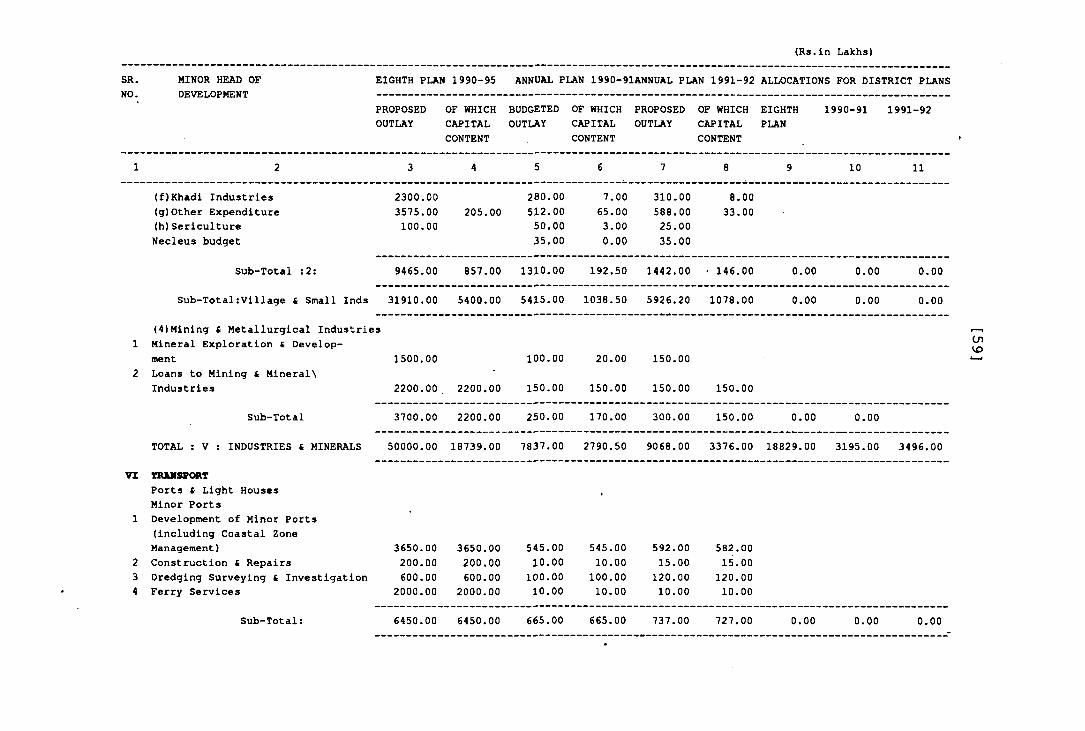
SR.NO.
MINOR HEAD OF DEVELOPMENT
EIGHTH PLAN 1990-95 ANNUAL PLAN 1990-91ANNUAL PLAN 1991-92 ALLOCATIONS FOR DISTRICT PLANS
PROPOSED OF WHICH BUDGETED OF WHICH PROPOSED OF WHICH EIGHTH 1990-91 1991-92OUTLAY CAPITAL OUTLAY CAPITAL OUTLAY CAPITAL PLAN
CONTENT
(Rs.in Lakhs)
CONTENT
4
CONTENT
6
(f)Khadi Industries(g)Other Expenditure(h)Sericulture Necleus budget
2300.00 280.003575.00 205.00 512.00
7.00 310.0065.00 588.00
Sub-Total :2;
100.00
9465.00
50.0035.00
3.000.00
25.0035.00
857.00 1310.00 192.50 1442.00
8
8.00
33.00
146.00
Sub-Total;Village £ Small Inds 31910.00 5400.00 5415,00 1038.50 5926.20 1078.00
0 . 0 0
0.00
(4)Mining & Metallurgical Industries1 Mineral Exploration £ Develop
ment2 Loans to Mining £ Mineral\
Industries
Sub-Total
TOTAL ; V : INDUSTRIES £ MINERALS
10
0.00
0.00
11
0.00
0 . 0 0
1500.00 100.00 20.00 150.00
2200.00 2200.00 150.00 150.00 150.00 150.00
3700.00 2200.00 250.00 170.00 300.00 150.00 0.00 0.00
50000.00 18739.00 7837.00 2790.50 9068.00 3376.00 18829.00 3195.00 3496.00
CnVO
VZ TRIMSPORTPorts £ Light Houses Minor Ports
1 Development of Minor Ports (including Coastal Zone Management)
2 Construction £ Repairs3 Dredging Surveying £ Investigation4 Ferry Services
Sub-Total:
3650.00 3650.00200.00 200.00600.00 600.00
2000.00 2000.00
6450.00 6450.00
545.00 10.00
100.00 100.0010.00
665.00
545.00 592.0010.00 15.00
120.00 10.0010.00
665.00 737.00
582.0015.00
120.0010.00
727.00 0.00 0.00 0.00
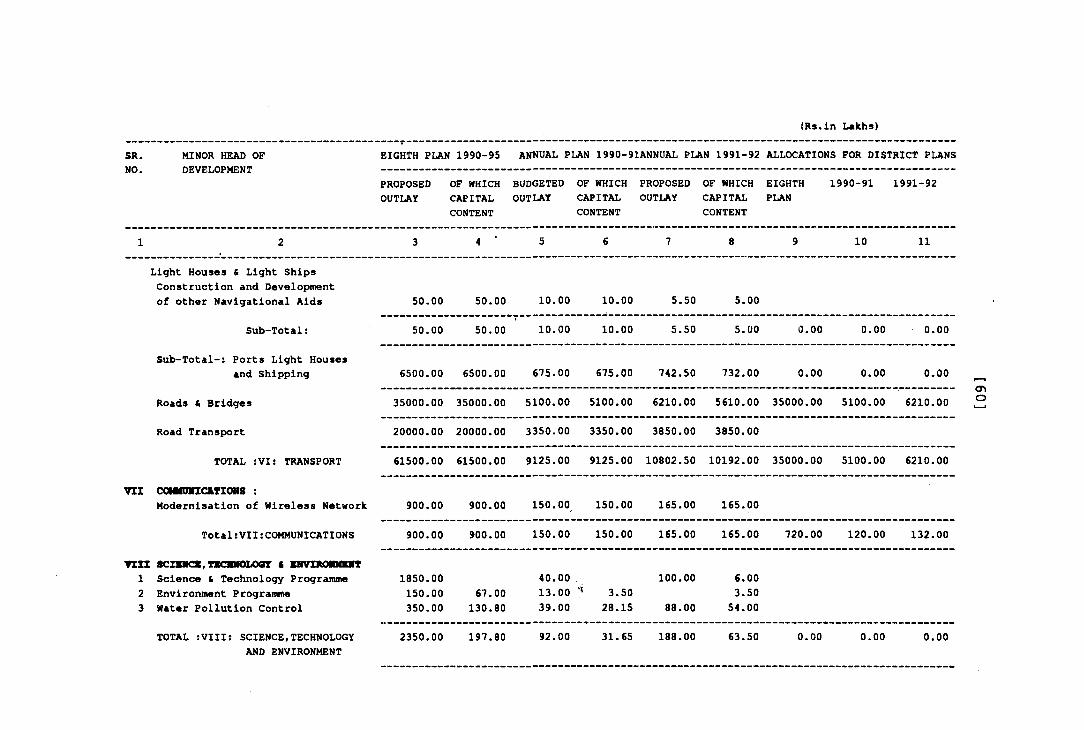
SR. MINOR HEAD OF
(Rs.in Lakhs)---- r--- — — — ------------------------ ------ ------ -----— ----------- ----------------- --------------------- —EIGHtH PLAN 1990-95 ANNUAL PLAN 1990-91ANNUAL PLAN 1991-92 ALLOCATIONS FOR DISTRICT PLANS
NO. DEVELOPMENTPROPOSEDOUTLAY
OF WHICHCAPITALCONTENT
BUDGETEDOUTLAY
OF WHICHCAPITALCONTENT
PROPOSEDOUTLAY
OF WHICHCAPITALCONTENT
EIGHTHPLAN
1990-91 1991-92
1 2 3 4 ' 5 6 7 8 9 10 11
Light Houses & Light Ships Construction and Development of other Navigational Aids 50.00 50.00 10.00 10.00 5.50 5.00
Sub-Total; 50.00 50.00 10.00 10.00 5.50 5.00 0.00 0.00 0.00
Sub-Total-; Ports Light Houses and Shipping 6500.00 6500.00 675.00 675.00 742.50 732.00 0.00 0.00 0.00
Roads i Bridges 35000.00 35000.00 5100.00 5100.00 6210.00 5610.00 35000.00 5100.00 6210.00
Road Transport 20000.00 20000.00 3350.00 3350.00 3850.00 3850.00
TOTAL ;VI; TRANSPORT 61500.00 61500.00 9125.00 9125.00 10802.50 10192.00 35000.00 5100.00 6210.00
V II COIMDViaiTIONS :Modernisation of Wireless Network 900.00 900.00 150.00 150.00 165.00 165.00
Total:VII:COMMUNICATIONS 900.00 900.00 150.00 150.00 165.00 165.00 720.00 120.00 132.00
V II I123
SCIXllCS,nCHIIOL06T i KMVIROIMSmScience & Technology Programme Environment Programme Water Pollution Control
1850.00150.00350.00
67.00130.80
40.0013.0039.00
3.5028.15
100.00
88.00
6.003.5054.00
TOTAL rVIII; SCIENCE,TECHNOLOGY AND ENVIRONMENT
2350.00 197.80 92.00 31.65 188.00 63.50 0.00 0.00 0.00
<T>O
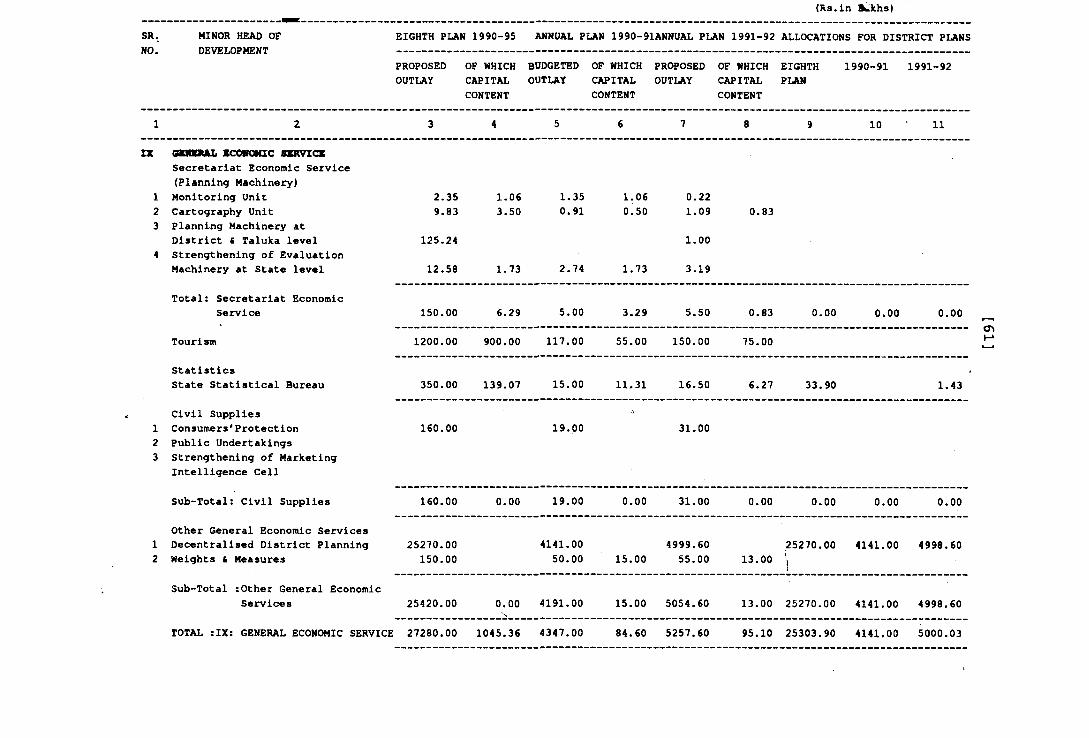
SR. MINOR HEAD OF EIGHTH PLAN 1990-95 ANNUAL PLAN 1990-91ANNUAL PLAN 1991-92 ALLOCATIONS FOR DISTRICT PLANS
(Rs.in ^khs)
NO. DEVELOPMENTPROPOSEDOUTLAY
OF WHICHCAPITALCONTENT
BUDGETEDOUTLAY
OF WHICHCAPITALCONTENT
PROPOSEDOUTLAY
OF WHICHCAPITALCONTENT
EIGHTHPLAN
1990-91 1991-92
1 2 3 4 5 6 7 8 9 10 11
zx
123
4
cniBiuiii icoaiOMic ssrvicsSecretariat Economic Service (Planning Machinery) Monitoring Unit Cartography Unit Planning Machinery at District & Talulca level Strengthening of Evaluation Machinery at State level
2.359.83
125.24
12.58
1.063.50
1,73
1.350.91
2.74
1.060.50
1,73
0,221.09
1.00
3.19
0.83
Total: Secretariat Economic Service 150.00 6.29 5.00 3.29 5.50 0.83 0.00 0.00 0.00
Tourism 1200.00 900.00 117.00 55.00 150.00 75.00
StatisticsState Statistical Bureau 350.00 139.07 15.00 11.31 16.50 6.27 33.90 1.43
123
Civil Supplies Consumers' Protection Public Undertakings Strengthening of Marketing Intelligence Cell
160.00 19.00 31.00
Sub-Total; Civil Supplies 160.00 0.00 19.00 0.00 31.00 0.00 0.00 0.00 0.00
12
Other General Economic Services Decentralised District Planning Heights & Measures
25270.00150,00
4141.0050.00 15.00
4999.6055.00 13.00
.25270.001!
4141.00 4998.60
Sub-Total :Other General Economic Services 25420,00 0.00 4191.00 15.00 5054.60 13.00 25270.00 4141,00 4998.60
TOTAL ;IX: GENERAL ECONOMIC SERVICE 27280.00 1045.36 4347.00 84.60 5257.60 95.10 25303.90 4141.00 5000.03
CT>
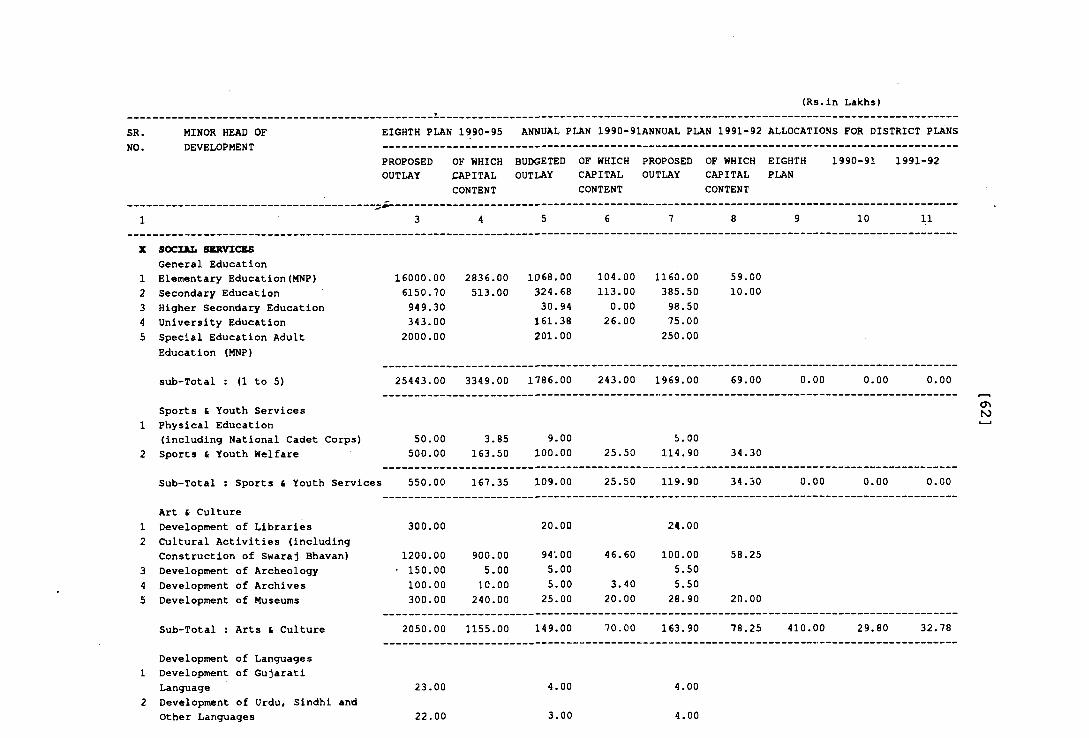
SR. MINOR HEAD OF EIGHTH PLAN 1990-95 ANNUAL PLAN 1990-91ANNUAL PLAN 1991-92 ALLOCATIONS FOR DISTRICT PLANS
(Rs.in Lakhs)
NO. DEVELOPMENTPROPOSED OF WHICH BUDGETED OF WHICH PROPOSED OF WHICH EIGHTH 1990-91 1991-92OUTLAY CAPITAL OUTLAY CAPITAL OUTLAY CAPITAL PLAN
CONTENT CONTENT CONTENT
1 3 4 5 6 7 8 9 10 11
X SOCIAL SBRVICBSGeneral Education
1 Elementary Education(MNP) 16000.00 2836.00 1068.00 104.00 1160.00 59.002 Secondary Education 6150.70 513.00 324.68 113.00 385.50 10.003 Higher Secondary Education 949.30 30.94 0.00 98.504 University Education 343.00 161.38 26.00 75.005 Special Education Adult 2000.00 201.00 250.00
Education (MNP)
sub-Total : (1 to 5) 25443.00 3349.00 1786.00 243.00 1969.00 69.00 0.00 0.00 0.00
Sports & Youth Services1 Physical Education
(including National Cadet Corps) 50.00 3.85 9.00 5.002 Sports & Youth Welfare 500.00 163.50 100.00 25.50 114.90 34.30
Sub-Total ; Sports £ Youth Services 550.00 167.35 109.00 25.50 119.90 34.30 0.00 0.00 0.00
Art & Culture1 Development of Libraries 300.00 20.00 24.002 Cultural Activities (including
Construction of Swaraj Bhavan) 1200.00 900.00 94-. 00 46.60 100.00 58.253 Development of Archeology ■ 150.00 5.00 5.00 5.504 Development of Archives 100.00 10.00 5.00 3.40 5.505 Development of Museums 300.00 240.00 25.00 20.00 28.90 20.00
Sub-Total ; Arts & Culture 2050.00 1155.00 149.00 70.00 163.90 78.25 410.00 29.80 32.78
o\ro
Development of Languages1 Development of Gujarati
Language2 Development of Urdu, Sindhi and
Other Languages
23.00
22.00
4.00
3.00
4.00
4.00
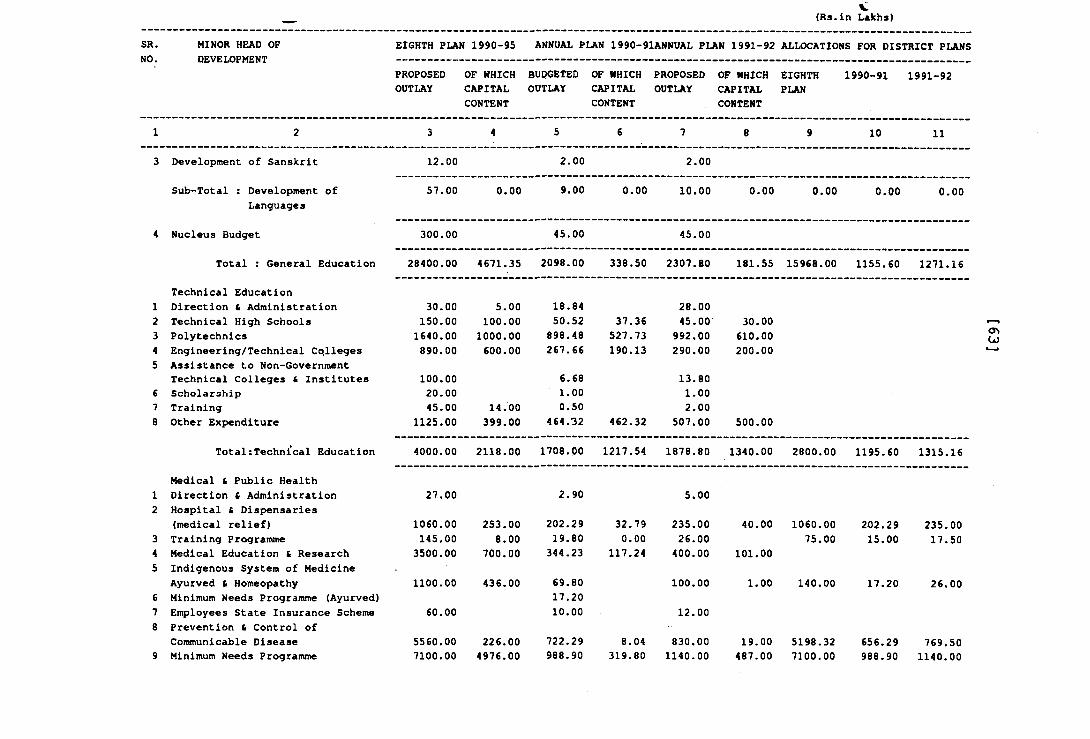
V(Rs.ln Lakhs)
SR. MINOR HEAD OF EIGHTH PLAN 1990-95 ANNUAL PLAN 1990-91ANNUAL PLAN 1991-92 ALLOCATIONS FOR DISTRICT PLANSNO. DEVELOPMENT
PROPOSED OF WHICH budgeted OF WHICH PROPOSED OF WHICH EIGHTH 1990-91 1991-92OUTLAY CAPITAL OUTLAY CAPITAL OUTLAY CAPITAL PLAN
CONTENT CONTENT CONTENT
1 2 3 4 5 6 7 8 9 10 11
3 Development of Sanskrit 12.00 2.00 2.00
Sub-Total : Development of 57.00 0.00 9.00 0.00 10.00 0.00 0.00 0.00 0.00Languages
4 Nucleus Budget 300.00 45.00 45.00
Total : General Education 28400.00 4671.35 2098.00 338.50 2307.80 181.55 15968.00 1155.60 1271.16
Technical Education1 Direction & Administration 30.00 5.00 18.84 28.002 Technical High Schools 150.00 100.00 50.52 37.36 45.00 30.003 Polytechnics 1640.00 1000.00 898.48 527.73 992.00 610.004 Engineering/Technical Cqlleges 890.00 600.00 267.66 190.13 290.00 200.005 Assistance to Non-Government
Technical Colleges £ Institutes 100.00 6.68 13.806 Scholarship 20.00 1.00 1.007 Training 45.00 14.00 0.50 2.008 Other Expenditure 1125.00 399.00 464.32 462.32 507.00 500.00
Total:Technical Education 4000.00 2118.00 1708.00 1217.54 1878.80 1340.00 2800.00 1195.60 1315.16
Medical & Public Health1 Direction £ Administration 27.00 2.90 5.002 Hospital t Dispensaries
(medical relief) 1060.00 253.00 202.29 32.79 235.00 40.00 1060.00 202.29 235.003 Training Programme 145.00 8.00 19.80 0.00 26.00 75.00 15.00 17.504 Medical Education & Research 3500.00 700.00 344.23 117.24 400.00 101.005 Indigenous System of Medicine
Ayurved & Homeopathy 1100.00 436.00 69.80 100.00 1.00 140.00 17.20 26.006 Minimum Needs Programme (Ayurved) 17.207 Employees State Insurance Scheme 60.00 10.00 12.008 Prevention & Control of
Communicable Disease 5560.00 226.00 722.29 8.04 830.00 19.00 5198.32 656.29 769.509 Minimum Needs Programme 7100.00 4976.00 988.90 319.80 1140.00 487.00 7100.00 988.90 1140.00
<TiCa)
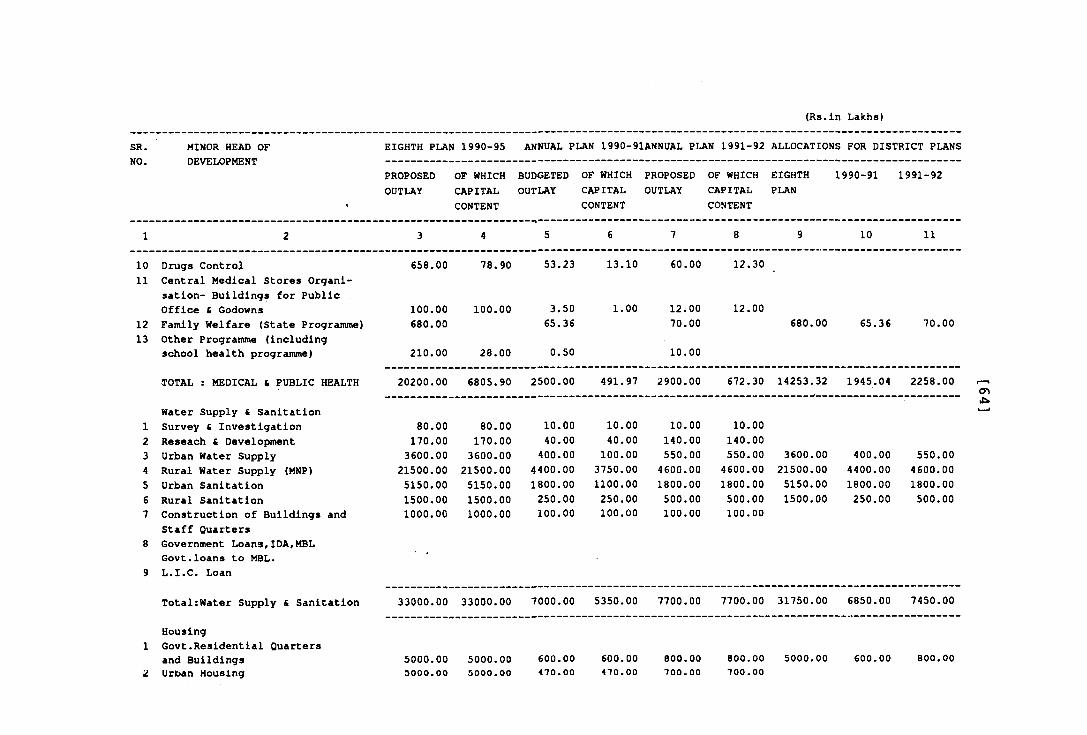
(Rs.in Lakhs)
SR. MINOR HEAD OF EIGHTH PLAN 1990-95 ANNUAL PLAN 1990-91ANNUAL PLAN 1991-92 ALLOCATIONS FOR DISTRICT PLANSNO. DEVELOPMENT
PROPOSEDOUTLAY
OF WHICHCAPITALCONTENT
BUDGETEDOUTLAY
OF WHICHCAPITALCONTENT
PROPOSEDOUTLAY
OF WHICHCAPITALCONTENT
EIGHTHPLAN
1990-91 1991-92
1 2 3 4 5 6 7 8 9 10 11
10 Drugs Control 658.00 78.90 53.23 13.10 60.00 12.3011 Central Medical Stores Organi
sation- Buildings for PublicOffice £ Godowns 100.00 100.00 3.50 1.00 12.00 12.00
12 Family Welfare (State Programme) 680.00 65.36 70.00 680.00 65.36 70.0013 Other Programme (including
school health programme) 210.00 28.00 0.50 10.00
TOTAL : MEDICAL 6 PUBLIC HEALTH 20200.00 6805.90 2500.00 491.97 2900.00 672.30 14253.32 1945.04 2258.00
Water Supply & Sanitation1 Survey & Investigation 80.00 80.00 10.00 10.00 10.00 10.002 Reseach & Development 170.00 170.00 40.00 40.00 140.00 140.003 Urban Water Supply 3600.00 3600.00 400.00 100.00 550.00 550.00 3600.00 400.00 550.004 Rural Water Supply (MNP) 21500.00 21500.00 4400.00 3750.00 4600.00 4600.00 21500.00 4400.00 4600.005 Urban Sanitation 5150.00 5150.00 1800.00 1100.00 1800.00 1800.00 5150.00 1800.00 1800.006 Rural Sanitation 1500.00 1500.00 250.00 250.00 500.00 500.00 1500.00 250.00 500.007 Construction of Buildings and 1000.00 1000.00 100.00 100.00 100.00 100.00
Staff Quarters8 Government Loans,IDA,MEL
Govt.loans to MEL.9 L.I.C. Loan
TotaliWater Supply & Sanitation 33000.00 33000.00 7000.00 5350.00 7700.00 7700.00 31750.00 6850.00 7450.00
Housing1 Govt.Residential Quarters
and Buildings 5000.00 5000.00 600.00 600.00 800.00 800.00 5000.00 600.00 800.002 Urban Housing 3000.00 5000.00 470.00 470.00 700.00 700.00
cn
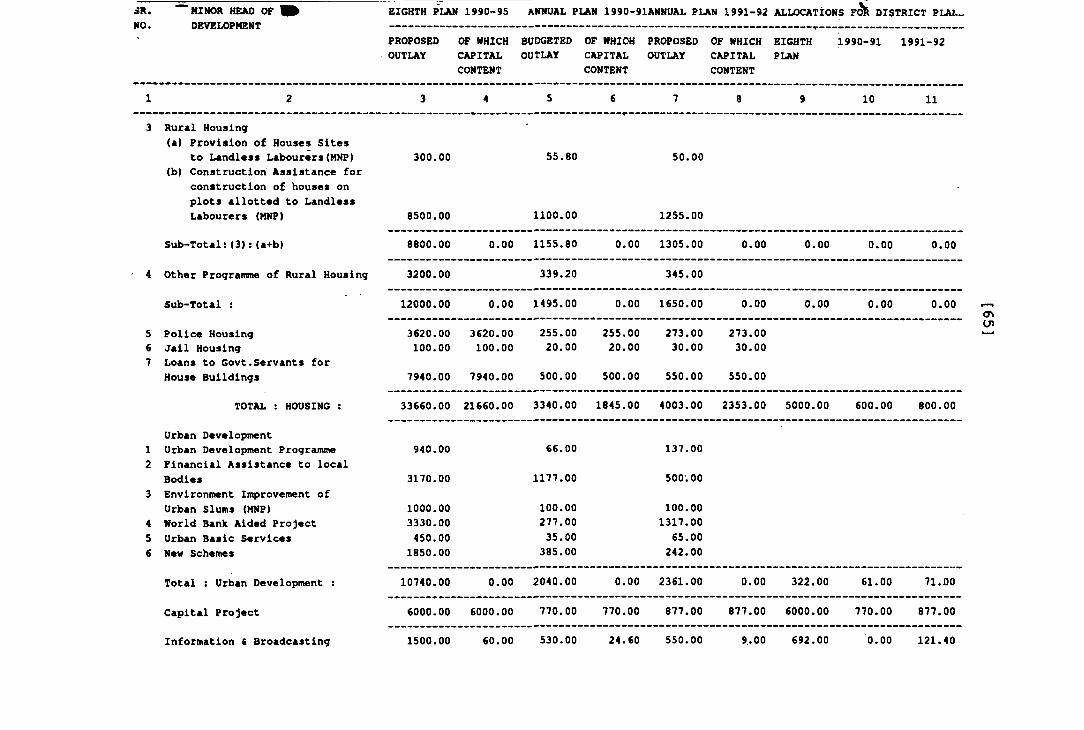
SR.NO.
MINOR HEAD OF DEVELOPMENT
EIGHTH PLAN 1990-95 ANNUAL PLAN 1990-91ANNUAL PLAN 1991-92 ALLOCATIONS DISTRICT PLAl,.,
3 Rural Housing(a) Provision of Houses Sites
to Landless Labourers(MNP)(b) Construction Assistance for
construction of houses on plots allotted to Landless Labourers (MNP)
Sub-Total;(3);(a+b)
4 Other Programme of Rural Housing
Sub-Total :
5 Police Housing6 Jail Housing7 Loans to Govt.Servants for
House Buildings
TOTAL : HOUSING :
Urban Development1 Urban Development Programme2 Financial Assistance to local
Bodies3 Environment Improvement of
Urban Slums (MNP)4 World Bank Aided Project5 Urban Basic Services6 New Schemes
Total : Urban Development :
Capital Project
Information i Broadcasting
PROPOSEDOUTLAY
OF WHICHCAPITALCONTENT
BUDGETEDOUTLAY
OF WHICHCAPITALCONTENT
PROPOSEDOUTLAY
OF WHICHCAPITALCONTENT
EIGHTHPLAN
1990-91 1991-92
3 4 5 6 7 8 9 10 11
300.00 55.80 50.00
8500.00 1100.00 1255.00
8800.00 0.00 1155.80 0.00 1305.00 0.00 0.00 0.00 0.00
3200.00 339.20 345.00
12000.00 0.00 1495.00 0.00 1650.00 0.00 0.00 0.00 0.00
3620.00100.00
3620.00100.00
255.0020.00
255.0020.00
273.0030.00
273.0030.00
7940.00 7940.00 500.00 500.00 550.00 550.00
33660.00 21660.00 3340.00 1845.00 4003.00 2353.00 5000.00 600.00 800.00
940.00 66.00 137.00
3170.00 1177.00 500.00
1000.003330.00 450.001850.00
100.00277.00 35.00385.00
100.001317.0065.00242.00
10740.00 0.00 2040.00 0.00 2361.00 0.00 322.00 61.00 71.00
6000.00 6000.00 770.00 770.00 877.00 877.00 6000.00 770.00 877.00
1500.00 60.00 530.00 24.60 550.00 9.00 692.00 'o.oo 121.40
<T%(jn
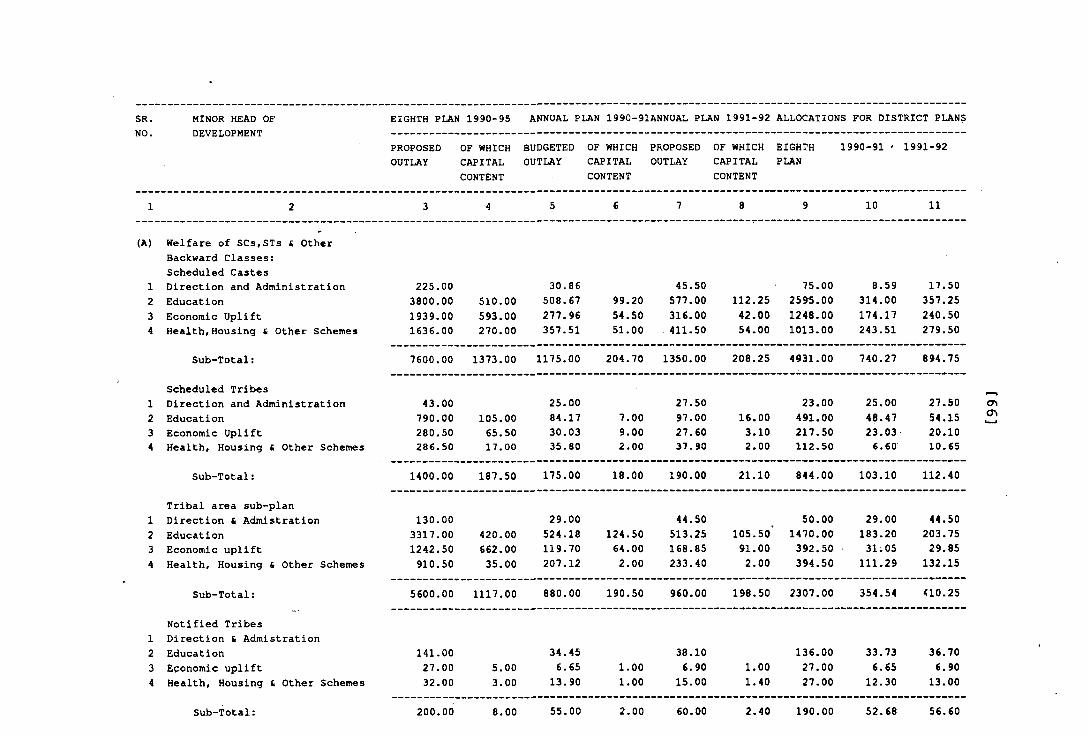
SR. MINOR HEAD OF EIGHTH PLAN 1990-95 ANNUAL PLAN 1990-91ANNUAL PLAN 1991-92 ALLOCATIONS FOR DISTRICT PLANSNO. DEVELOPMENT
PROPOSEDOUTLAY
OF WHICHCAPITALCONTENT
BUDGETEDOUTLAY
OF WHICHCAPITALCONTENT
PROPOSEDOUTLAY
OF WHICHCAPITALCONTENT
EIGHTHPLAN
1990-91 ' 1991-92
1 2 3 4 5 6 7 8 9 10 11
(A)
12
Welfare of SCs,STs & Other Backward Classes:Scheduled CastesDirection and AdministrationEducation
225.003800.00 510.00
30.86508.67 99.20
45.50577.00 112.25
75.0025»5.00
8.59314.00
17.50357.25
3 Economic Uplift 1939.00 593.00 277.96 54.50 316.00 42.00 1248.00 174.17 240.504 Health,Housing & Other Schemes 1636.00 270.00 357.51 51.00 411.50 54.00 1013.00 243.51 279.50
Sub-Total: 7600.00 1373.00 1175.00 204.70 1350.00 208.25 4931.00 740.27 894.75
12
Scheduled TribesDirection and AdministrationEducation
43.00790.00 105.00
25.0084.17 7.00
27.5097.00 16.00
23.00491.00
25.0048.47
27.5054.15
3 Economic Uplift 280.50 65.50 30.03 9.00 27.60 3.10 217.50 23.03 20.104 Health, Housing £ Other Schemes 286.50 17.00 35.80 2.00 37.90 2.00 112.50 6.60 10.65
Sub-Total: 1400.00 187.50 175.00 18.00 190.00 21.10 844.00 103.10 112.40
12
Tribal area sub-plan Direction £ Admistration Education
130.003317.00 420.00
29.00524.18 124.50
44.50513.25 105.50*
50.001470.00
29.00183.20
44.50203.75
3 Economic uplift 1242.50 662.00 119.70 64.00 168.85 91.00 392.50 31.05 29.854 Health, Housing & Other Schemes 910.50 35.00 207.12 2.00 233.40 2.00 394.50 111.29 132.15
Sub-Total: 5600.00 1117.00 880.00 190.50 960.00 198.50 2307.00 354.54 <10.25
123
Notified Tribes Direction & Admistration Education Economic uplift
141.0027.00 5.00
34.456.65 1.00
38.106.90 1.00
136.0027.00
33.736.65
36.706.90
4 Health, Housing & Other Schemes 32.00 3.00 13.90 1.00 15.00 1.40 27.00 12.30 13.00
Sub-Total: 200.00 8.00 55.00 2.00 60.00 2.40 190.00 52.68 56.60
Ch<r>
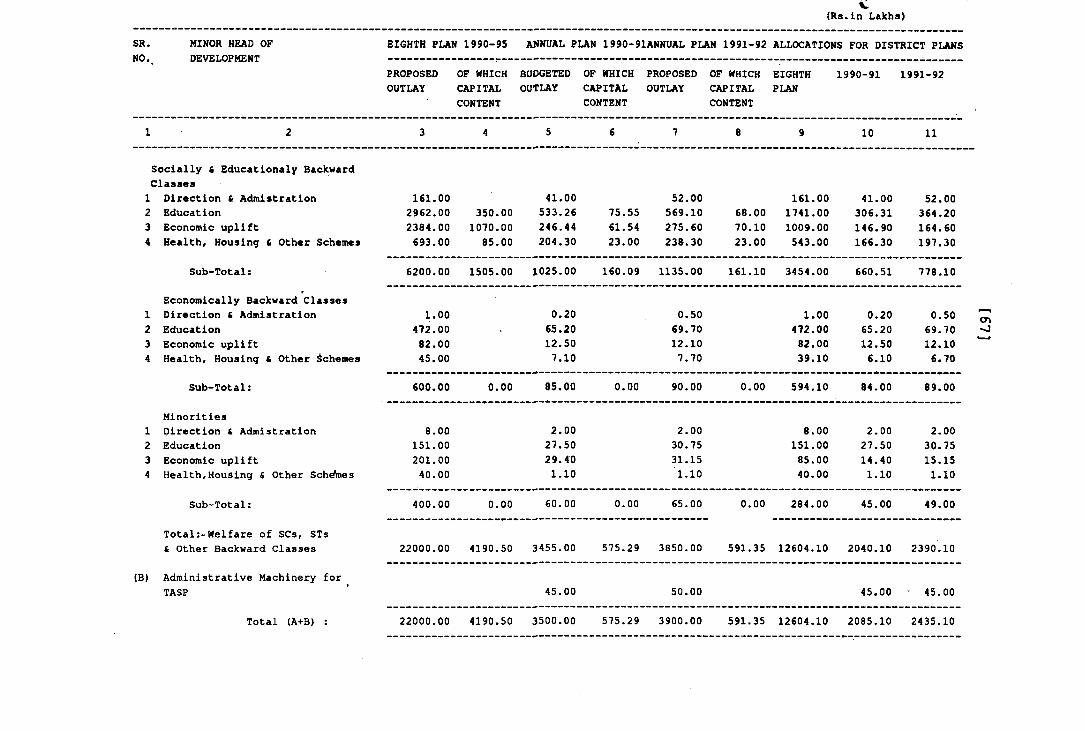
SR.NO.
MINOR HEAD OF DEVELOPMENT
EIGHTH PLAN 1990-95 ANNUAL PLAN 1990-91ANNUAL PLAN 1991-92 ALLOCATIONS FOR DISTRICT PLANS
PROPOSED OF WHICH BUDGETED OF WHICH PROPOSED OF WHICH EIGHTH 1990-91 1991-92OUTLAY CAPITAL OUTLAY CAPITAL OUTLAY CAPITAL PLAN
CONTENT
V
(Rs.in Lakhs)
CONTENT
4
CONTENT
6 8 10 11
6200.00 1505.00 1025.00
Socially i Educationaly Backward Classes1 Direction « Admistration 161.00 41.00 52.00 161.002 Education 2962.00 350.00 533.26 75.55 569.10 68.00 1741.003 Economic uplift 2384.00 1070.00 246.44 61.54 275.60 70.10 1009.004 Health, Housing « Other Schemes 693.00 85.00 204.30 23.00 238.30 23.00 543.00
Sub-Total:
Economically Backward Classes1 Direction fi Admistration 1.00 0.202 Education 472.00 65.203 Economic uplift 82.00 12.504 Health/ Housing & Other Schemes 45.00 7.10
Sub-Total: 600.00 0.00 85.00 0.00 90.00 0.00 594.10
160.09 1135.00
0.5069.7012.107.70
161.10 3454.00
1.00
472.0082.0039.10
41.00306.31146.90166.30
660.51
0.2065.2012.506.10
84.00
52.00364.20164.60197.30
778.10
0.5069.7012.106.70
89.00
Minorities1 Direction & Admistration2 Education3 Economic uplift4 Health, Housing & Other Sch^es
Sub-Total:
8.00151.00201.00 40.00
400.00 0.00
2.0027.5029.401.10
60.00 0.00
2.0030.7531.15
1.10
65.00 0.00
8.00151.0085.0040.00
284.00
2.0027.5014.401.10
45.00
2.0030.7515.151.10
49.00
Total:.Welfare of SCs, STs & Other Backward Classes 22000.00 4190.50 3455.00 575.29 3850.00 591.35 12604.10 2040.10 2390.10
(B) Administrative Machinery for TASP
Total (A+B) :
45.00
22000.00 4190.50 3500.00
50.00
575.29 3900.00 591.35 12604.10
45.00
2085.10
• 45.00
2435.10
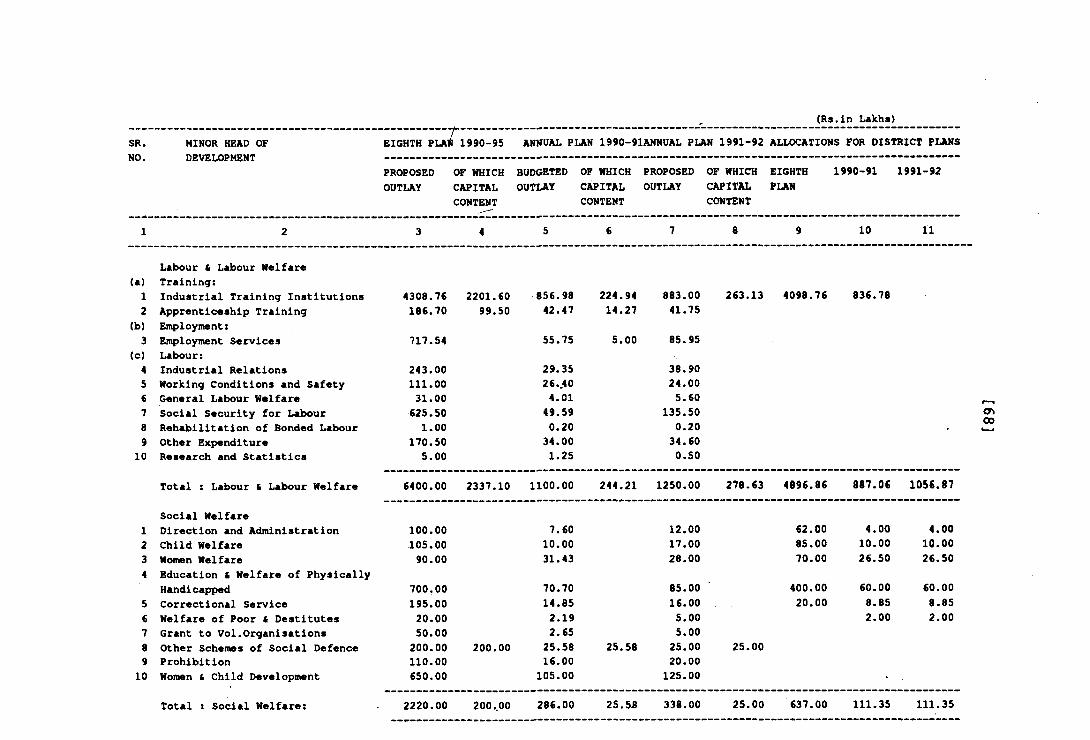
(Rs.in Lakhs)SR. MINOR HEAD OF
rvftftPTEIGHTH PLAiT :1990-95 ANNUAL PLAN 1990-91ANNUAL PLAN 1991-92 ALLOCATIONS FOR DISTRICT PLANS
NO* DEVELOPMENTPROPOSED OF WHICH BUDGETED OF WHICH PROPOSED OF WHICH EIGHTH 1990-91 1991-92OUTLAY CAPITAL OUTLAY CAPITAL OUTLAY CAPITAL PLAN
CONTENT CONTENT CONTENT
1 2 3 4 5 6 7 8 9 10 11
Labour & Labour Welfare(a) Training:1 Industrial Training Institutions 4308.76 2201.60 856.98 224.94 883.00 263.13 4098.76 836.782 Apprenticeship Training 186.70 99.50 42.47 14.27 41.75
(b) Employment:3 Employment Services 717.54 55.75 5.00 85.95
(c) Labour:4 Industrial Relations 243.00 29.35 38.905 Working Conditions and Safety 111.00 26..40 24.006 General Labour Welfare 31.00 4.01 5.607 Social Security for Labour 625.50 49.59 135.508 Rehabilitation of Bonded Labour 1.00 0.20 0.209 Other Expenditure 170.50 34.00 34.6010 Research and Statistics 5.00 1.25 0.50
Total : Labour & Labour Welfare 6400.00 2337.10 1100.00 244.21 1250.00 278.63 4896.86 887.06 1056.87------- ------------------ ------------------------------------- ---------
Social Welfare1. Direction and Administration 100.00 7.60 12.00 62.00 4.00 4.002 Child Welfare 105.00 10.00 17.00 85.00 10.00 10.003 Women Welfare 90.00 31.43 28.00 70.00 26.50 26.504 Education & Welfare of Physically
Handicapped 700.00 70.70 85.00 400.00 60.00 60.005 Correctional Service 195.00 14.85 16.00 20.00 8.85 8.85€ Welfare of Poor £ Destitutes 20.00 2.19 5.00 2.00 2.007 Grant to Vol.Organisations 50.00 2.65 5.008 Other Schemes of Social Defence 200.00 200.00 25.58 25.58 25.00 25.009 Prohibition 110.00 16.00 20.00
10 Women i Child Development 650.00 105.00 125.00
Total : Social Welfare: 2220.00 200 ..00 286.00 25.5S 338.00 25.00 637.00 111.35 111.35__________ --- --------- --------------- -------------- -------------
ON00
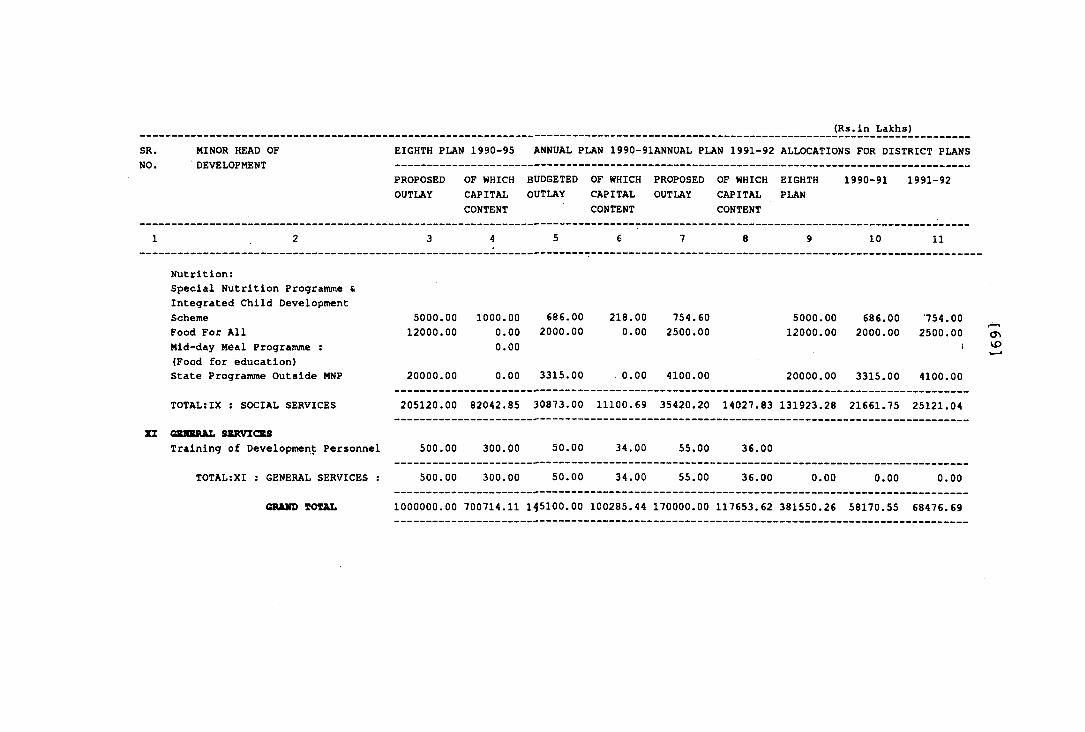
SR.NO.
MINOR HEAD OF DEVELOPMENT
EIGHTH PLAN 1990-95 ANNUAL PLAN 1990-91ANNUAL PLAN 1991-92 ALLOCATIONS FOR DISTRICT PLANS
PROPOSED OF WHICH BUDGETED OF WHICH PROPOSED OF WHICH EIGHTH 1990-91 1991-92OUTLAY CAPITAL OUTLAY CAPITAL OUTLAY CAPITAL PLAN
CONTENT CONTENT CONTENT
(Rs.ln Lakhs)
8 10 11
Nutrition:Special Nutrition Programme £ Integrated Child Development SchemeFood For AllMid-day Meal Programme ;(Food for education)State Programme Outside MNP
TOTAL;IX ; SOCIAL SERVICES
XI CaintRAI. 8BRVICSSTraining of Development Personnel
TOTAL:XI : GENERAL SERVICES :
(aUMD TOTAL
5000.00 1000.0012000.00
20000.00
0.00 2000.00 0.000.00 3315.00
686.00 218.00 754.600.00 2500.00
0.00 4100.00
5000.00 686.00 ‘754.0012000.00 2000.00 2500.00
20000.00 3315.00 4100.00
205120.00 82042.85 30873.00 11100.69 35420.20 14027.83 131923.28 21661.75 25121.04
500.00 300.00 50.00 34.00 55.00 36.00
500.00 300.00 50.00 34.00 55.00 36.00 0.00 0.00 0.00
1000000.00 700714.11 145100.00 100285.44 170000.00 117653.62 381550.26 58170.55 68476.69
cr»VD
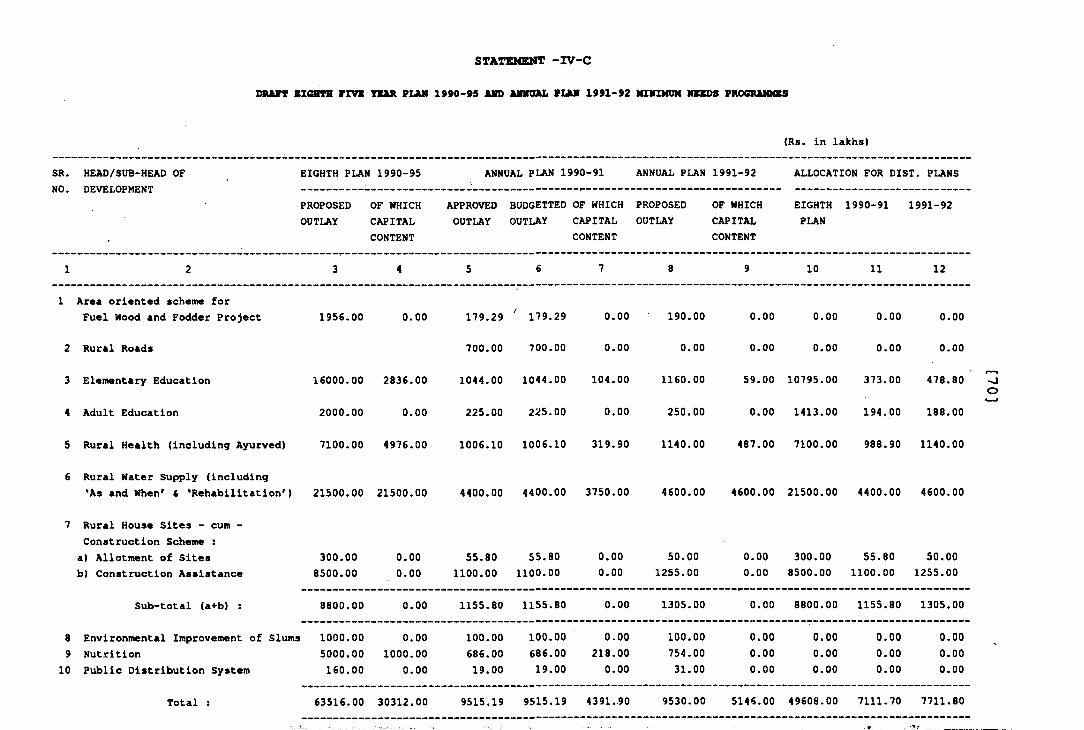
STATEMEMT -IV-COMTV KZGBTB FZVI YKMR PLAN 1990-95 AMD AmTOAL PUkM 1991-92 NnmfDM MSKDS PROOUMMBS
SR. HEAD/SUB-HEAD OF EIGHTH PLAN 1990-95 ANNUAL PLAN 1990-91 ANNUAL PLAN 1991-92 ALLOCATION FOR DIST. PLANS
(Rs. in lakhs)
nu. uc.vc.Liurne.n 1PROPOSEDOUTLAY
OF WHICHCAPITALCONTENT
APPROVEDOUTLAY
BUDGETTEDOUTLAY
OF WHICHCAPITALCONTENT
PROPOSEDOUTLAY
OF WHICHCAPITALCONTENT
EIGHTHPLAN
1990-91 1991-92
1 2 3 4 5 6 7 8 9 10 11 12
1 Area oriented scheme for Fuel Wood and Fodder Project 1956.00 0.00 179.29 ' 179.29 0.00 190.00 0.00 0.00 0.00 0.00
2 Rural Roads 700.00 700.00 0.00 0.00 0.00 0.00 0.00 0.00
3 Elementary Education 16000.00 2836.00 1044.00 1044.00 104.00 1160.00 59.00 10795.00 373.00 478.80
4 Adult Education 2000.00 0.00 225.00 225.00 0.00 250.00 0.00 1413.00 194.00 188.00
5 Rural Health (including Ayurved) 7100.00 4976.00 1006.10 1006.10 319.90 1140.00 487.00 7100.00 988.90 1140.00
6 Rural Water Supply (including 'As and When' t 'Rehabilitation') 21500.00 21500.00 4400.00 4400.00 3750.00 4600.00 4600.00 21500.00 4400.00 4600.00
7 Rural House Sites - cum - Construction Scheme :a) Allotment of Sitesb) Construction Assistance
300.008500.00
0.000.00
55.801100.00
55.801100.00
0.000.00
50.001255.00
0.000.00
300.008500.00
55.801100.00
50.001255.00
Sub-total (a+b) : 8800.00 0.00 1155.80 1155.80 0.00 1305.00 0.00 8800.00 1155.80 1305.00
89
10
Environmental Improvement of Slums 1000.00 Nutrition 5000.00 Public Distribution System 160.00
0.001000.00
0.00
100.00686.0019.00
100.00686.0019.00
0.00218.000.00
100.00754.0031.00
0.000.000.00
0.000.000.00
0.000.000.00
0.000.000.00
Total : 63516.00 30312.00 9515.19 9515.19 4391.90 9530.00 5146.00 49608.00 7111.70 7711.80
■>JO
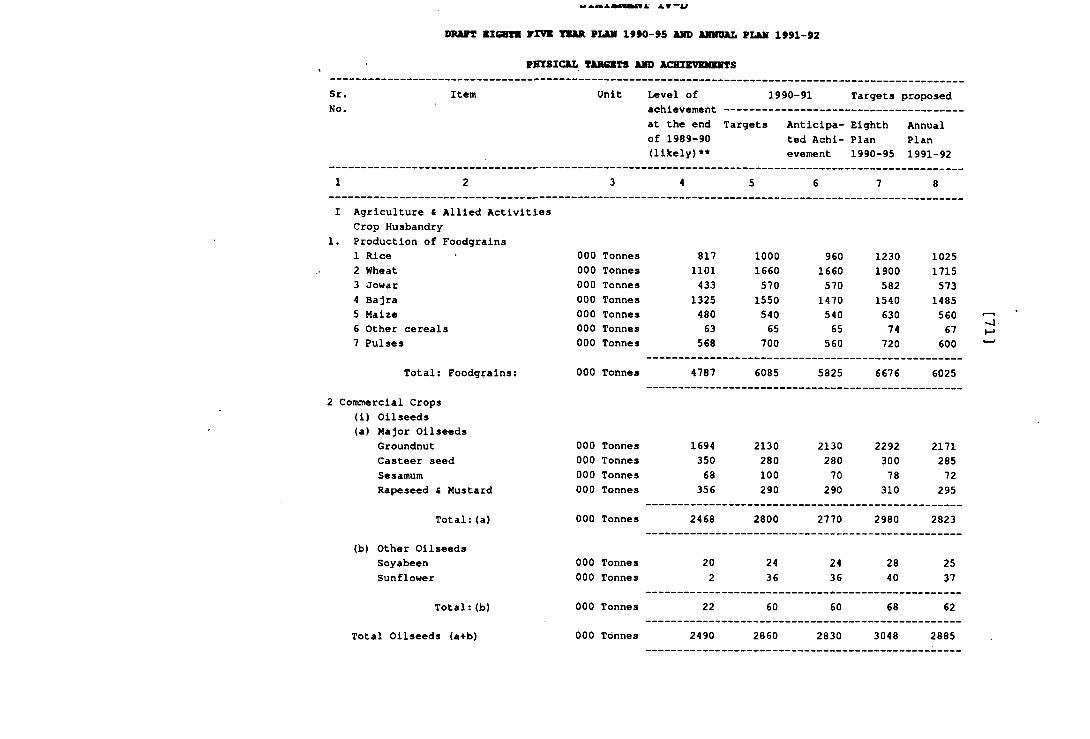
lA XV—
DRAFT BXGBTH VXVX TSAR PXAM 1990-95 AMD AimDIAL PLAM 1991-92
PHYSICAL TARCBTS AMD ACBZKVSMBMTS
Sr. Item Unit Level of 1990-91 Targets proposedNo. achievement ------------------------- ---------
at the end Targets Anticipa- Eighth Annualof 1989-90 ted Achi- Plan Plan(likely)** evement 1990-95 1991-92
1 2 3 4 5 6 7 8
1.Agriculture & Allied Activities Crop Husbandry Production of Foodgrains1 Rice 000 Tonnes 817 1000 960 1230 10252 Wheat 000 Tonnes 1101 1660 1660 1900 17153 Jowar 000 Tonnes 433 570 570 582 5734 Bajra 000 Tonnes 1325 1550 1470 1540 14855 Maize 000 Tonnes 480 540 540 630 5606 Other cereals 000 Tonnes 63 65 65 74 677 Pulses 000 Tonnes 568 700 560 720 600
Total: Foodgrains:
Commercial Crops (i) Oilseeds (a) Major Oilseeds
000 Tonnes 4787 6085 5825 6676 6025
Groundnut 000 Tonnes 1694 2130 2130 2292 2171Casteer seed 000 Tonnes 350 280 280 300 285Sesamum 000 Tonnes 68 100 70 78 72Rapeseed & Mustard 000 Tonnes 356 290 290 310 295
Total:(a)
(b) Other Oilseeds
000 Tonnes 2468 2800 2770 2980 2823
Soyabeen 000 Tonnes 20 24 24 28 25Sunflower 000 Tonnes 2 36 36 40 37
Total;(b) 000 Tonnes 22 60 60 68 62
Total Oilseeds (a+b) 000 Tonnes 2490 2860 2830 3048 2885
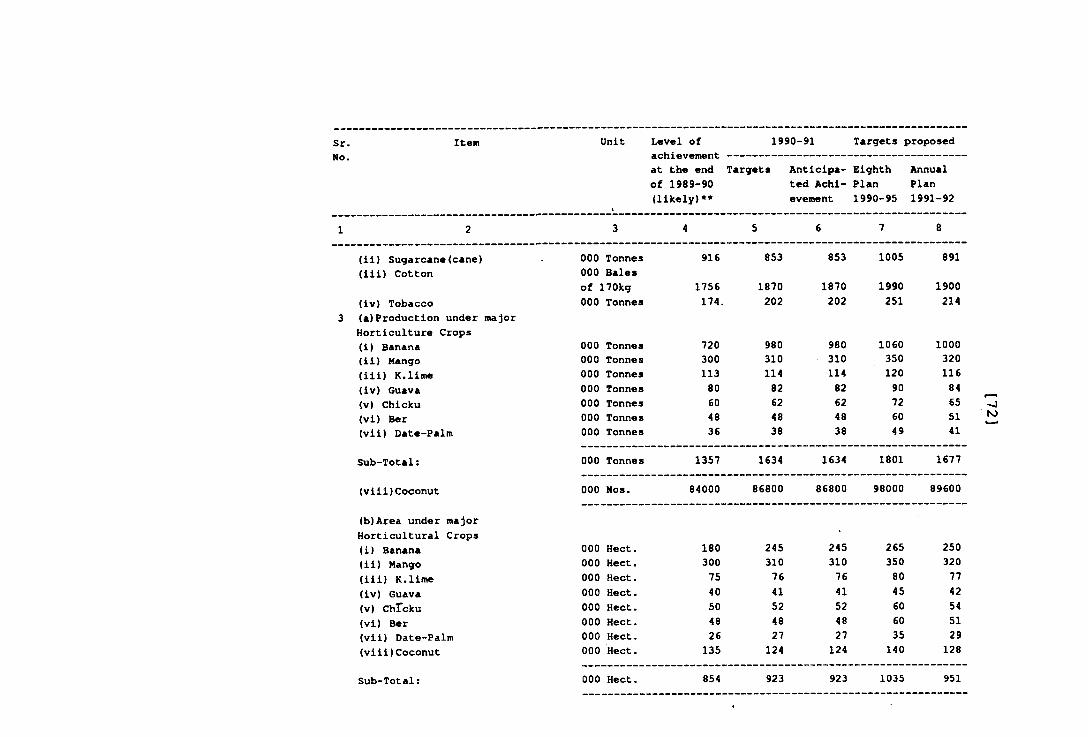
Sr. Item Unit Level of 1990-91 Targets proposedNO. acnievemenb
at the end Targets Anticipa Eighth Annualof 1989-90 ted Achi Plan Plan(likely)** evement 1990-95 1991-92
1 2 3 4 5 6 7 8
(ii) Sugarcane(cane) 000 Tonnes 916 853 853 1005 891(iii) Cotton 000 Bales
of 170kg 1756 1870 1870 1990 1900(iv) Tobacco 000 Tonnes 174. 202 202 251 214
3 (a)Production under major Horticulture Crops(i) Banana 000 Tonnes 720 980 980 1060 1000(ii) Mango 000 Tonnes 300 310 310 350 320(iii) K.lime 000 Tonnes 113 114 114 120 116(iv) Guava 000 Tonnes 80 82 82 90 84(v) Chicku 000 Tonnes 60 62 62 72 65(vi) Ber 000 Tonnes 48 48 48 60 51(vii) Date-Palm 000 Tonnes 36 38 38 49 41
Sub-Total; 000 Tonnes 1357 1634 1634 1801 1677
(viii)Coconut 000 Nos. 84000 86800 86800 98000 89600
(b)Area under majorHorticultural Crops(i) Banana 000 Hect. 180 245 245 265 250(ii) Mango 000 Hect. 300 310 310 350 320(iii) K.lime 000 Hect. 75 76 76 80 77(iv) Guava 000 Hect. 40 41 41 45 42(v) ChTcku 000 Hect. 50 52 52 60 54(vi) Ber 000 Hect. 48 48 48 60 51(vii) Date-Palm 000 Hect. 26 27 27 35 29(viii)Coconut 000 Hect. 135 124 124 140 128
Sub-Total: 000 Hect. 854 923 923 1035 951
to
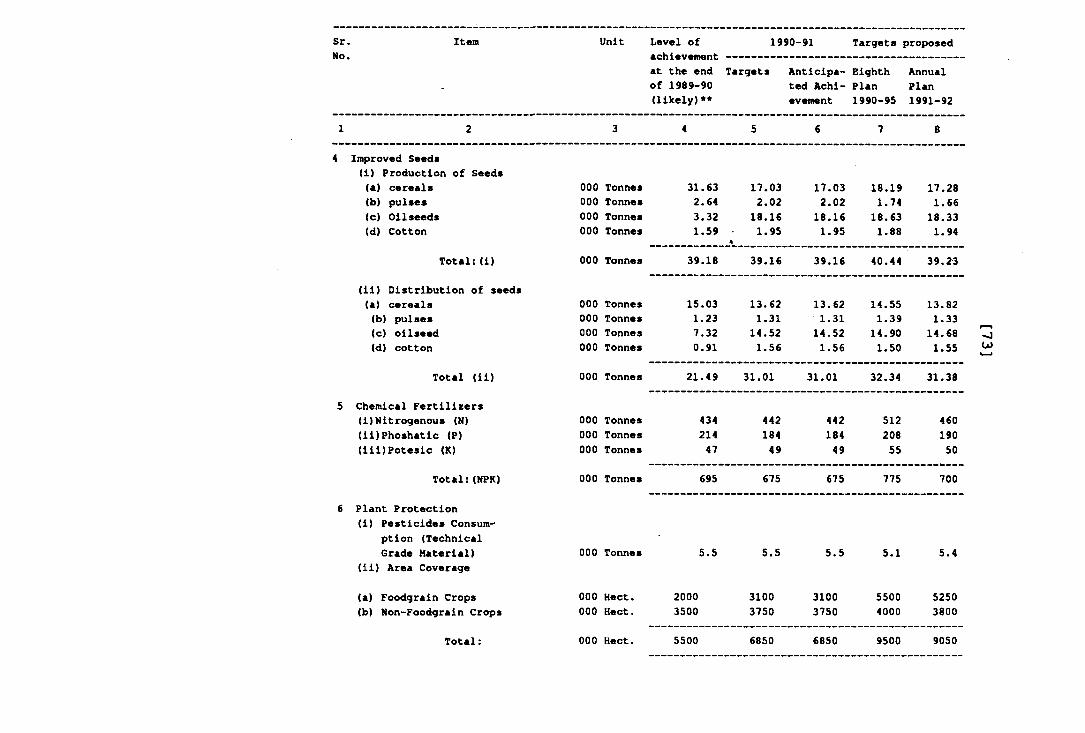
Sr.No.
Item Unit
Plant Protection(I) Pesticides Consum
ption (Technical Grade Material)
(II) Area Coverage
(a) Foodgraln Crops(b) Non-Foodgraln Crops
Level of achievement at the end Targets Antlclpa- Eighth Annual
1990-91 Targets proposed
of 1989-90 (likely)**
ted Achievement
Plan1990-95
Plan1991-92
1 2 3 4 5 6 7 8
4 Improved Seeds(1) Production of Seeds(a) cereals 000 Tonnes 31.63 17.03 17.03 18.19 17.28(b) pulses 000 Tonnes 2.64 2.02 2.02 1.74 1.66(c) Oilseeds 000 Tonnes 3.32 18.16 18.16 18.63 18.33(d) Cotton 000 Tonnes 1.59
*1.95 1.95 1.88 1.94
Total:(1) 000 Tonnes 39.18 39.16 39.16 40.44 39.23
(11) Distribution of seeds(a) cereals 000 Tonnes 15.03 13.62 13.62 14.55 13.82(b) pulses 000 Tonnes 1.23 1.31 1.31 1.39 1.33(c) oilseed 000 Tonnes 7.32 14.52 14.52 14.90 14.68(d) cotton 000 Tonnes 0.91 1.56 1.56 1.50 1.55
Total (11) 000 Tonnes 21.49 31.01 31.01 32.34 31.38
5 Chemical Fertilizers(1)Nitrogenous (N) 000 Tonnes 434 442 442 512 460(ll)Phoshatlc (P) 000 Tonnes 214 184 184 208 190(lil)Poteslc (K) 000 Tonnes 47 49 49 55 50
Total;(NPK) 000 Tonnes 695 675 675 775 700
000 Tonnes
000 Hect. 000 Hect.
5.5
20003500
5.5
31003750
5.5
31003750
5.1 5.4
5500 52504000 3800
U)
Total: 000 Hect. 5500 6850 6850 9500 9050
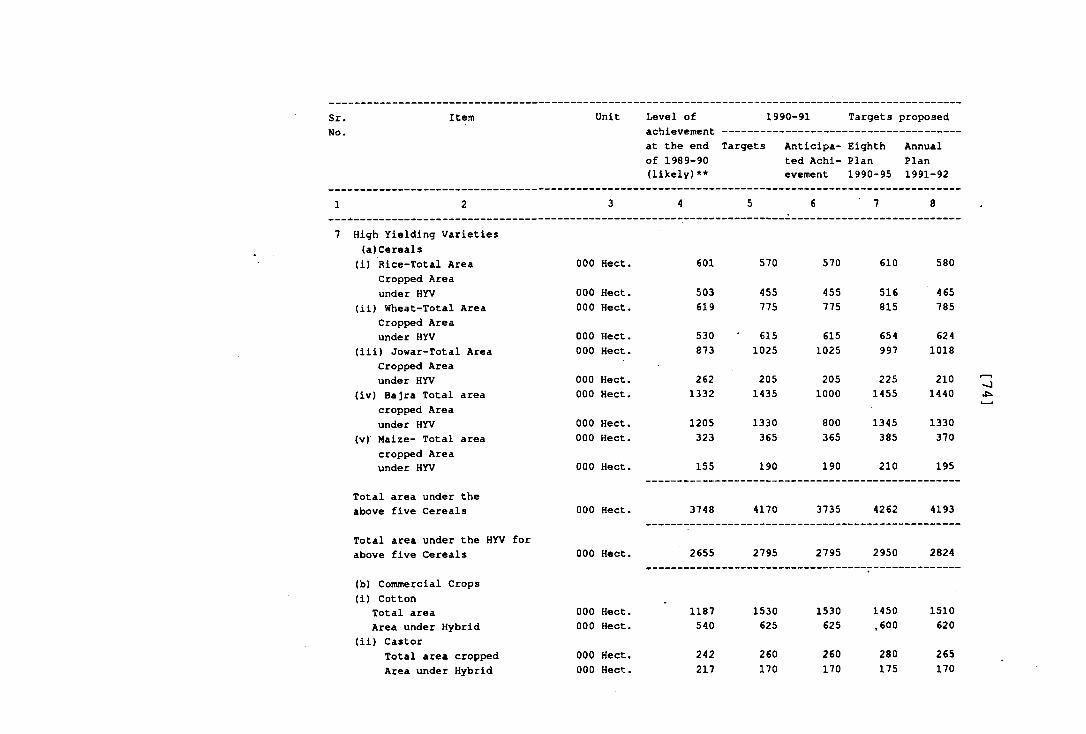
Sr. Item Unit Level of 1990-91 Targets proposedNo. achievement
at the end of 1989-90 (likely)**
Targets Anticipated Achievement
EighthPlan1990-95
AnnualPlan1991-92
1 2 3 4 5 6 7 8 •
7 High Yielding Varieties (a)Cereals(i) Rice-Total Area 000 Hect. 601 570 570 610 580
Cropped Area under HYV 000 Hect. 503 455 455 516 465
(ii) Wheat-Total Area 000 Hect. 619 775 775 815 785Cropped Area under HYV 000 Hect. 530 615 615 654 624
(iii) Jowar-Total Area 000 Hect. 873 1025 1025 997 1018Cropped Area under HYV 000 Hect. 262 205 205 225 210 1— 1
(iv) Bajra Total area 000 Hect. 1332 1435 1000 1455 1440cropped Area under HYV 000 Hect. 1205 1330 800 1345 1330
(v) Maize- Total area 000 Hect. 323 365 365 385 370cropped Area under HYV 000 Hect. 155 190 190 210 195
Total area under the above five Cereals 000 Hect. 3748 4170 3735 4262 4193
Total area under the HYV for above five Cereals 000 Hect. 2655 2795 2795 2950 2824
(b) Commercial Crops (i) Cotton
Total area 000 Hect. 1187 1530 1530 1450 1510Area under Hybrid 000 Hect. 540 625 625 ,600 620
(ii) CastorTotal area cropped 000 Hect. 242 260 260 280 265Area under Hybrid 000 Hect. 217 170 170 175 170
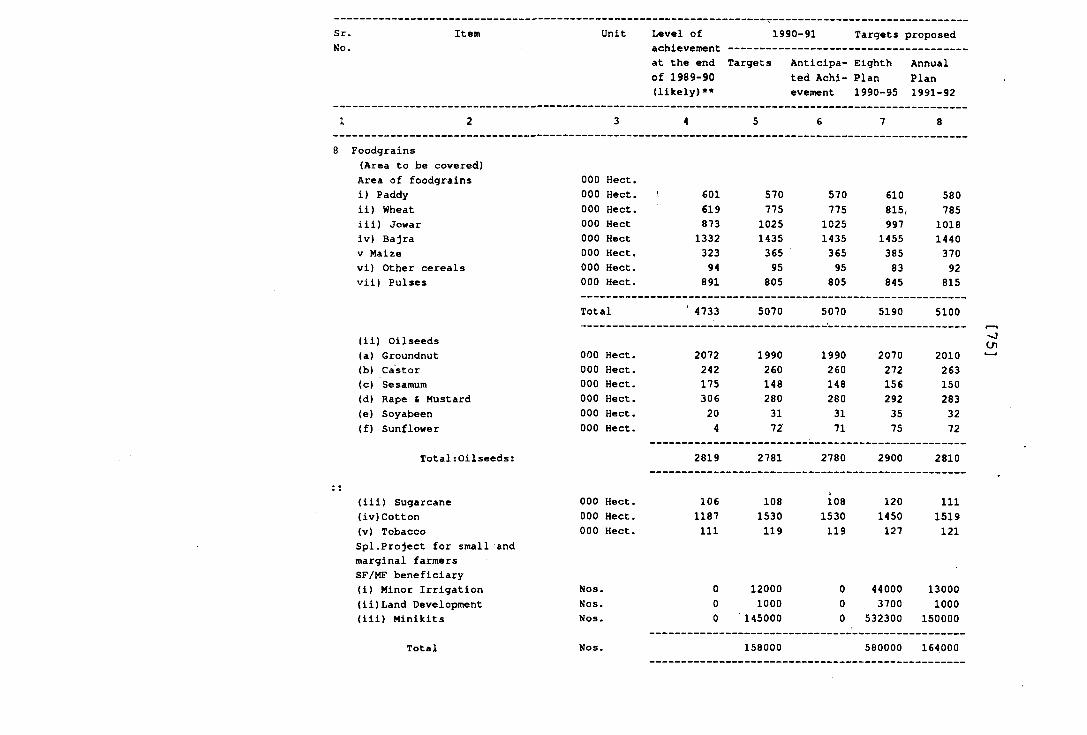
Sr.No.
Item Unit Level of 1990-91 Targets proposed
at the end Targets of 1989-90
Anticipa- Eighth Annualted Achi- Plan Plan
(likely)** evement 1990-95 1991-92
1 2 3 4 5 6 7 8
8 Foodgrains(Area to be covered)Area of foodgrains 000 Hect.i) Paddy 000 Hect. 1 601 570 570 610 580ii) Wheat 000 Hect. 619 775 775 815, 785iii) Jowar 000 Hect 873 1025 1025 997 1018iv) Bajra 000 Hect 1332 1435 1435 1455 1440V Maize 000 Hect. 323 365 365 385 370vi) Other cereals 000 Hect. 94 95 95 83 92vii) Pulses 000 Hect. 891 805 805 845 815
Total ' 4733 5070 5070 5190 5100
(ii) Oilseeds(a) Groundnut 000 Hect. 2072 1990 1990 2070 2010(b) Castor 000 Hect. 242 260 260 272 263(c) Sesamum 000 Hect. 175 148 148 156 150(d) Rape £ Mustard 000 Hect. 306 280 280 292 283(e) Soyabeen 000 Hect. 20 31 31 35 32(f) Sunflower 000 Hect. 4 72 71 75 72
Total:Oilseeds: 2819 2781 2780 2900 2810
(iii) Sugarcane 000 Hect. 106 108 io8 120 111(iv)Cotton 000 Hect. 1187 1530 1530 1450 1519(v) Tobacco 000 Hect. 111 119 119 127 121Spl.Project for small andmarginal farmersSF/MF beneficiary(i) Minor Irrigation Nos. 0 12000 0 44000 13000(ii)Land Development Nos. 0 1000 0 3700 1000(iii) Minikits Nos. 0 145000 0 532300 150000
Total Nos. 158000 580000 164000
Cn
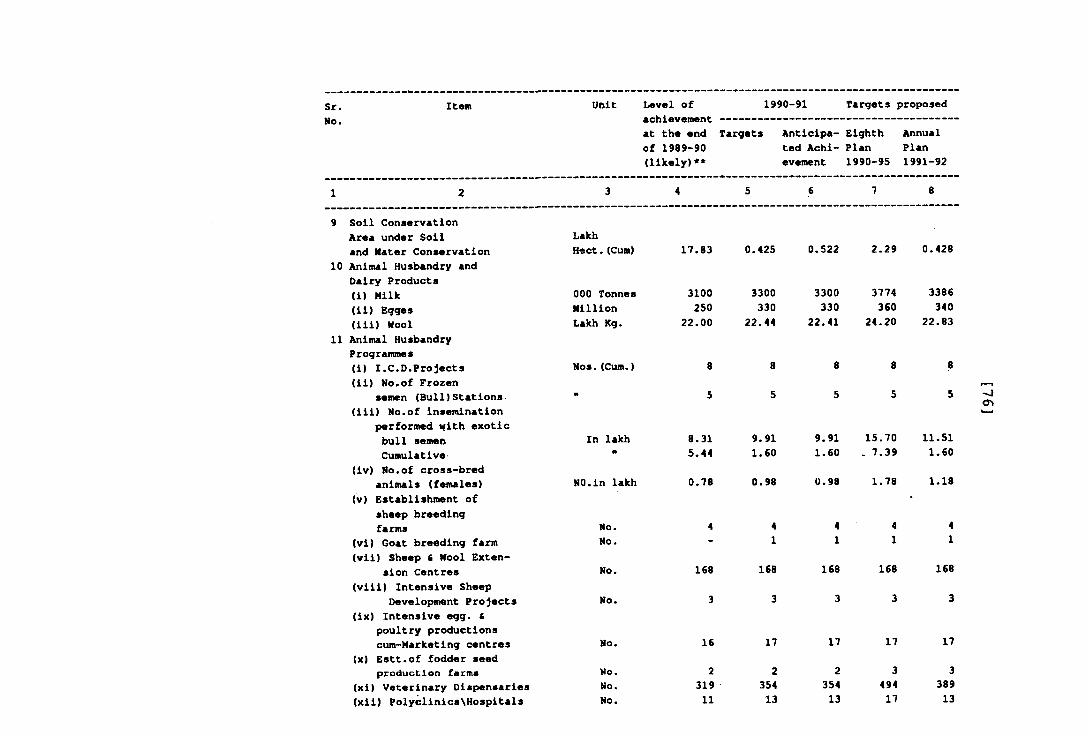
Sr. Item Unit Level of 1990-91 Targets proposedNo. achievement -------- ----------------- --------
at the end Targets Anticipa Eighth Annualof 1989-90 ted Achi Plan Plan(likely)** evement 1990-95 1991-92
1 2 3 4 5 6 7 8
9 Soli Conservation Area under Soli Lakhand Mater Conservation Hect.(Cum) 17.83 0.425 0.522 2.29 0.428
10 Animal Husbandry and Dairy Products(i) Milk 000 Tonnes 3100 3300 3300 3774 3386(ii) Bgges Million 250 330 330 360 340(iii) Wool Lakh Kg. 22.00 22.44 22.41 24.20 22.83
11 Animal Husbandry Programmes(i) I.C.D.Projects Nos.(Cum.) 8 8 8 8 8(ii) No.of Frozen
semen (Bull)Stations- II 5 5 5 5 5(iii) No.of insemination
performed «fith exoticbull semen In lakh 8.31 9.91 9.91 15.70 11.51Cumulative II 5.44 1.60 1.60 . 7.39 1.60
(iv) No.of cross-bredanimals (females) NO.in lakh 0.78 0.98 0.98 1.78 1.18
(v) Establishment of •sheep breedingfarms No. 4 4 4 4 4
(vi) Goat breeding farm No. - 1 1 1 1(vii) Sheep « Wool Exten
sion Centres No. 168 168 168 168 168(viii) Intensive Sheep
Development Projects No. 3 3 3 3 3(ix) Intensive egg. £
poultry productionscum-Mar)ceting centres No. 16 17 17 17 17
(X) Estt.of fodder seedproduction farms No. 2 2 2 3 3
(xi) Veterinary Dispensaries No. 319 354 354 494 389(xii) Polyclinics\Hospitals No. 11 13 13 17 13
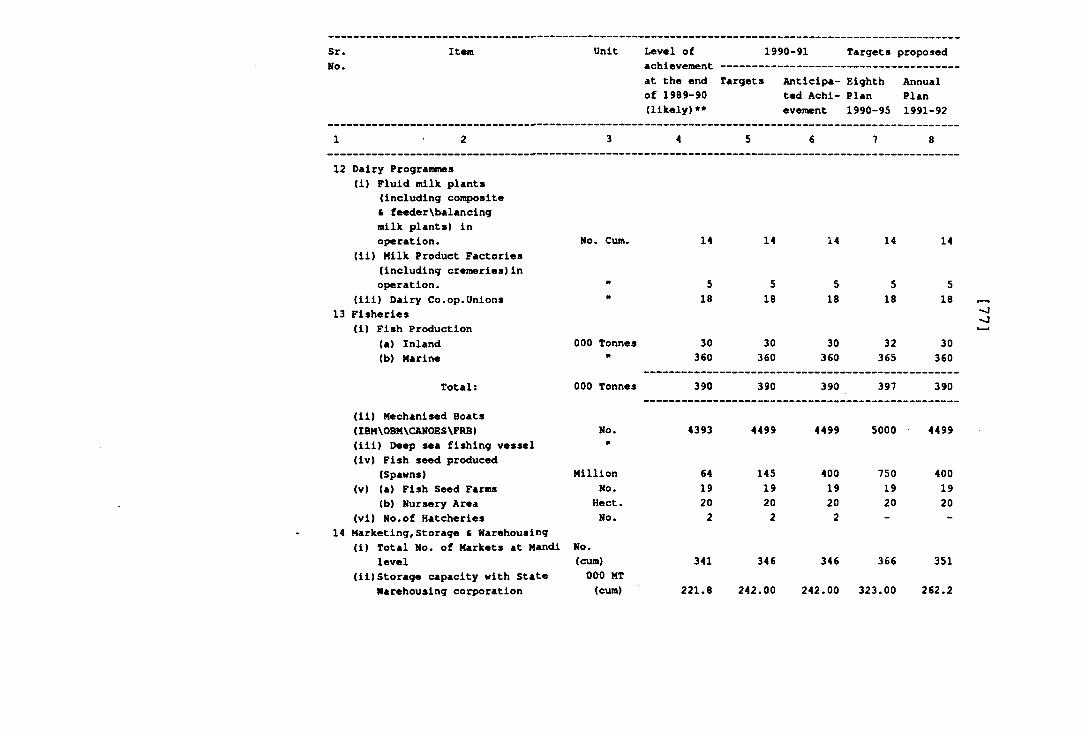
Sr.No.
Item Unit Level of 1990-91 Targets proposedachievement ----------------------------------at the end Targets Anticipa- Eighth Annualof 1989-90 ted Achi- Plan Plan(likely)** evement 1990-95 1991-92
812 Dairy Programmes
(i) Fluid milk plants (including coitqposite & feeder\balancing milk plants) inoperation. No. Cum. 14 14 14 14 14
(ii) Milk Product Factories(including cremeries)inoperation. Ii 5 5 5 5 5
(iii) Dairy Co.op.Unions m 18 18 18 18 18Fisheries(i) Fish Production
(a) Inland 000 Tonnes 30 30 30 32 30(b) Marine 11 360 360 360 365 360
Total: 000 Tonnes 390 390 390 397 390
(ii) Mechanised Boats(IBM\OBM\CANOES\FRB) No. 4393 4499 4499 5000 4499(iii) Deep sea fishing vessel m
(iv) Fish seed produced(Spawns) Million 64 145 400 750 400
(V) (a) Fish Seed Farms No. 19 19 19 19 19(b) Nursery Area Hect. 20 20 20 20 20
(vi) No.of Hatcheries No. 2 2 2 - -Marketing,Storage & Warehousing(i) Total No. of Markets at Mandi No.
level (cum) 341 346 346 366 351(ii)Storage capacity with State 000 MT
Warehousing corporation (cum) 221.8 242.00 242.00 323.00 262.2
■-J
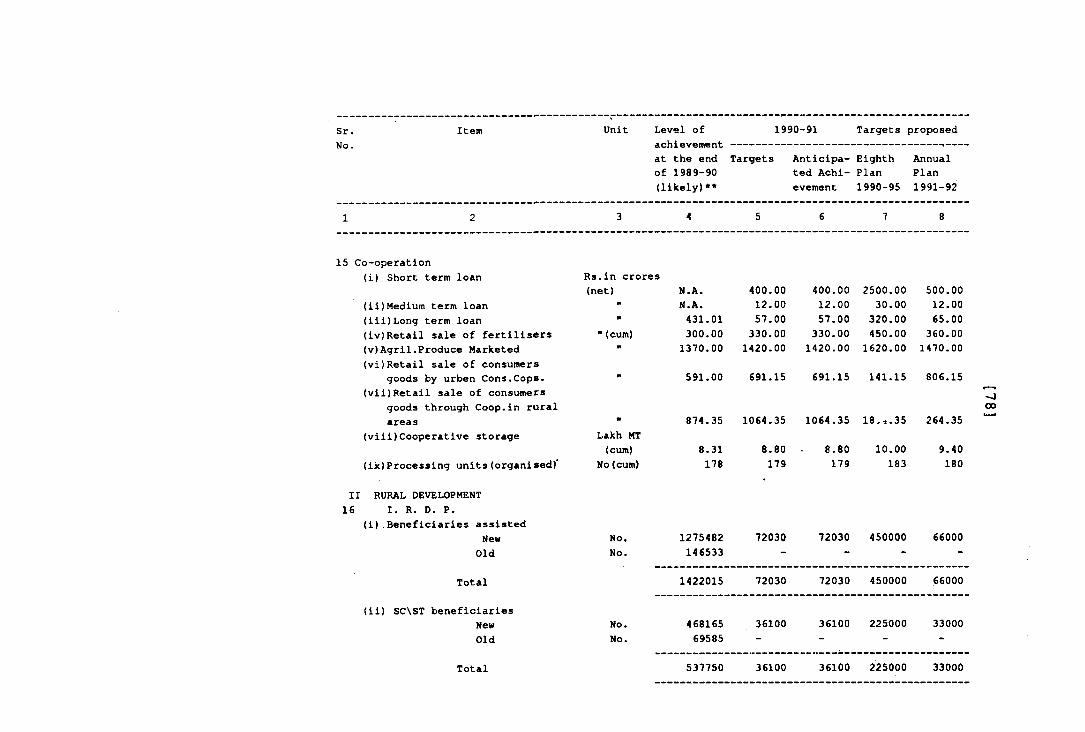
Sr. Item Unit Level of 1990-91 Targets proposedNo. achievement-------------------------------- ---
at the end Targets Anticipa- Eighth Annualof 1989-90 ted Achi- Plan Plan(likely)** evement 1990-95 1991-92
1 2 3 4 5 6 7 8
15 Co-operation(i) Short term loan Rs.in crores
II16
(net) N.A. 400.00 400.00 2500.00 500.00(ii)Medium term loan •• N.A. 12.00 12.00 30.00 12.00(iii)Long term loan n 431.01 57.00 57.00 320.00 65.00(iv)Retail sale of fertilisers "(cum) 300.00 330.00 330.00 450.00 360.00(v)Agril.Produce Marketed(vi)Retail sale of consumers
fl 1370.00 1420.00 1420.00 1620.00 1470.00
goods by urben Cons.Cops, (vii)Retail sale of consumers
goods through Coop.in rural
591.00 691.15 691.15 141.15 806.15
areas(viii)Cooperative storage
MLakh MT
874.35 1064.35 1064.35 18.-1.35 264.35
(cum) 8.31 8.80 8.80 10.00 9.40(ix) Processing units (organised)'
RURAL DEVELOPMENT I. R. D. P.
(i).Beneficiaries assisted
No(cum) 178 179 179 183 180
New No. 1275482 72030 72030 450000 66000Old No. 146533 - - - -
----------------- -------- -------Total
(ii) SC\ST beneficiaries
1422015 72030 72030 450000 66000
New No. 468165 36100 36100 225000 33000Old No. 69585
_____ ___Total 537750 36100 36100 225000 33000
00
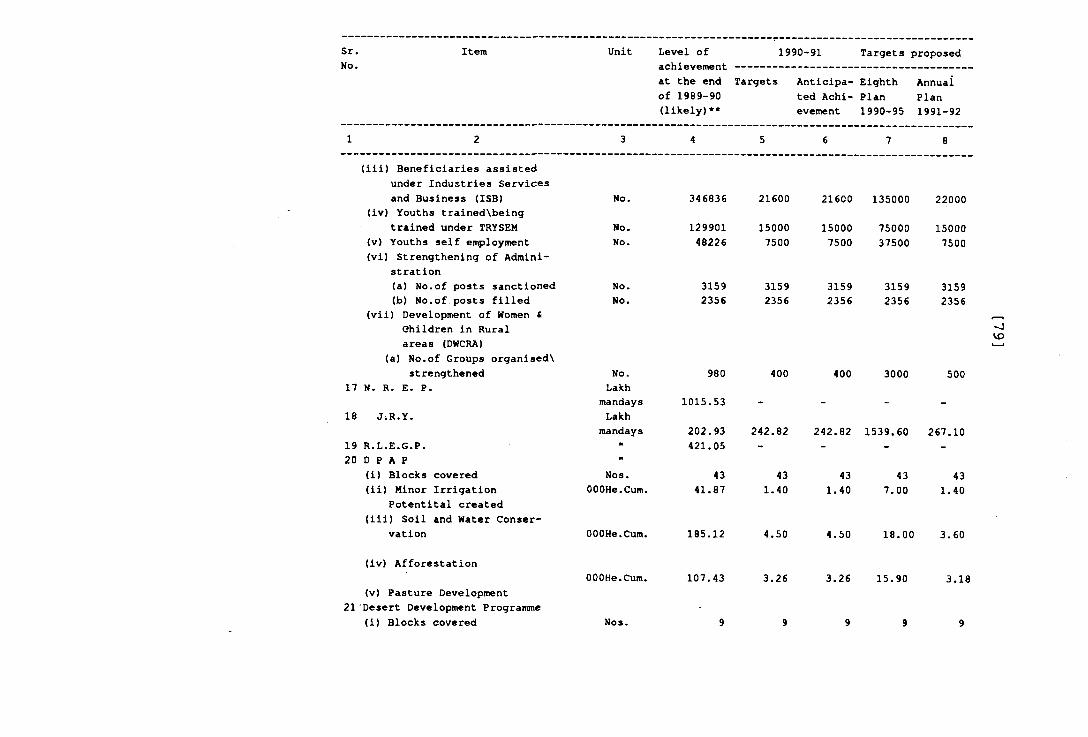
Sr. Item Unit Level of 1990-91 Targets proposedNo. achievement -------- --------- -------- ---------
at the end Targets Anticipa Eighth Annualof 1989-90 ted Achi Plan Plan(likely)** evement 1990-95 1991-92
1 2 3 4 5 6 7 8
(iii) Beneficiaries assistedunder Industries Servicesand Business (ISB) No. 346836 21600 21600 135000 22000
(iv) Youths trainedXbeingtrained under TRYSEM No. 129901 15000 15000 75000 15000
(v) Youths self employment No. 48226 7500 7500 37500 7500(vi) Strengthening of Admini
stration(a) No.of posts sanctioned No. 3159 3159 3159 3159 3159(b) No.of posts filled No. 2356 2356 2356 2356 2356
(vii) Development of Women tChildren in Ruralareas (DWCRA)
(a) No.of Groups organisedVstrengthened No. 980 400 400 3000 500
17 N. R. E. P. Lakhmandays 1015.53 - - - -
18 JiR.Y. Lakhmandays 202.93 242.82 242.82 1539.60 267.10
19 R.L.E.G.P. H 421.05 - - - -20 D P A P m
(i) Blocks covered Nos. 43 43 43 43 43(ii) Minor Irrigation OOOHe.Cum. 41.87 1.40 1.40 7.00 1.40
Potentital created(iii) Soil and Water Conser
vation OOOHe.Cum. 185.12 4.50 4.50 18.00 3.60
(iv) AfforestationOOOHe.Cum. 107.43 3.26 3.26 15.90 3.18
(v) Pasture Development21 Desert Development Programme
(i) Bloc)cs covered Nos. 9 9 9 9 9
-J
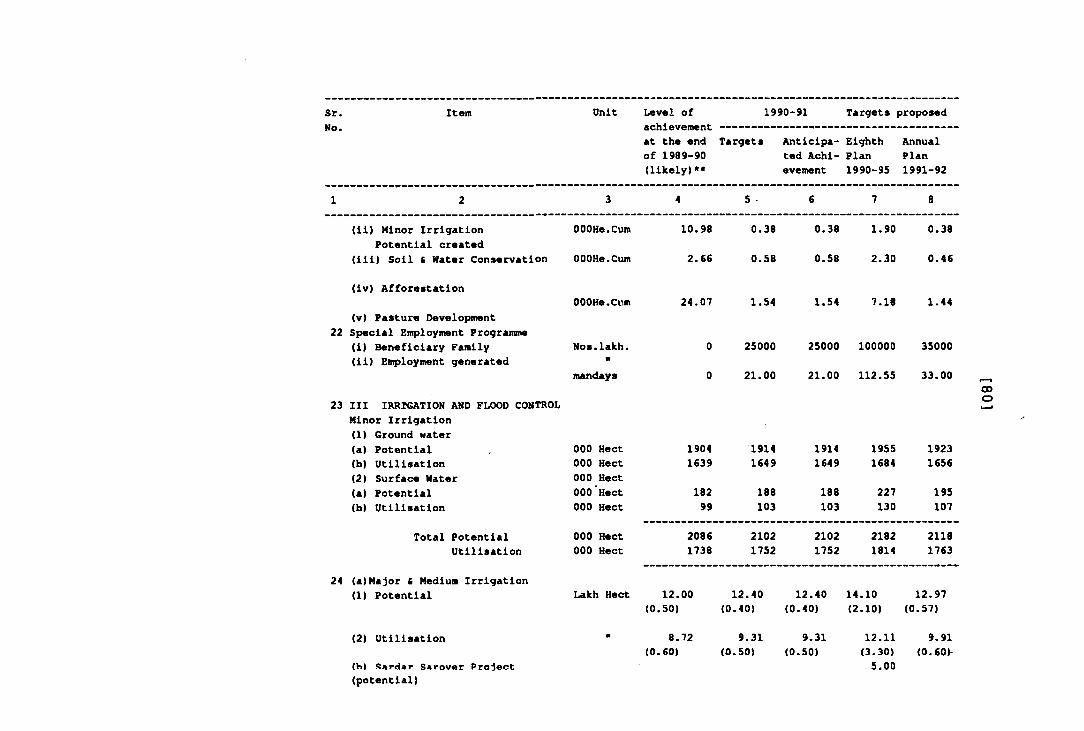
Sr.No.
Item
at the end Targets Antlcipa- Eighth Annualof 1989-90 ted Achi- Plan Plan(likely)** evement 1990-95 1991-92
Unit Level of 1990-91 Targets proposed
1 2 3 4 5 - 6 7 8
(ii) Minor Irrigation OOOHe.Cum 10.98 0.38 0.38 1.90 0.38Potential created
(iii) Soil & Water Conservation OOOHe.Cum 2.66 0.58 0.58 2.30 0.46
(iv) AfforestationOOOHe.Cum 24,07 1.54 1.54 7.18 1.44
(v) Pasture Development22 Special Employment Programme
(i) Beneficiary Family Nos.lakh. 0 25000 25000 100000 35000(ii) Employment generated II
mandays 0 21.00 21.00 112.55 33.00
23 H I IRRIGATION AND FLOOD CONTROLMinor Irrigation(1) Ground water(a) Potential 000 Hect 1904 1914 1914 1955 1923(b) Utilisation 000 Hect 1639 1649 1649 1684 1656(2) Surface Hater 000 Hect(a) Potential 000’Hect 182 188 188 227 195(b) Utilisation 000 Hect 99 103 103 130 107
Total Potential 000 Hect 2086 2102 2102 2182 2118Utilisation 000 Hect 1738 1752 1752 1814 1763
24 (a)Major i Medium Irrigation(1) Potential Lakh Hect 12.00 12.40 12.40 14.10 12.97
(0.50) (0.40) (0.40) (2.10) (0.57)
(2) Utilisation 8.72 9.31 9.31 12.11 9.91(0.60) (0.50) (0-50) (3-30) (0.60)
(V») sirdar SarovAr Project 5.00
CDO
(potential)
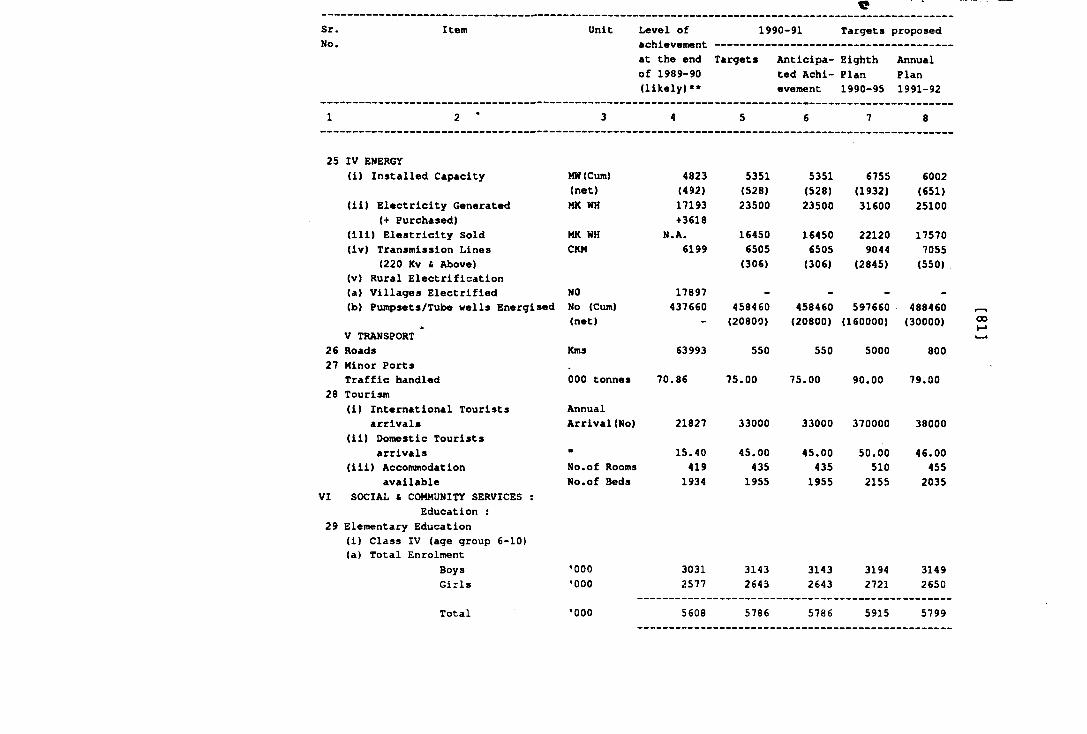
Sr. Item Unit Level of 1990-91 Targets proposedNo. achievement
at the end Targets Anticipa Eighth Annualof 1989-90 ted Achi Plan Plan(likely)** evement 1990-95 1991-92
1 2 * 3 4 5 6 7 8
25 IV ENERGY(i) Installed Capacity MH(Cum) 4823 5351 5351 6755 6002
(net) (492) (528) (528) (1932) (651)(11) Electricity Generated MK WH 17193 23500 23500 31600 25100
(+ Purchased) +3618(ill) Elestrlclty Sold MK WH N.A. 16450 16450 22120 17570(Iv) Transmission Lines CKM 6199 6505 6505 9044 7055
(220 Kv £ Above) (306) (306) (2845) (550)(v) Rural Electrification(a) Villages Electrified NO 17897 - - - -(b) Puit5>sets/Tube wells Energised No (Cum) 437660 458460 458460 597660 488460
(net) - (20800) (20800) (160000) (30000)V TRANSPORT
26 Roads Kms 63993 550 550 5000 80027 Minor Ports
Traffic handled 000 tonnes 70.86 75.00 75.00 90.00 79.0028 Tourism
(1) International Tourists Annualarrivals Arrival(No) 21827 33000 33000 370000 38000
(11) Domestic Touristsarrivals n 15.40 45.00 45.00 50.00 46.00
(ill) Accommodation No.of Rooms 419 435 435 510 455available No.of Beds 1934 1955 1955 2155 2035
VI SOCIAL fi COMMUNITY SERVICES : Education :
29 Elementary Education(i) Class IV (age group 6-10)(a) Total Enrolment
Boys '000 3031 3143 3143 3194 3149Girls *000 2577 2643 2643 2721 2650
Total '000 5608 5786 5786 5915 5799
oo
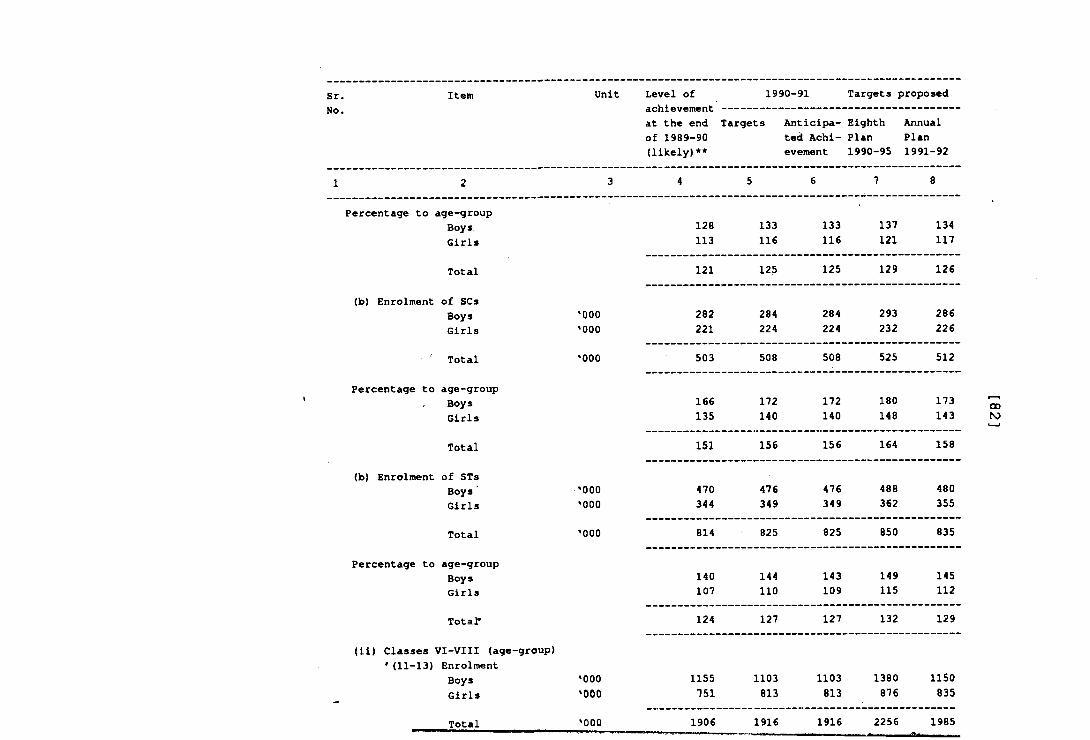
Sr.No.
Item
at the end Targets Anticipa- Eighth Annualof 1989-90 ted Achi- Plan Plan(likely)** evement 1990-95 1991-92
Unit Level of 1990-91 Targets proposed
8
Percentage to age-group Boys Girls
128113
133116
133116
137121
134117
Total
(b) Enrolment of SCs Boys Girls
121 125 125 129 126
'000‘000
282221
284224
284224
293232
286226
' Total
Percentage to age-group Boys Girls
*000 503 508 508 525 512
166135
172140
172140
180148
173143
00ro
Total
(b) Enrolment of STs Boys Girls
151 156 156 164 158
•000*000
470344
476349
476349
488362
480355
Total
Percentage to age-group Boys Girls
•000 814 825 825 850 835
140107
144110
143109
149115
145112
Total*
(ii) Classes VI-VIII (age-group) ' (11-13) Enrolment
Boys Girls
124 127 127 132 129
*000*000
1155751
1103813
1103813
1380876
1150835
Total *000 1906 1916 1916 2256 1985
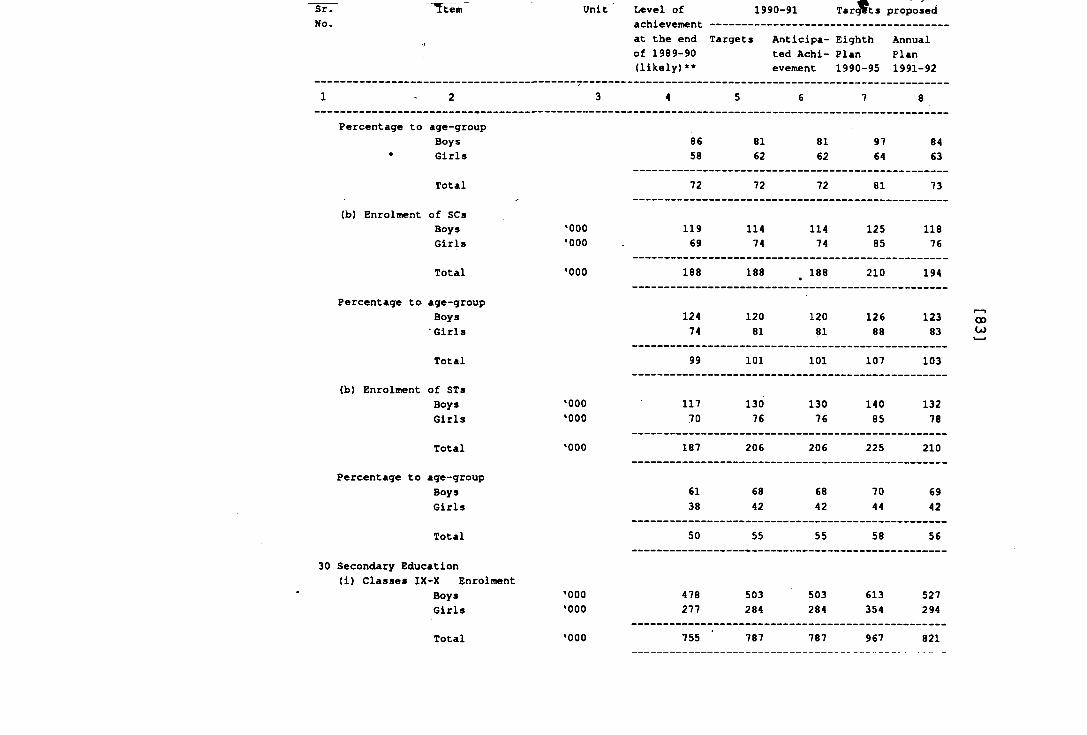
Sr. TtenT Unit Level of 1990-91 Tar^ts proposedNo.
■1
achievement at the end of 1989-90 (likely)**
Targets Anticipated Achievement
EighthPlan1990-95
AnnualPlan1991-92
1 2 3 4 5 6 7 8
Percentage to age-groupBoys 86 81 81 97 84Girls 58 62 62 64 63
Total 72 72 72 81 73
(b) Enrolment of SCsBoys *000 119 114 114 125 118Girls ’000 69 74 74 85 76
Total '000 188 188 188 210 194
Percentage to age-groupBoys 124 120 120 126 123■ Girls 74 81 81 88 83
Total 99 101 101 107 103
(b) Enrolment of STsBoys '000 117 130 130 140 132Girls '000 70 76 76 85 78
Total '000 187 206 206 225 210
Percentage to age-groupBoys 61 68 68 70 69Girls 38 42 42 44 42
Total 50 55 55 58 56
30 Secondary Education(1) Classes IX-X Enrolment
Boys Girls
*000*000
478277
503284
503284
613354
527294
00CO
Total •000 755 787 787 967 821
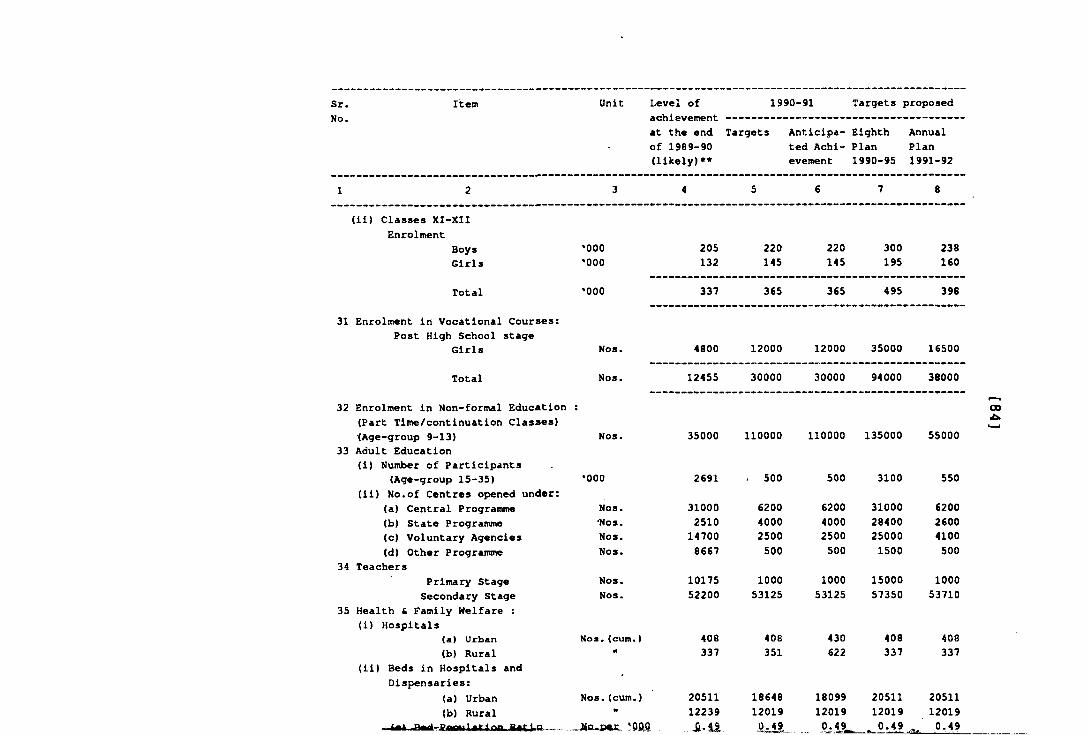
Sr.No.
Item Unit Level of achievement at the end of 1989-90 (likely)**
1990-91 Targets proposed
Targets Anticipa- Eighth Annualted Achi- Plan Planevement 1990-95 1991-92
1 2 3 4 5 6 7 8
(ii) Classes XI-XII Enrolment
Boys '000 205 220 220 300 238Girls '000 132 145 145 195 160
— -------- --- ----- ---------— ---- --- ------Total '000 337 365 365 495 396
31 Enrolment in Vocational Courses: Post High School stage
Girls Nos. 4800 12000 12000 35000 16500------------ ----- -- ------ ----- ----
Total Nos. 12455 30000 30000 94000 38000
32 Enrolment in Non-formal Education ;(Part Time/continuation Classes)(Age-group 9-13) Nos. 35000 110000 110000 135000 55000
33 Adult Education(i) Number of Participants
(Age-group 15-35) '000 2691 . 500 500 3100 550(ii) No.of Centres opened under:
(a) Central Programme Nos. 31000 6200 6200 31000 6200(b) State Programme •Nos. 2510 4000 4000 28400 2600(c) Voluntary Agencies Nos. 14700 2500 2500 25000 4100(d) Other Programme Nos. 8667 500 500 1500 500
34 TeachersPrimary Stage Nos. 10175 1000 1000 15000 1000Secondary Stage Nos. 52200 53125 53125 57350 53710
35 Health & Family Welfare : (i) Hospitals
(a) Urban Nos.(cum.) 408 408 430 408 408(b) Rural n 337 351 622 337 337
(ii) Beds in Hospitals andDispensaries:
(a) Urban Nos. (cum..) 20511 18648 18099 20511 20511(b) Rural 12239 12019 12019 12019 12019
1Q.01 Si.il 0.49 O.JL 0.49 , 0.49
00
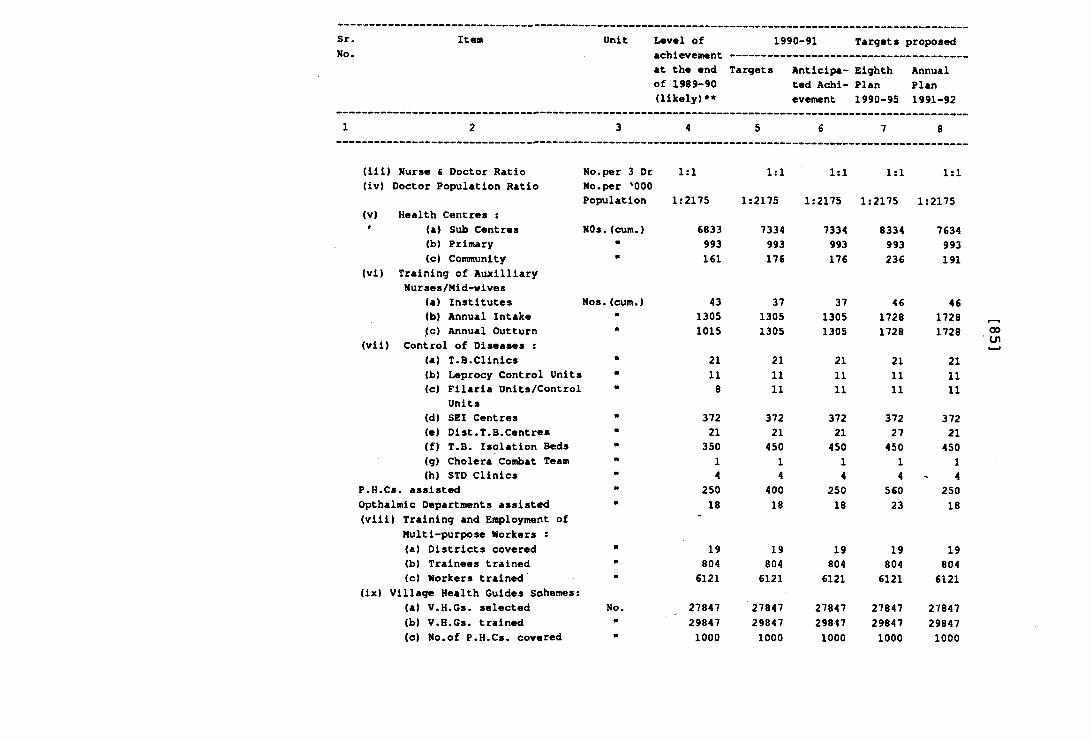
Sr.No.
Item Unit Level of 1990-91 Targets proposedachievement ------------------ ---------------at the end of 1989-90 (likely)**
Targets Anticipated Achievement
EighthPlan1990-95
AnnualPlan1991-92
1 2 3 4 5 6 7 8
(lit) Nurse fi Doctor Ratio(iv) Doctor Population Ratio
(v) Health Centres :
No.per 3 Dr No.per '000 Population
1:1
1:2175
1:1
1:2175
1:1
1:2175
1:1
1:2175
1:1
1:21759 (a) Sub Centres NOs.(cum.) 6833 7334 7334 8334 7634
(b) Primary m 993 993 993 993 993
(Vi)(c) Community
Training of Auxilliary Nurses/Mid-wives
n 161 176 176 236 191
(a) Institutes Nos.(cum.) 43 37 37 46 46(b) Annual Intake II 1305 1305 1305 1728 1728
(vii),(c} Annual Outturn
Control of Diseases :•1 1015 1305 1305 1728 1728
(a) T.B.Clinics • 21 21 21 21 21(b) Leprocy Control Units ■ 11 11 11 11 11<c) Filaria Units/Control
Unitsm 8 11 11 11 11
(d) SEI Centres n 372 372 372 372 372(e) Dist.T.B.Centres n 21 21 21 27 21(f) T.B. Isolation Beds m 350 450 450 450 450(g) Cholera Combat Team m 1 1 1 1 1(h) STD Clinics m 4 4 4 4 4
P.H.Cs. assisted m 250 400 250 560 250Opthalmic Departments assisted (viii) Training and Employment of
Multi-purpose Workers :
m 18 18 18 23 18
(a) Districts covered m 19 19 19 19 19(b) Trainees trained n 804 804 804 804 804(c) Workers trained
(ix) Village Health Guides Schemes:m 6121 6121 6121 6121 6121
(a) V.H.Gs. selected No. 27847 27847 27847 27847 27847(b) V.H.Gs. trained 29847 29847 29847 29847 29847(c) No.of P.H.Cs. covered 1000 1000 1000 1000 1000
00cn
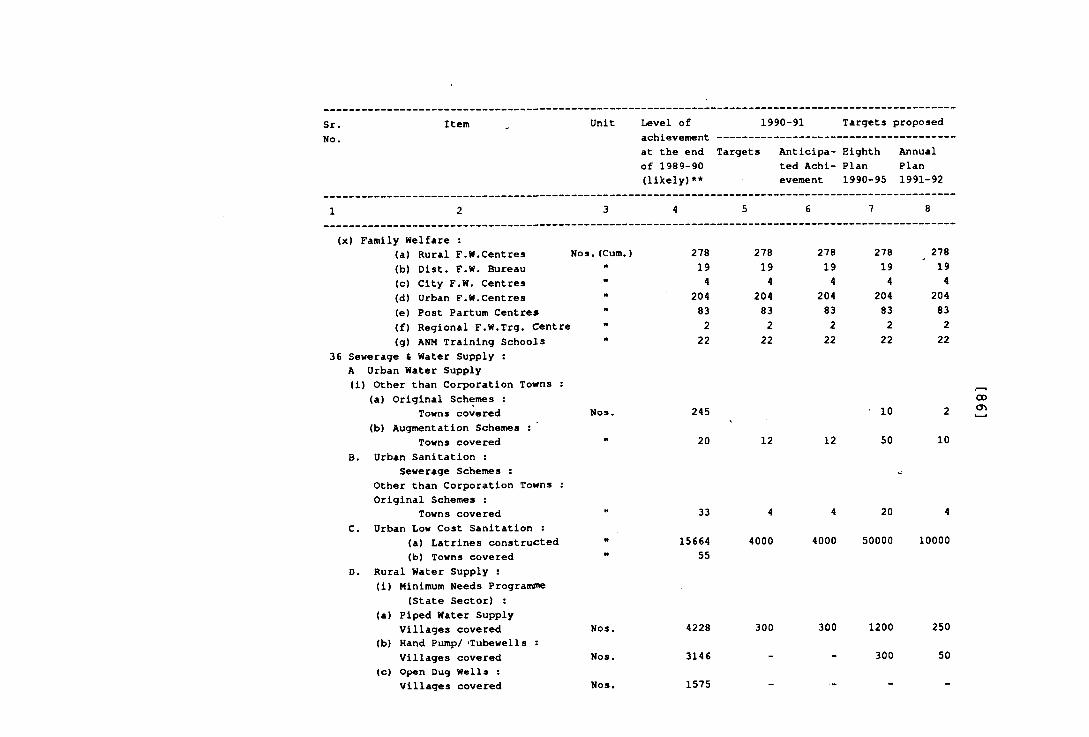
Sr.No.
Item Unit Level of 1990-91 Targets proposedachievement ---------------------------------at the end Targets Anticipa- Eighth Annualof 1989-90 ted Achi- Plan Plan(likely)** evement 1990-95 1991-92
8
(x) Family Welfare(a) Rural F.W.Centres Nos.(Cum.) 278 278 278 278 278(b) Dist. F.W. Bureau ft 19 19 19 19 19(c) City F.W. Centres m 4 4 4 4 4(d) Urban F.W.Centres m 204 204 204 204 204(e) Post Partum Centres ft 83 83 83 83 83(f) Regional F.W.Trg. Centre ft 2 2 2 2 2(g) ANM Training Schools ft 22 22 22 22 22
Sewerage & Water Supply :A Urban Water Supply(i) Other than Corporation Towns :
(a) Original Schemes :Towns covered Nos. 245 10 2
(b) Augmentation Schemes :Towns covered •t 20 12 12 50 10
B. Urban Sanitation :Sewerage Schemes : w
Other than Corporation Towns :Original Schemes :
Towns covered 33 4 4 20 4C. Urban Low Cost Sanitation :
(a) Latrines constructed ft 15664 4000 4000 50000 10000(b) Towns covered m 55
D. Rural Water Supply :(i) Minimum Needs Programme
(State Sector) :(a) Piped Water Supply
Villages covered(b) Hand Pump/ 'Tubewells :
Villages covered(c) Open Dug Wells ;
Villages covered
Nos.
Nos.
Nos.
4228
3146
1575
300 300 1200300
250
50
00
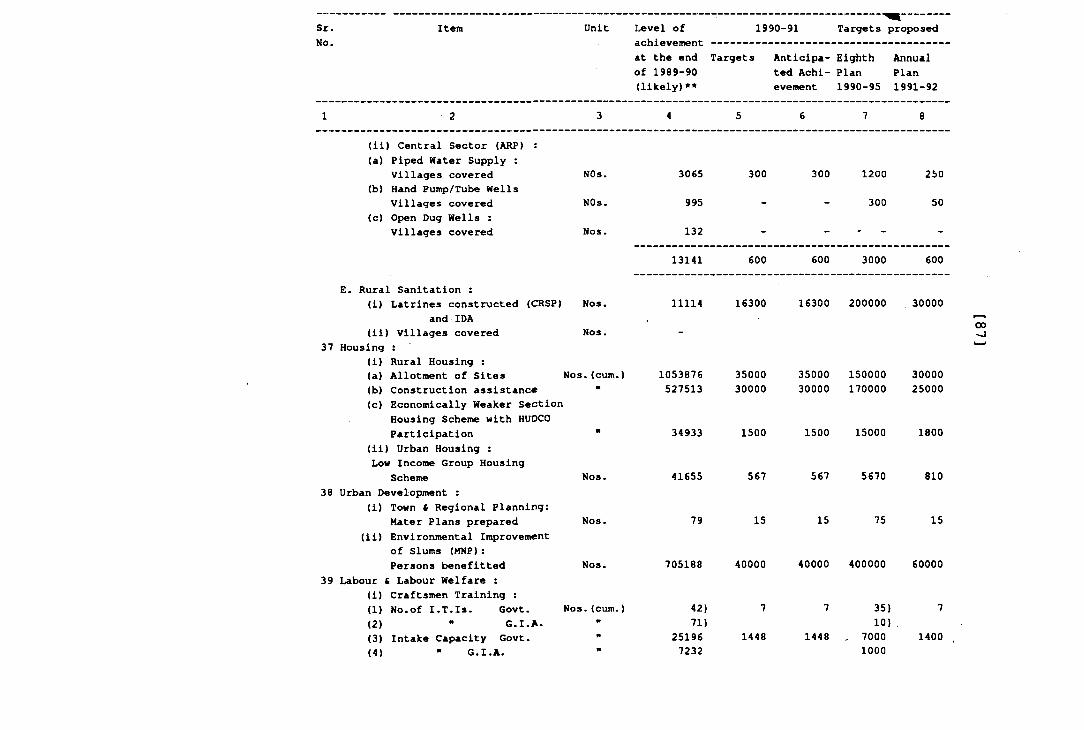
Sr. Item Unit Level of 1990-91 Targets proposedNo. achievement ----------------------------------
at the end Targets Anticipa- Eighth Annualof 1989-90 ted Achi- Plan Plan(likely)** evement 1990-95 1991-92
1 2 3 4 5 6 7 8
(ii) Central Sector (ARP) :(a) Piped Water Supply :
Villages covered NOs. 3065 300 300 1200 250(b) Hand Pump/Tube Wells
Villages covered NOs. 995 - - 300 50(c) Open Dug Wells :
Villages covered Nos. 132 _ _ . _
13141 600 600 3000 600
E. Rural Sanitation :(i) Latrines constructed (CRSP) Nos.
and IDA(ii) Villages covered Nos.
37 Housing t(i) Rural Housing :(a) Allotment of Sites Nos.(cum.)(b) Construction assistance "(c) Economically Wea)cer Section
Housing Scheme with HUDCO Participation "
(ii) Urban Housing :Low Income Group Housing
Scheme Nos.38 Urban Development :
(i) Town £ Regional Planning:Mater Plans prepared Nos.
(ii) Environmental Improvement of Slums (MNP):Persons benefitted Nos.
39 Labour £ Labour Welfare :(i) Craftsmen Training :(1) No.of I.T.Is. Govt. Nos.(cum.)(2) " G.I.A.(3) Intake Capacity Govt.(4) " G.I.A.
11114 16300 16300 200000 30000
1053876 35000 35000 150000 30000527513 30000 30000 170000 25000
34933 1500 1500 15000 1800
00
41655
79
567
15
567 5670
15 75
810
15
705188 40000 40000 400000 60000
42)71}
251967232
7
1448
7
1448
35) 10} ,
7000 1000
7
1400
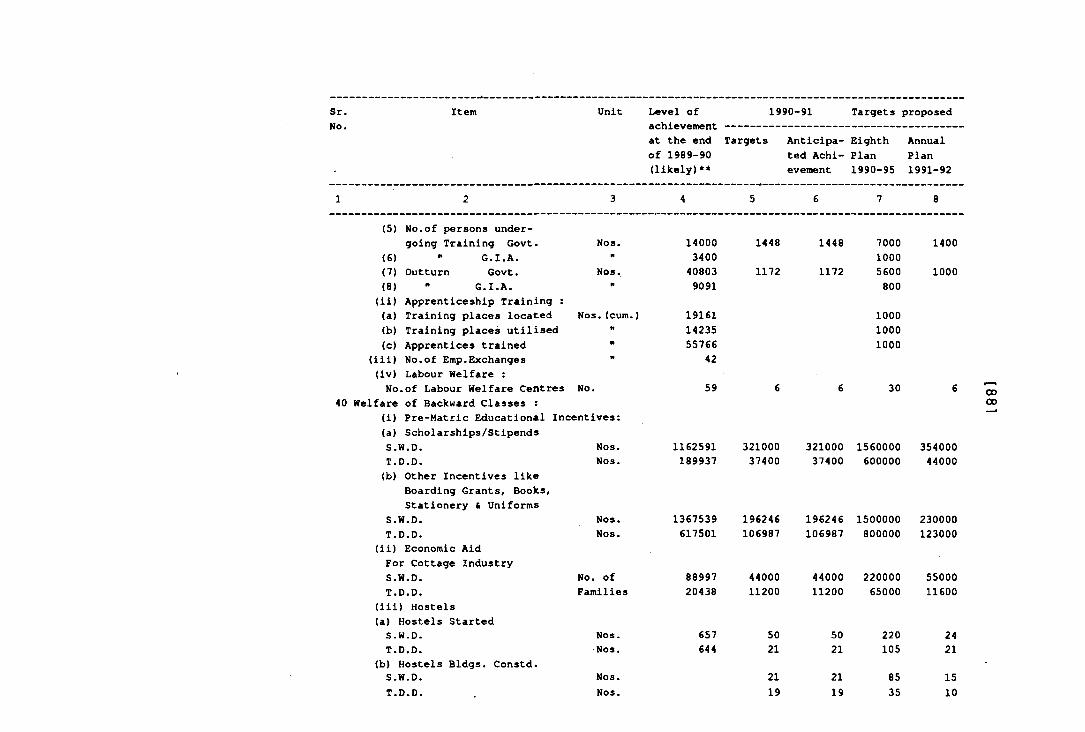
Sr.No.
Item Unit Level of 1990-91 Targets proposedachievement ----------------------------------at the end Targets Anticipa- Eighth Annualof 1989-90 ted Achi- Plan Plan(likely)** evement 1990-95 1^91-92
8(5)
(6)(7)(8)
(b)(c)
(iii)(iv)
Nos.
Nos.
Nos.(cum.)
No.
No.of persons undergoing Training Govt.
G.I.A.Outturn Govt.
G.I.A.(ii) Apprenticeship Training :(a) Training places located
Training places utilised Apprentices trained No.of Emp.Exchanges Labour Welfare :
No.of Labour Welfare Centres 40 Welfare of Backward Classes :
(i) Pre-Matric Educational Incentives:(a) Scholarships/Stipends S.W.D.T.D.D,(b) Other Incentives like
Boarding Grants, Books,Stationery ( Uniforms
S.W.D.T.D.D.
(ii) Economic Aid For Cottage Industry S.W.D.T.D.D.
(iii) Hostels(a) Hostels Started S.W.D.T.D.D.
(b) Hostels Bldgs. Constd.S.W.D.T.D.D.
Nos.Nos.
Nos.Nos.
No. of Families
Nos.Nos.
X40003400408039091
191611423555766
42
59
1162591189937
1367539617501
8899720438
657644
1448
1172
Nos.Nos.
32100037400
196246106987
4400011200
50212119
1448
1172
4400011200
5021
700010005600800
100010001000
30
321000 156000037400 600000
22000065000
220105
1400
1000
35400044000
196246 1500000 230000106987 800000 123000
5500011600
2421
CX500
2119
8535
1510
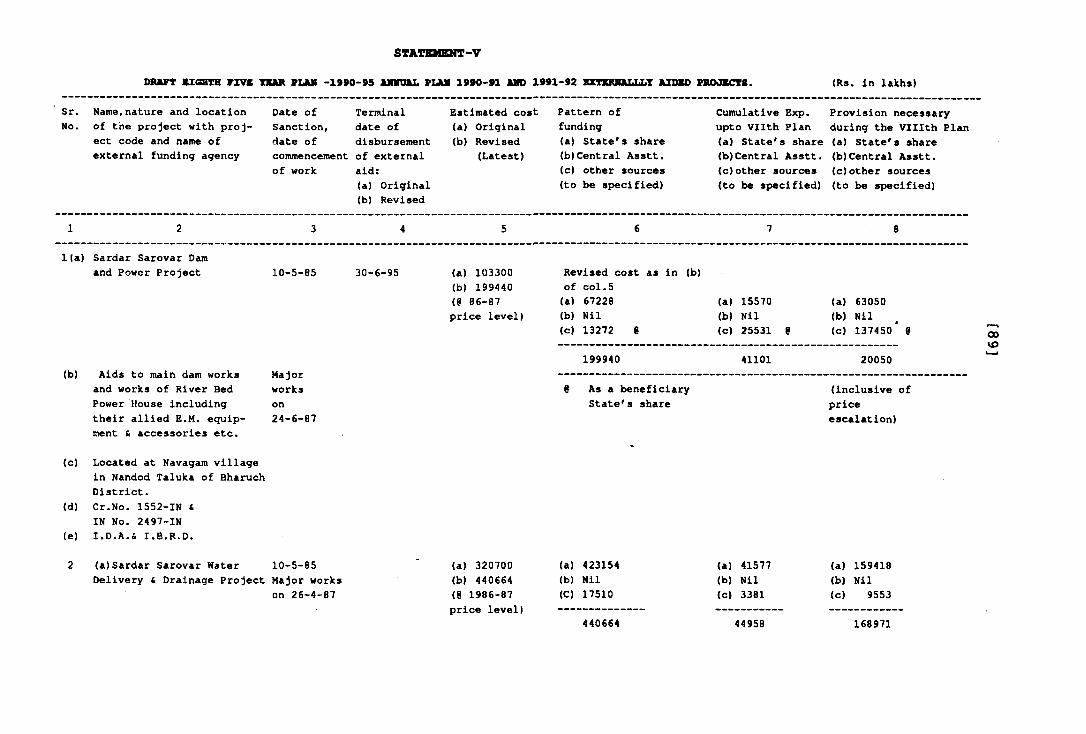
STATEMENT-VDRAFT BZ6HTH FZVC TSAR PLAIT -1990-95 AMmiAL PLAM 1990-91 AMD 1991-92 XXTIRIIALLLT AIOBD PROJECTS. (Rs. in lakhs)
Sr. Name,nature and location No. of the project with proj
ect code and name of external funding agency
Date of TerminalSanction, date ofdate of disbursementcommencement of external of work aid:
(a) Original(b) Revised
Estimated cost Pattern of(a) Original <b) Revised
(Latest)
funding(a) State's share(b)Central Asstt.(c) other sources (to be specified)
Cumulative Exp. upto Vllth Plan(a) State's share(b)Central Asstt.(c)other sources (to be specified)
Provision necessary during the Vlllth Plan(a) State's share(b)Central Asstt.(c)other sources (to be specified)
1(a) Sardar Sarovar Dam and Power Project
(b) Aids to main dam works and works of River Bed Power House including their allied E.M. equipment & accessories etc.
10-5-85 30-6-95
Majorworkson24-6-87
(a) 103300(b) 199440 (8 86-87 price level)
Revised cost as in (b) of col.5(a) 67228(b) Nil(c) 13272 %
199940
(a) 15570(b) Nil(c) 25531 i
41101
As a beneficiary State's share
(a) 63050(b) Nil(c) 137450* e
20050
00VO
(Inclusive of priceescalation)
(c) Located at Navagam village in Nandod Taluka of Bharuch District.
(d) Cr.No. 1552-IN £IN No. 2497-IN
(e) I.D.A.& I.B.R.D.
(a)Sardar Sarovar Water 10-5-85 Delivery C Drainage Project Major works
on 26-4-87
(a) 320700(b) 440664 (8 1986-87 price level)
(a) 423154(b) Nil (C) 17510
440664
(a) 41577(b) Nil(c) 3381
44958
(a) 159418(b) Nil(c) 9553
168971
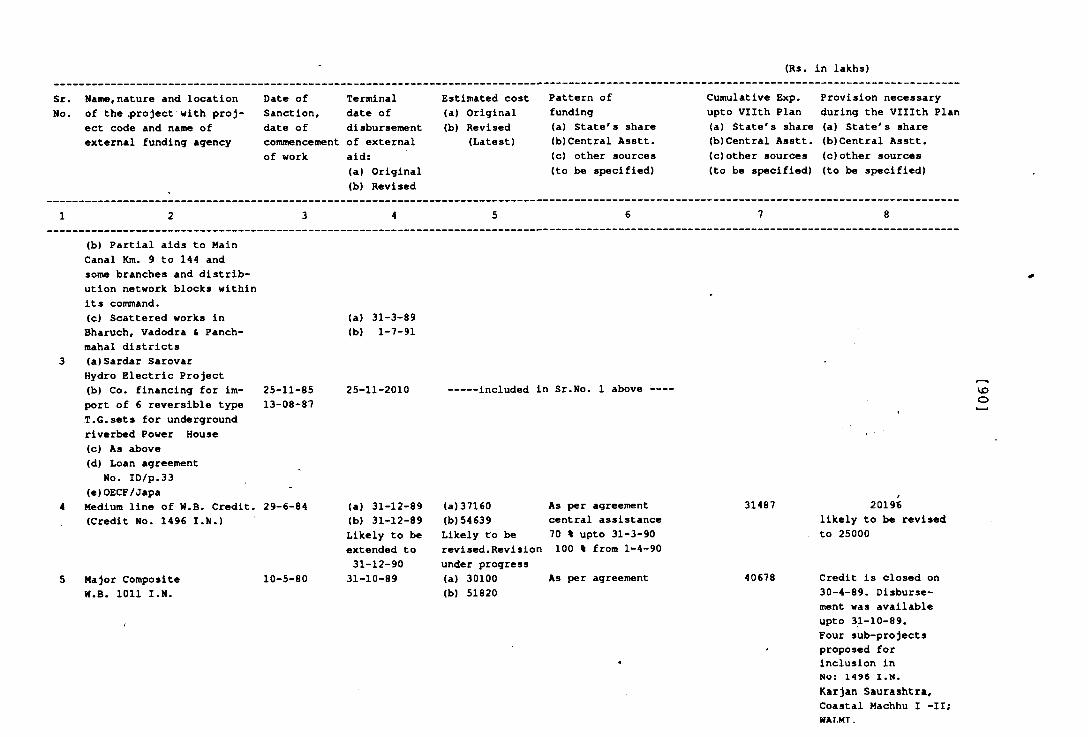
(Rs. In lakhs)
Sr. Name,nature and location No. of the .project with proj
ect code and name of external funding agency
Date of Sanction, date of
Terminal date of dlsbursement
commencement of externalof work aid:
(a) Original(b) Revised
Estimated cost Pattern of(a) Original(b) Revised
(Latest)
funding(a) State's share(b)Central Asstt.(c) other sources (to be specified)
Cumulative Exp. upto Vllth Plan(a) State's share(b)Central Asstt.(c)other sources (to be specified)
Provision necessary during the Vlllth Plan(a) State's share(b)Central Asstt.(c)other sources (to be specified)
(b) Partial aids to Main Canal Km. 9 to 144 and some branches and distribution network blocks within its command.(c) Scattered works in Bharuch, Vadodra & Panch- mahal districts(a)Sardar Sarovar Hydro Electric Project(b) Co. financing for im- 25-11-85port of 6 reversible type 13-08*87T.G.sets for underground riverbed Power House(c) As above(d) Loan agreement
No. ID/p.33(e)OECF/JapaMedium line of W.B. Credit. 29-6-84 (Credit No. 1496 I.N.)
Major Composite W.B. 1011 I.N.
10-5-80
(a) 31-3-89(b) 1-7-91
25-11-2010
(a) 31-12-89(b) 31-12-89 Likely to be extended to31-12-9031-10-89
-included in Sr.No. 1 above ----
(a)37160(b)54639 Likely to be revIsed.Revision under progress(a) 30100(b) 51820
As per agreement central assistance 70 % upto 31-3-90 100 % from 1-4-90
As per agreement
31487
40678
V£>O
20196likely to be revised to 25000
Credit is closed on 30-4-89. Disbursement was available upto 31-10-89.Four sub-projects proposed for inclusion in n o : 1496 I.N.Karjan Saurashtra, Coastal Machhu I -IIj UAT.MT.
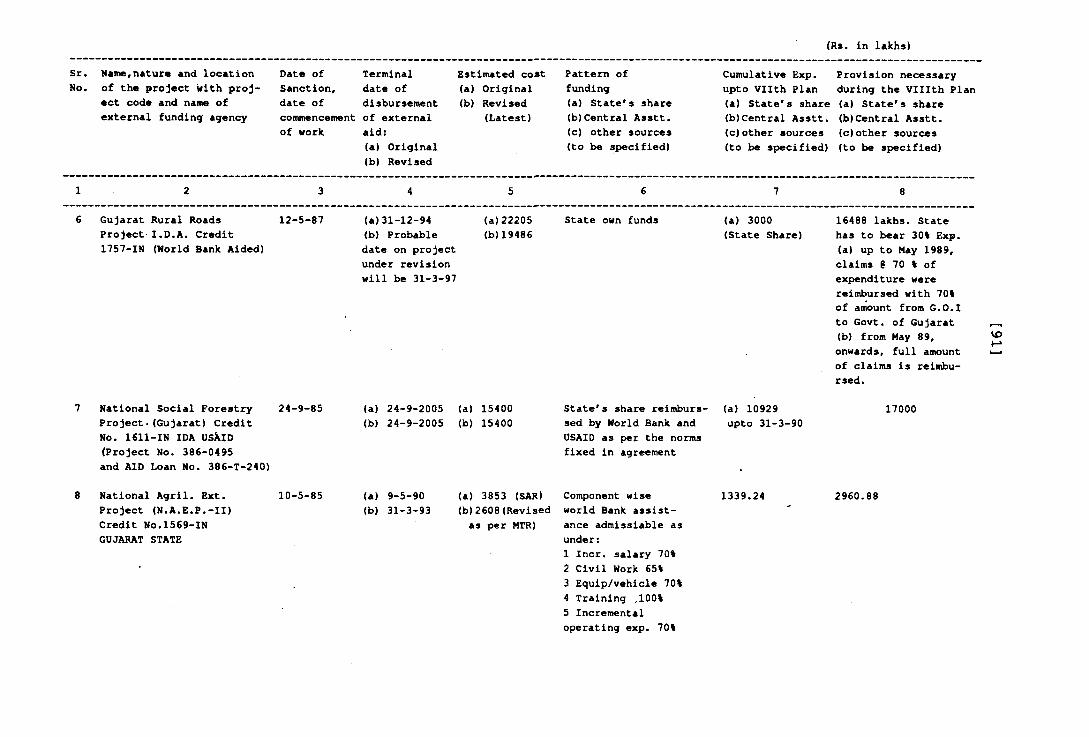
(Rs. In lakhs)
Sr. Name,nature and location No. of the project With proj
ect code and name of external funding agency
Date of Sanction, date of
Terminal date of disbursement
commencement of externalof work aid:
(a) Original(b) Revised
Estimated cost(a) Original(b) Revised
(Latest)
Pattern of funding(a) State's share(b)Central Asstt.(c) other sources (to be specified)
Cumulative Exp. upto Vllth Plan(a) State's share(b)Central Asstt.(c)other sources (to be specified)
Provision necessary during the Vlllth Plan(a) State's share(b)Central Asstt.(c)other sources (to be specified)
8Gujarat Rural Roads Project I.D.A. Credit 1757-IN (World Bank Aided)
12-5-87 (a)31-12-94(b) Probable date on project under revision will be 31-3-97
(a)22205(b)19486
State own funds (a) 3000 (State Share)
16488 lakhs. State has to bear 30% Exp.(a) up to May 1989, claims 6 70 % of expenditure were reimbursed with 70% of amount from G.O.I to Govt, of Gujarat(b) from May 89, onwards, full amount of claims is reimbursed.
VO
National Social Forestry Project.(Gujarat) Credit No. 1611-IN IDA USXiD (Project No. 386-0495 and AID Loan No. 386-T-240)
24-9-85 (a) 24-9-2005 (a) 15400 State's share reimburs-(b) 24-9-2005 (b) 15400 sed by World Bank and
USAID as per the norms fixed in agreement
(a) 10929 upto 31-3-90
17000
8 National Agril. Ext. Project (N.A.E.P.-II) Credit No.1569-IN GUJARAT STATE
10-5-85 (a) 9-5-90(b) 31-3-93
(a) 3853 (SAR)(b)2608(Revised as per MTR)
Component wise world Bank assistance admissiable as under:1 Incr. salary 70%2 Civil Work 65%3 Equip/vehicle 70%4 Training .100%5 Incremental operating exp. 70%
1339.24 2960.88
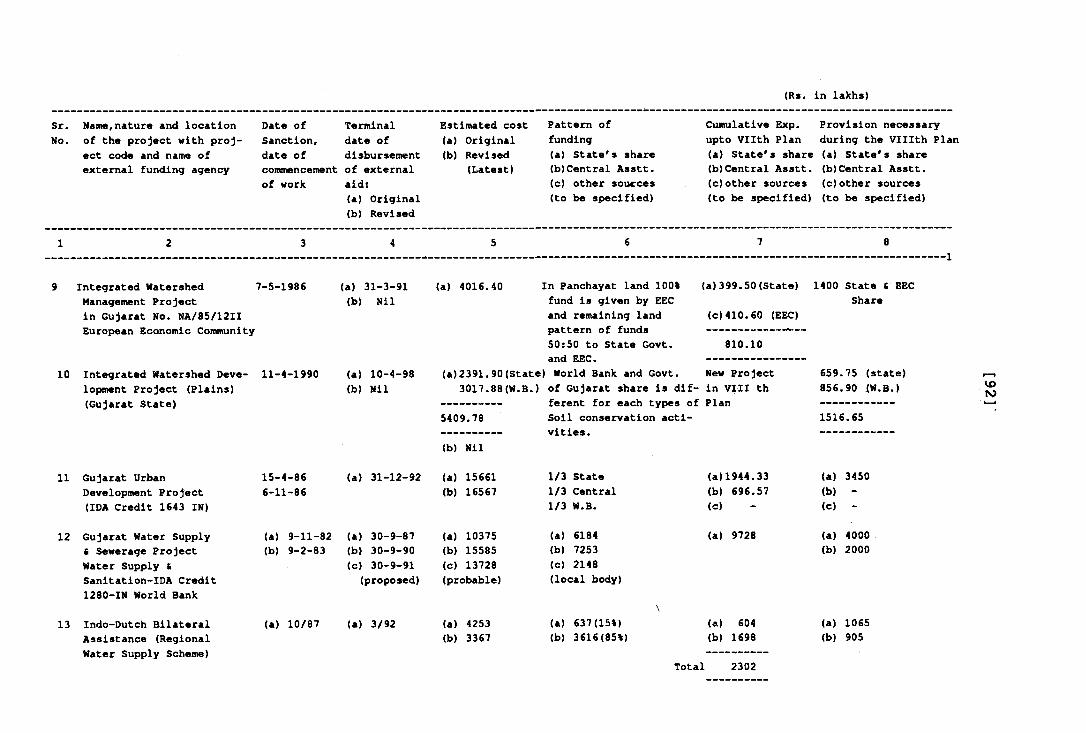
(Rs. in lakhs)
Sr. Name,nature and location No. of the project with proj
ect code and name of external funding agency
Date of Sanction, date of commencement of work
Terminal date of disbursement of external aid:(a) Original(b) Revised
Estimated cost(a) Original(b) Revised
(Latest)
Pattern of funding(a) State's share(b)Central Asstt.(c) other sources (to be specified)
Cumulative Exp. upto Vllth Plan(a) State's share(b)Central Asstt.(c)other sources (to be specified)
Provision necessary during the Vlllth Plan(a) State's share(b)Central Asstt.(c)other sources (to be specified)
1 2 3 4 5 6 7 8
10
Integrated Watershed 7-5-1986 (a) 31-3-91Management Project (b) Nilin Gujarat No. NA/85/12II European Economic Community
Integrated Watershed Deve- 11-4-1990 (a) 10-4-98lopment Project (Plains) (b) Nil(Gujarat State)
(c)410.60 (EEC)
810.10
(a) 4016.40 In Panchayat land 100% (a)399.50(State)fund is given by EEC and remaining land pattern of funds 50:50 to State Govt.and EEC. ----------
(a)2391.90(State) World Bank and Govt. New Project3017.88 (W.B.) of Gujarat share is dif- in VHI th
--------- ferent for each types of Plan5409.78 Soil conservation acti---------- vities.(b) Nil
1400 State & Share
EEC
659.75 (state) 856.90 iW.B.)
1516.65
VON)
11 Gujarat Urban 15-4-86Development Project 6-11-86(IDA Credit 1643 IN)
(a) 31-12-92 (a) 15661(b) 16567
1/3 State 1/3 Central 1/3 W.B.
(a)1944.33(b) 696.57(c)
(a) 3450(b) -(c) -
12 Gujarat Water Supply « Sewerage Project Water Supply & Sanitation-IDA Credit 1280-IN World Bank
(a) 9-11-82(b) 9-2-83
(a) 30-9-87(b) 30-9-90(c) 30-9-91 (proposed)
(a) 10375(b) 15585(c) 13728 (probable)
(a) 6184(b) 7253(c) 2148 (local body)
(a) 9728 (a) 4000(b) 2000
13 Indo-Dutch Bilateral Assistance (Regional Water Supply Scheme)
(a) 10/87 (a) 3/92 (a) 4253(b) 3367
(a) 637(15%)(b) 3616(85%)
Total
(a) 604(b) 1698
2302
(a) 1065(b) 905
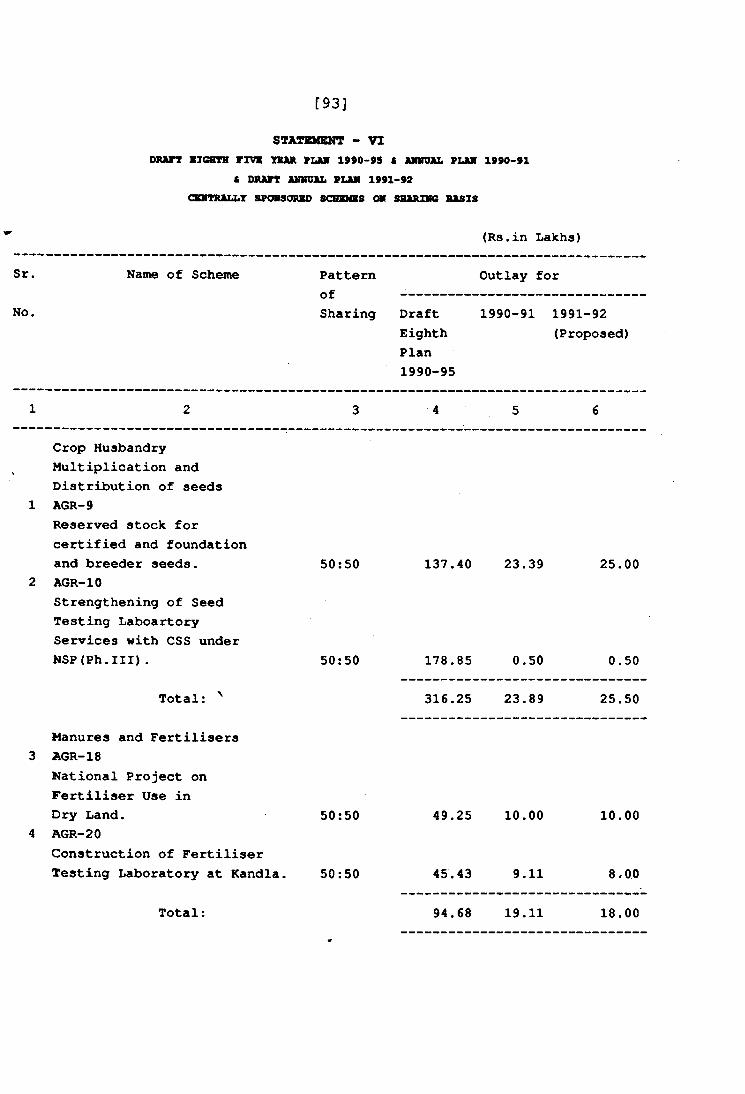
[93]
STATEMENT - VI DRAFT XICTTH FIVB TKAR PUOI 1990-95 C AimUlL PZJUl 1990-91
S DRAFT AMMUJa. FLAM 1991-92 CXiraRAXJ.T SPOnsORKD SCHXMBS OM SBARIMG BASIS
Sr.
No.
Name of Scheme PatternofSharing Draft
Eighth Plan 1990-95
(Rs.in Lakhs)
Outlay for
1990-91 1991-92(Proposed)
Crop Husbandry Multiplication and Distribution of seeds AGR-9Reserved stock forcertified and foundationand breeder seeds. 50:50AGR-10Strengthening of Seed Testing Laboartory Services with CSS under NSP(Ph.III). 50:50
Total:
Manures and Fertilisers AGR-18National Project on Fertiliser Use inDry Land. 50:50AGR-20Construction of FertiliserTesting Laboratory at Kandla. 50:50
Total:
137.40 23.39
178.85 0.50
316.25 23.89
49.25 10.00
45.43 9.11
94.68 19.11
25.00
0.50
25.50
10.00
8.00
18.00
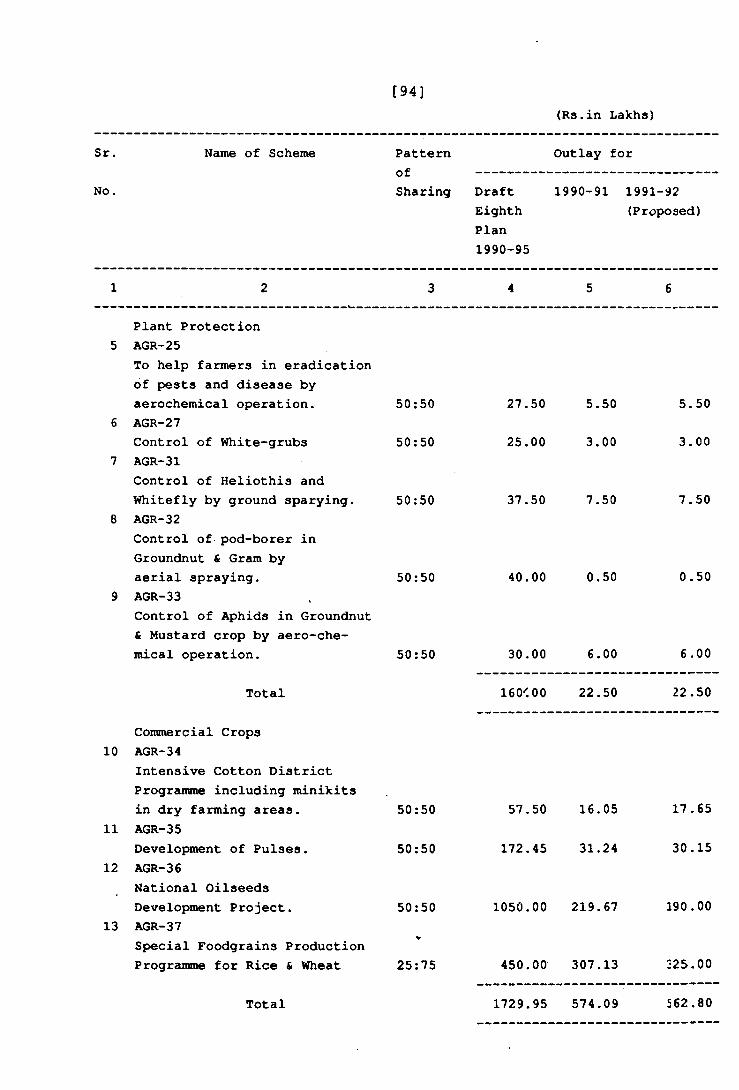
[ 9 4 ]
(Rs.in Lakhs)
Sr. Name of Scheme Pattern Outlay forof
No. Sharing Draft 1990-91 1991-92Eighth (proposed)Plan1990-95
1 2 3 4 5 6
Plant Protection5 AGR-25
To help farmers in eradicationof pests and disease byaerochemical operation. 50:50 27.50 5.50 5.50
6 AGR-27Control of White-grubs 50:50 25.00 3.00 3.00
7 AGR-31Control of Heliothis andWhitefly by ground sparying. 50:50 37.50 7.50 7.50
8 AGR-32Control of pod-borer inGroundnut & Gram byaerial spraying. 50:50 40.00 0.50 0.50
9 AGR-33Control of Aphids in Groundnut& Mustard crop by aero-che-mical operation. 50:50 30.00 6.00 6.00
Total 160<00 22.50 22.50
Commercial Crops10 AGR-34
Intensive Cotton DistrictProgramme including minikitsin dry farming areas. 50:50 57.50 16.05 17 .65
11 AGR-35Development of Pulses. 50:50 172.45 31.24 30.15
12 AGR-36National OilseedsDevelopment Project. 50:50 1050.00 219.67 190.00
13 AGR-37Special Foodgrains ProductionProgramDnne for Rice & Wheat 25:75 450.00 307.13 325.00
Total 1729.95 574.09 562.80________ —_—
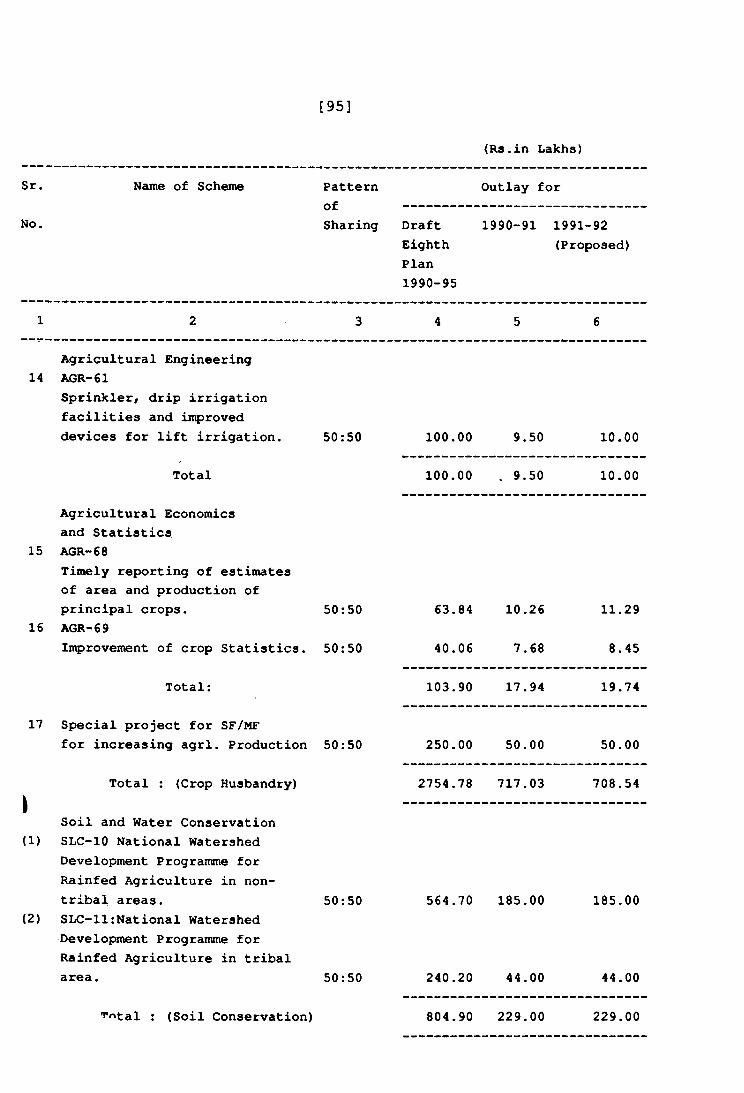
[95]
Sr.
No.
Name of Scheme Patternof ------Sharing Draft
Eighth Plan 1990-95
Outlay for
1990-91 1991-92(Proposed)
(Rs.in Lakhs)
Agricultural Engineering14 AGR-61
Sprinkler, drip irrigation facilities and improved devices for lift irrigation
Total
50:50
Agricultural Economics and Statistics
15 AGR-68Timely reporting of estimatesof area and production ofprincipal crops. 50:50
16 AGR-69Inprovement of crop Statistics. 50:50
Total:
17 Special project for SF/MFfor increasing agrl. Production 50:50
Total : (Crop Husbandry)\
Soil and Water Conservation(1) SLC-10 National Watershed
Development Programme for Rainfed Agriculture in non-tribal areas. 50:50
(2) SLC-11:National Watershed Development Programme for Rainfed Agriculture in tribalarea. 50:50
**'<tal : (Soil Conservation)
100.00 9.50
100.00 . 9.50
63.84 10.26
40.06 7.68
10.00
10.00
11.29
8.45
103.90 17.94 19.74
250.00 50.00 50.00
2754.78 717.03 708.54
564.70 185.00 185.00
240.20 44.00 44.00
804.90 229.00 229.00
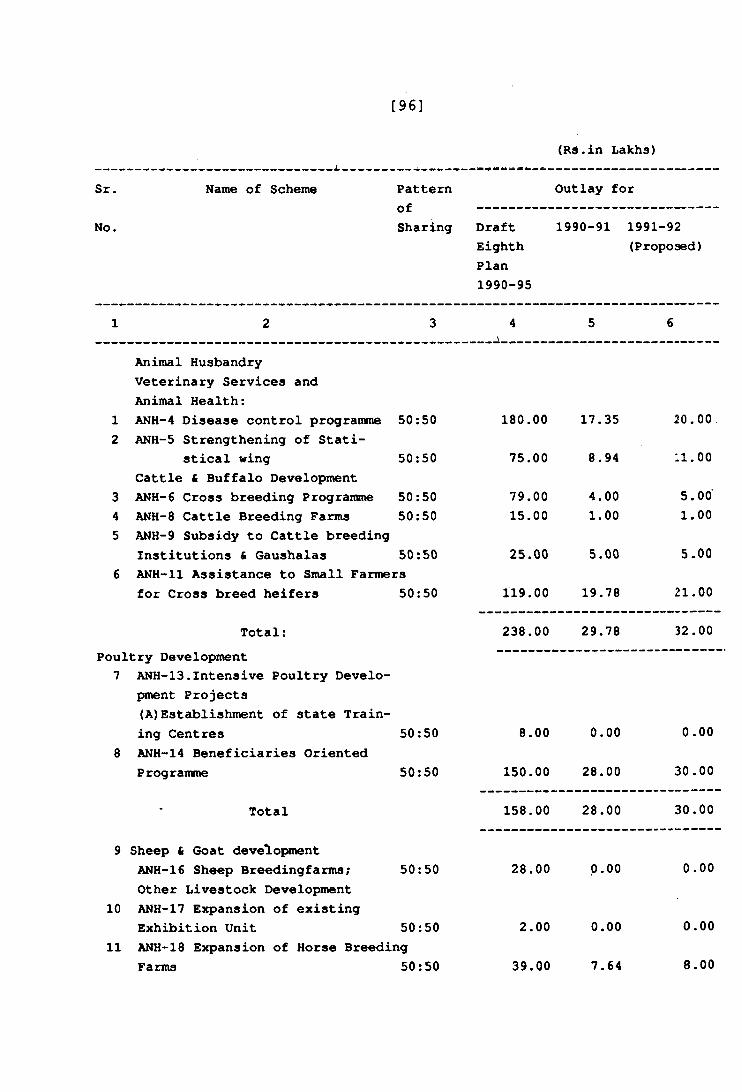
[96]
(Rs.in Lakhs)
Sr.
No.
Name of Scheme PatternofSharing Draft
EighthPlan1990-95
Outlay for
1990-91 1991-92(Proposed)
1 2 3 4\
5 6
1
Animal Husbandry Veterinary Services and Animal Health:ANH-4 Disease control programme 50:50 180.00 17.35 20.00
2 ANH-5 Strengthening of Statistical wing 50:50 75.00 8.94 11.00
3Cattle & Buffalo Development ANH-6 Cross breeding Programme 50:50 79.00 4.00 5.00
4 ANH-8 Cattle Breeding Farms 50:50 15.00 1.00 1.005 ANH-9 Subsidy to Cattle breeding
Institutions & Gaushalas 50:50 25.00 5.00 5.006 ANH-11 Assistance to Small Farmers
for Cross breed heifers 50:50 119.00 19.78 21.00
Total:Poultry Development7 ANH-13.Intensive Poultry Develo
pment Projects(A)Establishment of state Training Centres 50:50
238.00
8.00
29.78
0.00
32.00
0.008 ANH-14 Beneficiaries Oriented
Programme 50:50 150.00 28.00 30.00
Total 158.00 28.00 30.00
9 Sheep & Goat developmentANH-16 Sheep Breedingfarms; 50:50Other Livestock Development
10 ANH-17 Expansion of existingExhibition Unit 50:50
11 7^H-18 Expansion of Horse BreedingFarms 50:50
28.00 p.00
2.00 0.00
39.00 7.64
0.00
0.00
8.00
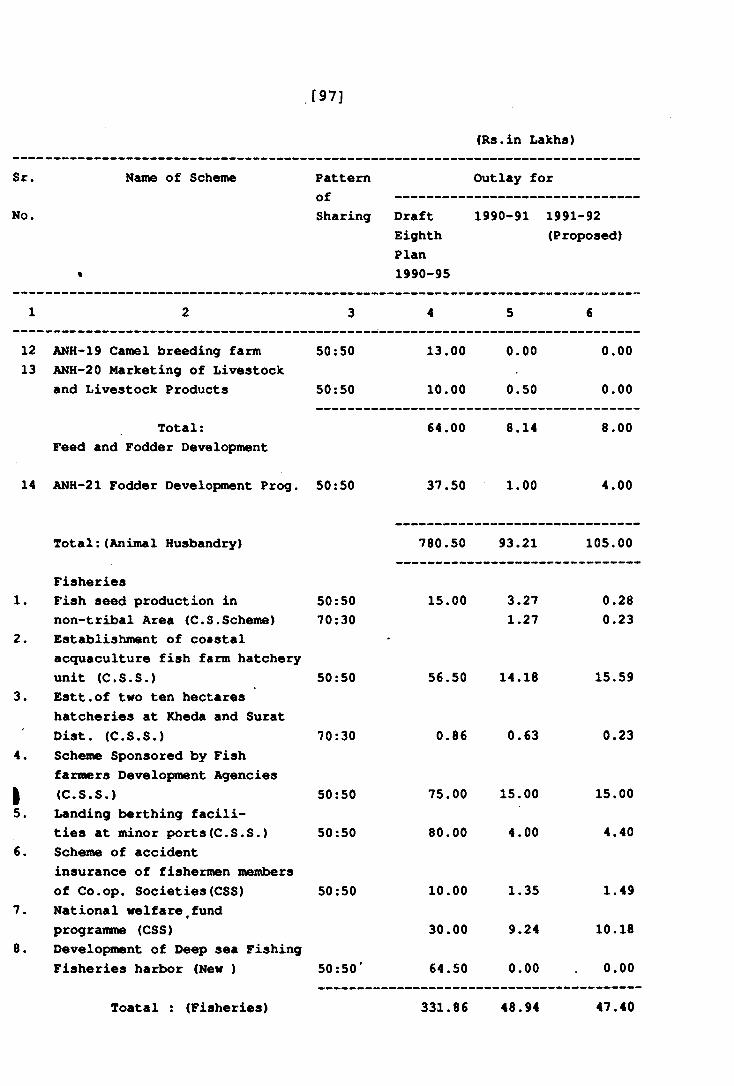
,[97]
Outlay for
1990-91 1991-92(Proposed)
(Rs.in Lakhs)
Sr.
No.
Name of Scheme Patternof --- —Sharing Draft
Eighth Plan
• 1990-95
1 2 3 4 5 6
12 ANH-19 Camel breeding farm 50:50 13.00 0.00 0.0013 ANH-20 Marketing of Livestock
and Livestock Products 50:50 10.00 0.50 0.00
Total: 64.00 8.14 8.00Feed and Fodder Development
14 ANH-21 Fodder Development Prog. 50:50 37.50 1.00 4.00
Total:(Animal Husbandry) 780.50 93.21 105.00
Fisheries1. Fish seed production in 50:50 15.00 3.27 0.28
non-tribal Area (C.S.Scheme) 70:30 1.27 0.232. Establishment of coastal *
acquaculture fish fam hatcheryunit (C.S.S.) 50:50 56.50 14.18 15.59
3. Estt.of two ten hectareshatcheries at Kheda and SuratDist. (C.S.S.) 70:30 0.86 0.63 0.23
4. Scheme Sponsored by Fishfarmers Development Agencies
1 (C.S.S.) 50:50 75.00 15.00 15.005. Landing berthing facili
ties at minor ports(C.S.S.) 50:50 80.00 4.00 4.406. Scheme of accident
insurance of fishermen membersof Co.op. Societies(CSS) 50:50 10.00 1.35 1.49
7. National welfare,fundprogramme (CSS) 30.00 9.24 10.18
8. Development of Deep sea FishingFisheries harbor (New ) 50:50' 64.50 0.00 0.00
Toatal : (Fisheries) 331.86 48.94 47.40
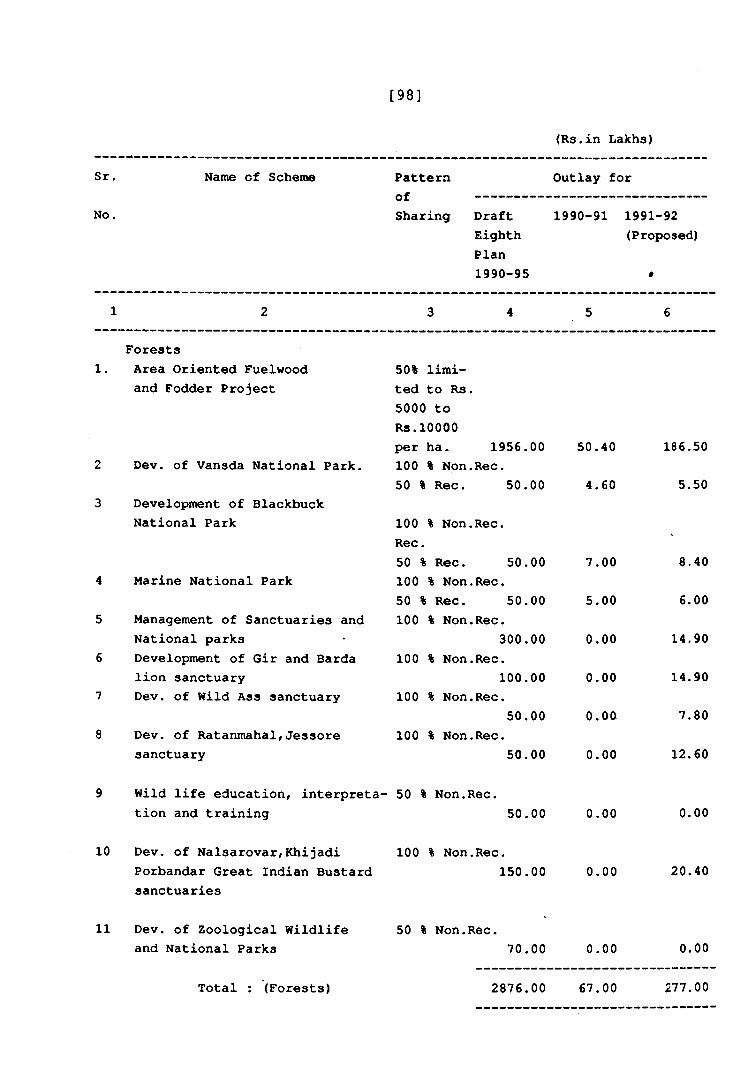
[983
(Rs.in Lakhs)
Sr. Name cf Scheme Pattern Outlay forof --------
No. Sharing Draft 1990-91 1991-92Eighth (Proposed)Plan1990-95 »
1 2 3 4 5 6
Forests1. Area Oriented Fuelwood 50% limi
and Fodder Project ted to RS.5000 toRs.10000per ha. 1956.00 50.40 186.50
2 Dev. of Vansda National Park, 100 % Non.Rec.50 % Rec. 50.00 4.60 5.50
3 Development of BlackbuckNational Park 100 % Non.Rec.
Rec.50 % Rec. 50.00 7.00 8.40
4 Marine National Park 100 % Non.Rec.50 % Rec. 50.00 5.00 6.00
5 Management of Sanctuaries and 100 % Non.Rec.National parks 300.00 0.00 14.90
6 Development of Gir and Barda 100 % Non.Rec.lion sanctuary 100.00 0.00 14.90
7 Dev. of Wild Ass sanctuary 100 % Non.Rec.50.00 0.00 7.80
8 Dev. of Ratanmahal,Jessore 100 % Non.Rec.sanctuary 50.00 0.00 12.60
9 Wild life education, interpreta 50 % Non.Rec.tion and training 50.00 0.00 0.00
10 Dev. of Nalsarovar,Khijadi 100 % Non.Rec.Porbandar Great Indian Bustard 150.00 0.00 20.40sanctuaries
11 Dev. of Zoological Wildlife 50 % Non.Rec.and National Parks 70.00 0.00 0.00
Total : (Forests) 2876.00 67.00 277.00— • ______ _____ __ _____ ______________
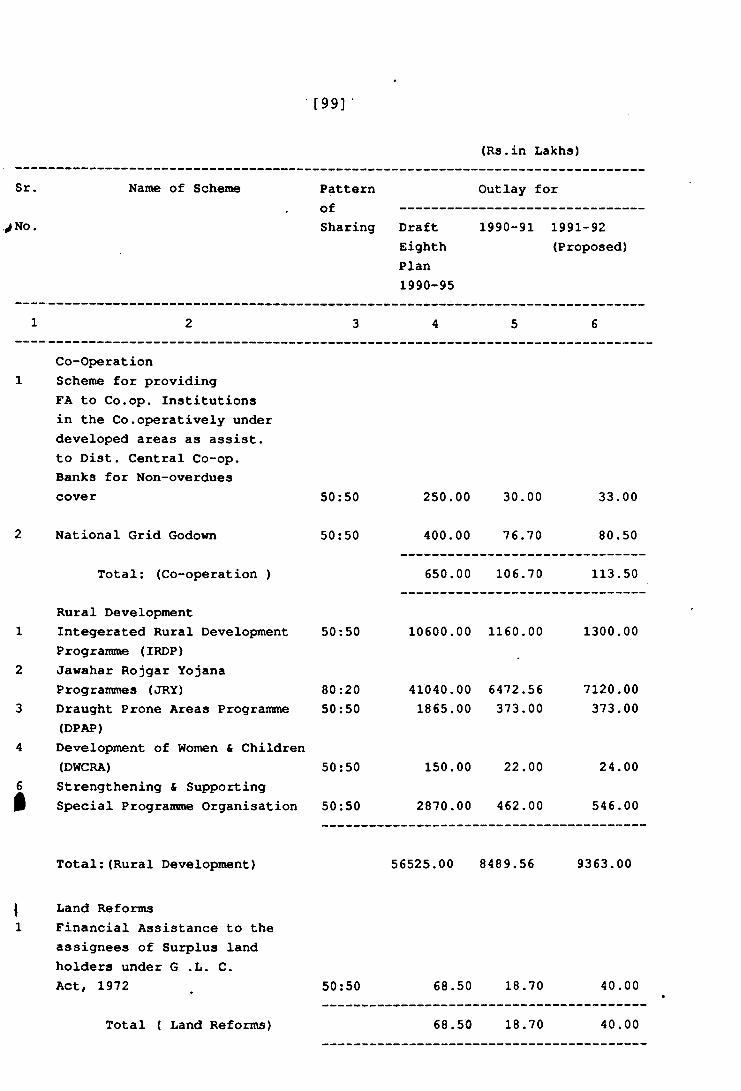
[ 9 9 3 •
(Rs.in Lakhs)
Sr. Name of Scheme PatternofSharing
Outlay for
No . DraftEighthPlan1990-95
1990-91 1991-92(Proposed)
1 2 3 4 5 6
Co-Operation Scheme for providing FA to Co.op. Institutions in the Co.operatively under developed areas as assist, to Dist. Central Co-op. Banks for Non-overduescover 50:50 250.00 30.00 33.00
2 National Grid Godown 50:50 400.00 76.70 80.50
Total; (Co-operation ) 650.00 106.70 113.50
Rural Development1 Integerated Rural Development 50:50 10600.00 1160.00 1300.00
Programme (IRDP)2 Jawahar Rojgar Yojana
Programmes (JRY) 80:20 41040.00 6472.56 7120.003 Draught Prone Areas Programme 50:50 1865.00 373.00 373.00
(DPAP)4 Development of Women & Children
(DWCRA) 50:50 150.00 22.00 24.006A Strengthening & Supporting1 Special Programme Organisation 50:50 2870.00 462.00 546.00
Total;(Rural Development) 56525.00 8489.56 9363.00
1 Land Reforms1 Financial Assistance to the
assignees of Surplus landholders under G .L. C.Act, 1972 50:50 68.50 18.70 40.00
Total ( Land Reforms) 68.50 18.70 40.00
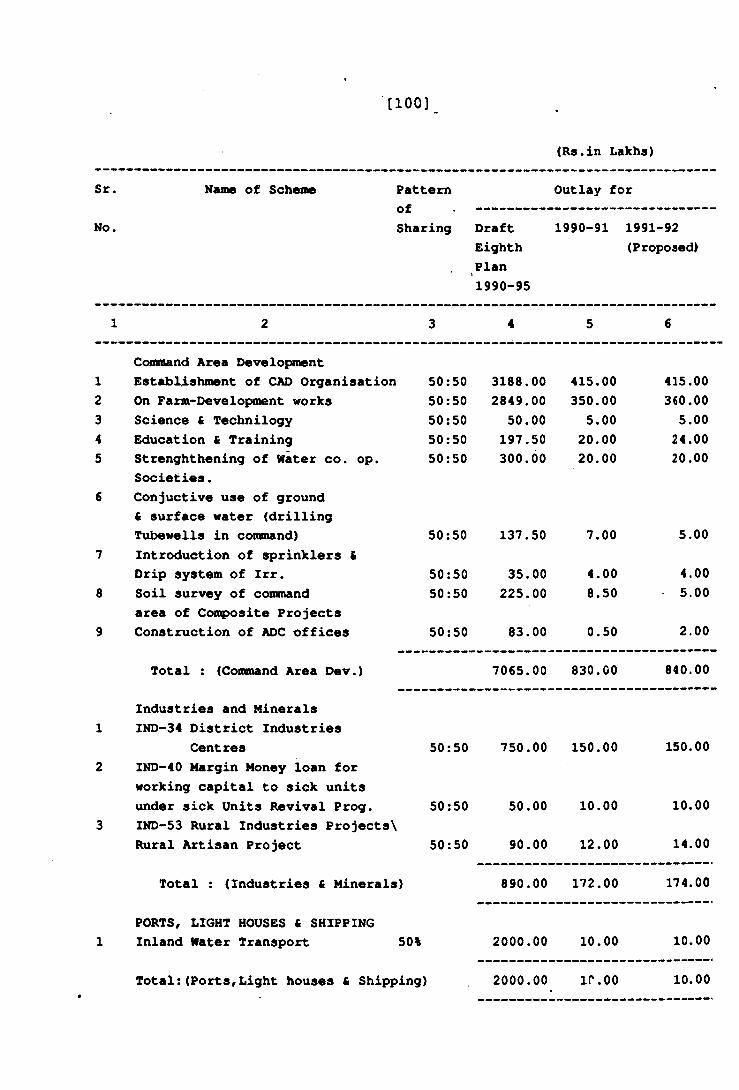
[100]
Sr. Name of Scheme Pattern
(Rs.in Lakhs)
Outlay for
No.
of
Sharing
1
Draft
Eighth
Plan
1990-95
1990-91 1991-92
(Proposed)
1 2 3 4 5 6
Command Area Develo{»nent
1 Establi-shment of CAD Organisation 50:50 3188.00 415.00 415.00
2 On Farm-DeveXopment works 50:50 2849.00 350.00 360.00
3 Science & Technilogy 50:50 50.00 5.00 5.00
4 Education & Training 50:50 197.50 20.00 24.00
5 Strenghthening of Water co. op. 50:50 300.00 20.00 20.00
Societies.
6 Conjuctive use of ground
£ surface water (drilling
Tubewells in coitonand) 50:50 137.50 7.00 5.00
7 Introduction of sprinklers (
Drip system of Irr. 50:50 35.00 4.00 4.00
8 Soil survey of consnand 50:50 225.00 8.50 • 5.00
area of Composite Projects
9 Construction of ADC offices 50:50 83.00 0.50 2.00
Total : (Conmnand Area Dev.) 7065.00 830.00 840.00
Industries and Minerals
1 IND~34 District Industries
Centres 50:50 750.00 150.00 150.00
2 IND-40 Margin Money loan for
working capital to sick units
under sick Units Revival Prog. 50:50 50.00 10.00 10.00
3 IND-53 Rural Industries Projects\
Rural Artisan Project 50:50 90.00 12.00 14.00
Total ; (Industries £ Minerals) 890.00 172.00 174.00
PORTS, LIGHT HOUSES « SHIPPING
1 Inland Water Transport 50% 2000.00 10.00 10.00
Total:(Ports#Light houses & Shipping) 2000.00 ir.oo 10.00
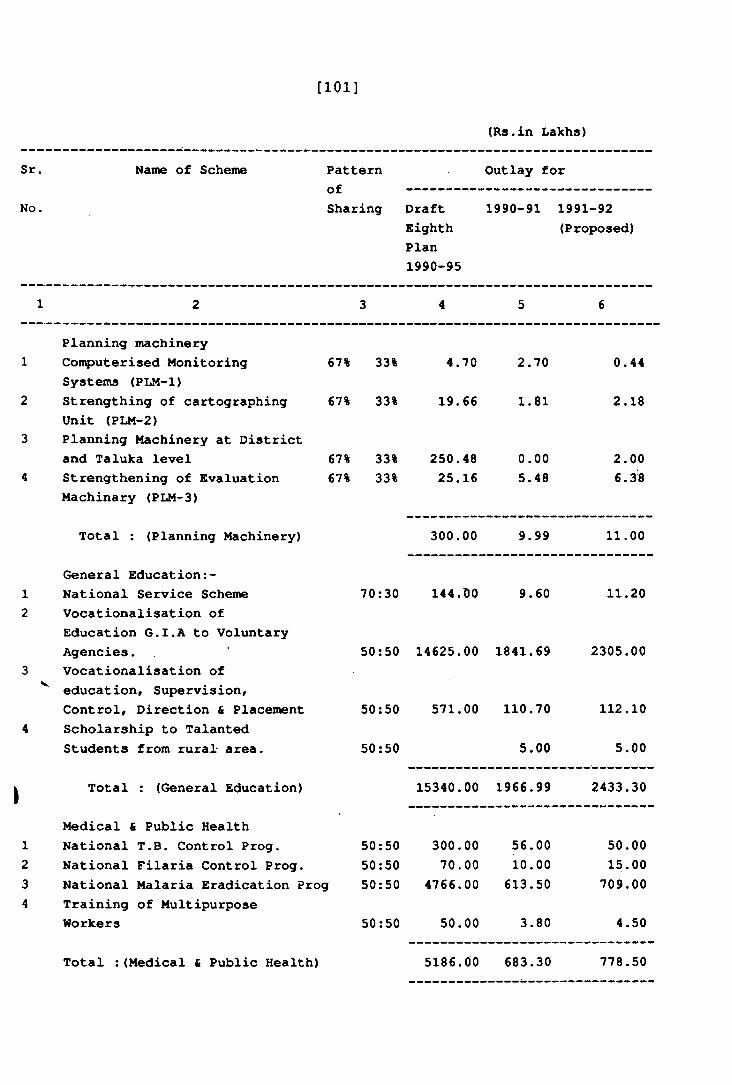
[101]
(Rs.in Lakhs)
Sr.
No.
Naune of Scheme PatternofSharing Draft
EighthPlan1990-95
Outlay for
1990-91 1991-92(Proposed)
1 2 3 4 5 6
Planning machinery1 Conqputerised Monitoring 67% 33% 4.70 2.70 0.44
Systems (PLM-1)2 Strengthing of cartographing 67% 33% 19.66 1.81 2.18
Unit (PLM-2)3 Planning Machinery at District
and Taluka level 67% 33% 250.48 0.00 2.004 Strengthening of Evaluation 67% 33% 25.16 5.48 6.38
Machinary (PLM-3)
Total : (Planning Machinery) 300.00 9.99 11.00
General Education1 National Service Scheme 70:30 144.DO 9.60 11.202 Vocationalisation of
Education G.I.A to VoluntaryAgencies. 50:50 14625.00 1841.69 2305.00
3 Vocationalisation ofV education, Supervision,
Control, Direction & Placement 50:50 571.00 110.70 112.104 Scholarship to Talanted
Students from rural- area. 50:50 5.00 5.00
I Total : (General Education) 15340.00 1966.99 2433.30
Medical & Public Health*
1 National T.B. Control Prog. 50:50 300.00 56.00 50.002 National Filaria Control Prog. 50:50 70.00 10.00 15.003 National Malaria Eradication Prog 50:50 4766.00 613.50 709.004 Training of Multipurpose
Workers 50:50 50.00 3.80 4.50
Total :(Medical & Public Health) 5186.00 683.30 778.50
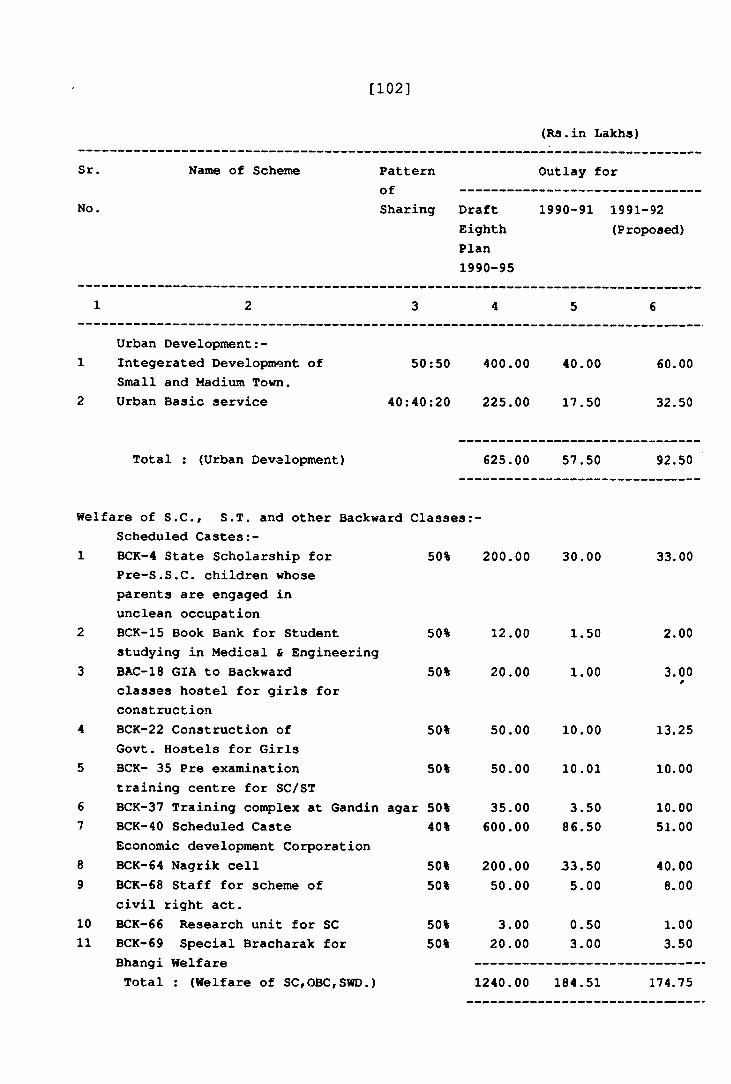
[102]
(Rs.in Lakhs)
Sr. Name of Scheme PatternofSharing
Outlay for
No. DraftEighthPlan1990-95
1990-91 1991-92(Proposed)
1 2 3 4 5 6
Urban Development:- Integerated Development of Small and Madium Town. Urban Basic service
50:50 400.00 40.00
40:40:20 225.00 17.50
60.00
32.50
Total : (Urban Development) 625.00 57.50 92.50
Welfare of S.C., S.T. and other Backward Classes: Scheduled Castes:-
1 BCK-4 State Scholarship for 50%Pre-S.S.C. children whoseparents are engaged in unclean occupation
2 BCK-15 Book Bank for Student 50%studying in Medical & Engineering
3 BAC-18 GIA to Backward 50%classes hostel for girls for construction
4 BCK-22 Construction of 50%Govt. Hostels for Girls
5 BCK- 35 Pre examination 50%training centre for SC/STBCK-37 Training cortplex at Gandin agar 50%
200.00 30.00
67
89
10 11
BCK-40 Scheduled Caste 40%Economic development Corporation BCK-64 Nagrik cell 50%BCK-68 Staff for scheme of 50%civil right act.BCK-66 Research unit for SC 50%BCK-69 Special Bracharak for 50%Bhangi Welfare Total : (Welfare of SC,OBC,SWD.)
12.00
20.00
50.00
50.00
35.00 600.00
200.0050.00
3.0020.00
1.50
1.00
10.00
10.01
3.5086.50
33.505.00
0.503.00
1240.00 184.51
33.00
2.00
3.00
13.25
10.00
10.0051.00
40.008.00
1.003.50
174.75
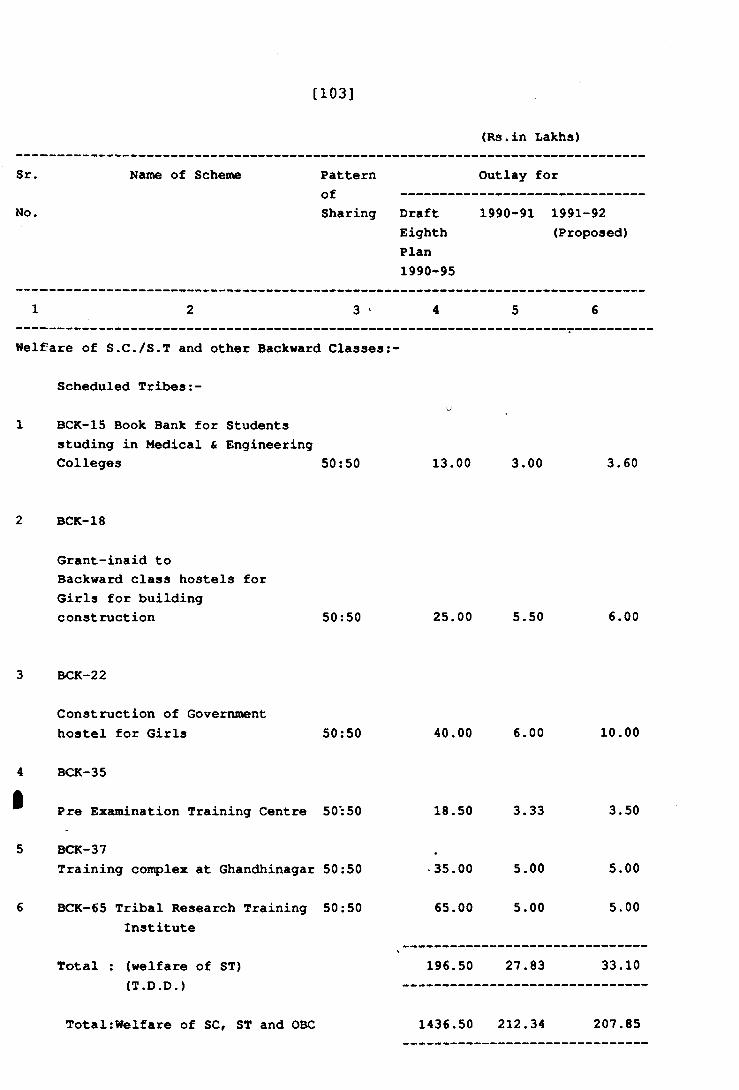
[103]
(Rs.in Lakhs)
Sr. Name of Scheme Pattern Outlay for
No.0£Sharing Draft
EighthPlan1990-95
1990-91 1991-92(Proposed)
1 2 3 ^ 4 5 6
Welfiare of S.C./S.T and other Backward Classes:-
Scheduled Tribes
1 BCK-15 Book Bank for Students studing in Medical & Engineering Colleges 50:50
U
13.00 3.00 3.60
2 BCK-18
Grant-inaid to Backward class hostels for Girls for building construction 50:50 25.00 5.50 6.00
3 BCK-22
Construction of Government hostel for Girls 50:50 40.00 6.00 10.00
4 BCK-35
1 Pre Exeunination Training Centre 50:50 18.50 3.33 3.50
5 BCK-37Training complex at Ghandhinagar 50:50 •35.00 5.00 5.00
6 BCK-65 Tribal Research Training Institute
50:50 65.00 5.00 5.00
Total : (welfare of ST) (T.D.D.)
196.50 27.83 33.10
Total:Welfare of SC, ST and OBC 1436.50 212.34 207.85
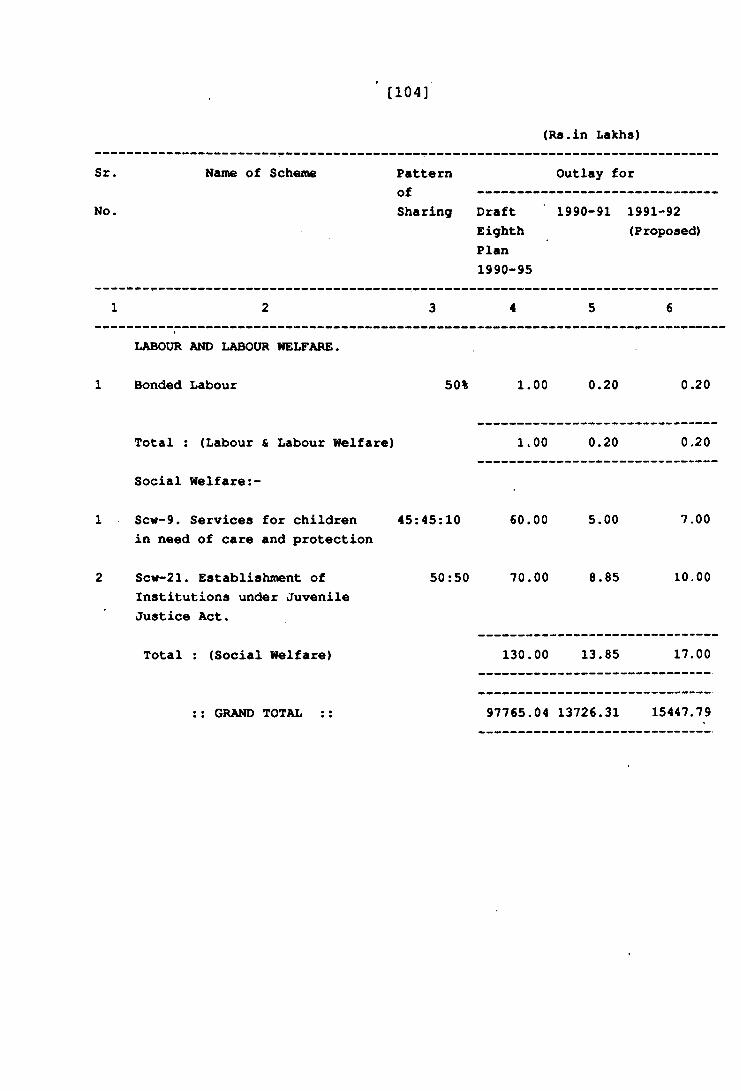
[104]
Sr.
No.
Name of Scheme Pattern Outlay forof ---------------------------Sharing Draft 1990-91 1991-92
Eighth (Proposed)Plan1990-95
(Rs.in Lakhs)
1 2
LABOUR AND LABOUR WELFARE.
Bonded Labour 50% 1.00 0.20 0.20
Total : (Labour & Labour Welfare)
Social Welfare
Sew-9. Services for children in need of care and protection
Scw-21. Establishment of Institutions under Juvenile Justice Act.
Total : (Social Welfare)
1.00 0.20 0.20
45:45:10 60.00 5.00 7.00
50:50 70.00 8.85 10.00
130.00 13.85 17.00
:: GRAND TOTAL :: 97765.04 13726.31 15447.79
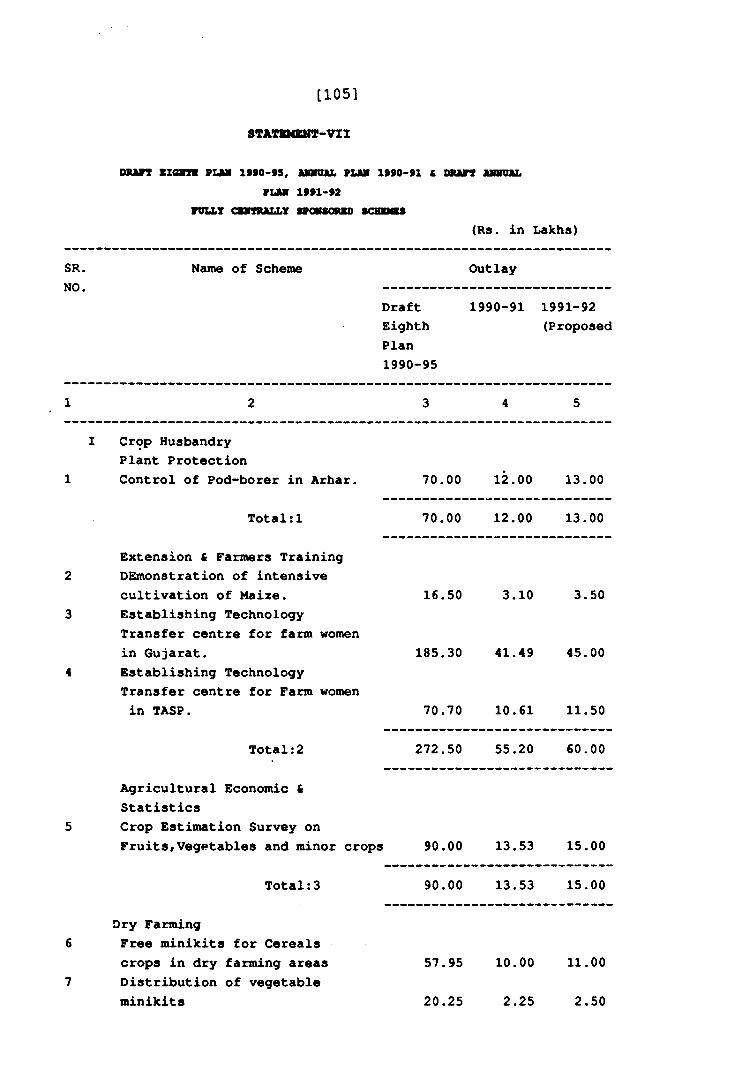
SR.NO.
DWUn BZGBni FLMM 1990-95, JkmniAL PLIV 19»0>91 C SRAFt AMMUIL » L M 1991-92
rOLLT CBRRAZXY SPOVSOMU) 8CHBNXS
[105]
STATEMENT-VII
Name o£ Scheme
DraftEighthPlan1990-95
(Rs. in Lakhs)
Outlay
1990-91 1991-92(Proposed
I Crop Husbandry Plant Protection
1 Control of Pod-borer in Arhar.
Total:1
Extension & Fanners Training2 DEmonstration of intensive
cultivation of Maize.3 Establishing Technology
Transfer centre for farm women in Gujarat.
4 Establishing Technology Transfer centre for Farm womenin TASP.
Total:2
Agricultural Economic &Statistics
5 Crop Estimation Survey on FruitsfVegetables and minor crops
Total:3
Dry Farming6 Free minikits for Cereals
crops in dry farming areas7 Distribution of vegetable
minikits
70.00 12.00 13.00
70.00 12.00 13.00
16.50 3.10 3.50
185.30 41.49 45.00
70.70 10.61 11.50
272.50 55.20 60.00
90.00 13.53 15.00
90.00 13.53 15.00
57.95 10.00 11.00
20.25 2.25 2.50
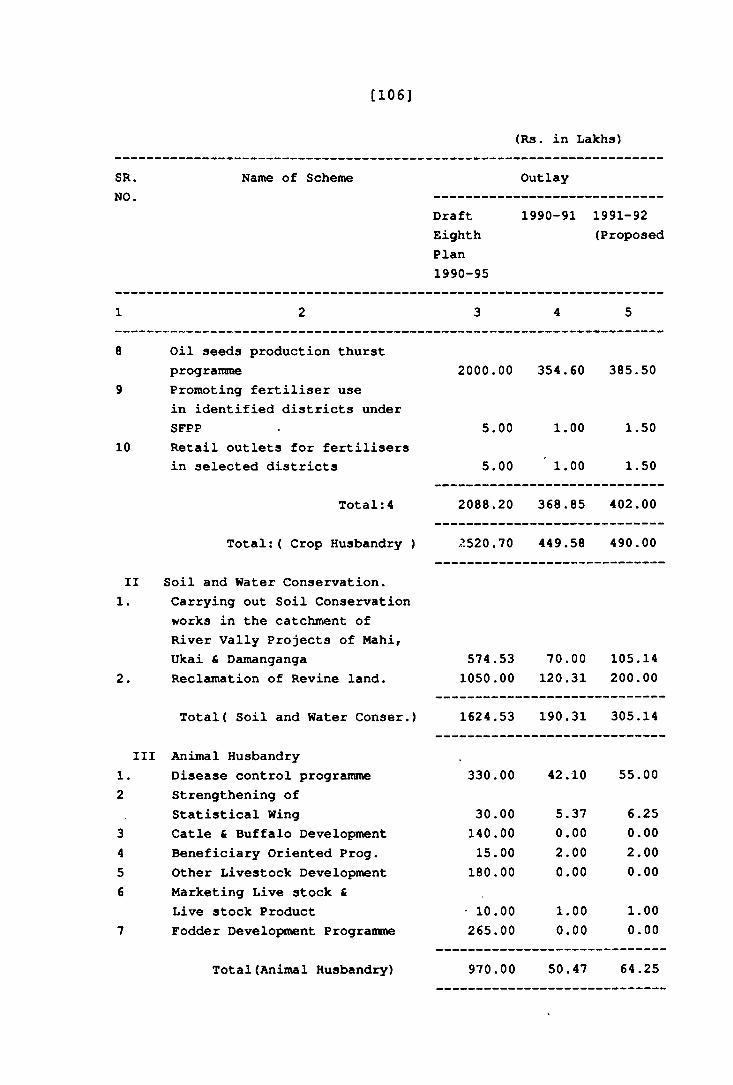
[106]
(Rs. in Lakhs)
SR. Name of Scheme OutlayNO.
DraftEighthPlan1990-95
1990-91 1991-92(Proposed
1 2 3 4 5
8 Oil seeds production thurst programme
9 Promoting fertiliser usein identified districts under SFPP
10 Retail outlets for fertilisers in selected districts
Total:4
Total;( Crop Husbandry )
II Soil and Water Conservation.1. Carrying out Soil Conservation
works in the catchment of River Vally Projects of Mahi, Ukai & Damanganga
2. Reclamation of Revine land.
Total ( Soil and Water Conser.)
Ill Animal HusbandryDisease control programme Strengthening of Statistical Wing Catle & Buffalo Development Beneficiary Oriented Prog. Other Livestock Development Marketing Live stock &Live stock ProductFodder Development Programme
Total(Animal Husbandry)
2000.00 354.60 385.50
5.00 1.00
5.00 ' 1.00
1.50
1.50
2088.20 368.85 402.00
. 520.70 449.58 490.00
574.53 70.00 105.141050.00 120.31 200.00
1624.53 190.31 305.14
330.00
30.00140.0015.00180.00
• 10.00265.00
42.10
5.370.002.000.00
1.000.00
55.00
6.250.00
2.000.00
1.000.00
970.00 50.47 64.25
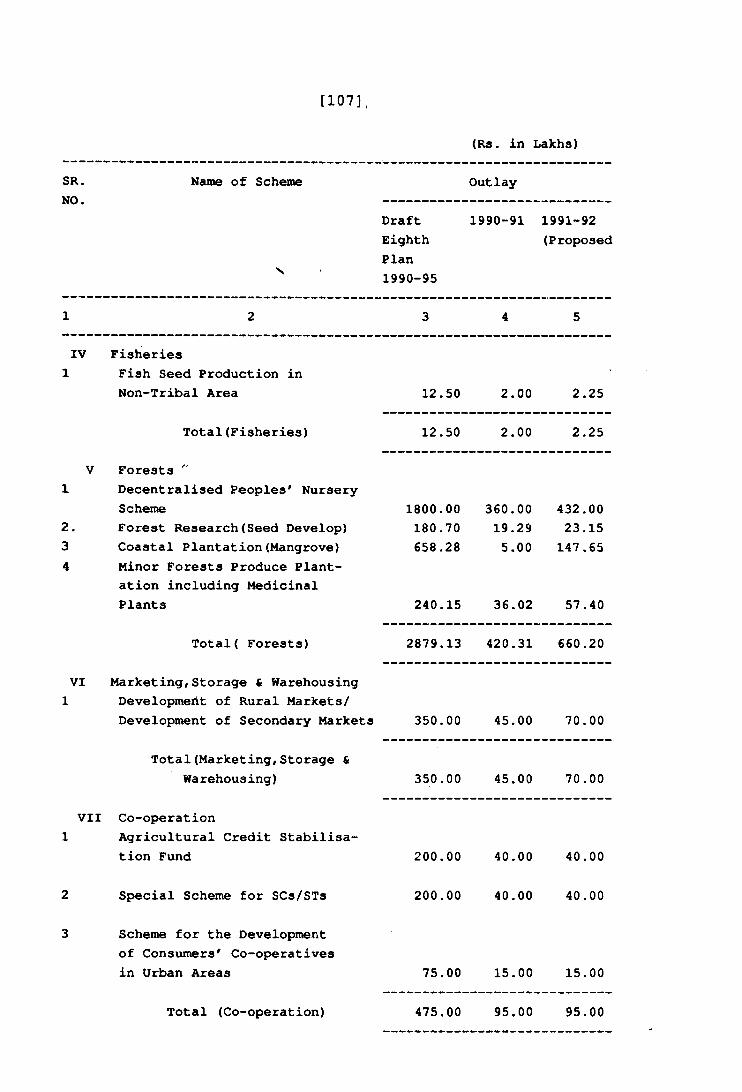
[107],
SR.NO.
Name of Scheme
DraftEighthPlan1990-95
(Rs. in Lakhs)
Outlay
1990-91 1991-92(Proposed
IV Fisheries1 Fish Seed Production in
Non-Tribal Area
Total(Fisheries)
V Forests1 Decentralised Peoples' Nursery
Scheme2. Forest Research(Seed Develop)3 Coastal Plantation(Mangrove)4 Minor Forests Produce Plant
ation including Medicinal Plants
Total( Forests)
VI Marketing,Storage & Warehousing1 Development of Rural Markets/
Development of Secondary Markets
Total(Marketing,Storage & Warehousing)
VII Co-operation1 Agricultural Credit Stabilisa
tion Fund
2 Special Scheme for SCs/STs
3 Scheme for the Development of Consumers' Co-operatives in Urban Areas
Total (Co-operation)
12.50 2.00 2.25
12.50 2.00 2.25
1800.00180.70658.28
360.0019.295.00
432.0023.15147.65
240.15 36.02 57.40
2879.13 420.31 660.20
350.00 45.00 70.00
350.00 45.00 70.00
200.00 40.00 40.00
200.00 40.00 40.00
75.00 15.00 15.00
475.00 95.00 95.00
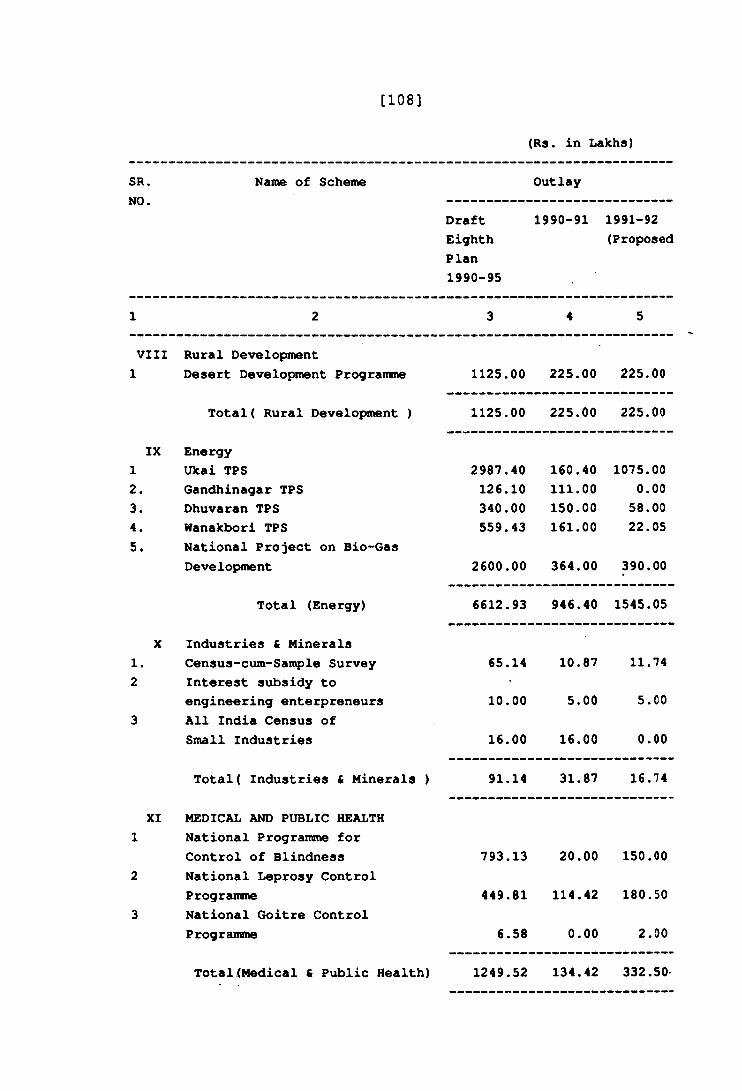
[108]
SR.NO.
Name of Scheme
DraftEighthPlan1990-95
(Rs. in Lakhs)
Outlay
1990-91 1991-92(Proposed
VIII Rural Development L Desert Development Prograirane
Total( Rural Development )
IX Energy12 .3.4.5.
XI
Ukai TPS Gandhinagar TPS Dhuvaran TPS Wanakbori TPSNational Project on Bio-Gas Development
Total (Energy)
Industries & Minerals
1125.00 225.00 225.00
1125.00 225.00 225.00
2987.40 160.40 1075.00126.10 111.00 0.00340.00 150.00 58.00559.43 161.00 22.05
2600.00 364.00 390.00
6612.93 946.40 1545.05
Census-cum-Sanple Survey 65.14 10.87 11.74Interest subsidy toengineering enterpreneurs 10.00 5.00 5.00All India Census ofSmall Industries 16.00 16.00 0.00
Total ( Industries & Minerals ) 91.14 31.87 16.74
MEDICAL AND PUBLIC HEALTHNational Programme forControl of Blindness 793.13 20.00 150.00National Leprosy ControlPrograunnme 449.81 114.42 180.50National Goitre ControlProgramme 6.58 0.00 2.00
Total(Medical £ Public Health) 1249.52 134.42 332.50
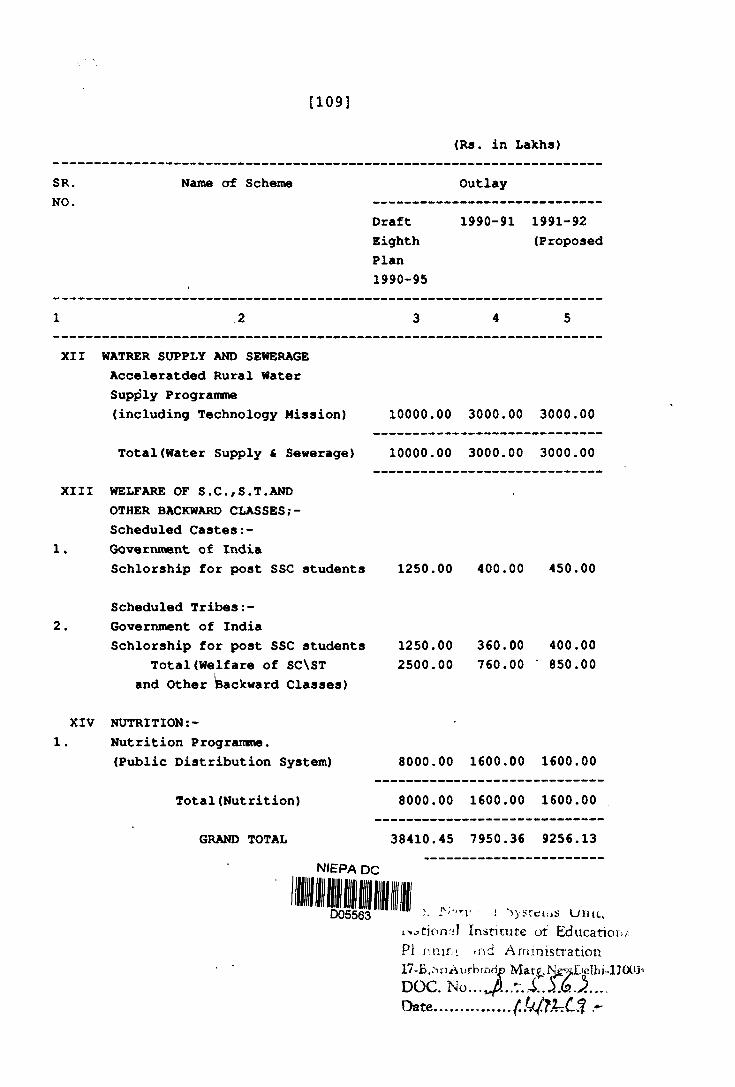
[109]
<Rs. in Lakhs)
SR.WO
Name af Scheme Outlay
DraftEighthPlan1990-95
1990-91 1991-92(Proposed
1 2 3 4 5
XII WATRER SUPPLY AND SEWERAGE Acceleratded Rural Water Supply Programme (including Technology Mission) 10000.00 3000.00 3000.00
Total(Water Supply & Sewerage) 10000.00 3000.00 3000.00
XIII
1.
WELFARE OF S.C.,S.T.AND OTHER BACKWARD CLASSES Scheduled Castes:- Governraent of India Schlorship for post SSC students 1250.00 400.00 450.00
2.Scheduled Tribes Government of India Schlorship for post SSC students
Total(Welfare of SC\ST and Other Bac)cward Classes)
1250.002500.00
360.00760.00
400.00 • 850.00
XIV1.
NUTRITIONNutrition Prograirane.(Public Distribution System) 8000.00 1600.00 1600.00
Total(Nutrition) 8000.00 1600.00 1600.00
GRAND TOTAL 38410.45 7950.36 9256.13
NIEPA DC
ID05663 N'-ti' ' i Uiitt,
INC.don ?I Institute of Educatioi)?.
Pi ivnim ti\d A ministration
17-B.miAurbjru Marf,I 'elhi-IKXOD O C . N o . . . . i . S h .
Date......................