la perouse project eighth annual progress
TRANSCRIPT
LA PEROUSE PROJECT
EIGHTH ANNUAL
PROGRESS REPORT
1992
LA PEROUSEIMASS PROJECT
EIGHTH ANNUAL PROGRESS REPORT
1992
DECEMBER 1993
CONTENTS
Page
1. Introduction 1
2. Standard Sampling Grids 7
3. Investigator Summaries 10
3.1 Physical Oceanographic Program 10 3.1.1 Current and water property observations
in 1992 10 3.1.2 Numerical model studies off the entrance to Juan
de Fuca Strait 21
3.2 Biological Oceanography Program 24
3.2.1 Seasonal cycle of plankton biomass and species composition in the La Perouse study area 24
3.2.2 Modeling plankton and fish trophodynamics in the Juan de Fuca Eddy 27
3.2.3 Euphausiid population biology studies 31 3.2.4 Processes controlling vertical exchanges of
carbon along the Pacific continental margin 39
3.3 Fisheries Oceanography Program 42
3.3.1 Summer pelagic fish distributions and trophic interactions 42
3.3.2 Pacific hake distribution and recruitment 49 3.3.3 LarvaVjuvenile fish and plankton interactions 54
4. Summary of 1991 surveys 59
5. Publication List 68
1
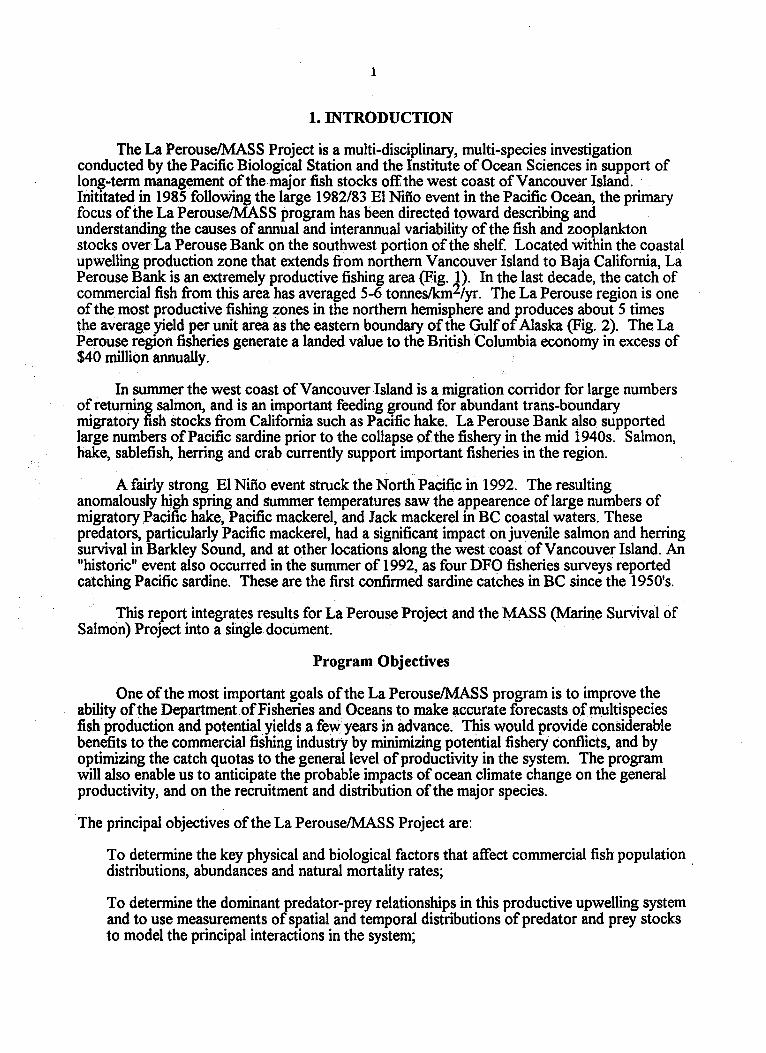
1. INTRODUCTION
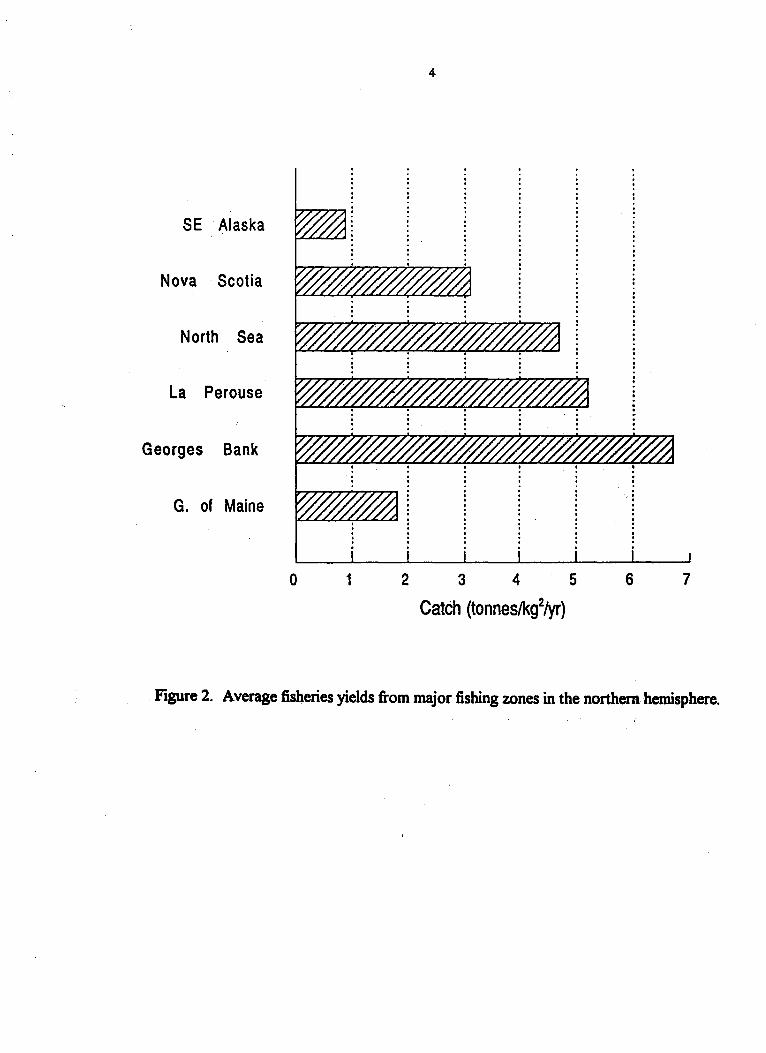
The La PerouselMASS Project is a multi-disciplinary, multi-species investigation conducted by the Pacific Biological Station and the Institute of Ocean Sciences in support of long-term management of the major fish stocks off the west coast of Vancouver Island. Inititated in 1985 following the large 1982/83 EI Nino event in the Pacific Ocean, the primary focus of the La PerouselMASS program has been directed toward describing and understanding the causes of annual and interannual variability of the fish and zooplankton stocks over La Perouse Bank: on the southwest portion of the shelf Located within the coastal upwelling production zone that extends from northern Vancouver Island to Baja California, La Perouse Bank is an extremely productive fishing area (Fig. 1). In the last decade, the catch of commercial fish from this area has averaged 5-6 tonneslkm2/yr. The La Perouse region is one of the most productive fishing zones in the northern hemisphere and produces about 5 times the average yield per unit area as the eastern boundary of the Gulf of Alaska (Fig. 2). The La Perouse region fisheries generate a landed value to the British Columbia economy in excess of $40 million annually.
In summer the west coast of Vancouver Island is a migration corridor for large numbers of returning salmon, and is an important feeding ground for abundant trans-boundary migratory fish stocks from California such as Pacific hake. La Perouse Bank also supported large numbers of Pacific sardine prior to the collapse ofthe fishery in the mid i940s. Salmon, hake, sablefish, herring and crab currently support important fisheries in the region.
A fairly strong El Nino event struck the North Pacific in 1992. The resulting anomalously high spring and summer temperatures saw the appearence of large numbers of migratory J»acific hake, Pacific mackerel, and Jack mackerel in BC coastal waters. These predators, particularly Pacific mackerel, had a significant impact on juvenile salmon and herring survival in Barkley Sound, and at other locations along the west coast of Vancouver Island. An "historic" event also occurred in the summer of 1992, as four DFO fisheries surveys reported catching Pacific sardine. These are the first confirmed sardine catches in BC since the 1950's.
This report integrates results for La Perouse Project and the MASS (Marine Survival of Salmon) Project into a single document.
Program ObJectives
One of the most important goals of the La PerouselMASS program is to improve the ability of the Department of Fisheries and Oceans to make accurate forecasts, of multi species fish production and potential,yields ,a few years in advance. This would provide considerable benefits to the commercial fishing industry by minimizing potential fishery conflicts, and by optimizing the catch quotas to the general level of productivity in the system. The program will also enable us to anticipate the probable impacts of ocean climate change on the general productivity, and on the recruitment and distribution of the major species.
The principal objectives of the La PerouselMASS Project are:
To determine the key physical and biological factors that affect commercial fish population distributions, abundances and natural mortality rates;
To determine the dominant predator-prey relationships in this productive upwelling system and to use measurements of spatial and temporal distributions of predator and prey stocks to model the principal interactions in the system;

2
ISLAND
\ °Go ,,;..
* ~ Qf(, .p
# # ~ ~
0.0
.~ ~
(a) ("G-
.p ,.p~
'1-~
126°30' 126°00' 125°30' 125"00'
Figure 1a. General summer circulation pattern on La Perouse Bank and surrounding waters. Shaded region denotes an area of confused flow.
48
48

(b) , ,
'--'I I
I \
14.1
, ,
FISHING SUBAREAS I. BARKLEY SOUND 2. FIRING RANGE 3.SWCORNER 4~ POTHOLES 5.12 MILE BANI< 6.40 MILE BANK 7. FINGER BANK 8. BOTTLENECK 9. SW I FTSU RE BAN K 10. EDDY II. WEST BANK 12.S0UTHSLOPE 13.CENTRAL SLOPE 14,NORTH SLOPE
"' I
, " --,
,I
( ....
,
3
I ..... "...... -,J I oJ - - I
12.1 " .I
'-, ,,' ,
------. ,,,
\.. \
i I
I-I , \ ,
I I
" , \
-- ......... C I
I ,. - " , I, - --1 I ,
I \ 200 .. )"' I
1'0'.,1 I' 1 I,' , , ? ./ ,I" I " ' ';', J l},' 9.1
\ ) " I '.. rJ !;;r I , I I
.I '"i I I I ,...... I ,
f'J I, I (', , I I
1,1/,,-, "\r\.l,
: I , 200m 200m 100m
I I ,
Figure lb. La Perouse Bank fishing' subareas. The map shows the locations of some important places mentioned in this report.
4
SE Alaska
Nova Scotia
North Sea
La Perouse
Georges Bank
G. of Maine
o 1 2 3 4 5 6 7
Catch (tonneslkg2/yr)
Figure 2. Average fisheries yields from major fishing zones in the northern hemisphere.

5
To use the emerging scientific results from the program to develop and verify sophisticated bio-physical models that can be used as operational tools in the long-term planning and management of the multispecies fisheries off the west coast of Vancouver Island.
Application of Results
The La PerouselMASS Project has proven to be a highly successful fisheries-oceanographic investigation with immediate, practical implications. We can count a number of successes that have a direct impact on British Columbia's commercial fisheries, and on international negotiations on the harvesting of trans boundary stocks. Specifically,
1. ThE; LaPerouseIMASS project has given us fundamental information on the seasonal patterns in the physical environment and the resulting primary and secondary productivity along the west coast-of Vancouver Island. We have also developed new theories on how changes in ocean climate -affect the general productivity. of the system, especially the success of herring, salmon and sablefish year-classes. These results have been published and have been made available to the fishing industry and the public.
2. The LaPerouselMASS project has increased our understanding of the seasonal distribution and biological response offish stocks, like Pacific hake, to local oceanic and feeding conditions. This vital new information has been used to secure a fair share of the North American west coast hake quota for Canadian fis~ermen. The-arguments made to support Canada's position were based on scientific evidence collected by the LaPerouselMASS project. The annual landed value of the Canadian hake fishery is currently about $15 million.
3. The salmon component of the La PerouselMASS project is using biological and physical oceanographic data to forecast the strength of the returning sockeye run, and the resulting fisheries potential for local fisheries managers. Recent work predicted recovery of the Barkley Sound sockeye fishery after 3 years of closure, and : helped assure the orderly harvest of commercial and sport caught sockeye worth $15 million in 1991.
4. The La PerouselMASS project has shown that one of the principal reasons why the Barkley Sound herring stock has been so unproductive for the last 6 years is due to the increased abundance of hake in the region, in association with abnornally warm oceanic conditions (warm;water results in poor herring survival). Hake are the principal predator of herring. New information collected by the program is used at annual DFO-Industry meetings to explain why the herring stock is declining. Our scientific evidence and interpretations have been accepted generally by industry as a believable explanation of what is happening, and has made it easier for them to accept DFO's attempts to rebuild the stock. The average landed value of the Barkley Sound herring fishery over the last 5 yrs is about $10-11 million.
5. Our knowledge offish distributions in the La Per:ouse region enabled us to anticipate, and forewarn DFO managers about, the serious potential consequences to salmon and herring of a summer trawl fishery for hake in, and near the mouth of, Barkley Sound, which was scheduled to begin in 1992. The La PerouseIMASS working group advised that Barkley Sound be closed to hake trawling in the summer to minimize the by-catch of salmon and herring.
The Operational Coupling of Fishery Science and Management
The La PerouseIMASS program is in the process of developing increasingly sophisticated numerical models of the oceanic circulation and fisheries oceanography off the west coast of Vancouver Island. The evolution of these models over the next few years will lead to
6
operational tools for fisheries managers. These models won't be the only tool, but they could be important for developing multispecies fishing plans, and for fish recruitment, stock abundance and productivity forecasting.
For example, a first generation model of the environmentally-forced, south-west Vancouver island upwelling ecosystem has been developed and accepted for publication. The model has been adequately tested and validated to warrent using it to generate quarterly and annual proxy indicies of primary and secondary production. The resulting production indicies can be used: 1) to describe the effect of current oceanic conditions on the· productivity of this ecosystem (this is the most cost-effective way to estimate trends in primary production), and 2) determine if the model production time series (which starts in 1972) can "explain" observed variations in the growth and survival of important regional invertebrate, fish and marine bird stocks. The model production indicies have great potential and could prove to be a better indicator of regional production trends than the widely used Bakun upwelling index.
Our modelling research will lead to the development of the new operational tools required for the integrated management of the productive multi species fisheries off the west coast of Vancouver Island.
This manuscript contains the 1992 progress reports for the individual investigators in the La Perouse Project, as well as the MASS project. Annual meetings are held to review the design, recent progress and future plans of the three main components of the program:
1. The Physical Oceanography Program (headed by Rick Thomson); 2. The Biological Oceanography Program (headed by Dave Mackas); 3. The Fisheries Oceanography Program (headed by Dan Ware and Sandy McFarlane).
For further details please contact the project coordinators:
D.M. Ware Department of Fisheries and Oceans Pacific Biological Station Nanaimo, B.C. V9R 5K6 Phone: (604) 756-7199
Fax: (604) 756-7053
R.E. Thomson Department of Fisheries and Oceans Institute of Ocean Sciences . Sidney, RC. V8L 4B2 Phone: (604) 363-6555
Fax: (604) 363-6479

7
2. STANDARD SAMPLING GRIDS
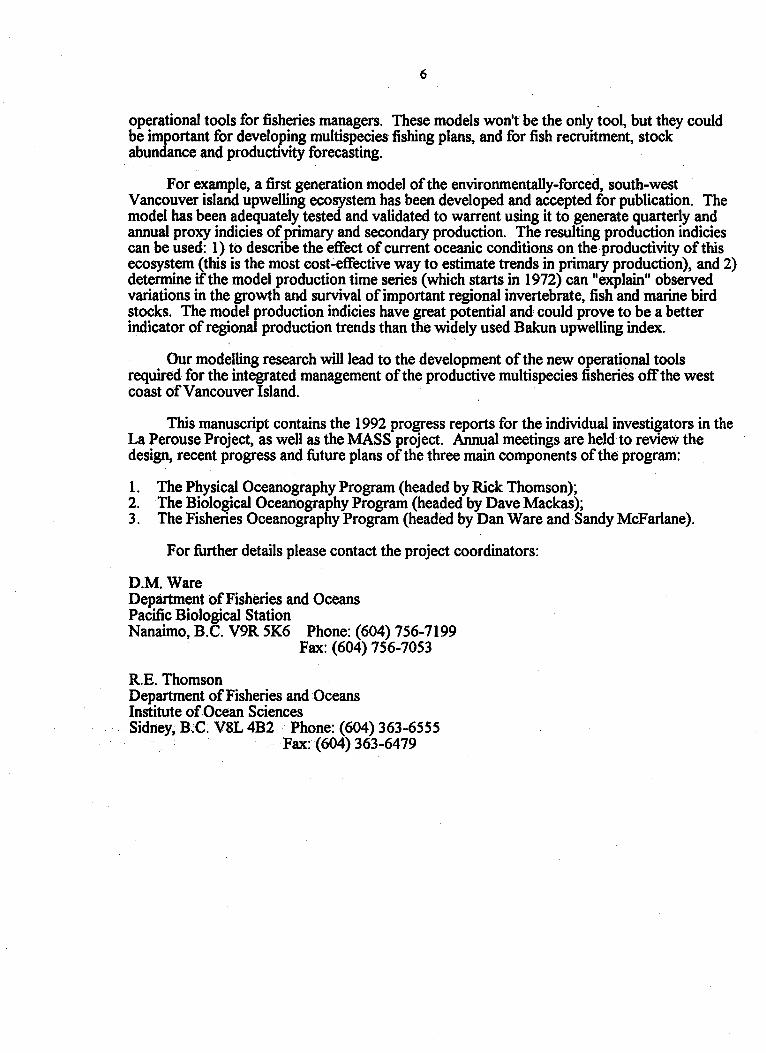
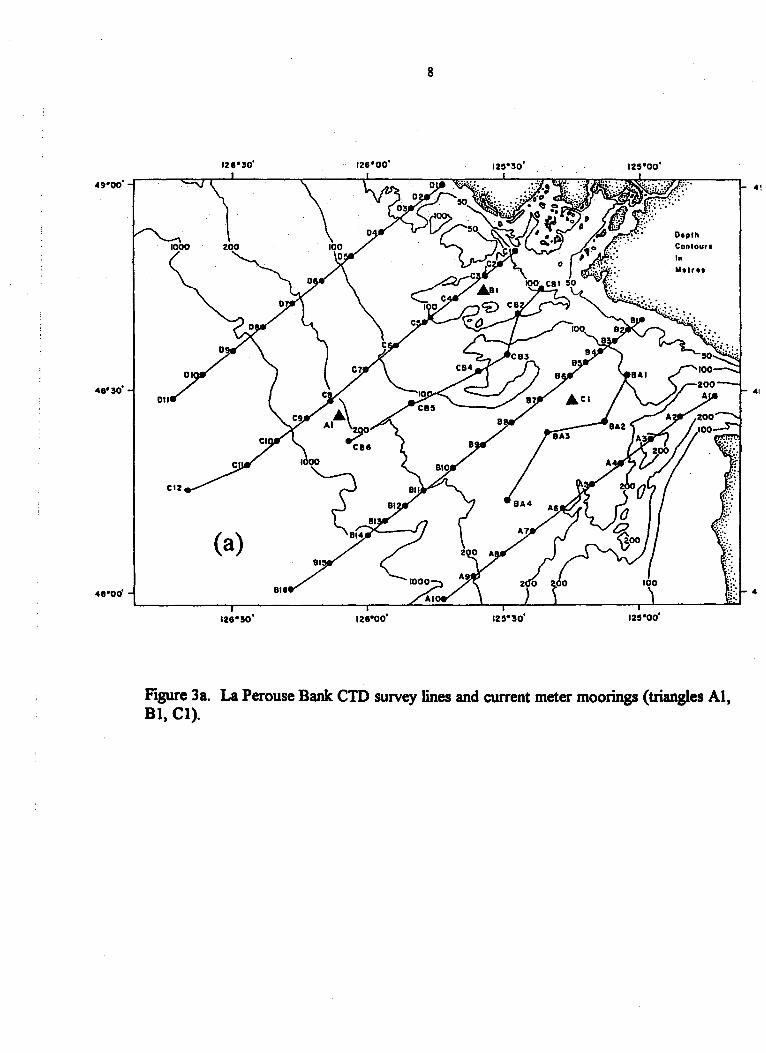
The standard sampling grids for CTD/hydro profile stations and plankton tow stations are presented in Figs. 3a and 3b, respectively. Figure 3a also shows the locations of the standard current meter moorings AI, Bl, and Cl. Mooring site Bl was not occupied during 1991. Generally, the area of interest is defined from north to south, between 480 00.0' and 490 00.0' N latitude, and from east to west, between 1240 40.0' and 1260 S0.0'W longitude. Furthermore, the sampling grid transect lines run perpendicular to the coast of Vancouver Island and pass through the above defined area at an approximate bearing of23So true N.
49"00'
48"30'
48"00'
8
128"30' 12S"00'
(a)
126"00' 125"30'
125"00'
125"00'
Olplh
Conlouro In Ihl, ..
Figure 3a. La Perouse Bank cm sUlVey lines and current meter moorings (triangles AI, BI, CI).
41
4
9
128"30' 126"00' 12!1°30'
49·00'·
1000 200
(b)
126"30' 12!1" 30'
Figure 3b .. La Perouse Bank plankton sampling stations.
12!1°00'
12!1°00'
Dop.II COftlaUf.
In
Mo" ..
49·00'
4,°30'
4,°00'

10
3. INVESTIGATORS SUMMARIES
3.1 PHYSICAL OCEANOGRAPIDC PROGRAM
The physical oceanographic component of the La Perouse Project provides current and water property data along the west coast of Vancouver Island and in the western portion of Juan de Fuca Strait in support of fisheries and interannual climate investigations. The physical data also contribute to our understanding of the circulation dynamics over the shelf and provide a data base for EI-Nino type oceanic variability in the northeast Pacific Ocean. Additional applications include the study of shelf/slope exchange processes, determination of the interannual variation in the timing and intensity of the Spring and Fall transitions, provision of input and calibration data for numerical circulation models, and calibration of remote sensing measurements. Observations collected during the program are used in the development of oil-spill trajectory models, in the interpretation of sea-bird distribution and in studies of sediment distribution and transport.
3.1.1 Current and Water Property Observations in 1992
Oceanographic data in the survey region (Figs. 3a,b) were collected during 6 dedicated La PerouselMASS cruises between January 1 and December 31 (see. section 4. Survey summaries). This compares with 6 dedicted cruises in 1991,9 dedicated cruises in 1990, 10 in 1989 and 17 in 1988. Several near-shore survey lines from three WOCE (Line P) cruises in 1992 have also been added to the data set. The decline from 1988 to 1989 was due to structural problems on the W.E. Ricker which forced cancellation of scientific cruises during the main portion of the field season. The decline in 1991 is related to the transfer of the principal lOS research vessel CSS Parizeau from the west coast to the east coast fleet.
Archived water property files include plots and listings of individual vertical CTD profiles of temperature, salinity and light attenuation together with horizontal maps and cross-sectional maps of temperature, salinity, density, dissolved oxygen, light attenuation coefficient, dynamic height and geostrophic currents. Transect records from the shipboard SAIL system also are available but considerable processing is needed to render the data useful. Unlike previous years, all stages of editing and processing of the CTD data are conducted under contract. Calibration and editing of the current meter and thermistor chain data are conducted in-house by Andrew Lee. Post processing of all data is done through external contract. Joseph Linguanti of lOS continues to oversee the editing and archiving stages of the data processing while Richard Thomson isdirectIyresponsible f()r data quality control during the editing stage. Profile data from the shipboard 150 kHz acoustic Doppler current profiler (ADCP) are processed under contract and kept in a separate archive. Copies of all data collected by the various contributing groups are available from Richard Thomson of the Institute of Ocean Sciences. Because of the government cutbacks on spending throughout 1992 and 1993, a large segment of the data set has yet to be edited and processed. The lack of funding also has caused . many highly trained contractors to find other sources of funding, limiting our ability to anlayze and interpret the data sets.
Current Meter Moorings in 1992
The standard deployment positions for all La Perousel MASS current meter moorings are shown in Fig. 4. [Owing to heavy fishing activity and associated data losses in recent years, the deployment of mooring, Bl, off Barkley Sound was suspended following the recovery cruise of April 1990.] Mooring Cl measures the variability in the flow over the central portion of the fishing bank while Al records the variability in the wind-induced flow along the outer edge of the broad continental shelf to the west of the main fishing sites. Mooring EO 1 offEstevan Point monitors the poleward flow associated with the buoyancy-driven, near-shore Vancouver Island

129' 128' 127'
51' o·
12'.' 12.'
11
127'
... SUBSURFACE
CURRENT METER
MOORING
125'
so·
Fipre 4 .. Location of current meter moorings on the west coast of Vancouver Island dunng 1992 and location of AESWeather Buoy (.) and moorings Jet (1) and NoJet (NJ).
12
Coastal Current. At this relatively "safe" quasi-permanent mooring site, the Coastal Current is known to be stable and well defined (Thomson et al. 1989).
Moorings E03 and Al record the temporal scales and longshore coherence of the ShelfBreak '~et". With its core centered near the surface over the 200 m depth contour, the ShelfBreak Current is a direct measure of summer upwelling intensity along the Vancouver Island continental shelf. 'Thermistor chains between 100 and 150 m depth on moorings Al and E03 provide detailed information on high frequency temperature variability during the upwelling period. Moorings Al and E03 also help to establish the long-term timing and intensity of the spring and fall transitions off the west coast of the island. Mooring BPI, consisting of current meters at 35 and 75 m depth at the edge of the steeply sloping shelf, provides data on the intense and highly-sheared flow past Brooks Peninsula and is maintained as an integral part of our long-term fisheries-climate program.
In addition to the La PerouselMASS moorings, we deployed a single subsurface mooring (CRD 1)' near the Macaulay Point outfall in support of eflluent dispersal research by the Capital Regional District (CRD). As part of this program, four CTD stations are occupied in the vicinity of the mooring. The purpose of this sub-program was to provide direct flow information for the outfall site as well as provide long-term verification and calibration data for numerical models being developed for the region by Seaconsult Marine Research and the Institute of Ocean Sciences. This work is partially funded through the Engineering Department oftheCRD.
Recovery and Servicing Operations
Servicing of all moorings took place in June and October 1992 (Table 1). Moorings deployed in October 1991 were returned with some data loss but no instrument losses. Mooring Cl(-N) was "hit" during the spring of 1992 and returned in part by a fisherman. The remaining portion was recovered from the CSS Tully during the June 1992 servicing period. Because of the increasing data losses sustained at,this site, current meter station Cl was not redeployed until October 1992. No losses were incurred between June and October, 1992. As in previous years, there was a survival problem with slope mooring E03, which was first deployed on October 10, 1990 in 500 m of water to the southwest of Est evan Point. This mooring was "hit" sometime in October 1992 (as indicated by a witness buoy "alert") and the top three instruments recovered by the FPV Tanuon November 8 as the array drifted off the west coast of Vancouver Island. The bottom portion of the mooring, consisting of an acoustic release, current meter vane and three glass balls, was recovered on March 8, 1993. Losses fromthis mooring (the total losses fotthe year) were a single RCM4 current meter and a S828 float. Redeployment of the La Perouse array took: place in early June 1992. Standard recovery and servicing of all moorings was undertaken during the period 25-30 October 1992.
The CRD mooring (CRD-B) deployed on October 5" 1991 failed to surface during the recovery cruise of June 1992. It was not until November 2, 1992 that we were able to recover the top instrument of the mooring through a dragging operation by the CSS Tully. The bottom instrument and acoustic release were recovered on May 9, 1993 with no loss of instrumentation. To ensure data continuity, a new,CRD mooring was deployed in June 1992 near the site of the original mooring.
Safeguarding Moorings
Several steps are taken each year to safeguard the moorings. In March 1991, over 5000 full page flyers (some in Japanese, Russian and Polish) were sent for distribution to the fishermen licensing agencies through the Commercial Licensing Division-Pacific Region ofDFO. Distribution to the trawlers was kindly handled by Mr. Athol Lang of the Hake Consortium.

13
The flyers detail instrument configurations and locations for each mooring and supply telephone numbers of Institute staff. Exact positions are also supplied to Totino Coast Guard
.. Radio for direct transmission to marine traffic in the area of moorings (Notice to Mariners).
In addition to the· dissemination of mooring information and labelling of all equipment . placed'in the ocean, other steps taken to reduce data and equipment loss are: (1) in-house
mainteJ1ance and pre-deploymenttestingofallmooring components; (2) proper design and selection of mooring components; (3) controlled deployment and recovery techniques combined with accurate (GPS, Loran-C, Radar) positioning techniques; and (4) provision for alternate recovery methods in conjunction with use of relocating aids such as VHF transmitters, Xenon flashing lights and Argos satellite beacons or "witness Buoys". Witness buoys have proven very successful in our ability to recover hit moorings. A summary of all losses during the La PerouselWest Coast project prepared by Tom Juhasz for the period November 1984 to October 1991 is presented in last year's report. For the 60 deployments in 9 years involving 274 individual instrument deployments to October 1992, the potential loss (equipment hit, cut adrift·or suffering·component failure) was roughly 36%; real losses (instruments not recovered or highly damaged) was about 6%.
Table 1. Mooring Status as of OctoberlNovember 1992. RCM is an Aanderaa current meter and TR is an Aailderaa thermister chain.
Station Latitude Longitude Deployment Depth ID oN oW DD-MM-YY (m) ..
-----------------------------------------------------------CRD-IC 4824.16 12324.55 02-11-92 RCM 25
RCM 50 Water depth 56
AI-16(P) 4831.86 12612.17 28-10-92 RCM 35 RCM 100
TRIOl RCM 175 RCM400
Water depth 500
CI-15(P) 4829.28 125 15.26 30-10-92 RCM 35 RCM 100
Water depth 152
EOl-16(P) 4917.91 12636A6 27-10;;'92 RCM 25 RCM 35 RCM 75
Water depth 1 00
E03-16(P) 4904.93 12757.06 27-10-92 RCM 35 RCM 100
TR 101 RCM 175 RCM400
Water depth 495
BPOI-16(P) 5003.71 12753.84 25-10-92 RCM 35 RCM 75
Water depth 100

14
Oceanic Winds
The Atmospheric Environment Service has maintained a 3-m discus wind buoy at 480 50.05' N, 125059.74' W on La Perouse Bank (Fig. 4) since November 1, 1988. Data are transmitted . to .shore via the GOES satellite and are archived. by the Marine: Environmental. Data Service in Ottawa. All wind data are now ar.chived at AES in Vancouver and arrangements have been made to have these data transmitted to Ocean Physics, lOS (contact Robin Brown).
Standard Oceanographic Products
The edited oceanographic data are processed \Ising a set of standard techniques that have been customized for the La Perouse region. Standard products derived from these .data are listed below. (Further details can be found in the Annual La Perouse Report for 1988 (see section.5). Archived data products are:
1. Files ,and plots of I-m averaged temperature, $alinity and light attenuation as a.function of depth for all oceanic surveys from June 1984 to January' 1993. Dissolved oxygen profiles from water bottle casts at standard depths are available for many of the La Perouse grid stations.
2. Files at standard hydrographic depths (e.g. 0, 10,20,30, 50m, ... ) of temperature, salinity, density (sigma-t), light attenuation coefficient, dissolved oxygen,. sound speed, and dynamic height.
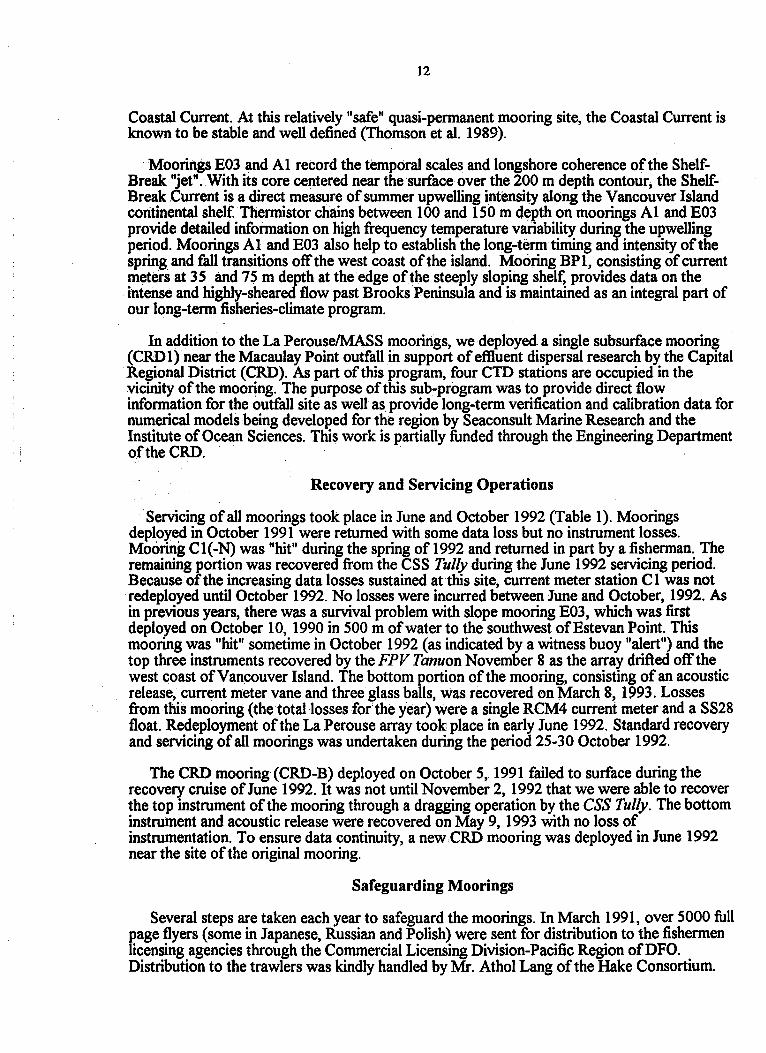
3. Objectively mapped water properties on horizontal surfaces at standard oceanic depths for each oceanic survey including temperature, salinity, density (sigma-t), dissolved oxygen, light attenuation coefficient, depth ofsigma-t surfaces and geostrophic velocity (Fig. 5a,b).
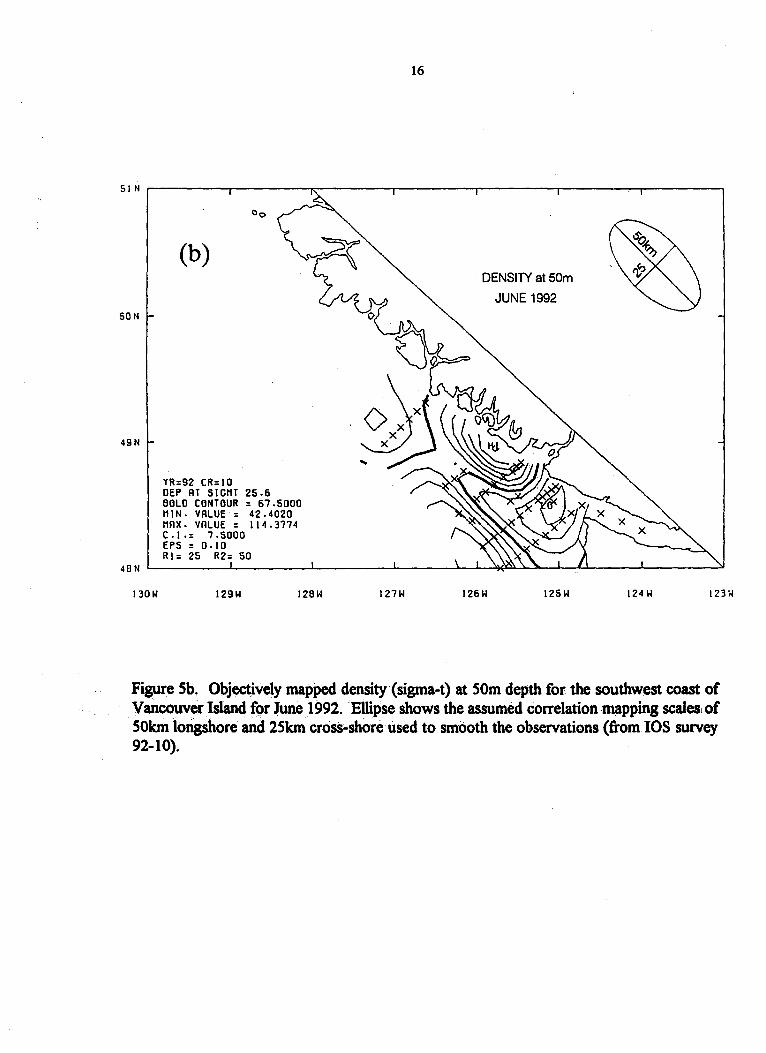
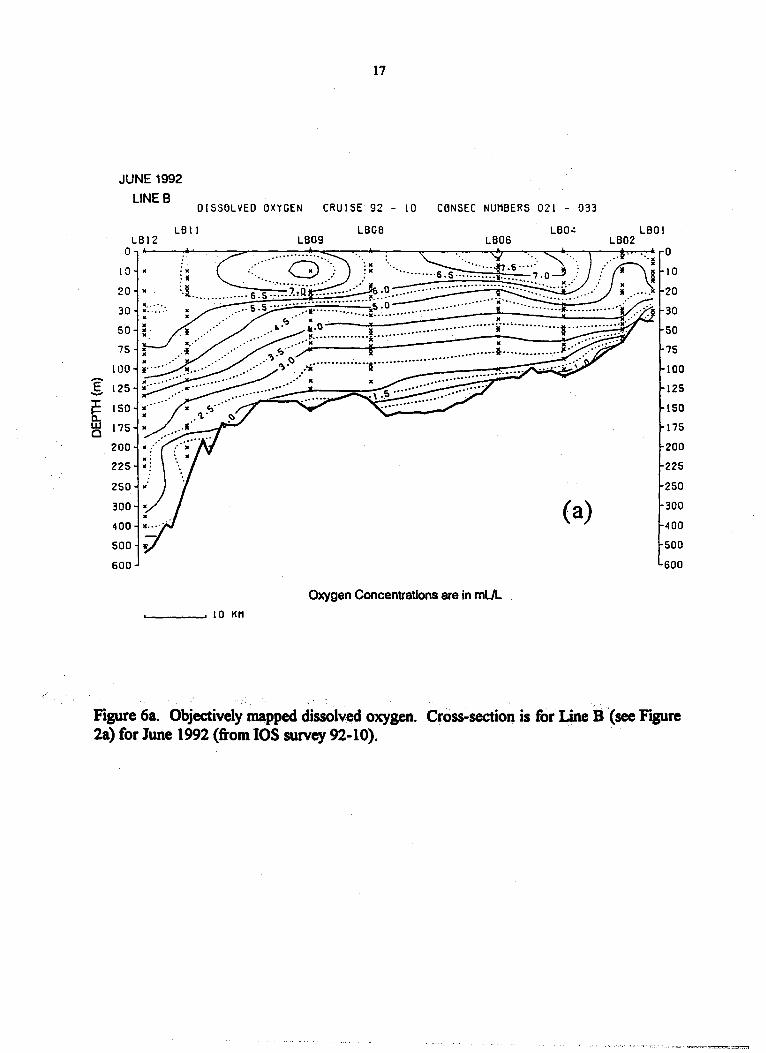
4. Objectively mapped cross-sections of the above oceanic properties (including geostrophic velocity relative to several reference depths) along all cross-shore survey lines (Fig. 6a,b).
The program to calculate cross-sections of geostrophic velocity normal to the CTD survey line has been recently generated under contract. Velocities are determined relative to userdefin~d depths of 50, 100, and 300 m and smoothed with the standard objective cross-sectional mappmg program.
5. Three-dimensional maps of water properties for the La Perouse region including bottom topography. [Not available for 1992 data sets due to a lack of funds and contractor support.]
6. Edited current meter records for all sites plus hourly and low pass filtered records. [The 1992 data are not yet available due to a lack offunds and computing support.]
7. Satellite thermal imagery (NOAA A VHRR data) for specific cruises. There is no mechanism to process the acquired data other than through contractors that specialize in these products (e.g. Borstad Associates and Arctic Sciences Ltd.)
8. Shipboard acoustic Doppler current profiler (ADCP) data consisting of horizontal currents and acoustic backscatter anomalies. Problems remain with the analysis and dissemination ofi the shipboard ADCP data. The data files are large and there are many erroneous values that require labour-intensive editing. Observations mix time and space scales so that interpretation of the data is difficult. Considerable development work is needed. The contractor who normally does the analysis and who has written all the software (Luc Cuypers) is not always available. All data from Ocean Physics cruises have been archived and cruise tracks plotted (see Rick Thomson and Robin Brown).

15
SIN r--------r--------~------_.--------_r--------r_------~------~
SON
49N
(a)
YR=92 CR=IO TNP AT DEPTH 50m BOLD CONTOUR = 9.0000 NIN. VALUE = 8.1971 MAX. VALUE = 10.0954 C.1.= 0.2000 EPS = 0.10 R1= 25 R2= 50
TEMPERATURE (0 C)
JUNE 1992
4BN L-______ ~ ________ ~ ______ _J ______ ~UU~~~--L-~----~------~
13011 12911 12811 12711 12611 12511 12411 123W
Figure Sa. Objectively mapped temperature. at SOm depth for the southwest coast of Vancouver Island for June 1992. Ellipse shows the assumed correlation mapping scales of SOkmlongshore and 2Skm cross-shore used to smooth the observations (from lOS survey 92-10).
16
SIN r--------r----~--~------~--------~--------r_------~------__,
SON
49N
(b)
YR=92 CR=IO OEP.AT SIGHT 25.6 BOLD CONTOUR = 67.5000 MIN. VALUE = 42.4020 MAX. VALUE = 114.3774 C.I.= 7.5000 EPS = 0.10 R1= 25 R2= 50
DENSITY at SOm
JUNE 1992
40N ~------~--------~------~------~~~~~--~~----~------~
130W 129W 128W 127W 1261-1 125W 124 W 1231-1
Figure Sb, Obj~ively mapped density (sigma-t) at SOm depth for the southwest coast of Vancouver Island for June 1992. Ellipse shows the assumed correlation mapping scaleslof SOlan longshore and 2Skm cross-shore used to smooth the observations (from lOS survey 92-10).
17
JUNE 1992
LINE B DISSOLVED OXYGEN CRUISE 92 - 10 CDNSEC NUMBERS 021 - 033
LBII LBOS LBO': LBI2 LB09
0 0
10 . 10
20 20
30 30
50 50
75 75
100 100
e- 125 125 -J: 150 ISO ~ w 175 0
200 200
225 225
250 250
300 . (a) 300
400 400
500
600 600
Oxygen Concentrations are in mUL , 10 KM
Figure6a. Objectively mapped dissolved oxygen. Cross-section is for Line B(see Figure 2a) for June 1992 (from lOS survey 92-10).

JUNE 1992 LINE B
nENSITY I SIGMR-T )
_E
10
20 30
50 75
100
125 150
175
LBI2
i!: 200' ' .. In 225 : ........ ~. o
250 •
300 x "'"'- -.,>---#
o\OU • 500 • 600 = ... 700
BOO
1000
'--____ . 10 KM
LBIO
CRUISE 92 - 10 ceNSEC NUMBERS 021 - 035
LBOB LB02
10
20 3.0
50 75 100 125 150 175
200 225 250 300 400
(b) 500 600 700 800 1000
Densities are in kg/m3
Figure 6b. Objectively mapped density (sigma-t), Cross-section is for Line B (see. Figure 2a}for lune'1992 (troin lOS survey 92:'1 O)~
19
Research Projects , ."'
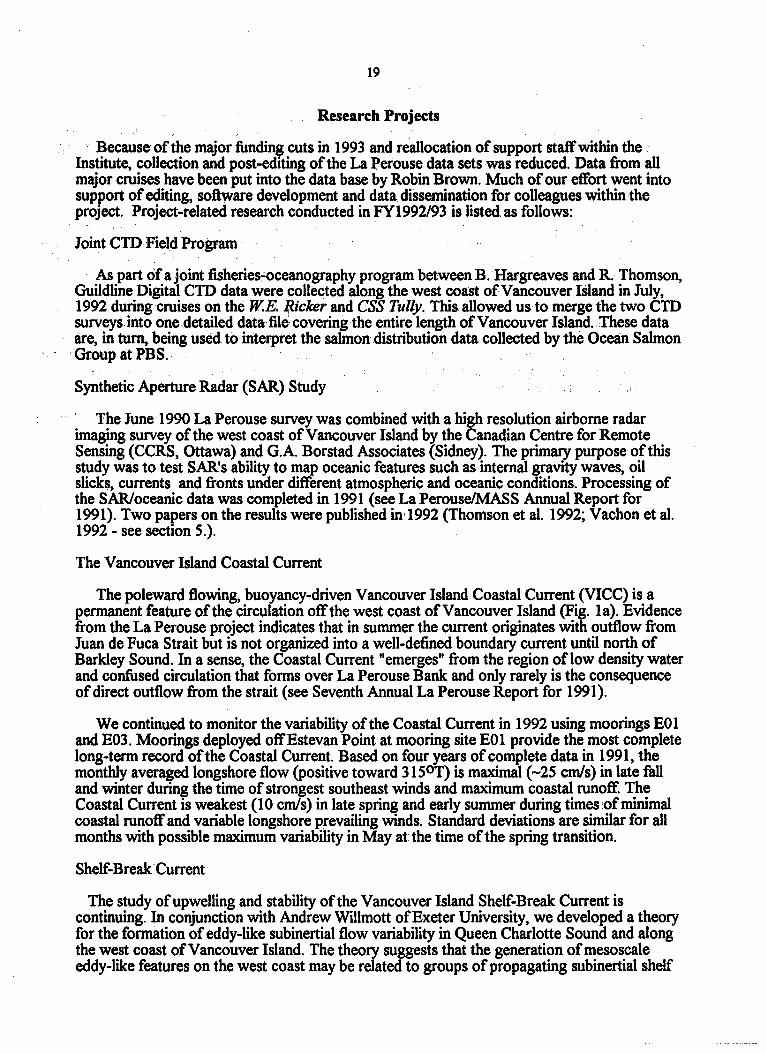
, Because of the major funding cuts in 1993 and reallocation of support staff within the Institute, collection and post-editing of the La Perouse data sets was reduced. Data from all major cruises have been put into the data base by Robin Brown. Much of our effort went into support of editing, software development and data dissemination for colleagues within the proJect. Project-related research conducted in FY1992/93 is listed. as follows:
Joint CTD Field Program
As part of a joint fisheries~oceanography program between B.Hargreaves and R. Thomson, . Guildline DigitalCTD data were collected along the west coast of Vancouver Island in July, 1992 during cruises onthe W.E J.Ucker and CSS Tully. This allowed us to merge the two CTD surveys. into one detailed data file covering the entire length of Vancouver Island .. These data are, in turn, being used. to interpret the salmon distribution data collected by the Ocean Salmon
, Group at PBS.
Synthetic Aperture Radar (SAR) Study
The June 1990 La Perouse survey was combined with a high resolution airborne radar imaging survey of the west coast of V ancouver Island by the Canadian Centre for Remote Sensing (CCRS, Ottawa) and G.A. Borstad Associates (Sidney). The primary purpose of this study was to test SARIs ability to map oceanic features such as internal gravity waves, oil slicks, currents and fronts under different atmospheric and oceanic conditions. Processing of the SAR/oceanic data was completed in 1991 (see La Perouse/MASS Annual Report for 1991). Two papers on the results were published in' 1992 (Thomson et al. 1992; Vachon etal. 1992 - see section 5.).
The Vancouver Island Coastal Current
The poleward flowing, buoyancy-driven Vancouver Island Coastal Current (VICC) is a permanent feature of the circulation off the west coast of Vancouver Island (Fig. la). Evidence from the La Perouse project indicates that in summer the current originates with outflow from Juan de Fuca Strait but is not organized into a well-defined boundary current until north of Barkley Sound. In a sense, the Coastal Current "emerges" from the region oflow density water and confused circulation that forms over La Perouse Bank and only rarely is the consequence of direct outflow from the strait (see Seventh Annual La Perouse Report for 1991).
We continued to monitor the variability of the Coastal Current in 1992 using moorings EO 1 and E03. Moorings deployed offEstevan Point at mooring site EOI provide the most complete long-term record of the Coastal Current. Based on four years of complete data in 1991, the monthly averaged longshore flow (positive toward 3150 T) is maximal (-25 cmls) in late fall and winter during the time of strongest southeast· winds and maximum coastal runoff. The Coastal Current is weakest (10 cmls) in late spring and early summer during times of minimal coastal runoff and variable longshore prevailing winds. Standard deviations are similar for all months with possible maximum variability in May at the time of the spring transition.
Shelf-Break· Current
The study of upwelling and stability of the Vancouver Island Shelf-Break Current is continuing. In conjunction with Andrew Willmott of Exeter University, we developed a theory for the formation of eddy-like subinertial flow variability in Queen Charlotte Sound and along the west coast of Vancouver Island. The theory suggests that the generation of mesoscale eddy-like features on the west coast may be related to groups of propagating subinertial shelf
20
waves generated by the longshore wind, diurnal tidal currents or by propagating offshore circulation cells. The patterns associated with the wave groups propagate poleward along the shelf and closely resemble the eddy-like features seen in, satellite imagery. R.esultsare being published (Willmott and Thomson 1994).
Seasonal Cycles in Coastal Upwelling
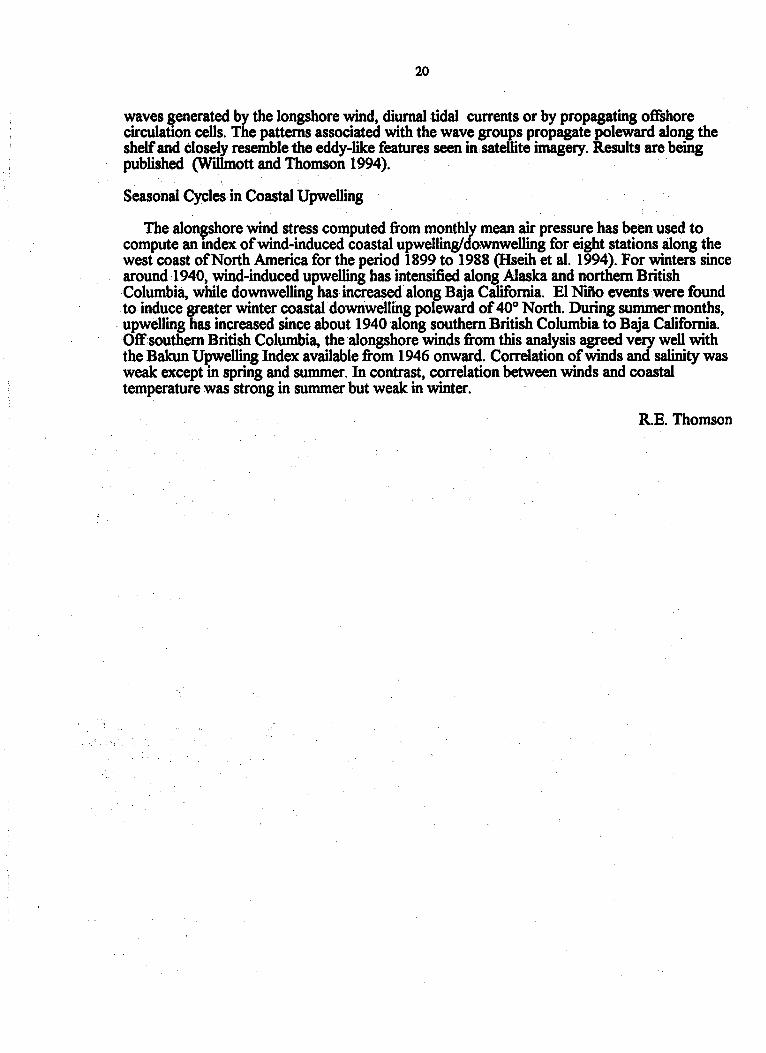
The alont'shore wind stress computed from monthly mean air pressure has been used to compute an mdex of wind-induced coastal upwelling/downwelling for eight stations along the west coast of North America for the period 1899 to 1988 (Hseib et al. 1994). For winters since around .1940, wind-induced upwelling has intensified along Alaska and northern British Columbia, while downwelling has increased along Baja California. EI Nino events were found to induce greater winter coastaldowriwelling poleward of 40° North. During summet months, upwelling has increased since about 1940 along southern British Columbia to Baja California. Off southern British Columbia, the alongshore winds from this analysis agreed very well with the Bakun Upwelling Index available from 1946 onward. Correlation of winds and salinity was weak except in spring and summer. In contrast, correlation between winds and coastal temperature was strong in summer but weak in winter.
R.E. Thomson
21
3.1.2 Numerical Model Studies ofT the Entrance to Juan de Fuca Strait
In 1992/93, work continued with the numerical model that calculates three-dimensional velocities from CTD data. Given the importance of upwelling as the major source of nutrients in the La Perouse region, the specific objective was to validate previously calculated vertical velocities such as those suggesting greater upwelling along the shelfbreak at Clayquot, Barkley, and Nitnat Canyons. (See La Perouse Annual Report for 1991) Although vertical velocities calculated with a similar model have been qualitatively compared to analytic solutions (Lynch et al., 1991), comparisons have yet to be made against obselVations.
To achieve this end we focussed on CTD measurements taken by three cruises between March and June 1985. This time period was chosen because it corresponded to the operation of seven current meter moorings that Freeland and McIntosh (1989) (henceforth FM) deployed to study tile Tully Eddy and its associated upwelling, and an eighth mooring that Thomson deployed (as part of the La Perouse Project) along the shelfbreak northwest of Barkley Canyon. All the FM moorings had meters at the depths of 40m and 100m, three had meters at additional depths, and the Thomson mooring had instruments at 51 and 201m .. Six of the PM moorings were placed in a pentagonal array (one in the centre) over the Tully Canyon with an approximate separation of9-11 km. With a simple conservation of volume argument, the obselVed horizontal velocities from these instruments can be used:to estimate vertical velocities that can then be compared to the model values. In order to reduce the potentially large uncertainties that FM suggested might arise with such an approach, the horizontal velocities were low-pass filtered to remove the tides, and averaged over the period of each CTD cruise. Although the computations are not yet complete, the hope is to provide more precise vertical velocities than the 0.005 cmls typical values estimated by FM.
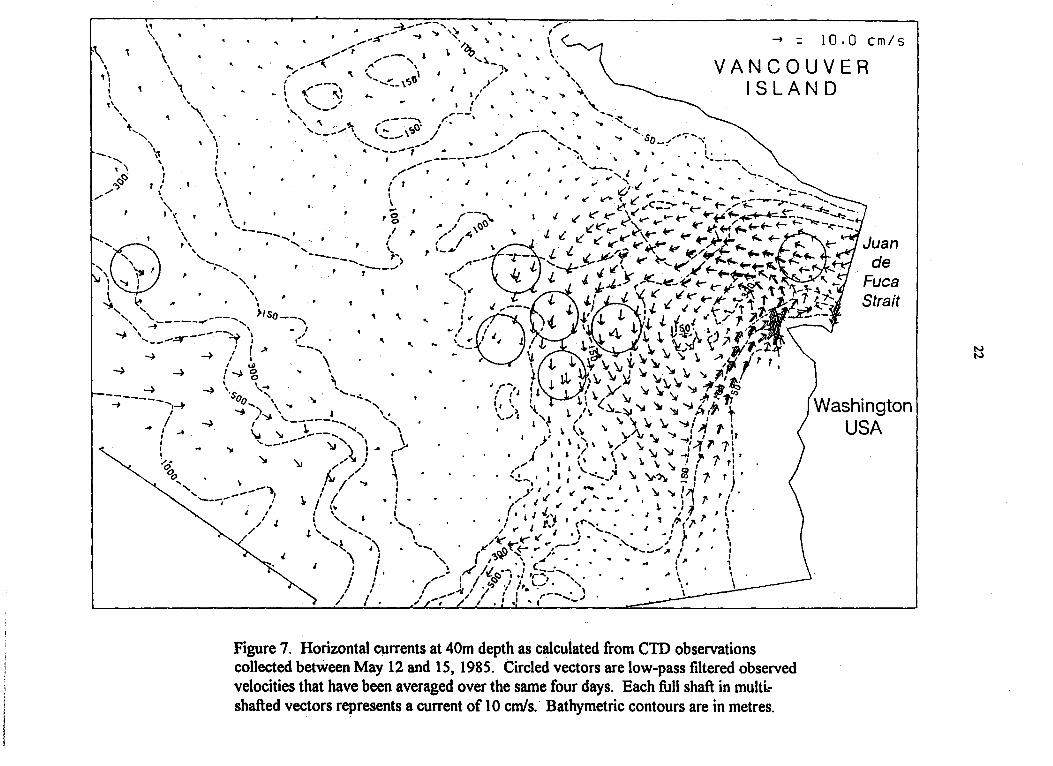
To illustrate the progress of the study, Fig. 7 'shows the model currents at 40m depth as calculated from the CTD data collected between May 12 and 15. A counterclockwise eddy is clearly evident off Cape Flattery but unfortunately its center (where the maximum upwelling should occur) is not where the current meters were.moored. The filtered and averaged obselVations at 40m and 51m depth are shown as vectors emanating from the centers of circles, and although they are not in perfect agreement, the model values compare very well. The similar figure for 100m depth does not show as good an agreement. This is largely due to
. problems in specifying conditions along the Juan de Fuca boundary so that the correct estuarine pattern of eastward flow at depth and westward flow at the surface is produced. Although Figure 7 shows surface westward flows, the model flows at 100m depth are not eastward. Present efforts are attempting to correctthis problem.
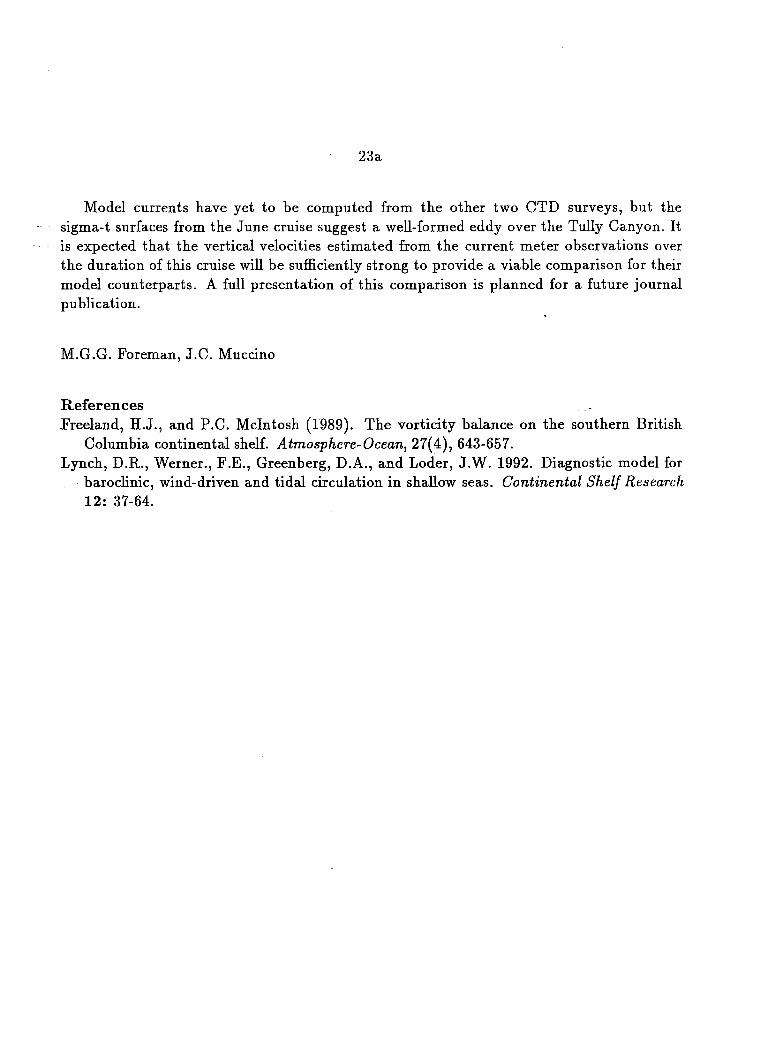
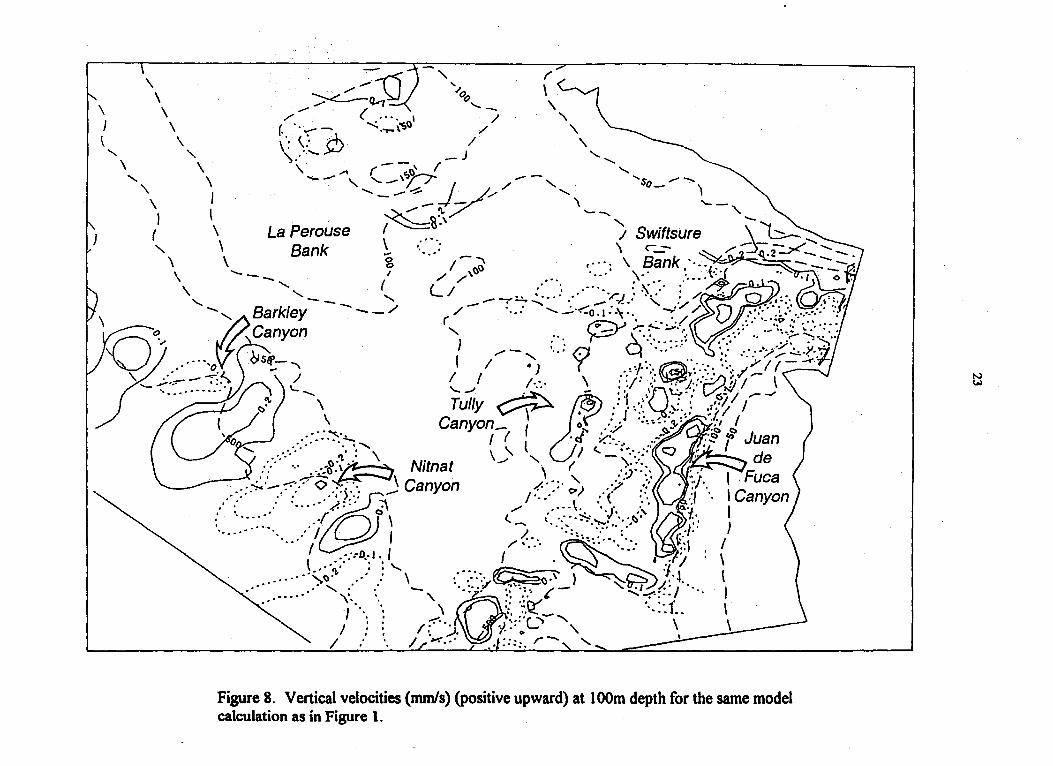
Figure 8 shows the associated model vertical velocities at 100m depth. Upwelling regions are contoured with solid lines while downwelling regions have dotted contQurs and the bathymetric contours are dashed. Notice the upwelling on the southeast sides of Barkley, Nitnat, and Juan de Fuca Canyons; on the southeast flank of La Perouse Bank; and around the southern flank of Swiftsure Bank. Unfortunately neither the model nor obselVations suggest much upwelling (or downwelling) in the Tully Canyon, so this case probably does not provide a sufficiently strong signal for validating the model· vertical velocities.
\ , , ,\ ,
I , 1'"
" \ \ \ '\
, ''\
~"'''\ , ,
-., ...... , '\
~.
,.,<::) //
\' , , I , , , '0\' , ,
\
\ \ I I , I I ,
A ~,---_~;tj~_ ~ ..,. ','I. 'I. ...
~/.,.., "" ~ ... .-"- '\ .,,-_~ 1 ;.I" /' ,,' "0 r _- '\ " \ ..... 1._ • ~ <" .. \ '-":- \~fj\ )~ \ \. ,\, ... y' '< ,_",' 1/'
\ '\ 1 ' , ,", ... ..---~ ,._..! _-._/, to.. ~. ," .. ' _', ,, __ \':J /
" ...... -----,_/ ... . . '" .".,-.-------"" .,,-" ,-
: ' , , I \ , -
\ ,g I \ I
' , , I ,
'----, ' ", ,. ,.
/ I
\ , ~ \~ ,
\, ,
-+ 10.0 cm/s
VANCOUVER ISLAND .... .., .... ,
... ". --. ...... ~
.... ' ..... ~. ... ... -;--" .... 50_-:" : .
" '---,
..,.
.. ' ..
... ''':- ........ .. .,
,..... ") -------....._----"" r
"--'f ." lY" :f..--- ~ 4!'" ~'-I('/ ~ "'(...~~rr..~f..- ~ ~M1 I -,I I. .-J:- .L~,. ~f-.L....~. r f-
"Ci)' '\, " ...... ,' ..... ' , ' ':w " " \ , , Fuca
Strait : ~ : \
.. ! ~ ~ ~R0~~ L~: i t ~ J~ ~t7'1 (l{p::! ~ I I' , \ 4o.L. t!~'11 ,. " ~ .. .' "J 1 I I \ ~ ~ .. ~ .... A, ( ... ~ 1I,_~_
, '\ \ I:t.. >150 __ " ...,., ',- ---...... ----" -" ',~-- ---~ , ,'" ,~ -- T' __ , ~ ', __ --"Y"" " I .,10 \
~ .. ~
~ -4
-4 I , ,
I ~ \ I ~ 0 ,
: \.... '-':"', -4 \s: ',,'10 '. 0
0" ,... 1 " ------~-
-+ -,-4 , ... I ~ , ... , ,
I , ~.
~ )~'~------,,~ \ I 1. ___ " '\ ). \.. '11--- ...,,~ I" ( '-- ... : \ ..,.
~ \J 1."'''',,/ "\ /'>1 I.... :
~ ", \
" -----"\, '----- I ,
I
./ J /
, I . l I , 1. I ,.. 1
: ".....' '"'' . \ '... , l.', '\ \"
..... ~ I ", \ : , I . , ,
I , , I
I I ./ I
I
Figure 7. Horizontal currents at 40m depth as calculated from CTO observations collected between May 12 and 15, 1985. Circled vectors are low-pass filtered observed velocities that have been averaged over the same four days. Each futl shaft in multkshafted vectors represents a current of 10 cm/s. Bathymetric contours are in metres.
) Washington
USA
I N N
I
23a
Model currents have yet to be computed from the other two CTD surveys, but the sigma-t surfaces from the June cruise suggest a well-formed eddy over the Tully Canyon. It is expected that the vertical velocities estimated from the current meter observations over the duration of this cruise will be sufficiently strong to provide a viable comparison for their model counterparts. A full presentation of this comparison is planned for a future journal publication.
M.G.G. Foreman, J.C. Muccino
References Freeland, H.J., and P.C. McIntosh (1989). The vorticity balance on the southern British
Columbia continental shelf. Atmosphere-Ocean, 27(4), 643-657. Lynch, D.R., Werner., F.E., Greenberg, D.A., and Loder, J.W. 1992. Diagnostic model for
baroclinic, wind-driven and tidal circulation in shallow seas. Continental. Shelf Research 12: 37-64.
\ J \ " \
\ \ \
\ \
" \ \ , \ \ \ \
/.7-r<)) " <_><--..... \d< ".. I'
(. . ( ." '- \ __ ....:,. I
,': C' -rh.. • ..... \'f!oO /' ,> .. , .... .\J /" , /'
__ ~ r--' /- J ' " ,-_\C:I~ "-/" "-'-~~'j -- '
.' ~ D_ -~_",I_"// ' ..... s. /
La Perouse Bank
....... --... ..........
r o" \ ' \ ;.... -~ '-;; ..... ,,' ~ ,_ -,. { Swlftsure-~ ......, - "-
( / /'<1' '-- D-, •.... \ B ",--..... , ...... . .... , .. ank:"~' .~:::,
--" < • ••••• ..". -
/
- .- ........ " .. , ..... {.( ~- .
r
. . ~ . 'r'" ." . A§. - --~ '. . " ..... _ :J..' '. . . or 7' . ./ . - • .... _ '-0' ,,' /J .. ' ~o , .I"~" ....,y • 0 .' .
~ .. / ., ... ,
1 " - ..-~ ... / D ,......... ,':. . . . ;--' , .,... ) / '" _ >} ',,: <p q',,::,,;;' .::.,/ ':. '~~~;Pl;\': ' '- ~ /., ·F !d' ' ... ···Y·,· . ." Tull" ~... ~ (:/.<: ~~.:.:,:-. '.::. -;;, 11/ -=-:!.:.~
.. ' ' .' ... , ..... ,./- _'#-
'- ... ;:::' ... ~.~ Canyon . \ .!!- .:'1. "."'Q~(: ~~/ \ ..... • ......... _ { • J '.' ,:: .'." I ,.--' ,,' . • . " _. "J '-~" .' ••.•.. \ ( r • .' y .",.' ", 'i
l
} . •• ',' ~~O~\ N' \ ' l .J y,:. ~~ ':, I
.' ~ __ .. 0 Itnat ,.' ~ .-.. ' .. ' ....... . :'. \ _" I ' "'., •. - ;~ ~ ::. :" ... ~ .. '.:>: . .': _ Canyon \ ( - " .. :.' <:) " I Juan : ...... <"..::\ p"" ;;i::-. . d ...... ..... ..r 0 () I:' .. ' c:.) .'~' :. e , .' / \ .... . . r ,,' I c:: ..... . ('" ..... \. :. (::. . . ruea r I - ,.: '. --. ./. .' . ./ I C
l
... ;.-D.! I .I ... ,' ......... ... ~.'" '.J. I anyon . ...... .... / .... ",. . ....... ' " .
...... ~~,. .: '- I .. ' ~.':: ... :... 1::
1> )
...... ',-: ; \ ..... . '" ,.\ I ...... .... ~ .. , . - ." . -I····· ,," : ... /' .,'" •. ' ) • :; / \ . . (J; ., /- r--.:. rl
I
,: \ :: "w' "l1:T /." ',. I .• "-" '. :'."- .... -<"::} ".
I : 1/";;' .. J:::·L....,-" '. :'1' . \ . /" -.. ' '..' '" .. \ , .. j:::' r - \ .. ......... \
Figure 8. Vertical velocities (mm/s) (positive upward) at 100m depth for the same model calculation as in Figure 1.
to..) 1M

24
3.2.1. Seasonal cycle of plankton biomass and species composition in the La Perouse study area.
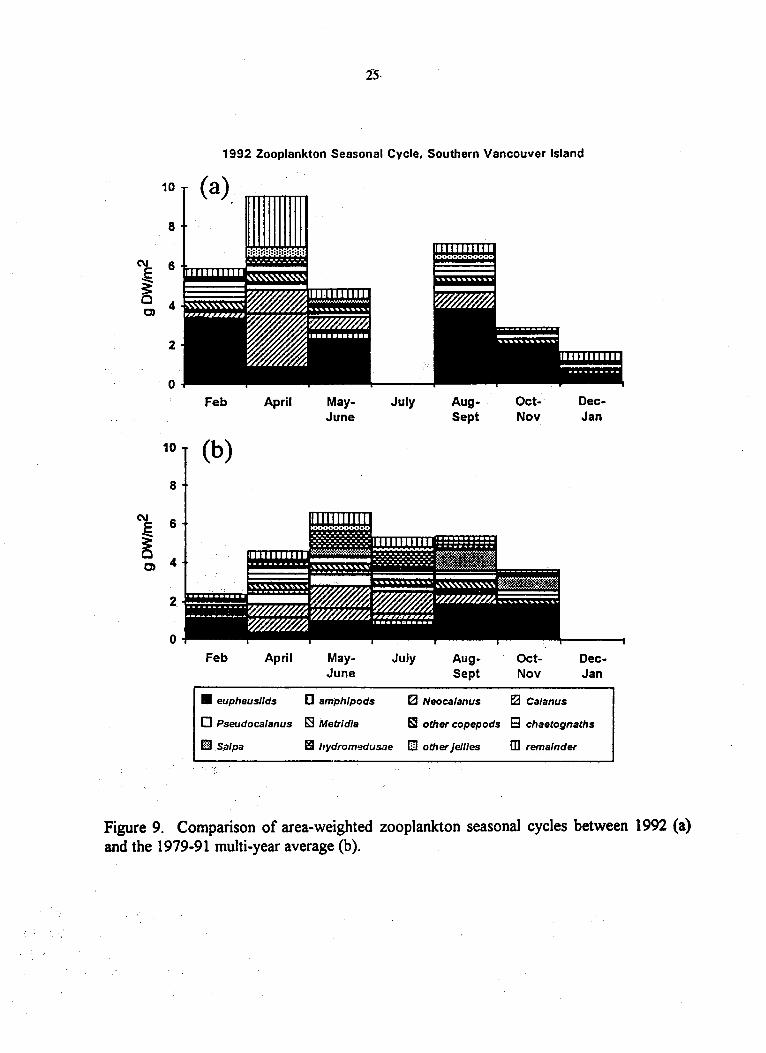
A detailed description of the "normal" seasonal cycle of water properties and plankton concentration using spatial and bimonthly time-period averages of samples collected from 1979-89 has been published (Mackas 1992), and subsequently updated to include 1990 and 1991 data (Mackas, in press; Fig. 9b shows an area-weighted spatial average over all statistical regions). Knowledge of the average seasonal cycle is an essential first step toward examination of year-to-year anomalies in plankton productivity. All regions have a spring-summer maximum in zooplankton biomass but there are between-region differences in timing and in the relative ranking of zooplankton species. In general, peak biomass is lowest and earliest on the inner shelf banks, higher and more persistent in offshore and deep water shelf locations. Zooplankton biomass tends to decline in mid to late summer. In contrast to the zooplankton, nutrient and phytoplankton levels remain high or increase throughout the summer. This suggests sustained high input rates of nutrient-rich (upwelled) water and substantial advective export of phytoplankton and zooplankton biomass.
Interannual Variability
We can also now make meaningful comparisons of the zooplankton seasonal cycle observed in a single year against the multi-year average. Fig. 9a compares the averages from 1992 sampling (February, April, June, August, October, and December}vs. the multi-year average shown in Fig. 9b. 1992 was a moderate El Nino year. The most notable feature is the low total biomass in June at the time of the normal annual peak. The relatively high euphausiid biomass in February and August 1992 may reflect upward bias due to reduced spatial coveflage during these cruises. However, even with these two high values, both cruise and annual averages of euphausiid biomass are slightly lower than they had been during the previous 2-3 years.
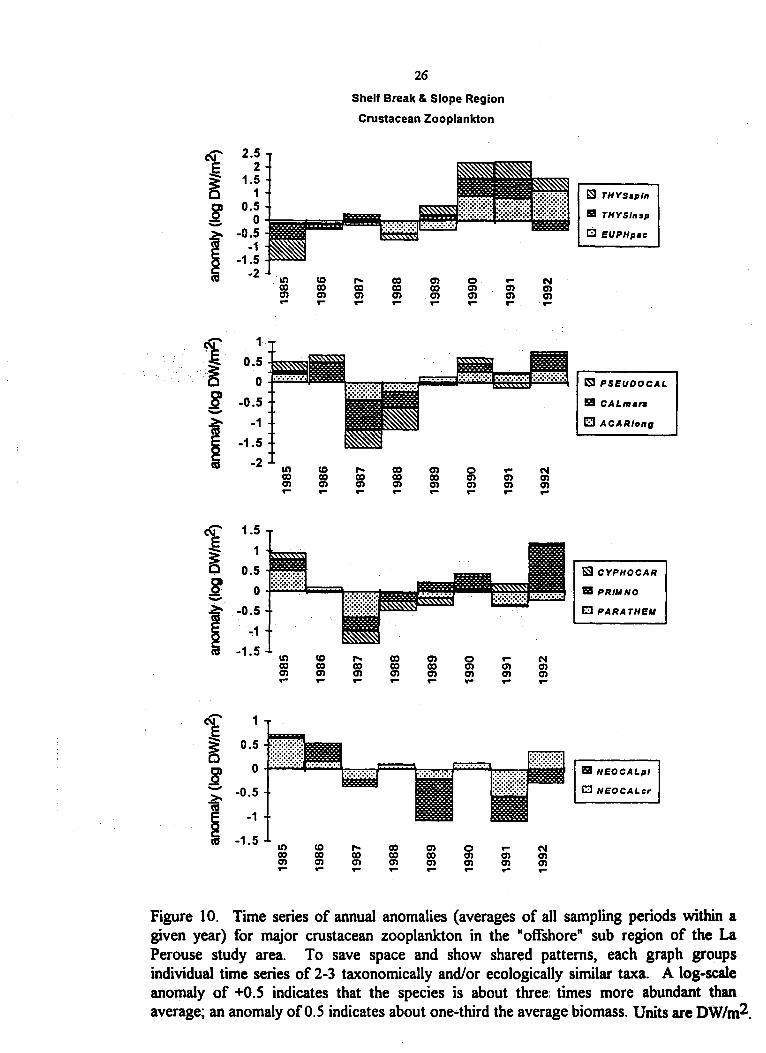
Annual anomaly time series (within-year averages of deviations from the multi-year average seasonal cycle) have been calculated for all three statistical areas and for the time span 1985-1992 (Mackas, in press). Statistically significant deviations from the long-term average occur in all of.the major taxa and in all three statistical regions. Fig. 10 shows as an example the anomaly time series for four of the important crustacean zooplankton groups in the outer shelf region. Average persistence of the anomalies ranges from less than a year for gelatinous zooplankton, to 1 to 2 yr for the common copepods, to 3 yr or more for chaetognaths and euphausiids. Significant zooplankton anomalies occur throughout the time-series; they are not confined to transient episodes such as the 1987 and 1992 El Nino events. However, coincidence of timing and duration suggests an association of local zooplankton and environmental anomalies with the 1988 change in lwinter-season atmospheric pressure patterns in the North Pacific Ocean.
D.L. Mackas
2"5·
'992 Zooplankton Seasonal Cycle, Southern Vancouver Island
10 (a)
8
C\I 6 .E ~ C) 4
2
0 Feb April May- July Aug- Oct- Dec-
June Sept Nov Jan
10 (b) 8
C\I 6 .E ~
4 C)
2
0
Feb April May- July Aug- Oct- Dec-June Sept Nov Jan
• euphausJ/ds D amphlpods 121 Neocalanus fa Calanus
o Pseudocalanus !;3 Metrldia SI other copepods B chaetognaths
BSalpa l!!:I Ilydrom~duS<Je (] other Jellies m remainder
Figure 9. Comparison of area-weighted zooplankton seasonal cycles between 1992 (a) and the 1979-91 multi-year average (b).
1 ... ~ o g
t
t
2.5 2
1.5 1
0.5 o
-0.5 -1 ~~ ...... ~~
-1.5 .,.,.,.~~ -2
1
0·:.1 -0.5
-1
-1.5
-2
1.5
an IX) en r"
1--....;.
0.5~~
U) IX) en r"
26
Shelf Break & Slope Region
Crustacean Zooplankton
,.. IX) en r"
,.. IX) en r"
IX) IX) en r"
IX) IX) en r"
en IX) en r"
en IX) en r"
o en en r"
o en en r"
r" en en r"
r" en en r"
-O.~ r~~:O:;:;:;iJml~~m~ ..,1
-1.5
1
0.5
an IX) en r"
U) IX) en r"
,.. IX) en r"
IX) IX) en ....
en IX) en r"
o en en r"
r" en en r"
N en en r"
N en en r"
N en en r"
O~~1==r=,~~t:ITmm. -0.5
-1
-1.5 an IX) 0'1 ....
U) IX) 0'1 ....
,.. IX) 0'1 ....
IX) IX) en ....
en IX) en ...
o 0'1 en ...
.... en 0'1 ....
N en en ....
~ THYSspln
IS!! THYSinsp
I::l EUPHpac
~ PSEUDOCAL
IS! CALmar.
f:::J ACARlong
~ CYPHOCAR
IS! P'RIM NO
C PARATHEIrI
IS! NEO CALpl
E::l NEOCALcr
Figure 10. Time series of annual anomalies (averages of all sampling periods within a given year) for major crustacean zooplankton in the "offshore" sub region of the La Perouse study area. To save space and show shared patterns, each graph groups individual time series of 2-3 taxonomically and/or ecologically similar taxa. A log-scale anomaly of +0.5 indicates that the species is about three: times more abundant than average; an anomaly ofO.S indicates about one-third the average biomass. Units are DW/m2.
27
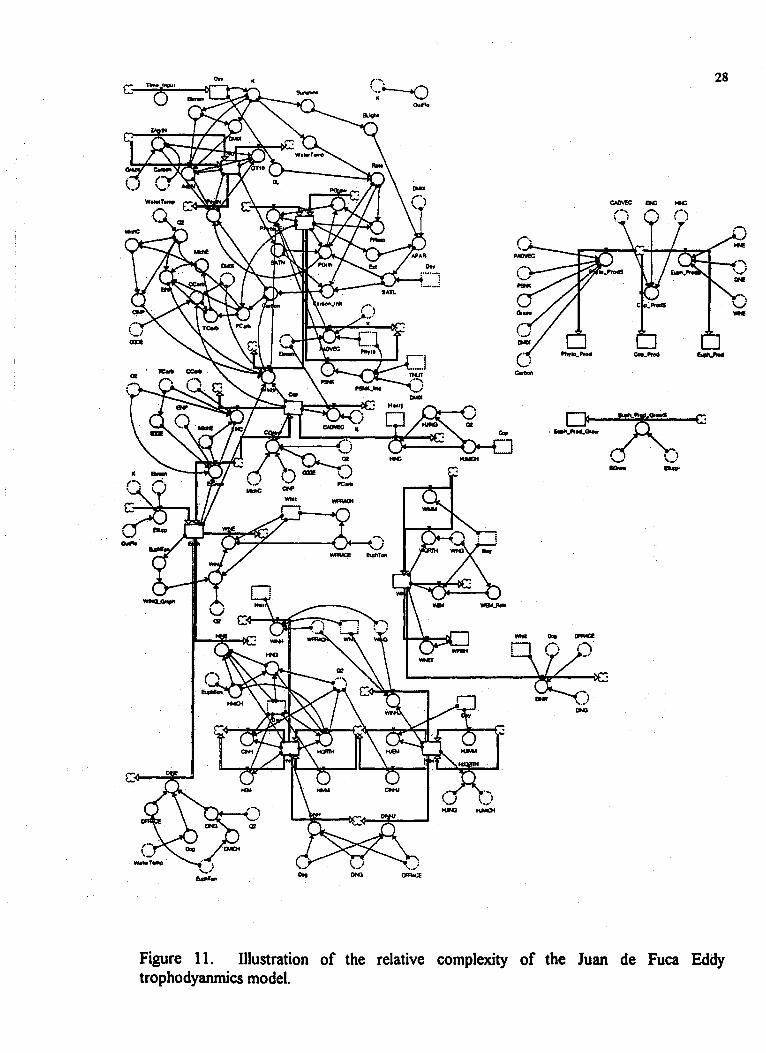
3.2.2 Modelling plankton and fish trophodynamics in the Juan de Fuca Eddy
A trophodynamics model (Robinson and Ware, in press - see section 5.) is used'to estimate the average annual plankton and fish production in,the Eddy regi()non the southern British Columbia continental shelf during 1985-89. The model describes the feeding
, interactions among diat()ms, copepods, euphausiids, Pacific herring, Pacific hake, Spiny dogfish, and Chinook salmon. The trophodynamics model is forced by observed seasonal
, patterns in Ekrnan transport (upwelling), sea surface temperature, and solar radiation. The model'is relatively complex and requires data for about 50 parameters to simulate the feeding, growth and mortality processes of the seven state variables (Fig 11). It uses a numerical integration routine with a 1 day time step.
The first-order simulated average (and standard error) estimate of annual production for diatoms in the late 1980s is 330 (10.6) gC/m2/y, for copepods: 24.3 (2.8) gC/m2/y, for euphausiids: 11.9 (0.6) gC/m2/y, for adult herring: 1.4 (0.04) g C/m2/y, and for Pacific hake: 0.24 (0.015) gC/m2/y. Production estimates for Chinook salmon and Spiny dogfish are not determined at present.
Production dynamics of herring and hake were found to be tightly coupled to the euphausiids. Furthermore, the model indicates that late spring (AprillMay) had the greatest influence on euphausiid production. During this period, euphausiid production was influenced by perturbations in parameters affecting the increase in euphausiid biomass (e.g., gross growth efficiency), and by the arrival time and biomass of migratory Pacific hake.
A relatively rapid increase in spring euphausiid biomass was required'to track the observed early summer euphausiid biomass pattern, the empirical hake ingestion rate ,pattern, and the fraction of euphausiids in the hake diet. The large increase in euphausiid spring biomass occurs in the model because euphausiids have high growth efficiencies, and a signiticant biomass ofeuphausiids is believed to be imported into the Eddy region from surrounding oceanic regions by upwelling currents. The model results clearly identify the importance of understanding the growth dynamics of the most dominant euphausiid (T. spinijera) in the system, and the., hypothesized, euphausiid biomass import mechanism.
Variable hake biomass and arrival time'are also important processes affecting simulated euphausiid production. For example, the model predicts that if Pacific hake arrive in early May, euphausiid biomass will only increase after hake emigrate to the outer shelfin July/August. Alternatively, a late arrival of hake (late June) allows a 'build-up' of euphausiid biomass during May/June. The simulated effects o£variable hake biomass and arrival time combined indicates that euphausiid annual production should be greatest when few hake arrive late (in June). In contrast, copepod production should increase when many hake arrive early (in May), while adult herring annual production should be greatest when few hake arrive early (in May). Interestingly, there was little effect of variability in migratory properties of the hake stock on diatom production.
28
21-'_-l\"-=~::;;;;. ~--=-I..-,-)--tC:: moo. _.
Figure 11. Illustration of the relative complexity of the Juan de Fuca Eddy trophodyanmics model.
29
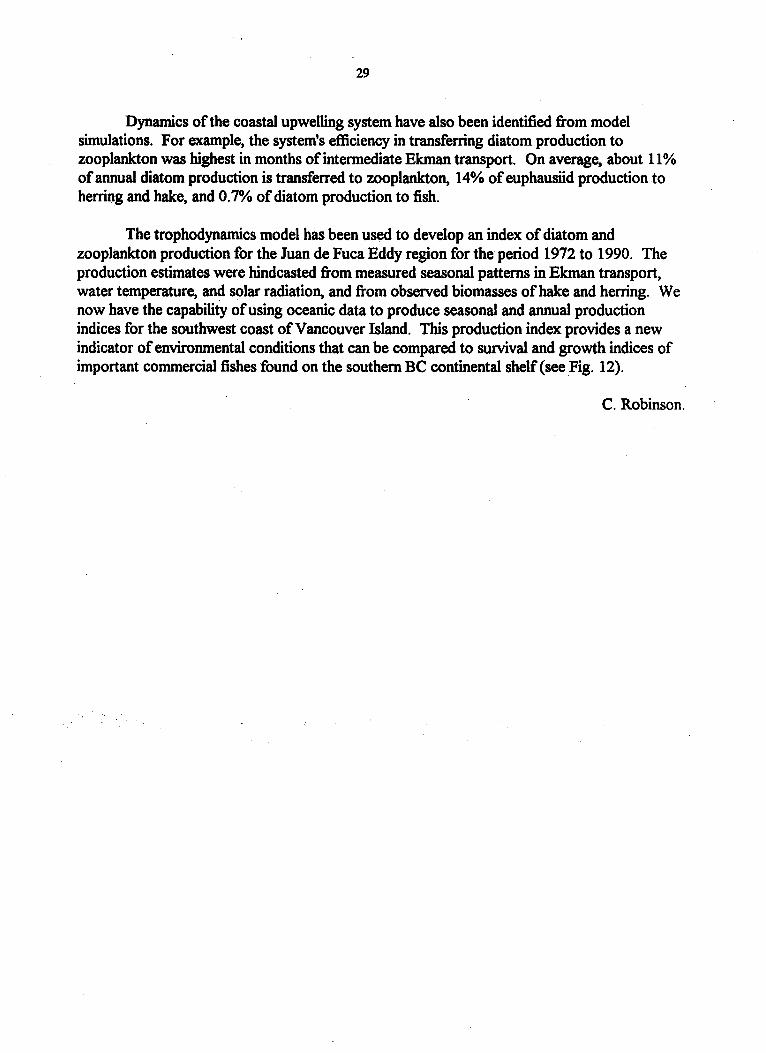
Dynamics of the coastal upwelling system have also been identified from model simulations. For example, the system's efficiency in transferring diatom production to zooplankton was highest in months of intermediate Ekman transport. On average, about 11 % of annual diatom production is transferred to zooplankton, 14% of euphausiid production to herring and hake, and 0.7% of diatom production to fish.
The trophodynamics model has been used to develop an index of diatom and zooplankton production for the Juan de Fuca Eddy region for the period 1972 to 1990. The production estimates were hindcasted from measured seasonal patterns in Ekman transport, water temperature, and solar radiation, and from observed biomasses of hake and herring. We now have the capability of using oceanic data to produce seasonal and annual production indices for the southwest coast of Vancouver Island. This production index provides a new indicator of environmental conditions that can be compared to survival and growth indices of important commercial fishes found on the southern BC continental shelf (see Fig. 12).
C. Robinson.
30,
1.4~--------------~----------------------~ l-e --u as - -1.3 l---c-_______ ----______________ c __ ---:i C e ';: -:c
o o
51.2 l---c----'--~---------___,_--------~"""'_1 u C) c 'E 1.1~---------~___,_~~--------D----------~ G) .c "C G)
c o o o
c
~ 1.01~~-----c----------------=D----~ G) en .a o
c
O.9~-------~~------~--------~~--~ 2.7 4.7 6.7 8.7
Fall zooplankton production (gC/m2)
Figure 12. Relationship between the condition of age 5 herring and simulated fall zooplankton production, during 1972 to 1990 (r = 0.58; P < 0.05).
31
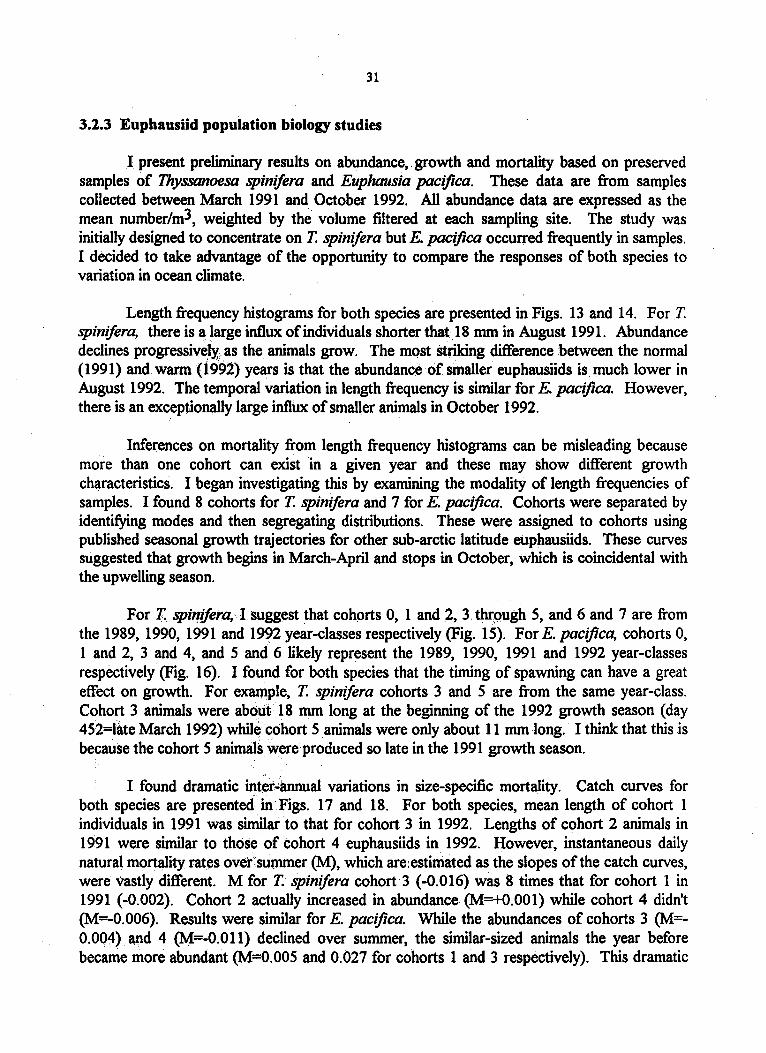
3.2.3 Eupbausiid population biology studies
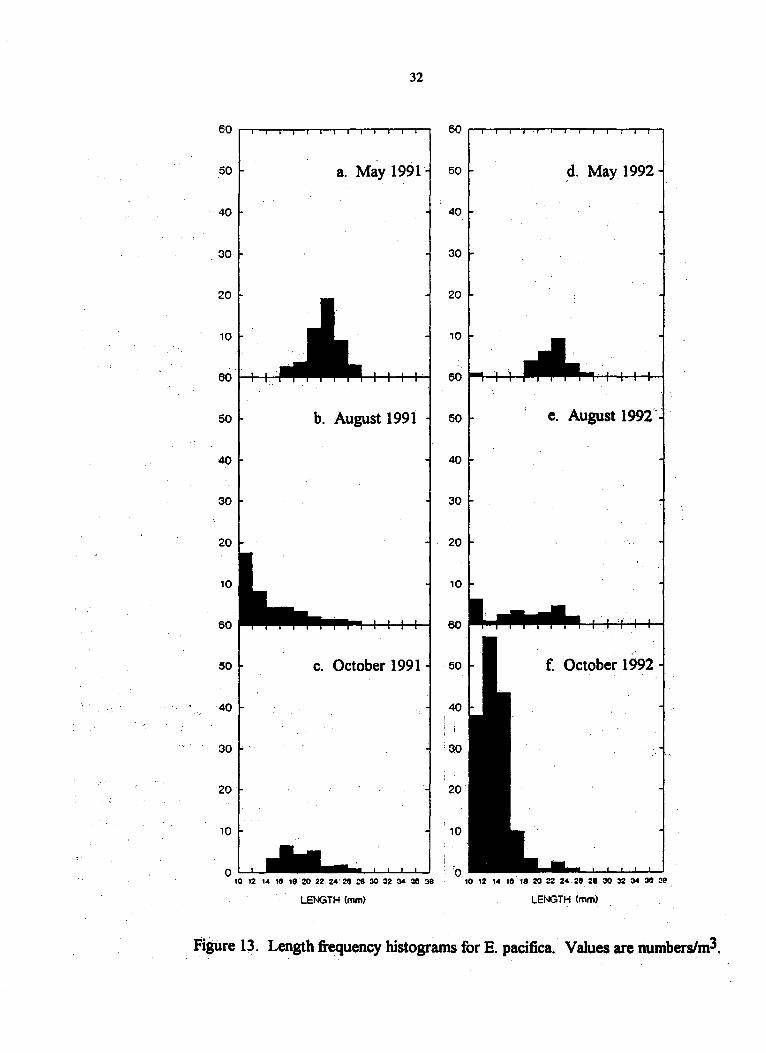
I present preliminary results on abundance" growth and mortality based on preserved samples of Thyssanoesa spinifera and Euphausia pacifica. These data are from samples collected between March 1991 and October 1992. All abundance data are expressed as the mean number/m3, weighted by the' volume filtered at each sampling site. The study was initially designed to concentrate on T. spinifera but E. pacifica occurred frequently in samples. I decided to take advantage of the opportunity to compare the responses of both species to variation in ocean climate.
Length frequency histograms for both species are presented in Figs. 13 and 14. For T. spinifera, there is a large influx of individuals shorter that 18 mm in August 1991. Abundance declines progressively>as the, animals grow. The mQst striking difference between the normal (1991) and warm (i992) years is that the abundance of smaller euphausiids is much lower in August 1992. The temporal variation in length frequency is similar for E. pacifica. However, there is an excep~ionally large influx of smaller animals in October 1992.
Inferences on mortality from length frequency histograms can be misleading because more than one cohort can exist in a given year and these may show different growth characteristics. I began investigating this by examining the modality of length frequencies of samples. I found 8 cohorts for T.spinifera and 7 for E. pacifica. Cohorts were separated by identifying modes and then segregating distributions. These were assigned to cohorts using published seasonal growth trajectories for other sub-arctic latitude euphausiids. These curves suggested that growth begins in March-April and stops in October, which is coincidental with the upwelling season.
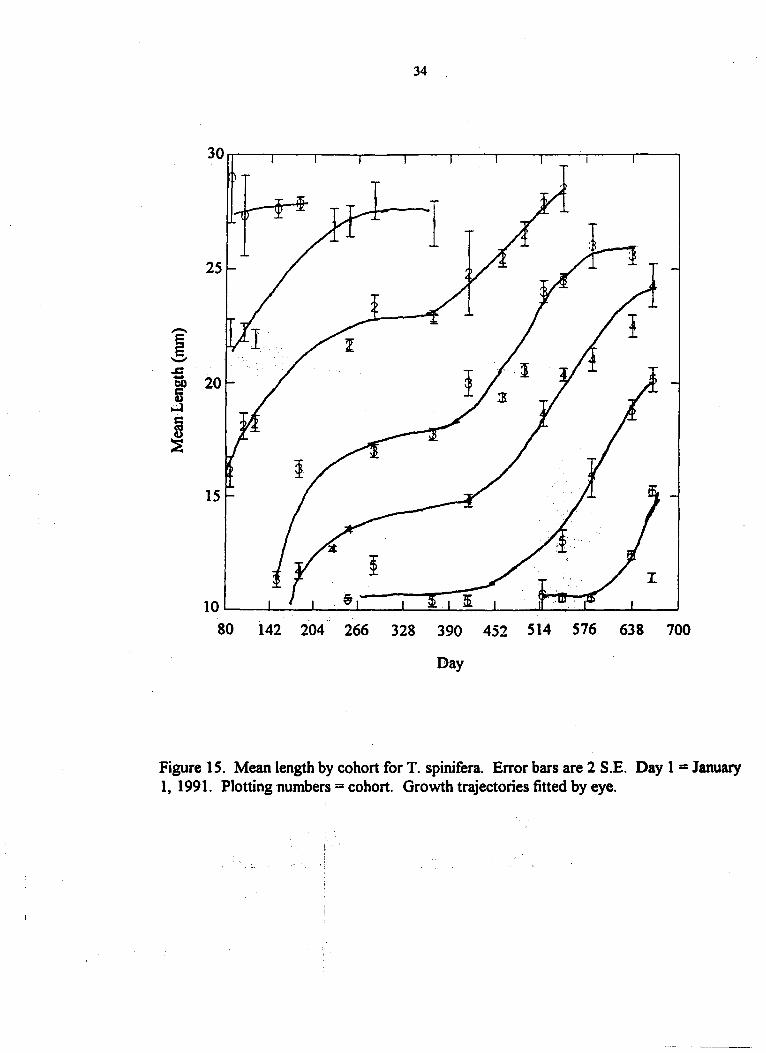
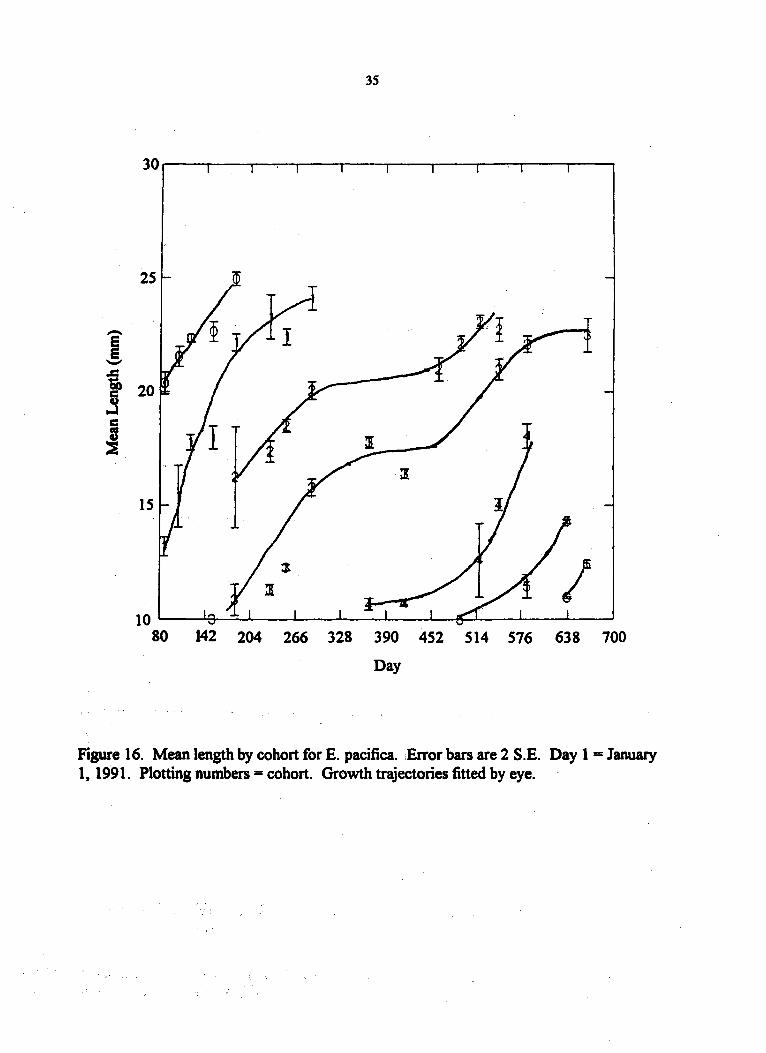
For T. spi~ifera, I suggest that cohorts 0, 1 and 2, 3, thrQugh 5, and 6 and 7 are from the 1989, 1990, 1991 and 1992 year-classes respectively (Fig. 15). For E. pacifica, cohorts 0, 1 and 2, 3 and 4, and 5 and 6 likely represent the 1989, 1990, 1991 and 1992 year-classes respectively (Fig. 16). I found for both species that the timing of spawning can have a great effect on growth. For example, T. spinifera cohorts 3 and 5 are from the same year-class. Cohort 3 animals were about 18 mm long at the beginning of the 1992 growth season (day 452=late March 1992) while cohort 5 animals were only about 11 mm long. I think that this is because the cohort 5 animals, were produced so late in the 1991 growth season.
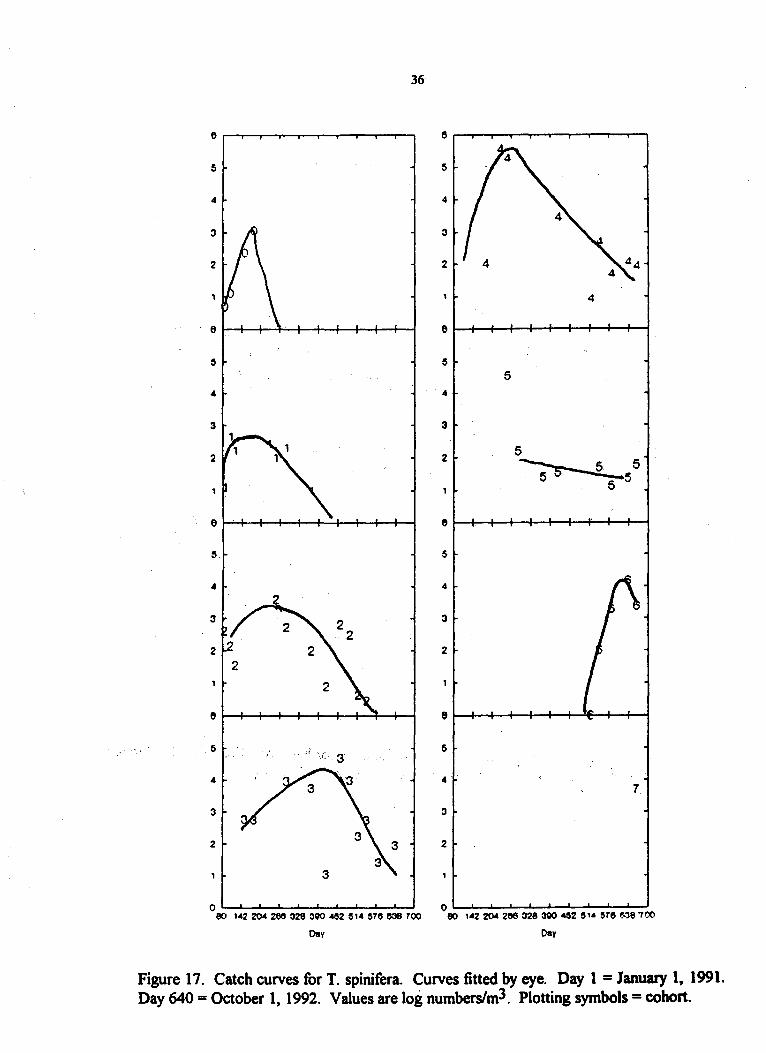
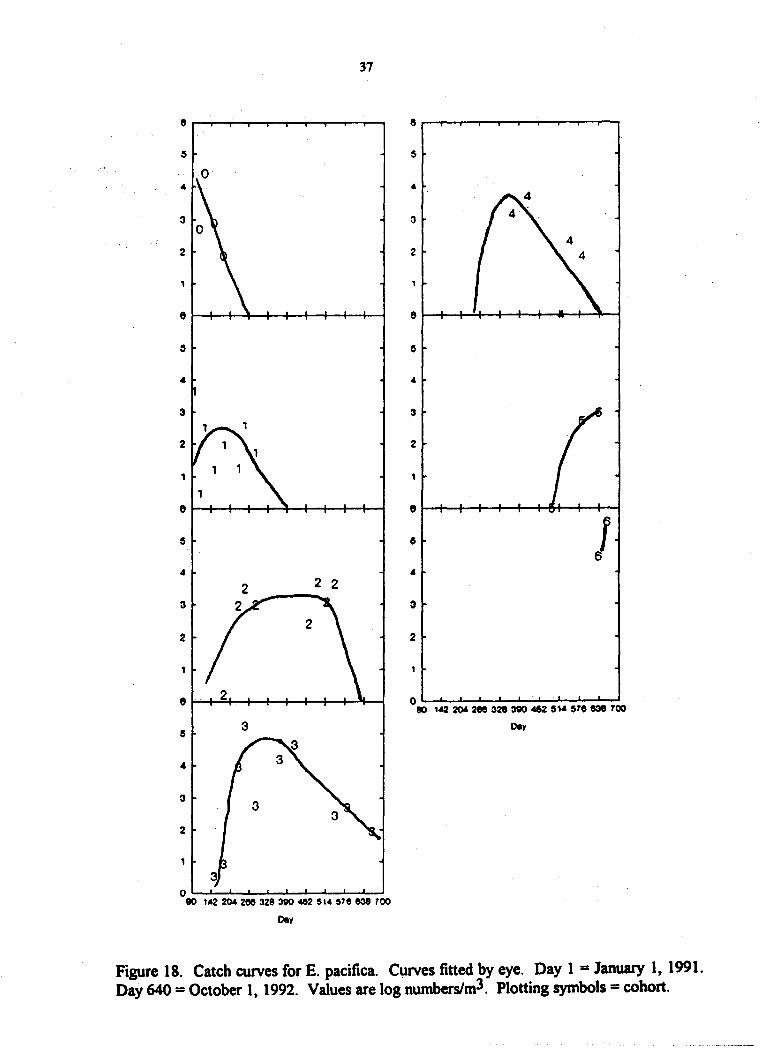
I found dramatic intet~annual variations in size-specific mortality. Catch curves for both species are presented in Figs. 17 and 18. For both species, mean length of cohort 1 individuals in 1991 was similar to that for cohort 3 in 1992. Lengths of cohort 2 animals in 1991 were similar to those of cohort 4 euphausiids in 1992. However, instantaneous daily natural mortality rat~s over:summer (M), which are:estimated as the slopes of the catch curves, were vastly different. M for T. spinifera cohort 3 (-0.016) was 8 times that for cohort 1 in 1991 (-0.002). Cohort 2 actually increased in abundance (M=+0.001) while cohort 4 didn't (M=-0.006). Results were similar for E. pacifica. While the abundances of cohorts 3 (M=-0.004) and 4 (M=-O.Oll) declined over summer, the similar-sized animals the year before became more abundant (M=0.005 and 0.027 for cohorts 1 and 3 respectively). This dramatic
32
60 60
50 a. May 1991 50 d. May 1992
40 40
30 30
20 20
10 10
60 60
50 b. August 1991 50 e. August 1992"
40 40
30 30
20 20
10 10
60 60
50 c. October 1991 50 f. October 1992
40 40
30 30
20 20
, 10 10
LENGTH (mm) LENGTH (mm)
Fi$Ure 13. Length frequency histograms for E. pacifica. Values are numberslm3.

33
60 60
50 a. May 1991 50 d. May 1992
40 40
:30 :30
20 20
10 10
60 60
50 b. August 1991 50 e. August 1992
40 40
30 30
20 20
10 10
60 60
50 c. October 1991 50 f. October 1992
40 40
:30 :30
.... ", ,f~Z:.~
20 20
10 10
0 0 '0 .2 I. Ie II 20 22 2. 2e 2e :JO :12 ~ :18 38 '0 .2 •• .e .e 20 22 :. :e %8 :JO 0: ~ :Ie :18
LENGTH (mm) LENGTH (mm)
Figure 14. Length frequency histograms for T. spinifera. Values are numberslm3.
J -.c
34
30~--~--~--~--~--~----~--~--~--~--~
25
t 20 ,.J
~ 15
IO~--~--~--~--~--=-~~~--~~~--~~~
80 142 204 266 328 390 452 514 576 638 700
Day
Figure 15. Mean length by cohort for T. spinifera. Error bars are 2 S.E. Day 1 = January 1, 1991. Plotting numbers = cohort. Growth trajectories fitted by eye.
35
10~--~~~--~--~--~--~~~~--~--~--~
80 142 204 266 328 390 452 514 576 638 700
Day
Figure 16. Mean length by cohort for E. pacifica. :Error bars are 2 S.E. Day 1 = January 1, 1991. Plotting numbers = cohort. Growth trajectories fitted by eye.
36
6 6
5 5
4 4
3 3
2 2
4
e e
5 5 5
4 4
3 3
2 2 5 ~5
5 5 5
e e
5. 5
4 4
3 3
2 2
5 '(
4 4 7
3 3
2 2
o O~~~~~~--L-~~~~
eo I.2:zoe 261' 328 3110 ~2 SI. STe!J38 TOO eo I.2:zoe 2ee 328 3Q() 452 S'. 5T8 ~)8700
~y ~y
Figure 17. Catch curves for T. spinifera. Curves fitted by eye. Day 1 = January I, 1991. Day 640 = October 1, 1992. Values are log numberslm3. Plotting symbols = cohort.
37
4
3
2
el-+-+-+-+--+-+--+-+-J~
.. 3
2
el-+-+-+-'-'+-+-+-+--f-~
5
..
3
..
2
O':-.&.-...L..~-'--'--L.---L--I.-JL--J 80 llt2 204 2ee 328 300 482 514 57e eoe TOO
Dey
4
4
J .. 3
2
O~L-~~-L-L--I.~~L-~~ 80 '42 204 2ee328 300 462 514 5Te e38 700
0.,
Figure 18. Catch curves for E. pacifica. Curves fitted by eye. Day 1 = January 1, 1991. Day 640 = October 1, 1992. Values are log numberslm3. Plotting symbols = cohort.

38
change in mortality coincided with the appearance of mackerel in Barkley Sound. lit addition, the smoothness of the catch curves suggest no immigration or emigration of animals.
The results I presented show that there can be a severe impact of fish predation on euphausiid stocks. Detection of effects on other aspects of euphausiid population biology awaits sample and data analyses. .
. R. Tanasichuk
39
3.2.4 Processes controlling vertical exchanges of carbon along the Pacific continental margin
Further progress was made in analyzing the samples from the 1990 pilot moorings off Brooks Peninsula. To summarize results reported last year, sediment trap mooring yielded roughly the same total sinking flux over 6 months at two sites off the west coast of Vancouver Island, one under a recurring upwelling jet (~etl site - Fig 4) and one in a control area north of the upwelling jet ('no-jetl site - Fig. 4). A one-week long spring bloom was observed at the ~etl
. site, but results from the Ino-jetl site were inconclusive because of a malfunction in the sequencing motor. The sinking fluxes of total material in one-week samples over the 6-month study were highly correlated with the silica amount in each sample, indicative of dominance by diatoms with significant skeletal structures. Amounts of organic C and N in the samples were
. inversely correlated with the sinking fluxes. Our interpretation of this result is that during high flux penods, much of the sample consists of the remains of diatom shells after grazing, which are slow to dissolve and be oxidized relative to the organic C and N in the sinking debris.
The isotope analyses of the trap samples have now been completed and show the following features.. The a 13C isotope analyses of the trap contents yield values between -17 and -25 ppt. They span the range of values typical for coastal diatoms to values found in the trap samples at Ocean Station Papa: The time series of al3c and a15N isotopes for the southerly (~et') site are shown in Fig. 19, both plotted together with the sinking flux of carbon. Before and espeCially during the spring bloom peak Gust before Julian Day 150 = 30 May), a15N was low and increased abruptly after the flux maximum (bloom). The low values during the bloom may reflect preferential uptake of the lighter isotope during periods of lower growth rates·when nutrients were probably limiting. The a13c trends are more complex: heavier values are found during the bloom, after which they, decrease, but there are two other periods of heavier values during the low flux period following the bloom .. The heavier values (more l3C) during the bloom may reflect less fractionatioR of the isotopes during rapid
. phytoplankton growth, whereas the heavy values centred at day 220 and day 270 may be related to dissolved C02 limitation during periods of nutrient depletion.
. . . Two questions have been raised: (l)regarding the possible input of terrigenous materials
and the contribution of this fraction to the overall flux, and (2) regarding the fate of sinking biogenic materials.
First, Scanning Electron Microscope photographs of the samples show abundant diatoms, with some background unidentifiable debris. However, there is no indication, either from the SEM photographs or the isotope data, that the trap samples contain significant amounts of terrigenous materials. Furthermore, Macdonald and Pedersen (1991) pointed out that the residence time for the Fraser River runoffbefore it reaches the Vancouver Island shelf is about 0.8 years, ensuring that most of the terrigenous materials would already have been removed. Also, even runofffrom local streams probably delivers little terrigenous material onto the shelf, rather it sinks out in the fjords. They cite as evidence C:N weight ratios of around 6 off Alberni IDlet, characteristic of marine detritus rather than of terrigenous materials which have C:N ratios normally above 16,ranging as high as 30. The organic C:N weight

14
13
12 '0' ~ 11 ---Z 10
\I")
~ 9
'0'
8
7
6
-16
-18
~ -20 ---U C""l ..... -22 c,o
-24·
-26
o
~815N
••• -eo ••• CFlux
(a)
50 100
40
T : .. " " " " .. " .. .. " " " " , , , , , , , , , , , , , , , , , , ,. , , , ! ' ~, , : , ,
4 ~.~ w ~ \ - j\ Q
~ . ~ :~ • _Q"'~" Q ~ ~.: b o
150 200 250 300 350 JulianDays
T = "
~813C H org !!
" ••• -eo ••• CFI ux ii , , , , , , , ,
. : .
(b)
o 50 100 150 200 250 300 350 JulianDays
80
70 ..
60
50
40
30
20
10
o
80
70
60
40
.30
20
10
a
Figure 19. Time series of isotope ratios (a) SISN and (b) Sl3C, and carbon sinking flux for the 1990 "Jet" sediment trap mooring south of Brooks Peninsula on Vancouver Island, 49°38.9'N; 127°37.8'W. Heavier isotope ratios are upwards on the graphs. Courtesy of Dr. Steve Calvert, University of Brit ish Columbia.
41
ratios from our trap samples range from 6 to 9, comparable with those from Ocean Station Papa (6 to 8) and again indicative of materials of marine rather than terrigenous origin. Unfortunately, geochemical studies of the benthic environment off Vancouver Island have been few, and much information has been inferred from studies off Washington and Oregon.
Second,· we searched the Pacific Geoscience Centre's core and grab collections for bottom samples in the vicinity of our traps. There were no cores and only two grabs off the continental shelf, which were reported as containing mixed sand and gravel. The shelf of Vancouver Island in known to be covered with relict and reworked, coarse-grained sediments, with very little modern, equilibrium sedimentary material (Bornhold and Barrie, 1991). To address our lack of knowledge of the geochemistry of the shelf and slope regions off Vancouver Island; R W.Macdonald ofIOS, and Steve Calvert and Tom Pedersen of University of British Columbia are planning a study of the sediments in these areas. Initially they plan to obtain several large box cores in the area, possibly in 1994 depending on shiptime availability, and perform an extensive set of geochemical analyses on these core samples.
Research Plans:
In Oc~ober 1993, the sediment traps will be deployed at the five sites given below, with site 'F' as-the lowest priority ifbad weather results in too much lost time. It is hoped.that the sediment traps will be. serviced in April 1993 and redeployed for the 1994 spring bloom. Because the Tully is supposed to carry out a North-South WOCE line roughly the last 4 months of 1994, it may be necessary to recover the traps in August 1994. Depending: on DFO Green Plan funding, ship availability, and equipment losses, we would like to deploy some of the traps fora second year, i.e. 1994;;.95. Subsequent to that, we would like to deploy one mooring with several sediment traps at different depths to determine the vertical gradient of the remineralization rate, whereby organic particles are oxidized back to inorganic nutrients and carbon by the action of bacteria.
J G o F S
S002.S'N 4939.0'N 4909.0'N 4900.7'N 4847.0'N
References:
12851.8' W 12738.0'W 1274S.9'W 1271S.3'W 12800.0'W
1950m SSOm
247Sm 2000m 2S00m
Bornhold, B.D., and J.V. Barrie, 1991. Surficial sediments on the western Canadian continental shelf, Continental Shelf Research, 11,685-699.
Macdonald, RW., and T.F. Pedersen, 1991. Geochemistry of sediments of the western Canadian continental shelf, Continental Shelf Research, 11, 717-735.
K. Denman (project Leader), R Forbes, R Thomson, S.E. Calvert

42
3.3 FISHERIES OCEANOGRAPHY PROGRAM
3.3.1 Summer Pelagic Fish Distributions and Trophic Interactions
An exploratory analysis of the existing oceanographic and fisheries data for the 1960-81 period (Ware and McFarlane 1986 - see section 5.) at the onset of the project indicated that
.. year-class strength of the lower west coast of Vancouver Island (LWCVI) herring stock was negatively correlated with: 1) the summer biomass of hake in the Canadian zone, and 2) the annual surface water temperature.· These findings were corroborated by a more. extensive analysis of herring recruitment and growth using the complete historical.data base which extends back to the 1930s (Ware 1991). More recent work has also uncovered a negative correlation between winter wind stress and year-class strength: very windy winters produce
. poor year-classes (Ware and Tanasichuk 1993. PSARC Working Paper)
Guided· by these relationships, a program was designed to determine if mortality of prerecruit and adult herring was related to: 1) the spatial and temporal overlap in the herring, and offshore predator distributions on the continental shelf, and 2) the: abundance of alternative prey during the upwelling season (May to October). Since the inception of the program in 1985, the LWCVI herring stock has averaged 32 thousand tonnes in mid-summer, which is below the long-term average. There are eight key predator species in the La Perouse Bank area. In order of importance according to the size of stock and amount of herring they consume, they are: Pacific hake, chinook salmon, coho salmon, .ling~od, Pacific cod, dogfish,
? sablefish and halibut. Pacific hake account for 113 of all predator-related herring deaths, which makes them the single most important predator species. . This independent diet analysis corroborates the statistical evidence above, and provides a causalpredatot-prey interaction to account for the significant negative correlation between herring recruitment and hake biomass.
The two most abundant prey items of commercial-sized fish at La Perouse Bank are euphausiids and herring. Euphausiids are the dominant prey accounting for 21-63% of the mid-summer diet of offshore predators; herring make up. 12-71 % of the diet, depending upon the predator species (Ware and McFarlane 1994). ,Preliminary estimates suggest that virtually all estimated natural mortality of the L WCVI herring stock can be accounted for by predation.
The results of the program to date indicate that interannual variability in summer oceanic conditions has an impact on predator-prey interactions, and herring mortality. Two important changes occur in warm summers like 1992. First, a retrospective analysis of 13 years of midwater trawl survey data in the La Perouse Bank area (8 years of our own surveys and 5 others dating back to 1968) convincingly demonstrates that significantly more hake migrate northward into the La Perouse survey area in warm, summers (Fig. 20; Ware and McFarlane 1994). For a 10 C rise in summer temperature, 174,000 'more tonnes of hake. enter the area (p<0.001). Second, modelling studies suggest that this increased abundance of hake. quickly grazes down the euphausiid stocks on the continental shelf and in the Juan de Fuca Eddy. In response to this depletion of the local food supply, hake begin moving, earlier than usual, to comparatively better feeding grounds alongthe shelf-break (Ware and McFarlane 1994).

43
600~--------~--~--~~------~
500
•• 400
Ul .~
300 • :IE 0 m •
200
• 100 • •
011 12 13 14
TEMPERATURE ( °e)
Figure 20. Relationship between the average Iune & Iuly sea surface temperature and the summer biomass of hake in the survey area for 13 summer surveys conducted between 1968 and 1991.
44
1992 Multispecies Survey
The 1992 mid-water trawl survey of the herring, hake and . dogfish stocks off the lower west coast of Vancouver Island was conducted by the RIV W.E. Ricker between July 29-August 7. The survey covered 6000 km2 of the continental shelffrom the U.S.-Canada border, to 490 N, and seaward to the 200 m isobath. Thirty-two mid-water tows were made to determine species composition, diet, and length and age composition of the dominant pelagic fish species in the area (Fig. 21). This multi species trawl survey has been conducted annually for the last 8 years, as part of the La Perouse Bank Project. A principal objective of this project is to quantify how interannual changes in oceanic conditions, and in the distribution and abundance of offshore predators, affect herring recruitment and mortality.
Hake Distribution
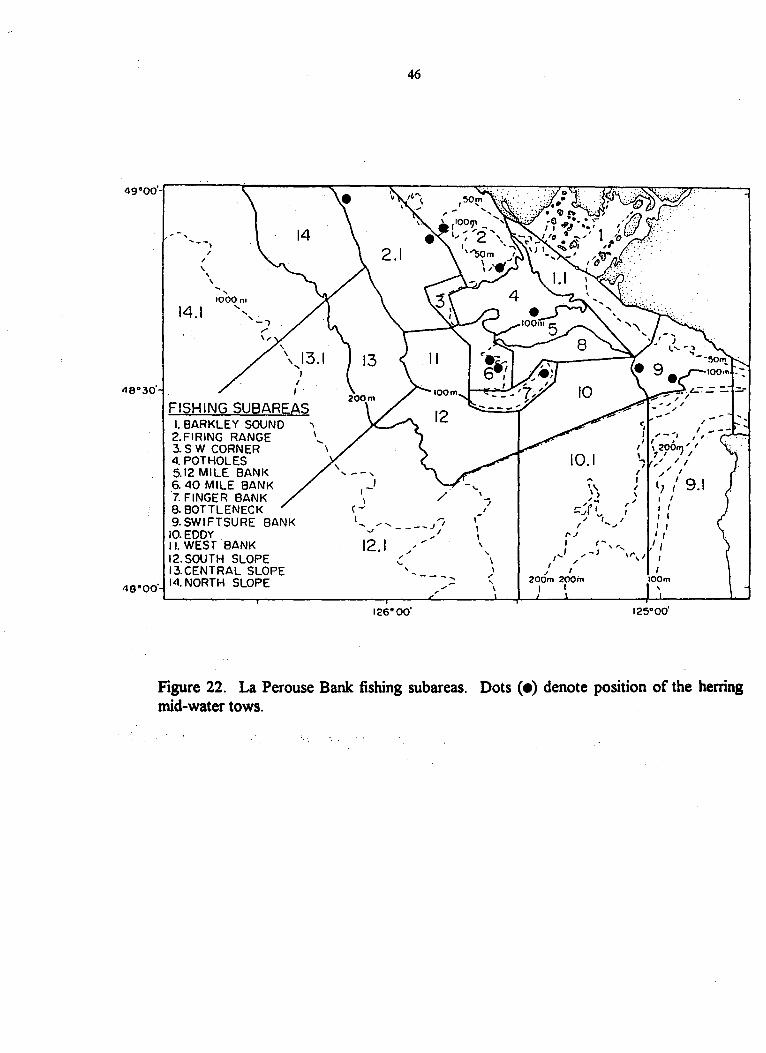
The hake stock was most highly concentrated off the mouth of Barkley Sound in subareas 4 and 8, and along the shelf-break (near the 200 m isobath) in subarea 13 (Fig. 22). The concentrations in subareas 4 and 8 are fairly typical for this time of year. However, the concentrations along the shelf-break so early in the summer are indicative of EN SO conditions.
Pacific Sardine Distribution
Sixty-four Pacific sardine were captured in five tows made in subarea 4 (close to the 100 m isobath) between August 4 and 5. The first sardine was discovered in a tow dominated by herring. The largest catch of sardine (42 fish) was obtained from a tow targeted on mackerel (concentrated at depths between 40-70 m) , which were distributed on top of a layer of hake, found at 70-90 m depth. In order of abundance this set caught a mixture of dogfish, hake, Jack mackerel, herring, sardine, and Pacific mackerel. The presence of Pacific sardine in the La Perouse Bank area in the 1992 survey, and two others in the area, represent the first confirmed catches of Pacific sardine in B.C. waters since the 1950s (Hargreaves, Ware & McFarlane, 1994. in press). It is also of interest that Ron Tanasichuk found sardines overwintering with herring in the Strait of Georgia in March 1993. He found two sardines during a routine herring maturity sampling program.
Mackerel Distribution
More Pacific and Jack mackerel were caught during the 1992 survey than at any time since 1985 (both species were abundant in the area during the last strong ENSO event in 1983 and 1984). Jack mackerel were the most abundant and widely distributed of the two species in the survey area (they were found in subareas 1,2,6,7,8,9,10; Fig. 22) and were caught in 16 of 32 tows in 1992 . Pacific mackerel were caught in 9 tows, primarily in subareas 1, 7, 9 and .10. The unusally high abundance of both species was related to the .1992 ENSO warm event.
Herring Distribution
The spatial distribution of different ages of herring varied markedly between subareas

10
7
Pacific
Ocean
(13:> 12 V
4S
15 .f\.-21 ~18 <\)
J.;T 0 C\ 19 4
5
6
Q
23
3
~-------------'--------------~-------------r--------47°
Figure 21. Postions of mid-water tows made during the 1992 August survey over La Perouse Bank.
49"00'
, ,
14.1
, \
I , FISHING SUBAREAS
I. BARKLEY SOUND 2.FIRING RANGE 3.S W CORNER 4. POTHOLES 5.12 MILE BANI< 6.40 MILE BANK 7. FINGER BANK 8. BOTTLENECK 9. SWIFTSURE BANK
10. EDDY II. WEST BANI< 12. SOUTH SLOPE 13.CENTRAL SLOPE 14. NORTH SLOPE
, I
-' r \
(~
46
I ~ ...... .,.,. ...... __ --)1
oJ I
12.1 ' ,
126"00'
"
-- -",
, ..... ~
"j I
I-
I I \ ,
\ I
;, ,
10.1 ~
'\ , ) ' .. '11
~Jf ( J 'I
I ' .... ('.I
I .. ..I " ..-I ,
200m 200m I 1
<; , I JII' - " , I, ~ --I' . , ,200"," I
I 1 I I I
j ;/ /" I I / I
) l},' 9.1 \
rJ I I I I I
I 1
125"00'
Figure 22. La Perouse Bank fishing subareas. Dots (e) denote position of the herring mid-water tows.

47
during the 1992 survey. This is typical in this region in the summer. Young-of-the year herring (age 0+, the 1992 yr-class) were not plentiful offshore during the survey. The small numbers we ecountered were in the northern part of the survey area and in Barkley Sound., Age 1+ juvenile herring were most abundant in the northern part of the shelf(subareas 14,2.1, and 2) and Swift sure Bank (Fig. 22). Age 2+ (prerecruits) and older, adult herring were most abundant on 40-miIe (subarea 6) and Swiftsure Banks (subarea 9). Last year we found large concentrations of adult herring (age 3+ and older) near the outer edge of the continental shelf (subarea 12). This year we didn't find enough in subareas 12 and 13 to justify making a tow.
Predator Diets
The diets of 1663 hake, SI1 dogfish, 122 Pacific mackerel, 111 Jack mackerel, and ISS chinook salmon were examined at sea. Euphausiids made up 57%, and herring 36% of the diet (by weight) of hake. The corresponding 8-yr average values for hake in August are 60% and 32%, respectively. Euphausiids made up 32%, and herring 37% of the diet (by weight) of dogfish. The 8-yr average values for dogfish are 58% and 12%, respectively. Thus both hake and dogfish had slightly lower proportions of euphausiids in their diets, and higher proportions of herring in their diets in 1992.
1993 Herring Recruitment Forecast
The relative abundance of maturing age 2+ fish encountered during the August trawl survey is being used to forecast the proportion of the same age group (which will appear as recruit spawners) six months later in early March 1993 in the Barkley and Clayoquot Sounds spawning stock. This forecast is used in association with the age~structured herring stock aS,sessment model to' determine the projected biomass of new recruits, and hence the fishing quota recommended by the Pacific Region Herring Stock Assessment Committee.
Based on the relative abundance of age 2+ herring encountered during the survey we forecast in September 1992 that 24% of the Barkley and Clayoquot Sounds spawning stock will consist of age 2+ recruits in the spring of 1993. Fig. 23, summarizes the 'track-record' of
. the forecast since its inception (n=7, p=O.018). To date, our sampling procedure has produced a fairlyreliableprojectidn. The August 1992 forecast was quite accUrate. since the anticipated -retruitnientfrequeney of 24% was remarkably close to what was measured (26%) by the prefishery charters in Barkley and Clayoquot Sounds prior to the 1993 roe herring fishery.
Future Activities
The 1992 diet information corroborates the mechanism that we hypothesized was behind the negative correlations between herring year-class strength, hake biomass, and water temperature. These results are being incorporated into a multispecies predator-prey model that will be used to estimate interannual variability in herring 'natural-mortality rates (in collaboration with Cliff Robinson).
D.M. Ware R.W. Tanasichuk

48
-;::" 50 -~ .s= e
40 as ::E -en t:: ~ 30 .0: (.) w 0: +
C\I 20 w CJ < ~ 0 10
O~'----'----L.....--.L.....:----'---......L-~----' o 10 20 30 4050 60
% AGE 2 + PRERECRUITS (August yr t-1)
Figure 23. RelatiQnship between the % age. 2 + (prerecruit) herring measured in August ,(yr ~"1) inU1~ L.a Perouse sUlVeyarea, and the % of the, ~me yr~class m~asured six months later in the spawning stock in March (yr t).
49
3.3.2 Pacific Hake Distribution and Recruitment
Pacific hake (Merluccius productus) is the most abundant species in waters off the west coast of Canada and is a major component of the groundfish fishery. The offshore stock is migratory and, after spawning off California and Mexico during the winter, moves northward to feed during the summer from northern California to Queen Charlotte Sound. Schools of adult hake first appear off Vancouver Island in late May and remain until late November. The southward migration may be triggered by the onset ofthe.fall transition.
Total reported catches i~ the Canadian zone averaged 90.5 Kt over the five year period 1988-1992. The catch in 1992 decreased to 86,370 t from 104,522 t in 1991. Participating countries in 1992 were Poland, China and Japan. In 1992, most hake was landed through. a joint venture with Canadian fishermen. Interest in domestic processing of hake, in particular in the Ucluelet area, continues to grow.
The proportion of the stock supporting the Canadian fishery is in good condition as the Canadian fishery cont41ues to be supported by a series of strong year-classes, in particular, 1980, 1984 and 1987/88. Over thetast several decades Pacific hake have generated strongyear classes approximately every 3-4 years. The stock overall is beginning to decline in abundance as the strong 1984 and 1980 year,-classes are declining. There is no· indication yet that either the 1990 or 1991 year-classes are strong .. It is anticipated that quotas will decline over the next several years unless recruitment increases.
The objectives of this study are: (1) to,detern1ine the distribution and relative abundance of Pacific hake in Canadian waters on an annual basis; (2) to examine distribution in relation to oceanographic and biological features; (3) to determine biotic and abiotic factors controlling year-class success; and (4) to determine the impact of Pacific hake and other predators on the abundance of Pacific herring (with D. Ware and R. Tanasichuk).
Research on the distribution, abundance and biology of this stock has been conducted annually since 1977. Qualitative surveys examining the distribution of hake were conducted annually from 1985 to 1989 and found hake from the Canada-U.S. border to Queen Charlotte Sound. In 1990, 1991 and 1992 hydroacoustic surveys were conducted over this range. In
, gener~, large concentrations were' found in the basins adjacent to La Perouse Bank and adjacent to Brooks Peninsula. Smaller, dense schools were found along the 150-200 m isobath (Fig. 24).
In 1992 a coastwide hydroacoustic survey was conducted by the U.S. using the NOAA ship Miller Freeman. Aside by side comparison of the Canadian and U.S. acoustic systems indicated that over the range of hake densities observed, the two systems recorded similar biomasses. Overall results of the independent surveys of the Canadian zone were comparable with the U.S. finding of932 Kt and the DFO survey finding of 1,101 Kt. This was a substantial increase from the 1990 and 1991 estimates of316 Kt and 568 Kt,
.' respectively. The high level of abundance in the Canadian zone was expected due to the warm . ocean conditions and the positive correlation' between high temperatures and the proportion of
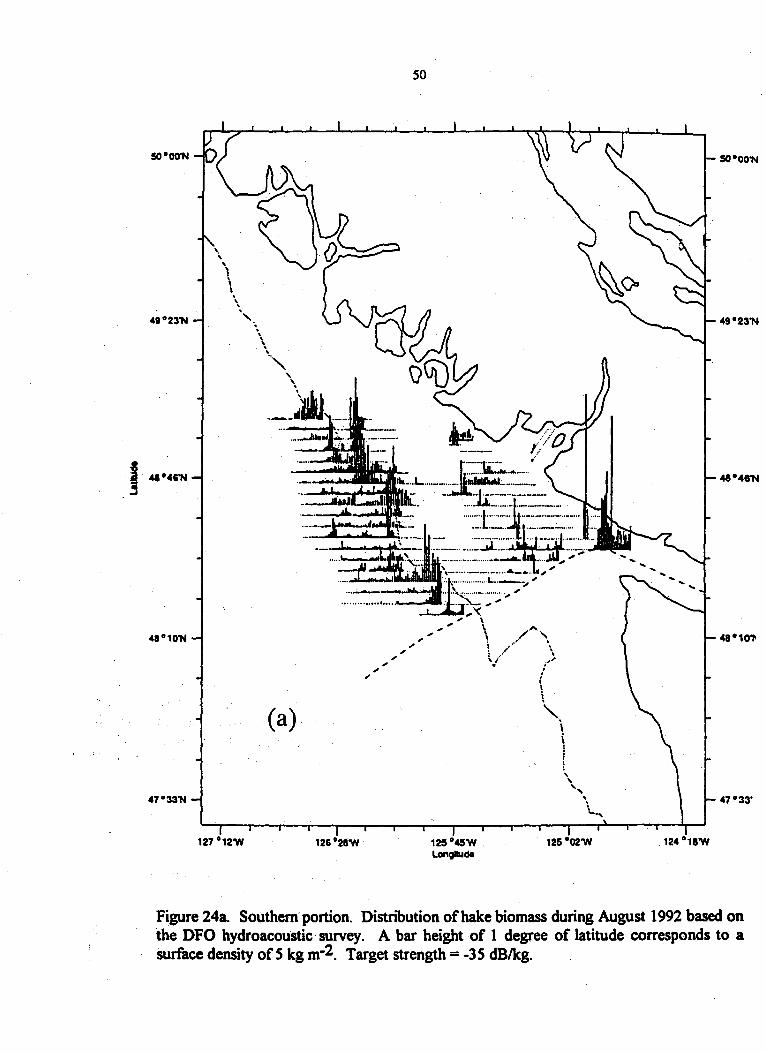
(a).
127 12W 126
50
125°4SW Longitude
/-", ,.... \
.. / \
/" I \
\ '-.
\ \
125
I , , " '.
\....,
Figure 24a. Southern portion. Distribution of hake biomass during August 1992 based on the DFO hydroacoustic· survey. A bar height of 1 degree of latitude corresponds to a surface density of 5 kg m-2. Target strength = -35 dBlkg.

53°00'N
I SO·30'N·
48°00'N
131
/, I ... \ . , . \
(b)
\ ,
129
51
'48·00'N
Figure 24b, Northern portion. Distribution of hake biomass during August 1992 based on the DFO hydroacoustic survey. A bar height of 1 degree of latitude corresponds to a surface density of5 kg m-2. Target strength = -35 dBlkg.
52
hake in the Canadian zone. Tracklines were extended further offshore in 1992 than in previous surveys due to a light scatter of hake that persisted seaward of the she1f7break. This offshore extension was also noted during the concurrent U.S. survey and may reflect anomalous oceanographic conditions coastwide.
The 1990-92 survey data were used extel)sivelyin analysis related to CanadalU.S. negotiations regarding allocation of yield. Briefly, negotiators agreed to use coastwide surveys conducted by the U.S. to determine the proportion of total coastwide biomass found in the Canadian zone. This same proportion would be used to split available yield. The U.S. surveys however, did not go beyond 50 degrees with one going only to 49 degrees. The Canadian surveys provided evidence of substantial quantities offish north of the U.S. survey limits and formed the basis for increasing the proportion accredited to Canada.
During 1992 work continued on the factors affecting the distribution of hake we have examined the effect of physical and biological environmental conditions on hake distribution. The distribution of hake matched very closely the distribution of,euphausiids reported by Simard and Mackas (1989 -see section 5.). Given the importance ofeuphausiids in the diet of hake it appears that the distribution of hake is linked to the distribution of their primary prey. A cooperative program with industry was irutiated to examine the interannual variation in the. timing of entry of hake into the Canadian zone .. Preliminary analysis indicated that commercial
. .
quantities were present in the Canadian zone as early as May throughout the summer range of hake (Fig. 25).
Future research will include the following:
1. Continue to examine.the factors influencing the summer and winter hake distribution.
2. Examine factors controlling hake year-class success.
M.W. Saunders G.A. McFarlane

s:
Hake Density
II Heavy
II Moderate/Light
Trackline
Hope Bay May 1992
Hak. Distribution
"'Ie &ri .... r. a 1iOaa-,.- __ -~SiiGno
Figure 25. Subjective estimates of hake density during May 1992.
VI W

54
3.3.3 Larval/juvenile fish and plankton interactions
General Overview
This project concerns the cross-shelf exchanges and interactions of plankton off the west coast of Vancouver Island, and the impact of these exchanges for larval and juvenile fish production and growth. Mackas (1992 - see section 5.) identified a general seasonal flux of zooplankton from the continental shelf to the shelfbreak and open ocean. Yet McFarlane (pers. comm.) has suggested that successful recruitment of sable fish (which spawn at the shelf break in spring) can depend upon transport of larvae to protected nearshore "nursery areas". Further, the contrasts between the shelf zooplankton and larval fish community and the community over the continental slope and deep ocean are very clear and quite sharp, occurring over a few 10's ofkm at about the location of the shelfbreak. Hargreaves (pers. comm.) has found that ,the extent of juvenile salmon distributions across the shelf during their northward migration in early summer can be highly variable, and appears to be poorly (at best) related. to prevailing hydrographic and current patterns.
The general thrust of these 3 projects is to determine whether these distmct shelf and slope communities can be identified by chemical signals, e.g. stable isotope anomalies, and are th'esedifferent anomalies consistent up the food web? Second, how much exchange is likely to occur between these two communities, and what are the dominant physical oceanographic processes that are likely to regulate such exchanges? Third, can the constant nature of these communities and their stable isotope anomalies be used as tracers to indicate whether highly migratory fishes, such as juvenile salmon, feed predominately on plankton communities on, the shelf or over the slope regions. The answer to this final question has bearing on the dynamics of control of zooplankton biomass and resulting growth and potential survival of these small fishes.
Stable isotopes as tracers of larval fish food-webs during spring of sw Vancouver Island (R. Ian Perry, Peter A. Thompson and Paul J. Harrison)
This project explores the use of stable isotopes of carbon (~13C) and nitrogen (~15N) as tracers of food-web pathways off southwesfVancouver Island during spring 1992. The principal vector is from phytoplankton to larval' fishes; The purpose is to determine if these stable isotopes may be used as indicators of the dominant feeding locations of larval and juvenile fishes, i.e. whether feeding occurred predominately on the continental shelf, or at the shelf break, and beyond the continental shelf. . Although s~ple analyses ,are continuing, preliminary results indicate that distinct differences existed in the ~13C anomalies of several size classes. of particulate material (phytoplankton), and in larval fishes, between the continental shelf.'and the shelf break (e.g. Fig. 26). Carbon isotope anomalies were significantly lower in the La Perouse Bank region in all size ,classes of particplate material (mean anomaly value of -20.9 over all size classes) compared with samples collected at the shelfbreak (mean anomaly value of -23.0 over all size classes). A similar pattern occurred for fish larvae, for which the mean carbon anomaly value on the continental shelfwas -17.8, while at the shelfbreak the mean anomaly was -21.7 (these results are based on over 30 larval fish in each region, and are significantly different at the 0.01 probability level (t-test». These findings

.Z ::l o (,)
15
10
5
-
-
-
o -25
20
15
.z ::l10 o (,)
5
I-
I-
I-
o ~25
I I
a
I--
. •
b
,
.
55
I • •
I--
r---
-20 DEL13C
•
I I -20
DEL 13C
r---
•
-
-
-15
.
r--- -
-
--
-15
Figure 26. Frequency distribution of the a l3e anomaly in fish larvae collected from (a) the shelf break area, and.(b) the La Perouse Bank area, west of Vancouver Island during April 1992.
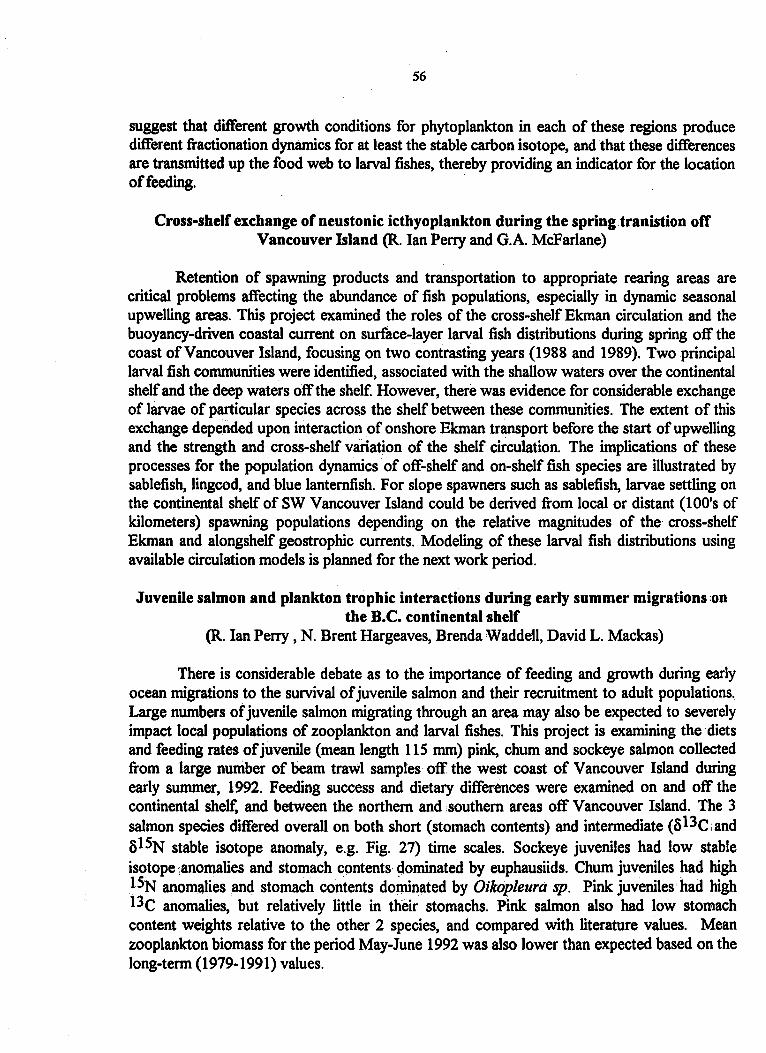
56
suggest that different growth conditions for phytoplankton in each of these regions produce different fractionation dynamics for at least the stable carbon isotope, and. that these differences are transmitted up the food web to larval fishes, thereby providing an indicator for the location of feeding.
Cross-shelf exchange of neustonic icthyoplankton during the springtranistion ofT Vancouver Island (R. Ian Perry and G.A. McFarlane)
Retention of spawning products and transportation to appropriate rearing areas are critical problems affecting the abundance of fish populations, especially in dynamic seasonal upwelling areas. This project examined the roles of the cross-shelf Ekman circulation and the buoyancy-driven coastal current on surface-layer larval fish distributions during spring off the coast of Vancouver Island, focusing on two contrasting years (1988 and 1989). Two principal larval fish communities were identified, associated with the shallow waters over the continental shelf and the deep waters off the shelf. However, there was evidence for considerable exchange of larvae of particular species across the shelf between these communities. The extent of this exchange depended upon interaction of onshore Ekman transport before the start of upwelling and the strength and cross-shelf vanation of the shelf circulation. The implications of these processes for the population dynamics of off-shelf and on-shelf fish species are illustrated by sablefish, lingcod, and blue lanternfish. For slope spawners such as sablefish, larvae settling on the continental shelf of SW Vancouver Island could be derived from local or distant (100's of kilometers) spawning populations depending on the relative magnitudes of the cross-shelf Ekman and alongshelf geostrophic currents. Modeling of these larval fish distributions using available circulation models is planned for the next work period.
Juvenile salmon and plankton trophic interactions during early summer migrations :on the B.C. continental 'shelf
(R. Ian Perry, N. Brent Hargeaves, Brenda Waddell, David L. Mackas)
There is considerable debate as to the importance of feeding and growth during early ocean migrations to the survival of juvenile salmon and, their recruitment to adult populations. Large numbers of juvenile salmon migrating through an area may also be expected to severely impact local populations of zooplankton and larval fishes. This project is examining the diets and feeding rates of juvenile (mean length 115 mm) pink, chum and sockeye salmon collected from a large number of beam trawl samples· off·the west coast of Vancouver Island during early summer, 1992. Feeding success and dietary differences were examined on and off the continental shelf, and between the northern and southern areas off Vancouver Island. The 3 salmon species differed overall on both short (stomach contents) and intermediate (a13C i and a15N stable isotope anomaly, e.g. Fig. 27) time scales. Sockeye juveniles had low stable isotope "anomalies and stomach contents 40minated by euphausiids. Chum juveniles had high 15N anomalies and stomach contents dominated by Oikopleura sp. Pink juveniles' had high l3C anomalies, but relatively little in their stomachs. Pink salmon also had low stomach content weights relative to the other 2 species, and compared with literature values. Mean zooplankton biomass for the period May-June 1992 was also lower than expected based on the long-term (1979-1991) values.
57
STABLE ISOTOPE ANOMALIES 16~--~----~1----------~1----------~
15 - ,e 6 -
0 8 0 •
z 14 ro- . -an () --~ 0 0 • ..J W o .1 c 13 r- -
• 6 •
12 6
f- -
11~---------------~1------------------~1---------------~ -30 -25 -20 -15
DELTA 13C
Figure 27. Stable isotope anomalies of nitrogen and carbon in muscle tissue from juvenile salmon (mean fork length 115 mm) collected off the west coast of Vancouver Island during early July 1992. Triangles indicate values for sockeye salmon; circles represent chum salmon; and dots represent pink salmon.
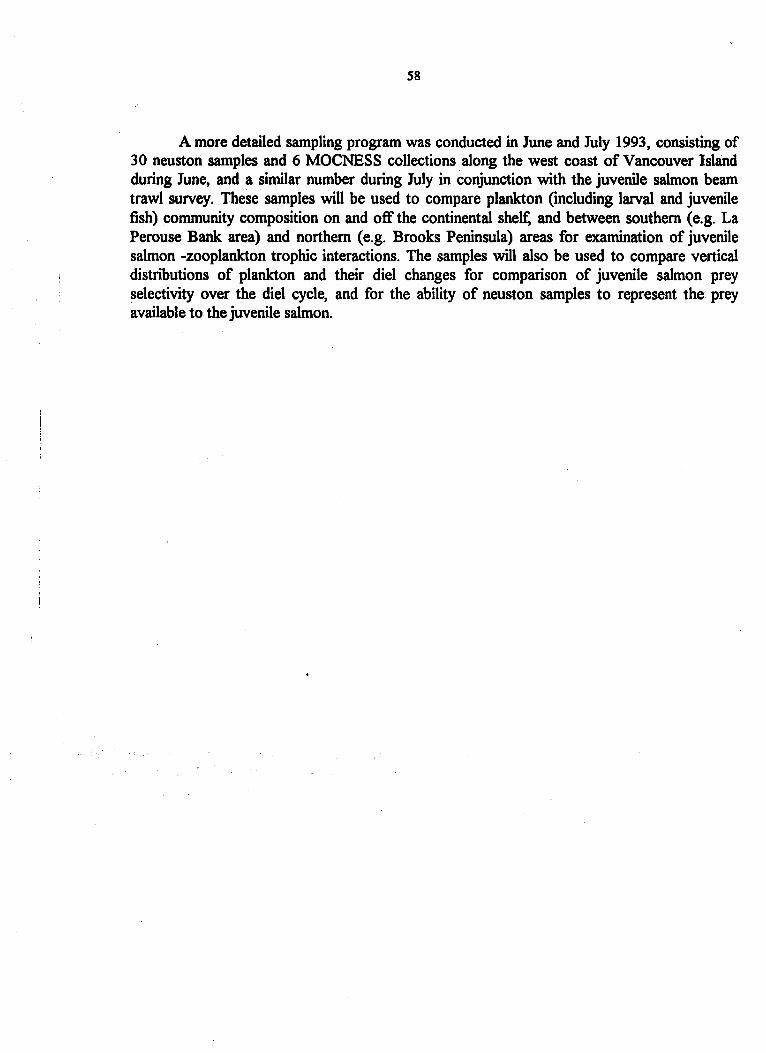
S8
A more detailed sampling program was conducted in June and July 1993, consisting of 30 neuston samples and 6 MOCNESS collections along the west coast of Vancouver Island during June, and a similar number during July in conjunction with the juvenile salmon beam trawl survey. These samples will be used to compare plankton (including larval and juvenile fish) community composition on and off the continental shelf: and between southern (e.g. La Perouse Bank area) and northern (e.g. Brooks Peninsula) areas for examination of juvenile salmon -zooplankton trophic interactions. The samples will also be used to compare vertical distributions of plankton and their diel changes for comparison of juvenile salmon prey selectivity over the diel cycle, and for the ability of neuston samples to represent the prey available to the juvenile salmon.
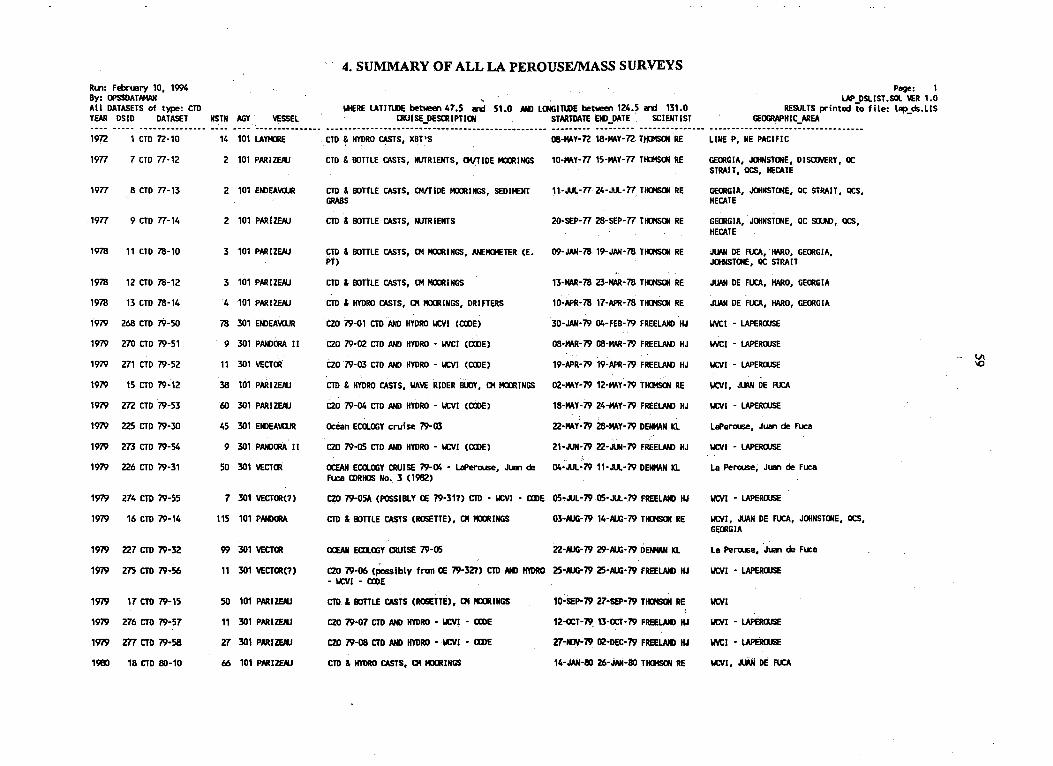
RU1: February 10, 1994 By: OPSSOATAHAH All OATASETS of type: CTO YEAR OSlO DATASET NSTN Nr1 VESSEL
1972 1 eTO 12-10
1977 7 CTO 77-12
1977 8 CTO 77-13
1977 9 eTD 77-14
1978 11 eTO 78-10
1978 12 CTO 78-12
1978 13 CTO 78-14
1979 268 CTD 79-50
1979 270 CTD 79-51
1979 271 CT079-52
1979 15 CTD 79-12
1979 212 CTD 79-53
1979 225 eTO 79-30
1979 273 eTO 79-54
1979 226 CTD 79-31
1979 274 eTO 79-55
1979 16 CTO 79-14
1979 227 eTO 79-32
1979 275 eTD 79-56
1979 17 CTO 79-15
1979 276 CTD 79-57
1979 277 CTD 79-58
19S0 18 CTO 80-10
14 101 LAYMalE
2 101 PARIZENJ
2 101 EIIlEA\IQJR
2 101 PAR/ZENJ
3 101 PARIZENJ
3 101 PARIZENJ
4 101 PARIZENJ
78 301 EIIlEAWJR
9 301 PAMlCRA II
11 301 VECTeR
38 101 PARIZENJ
60 301 PARIZENJ
45 301 EIIlEA\IQJR
9 301 PAMlcRA II
50 301 VECT!R
7 301 VECT!R(7)
115 101 PAMlCRA
99 301VECT!R
11 301 VECT!R(?)
50 101 PARI ZENJ
11 301 PARIZENJ
27 301 PARIZENJ
66 101 PARIZENJ
4. SUMMARY OF ALL LA PEROUSEIMASS SURVEYS
\/HERE LATlTUlE between 47.5 IRf 51.0 AlII LCJlGITLOE between 124.5;rd 131.0 CRUISE_OESCRIPTlDI STARTDATEEIIl_DATE· SCIENTIST
CTO & HYDRO CASTS, XBl'S 08-MAY-n 18-MAy-n T)QISCJI RE
CTD & BOTTLE CASTS, NUTRIENTS, CMfTIOE MaJUNGS 10-MAY-77 15-MAY-77 THIJIS(Jj RE
CTO & BOTTLE CASTS, OVTIDE IIXJIINGS, SEDIMENT .1hIUL-77 24-JUL.77 THIJIS(Jj RE GRABS
CTO & BOTTLE CASTS, NUTRIENTS 20-SEP-77 28-SEP-77 THIJIS(Jj RE
CTO & BOTTLE CASTS, CM MCXRINGS, ANEIDETER (E. 09-JAN-78 19-JAN-78 THIJIS(Jj RE PT)
CTO & BOTTLE CASTS, CM MIDlINGS 13-MAR-78 Z3-MAR-78 TID1SDI RE
CTO & HYDRO CASTS, CM !«)(RINGS, DRIFTERS 10-APR-78 17-APR-78 TIOISDI RE
czo 79-01 CTD AND HYDRO 1«:'11 (IXDE)30-JAN-79 O4-FEB-79 FREELAMlHJ
CZO 79-02 CTO AND HYDRO - INCI (IXDE) 08-MAR-79 08-MAR-79 FREELAMl HJ
CZO 79-03 CTO AND HYDRO - leVI (IXDE) 19-APR-79 19-APR-79 FREELAMl HJ
CTO & HYDRO CASTS, IIAVE RIDER Iiim, CM MIDlINGS 02-MAY-79 12-MAY-79 THIJIS(Jj RE
CZO 79-04 CTD AND HYDRo - IICVI ((mE) 18-MAY-79 24-MAY-79 FREELAMl HJ
Ocean ECQ.OOY cruise 79-03 22-MAY-79 28-MAY-79 DEIllAN III
CZO 79-05 CTO AND HYDRO - 1«:'11 (IXDE) 2hIUN-79 22-JIIoI-79 FREElAIIl HJ
OCEAN ECOLOOY CRUISE 79-04 - LaPerouse, Juan de O4-JUL-79 11-.M.-79 DENMAN III Fuca CDRHOS No. 3 (1982)
czo 79-05A (POSSIBLY IE 79-317) CTD - leVI - IXDE Os,.'JL-79 05-J\l.-79 FREELAMl HJ
CTO & BOTTLE CASTS (ROSETTE), CM !«)(RINGS 03-MXi-79 14-AUl-79 TIDISDI RE
OCEAN ECQ.OOY CRUISE 79-05 22-MXi-79 29-AUl-79 DENMAN III
CZO 79-06 (Possibly fran IE 79-321) CTD AlII IfYDRO 25-MXi-79 25-AUl-79 FREElAIIl HJ - leVI - IXDE
CTO & BOTTLE CASTS (ROSETTE), CM IO>RINGS
CZO 79-07 CTD N#J HYDRO - leVI - IXDE
CZO 79-08 CTO AND HYDRO - leVI - IXDE
CTD & HYDRO CASTS, CM !«)(RINGS
10~SeP-79 27-5EP-79 TIDISDI RE
lZ-OCT-79. 13-OCT-79 FREElAIIl HJ
27-WN-79 02-DEC-79 FREElAMl HJ
14-JAN-80 26-jAN-80 TIDISDI RE
Page: 1 LAP OSLlST.SQL VER 1.0
RESULTS printed to file: IIlP_cis.L1S GEOGRAPHIC_AREA
LINE P, NE PACIFIC
GE!RGIA, JotNSTDlE, DISOlVERY, QC STRAIT, acs, HECATE
GE!RGIA, JotNSTDlE, ac STRAIT, QCS, HECATE
GE!RGIA, JotNSTDlE, ac SIUI>, QCS,
HECATE
JUAN DE FUCA,· HARO, GE!RGIA, JotNSTONE, QC STRA IT
JUAN DE FUCA, HARO, GE!RGIA
JUAN DE FUCA, HARO, GE!RGlA
IIVCI - lAPEROOSE
IIVCI - lAPERWSE
IICVI - LAPEROOSE
IICVI, JUAN DE FUCA
\leVI - lAPERrusE
laPerouse, Juan de Fuca
\leVI - LAPEROJSE
La Perwse, Juan de Fuca
\leVI - lAPEROUSE·
IICVI, JUAN DE FUCA, JotNSTDlE, QCS,
GE!RGIA
La Perwse, Juan de Fuca
\leVI - lAPEROUSE
\leVI
IICVI - lAPEROUSE
II\ICI - lAPERaJsE
\leVI, JIJAIj DE FUCA
VI \0
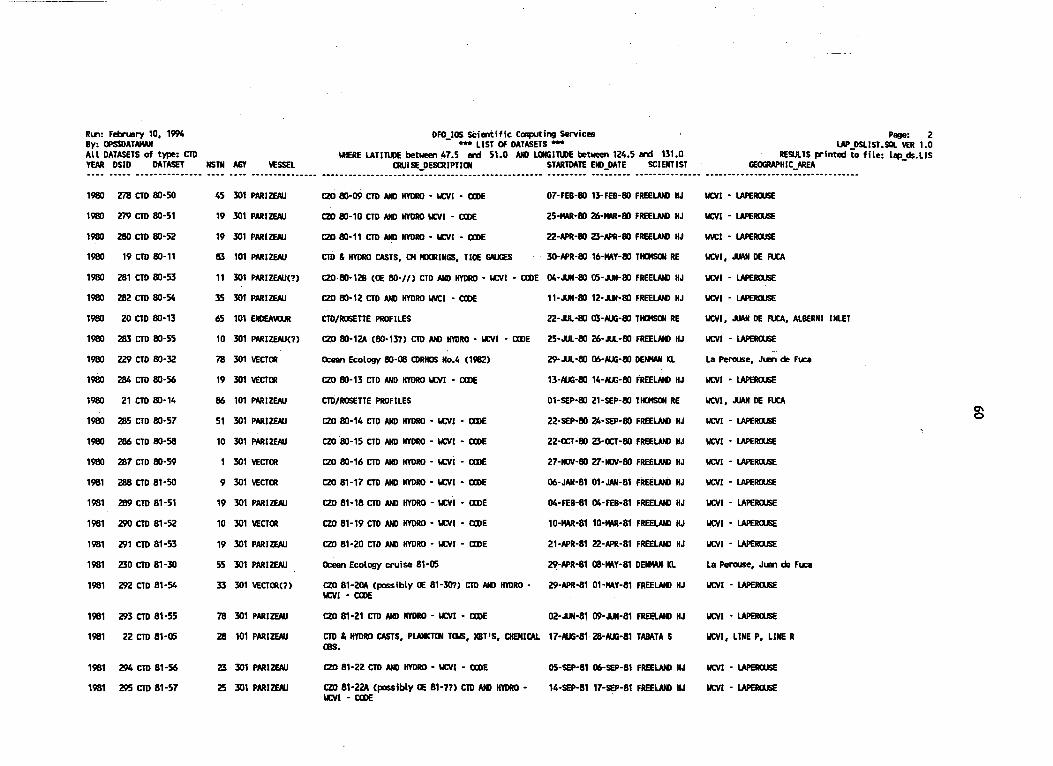
R",: February 10, 1994 By: OPSSOATNWI All OATASETS of type: CTD YEAR DSID DATASET NSTN Nrf VESSEL
19S0 278 CTD SO-SO
19S0 m CTD SO-51
19S0 280 CTD SO-52
19S0 19 CTD SO-11
19S0 281 CTD BO-53
19S0 282 CTD SO-54
19S0 20 CTD so-13
19S0 283 CTD SO-55
19S0 229 CTD SO-32
19S0 284 CTD SO-56
19S0 21 CTD BO-14
19S0 285 CTD SO-57
19S0 286 CTD SO-58
19S0 287 CTD SO-59
1981 288 CTD 81-SO
1981 289 CTD 81-51
1981 290 CTD 81-52
1981 291 CTD 81-53
1981 230 CTD 81 -30
1981 292 CTD 81-54
1981 293 CTD 81-55
1981 22 CTD 8H)5
1981 294 CTD 81-56
1981 295 CTD 81-57
45 301 PARIZEAIJ
19 301 PARIZEAIJ
19 301 PARIZEAU
8l 101 PARIZEAIJ
11 301 PARIZEAIJ(?)
35 301 PARI ZEAIJ
65 101 ENDEAVDJR
10 301 PARIZEAIJ(?)
78 301VECTa!
19 301 VECTa!
56 101 PARIZEAIJ
51 301 PARIZEAIJ
10 301 PARIZEAIJ
301VECTa!
9301VECTa!
19 301 PARIZEAIJ
10 301 VECTa!
19 301 PARIZEAIJ
55 301 PARIZEAIJ
33 301 VECTa!(?)
78 301 PARIZEAU
28 101 PARIZEAU
23 301 PARIZEAU
25 301 PARI ZEAU
DFO_I05 SCientific ~ing Services .... LIST Of DATASETS ***
WERE lATlrulE betWl!!!fl 47_5 ard 51_0 AND UllGlnnE between 124_5 ard 131_0 CRUISE_DESCRIPTlIIf STARTDATE END_DATE SCIENTIST
CZO SO-09 CTD AND HYDRO - 1«:'11 - IXDE 07-FEB-SO 13-FEB-SO FREElAND HJ
CZO SO-10 CTD AND HYDRO 1«:'11 - IXDE 25-MAR-SO 26-MAR-80 FREElAND HJ
CZO SO-11 CTD AND HYDRO - 1«:'11 - IXDE 22-APR-SO 23-APR-SO FREELAND HJ
aD & HYDRO CASTS, CM ,alUNGS, TIDE GAUGES 30-APR-8016-MAY-SO TIOISOI RE
CZOSO-12B (DE BO-I/) CTD AND HYDRO - 1«:'11 - IXDE 04-JUN-SO OS-JUN-SO FREElAND HJ
CZO SO-12 CTD AND HYDRO INCI - IXDE "-JUN-SO 12-JlJl-SO FREElAND HJ
CTD/ROSETTE PROFILES 22-JUl-SO 03-MJG-SO TIOISOI RE
CZO SO-12A (SO-137) CTD AND H'lDRO - !«:VI - IXDE 25-JUl-SO 26-M-SO FREElAND HJ
Ocean Ecology SO-DB CDRHOS No_4 (19112) 29-JUl-SO 06-MJG-SO DEIfWI Kl
CZO SO-13 CTD AND HYDRO !«:VI - IXDE 13-MJG-80 14-MJG-SO FREElAND HJ
CTD/ROSETTE PROFILES 01-SEP-SO 21-SEP-SO TIOISOI RE
CZO SO- 14 CTD AND HYDRO - 1«:'11 - IXDE 22-SEP-SO 24-SEP-SO FREElAND HJ
CZO SO-15 CTD AND HYDRO - 1«:'11 - IXDE 22-OCT-SO 23-OCT-SO FREElAND HJ
CZO SO-16 CTD AND HYDRO - l«:'Ii - IXDE 27-NOY-SO 27-NOY-SO FREELAND HJ
CZO 81-17 CTD AND HYDRO - 1«:'11 - IXDE 06-JAN-81 01-JAN-81 FREELAND HJ
CZO 81-18 CTD AND HYDRO - 1«:'11 - IXDE 04-FEB-81 D4-FEB-81 FREElAND HJ
CZO 81-19 CTD AND HYDRO - 1«:'11 - IXDE 10-MAR-81 10-MAR-81 FREElAND HJ
CZO 81-20 CTD AND HYDRO - 1«:'11 - IXDE 21-APR-81 22-APR-81 FREELAND HJ
Ocean Ecology crui se 81 -OS 29-APR-81 DB-MAY-81 DEIfWI· Kl
CZO 81-2OA (possibly DE 81-307) CTD AND H'lDRO - 29-APR-81 01-MAY-81 FREElAND HJ 1«:'11 - IXDE
CZO 81-21 CTD AND HYDRO - 1«:'11 - IXDE 02-JUN-81 09-JIJI-81 FREElAND HJ
CTD & HYORO CASTS, PlANICTlIf TIllS, lCBT'S, CHEMICAL 17-MJG-8128-MJG-81 TABATA 5 cas_
CZO 81 -22 CTD AND HYDRO - 1«:'11 - IXDE
CZO 81-22A (possibly DE 81-77) CTD AND II'tDRO -1«:'11 - IXDE
OS-SEP-81 06-SEP-81 FREElAND HJ
14-SEP-81 17-SEP-81 FREElAND HJ
Page: 2 lAP DSlIST _SIll VER 1.0
RE!ilA.TS printed to file: l"UIs.lIS GEOOW'HIC_AREA
IICYI - lAPERQISE
IICYI - lAPERQISE
INCI - lAPERWSE
IICYI, .RJAII DE FUCA
IICYI - lAPERWSE
IICYI - lAPERQISE
I/CVI, .RJAII DE FUCA, ALBERNI INLET
IICYI - lAPERQISE
La Perouse, JI.&l de Fuca
IICYI - lAPERQJSE
IICYI, .RJAII DE FUCA
IICYI - lAPERQISE
IICYI - lAPERQISE
IICYI - lAPERQJSE
IICYI - lAPERQISE
IICYI - lAPERWSE
IICYI - lAPERQISE
IICYI - lAPERQJSE
La Perouse, JI.&l de Fuca
IICYI - lAPERQJSE
IICYI - lAPERQISE
IICYI, LINE P, LINE R
IICYI - lAPERWSE
IICYI - lAPERWSE
g

Rln: February 10, 1994 By: OPSSOATAMAN All DATASETS of type: CTD YEAR OSlO DATASET NSTN NiY VESSEL
1981 23 CTD BH16
1982 24 CTD 82-01
1982 25 CTD 82-02
1982 26 CTD 82-(3
1982 27 CTD 82-04
1982 28 CTD 82-05
1982 29 CTD 82-06
1983 30 CTD 83-01
1983 32 CTD 83-10
1983 33 CTD 83-11
1983 232 CTD83-31
1983 296 CTD 83-50
1983 31 CTD 83-02
1984 35 CTD 84-01
1984 233 CTD 84-30
1984 40 CTD 84-12
1984 41 CTD 84-13
1984 36 CTD 84-02
1984 42 CTD 84-14
1984 37 CTD 84-(3
. 1985 43 CTD 85-01
1985 51 CTD 85-20
1985 44 CTD 85-02
1985 52 CTD 85-30
13 101 PARIZEAlJ
25 101 EIIlEAVIlJR
31 101 EIIlEAVIlJR
21 101 PARIZEAU
27 101 PARIZEAlJ
lB 101 .PARI ZEAlJ
31 101 EIIlEAVIlJR
30 101 ENDEAVIlJR
9 101 PARIZEAlJ
21 101 EIIlEAIoOJR
37 301 EIIlEAIoOJR
20 301 PARIZEAlJ(?)
30 101 PARIZEAlJ
12 101 PARIZEAlJ
6 301 PARIZEAlJ
149 101 PARIZEAlJ
59 101 PAIIlaIA
16 101 EIIlEAVIlJR
11 101 PARIZEAlJ
42 101 PARIZEAlJ
11 101 EIIlEAYIlJR
134 101 EIIlEAVIlJR
70 101 PARIZENJ
32 101 OCEAN KING
DFO_IOS. Scientific Carputing Services .... LIST OF DATASETS ....
\/HERE LATlTlIlE between 47_5 end 51_0 AlII lQIGITUlE between 124.5 end 131.0 CRUISE_DESCRIPTlIJI STARTDATE EIIl_DATE SCIENTIST
CTD & HYDRO CASTS, PI..ANJ(TIJI TDIS, DRIFTING BU:lY, 19-OCT-Bl 27-OCT-Bl TABATA S CHEM. (PRECIP.)
cio & HYDRO CASTS, PlANKTIJI, DRIFTERS, )(8T'S 18-JAH-B2 29-JAH-82 TABATA S
CTD & HYDRO CASTS, PI..ANJ(TIJI, lOOP DIEM. 15-1IAR-82.26-1IAR-82 TABATA S
CTD & HYDRO CASTS, UXP CHEM., NCAR IU)'(, XBT'S 03-MAY-82 14-MAY-82 TABATA S
CTD & HYDRO CASTS, NEUSTIJI TM, XBT'S 12-JUl-B2 22-JUL-82 TABATA S
CTD & HYDRO CASTS, SEDIMENT TRAPS, PlANKTIJI 17-SEP-82 29-SEP-82 TABATA S
CTD & HYDRO CASTS, SUlFACE OIlS., PlANKTIJI 24-NQV-82 05-DEC-82 TABATA S
CTD & HYDRO CASTS, SEDIMENT TRAPS, PI..ANJCTIJI TM 16-1IAR-83 3O-1IAR-83 TABATA S
CTD & HYDRO CASTS, CM KJalINGS, TIDE GAUGES, 02-MAY-83 2O-MAY-83 TIQISIJI RE IoEATHER IU)'(
CTD & HYDRO CASTS, PlANKTIJI TDIS 2B-JUN-83 16- JUL -83 TIQISIJI RE
Ocean Ecology 83-04
CZO 83-23 (possibly 83-111 OR 83-311) CTD AND HYDRO - \lCY1 - CCDE
CTD & HYDRO CASTS, PlANKTIJI IWJLS, DRI FTERS
CTD & HYDRO CASTS
29-JUN-83 10-JUL-83 DENMAN KL
29-JUN-83 O1-JUL-83 FREELAIII HJ
16-AlJG-83 27-AUG-83 TABATA S
26-APR-84 04-MAY-84 TABATA S
Ocean Ecology 84-02 - Line P I Station P - SlJ'ER 12-MAY-84 2O-MAY-84 DENMAN KL 1
CTD & HYDRO CASTS, CM KJalINGS
CTD & HYDRO CASTS
CTD & HYDRO CASTS, SEDIMENT TRAPS
CTD & HYDRO CASTS, CM IGRINGS
CTD & HYDRO CASTS, DRIFTERS, SEDIMENT TRAPS
CTD & HYDRO CASTS
CTD PROFILES, 04 IGRINGS.
CTD & HYDRO CASTS, CM IGRINGS
CTD PROFilES
lB~JUN-84 3O-,Mj-84 TIQISIJI RE
23-JUl-84 26-JUL-84 TIQISIJI RE
21-AUG-84 31-AUG-84 TABATA S
11-OCT-84 31-OCT-84 TIOISOI RE
ONIOV-84 22-NQY-84 TABATA S
1.1~FEB~85 15-FE8-85 TABATA S
OS-IIAR-85 12-1IAR-85 TIQISIJI RE
29-APR-85 16-MAY-85 TIOISOI RE
09-.MI-85 19-,Mj-85 TIQISIJI RE
Page: 3 LAP DSLI ST • sal VER 1.0
RESULTS printed to file: lep_ds.L1S GEOGRAPHIC_AREA
LINE P, LINE R, \lCY1
LINE P, LINE R
LINE P, LINE R, WCVI
LINE P, LINE R, WCVI
LINE P, LINE R, WCVI
JUAN DE FUCA, LINE P, LINE R
LINE P, LINE R, WCVI
IICQC, LINE P, LINE R, \lCY1
WCVI, QCS, HECATE, \alt, DIXON
DIXIJI, \.'CQC, \lCY1, QCS, LINE P
la Perouse, WCVI, QC Sould, Hecate Str
WCVI - LAPERWSE
WCVI, LINE R, LINE P, QCS
LINE P, LINE R, LINE A, LINE B
LINE P, STN P, NORTHEAST PACIFIC
\lCY1
WCVI
LINE P, LINE A
D IXIJI, \alt, \lCY1
LINE P, LINE J, \lCY1
LINE P
\lCY1
LINE P, WCVI, LINE R
WCVI
~
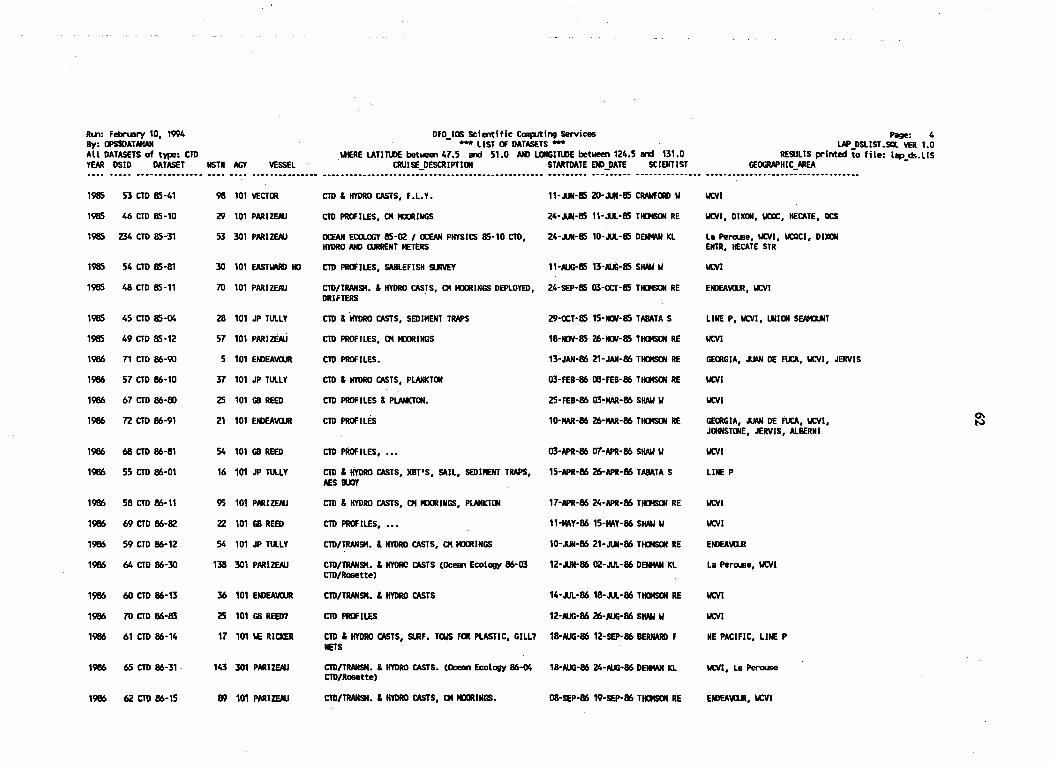
RU1: February 10, 1994 By: OPSIOATNWI All DATASETS of type: CTD YEAR OSlO DATASET NSTN N:r VESSEL
1985 53 CTD 85-41
1985 46 CTD 85-10
1985 Z34 CTD 85-31
1985 54 CTD 85-81
1985 48 CTD 85-11
1985 45 CTD 85-04
1985 49 CTD 85-12
1986 71 CTD 86-90
1986 57 CTD 86-10
1986 67 CTD 86-80
1986 72 CTD 86-91
1986 68 CTD 86-81
1986 55 CTD 86-01
1986 58 CTD 86-11
1986 69 CTD 86-82
1986 59 CTD 86-12
1986 64 CTD 86-30
1986 60 CTD 86-13
1986 70 CTD 86-85
1986 61 CTD 86-14
1986 65 CTD ~86-31 .
1986 62 CTD 86-15
98 101 VECTOR
29 101 PARI ZENJ
53 301 PARIZENJ
30 101 EASTWARD 110
70 101 PARI ZENJ
28 101 JP TUlLY
57 101 PARIzEN.i
5 101 EhDEAVIlJR
37 101 JP TIA.LY
25 101 GB REED
21 101 EhDEAVIlJR
54 101 GB REED
16 101 JP TUlLY
95 101 PARIZENJ
22 101 GB REED
54 101 JP TlA.LY
138 301 PARIZENJ
36 101 EhDEAVIlJR
25 101 GB REED?
17 101 IoE RICICER
143 301 PARIZENJ
f!R 101 PARIZENJ
DFO_IOS Scientific CCJ1fjUting Services - LIST OF DATASETS -
\/HERE LATlTUlE between 47.5 and 51.0 AhD LOIGITlDE between 124.5 and 131.0 CRUISE_DESCRIPTIIII STARTDATE EIIl_DATE SCIENTIST
CTD .. HYDRO CASTS, F.L. Y. 1"'RJN-85 20-..... -85 CRAWFORD "
CTD PROFILES, 04 IUlRINGS 24-JUN-85 1"'u.-85 TI04SQI RE
OCEAN Eca.ooy 85-02 / OCEAN PHYSICS 85-10 CTD, 24-JUN-85 10·JIA.-85 DEIIWI I(l HYDRO AND QJRRENT I'ETERS
CTD PROFILES, SABLEFISH SUIVEY 11-NJG-85 13-AlJ;-85 SHAll "
CTO/TRANSM ... HYDRO CASTS, 04 IUlRINGS DEPLOYED, 24-SEp-85 O3-ocr-85 TI04SQI RE DRIFTERS .
CTD .. HYDRO CASTS, SEDIMENT TRAPS 29-OCT-85 15-Il0'l-85 TABATA S
CTD PROFILES, 04 IUlRINGS 18-Il0'l-85 26-Il0'l-85 TI04SQI RE
CTD PROFILES. 13-JAN-86 21-JAN-86 TI04SQI RE
CTD .. HYDRO CASTS, PlANICTIII 03-FEB-86 OS·FEB-86 TI04SQI RE
CTD PROF ILES .. PLANlCTIII. 25-FEB-86 O3-MAR-86 SHAll "
CTO PROFILES 10·MAR-86 26-MAR-86 TI04SQI RE
CTD PROF ILES, ••• 03-APR-86 07-APR-86 SHAll "
CTO .. HYDRO CASTS, )(BT'S, SAIL, SEOII'ENT TRAPS, 15-APR-86 26-APR-86 TABATA S AES lUll'
CTO .. HYDRO CASTS, 04 IUlRINGS, PLANICTIII 17-APR-86 24-APR-86 TI04SQI RE
CTD PROFILES, ••• 11-MAY-86 15-MAT-86 SHAll "
CTD/TRANSM ... HYDRO CASTS, 04 IUlRINGS 10·JUN-86 2hu-86 TI04SQI RE
CTO/TRANSM ... HYDRO CASTS (Ocean Ecology 86-03 12-JUN-86 02-JlA.-86 DEIIWI I(l
CTD/Rosette)
CTD/TRANSM ... HYDRO CASTS 14-.lJI.-86 18-JlA.-86 TIOISOI RE
CTD PROFILES 12-NJG-86 26-NJG-86 SHAll "
CTD .. HYDRO CASTS, SUlF. TM FOR PLASTIC, GILL? 18-NJG-86 12-SEP-86 BERNARD F NETS
CTD/TRANSM ... HYDRO CASTS. (Ocean Ecology 86-04 18-NJG-86 24-NJG-86 DENMAN I(l CTD/Rosette)
CTD/TRANSM ... HYDRO CASTS, CM IIIORINGS. 08-SEp·86 19-sep-86 TIOISOI RE
Page: 4 IN' DSLIST.SIX. \9 1.0
RE!llLTS printed to file: lip ds.lIS GEOGRAPHIC_AREA -
\lCY1
\lCYI, 01)(111, \IlIC, HECATE, QCS
La Perase, \lCYI, \.OICI, OIltON ENTR, HECATE STR
\lCY1
EhDEAlIOJ!, IICVI
LINE P, \lCYI, UlION SENOJIT
\lCY1
GEORGIA, JUAN DE FUCA, IICVI, JERVIS
\lCY1
\lCY1
GEORGIA, JUAN DE FUCA, IICVI, JOHNSTIIIE, JERVIS, AlBERN I
\lCY1
LINE P
\lCY1
\lCY1
EhDEAlIOJ!
La Perase, IItVI
\lCY1
IICYI
NE PACIFIC, LINE P
IICYI, La Perouse
ENDEAInIt, \lCY1
~

RI.f'I:FebrLllry 10, 1994 By: OPSSOATAMAN All OATASETS of type: CTD YEAR DSID DATASET NSTN AGY VESSEL
1986 56 CTD 86-03
1986 63 CTD 86-16
1987 77 CTD 87-10
1987 87 CTD 87-82
1987 78 CTD 87-11
1987 88 CTD B7-83
1987 73 CTD 87-01
1987 79 CTD 87-12
1987 89 CTD 87-84
1987 86CTD 87-81
1987 85 CTD 87-SO
1987 83 CTD 87-34
1987 84 CTD 87-41
1987 80 CTD 87-13
1987 235 CTD 87·35
1987 90 CTD 87-85
1987 81 CTD 87-14
1987 74 CTD 87-02
1987 82 CTD 87-15
1987 76 CTD 87-04
1988 104 CTD 88-81
1988 99 CTD 88-50
1988 105 CTD 88-82
28 101 PAR I ZEAU~
54 101 PARI ZEAU
57 101 EIIlEA\«JR
21 101 OCEAN KING
42 101 EIIlEA\«JR
40 101
10 101 EIIlEAIoUJR
so 101 JP TlA.LY
30 101
30 101 JP TULLY
11 101 I.E RICKER
13 301 PARIZENJ
35 101 PARI ZEAU
107 101 PARI ZEAU
101 301 PARIZEAU
64 101
86 101E11lEA\«JR
36 101 PARIZENJ
20 101 PARIZEAU
12 101 PARIZENJ
18 101 I.E RICKER
55 101 PARIZEAU
17 101 I.E RICKER
Page: 5 DFO_IOS Scientific ~ing Services ... LIST Of DATASETS "**
WHERE LATlTUlE between 47.5 ard 51.0 NIl La«iITtOE between 124.5 ard 131.0 CRUISE_DESCRIPTICII STARTDATE EIIl_DATE SCIENTIST
LAP OSlIST. SQL VER 1.0 RESULTS printed to fi Ie: l"'UIs.lIS
GEOGRAPHIC_AREA
CTD & HYDRO CASTS, KBT'S, DRIFTERS, PRalUCTIVITY Il-OCT-86 3O-QCT-86 TIDISCII RE \lCYI, LINE P
CTD& HYDRO CASTS, CM IIDIINGS. 09-NOV-86 11-11lV-86 TIDISCII RE \lCY1
CTD/TRANSM. & HYDRO CASTS, CM IIDIINGS, PLANlCTCII ll-FEB-87 19-FEB-87 TIDISCII RE \lCY1
CTD PROFILES (PBS) 15-FEB-87 21-1W1-87 TANASACIllK R \lCY1
CTD/TRANSM. & HYDRO CASTS, CYCLEsaIIE 10-MAR-87 15-1W1-87 TIDISCII RE \lCY1
CTD. PROFILES, SABLEFISH/PLANKTCII (PBS) 14-MAR-87 23-1W1-87 TANASACIllK R \lCY1
CTD & HYDRO CASTS, SEDIMENT TRAPS, XBT'S lO,MAR-87 09-APR-87 TABATA S LINE P
CTD/TRANSM. & HYDRO CASTS, CYCLE!DI;lEIRCM 21-APR-87 28-APR-87 TIDISCII RE \lCY1 IIDIINGS, SAIL
CTD PROFILES (PBS) 26-APR-87 3O-APR-87 TANASACIllK R \lCY1
CRAB SlJIVEY, CTD PROFILES, DRIFTERS 05-MAY-87 23-oUI-87 JAMiESOI G \lCY1
CTD, PLANKTCII (BCIIOO), GILL NETS, LONG LINES, SAIL 26-MAY-87 05-JUl.-87 HARGREAVES B LINE P
CTD & HYDRO CASTS, NET Tas, DRI FTERS, 1Xl2, GEmYNE IUJ'f
27~MAY-87 09-oUI-87 DENMAN KL
CTD CASTS, NEUSTCIIIMILLEII/TIlCKER TOIS, DRIFTERS, 15-JIII-87 26-oUI-87 TIDISCII RE SAIL
CTD/TRANSM. & HYDRO CASTS, CM IIDIINGS, RDI & CTD 29-oUI-87 10-JUl.-87 TIDISCII RE PROFILES
LINE P, NE PACIFIC
\lCY1
\lCYI, EIIlEA\«JR
Ocean Ecology 87-05 CTD/Rosette 14-JUl.-87 23-.u..-87 DENMAN KL 1ICV1, La Perouse
CTD PROFILES (PBS) 21-NJG-87 29-N.Jl-87 TANASACIllK R \lCY1
CTD/TRANSM. & HYDRO CASTS, CM IIDIINGS, RDI 01-SEP-87 12-SEP-87 TIDISCII RE \lCYI, EIIlEA\«JR Da'PLER TEST
CTDITRANSM. & HYDRO CASTS, AES BIllY & DRIFTERS, 22-SEP-87 16-QCT-87 TABATA S LINE P, NE PACIFIC THERMIST<R CHAINS, NUTRIENTS, SAIL, icaT'S
CTD PROFILES, CM IOlRINGS, PRIMARY PRalUCTIVITY 16-NOV-87 19-1IlV-87 TIDISCII RE \lCY1
CTD & HYDRO CASTS,PRmUCTIVITY, SEDII£NT TRAPS 24-NOV-87 09-oeC-87 TABATA S LINE P, NE PACIFIC
CTD PROFILES, SA8LEfISH $LRYEY (PBS) l1-FEB-88 17-fEB-1II SHAll II \lCY1
CTD/TRANSM. PROFILES, IDa> IlIUIENT PROFILEs 15-FEB-BS 18-FEB-BS FREELNIJ HJ \lCY1
CTD PROFILES, XBT, SAllLEflSH SUlVEY 02-MAR-BS 10-MAR-1II SlIM/II \lCY1
0\ 1M

RUl: February 10, 1994 By: OPSSOATAMAN AIIDATASETS of type: CTD YEAR OSlO DATASET NSTN Nrf VESSEL
DFO_I05 Scientific carputi~ Servi~es ... liST OF DATASETS - "
WHERE LATilUlE between 47.5 Ird 51.0 AND llJlGlTlOE between 124.5 Ird 131.0 CJlJlsE_DEsClIPTICrt STARTDATE END_DATE SCIENTIST
Page: 6 lAP DSlIST.SIIl VER 1.0
RE9JlTS printed to file: lap cIs.llS GEOGRAPHIC_AREA --_ .... .. _ .. _"- --- .. ----_ ..... _-_ .. ---- ...... - -..... -... ~ .. :-------- ....... __ .... _------_. __ ........ _-------_ ........ _-_ .... _----_ .......... - ...... --_ ..... - -.......... .; ......... -_ .... -_ .. _-_ .. - .. -----_ ....... ------------- ......... _- ............. ..
1988 106 CTD 88-113
1988 94 CTD 88-11
1988 91 CTD 88-01
1988 100 CTD 88-51
1988 103 CTD 88-80
1988 101 CTD 88-52
1988 9Z CTD 88-OZ
1988 95 CTD 88-12
1988 98 CTD 88-30
1988 108 CTD 88-85
1988 96 CTD 88-14
1988 97 CTD 88-15
1988 IOZ CTD 88-53
1988 93 CTD 88-03
1989 109 CTD 89-01
1989 117 CTD 89-80
1989 237 CTD 89-Bl
1989 112 CTD 89-10
1989 110 CTD 89-OZ
1989 116 CTD 89-50
1989 113 CTD 89-11
1989 Z36 CTD 89-30
40 101 \I: RICKER
108 101 PARIZENJ
41 101 PARIZEAU
T2 101 PAR I ZENJ
9 101 \I: RICKER
50 101 PAR I ZOO
37 101 PARIZENJ
113 101 PARIZENJ
76 101 PARIZENJ
59 101 \I: RICKER
81 101 PARIZENJ
49 101 PARIZENJ
99 101 PARIZENJ
43 101 PARI ZENJ
12 101 JP TUllY
15 101
36 310 IrinoM'I
57 101 PARIZENJ
15 101 PARIZENJ
fR 101 PARIZENJ
43 101 PARI ZENJ
53 301 PARIZENJ
CTD PROFilES, SABlEFISH SlINEY 07-APR-88 '15-APR-88 SHAll II \ltV1
CTD/TRAHSM. & HYDRO CASTS, DRIFTERS, 01 IURINGS 12-APR-88 22-APR-88 TIOISOI RE \ltV1
CTD/TRAH)iM. & HYDRO CASTS, PRIMARY PROO. 02-MAY-88 19-MAY-88 TABATA S LINE P, \ltV1
CTD PROFilES, LORAH DRIFTERS, PLANKTOI, ADI 23-MAY-88 03-.AM-88 FREELAND HJ \ltV1 ,DlPPlER 01, SAil
CTD PROFILES, SAil, lOlGllNE/GlllNET TEST OI-,JUN-88 12-J\A.-88 HARQlEAVES B NE PACIFIC FISHERIES, XBT'S
CTD PROFilES, DRIFTERS, SAil 14-JlII-88 23-.AM-88'CRAliFam loR \ltV1
CTD & HYDRO CASTS, RDI Da'PlER 01, SEARCH FOR 28-JUN-88 14-JUl-88 TABATA S liNE P, \ltV1 NEPCS IO.llING, a2
CTD/TRAHSM. & HYDRO CASTS, RDI IKJ>PlER eM, 14-JUl-88 21-J\A.-88 TIKJolSOI RE \ltV1 DRIFTERS, 01 IO.llING '
CTD/TRAHSM. PROFilES, PlANICTOI, DRIFTERS, KJCP 10-N..IG-88 19-N.JG-88 DEIf4AN KI. \ltVI, laPerouse
CTD PROFILES, QlWllFISH (HAKE) SlINEY 12-AUG-88 15-N.JG-88 WARE 0 \ltV1
CTD/TRAHSM. & HYDRO CASTS' .... 22-N..IG-88 OZ· SEP-88 TIOISOI RE
CTD/TRAHSM. & HYDRO CASTS, eM IO.llING, RDI D<I'PlER 27-SEP-88 07-ocr-88 TIOISOI RE 01
CTDlTRAHSM. PROFilES, SAil, ADI DlPPlER 01, 24-OCT-88 O3-NO'I-88 FREElAND HJ PlANKTCII
eTD ,; HYDRO CASTS, sEDIMENT TRAPS, PRalUCTIVITY 29-IIOV-88 13-DeC-88 TABATA S
CTD & HYDRO UVEYj SAil 13-FE8-89 26- FEB-89 TABATA S
C1'o:'2 PROFILES, LING !XII SI.IRVEY 18-MAR-89 21-MAR-89 RICHARDS L
PBS cruise - AMI. CTD-12 - DATA FRO! BilL SHAll 07-APR-89 17-APR-89 SHAll II
CTD/TRAHSM. & HYDRO CASTS, 01 IO.llINGS, "lENT 18-APR-89 26-APR-89 TIOISOI'RE NPISE DRIFTERS
CTD/TRAHSM. & HYDRO CASTS, RD,I D<PPlER 01, 01-MAY-89 12-MAY-89 TABATA S SEDIIEJIT TRAPS '
CTD/TRAHSM. PROFILES, DRIFTERS, ,PlANKTCII IINJlS 23-MAT-1B 26-MAY-89 FREElAND HJ
CTD/TRAHSM. & HYDRO CASTS, 01 ~INGS 27-MAY-1B O9-JlII-89 TIDISOI RE
ocean Ecology Cruise 89-06 (CTD/Rosette, net taws, 08-N.JG-1B 14-N.JG-89 DEJIIAII KI. BICIIESS etc)
IIVCI, EIllEAIIIlR
\ltV1
\ltV1
LINE P, \ltV1
LINE P
\ltV1
\ltV1
\ltVI" GEORGIA, JJAN DE fUCA
liNE P
\ltV1
\ltVI, Jl.WI De FU:A
laPercuse, \ltV1
~

RI.n: Febrl.llry 10, 1994 DFO_IOS Scientific Ca!puting Services Page: 7 By: OPSSOATAMAN *** LIST Of DAfASETS *** IN'_DSLIST.SCIl VER 1.0 All DATASETS of type: CTO WHERE LATHUlE bet~ 47.5 ard 51.0. All) UJIGI.1U)E between 124.5 rd 131.0 RESULTS printed to file: IIlP_m.lIS YEAR DSID DATASET NSTN AGY VESSel CRUISE_DEScRIPTION . STARTDATE ali_DATE SCIENTIST GE()I;W'HIC_ AREA -................ - ....... _-_ ....... _-_ ........ -... -- -- ..... -----_ ................ _-- ... -,. ........... ---- -_ .... -............................ __ .......... -... _ .. --- -- -_ .......... -------- _ .... _- ... _ ....... ---- --_ .. _ .. _- -- ....... -....................................... ---_ ............... -- ...........
1989 114 CTD 89-12 87 101 PARIZEAlJ CTD/TRAN!iM. & HYDRO CASTS, RDI Da'PLER CM, CM 15-AlJG-89 25-NJG-89 TIDlSaI RE \lCY1 IIXlIINGS .
1989 111 CTD 89-03 22 101 PARIZEAlJ CTD/TRAN!iM. & HYDRO CASTS, SmlMENT TRAP IOIIIINGS, 03-OCT-89 22-ocr-89 TMATA S liNE P RDI IXPPLER CM, CM MlXlIINGS, DRIFTERS, XBT'S
1989 115 CTD 89-13 31 101 PAR I ZEAIJ CTD/TRAN!iM. PROFILES, RD.I DOPPlER CM, CM IIlOIIINGS 22-OCT-89 27-ocr-89 TIDlSaI RE \lCYI, JUAN DE FUCA
1990 120 CTD 90-10 25 101 J P TlA.L Y CTD SURVEY, PlANKTON IWJL 29-JAN-9O 09-FEB-9O TIDlSaI RE \ltV1
1990 129 CTD 90-81 28 101 II E RICKER CTD SURVEY, NET HAUlS 21-MAR-9O 15-DEC-9O SHAll B \ltV1
1990 121 CTD 90-11 104 101 PARI ZEAIJ CM REIXNERY /DEPLO'IIENT, CTD SURVEY 17-APR-9O 24-APR-9O TIDlSaI RE \ltV1
1990 238 CTD 90-31 24 301 PAR I ZEAlJ Ocean Ecology 90-03 CTD/Rosette, JOOFS sedilelt 25-APR-9O OZ-KAY-9O DENKAN I(l \lCYI, LaPerouse, Brooks Peninsula traps/RCM , BIONESS, net tows
1990 118 CTD 90-01 35 101 PARIZEAlJ CTD SURVEY, CM & SEDI"'NT TRAP IURINGS 10-KAY-W 29-KAY-9Q TABATA 5 LINE P REOOIIERY /DEPLOYMENT
1990 122 CTD 90-12 '17 101 PARIZEAlJ CTD & RDI-AIlCP Sl.RVEY, DRIFT NETS, CM lURING 11-.1UN-9O 21-.JIJI-9O TIOISON RE \ltV1 REOOIIERY /DEPLOYMENT 0\
VI 1990 123 CTD 90-13 17 101 PARIZEAIJ CTD QJlVEY 28- ,JUN-9O 13-.1Ul-9O CRAIIfORD ~ HECATE STRAIT, DI XON ENTRANCE
1990 125 CTD 90-30 2 101 \/ESTERLY IIIND CTD SUNEYS IN SII'PORT OF SURFACE WRRENT 05-.A.lL·9O 28-NJG-9O CRAllfORD 1M DIXON ENTRANCE, HECATE STRAIT I£WEMENTS BY LORAN-C DRIFTERS .
1990 239 CTD 90-32 73 301 JP Tll.U Ocean.Ecology 90-04 JOOFS sediment treps, BJ(~SS, 18-.A.lL-9O 25-Jll.-9O D~ I(J. \lCY1 net tows etc.
1990 128 CTD 90-80 46 101 II E RICKER CTD SURVEY, NET IWJlS 26-M-9O 06-Ni;-9O HARGREAVES B \lCY1
1990 126 CTD 90-50 101 PARIZEAIJ CTD & RDI-AIlCP Sl.RVEY, DRIFTER TRACKING 30-M-9O 15-NJG-9O FREElAND H calli SENIClIIT, \lCY1
1990 119 CTD 90-02 13 101 PARIZEAIJ CTO & RD h~DCP Sl.RVEY, ORI FTER TRACKING, CM & 22-AlJG-9O 06-SEP-9O TMATA S LINE P SEDI"'NT TRAP REIXNERY/DEPlO'llENT
1990 124 CTD 90-14 71 101 PARIZEAIJ CTD & RDI-ADCP Sl.RVEY, CM lURING 01-OCT·9012-ocr -90 TIDISON RE \ltV1 REOOIIERY /DEPLOYMENT
1990 240 CTD 90-33 43 301 PARIZEAIJ Ocean Ecology 90·06 end JOOFS sediment treps/rm , 12-OCT-9O 18-ocr-9O DEIIMAN I(J. \lCY1 BIONESS, net tows etc
1991 152 CTD 91-01 11 101 PARIZEAIJ . CTD All) CM lURING ALSO SAIL, 1IM-RDI 07-JAN-91 19-JAN-91 CRAWFORD ~ QC SQJI), \lCY1
1991 171 CTD 91-81 39 101 \I: RIMR HAKE SURVEYS (with CTO's) (PBS 91-03) OZ-FEB-91 27-FEB-91 SHNlERS " lAPERQJSE, IMSIIINGTaI, IJIEGON, CALIFORNIA All) STR OF GEORGIA
1991 1S3 CTD 91-03 43 101 JCHI P TlJ..LY CTD'S, HYDRO'S SAIL - (C0CC91-01) IIJCE REPEAT 19-FEB-91 l1-KAR-91 FREElAND H JIM DE FUCA, LINE P, WCVI, LINE R HYDROG

RIJ"I: February 10, 1994 By: OPSSDATNWI All OATASETS of type: CTD YEAR OSlO DATASET NSTN M;t 1IESSEL
1991 154 CTO 91-04 5 101 PMIZENJ
1991 180 CTD 91-82 2 101 I.E RICKER
1991 In CTO 91-83 4 101 I.E RICKER
1991 155 CTD 9H18 28 101 PMIZENJ
1991 173 cTIi 91-84 4 101 I.E RICKER
1991 174 CTD 91-85 2 101 I.E RICKER
1991 156 CTO 91-10 86 101 PMIZENJ
1991 161 CTO 91-12 f:B 101 PARIZEAIJ
1991 176 CTO 91-87 36 101 IE RICKER
1991 177 CTO 91-1!8 21 101 I.E RICKER
1991 178 CTD 91-89 ill 101 I.E RICKER
1991 163 CTD 91-14 n 101 PARIZENJ
1991 179 CTD 91-90 14 101 I.E RICKER
1991 167 CTO 91-15 12 101 EIClEA\QJR
1992 194 CTD 92-01 12 101 J P nA.LY
1992 199 CTO 92-06 12 101 E/IlEA\OJR
1992 202 CTO 92-10 46 101 JP TULU
1992 206 CTO 92-81 43 312 IE RICKER
1992 204 CTO 92-12 2 101 ENOEA\OJR
1992 216 CTO 92-82 67 312 IE RICKER
OFO_IOS Scientific Ccnputlng Services . .... LIST OF OATASETS .-
WlERE LATIl\.oE between 47.5 ref 51.0 AN) LCllGlruiEbetween 124.5 ref 131.0 CRUISE_DESCRIPTlCII STMTDATE EICljlATE SCIENTIST
cio's , CM MlXRINGS 7, SAIL, RDI 21·FEB-91 25~FEB-91 CRAWFORD \II
ROCKFISH ~VEYS (7) 1'-MAR-91 27-MAR-91 LeNwI iI
HERR I NG SUM:Y (7) (PBS 91-113) "-APR-91 16-APR-91 HAY 0
CTD, HYDRO, IIXRING QEP, SAIL, RDI, PlANICTCII, TEST 29-APR-91 10-MAY-91 FREElANl HJ NEV IlIILDlINE CTO
SHELLFISH (PRMoNS/SHRIM'7) (PBS 91-04) 30-APR-91 1'-MAY-91 8QJTILlIER J
ROCKFISH (7) (PBS 91-05) 23-MAY-91 24-MAY-91 LEAMAN B
CTD, HYDRO,. SAIL, RDI - CRD , lAPElDJSE CM IIXRING 27-MAY-91 07-.Ul-91 T~ RE , PlANICTCII TM
CTD/ADCP/TUClCER TRAWlS, HYDRDS AT VENTS; JOINT 15-JUl-91 26-JlA.-91 TIKJISCW RE CTD ~VEY IIITH HARGREAVES (IE RICKER) lET IIOOY DEl'lOYED I N BARKLEY saHl
Bemard-Sig'lUld trawls for jlM!llile salmon; CTD's 16-JUl-91 01-AUG-91 HARGREA1IES B (PBS 91-07)
lAPERQJSE CTO's AlII PlANKTON TM (PBS 91-08) 14-AUG-91 18-AUG-91 SAlNlERS M
BERNARD-SIIJUIl TRAWlS FOR JlNENiLE SAUIlN; CTD'S 09-SEP-91 26-SEP-91 HARGREAVES B (PBS 91-09)
CRD IIXRINGS, CTO, HOT VENT SCINT lOlliNG REIXIII, 05-OCT -91 IS-OCT -91 TIKJISCW RE HYDRO, lAP IOlIINGS, SAIL, RDI, PlANKTON TM
IWCE ~VEY (7) CTO AlII PlANKTON TM 10-OCT-91 3O-OCT-91 SAlIIlERS M'
CTO; HYDRO, CM DEPlOYlENT (QUIET EDDY) STN P 17-OCT-91 01-NOV-91 FREElANl HJ SEDIJOT TRAPS, TEST ARCTIC CTD PRalE
I.QCE PR"6 REPEAT HYDRCXJW>HY LINE PI STATION P 03-FEB-92 12-FEB-92 FREElANl HJ .CTD'S, HYDRO'S, CO2, IIlTRIENTS
CTDiS AND HYDRDS LINE PI STNP Alia REFERRED TO AS 27-MAR-92 12-APR-92 FREElANl HF 0XC9202
CTD'S, moorlrvs, plriton tOllS,SAIL(7) 14-.Ul-92 21-.Ul-92 TIKJISCW RE
CTD'S, BEAM TRAIl\. FOR .aJ\IEIIILE SAlMlN (PBS 92-06) 16-.Ul-92 02-.0.-92 HARGREAVES B
saJlo tOIlS, HYDRO's coring, dredgll'Q, video 06-JUl-92 23-JIA. -92 TIKJISCW RE
CTD'S, BEM TRAWLS fOR JUVENILE SAIJOI (PBS 30-.0.-92 02-SEP-92 SlUl)ERS M 92-08)
Page: 8 LAP DSlIST. SQl 1IER 1.0
. RESULTS printed to file: lap_ds.lIS GEOGRAPHIC_MEA
QC saHl
STR OG GEORGIA, at saHl, II:VI
STR OF GEORGIA, lAPERQJSE, II:VI
II:VI, LINE P,lINE R,JUAN DE FUCA
lAPERrusE, . Y;YI
lAPERrusE, II:VI, at STAAl T
~, II:VI, QC saHl
EIIlEAIoUIl RIDGE, .AlAN DE FUCA, II:VI
lAPERrusE, II:VI
lAPERrusE, Y;YI
lAPERQJSE, II:VI
JLWI DE FUCA, EIClEAIoUIl RIDGE, II:VI, QC sa.tm, lAPERQJSE
STR OF GEORGIA, lAPERrusE, II:VI, Y:QCI, QC SQJII)
LINE P, NE PACIFIC
LINE P I STATION P
LINE P I STATION P
LaPerClUSe, WCI
·\ltVI, L.APERaJse
ErdeaVOlF Ridge
\ltV1, L.APERQJSE
~

RIrI: February 10, 1994 By: tPSSOATAMAN All OATASETS of type: CTO YEAR OSlO DATASET NSTN NiT VEssel
OFO_IOS sCjentific ~ing Services - LIST OF OATASETS -
IlHERE LATiTLOE between 47.5 an:! 51.0 NIIlOlGm.oE between 124.5 an:! 131.0 CRUISE_OESCRIPTICII STMTDATE EIIlJlATE SCIENTIST
Page: 9 lAP DSlIST.saL VER 1.0
RESULTS printed to file: lap_ds.lIS O:~HIC""AREA
.......... --_.... ..- ......... -_ ....... -_.... .. .. -- ....... - ...... -.......................... .-..................... -_ .......... -_ .... -_ .... --_ .............. -_ ............... -_ ...... _.... .. ........ "--.. _ ...... -_........ ............................... .. -_ .... ---_ ........... --- .. -_ ............................. ..
1992 208 CTO 92·15 13 101 JP TUllY CTO'S, NUTRIENTS, 1Xl2, HYDROS, SEDIMENT TRAPS 09-SEP-92 29-SEP-92 FREElAIIl HJ STN P, LINE P, Z, R, HE PACIFIC
1992 212 CTO 92-85 21 310 WE RICKER CTD, SAl l, SASlEFI SH TRAPS (PBS 92-10) 13-OCT-92 05-101-92 SNMIERS M WDX:I, WCVI, lAPERWSE, GEIIIGIA STR
1992 210 CTO 92-19 81 101 JP TUllY CTD'S, QJlRENT METERS, H1DRas, PlANICTCII, 22-OCT-92 19-101-92 TIOISQI RE WCVI, lAPERQJSE, O:!RGIA STR ZOPLANKTCII MnJSTJ CS (DE 92 -05)
1992 . 214 CTO 92-22 52 101 EIIlEAYI1JR CTO, HYDRas, PLANKTON TOWS (DE 92-(6) 07-oeC-92 l1-DEC-92 IWXAS 0 WCVI, lAPERQJSE
182 rows selected.
SQl> SPOOl OF F;
~

68
5. PUBLICATION LIST
1994
Hargreaves, N.B., D.M. Ware and G.A McFarlane. 1994. Return of Pacific sardine (Sardinops sagax) to the British Columbia coast in 1992: too little, too late? Can. J. Fish. Aquat. Sci. (in press).
Hsieh, W.W., D.M. Ware and RE. Thomson. 1994. Wmd-induced upwelling along the west coast of North America, 1899-1988. Can. J. Fish. Aquat. Sci. (accepted).
Labrecque, M.A, R.E. Thomson, M. Stacey and J. Buckley. 1994. Residual residual currents in Juan de Fuca Strait. Atmos.-Ocean (in press).
LeBlond, P.H., D.A Griffin and RE. Thomson. 1994. Surface salinity variations in Juan de Fuca Strait: Test of a predictive model. Cont. Shelf Res. (in press).
Mackas, D.L. 1994. Interannual variability of the zooplankton community off southern Vancouver Island. in: RJ. Beamish, ed. Climate Change and Northern Fish Populations. Can. Spec. Publ. Fish. Aquatic Sci. 50 (in press).
McFarlane, G.A, M.W. Saunders, RE. Thomson and I. Perry. 1994; Larval distribution and abundance of sablefish, Anoplopoma fimbria, off the west coast of Vancouver Island and the relation to physical oceanography. Proc. Int. symp. on the Biology. and Management of Sablefish. NOAA Technical Rep. Ser. (in press).
Robinson, C.L.K and D.M. Ware. Modelling pelagic fish and plankton trophodynamics off the southwestern coast of Vancouver Island, British Columbia. Submitted to Can. J. Fish. Aquat. Sci.
Ware, D.M. and G.A McFarlane. 1994. Climate-induced changes in Pacific hake (Merluccius productus) abundance and pelagic community interactions the Vancouver Island upwelling system. Can. J. Fish. Aquat. Sci. (in press).
i Willmott, AI., and RE. Thomson. 1994. Application offorced shelf wave dynamics along the coast of British Columbia. J. Phys. Oceano gr. (in press).
1993
Denman, KL., 1993. The ocean carbon cycle and !climate change: an analysis of interconnected scales, p. 213-223, In: S.A Levin, T.M. Powell and J.H.Steele, [eds.], Patch Dynamics, Lecture Notes in Biomathematics, Springer-Verlag,. Berlin.
Denman, K.L, 1993. Upper ocean processes and the global carbon cycle, Physics in Canada, 49, 261-268.
Forbes, J.R and Waters, R.E. 1993. Phytoplankton species composition and abundance along the Pacific coast of Canada, 1979-1989: Volume 1: 1979-1984. Can. Data
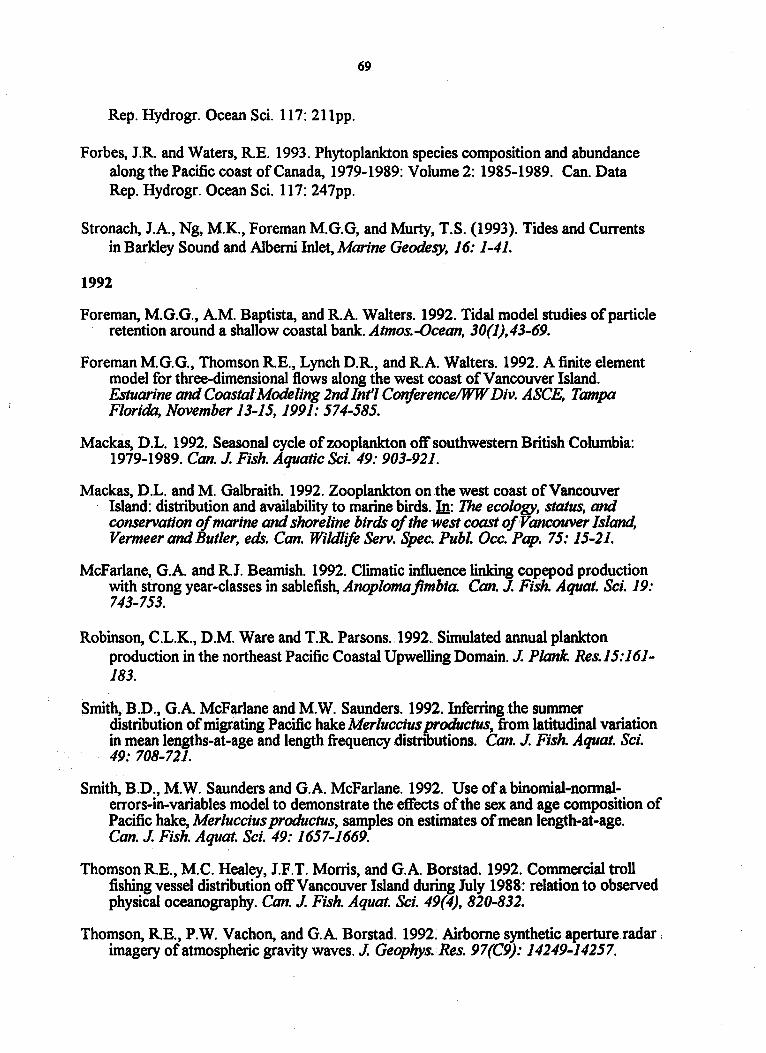
69
Rep. Hydrogr. Ocean Sci. 117: 211pp.
Forbes, J.R and Waters, RE. 1993. Phytoplankton species composition and abundance along the Pacific coast of Canada, 1979-1989: Volume 2: 1985-1989. Can. Data Rep. Hydrogr. Ocean Sci. 117: 247pp.
Stronach, J.A, Ng, M.K., Foreman M.G.G, and Murty, T.S. (1993). Tides and Currents in Barkley Sound and A1bemi Inlet, Marine Geodesy, 16: 1-41.
1992
Foreman, M.G.G., AM. Baptista, and RA Walters. 1992. Tidal model studies of particle retention around a shallow coastal bank. Atmos.-Ocean, 30(1),43-69.
Foreman M.G.G., Thomson RE., Lynch D.R, and RA Walters. 1992. A finite element model for three-dimensional flows along the west coast of Vancouver Island. Estuarine and Coastal Modeling 2nd Int'l ConferencelWW Div. ASCE, Tampa Florida, November 13-15, 1991: 574-585.
Mackas, D.L. 1992. Seasonal cycle of zooplankton off southwestern British Columbia: 1979-1989. Can. J. Fish. Aquatic Sci. 49: 903-92l.
Mackas, D.L. and M. Galbraith. 1992. Zooplankton on the west coast of Vancouver Island: distribution and availability to marine birds. In: The ecology, status, and conservation of marine and shoreline birds of the west coast o/,Vancouverlsland, Vermeer and Butler, eds. Can. Wildlife Servo Spec. Publ. Occ. Pap. 75: 15-2l.
McFarlane, G.A and RJ. Beamish. 1992. Climatic influence linking copepod production with strong year-classes in sablefish, Anoplomajimbia. Can. J. Fish. Aquat. Sci. 19: 743-753.
Robinson, C.L.K., D.M. Ware and T.R Parsons.: 1992 .. ' Simulated annual plankton production in the northeast Pacific Coastal Upwelling Domain. J. Plank. Res.15:161-183.
Smith, B.D., G.A McFarlane andM.W. Saunders. 1992. Inferring the summer distribution of migrating Pacific hake Merluccius productus, from latitudinal variation in mean lengths-at-age and length frequency distnbutions. Can. J. Fish. Aquat. Sci. 49: 708-721.
Smith, B.D., M.W. Saunders and G.A McFarlane. 1992. Use ofa binomial-nonnalerrors-in-variables model to demonstrate the! effects of the sex and age composition of Pacific hake, Merluccius productus, samples on estimates of mean length-at-age. Can. J. Fish. Aquat. Sci. 49: 1657-1669.
Thomson RE., M.C. Healey, J.F.T. Morris, and G.A Borstad. 1992. Commercial troll fishing vessel distribution off Vancouver Island during July 1988: relation to observed physical oceanography. Can. J. Fish. Aquat. Sci. 49(4), 820-832.
Thomson, RE., P.W. Vachon, and G.A Borstad. 1992. Airborne synthetic aperture. radar , imagery of atmospheric gravity waves. J. Geophys.Res. 97(C9): 14249-14257.
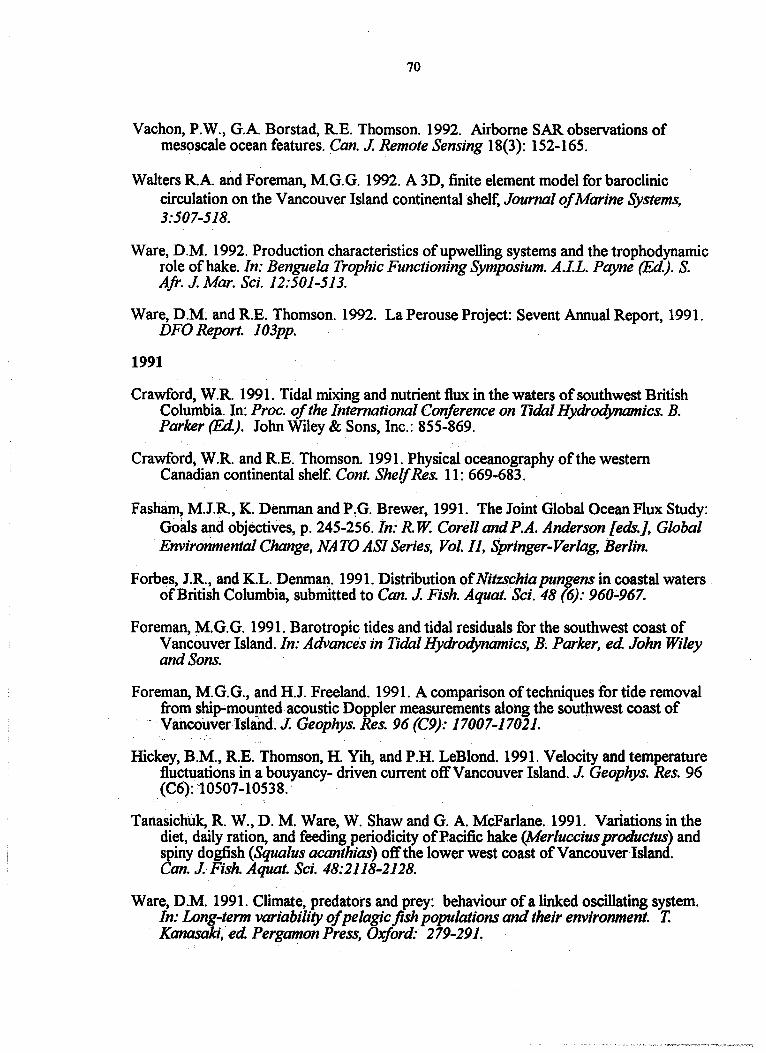
70
Vachon, P.W., G.A. Borstad, RE. Thomson. 1992. Airborne SAR observations of mesoscale ocean features. Can. J. Remote Sensing 18(3): 152-165.
Walters RA. and Foreman, M.G.G. 1992. A 3D, finite element model for baroclinic circulation on the Vancouver Island continental shelf, Journal of Marine Systems, 3:507-518.
Ware, D.M. 1992. Production characteristics of upwelling systems and the trophodynamic role of hake. In: Benguela Trophic Functioning Symposium. A.LL. Payne (Ed). S. Afr. J. Mar. Sci. 12:501-513.
Ware, D.M~ and RE. Thomson. 1992. La Perouse Project: Sevent Annual Report, 1991. DFO Report. 103pp.
1991
Crawford, W.R 1991. Tidal mixing and nutrient flux in the waters of southwest British Columbia. In: Proc. of the International Conference on Tidal Hydrodynamics. B. Parker (Ed). John Wiley & Sons, Inc.: 855-869.
Crawfordt W.R and RE. Thomson. 1991. Physical oceanography of the western Canadian continental shelf Cont. Shelf Res. 11: 669-683.
Fasham, M.IR, K. Denman and P~G. Brewer, 1991. The Joint Global Ocean Flux Study: Goats and objectives, p. 245-256. In.; R. W. Corell and P.A. Anderson [eds.], Global Environmental Change, NATO ASI Series, Vol. /1, Springer-Verlag, Berlin.
Forbes, J.R, and K.L. Denman. 1991. Distribution of Nitzschia pungens in coastal waters of British Columbia, submitted to Can. J. Fish. Aquat. Sci. 48 (6): 960-967.
Foreman, M.G.G. 1991. Barotropic tides and tidal residuals for the southwest coast of Vancouver Island. In: Advances in Tidal Hydrodynamics, B~ Parker, ed John Wiley and Sons.
Foreman, M.G.G., and H.I Freeland. 1991. A comparison of techniques for tide removal from ship"mou!lted acoustic Doppler measurements along the southwest coast of Vancouver;Islahd. J. Geophys. Res. 96 (C9)~· 17007-17021.
Hickey, B.M., RE. Thomson, H. Yih, and P.H. LeBlond. 1991. Velocity and temperature fluctuations in a bouyancy- driven current off Vancouver Island. J. Geophys. Res. 96 (C6):'10507-10538. .
Tanasichuk, R W.,D. M. Ware, W. Shaw and G. A. McFarlane .. 1991. Variations in the diet, daily ration, and feeding periodicity of Pacific hake (Merluccius productus) and spiny dogfish (Squalus acanthi as) off the lower west coast of Vancouver Island. Can. J.Fish. Aquat. Sci. 48:2118-2128.
Ware, D .M. 1991. Climate, predators and prey: behaviour of a linked oscillating system. In: Long-term variability of pelagic fish populations and their environment. T. Kanasaki, ed Pergamon Press, Oxford: 279-291.

71
Ware, D.M. and RE. Thomson. 1991. Link between long-term variability in upwelling and fish productivity. Can. J. Fish. Aquat. Sci. 48:2296-2306.
Ware, D., and RE. Thomson. 1991. La Perouse Project: Sixth Annual Report, 1990. DFO Report. 72p.
1990
Bowden, D.G., RP. Foucher and AV. Tyler. 1990. A guide to the ovarian histology of Pacific Cod. Can. Tech. Rep. Fish. Aquat. Sci. 1723. 44pp.
Crawford, W.R. and RK. Dewey. 1990. Confidence limits for friction velocity determined from turbulence profiles in coastal waters. J. Atmos. Oceanic Technol. 7(1): 50-57.
Denman, K., M.I. Fasham and B. Zeitzschel, 1990. Ioint Global Ocean Flux Study (looFS), 7pp. In: Oceanology International '90, Brighton, March 1990, Vol 1. Civil Applications. Kingston-upon-Thames: Spearhead Exhibitions Ltd (4 Vols).
Foreman, M.G.G., AM. Baptista, P.I. Turner and RA Walters. 1990. Lagrangian studies with a tidal model for the southwest coast of Vancouver Island. In: Computational methods in Surface Hydrology, Proc. of Vllllnternational Conference on ComputationalMethods in Water Resources, Venice, June 11-15, 1990, G. Gambolati et al., eds. Computational Mechanics Publications, Elsevier Press: 177-182.
Foreman, M.G. G., and RA Walters. 1990. A finite element tidal model for the southwest coast of Vancouver Island. Atmos.-Ocean 28(3): 261-287.
Freeland, H.I., 1990. Sea surface temperatures along the coast of British Columbia: regional evidence for a warming trend. Can. J. Fish. Aquat. Sci. 47: 346-350.
Griffin, D.A and P.H. LeBlond. 1990. Estuary/ocean exchange controlled by spring-neap tidal mixing. Est. Coastal Shelf Sci. 30: 275-297.
Healey, M:C., RE. Thomson, and I.F.T. Morris. 1990. The distribution of commercial trawl fishing vessels off southwest Vancouver Island in relation to fishing success and oceanic water properties and circulation, Can.J. Fish. Aquatic Sci. 47: 1846-1864.
Kundo, P.K. andR.E. Thomson. 1990. Inertial oscillations observed near British Columbia; In,' Special Volume o/Pure and Applied Geophysics, R. Hughes,ed: 677-689.
Smith, B.D., G.A McFarlane and M.W. Saunders. 1990. Variation in Pacific hake, Merluccius productus, summer length-at-age near southern Vancouver Island and its relationship to fishing and oceanography. Can. J. Fish. Aquat. Sci. 47: 2195-2211.
Ware, D., and RE. Thomson. 1990. La Perouse Project: Fifth Annual Report, 1989. DFO Report. 65p.
Zellerer, R, D. Krauel, and R Thomson. 1990. Seasonal variability of ocean features at the entrance to Iuan de Fuca Strait. Proc. 24th Annual CMOS congress: 116.
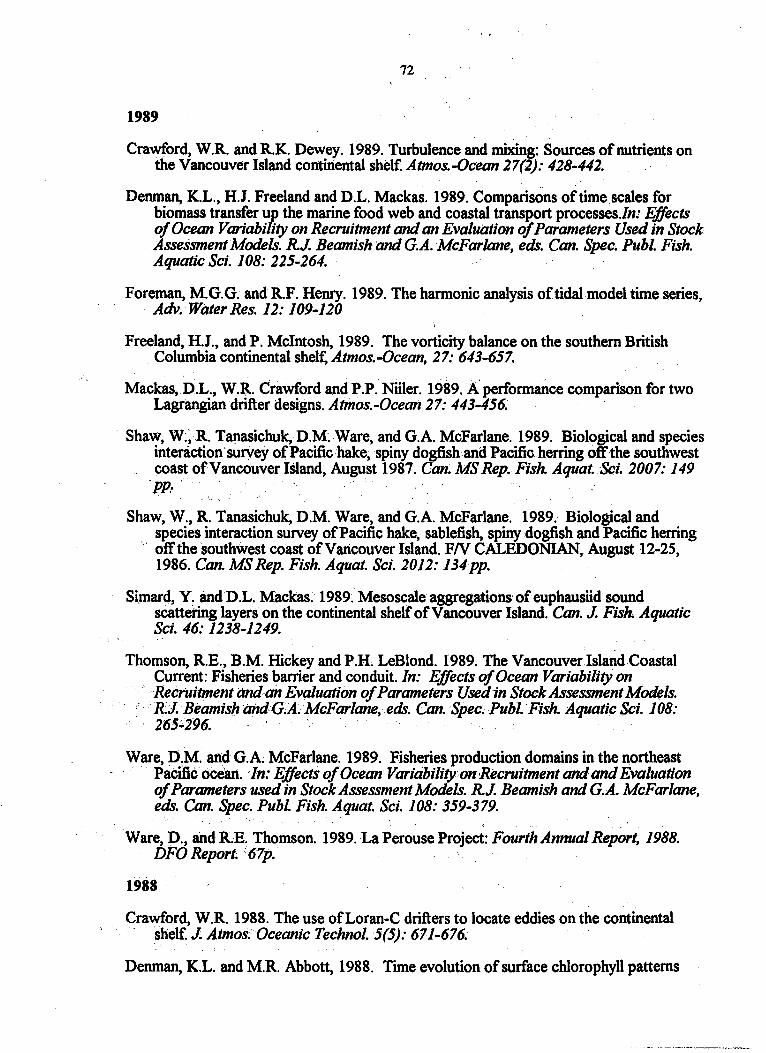
72
1989
Crawford, W.R and RK. Dewey. 1989. Turbulence and mixing: Sources of nutrients on the Vancouver Island continental shelf. Atmos.-Ocean 27(2): 428-442. .'
Denman, K.L., H.J. Freeland and D.L. Mackas. 1989. Comparisons of time scales for biomass transfer up the marine food web and coastal transport processesln: Effects of Ocean Variability on Recruitment and an Evaluation of Parameters Used in Stock Assessment Models. R.J. Beamish and G.A. McFarlane, eds. Can. Spec. Publ. Fish. Aquatic Sci. 108: 225-264.
Foreman, M.G.G. and RF. Henry. 1989. The harmonic analysis of tidal model time series, Adv. Water Res. 12: 109-120 .
Freeland, H.I., and P. Mcintosh, 1989. The vorticity balance on the southern British Columbia continental shelf, Atmos.-Ocean, 27: 643-657.
Mackas, D.L., W.R. Crawford and P.P. Niiler. 1989. A performance comparison for two Lagrangian drifter designs. Aimos.-Ocean 27: 443-456. .
Shaw, W;,R Tanasichuk, D.M; Ware, and G.A. McFarlane. 1989. Biological and species intenicti6n'survey of Pacific hake, spiny dogfish and Pacific. herring off the southwest coast of Vancouver Island~ August 1987. Can. MS Rep. Fish. Aquat. Sci. 2007: 149 pp~
Shaw, W., R Tanasichuk, D.M. Ware, and G.A. McFarlane. 1989.' Biological and species interaction survey of Pacific hake, sablefish, spiny dogfish and Pacific herring
" off the southwest coast of Vancouver Island. FN CALEDONIAN, August 12-25, 1986. Can. MS Rep. Fish. Aquat. Sci. 2012: 134 pp.
Si.mard~ y~ andD.L. Mackas.1989~ Mesoscale aggregations'ofeuphausiid sound scattering layers on the continental shelf of Vancouver Island. Can. J. Fish. Aquatic Sci. 46: 1238-1249.
Thomson, RE., B.M. Hickey and P.H. LeBlond. 1989. The Vancouver.lslandCoastal Current: Fisheries barrier and conduit. In: Effects of Ocean Variability on Recruitment and an Evaluation of Parameters Usedin Stock Assessment Models.
"'RJ.BeamisJr andG~A. McFarlane,eds. Can. Spec.Publ. Fish. Aquatic Sci. 108: 265~296.· ,
Ware, P:M. andG.A. McFarlane~ 1989. Fisheries production domains in the northeast Pacific ocean .. In: Effects of Ocean Variability,onRecruitment and and Evaluation of Parameters used in Stock Assessment Models. R.J. Beamish and G.A. McFarlane, . eds. Can. Spec. Publ. Fish. Aquat. Sci. 108: 359-379.
Ware, D., and RR Thomson. 1989. La Perouse Project: Fourth Annual Report, 1988. DFO Report; .: 67p.
1988 .
Crawford, W.R 1988. The use ofLoran-C drifters to locate eddies on the continental . shelf.J. Atmos.Oceanic Technol. 5(5): 671-676.
Denman, K.L. and M.R Abbott, 1988. Time evolution of surface chlorophyll patterns
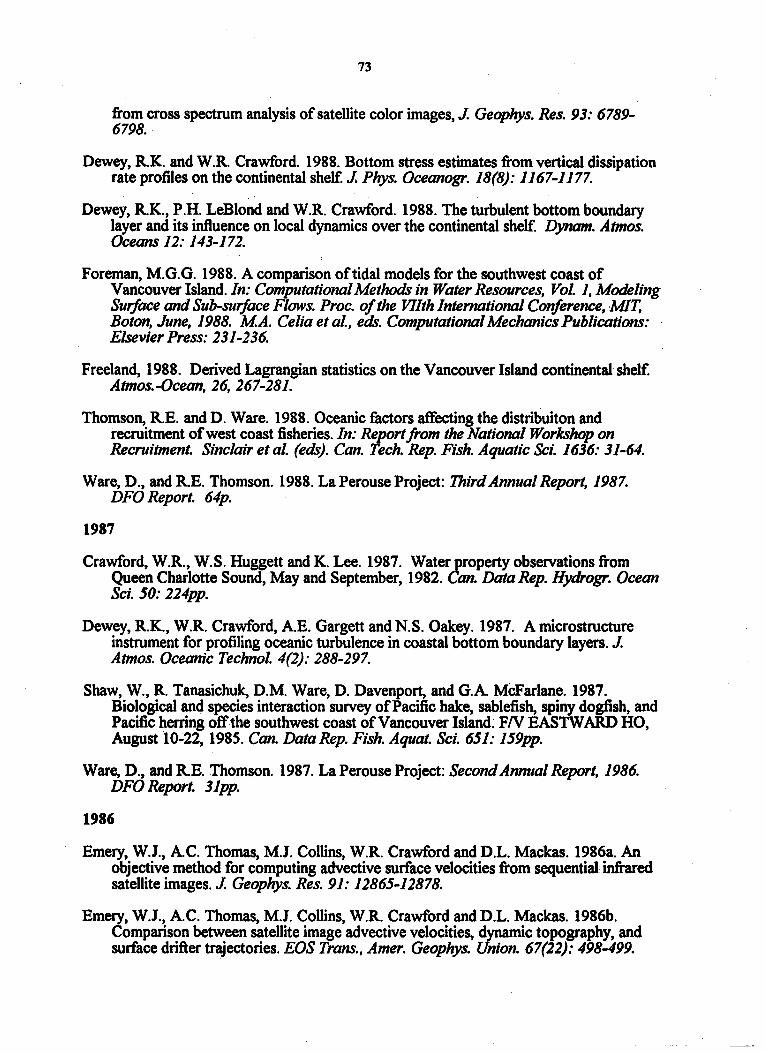
73
from cross spectrum analysis of satellite color images, J. Geophys. Res. 93: 6789-6798.
Dewey, RK. and W.R Crawford. 1988. Bottom stress estimates from vertical dissipation rate profiles on the continental shelf. J. Phys. Oceanogr. 18(8): 1167-1177.
Dewey, RK., P.H. LeBlond and W.R Crawford. 1988. The turbulent bottom boundary layer and its influence on local dynamics over the continental shelf. Dynam. Atmos. Oceans 12: 143-172.
Foreman, M.G.G. 1988. A comparison of tidal models for the southwest coast of Vancouver Island. In: Computational Methods in Water Resources, Vol. 1, Modeling Surface and Sub-surface Flows. Proc. of the VIIth International Conference, MIT, Boton, June, 1988. MA. Celia et al., eds. Computational Mechanics Publications: Elsevier Press: 231-236.
Freeland, 1988. Derived Lagrangian statistics on the Vancouver Island continental shelf. Atmos.-Ocean, 26, 267-281.
Thomson, RE. and D. Ware. 1988. Oceanic factors affecting the distribuiton and recruitment of west coast fisheries. In: Reportfrom the National Workshop on Recruitment. Sinclair et al. (eds). Can. Tech. Rep. Fish. Aquatic Sci. 1636: 31-64.
Ware, D., and RE. Thomson. 1988. La Perouse Project: Third Annual Report, 1987. DFO Report. 64p.
1987
Crawford, W.R, W.S. Huggett and K. Lee. 1987. Water property observations from Queen Charlotte Sound, May and September, 1982. Can. Data Rep. Hydrogr. Ocean Sci. 50: 224pp.
Dewey, R.K., W.R Crawford, AE. Gargett and N.S. Oakey. 1987. A microstructure instrument for profiling oceanic turbulence in coastal bottom boundary layers. J. Atmos. Oceanic Techno/. 4(2): 288-297.
Shaw, W., R Tanasichuk, D.M. Ware, D. Davenport, and G.A McFarlane. 1987. Biological and species interaction survey of Pacific hake, sablefish, spiny dogfish, and Pacific herring off the southwest coast of Vancouver Island. FN EASTWARD HO, August 10-22, 1985. Can. Data Rep. Fish. Aquat. Sci. 651: 159pp.
Ware, D., and RE. Thomson. 1987. La Perouse Project: Second Annual Report, 1986. DFOReport. 31pp.
1986
Emery, W.J., AC. Thomas, M.l Collins, W.R Crawford and D.L. Mackas. 1986a. An objective method for computing advective surface velocities from sequential infrared satellite images. J. Geophys. Res. 91: 12865-12878.
Emery, W.l, AC. Thomas, M.J. Collins, W.R. Crawford and D.L. Mackas. 1986b. Comparison between satellite image advective velocities, dynamic topography, and surface drifter trajectories. EOS Trans., Amer. Geophys. Union. 67(22): 498-499.
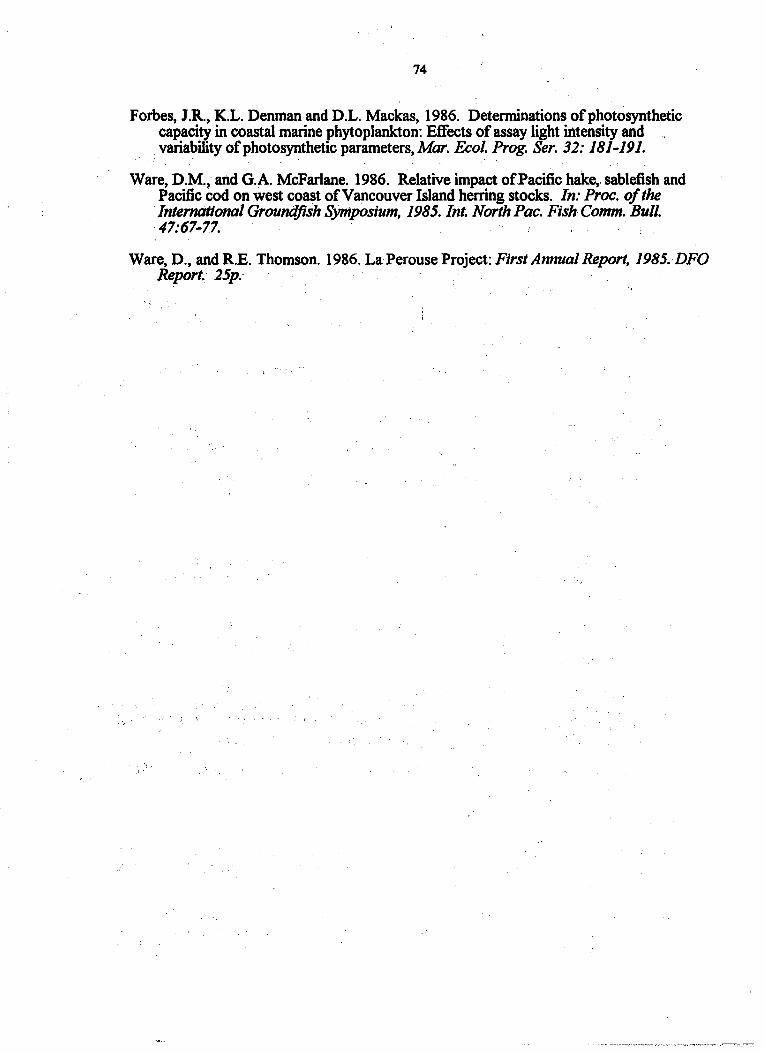
74
Forbes, J.R., K.L. Denman and D.L. Mackas, 1986. Determinationsofphotosynthetic capacity in coastal marine phytoplankton: Effects of assay light intensity and _ variability of photosynthetic parameters, Mar. Ecol. Prog. Ser. 32: 181-191.
Ware, D.M., and G.A. McFarlane. 1986. Relative impact of Pacific hake, sablefish and Pacific cod on west coast of Vancouver Island herring stocks. In: Proc. of the International Groundfish Symposium, 1985. Int. North Pac. Fish Comm. Bull. 47:67-77.
Ware, D., and R.E. Thomson. 1986. LaPerouse Project: First Annual Report, 1985.DFO Report. 25p.
"