eighth external quality assessment scheme for salmonella
TRANSCRIPT

TECHNICAL REPORT
Eighth external quality assessment scheme for
Salmonella typing
www.ecdc.europa.eu
ECDC TECHNICAL REPORT
Eighth external quality assessment scheme for Salmonella typing

ii
This report was commissioned by the European Centre for Disease Prevention and Control (ECDC), coordinated by
Taina Niskanen (ECDC Food- and Waterborne Diseases and Zoonoses Programme), and produced by Susanne Schjørring, Gitte Sørensen, Kristoffer Kiil, Malgorzata Kigowska-Marzeta, Mie B. F. Jensen and Eva Møller Nielsen (Section for Foodborne Infections, Statens Serum Institut, Artillerivej 5, DK-2300 Copenhagen S, Denmark).
Suggested citation: European Centre for Disease Prevention and Control. Eighth external quality assessment scheme for Salmonella typing. Stockholm: ECDC; 2018.
Stockholm, October 2018
ISBN 978-92-9498-269-8 DOI 10.2900/42336 Catalogue number TQ-04-18-835-EN-N
© European Centre for Disease Prevention and Control, 2018
Reproduction is authorised, provided the source is acknowledged.
For any use or reproduction of photos or other material that is not under the EU copyright, permission must be sought directly from the copyright holders.

TECHNICAL REPORT Eighth external quality assessment scheme for Salmonella typing
iii
Contents Abbreviations ................................................................................................................................................ 1 Executive summary ........................................................................................................................................ 2 1 Introduction ............................................................................................................................................... 4
1.1 Background ........................................................................................................................................ 4 1.2 Surveillance of non-typhoidal salmonellosis ............................................................................................ 4 1.3 Objectives .......................................................................................................................................... 5
1.3.1 Pulsed field gel electrophoresis typing ............................................................................................ 5 1.3.2 Multiple locus variable number of tandem repeats analysis typing of S. Typhimurium and S. Enteritidis 5 1.3.3 Molecular typing-based cluster analysis .......................................................................................... 5
2 Study design ............................................................................................................................................... 6 2.1 Organisation ....................................................................................................................................... 6 2.2 Selection of test isolates ...................................................................................................................... 6 2.3 Carriage of isolates .............................................................................................................................. 7 2.4 Testing ............................................................................................................................................... 7 2.5 Data analysis ...................................................................................................................................... 7
3 Results ....................................................................................................................................................... 9 3.1 Participation ....................................................................................................................................... 9 3.2 Pulsed field gel electrophoresis ............................................................................................................. 9
3.2.1 Gel quality ................................................................................................................................... 9 3.2.2 Gel analysis ............................................................................................................................... 11
3.3 Multiple locus variable number of tandem repeats analysis .................................................................... 14 3.3.1 MLVA for S. Typhimurium ........................................................................................................... 14 3.3.2 MLVA for S. Enteritidis ................................................................................................................ 16
3.4 Molecular typing-based cluster analysis ............................................................................................... 18 3.4.1 PFGE-derived data ...................................................................................................................... 18 3.4.2 MLVA-derived data ..................................................................................................................... 19 3.4.3 WGS-derived data ...................................................................................................................... 21
4 Discussion ................................................................................................................................................ 30 4.1 Pulsed field gel electrophoresis ........................................................................................................... 30 4.2 Multiple-locus variable number of tandem repeats analysis ................................................................... 31 4.3 Molecular typing-based cluster analysis ............................................................................................... 31 4.3.1 PFGE-derived data .......................................................................................................................... 32 4.3.2 MLVA-derived data ......................................................................................................................... 32 4.3.3 WGS-derived data .......................................................................................................................... 32
5 Conclusions .............................................................................................................................................. 34 6 Recommendations ..................................................................................................................................... 35
6.1 Laboratories ..................................................................................................................................... 35 6.2 ECDC and FWD-Net ........................................................................................................................... 35 6.3 EQA provider .................................................................................................................................... 35
References .................................................................................................................................................. 36
Figures Figure 1. Participant scores for PFGE gel quality ............................................................................................. 10 Figure 2. TIFF file example of gel with running condition problems and gel that scored excellent ........................ 11 Figure 3. EQA-provided profile ...................................................................................................................... 11 Figure 4. Participant scores for PFGE gel analysis ............................................................................................ 12 Figure 5. Band assignment of profile 13 ......................................................................................................... 13 Figure 6. Participant scores for MLVA typing of the 10 S. Typhimurium test isolates ........................................... 14 Figure 7. Average percentage scores of the 10 S. Typhimurium test isolates ..................................................... 15 Figure 8. Correct MLVA typing of three repeated S. Typhimurium isolates from EQA-4 to 8 ................................. 16 Figure 9. Participant scores for MLVA typing of the 10 S. Enteritidis test isolates ................................................ 17 Figure 10. Average percentage score of the 10 MLVA S. Enteritidis test isolates ................................................. 17 Figure 11. Difference between reported total number of bands (A) and shared bands (B) for each isolate to selected isolates .......................................................................................................................................... 19 Figure 12. Reported MLVA results of each test isolate ..................................................................................... 20 Figure 13. Reported SNP distances or allele differences for each test isolate to selected cluster representative isolate . 24 Figure 14. Minimum spanning tree of core genome multilocus sequence typing, participant FASTQ files .............. 25 Figure 15. Participant allele difference from reference result (EQA provider) for each test isolate ........................ 26 Figure 16. Calculated allele difference between participant and REF isolates compared with selected QC parameters 28

Eighth external quality assessment scheme for Salmonella typing TECHNICAL REPORT
iv
Tables
Table 1. Serovars of test isolates ..................................................................................................................... 6 Table 2. Number and percentage of laboratories submitting results for each method ........................................... 9 Table 3. Results of PFGE gel quality ............................................................................................................... 10 Table 4. Results of PFGE gel analysis ............................................................................................................. 12 Table 5. Results of cluster identification based on PFGE-derived data ............................................................... 18 Table 6. Results of cluster identification based on MLVA-derived data ............................................................... 19 Table 7. Results of cluster identification based on WGS-derived data ................................................................ 21 Table 8. Reported results of SNP-based cluster analysis .................................................................................. 22 Table 9. Reported results of allele-based cluster analysis ................................................................................. 23 Table 10. Participants’ reported quantitative and qualitative parameters ........................................................... 27 Table 11. Results of participants’ raw sequence data evaluated by EQA provider’s QC pipeline ............................ 29
Annexes
Annex 1. List of participants .......................................................................................................................... 37 Annex 2. Participation overview EQA-7 and 8 ................................................................................................. 38 Annex 3. TIFF quality grading guidelines EQA-8 .............................................................................................. 39 Annex 4. BioNumerics gel analysis quality guidelines EQA-8 ............................................................................. 40 Annex 5. PFGE profiles of two test isolates ..................................................................................................... 41 Annex 6. Scores of PFGE results .................................................................................................................... 42 Annex 7. Scores of MLVA results S. Typhimurium ............................................................................................ 43 Annex 8. Scores of MLVA results S. Enteritidis ................................................................................................ 44 Annex 9. EQA provider cluster analysis based on PFGE-derived data ................................................................. 45 Annex 10. EQA provider cluster analysis based on MLVA-derived data .............................................................. 46 Annex 11. EQA provider cluster analysis based on WGS-derived data ............................................................... 47 Annex 12. Reported cluster of closely related isolates based on PFGE-derived data ............................................ 48 Annex 13. Reported PFGE band differences .................................................................................................... 49 Annex 14. Reported sequencing details .......................................................................................................... 50 Annex 15. Reported cluster of closely related isolates based on MLVA-derived data ........................................... 51 Annex 16. Reported MLVA profile data ........................................................................................................... 52 Annex 17. Reported cluster of closely related isolates based on WGS-derived data ............................................ 53 Annex 18. Reported SNP distance and allelic differences.................................................................................. 54 Annex 19. Reported QC parameters ............................................................................................................... 55 Annex 20. Calculated qualitative/quantitative parameters .................................................................................. 56 Annex 21. EQA-8 laboratory questionnaire ..................................................................................................... 60
TECHNICAL REPORT Eighth external quality assessment scheme for Salmonella typing
1
Abbreviations
BN BioNumerics cgMLST Core genome multilocus sequence type wgMLST Whole genome multilocus sequence type EFSA European Food Safety Authority EQA External Quality Assessment EURL European Union Reference Laboratory FWD Food- and waterborne diseases and zoonoses FWD-Net Food- and Waterborne Diseases and Zoonoses Network PFGE Pulsed field gel electrophoresis PH NRL Public health national reference laboratories QC Qualitative control SNP Single nucleotide polymorphism SSI Statens Serum Institut ST Sequence type TESSy The European Surveillance System WGS Whole genome sequence

Eighth external quality assessment scheme for Salmonella typing TECHNICAL REPORT
2
Executive summary
This report presents the results of the eighth round of the external quality assessment (EQA-8) scheme for typing of Salmonella enterica subsp. enterica organised for public health national reference laboratories (PH NRLs) in ECDC’s Food- and Waterborne Diseases and Zoonoses network (FWD-Net). Since 2012, the EQA scheme has covered molecular typing methods used for EU-wide surveillance. The EQA-8 scheme was arranged by the Section for Foodborne Infections at the Statens Serum Institut (SSI) in Denmark and the current EQA represents the first round of a new ECDC-funded contract.
Salmonellosis was the second-most commonly reported zoonotic disease in EU, with a notification rate of 20.4 cases per 100 000 population in 2016. From 2012 to 2016, the annual number of reported salmonellosis cases has been in the range of 92 012–94 597 except for 2013, when 87 453 cases were reported [3]. Since 2007, ECDC's Food- and waterborne diseases and zoonoses (FWD) programme has been responsible for EU-wide surveillance of salmonellosis, including facilitating the detection and investigation of food-borne outbreaks. Surveillance data, including certain basic typing parameters, are reported by Member States to the European Surveillance System (TESSy). In 2012, more advanced and discriminatory molecular typing data were incorporated into TESSy to improve surveillance of food-borne infections.
The reporting of molecular surveillance data relies on the capacity of PH NRLs in FWD-Net to produce comparable typing results. Currently, data from pulsed-field gel electrophoresis (PFGE) and multiple-locus variable number of tandem repeat analysis (MLVA) are collected in TESSy. The previous EQA schemes from EQA-4 to EQA-7 included assessment of the PFGE typing methods for all Salmonella serovars and MLVA for Salmonella Typhimurium (STm). In order to ensure the EQA is contemporary with the development of surveillance methods used by PH NRLs in Europe, EQA-8 contains two new features: assessment of performance of MLVA for S. Enteritidis (SE) and ability to identify a cluster based on molecular typing by PFGE, MLVA and/or whole genome sequencing- (WGS) derived data.
The objectives of the EQA scheme are to assess the quality and comparability of molecular typing data produced by PH NRLs in FWD-Net. Test isolates for the EQA were selected to cover isolates currently relevant for public health in Europe. Four sets of 10 to 12 isolates were selected, including different Salmonella serovars for PFGE, S. Typhimurium and S. Enteritidis isolates for the two MLVA methods and a mixture of different sequence types (ST) in the cluster analysis.
Twenty-five laboratories signed up and 24 completed the exercise despite some only completing part of the methods for which the laboratory had signed up. This is a minor decrease of 8% in overall participation compared with the previous EQA-7. Implementation of the already scheduled removal of the PFGE part (gel quality and analysis) in the coming EQAs will possibly result in a further decrease. A minority (21%) of participants completed the full EQA scheme (PFGE, MLVA and molecular typing-based cluster analysis). In total, 17 (71%) participated in the PFGE part, 13 (54%) in at least one of the MLVA methods (12 for STm and 12 for SE) and 13 (54%) in the molecular typing-based cluster analysis. Eleven (46%) laboratories submitted WGS-based typing results for cluster analysis.
A PFGE gel of sufficiently high quality was produced by the majority of laboratories (14/17; 82%) and almost all (10/11; 91%) made the gel analysis in accordance with guidelines for producing inter-laboratory comparable gels. For both MLVA schemes (STm and SE), the overall performance was high, as nine laboratories of 12 (75%) reported correct allelic profiles for all test isolates in each set. In the new MLVA part for S. Enteritidis, two participants had low scores, as only 40% and 70% of the test isolates were reported with correct allelic profiles.
Out of the twenty-four laboratories participating in EQA-8, 13 (54%) performed molecular typing-based cluster analysis. The idea of the cluster analysis part of the EQA was to assess the PH NRL’s ability to identify a cluster of genetically closely related isolates given the fact that a multitude of different laboratory and analytical methods are used as the primary cluster detection approach in Member States. This part of the EQA was atypical in the sense that the aim was to assess the participants’ ability to reach the correct conclusion, i.e. correctly categorise cluster test isolates, not the ability to follow a specific procedure.
The cluster of closely related S. Enteritidis ST11 isolates could be identified by PFGE, MLVA and WGS-derived data. The expected cluster was based on a predefined categorisation by the organiser and contained seven isolates based on PFGE, five isolates by MLVA and four if the identification was based on WGS-derived data. All four cluster isolates had been part of the multi-country outbreak linked to eggs [7].
Four laboratories used PFGE for cluster analysis and two of them reported a cluster analysis based on WGS data. Only one laboratory did not identify the correct cluster using PFGE. Four laboratories used MLVA for cluster analysis and all also reported a cluster analysis based on WGS data. All laboratories identified the correct cluster using
MLVA.
Performance was high using WGS-derived data for cluster analysis, with 10/11 of the participants (91% correctly identifying the cluster of four closely related isolates. However, one of these laboratories did not report a complete cluster analysis data set due to low sequencing quality for two test isolates. Another laboratory identified a cluster of only three isolates, but indicated that possible inclusion of the fourth isolate should depend on epidemiological information. The participants were free to choose their preferred analytical method for WGS-based cluster
TECHNICAL REPORT Eighth external quality assessment scheme for Salmonella typing
3
identification. The majority of participants preferred a whole core genome multilocus sequence typing (allele-
based) method, with 7/11 (64%) using cgMLST and only 4/11 (36%) using single nucleotide polymorphism (SNP-based) analysis as the main method for cluster analysis. Allele-based and SNP methods seemed equally suitable for cluster identification.
For inter-laboratory comparability and communication about cluster definitions, cgMLST using a standard scheme (e.g. Enterobase) gives a very high degree of homogeneity in the results, whereas the use of non-standardised SNP analysis may be more challenging for comparison and communication between laboratories. This issue is further complicated because many laboratories still use other methods (PFGE or MLVA) and will probably not switch to WGS in the near future.
Eighth external quality assessment scheme for Salmonella typing TECHNICAL REPORT
4
1 Introduction
1.1 Background The European Centre for Disease Prevention and Control (ECDC) is an independent European Union (EU) agency with a mandate to operate dedicated surveillance networks. The mission of ECDC is to identify, assess and communicate current and emerging threats to human health from communicable diseases. ECDC fosters the development of sufficient capacity within the community network for the diagnosis, detection, identification and characterisation of infectious agents that may threaten public health. ECDC maintains and extends such cooperation and supports the implementation of quality assurance schemes [1].
External quality assessments (EQA) are an essential part of laboratory quality management and uses an external evaluator to assess the performance of laboratories on test samples supplied specifically for the purpose.
ECDC’s disease-specific networks organise a series of EQAs for EU/European Economic Area (EEA) countries. EQAs aim to identify areas for improvement in laboratory diagnostic capacities relevant to epidemiological surveillance of communicable diseases as set forth in Decision No 1082/2013/EU [2] and ensure the reliability and comparability of results generated by laboratories across all EU/EEA countries.
The main objectives of the EQA schemes are to:
assess the general standard of performance (‘state-of–the-art’) assess the effects of analytical procedures (method principle, instruments, reagents, calibration) evaluate individual laboratory performance identify and justify problem areas provide continuing education; and identify needs for training activities.
Since 2012, the Section for Foodborne Infections at the Statens Serum Institut (SSI) in Denmark has been the EQA provider for the typing of S. enterica subsp. enterica. Shiga toxin/verocytotoxin-producing Escherichia coli (STEC/VTEC) and Listeria monocytogenes. In 2016, SSI was also granted the new round of tenders (2017 to 2020) for all three lots. The contracted EQA-8 scheme for Salmonella covers PFGE, MLVA typing of both S. Typhimurium and S. Enteritidis and molecular typing-based cluster analysis. This report presents the results of the Salmonella EQA-8.
1.2 Surveillance of non-typhoidal salmonellosis
In 2016, non-typhoidal salmonellosis (later ‘salmonellosis’) was the second-most commonly reported zoonotic disease in the EU, with a total of 94 530 cases reported by the 28 EU Member States (EU notification rate of 20.4 cases per 100 000 population) similar to 2015. As in previous years, the most commonly reported Salmonella serovars were S. Enteritidis, S. Typhimurium, monophasic S. Typhimurium, S. Infantis and S. Derby. In the period 2012 to 2016, the annual number of reported salmonellosis cases was in the range of 92 012 to 94 597, except for 2013, when 87 453 cases were reported [3].
Since 2007, ECDC’s Food- and waterborne diseases and zoonoses (FWD) programme has been responsible for EU-wide surveillance of salmonellosis and facilitating the detection and investigation of foodborne outbreaks. One of the key objectives of the FWD programme is to improve and harmonise the surveillance system in the EU and increase scientific knowledge of aetiology, risk factors and the burden of FWD. The surveillance data, including some basic typing parameters for the isolated pathogen, are reported by Member States to the European Surveillance System (TESSy). In addition to the basic characterisation of the pathogens isolated from human infections, there is a public health value in using more discriminatory typing techniques in the surveillance of foodborne infections. In 2012, ECDC initiated enhanced EU-level surveillance by incorporating molecular typing data into reporting (‘molecular surveillance’). Three priority FWD pathogens were selected for the pilot: Salmonella enterica subsp. enterica, L. monocytogenes and STEC/VTEC. The overall aims of integrating molecular typing data into EU-level surveillance are to:
foster rapid detection of dispersed international clusters/outbreaks facilitate the detection and investigation of transmission chains and relatedness of strains across EU/EEA
Member States and contribute to global outbreak investigations detect emergence of new evolving pathogenic strains support investigations to trace-back the source of an outbreak and identify new risk factors; and aid the study of a particular pathogen’s characteristics and behaviour in a community of hosts.
Molecular typing-enhanced surveillance gives Member State users access to EU-wide molecular typing data for the pathogens included. It also provides users with the opportunity to perform cluster searches and cross-sector
TECHNICAL REPORT Eighth external quality assessment scheme for Salmonella typing
5
comparability of EU-level data to determine whether isolates characterised by molecular typing at the national
level(s) are part of a multinational cluster that may require cross-border response collaboration.
EQA schemes are targeted to public health national reference laboratories (PH NRL) already expected to be performing molecular typing-enhanced surveillance at the national level.
1.3 Objectives
1.3.1 Pulsed field gel electrophoresis typing
The objectives of the Salmonella EQA-8 were to assess the quality of standard PFGE typing and comparability of collected test results among participating laboratories. The exercise focused on the production of high-quality raw PFGE gels, normalisation of PFGE images and band assignment.
1.3.2 Multiple locus variable number of tandem repeats analysis
typing of S. Typhimurium and S. Enteritidis
The Salmonella EQA-8 aimed to determine and ensure the quality and integrity of S. enterica subsp. enterica serovar Typhimurium and serovar Enteritidis MLVA results in the participating laboratory. The MLVA part covered both the laboratory procedure and subsequent data analysis (calibration of raw data into correct MLVA alleles according to the nomenclature [4–5]).
1.3.3 Molecular typing-based cluster analysis
The objective of the molecular typing-based cluster analysis of Salmonella EQA-8 was to assess the ability to detect clusters of closely related isolates. Laboratories could perform the analyses using PFGE, MLVA and/or derived data from WGS.
Eighth external quality assessment scheme for Salmonella typing TECHNICAL REPORT
6
2 Study design
2.1 Organisation The Salmonella EQA-8 was funded by ECDC and arranged by SSI following the requirements in ISO/IEC 17043:2010 [6]. EQA-8 included PFGE of different serovars, MLVA of S. Typhimurium and S. Enteritidis and molecular typing-based cluster analysis. EQA-8 was conducted between September 2017 and March 2018.
Invitations were emailed to ECDC contact points in FWD-Net (30 countries) by 14 June 2017 with a deadline to respond 28 June 2017. In addition, invitations were sent to EU candidate and potential candidate countries Albania, Montenegro, the former Yugoslav Republic of Macedonia, Serbia, Turkey, Bosnia and Herzegovina and Kosovoi.
Twenty-five PH NRLs in the EU/EEA and EU candidate countries accepted the invitation to participate, but only 24 submitted results (Annex 1). Among the 24 participants, one new participant was included. In Annex 2, details of
participation in EQA-7 and EQA-8 are listed to give an overview of the trend in the number of participants.
EQA test isolates were sent to the laboratories on 30 August 2017. The participants were asked to submit their results to an SSH File Transfer Protocol (SFTP) site and complete the online form by 20 November 2017 (Annex 21).
EQA submission protocol, preconfigured BioNumerics (BN) databases, XML export, Excel sheets for the MLVA reference isolates and MLVA allele calling were available at the online site.
2.2 Selection of test isolates
One hundred Salmonella test isolates were selected to fulfil the following criteria:
represent commonly reported isolates in Europe remain stable during the preliminary test period at the organising laboratory
include repeat isolates from EQA-4 through 8; and
include closely related isolates.
The 100 selected isolates were analysed using the methods in the EQA before and after having been re-cultured 10 times. All candidate isolates remained stable using these methods and the final test isolates were selected. The 11 test isolates for the PFGE part were selected to include both ‘easy’ and more ‘difficult’ profiles with double bands. A variety of different serovars relevant for the epidemiological situation in Europe, including recent outbreak isolates of S. Enteritidis [7], were selected (Table 1). For the MLVA part, 10 S. Typhimurium and 10 S. Enteritidis were selected to cover common MLVA profiles (Annexes 7–8). The 12 isolates for cluster analysis were selected to include isolates with different (or varying) relatedness and comprised different multilocus sequence types (ST 10, 11, 183, and 1925). The cluster contained seven isolates if based on PFGE derived data, five if based on MLVA derived data and four isolates (one technical duplicate) if based on WGS-derived data. The characteristics of the test isolates used are listed as Original/REF in Annexes 5 and 7–11.
Table 1. Serovars of test isolates
*: repeat isolates included in EQA-4 to 8. NA: designates a locus not present (-2 by submission, Annex 7).
i This designation is without prejudice to positions on status, and in line with UNSCR 1244/99 and the ICJ Opinion on the Kosovo
Declaration of Independence.
Method Number of test isolates Serovars Annex
PFGE 11 Enteritidis, Infantis*, Kentucky, Newport, O:4,5,12;H:i:-, Oranienburg, Poona*, Szentes, Typhimurium and Virchow
3–6
MLVA S. Typhimurium
10 Typhimurium
*STm6 (3-12-9-NA-211), *STm9 (3-13-NA-NA-211) 7
MLVA S. Enteritidis
10 Enteritidis 8
Cluster 12 Enteritidis (ST11, ST183 and ST1925), Dublin (ST10) 9–20

TECHNICAL REPORT Eighth external quality assessment scheme for Salmonella typing
7
2.3 Carriage of isolates All test isolates were blinded and shipped on 30 August 2017. The protocol for the EQA exercise and a letter stating the unique isolate IDs were included in the packages and distributed individually to participants by e-mail on 29 August as an extra precaution. Twenty participants received their dispatched isolates within one day, three within three days and only two participants received the isolates late after shipment, six and 13 days respectively. The parcels were shipped from SSI labelled as UN 3373 Biological Substance. No participants reported damage to the shipment or errors in the unique specific isolate IDs.
On 20 September 2017, instructions to the submission of results procedure were e-mailed to the participants. This included the links to the online uploading/downloading site and submission form.
At the site, participants should have downloaded the preconfigured BioNumerics (BN) databases with the correct experiment settings (PFGE part), an XML export file and four Excel sheets; a compensatory table for MLVA reference isolates and a sheet for the subsequent calculation of MLVA alleles for both S. Typhimurium and
S. Enteritidis (MLVA part).
2.4 Testing
In the PFGE part, participants could choose to perform the laboratory part only (submit TIFF image of the PFGE gel) or to further complete an analysis of a PFGE profile made by the EQA provider. This change was introduced in order to truly evaluate the band assignment without the influence of the participants’ own gel quality. For the laboratory procedures, the participants were instructed to use the laboratory protocol ‘Standard PulseNet Salmonella PFGE-One-Day (24–28 h) Standardised Laboratory Protocol for Molecular Subtyping of Escherichia coli O157:H7, Salmonella serotypes, Shigella sonnei and Shigella flexneri by Pulsed Field Gel Electrophoresis (PFGE)’ [8]. For the gel analysis, participants were instructed to use the distributed preconfigured BN database and analyse the PFGE gel made by the EQA provider, including normalisation and band assignment. Submission of results included online uploading of PFGE images as either TIFF or XML export files including the BN analysis. Guidelines for setting up the BN database and exporting XML files from BN were included in the EQA submission instruction.
In the MLVA part, the 10 S. Typhimurium and 10 S. Enteritidis test isolates were tested to assess the participants’ ability to obtain the true number of repeats in each of the five MLVA loci for each scheme. The participants were instructed to use ECDC’s laboratory standard operating procedure for MLVA of Salmonella enterica serotype Typhimurium [4] and MLVA of Salmonella enterica serotype Enteritidis [5]. The distributed Excel sheets could be used to convert the measured fragment sizes to true allele numbers based on the results obtained for the 33 S. Typhimurium and 16 S. Enteritidis reference isolates. The allelic profiles should be submitted using the online submission form, -2 was used instead of NA when a locus was missing [4–5].
In the cluster analysis part, the participants could choose to perform the laboratory part using PFGE, MLVA and/or WGS derived data. The participants were instructed to report the IDs of the isolates included in the cluster of closely related isolates by method. A pdf version of the online form was also available for the participants. (Annex 21). If PFGE analysis was conducted, the participant reported the number of shared bands with an isolate that was found as a representative of the cluster. If MLVA was performed, the participants were instructed to report the MLVA scheme used and the number of repeats in each of the loci per isolate.
Laboratories performing WGS could use their own analysis pipeline for the cluster analysis, e.g. SNP-based or allele based and were asked to submit the isolates, identified as cluster of closely related isolates, based on the analysis used. The laboratories could report results from up to three analyses (1 main and 0 to 2 additional), but the detected cluster had to be based on results from the main analysis. The laboratories reported SNP distance or allelic differences between a selected cluster isolate and each test isolate, and uploaded the raw reads (FASTQ files).
2.5 Data analysis
As the participating laboratories submitted their results, the PFGE, MLVA and cluster analysis results, as well as the participants’ uploaded raw reads, were imported to a dedicated Salmonella EQA-8 BN database.
No errors were identified in the submission process, but several participants needed reminders to upload the raw
reads.
PFGE gel quality was evaluated according to a modified version of ECDC’s FWD MolSurv Pilot – ‘SOPs 1.0, PulseNet US protocol PFGE Image Quality Assessment (TIFF Quality Grading Guidelines EQA-7, Annex 3)’ – by scoring the gel according to seven parameters (scores in the range of 1 to 4). The BN analysis was evaluated according to the ‘BioNumerics Gel Analysis Quality Guidelines EQA-8’ developed at SSI (Annex 4) to grade the BN analysis according to five parameters (scores in the range of 1–3). A score of 1 [Poor] in any of the parameters in the two guidelines corresponded to a gel analysis that could be used for inter-laboratory comparison. The BioNumerics Gel Analysis

Eighth external quality assessment scheme for Salmonella typing TECHNICAL REPORT
8
Quality Guidelines were slightly modified from EQA-7, giving a more accurate evaluation of the band assignment
(Annex 4).
The MLVA results were evaluated according to the percentage of correctly assigned allelic profiles generating a score from 0 to 100% correct profiles.
The molecular typing-based cluster analysis part was evaluated according to correct or incorrect identification of the cluster of closely related isolates based on a predefined categorisation by the EQA provider.
The EQA provider’s PFGE results were based on XbaI profiles and included seven of the 12 test isolates (REF1, REF2, REF3, REF4, REF6, REF9 and REF11; REF2 and REF11 were technical duplicates). The EQA provider’s MLVA results were based on the S. Enteritidis scheme [5] and included five ST11 isolates: REF1, REF2, REF4, REF9 and REF11 with the MLVA profile 2-9-7-3-2. The EQA provider’s cluster analysis based on WGS-derived data was based on an allele-based (cgMLST, [9]) and SNP analysis (NASP, [10]). The correct number of closely related S. Enteritidis isolates were four out of the 12 isolates (REF2, REF4, REF9 and REF11) and all four were part of an European S. Enteritidis outbreak [7]. The EQA provider found at most a 0–3-allele difference or 0–6 SNP distances between any two isolates in the cluster. The rest of the cluster test isolates were an additional five ST11 isolates, one ST10, one ST183 and one ST1925.
Individual evaluation reports were distributed to the participants in the beginning of March 2018 and certificates of attendance in April 2018. If WGS data were used, the evaluation report included a quality assessment made by the EQA provider’s in-house quality control pipeline (e.g. coverage, N50, sequence length and number of contigs). The evaluation report did not include an evaluation based on quality thresholds.

TECHNICAL REPORT Eighth external quality assessment scheme for Salmonella typing
9
3 Results
3.1 Participation The laboratories could participate in either the full EQA scheme or one part only (PFGE quality, PFGE analysis, MLVA S. Typhimurium, MLVA S. Enteritidis and/or molecular typing-based cluster analysis based on PFGE, MLVA and/or WGS-derived data). Out of the 25 participants who signed up for the exercise, 24 managed to complete and submit their results. Only five laboratories completed PFGE, MLVA (STm and/or SE) and molecular typing-based cluster analysis (PFGE, MLVA and/or WGS). Most laboratories participated in the PFGE part, where 17 (71%) laboratories produced a PFGE gel image, and 11 of them also completed the analysis of the provided PFGE gel. Thirteen (54%) laboratories participated in the MLVA part, 12 out of 13 (92%) submitted results of the S. Typimurium test isolates and 12 (92%) laboratories submitted results of the S. Enteritidis test isolates. Thirteen laboratories (54%) participated in the cluster analysis part and most of them (11, 85%) reported cluster analysis based on WGS-derived data. Two participants (15%) reported cluster identification using only PFGE data. Furthermore, two participants submitted cluster data based on both MLVA and WGS and two participants reported the cluster using all three methods (Table 2).
Table 2. Number and percentage of laboratories submitting results for each method
PFGE MLVA Cluster All
Gel+ analysis
Gel only Total STm only
SE only
Both Total PFGE only
WGS only
MLVA + WGS
All Total Total
Number of participants
11 6 17 1 1 11 13 2 7 2 2 13 24
Percentage of participants
65% 35% 71%* 8% 8% 85% 54%* 15% 54% 15% 15% 54%* -
Five participants (21%) completed both PFGE, MLVA and cluster analysis of the EQA scheme. Eight participants (33%) completed both PFGE and MLVA. Nine participants (34%) completed both MLVA and cluster analysis of the EQA scheme. None of the laboratories participating in the cluster analysis used only MLVA. *: Percentage of the total number of participating laboratories (24) STm: S. Typhimurium
SE: S. Enteritidis.
3.2 Pulsed field gel electrophoresis Seventeen laboratories (71%) produced a PFGE gel image and 11 of them also analysed the PFGE profile made by the EQA provider and thus submitted the analysed data in XML export format.
Annex 5 shows the profiles generated by the laboratories for two selected test isolates, PFGE C and H, including the profile produced by the EQA provider.
3.2.1 Gel quality
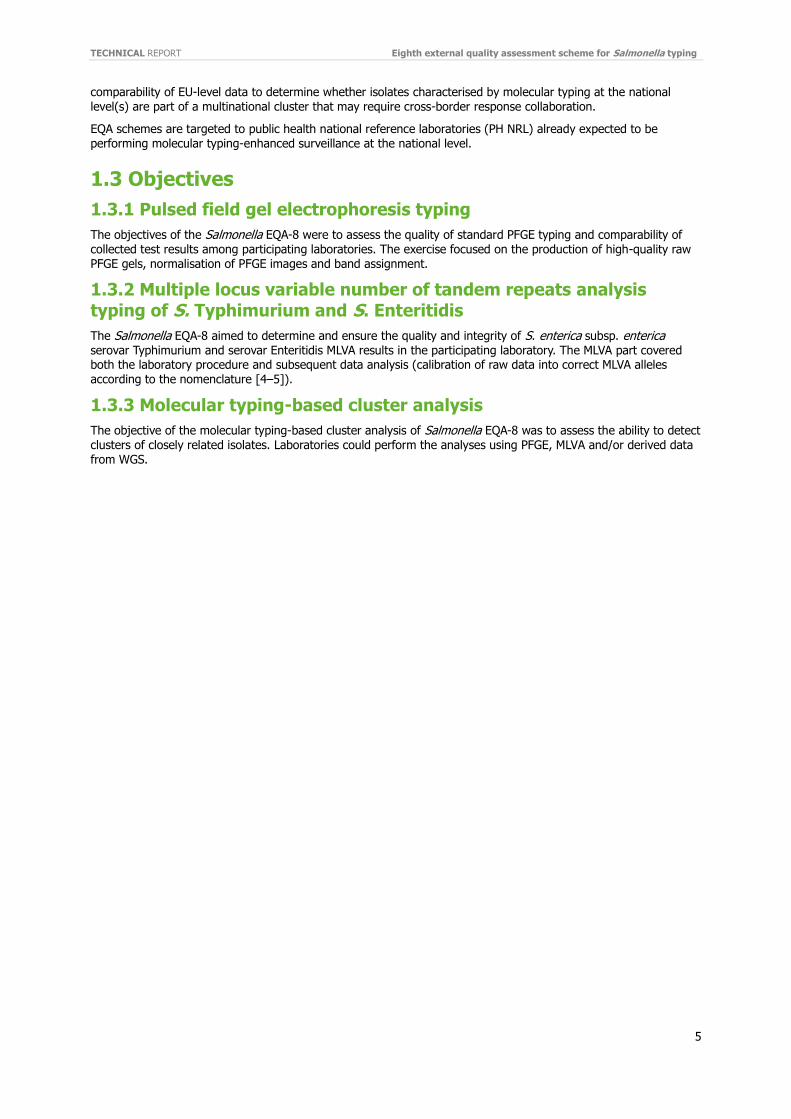
Gel quality varied considerably among the laboratories (Figure 1) based on a highly variable quality of the profiles for the individual test isolates (Annex 5). Gels were graded according to the TIFF Quality Grading Guidelines EQA-8, evaluating seven gel parameters using four scores from 1 to 4 (Annex 3). An acceptable gel quality (score of 2 [Fair] or better) should be achieved in each parameter since a low quality score of 1 [Poor] in just one parameter would have an impact on the ability to further analyse the image and compare profiles across laboratories. It is important to note that since a score of 1 in any parameter reflects an unacceptable gel that is incomparable on an inter-laboratory basis, the total gel quality score alone cannot be used as a measure for quality.
Fourteen (82%) of the participating laboratories were able to produce a gel of sufficient quality to enable profile detection and inter-laboratory comparison (Figure 1, Annex 6). Laboratories 96 and 130 produced gels with bands that were too fuzzy and laboratory 138 had incorrect running conditions, restriction and DNA degradation issues that made them not acceptable for inter-laboratory comparison. Only laboratory 147 produced a gel of excellent quality with respect to all parameters.
Eighth external quality assessment scheme for Salmonella typing TECHNICAL REPORT
10
Figure 1. Participant scores for PFGE gel quality
Participating laboratories represented by arbitrary numbers. Bars represent the total as a percentage of the maximum score of 28 points, according to evaluation of the gels using seven parameters graded 1–4. *: gels unacceptable for inter-laboratory comparison, score of 1 [Poor] in at least one parameter.
Table 3 shows the seven gel parameters, evaluated by the TIFF Quality Grading Guidelines EQA-8 (Annex 3), the percentage of laboratories scoring 1–4 and the average score for all laboratories. In general, the average score was above 3 (i.e. between good and excellent). However, one parameter (‘DNA Degradation’), obtained an average score just below 3 (i.e. between fair and good) and only a minor percentage (29%) of the laboratories were able to obtain an Excellent [4] score. Furthermore, one gel (laboratory 138) unsuitable for inter-laboratory comparison obtained a score of 1 [Poor] in the parameters ‘Image acquisition and running conditions’, ‘Restriction’ and ‘DNA degradation’. Two additional laboratories (96 and 130) also obtained a score of 1 [Poor] in the parameter ‘Bands’. On average, the majority of the laboratories (11/17; 65%) obtained 3 [Good] or 4 [Excellent] in all parameters, reflecting a generally good gel performance (Table 3). None of the parameters evaluates the number of included reference lanes in the produced gel. Four laboratories disregarded the very important factor of including a reference lane for every 3 to 4 (maximum 5) test isolates.
Table 3. Results of PFGE gel quality
Grade [score in points] XbaI
Parameter 1 [Poor] 2 [Fair] 3 [Good] 4 [Excellent] Average
Image acquisition and running conditions 6% 0% 53% 41% 3.3
Cell suspension 0% 12% 29% 59% 3.5
Bands 12% 12% 35% 41% 3.1
Lanes 0% 0% 59% 41% 3.4
Restriction 6% 6% 6% 82% 3.6
Gel background 0% 18% 35% 47% 3.3
DNA degradation 6% 24% 41% 29% 2.9
The average score and the percentage of laboratories obtaining scores 1–4 in the seven TIFF Quality Grading Guidelines parameters.
0%
20%
40%
60%
80%
100%
147 92 36 106 134 142 127 19 128 55 145 140 100 144 96 130 138
Laboratory no.
**
*

TECHNICAL REPORT Eighth external quality assessment scheme for Salmonella typing
11
Figure 2 shows gels of varying quality with low and high scores in the parameter ‘Bands’ in this EQA.
Figure 2 (left) shows a gel with a score of 1 [Poor] in ‘Bands’ due to the fuzziness of the bands. The comparison with a gel with a high score in the same parameter shows how clear bands affect the possibility of correct band assignment.
Figure 2. TIFF file example of gel with running condition problems and gel that scored excellent
A: gels with fuzzy bands scoring 1 [Poor] in the parameter bands. B: gel scoring 4 [Excellent] in all parameters.
3.2.2 Gel analysis
BioNumerics (BN) is a software initially developed for PFGE gel analysis. One of the critical steps in analysis is the normalisation of the gel, but all steps in the analysis impact the final profiles and thereby possibility of performing an inter-laboratory comparison. To ensure identical experimental settings in BN, the EQA provider distributed preconfigured BN databases to the participants. Despite the analysis part being separate from the gel quality part, the parameter ‘Band assignment´ has been dependent on the participants’ gel quality in previous EQAs. In order to standardise and systematically compare the band assignment, a new approach was introduced in EQA-8 and the participants were tasked with analysing a PFGE TIFF file with excellent quality provided by the EQA provider (Figure 3).
Figure 3. EQA-provided profile
SB: S. Braenderup position in lanes 1, 5, 10 and 15.
Eleven laboratories (65%) analysed the provided PFGE TIFF file in BN and were able to produce XML export files according to the protocol. No resubmission of results was necessary. The participants’ ability to perform gel analysis was graded according to the updated BioNumerics Gel Quality Grading Guidelines EQA-8. The grading was made for five parameters with scores ranging from 1–3 (Annex 4).
Compared to the varying gel quality observed among the participants, the quality of the gel analysis was more even and demonstrated a very high quality performance (Figure 4). Laboratories 19 and 36 produced a gel analysis
A B
SB 2 3 4 SB 6 7 8 9 SB 11 12 13 14 Size marker
-1135
-668.9
-452.7 -336.5
-244.4
-138.9
-78.2
-33.3
-398.4
-310.1
-216.9
-104.5
-54.7

Eighth external quality assessment scheme for Salmonella typing TECHNICAL REPORT
12
with ’excellent’ [3] quality in all parameters including the new more challenging band assignment. Laboratories
142, 147, 55, 100 and 134 achieved a total score of 14 of the maximum 15 points (93%) (Figure 4, Annex 6).
Figure 4. Participant scores for PFGE gel analysis
Participating laboratories are represented by arbitrary numbers. Bars represent the total as a percentage of the maximum score of 15 points according to gel analysis evaluation using five parameters graded 1–3. *: gels unacceptable for inter-laboratory comparison, score of 1 [Poor] in at least one parameter.
Table 4 shows the five gel analysis parameters evaluated using the BioNumerics Gel Quality Grading Guidelines EQA-8, the percentage of laboratories scoring 1–3 and the average score for all laboratories.
Ten out of the 11 laboratories performed a gel analysis of 2 (fair) to 3 (excellent) quality (Table 4). Laboratory 128 made an unusual error: mixing inverted and not inverted TIFF in the submission, which also resulted in incorrect normalisation. This average level is on a par with the level of the previous EQA (Table 4, Annex 6). In the previous EQAs, the quality of the band assignment was graded according to the quality of the gel, i.e. a laboratory producing a gel that could not be used for inter-laboratory comparison in terms of gel quality could still achieve an ”excellent” score in the BN analysis. In this EQA, the band assignment criteria were slightly changed in order to fully assess the quality of the band assignment (Annex 4). The parameter band assignment obtained the lowest average score of 2.2, but no laboratory scored 1 [Poor] even with these changes.
Table 4. Results of PFGE gel analysis
Grade [score in points]
Parameter Poor [1] Fair [2] Excellent [3] Average
Position of gel frame 9% 18% 73% 2.6
Strips 0% 18% 82% 2.8
Curves 0% 18% 82% 2.8
Normalisation 9% 0% 91% 2.8
Band assignment 0% 82% 18% 2.2
Average scores and percentage of laboratories obtaining scores 1–3 for the five BioNumerics Gel Analysis Quality Guidelines parameters.
TECHNICAL REPORT Eighth external quality assessment scheme for Salmonella typing
13
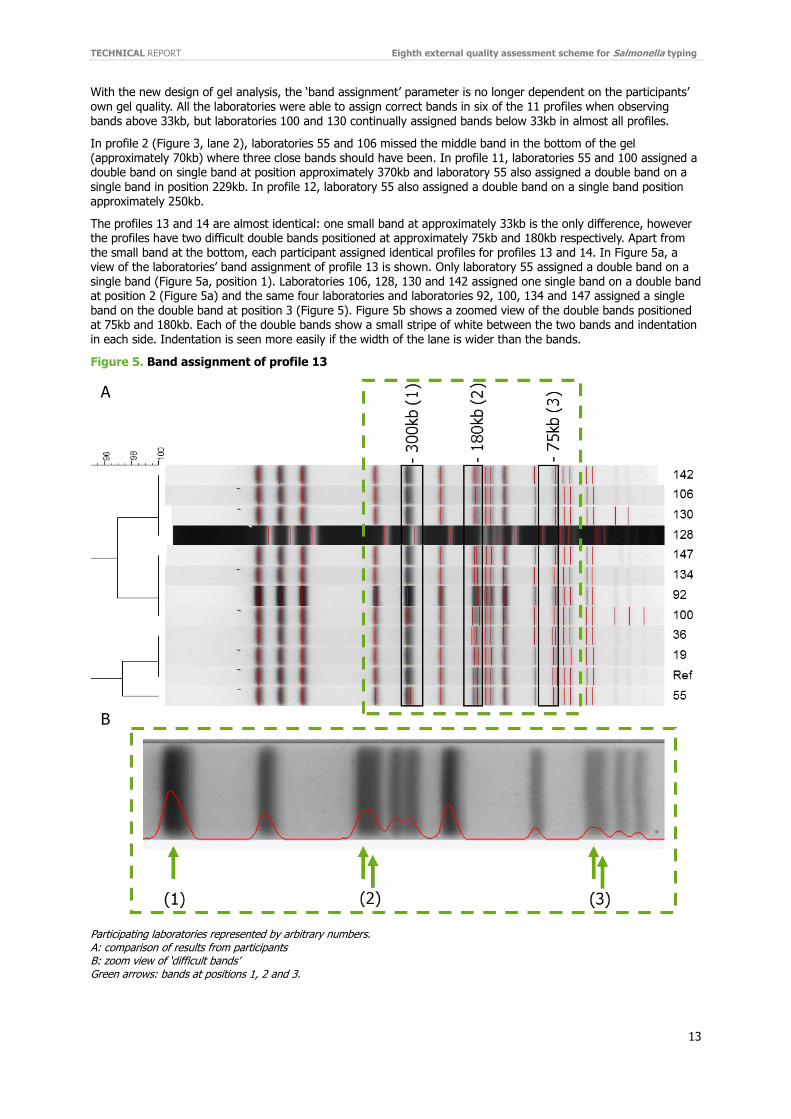
With the new design of gel analysis, the ‘band assignment’ parameter is no longer dependent on the participants’
own gel quality. All the laboratories were able to assign correct bands in six of the 11 profiles when observing bands above 33kb, but laboratories 100 and 130 continually assigned bands below 33kb in almost all profiles.
In profile 2 (Figure 3, lane 2), laboratories 55 and 106 missed the middle band in the bottom of the gel (approximately 70kb) where three close bands should have been. In profile 11, laboratories 55 and 100 assigned a double band on single band at position approximately 370kb and laboratory 55 also assigned a double band on a single band in position 229kb. In profile 12, laboratory 55 also assigned a double band on a single band position approximately 250kb.
The profiles 13 and 14 are almost identical: one small band at approximately 33kb is the only difference, however the profiles have two difficult double bands positioned at approximately 75kb and 180kb respectively. Apart from the small band at the bottom, each participant assigned identical profiles for profiles 13 and 14. In Figure 5a, a view of the laboratories’ band assignment of profile 13 is shown. Only laboratory 55 assigned a double band on a single band (Figure 5a, position 1). Laboratories 106, 128, 130 and 142 assigned one single band on a double band at position 2 (Figure 5a) and the same four laboratories and laboratories 92, 100, 134 and 147 assigned a single
band on the double band at position 3 (Figure 5). Figure 5b shows a zoomed view of the double bands positioned at 75kb and 180kb. Each of the double bands show a small stripe of white between the two bands and indentation in each side. Indentation is seen more easily if the width of the lane is wider than the bands.
Figure 5. Band assignment of profile 13
Participating laboratories represented by arbitrary numbers. A: comparison of results from participants B: zoom view of ‘difficult bands’ Green arrows: bands at positions 1, 2 and 3.
A
B

Eighth external quality assessment scheme for Salmonella typing TECHNICAL REPORT
14
3.3 Multiple locus variable number of tandem repeats analysis For the first time in ECDC EQA history, MLVA for S. Enteritidis was included in the EQA. In total, 13 laboratories (54%) participated in the MLVA part of the EQA, 12 (92%) in MLVA for S. Typhimurium and 12 (92%) in MLVA for S. Enteritidis. Laboratory 36 participated only in MLVA S. Typhimurium and laboratory 55 only in MLVA S. Enteritidis (Annex 2).
3.3.1 MLVA for S. Typhimurium
Twelve out of the 24 participants in EQA-8 (50%) performed the MLVA typing of S. Typhimurium, and nine (75%) of these reported the correct allelic profiles for all ten test isolates (Figure 6).
Laboratory 144 had two errors, both missing the presence of a fragment in locus STTR3. In EQA-5, laboratory 144 had the same mistake and also missed a locus fragment for STTR3 for two different test isolates. Laboratories 134
and 147 had one error each, both reporting a fragment in absent loci (STTR6 and STTR10 respectively).
Figure 6. Participant scores for MLVA typing of the 10 S. Typhimurium test isolates
Arbitrary numbers represent the participating laboratories. Bars represent the number of correctly assigned MLVA profiles.
The results for each test isolate are summarised in Figure 7. The correct MLVA profile was reported for six of the 10 S. Typhimurium test isolates by all participants. No common isolate characteristics caused the problems (Annex 7) as the four incorrect MLVA profiles concerned four different isolates (STm1, 5, 6 and 8).
TECHNICAL REPORT Eighth external quality assessment scheme for Salmonella typing
15
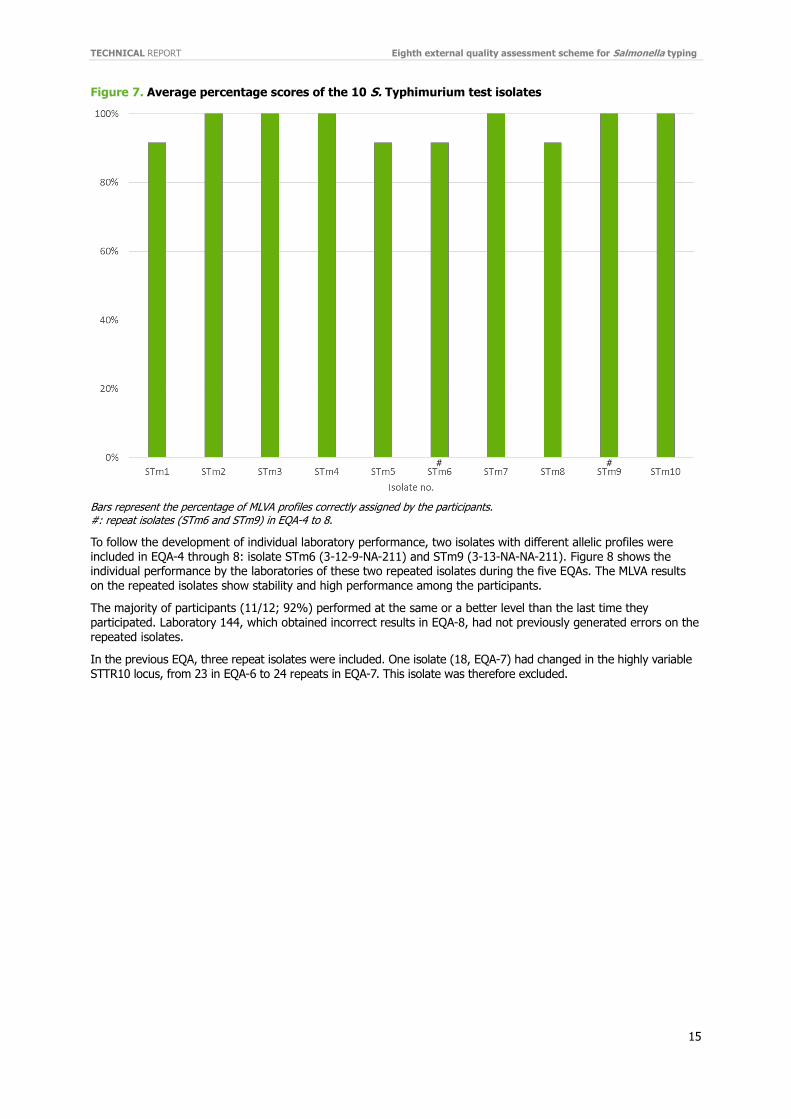
Figure 7. Average percentage scores of the 10 S. Typhimurium test isolates
Bars represent the percentage of MLVA profiles correctly assigned by the participants. #: repeat isolates (STm6 and STm9) in EQA-4 to 8.
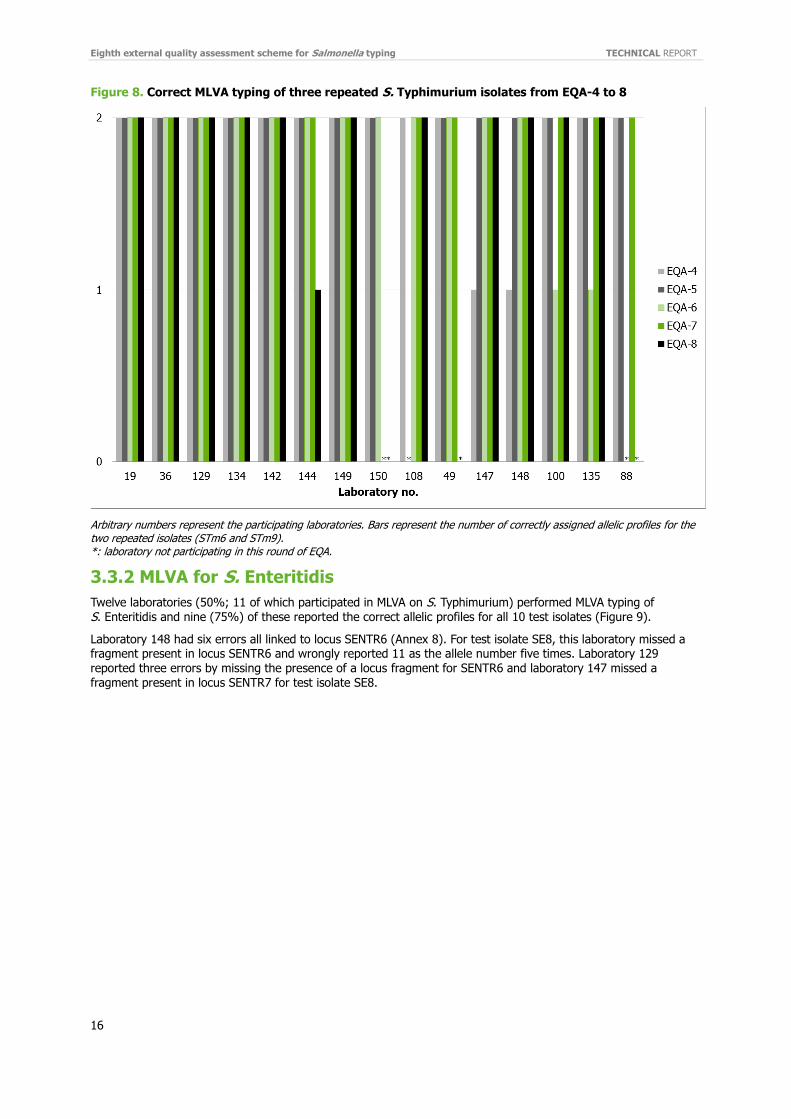
To follow the development of individual laboratory performance, two isolates with different allelic profiles were included in EQA-4 through 8: isolate STm6 (3-12-9-NA-211) and STm9 (3-13-NA-NA-211). Figure 8 shows the individual performance by the laboratories of these two repeated isolates during the five EQAs. The MLVA results on the repeated isolates show stability and high performance among the participants.
The majority of participants (11/12; 92%) performed at the same or a better level than the last time they participated. Laboratory 144, which obtained incorrect results in EQA-8, had not previously generated errors on the repeated isolates.
In the previous EQA, three repeat isolates were included. One isolate (18, EQA-7) had changed in the highly variable STTR10 locus, from 23 in EQA-6 to 24 repeats in EQA-7. This isolate was therefore excluded.
# #
Eighth external quality assessment scheme for Salmonella typing TECHNICAL REPORT
16
Figure 8. Correct MLVA typing of three repeated S. Typhimurium isolates from EQA-4 to 8
Arbitrary numbers represent the participating laboratories. Bars represent the number of correctly assigned allelic profiles for the two repeated isolates (STm6 and STm9). *: laboratory not participating in this round of EQA.
3.3.2 MLVA for S. Enteritidis
Twelve laboratories (50%; 11 of which participated in MLVA on S. Typhimurium) performed MLVA typing of S. Enteritidis and nine (75%) of these reported the correct allelic profiles for all 10 test isolates (Figure 9).
Laboratory 148 had six errors all linked to locus SENTR6 (Annex 8). For test isolate SE8, this laboratory missed a fragment present in locus SENTR6 and wrongly reported 11 as the allele number five times. Laboratory 129 reported three errors by missing the presence of a locus fragment for SENTR6 and laboratory 147 missed a fragment present in locus SENTR7 for test isolate SE8.
TECHNICAL REPORT Eighth external quality assessment scheme for Salmonella typing
17
Figure 9. Participant scores for MLVA typing of the 10 S. Enteritidis test isolates
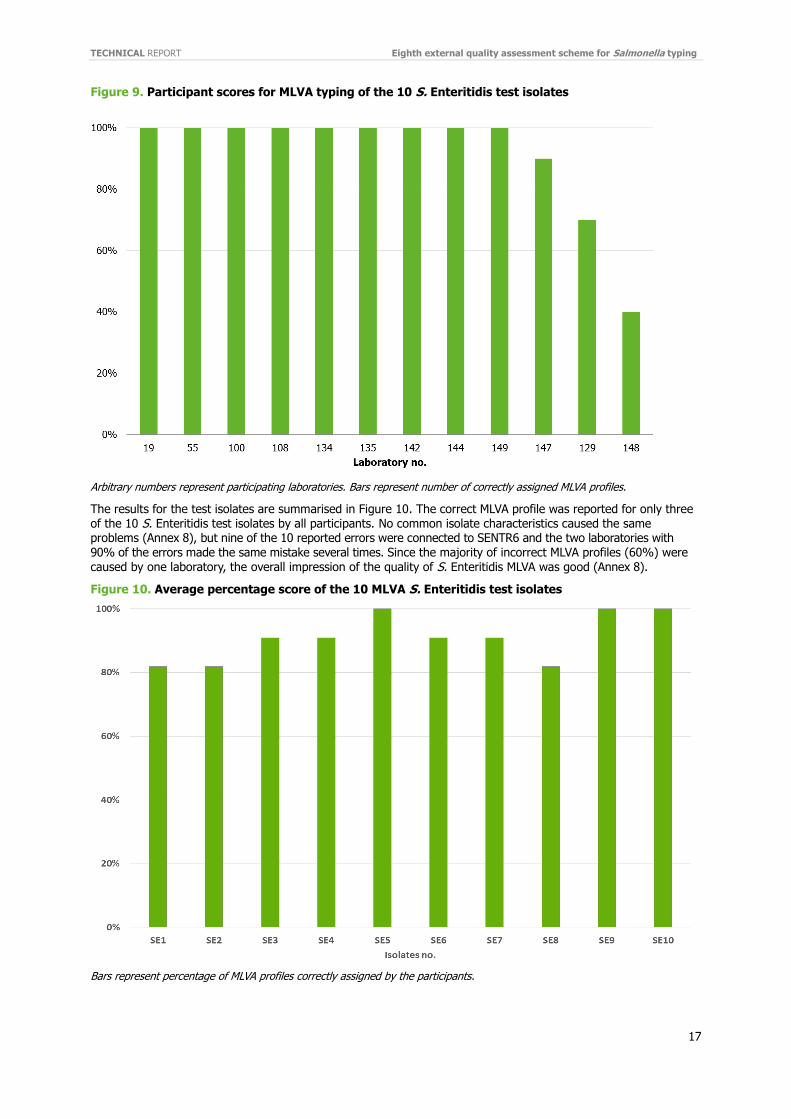
Arbitrary numbers represent participating laboratories. Bars represent number of correctly assigned MLVA profiles.
The results for the test isolates are summarised in Figure 10. The correct MLVA profile was reported for only three of the 10 S. Enteritidis test isolates by all participants. No common isolate characteristics caused the same problems (Annex 8), but nine of the 10 reported errors were connected to SENTR6 and the two laboratories with 90% of the errors made the same mistake several times. Since the majority of incorrect MLVA profiles (60%) were caused by one laboratory, the overall impression of the quality of S. Enteritidis MLVA was good (Annex 8).
Figure 10. Average percentage score of the 10 MLVA S. Enteritidis test isolates
Bars represent percentage of MLVA profiles correctly assigned by the participants.

Eighth external quality assessment scheme for Salmonella typing TECHNICAL REPORT
18
3.4 Molecular typing-based cluster analysis In this part of the EQA, the participants should correctly identify a cluster of closely related isolates among 12 test isolates by using either PFGE, MLVA and/or WGS-derived data. The cluster test isolates were pre-categorised by the EQA provider.
Based on WGS-derived data, the cluster consisted of four ST11 isolates: REF2, REF4, REF9 and REF11 (Annex 11). The analysis was based on an allele-based (cgMLST [9]) and SNP analysis (NASP [10]). The EQA provider found 0–3 allele differences and a distance of 0–6 SNPs between any two isolates in the cluster. The rest of the cluster test isolates were additional ST11 (5), ST10 (1), ST183 (1) and ST1925 (1).
Based on PFGE (XbaI profiles), the EQA provider defined a cluster of seven S. Enteritidis ST11 isolates: REF1, REF2, REF3, REF4, REF6, REF9 and REF11 (REF2 and REF11 were technical duplicates). The seven isolates were indistinguishable from each other by PFGE and two other ST11 isolates, REF12 and REF7, differed only by one and two bands respectively from the cluster PFGE-pattern (Annex 9). The last three test isolates, ST1925, ST183 and ST10 (Dublin), had several band differences and REF5 and REF8 in particular had a clearly unrelated PFGE profile (Annex 9).
Based on MLVA-derived data, the cluster consisted of five ST11 isolates, REF1, REF2, REF4, REF9 and REF11 with the MLVA profile 2-9-7-3-2 (Annex 10). Two other isolates, REF6 (2-10-7-3-2) and REF8 (2-9-7-3-1), differed in only one locus from the cluster MLVA-profile. The last five test isolates had variation in two to five loci (Annex 10).
3.4.1 PFGE-derived data
Four (31%) participants performed the cluster analysis using PFGE-derived data. Performance was high, 3 (75%) of the participants correctly identified the cluster of closely related isolates, defined by a pre-categorisation by the EQA provider, among the 12 cluster test isolates. Table 5 provides an overview of the isolates each participant included (yes) or excluded (no) in their cluster identification. Laboratory 92 reported 10 out of 12 cluster isolates as being a part of the cluster of closely related isolates.
Table 5. Results of cluster identification based on PFGE-derived data
Isolate no. Laboratory
Isolate number ST 19 55 92 142
REF1‡ 11 Yes Yes Yes Yes
REF2‡# 11 Yes Yes Yes Yes
REF3‡ 11 Yes Yes Yes Yes
REF4‡ 11 Yes Yes Yes Yes
REF5 10 No No No No
REF6‡ 11 Yes Yes Yes Yes
REF7 11 No No Yes No
REF8 183 No No No No
REF9‡ 11 Yes Yes Yes Yes
REF10 1925 No No Yes No
REF11‡# 11 Yes Yes Yes Yes
REF12 11 No No Yes No
Cluster-identified Yes Yes No Yes
‡: closely related isolates #: technical duplicate isolates.
The participants were also instructed to report the total number of bands in each isolate and then report the number of bands shared between each test isolate and the selected cluster representative (Figure 11). All data is available in Annexes 12 and 13.
Figure 11A shows the total number of band differences between the reported total number of bands by the participants and the total number of bands observed by the EQA provider for XbaI. Only laboratory 142 reported a higher number of bands in isolate REF10 (ST1925) than expected by the EQA provider. Figure 11B shows the number of band differences between the reported number of shared bands with a selected cluster representative by the participants and the number of shared bands observed by the EQA provider for XbaI. Only four differences were reported, as laboratory 19 reported one band more than expected for two isolates, laboratory 92 reported one band more than expected for one isolate and laboratory 142 reported one band less than expected for one isolate. Band differences above 1 were not observed.

TECHNICAL REPORT Eighth external quality assessment scheme for Salmonella typing
19
Figure 11. Difference between reported total number of bands (A) and shared bands (B) for each
isolate to selected isolates
Data from all nine ST11 isolates (REF1, REF2, REF3, REF4, REF6, REF7, REF9, REF11 and REF12) and one ST1925 (REF10). Data from REF5 (ST10, S. Dublin) and REF8 (ST183) with clearly unrelated PFGE profiles (Annex 9) were not included.
3.4.2 MLVA-derived data
All participants selected the S. Enteritidis scheme and reported the loci in the correct order: SENTR7, SENTR5, SENTR6, SENTR4 and SE-3.
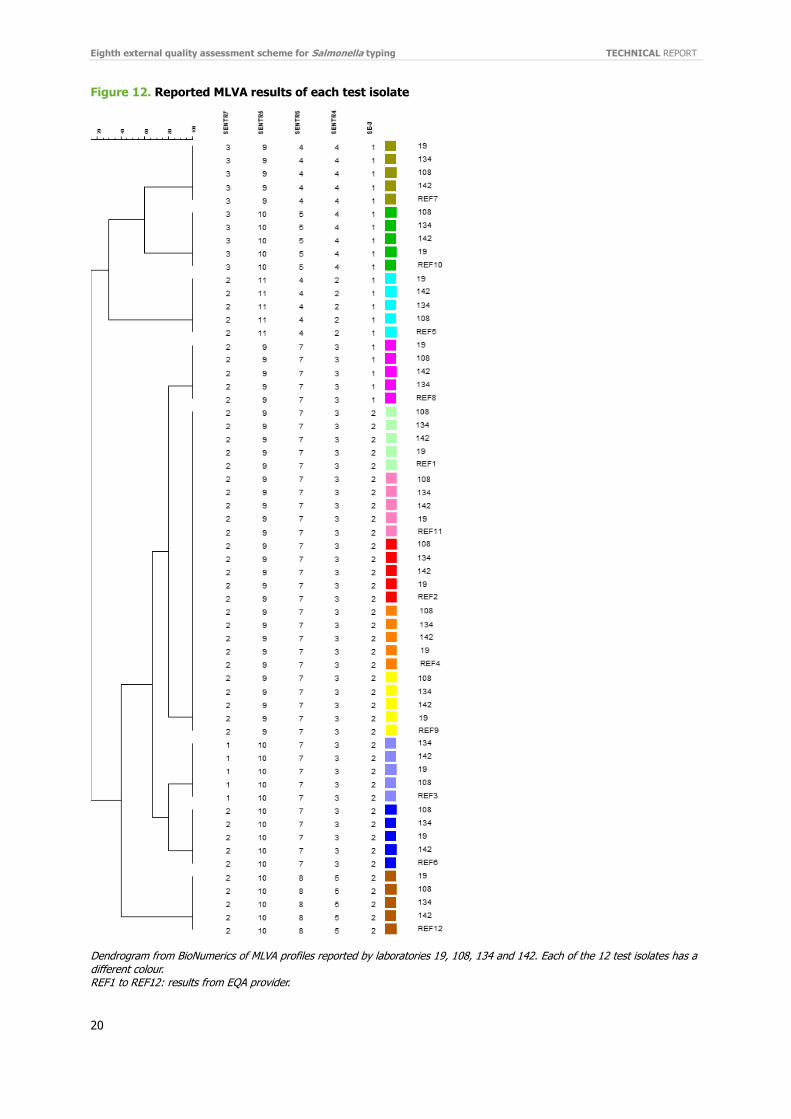
Four participants (31%) performed cluster analysis using MLVA-derived data. Performance was high, with all participants (100%) correctly identifying the cluster of closely related isolates (MLVA profile: 2-9-7-3-2) defined by a pre-categorisation by the EQA provider among the 12 cluster test isolates. Table 6 shows the overview of the isolate each participant included (Yes) and excluded (No) in their cluster analysis. Figure 12 shows a dendrogram of the reported MLVA results. All data are available in Annexes 15 and 16.
Table 6. Results of cluster identification based on MLVA-derived data
Laboratory ID
Isolate number ST MLVA-profile 19 108 134 142
REF1‡ 11 2 - 9 - 7 - 3 - 2 Yes Yes Yes Yes
REF2‡# 11 2 - 9 - 7 - 3 - 2 Yes Yes Yes Yes
REF3 11 1 - 10 - 7 - 3 - 2 No No No No
REF4‡ 11 2 - 9 - 7 - 3 - 2 Yes Yes Yes Yes
REF5 10 2 - 11 - 4 - 2 - 1 No No No No
REF6 11 2 - 10 - 7 - 3 - 2 No No No No
REF7 11 3 - 9 - 4 - 4 --
1 No No No No
REF8 183 2 - 9 - 7 - 3 - 1 No No No No
REF9‡ 11 2 - 9 - 7 - 3 --
2 Yes Yes Yes Yes
REF10 1925 3 - 10 - 5 - 4 - 1 No No No No
REF11‡# 11 2 - 9 - 7 - 3 - 2 Yes Yes Yes Yes
REF12 11 2 - 10 - 8 - 5 - 2 No No No No
Cluster-identified 2 - 9 - 7 - 3 - 2 Yes Yes Yes Yes
‡: closely related isolates #: technical duplicate isolates.
A B
Eighth external quality assessment scheme for Salmonella typing TECHNICAL REPORT
20
Figure 12. Reported MLVA results of each test isolate
Dendrogram from BioNumerics of MLVA profiles reported by laboratories 19, 108, 134 and 142. Each of the 12 test isolates has a different colour. REF1 to REF12: results from EQA provider.
TECHNICAL REPORT Eighth external quality assessment scheme for Salmonella typing
21
3.4.3 WGS-derived data
Reported results from participants
Eleven participants (46%) performed cluster analysis using WGS-derived data. Three laboratories reported using external assistance for sequencing. Different sequencing platforms were listed among the participants: one MiniSeq, five MiSeq, one HiSeq, three NextSeq and one Ion Torrent. All reported using commercial kits for library preparation. Of the 11 participants, nine (82%) used Illumina’s Nextera kit. Two reported volume changes from the manufacturer’s protocol and one laboratory listed increased input DNA (5ng), altered PCR protocol to favour longer fragment sizes, adjustment of extension temperature from 72°C to 65°C and ‘manual’ normalisation using library concentration and fragment size (as opposed to bead-based normalisation, Annex 14).
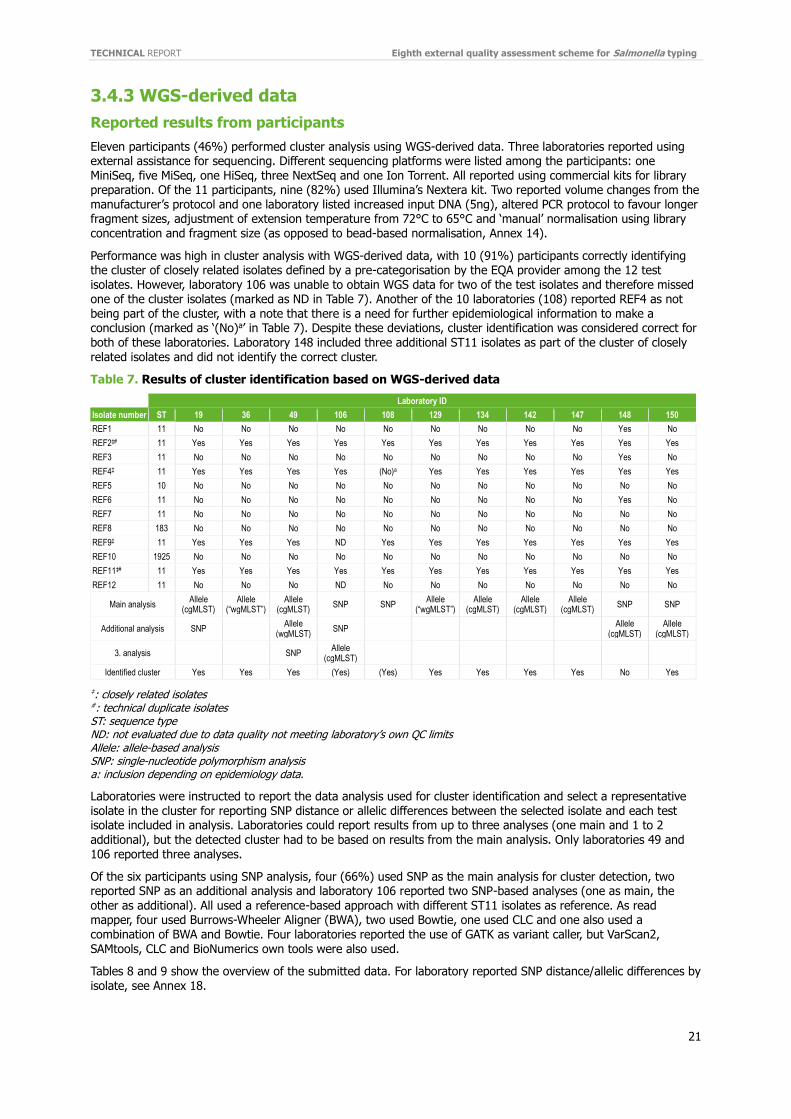
Performance was high in cluster analysis with WGS-derived data, with 10 (91%) participants correctly identifying the cluster of closely related isolates defined by a pre-categorisation by the EQA provider among the 12 test isolates. However, laboratory 106 was unable to obtain WGS data for two of the test isolates and therefore missed one of the cluster isolates (marked as ND in Table 7). Another of the 10 laboratories (108) reported REF4 as not being part of the cluster, with a note that there is a need for further epidemiological information to make a conclusion (marked as ‘(No)a’ in Table 7). Despite these deviations, cluster identification was considered correct for both of these laboratories. Laboratory 148 included three additional ST11 isolates as part of the cluster of closely related isolates and did not identify the correct cluster.
Table 7. Results of cluster identification based on WGS-derived data
Laboratory ID
Isolate number ST 19 36 49 106 108 129 134 142 147 148 150
REF1 11 No No No No No No No No No Yes No
REF2‡# 11 Yes Yes Yes Yes Yes Yes Yes Yes Yes Yes Yes
REF3 11 No No No No No No No No No Yes No
REF4‡ 11 Yes Yes Yes Yes (No)a Yes Yes Yes Yes Yes Yes
REF5 10 No No No No No No No No No No No
REF6 11 No No No No No No No No No Yes No
REF7 11 No No No No No No No No No No No
REF8 183 No No No No No No No No No No No
REF9‡ 11 Yes Yes Yes ND Yes Yes Yes Yes Yes Yes Yes
REF10 1925 No No No No No No No No No No No
REF11‡# 11 Yes Yes Yes Yes Yes Yes Yes Yes Yes Yes Yes
REF12 11 No No No ND No No No No No No No
Main analysis Allele
(cgMLST) Allele
(“wgMLST”) Allele
(cgMLST) SNP SNP
Allele (“wgMLST”)
Allele (cgMLST)
Allele (cgMLST)
Allele (cgMLST)
SNP SNP
Additional analysis SNP Allele
(wgMLST) SNP
Allele (cgMLST)
Allele (cgMLST)
3. analysis SNP Allele
(cgMLST)
Identified cluster Yes Yes Yes (Yes) (Yes) Yes Yes Yes Yes No Yes
‡: closely related isolates #: technical duplicate isolates ST: sequence type ND: not evaluated due to data quality not meeting laboratory’s own QC limits Allele: allele-based analysis SNP: single-nucleotide polymorphism analysis a: inclusion depending on epidemiology data.
Laboratories were instructed to report the data analysis used for cluster identification and select a representative isolate in the cluster for reporting SNP distance or allelic differences between the selected isolate and each test isolate included in analysis. Laboratories could report results from up to three analyses (one main and 1 to 2 additional), but the detected cluster had to be based on results from the main analysis. Only laboratories 49 and 106 reported three analyses.
Of the six participants using SNP analysis, four (66%) used SNP as the main analysis for cluster detection, two reported SNP as an additional analysis and laboratory 106 reported two SNP-based analyses (one as main, the
other as additional). All used a reference-based approach with different ST11 isolates as reference. As read mapper, four used Burrows-Wheeler Aligner (BWA), two used Bowtie, one used CLC and one also used a combination of BWA and Bowtie. Four laboratories reported the use of GATK as variant caller, but VarScan2, SAMtools, CLC and BioNumerics own tools were also used.
Tables 8 and 9 show the overview of the submitted data. For laboratory reported SNP distance/allelic differences by isolate, see Annex 18.

Eighth external quality assessment scheme for Salmonella typing TECHNICAL REPORT
22
Table 8. Reported results of SNP-based cluster analysis
*: additional analysis #: only three isolates included due to data quality not meeting laboratory’s own QC limits. Distance outside cluster is for reported ST11 isolates. For detailed data, see Annex 18.
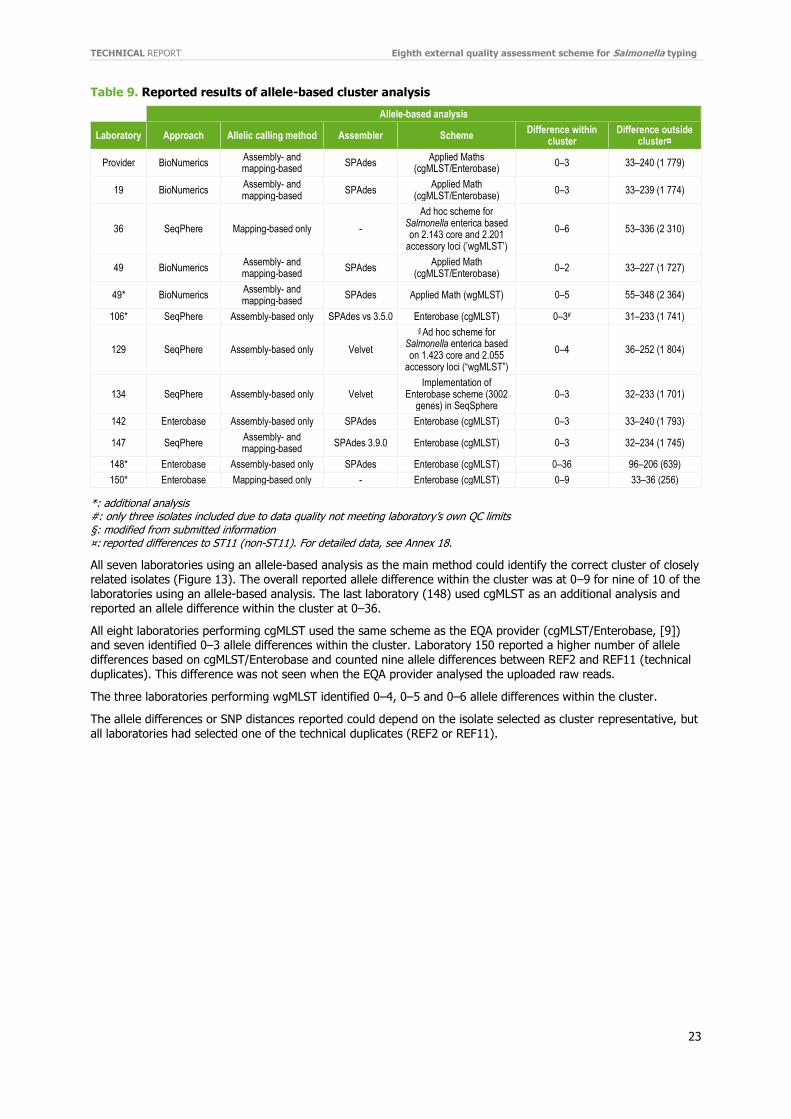
Of the 10 participants using an allele-based analysis, seven selected the method as the main analysis for cluster detection. Five of 10 (50%) used only an assembly-based allele calling method and three (30%) used both assembly- and mapping-based allele calling methods. Six used SPAdes as the assembler and two used Velvet. The remaining two laboratories (20%) used only a mapping-based allele calling method.
Eight of 10 laboratories (80%) reported using Enterobase (cgMLST) as the scheme for analysis. The remaining two laboratories (20%) reported the use of wgMLST (an ad hoc scheme for Salmonella enterica based on 2.143/1.423 core and 2.201/2.055 accessory loci respectively). Furthermore, laboratory 49, which had reported the use of Enterobase (cgMLST) as the main analysis, also reported results using wgMLST/Applied Maths.
SNP-based
Laboratory Approach Reference Read mapper Variant caller
Distance
within cluster
Distance
outside cluster
Provider Reference-based ST11 REF2 BWA GATK 0–6 61–462
19* Reference-based ST11 in-house strain
1606T13806 BWA GATK 0–7 78–525
49* Reference-based ST11 6302 BWA, Bowtie2 BioNumerics own tools
0–6 65–488
106 Reference-based CPOO7332 strain EC20120916 ST11
BWA-MEM 0.7.12
GATK 3.8.0 0–3# 15–117
106* Reference-based CP007332 strain
EC20120916 ST11
BOWTIE2 vs 2.2.5
VarScan2 0–9# 43–300
108 Reference-based In-house strain resp ST CLC assembly
cell v4.4.2
CLC assembly cell v4.4.2
0–7 65–510
148 Reference-based ST11_(NC_011294.1) Bowtie2 SAMtools 0–97 None
reported
150 Reference-based AM933172 (EBI),
ST11, EBG4 BWA GATK 0–7 68–493
TECHNICAL REPORT Eighth external quality assessment scheme for Salmonella typing
23
Table 9. Reported results of allele-based cluster analysis
*: additional analysis #: only three isolates included due to data quality not meeting laboratory’s own QC limits §: modified from submitted information ¤: reported differences to ST11 (non-ST11). For detailed data, see Annex 18.
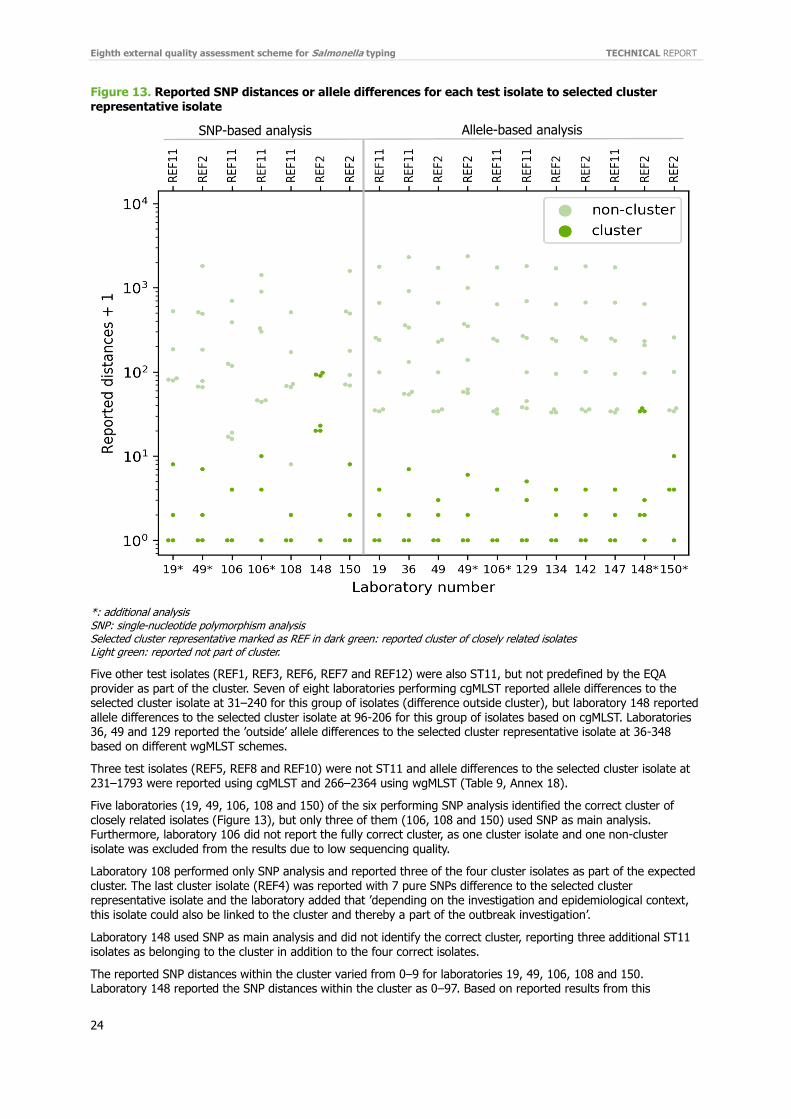
All seven laboratories using an allele-based analysis as the main method could identify the correct cluster of closely related isolates (Figure 13). The overall reported allele difference within the cluster was at 0–9 for nine of 10 of the laboratories using an allele-based analysis. The last laboratory (148) used cgMLST as an additional analysis and reported an allele difference within the cluster at 0–36.
All eight laboratories performing cgMLST used the same scheme as the EQA provider (cgMLST/Enterobase, [9]) and seven identified 0–3 allele differences within the cluster. Laboratory 150 reported a higher number of allele differences based on cgMLST/Enterobase and counted nine allele differences between REF2 and REF11 (technical duplicates). This difference was not seen when the EQA provider analysed the uploaded raw reads.
The three laboratories performing wgMLST identified 0–4, 0–5 and 0–6 allele differences within the cluster.
The allele differences or SNP distances reported could depend on the isolate selected as cluster representative, but all laboratories had selected one of the technical duplicates (REF2 or REF11).
Allele-based analysis
Laboratory Approach Allelic calling method Assembler Scheme Difference within
cluster Difference outside
cluster¤
Provider BioNumerics Assembly- and mapping-based
SPAdes Applied Maths
(cgMLST/Enterobase) 0–3 33–240 (1 779)
19 BioNumerics Assembly- and mapping-based
SPAdes Applied Math
(cgMLST/Enterobase) 0–3 33–239 (1 774)
36 SeqPhere Mapping-based only -
Ad hoc scheme for Salmonella enterica based on 2.143 core and 2.201
accessory loci (’wgMLST’)
0–6 53–336 (2 310)
49 BioNumerics Assembly- and mapping-based
SPAdes Applied Math
(cgMLST/Enterobase) 0–2 33–227 (1 727)
49* BioNumerics Assembly- and mapping-based
SPAdes Applied Math (wgMLST) 0–5 55–348 (2 364)
106* SeqPhere Assembly-based only SPAdes vs 3.5.0 Enterobase (cgMLST) 0–3# 31–233 (1 741)
129 SeqPhere Assembly-based only Velvet
§ Ad hoc scheme for Salmonella enterica based on 1.423 core and 2.055
accessory loci (“wgMLST”)
0–4 36–252 (1 804)
134 SeqPhere Assembly-based only Velvet Implementation of
Enterobase scheme (3002 genes) in SeqSphere
0–3 32–233 (1 701)
142 Enterobase Assembly-based only SPAdes Enterobase (cgMLST) 0–3 33–240 (1 793)
147 SeqPhere Assembly- and mapping-based
SPAdes 3.9.0 Enterobase (cgMLST) 0–3 32–234 (1 745)
148* Enterobase Assembly-based only SPAdes Enterobase (cgMLST) 0–36 96–206 (639)
150* Enterobase Mapping-based only - Enterobase (cgMLST) 0–9 33–36 (256)
Eighth external quality assessment scheme for Salmonella typing TECHNICAL REPORT
24
Figure 13. Reported SNP distances or allele differences for each test isolate to selected cluster
representative isolate
*: additional analysis SNP: single-nucleotide polymorphism analysis Selected cluster representative marked as REF in dark green: reported cluster of closely related isolates Light green: reported not part of cluster.
Five other test isolates (REF1, REF3, REF6, REF7 and REF12) were also ST11, but not predefined by the EQA provider as part of the cluster. Seven of eight laboratories performing cgMLST reported allele differences to the selected cluster isolate at 31–240 for this group of isolates (difference outside cluster), but laboratory 148 reported allele differences to the selected cluster isolate at 96-206 for this group of isolates based on cgMLST. Laboratories 36, 49 and 129 reported the ’outside’ allele differences to the selected cluster representative isolate at 36-348 based on different wgMLST schemes.
Three test isolates (REF5, REF8 and REF10) were not ST11 and allele differences to the selected cluster isolate at 231–1793 were reported using cgMLST and 266–2364 using wgMLST (Table 9, Annex 18).
Five laboratories (19, 49, 106, 108 and 150) of the six performing SNP analysis identified the correct cluster of closely related isolates (Figure 13), but only three of them (106, 108 and 150) used SNP as main analysis. Furthermore, laboratory 106 did not report the fully correct cluster, as one cluster isolate and one non-cluster isolate was excluded from the results due to low sequencing quality.
Laboratory 108 performed only SNP analysis and reported three of the four cluster isolates as part of the expected cluster. The last cluster isolate (REF4) was reported with 7 pure SNPs difference to the selected cluster representative isolate and the laboratory added that ’depending on the investigation and epidemiological context, this isolate could also be linked to the cluster and thereby a part of the outbreak investigation’.
Laboratory 148 used SNP as main analysis and did not identify the correct cluster, reporting three additional ST11 isolates as belonging to the cluster in addition to the four correct isolates.
The reported SNP distances within the cluster varied from 0–9 for laboratories 19, 49, 106, 108 and 150. Laboratory 148 reported the SNP distances within the cluster as 0–97. Based on reported results from this
SNP-based analysis Allele-based analysis

TECHNICAL REPORT Eighth external quality assessment scheme for Salmonella typing
25
laboratory, the SNP distance for the correct cluster of closely related isolate was 0–22 SNPs. Overall, laboratory 148
reported higher SNP distances than expected and an SNP distance of 19 was reported for the technically duplicated isolate (REF2 and REF11).
Laboratory 148 was the only one that did not report an SNP distance outside the cluster. The overall reported SNP distances outside the cluster were 15–525. Laboratory 106 reported two different SNP results, both with significantly shorter distances for non-cluster isolates. A likely cause could be the inclusion of the distant S. Dublin isolate (REF5) in the analysis, resulting in a reduced core genome. The results reported for the Bowtie/Varscan analysis included three SNPs between the technical replicates. The reported SNP distances outside the cluster for each laboratory were more uniform (65–525) when disregarding the SNP result from laboratory 106 (15–117 and 43–300).
Analysis of raw reads uploaded by participants
In addition to the reported cluster identification, participants submitted their FASTQ files to be evaluated by the EQA provider. The data was initially evaluated using the EQA provider’s QC pipeline [11] and FASTQ files were uploaded to an Applied Maths calculation engine for allele calling (cgMLST/Enterobase, [9]). Isolates from laboratories 134, 147 and 150 failed the QC and were excluded from figures derived from the submitted data.
In addition, laboratory 106 only submitted 10 FASTQ files due to data quality not meeting the laboratory’s own QC limits and laboratory 108 did not submit FASTQ files for REF5 (ST10, Dublin).
The overall cgMLST analysis shown in the minimum spanning tree (MST, Figure 14) based on submitted raw reads from 11 laboratories shows clear clustering of the results for each test isolate.
Figure 14. Minimum spanning tree of core genome multilocus sequence typing, participant FASTQ files
Minimum spanning tree (MST) in log scale of core genome multilocus sequence typing (cgMLST, [9]) based on submitted raw reads (FASTQ files). Each REF1–REF12 test isolate has a different colour. REF results from the EQA provider are in grey. Of 11 laboratories, laboratory 106 only submitted 10 FASTQ files due to data quality not meeting the laboratory’s own QC limits. For laboratories 134, 147 and 150, only 11 of the 12 submitted FASTQ files were used due to data quality not meeting the provider’s QC limits. Laboratory 108 did not submit FASTQ files for REF5 (ST10, Dublin).
Eighth external quality assessment scheme for Salmonella typing TECHNICAL REPORT
26
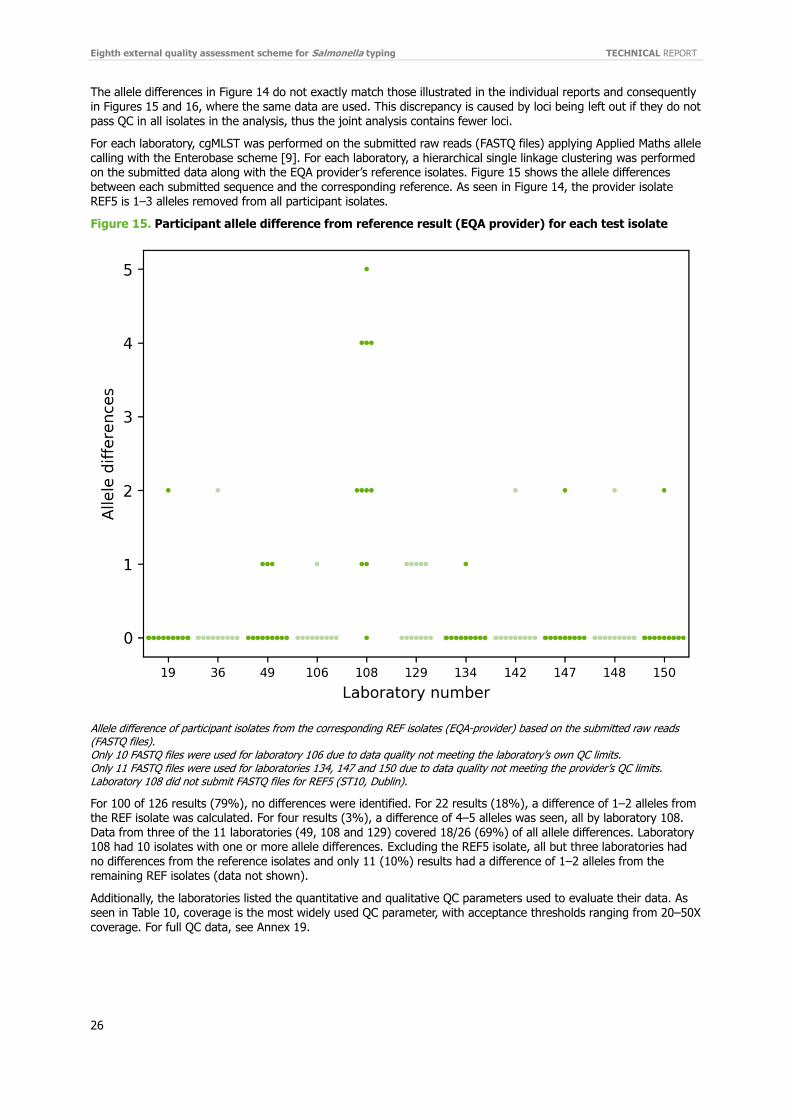
The allele differences in Figure 14 do not exactly match those illustrated in the individual reports and consequently
in Figures 15 and 16, where the same data are used. This discrepancy is caused by loci being left out if they do not pass QC in all isolates in the analysis, thus the joint analysis contains fewer loci.
For each laboratory, cgMLST was performed on the submitted raw reads (FASTQ files) applying Applied Maths allele calling with the Enterobase scheme [9]. For each laboratory, a hierarchical single linkage clustering was performed on the submitted data along with the EQA provider’s reference isolates. Figure 15 shows the allele differences between each submitted sequence and the corresponding reference. As seen in Figure 14, the provider isolate REF5 is 1–3 alleles removed from all participant isolates.
Figure 15. Participant allele difference from reference result (EQA provider) for each test isolate
Allele difference of participant isolates from the corresponding REF isolates (EQA-provider) based on the submitted raw reads (FASTQ files). Only 10 FASTQ files were used for laboratory 106 due to data quality not meeting the laboratory’s own QC limits. Only 11 FASTQ files were used for laboratories 134, 147 and 150 due to data quality not meeting the provider’s QC limits. Laboratory 108 did not submit FASTQ files for REF5 (ST10, Dublin).
For 100 of 126 results (79%), no differences were identified. For 22 results (18%), a difference of 1–2 alleles from the REF isolate was calculated. For four results (3%), a difference of 4–5 alleles was seen, all by laboratory 108. Data from three of the 11 laboratories (49, 108 and 129) covered 18/26 (69%) of all allele differences. Laboratory 108 had 10 isolates with one or more allele differences. Excluding the REF5 isolate, all but three laboratories had no differences from the reference isolates and only 11 (10%) results had a difference of 1–2 alleles from the remaining REF isolates (data not shown).
Additionally, the laboratories listed the quantitative and qualitative QC parameters used to evaluate their data. As
seen in Table 10, coverage is the most widely used QC parameter, with acceptance thresholds ranging from 20–50X coverage. For full QC data, see Annex 19.

TECHNICAL REPORT Eighth external quality assessment scheme for Salmonella typing
27
Table 10. Participants’ reported quantitative and qualitative parameters
Parameters Number of laboratories
Coverage 10
Assembly quality 6
Assembly length 6
Allele calling 6
Confirmation of organism 6
Read length 5
Read quality 4
Allele calling 2
Contamination 2
Read trimming 2
GC content 1
Run performance 1
Sequence present 1
SNP pruning 1
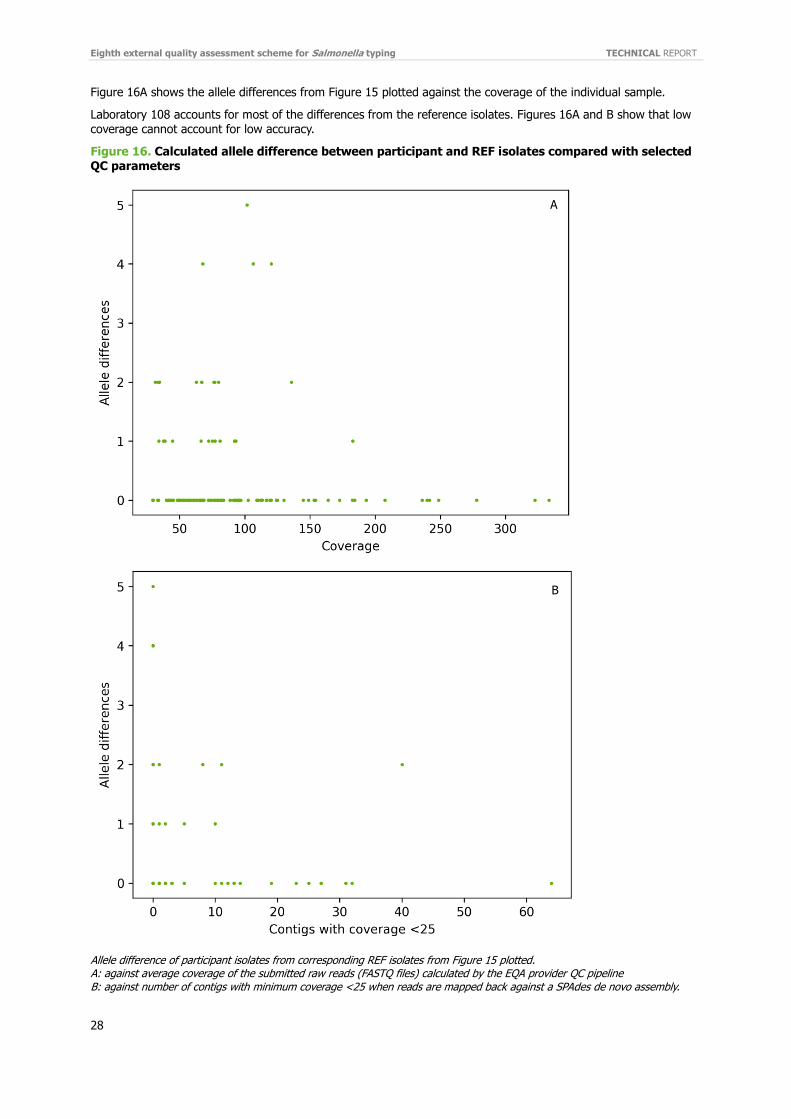
Eighth external quality assessment scheme for Salmonella typing TECHNICAL REPORT
28
Figure 16A shows the allele differences from Figure 15 plotted against the coverage of the individual sample.
Laboratory 108 accounts for most of the differences from the reference isolates. Figures 16A and B show that low coverage cannot account for low accuracy.
Figure 16. Calculated allele difference between participant and REF isolates compared with selected QC parameters
Allele difference of participant isolates from corresponding REF isolates from Figure 15 plotted. A: against average coverage of the submitted raw reads (FASTQ files) calculated by the EQA provider QC pipeline B: against number of contigs with minimum coverage <25 when reads are mapped back against a SPAdes de novo assembly.
B
A
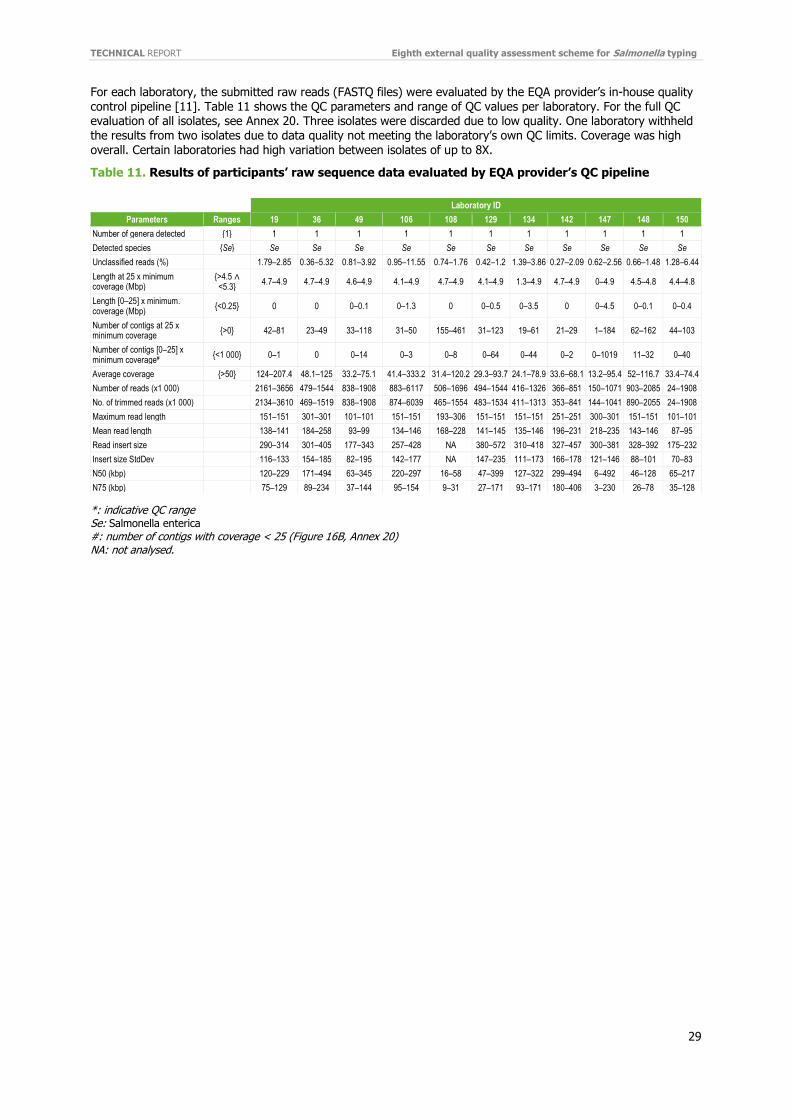
TECHNICAL REPORT Eighth external quality assessment scheme for Salmonella typing
29
For each laboratory, the submitted raw reads (FASTQ files) were evaluated by the EQA provider’s in-house quality
control pipeline [11]. Table 11 shows the QC parameters and range of QC values per laboratory. For the full QC evaluation of all isolates, see Annex 20. Three isolates were discarded due to low quality. One laboratory withheld the results from two isolates due to data quality not meeting the laboratory’s own QC limits. Coverage was high overall. Certain laboratories had high variation between isolates of up to 8X.
Table 11. Results of participants’ raw sequence data evaluated by EQA provider’s QC pipeline
*: indicative QC range Se: Salmonella enterica #: number of contigs with coverage < 25 (Figure 16B, Annex 20) NA: not analysed.
Laboratory ID
Parameters Ranges 19 36 49 106 108 129 134 142 147 148 150
Number of genera detected {1} 1 1 1 1 1 1 1 1 1 1 1
Detected species {Se} Se Se Se Se Se Se Se Se Se Se Se
Unclassified reads (%) 1.79–2.85 0.36–5.32 0.81–3.92 0.95–11.55 0.74–1.76 0.42–1.2 1.39–3.86 0.27–2.09 0.62–2.56 0.66–1.48 1.28–6.44
Length at 25 x minimum coverage (Mbp)
{>4.5 ∧ <5.3}
4.7–4.9 4.7–4.9 4.6–4.9 4.1–4.9 4.7–4.9 4.1–4.9 1.3–4.9 4.7–4.9 0–4.9 4.5–4.8 4.4–4.8
Length [0–25] x minimum. coverage (Mbp)
{<0.25} 0 0 0–0.1 0–1.3 0 0–0.5 0–3.5 0 0–4.5 0–0.1 0–0.4
Number of contigs at 25 x minimum coverage
{>0} 42–81 23–49 33–118 31–50 155–461 31–123 19–61 21–29 1–184 62–162 44–103
Number of contigs [0–25] x minimum coverage#
{<1 000} 0–1 0 0–14 0–3 0–8 0–64 0–44 0–2 0–1019 11–32 0–40
Average coverage {>50} 124–207.4 48.1–125 33.2–75.1 41.4–333.2 31.4–120.2 29.3–93.7 24.1–78.9 33.6–68.1 13.2–95.4 52–116.7 33.4–74.4
Number of reads (x1 000) 2161–3656 479–1544 838–1908 883–6117 506–1696 494–1544 416–1326 366–851 150–1071 903–2085 24–1908
No. of trimmed reads (x1 000) 2134–3610 469–1519 838–1908 874–6039 465–1554 483–1534 411–1313 353–841 144–1041 890–2055 24–1908
Maximum read length 151–151 301–301 101–101 151–151 193–306 151–151 151–151 251–251 300–301 151–151 101–101
Mean read length 138–141 184–258 93–99 134–146 168–228 141–145 135–146 196–231 218–235 143–146 87–95
Read insert size 290–314 301–405 177–343 257–428 NA 380–572 310–418 327–457 300–381 328–392 175–232
Insert size StdDev 116–133 154–185 82–195 142–177 NA 147–235 111–173 166–178 121–146 88–101 70–83
N50 (kbp) 120–229 171–494 63–345 220–297 16–58 47–399 127–322 299–494 6–492 46–128 65–217
N75 (kbp) 75–129 89–234 37–144 95–154 9–31 27–171 93–171 180–406 3–230 26–78 35–128

Eighth external quality assessment scheme for Salmonella typing TECHNICAL REPORT
30
4 Discussion
The total number of participants decreased from 26 in EQA-7 to 24 in EQA-8. Among the 24 participants was one new and another participating again after a break of three years. Three laboratories that participated in the PFGE part of EQA-7 did not participate in EQA-8 at all (neither in the independent PFGE part nor in the cluster part by PFGE). One laboratory that only participated in the MLVA part of EQA-7 did not participate in EQA-8 at all.
4.1 Pulsed field gel electrophoresis
Seventeen laboratories participated in the PFGE gel part and their gels were graded according to the TIFF Quality Grading Guidelines EQA-8, where seven parameters are used for grading given scores between 1 and 4 (Poor, Fair, Good and Excellent). The majority of the participating laboratories (14/17; 82%) produced an acceptable quality TIFF gel image for inter-laboratory comparison, representing an increase from 72% in EQA-6 and 76% in EQA-7.
Three laboratories (18%) scored 1 [Poor] in one or three parameters (‘Bands’ or ‘Image acquisition and running condition’, ‘Restriction’ and ‘DNA degradation’), having generated a gel of insufficient quality for inter-laboratory comparisons.
For the parameter ‘Bands’ in particular, seven participants (41%) were able to obtain a score of 4 [Excellent], representing an increase from 28% in both EQA-6 and EQA-7. Two of the three laboratories that produced a gel deemed unsuitable for inter-laboratory comparison scored 1 [Poor] in this parameter. The same trend was observed in the previous EQA and laboratories need to improve the quality of bands to ensure onward inter-laboratory comparability of PFGE profiles. The low ‘Band’ scores were due to thick or fuzzy bands. The easiest and often best way to improve the sharpness of the bands is to use wider wells.
Four laboratories disregarded the very important factor of including a reference lane for every three or four test isolates (no more than five isolate lanes between reference lanes). This strongly affected the subsequent normalisation and band assignment. Furthermore, it is important that equipment is properly maintained, works within specifications and the buffer temperature complies with protocol. The electrophoresis time should also be
adjusted in each laboratory, as failure to do so will result in a bottom band that is not 1–1.5 cm from the base of the gel. Following the gel electrophoresis, proper image capture of the gel is critical to obtaining a good quality TIFF image.
Among the six laboratories (96, 129, 130, 132, 138 and 144) scoring 1 [Poor] in the gel-producing part of EQA-7, two (129, 144) improved their performance to 3 [Good] in the current EQA. One did not participate (132) and three (96, 130 and 138) still achieved 1 [Poor] for some of the same parameters as previously in EQA-7 despite many recommendations for improvements. Laboratories were encouraged to resubmit a new PFGE gel, but no laboratories responded that they would.
The performance of the gel analysis was generally very good. Almost all laboratories performed gel analysis in accordance with guidelines. Only one laboratory used an inverted gel in the analysis, which resulted in incorrect normalisation. The performance of PFGE typing has been part of the EQA scheme for Salmonella since EQA-4, but for the first time, the gel analysis part was performed with a gel preproduced by the EQA provider. In each previous round, three laboratories (EQA-4 to EQA-6) or none (EQA-7) were unable to produce gel analysis in accordance with the guidelines. Only laboratory 128 scored a Poor performance in gel analysis three times (EQA-8, EQA-6 and EQA-5), two related to normalisation, despite the laboratory receiving recommendations for improvements in the individual evaluation reports. In general, the average score of the parameter ‘band assignment’ was lower in EQA-8 than in previous EQAs, caused by the new strict evaluation criteria (see Annex 4) and because the parameter is no longer dependent on the quality of the participants’ gel. Not surprisingly, the double bands were the most difficult to assign correctly, emphasising the necessity of a curated ECDC/EFSA joint database.
The participation rate in the PFGE part was lower than in the previous schemes (24 in EQA-7 and 17 in EQA-8), and several laboratories (6/17; 35%) did not perform gel analysis (i.e. normalisation and band assignment of the EQA-provided gel). None of the former participants substituted the quality PFGE assessment with the PFGE cluster part, but four previous PFGE participants switched to the cluster part using WGS-derived data. Despite the increased use of WGS-based typing tools for investigating larger outbreaks, some laboratories still use PFGE for their primary surveillance and outbreak investigation. In order to perform good national surveillance as well as submit profiles to EU-wide surveillance, it is important to have the capacity to properly analyse and interpret PFGE profiles at the national level and compare human and food isolates. In this EQA, with improved gel analysis, participants received very detailed band assignment feedback in their individual reports in order for them to improve their performance on assigning double bands correctly.

TECHNICAL REPORT Eighth external quality assessment scheme for Salmonella typing
31
4.2 Multiple-locus variable number of tandem repeats analysis Thirteen laboratories participated overall in the MLVA part of the EQA: 12 in MLVA for S. Typhimurium and 12 in MLVA for S. Enteritidis. MLVA for S. Enteritidis was included in the EQA for the first time and the relatively high number of participants shows that it was relevant to include this method. The number of participants in MLVA for S. Typhimurium was two laboratories fewer than in EQA-7. By adding MLVA for S. Enteritidis, there was one new MLVA participant, but this laboratory only performed MLVA for S. Enteritidis.
Nine laboratories (75%) obtained a total score of 100% for S. Typhimurium and reported the correct MLVA types for all 10 test isolates. This is a high performance, but a slight decrease compared with EQA-7, where 80% of participants obtained a score of 100%. From EQA-4 to EQA-8, the overall performance in each round was 60%, 71%, 79%, 80% and 75% respectively of the participants reporting correct MLVA S. Typhimurium types for all test isolates. There were no obvious reasons for the decrease this round – fewer laboratories participated, but the same
number of laboratories reported incorrectly (not the same laboratories).
The MLVA results of the two repeated S. Typhimurium isolates from EQA-4 through EQA-8 showed high performance by the participants. The majority of participants (92%; 11/12) performed at the same level as the last time they participated. Laboratory 144 made a mistake for the first time on one of the repeated isolates.
MLVA of S. Enteritidis was a new part of EQA-8. Nine laboratories (75%) obtained a total score of 100% and reported correct MLVA types for all 10 test isolates.
No common characteristics of the isolates caused problems among the participants. Mistakes in the MLVA for both S. Typhimurium and S. Enteritidis were mainly caused by reporting absent alleles where fragments should have been detected or alleles in a locus with no fragment present, and less frequently by assigning a wrong allele in a present fragment. However, laboratory 148 seemed to make a systematic error reporting allele number 11 for S. Enteritidis in locus SENTR6 several times.
The reasons for missing the presence of a locus or vice versa (false positive allele number for an absent locus)
could be from not using a freshly prepared primer mix. Amplification signals (peaks) decrease as the primer mix gets older and the use of control/reference isolates should indicate whether the primer mix produces readable signals. Another reason could be an unbalanced primer mix, resulting in very different peak heights and a signal being mistakenly recognised as background noise or background noise being identified as a signal.
For a highly discriminatory method such as MLVA that includes fast-changing loci, there is always a risk that the allelic profile may change during passage or transport. Changes in highly variable loci are impossible to avoid or foresee. All test isolates were stability-tested by being passaged 10 times and the one-repeat variant was stable, as also reported by all participants identifying the locus. In general, changes only occur in fast-changing loci (e.g. STTR5, STTR6 and STTR10 for S. Typhimurium) and one-repeat changes in these loci would be accepted as correct when evaluating the results of the EQA. However, no one-locus variants were reported by participants this year, so the rule was never applied.
4.3 Molecular typing-based cluster analysis In the present EQA scheme, a molecular typing-based cluster analysis was included for the first time. Participants were free to choose their preferred method between PFGE, MLVA and/or WGS-derived data and the identified cluster depended on the used method. According to WGS-derived typing results obtained by the EQA provider, four of the 12 test isolates formed a cluster of closely related isolates, whereas the remaining isolates clearly were genetically more distant. If PFGE or MLVA was used as the single typing method, 7 and 5 isolates respectively were indistinguishable, whereas the profiles of the remaining isolates had small or large differences to the cluster profile.
Compared to MLVA, the discriminatory power of PFGE is often too low for cluster detection, but overall, PFGE and analysis based on WGS data showed the same picture of relatedness between the test isolates, where clearly unrelated isolates by PFGE (REF8 and REF5) also had the highest differences by WGS.
The results by MLVA did not show exactly the same as one isolate (REF8, ST183) was more related to the predefined WGS cluster than the other ST11 test isolates by MLVA, which highlights the challenge of MLVA only measuring a few specific regions of the genome and sometimes showing incorrect phylogenetic relatedness.
The allele difference and SNP distances calculated of the cluster defined by PFGE or MLVA were much higher than in the ’true’ WGS defined cluster. The SNP distance within the extended cluster defined by PFGE was 83 (provider result) and allele differences were up to 35 (cgMLST by provider). If the isolate with one band difference was included, the SNP distance within the cluster increased to 163 and the allele differences to 97.
The identification of closely related isolates by MLVA included one additional isolate with an SNP distance within the MLVA cluster of 61 (provider result) and allele differences up to 33 (cgMLST by provider). If the two isolates with
Eighth external quality assessment scheme for Salmonella typing TECHNICAL REPORT
32
variation in one locus (REF6 and REF8) were included, the genetic distance within the cluster would increase
noticeably. The distance from the closely related cluster to REF6 was 83 SNPs and 35 alleles. For REF8 (ST183), the distance was 1742 SNPs and 660 allele differences. However, the variation in the MLVA profile was connected to the highly conserved locus SE-3 and a one-repeat unit difference in this locus is usually not considered as a closely related MLVA profile.
This shows the difficulties of inter-laboratory comparability between Member States with regards to surveillance and outbreak investigation when different methods are used. Despite the increasing use of WGS as a typing tool for large outbreaks, some laboratories still use PFGE for their primary surveillance and outbreak investigation, which complicates communication regarding outbreaks, e.g. in ECDC’s Epidemic Intelligence Information System (EPIS).
Acceptance by the Member States of the addition of cluster analysis in this EQA for Salmonella typing seems unclear (Annex 2). Only 13 of the 24 laboratories (54%) participated in the cluster part using PFGE-, MLVA- and/or WGS-derived data. No more than four participated in cluster identification using PFGE even though 17 laboratories participated in the PFGE part of the EQA and two of them also participated in cluster identification using WGS. Four
laboratories participated in cluster identification using MLVA and all four also participated in cluster identification using WGS. Four laboratories participating in gel quality and gel analysis (PFGE part) in EQA-7 switched methods completely and participated in cluster analysis using only WGS-derived data and did not perform PFGE at all.
All laboratories participating in the cluster part by either PFGE or MLVA also participated in gel quality/gel analysis (PFGE part) or the individual MLVA part of EQA-8. However, remarkably few laboratories (two) in the cluster part chose to use PFGE or MLVA alone and not in combination with WGS. The further scheduled adjustment of the EQA scheme, where gel quality and analysis (PFGE part) is removed, may decrease the overall number of participants as laboratories no longer receive an EQA of their PFGE performance.
4.3.1 PFGE-derived data Of the 24 laboratories, four (17%) performed cluster analysis using PFGE-derived data. Three laboratories (75%) correctly identified the cluster of seven closely related isolates designed by the EQA provider using XbaI.
Laboratory 92 did not identify the correct cluster and reported three additional isolates in the cluster of closely related isolates with up to three band differences. This laboratory did not perform MLVA or WGS on the test isolates. S. Enteritidis is normally a very genetically related serovar and the discriminatory power of PFGE can be insufficient for cluster detection [12]. It is advisable to use very conservative criteria for interpreting the relatedness by PFGE for this serovar and only to consider isolates with indistinguishable PFGE profiles as closely related. Very few differences in total number of bands and in shared bands with the cluster PFGE-profile were observed for the four laboratories compared with the EQA provider.
4.3.2 MLVA-derived data
In the European S. Enteritidis outbreak from 2016 to 2018 linked to eggs, MLVA profiles were used in the definition of probable cases [7], but out of the 24 EQA participants, only four (17%) performed cluster analysis using MLVA-derived data . Performance was very high as all (100%) correctly identified the cluster of five closely related isolates. None of the laboratories included or suggested the inclusion of single-locus variants in the cluster, but all four laboratories also performed cluster analysis by WGS.
4.3.3 WGS-derived data Eleven of 24 laboratories (46%) performed cluster analysis using WGS-derived data. This was a slightly lower participation compared to the corresponding EQA of Listeria monocytogenes, where 12 of 20 laboratories (60%) performed cluster analysis using WGS-derived data. Performance was high, as 10 (91%) correctly identified the cluster of closely related isolates, although one of these laboratories was unable to obtain WGS data for all test isolates and therefore missed one of the cluster isolates. Another of the 10 laboratories also omitted to report one of the cluster isolates, as it reported the need for epidemiological information to make a conclusion.
The majority of laboratories (11/12) reported the use of an Illumina platform and three laboratories reported the use of external assistance for sequencing. All reported using commercial kits for library preparation. Out of 11 laboratories, seven (64%) reported using an allele-based method as the main analysis and four (36%) reported using SNP analysis. If only evaluating the main analysis of the laboratories reporting the correct cluster, the distances reported using SNP-based analyses were 0–7 inside the cluster and the number of allele differences using cgMLST were 0–3 inside the cluster.
The two approaches to analyse WGS-derived data (allele- and SNP-based analysis) showed comparable results. In an evaluation of a European Salmonella serovar Enteritidis outbreak, cgMLST analysis was also congruent with the original SNP-based analysis [13]. One exception in EQA-8 was the results from the laboratory not identifying the

TECHNICAL REPORT Eighth external quality assessment scheme for Salmonella typing
33
correct cluster. This laboratory used an SNP-based approach as the main analysis and identified a large number of
SNPs between cluster isolates, including between the technical replicates, making the cluster identification unclear. If the laboratory had instead identified the cluster using cgMLST results, the correct cluster could have been identified more easily. Laboratory 106 reported the correct cluster by two SNP analyses with different mappers and variant callers. Neither of the analysis results were directly comparable to the other participants, likely due to the inclusion of the remote S. Dublin isolate in the analyses causing a large decrease of the core genome. However, it is likely that the BWA/GATK analysis would show the best correspondence since it did not show differences between the technical replicates. Furthermore, the analysis steps are more similar to those reported by other laboratories.
High similarity was seen for the reported cgMLST results based on Enterobase (0–3 allele differences within the cluster). Only one laboratory reported higher allele differences using this scheme (0–9 allele differences within the cluster). Other schemes used for allele-based analysis (wgMLST) showed similar results, with up to 6 allele differences within the cluster. Outside the cluster, the reported allelic differences were 31–1 793 based on cgMLST/Enterobase and up to 2 364 using wgMLST. This highlights the potential of cgMLST for standardisation and
improved inter-laboratory comparability for cluster definitions.
Cluster data were based on a real international outbreak linked to eggs in 2017. The distances within the cluster were calculated by the EQA provider to be 0–6 SNP distances and 0–3 cgMLST differences. Most of the participants correctly identified the cluster, but only one laboratory stated the need for additional epidemiological data before including the fourth isolate (distance 7 SNPs) into the cluster. The EQA provider acknowledged that epidemiological information is important for any outbreak investigation and neither microbiological nor epidemiological data can stand on its own. Nevertheless, epidemiological data were not included in this EQA. This also shows that a variable ’cut-off’ is needed for different outbreak situations.
Of the reported SNP results, all but one were largely comparable to allele-based results as far as cluster isolates are concerned. Longer distances were reported to the non-cluster isolates, which is likely caused by SNPs in regions not included in allele schemes or multiple SNPs in the same locus. The inclusion of the remote S. Dublin isolate negates this effect due to a smaller core genome. For most intents and purposes, the reported SNP and allele distances are sufficiently similar for inter-laboratory comparability and shared cluster definitions. The reported
results give no clear indication on the influence the choice of analysis tools (assembler, allele calling method and software) has on the number of allele differences. According to results from laboratory 106, there may be an influence on the choice of mapper and variant caller when calculating SNP distances, but no clear recommendations can be made. The choice of scheme (cgMLST or wgMLST) has an influence on reported allele differences, particularly outside the cluster. Likewise, the inclusion of remote isolates has an influence on the distances reported in SNP analysis.
Participants reported the QC checks (quantitative and qualitative) used on their data before analysis and submission. Coverage was reported by the majority of laboratories (91%) and allele calling for cgMLST was reported by six (55%). Assembly length and quality, as well as species confirmation, were reported by all six laboratories (55%). In order to compare the quality of raw data, the EQA provider analysed the submitted raw reads to obtain selected QC measures. The three discarded sequences all had very low coverage, but many of the remaining submitted sequences had depths that vastly exceeded QC thresholds for coverage reported by the participants.

Eighth external quality assessment scheme for Salmonella typing TECHNICAL REPORT
34
5 Conclusions
Twenty-four laboratories participated in the EQA-8 scheme: 17 laboratories (71%) performed PFGE and 13 (54%) performed MLVA. In the new part with cluster identification using molecular typing methods (PFGE, MLVA or/and WGS), 13 laboratories (54%) participated. Five laboratories (21%) completed all three parts of the EQA.
One new participant enrolled in the PFGE part. Seven laboratories who previously participated in PFGE (EQA-7) no longer participated in the PFGE part. Three of them did not participate in the EQA scheme at all and four participated only in the MLVA or cluster parts using WGS.
One new participant was enrolled in the MLVA part after MLVA for S. Enteritidis was included in the EQA. Two laboratories who previously participated in MLVA (EQA-7) no longer participated in the MLVA part. One did not participate in the EQA-scheme at all, while the other participated only in the cluster part using WGS.
The majority of participants (14/17; 82%) were able to produce a PFGE gel of sufficiently high quality to allow for
inter-laboratory comparison of profiles. The comparability of profiles between laboratories primarily relies on the use of correct running conditions, good quality image acquisition and distinct bands. The subsequent normalisation and interpretation of profiles in BN were performed by 11 of participants (64%) in the PFGE part, a decrease compared with EQA-7. All but one analysed their gels in accordance with guidelines for producing inter-laboratory-comparable gels. Despite the new design of the gel analysis (of a provided gel), which revealed differences in the ability to assign correct double bands, all laboratories scored 2 or above in the parameter band assignment.
In EQA-8, participation in the MLVA part was possible for both S. Typhimurium and S. Enteritidis. The performance level was high for both schemes: nine laboratories (75%) reported correct allelic profiles for all test isolates in each. Except for one laboratory, all errors were caused by missing the presence of a locus fragment or reporting a fragment that was absent.
Incorporating a molecular typing-based cluster analysis in this EQA is up to date with the development of surveillance methods used by PH NRLs in Europe. This adjustment of the EQA seems in some degree to be accepted by the Member States, but an overall decrease in the numbers of participants was seen and only 13 of the 24 laboratories participating in EQA-8 (54%) performed cluster analysis using either PFGE, MLVA and/or WGS-derived data. Only one laboratory did not identify the correct cluster using PFGE, caused by including too many band differences in the cluster and one laboratory using WGS. During the next scheduled adjustment of the EQA scheme, where gel quality and analysis (PFGE part) is removed, the overall number of participants may possibly decrease further.
In total, 11 laboratories performed cluster analysis using WGS-derived data. Performance was high, with 10 of the participants (91%) correctly identifying the cluster of closely related isolates, but two laboratories only identified a cluster of three isolates: one due to data quality not meeting the laboratory’s own QC limits for one of the cluster isolates and the other specifying the need for additional epidemiological investigation before inclusion of the isolate.
Most laboratories preferred an allele-based method, as 64% (7/11) used cgMLST and 36% (4/11) used SNP as the main reported cluster analysis. The use of a standard cgMLST scheme (e.g. Enterobase) gives a very high degree of homogeneity in the results, but both SNP- and allele-based methods seem to be useful for inter-laboratory comparability and communication about cluster definitions. More challenges can appear if a non-standardised SNP analysis is used for comparison and communication between laboratories. Another difficulty is illustrated by data from one laboratory, where including a remote isolate (S. Dublin) in SNP analysis resulted in a reduced core genome and consequently fewer SNPs.
The current EQA scheme for typing of Salmonella enterica subsp. enterica is the eighth organised for laboratories in FWD-Net. The molecular surveillance system implemented as part of TESSy relies on the capacity of FWD-Net laboratories to produce analysable and comparable typing results in a central database. WGS-based typing for surveillance is increasingly used in EU. In 2018, it is planned to allow WGS variables for L. monocytogenes to be submitted to the TESSy database. It is anticipated that member states will also be able to upload WGS variables for Salmonella to the TESSy database in the near future.
TECHNICAL REPORT Eighth external quality assessment scheme for Salmonella typing
35
6 Recommendations
6.1 Laboratories The PFGE gel quality is directly dependent on the quality of the laboratory procedure. Therefore, it is strongly recommended that the protocol be followed strictly. The parameters ‘Bands’ and ‘Image acquisition and running conditions’ caused the most problems in both this and the previous EQA. It should therefore be emphasised that individual laboratories should use the EQA results and feedback for a thorough evaluation of their laboratory procedures and equipment. Laboratories are encouraged to use the possibility of rerunning the test isolates after adjustment of the procedures and submitting the new PFGE gel for assessment.
Although the vast majority of the participant’s profiles were correct in the MLVA part, a few laboratories with repeated errors could use the possibility of repeating the MLVA analysis and submit the results for troubleshooting.
S. Enteritidis and S. Typhimurium are the two most common serovars in Europe and MLVA typing provides high discrimination within isolates of both serovars. Only half of the participants (54%) performed either MLVA for S. Typhimurium and/or S. Enteritidis. Some of the laboratories, who are not moving towards the use of WGS at this stage, could benefit from implementing MLVA because of its low-cost, easy analysis and interpretation compared to WGS.
One participant in the WGS based cluster analysis experienced that the generated sequences did not meet their own QC criteria. Participants are encouraged to assign sufficient resources to repeat failed analysis if necessary.
For one laboratory, a more conservative SNP calling would facilitate better cluster delineation.
Despite good consistency in the results, further standardization of analysis parameters could be relevant for improving inter-laboratory comparability.
The laboratories are encouraged to submit their high quality typing data to TESSy as close to real time as possible.
The laboratories should try to submit results for all methods and parts of the EQA as signing up for.
6.2 ECDC and FWD-Net ECDC will encourage more participants to take part in the new molecular typing-based cluster analysis, also participants who have not previously participated in the PFGE gel analysis or MLVA part.
ECDC will continuously aim to include and assist new participants in getting even better, potentially with training or workshops.
ECDC plans to standardise the TESSy system for use of MLST and cgMLST nomenclature.
6.3 EQA provider This year, the EQA provider changed the invitation letter to also contain recommended methods and a short description of the molecular typing-based cluster analysis. The requirements for submission and evaluation criteria were also listed. The submission protocol was short and precise, but some laboratories did not follow protocol regarding the labelling of FASTQ files. In the next round, the participants will be asked to rename their files.
The link to the online registration and submission were sent to the national focal point of FWD-Net and the subsequent need to circulate this to the relevant person within the institute occasionally caused misunderstandings and delays. The participants will be made aware of this issue in the next round.
As PFGE will remain in the cluster analysis, a short guide on when to assign double bands and perform cluster analysis using PFGE could possibly increase participant comfort in participating in cluster analysis.
In the next round of EQAs, laboratories will also have the possibility to submit the ST of isolates in cluster analysis. They will also be asked to report the number of loci in the used allelic schemes and the name of the used SNP pipeline if publicly available.
The EQA provider will try to give the participants more time to test and report the results.
Eighth external quality assessment scheme for Salmonella typing TECHNICAL REPORT
36
References
1. Regulation (EC) No 851/2004 of the European Parliament and of the Council of 21 April 2004 establishing a European centre for disease prevention and control, Article 5.3. Available from: http://ecdc.europa.eu/en/aboutus/Key%20Documents/0404_KD_Regulation_establishing_ECDC.pdf.
2. Decision No 1082/2013/EU of the European Parliament and the Council 22 October 2013 on serious cross-border threats to health and repealing Decision No 2119/98/EC (Text with EEA relevance). Available from: http://ec.europa.eu/health/preparedness_response/docs/decision_serious_crossborder_threats_22102013_en.pdf.
3. European Food Safety Authority and European Centre for Disease Prevention and Control. The European Union summary report on trends and sources of zoonoses, zoonotic agents and food-borne outbreaks in 2016. EFSA Journal. 2017;15(12):5077. Available from: http://ecdc.europa.eu/publications-data/european-
union-summary-report-trends-and-sources-zoonoses-zoonotic-agents-and-9.
4. European Centre for Disease Prevention and Control. Laboratory standard operating procedure for MLVA of Salmonella enterica serotype Typhimurium. Stockholm: ECDC; 2011. Available from: http://ecdc.europa.eu/publications-data/laboratory-standard-operating-procedure-mlva-salmonella-enterica-serotype.
5. European Centre for Disease Prevention and Control. Laboratory standard operating procedure for multiple-locus variable-number tandem repeat analysis of Salmonella enterica serotype Enteritidis. Stockholm: ECDC; 2016. Available from: http://ecdc.europa.eu/publications-data/laboratory-standard-operating-procedure-multiple-locus-variable-number-tandem.
6. International Organisation for Standardization. ISO/IEC 17043:2010: Conformity assessment -- General requirements for proficiency testing. ISO: Geneva, 2010. Available from: http://www.iso.org/iso/catalogue_detail.htm?csnumber=29366.
7. European Centre for Disease Prevention and Control and European Food Safety Authority. Multi-country outbreak of Salmonella Enteritidis infections linked to Polish eggs, 12 December 2017. ECDC and EFSA: Stockholm and Parma; 2017. Available from: http://ecdc.europa.eu/publications-data/joint-rapid-outbreak-assessment-multi-country-outbreak-salmonella-enteritidis-0.
8. PulseNet International. Standard operating procedure for PulseNet of Escherichia coli O157:H7, Salmonella serotypes, Shigella sonnei and Shigella flexneri. Wellington: Institute of Environment Science and Research; 2013. Available from: http://www.pulsenetinternational.org/assets/PulseNet/uploads/pfge/PNL05_Ec-Sal-ShigPFGEprotocol.pdf.
9. Warwick Medical School. EnteroBase [Internet]. Coventry: University of Warwick; 2018 [cited 21 August 2018]. Available from: http://enterobase.warwick.ac.uk.
10. Sahl JW, Lemmer D, Travis J, Schupp JM, Gillece JD, Aziz M, et al. NASP: an accurate, rapid method for the identification of SNPs in WGS datasets that supports flexible input and output formats. Microb Genom. 2016
Aug 25;2(8):e000074.
11. Statens Serum Institut. SerumQC [Internet]. Copenhagen: SSI; 2018 [cited 21 August 2018]. Available from: http://www.github.com/ssi-dk/SerumQC.
12. Deng X, Shariat N, Driebe EM, Roe CC, Tolar B, Trees E, et al. Comparative Analysis of Subtyping Methods against a Whole-Genome-Sequencing Standard for Salmonella enterica Serotype Enteritidis. J Clin Microbiol. 2015 Jan;53(1):212-8.
13. Pearce ME, Alikhan N, Dallman TJ, Zhou Z, Grant K, Maiden MCJ. 2018. Comparative analysis of core genome MLST and SNP typing within a European Salmonella serovar Enteritidis outbreak. Int J Food Microbiol. 2018 Jun 2:274:1-11.

TECHNICAL REPORT Eighth external quality assessment scheme for Salmonella typing
37
Annex 1. List of participants
Country Laboratory National institute
Austria NRC Salmonella Austria Institute for Medical Microbiology and Hygiene Graz, AGES
Belgium National Reference Centre Salmonella Scientific Institute Public Health
Czech Republic
National Reference Laboratory for Salmonella The National Institute of Public Health
Denmark Foodborne Infections Statens Serum Institut
Estonia Laboratory of Communicable Diseases Health Board
Finland Expert Microbiology National Institute for Health and Welfare
France CNR Escherichia coli, Shigella and Salmonella Institut Pasteur
Germany National Reference Centre for Salmonella and
Other Bacterial Enteric Pathogens Robert Koch Institute
Greece National Reference Laboratory for Salmonella National School of Public Health
Hungary Department of Phage-Typing and Molecular
Epidemiology National Public Health Institute
Ireland National Salmonella, Shigella and Listeria
Reference Laboratory University Hospital Galway
Italy Department of Infectious Diseases Istituto Superiore di Sanità
Latvia National Microbiology Reference Laboratory Infectology Centre of Latvia, Riga East University Hospital
Lithuania National Public Health Surveillance Laboratory Nacionaline Visuomenes Sveikatos Prieziuros Laboratorija
Luxembourg Epidémiologie et Génomique Microbienne Laboratoire National de Santé
Netherlands Centre for Infectious Diseases Research,
Diagnostics and Screening National Institute for Public Health and the Environment
Norway National Reference Laboratory for
Enteropathogenic Bacteria Norwegian Institute of Public Health
Romania Molecular Epidemiology Laboratory Cantacuzino National Institute of Research
Serbia Laboratory for Molecular Microbiology Public Health Institute Of Serbia, Center for Microbiology
Slovakia NRC for Salmonelloses Public Health Authority of the Slovak Republic
Slovenia Department for Public Health Microbiology National Laboratory of Health, Environment and Food,
Centre for Medical Microbiology
Spain Unit of Enterobacteriaceae Instituto de Salud Carlos III, Centro Nacional de
Microbiología
Sweden MI-LB Folkhälsomyndigheten
UK (England) Gastrointestinal Bacterial Reference Unit Public Health England
Eighth external quality assessment scheme for Salmonella typing TECHNICAL REPORT
38
Annex 2. Participation overview EQA-7 and 8
2016 to 2017 (EQA-7) 2017 to 2018 (EQA-8)
Total PFGE MLVA Total PFGE MLVA Cluster
Laboratory All Gel quality Gel
analysis STm All Gel quality
Gel
analysis STm SE PFGE MLVA WGS
19 X X X X X X X X X X X X
36 X X X X X X X X X
49 X X X X X X
55 X X X X X X X X
88 X X
92 X X X X X X X
96 X X X X
100 X X X X X X X X X
106 X X X X X X X
108 X X X X X X X X X
114 X X
127 X X
128 X X X X X X
129 X X X X X X X X
130 X X X X X X
132 X X X
134 X X X X X X X X X X X
135* X X X X X X X
138 X X X X
140 X X X X
142 X X X X X X X X X X X X
144 X X X X X X X
145 X X X X
147 X X X X X X X X X X
148 X X X X X X X X
149 X X X X X
150 X X
180 X X
Number of participants 26 24 17 14 24 17 11 12 12 4 4 11
*: previously laboratory 77
TECHNICAL REPORT Eighth external quality assessment scheme for Salmonella typing
39
Annex 3. TIFF quality grading guidelines EQA-8
Grade [score in points]
Parameter Poor [1] Fair [2] Good [3] Excellent [4]
Image acquisition
and running
conditions
-Gel does not fill whole TIFF
and band finding is highly
affected
-Bottom band of standard not
1–1.5 cm from the base of the
gel and analysis is strongly
affected
-Band spacing of standards
does not match global
standard and analysis is
strongly affected
-Too few reference lanes
included
-Gel does not fill whole TIFF
and band finding is slightly
affected
-Wells not included on TIFF
-Bottom band of standard not
1–1.5 cm from the base of the
gel and analysis is slightly
affected
-Band spacing of standards
does not match global
standard and analysis is
slightly affected
-Gel does not fill whole TIFF,
but band finding is not
affected
-Bottom band of standard not
1–1.5 cm from the base of the
gel, but analysis is not affected
By protocol, for example:
-Gel fills whole TIFF
-Wells included on TIFF
-Bottom band of standard1–
1.5 cm from the base of the
gel
Cell suspensions Cell concentrations are uneven
from lane to lane, making
analysis impossible
-More than two lanes contain
darker or lighter bands than
the other lanes.
-At least one lane is much
darker or lighter than the other
lanes, making the gel difficult
to analyse.
One or two lanes contain
darker or lighter bands than
the other lanes
Cell concentration is
approximately the same in
each lane
Bands -Band distortion making
analysis difficult
-Very fuzzy bands
-Many bands too thick to
distinguish
-Bands at the base of the gel
too light to distinguish
- Some band distortion (i.e.
nicks) in two or three lanes,
but still analysable
-Fuzzy bands
-Some bands (four or five) are
too thick
-Bands at the bottom or top of
the gel are light but still
analysable
-Slight band distortion in one
lane, but analysis is not
affected
-Bands are slightly fuzzy
and/or slanted
-A few bands (three or less)
are difficult to see clearly (i.e.
DNA overload) especially at
the bottom of the gel
Clear and distinct all the way
to the bottom of the gel
Lanes ‘Smiling’ or curving affecting
analysis
-Significant ‘smiling’
-Slight curves on the outside
lanes, but still analysable
-Slight ‘smiling’ (higher bands
in outside lanes than inside)
-Slight curving
-Lanes gradually run longer
towards the right or left, but
still analysable
Straight
Restriction -More than one lane with
several shadow bands
-Lots of shadow bands over
the whole gel
-One lane with many shadow
bands
-A few shadow bands spread
out over several lanes
One or two faint shadow
bands
Complete restriction in all lanes
Gel background Lots of debris present, making
analysis impossible
-Some debris present that may
or may not make analysis
difficult (i.e. auto band search
finds too many bands)
-Background caused by
photographing a gel with very
light bands (image contrast
was enhanced making the
image look grainy)
-Mostly clear background
-Minor debris not affecting
analysis
Clear
DNA degradation
(smearing in lanes)
Smearing making several
lanes unanalysable
-Significant smearing in one or
two lanes that may or may not
make analysis difficult
-Minor background (smearing)
in many lanes
Minor background (smearing)
in a few lanes, but bands are
clear
Not present
Eighth external quality assessment scheme for Salmonella typing TECHNICAL REPORT
40
Annex 4. BioNumerics gel analysis quality guidelines EQA-8
Parameter Grade [score in points]
Poor [1] Fair [2] Excellent [3]
Position of gel
frame
-Wells wrongly included when
placing the frame
-Gel not inverted
-Fframe is positioned too low
-Too much space framed at the
bottom of the gel
-Too much space framed on the
sides of the gel
Excellent placement of frame and
gel is inverted
Strips Lanes incorrectly defined -Lanes are defined too narrowly
(or widely)
-Lanes are defined outside profile
-A single lane is not correctly
defined
All lanes correctly defined
Curves Curve set so that artefacts will
cause wrong band assignment
-Curve extraction is defined
either too narrowly or including
almost the whole lane
1/3 or more of the lane is used
for averaging curve extraction
Normalisation -Many bands not assigned in
reference lanes
-References were not included
when submitting the data
-Assignment of band(s) in
reference lane(s) to incorrect
size(s)
-Bottom bands <33kb are not
assigned in some or all of the
reference lanes
-Some bands wrongly assigned in
reference lane(s)
All bands correctly assigned in all
reference lanes
Band
assignment
-Incorrect band assignment
making inter-laboratory
comparison impossible
-Few shadow bands assigned*
-Few bands not assigned*
-Few double bands assigned as
single bands or single bands
assigned as double bands
-Few bands are not assigned
-Bands below <33kb assigned*
Excellent band assignment
*: Compared with 2016 guidelines, sentences were added to ‘Band assignment’ parameter. Compared with previous EQAs, in the gel analysis part, participants analysed a provided gel instead of their own.
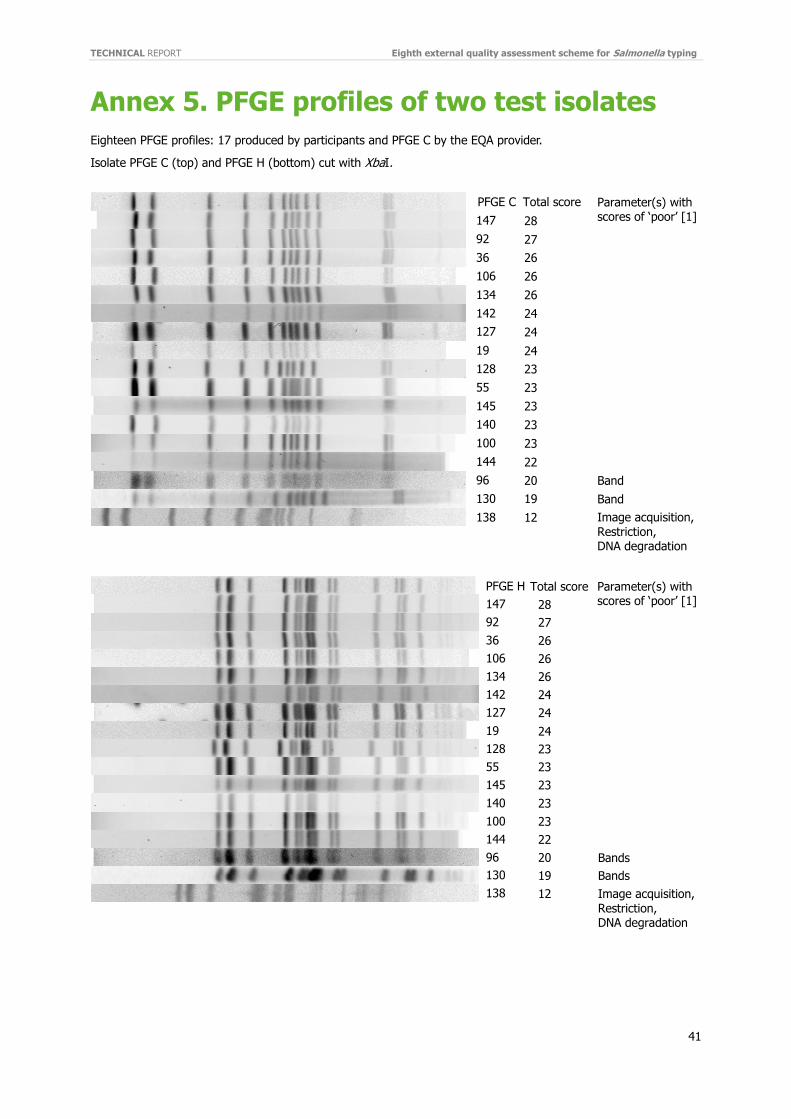
TECHNICAL REPORT Eighth external quality assessment scheme for Salmonella typing
41
Annex 5. PFGE profiles of two test isolates
Eighteen PFGE profiles: 17 produced by participants and PFGE C by the EQA provider.
Isolate PFGE C (top) and PFGE H (bottom) cut with XbaI.
PFGE C Total score 28 27 26 26 26 24 24 24 23 23 23 23 23 22 20 19 12
Parameter(s) with scores of ‘poor’ [1]
Band
s Bands Image acquisition, Restriction, DNA degradation
147 92 36 106 134 142 127 19 128 55 145 140 100 144 96 130 138
PFGE H 147 92 36 106 134 142 127 19 128 55 145 140 100 144 96 130 138
Total score 28 27 26 26 26 24 24 24 23 23 23 23 23 22 20 19 12
Parameter(s) with scores of ‘poor’ [1]
Bands Bands Image acquisition, Restriction, DNA degradation

Eighth external quality assessment scheme for Salmonella typing TECHNICAL REPORT
42
Annex 6. Scores of PFGE results
Gel quality
Participant scores 1–4 (Poor, Fair, Good, Excellent) obtained for each of the seven TIFF quality grading guidelines parameters and the total score.
BN analysis
Participant scores 1–3 (Poor, Fair, Excellent) obtained for each of the five BioNumerics Gel Analysis Quality Guidelines parameters and the total score.
Laboratory ID
Parameters 19 36 55 92 96 100 106 128 129 130 134 138 140 142 144 145 147
Image acquisition and running conditions 3 4 3 4 3 4 3 3 4 4 4 1 3 3 3 3 4
Cell suspension 3 4 4 4 4 3 4 3 3 2 4 2 4 4 3 4 4
Bands 4 4 2 4 1 3 4 3 3 1 4 2 4 3 3 3 4
Lanes 3 3 3 3 4 3 4 4 3 4 3 3 3 4 4 3 4
Restriction 4 4 4 4 4 4 4 4 4 4 4 1 2 4 3 4 4
Gel background 4 3 4 4 2 3 3 3 4 2 4 2 3 4 3 4 4
DNA degradation 3 4 3 4 2 3 4 3 3 2 3 1 4 2 3 2 4
Total quality 24 26 23 27 20 23 26 23 24 19 26 12 23 24 22 23 28
Laboratory ID
Parameters 19 36 55 92 96 100 106 128 129 130 134 138 140 142 144 145 147
Position of the gel 3 3 3 2 - 3 3 1 - 2 3 - - 3 - - 3
Strips 3 3 3 2 - 3 3 2 - 3 3 - - 3 - - 3
Curves 3 3 3 3 - 3 2 2 - 3 3 - - 3 - - 3
Normalisation 3 3 3 3 - 3 3 1 - 3 3 - - 3 - - 3
Band assignment 3 3 2 2 - 2 2 2 - 2 2 - - 3 - - 3
Total quality 15 15 14 12 - 14 13 8 - 13 14 - - 14 - - 14
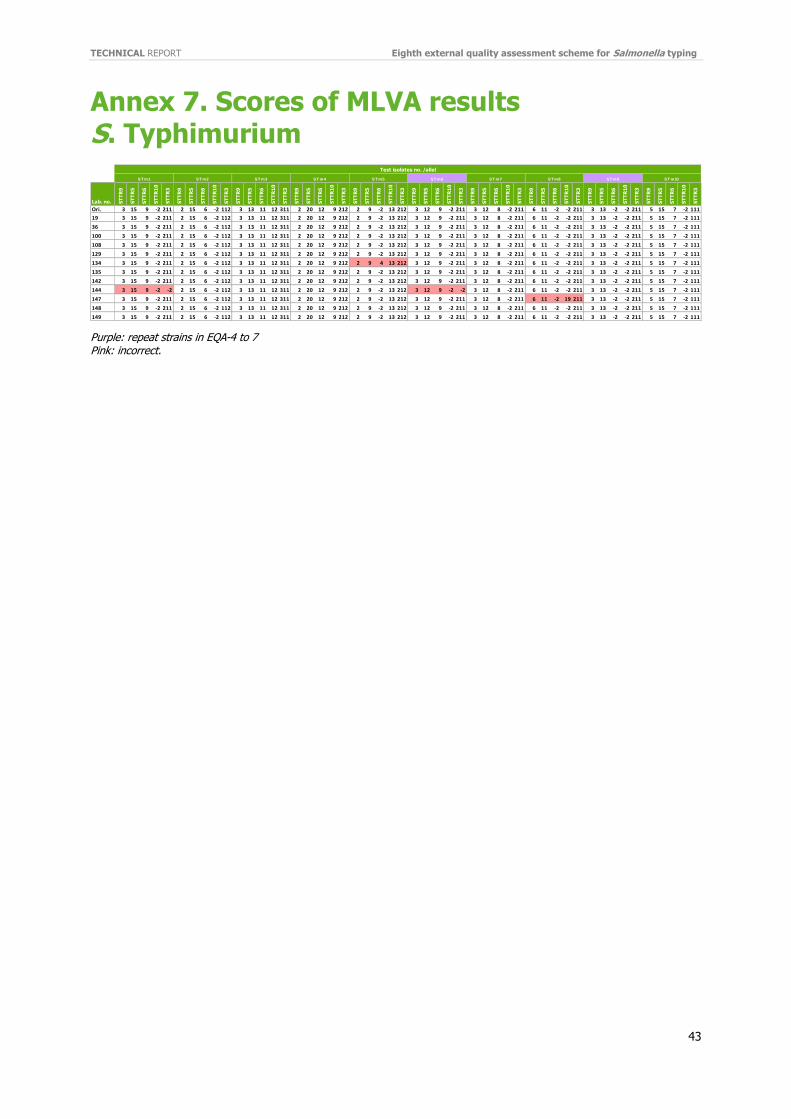
TECHNICAL REPORT Eighth external quality assessment scheme for Salmonella typing
43
Annex 7. Scores of MLVA results S. Typhimurium
Purple: repeat strains in EQA-4 to 7 Pink: incorrect.
Lab. no. ST
TR
9
ST
TR
5
ST
TR
6
ST
TR
10
ST
TR
3
ST
TR
9
ST
TR
5
ST
TR
6
ST
TR
10
ST
TR
3
ST
TR
9
ST
TR
5
ST
TR
6
ST
TR
10
ST
TR
3
ST
TR
9
ST
TR
5
ST
TR
6
ST
TR
10
ST
TR
3
ST
TR
9
ST
TR
5
ST
TR
6
ST
TR
10
ST
TR
3
ST
TR
9
ST
TR
5
ST
TR
6
ST
TR
10
ST
TR
3
ST
TR
9
ST
TR
5
ST
TR
6
ST
TR
10
ST
TR
3
ST
TR
9
ST
TR
5
ST
TR
6
ST
TR
10
ST
TR
3
ST
TR
9
ST
TR
5
ST
TR
6
ST
TR
10
ST
TR
3
ST
TR
9
ST
TR
5
ST
TR
6
ST
TR
10
ST
TR
3
Ori. 3 15 9 -2 211 2 15 6 -2 112 3 13 11 12 311 2 20 12 9 212 2 9 -2 13 212 3 12 9 -2 211 3 12 8 -2 211 6 11 -2 -2 211 3 13 -2 -2 211 5 15 7 -2 111
19 3 15 9 -2 211 2 15 6 -2 112 3 13 11 12 311 2 20 12 9 212 2 9 -2 13 212 3 12 9 -2 211 3 12 8 -2 211 6 11 -2 -2 211 3 13 -2 -2 211 5 15 7 -2 111
36 3 15 9 -2 211 2 15 6 -2 112 3 13 11 12 311 2 20 12 9 212 2 9 -2 13 212 3 12 9 -2 211 3 12 8 -2 211 6 11 -2 -2 211 3 13 -2 -2 211 5 15 7 -2 111
100 3 15 9 -2 211 2 15 6 -2 112 3 13 11 12 311 2 20 12 9 212 2 9 -2 13 212 3 12 9 -2 211 3 12 8 -2 211 6 11 -2 -2 211 3 13 -2 -2 211 5 15 7 -2 111
108 3 15 9 -2 211 2 15 6 -2 112 3 13 11 12 311 2 20 12 9 212 2 9 -2 13 212 3 12 9 -2 211 3 12 8 -2 211 6 11 -2 -2 211 3 13 -2 -2 211 5 15 7 -2 111
129 3 15 9 -2 211 2 15 6 -2 112 3 13 11 12 311 2 20 12 9 212 2 9 -2 13 212 3 12 9 -2 211 3 12 8 -2 211 6 11 -2 -2 211 3 13 -2 -2 211 5 15 7 -2 111
134 3 15 9 -2 211 2 15 6 -2 112 3 13 11 12 311 2 20 12 9 212 2 9 4 13 212 3 12 9 -2 211 3 12 8 -2 211 6 11 -2 -2 211 3 13 -2 -2 211 5 15 7 -2 111
135 3 15 9 -2 211 2 15 6 -2 112 3 13 11 12 311 2 20 12 9 212 2 9 -2 13 212 3 12 9 -2 211 3 12 8 -2 211 6 11 -2 -2 211 3 13 -2 -2 211 5 15 7 -2 111
142 3 15 9 -2 211 2 15 6 -2 112 3 13 11 12 311 2 20 12 9 212 2 9 -2 13 212 3 12 9 -2 211 3 12 8 -2 211 6 11 -2 -2 211 3 13 -2 -2 211 5 15 7 -2 111
144 3 15 9 -2 -2 2 15 6 -2 112 3 13 11 12 311 2 20 12 9 212 2 9 -2 13 212 3 12 9 -2 -2 3 12 8 -2 211 6 11 -2 -2 211 3 13 -2 -2 211 5 15 7 -2 111
147 3 15 9 -2 211 2 15 6 -2 112 3 13 11 12 311 2 20 12 9 212 2 9 -2 13 212 3 12 9 -2 211 3 12 8 -2 211 6 11 -2 19 211 3 13 -2 -2 211 5 15 7 -2 111
148 3 15 9 -2 211 2 15 6 -2 112 3 13 11 12 311 2 20 12 9 212 2 9 -2 13 212 3 12 9 -2 211 3 12 8 -2 211 6 11 -2 -2 211 3 13 -2 -2 211 5 15 7 -2 111
149 3 15 9 -2 211 2 15 6 -2 112 3 13 11 12 311 2 20 12 9 212 2 9 -2 13 212 3 12 9 -2 211 3 12 8 -2 211 6 11 -2 -2 211 3 13 -2 -2 211 5 15 7 -2 111
Test isolates no. /allel
ST m7 ST m8 ST m9 ST m10ST m1 ST m2 ST m3 ST m4 ST m5 ST m6
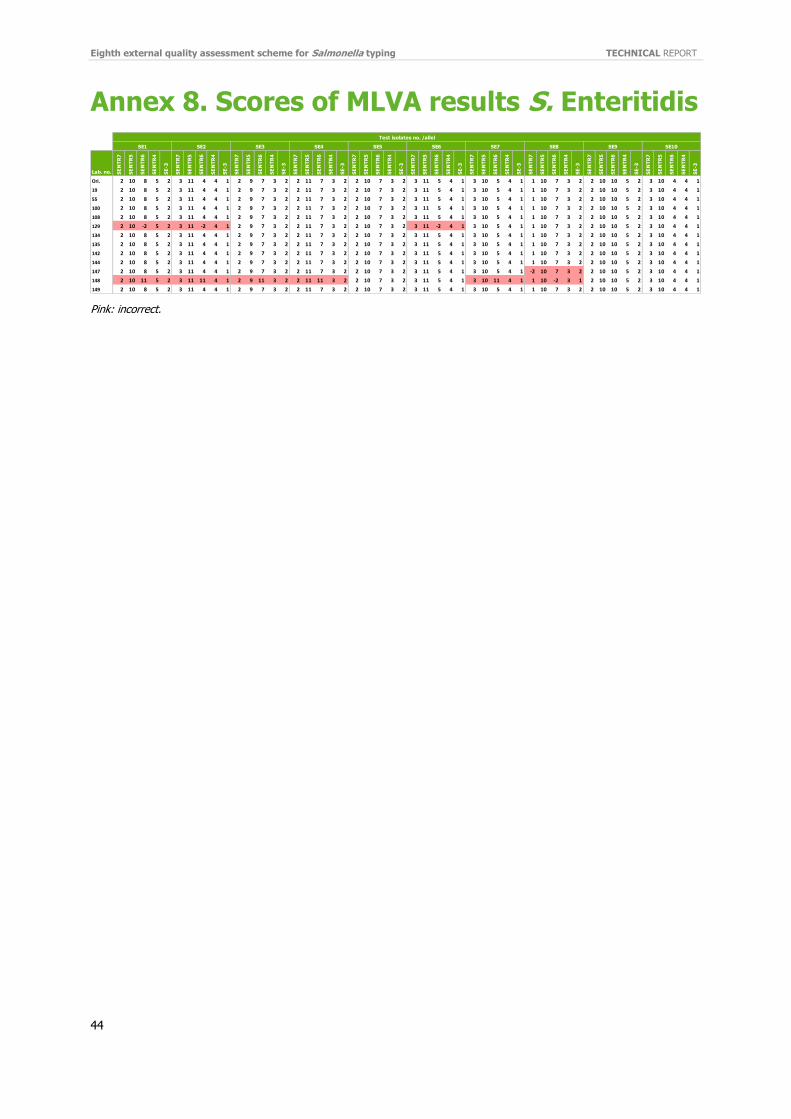
Eighth external quality assessment scheme for Salmonella typing TECHNICAL REPORT
44
Annex 8. Scores of MLVA results S. Enteritidis
Pink: incorrect.
Lab. no. SE
NT
R7
SE
NT
R5
SE
NT
R6
SE
NT
R4
SE
-3
SE
NT
R7
SE
NT
R5
SE
NT
R6
SE
NT
R4
SE
-3
SE
NT
R7
SE
NT
R5
SE
NT
R6
SE
NT
R4
SE
-3
SE
NT
R7
SE
NT
R5
SE
NT
R6
SE
NT
R4
SE
-3
SE
NT
R7
SE
NT
R5
SE
NT
R6
SE
NT
R4
SE
-3
SE
NT
R7
SE
NT
R5
SE
NT
R6
SE
NT
R4
SE
-3
SE
NT
R7
SE
NT
R5
SE
NT
R6
SE
NT
R4
SE
-3
SE
NT
R7
SE
NT
R5
SE
NT
R6
SE
NT
R4
SE
-3
SE
NT
R7
SE
NT
R5
SE
NT
R6
SE
NT
R4
SE
-3
SE
NT
R7
SE
NT
R5
SE
NT
R6
SE
NT
R4
SE
-3
Ori. 2 10 8 5 2 3 11 4 4 1 2 9 7 3 2 2 11 7 3 2 2 10 7 3 2 3 11 5 4 1 3 10 5 4 1 1 10 7 3 2 2 10 10 5 2 3 10 4 4 1
19 2 10 8 5 2 3 11 4 4 1 2 9 7 3 2 2 11 7 3 2 2 10 7 3 2 3 11 5 4 1 3 10 5 4 1 1 10 7 3 2 2 10 10 5 2 3 10 4 4 1
55 2 10 8 5 2 3 11 4 4 1 2 9 7 3 2 2 11 7 3 2 2 10 7 3 2 3 11 5 4 1 3 10 5 4 1 1 10 7 3 2 2 10 10 5 2 3 10 4 4 1
100 2 10 8 5 2 3 11 4 4 1 2 9 7 3 2 2 11 7 3 2 2 10 7 3 2 3 11 5 4 1 3 10 5 4 1 1 10 7 3 2 2 10 10 5 2 3 10 4 4 1
108 2 10 8 5 2 3 11 4 4 1 2 9 7 3 2 2 11 7 3 2 2 10 7 3 2 3 11 5 4 1 3 10 5 4 1 1 10 7 3 2 2 10 10 5 2 3 10 4 4 1
129 2 10 -2 5 2 3 11 -2 4 1 2 9 7 3 2 2 11 7 3 2 2 10 7 3 2 3 11 -2 4 1 3 10 5 4 1 1 10 7 3 2 2 10 10 5 2 3 10 4 4 1
134 2 10 8 5 2 3 11 4 4 1 2 9 7 3 2 2 11 7 3 2 2 10 7 3 2 3 11 5 4 1 3 10 5 4 1 1 10 7 3 2 2 10 10 5 2 3 10 4 4 1
135 2 10 8 5 2 3 11 4 4 1 2 9 7 3 2 2 11 7 3 2 2 10 7 3 2 3 11 5 4 1 3 10 5 4 1 1 10 7 3 2 2 10 10 5 2 3 10 4 4 1
142 2 10 8 5 2 3 11 4 4 1 2 9 7 3 2 2 11 7 3 2 2 10 7 3 2 3 11 5 4 1 3 10 5 4 1 1 10 7 3 2 2 10 10 5 2 3 10 4 4 1
144 2 10 8 5 2 3 11 4 4 1 2 9 7 3 2 2 11 7 3 2 2 10 7 3 2 3 11 5 4 1 3 10 5 4 1 1 10 7 3 2 2 10 10 5 2 3 10 4 4 1
147 2 10 8 5 2 3 11 4 4 1 2 9 7 3 2 2 11 7 3 2 2 10 7 3 2 3 11 5 4 1 3 10 5 4 1 -2 10 7 3 2 2 10 10 5 2 3 10 4 4 1
148 2 10 11 5 2 3 11 11 4 1 2 9 11 3 2 2 11 11 3 2 2 10 7 3 2 3 11 5 4 1 3 10 11 4 1 1 10 -2 3 1 2 10 10 5 2 3 10 4 4 1
149 2 10 8 5 2 3 11 4 4 1 2 9 7 3 2 2 11 7 3 2 2 10 7 3 2 3 11 5 4 1 3 10 5 4 1 1 10 7 3 2 2 10 10 5 2 3 10 4 4 1
Test isolates no. /allel
SE7 SE8 SE9 SE10SE1 SE2 SE3 SE4 SE5 SE6

TECHNICAL REPORT Eighth external quality assessment scheme for Salmonella typing
45
Annex 9. EQA provider cluster analysis based on PFGE-derived data
PFGE_XbaI100
90
80
70
PFGE_XbaI
...
...
...
...
...
...
...
...
...
...
...
...
REF3
REF1
REF9
REF2
REF4
REF6
REF11
REF12
REF7
REF10
REF8
REF5
ST11
ST11
ST11
ST11
ST11
ST11
ST11
ST11
ST11
ST1925
ST183
ST10 (Dublin)
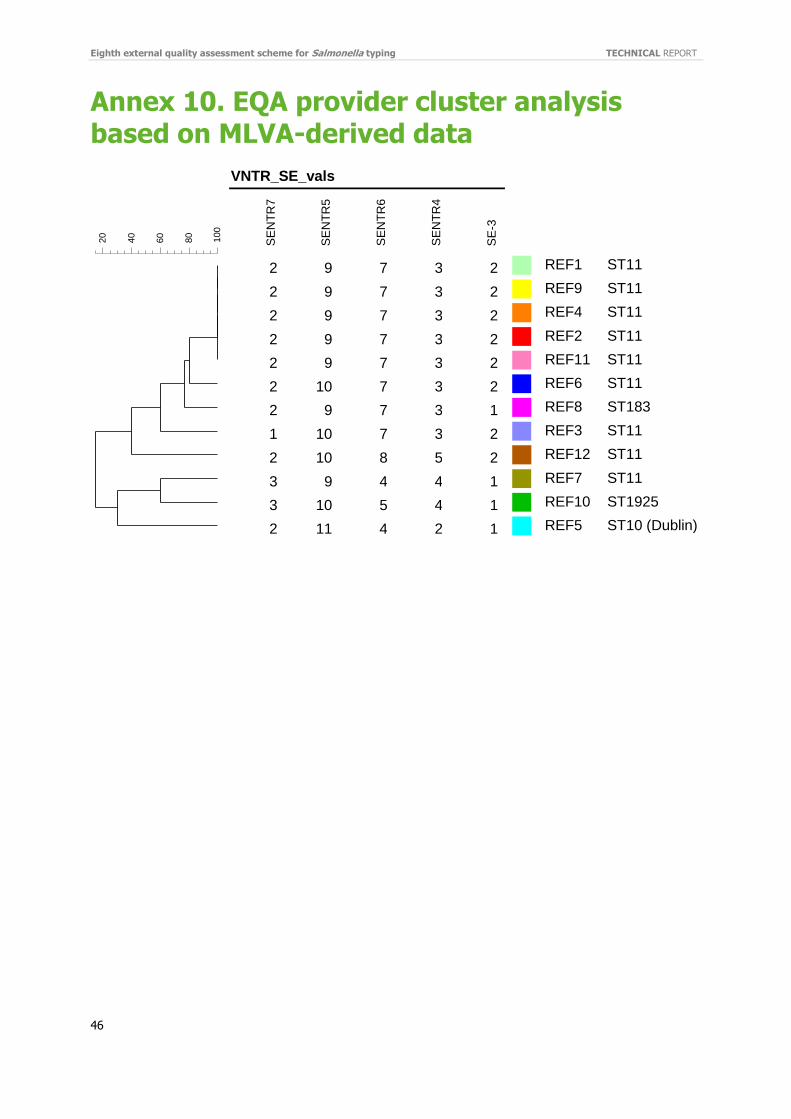
Eighth external quality assessment scheme for Salmonella typing TECHNICAL REPORT
46
Annex 10. EQA provider cluster analysis based on MLVA-derived data
100
80
60
40
20
VNTR_SE_vals
SE
NT
R7
SE
NT
R5
SE
NT
R6
SE
NT
R4
SE
-3
2 9 7 3 2
2 9 7 3 2
2 9 7 3 2
2 9 7 3 2
2 9 7 3 2
2 10 7 3 2
2 9 7 3 1
1 10 7 3 2
2 10 8 5 2
3 9 4 4 1
3 10 5 4 1
2 11 4 2 1
REF1
REF9
REF4
REF2
REF11
REF6
REF8
REF3
REF12
REF7
REF10
REF5
ST11
ST11
ST11
ST11
ST11
ST11
ST183
ST11
ST11
ST11
ST1925
ST10 (Dublin)
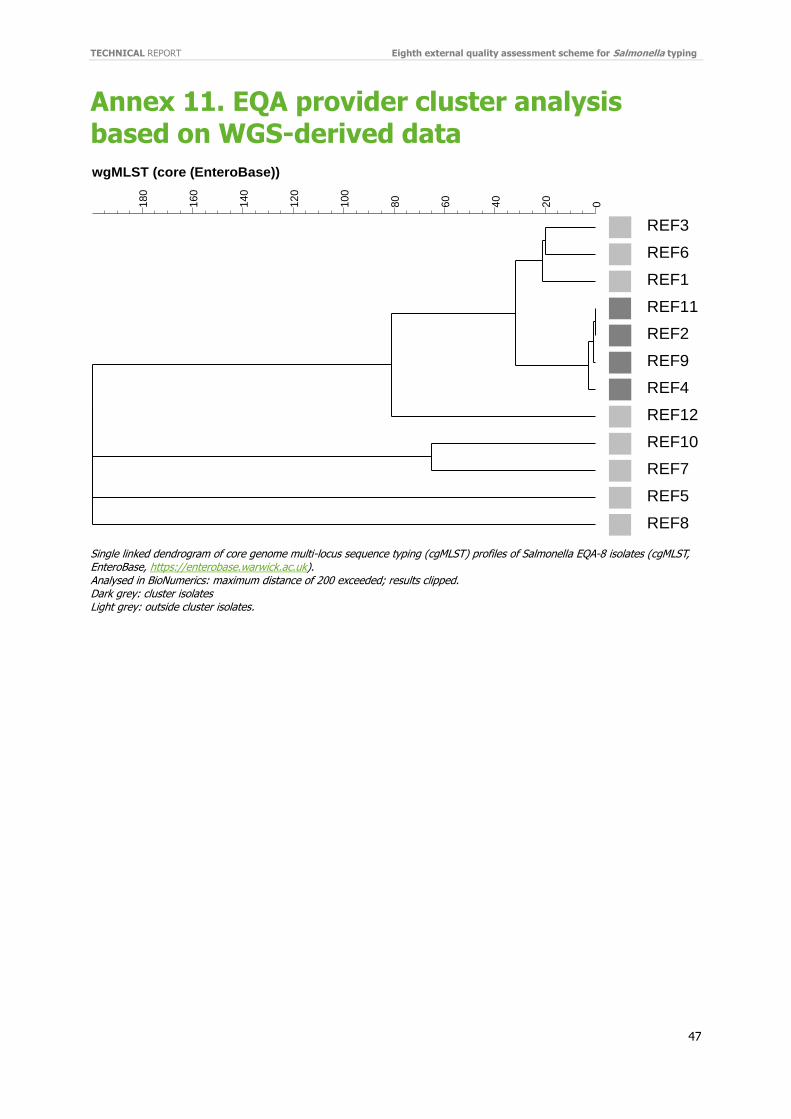
TECHNICAL REPORT Eighth external quality assessment scheme for Salmonella typing
47
Annex 11. EQA provider cluster analysis based on WGS-derived data
Single linked dendrogram of core genome multi-locus sequence typing (cgMLST) profiles of Salmonella EQA-8 isolates (cgMLST, EnteroBase, https://enterobase.warwick.ac.uk). Analysed in BioNumerics: maximum distance of 200 exceeded; results clipped. Dark grey: cluster isolates Light grey: outside cluster isolates.
wgMLST (core (EnteroBase))
020
40
60
80
100
120
140
160
180
...
...
...
...
...
...
...
...
...
...
...
...
.
.
.
.
.
.
.
.
.
.
.
.
REF3
REF6
REF1
REF11
REF2
REF9
REF4
REF12
REF10
REF7
REF5
REF8

Eighth external quality assessment scheme for Salmonella typing TECHNICAL REPORT
48
Annex 12. Reported cluster of closely related isolates based on PFGE-derived data
Laboratory Reported cluster Corresponding REF isolates Correct
Provider REF1, REF2, REF3, REF4, REF6, REF9, REF11
19 6196, 6508, 6613, 6884, 6934, 6075, 6453 REF1, REF3, REF6, REF11, REF9, REF4, REF2 Yes
55 6030, 6201, 6437, 6498, 6700, 6923, 6941 REF11, REF1, REF9, REF2 REF6, REF4, REF3 Yes
92 6047, 6070, 6120, 6171, 6298, 6301, 6333, 6165, 6355,
6589 REF3, REF4, REF11, REF1, REF2, REF8, REF6, REF12, REF10,
REF7 No
142 6103, 6166, 6182, 6239, 6329, 6426, 6672 REF6, REF2, REF3, REF1, REF4, REF9, REF11 Yes
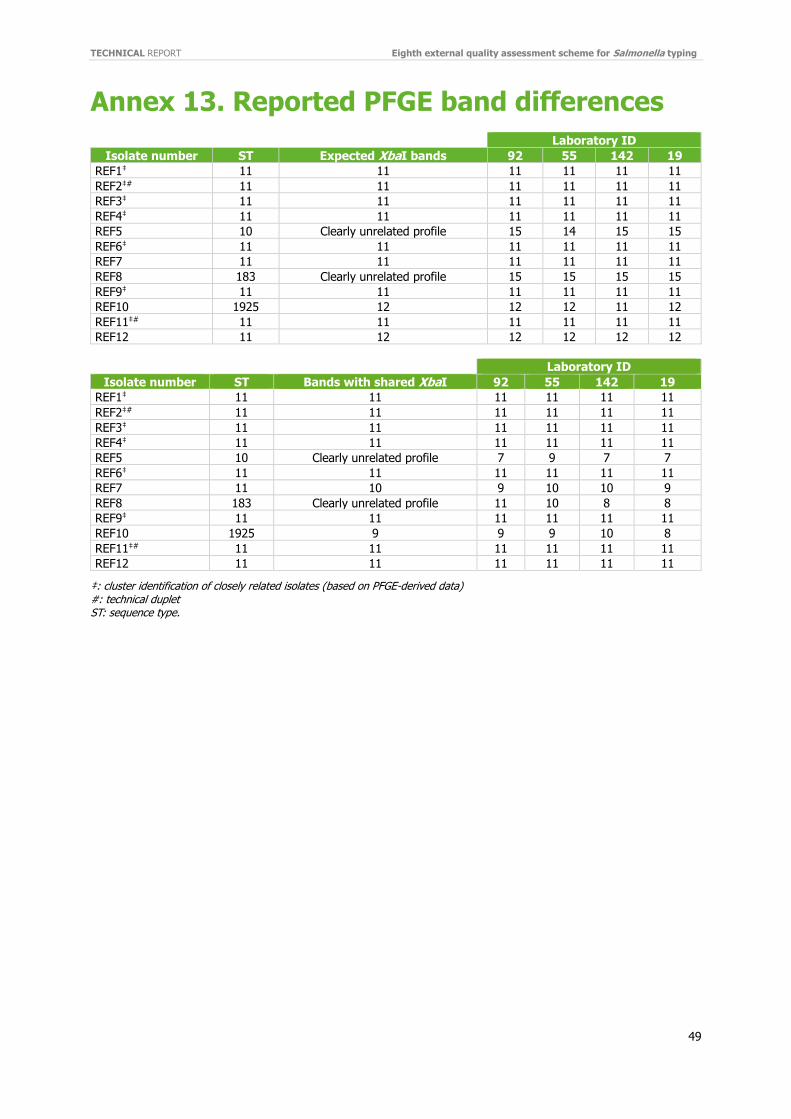
TECHNICAL REPORT Eighth external quality assessment scheme for Salmonella typing
49
Annex 13. Reported PFGE band differences
Isolate No. ST Laboratory ID
Isolate number ST Expected XbaI bands 92 55 142 19
REF1‡ 11 11 11 11 11 11
REF2‡# 11 11 11 11 11 11
REF3‡ 11 11 11 11 11 11
REF4‡ 11 11 11 11 11 11
REF5 10 Clearly unrelated profile 15 14 15 15
REF6‡ 11 11 11 11 11 11
REF7 11 11 11 11 11 11
REF8 183 Clearly unrelated profile 15 15 15 15
REF9‡ 11 11 11 11 11 11
REF10 1925 12 12 12 11 12
REF11‡# 11 11 11 11 11 11
REF12 11 12 12 12 12 12
Laboratory ID
Isolate number ST Bands with shared XbaI 92 55 142 19
REF1‡ 11 11 11 11 11 11
REF2‡# 11 11 11 11 11 11
REF3‡ 11 11 11 11 11 11
REF4‡ 11 11 11 11 11 11
REF5 10 Clearly unrelated profile 7 9 7 7
REF6‡ 11 11 11 11 11 11
REF7 11 10 9 10 10 9
REF8 183 Clearly unrelated profile 11 10 8 8
REF9‡ 11 11 11 11 11 11
REF10 1925 9 9 9 10 8
REF11‡# 11 11 11 11 11 11
REF12 11 11 11 11 11 11
‡: cluster identification of closely related isolates (based on PFGE-derived data) #: technical duplet ST: sequence type.

Eighth external quality assessment scheme for Salmonella typing TECHNICAL REPORT
50
Annex 14. Reported sequencing details
Sequencing performed Protocol (library preparation) Commercial kit Sequencing platform
In own laboratory Commercial kits Illumina Nextera XT Library preparation kit, Illumina TruSeq rapid SBS kit* HiSeq 2500
Externally Commercial kits Nextera XT MiSeq
Externally Commercial kits Nextera XT DNA Library Preparation Kit MiSeq
In own laboratory Commercial kits Illumina Nextera XT MiSeq
Externally Commercial kits Nextera XT NextSeq
In own laboratory Commercial kits Nextera XT NextSeq
In own laboratory Commercial kits Nextera MiSeq
In own laboratory Commercial kits Qiagen blood and tissue** NextSeq
In own laboratory Commercial kits Nextera XT** MiniSeq, Illumina
In own laboratory Commercial kits Ion Xpress TM Plus Fragment Library Kit IonTorent S5XL
In own laboratory Commercial kits Illumina Nextera XT MiSeq
*: 5ng input DNA (as opposed to 1ng) Altered PCR protocol to favour longer fragment sizes - adjustment of extension temperature (and final extension) from 72°C to 65°C. ‘Manual’ normalisation using library concentration and fragment size (as opposed to bead based normalisation). **: 1/2 volume for all reagents.
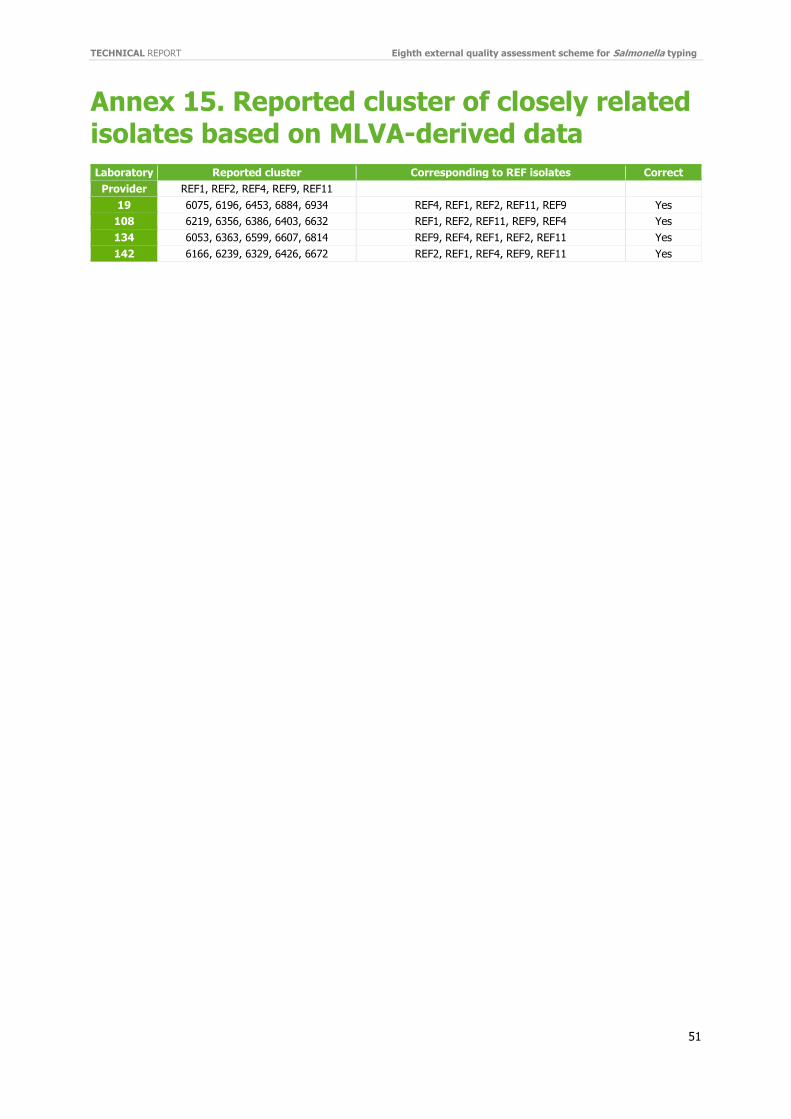
TECHNICAL REPORT Eighth external quality assessment scheme for Salmonella typing
51
Annex 15. Reported cluster of closely related isolates based on MLVA-derived data
Laboratory Reported cluster Corresponding to REF isolates Correct
Provider REF1, REF2, REF4, REF9, REF11
19 6075, 6196, 6453, 6884, 6934 REF4, REF1, REF2, REF11, REF9 Yes
108 6219, 6356, 6386, 6403, 6632 REF1, REF2, REF11, REF9, REF4 Yes
134 6053, 6363, 6599, 6607, 6814 REF9, REF4, REF1, REF2, REF11 Yes
142 6166, 6239, 6329, 6426, 6672 REF2, REF1, REF4, REF9, REF11 Yes
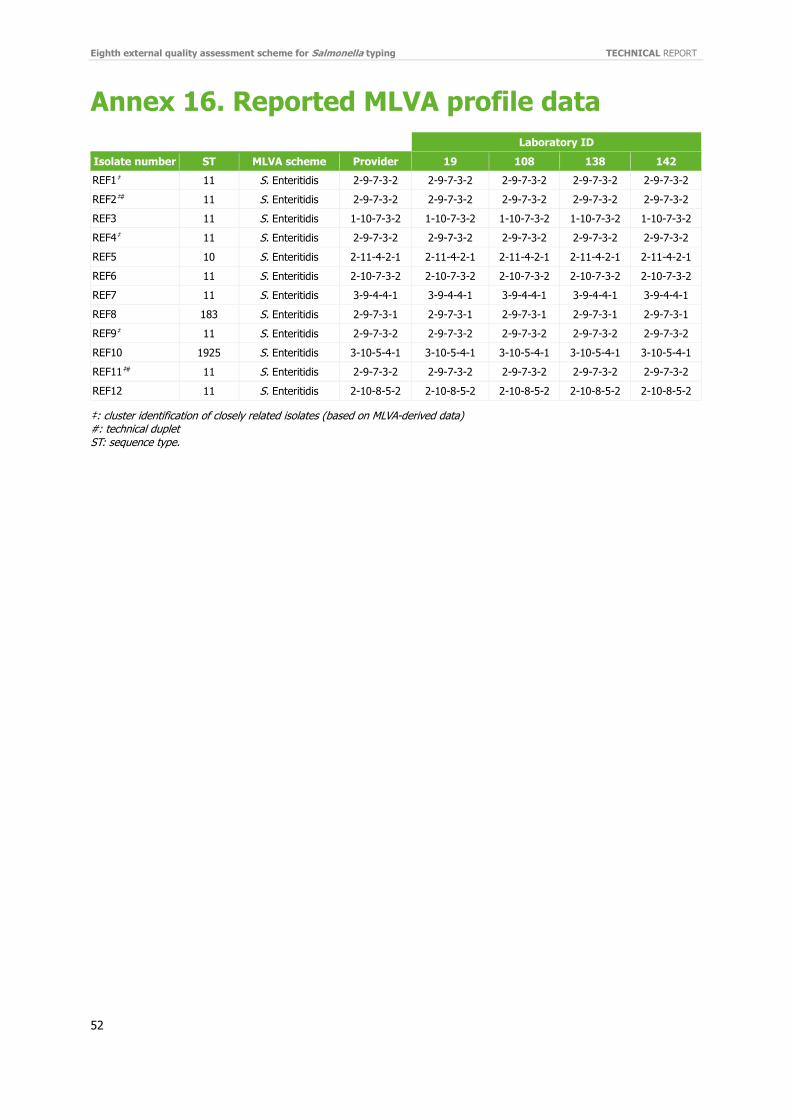
Eighth external quality assessment scheme for Salmonella typing TECHNICAL REPORT
52
Annex 16. Reported MLVA profile data
Laboratory ID
Isolate number ST MLVA scheme Provider 19 108 138 142
REF1‡ 11 S. Enteritidis 2-9-7-3-2 2-9-7-3-2 2-9-7-3-2 2-9-7-3-2 2-9-7-3-2
REF2‡# 11 S. Enteritidis 2-9-7-3-2 2-9-7-3-2 2-9-7-3-2 2-9-7-3-2 2-9-7-3-2
REF3 11 S. Enteritidis 1-10-7-3-2 1-10-7-3-2 1-10-7-3-2 1-10-7-3-2 1-10-7-3-2
REF4‡ 11 S. Enteritidis 2-9-7-3-2 2-9-7-3-2 2-9-7-3-2 2-9-7-3-2 2-9-7-3-2
REF5 10 S. Enteritidis 2-11-4-2-1 2-11-4-2-1 2-11-4-2-1 2-11-4-2-1 2-11-4-2-1
REF6 11 S. Enteritidis 2-10-7-3-2 2-10-7-3-2 2-10-7-3-2 2-10-7-3-2 2-10-7-3-2
REF7 11 S. Enteritidis 3-9-4-4-1 3-9-4-4-1 3-9-4-4-1 3-9-4-4-1 3-9-4-4-1
REF8 183 S. Enteritidis 2-9-7-3-1 2-9-7-3-1 2-9-7-3-1 2-9-7-3-1 2-9-7-3-1
REF9‡ 11 S. Enteritidis 2-9-7-3-2 2-9-7-3-2 2-9-7-3-2 2-9-7-3-2 2-9-7-3-2
REF10 1925 S. Enteritidis 3-10-5-4-1 3-10-5-4-1 3-10-5-4-1 3-10-5-4-1 3-10-5-4-1
REF11‡# 11 S. Enteritidis 2-9-7-3-2 2-9-7-3-2 2-9-7-3-2 2-9-7-3-2 2-9-7-3-2
REF12 11 S. Enteritidis 2-10-8-5-2 2-10-8-5-2 2-10-8-5-2 2-10-8-5-2 2-10-8-5-2
‡: cluster identification of closely related isolates (based on MLVA-derived data) #: technical duplet ST: sequence type.
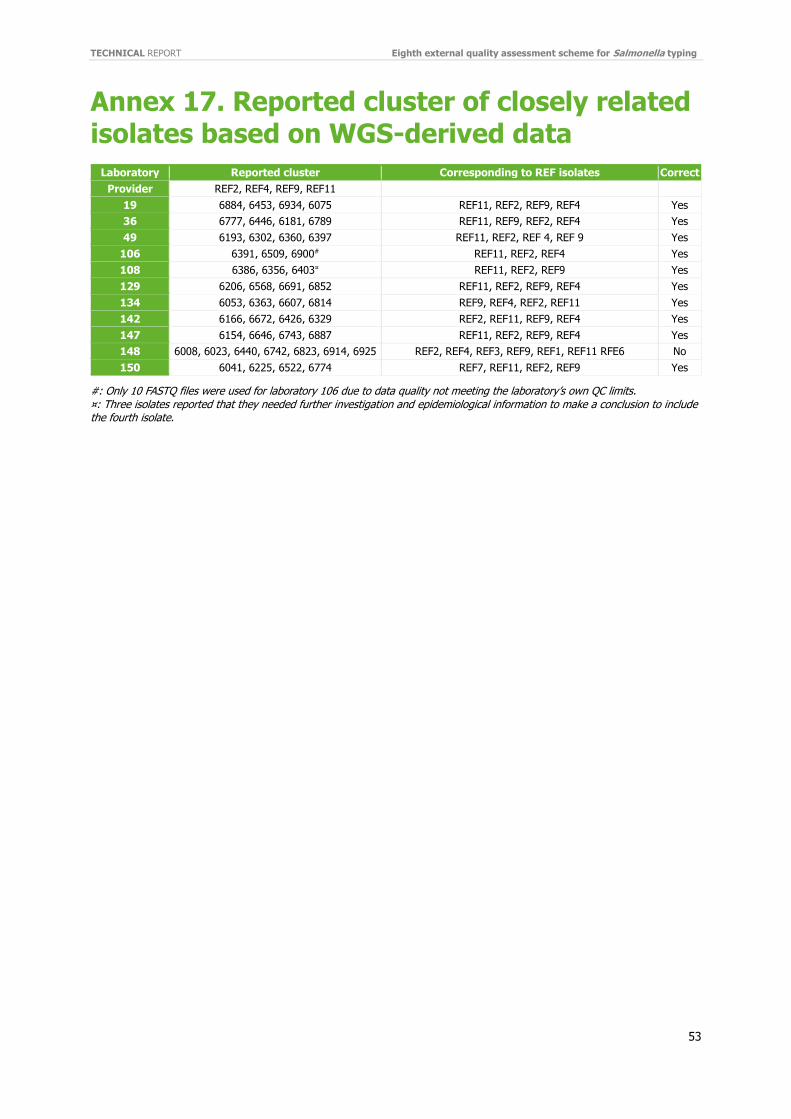
TECHNICAL REPORT Eighth external quality assessment scheme for Salmonella typing
53
Annex 17. Reported cluster of closely related isolates based on WGS-derived data
Laboratory Reported cluster Corresponding to REF isolates Correct
Provider REF2, REF4, REF9, REF11
19 6884, 6453, 6934, 6075 REF11, REF2, REF9, REF4 Yes
36 6777, 6446, 6181, 6789 REF11, REF9, REF2, REF4 Yes
49 6193, 6302, 6360, 6397 REF11, REF2, REF 4, REF 9 Yes
106 6391, 6509, 6900# REF11, REF2, REF4 Yes
108 6386, 6356, 6403¤ REF11, REF2, REF9 Yes
129 6206, 6568, 6691, 6852 REF11, REF2, REF9, REF4 Yes
134 6053, 6363, 6607, 6814 REF9, REF4, REF2, REF11 Yes
142 6166, 6672, 6426, 6329 REF2, REF11, REF9, REF4 Yes
147 6154, 6646, 6743, 6887 REF11, REF2, REF9, REF4 Yes
148 6008, 6023, 6440, 6742, 6823, 6914, 6925 REF2, REF4, REF3, REF9, REF1, REF11 RFE6 No
150 6041, 6225, 6522, 6774 REF7, REF11, REF2, REF9 Yes
#: Only 10 FASTQ files were used for laboratory 106 due to data quality not meeting the laboratory’s own QC limits. ¤: Three isolates reported that they needed further investigation and epidemiological information to make a conclusion to include the fourth isolate.
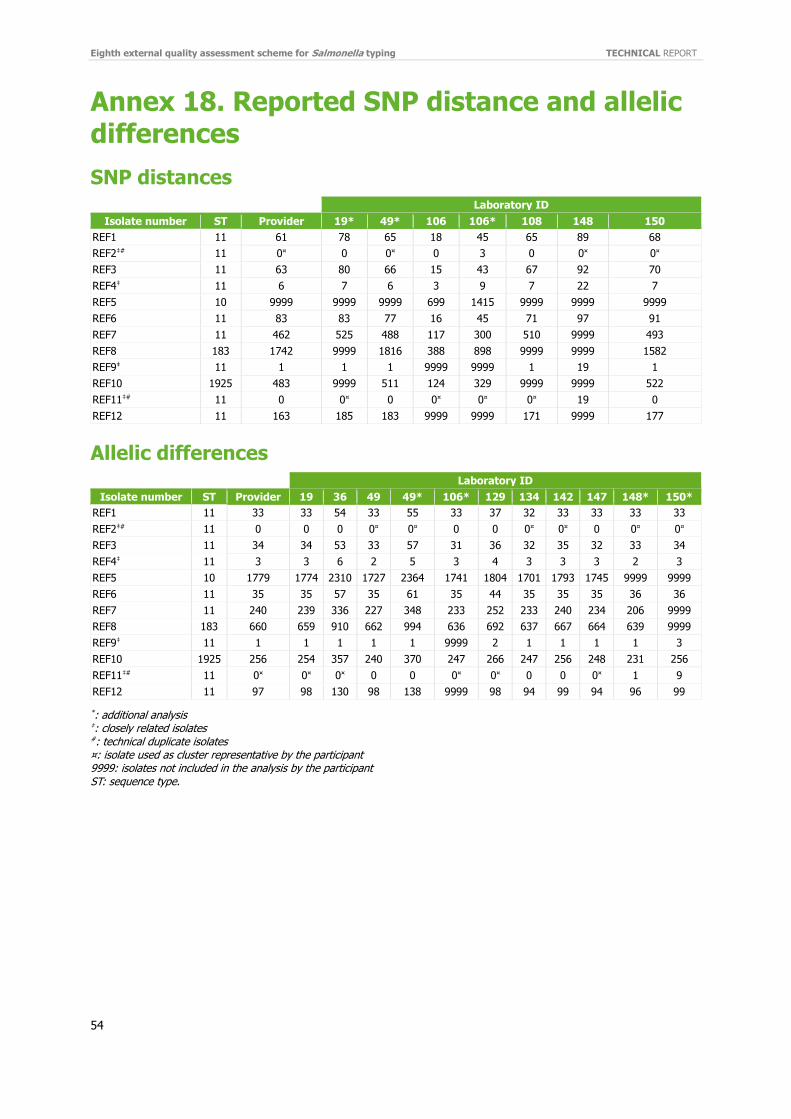
Eighth external quality assessment scheme for Salmonella typing TECHNICAL REPORT
54
Annex 18. Reported SNP distance and allelic differences
SNP distances
Laboratory ID
Isolate number ST Provider 19* 49* 106 106* 108 148 150
REF1 11 61 78 65 18 45 65 89 68
REF2‡# 11 0¤ 0 0¤ 0 3 0 0¤ 0¤
REF3 11 63 80 66 15 43 67 92 70
REF4‡ 11 6 7 6 3 9 7 22 7
REF5 10 9999 9999 9999 699 1415 9999 9999 9999
REF6 11 83 83 77 16 45 71 97 91
REF7 11 462 525 488 117 300 510 9999 493
REF8 183 1742 9999 1816 388 898 9999 9999 1582
REF9‡ 11 1 1 1 9999 9999 1 19 1
REF10 1925 483 9999 511 124 329 9999 9999 522
REF11‡# 11 0 0¤ 0 0¤ 0¤ 0¤ 19 0
REF12 11 163 185 183 9999 9999 171 9999 177
Allelic differences
Laboratory ID
Isolate number ST Provider 19 36 49 49* 106* 129 134 142 147 148* 150*
REF1 11 33 33 54 33 55 33 37 32 33 33 33 33
REF2‡# 11 0 0 0 0¤ 0¤ 0 0 0¤ 0¤ 0 0¤ 0¤
REF3 11 34 34 53 33 57 31 36 32 35 32 33 34
REF4‡ 11 3 3 6 2 5 3 4 3 3 3 2 3
REF5 10 1779 1774 2310 1727 2364 1741 1804 1701 1793 1745 9999 9999
REF6 11 35 35 57 35 61 35 44 35 35 35 36 36
REF7 11 240 239 336 227 348 233 252 233 240 234 206 9999
REF8 183 660 659 910 662 994 636 692 637 667 664 639 9999
REF9‡ 11 1 1 1 1 1 9999 2 1 1 1 1 3
REF10 1925 256 254 357 240 370 247 266 247 256 248 231 256
REF11‡# 11 0¤ 0¤ 0¤ 0 0 0¤ 0¤ 0 0 0¤ 1 9
REF12 11 97 98 130 98 138 9999 98 94 99 94 96 99
*: additional analysis ‡: closely related isolates #: technical duplicate isolates ¤: isolate used as cluster representative by the participant 9999: isolates not included in the analysis by the participant ST: sequence type.
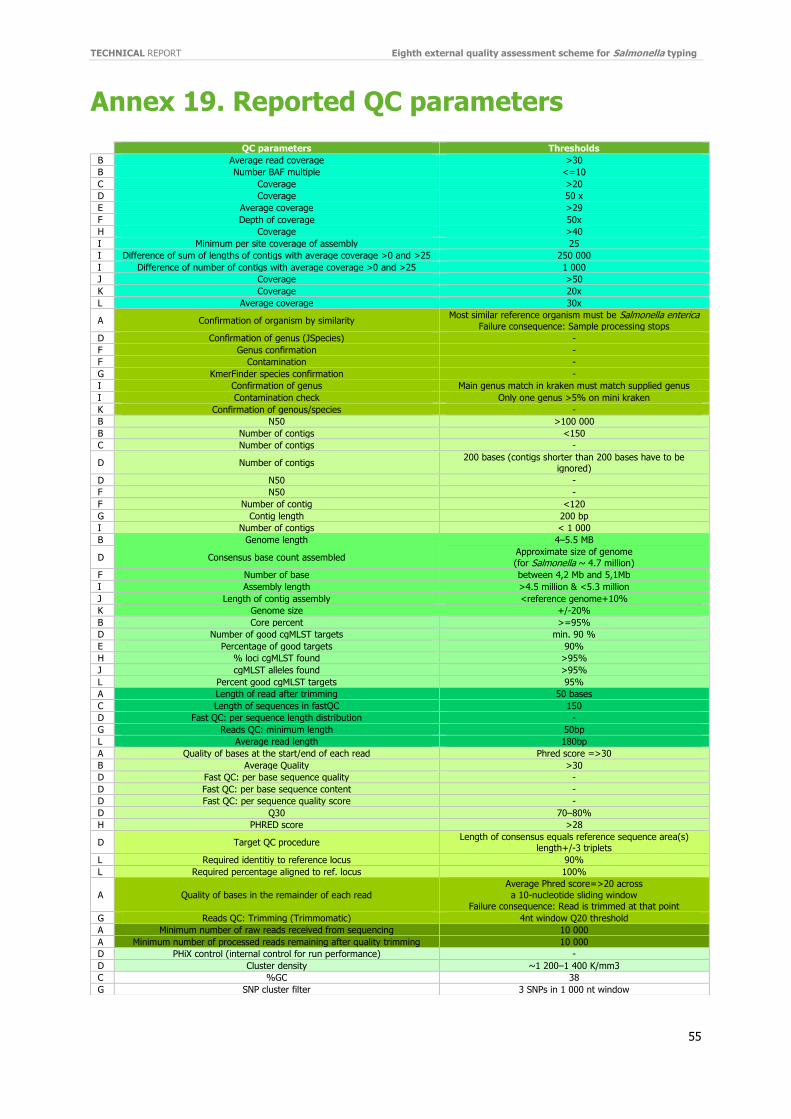
TECHNICAL REPORT Eighth external quality assessment scheme for Salmonella typing
55
Annex 19. Reported QC parameters
QC parameters Thresholds
B Average read coverage >30
B Number BAF multiple <=10
C Coverage >20
D Coverage 50 x
E Average coverage >29
F Depth of coverage 50x
H Coverage >40
I Minimum per site coverage of assembly 25
I Difference of sum of lengths of contigs with average coverage >0 and >25 250 000
I Difference of number of contigs with average coverage >0 and >25 1 000
J Coverage >50
K Coverage 20x
L Average coverage 30x
A Confirmation of organism by similarity Most similar reference organism must be Salmonella enterica
Failure consequence: Sample processing stops
D Confirmation of genus (JSpecies) -
F Genus confirmation -
F Contamination -
G KmerFinder species confirmation -
I Confirmation of genus Main genus match in kraken must match supplied genus
I Contamination check Only one genus >5% on mini kraken
K Confirmation of genous/species -
B N50 >100 000
B Number of contigs <150
C Number of contigs -
D Number of contigs 200 bases (contigs shorter than 200 bases have to be
ignored)
D N50 -
F N50 -
F Number of contig <120
G Contig length 200 bp
I Number of contigs < 1 000
B Genome length 4–5.5 MB
D Consensus base count assembled Approximate size of genome
(for Salmonella ~ 4.7 million)
F Number of base between 4,2 Mb and 5,1Mb
I Assembly length >4.5 million & <5.3 million
J Length of contig assembly <reference genome+10%
K Genome size +/-20%
B Core percent >=95%
D Number of good cgMLST targets min. 90 %
E Percentage of good targets 90%
H % loci cgMLST found >95%
J cgMLST alleles found >95%
L Percent good cgMLST targets 95%
A Length of read after trimming 50 bases
C Length of sequences in fastQC 150
D Fast QC: per sequence length distribution -
G Reads QC: minimum length 50bp
L Average read length 180bp
A Quality of bases at the start/end of each read Phred score =>30
B Average Quality >30
D Fast QC: per base sequence quality -
D Fast QC: per base sequence content -
D Fast QC: per sequence quality score -
D Q30 70–80%
H PHRED score >28
D Target QC procedure Length of consensus equals reference sequence area(s)
length+/-3 triplets
L Required identitiy to reference locus 90%
L Required percentage aligned to ref. locus 100%
A Quality of bases in the remainder of each read
Average Phred score=>20 across
a 10-nucleotide sliding window Failure consequence: Read is trimmed at that point
G Reads QC: Trimming (Trimmomatic) 4nt window Q20 threshold
A Minimum number of raw reads received from sequencing 10 000
A Minimum number of processed reads remaining after quality trimming 10 000
D PHiX control (internal control for run performance) -
D Cluster density ~1 200–1 400 K/mm3
C %GC 38
G SNP cluster filter 3 SNPs in 1 000 nt window
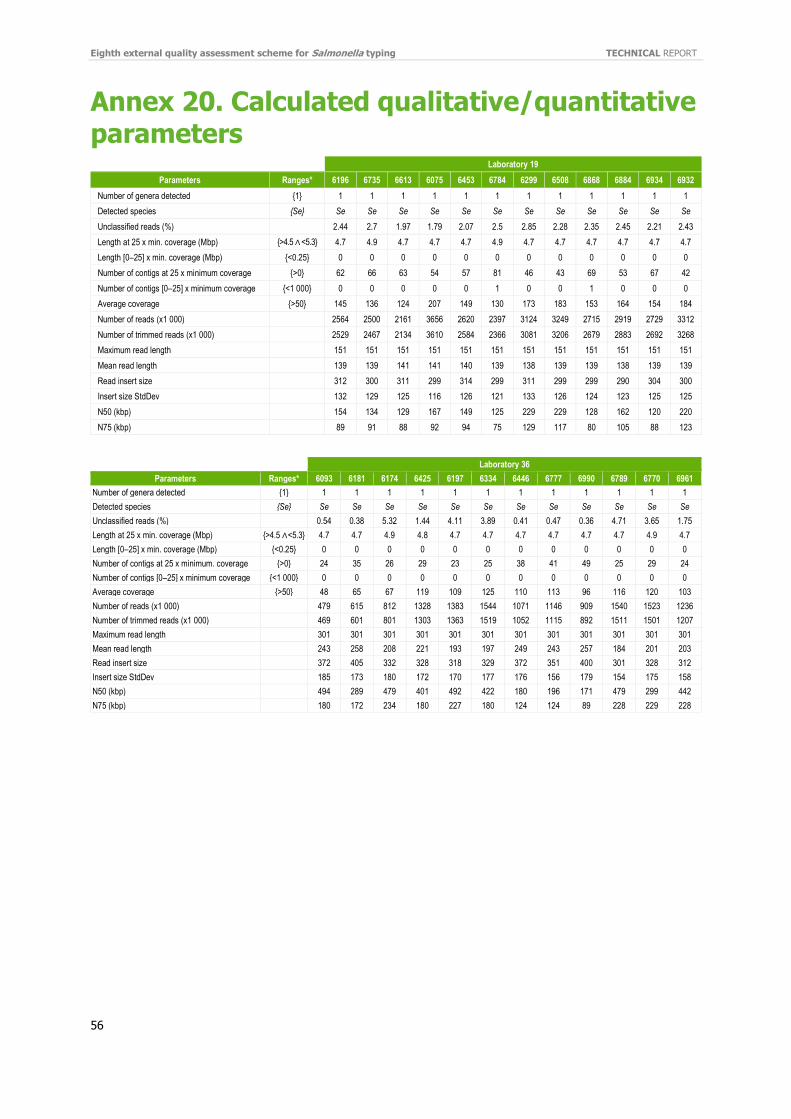
Eighth external quality assessment scheme for Salmonella typing TECHNICAL REPORT
56
Annex 20. Calculated qualitative/quantitative parameters
8 Laboratory 19
Parameters Ranges* 6196 6735 6613 6075 6453 6784 6299 6508 6868 6884 6934 6932
Number of genera detected {1} 1 1 1 1 1 1 1 1 1 1 1 1
Detected species {Se} Se Se Se Se Se Se Se Se Se Se Se Se
Unclassified reads (%) 2.44 2.7 1.97 1.79 2.07 2.5 2.85 2.28 2.35 2.45 2.21 2.43
Length at 25 x min. coverage (Mbp) {>4.5 ∧ <5.3} 4.7 4.9 4.7 4.7 4.7 4.9 4.7 4.7 4.7 4.7 4.7 4.7
Length [0–25] x min. coverage (Mbp) {<0.25} 0 0 0 0 0 0 0 0 0 0 0 0
Number of contigs at 25 x minimum coverage {>0} 62 66 63 54 57 81 46 43 69 53 67 42
Number of contigs [0–25] x minimum coverage {<1 000} 0 0 0 0 0 1 0 0 1 0 0 0
Average coverage {>50} 145 136 124 207 149 130 173 183 153 164 154 184
Number of reads (x1 000) 2564 2500 2161 3656 2620 2397 3124 3249 2715 2919 2729 3312
Number of trimmed reads (x1 000) 2529 2467 2134 3610 2584 2366 3081 3206 2679 2883 2692 3268
Maximum read length 151 151 151 151 151 151 151 151 151 151 151 151
Mean read length 139 139 141 141 140 139 138 139 139 138 139 139
Read insert size 312 300 311 299 314 299 311 299 299 290 304 300
Insert size StdDev 132 129 125 116 126 121 133 126 124 123 125 125
N50 (kbp) 154 134 129 167 149 125 229 229 128 162 120 220
N75 (kbp) 89 91 88 92 94 75 129 117 80 105 88 123
Laboratory 36
Parameters Ranges* 6093 6181 6174 6425 6197 6334 6446 6777 6990 6789 6770 6961
Number of genera detected {1} 1 1 1 1 1 1 1 1 1 1 1 1
Detected species {Se} Se Se Se Se Se Se Se Se Se Se Se Se
Unclassified reads (%) 0.54 0.38 5.32 1.44 4.11 3.89 0.41 0.47 0.36 4.71 3.65 1.75
Length at 25 x min. coverage (Mbp) {>4.5 ∧ <5.3} 4.7 4.7 4.9 4.8 4.7 4.7 4.7 4.7 4.7 4.7 4.9 4.7
Length [0–25] x min. coverage (Mbp) {<0.25} 0 0 0 0 0 0 0 0 0 0 0 0
Number of contigs at 25 x minimum. coverage {>0} 24 35 26 29 23 25 38 41 49 25 29 24
Number of contigs [0–25] x minimum coverage {<1 000} 0 0 0 0 0 0 0 0 0 0 0 0
Average coverage {>50} 48 65 67 119 109 125 110 113 96 116 120 103
Number of reads (x1 000) 479 615 812 1328 1383 1544 1071 1146 909 1540 1523 1236
Number of trimmed reads (x1 000) 469 601 801 1303 1363 1519 1052 1115 892 1511 1501 1207
Maximum read length 301 301 301 301 301 301 301 301 301 301 301 301
Mean read length 243 258 208 221 193 197 249 243 257 184 201 203
Read insert size 372 405 332 328 318 329 372 351 400 301 328 312
Insert size StdDev 185 173 180 172 170 177 176 156 179 154 175 158
N50 (kbp) 494 289 479 401 492 422 180 196 171 479 299 442
N75 (kbp) 180 172 234 180 227 180 124 124 89 228 229 228
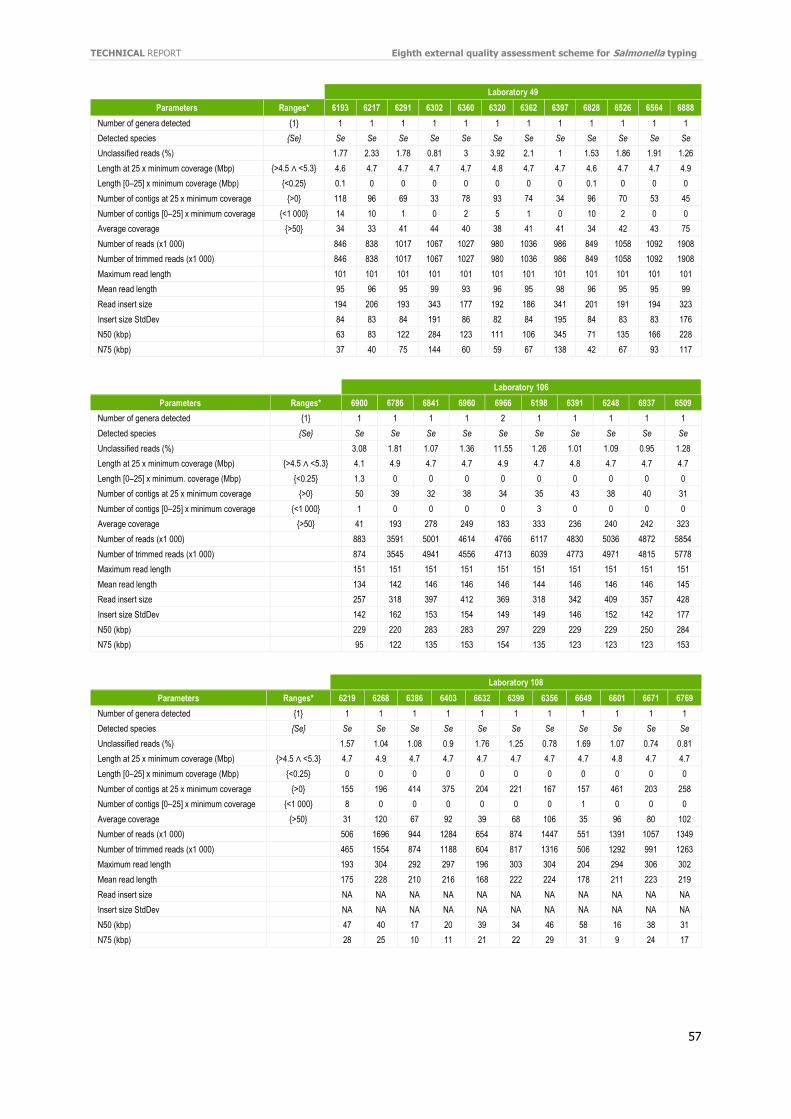
TECHNICAL REPORT Eighth external quality assessment scheme for Salmonella typing
57
Laboratory 49
Parameters Ranges* 6193 6217 6291 6302 6360 6320 6362 6397 6828 6526 6564 6888
Number of genera detected {1} 1 1 1 1 1 1 1 1 1 1 1 1
Detected species {Se} Se Se Se Se Se Se Se Se Se Se Se Se
Unclassified reads (%) 1.77 2.33 1.78 0.81 3 3.92 2.1 1 1.53 1.86 1.91 1.26
Length at 25 x minimum coverage (Mbp) {>4.5 ∧ <5.3} 4.6 4.7 4.7 4.7 4.7 4.8 4.7 4.7 4.6 4.7 4.7 4.9
Length [0–25] x minimum coverage (Mbp) {<0.25} 0.1 0 0 0 0 0 0 0 0.1 0 0 0
Number of contigs at 25 x minimum coverage {>0} 118 96 69 33 78 93 74 34 96 70 53 45
Number of contigs [0–25] x minimum coverage {<1 000} 14 10 1 0 2 5 1 0 10 2 0 0
Average coverage {>50} 34 33 41 44 40 38 41 41 34 42 43 75
Number of reads (x1 000) 846 838 1017 1067 1027 980 1036 986 849 1058 1092 1908
Number of trimmed reads (x1 000) 846 838 1017 1067 1027 980 1036 986 849 1058 1092 1908
Maximum read length 101 101 101 101 101 101 101 101 101 101 101 101
Mean read length 95 96 95 99 93 96 95 98 96 95 95 99
Read insert size 194 206 193 343 177 192 186 341 201 191 194 323
Insert size StdDev 84 83 84 191 86 82 84 195 84 83 83 176
N50 (kbp) 63 83 122 284 123 111 106 345 71 135 166 228
N75 (kbp) 37 40 75 144 60 59 67 138 42 67 93 117
Laboratory 106
Parameters Ranges* 6900 6786 6841 6960 6966 6198 6391 6248 6937 6509
Number of genera detected {1} 1 1 1 1 2 1 1 1 1 1
Detected species {Se} Se Se Se Se Se Se Se Se Se Se
Unclassified reads (%) 3.08 1.81 1.07 1.36 11.55 1.26 1.01 1.09 0.95 1.28
Length at 25 x minimum coverage (Mbp) {>4.5 ∧ <5.3} 4.1 4.9 4.7 4.7 4.9 4.7 4.8 4.7 4.7 4.7
Length [0–25] x minimum. coverage (Mbp) {<0.25} 1.3 0 0 0 0 0 0 0 0 0
Number of contigs at 25 x minimum coverage {>0} 50 39 32 38 34 35 43 38 40 31
Number of contigs [0–25] x minimum coverage {<1 000} 1 0 0 0 0 3 0 0 0 0
Average coverage {>50} 41 193 278 249 183 333 236 240 242 323
Number of reads (x1 000) 883 3591 5001 4614 4766 6117 4830 5036 4872 5854
Number of trimmed reads (x1 000) 874 3545 4941 4556 4713 6039 4773 4971 4815 5778
Maximum read length 151 151 151 151 151 151 151 151 151 151
Mean read length 134 142 146 146 146 144 146 146 146 145
Read insert size 257 318 397 412 369 318 342 409 357 428
Insert size StdDev 142 162 153 154 149 149 146 152 142 177
N50 (kbp) 229 220 283 283 297 229 229 229 250 284
N75 (kbp) 95 122 135 153 154 135 123 123 123 153
Laboratory 108
Parameters Ranges* 6219 6268 6386 6403 6632 6399 6356 6649 6601 6671 6769
Number of genera detected {1} 1 1 1 1 1 1 1 1 1 1 1
Detected species {Se} Se Se Se Se Se Se Se Se Se Se Se
Unclassified reads (%) 1.57 1.04 1.08 0.9 1.76 1.25 0.78 1.69 1.07 0.74 0.81
Length at 25 x minimum coverage (Mbp) {>4.5 ∧ <5.3} 4.7 4.9 4.7 4.7 4.7 4.7 4.7 4.7 4.8 4.7 4.7
Length [0–25] x minimum coverage (Mbp) {<0.25} 0 0 0 0 0 0 0 0 0 0 0
Number of contigs at 25 x minimum coverage {>0} 155 196 414 375 204 221 167 157 461 203 258
Number of contigs [0–25] x minimum coverage {<1 000} 8 0 0 0 0 0 0 1 0 0 0
Average coverage {>50} 31 120 67 92 39 68 106 35 96 80 102
Number of reads (x1 000) 506 1696 944 1284 654 874 1447 551 1391 1057 1349
Number of trimmed reads (x1 000) 465 1554 874 1188 604 817 1316 506 1292 991 1263
Maximum read length 193 304 292 297 196 303 304 204 294 306 302
Mean read length 175 228 210 216 168 222 224 178 211 223 219
Read insert size NA NA NA NA NA NA NA NA NA NA NA
Insert size StdDev NA NA NA NA NA NA NA NA NA NA NA
N50 (kbp) 47 40 17 20 39 34 46 58 16 38 31
N75 (kbp) 28 25 10 11 21 22 29 31 9 24 17
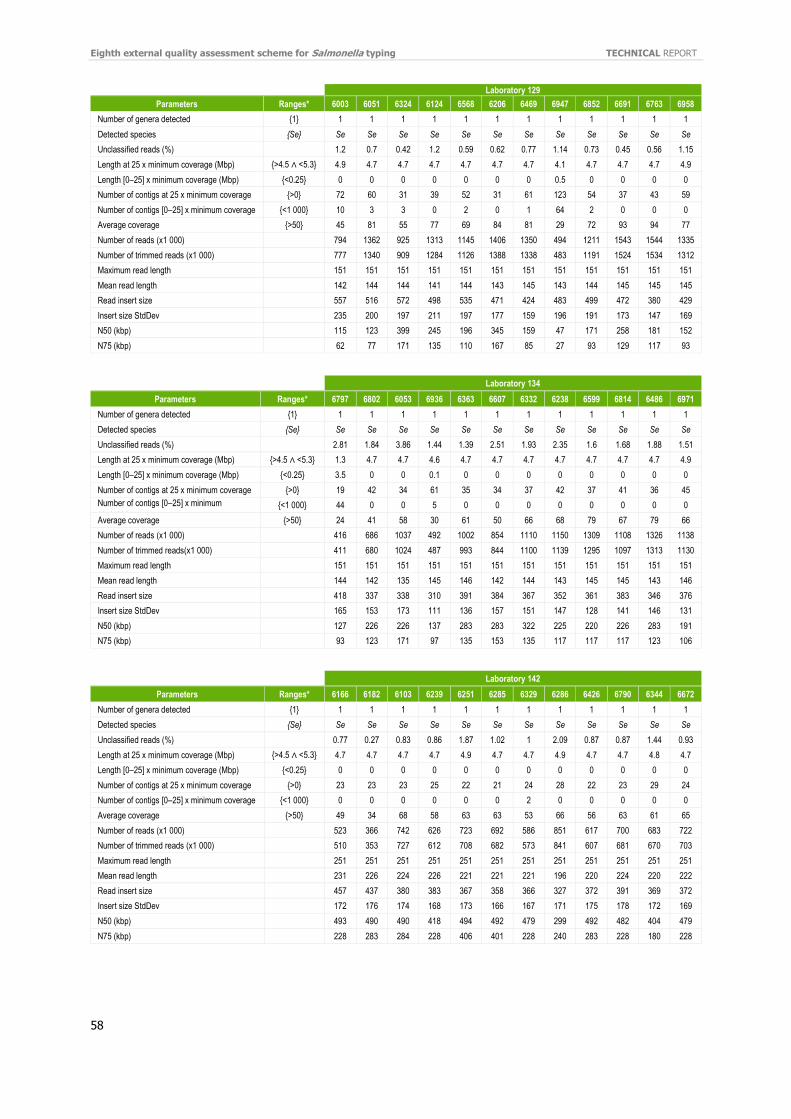
Eighth external quality assessment scheme for Salmonella typing TECHNICAL REPORT
58
Laboratory 129
Parameters Ranges* 6003 6051 6324 6124 6568 6206 6469 6947 6852 6691 6763 6958
Number of genera detected {1} 1 1 1 1 1 1 1 1 1 1 1 1
Detected species {Se} Se Se Se Se Se Se Se Se Se Se Se Se
Unclassified reads (%) 1.2 0.7 0.42 1.2 0.59 0.62 0.77 1.14 0.73 0.45 0.56 1.15
Length at 25 x minimum coverage (Mbp) {>4.5 ∧ <5.3} 4.9 4.7 4.7 4.7 4.7 4.7 4.7 4.1 4.7 4.7 4.7 4.9
Length [0–25] x minimum coverage (Mbp) {<0.25} 0 0 0 0 0 0 0 0.5 0 0 0 0
Number of contigs at 25 x minimum coverage {>0} 72 60 31 39 52 31 61 123 54 37 43 59
Number of contigs [0–25] x minimum coverage {<1 000} 10 3 3 0 2 0 1 64 2 0 0 0
Average coverage {>50} 45 81 55 77 69 84 81 29 72 93 94 77
Number of reads (x1 000) 794 1362 925 1313 1145 1406 1350 494 1211 1543 1544 1335
Number of trimmed reads (x1 000) 777 1340 909 1284 1126 1388 1338 483 1191 1524 1534 1312
Maximum read length 151 151 151 151 151 151 151 151 151 151 151 151
Mean read length 142 144 144 141 144 143 145 143 144 145 145 145
Read insert size 557 516 572 498 535 471 424 483 499 472 380 429
Insert size StdDev 235 200 197 211 197 177 159 196 191 173 147 169
N50 (kbp) 115 123 399 245 196 345 159 47 171 258 181 152
N75 (kbp) 62 77 171 135 110 167 85 27 93 129 117 93
Laboratory 134
Parameters Ranges* 6797 6802 6053 6936 6363 6607 6332 6238 6599 6814 6486 6971
Number of genera detected {1} 1 1 1 1 1 1 1 1 1 1 1 1
Detected species {Se} Se Se Se Se Se Se Se Se Se Se Se Se
Unclassified reads (%) 2.81 1.84 3.86 1.44 1.39 2.51 1.93 2.35 1.6 1.68 1.88 1.51
Length at 25 x minimum coverage (Mbp) {>4.5 ∧ <5.3} 1.3 4.7 4.7 4.6 4.7 4.7 4.7 4.7 4.7 4.7 4.7 4.9
Length [0–25] x minimum coverage (Mbp) {<0.25} 3.5 0 0 0.1 0 0 0 0 0 0 0 0
Number of contigs at 25 x minimum coverage {>0} 19 42 34 61 35 34 37 42 37 41 36 45
Number of contigs [0–25] x minimum coverage
{<1 000} 44 0 0 5 0 0 0 0 0 0 0 0
Average coverage {>50} 24 41 58 30 61 50 66 68 79 67 79 66
Number of reads (x1 000) 416 686 1037 492 1002 854 1110 1150 1309 1108 1326 1138
Number of trimmed reads(x1 000) 411 680 1024 487 993 844 1100 1139 1295 1097 1313 1130
Maximum read length 151 151 151 151 151 151 151 151 151 151 151 151
Mean read length 144 142 135 145 146 142 144 143 145 145 143 146
Read insert size 418 337 338 310 391 384 367 352 361 383 346 376
Insert size StdDev 165 153 173 111 136 157 151 147 128 141 146 131
N50 (kbp) 127 226 226 137 283 283 322 225 220 226 283 191
N75 (kbp) 93 123 171 97 135 153 135 117 117 117 123 106
Laboratory 142
Parameters Ranges* 6166 6182 6103 6239 6251 6285 6329 6286 6426 6790 6344 6672
Number of genera detected {1} 1 1 1 1 1 1 1 1 1 1 1 1
Detected species {Se} Se Se Se Se Se Se Se Se Se Se Se Se
Unclassified reads (%) 0.77 0.27 0.83 0.86 1.87 1.02 1 2.09 0.87 0.87 1.44 0.93
Length at 25 x minimum coverage (Mbp) {>4.5 ∧ <5.3} 4.7 4.7 4.7 4.7 4.9 4.7 4.7 4.9 4.7 4.7 4.8 4.7
Length [0–25] x minimum coverage (Mbp) {<0.25} 0 0 0 0 0 0 0 0 0 0 0 0
Number of contigs at 25 x minimum coverage {>0} 23 23 23 25 22 21 24 28 22 23 29 24
Number of contigs [0–25] x minimum coverage {<1 000} 0 0 0 0 0 0 2 0 0 0 0 0
Average coverage {>50} 49 34 68 58 63 63 53 66 56 63 61 65
Number of reads (x1 000) 523 366 742 626 723 692 586 851 617 700 683 722
Number of trimmed reads (x1 000) 510 353 727 612 708 682 573 841 607 681 670 703
Maximum read length 251 251 251 251 251 251 251 251 251 251 251 251
Mean read length 231 226 224 226 221 221 221 196 220 224 220 222
Read insert size 457 437 380 383 367 358 366 327 372 391 369 372
Insert size StdDev 172 176 174 168 173 166 167 171 175 178 172 169
N50 (kbp) 493 490 490 418 494 492 479 299 492 482 404 479
N75 (kbp) 228 283 284 228 406 401 228 240 283 228 180 228
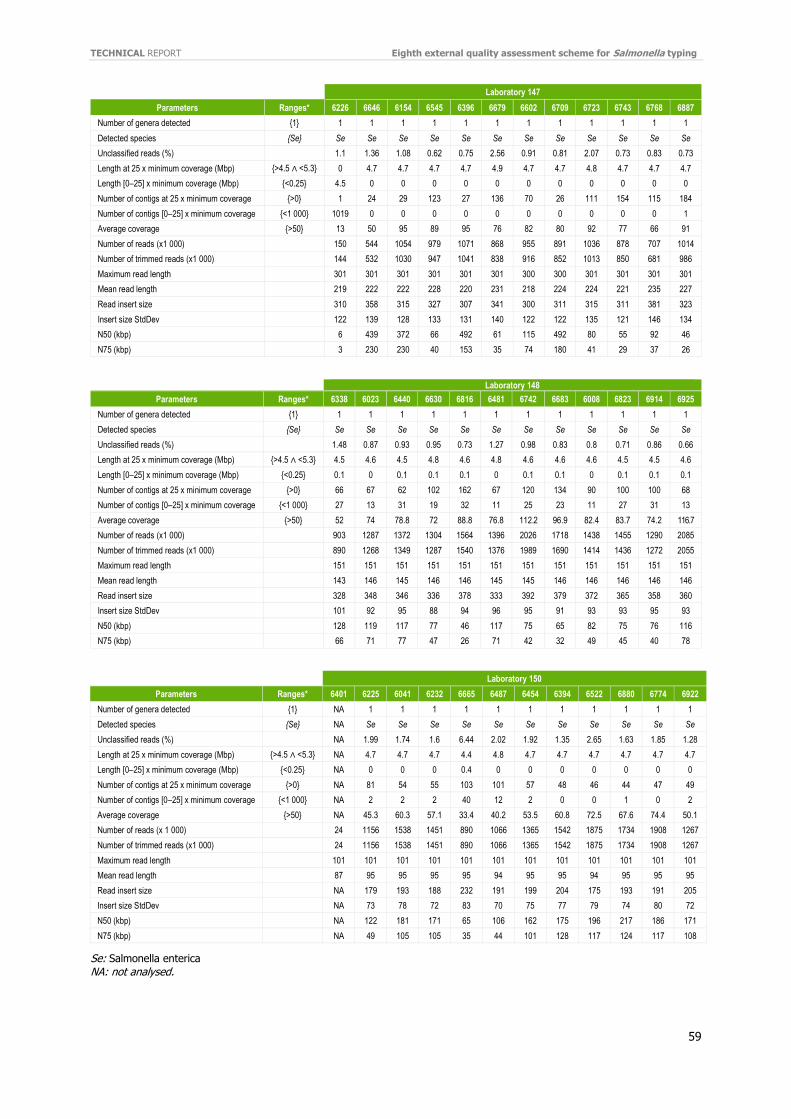
TECHNICAL REPORT Eighth external quality assessment scheme for Salmonella typing
59
Laboratory 147
Parameters Ranges* 6226 6646 6154 6545 6396 6679 6602 6709 6723 6743 6768 6887
Number of genera detected {1} 1 1 1 1 1 1 1 1 1 1 1 1
Detected species {Se} Se Se Se Se Se Se Se Se Se Se Se Se
Unclassified reads (%) 1.1 1.36 1.08 0.62 0.75 2.56 0.91 0.81 2.07 0.73 0.83 0.73
Length at 25 x minimum coverage (Mbp) {>4.5 ∧ <5.3} 0 4.7 4.7 4.7 4.7 4.9 4.7 4.7 4.8 4.7 4.7 4.7
Length [0–25] x minimum coverage (Mbp) {<0.25} 4.5 0 0 0 0 0 0 0 0 0 0 0
Number of contigs at 25 x minimum coverage {>0} 1 24 29 123 27 136 70 26 111 154 115 184
Number of contigs [0–25] x minimum coverage {<1 000} 1019 0 0 0 0 0 0 0 0 0 0 1
Average coverage {>50} 13 50 95 89 95 76 82 80 92 77 66 91
Number of reads (x1 000) 150 544 1054 979 1071 868 955 891 1036 878 707 1014
Number of trimmed reads (x1 000) 144 532 1030 947 1041 838 916 852 1013 850 681 986
Maximum read length 301 301 301 301 301 301 300 300 301 301 301 301
Mean read length 219 222 222 228 220 231 218 224 224 221 235 227
Read insert size 310 358 315 327 307 341 300 311 315 311 381 323
Insert size StdDev 122 139 128 133 131 140 122 122 135 121 146 134
N50 (kbp) 6 439 372 66 492 61 115 492 80 55 92 46
N75 (kbp) 3 230 230 40 153 35 74 180 41 29 37 26
Laboratory 148
Parameters Ranges* 6338 6023 6440 6630 6816 6481 6742 6683 6008 6823 6914 6925
Number of genera detected {1} 1 1 1 1 1 1 1 1 1 1 1 1
Detected species {Se} Se Se Se Se Se Se Se Se Se Se Se Se
Unclassified reads (%) 1.48 0.87 0.93 0.95 0.73 1.27 0.98 0.83 0.8 0.71 0.86 0.66
Length at 25 x minimum coverage (Mbp) {>4.5 ∧ <5.3} 4.5 4.6 4.5 4.8 4.6 4.8 4.6 4.6 4.6 4.5 4.5 4.6
Length [0–25] x minimum coverage (Mbp) {<0.25} 0.1 0 0.1 0.1 0.1 0 0.1 0.1 0 0.1 0.1 0.1
Number of contigs at 25 x minimum coverage {>0} 66 67 62 102 162 67 120 134 90 100 100 68
Number of contigs [0–25] x minimum coverage {<1 000} 27 13 31 19 32 11 25 23 11 27 31 13
Average coverage {>50} 52 74 78.8 72 88.8 76.8 112.2 96.9 82.4 83.7 74.2 116.7
Number of reads (x1 000) 903 1287 1372 1304 1564 1396 2026 1718 1438 1455 1290 2085
Number of trimmed reads (x1 000) 890 1268 1349 1287 1540 1376 1989 1690 1414 1436 1272 2055
Maximum read length 151 151 151 151 151 151 151 151 151 151 151 151
Mean read length 143 146 145 146 146 145 145 146 146 146 146 146
Read insert size 328 348 346 336 378 333 392 379 372 365 358 360
Insert size StdDev 101 92 95 88 94 96 95 91 93 93 95 93
N50 (kbp) 128 119 117 77 46 117 75 65 82 75 76 116
N75 (kbp) 66 71 77 47 26 71 42 32 49 45 40 78
Laboratory 150
Parameters Ranges* 6401 6225 6041 6232 6665 6487 6454 6394 6522 6880 6774 6922
Number of genera detected {1} NA 1 1 1 1 1 1 1 1 1 1 1
Detected species {Se} NA Se Se Se Se Se Se Se Se Se Se Se
Unclassified reads (%) NA 1.99 1.74 1.6 6.44 2.02 1.92 1.35 2.65 1.63 1.85 1.28
Length at 25 x minimum coverage (Mbp) {>4.5 ∧ <5.3} NA 4.7 4.7 4.7 4.4 4.8 4.7 4.7 4.7 4.7 4.7 4.7
Length [0–25] x minimum coverage (Mbp) {<0.25} NA 0 0 0 0.4 0 0 0 0 0 0 0
Number of contigs at 25 x minimum coverage {>0} NA 81 54 55 103 101 57 48 46 44 47 49
Number of contigs [0–25] x minimum coverage {<1 000} NA 2 2 2 40 12 2 0 0 1 0 2
Average coverage {>50} NA 45.3 60.3 57.1 33.4 40.2 53.5 60.8 72.5 67.6 74.4 50.1
Number of reads (x 1 000) 24 1156 1538 1451 890 1066 1365 1542 1875 1734 1908 1267
Number of trimmed reads (x1 000) 24 1156 1538 1451 890 1066 1365 1542 1875 1734 1908 1267
Maximum read length 101 101 101 101 101 101 101 101 101 101 101 101
Mean read length 87 95 95 95 95 94 95 95 94 95 95 95
Read insert size NA 179 193 188 232 191 199 204 175 193 191 205
Insert size StdDev NA 73 78 72 83 70 75 77 79 74 80 72
N50 (kbp) NA 122 181 171 65 106 162 175 196 217 186 171
N75 (kbp) NA 49 105 105 35 44 101 128 117 124 117 108
Se: Salmonella enterica NA: not analysed.
Eighth external quality assessment scheme for Salmonella typing TECHNICAL REPORT
60
Annex 21. EQA-8 laboratory questionnaire
This is a preview of all the fields and questions available.
Please keep in mind that, depending on your answers in the questionnaire, you will not necessarily have to answer all the questions.
1. Salmonella EQA-8 2017
Dear Participant,
Welcome to the eight External Quality Assessment (EQA-8) scheme for typing of Salmonella in 2017-2018. Please note that most of the fields are required to be filled in before the submission can be completed. Any comments can be written at the end of the form. You are always welcome to contact us at [email protected].
Please start by filling in your country, your Laboratory name and your LAB_ID.
Available options in this submission form include:
- Click "Options" and "Pause" to save your results and finish at a later time (using the same link) - Click "Options" and "Print" to print your answers. This can be done at any time, but before pressing
"Submit results" - Click "Previous" to go back to the questions you have already answered - Click "Options" and "Go to.." to go back to a specific page number
Note: After pressing "Submit results" you will not be able to review your results.
2. Country
Australia Austria
Belgium Czech Republic Denmark Estonia Finland France Germany Greece Hungary Ireland Italy Latvia Lithuania Luxembourg
New Zealand Norway Portugal Romania Scotland Serbia Slovak Republic Slovenia Spain Sweden Netherlands Turkey UK
TECHNICAL REPORT Eighth external quality assessment scheme for Salmonella typing
61
3. Laboratory name
4. Laboratory ID
5. E-mail
6. Pulsed field gel electrophoresis (PFGE)
7. Submitting results
TIFF (please fill in the strain ID’s in the following section) BioNumerics analysis XML exports (please upload to ftp site) Did not participate in the PFGE part
8. Position of strain ID’s on gel
Please enter the PFGE strain ID (4 digits) or ‘9999’ (S. Braenderup H9812) in the position lanes.
XbaI Lane 1 ___ Lane 2 ___ Lane 3 ___ Lane 4 ___ Lane 5 ___ Lane 6 ___ Lane 7 ___ Lane 8 ___ Lane 9 ___ Lane 10 ___ Lane 11 ___ Lane 12 ___ Lane 13 ___ Lane 14 ___ Lane 15 ___
9. Multiple-locus variable number of tandem repeats analysis (MLVA)
10. Submitting results
Online here (please fill in the strain ID´s in the following section) Did not participate in the MLVA part
11. Select method
S. Typhimurium and S. Enteritidis Only S. Typhimurium Only S. Enteritidis

Eighth external quality assessment scheme for Salmonella typing TECHNICAL REPORT
62
12. MLVA strain ID’s
Please enter the MLVA strain ID (4 digits)
S. Typhimurium
Strain 1 ___ Strain 2 ___ Strain 3 ___ Strain 4 ___ Strain 5 ___ Strain 6 ___ Strain 7 ___ Strain 8 ___ Strain 9 ___
Strain 10 ___
13. Results for MLVA S. Typhimurium - Allele profile
Please use ‘-2’ for not detected
Strain STTR9 STTR5 STTR6 STTR10 STTR3
Strain 1
Strain 2
Strain 3
Strain 4
Strain 5
Strain 6
Strain 7
Strain 8
Strain 9
Strain 10
14. Submitting MLVA S. Enteritidis results
Online here (please fill in the strain ID´s in the following section) Did not participate in the MLVA S. Enteritidis
15. MLVA strain ID’s
Please enter the MLVA strain ID (4 digits)
S. Enteritidis
Strain 1 ___ Strain 2 ___ Strain 3 ___ Strain 4 ___ Strain 5 ___ Strain 6 ___ Strain 7 ___ Strain 8 ___ Strain 9 ___ Strain 10 ___
TECHNICAL REPORT Eighth external quality assessment scheme for Salmonella typing
63
16. Results for MLVA S. Enteritidis - Allele profile
Please use ‘-2’ for not detected
SENTR7 SENTR5 SENTR6 SENTR4 SE-3
Strain 1
Strain 2
Strain 3
Strain 4
Strain 5
Strain 6
Strain 7
Strain 8
Strain 9
Strain 10
17. Submitting cluster results
Cluster analyses based on PFGE/MLVA/WGS
Did not participate in the cluster part
18. Cluster strain ID’s
Please enter the cluster strain ID (4 digits)
Cluster strain ID
Strain 1 ___ Strain 2 ___ Strain 3 ___ Strain 4 ___ Strain 5 ___ Strain 6 ___ Strain 7 ___ Strain 8 ___ Strain 9 ___ Strain 10 ___ Strain 11 ___ Strain 12 ___
19. Submitting cluster results
Cluster analysis based on PFGE
Do not wish to submit any cluster results based on PFGE analysis
20. Cluster analysis based on PFGE data
21. Please list the ID for the strains included in the cluster detected by PFGE:
Please use semicolon (;) to separate the ID’s
22. Select a representative strain with the cluster profile detected by PFGE:
Indicate the strain ID
Eighth external quality assessment scheme for Salmonella typing TECHNICAL REPORT
64
23. Total number of bands (>33kb) in the selected representative cluster strain
24. Results for cluster analysis - PFGE (XbaI)
Please use ‘9999’ for not analysed
Total number of bands (>33kb)
Number of bands with same/shared position as the profile of the selected cluster
strain (>33kb)
Strain 1
Strain 2
Strain 3
Strain 4
Strain 5
Strain 6
Strain 7
Strain 8
Strain 9
Strain 10
Strain 11
Strain 12
25. Submitting cluster results
Cluster analysis based on MLVA Do not wish to submit any cluster results based on MLVA analysis
26. Cluster analysis based on MLVA data
27. Please list the ID for the strains included in the cluster by MLVA detection:
Please use semicolon (;) to separate the ID’s
28. MLVA scheme used:
Please indicate serovar and/or protocol
29. Please list the loci in scheme used
30. Locus 1:
31. Locus 2:
32. Locus 3:
33. Locus 4:

TECHNICAL REPORT Eighth external quality assessment scheme for Salmonella typing
65
34. Locus 5:
35. Results for cluster analysis (MLVA) - allele profile
Please use ‘-2’ for not detected and ‘9999’ for not analysed
Locus 1 Locus 2 Locus 3 Locus 4 Locus 5
Strain 1
Strain 2
Strain 3
Strain 4
Strain 5
Strain 6
Strain 7
Strain 8
Strain 9
Strain 10
Strain 11
Strain 12
36. Submitting cluster results
Cluster analysis based on MLVA Do not wish to submit any cluster results based on MLVA analysis
37. Cluster analysis based on WGS data
38. Please select the analysis used to detect the cluster on data derived from WGS
As basis for the cluster detection only one data analysis can be reported. If more than one analysis is performed please report later in this submission
SNP-based Allele-based Other
39. If another analysis is used, please describe your approach:
40. Please select the approach used for the SNP analysis
Reference-based Assembly-based
41. Reference genome used
Please indicate multilocus sequence type (e.g. ST34) and strain ID (e.g. one of the strains from the current cluster, ID of a public reference strain or an in-house strain)
42. Please indicate the read mapper used
(e.g. BWA, Bowtie 2)
43. Please indicate the variant caller used
44. Please indicate the assembler used

Eighth external quality assessment scheme for Salmonella typing TECHNICAL REPORT
66
(e.g. SPAdes, Velvet)
45. Please specify the variant caller used
46. Please select tools used for the allele analysis
BioNumerics SeqPhere Enterobase Assembly-based
47. If another tool is used, please enter here:
48. Please indicate allele calling method:
Assembly based and mapping-based
Only assembly-based Only mapping-based
49. Please indicate the assembler used (e.g. SPAdes, Velvet)
50. Please select scheme used for the allele analysis
Applied Math (wgMLST)
Applied Math (cgMLST/Enterobase) Enterobase (cgMLST) Other
51. If another scheme (e.g. in-house) is used, please give a short description
52. Cluster detected by analysis on data derived from WGS
On this page, you have to report the results for the cluster detected by the selected analysis (e.g. SNP-based). If another additional analysis (e.g. allele based or another SNP based analysis) is performed, please report results later, but you will not be asked to submit the ID’s for strains in the cluster detected with the additional analysis.
53. Please list the ID’s for the strains included in the cluster
Please use semicolon (;) to separate the strain ID’s
54. Select a representative strain in the cluster indicate the strain ID
TECHNICAL REPORT Eighth external quality assessment scheme for Salmonella typing
67
55. Results for cluster analysis (e.g. SNP- or allele-based)
Please use ‘9999’ for not analysed
Distance (e.g. SNP) to the selected cluster strain
Strain 1 ___ Strain 2 ___ Strain 3 ___ Strain 4 ___ Strain 5 ___ Strain 6 ___ Strain 7 ___ Strain 8 ___ Strain 9 ___ Strain 10 ___
Strain 11 ___ Strain 12 ___
56. Would you like to add results performed with another additional analysis on the data derived from the WGS?
E.g. if SNP-based results are submitted, you can also report allele-based results or results from a second SNP analysis
Yes No
57. Please select the additional analysis used on data derived from WGS
SNP-based Allele-based Other
58. If another analysis is used, please describe your approach:
59. Please select the approach used for the SNP analysis
Reference-based Assembly-based
60. Reference genome used
Please indicate multilocus sequence type (e.g. ST34) and strain ID (e.g. one of the strains from the current cluster, ID of a public reference strain or an in-house strain)
61. Please indicate the read mapper used
(e.g. BWA, Bowtie 2)
62. Please indicate the variant caller used
(e.g. SAMtools, GATK)
63. Please indicate the assembler used
64. Please specify the variant caller used

Eighth external quality assessment scheme for Salmonella typing TECHNICAL REPORT
68
(e.g. NUCMER)
65. Please select tool used for the allele analysis
BioNumerics SeqPhere Enterobase Other
66. If another tool is used, please list here:
67. Please indicate allele calling method:
BioNumerics SeqPhere Enterobase Other
68. Please indicate the assembler used (e.g. SPAdes, Velvet)
69. Please select scheme used for the allele analysis
Applied Math (wgMLST) Applied Math (cgMLST/Enterobase) Enterobase (cgMLST) Other
70. If another scheme (e.g. inhouse) is used, please give a short description
71. Additional analysis on data derived from WGS
72. Select a representative strain in the cluster detected by the additional analysis
Indicate the strain ID
TECHNICAL REPORT Eighth external quality assessment scheme for Salmonella typing
69
73. Results for the additional cluster analysis (e.g. SNP- or allele-based)
Please use ‘9999’ for not analysed
Distance (e.g. SNP) to the selected cluster strain
Strain 1 ___ Strain 2 ___ Strain 3 ___ Strain 4 ___ Strain 5 ___ Strain 6 ___ Strain 7 ___ Strain 8 ___ Strain 9 ___ Strain 10 ___ Strain 11 ___ Strain 12 ___
74. Would you like to add results performed with a third analysis on the data derived from the WGS?
E.g. if SNP based results are submitted, you can also report allele-based results or results from a second SNP analysis
Yes No
75. Please select the third analysis used on data derived from WGS
SNP-based Allele-based Other
76. If another analysis is used, please describe your approach:
77. Please select the approach used for the SNP analysis
Reference-based Assembly-based
78. Reference genome used
Please indicate multilocus sequence type (e.g. ST34) and strain ID (e.g. one of the strains from the current cluster, ID of a public reference strain or an in-house strain)
79. Please indicate the read mapper used
(e.g. BWA, Bowtie 2)
80. Please indicate the variant caller used
(e.g. SAMtools, GATK)
81. Please indicate the assembler used
(e.g. SPAdes, Velvet)
Eighth external quality assessment scheme for Salmonella typing TECHNICAL REPORT
70
82. Please specify the variant caller used
(e.g. NUCMER)
83. Please select tool used for the allele analysis
SNP-based Allele-based Allele-based Other
84. If another tool is used, please enter here:
85. Please indicate allele calling method:
Assembly- and mapping-based Only assembly-based Only mapping-based
86. Please indicate the assembler used
(e.g. SPAdes, Velvet)
87. Please select scheme used for the allele analysis
Applied Math (wgMLST) Applied Math (cgMLST/Enterobase) Enterobase (cgMLST) Other
88. If another scheme (e.g. in-house) is used, please give a short description
89. Third analysis on data derived from WGS
90. Select a representative strain in the cluster detected by the third analysis
91. Results for the third cluster analysis (e.g. SNP- or allele-based)
Distance (e.g. SNP) to the selected cluster strain
Strain 1 ___ Strain 2 ___ Strain 3 ___ Strain 4 ___ Strain 5 ___ Strain 6 ___ Strain 7 ___ Strain 8 ___
Strain 9 ___ Strain 10 ___ Strain 11 ___ Strain 12 ___

TECHNICAL REPORT Eighth external quality assessment scheme for Salmonella typing
71
92. Additional questions to the WGS part
93. Where was the sequencing performed
In own laboratory Externally
94. Protocol used to prepare the library for sequencing:
In own laboratory Externally
95. Please indicate name of commercial kit:
96. If relevant, please list deviation from commercial kit shortly in few bullets:
97. For non-commercial kit please indicate a short summary of the protocol:
98. The sequencing platform used
Ion Torrent PGM
Ion Torrent Proton
Genome Sequencer Junior System (454)
Genome Sequencer FLX System (454)
Genome Sequencer FLX+ System (454)
PacBio RS
PacBio RS II
HiScanSQ
HiSeq 1000
HiSeq 1500
HiSeq 2000
HiSeq 2500
HiSeq 4000
Genome Analyzer lix
MiSeq
MiSeq Dx
MiSeq FGx
ABI SOLiD
NextSeq
MinION (ONT)
Other
99. If another platform is used, please list here:
100. Quantitative criteria used to evaluate the quality of sequence data.
Please list up to 10 different criteria (e.g. coverage, N50, number of contigs)
101. Quantitative criteria 1:
102. Threshold used for quantitative criteria 1:

Eighth external quality assessment scheme for Salmonella typing TECHNICAL REPORT
72
103. Quantitative criteria 2:
104. Threshold used for quantitative criteria 2:
105. Quantitative criteria 3:
106. Threshold used for quantitative criteria 3:
107. Quantitative criteria 4:
108. Threshold used for quantitative criteria 4:
109. Quantitative criteria 5:
110. Threshold used for quantitative criteria 5:
111. Quantitative criteria 6:
112. Threshold used for quantitative criteria 6:
113. Quantitative criteria 7:
114. Threshold used for quantitative criteria 7:
115. Quantitative criteria 8:
116. Threshold used for quantitative criteria 8:
117. Quantitative criteria 9
118. Threshold used for quantitative criteria 9:
119. Quantitative criteria 10:

TECHNICAL REPORT Eighth external quality assessment scheme for Salmonella typing
73
120. Threshold used for quantitative criteria 10:
121. Qualitative criteria used to evaluate the quality of sequence data
Please list up to 10 different criteria (e.g. contamination, confirmation of genus)
122. Qualitative criteria 1:
123. If relevant, threshold used for qualitative criteria 1:
124. Qualitative criteria 2:
125. If relevant, threshold used for qualitative criteria 2:
126. Qualitative criteria 3:
127. If relevant, threshold used for qualitative criteria 3:
128. Qualitative criteria 4:
129. If relevant, threshold used for qualitative criteria 4:
130. Qualitative criteria 5:
131. If relevant threshold used for qualitative criteria 5:
132. Qualitative criteria 6:
133. If relevant threshold used for qualitative criteria 6:
134. Qualitative criteria 7:
135. If relevant, threshold used for qualitative criteria 7:
136. Qualitative criteria 8:
137. If relevant, threshold used for qualitative criteria 8:
Eighth external quality assessment scheme for Salmonella typing TECHNICAL REPORT
74
139. If relevant, threshold used for qualitative criteria 9:
140. Qualitative criteria 10:
141. If relevant, threshold used for qualitative criteria 10:
142. Comment(s):
E.g. remarks to the submission, the data analyses or the laboratory methods
143. Thank you for your participation
Thank you for filling out the Submission form for the Salmonella EQA-8. For questions, please contact [email protected] or phone +45 3268 8341 +45 3268 8372. We highly recommend to document this Submission form by printing it. You will find the Print option after pressing the "Options" button. Important: After pressing "Submit results" you will no longer be able to edit or print your information. For final submission, remember to press "Submit results" after printing.

ECDC is committed to ensuring the transparency and independence of its work
In accordance with the Staff Regulations for Officials and Conditions of Employment of Other Servants of the European Union and the ECDC Independence Policy, ECDC staff members shall not, in the performance of their duties, deal with a matter in which, directly or indirectly, they have any personal interest such as to impair their independence. Declarations of interest must be received from any prospective contractor(s) before any contract can be awarded.www.ecdc.europa.eu/en/aboutus/transparency
HOW TO OBTAIN EU PUBLICATIONSFree publications:• onecopy: viaEUBookshop(http://bookshop.europa.eu);
• morethanonecopyorposters/maps: fromtheEuropeanUnion’srepresentations(http://ec.europa.eu/represent_en.htm); fromthedelegationsinnon-EUcountries(http://eeas.europa.eu/delegations/index_en.htm); bycontactingtheEuropeDirectservice(http://europa.eu/europedirect/index_en.htm)or calling 00 800 6 7 8 9 10 11 (freephone number from anywhere in the EU) (*).
(*)Theinformationgivenisfree,asaremostcalls(thoughsomeoperators,phoneboxesorhotelsmaychargeyou).
Priced publications:• viaEUBookshop(http://bookshop.europa.eu).
European Centre for Disease Prevention and Control (ECDC)
Address: GustavIII:sboulevard40,SE-16973Solna,Sweden
Tel.+46858601000Fax+46858601001www.ecdc.europa.eu
An agency of the European Unionwww.europa.eu
Subscribe to our publications www.ecdc.europa.eu/en/publications
Contact us [email protected]
Follow us on Twitter @ECDC_EU
Like our Facebook page www.facebook.com/ECDC.EU