efficient screening for expressed sequence tag polymorphisms (estps) by dna pool sequencing and...
TRANSCRIPT
Efficient screening for expressed sequence tag polymorphisms (ESTPs) byDNA pool sequencing and denaturing gradient gel electrophoresis (DGGE)in spruces
Betty Pelgas1, Nathalie Isabel1,2 and Jean Bousquet1,*1Chaire de recherche du Canada en génomique forestière et environnementale, Centre de recherche enbiologie forestière, Pavillon Charles-Eugène-Marchand, Université Laval, Sainte-Foy, Québec Canada G1K7P4; 2Service Canadien des Forêts, Ressources naturelles Canada, Centre de foresterie des Laurentides, 1055du PEPS, C.P. 3800, Sainte-Foy, Québec, Canada G1V 4C7; *Author for correspondence (e-mail:[email protected]; tel.: 418-656-3493; fax: 418-656-7493)
Received 19 May 2003; accepted in revised form 3 November 2003.
Key words: Codominant markers, Conifers, Consensus mapping, Insertion-deletion, Picea, Single nucleotidepolymorphism
Abstract
There is an urgent need to accelerate the development of informative codominant markers of coding regions suchas ESTPs �expressed sequence tag polymorphisms� to estimate map synteny within and among taxa. A set ofprimer pairs for 207 ESTs or cDNAs from Picea and Pinus taxa was screened on three distantly-related taxa inthe genus Picea, P. mariana �Mill.� B.S.P., P. glauca �Moench� Voss and P. abies �L.� Karst. Of these, 118 �57%�resulted in positive amplification of single-locus gene products in the first two species. To detect polymorphism,these 118 markers were further screened on a panel of 10 pedigree parents for each of P. mariana and P. glauca,either by agarose gel electrophoresis �AGE� or by parallel denaturing gradient gel electrophoresis �DGGE� withstandard conditions of 15-45% urea-formamide. Of these, 87 and 74 were found polymorphic in P. mariana andP. glauca, respectively, and 65 were polymorphic in both species. DNA pool sequencing has been explored as apossible strategy to increase economically the detection throughput of SNPs and small indels, and to characterizethe types of DNA polymorphism detected by DGGE. Different DNA samples of known sequences were pooledin different ratio mixtures before and after PCR amplifications to determine their minimum relative abundancefor detection of DNA polymorphisms by sequencing. For detection of a polymorphism in the DNA pools, theminimum level of relative abundance was 10%. Pooling DNA samples before or after PCR amplification had noeffect on the detection of polymorphism by sequencing. For each species panel, the DNAs were pooled and thenamplified and sequenced for the 118 primer pairs. With this strategy, the number of ESTPs increased to 107 in P.mariana and 106 in P. glauca, and the number of ESTPs shared by both species increased to 99. About half ofthe ESTP markers displayed both SNP and indel polymorphisms while the other half displayed only SNPs. Mostof the additional ESTPs were amenable to detection by DGGE or CAPS �Cleaved Amplified Polymorphic Se-quence� for mapping purposes.
Introduction
Synteny between genetic linkage maps is increasinglybeing investigated for the study of genome evolution
within and between taxa �for a review see Paterson etal. 2000�. To anchor linkage maps, informative multi-allelic homologous markers are ideally sought. ESTPs�expressed sequence tag polymorphisms� are DNA
© 2004 Kluwer Academic Publishers. Printed in the Netherlands.263Molecular Breeding 13: 263–279, 2004.
markers of coding regions, that might be useful to lo-cate potential candidate genes. They are often foundin transcribed but untranslated regions, which are un-der less selective constraints and thus, offer more nu-merous opportunities for substitutions �single nucle-otide polymorphisms, SNPs� and insertions/deletions�indels� �Perry and Bousquet 1998a; Perry et al. 1999;Picoult-Newberg et al. 1999; Grivet et al. 2003�. ES-TPs are usually codominant �Harry et al. 1998; Perryand Bousquet 1998a�, thus they should be more in-formative than dominant markers to anchor linkagemaps �e.g., Plomion et al. 1999; Brown et al. 2001;Gosselin et al. 2002�. Marker homology betweenpedigrees and species can be easily ascertained, forcross-genome comparative mapping. In addition,when primers are designed for conserved regions,ESTPs show a high potential of transferability amongcongeneric species in the conifers �Tsumura et al.1997; Perry and Bousquet 1998b; Temesgen et al.2001; Fournier et al. 2002�.
One of the main challenges with the developmentof ESTP markers in large numbers for use in map-ping projects is to accelerate marker discovery andkeep the detection of DNA polymorphisms simpleand affordable, whether SNPs or indels. Severalmethods are available for such a purpose, includingpolyacrylamide or agarose gel electrophoresis�PAGE-AGE� of PCR products with or withoutdigestion by restriction endonucleases, single strandconformation polymorphism �SSCP; Orita et al.1989�, denaturing gradient gel electrophoresis�DGGE; Myers et al. 1987�, cleaved amplified poly-morphic sequence �CAPS; Konieczny and Ausubel1993�, denaturing high-performance liquid chromato-graphy �DHPLC; Oefner et al. 1994�, and DNA se-quencing. Although SSCP is a highly sensitivemethod to detect mutations within PCR products�Fournier et al. 2002�, DGGE and DHPLC appearedto be more sensitive on many occasions �Choy et al.1999; Numakura et al. 2002�. DGGE is sensitive toSNPs, it is less costly than DHPLC �Choy et al. 1999�and conformational polymorphisms can be revealedwithin a few hours, contrary to SSCP �Fournier et al.2002�.
While DGGE is more cost effective than DNA se-quencing to genotype progeny in large-scale mappingprojects, the scaling of hundreds of markers forDGGE is labor intensive because it is dependent onoptimizing primers and separation conditions for eachmarker �Miller et al. 1999; Temesgen et al. 2001�,without knowing a priori the presence and the type
of DNA polymorphisms. At the other end of the fi-nancial spectrum, DNA sequencing of single geno-types is fully informative but still costly for mappingpurposes. However, one could consider sequencingDNA pools encompassing several or many distinctgenotypes in order to check for marker polymorphismbefore delineating the best DGGE conditions for agiven marker. While common polymorphisms arelikely to be detected beyond background noise withsuch a preparative step to DGGE, the intent is not todetect all polymorphisms within a nucleotide se-quence but to render the marker informative by flag-ging some of the most common polymorphisms. Inno case do we propose to extend such a DNA pool-ing strategy for estimating allele frequencies in asample. In line with our hypothesis, the pooling ofgenomic samples from different individuals prior tosequencing has been considered as a useful methodto efficiently screen for multiple alleles derived fromSNPs �Kwok et al. 1994; Shubitowski et al. 2001�.
The aim of this study was to develop a new cohortof codominant ESTP markers for cross-genome com-parative mapping in the genus Picea, and to test amodified approach for the screening of polymor-phisms in gene coding regions, using a DNA pool se-quencing strategy prior to detection by parallelDGGE. With this combined approach, all pedigreeparents of a same species were regrouped into a com-mon DNA pool, then sequenced to detect polymor-phisms. This study demonstrates an increased sim-plicity to generate rapidly a large number of commonanchor markers for consensus genome mapping be-tween two distantly-related congeneric taxa.
Materials and methods
PCR primers
A total of 207 primer pairs previously developed fromESTs or cDNAs from black spruce �Picea mariana��Perry and Bousquet 1998a�, Norway spruce �Piceaabies� �Schubert et al. 2001; Plomion personnal com-munication; www.pierroton.inra.fr/genetics/pinus/primers.html�, loblolly pine �Pinus taeda� �Harry etal. 1998; Plomion et al. 1999; Brown et al. 2001; Te-mesgen et al. 2001; www.pierroton.inra.fr/genetics/pinus/primers.html�, maritime pine �Pinus pinaster��www.pierroton.inra.fr/genetics/pinus/primers.html�,Scots pine �Pinus sylvestris� �Plomion et al. 1999�,japanese black pine �Pinus thunbergii� �www.pierro-
264
ton.inra.fr/genetics/pinus/primers.html� and jack pine�Pinus banksiana� �www.pierroton.inra.fr/genetics/pi-nus/primers.html� were screened for amplificationand for polymorphism on a panel of 10 diploid pedi-gree parents �20 alleles� for each of black spruce andwhite spruce �Picea glauca�. They were also screenedfor positive amplification and absence of multiple-banding pattern with two individuals of Norwayspruce.
DNA extraction and amplification
Genomic DNA was extracted from each individualwith the DNeasy® Plant Mini Kit �Qiagen, Missis-sauga, Ontario�. DNA concentrations were assessedby GeneSpec spectrophotometer �MiraiBio, Alameda,California� before PCR amplification. PCR reactionswere based on the protocol of Perry and Bousquet�1998a�, with some modifications. DNA amplifica-tions were performed in volumes of 15�l containing1x of reaction buffer, 2mM of MgCl2, 200 �M ofeach dNTP, 120 �M of each primer and 1 unit Plati-num® Taq DNA polymerase �Invitrogen, Carlsbad,California�. To reduce the occurrence of multiple-banding pattern, three PCR programs were used de-pending on the primer pairs tested: �1� 4 min at 95 °Cfor initial denaturation, 40 cycles of 30 s at 95 °C, 30s at 55 °C and 1 min at 72 °C, followed by 10 min at72 °C; �2� 4 min at 94 °C, then 35 cycles of 45 s at94 °C, 45 s at 60 °C and 1 min 30 s at 72 °C, fol-lowed by 10 min at 72 °C; and �3� 5 min at 94 °C,then 14 cycles of 45 s at 94 °C, 45 s at 65 °C �tem-perature decrease of 1 °C per two cycles until 58 °C�and 1 min 30 s at 72 °C, followed by 30 cycles at58 °C annealing temperature, then followed by 10min at 72 °C. To further optimize DNA amplificationfor some markers, the annealing temperatures of thefirst and second programs were modified �AppendixA�. DNA samples were amplified on a PTC-225 ther-mal cycler �MJ Research, Waltham, Massachusetts�.
General strategy for screening EST polymorphisms
For each individual and each primer pair, amplifica-tion products were visualized on 2% agarose gelstained with EtBr to verify amplification and optimizePCR conditions. The presence of polymorphisms wasalso checked on 2% agarose gel and if no detectablepolymorphisms were observed, by DGGE, using asingle standard parallel gradient gel of 15-45% urea-formamide �Temesgen et al. 2001; 100% is defined as
7M urea with 40% �v/v� formamide� with 10% poly-acrylamide �37.5:1; acrylamide:bisacrylamide�. De-naturing gels were subjected to electrophoresis at 175V for 4 hrs, stained with EtBr and visualized on anImager 2000 �Appligene Instrumentation, Illkirch,France�.
For each species panel, DNA samples of the 10parents were also pooled in equal amounts �4 ngDNA/parent� before PCR amplification, then ampli-fied for each candidate primer pair that lead to posi-tive amplification of single-locus product �total of 118primer pairs, see Results� and sequenced on the twoDNA strands to identify putative SNPs or small in-dels �see below for sensitivity analysis�. Such proce-dure enabled: 1- the discovery of additional ESTPmarkers not revealed by standard AGE or DGGE �seeabove�; 2- to characterize at the DNA sequence levelthe types of polymorphism revealed or not revealedby standard DGGE; and 3- for each ESTP detectedby DNA pool sequencing, optimize DGGE conditionswhenever necessary to visualize polymorphisms bytesting additional denaturing parallel gradients, from15-50% to 40-80%. When optimized DGGE couldnot reveal polymorphisms detected by sequencingDNA pools, digestion of PCR products with restric-tion endonucleases was conducted in order to detectCAPS whenever the possibility was indicated by se-quencing information. For each assay, 15 �l of PCRproducts were digested overnight at 37 °C or 65 °Cin a total reaction volume of 24 �l containing 2.4 �lof enzyme buffer �10X�, 6.5 �l H2O and 0.12 unitsof appropriate restriction enzyme. The restrictionproducts were separated on non-denaturing polyacry-lamide gel �10%�, then stained with EtBr.
Testing the sensitivity of DNA pool sequencing
The sensitivity of DNA pool sequencing was deter-mined using different concentrations of two knownalleles/haplotypes into a pool. Primers for the genesSb06 �acyl-CoA oxidase� and Sb12 �RNA bindingprotein� �Perry and Bousquet 1998a� were used forthis purpose as polymorphism was detected usingDGGE with standard parallel gradient of 15-45%urea-formamide. PCR was conducted as describedabove. For each locus, alleles/haplotypes a and bwere amplified and sequenced a priori from needleDNA samples of two selected homozygous individu-als of P. glauca �individual 1: aa; individual 2 : bb�.After identification of SNPs between both individu-als, DNA samples from both alleles/haplotypes were
265
mixed in various ratios to obtain the different DNApools, before or after the amplification step �see be-low�. Final volumes of the PCR reactions were 60�l,including 40�l of master mix and 40ng of total DNAat a concentration of 2ng/�l for each DNA pool.
Experiment 1To verify any competition effect between alleles/hap-lotypes during the amplification process of pooledsamples, the two DNA samples were: A� pooled fol-lowing various ratios �0% allele a and 100% allele b,5-95%, 25-75%, and 50-50%� before the amplifica-tion step; B� amplified individually and then pooledafter amplification but before the purification stepprior to sequencing, and; C� pooled after the purifi-cation step. Purification was done with Microcon-PCR filter units �Millipore, Bedford, Massachusetts�.Both DNA strands were sequenced using the Big-Dye™ Terminator v3.0 Cycle Sequencing Ready Re-action Kit �Applied Biosystems, Foster City, Califor-nia� and an ABI Prism® 3700 Genetic Analyser�Applied Biosystems, Foster City, California�. Eachsequencing reaction was repeated three times.
Experiment 2To determine the sensitivity of DNA pool sequencing,the following pools were constructed from genomicDNA samples before PCR amplification: 100% allelea and 0% allele b, 95-5%, 90-10%, 85-15%, 80-20%,75-25%, 50-50%, 25-75%, 20-80%, 15-85%, 10-90%, 5-95%, 0-100%, respectively. The various poolswere amplified, and purification and sequencing fol-lowed methods described above. Both DNA strandswere sequenced and each sequencing reaction wasrepeated three times to verify consistency.
Analysis of sequencing chromatograms
The sequencing chromatograms of the various DNApools were compared with the chromatograms pro-duced from homozygotes used to construct the pools.Polymorphic sites were identified by visual inspectionof the chromatograms, where superimposed peakshigher than the baseline level were taken as evidenceof potential SNPs. The analysis of the second DNAstrand was done independently and consistencyacross the repeats for each DNA strand and betweenDNA strands was verified a posteriori. Indel poly-morphisms were detected by the presence of a con-tinuous superimposed sequence. Both the beginningand the end of the indel could be deduced from theforward and reverse DNA strands, respectively. Eachanalysis was duplicated with a second scoringobserver.
Results
Detection of polymorphisms by AGE and DGGE
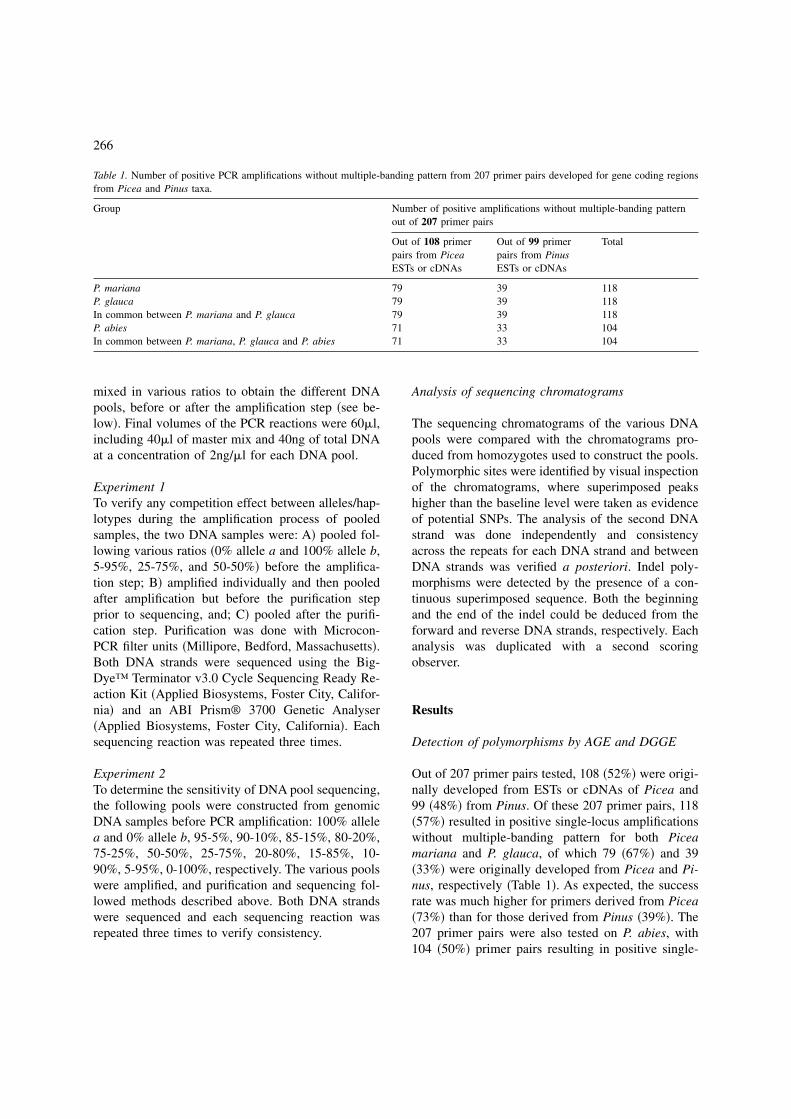
Out of 207 primer pairs tested, 108 �52%� were origi-nally developed from ESTs or cDNAs of Picea and99 �48%� from Pinus. Of these 207 primer pairs, 118�57%� resulted in positive single-locus amplificationswithout multiple-banding pattern for both Piceamariana and P. glauca, of which 79 �67%� and 39�33%� were originally developed from Picea and Pi-nus, respectively �Table 1�. As expected, the successrate was much higher for primers derived from Picea�73%� than for those derived from Pinus �39%�. The207 primer pairs were also tested on P. abies, with104 �50%� primer pairs resulting in positive single-
Table 1. Number of positive PCR amplifications without multiple-banding pattern from 207 primer pairs developed for gene coding regionsfrom Picea and Pinus taxa.
Group Number of positive amplifications without multiple-banding patternout of 207 primer pairs
Out of 108 primerpairs from PiceaESTs or cDNAs
Out of 99 primerpairs from PinusESTs or cDNAs
Total
P. mariana 79 39 118P. glauca 79 39 118In common between P. mariana and P. glauca 79 39 118P. abies 71 33 104In common between P. mariana, P. glauca and P. abies 71 33 104
266
locus amplifications without multiple-banding pattern�Table 1�.
For each of P. mariana and P. glauca, respectively,87 �74%� and 74 �63%� of the 118 primer pairs re-sulted in single-locus polymorphisms �Table 2�, de-tected either by AGE or by standard DGGE �15-45%urea-formamide gradient�, which was used whenAGE failed to detect fragment length polymorphism.A total of 65 primer pairs �55%� revealed single-lo-cus polymorphisms in both species, either by usingAGE or standard DGGE when AGE failed �Table 2�.
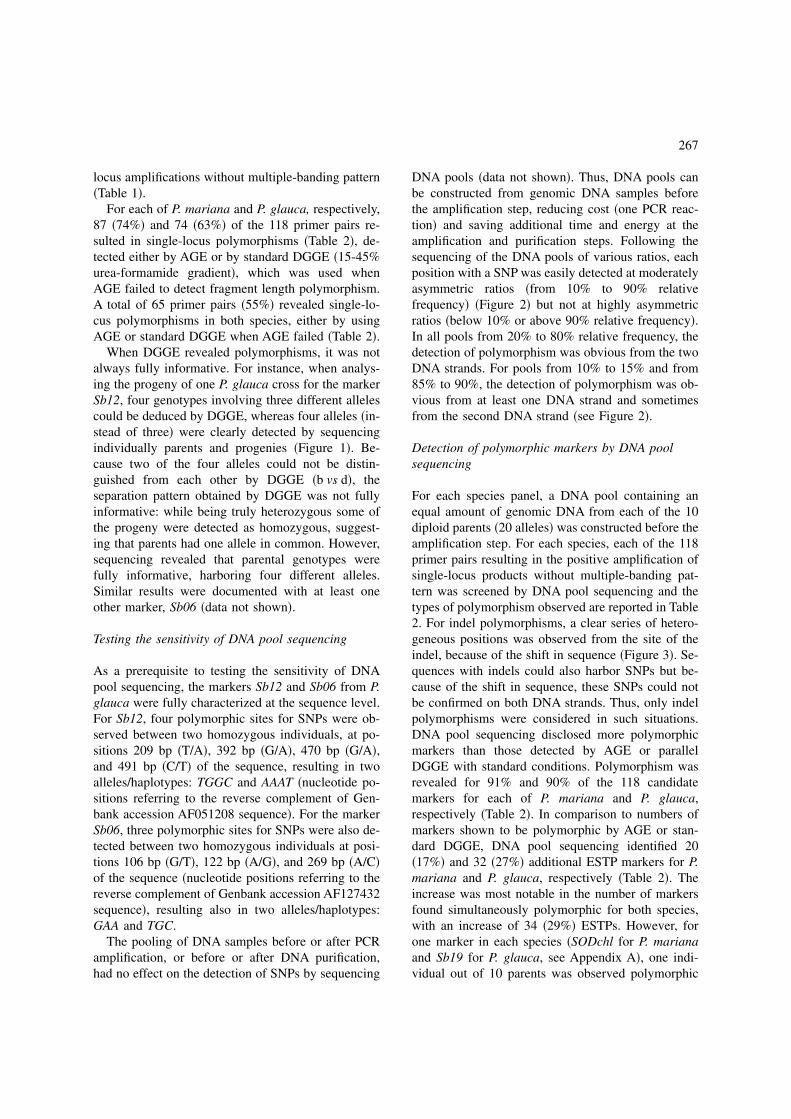
When DGGE revealed polymorphisms, it was notalways fully informative. For instance, when analys-ing the progeny of one P. glauca cross for the markerSb12, four genotypes involving three different allelescould be deduced by DGGE, whereas four alleles �in-stead of three� were clearly detected by sequencingindividually parents and progenies �Figure 1�. Be-cause two of the four alleles could not be distin-guished from each other by DGGE �b vs d�, theseparation pattern obtained by DGGE was not fullyinformative: while being truly heterozygous some ofthe progeny were detected as homozygous, suggest-ing that parents had one allele in common. However,sequencing revealed that parental genotypes werefully informative, harboring four different alleles.Similar results were documented with at least oneother marker, Sb06 �data not shown�.
Testing the sensitivity of DNA pool sequencing
As a prerequisite to testing the sensitivity of DNApool sequencing, the markers Sb12 and Sb06 from P.glauca were fully characterized at the sequence level.For Sb12, four polymorphic sites for SNPs were ob-served between two homozygous individuals, at po-sitions 209 bp �T/A�, 392 bp �G/A�, 470 bp �G/A�,and 491 bp �C/T� of the sequence, resulting in twoalleles/haplotypes: TGGC and AAAT �nucleotide po-sitions referring to the reverse complement of Gen-bank accession AF051208 sequence�. For the markerSb06, three polymorphic sites for SNPs were also de-tected between two homozygous individuals at posi-tions 106 bp �G/T�, 122 bp �A/G�, and 269 bp �A/C�of the sequence �nucleotide positions referring to thereverse complement of Genbank accession AF127432sequence�, resulting also in two alleles/haplotypes:GAA and TGC.
The pooling of DNA samples before or after PCRamplification, or before or after DNA purification,had no effect on the detection of SNPs by sequencing
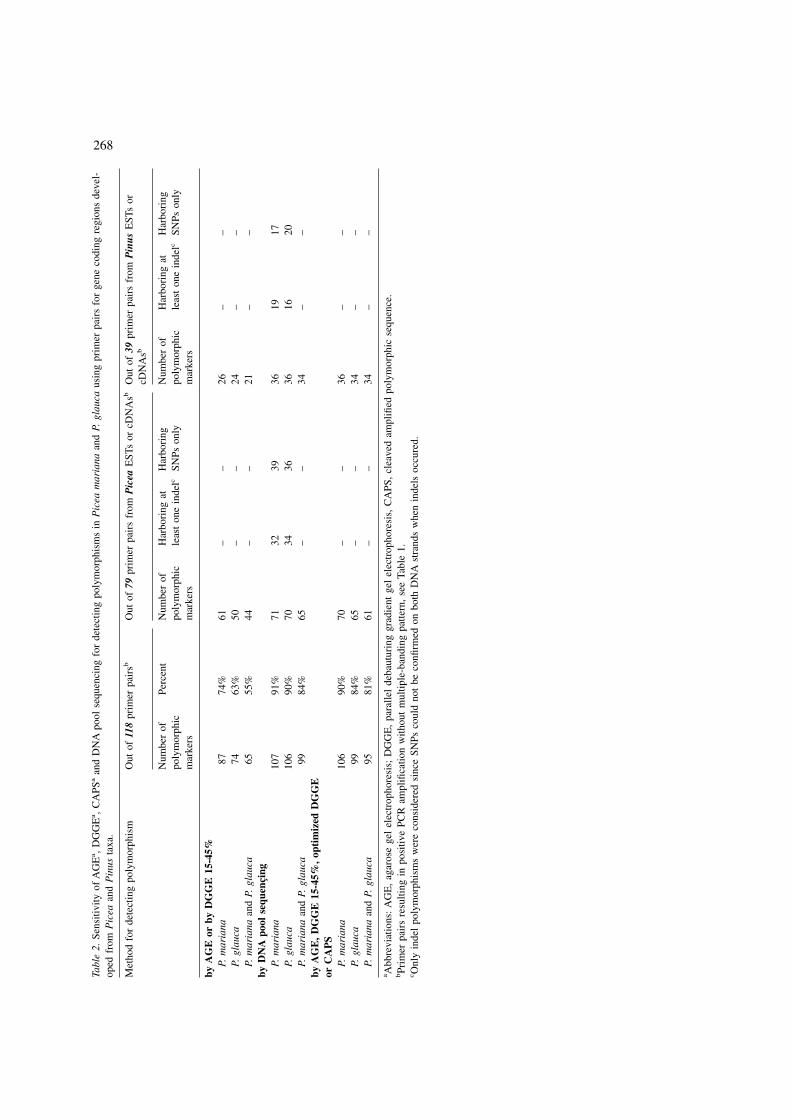
DNA pools �data not shown�. Thus, DNA pools canbe constructed from genomic DNA samples beforethe amplification step, reducing cost �one PCR reac-tion� and saving additional time and energy at theamplification and purification steps. Following thesequencing of the DNA pools of various ratios, eachposition with a SNP was easily detected at moderatelyasymmetric ratios �from 10% to 90% relativefrequency� �Figure 2� but not at highly asymmetricratios �below 10% or above 90% relative frequency�.In all pools from 20% to 80% relative frequency, thedetection of polymorphism was obvious from the twoDNA strands. For pools from 10% to 15% and from85% to 90%, the detection of polymorphism was ob-vious from at least one DNA strand and sometimesfrom the second DNA strand �see Figure 2�.
Detection of polymorphic markers by DNA poolsequencing
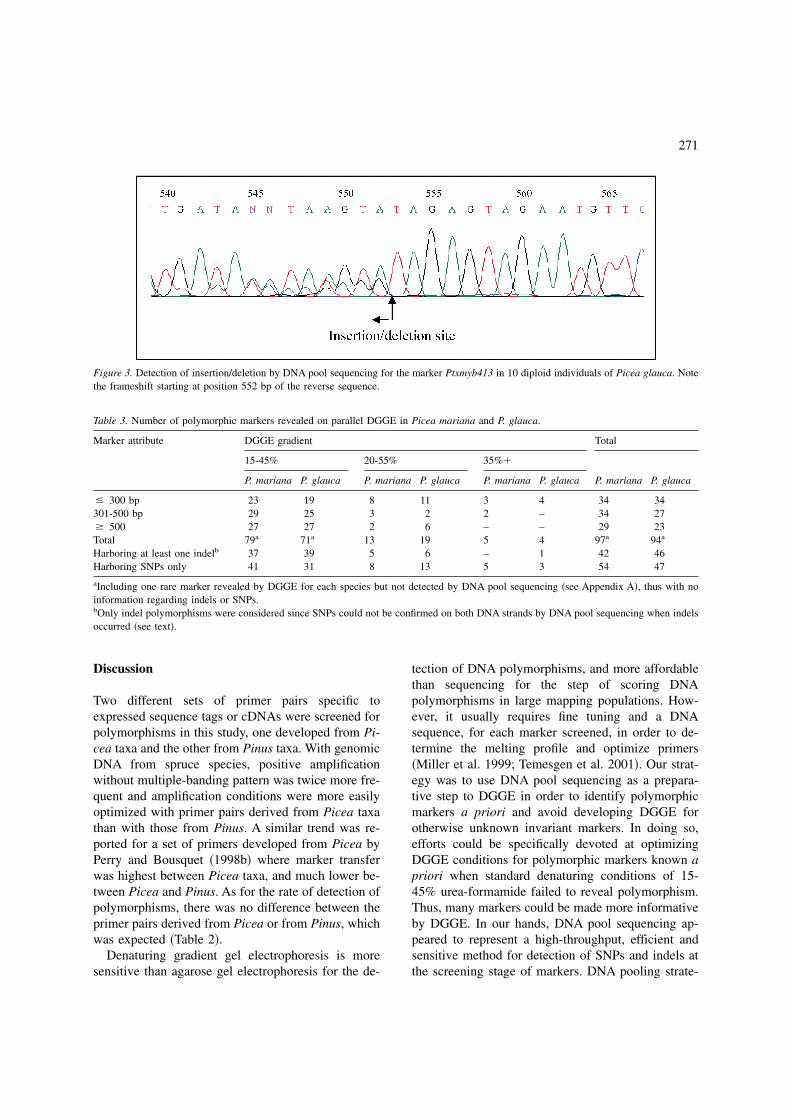
For each species panel, a DNA pool containing anequal amount of genomic DNA from each of the 10diploid parents �20 alleles� was constructed before theamplification step. For each species, each of the 118primer pairs resulting in the positive amplification ofsingle-locus products without multiple-banding pat-tern was screened by DNA pool sequencing and thetypes of polymorphism observed are reported in Table2. For indel polymorphisms, a clear series of hetero-geneous positions was observed from the site of theindel, because of the shift in sequence �Figure 3�. Se-quences with indels could also harbor SNPs but be-cause of the shift in sequence, these SNPs could notbe confirmed on both DNA strands. Thus, only indelpolymorphisms were considered in such situations.DNA pool sequencing disclosed more polymorphicmarkers than those detected by AGE or parallelDGGE with standard conditions. Polymorphism wasrevealed for 91% and 90% of the 118 candidatemarkers for each of P. mariana and P. glauca,respectively �Table 2�. In comparison to numbers ofmarkers shown to be polymorphic by AGE or stan-dard DGGE, DNA pool sequencing identified 20�17%� and 32 �27%� additional ESTP markers for P.mariana and P. glauca, respectively �Table 2�. Theincrease was most notable in the number of markersfound simultaneously polymorphic for both species,with an increase of 34 �29%� ESTPs. However, forone marker in each species �SODchl for P. marianaand Sb19 for P. glauca, see Appendix A�, one indi-vidual out of 10 parents was observed polymorphic
267
Tabl
e2.
Sens
itivi
tyof
AG
Ea ,
DG
GE
a ,C
APS
aan
dD
NA
pool
sequ
enci
ngfo
rde
tect
ing
poly
mor
phis
ms
inP
icea
mar
iana
and
P.gl
auca
usin
gpr
imer
pair
sfo
rge
neco
ding
regi
ons
deve
l-op
edfr
omP
icea
and
Pin
usta
xa.
Met
hod
for
dete
ctin
gpo
lym
orph
ism
Out
of11
8pr
imer
pair
sbO
utof
79pr
imer
pair
sfr
omP
icea
EST
sor
cDN
Asb
Out
of39
prim
erpa
irs
from
Pin
usE
STs
orcD
NA
sb
Num
ber
ofpo
lym
orph
icm
arke
rs
Perc
ent
Num
ber
ofpo
lym
orph
icm
arke
rs
Har
bori
ngat
leas
ton
ein
delc
Har
bori
ngSN
Pson
lyN
umbe
rof
poly
mor
phic
mar
kers
Har
bori
ngat
leas
ton
ein
delc
Har
bori
ngSN
Pson
ly
byA
GE
orby
DG
GE
15-4
5%P.
mar
iana
8774
%61
––
26–
–P.
glau
ca74
63%
50–
–24
––
P.m
aria
naan
dP.
glau
ca65
55%
44–
–21
––
byD
NA
pool
sequ
ençi
ngP.
mar
iana
107
91%
7132
3936
1917
P.gl
auca
106
90%
7034
3636
1620
P.m
aria
naan
dP.
glau
ca99
84%
65–
–34
––
byA
GE
,D
GG
E15
-45%
,op
tim
ized
DG
GE
orC
AP
SP.
mar
iana
106
90%
70–
–36
––
P.gl
auca
9984
%65
––
34–
–P.
mar
iana
and
P.gl
auca
9581
%61
––
34–
–
a Abb
revi
atio
ns:A
GE
,ag
aros
ege
lel
ectr
opho
resi
s;D
GG
E,
para
llel
deba
utur
ing
grad
ient
gel
elec
trop
hore
sis,
CA
PS,
clea
ved
ampl
ified
poly
mor
phic
sequ
ence
.bPr
imer
pair
sre
sulti
ngin
posi
tive
PCR
ampl
ifica
tion
with
out
mul
tiple
-ban
ding
patte
rn,
see
Tabl
e1.
c Onl
yin
del
poly
mor
phis
ms
wer
eco
nsid
ered
sinc
eSN
Psco
uld
not
beco
nfirm
edon
both
DN
Ast
rand
sw
hen
inde
lsoc
cure
d.
268
by DGGE, whereas no polymorphism was detectedby DNA pool sequencing. This result was likelycaused by one heterozygous parent for the marker,thus decreasing to 5% the frequency of the variant inthe DNA pool �one out of 20 alleles derived from 10diploid individuals�, below the minimum detectionlevel of 10% by DNA pool sequencing �see above�.
There were slightly more markers harboring onlySNPs only than those harboring indels, with respec-tive numbers of 56 and 51 for P. mariana and 56 and50 for P. glauca �Table 2�. On average, there was oneSNP per 100 bp �1.0%� and one indel per 555 bp�0.18%� in P. mariana, and one SNP per 122 bp�0.82%� and one indel per 575 bp �0.17%� in P.glauca. When coupling SNPs and indels, the overallrate of polymorphism was one per 85 bp �1.18 %� inP. mariana and one per 101 bp �0.99 %� in P. glauca.The estimates of SNP rates should be considered as
conservative: when indels were detected by DNApool sequencing, a shift in DNA sequence was vis-ible on the chromatograms from the position of theindel, preventing SNPs to be confirmed on both DNAstrands. Thus, these SNPs were not considered andscored.
Optimization of DGGE
Using information from DNA pool sequencing,DGGE conditions were further optimized to revealadditional markers in the mapping populations, or byusing CAPS �Table 2�. The rates of conversion of thenew polymorphic markers discovered by DNA poolsequencing to additional markers detectable by opti-mized DGGE or CAPS were 95% additional markersfor P. mariana �19 out of 20 new polymorphic mark-ers�, 78% for P. glauca �25 out of 32� and 88% �30
Figure 1. The relative efficiency of DNA sequencing and DGGE at detecting allelic variation for the marker Sb12 in Picea glauca: �A� fourdifferent genotypes �ab: #225; ac: #221; bc: #224; and bb: #238; ht is the heterodimer� were observed by DGGE �parallel gradient of 15-45%urea-formamide�, resulting in only three different alleles deduced �a, b, and c, with b as a heterogenous class containing two indiscerniblealleles�; �B� whereas four different alleles �a, b, c, and d� were clearly detected by sequencing.
269
out of 34� additional markers common to both spe-cies �Table 2�. Only a few markers shown to be poly-morphic by DNA pool sequencing remained mono-morphic by using these refined procedures �seeAppendix A�.
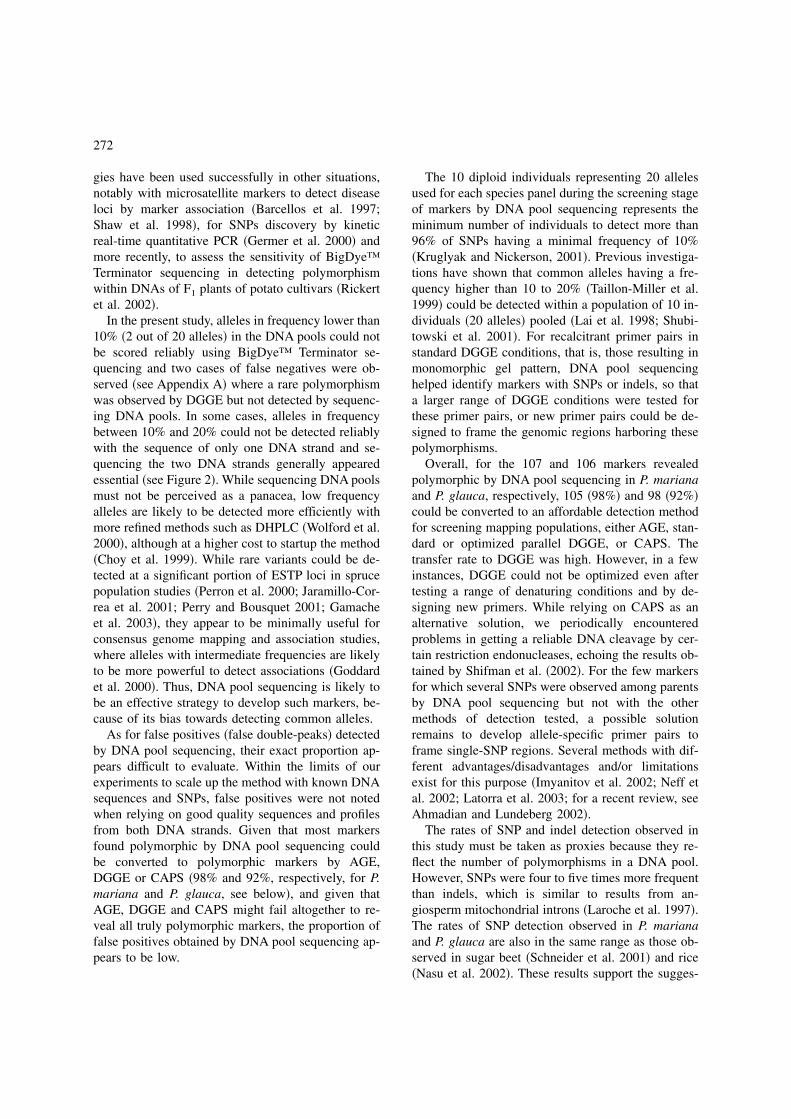
Regarding the markers shown to be polymorphicby DNA pool sequencing in P. mariana �107� and inP. glauca �106� �Table 1�, DGGE could achieve thedetection of polymorphism for 91% �97 out of 107�and 89% �94 out of 106� of them, respectively, usingeither standard or optimized conditions �see Appen-dix A�. The DNA fragment size class below 300 bpwas more frequently recovered than other size classes
by DGGE with 20-55% or 35%� parallel gradients,as opposed to DGGE with 15-45% parallel gradient�Table 3�. Of the markers detected polymorphic byDGGE on P. mariana and for which information wasavailable from DNA pool sequencing, 56% harboredSNPs only �54 out of 96 markers� while this propor-tion was 51% �47 out of 93� for P. glauca �Table 3�.The rest of the markers harbored indels with or with-out SNPs.
Figure 2. Sensitivity of SNP detection by DNA pool sequencing for the marker Sb12 in Picea glauca. To avoid overloading, only results forthe second SNP �A; position 392� and the fourth SNP �B; position 491� are shown. Under each chromatogram, variant alleles are indicatedby percent fraction �50 to 0%� in the DNA pools. The variant nucleotides are underlined. The P. glauca DNA sequence is indicated aboveeach chromatogram. SNPs could be detected with frequencies equal to or higher than 10% �ratios of a:b haplotypes equal to or above 2:20�in the DNA pools �A and B�.
270
Discussion
Two different sets of primer pairs specific toexpressed sequence tags or cDNAs were screened forpolymorphisms in this study, one developed from Pi-cea taxa and the other from Pinus taxa. With genomicDNA from spruce species, positive amplificationwithout multiple-banding pattern was twice more fre-quent and amplification conditions were more easilyoptimized with primer pairs derived from Picea taxathan with those from Pinus. A similar trend was re-ported for a set of primers developed from Picea byPerry and Bousquet �1998b� where marker transferwas highest between Picea taxa, and much lower be-tween Picea and Pinus. As for the rate of detection ofpolymorphisms, there was no difference between theprimer pairs derived from Picea or from Pinus, whichwas expected �Table 2�.
Denaturing gradient gel electrophoresis is moresensitive than agarose gel electrophoresis for the de-
tection of DNA polymorphisms, and more affordablethan sequencing for the step of scoring DNApolymorphisms in large mapping populations. How-ever, it usually requires fine tuning and a DNAsequence, for each marker screened, in order to de-termine the melting profile and optimize primers�Miller et al. 1999; Temesgen et al. 2001�. Our strat-egy was to use DNA pool sequencing as a prepara-tive step to DGGE in order to identify polymorphicmarkers a priori and avoid developing DGGE forotherwise unknown invariant markers. In doing so,efforts could be specifically devoted at optimizingDGGE conditions for polymorphic markers known apriori when standard denaturing conditions of 15-45% urea-formamide failed to reveal polymorphism.Thus, many markers could be made more informativeby DGGE. In our hands, DNA pool sequencing ap-peared to represent a high-throughput, efficient andsensitive method for detection of SNPs and indels atthe screening stage of markers. DNA pooling strate-
Figure 3. Detection of insertion/deletion by DNA pool sequencing for the marker Ptxmyb413 in 10 diploid individuals of Picea glauca. Notethe frameshift starting at position 552 bp of the reverse sequence.
Table 3. Number of polymorphic markers revealed on parallel DGGE in Picea mariana and P. glauca.
Marker attribute DGGE gradient Total
15-45% 20-55% 35%�
P. mariana P. glauca P. mariana P. glauca P. mariana P. glauca P. mariana P. glauca
� 300 bp 23 19 8 11 3 4 34 34301-500 bp 29 25 3 2 2 – 34 27� 500 27 27 2 6 – – 29 23Total 79a 71a 13 19 5 4 97a 94a
Harboring at least one indelb 37 39 5 6 – 1 42 46Harboring SNPs only 41 31 8 13 5 3 54 47
aIncluding one rare marker revealed by DGGE for each species but not detected by DNA pool sequencing �see Appendix A�, thus with noinformation regarding indels or SNPs.bOnly indel polymorphisms were considered since SNPs could not be confirmed on both DNA strands by DNA pool sequencing when indelsoccurred �see text�.
271
gies have been used successfully in other situations,notably with microsatellite markers to detect diseaseloci by marker association �Barcellos et al. 1997;Shaw et al. 1998�, for SNPs discovery by kineticreal-time quantitative PCR �Germer et al. 2000� andmore recently, to assess the sensitivity of BigDye™Terminator sequencing in detecting polymorphismwithin DNAs of F1 plants of potato cultivars �Rickertet al. 2002�.
In the present study, alleles in frequency lower than10% �2 out of 20 alleles� in the DNA pools could notbe scored reliably using BigDye™ Terminator se-quencing and two cases of false negatives were ob-served �see Appendix A� where a rare polymorphismwas observed by DGGE but not detected by sequenc-ing DNA pools. In some cases, alleles in frequencybetween 10% and 20% could not be detected reliablywith the sequence of only one DNA strand and se-quencing the two DNA strands generally appearedessential �see Figure 2�. While sequencing DNA poolsmust not be perceived as a panacea, low frequencyalleles are likely to be detected more efficiently withmore refined methods such as DHPLC �Wolford et al.2000�, although at a higher cost to startup the method�Choy et al. 1999�. While rare variants could be de-tected at a significant portion of ESTP loci in sprucepopulation studies �Perron et al. 2000; Jaramillo-Cor-rea et al. 2001; Perry and Bousquet 2001; Gamacheet al. 2003�, they appear to be minimally useful forconsensus genome mapping and association studies,where alleles with intermediate frequencies are likelyto be more powerful to detect associations �Goddardet al. 2000�. Thus, DNA pool sequencing is likely tobe an effective strategy to develop such markers, be-cause of its bias towards detecting common alleles.
As for false positives �false double-peaks� detectedby DNA pool sequencing, their exact proportion ap-pears difficult to evaluate. Within the limits of ourexperiments to scale up the method with known DNAsequences and SNPs, false positives were not notedwhen relying on good quality sequences and profilesfrom both DNA strands. Given that most markersfound polymorphic by DNA pool sequencing couldbe converted to polymorphic markers by AGE,DGGE or CAPS �98% and 92%, respectively, for P.mariana and P. glauca, see below�, and given thatAGE, DGGE and CAPS might fail altogether to re-veal all truly polymorphic markers, the proportion offalse positives obtained by DNA pool sequencing ap-pears to be low.
The 10 diploid individuals representing 20 allelesused for each species panel during the screening stageof markers by DNA pool sequencing represents theminimum number of individuals to detect more than96% of SNPs having a minimal frequency of 10%�Kruglyak and Nickerson, 2001�. Previous investiga-tions have shown that common alleles having a fre-quency higher than 10 to 20% �Taillon-Miller et al.1999� could be detected within a population of 10 in-dividuals �20 alleles� pooled �Lai et al. 1998; Shubi-towski et al. 2001�. For recalcitrant primer pairs instandard DGGE conditions, that is, those resulting inmonomorphic gel pattern, DNA pool sequencinghelped identify markers with SNPs or indels, so thata larger range of DGGE conditions were tested forthese primer pairs, or new primer pairs could be de-signed to frame the genomic regions harboring thesepolymorphisms.
Overall, for the 107 and 106 markers revealedpolymorphic by DNA pool sequencing in P. marianaand P. glauca, respectively, 105 �98%� and 98 �92%�could be converted to an affordable detection methodfor screening mapping populations, either AGE, stan-dard or optimized parallel DGGE, or CAPS. Thetransfer rate to DGGE was high. However, in a fewinstances, DGGE could not be optimized even aftertesting a range of denaturing conditions and by de-signing new primers. While relying on CAPS as analternative solution, we periodically encounteredproblems in getting a reliable DNA cleavage by cer-tain restriction endonucleases, echoing the results ob-tained by Shifman et al. �2002�. For the few markersfor which several SNPs were observed among parentsby DNA pool sequencing but not with the othermethods of detection tested, a possible solutionremains to develop allele-specific primer pairs toframe single-SNP regions. Several methods with dif-ferent advantages/disadvantages and/or limitationsexist for this purpose �Imyanitov et al. 2002; Neff etal. 2002; Latorra et al. 2003; for a recent review, seeAhmadian and Lundeberg 2002�.
The rates of SNP and indel detection observed inthis study must be taken as proxies because they re-flect the number of polymorphisms in a DNA pool.However, SNPs were four to five times more frequentthan indels, which is similar to results from an-giosperm mitochondrial introns �Laroche et al. 1997�.The rates of SNP detection observed in P. marianaand P. glauca are also in the same range as those ob-served in sugar beet �Schneider et al. 2001� and rice�Nasu et al. 2002�. These results support the sugges-
272
tion of Gupta et al. �2001� that SNPs are more fre-quent in plant genomes than in mammalian genomes�Wang et al. 1998; Cargill et al. 1999; Sachidanan-dam et al. 2001�. However, the rate of indel detectionwas lower than that observed in maize �Bhattramakkiet al. 2002; Ching et al. 2002�. When coupling bothSNPs and indels, one polymorphism was observedevery 92 bp �or 1.09 %�, on average, for both Piceaspecies. This rate of polymorphism is higher than thatestimated in barley from a sequenced gene pool�Kanazin et al. 2002�.
DNA pool sequencing indicated high rates ofmarker polymorphism in P. mariana and P. glauca�91 and 90%, respectively�, which appears to be en-couraging for estimating consensus maps in the ge-nus Picea. Comparative mapping requires commonanchor markers such as microsatellites or ESTPs inorder to estimate synteny and colinearity of linkagegroups between species. In Angiosperms, studies of
synteny and colinearity are in progress �Babula et al.2003� and in Gymnosperms, such studies are con-ducted within the genus Pinus �Brown et al. 2001; D.Neale, USDA Forest Services, UC Davis, CA, pers.comm.�. It is to be expected that the markers reportedin this study will help achieve a similar goal in thegenus Picea and more generally, in conifers.
Acknowledgements
We thank S. Plante and S. Senneville �CRBF, Univ.Laval� for help and support in the laboratory, C. Plo-mion �INRA-Bordeaux� for providing some of theprimer sequences, and two anonymous reviewers fortheir helpful suggestions. This research was supportedby a National Sciences and Engineering ResearchCouncil of Canada grant �Genomics Program� to J.B.and N.I.
273
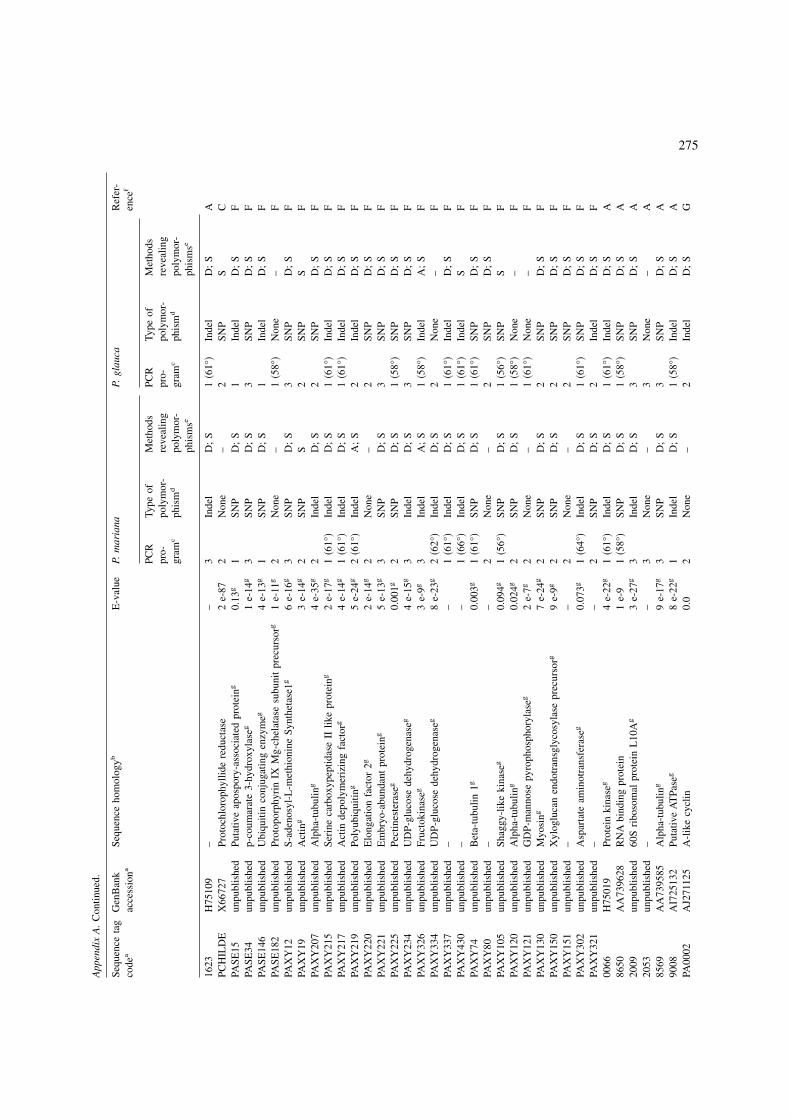
App
endi
x
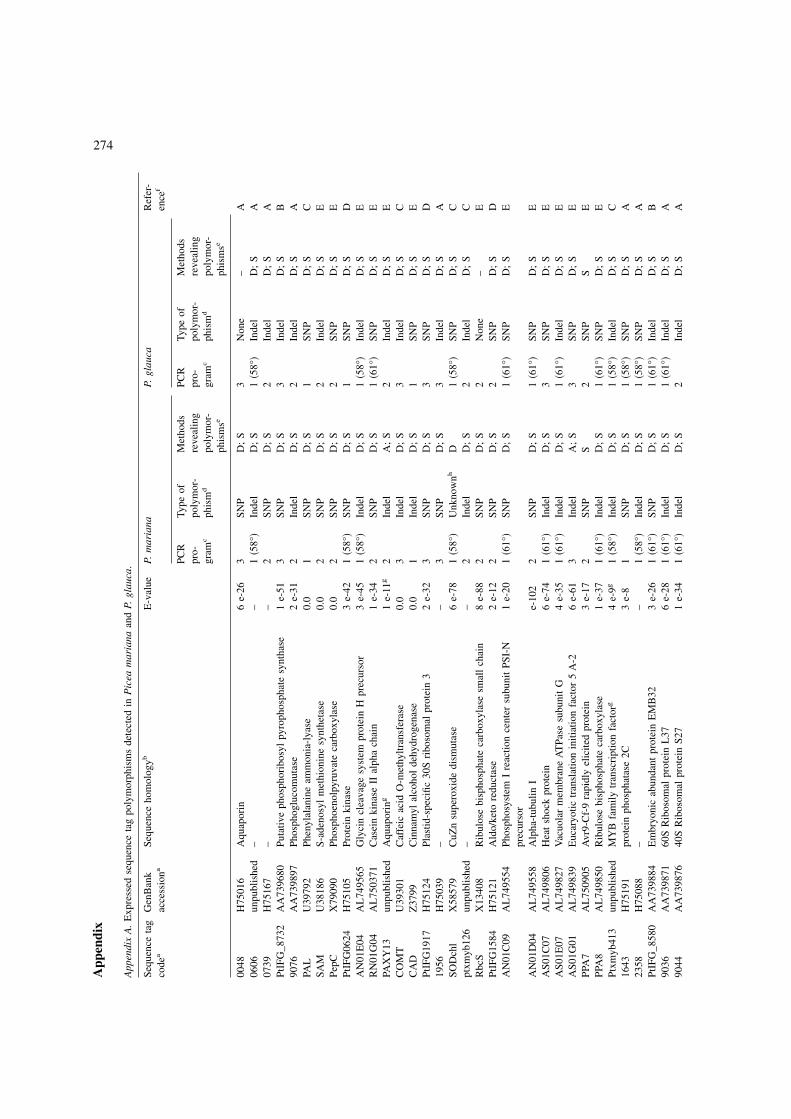
App
endi
xA
.E
xpre
ssed
sequ
ence
tag
poly
mor
phis
ms
dete
cted
inP
icea
mar
iana
and
P.gl
auca
.
Sequ
ence
tag
code
aG
enB
ank
acce
ssio
naSe
quen
ceho
mol
ogyb
E-v
alue
P.m
aria
naP.
glau
caR
efer
-en
cef
PCR
pro-
gram
c
Type
ofpo
lym
or-
phis
md
Met
hods
reve
alin
gpo
lym
or-
phis
mse
PCR
pro-
gram
c
Type
ofpo
lym
or-
phis
md
Met
hods
reve
alin
gpo
lym
or-
phis
mse
0048
H75
016
Aqu
apor
in6
e-26
3SN
PD
;S
3N
one
–A
0606
unpu
blis
hed
––
1�5
8°�
Inde
lD
;S
1�5
8°�
Inde
lD
;S
A07
39H
7516
7–
–2
SNP
D;
S2
Inde
lD
;S
APt
IFG
_873
2A
A73
9680
Puta
tive
phos
phor
ibos
ylpy
roph
osph
ate
synt
hase
1e-
513
SNP
D;
S3
Inde
lD
;S
B90
76A
A73
9897
Phos
phog
luco
mut
ase
2e-
312
Inde
lD
;S
2In
del
D;
SA
PAL
U39
792
Phen
ylal
anin
eam
mon
ia-l
yase
0.0
1SN
PD
;S
1SN
PD
;S
CSA
MU
3818
6S-
aden
osyl
met
hion
ine
synt
heta
se0.
02
SNP
D;
S2
Inde
lD
;S
EPe
pCX
7909
0Ph
osph
oeno
lpyr
uvat
eca
rbox
ylas
e0.
02
SNP
D;
S2
SNP
D;
SE
PtIF
G06
24H
7510
5Pr
otei
nki
nase
3e-
421
�58°
�SN
PD
;S
1SN
PD
;S
DA
N01
E04
AL
7495
65G
lyci
ncl
eava
gesy
stem
prot
ein
Hpr
ecur
sor
3e-
451
�58°
�In
del
D;
S1
�58°
�In
del
D;
SE
RN
01G
04A
L75
0371
Cas
ein
kina
seII
alph
ach
ain
1e-
342
SNP
D;
S1
�61°
�SN
PD
;S
EPA
XY
13un
publ
ishe
dA
quap
orin
g1
e-11
g2
Inde
lA
;S
2In
del
D;
SE
CO
MT
U39
301
Caf
feic
acid
O-m
ethy
ltran
sfer
ase
0.0
3In
del
D;
S3
Inde
lD
;S
CC
AD
Z37
99C
inna
myl
alco
hol
dehy
drog
enas
e0.
01
Inde
lD
;S
1SN
PD
;S
EPt
IFG
1917
H75
124
Plas
tid-s
peci
fic30
Sri
boso
mal
prot
ein
32
e-32
3SN
PD
;S
3SN
PD
;S
D19
56H
7503
9–
–3
SNP
D;
S3
Inde
lD
;S
ASO
Dch
lX
5857
9C
uZn
supe
roxi
dedi
smut
ase
6e-
781
�58°
�U
nkno
wnh
D1
�58°
�SN
PD
;S
Cpt
xmyb
126
unpu
blis
hed
––
2In
del
D;
S2
Inde
lD
;S
CR
bcS
X13
408
Rib
ulos
ebi
spho
spha
teca
rbox
ylas
esm
all
chai
n8
e-88
2SN
PD
;S
2N
one
–E
PtIF
G15
84H
7512
1A
ldo/
keto
redu
ctas
e2
e-12
2SN
PD
;S
2SN
PD
;S
DA
N01
C09
AL
7495
54Ph
osph
osys
tem
Ire
actio
nce
nter
subu
nit
PSI-
Npr
ecur
sor
1e-
201
�61°
�SN
PD
;S
1�6
1°�
SNP
D;
SE
AN
01D
04A
L74
9558
Alp
ha-t
ubul
inI
e-10
22
SNP
D;
S1
�61°
�SN
PD
;S
EA
S01C
07A
L74
9806
Hea
tsh
ock
prot
ein
6e-
741
�61°
�In
del
D;
S3
SNP
D;
SE
AS0
1E07
AL
7498
27V
acuo
lar
mem
bran
eA
TPa
sesu
buni
tG
4e-
351
�61°
�In
del
D;
S1
�61°
�In
del
D;
SE
AS0
1G01
AL
7498
39E
ucar
yotic
tran
slat
ion
initi
atio
nfa
ctor
5A
-26
e-61
3In
del
A;
S3
SNP
D;
SE
PPA
7A
L75
0905
Avr
9-C
f-9
rapi
dly
elic
ited
prot
ein
3e-
172
SNP
S2
SNP
SE
PPA
8A
L74
9850
Rib
ulos
ebi
spho
spha
teca
rbox
ylas
e1
e-37
1�6
1°�
Inde
lD
;S
1�6
1°�
SNP
D;
SE
Ptxm
yb41
3un
publ
ishe
dM
YB
fam
ilytr
ansc
ript
ion
fact
org
4e-
9g1
�58°
�In
del
D;
S1
�58°
�In
del
D;
SC
1643
H75
191
prot
ein
phos
phat
ase
2C3
e-8
1SN
PD
;S
1�5
8°�
SNP
D;
SA
2358
H75
088
––
1�5
8°�
Inde
lD
;S
1�5
8°�
SNP
D;
SA
PtIF
G_8
580
AA
7398
84E
mbr
yoni
cab
unda
ntpr
otei
nE
MB
323
e-26
1�6
1°�
SNP
D;
S1
�61°
�In
del
D;
SB
9036
AA
7398
7160
SR
ibos
omal
prot
ein
L37
6e-
281
�61°
�In
del
D;
S1
�61°
�In
del
D;
SA
9044
AA
7398
7640
SR
ibos
omal
prot
ein
S27
1e-
341
�61°
�In
del
D;
S2
Inde
lD
;S
A
274
App
endi
xA
.C
ontin
ued.
Sequ
ence
tag
code
aG
enB
ank
acce
ssio
naSe
quen
ceho
mol
ogyb
E-v
alue
P.m
aria
naP.
glau
caR
efer
-en
cef
PCR
pro-
gram
c
Type
ofpo
lym
or-
phis
md
Met
hods
reve
alin
gpo
lym
or-
phis
mse
PCR
pro-
gram
c
Type
ofpo
lym
or-
phis
md
Met
hods
reve
alin
gpo
lym
or-
phis
mse
1623
H75
109
––
3In
del
D;
S1
�61°
�In
del
D;
SA
PCH
ILD
EX
6672
7Pr
otoc
hlor
ophy
llide
redu
ctas
e2
e-87
2N
one
–2
SNP
SC
PASE
15un
publ
ishe
dPu
tativ
eap
ospo
ry-a
ssoc
iate
dpr
otei
ng0.
13g
1SN
PD
;S
1In
del
D;
SF
PASE
34un
publ
ishe
dp-
coum
arat
e3-
hydr
oxyl
aseg
1e-
14g
3SN
PD
;S
3SN
PD
;S
FPA
SE14
6un
publ
ishe
dU
biqu
itin
conj
ugat
ing
enzy
meg
4e-
13g
1SN
PD
;S
1In
del
D;
SF
PASE
182
unpu
blis
hed
Prot
opor
phyr
inIX
Mg-
chel
atas
esu
buni
tpr
ecur
sorg
1e-
11g
2N
one
–1
�58°
�N
one
–F
PAX
Y12
unpu
blis
hed
S-ad
enos
yl-L
-met
hion
ine
Synt
heta
se1g
6e-
16g
3SN
PD
;S
3SN
PD
;S
FPA
XY
19un
publ
ishe
dA
ctin
g3
e-14
g2
SNP
S2
SNP
SF
PAX
Y20
7un
publ
ishe
dA
lpha
-tub
ulin
g4
e-35
g2
Inde
lD
;S
2SN
PD
;S
FPA
XY
215
unpu
blis
hed
Seri
neca
rbox
ypep
tidas
eII
like
prot
eing
2e-
17g
1�6
1°�
Inde
lD
;S
1�6
1°�
Inde
lD
;S
FPA
XY
217
unpu
blis
hed
Act
inde
poly
mer
izin
gfa
ctor
g4
e-14
g1
�61°
�In
del
D;
S1
�61°
�In
del
D;
SF
PAX
Y21
9un
publ
ishe
dPo
lyub
iqui
ting
5e-
24g
2�6
1°�
Inde
lA
;S
2In
del
D;
SF
PAX
Y22
0un
publ
ishe
dE
long
atio
nfa
ctor
2g2
e-14
g2
Non
e–
2SN
PD
;S
FPA
XY
221
unpu
blis
hed
Em
bryo
-abu
ndan
tpr
otei
ng5
e-13
g3
SNP
D;
S3
SNP
D;
SF
PAX
Y22
5un
publ
ishe
dPe
ctin
este
rase
g0.
001g
2SN
PD
;S
1�5
8°�
SNP
D;
SF
PAX
Y23
4un
publ
ishe
dU
DP-
gluc
ose
dehy
drog
enas
eg4
e-15
g3
Inde
lD
;S
3SN
PD
;S
FPA
XY
326
unpu
blis
hed
Fruc
toki
nase
g3
e-9g
3In
del
A;
S1
�58°
�In
del
A;
SF
PAX
Y33
4un
publ
ishe
dU
DP-
gluc
ose
dehy
drog
enas
eg8
e-23
g2
�62°
�In
del
D;
S2
Non
e–
FPA
XY
337
unpu
blis
hed
––
1�6
1°�
Inde
lD
;S
1�6
1°�
Inde
lD
;S
FPA
XY
430
unpu
blis
hed
––
1�6
6°�
Inde
lD
;S
1�6
1°�
Inde
lS
FPA
XY
74un
publ
ishe
dB
eta-
tubu
lin1g
0.00
3g1
�61°
�SN
PD
;S
1�6
1°�
SNP
D;
SF
PAX
Y80
unpu
blis
hed
––
2N
one
–2
SNP
D;
SF
PAX
Y10
5un
publ
ishe
dSh
aggy
-lik
eki
nase
g0.
094g
1�5
6°�
SNP
D;
S1
�56°
�SN
PS
FPA
XY
120
unpu
blis
hed
Alp
ha-t
ubul
ing
0.02
4g2
SNP
D;
S1
�58°
�N
one
–F
PAX
Y12
1un
publ
ishe
dG
DP-
man
nose
pyro
phos
phor
ylas
eg2
e-7g
2N
one
–1
�61°
�N
one
–F
PAX
Y13
0un
publ
ishe
dM
yosi
ng7
e-24
g2
SNP
D;
S2
SNP
D;
SF
PAX
Y15
0un
publ
ishe
dX
ylog
luca
nen
dotr
ansg
lyco
syla
sepr
ecur
sorg
9e-
9g2
SNP
D;
S2
SNP
D;
SF
PAX
Y15
1un
publ
ishe
d–
–2
Non
e–
2SN
PD
;S
FPA
XY
302
unpu
blis
hed
Asp
arta
team
inot
rans
fera
seg
0.07
3g1
�64°
�In
del
D;
S1
�61°
�SN
PD
;S
FPA
XY
321
unpu
blis
hed
––
2SN
PD
;S
2In
del
D;
SF
0066
H75
019
Prot
ein
kina
seg
4e-
22g
1�6
1°�
Inde
lD
;S
1�6
1°�
Inde
lD
;S
A86
50A
A73
9628
RN
Abi
ndin
gpr
otei
n1
e-9
1�5
8°�
SNP
D;
S1
�58°
�SN
PD
;S
A20
09un
publ
ishe
d60
Sri
boso
mal
prot
ein
L10
Ag
3e-
27g
3In
del
D;
S3
SNP
D;
SA
2053
unpu
blis
hed
––
3N
one
–3
Non
e–
A85
69A
A73
9585
Alp
ha-t
ubul
ing
9e-
17g
3SN
PD
;S
3SN
PD
;S
A90
08A
I725
132
Puta
tive
AT
Pase
g8
e-22
g1
Inde
lD
;S
1�5
8°�
Inde
lD
;S
APA
0002
AJ2
7112
5A
-lik
ecy
clin
0.0
2N
one
–2
Inde
lD
;S
G
275
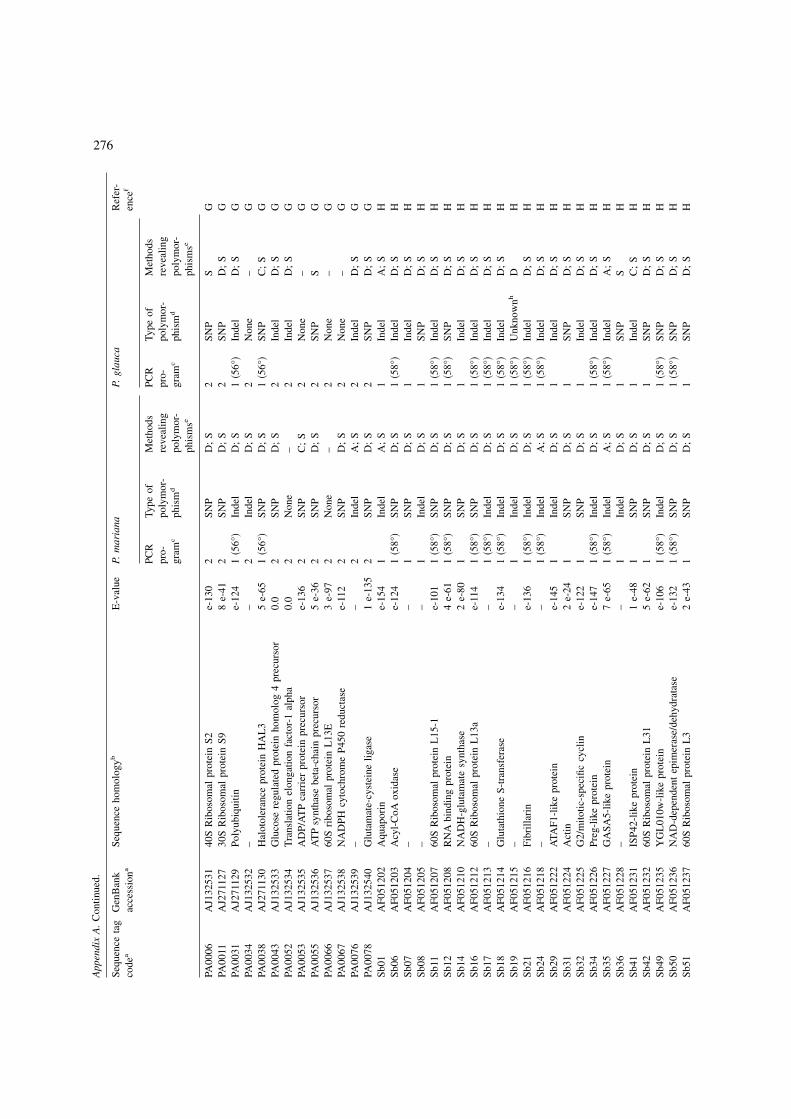
App
endi
xA
.C
ontin
ued.
Sequ
ence
tag
code
aG
enB
ank
acce
ssio
naSe
quen
ceho
mol
ogyb
E-v
alue
P.m
aria
naP.
glau
caR
efer
-en
cef
PCR
pro-
gram
c
Type
ofpo
lym
or-
phis
md
Met
hods
reve
alin
gpo
lym
or-
phis
mse
PCR
pro-
gram
c
Type
ofpo
lym
or-
phis
md
Met
hods
reve
alin
gpo
lym
or-
phis
mse
PA00
06A
J132
531
40S
Rib
osom
alpr
otei
nS2
e-13
02
SNP
D;
S2
SNP
SG
PA00
11A
J271
127
30S
Rib
osom
alpr
otei
nS9
8e-
412
SNP
D;
S2
SNP
D;
SG
PA00
31A
J271
129
Poly
ubiq
uitin
e-12
41
�56°
�In
del
D;
S1
�56°
�In
del
D;
SG
PA00
34A
J132
532
––
2In
del
D;
S2
Non
e–
GPA
0038
AJ2
7113
0H
alot
oler
ance
prot
ein
HA
L3
5e-
651
�56°
�SN
PD
;S
1�5
6°�
SNP
C;
SG
PA00
43A
J132
533
Glu
cose
regu
late
dpr
otei
nho
mol
og4
prec
urso
r0.
02
SNP
D;
S2
Inde
lD
;S
GPA
0052
AJ1
3253
4T
rans
latio
nel
onga
tion
fact
or-1
alph
a0.
02
Non
e–
2In
del
D;
SG
PA00
53A
J132
535
AD
P/A
TP
carr
ier
prot
ein
prec
urso
re-
136
2SN
PC
;S
2N
one
–G
PA00
55A
J132
536
AT
Psy
ntha
sebe
ta-c
hain
prec
urso
r5
e-36
2SN
PD
;S
2SN
PS
GPA
0066
AJ1
3253
760
Sri
boso
mal
prot
ein
L13
E3
e-97
2N
one
–2
Non
e–
GPA
0067
AJ1
3253
8N
AD
PHcy
toch
rom
eP4
50re
duct
ase
e-11
22
SNP
D;
S2
Non
e–
GPA
0076
AJ1
3253
9–
–2
Inde
lA
;S
2In
del
D;
SG
PA00
78A
J132
540
Glu
tam
ate-
cyst
eine
ligas
e1
e-13
52
SNP
D;
S2
SNP
D;
SG
Sb01
AF0
5120
2A
quap
orin
e-15
41
Inde
lA
;S
1In
del
A;
SH
Sb06
AF0
5120
3A
cyl-
CoA
oxid
ase
e-12
41
�58°
�SN
PD
;S
1�5
8°�
Inde
lD
;S
HSb
07A
F051
204
––
1SN
PD
;S
1In
del
D;
SH
Sb08
AF0
5120
5–
–1
Inde
lD
;S
1SN
PD
;S
HSb
11A
F051
207
60S
Rib
osom
alpr
otei
nL
15-1
e-10
11
�58°
�SN
PD
;S
1�5
8°�
Inde
lD
;S
HSb
12A
F051
208
RN
Abi
ndin
gpr
otei
n4
e-61
1�5
8°�
SNP
D;
S1
�58°
�SN
PD
;S
HSb
14A
F051
210
NA
DH
-glu
tam
ate
synt
hase
2e-
801
SNP
D;
S1
Inde
lD
;S
HSb
16A
F051
212
60S
Rib
osom
alpr
otei
nL
13a
e-11
41
�58°
�SN
PD
;S
1�5
8°�
Inde
lD
;S
HSb
17A
F051
213
––
1�5
8°�
Inde
lD
;S
1�5
8°�
Inde
lD
;S
HSb
18A
F051
214
Glu
tath
ione
S-tr
ansf
eras
ee-
134
1�5
8°�
Inde
lD
;S
1�5
8°�
Inde
lD
;S
HSb
19A
F051
215
––
1In
del
D;
S1
�58°
�U
nkno
wnh
DH
Sb21
AF0
5121
6Fi
brill
arin
e-13
61
�58°
�In
del
D;
S1
�58°
�In
del
D;
SH
Sb24
AF0
5121
8–
–1
�58°
�In
del
A;
S1
�58°
�In
del
D;
SH
Sb29
AF0
5122
2A
TAF1
-lik
epr
otei
ne-
145
1In
del
D;
S1
Inde
lD
;S
HSb
31A
F051
224
Act
in2
e-24
1SN
PD
;S
1SN
PD
;S
HSb
32A
F051
225
G2/
mito
tic-s
peci
ficcy
clin
e-12
21
SNP
D;
S1
Inde
lD
;S
HSb
34A
F051
226
Preg
-lik
epr
otei
ne-
147
1�5
8°�
Inde
lD
;S
1�5
8°�
Inde
lD
;S
HSb
35A
F051
227
GA
SA5-
like
prot
ein
7e-
651
�58°
�In
del
A;
S1
�58°
�In
del
A;
SH
Sb36
AF0
5122
8–
–1
Inde
lD
;S
1SN
PS
HSb
41A
F051
231
ISP4
2-lik
epr
otei
n1
e-48
1SN
PD
;S
1In
del
C;
SH
Sb42
AF0
5123
260
SR
ibos
omal
prot
ein
L31
5e-
621
SNP
D;
S1
SNP
D;
SH
Sb49
AF0
5123
5Y
GL
010w
-lik
epr
otei
ne-
106
1�5
8°�
Inde
lD
;S
1�5
8°�
SNP
D;
SH
Sb50
AF0
5123
6N
AD
-dep
ende
ntep
imer
ase/
dehy
drat
ase
e-13
21
�58°
�SN
PD
;S
1�5
8°�
SNP
D;
SH
Sb51
AF0
5123
760
SR
ibos
omal
prot
ein
L3
2e-
431
SNP
D;
S1
SNP
D;
SH
276
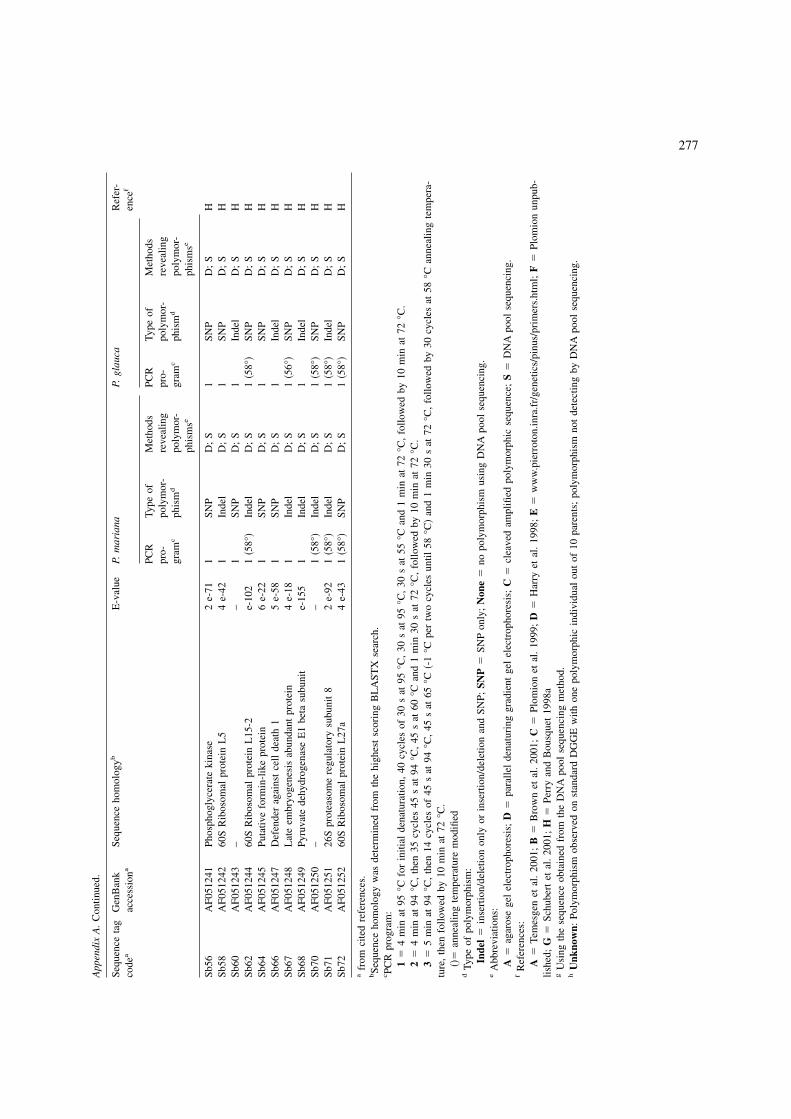
App
endi
xA
.C
ontin
ued.
Sequ
ence
tag
code
aG
enB
ank
acce
ssio
naSe
quen
ceho
mol
ogyb
E-v
alue
P.m
aria
naP.
glau
caR
efer
-en
cef
PCR
pro-
gram
c
Type
ofpo
lym
or-
phis
md
Met
hods
reve
alin
gpo
lym
or-
phis
mse
PCR
pro-
gram
c
Type
ofpo
lym
or-
phis
md
Met
hods
reve
alin
gpo
lym
or-
phis
mse
Sb56
AF0
5124
1Ph
osph
ogly
cera
teki
nase
2e-
711
SNP
D;
S1
SNP
D;
SH
Sb58
AF0
5124
260
SR
ibos
omal
prot
ein
L5
4e-
421
Inde
lD
;S
1SN
PD
;S
HSb
60A
F051
243
––
1SN
PD
;S
1In
del
D;
SH
Sb62
AF0
5124
460
SR
ibos
omal
prot
ein
L15
-2e-
102
1�5
8°�
Inde
lD
;S
1�5
8°�
SNP
D;
SH
Sb64
AF0
5124
5Pu
tativ
efo
rmin
-lik
epr
otei
n6
e-22
1SN
PD
;S
1SN
PD
;S
HSb
66A
F051
247
Def
ende
rag
ains
tce
llde
ath
15
e-58
1SN
PD
;S
1In
del
D;
SH
Sb67
AF0
5124
8L
ate
embr
yoge
nesi
sab
unda
ntpr
otei
n4
e-18
1In
del
D;
S1
�56°
�SN
PD
;S
HSb
68A
F051
249
Pyru
vate
dehy
drog
enas
eE
1be
tasu
buni
te-
155
1In
del
D;
S1
Inde
lD
;S
HSb
70A
F051
250
––
1�5
8°�
Inde
lD
;S
1�5
8°�
SNP
D;
SH
Sb71
AF0
5125
126
Spr
otea
som
ere
gula
tory
subu
nit
82
e-92
1�5
8°�
Inde
lD
;S
1�5
8°�
Inde
lD
;S
HSb
72A
F051
252
60S
Rib
osom
alpr
otei
nL
27a
4e-
431
�58°
�SN
PD
;S
1�5
8°�
SNP
D;
SH
afr
omci
ted
refe
renc
es.
bSe
quen
ceho
mol
ogy
was
dete
rmin
edfr
omth
ehi
ghes
tsc
orin
gB
LA
STX
sear
ch.
c PCR
prog
ram
:1
�4
min
at95
°Cfo
rin
itial
dena
tura
tion,
40cy
cles
of30
sat
95°C
,30
sat
95°C
,30
sat
55°C
and
1m
inat
72°C
,fo
llow
edby
10m
inat
72°C
.2
�4
min
at94
°C,
then
35cy
cles
45s
at94
°C,
45s
at60
°Can
d1
min
30s
at72
°C,
follo
wed
by10
min
at72
°C.
3�
5m
inat
94°C
,th
en14
cycl
esof
45s
at94
°C,
45s
at65
°C�-
1°C
per
two
cycl
esun
til58
°C�
and
1m
in30
sat
72°C
,fo
llow
edby
30cy
cles
at58
°Can
neal
ing
tem
pera
-tu
re,
then
follo
wed
by10
min
at72
°C.
���
anne
alin
gte
mpe
ratu
rem
odifi
edd
Type
ofpo
lym
orph
ism
:In
del
�in
sert
ion/
dele
tion
only
orin
sert
ion/
dele
tion
and
SNP;
SNP
�SN
Pon
ly;
Non
e�
nopo
lym
orph
ism
usin
gD
NA
pool
sequ
enci
ng.
eA
bbre
viat
ions
:A
�ag
aros
ege
lel
ectr
opho
resi
s;D
�pa
ralle
lde
natu
ring
grad
ient
gel
elec
trop
hore
sis;
C�
clea
ved
ampl
ified
poly
mor
phic
sequ
ence
;S
�D
NA
pool
sequ
enci
ng.
fR
efer
ence
s:A
�Te
mes
gen
etal
.20
01;
B�
Bro
wn
etal
.20
01;
C�
Plom
ion
etal
.19
99;
D�
Har
ryet
al.
1998
;E
�w
ww
.pie
rrot
on.in
ra.f
r/ge
netic
s/pi
nus/
prim
ers.
htm
l;F
�Pl
omio
nun
pub-
lishe
d;G
�Sc
hube
rtet
al.
2001
;H
�Pe
rry
and
Bou
sque
t19
98a
gU
sing
the
sequ
ence
obta
ined
from
the
DN
Apo
olse
quen
cing
met
hod.
hU
nkno
wn:
Poly
mor
phis
mob
serv
edon
stan
dard
DG
GE
with
one
poly
mor
phic
indi
vidu
alou
tof
10pa
rent
s;po
lym
orph
ism
not
dete
ctin
gby
DN
Apo
olse
quen
cing
.
277
References
Ahmadian A. and Lundeberg J. 2002. A brief history of geneticvariation analysis. Biotechniques 32: 1122–1137.
Babula D., Kaczmarek M., Barakat A., Delseny M., Quiros C.F.and Sadowski J. 2003. Chromosomal mapping of Brassica ol-eracea based on ESTs from Arabidopsis thaliana: complexity ofthe comparative map. Mol. Genet. Genomics 268: 656–665.
Barcellos L.F., Klitz W., Field L.L., Tobias R., Bowcock A.M.,Wilson R., Nelson M.P., Nagatomi J. and Thomson G. 1997. As-sociation mapping of disease loci, by use of a pooled DNA ge-nomic screen. Am. J. Hum. Genet. 61: 734–747.
Bhattramakki D., Dolan M., Hanafey M., Wineland R., Vaske D.,Register J.C., Tingey S.V. and Rafalski A. 2002. Insertion-dele-tion polymorphisms in 3’regions of maize genes occur fre-quently and can be used as highly informative genetic markers.Plant Mol. Biol. 48: 539–547.
Brown G.R., Kadel E.E., Bassoni D.L., Kiehne K.L., Temesgen B.,van Buijtenen J.P., Sewell M.M., Marshall K.A. and Neale D.B.2001. Anchored reference loci in loblolly pine �Pinus taeda L.�for integrating pine genomics. Genetics 159: 799–809.
Cargill M., Altshuler D., Ireland J., Sklar P., Ardlie K., Patil N.,Shaw N., Lane C.R., Lim E.P., Kalyanaraman N., Nemesh J.,Ziaugra L., Friedland L., Rolfe A., Warrington J., Lipshutz R.,Daley G.Q. and Lander E.S. 1999. Characterization of single-nucleotide polymorphisms in coding regions of human genes.Nature Genet. 22: 231–238.
Ching A., Caldwell K.S., Jung M., Dolan M., Smith O.S., TingeyS., Morgante M. and Rafalski A.J. 2002. SNP frequency, haplo-type structure and linkage disequilibrium in elite maize inbredlines. BMC Genet. 3: 19–33.
Choy Y.S., Dabora S.L., Hall F., Ramesh V., Niida Y., Franz D.,Kasprzyk-Obara J., Reeve M.P. and Kwiatkowski D.J. 1999. Su-periority of denaturing high performance liquid chromatographyover single-stranded conformation and conformation-sensitivegel electrophoresis for mutation detection in TSC2. Ann. Hum.Genet. 63: 383–391.
Fournier D., Perry D.J., Beaulieu J., Bousquet J. and Isabel N.2002. Optimizing expressed sequence TAG polymorphisms bysingle strand conformation polymorphism in spruces. For. Genet.9: 11–17.
Gamache I., Jaramillo-Corea J.P., Payette S. and Bousquet J. 2003.Diverging patterns of mitochondrial and nuclear DNA diversityin subarctic black spruce: imprint of a founder effect associatedwith postglacial colonization. Mol. Ecol. 2: 891–901.
Germer S., Holland M.J. and Higuchi R. 2000. High-throughputSNP allele-frequency determination in pooled DNA samples bykinetic PCR. Genome Res. 10: 258–266.
Goddard K.A., Hopkins P.J., Hall J.M. and Witte J.S. 2000. Link-age disequilibrium and allele-frequency distributions for 114single-nucleotide polymorphisms in five populations. Am. J.Hum. Genet. 66: 216–234.
Gosselin I., Zhou Y., Bousquet J. and Isabel N. 2002. Megagame-tophyte-derived linkage maps of white spruce �Picea glauca�based on RAPD, SCAR and ESTP markers. Theor. Appl. Genet.104: 987–997.
Grivet L., Glaszmann J.C., Vincentz M., da Silva F. and Arruda P.2003. ESTs as a source for sequence polymorphism discovery insugarcane: example of the Adh genes. Theor. Appl. Genet. 106:190–197.
Gupta P.K., Roy J.K. and Prasad M. 2001. Single nucleotide poly-morphisms: A new paradigm for molecular marker technologyand DNA polymorphism detection with emphasis on their use inplants. Curr. Sci. 80: 524–535.
Harry D.E., Temesgen B. and Neale D.B. 1998. Codominant PCR-based markers for Pinus taeda developed from mapped cDNAclones. Theor. Appl. Genet. 97: 327–336.
Imyanitov E.N., Buslov K.G., Suspitsin E.N., Kuligina E.,Belogubova E.V., Grigoriev M.Y., Togo A.V. and Hanson K.P.2002. Improved reliability of allele-specific PCR. Biotechniques33: 484–488.
Jaramillo-Correa J.P., Beaulieu J. and Bousquet J. 2001. Contrast-ing evolutionary forces driving population structure at ESTPs,allozymes, and quantitative traits in white spruce. Mol. Ecol. 10:2729–2740.
Kanazin V., Talbert H., See D., DeCamp P., Nevo E. and Blake T.2002. Discovery and assay of single-nucleotide polymorphismsin barley �Hordeum vulgare�. Plant Mol. Biol. 48: 529–537.
Kruglyak L. and Nickerson D.A. 2001. Variation is the spice of life.Nature Genet. 27: 234–236.
Kwok P.Y., Carlson C., Yager T.D., Ankener W. and NickersonD.A. 1994. Comparative analysis of human DNA variations byfluorescence-based sequencing of PCR products. Genomics 23:138–144.
Lai E., Riley J., Purvis I. and Roses A. 1998. A 4-Mb high-densitysingle nucleotide polymorphism-based map around humanAPOE. Genomics 54: 31–38.
Laroche J., Li P., Maggia L. and Bousquet J. 1997. Molecular evo-lution of angiosperm mitochondrial exons and introns. Proc. Nat.Acad. Sci. USA 94: 5722–5727.
Latorra D., Hopkins D., Campbell K. and Hurley J.M. 2003. Mul-tiplex allele-specific PCR with optimized locked nucleic acidprimers. Biotechniques 34: 1150–1158.
Miller K.M., Ming T.J., Schulze A.D. and Withler R.E. 1999. De-naturing gradient gel electrophoresis �DGGE�: A rapid and sen-sitive technique to screen nucleotide sequence variation inpopulations. Biotechniques 27: 1016–1030.
Myers R.M., Maniatis T. and Lerman L.S. 1987. Detection and lo-calization of single base changes by denaturing gradient gelelectrophoresis. Meth. Enzymol. 155: 501–527.
Nasu S., Suzuki J., Ohta R., Hasegawa K., Yui R., Kitazawa N.,Monna L. and Minobe Y. 2002. Search for and analysis of singlenucleotide polymorphisms �SNPs� in rice �Oryza sativa, Oryzarufipogon� and establishment of SNP markers. DNA Res. 9:163–171.
Neff M., Turk E. and Kalishman M. 2002. Web-based primer de-sign for single nucleotide polymorphism analysis. Trends in Ge-netics 18: 613–615.
Numakura C., Lin C., Ikegami T., Guldberg P. and Hayasaka K.2002. Molecular analysis in Japanese patients with Charcot-Marie-Tooth disease: DGGE analysis for PMP22, MPZ, andCx32/GJB1 mutations. Hum. Mutat. 20: 392–398.
Oefner P.J., Huber C.G., Umlauft F., Berti G.N., Stimpfl E. andBonn G.K. 1994. High-resolution liquid chromatography offluorescent dye-labeled nucleic acids. Anal. Biochem. 223: 39–46.
Orita M., Iwahana H., Kanazawa H., Hayashi K. and Sekiya T.1989. Detection of polymorphisms of human DNA by gel elec-trophoresis as single-strand conformation polymorphisms. Proc.Natl. Acad. Sci. USA 86: 2766–2770.
278
Paterson A.H., Bowers J.E., Burow M.D., Draye X., Elsik C.G.,Jiang C.X., Katsar C.S., Lan T.H., Lin Y.R., Ming R.G. andWright R.J. 2000. Comparative genomics of plant chromosomes.Plant Cell. 12: 1523–1539.
Perron M., Perry D.J., Andalo C. and Bousquet J. 2000. Evidencefrom sequence-tagged-site markers of a recent progenitor-derivative species pair in conifers. Proc. Nat. Acad. Sci. USA97: 11331–11336.
Perry D.J. and Bousquet J. 1998a. Sequence-tagged-site �STS�markers of arbitrary genes: development, characterization andanalysis of linkage in black spruce. Genetics 149: 1089–1098.
Perry D.J. and Bousquet J. 1998b. Sequence-tagged-site �STS�markers of arbitrary genes: the utility of black spruce-derivedSTS primers in other conifers. Theor. Appl. Genet. 97: 735–743.
Perry D.J. and Bousquet J. 2001. Genetic diversity and mating sys-tem of post-fire and post-harvest black spruce: an investigationusing codominant sequence-tagged site �STS� markers. Can. J.For. Res. 31: 32–40.
Perry D.J., Isabel N. and Bousquet J. 1999. Sequence-tagged-site�STS� markers of arbitrary genes: the amount and nature of vari-ation revealed in Norway spruce. Heredity 83: 239–248.
Picoult-Newberg L., Ideker T.E., Pohl M.G., Taylor S.L., Donald-son M.A., Nickerson D.A. and Boyce-Jacino M. 1999. MiningSNPs from EST databases. Genome Res. 9: 167–174.
Plomion C., Hurme P., Frigerio J.M., Ridolfi M., Pot D., PionneauC., Avila C., Gallardo F., David H., Neutelings G., Campbell M.,Canovas F.M., Savolainen O., Bodenes C. and Kremer A. 1999.Developing SSCP markers in two Pinus species. Mol. Breed. 5:21–31.
Rickert A.M., Premstaller A., Gebhardt C. and Oefner P.J. 2002.Genotyping of SNPs in a polyploid genome by pyrosequencing.Biotechniques 32: 592–603.
Sachidanandam R., Weissman D., Schmidt S.C., Kakol J.M., SteinL.D., Marth G., Sherry S., Mullikin J.C., Mortimore B.J., WilleyD.L., Hunt S.E., Cole C.G., Coggill P.C., Rice C.M., Ning Z.,Rogers J., Bentley D.R., Kwok P.Y., Mardis E.R., Yeh R.T.,Schultz B., Cook L., Davenport R., Dante M., Fulton L., HillierL., Waterston R.H., McPherson J.D., Gilman B., Schaffner S.,Van Etten W.J., Reich D., Higgins J., Daly M.J., Blumenstiel B.,Baldwin J., Stange-Thomann N., Zody M.C., Linton L., LanderE.S. and Altshuler D. 2001. A map of human genome sequence
variation containing 1.42 million single nucleotide polymor-phisms. Nature 409: 928–933.
Schneider K., Weisshaar B., Borchardt D.C. and Salamini F. 2001.SNP frequency and allelic haplotype structure of Beta vulgarisexpressed genes. Mol. Breed. 8: 63–74.
Schubert R., Mueller-Starck G. and Riegel R. 2001. Developmentof EST-PCR markers and monitoring their intrapopulational ge-netic variation in Picea abies �L.� Karst. Theor. Appl. Genet.103: 1223–1231.
Shaw S.H., Carrasquillo M.M., Kashuk C., Puffenberger E.G., andChakravarti A. 1998. Allele frequency distributions in pooledDNA samples: applications to mapping complex disease genes.Genome Res. 8: 111–123.
Shifman S., Pisante-Shalom A., Yakir B. and Darvasi A. 2002.Quantitative technologies for allele frequency estimation ofSNPs in DNA pools. Mol. Cell. Probes 16: 429–434.
Shubitowski D.M., Venta P.J., Douglass C.L., Zhou R.X. and EwartS.L. 2001. Polymorphism identification within 50 equine gene-specific sequence tagged sites. Anim. Genet. 32: 78–88.
Taillon-Miller P., Piernot E.E. and Kwok P.Y. 1999. Efficient ap-proach to unique single-nucleotide polymorphism discovery.Genome Res. 9: 499–505.
Temesgen B., Brown G.R., Harry D.E., Kinlaw C.S., Sewell M.M.and Neale D.B. 2001. Genetic mapping of expressed sequencetag polymorphism �ESTP� markers in loblolly pine �Pinus taedaL.�. Theor. Appl. Genet. 102: 664–675.
Tsumura Y., Suyama Y., Yoshimura K., Shirato N. and Mukai Y.1997. Sequence-tagged-sites �STSs� of cDNA clones in Cryp-tomeria japonica and their evaluation as molecular markers inconifers. Theor. Appl. Genet. 94: 764–772.
Wang D.G., Fan J.B., Siao C.J., Berno A., Young P., Sapolsky R.,Ghandour G., Perkins N., Winchester E., Spencer J., KruglyakL., Stein L., Hsie L., Topaloglou T., Hubbell E., Robinson E.,Mittmann M., Morris M.S., Shen N., Kilburn D., Rioux J., Nus-baum C., Rozen S., Hudson T.J., Lander E.S. 1998. Large-scaleidentification, mapping, and genotyping of single-nucleotidepolymorphisms in the human genome. Science 280: 1077–1082.
Wolford J.K., Blunt D., Ballecer C. and Prochazka M. 2000. High-throughput SNP detection by using DNA pooling and denatur-ing high performance liquid chromatography �DHPLC�. Hum.Genet. 107: 483–487.
279