kumar et al 2009 tag
TRANSCRIPT

ORIGINAL PAPER
Mapping of resistance to spot blotch disease causedby Bipolaris sorokiniana in spring wheat
Uttam Kumar Æ Arun K. Joshi Æ Sundeep Kumar ÆRamesh Chand Æ Marion S. Roder
Received: 22 February 2008 / Accepted: 13 November 2008 / Published online: 9 December 2008
� Springer-Verlag 2008
Abstract Spot blotch caused by Bipolaris sorokiniana is
a destructive disease of wheat in warm and humid wheat
growing regions of the world. The development of disease
resistant cultivars is considered as the most effective con-
trol strategy for spot blotch. An intervarietal mapping
population in the form of recombinant inbred lines (RILs)
was developed from a cross ‘Yangmai 6’ (a Chinese source
of resistance) 9 ‘Sonalika’ (a spot blotch susceptible cul-
tivar). The 139 single seed descent (SSD) derived F6, F7, F8
lines of ‘Yangmai 6’ 9 ‘Sonalika’ were evaluated for
resistance to spot blotch in three blocks in each of the
3 years. Joint and/or single year analysis by composite
interval mapping (CIM) and likelihood of odd ratio (LOD)
[2.2, identified four quantitative trait loci (QTL) on the
chromosomes 2AL, 2BS, 5BL and 6DL. These QTLs were
designated as QSb.bhu-2A, QSb.bhu-2B, QSb.bhu-5B and
QSb.bhu-6D, respectively. A total of 63.10% of phenotypic
variation was explained by these QTLs based on the mean
over years. Two QTLs on chromosomes 2B and 5B with
major effects were consistent over 3 years. All QTL alleles
for resistance were derived from the resistant parent
‘Yangmai 6’.
Introduction
Spot blotch caused by Bipolaris sorokiniana is a disease
causing substantial damage to wheat (Triticum aestivum L.
em. Thell) in the warm and humid regions of the world
such as Eastern India, South East Asia, Latin America, the
tarai of Nepal, China and Africa (Raemakers 1991; Saari
1998). For a long time, spot blotch was considered a part of
Helminthosporium Leaf Blight (HLB) which was under-
stood to be a complex of many pathogenic fungi occurring
simultaneously at different growth stages of the wheat.
However, recently it has been established that leaf blight
observed in the North-Eastern Plain Zone of India is
actually spot blotch caused by B. sorokiniana (Sacc.)
shoem syn. Drechslera sorokiniana (Sacc.) Subrm and Jain
(syn. Helminthosporium sativum, teleomorph Cochliobolus
sativus) (Chaurasia et al. 2000). Due to wide spread losses,
this disease is considered as the most significant disease of
wheat in North-Eastern Plain Zone of India (Saari 1998;
Joshi et al. 2007b). Although spot blotch has assumed
epidemic proportions in the eastern parts of India, more
recently it has been reported to spread into the cooler tra-
ditional rice–wheat production areas (Villareal et al. 1995;
Chand et al. 2003).
The average yield losses due to combined effects of leaf
blight pathogens for South Asia and India are reported to
be 19.6 and 15.5%, respectively. In the eastern part of the
Communicated by A. Charcosset.
U. Kumar � M. S. Roder (&)
Leibniz Institute of Plant Genetics and Crop Plant Research
(IPK), Corrensstr. 3, 06466 Gatersleben, Germany
e-mail: [email protected]
A. K. Joshi
Department of Genetics and Plant Breeding,
Institute of Agricultural Sciences, Banaras Hindu University,
Varanasi 221005, India
S. Kumar
Department of Biotechnology, Sardar Vallabh Bhai Patel
University of Agriculture and Technology, Meerut 250110, India
R. Chand
Department of Mycology and Plant Pathology,
Institute of Agricultural Sciences, Banaras Hindu University,
Varanasi 221005, India
123
Theor Appl Genet (2009) 118:783–792
DOI 10.1007/s00122-008-0938-5

Indian subcontinent, on-farm studies indicated crop losses
of up to 16% in Nepal and 15% in Bangladesh (Saari
1998). Diseased plots yielding 43% less than fungicide
protected plots have been found in Mexico (Villareal et al.
1995). Some studies report that the losses due to foliar
blight may be as high as 100% under most severe condi-
tions of infection (Mehta 1994). The increasing threat of
spot blotch in the last decade has attracted the attention of
plant breeders to develop varieties that are resistant to this
pathogen.
The genetic basis of resistance to spot blotch appears to
be nonspecific and complete resistance or immunity to spot
blotch has not been observed among resistant wheat
germplasm lines (Chaurasia et al. 1999). Although, inher-
itance studies on resistance to spot blotch indicate both
monogenic (Srivastava et al. 1971) and polygenic (Joshi
et al. 2004b) types of resistance, the experience of wheat
workers to achieve partial resistance in breeding popula-
tions (Chaurasia et al. 1999; Joshi et al. 2004b) suggests a
polygenic type of resistance.
Despite the understanding that the use of resistant cul-
tivars is the best way to control the disease, the progress in
breeding for resistance to spot blotch has not been to the
expected level (Chaurasia et al. 1999; Joshi et al. 2007b).
One of the important reasons for this slow progress has
been the identification of reliable levels of resistance. The
effect of environment on disease expression is substantial.
Therefore, proper conclusions can be drawn only when
evaluation of resistance is repeated over several years
(Chaurasia et al. 1999). Erect leaf posture (Joshi and Chand
2002), leaf tip necrosis (Joshi et al. 2004a, 2007a) and
staygreen trait have been demonstrated to have positive
effects on resistance to spot blotch and can be used as
morphological markers. However, more information with
respect to the identification of suitable molecular markers
is required.
Reports of tagging and mapping of several disease
resistance genes and QTLs are available in wheat
(Langridge et al. 2001). However, information on closely
linked molecular markers for resistance to the spot blotch
pathogen of wheat is lacking with only few reports
available so far (Kumar et al. 2004; Sharma et al. 2007).
Thus the objective of the present study was to identify the
QTLs associated with spot blotch resistance in spring
wheat.
Materials and methods
Plant materials
A total of 139 single seed descent (SSD) derived recom-
binant inbred lines (RILs, F6, F7, F8 generations) of the
cross ‘Yangmai 6’ 9 ‘Sonalika’ were evaluated in field
trials for resistance to spot blotch. The cultivar ‘Sonalika’
of Indian origin was a popular cultivar in north-eastern
India during the 1970s and 1980s and is highly susceptible
to spot blotch, whereas ‘Yangmai 6’ is a Chinese cultivar
(of unknown origin) carrying resistance to spot blotch.
Field evaluation for disease severity
The RILs of ‘Yangmai 6’ 9 ‘Sonalika’ cross were evalu-
ated in the field at the Agricultural research farm of
Banaras Hindu University, Varanasi, India (North-Eastern
Plains Zone, 25.2�N and 83.0�E) during the crop seasons
2003–2004, 2004–2005 and 2005–2006 for F6, F7 and F8
generations, respectively. Each year, the lines were eval-
uated in three randomized complete blocks. Each line was
sown in single row of 3 m under irrigated conditions. Row
to row and plant to plant distance was 25 and 5 cm,
respectively. Based on the number of days to heading of
the RILs observed in the F5 generation, the RILs were
divided in to three groups. Sowing was done at staggered
time intervals of 3 days in the F6, F7 and F8 generations to
synchronize the days to heading between progeny rows of
the three groups, thereby attempting to minimize the days
to heading 9 disease severity interaction. To promote
disease build up and spread, one row of the susceptible
parent was planted after every 20th row and in alleys along
the plots. Spreader rows of the highly susceptible cultivar
A-9-30-1 were also planted in the alleyways of the
experimental plots 2 weeks prior to sowing the experiment
to induce disease development. To achieve the highest
possible disease pressure, planting was carried out during
the second and fourth week of December which allows the
post-anthesis stage to coincide with warm temperature
conducive to the disease that occurs in March (Chaurasia
et al. 2000).
Agronomic practices recommended for normal fertility
(120 kg N: 60 kg P2O5: 40 kg K2O) were followed. The
full dose of P2O5 and K2O was applied at the time of
sowing. Nitrogen was given as split application; 1/2 at
sowing, 1/4 at first irrigation (21 days after sowing), and 1/
4 at the time of second irrigation (40 days after sowing).
Creation of artificial epiphytotic conditions in the field
A pure culture of the most aggressive isolate of B. soro-
kiniana (isolate No. ICMP 13584, Auckland, New
Zealand) identified at Banaras Hindu University, Varanasi,
India (Chairasia et al. 2000) was used for the creation of
artificial epiphytotic. The isolate was multiplied on wheat
grains and a spore suspension adjusted to 104 spores/ml of
water was uniformly sprayed at three different growth
states (GS) viz., tillering (GS20), flag leaf emergence
784 Theor Appl Genet (2009) 118:783–792
123

(GS37) and anthesis (GS65) on Zadoks scale (Zadoks et al.
1974) during evening hours. The field was irrigated
immediately after inoculation and a total of six irrigations
were given in the entire crop period to provide a favourable
environment for the development of spot blotch disease.
Furrow irrigation was used with intervals of approximately
15–20 days between two irrigations. First irrigation was
given 21 days after sowing.
Disease assessment
Disease severity (%) displayed by all the leaves of each
row was recorded at three different growth stages (GS)
viz., GS 63 (growth stage 63, beginning of anthesis to half
complete), GS 69 (growth stage 69, anthesis complete) and
GS 77 (growth stage 77, late milking) on Zadoks scale
(Zadoks et al. 1974). Since the susceptible parent displayed
highest disease severity at GS 77, to make better judgment
about the level of resistance, disease severity recorded at
this stage was used as disease severity of each line. Area
under disease progress curve (AUDPC) based on disease
severity (GS63, GS69 and GS77) over time has been
suggested to be a pragmatic approach for disease assess-
ment (Jeger 2004) and was estimated using the following
formula (Roelfs et al. 1992):
AUDPC ¼Xn
i¼1
Yi þ Yðiþ1Þ� �
=2� �
� t iþ1ð Þ � ti
� �� �
where, Yi = disease level at time ti, t(i ? 1) - ti = time
(days) between two disease scores, n = number of dates on
which spot blotch was recorded.
DNA isolation
Leaves were harvested from 15 days old seedlings of the
RILs (F8). Genomic DNA was isolated using the CTAB
method described by Doyle and Doyle (1990) with modi-
fications. Briefly, 200–300 mg of frozen leaf tissue per
sample were ground in a ‘Retsch Mixer Mill MM300’
(fabricated by Retsch GmbH, 42781 Haan, Germany) for
30 s twice at 25 times/s and incubated in CTAB extraction
buffer [2.0% (w/v) CTAB, 100 mM Tris-HCL pH 8.0,
20 mM EDTA pH 8.0, 1.4 M NaCl, 1% Na2S2O3 and 0.2%
b-merceptoethanol] for 30–45 min. Chloroform:isoamyl
alcohol (24:1) extraction step was done twice. DNA was
precipitated with acetate mix (3 M sodiumacetate pH
5.5 ? 10 M ammoniumacetate) and isopropanol. The
precipitated DNA was dissolved in 19 TE buffer (10 mM
Tris-HCl pH 8.0 and 1 mM EDTA pH 8.0). DNA samples
were stored at -20�C after overnight incubation at
4�C. DNA was diluted in H2O to a concentration of
5–10 ng ll-1 before use for microsatellite analysis.
Microsatellite analysis
PCR reactions of Gatersleben wheat microsatellite (gwm)
and Beltsville Agriculture Research Center (barc) micro-
satellite markers were performed as described by Roder
et al. (1998) and Somers et al. (2004). DNA amplification
was carried out in a 96 well thermocycler (Applied Bio-
systems, Foster City, USA) each containing 50–100 ng
template DNA, 250 nM of each primer (one primer was
labeled with Cy-5), 200 lM of each deoxynucleotide,
1.5 mM MgCl2, 19 PCR buffer and 1 U of Taq DNA
Polymerase. The following PCR profile was followed:
initial denaturation at 94�C for 3 min, followed by 45
cycles of 94�C for 1 min, 50�C (55 or 60�C) for 1 min,
72�C for 2 min with a final extension step of 10 min at
72�C. The choice of 50, 55 or 60�C for annealing was
according to the information provided for the primers
(Roder et al. 1998; Somers et al. 2004). Microsatellite
fragments were detected on an automated laser fluores-
cence ALF express sequencer (Amersham Biosciences
Europe GmbH, Freiburg, Germany) using a short gel cas-
sette. An external standard with four fragments (73, 122,
196, 231 bp) was loaded in one lane. Fragment sizes were
calculated using the computer program Fragment Analyzer
Version 1.02 by comparison with the internal and external
size standards.
Map construction and QTL detection
The parents ‘Yangmai 6’ and ‘Sonalika’ were screened for
microsatellite polymorphism. We selected approximately
20 microsatellite markers from each chromosome evenly
distributed in the reference ITMI map (Ganal and Roder
2007; Roder et al. 1998). Once the polymorphism was
identified between the parents, 74 selected individuals of
the RILs (37 most resistant and 37 most susceptible) were
screened with the polymorphic microsatellite primer pairs.
Initially single marker regression analysis was performed
using the software Qgene developed by Nelson (1997) to
test each marker for the significance of disease severity
based on 37 resistant lines and 37 susceptible lines. When a
marker was observed significant (P \ 0.001), all RILs
were genotyped with the respective marker and QTL
Cartographer version 2.5 (Wang et al. 2005) was used to
confirm the QTLs by interval mapping (IM) and composite
interval mapping (CIM).
Mapmaker v 2.0 (Lander et al. 1987) was used to ana-
lyse all polymorphic markers to create a framework map
with 129 markers for initial QTL detection with 74 indi-
viduals. Later on more markers were added to enrich the
neighbouring regions of significant markers found in initial
analysis. Finally, Mapmaker was used to create linkage
map of significant markers on chromosomes 2A, 2B, 5B
Theor Appl Genet (2009) 118:783–792 785
123
and 6B. The linkage map was constructed using the
Likelihood of odd ratio (LOD) of [3 and recombination
fraction of \0.4. The commands ‘Order’ and ‘Rip’ were
used to assign the order of markers on the map. To include
additional marker on the map ‘Try’ and ‘Compare’ com-
mands were used.
QTL analysis was performed with the software QTL
Cartographer version 2.5. Firstly data were analysed to
identify markers associated with spot blotch resistance
using single marker analysis using all linked and unlinked
loci data at a statistical threshold of P \ 0.01. Secondly, the
data was analysed by composite interval mapping (CIM)
using a reduced set of marker loci containing significant loci
detected by single marker analysis. The parameters settings
for CIM were model 6, forward and backward stepwise
regression with threshold of P \ 0.05 to select cofactors,
window size 10 and 2 cM walking speed along chromo-
somes. QTLs were verified by LOD scores compared to as
empirical genome-wide significant threshold calculated
from 1000 permutations for P \ 0.01 to control Type-I
error. LOD scores and coefficients of determination were
estimated by CIM for each QTL. QTLs were considered to
have a significant effect when LOD statistics exceeded a
threshold of 2.2. Adjusted mean for AUDPC values of each
year were calculated before pooling the data from all
3 years. QTL 9 QTL and QTL 9 Environments interac-
tions were calculated using the program QTL Network V
1.60 and PlabQTL V 1.2 (http://www.uni-hohenheim.de/
*ipspwww/soft.html), respectively.
The names of the QTLs were assigned according to the
International Rules of Genetic Nomenclature (http://wheat.
pw.usda.gov/ggpages/wgc/98/Intro.htm): QSb.bhu as QTL
for resistance to spot blotch disease detected at Banaras
Hindu University.
Statistical analysis
Analysis of variance (ANOVA) for AUDPC for all 3 years
was performed using PROC GLM of SAS software (ver-
sion 6.03; SAS Institute Inc., Cary, NC 1997). Heritability
(h2) was estimated from the analysis of variance following
Nyquist (1991) as h2 = 1 - [MS(Genotype 9 Environ-
ment)]/MS(Genotype). Phenotypic correlation coefficients
of spot blotch disease severity and AUDPC values were
calculated using Qgene software (Nelson 1997).
Results
Phenotypic variation
Mean spot blotch severity (%) of the resistant (‘Yangmai
6’) and the susceptible (‘Sonalika’) parents at GS 77 (Za-
doks scale, Zadoks et al. 1974) ranged from 20 (2003–
2004) to 24% (2005–2006) and 85 (2004–2005) to 88%
(2005–2006), respectively (Table 1). The disease severity
of F1 ranged from 42 (2003–2004) to 46% (2005–2006).
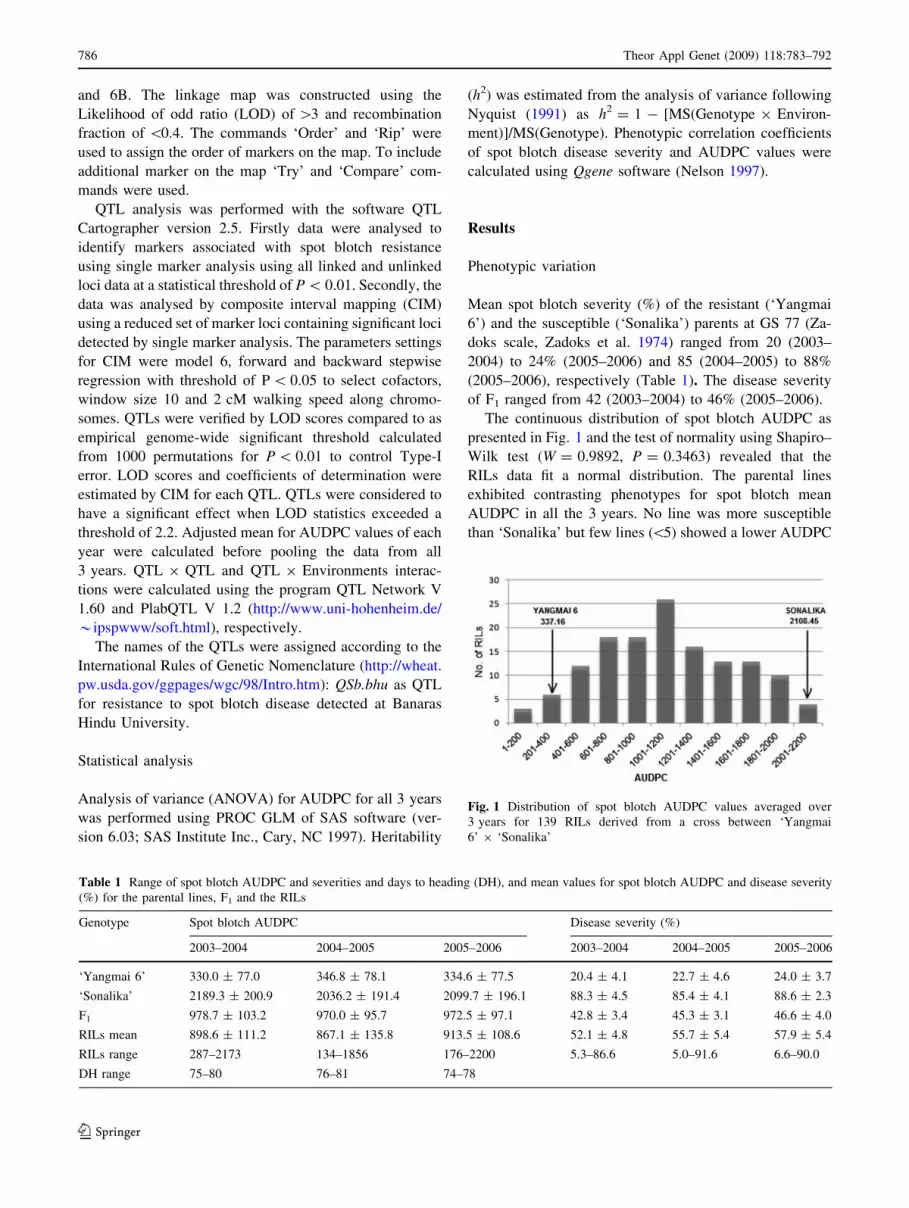
The continuous distribution of spot blotch AUDPC as
presented in Fig. 1 and the test of normality using Shapiro–
Wilk test (W = 0.9892, P = 0.3463) revealed that the
RILs data fit a normal distribution. The parental lines
exhibited contrasting phenotypes for spot blotch mean
AUDPC in all the 3 years. No line was more susceptible
than ‘Sonalika’ but few lines (\5) showed a lower AUDPC
Table 1 Range of spot blotch AUDPC and severities and days to heading (DH), and mean values for spot blotch AUDPC and disease severity
(%) for the parental lines, F1 and the RILs
Genotype Spot blotch AUDPC Disease severity (%)
2003–2004 2004–2005 2005–2006 2003–2004 2004–2005 2005–2006
‘Yangmai 6’ 330.0 ± 77.0 346.8 ± 78.1 334.6 ± 77.5 20.4 ± 4.1 22.7 ± 4.6 24.0 ± 3.7
‘Sonalika’ 2189.3 ± 200.9 2036.2 ± 191.4 2099.7 ± 196.1 88.3 ± 4.5 85.4 ± 4.1 88.6 ± 2.3
F1 978.7 ± 103.2 970.0 ± 95.7 972.5 ± 97.1 42.8 ± 3.4 45.3 ± 3.1 46.6 ± 4.0
RILs mean 898.6 ± 111.2 867.1 ± 135.8 913.5 ± 108.6 52.1 ± 4.8 55.7 ± 5.4 57.9 ± 5.4
RILs range 287–2173 134–1856 176–2200 5.3–86.6 5.0–91.6 6.6–90.0
DH range 75–80 76–81 74–78
Fig. 1 Distribution of spot blotch AUDPC values averaged over
3 years for 139 RILs derived from a cross between ‘Yangmai
6’ 9 ‘Sonalika’
786 Theor Appl Genet (2009) 118:783–792
123

value than the resistant parent ‘Yangmai 6’. The spot
blotch AUDPC of the RILs ranged from 134 (2004–2005)
to 2200 (2005–2006) showing large phenotypic variation in
the population (Table 1).
The analysis of variance for AUDPC values revealed a
significant variation for genotypes and genotype-by-year
interaction (Table 2). In each year, variation due to geno-
types was highly significant. Broad sense heritability based
on AUDPC values of 3 years was estimated to be 0.68. The
data from different years were used separately for QTL
mapping.
Trait correlations
High Pearson correlation coefficients were observed
between disease severity and AUDPC value within years
with a range from 0.82 to 0.90 (P \ 0.0001). Moderate
correlations were observed between years ranging from
0.39 to 0.78 for AUDPC (P \ 0.001 or P \ 0.0001). Dis-
ease severities as well as AUDPC in the third year were
more highly correlated to second year values rather than to
the first year values. However, there was a significant
correlation (P \ 0.001) between first year and second year
as well as first year and third year data (Table 3). The
correlation coefficient between days to heading and AU-
DPC was non-significant when calculated across 3 years
(0.083). For each of the 3 years also correlation coefficient
values were non-significant (0.050, 0.064 and 0.171 in first,
second and third year, respectively) (Table 3). Likewise,
the correlations between disease severity and days to
heading were also non-significant for each of the years
(0.040, 0.056 and 0.082) and across years (0.058)
(Table 3). This suggested that disease severity/AUDPC and
days to heading behaved as independent variables, possibly
because the synchronization due to time intervals in sowing
was quite successful in solving this problem.
Microsatellite polymorphism and marker segregation
We tested 473 genomic microsatellite markers covering the
genome for polymorphisms between the parents ‘Yangmai
6’ and ‘Sonalika’. Out of these, 151 (31.9%) simple
sequence repeat (SSR) markers were polymorphic and used
for genotyping 74 RILs (F8) initially. Later on, all the RILs
(139 lines) were genotyped with the significant markers.
The rate of polymorphism was highest in the B genome
(41.2%) as compared to genomes A (30.3%) and D
(29.6%). We observed around 1.33% loci in heterozygous
state which may represent unfixed loci in the RILs. The
population was in the advanced stage (F8) and the alleles
were expected to segregate in equal proportions. Most
marker loci segregated in the expected 1:1 ratio (P \ 0.05)
with few exceptions, that is 12 marker loci did not fit the
1:1 ratio.
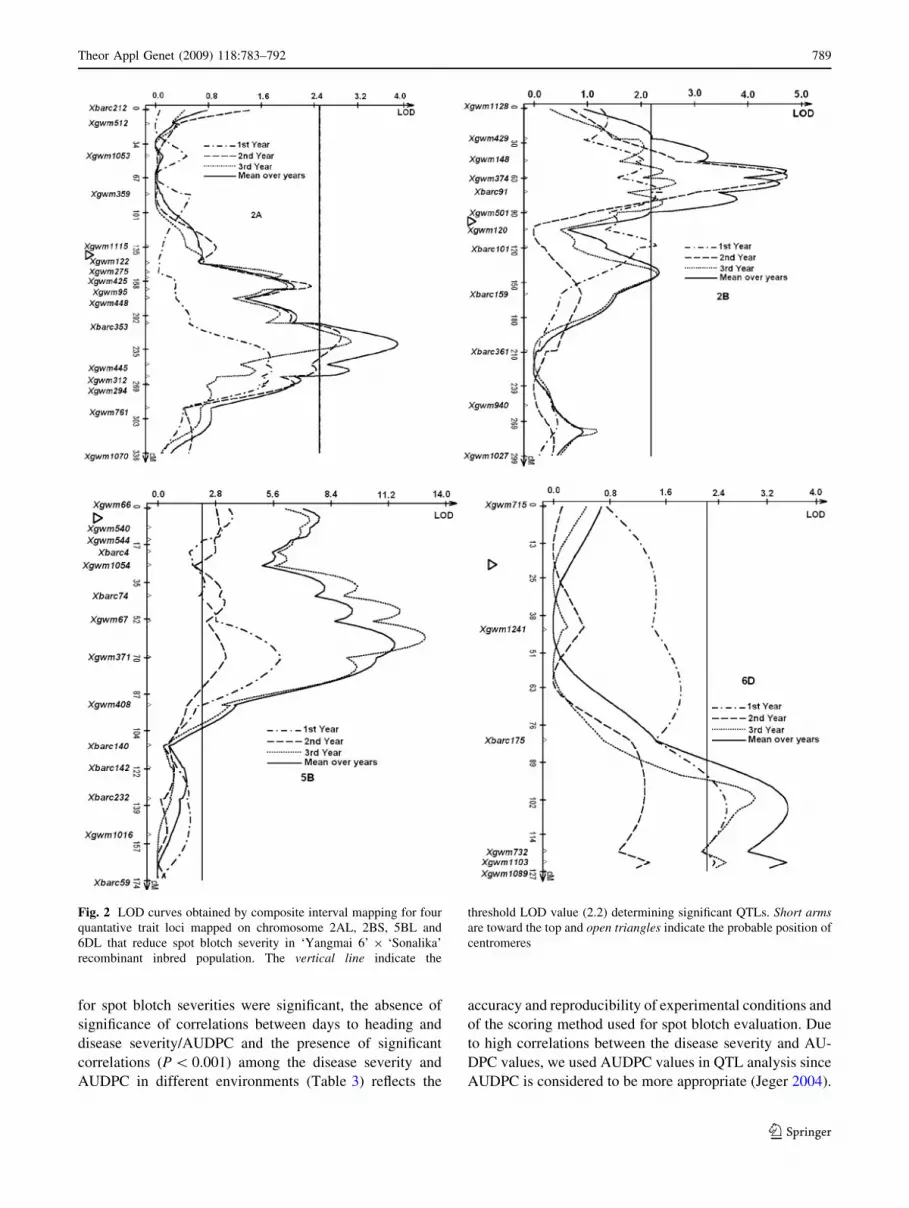
QTL detection and mapping
Four QTLs were detected for spot blotch AUDPC. The
LOD values ranged from 2.4 to 12.8 and the corresponding
R2 ranged from 8.72 to 41.10 in the individual years
(Table 4). Individual QTLs explained between 8.72 and
41.10% of phenotypic variance in the composite interval
mapping. The two most consistent QTLs mapped on the
short arm of chromosome 2B and the long arm of chro-
mosome of 5B (Fig. 2), were detected in all 3 years, while
other QTLs present in at least 2 years were located on the
long arm of chromosome 2A and the long arm of chro-
mosome 6D (Fig. 2). The QTL on 5BL explained the
largest part of phenotypic variance in the third year
(41.10%). In the second year, maximum phenotypic vari-
ation (14.89%) was controlled by the QTL located on
chromosome 2BS, whereas the QTLs on 6DL was not
significant. The QTLs mapped on 2AL, 2BS, 5BL and 6DL
accounted for 14.80, 20.50, 38.6 and 22.5% of phenotypic
variation based on mean over years, respectively. The
mean values and the variation in AUDPC of different QTL
classes are presented in Fig. 3.
Genetic maps consisting of 16 loci on chromosome 2A,
12 loci on 2B, 14 loci on 5B, and 6 loci on chromosome 6D
were developed. Using composite interval mapping the
QTL, QSb.bhu-2A was located on the long arm of chro-
mosome 2A between the markers interval Xbarc353-
Xgwm445 (37.4 cM) and the main QTL QSb.bhu-5B was
located on the long arm of chromosome 5B between the
markers interval Xgwm067-Xgwm371 (13.2 cM). Other
QTLs QSb.bhu-2B and QSb.bhu-6D were mapped between
the markers Xgwm148-Xgwm374 (15.0 cM) and Xbarc175-
Xgwm732 (30.1 cM), respectively. For four QTLs detected
in the ‘Yangmai 6’ 9 ‘Sonalika’ mapping population, the
alleles for reduced disease severity were derived from the
resistant parent ‘Yangmai 6’. The QTL 9 QTL and
QTL 9 environment interactions were investigated. There
were 12 possible digenic epistatic effects between these
four QTLs. Only three combinations (2AL 9 2BS,
Table 2 Analysis of variance for spot blotch AUDPC over 3 years
Source df MS F value P value
Year 2 1.9 9 107 1514.19 \0.01
Block (year) 6 1.7 9 105 13.50 \0.01
Genotype 138 7.7 9 105 61.30 \0.01
Genotype 9 Year 276 2.4 9 105 19.68 \0.01
Error 828 12681.90
The degrees of freedom (df) and mean sum of squares (MS) are shown
for each analysis
Theor Appl Genet (2009) 118:783–792 787
123

2BS 9 5BL, 5BL 9 6DL) showed significant and additive
QTL 9 QTL interactions (Table 4). The identified QTLs
located on the long arm of chromosome 2A, short arm of
chromosome 2B, long arm of chromosome 5B and long
arm of chromosome 6D showed significant QTL 9 envi-
ronment interactions.
Discussion
The distribution of 139 RILs for spot blotch AUDPC
(Fig. 1) suggested that spot blotch resistance is polygenic
and not controlled by a single gene in the ‘Yangmai
6’ 9 ‘Sonalika’ cross. Earlier studies on the inheritance of
resistance to spot blotch (Adlakha et al. 1984; Joshi et al.
2004b) also suggested a polygenic control. Planting of seeds
in the third or fourth week of December led the post-anthesis
stages to coincide with relatively higher temperature that
favoured disease development. It has been reported that spot
blotch disease becomes more severe when the mean tem-
perature exceeds 26�C (Chaurasia et al. 2000). To minimize
environmental effects, the epiphytotic conditions were cre-
ated by artificial inoculation. AUDPC was calculated using
the disease severity (%) data, recorded at three growth
stages (GS63, GS69, GS77). In this study, RILs were clas-
sified into three groups based on days to heading and disease
severity was recorded at specific growth stages when days to
headings were synchronized by differential sowing of the
RILs. Hence, the problem of variation in earliness was
overcome. Therefore, the correlation coefficient values
between disease severity/AUDPC and days to heading were
non-significant within each experiment and across mean of
experiments. Following 3 years of disease recording at
different growth stages, an accurate evaluation of the pop-
ulation for resistance to spot blotch was obtained under field
conditions. Although genotype-by-environment interactions
Table 3 Correlation coefficients among the spot blotch severities and days to heading with AUDPC in 3 years of testing of 139 RILs of the cross
‘Yangmai 6 9 Sonalika’
Traits %disease 1st year %disease 2nd year %disease 3rd year AUDPC 1st year AUDPC 2nd year Days to heading
%disease 1st year 0.04 (NS)
%disease 2nd year 0.39** 0.05 (NS)
%disease 3rd year 0.49** 0.71** 0.05 (NS)
%disease across year 0.05 (NS)
AUDPC 1st year 0.82** 0.41** 0.48** 0.05 (NS)
AUDPC 2nd year 0.39** 0.84** 0.77** 0.38** 0.06 (NS)
AUDPC 3rd year 0.52** 0.69** 0.90** 0.50** 0.77** 0.17 (NS)
AUDPC across years 0.08 (NS)
NS non-significant
** Correlation was significant at the 0.001 probability level
Table 4 Effects of quantitative loci (QTLs) that reduce spot blotch severity in ‘Yangmai 6 9 Sonalika’ recombinant inbred (RI) population
detected by composite interval mapping (CIM)
QTLs Marker interval Interval size (cM) Chrom 2003–2004 2004–2005 2005–2006 Mean over years
LOD R2 LOD R2 LOD R2 LOD R2 Q 9 E
QSb.bhu-2A Xbarc353-Xgwm445 37.4 2AL – – 3.2 13.79 2.8 15.58 3.8 14.80*
QSb.bhu-2B Xgwm148-Xgwm374 15.0 2BS 2.4 8.72 4.8 14.89 2.6 9.71 5.8 20.50**
QSb.bhu-5B Xgwm067-Xgwm371 13.2 5BL 6.0 18.42 3.4 11.76 12.8 41.10 11.5 38.62**
QSb.bhu-6D Xbarc175-Xgwm732 30.1 6DL 2.5 14.61 – – 2.5 19.05 3.3 22.50*
Total R2 by joint analysis 10.4 31.20 7.67 32.52 15.4 58.7 19.2 63.10
QTL 9 QTL Interactions
2A 9 2B – – – – 3.7** – – – ns
2B 9 5B – – – – 3.5** – 3.4** – ns
5B 9 6D – – 2.9** – – – – ns
The marker intervals cited are those flanking the peak of the LOD scan. R2 represents the percentage of phenotypic variance explained for each
QTL. Significant QTL 9 QTL and QTL 9 environments interactions (Q 9 E) are also presented
LOD logarithm of odd ratio
*, ** Significant at the 0.05 and 0.01 probability level, respectively
788 Theor Appl Genet (2009) 118:783–792
123
for spot blotch severities were significant, the absence of
significance of correlations between days to heading and
disease severity/AUDPC and the presence of significant
correlations (P \ 0.001) among the disease severity and
AUDPC in different environments (Table 3) reflects the
accuracy and reproducibility of experimental conditions and
of the scoring method used for spot blotch evaluation. Due
to high correlations between the disease severity and AU-
DPC values, we used AUDPC values in QTL analysis since
AUDPC is considered to be more appropriate (Jeger 2004).
Fig. 2 LOD curves obtained by composite interval mapping for four
quantative trait loci mapped on chromosome 2AL, 2BS, 5BL and
6DL that reduce spot blotch severity in ‘Yangmai 6’ 9 ‘Sonalika’
recombinant inbred population. The vertical line indicate the
threshold LOD value (2.2) determining significant QTLs. Short armsare toward the top and open triangles indicate the probable position of
centromeres
Theor Appl Genet (2009) 118:783–792 789
123

Most of the recent studies on spot blotch (Saari 1998;
Pandey et al. 2005; Joshi et al. 2007a, b) are also based on
AUDPC.
We tested approximately 20 microsatellite markers from
each chromosome providing coverage of the whole gen-
ome. The ratio of polymorphic markers of nearly 30% was
consistent with results of Prasad et al. (1999) and Roy et al.
(1999). The order and orientation of the mapped micro-
satellite markers in our study was in agreement with those
in the map of the ITMI population (Ganal and Roder 2007).
There were 12 loci that did not segregate in 1:1 ratio
showed segregation distortion. These loci were randomly
distributed throughout the genome. However, the linkage
map was not affected by the distortion and we included
these loci in the linkage map.
Since only 31.9% of the markers were polymorphic,
gaps in certain region were not covered. However, it is
unlikely that some major QTLs remained undetected
because the identified QTLs explained a large part of
phenotypic variance ranging from 31.2 (2003–2004) to
58.7% (2005–2006) by joint analysis and 63.1% based on
mean over years.
Across 3 years, we identified four QTLs for spot blotch
resistance on 2A, 2B, 5B and 6D. This study supports the
finding of Joshi et al. (2004b) who reported that the
resistance in ‘Yangmai 6’ was governed by at least three
major and a few minor genes. The published data of
Sourdille et al. (2004) about deletion mapping of more than
700 microsatellite markers on specific chromosome seg-
ments enabled us to check the physical location of markers
linked to three of the detected QTLs. The deletion map of
Sourdille et al. (2004) was in reference to ITMI map. The
order and orientation of markers on the maps developed in
our mapping population were also in agreement with the
ITMI maps. Therefore, it could be possible to assign the
QTL on the physical map. In the deletion maps developed
for wheat, the microsatellite locus Xgwm445 flanking the
QTL QSb.bhu-2A were assigned to the 2AL1-0.78 dele-
tions bin. The loci Xgwm148 and Xgwm374 flanking the
QTL QSb.bhu-2B have been assigned to the 2BS1-0.53-
0.75 and the C-2BS1-0.53 deletion bins, respectively, while
the loci Xgwm067 and Xgwm371 flanking QSb.bhu-5B
were assigned to the C-5BL6-0.29 and 5BL1-0.55-0.75
bins, respectively. Similarly the loci Xbarc175 flanking the
550
650
750
850
950
1050
1150
1250
QT
L m
ean
AU
DP
C
1st Year
2nd Year
3rd Year
550
650
750
850
950
1050
1150
1250
QT
L m
ean
AU
DP
C
1st Year
2nd Year
3rd Year
550
650
750
850
950
1050
1150
1250
1350
1450
QT
L m
ean
AU
DP
C
1st Year
2nd Year
3rd Year
550
650
750
850
950
1050
1150
1250
QT
L m
ean
AU
DP
C
1st Year
2nd Year
3rd Year
A
A
A
A
B B
BB
QSb.bhu-6D
QSb.bhu-2B
QSb.bhu-5B
QSb.bhu-2A
a b
dc
Fig. 3 Mean values and the standard variation in AUDPC of different QTL classes (a–d). A and B are the mean phenotypic value of alleles
derived from resistant parent and susceptible parent, respectively
790 Theor Appl Genet (2009) 118:783–792
123

QTL QSb.bhu-6D was assigned to the 6DL1-0.47-0.68
deletion bin (http://wheat.pw.usda.gov/GG2/index.shtml).
Many plant resistance genes appear to be organized as
complex clusters. For example, the Xa21 resistance gene
family of rice and the Cf-2 family of tomato are assembled
as single, locally restricted clusters of homologous genes
(Dixon et al. 1998). The microsatellite marker Xgwm148
found in our study flanking the QTL located on the short
arm of chromosome 2B was also reported to be associated
with the powdery mildew resistance gene Pm26 (Rong
et al. 2000). These two genes/QTLs may belong to same
gene family clustered together or may be located very close
to each other on the short arm of chromosome 2B.
The alleles for reduced disease severity were derived
from the resistant parent ‘Yangmai 6’ for all the QTLs
detected in the ‘Yangmai 6’ 9 ‘Sonalika’ mapping popu-
lation. Additive QTL 9 QTL interactions resulted in
enhanced level of resistance. (Table 4). Marker assisted
selection (MAS) simultaneously for these QTLs would be
more effective than selection for any one of them since all
QTLs showed significant additive QTL 9 QTL interac-
tions, even though not in all the years. Of the four QTLs
detected, two QTLs on chromosome 2BS and 5BL were
significant in all years and seem to be essential for resistance
expression in ‘Yangmai 6’. The other QTLs mapped on 2AL
and 6DL were significant in at least 2 years. We observed
QTL 9 environment effect on the expression of all QTLs.
This effect could be due to variation in the infection level in
the field as indicated by ANOVA. However, although these
significant effects were moderate in general when compared
to the main effect over 3 years (Fig. 3 a–d). QTL mapping
achieved in this study should therefore provide preliminary
information to generate a finer map and to initiate a marker
assisted selection strategy. Successful MAS and cloning of
the major resistance QTL in the future will crucially depend
on the generation of new flanking markers and the devel-
opment of high-resolution mapping populations.
Acknowledgments This research was supported by a DAAD-
Leibniz (German Academic Exchange Service) fellowship to U.
Kumar. Initial work on RILs was supported by the Council of Sci-
entific and Industrial Research, N. Delhi. Authors are thankful to
Ramawadh, Anette Heber and Sonja Allner for excellent technical
assistance. The help rendered by Dr. Rajender Parsad, Indian Agri-
cultural Statistical Research Institute, N. Delhi in the analysis of data
is gratefully acknowledged.
References
Adlakha KL, Wilcoxson RD, Raychaudhuri SP (1984) Resistance of
wheat to leaf spot caused by Bipolaris sorokiniana. Plant Dis
68:320–321
Chand R, Pandey SP, Singh HV, Kumar S, Joshi AK (2003)
Variability and its probable cause in natural populations of spot
blotch pathogen Bipolaris sorokiniana of wheat (T. aestivum L.)
in India. J Plant Dis Protec 110:27–35
Chaurasia S, Joshi AK, Dhari R, Chand R (1999) Resistance to foliar
blight of wheat: a search. Genet Resour Crop Evol 46:469–475
Chaurasia S, Chand R, Joshi AK (2000) Relative dominance of
Alternaria triticina Pras. et Prab and Bipolaris sorokiniana(Sacc.) shoemaker, in different growth stages of wheat (T.aestivum L). J Plant Dis Protec 107:176–181
Dixon MS, Hatzixanthis K, Jones DA, Harrison K, Jones JDG (1998)
The tomato Cf–5 disease resistance gene and six homologues
show pronounced allelic variation in leucine-rich repeat copy
number. Plant Cell 10:1915–1926
Doyle JJ, Doyle JL (1990) Isolation of plant DNA from fresh tissue.
Focus 12:12–15
Ganal MW, Roder MS (2007) Microsatellite and SNP markers in
wheat breeding. In: Varshney RK, Tuberosa R (eds) Genomics
assisted crop improvement, Genomics applications in crops, vol
2. Springer, Netherlands, pp 1–24
Jeger MJ (2004) Analysis of disease progress as a basis for evaluating
disease management practices. Annu Rev Phytopathol 42:61–82
Joshi AK, Chand R (2002) Variation and inheritance of leaf angle and
its association with spot blotch (Bipolaris sorokiniana) severity
in wheat (Triticum aestivum). Euphytica 124:283–291
Joshi AK, Chand R, Kumar S, Singh RP (2004a) Leaf tip necrosis: a
phenotypic marker associated with resistance to spot blotch
disease in wheat. Crop Sci 44:792–796
Joshi AK, Kumar S, Chand R, Ortiz-Ferrara G (2004b) Inheritance of
resistance to spot blotch caused by Bipolaris sorokiniana in
spring wheat. Plant Breed 123:213–219
Joshi AK, Kumari M, Singh VP, Reddy CM, Kumar S, Rane J, Chand
R (2007a) Stay green trait: variation, inheritance and its
association with spot blotch resistance in spring wheat (Triticumaestivum L.). Euphytica 153:59–71
Joshi AK, Ortiz-Ferrara G, Crossa J, Singh G, Alvarado G, Bhatta
MR, Duveiller E, Sharma RC, Pandit DB, Siddique AB, Das SY,
Sharma RN, Chand R (2007b) Associations of environments in
South Asia based on spot blotch disease of wheat caused by
Cochliobolus sativus. Crop Sci 47:1071–1081
Kumar U, Kumar S, Tyagi K, Chand R, Joshi AK (2004) Identifi-
cation of RAPD marker linked to spot blotch resistance gene
using bulked segregant analysis in wheat (T. aestivum). In:
Proceedings of 74th annual session of National Academy of
Science India, 2–4 December 2004, Jaipur, India, p 9–10
Lander ES, Green P, Abrahamson J, Barlow A, Daly MJ, Lincoln SE,
Newburg L (1987) MAPMAKER: an interactive computer
package for constructing primary genetic linkage maps of
experimental and natural populations. Genomics 1:174–181
Langridge P, Lagudah ES, Holton TA, Appels R, Sharp PJ, Chalmers
KJ (2001) Trends in genetic and genome analysis in wheat: a
review. Aust J Agric Res 52:1043–1077
Mehta YR (1994) Manejo Integrado de Enfermedadas de Trigo-santa
Cruz. Bolivia: CIAT/IAPAR. 314
Nelson J (1997) Qgene: software for marker-based genomic analysis
and breeding. Mol Breed 3:239–245
Nyquist WE (1991) Estimation of heritability and prediction of
selection response in plant populations. Crit Rev Plant Sci
10:235–322
Pandey SP, Kumar S, Kumar U, Chand R, Joshi AK (2005) Source of
inoculation of spot blotch pathogen and the variation in the
pathogen population at interaspecific level. Euro J Pl Pathol
111:47–55
Prasad M, Varshney RK, Kumar A, Balyan HS, Sharma PC, Edwards
KJ, Singh H, Dhaliwal HS, Roy JK, Gupta PK (1999) A
microsatellite marker associated with a QTL for grain protein
content on chromosome arm 2DL of bread wheat. Theor Appl
Genet 99:341–345
Theor Appl Genet (2009) 118:783–792 791
123

Raemakers RH (1991) Contribution to the epidemiology of Bipolarissorokiniana disease and the development of rainfed wheat, a new
crop in Zambia. Diss. Land bouwwetenschappen, Katholicke
Universiteitte Leuven, Belgium
Roder MS, Korzun V, Wendehake K, Plaschke J, Tixier M-H, Leroy
P, Ganal MW (1998) A microsatellite map of wheat. Genetics
149:2007–2023
Roelfs AP, Singh RP, Saari EE (1992) Rust Diseases of Wheat:
concepts and methods of disease management. CIMMYT,
Mexico, pp 1–81
Rong JK, Millet E, Manisterski J, Feldman M (2000) A new powdery
mildew resistance gene: introgression from wild emmer into
common wheat and RFLP-baseed mapping. Euphytica 115:121–
126
Roy JK, Prasad M, Varshney RK, Balyan HS, Blake TK, Dhaliwal
HS, Singh H, Edward KJ, Gupta PK (1999) Identification of a
microsatellite on chromosome 6B and STS on 7D of bread wheat
showing an association with preharvest sprouting tolerance.
Theor Appl Genet 99:336–340
Saari EE (1998) Leaf blight diseases and associated soil borne fungal
pathogens of wheat in north and south East Asia. In: Duveiller E,
Dubin HJ, Reeves J, Mc Nab A (eds) Helminthosporium Blights
of wheat: spot blotch and tan spot. CIMMYT, Mexico, pp 37–51
Sharma RC, Duveiller E, Jacquemin JM (2007) Microsatellite
markers associated with spot blotch resistance in spring wheat.
J Phytopathology 155:316–319
Somers DJ, Issac P, Edwards K (2004) A high-density microsatellite
consensus map for bread wheat (Triticum aestivum L.). Theor
Appl Genet 109:1105–1114
Sourdille P, Singh S, Cadalen T, Brown-Guedira GL, Gay G, Qi L,
Gill BS, Dufour P, Murigneux A, Bernard M (2004) Microsat-
ellite based deletion bin system for the establishment of genetic-
physical map relationships in wheat (Triticum aestivum L.).
Funct Integr Gen 4:12–25
Srivastava OP, Luthra JK, Narula PN (1971) Inheritance of seedling
resistance to leaf blight of wheat. Indian J Genet Plant Breed
45(54):941–943
Villareal RL, Mujeeb-Kazi A, Gilchrist LI, Toro ED (1995) Yield loss
to spot blotch in spring bread wheat in warm nontraditional
wheat production areas. Plant Dis 79:893–897
Wang S, Basten CJ, Zeng ZB (2005) Windows QTL Cartographer
2.5. Department of Statistics, North Carolina State University,
Raliegh, N�C. (http://statgen.ncsu.edu/qtlcart/WQTLCart.htm)
Zadoks JC, Chang TT, Konjak CF (1974) A decimal code for the
growth stages of cereals. Weed Res 14:415–421
792 Theor Appl Genet (2009) 118:783–792
123