effect of ultrasound parameters on the release of liposomal calcein
TRANSCRIPT

Ultrasound in Med. & Biol., Vol. 38, No. 3, pp. 476–486, 2012Copyright � 2012 World Federation for Ultrasound in Medicine & Biology
Printed in the USA. All rights reserved0301-5629/$ - see front matter
asmedbio.2011.11.017
doi:10.1016/j.ultrd Original Contribution
EFFECT OF ULTRASOUND PARAMETERS ON THE RELEASEOF LIPOSOMAL CALCEIN
MERCYAFADZI,*y CATHARINA DE L. DAVIES,* YNGVE H. HANSEN,* TONNI JOHANSEN,y
ØYVIND K. STANDAL,y RUNE HANSEN,yz SVEIN-ERIK M�ASØY,y ESBEN A. NILSSEN,x
and BJØRN ANGELSENy
*Department of Physics; yDepartment of Circulation and Medical Imaging, The Norwegian University of Science andTechnology, Trondheim, Norway; zDepartment of Medical Technology SINTEF Technology and Society, Trondheim, Norway;
and xEpitarget AS, Oslo, Norway
(Received 1 July 2011; revised 17 November 2011; in final form 27 November 2011)
APhysicHøgskntnu.no
Abstract—The ultrasound exposure parameters that maximize drug release from dierucoyl-phosphatidylcholine(DEPC)-based liposomes were studied using two transducers operating at 300 kHz and 1MHz. Fluorescent calceinwas used as amodel drug, and the release from liposomes in solution wasmeasured using a spectrophotometer. Therelease of calcein was more efficient at 300 kHz than at 1 MHz, with thresholds of peak negative pressures of 0.9MPa and 1.9MPa, respectively. Above this threshold, the release increased with increasing peak negative pressure,mechanical index (MI), and duty cycle. The amount of drug released followed first-order kinetics and increasedwith exposure time to a maximal release. To increase the release further, the MI had to be increased. The resultsdemonstrate that theMI and the overall exposure time are themajor parameters that determine the drug’s release.The drug’s release is probably due to mechanical (cavitation) rather than thermal effects, and that was alsoconfirmed by the detection of hydroxide radicals. (E-mail: [email protected]) � 2012 World Federationfor Ultrasound in Medicine & Biology.
Key Words: Ultrasound parameters, Mechanical index, Drug release, Liposomes, Cavitation.
INTRODUCTION
The main limitation associated with conventional chemo-therapy is the poor therapeutic index caused by the highlevel of toxicity in healthy tissues (Drummond et al.1999). Successful cancer therapy requires that cytotoxicdrugs reach the tumor cells and inactivate them withminimal damage to normal tissue. To reduce the exposureof normal tissue, cytotoxic drugs should be selectivelydelivered to tumor tissue. This may be achieved by encap-sulating the drug in a particulate carrier, such as a lipo-some, micelle, or other nanoparticle (Allen 1997;Barenholz 2001, 2007; Torchilin 2005; Liu et al. 2006).For an effective therapeutic effect, the carrier shouldremain stable in the circulatory system with anadequate amount of drug and then release the drug ata sufficient rate once the nanoparticle is at the tumor
ddress correspondence to: Mercy Afadzi, M.Sc., Department ofs, The Norwegian University of Science and Technology,oleringen 5, 7491 Trondheim, Norway. E-mail: mercy.afadzi@
476
site (Huang and McDonald 2004). Because of the hyper-permeable, fenestrated nature of tumor vessels (Yuanet al. 1994; Bae 2009), nanoparticles with diameters ofapproximately 100 nm are typically able to cross thecapillary wall and accumulate in the tumor interstitium.However, the distribution of the nanoparticles and thedrug is heterogeneous within the tumor tissue (Vaageet al. 1997; Davies et al. 2004; Bae 2009). Large areasof the tumor are not reached by the drug because of theheterogeneous fenestration of the tumor blood vesselsand poor penetration through the extracellular matrix.
There is also a challenge in controlling the localiza-tion and drug-release kinetics of intravenously injectednanoparticles so as to obtain sufficient drug concentrationsat the target site. Triggered mechanisms, both chemicaland physical, for controlling the release of the drug maybe used to overcome this challenge. Ultrasound has beenshown to improve both the release and the biodistributionof the drug (Huang and McDonald 2004; Rapoport2007; Steinberg et al. 2007; Schroeder et al. 2007,2009;). Ultrasound is of special interest because it isnoninvasive, can be controlled both spatially and

Effect of ultrasound parameters on drug release d M. AFADZI et al. 477
temporally, and can penetrate deep into the body withoutaffecting intermediate tissue. Furthermore, it has beenshown that ultrasound increases the permeability ofblood-tissue barriers and cell membranes (Bednarskiet al. 1997; Price et al. 1998; Guaman et al. 2001; Kostand Langer 2001). Several animal studies combiningultrasound and liposomal drugs have demonstrateda reduced tumor growth rate when ultrasound andliposomal drugs are combined, compared to liposomaldrugs alone (Myhr and Moan 2006; Schroeder et al.2009; Hagtvet et al. 2011; Pitt et al. 2011).
Although the mechanism of ultrasound-mediateddrug release is not fully understood (Pitt et al. 2004;Steinberg et al. 2007), it is generally divided intothermal and nonthermal effects. Acoustic cavitation isthe most important nonthermal mechanism; it involvesthe creation, oscillation, growth, and collapse of gasbubbles in a fluid exposed to a sound wave (Leightonet al. 1994, 1998; Young 1999). The effect of the soundwave on the bubbles can lead to stable oscillations(stable cavitation) or to total collapse (transient orinertial cavitation) of the bubbles. The transition fromstable cavitation to inertial cavitation occurs ata threshold called the inertial cavitation threshold(Apfel and Holland 1991; Leighton 1994; Young 1999;Miller 2007), which is dependent on the peak negativepressure, the frequency, and the initial bubble radius(Leighton 1994, 2007; Young 1999; Humphrey 2007).During inertial cavitation, the collapse of the bubblescan be very violent, and the bubbles often disintegrateinto a mass of smaller bubbles, which can produceshock waves, jet streams, high temperatures, and freeradicals (Apfel and Holland 1991; Leighton 1994;Young 1999; Miller 2007). The mechanical index (MI)(i.e., the ratio between the peak negative pressure[megapascal] and the square root of the frequency[megahertz]) indicates the occurrence of inertialcavitation; an MI below 0.7 (with a broad range ofbubbles sizes) theoretically signifies no occurrence ofcavitation (Apfel and Holland 1991).
Husseini et al. (2000) used 70 kHz ultrasound,varied the intensity, and showed that the release of drugfrom the micelles was caused by cavitation, that is, thestructure of the micelles was perturbed by cavitation.Liu et al. (1988) also reported that inertial cavitationplayed a dominant role in the drug release from micellecores. Schroeder et al. (2007) and Pangu et al. (2010),using 20 kHz ultrasound and varying the intensity andexposure time, suggested that the increased release wascaused by cavitation-inducing transient pore formationin liposomes and polysomes, respectively. However,most of these studies were based on nonfocused low-frequency (20 to 90 kHz) ultrasound, which is notcompatible with frequencies used in the clinic; only
a few different exposure regimes were compared; andthe transducers used were often ultrasonic mixers,limiting user control over exposure parameters. Thus,only a limited number of exposure parameters havebeen studied. For the effective release of drug from lipo-somes, determination of optimal ultrasound exposureparameters, such as frequency, negative pressure, inten-sity, duration, and duty cycle, have to be determined inorder to develop protocols for improved cancer therapy.
The lipid composition of liposomes has been re-ported to be of importance for ultrasound-induced drugrelease (Lin and Thomas 2003, 2004; Schroeder et al.2009). Traditional and clinically used liposomes consi-sting of hydrogenated soy phosphatidylcholine (HSPC);cholesterol; and polyethylene glycol–conjugatedphosphatidylethanolamines (DSPE-PEG) are reportedto have reduced sonosensitivity compared to liposomalformulations comprising phospholipids with smallerhead groups and longer and/or unsaturated acyl chains(Evjen et al. 2010, 2011). The latter liposomes may bebased on, for example, distearoyl-phosphatidyleth-anolamine (DSPE); dioleoylphosphatidylethanolamine(DOPE); or dierucoyl-phosphatidylcholine (DEPC)without nondissolved gasses. In the present work weused DEPC-based liposomes.
The aim of this work was to investigate the effects ofthe various ultrasound exposure parameters that maxi-mize drug release from DEPC-based liposomes. Wehypothesized that cavitation was the primary mechanismof drug release, and the impact of MI on drug release wasstudied, as was the overall exposure time determined bythe duty cycle and insonication time. The liposomeswere placed in solution and exposed to a focused ultra-sound beam using frequencies of 300 kHz and 1 MHz.Such frequencies allow adequate focusing of the ultra-sound beam, hence facilitating spatially confined drugdelivery. The release of the model drug calcein (a smallfluorescent molecule) was monitored by measuring thefluorescence intensity of the released drug spectrophoto-metrically at increasing acoustic pressures and exposuretimes.
MATERIALS AND METHODS
MaterialsDistearoylphosphatidylcholine (DSPC) and distear-
oylphosphatidylethanolamine-(methoxy(polyethylenegly-col)2000) (DSPE-PEG) were purchased from GenzymePharmaceuticals (Liestal, Switzerland). Calcein, choles-terol, 4-(2-hydroxyethyl)-1-piperazineethanesulfonic acid(HEPES), Triton X-100 solution, and sucrose were ob-tained from Sigma Aldrich (Oslo, Norway). Dierucoyl-phosphatidylcholine (DEPC) was supplied by AvantiPolar Lipids (Alabaster, AL, USA).

Table 1. Specification of transducers
Parameter
Frequency
0.3 MHz 1 MHz
Diameter (active) 55 mm 50 mmRadius of curvature 90 mm 131 mmLocation of maximum intensity 69 mm 125 mmRelative bandwidth 47% 62%23 dB beam diameter at location ofmaximum intensity
6.6 mm 3 mm
Lm, range where the pressure is 21 dBcompared to the pressure at the maximumintensity
32.57 mm 33 mm
478 Ultrasound in Medicine and Biology Volume 38, Number 3, 2012
LiposomesThe liposomes had a lipid composition of 52 mol%
DEPC, 5 mol%DSPC, 8 mol%DSPE-PEG, and 35mol%cholesterol. The intraliposomal phase consisted of50 mM calcein in a 10 mM HEPES solution (osmolalityof 313 mOsm/kg and a pH of 7.4). The extraliposomalphase consisted of an isosmotic sucrose solution in10 mM HEPES and 0.02% (w/v) sodium azide (pH 7.4).The liposomes were produced according to the thin filmmethod (Lasic 1993). Briefly, the lipids were dissolvedin a chloroform/methanol mixture (9/1 v/v) at 60�C androtary-evaporated to dryness under vacuum for 6 h. Theresulting dried lipid films were hydrated with the50 mM calcein solution for 2 h followed by 3 freeze-thaw cycles in a dry ice/acetone/methanol mixture andwater, respectively. The liposomes at a lipid concentra-tion of 16 mg/mL were downsized by stepwise extrusion(Lipex extruder, Biomembrane, Vancouver, BC, Canada)through Nucleopore polycarbonate filters with pore sizesof 800, 400, 200, 100, and 100 nm (Nuclepore, WestChester, PA, USA). The lipid hydration, liposome extru-sion, and thawing processes were performed at 25�C,which is above the gel-to-liquid crystalline phase transi-tion temperature of the phospholipids. Extraliposomalcalcein was removed by dialyzing 10 mL liposomedispersion against 0.5 L isotonic sucrose solution con-taining 10 mM HEPES and 0.01% (w/v) sodium azide.The latter dialysis buffer was changed 10 times. The lipo-some diameter was determined to be 105 nm (polydisper-sity index of 0.18) by photon correlation spectroscopy(Nanosizer, Malvern Instruments, Malvern, UK).Stability studies showed 1% or less liposome leakageafter 4-hour incubation at 37�C or 6-month incubationat 5�C in HEPES sucrose buffer.
Characterization of transducersTwo custom-made, single-element ultrasound trans-
ducers (Imasonic, Besancon, France) with frequencies of300 kHz and 1 MHz were used. The transducers were ofpiezoelectric composite and had matching layers and
a thick backing. Each transducer had a thermocouplerin the backing to monitor the temperature in thetransducer. The specifications of the transducers can befound in Table 1. The acoustic field was characterizedusing a capsule hydrophone (Onda HGL-0200, Onda,Sunnyvale, CA, USA) with a tip diameter of 200 mm, con-nected to a 20-dB preamplifier (Onda AH-2020) in a rect-angular Plexiglas water tank. The 2-dimensional beamprofiles were recorded and the -3-dB beam width alongthe lateral direction was measured (see Table 1). Also,the range (Lm) at which the pressure was -1 dB comparedto the pressure at the maximum intensity was determined(see Table 1). Generally, the 1-MHz transducer was foundto exhibit more nonlinearity than the 300-kHz transducerat the peak maximum intensity. That is, the ratio of thesecond to the first harmonic component for the 1-MHztransducer was -17.6 dB and -7.6 dB for, respectively,the lowest and highest pressures measured, whereas thatof the 300-kHz transducer was -36.6 dB (lowest pressure)and -22.9 dB (highest pressure measured). The maximalpressures and their corresponding temporal averageintensities (ITA) and MIs were calculated from the exper-imental data using Equations 1 and 2:
ITA 5PRF
ðT0
p2
rcdt (1)
MI5Pnegffiffiffi
fp (2)
where p is the acoustic pressure, r is the mass density, c isthe speed of sound in the medium, T is the repetitionperiod, PRF is the pulse repetition frequency, Pneg is thepeak negative pressure in MPa, and f is the frequency inMHz. However, the levels of the pressure were measuredin free space (inside the water tank), not inside the samplechamber.
Ultrasound exposure set-upThe exposure set-up consisted of a signal generator
(Hewlett Packard 33120A, San Jose, CA, USA); an oscil-loscope (Lecroy waverunner, LT262, Long Branch, NJ,USA); a power amplifier (ENI 2100L, Rochester, NY,USA); the two custom-made transducers, and an insoni-cation chamber. However, because of the power limita-tions of the ENI amplifier, in addition, an 8-channelPC-controlled arbitrary waveform generator board(DA4300, Acquitek, Massy, France) connected toa custom-made 8 channel power amplifier (ENI 90AB8,Rochester, NY, USA), (in which the 8 channels werecombined) was used to drive the transducer. A cylindricalPVC water tank (200 mm in diameter and 300 mm long)was designed for the insonication of the sample. Theinside of the water tank was coated with regular sponge
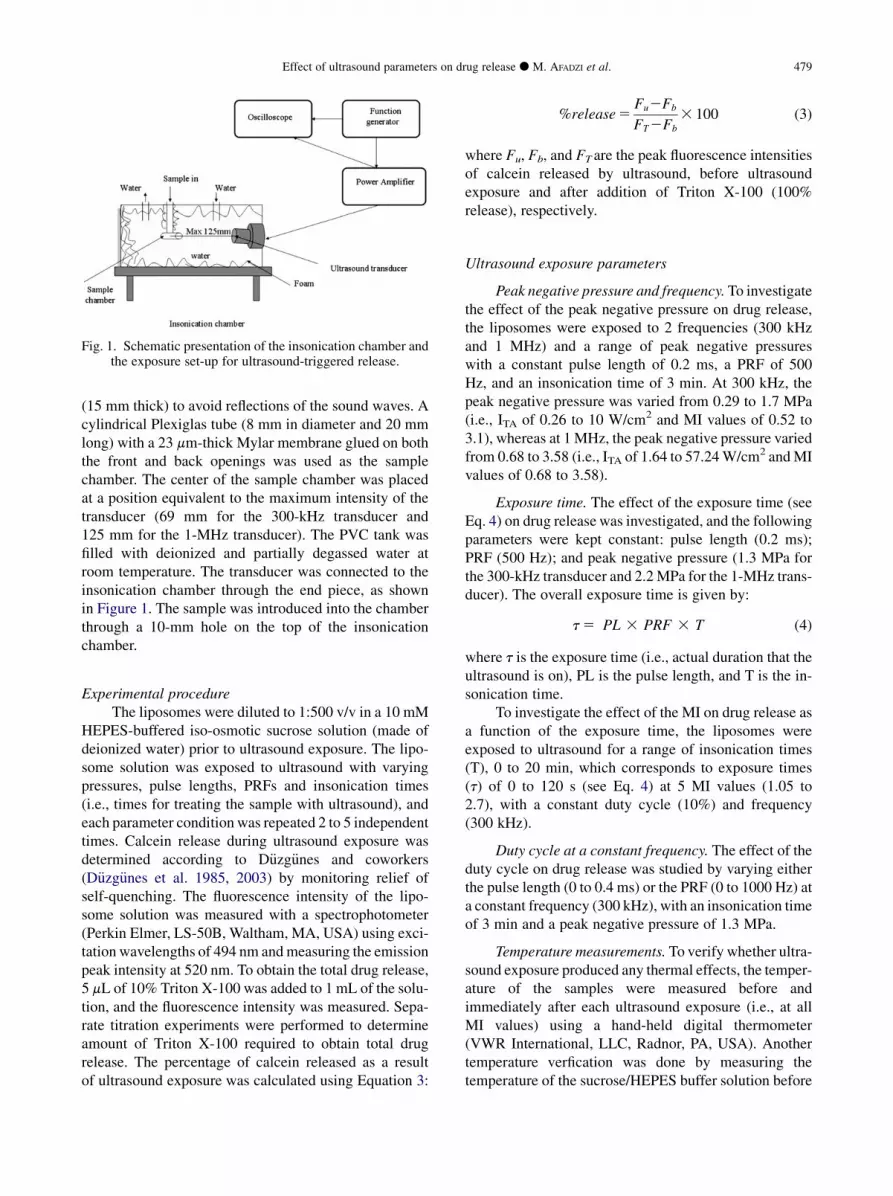
Fig. 1. Schematic presentation of the insonication chamber andthe exposure set-up for ultrasound-triggered release.
Effect of ultrasound parameters on drug release d M. AFADZI et al. 479
(15 mm thick) to avoid reflections of the sound waves. Acylindrical Plexiglas tube (8 mm in diameter and 20 mmlong) with a 23 mm-thick Mylar membrane glued on boththe front and back openings was used as the samplechamber. The center of the sample chamber was placedat a position equivalent to the maximum intensity of thetransducer (69 mm for the 300-kHz transducer and125 mm for the 1-MHz transducer). The PVC tank wasfilled with deionized and partially degassed water atroom temperature. The transducer was connected to theinsonication chamber through the end piece, as shownin Figure 1. The sample was introduced into the chamberthrough a 10-mm hole on the top of the insonicationchamber.
Experimental procedureThe liposomes were diluted to 1:500 v/v in a 10 mM
HEPES-buffered iso-osmotic sucrose solution (made ofdeionized water) prior to ultrasound exposure. The lipo-some solution was exposed to ultrasound with varyingpressures, pulse lengths, PRFs and insonication times(i.e., times for treating the sample with ultrasound), andeach parameter condition was repeated 2 to 5 independenttimes. Calcein release during ultrasound exposure wasdetermined according to D€uzg€unes and coworkers(D€uzg€unes et al. 1985, 2003) by monitoring relief ofself-quenching. The fluorescence intensity of the lipo-some solution was measured with a spectrophotometer(Perkin Elmer, LS-50B, Waltham, MA, USA) using exci-tation wavelengths of 494 nm andmeasuring the emissionpeak intensity at 520 nm. To obtain the total drug release,5 mL of 10% Triton X-100 was added to 1 mL of the solu-tion, and the fluorescence intensity was measured. Sepa-rate titration experiments were performed to determineamount of Triton X-100 required to obtain total drugrelease. The percentage of calcein released as a resultof ultrasound exposure was calculated using Equation 3:
%release5Fu2Fb
FT2Fb
3 100 (3)
where Fu, Fb, and FT are the peak fluorescence intensitiesof calcein released by ultrasound, before ultrasoundexposure and after addition of Triton X-100 (100%release), respectively.
Ultrasound exposure parameters
Peak negative pressure and frequency.To investigatethe effect of the peak negative pressure on drug release,the liposomes were exposed to 2 frequencies (300 kHzand 1 MHz) and a range of peak negative pressureswith a constant pulse length of 0.2 ms, a PRF of 500Hz, and an insonication time of 3 min. At 300 kHz, thepeak negative pressure was varied from 0.29 to 1.7 MPa(i.e., ITA of 0.26 to 10 W/cm2 and MI values of 0.52 to3.1), whereas at 1 MHz, the peak negative pressure variedfrom 0.68 to 3.58 (i.e., ITA of 1.64 to 57.24W/cm2 andMIvalues of 0.68 to 3.58).
Exposure time. The effect of the exposure time (seeEq. 4) on drug release was investigated, and the followingparameters were kept constant: pulse length (0.2 ms);PRF (500 Hz); and peak negative pressure (1.3 MPa forthe 300-kHz transducer and 2.2MPa for the 1-MHz trans-ducer). The overall exposure time is given by:
t5 PL 3 PRF 3 T (4)
where t is the exposure time (i.e., actual duration that theultrasound is on), PL is the pulse length, and T is the in-sonication time.
To investigate the effect of the MI on drug release asa function of the exposure time, the liposomes wereexposed to ultrasound for a range of insonication times(T), 0 to 20 min, which corresponds to exposure times(t) of 0 to 120 s (see Eq. 4) at 5 MI values (1.05 to2.7), with a constant duty cycle (10%) and frequency(300 kHz).
Duty cycle at a constant frequency. The effect of theduty cycle on drug release was studied by varying eitherthe pulse length (0 to 0.4 ms) or the PRF (0 to 1000 Hz) ata constant frequency (300 kHz), with an insonication timeof 3 min and a peak negative pressure of 1.3 MPa.
Temperature measurements. To verify whether ultra-sound exposure produced any thermal effects, the temper-ature of the samples were measured before andimmediately after each ultrasound exposure (i.e., at allMI values) using a hand-held digital thermometer(VWR International, LLC, Radnor, PA, USA). Anothertemperature verfication was done by measuring thetemperature of the sucrose/HEPES buffer solution before

I TA (W/cm 2 )
5 15 25 35 45 55 0 10 20 30 40 50 60
e s a e l e R
%
10
30
50
70
0
20
40
60
300 kHz 1 MHz
MI
0,5 1,5 2,5 3,5 0,0 1,0 2,0 3,0
% R
e l
e s a
e
10
30
50
70
0
20
40
60
300kHz 1MHz
Peak negative pressure (MPa)
0,5 1,5 2,5 3,5 0,0 1,0 2,0 3,0
%
e s a e l e R
10
30
50
70
0
20
40
60
300kHz 1MHz
a
b
c
Fig. 2. Effect of the acoustic parameters on the release of cal-cein from liposomes with a 10% duty cycle and a 3-min insoni-cation time for the 300 kHz (�) and 1 MHz (B) transducers. Theerror bars show the standard deviation (n5 5) from the mean ofthe percentage release. The percentage release is shown asa function of peak negative pressure (a), intensity (b), and MI
(c), R2 value . 0.9886; p , 0.0001 for all fits.
480 Ultrasound in Medicine and Biology Volume 38, Number 3, 2012
and continuously during ultrasound exposure, usinga thermocouple placed inside the sample chamber. Thebuffer solution was exposed to ultrasound with MI valuesof 2.6 and 2.2 for, respectively, the 300-kHz and 1-MHztransducers, and a duty cycle of 10% and 20 min of inso-nication time (i.e., 120 s of exposure time).
Validation of inertial cavitation. To study whetherthe ultrasound treatment generated inertial cavitation,a terephthalate dosimeter was used (Mason et al. 1994;Villeneuve et al. 2009; Somaglino et al. 2010). Inbrief, when inertial cavitation occurs, the producedhydroxide (OH) radicals react with the nonfluorescentterephthalate (TA) to form fluorescent 2-hydroxyterephthalic acid (HTA). Solutions of 2 mM TA(Sigma Aldrich, Oslo, Norway) and HTA (Mole’sScience & Technology, Hangzhou, China) were prepared(with deionized water) and maintained at pH 7.3. TheHTA solution was diluted to concentrations between0.01 mM and 1 mM, and the fluorescence intensity ofeach concentration was measured to obtain a standardcurve. A spectrophotometer (Olis RSM 1000, Conway,SC, USA) with excitation and emission wavelengths of320 and 425.5 nm (i.e., peak intensity value), respec-tively, was used for the fluorescent measurement. A1-mL TA solution was placed in the sample chamberand exposed to various acoustic pressures using thesame set-up as previously described. The fluorescenceintensity of the TA solution before and after ultrasoundexposure was measured with the same settings as theHTA standard curve. The background fluorescence inten-sity of TAwas subtracted from the fluorescence intensityof the HTA that was generated as a result of cavitation.
Mathematical fitting and statistical analysis. Therelationship between the release of calcein and the ultra-sound exposure parameters (peak negative pressure, ITAand MI) was described mathematically by fitting a linearfunction of 2 or 3 segments to the experimental releasedata. A first-order exponential model was used to fit thedata describing drug release as a function of time. Sigma-Plot (Systat Software, Chicago, IL, USA) was used for allfits. Thesemodelswere selected because they gave the bestfit. The goodness of the fit was determined by the squarecoefficient of correlation (R2) and the p value of the fit.
RESULTS
Effect of ITA, peak negative pressure, MI, and exposuretime on calcein release: Comparison of 300-kHz and1-MHz frequencies
The effect of the peak negative pressure and expo-sure time on the release of calcein from liposomes wasinvestigated at the same duty cycle (10%) for the 2frequencies using a 500-Hz PRF and a pulse length of0.2 ms. The release was plotted as a function of thepeak negative pressure and the corresponding ITA andMI values (Fig. 2). Generally, the 300-kHz transducerreleased more calcein than did the 1-MHz transducer,although the 1-MHz transducer was used at higher inten-sities and peak negative pressures than was the 300-kHztransducer (Fig. 2). A minimum threshold of acoustic
Exposure time (s) 0 20 40 60 80 100 120
e s a e l e R
%
0
10
20
30
40
50
60
1.1 1.5 2.0 2.4 2.7
MI 0,0 0,5 1,0 1,5 2,0 2,5 3,0
s ( ) c
T
/ 1 ( t n a t s n o c
e t a R
1 - )
0,000
0,005
0,010
0,015
0,020
0,025
0,030
a
b
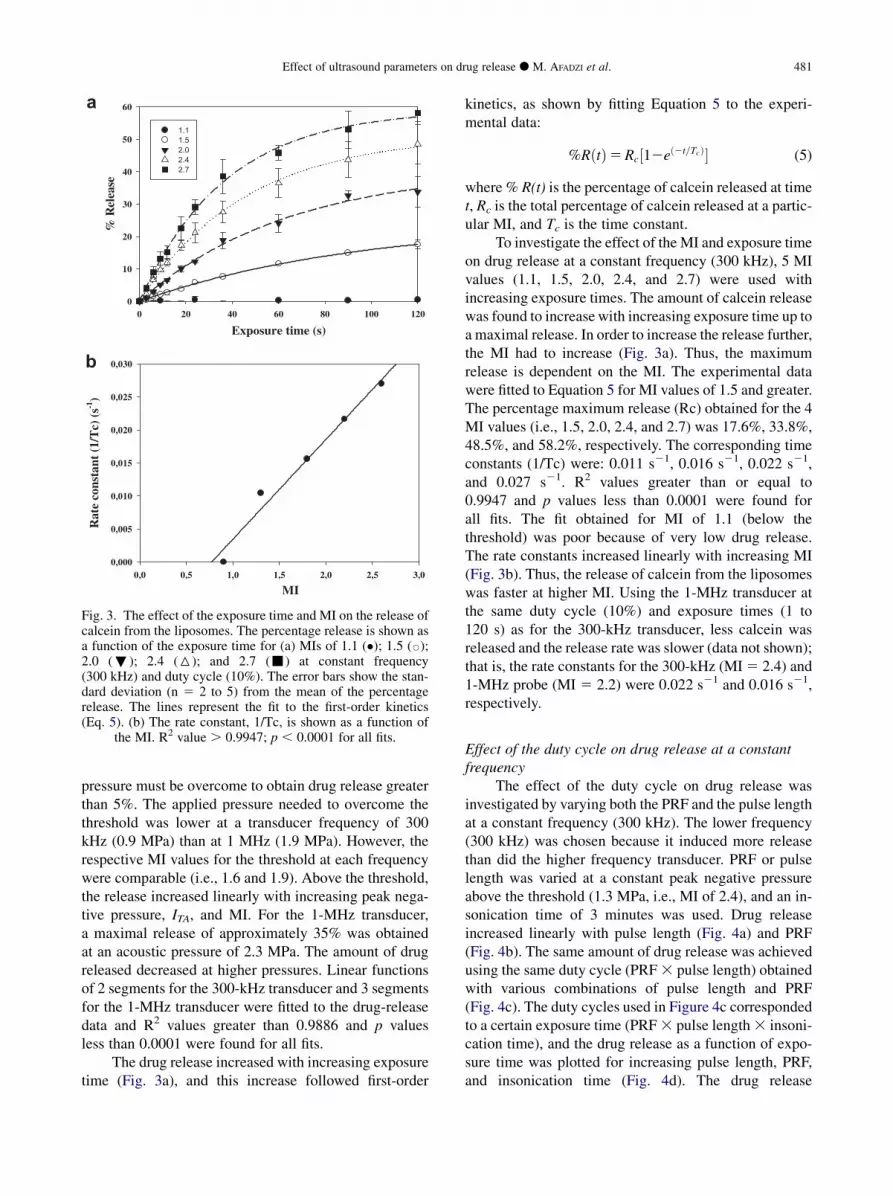
Fig. 3. The effect of the exposure time and MI on the release ofcalcein from the liposomes. The percentage release is shown asa function of the exposure time for (a) MIs of 1.1 (�); 1.5 (B);2.0 (;); 2.4 (6); and 2.7 (-) at constant frequency(300 kHz) and duty cycle (10%). The error bars show the stan-dard deviation (n 5 2 to 5) from the mean of the percentagerelease. The lines represent the fit to the first-order kinetics(Eq. 5). (b) The rate constant, 1/Tc, is shown as a function of
the MI. R2 value . 0.9947; p , 0.0001 for all fits.
Effect of ultrasound parameters on drug release d M. AFADZI et al. 481
pressure must be overcome to obtain drug release greaterthan 5%. The applied pressure needed to overcome thethreshold was lower at a transducer frequency of 300kHz (0.9 MPa) than at 1 MHz (1.9 MPa). However, therespective MI values for the threshold at each frequencywere comparable (i.e., 1.6 and 1.9). Above the threshold,the release increased linearly with increasing peak nega-tive pressure, ITA, and MI. For the 1-MHz transducer,a maximal release of approximately 35% was obtainedat an acoustic pressure of 2.3 MPa. The amount of drugreleased decreased at higher pressures. Linear functionsof 2 segments for the 300-kHz transducer and 3 segmentsfor the 1-MHz transducer were fitted to the drug-releasedata and R2 values greater than 0.9886 and p valuesless than 0.0001 were found for all fits.
The drug release increased with increasing exposuretime (Fig. 3a), and this increase followed first-order
kinetics, as shown by fitting Equation 5 to the experi-mental data:
%RðtÞ5Rc½12eð2t=TcÞ� (5)
where % R(t) is the percentage of calcein released at timet, Rc is the total percentage of calcein released at a partic-ular MI, and Tc is the time constant.
To investigate the effect of the MI and exposure timeon drug release at a constant frequency (300 kHz), 5 MIvalues (1.1, 1.5, 2.0, 2.4, and 2.7) were used withincreasing exposure times. The amount of calcein releasewas found to increase with increasing exposure time up toa maximal release. In order to increase the release further,the MI had to increase (Fig. 3a). Thus, the maximumrelease is dependent on the MI. The experimental datawere fitted to Equation 5 for MI values of 1.5 and greater.The percentage maximum release (Rc) obtained for the 4MI values (i.e., 1.5, 2.0, 2.4, and 2.7) was 17.6%, 33.8%,48.5%, and 58.2%, respectively. The corresponding timeconstants (1/Tc) were: 0.011 s21, 0.016 s21, 0.022 s21,and 0.027 s21. R2 values greater than or equal to0.9947 and p values less than 0.0001 were found forall fits. The fit obtained for MI of 1.1 (below thethreshold) was poor because of very low drug release.The rate constants increased linearly with increasing MI(Fig. 3b). Thus, the release of calcein from the liposomeswas faster at higher MI. Using the 1-MHz transducer atthe same duty cycle (10%) and exposure times (1 to120 s) as for the 300-kHz transducer, less calcein wasreleased and the release rate was slower (data not shown);that is, the rate constants for the 300-kHz (MI5 2.4) and1-MHz probe (MI 5 2.2) were 0.022 s21 and 0.016 s21,respectively.
Effect of the duty cycle on drug release at a constantfrequency
The effect of the duty cycle on drug release wasinvestigated by varying both the PRF and the pulse lengthat a constant frequency (300 kHz). The lower frequency(300 kHz) was chosen because it induced more releasethan did the higher frequency transducer. PRF or pulselength was varied at a constant peak negative pressureabove the threshold (1.3 MPa, i.e., MI of 2.4), and an in-sonication time of 3 minutes was used. Drug releaseincreased linearly with pulse length (Fig. 4a) and PRF(Fig. 4b). The same amount of drug release was achievedusing the same duty cycle (PRF3 pulse length) obtainedwith various combinations of pulse length and PRF(Fig. 4c). The duty cycles used in Figure 4c correspondedto a certain exposure time (PRF3 pulse length3 insoni-cation time), and the drug release as a function of expo-sure time was plotted for increasing pulse length, PRF,and insonication time (Fig. 4d). The drug release

Pulse length (ms)
0,0 0,1 0,2 0,3 0,4
% R
elea
se
0
10
20
30
40
50
PRF (Hz)
0 200 400 600 800 1000
% R
elea
se
0
10
20
30
40
50
Duty cycle (%)
2,5 7,5 12,5 17,50,0 5,0 10,0 15,0 20,0
% R
elea
se
0
10
20
30
40
50
Pulse LengthPRF
Exposure time (s)5 15 25 350 10 20 30 40
% R
elea
se
0
10
20
30
40
50
60
a
c d
b
Fig. 4. The effect of the duty cycle (pulse length [�] and PRF [B]) on the release of calcein from liposomes at a constantfrequency (300 kHz); peak negative pressure (1.3 MPa); and insonication time (180 s). The error bars show the standarddeviation (n 5 2) from the mean of the percentage release. The percentage release is shown as a function of the pulselength (a), PRF (b), and duty cycle (c). Release as a function of exposure time with variation in pulse length (d) (constantinsonication time and PRF); PRF (constant insonication time and pulse length); and insonication (;) (pulse length and
PRF constant). R2 value .0.9834; p , 0.0001 for all fits.
482 Ultrasound in Medicine and Biology Volume 38, Number 3, 2012
increased linearly with exposure time, and this corre-sponds to the first part (exposure time below 40 s) ofthe first-order kinetics curve in Figure 3a at 2.4 MI.
Thermal effectsThe temperature in the sample was measured before
and immediately after ultrasound exposure and alsocontinuously during ultrasound exposure of the sucrose/HEPES buffer solution. The increase in temperaturewas 1 to 9�C, and the increase correlated positivelywith the MI. The temperature increased within the first3 min (i.e., 18 s of exposure time), and then the tempera-ture was constant for the remaining 17 min of insonica-tion time. Separate temperature studies showed 1% orless of calcein leakage from the liposomes after 4 hoursof incubation at 37�C in sucrose/HEPES solution.
Validation of inertial cavitationA linear relationship was obtained between the fluo-
rescence intensity and the concentration of HTAmeasured at concentrations up to 0.5 mM (data notshown). The fluorescence of the ultrasound-exposed TAsolution had intensity within the same range as theHTA standard curve (0 to 70 absorbance units a.u.).
Minimal fluorescence was detected in samples exposedto ultrasound using peak negative pressures below thethreshold for drug release. The thresholds were found tobe higher for the higher frequency transducer (1.9 MPa)than for the lower frequency transducer (0.9 MPa), whichcorrespond to MI values of 1.9 and 1.6, respectively.Above the threshold, the fluorescence intensity increasedwith increasing peak negative pressure, indicating anincrease in the production of OH radicals (Fig. 5a). Forthe 1-MHz transducer, maximal fluorescence intensitywas obtained at a peak negative pressure of 2.3 MPa, fol-lowed by a decrease in intensity with further increases innegative pressure. The fluorescence intensity of thegenerated HTA correlated linearly with the release of cal-cein from the liposomes (Fig. 5b) for both ultrasoundtransducers (correlation coefficients R2 5 0.9602(300 kHz) and R2 5 0.8826 (1 MHz).
DISCUSSION
The effects of various ultrasound exposure parame-ters on the release of liposomal calcein in solution werestudied. By varying the peak negative pressure at 2frequencies, the impact of the MI on drug release was

Negative pressure (MPa)
% R
elea
se
0,5 1,5 2,5 3,50,0 1,0 2,0 3,00
10
20
30
40
50
60
70
Flu
ores
cenc
e it
ensi
ty (
a.u)
0
10
20
30
40
50
60
70
% R (300kHz)% R (1MHz)FLU (300kHz) FLU (1MHz)
Fluorescence intensity (a.u)
% R
elea
se
10 30 50 700 20 40 60
10
30
50
70
0
20
40
60
300kHz1MHz
a
b
Fig. 5. (a) Fluorescence intensity (in arbitrary units) (FLU,>)of HTA produced after ultrasound exposure of a TA solutionusing the 300-kHz (closed symbol) and 1-MHz (open symbol)transducers as a function of the peak negative pressure. Thefluorescence intensity is compared to the percentage release(%R, B) from liposomes presented in Figure 2(b). (b) The corre-lation between the percentage release and the fluorescenceintensity (in arbitrary units) of HTA for the 300-kHz (closedsymbol) and 1-MHz (open symbol) transducers. The errorbars show the standard deviation (n 5 2) from the mean of
the percentage release.
Effect of ultrasound parameters on drug release d M. AFADZI et al. 483
determined. Minimal drug release (less than 5%)occurred until certain threshold values of ITA, peak nega-tive pressure, andMIwere reached, at which point a linearincrease in the drug release with increase in the 3 param-eters followed. The peak negative pressure threshold waslower for the 300-kHz transducer than for the 1-MHztransducer for the same duty cycle (10%). However, thecorresponding threshold for the MI was almost thesame for the 2 frequencies. The linear dependencebetween drug release and MI suggests that the drugrelease is caused by a mechanical mechanism such asstable or inertial cavitation. Inertial cavitation requiresthe presence of gas bubbles, and the sucrose/HEPESbuffer solution used in our work was made of deionizedwater that might have contained micrometer-sized gas
bubbles. Apfel and Holland (1991) found that for1-MHz transducers, the cavitation threshold was almostindependent of initial bubble radius in the micrometerrange. Thus, gas bubbles in the sucrose/HEPES buffercan probably cause inertial cavitation. The occurrenceof the threshold to obtain drug release also suggests thatthe drug release was caused by inertial cavitation. Inertialcavitation is reported to occur only above a certain pres-sure/MI threshold (Daniels et al. 1987; Apfel and Holland1991; Brennen 1995; Miller et al. 1996; Young 1999).Other studies (Husseini et al. 2000; Schroeder et al.2007) have also reported the important role of inertialcavitation in drug release and have shown a lineardependence of drug release with the acoustic amplitude(intensity). In our study we extended this relationshipand correlated drug release to MI using 2 clinicallyrelevant frequencies and varying the acoustic pressureof the focused ultrasound beam. To verify whetherinertial cavitation actually took place, the presence ofOH radicals was demonstrated by measuring thefluorescence intensity of an ultrasound-exposed TAsolution.
Ultrasound exposure induced only a minor increasein the temperature of the liposome solution. The smallincrease in temperature did not increase linearly withexposure time (i.e., it was constant after the first 18 s ofexposure time), suggesting that this is not a thermal effectbut the occurrence of a mechanical effect. Also, 1% orless calcein leakage was found when the liposomeswere incubated for 4 h at 37�C in sucrose/HEPES solu-tion, suggesting that these liposomes were not thermallysensitive.
Ultrasound-induced drug release followed a first-order kinetic model that depended on the exposure timeand the MI. The maximal drug release was obtained fora certain exposure time, and any further increase inrelease could occur only if the MI increased. Thus, it istheMI together with overall exposure time that determinethe maximal drug release. Additionally, the first-orderrate constant was also found to depend linearly on theMI at a constant frequency. Thus, it takes less time forthe drug to be released if the MI is higher, and calceinwas released faster at a lower frequency than at a higherfrequency. These observations also suggest that therelease was due to inertial cavitation, and they are consis-tent with the results reported by other studies (Schroederet al. 2007; Enden and Schroeder 2009). Theexperimental validation of the first-order kinetic modeldemonstrates that it is possible to determine thepercentage of drug release at a given MI and exposuretime. Whether this will be possible in an in vivo settingis, however, the subject of future investigations.
Above the threshold for inertial cavitation, therelease increased linearly with the peak negative pressure

484 Ultrasound in Medicine and Biology Volume 38, Number 3, 2012
for both frequencies used. However, for the 1-MHz trans-ducer, an increase in drug release was followed bya reduction above a certain pressure (2.3 MPa), whereasno reduction in drug release was observed when the300-kHz transducer was used. The reduction in drugrelease might be due to attenuation of the ultrasoundbeam by gas bubbles between the transducer and thesample chamber. Gas bubbles can attenuate the beamthrough scattering and absorption (Angelsen 2002;Leighton 2007), and the attenuation of the pressure isdependent on the frequency. Thus, higher attenuationis obtained at higher frequencies than at lowerfrequencies. Also, at higher pressures more energywould be pumped into higher harmonics and becauseattenuation increases with frequency, the sound wavefrom the 1 MHz transducer (because of its nonlinearity)would be attenuated more than that of the 300 kHztransducer. When the voltage at the output of theamplifier was monitored, echoes from the front of thesample chamber and the back of the cylindrical PVCtank were observed. The transmit voltage and the echofrom the back of the PVC tank showed a stable pulseshape at all voltage levels. At higher voltages (higherpressures), there were drastic oscillations in the echosignal from the front of the sample chamber. Theymight be echoes from the sample chamber surface oroscillations of gas bubbles attached to the samplechamber’s surface that resulted in inertial cavitation andprobably movement of bubbles. The reduction of drugrelease occurred at pressures at which drasticoscillations were also observed. Others have alsoobserved that cavitational activity increases withacoustic intensity, and the resulting bioeffect reacheda maximum before declining with further increase inacoustic intensity (Miller et al. 1989, 1996).Furthermore, Miller et al. (1989) showed that at higheracoustic intensities (with a 1-MHz transducer), thenumber of cells that ruptured decreased with increasingacoustic intensity, whereas the number of visible bubbles(between the insonated test tube and transducer)increased dramatically with acoustic intensity. Thus, thedecrease in the bioeffect at higher intensities is likely tobe caused by attenuation or absorption of the ultrasoundbeam by gas bubbles.
The effect of the duty cycle was studied using the300-kHz transducer by varying the pulse length andPRF. Drug release was found to correlate linearly withduty cycle, as modulated by either PRF or pulse length.The release was also found to be linear at lower exposuretimes (i.e., 40 s), corresponding with the initial part of thefirst-order kinetic curve, and this linearity was obtainedby increasing PRF, pulse length, or insonication time.These results imply that at constant MI, drug releasedepends on the overall exposure time, independent of
the manner in which the exposure time is obtained.Consistent with our results, Schroeder et al. (2007) foundthat liposomes released the same amount of drug whenexposed to either continuous or pulsed ultrasoundapplying the same overall exposure time.
The mechanism of cavitation-mediated drug releasefrom the liposomes is thought to involve increasedpermeability (sonoporation) or total disintegration ofthe liposome membrane when small oscillating gasbubbles cavitate close to or in the hydrophobic regionof the liposomal membrane (Schroeder et al. 2007,2009; Enden and Schroeder 2009). The dependence ofthe release on the pulse length may be related to theself-sealing properties of sonoporated liposomes. Earlierreports suggest that lipids reseal rapidly after rupturing(Marin et al. 2001) and that it takes more time for thelipids to reseal when the pulses are longer. Some miscel-lar formulations have been observed to re-encapsulateduring the ultrasound-off phase, yielding greater drugrelease at shorter pulse intervals (i.e., higher PRF)(Husseini et al. 2000; Marin et al. 2001). Althougha mechanism involving lipid pore formation andresealing is consistent with our results, such aninterpretation is not supported by reports of collapse ofDOPE-based liposomes during low-frequency ultrasoundexposure (Evjen et al. 2011). Destabilization of the lipidmembrane was here visualized by electron microscopy aslarger liposomes or lipid aggregates observed after ultra-sound exposure (Evjen et al. 2011). Evjen and coworkers(2011) suggested that the cone-shaped geometry and non-bilayer characteristics of DOPE render the liposomemembrane prone to form a so-called reverse hexagonalstructure (flip and release) during ultrasound exposure.DEPC, the main phospholipid of the present liposomes,also has a cone-shaped geometry andmay release througha similar mechanism. Although our results are limited toDEPC-based liposomes, the first-order drug releasekinetics are also reported for other types of liposomes(Schoeder et al. 2007; Enden and Schroeder 2009), sug-gesting that the results might be generalized to other typesof non–thermally sensitive liposomes.
The present work demonstrates that two ultrasoundexposure parameters, MI, and overall exposure time,determine the total drug release from liposomes. Theoptimal value of these two parameters may be obtainedin various combinations of the parameters they dependon. Thus, optimal MI may be obtained using either lowfrequency and low negative pressure or high frequencyand high negative pressure. Optimal exposure time maybe achieved by using both continuous and pulsed waves.Clinically, this can be of importance because the ultra-sound exposure can be tuned to avoid heating of thetissue. However, because of the complexity of thein vivo environment, the translation from in vitro to

Effect of ultrasound parameters on drug release d M. AFADZI et al. 485
in vivo cavitation is not straightforward. There isevidence that submicrometer gas bodies exist naturallyin vitro (Blatteau et al. 2006), but bubble nucleation,distribution in terms of nucleus size and local concentra-tion, and the activation of these potential natural nuclei byultrasound exposure is still relatively poorly understood.The induction of cavitation also depends on viscosity andcell density (Apfel and Holland 1991). An in vitro studyof inertial cavitation in human blood showed a significantreduction in cavitation threshold when the viscosity wasreduced by reducing the hematocrit and by adding poly-meric particles to the blood (Deng et al. 1996). Alto-gether, these factors show the challenges involved inpredicting the optimal MI in a clinical situation.
CONCLUSIONS
This study characterized the ultrasound parametersoptimal for drug release from DEPC-based liposomesand pointed to MI and overall exposure time as the majorparameters that determine the drug release. The first-order kinetic for drug release demonstrated thatincreasing the exposure time above a certain value doesnot enhance the release further. The observation thatdrug release was dependent on the MI was supported bysonochemical experiments indicating free radical forma-tion. Only minor temperature effects were found. Alto-gether, this demonstrated that the release mechanisminvolved amechanical effect or, more specifically, inertialcavitation. The study also suggested that the duty cyclemay be used to control the amount of energy depositedand the heat generated in tissue. An optimization of ultra-sound exposure is, however, needed to enhanceultrasound-mediated drug release from liposomes andfacilitate future clinical applications.
Acknowledgments—The authors thank Sibylla R€ognvaldsson (EpitargetAS, Oslo) for producing and characterizing the liposomes, as well asKristin G. Sæterbø and Ingerid Arbo for their assistance at the labora-tory. This project is supported by the Schlumberger Foundation PhDFellowship (Faculty for the Future).
REFERENCES
Allen TM. Liposomes: Opportunities in drug delivery. Drugs 1997;54:8–14.
Angelsen BAJ. Waves, signals, and siginal processing. Trondheim,Norway: Emantec; 2002.
Apfel RE, Holland CK. Gauging the likelihood of cavitation from short-pulse, low-duty-cycle diagnostic ultrasound. Ultrasound Med Biol1991;17:179–185.
Bae YH. Drug targeting and tumor heterogeneity. J Control Release2009;133:2–3.
Bednarski MD, Lee JW, Callstrom MR, Li KC. In vivo target-specificdelivery of macromolecular agents with MR-guided focused ultra-sound. Radiology 1997;204:263–268.
Barenholz Y. In: Liposome Technology. London: Gregoriadis; 2007. p.1–21.
Barenholz Y. Liposome application: problems and prospects. Curr OpinColloid Interface Sci 2001;6:66–77.
Blatteau JE, Souraud JB, Gempp E, Boussuges A. Gas nuclei, theirorigin, and their role in bubble formation. Aviat Space EnvironMed 2006;77:1068–1076.
Brennen CE. Cavitation and bubble dynamics. New York: OxfordUniversity Press; 1995.
Daniels S, Blondel D, Crum LA, Haar GR, Dyson M. Ultrasonicallyinduced gas bubbles production in agar-based gels: Part I. Experi-mental investigation. Ultrasound Med Biol 1987;9:527–539.
Davies CD, Lundsrøm LM, Frengen J, Eikenes L, Bruland ØS,Kaalhus O, Hjelstuen MHB, Brekken C. Radiation improves thedistribution and uptake of liposomal doxorubicin (caelyx) in humanosteosarcoma xenogrefts. Cancer Res 2004;64:547–553.
Deng CX, Xu Q, Apfel RE, Holland CK. In vitro measurements of iner-tial cavitation thresholds in human blood. Ultrasound Med Biol1996;22:939–948.
Drummond DC, Meyer O, Hong K, Kirpotin DB, Papahadjopoulos D.Optimizing liposomes for delivery of chemotherapeutic agents tosolid tumors. Pharmacol Rev 1999;51:691–743.
DuzgunesN,StraubingerRM,BaldwinPA,FriendDS,PapahadjopoulosD.Proton-induced fusion of oleic acid-phosphatidylethanolamineliposomes. Biochemistry 1985;24:3091–3098.
D€uzg€unes N, Bagatolli LA, Meers P, Oh YK, Straubinger RM. Fluores-cence methods in liposome research. In: Torchilin VP, Weissig V,(eds). Liposomes. New York: Oxford University Press; 2003. p.118–119.
Enden G, Schroeder A. Amathematical model of drug release from lipo-somes by low-frequency ultrasound. Ann Biomed Eng 2009;37:2640–2645.
Evjen TJ, Nilssen EA, R€ognvaldsson S, Brandl M, Fossheim SL. Dis-tearoylphosphatidylethanolamine-based liposomes for ultrasound-mediated drug delivery. Eur J Pharm Biopharm 2010;75:327–333.
Evjen TJ, Nilssen EA, Barnert S, Schubert R, Brandl M, Fossheim SL.Ultrasound-mediated destabilization and drug release from lipo-somes comprising dioleoylphosphatidylethanolamine. Eur J PharmSci 2011;42:380–386.
Guaman H, Nguyen D, Khan S, Prausnitz M. Ultrasound-mediateddisruption of cell membranes.I. Quantification of molecular uptakeand cell viability. J Acous Soc Am 2001;110:588–596.
Hagtvet E, Evjen TJ, Olsen DR, Fossheim SL, Nilssen EA. Ultrasound-enhanced antitumor activity of liposomal doxorubicin in mice.J Drug Target 2011;1:1–8.
Huang SL,MacDonald C. Acoustically active liposomes for drug encap-sulation and ultrasound-triggered release. Biochim Biopys Acta2004;1665:134–141.
Humphrey VF. Ultrasound and matter: Physical interactions. Prog Bio-phys Mol Biol 2007;93:195–211.
Husseini GA, Myrup GD, Pitt WG, Christensen DA, Rapoport NY.Factors affecting acoustically triggered release of drugs from poly-meric micelles. J Control Release 2000;69:43–52.
Kost J, Langer R. Responsive polymeric delivery systems. Adv DrugDeliv Rev 2001;46:125–148.
Lasic DD. Liposomes: From Physics to Applications. Amsterdam,London, New York, Tokyo: Elsevier; 1993.
Leighton TG. The acoustic bubble. London: Academic Press; 1994.Leighton TG, Phelps AD, Cox BT, Ho WL. Theory and preliminary
measurements of the Rayleigh-like collapse of a conical bubble.Acta Acoust 1998;84:801–814.
Leighton TG. What is ultrasound? Prog Biophs Mol Biol 2007;93:3–83.Lin HY, Thomas JL. PEG-lipids and oligo (ethylene glycol) surfactants
enhance the ultrasonic permeabilizability of liposomes. Langmuir2003;19:1098–1105.
Lin HY, Thomas JL. Factors affecting responsivity of unilamellarlipsomes to 20 kHz ultrasound. Langmuir 2004;20:6100–6106.
Liu J, Lewis TN, Prausnitz MR. Non-invasive assessment and control ofultrasound-mediated membrane permeabilzation. Pharm Res 1988;15:918–924.
Liu Y, Miyoshi H, Nakamura M. Encapsulated ultrasound microbub-bles: Therapeutic application in drug/gene delivery. J ControlRelease 2006;114:89–99.
Marin A, Muniruzzaman MD, Rapoport N. Acoustic activation of drugdelivery from polymeric micelles: Effect of pulsed ultrasound.J Control Release 2001b;71:239–249.

486 Ultrasound in Medicine and Biology Volume 38, Number 3, 2012
Mason TJ, Lorimer JP, Bates DM, Zhao Yl. Dosimetry in sonochemis-try: The use of aqueous terephthalate ion as a fluorescence monitor.Ultrason Sonochem 1994;1:91–95.
MillerMW,ChurchCC,BraymanAA,MalcuitMS,BoydRW.An expla-nation for the decrease in cell lysis in a rotating tube with increasingultrasound intensity. Ultrasound Med Biol 1989;15:67–72.
Miller MW, Miller DL, Brayman AA. A review of in vitro bioeffect ofinertial ultrasonic cavitation from a mechanistic perspective. Ultra-sound Med Biol 1996;22:1131–1154.
Miller DL. Overview of experimental studies of biological effects ofmedical ultrasound caused by gas activation and inertial cavitation.Prog Biophys Mol Biol 2007;93:314–330.
Myhr G, Moan J. Synergistic and tumour selective effects of chemo-therapy and ultrasound. Cancer Lett 2006;232:206–213.
Pangu GD, Davies KP, Bates FS, Hammer DA. Ultrasonically inducedrelease from nanosized polymer vesicles. Macromol Biosci 2010;10:546–554.
Pitt WG, Husseini GA, Staples BJ. Ultrasonic drug delivery: A generalreview. Expert Opin Drug Deliv 2004;1:37–56.
Pitt WG, Husseini GA, Roeder BL, Dickinson DJ, Warden DR,Hartley JM, Jones PW. Preliminary results of combininglow-frequency low-intensity ultrasound and liposomal drug deliveryto treat tumors in rats. J Nanosci Nanotechnol 2011;11:1866–1870.
Price RJ, Skyba DM, Kaul S, Skalak TC. Delivery of colloidal particlesand red blood cells to tissue through microvessel ruptures created bytargeted microbubble destruction with ultrasound. Circulation 1998;98:1264–1267.
Rapoport N. Physical stimuli-responsive polymeric micelles for anti-cancer drug delivery. Prog Polym Sci 2007;32:962–990.
Schroeder A, Avnir Y, Weisman S, Najajreh Y, Gabizon A, Talmon Y,Kost J, Barenholz Y. Controlling liposomal drug release with low-frequency ultrasound mechanism and feasibility. Langmuir 2007;23:4019–4025.
Schroeder A, Kost J, Barenholz Y. Ultrasound, liposomes, and drugdelivery: Principles for ultrasound to control the release of drugsfrom liposomes. Chem Phys Lipids 2009;162:1–16.
Somaglino L, Bouchoux G, Mestas JL, Lafon C. Validation of anacoustic cavitation dose with hydroxyl radical production generatedby inertial cavitation in pulsed mode: Application to in vitro drugrelease from liposomes. Ultrason Sonochem 2010;18:577–588.
Steinberg Y, Schroeder A, Talmon Y, Schmidt J, Khalfin RL, Cohen Y,Dvoissele JM, Begu S, Avnir D. Synergistic and tumour selectiveeffects of chemotherapy and ultrasound. Langmuir 2007;23:12024–12031.
Torchilin VP. Recent advances with liposomes as pharmaceuticalcarriers. Nat Review Drug Discov 2005;4:145–160.
Vaage J, Donovan D, Uster P, Working P. Tumour uptake of doxorubicinin polyethylene glycol-coated liposomes and therapeutic effectagainst a xenografted human pancreatic carcinoma. Br J Cancer1997;75:482–486.
Villeneuve L, Alberti L, Steghens JP, Lancelin JM, Mestas JL. Assay ofhydroxyl radicals generated by focused ultrasound. Ultrason Sono-chem 2009;16:339–344.
Yuan F, Leunig M, Huang SK, Berk DA, Papahadjopoulos D, Jain K.Microvascular permeability and interstitial penetration ofsterically-stabilized (Stealth) liposomes in a human tumor xeno-graft. Cancer Res 1994;54:3352–3356.
Young FR. Cavitation. London: Imperial College Press; 1999.