effect of rock types on polymer properties and incremental
TRANSCRIPT
Chair of Reservoir Engineering
Master's Thesis
Effect of Rock Types on Polymer Properties and
Incremental Oil Recovery from Polymer Flooding
Heba Eshawesh
September 2020

ii
Dispersion an
I dedicate this work to the memory of my father
My mother whom I owe everything I have accomplished to,
and my best friend, Aljali Albaden, who has supported me in making my dream a reality.
iii
I declare on oath that I wrote this thesis independently, did not use other than the specified
sources and aids, and did not otherwise use any unauthorized aids.
I declare that I have read, understood, and complied with the guidelines of the senate of the
Montanuniversität Leoben for "Good Scientific Practice".
Furthermore, I declare that the electronic and printed version of the submitted thesis are
identical, both, formally and with regard to content.
Date 23.07.2020
Signature Author
Heba, Eshawesh
AFFIDAVIT
iv
Acknowledgements
My deep thanks to OMV Exploration & Production GmbH, for their kind support and for
providing me with all the necessary hardware, software, and supervision.
I would like also to express my sincere thanks to Gisela Vanegas Cabas and Torsten Clemens
for their supervision, encouragement, and valuable directions throughout my research.
I would like to thank my university professor Holger Ott who agreed to supervise my thesis. And I
would like to also thank him for making this research enjoyable through his remarks.
My deep thank to all members of the Petroleum Engineering Department for their kind
academic contribution and support.
Finally, my biggest thanks go to my family for their endless support.

v
Abstract
The petroleum industry has shown an increasing interest over the last decade in chemically
enhancing the oil recovery in mature fields, especially polymer and alkali-surfactant-polymer
injection projects. In Austria, OMV Upstream is injecting polymers into the 8 Torton Horizon
and 9 Torton Horizon. Furthermore, an alkali-polymer injection project is planned for the 16
Torton Horizon (TH). These reservoirs consist of heterogeneous sandstones with different rock
types, having a different impact on the polymer project intended.
Polymer injection has been one of the most used Enhanced Oil Recovery (EOR) methods
implemented worldwide, due to its simplicity and efficiency. Several studies regarding the
physical properties of the polymer, such as polymer adsorption, Residual Resistance Factor
(RRF), and Inaccessible Pore Volume (IPV) and their impact on oil recovery, were conducted
and reported.
Nevertheless, the effect of rock types on polymer behavior and incremental oil recovery was
not covered; therefore, a simulation model was set to investigate the impact of having different
polymer properties per rock types.
A 2D reservoir model of the 16 TH was used to examine the impact of rock types on polymer
behavior and incremental oil production under uncertainty conditions. The variables used in the
investigation are RRF, IPV, and polymer adsorption, where the Latin hypercube sampling
model generated different variable points within a fixed variance.
Having different polymer physical properties depending on the rock type is shown to impact
the polymer performance, and therefore incremental oil production. The recovery factor
increased from 42.5% to almost 50% of IOIP in the numerical model based on 16 TH properties
by merely understanding the influence of each rock type on the polymer properties.
Hence, understanding the impact of having different rock types on polymer behavior would
correctly estimate the amount of oil that will be recovered by injecting polymer. This can be
achieved by either increasing the previous laboratory work to reduce the uncertainty or by
incorporating the full range of uncertainty, as shown in this work in reservoir simulation of all-
polymer pilot evaluations.
vi
Zusammenfassung
Die Erdölindustrie hat in den letzten zehn Jahren ein zunehmendes Interesse an einer
chemischen Verbesserung der Ölproduktion in alten Lagerstätten gezeigt, besonderes Interesse
gilt Projekten zur Injektion von Polymeren und Alkali-Surfactant-Polymeren. In Österreich
injiziert OMV Upstream Polymere in den 8. Torton Horizont und 9. Torton Horizont. Darüber
hinaus ist für den 16. Torton Horizont (TH) ein Alkali-Polymer-Injektionsprojekt geplant.
Diese Lagerstätten bestehen aus heterogenen Sandsteinen unterschiedlicher Gesteinsarten, die
sich unterschiedlich auf das beabsichtigte Polymerprojekt auswirken.
Die Polymerinjektion ist aufgrund ihrer Einfachheit und Effizienz eines der weltweit am
häufigsten verwendeten EOR-Verfahren (Enhanced Oil Recovery). Es wurden mehrere Studien
zu den physikalischen Eigenschaften der Polymere durchgeführt, wie z. B. Polymeradsorption,
Residual Resistance Factor (RRF) und unzugängliches Porenvolumen (IPV) und deren
Auswirkungen auf die Entölung. Der Einfluss von unterschiedlichen Gesteinsarten auf das
Polymerverhalten und die inkrementelle Ölproduktion wurde jedoch nicht abgedeckt. Daher
wurde ein Simulationsmodell erstellt, um die Auswirkungen unterschiedlicher Gesteinsarten zu
untersuchen.
Ein 2D-Reservoirmodell des 16. TH wurde verwendet, um den Einfluss von Gesteinsarten auf
Polymer und inkrementelles Öl unter unklaren Bedingungen zu untersuchen. Die in der
Untersuchung verwendeten Variablen sind RRF, IPV und Polymeradsorption, wo das Latin-
Hypercube-Stichprobeverfahren verschiedene variable Punkte innerhalb einer festen Varianz
erzeugt. Es kann gezeigt werden, dass unterschiedliche physikalische Eigenschaften des
Polymers in Abhängigkeit vom Gesteinstyp die Polymerleistung und damit die inkrementelle
Ölproduktion beeinflussen.
Die Entölung stieg im numerischen Modell basierend auf den Eigenschaften des16. TH von
42,5% auf fast 50% des IOIP, indem lediglich der Einfluss jedes Gesteinstyps auf die
Polymereigenschaften verstanden wurde. Ein Verständnis der Auswirkung unterschiedlicher
Gesteinsarten auf das Polymerverhalten würde daher verhindern, dass die Menge an Öl, die
durch Polymerinjektion zurückgewonnen wird, überschätzt oder unterschätzt wird. Dies kann
erreicht werden, indem entweder die vorherigen Laborarbeiten vermehrt werden, um die
Unsicherheit zu verringern, oder indem der gesamte Unsicherheitsbereich einbezogen wird, wie
es in dieser Abhandlung durch eine Lagerstättensimulation von Polymer- Pilotevaluierungen
gezeigt wird

vii
Table of Contents
Acknowledgements .............................................................................................................. iv
Abstract ................................................................................................................................ v
Zusammenfassung ............................................................................................................... vi
Chapter 1 ............................................................................................................................ 17
Introduction ........................................................................................................................ 17
1.1 Background Theory ............................................................................................. 17
1.2 Scope and Objectives ........................................................................................... 25
1.3 Findings .............................................................................................................. 26
1.4 Overview of Thesis .............................................................................................. 26
Chapter 2 ............................................................................................................................ 27
Literature Review ............................................................................................................... 27
Chapter 3 ............................................................................................................................ 31
Methodology ...................................................................................................................... 31
3.1 Model Description ............................................................................................... 32
3.2 Uncertainty Analysis ........................................................................................... 37
3.3 Base Case Description ......................................................................................... 40
Chapter 4 ............................................................................................................................ 41
Results and Discussion ........................................................................................................ 41
4.1 Basecase Results .................................................................................................. 44
4.2 Parametric Studies ............................................................................................... 45
4.3 Geological Configuration Investigation ................................................................ 57
Chapter 5 ............................................................................................................................ 61
Conclusion .......................................................................................................................... 61
5.1 Summary ............................................................................................................. 61
5.2 Future Work ........................................................................................................ 61
References .......................................................................................................................... 63


ix
List of Figures
Figure 1-Effect of EOR Operation on Oil Recovery ............................................................ 18 Figure 2 – Desaturation Curve ............................................................................................ 19
Figure 3-Improvement of Areal Sweep Efficiency caused by polymer flooding ................... 20
Figure 4 – Improvement of Vertical Sweep Efficiency Caused by Polymer Flooding ........... 20
Figure 5 – Schematic Diagram Representing the Presence of IPV ........................................ 21 Figure 6 – Schematic Diagram Illustrate Polymer Retention Mechanisms ............................ 22
Figure 7- Fractional Flow Curve ........................................................................................ 24
Figure 8- Saturation Profile ................................................................................................ 25 Figure 9 – 2D Reservoir Model ........................................................................................... 32
Figure 10 – Oil Properties as Function of Pressure .............................................................. 33
Figure 11-Permeability-Porosity Relationship ..................................................................... 34 Figure 12- Rock types grain size distribution ...................................................................... 34
Figure 13 – Porosity and Permeability Distribution in the Model for each Rock Type, Clean
Sandstone on top, Fine Sandstone in the middle and Silty Shale in Bottom .......................... 36
Figure 14-Latin Hypercube Theory ..................................................................................... 38 Figure 15- Effect of Describing the RRF for all RTs as one ................................................. 44
Figure 16- Effect of Describing the IPV for all RTs as one .................................................. 44
Figure 17- Effect of Describing the Polymer Adsorption Coefficient for all RTs as one ....... 45 Figure 18– Effect of varying RRF in different RTs on Incremental Oil Recovery. For the
sensitivity analysis, the non-varying RRF is fixed as 1.456 for all RTs ................................ 46
Figure 19- Sensitivity Analysis for RTS on RRF and Incremental Oil Recovery Difference from Basecase ............................................................................................................................. 48
Figure 20 – Effect of Varying IPV for Different RTs on Incremental Oil Recovery. For the
sensitivity analysis, the non-varying IPV for RT1 and RT2 is fixed as 0.2, for RT 3 is fixed as
0.25 .................................................................................................................................... 49 Figure 21- Sensitivity Analysis for RTs on IPV, and Incremental Oil Recovery Difference from
Basecase ............................................................................................................................. 50
Figure 22 - Effect of Maximum Polymer Adsorption on Incremental Oil Recovery ............. 51 Figure 23- Effect of Varying Maximum Adsorption and RRF RT1 on Incremental Oil Recovery
........................................................................................................................................... 54
Figure 24- Effect of Varying Maximum Adsorption and RRF RT2 on Incremental Oil Recovery
........................................................................................................................................... 54 Figure 25- Sensitivity Analysis for varying Maximum adsorption and RRF for RTs on
Incremental Oil Recovery ................................................................................................... 55
Figure 26- Effect of Varying Maximum Adsorption, RRF and IPV RT1 on Incremental Oil Recovery ............................................................................................................................ 56
Figure 27- Effect of Varying Maximum Adsorption, RRF and IPV RT2 on Incremental Oil
Recovery ............................................................................................................................ 56 Figure 28- Sensitivity Analysis for varying Maximum adsorption, RRF, and IPV for RTs on
Incremental Oil Recovery ................................................................................................... 57
Figure 29- Case 2 Geological Configuration ........................................................................ 58
Figure 30- Effect of RTs for Different Geological Configuration at Varied Adsorption vs.
RRF…………………………………………………………………………………………...59
Figure31- Effect of RTs for Different Geological Configuration at Varied Adsorption, RRF vs. IPV…59


xi
List of Tables
Table 1 – Rock and Fluid Properties .................................................................................... 32 Table 2 – Rock Type Description ........................................................................................ 35
Table 3 – Investigated Parameters and their Ranges ............................................................ 38


xiii
Nomenclature
Rf Recovery Factor [%]
Nc Capillary Number [-]
v Fluid velocity [m/s]
μ Fluid viscosity [cP]
𝜎 Interfacial tension [N/m]
ED Microscopic (Displacement) sweep efficiency [fraction]
ES Macroscopic (Volumetric) sweep efficiency [fraction]
EA Areal sweep efficiency [fraction]
EV Vertical sweep efficiency [fraction]
M Mobility ratio [-]
𝛌 Fluid mobility [mD/cP]
k Absolute permeability mD
kr Relative permeability mD
kref Reference permeability mD
∅𝑧 Normalized porosity [-]
∅𝐼𝑃𝑉 Inaccessible pore space [-]
Cp Polymer Adsorption concentration [-]
a,b Adsorption coefficient
𝑓𝑤 Water fractional flow [-]


xv
Abbreviations
EOR Enhanced Oil Recovery
EMV Expected Monetary Value
FZI Flow Zone Indicator
IOR Improved Oil Recovery
IPV Inaccessible Pore Volume
IOIP Initial Oil In Place
RF Recovery Factor
RRF Residual Resistance Factor
ROS Residual Oil Saturation
RQI Reservoir Quality Index
TH Torton Horizon


17 Introduction
Chapter 1
Introduction
Different Enhanced Oil Recovery (EOR) techniques has been implemented in the last few
decades, with the target of increasing the amount of oil recovered from the fields. Applying the
precise EOR technique for the reservoir could lead to an increase in total recovery factor up to
30% to 60% of the IOIP (Energy, 2020). The exploitation of new oil fields is becoming more
challenging nowadays with the current economy; therefore, the focus is on further developing
the existent mature fields that are not yet fully depleted.
Applying polymer flooding as a tertiary recovery mechanism post waterflooding will
substantially boost the oil recovery. The main reason for associating polymer with water
flooding projects is to increase the injected fluid viscosity and improving the macroscopic
sweep efficiency, decrease the water cut, and increase the oil cut. The mechanisms responsible
for the additional recovery are explained in 1.1.
1.1 Background Theory
1.1.1 The Principle of Polymer Flooding
Enhanced Oil Recovery processes are responsible for more than 3% of world oil production
(J.J Taber, 1997), it is known to be the most implemented chemical EOR process.
Polymer injection can be used as an advanced secondary or tertiary recovery technique to
prolong the life of a depleted field (J.J Taber, 1997), with an average polymer flood incremental
oil recovery of 8% and 1.8% of the IOIP, respectively (Riley B. Needham, 1987). As can be
seen in Figure 1, implementing EOR can increase the amount of oil recovered significantly.

18 Introduction
Figure 1-Effect of EOR Operation on Oil Recovery (Sorbie, 1991)
The time-scale of polymer implementation is highly dependent on reservoir conditions and
characteristics (J.J Taber, 1997). And when the water flooding is no longer efficient due to
high-water production and low oil recovery (Sorbie, 1991).
The success of polymer flooding or any other EOR process can be determined by the amount
of additional oil that has been recovered post the initiation of EOR operations (Lake, 1989).
Oil recovered post-EOR is the oil that has been bypassed during the water flooding or trapped
by capillary trapping. Trapped oil is immobilized oil due to the capillary forces and is referred
to as the residual oil (Lake, 1989).
In order to remobilize the residual oil in the reservoir, the viscous forces must overcome the
capillary forces. The relationship between the two forces are linked together using the Capillary
Number, NC:
𝑁𝐶 =𝑣𝜇
𝜎
The viscous/capillary forces relationship can be graphically described using the Desaturation
Curve, see Figure 2. The figure shows the magnitude of the critical capillary number that needs
to be decreased to remobilize the residual oil.

19 Introduction
Figure 2 – Desaturation Curve (Mohd Shahid M. Shaharudin, 2013)
The capillary number of waterflooding process is around 10-6; additives are needed to reduce
the values and increase the recovery (Lake, 1989). The most used chemicals in the industry to
lower the capillary number are polymers and surfactants. The surfactant has much more
influence on reducing the capillary number by decreasing the interfacial tension, than polymer
by simply increasing the viscosity.
Hence, the polymer is only used to recover the oil that has been bypassed by the flooded water
(Lake, 1989) (Riley B. Needham, 1987) (Littmann, 1988). By recovering the bypassed oil, the
macroscopic (volumetric) sweep efficiency Es increases, and consequently, the recovery factor
Rf.
The recovery factor is defined as the ratio of the cumulative oil produced to the initial oil in
place, and in this context is the product of the microscopic (Displacement) sweep efficiency ED
and the macroscopic (Volumetric) sweep efficiency Es (Ahmed, 2019)
𝑅𝑓 = 𝐸𝐷 ∗ 𝐸𝑠
The microscopic (Displacement) sweep efficiency is defined as the portion of oil recovered to
the volume of oil that has been contacted by the displacing fluid (Ahmed, 2019) (Lake, 1989),
and it is expressed as follows:
𝐸𝐷 =𝑂𝑖𝑙 𝑑𝑖𝑠𝑝𝑙𝑎𝑐𝑒𝑑
𝑣𝑜𝑙𝑢𝑚𝑒 𝑜𝑓 𝑜𝑖𝑙 𝑐𝑜𝑛𝑡𝑎𝑐𝑡𝑒𝑑 𝑏𝑦 𝑑𝑖𝑠𝑝𝑙𝑎𝑐𝑖𝑛𝑔 𝑓𝑙𝑢𝑖𝑑
The macroscopic (Volumetric) sweep efficiency is defined as the volume of the oil that has
been contacted by the displacing fluid to the OIIP, and in this context can also be defined as the
product of the areal sweep efficiency EA and the vertical sweep efficiency Ev (Ahmed, 2019)
(Lake, 1989)
𝐸𝑠 =𝑉𝑜𝑙𝑢𝑚𝑒 𝑜𝑓 𝑜𝑖𝑙 𝑐𝑜𝑛𝑡𝑎𝑡𝑐𝑒𝑑 𝑏𝑦 𝑑𝑖𝑠𝑝𝑙𝑎𝑐𝑖𝑛𝑔 𝑓𝑙𝑢𝑖𝑑
𝐼𝑂𝐼𝑃

20 Introduction
𝐸𝑠 = 𝐸𝐴 ∗ 𝐸𝑉
The areal sweep efficiency is defined as the ratio between the area contacted by the displacing
fluid to the total area. Figure 3 shows the improvement in the areal sweep from a to b, this
achievement has been by the polymer flooding (Sorbie, 1991).
Figure 3-Improvement of Areal Sweep Efficiency caused by polymer flooding (Sorbie, 1991)
The vertical sweep efficiency is defined as the vertical cross-sectional area that has been
contacted by the displacing fluid to the total cross-sectional area (Ahmed, 2019) (Lake, 1989).
The improve in sweep efficiency is illustrated in Figure 4.
Figure 4 – Improvement of Vertical Sweep Efficiency Caused by Polymer Flooding (Sorbie,
1991)
The macroscopic displacement is improved into more piston-like displacement by controlling
the injected fluid mobility, and the polymer is considered to be the perfect candidate for such
an application.

21 Introduction
Ultimately polymer flooding is used for mobility control, which can be simply described as
controlling the rates at which the displacing and displaced fluids move in the reservoir (Don
W. Green, 1998) by increasing the viscosity of displacing fluid by adding water-soluble
polymer.
The mobility ratio is defined as:
𝑀 =𝜆𝐷𝑖𝑠𝑝𝑙𝑎𝑐𝑖𝑛𝑔 𝐹𝑙𝑢𝑖𝑑
𝜆𝐷𝑖𝑠𝑝𝑙𝑎𝑐𝑒𝑑 𝐹𝑙𝑢𝑖𝑑
Where
𝜆 =𝐾𝑟
𝜇
The improvement in oil recovery using polymer can be mathematically described and
quantified using fractional flow theory, as described in 1.1.3.
1.1.2 Physics of Polymer Flooding
1. Inaccessible Pore Volume (IPV)
Not all pore space is accessible to the polymer solution, due their relatively large molecules.
The pore space that is not contacted by polymer is called inaccessible pore volume as shown in
Figure 5. (Lake, 1989) (Sheng, 2013)
Figure 5 – Schematic Diagram Representing the Presence of IPV (Saeed Akbari, 2019)
Therefore, a portion of the oil in the reservoir is not going to be contacted by the polymer
therefore it will not be recovered. As the IPV increases the polymer solution velocity increases,
leading to an earlier arrival of the polymer, and consequently the oil.
On the other hand, the polymer might be delayed as a result of polymer adsorption. Therefore,
the two phenomena are counterattacking each other with IPV having the most effect (Littmann,
1988) (Lake, 1989) (Sheng, 2013).

22 Introduction
The amount of pore space invaded is dependent on polymer molecules, porosity, permeability,
pore size distribution, and rock type, where IPV ranges from 1% to 30% (Littmann, 1988). IPV
is typically assumed to be constant in the entire reservoir.
𝛷𝐼𝑃𝑉 = (1 − 𝐼𝑃𝑉)𝛷
2. Polymer Retention
Polymer retention can be simply described as the process of removing the polymer from the
flooded aqueous phase (Sorbie, 1991) (Lake, 1989).
Polymer retention mechanisms are (Figure 6):
1. Hydrodynamic retention
2. Mechanical entrapment
3. Adsorption
Hydrodynamic retention is rate-dependent phenomena; nonetheless, it is neither well defined
nor understood, and its contribution to the overall polymer retention is considered to be
neglected in field-scale implementation (Don W. Green, 1998) (Sorbie, 1991).
Mechanical entrapment is a more probable accruing mechanism, especially in relatively low
permeable formation. Mechanical entrapment occurs when the large polymer molecules get
blocked in narrow pore throats. Nevertheless, optimizing the size of the molecules or changing
the type of polymer will reduce the retention caused by the mechanical entrapment with
maintaining the targeted properties (Don W. Green, 1998) (Sorbie, 1991).
Figure 6 – Schematic Diagram Illustrate Polymer Retention Mechanisms (Saeed Akbari,
2019)
23 Introduction
Adsorption is the most crucial mechanism when it comes to polymer retention, and it cannot be
avoided even by choosing a different kind of polymer. Adsorption illustrates the interaction
between the polymer molecules and the rock surface; the interaction causes the polymer
molecules to attach to the solid surface (Don W. Green, 1998) (Lake, 1989) (Sorbie, 1991).
Polymer adsorption can be described using Langmuir-type isothermal:
𝐶𝑝 =𝑎𝐶
1 + 𝑏𝐶
Where Cp is the amount of polymer adsorbed, a and b are empirical adsorption coefficients, and
C is the polymer concentration in the aqueous phase. a is calculated as a function of water
salinity, average permeability, and the reference permeability.
𝑎 = (𝑎1 + 𝑎2𝐶𝑆𝐸)(𝑘𝑟𝑒𝑓
𝑘)0.5
Where a1 and a2 are input parameters, 𝐶𝑆𝐸 is the effective aqueous salinity, k is the permeability,
and kref is the reference rock permeability.
3. Permeability Reduction
The adsorbed polymer will cause permeability to reduce (Lake, 1989). Permeability reduction
is defined using the Permeability Reduction Factor or also known as Resistance Factor (Lake,
1989) (Sheng, 2013):
𝑅𝐹 =𝑃𝑒𝑟𝑚𝑒𝑎𝑏𝑖𝑙𝑖𝑡𝑦 𝑜𝑓 𝑟𝑜𝑐𝑘 𝑤ℎ𝑒𝑛 𝑤𝑎𝑡𝑒𝑟 𝑓𝑙𝑜𝑤𝑠, 𝐾𝑤
𝑃𝑒𝑟𝑚𝑒𝑎𝑏𝑖𝑙𝑖𝑡𝑦 𝑜𝑓 𝑟𝑜𝑐𝑘 𝑤ℎ𝑒𝑛 𝑝𝑜𝑙𝑦𝑚𝑒𝑟 𝑠𝑜𝑙𝑢𝑡𝑖𝑜𝑛 𝑓𝑙𝑜𝑤𝑠, 𝐾𝑝
Blocking the pores and reducing the permeability is a relatively irreversible process, even with
post water flooding. The permeability reduction then will be defined using the Residual
Permeability Reduction Factor, also referred to as Residual Resistance Factor:
𝑅𝑅𝐹 =𝑃𝑒𝑟𝑚𝑒𝑎𝑏𝑖𝑙𝑖𝑡𝑦 𝑜𝑓 𝑟𝑜𝑐𝑘 𝑡𝑜 𝑤𝑎𝑡𝑒𝑟 𝑝𝑟𝑖𝑜𝑟 𝑝𝑜𝑙𝑦𝑚𝑒𝑟 𝑓𝑙𝑜𝑜𝑑
𝑃𝑒𝑟𝑚𝑒𝑎𝑏𝑖𝑙𝑖𝑡𝑦 𝑜𝑓 𝑟𝑜𝑐𝑘 𝑡𝑜 𝑤𝑎𝑡𝑒𝑟 𝑝𝑜𝑠𝑡 𝑝𝑜𝑙𝑦𝑚𝑒𝑟 𝑓𝑙𝑜𝑜𝑑
1.1.3 Fractional Flow Theory
Buckley and Leverett were the first to develop a model for a one-dimensional displacement of
oil by water under the assumptions of no mass transfer and incompressible flow.
However, a more complex representation of the fractional flow curve is used in polymer
flooding to account for IPV and polymer retention (Pope, 1980); since they are considered to
affect the polymer transport in porous media the most (Lake, 1989).
To obtain a simple mathematical and graphical solution for the continuity equation in the
presence of polymer, several assumptions were made (Pope, 1980):

24 Introduction
1. 1D flow in a homogenous, isotropic and isothermal reservoir
2. Three components and 2 phases are flowing
3. Incompressible fluids
4. Gravity, capillarity, and dispersion are negligible
5. Darcy’s law is applicable
6. Continuous injection of constant composition
The fractional flow curve can be constructed using the following equation:
𝑓𝑤 =1
1 +1𝑀
Polymer flooding is usually associated with waterflooding projects; therefore, two fractional
flow curves are typically constructed to determine the overall recovery. One curve would
account for the water-oil flow and the other for polymer-oil flow, as seen in Figure 7.
Increasing the injected fluid viscosity will shift the fractional flow to the left, permitting
additional oil to be recovered; however, the velocity at which the polymer solution will flow in
porous media is dependent on IPV and polymer retention.
The presence of IPV will lead to faster polymer propagation in the reservoir since the water
velocity is the same as the polymer. IPV will account for positive retention governing a faster
movement to the polymer and shifting its velocity to the right with a higher slope.
As the effect of polymer retention is much stronger than the IPV effect, the polymer front would
have a lower slope than the injected water, and a delay in the front is indicated, as seen in Figure
7.
Figure 7- Fractional Flow Curve (Lake, 1989)

25 Introduction
The saturation profile is constructed for the recovery, as seen in Figure 8. The saturation profile
is illustrating the amount of oil bank formed and displaced by the polymer. A shock front along
the polymer-oil fractional flow curve forms the oil bank where its amount will depend on the
polymer velocity (IPV and polymer retention). The second front formed would be an indifferent
front where the polymer is displacing the oil (Lake, 1989).
Figure 8- Saturation Profile (Lake, 1989)
1.2 Scope and Objectives
Maximizing the recovery factor of oil fields has been the aim of the industry since almost all
large fields worldwide are mature. Due to the simplicity of polymer implementation in the
reservoir, it became one of the most used chemical enhanced recovery methods.
OMV, in the last decade, has focused on how to improve polymer flooding to achieve higher
oil recovery from its mature assets. Several studies have been conducted by OMV to understand
the polymer behavior in core scale and field scale.
Starting with the effect of heterogeneity and polymer rheology on sweep efficiency (Ajana
Laoroongroj, 2014). Forecasting the behavior of oil recovery under geological uncertainties
(Maria-Magdalena Chiotoroiu, 2016) and establishing guidelines to assess the feasibility of
polymer flooding projects (Martin Sieberer, 2016) all studies were conducted on the 8 TH
reservoir of the Matzen field in Austria. Improving the understanding of the polymer physical
processes would help in making better decisions on reservoir re-development and increase the
EMV of these developments accordingly.
One of the aspects of polymer flooding that is yet to be understood is the impact of rock types
on polymer and relative permeability parameters on incremental oil production, which is the
scope of this work.

26 Introduction
1.3 Findings
Polymer properties are sensitive to reservoir heterogeneity, thus the oil recovery. Before, the
heterogeneity effect on polymer flooding had been explored by better describing the reservoir
geology but with common polymer parameters. This study has shown that there is a high
sensitivity to different rock types descriptions and their impact on oil recovery. When rock
types exhibit different RRF, IPV, and polymer adsorption values, different oil recovery is
reached. In other words, keeping these values constant for all rock types will lead in some cases
to overestimating or underestimating the amount of oil recovered. However, no general trend
for the effect of RRF, IPV, or polymer adsorption on oil recovery could be found, mainly
because understanding the effect of each parameter is a very complex process since the
parameters are dependent on the other as explained in section 1.1.2.
1.4 Overview of Thesis
The impact of the polymer physical behavior on rock quality variation has been poorly
investigated over the years. The focus in previous studies was put on the understanding of each
phenomena’s impact on oil recovery. Chapter 2 summarizes the studies conducted to evaluate
the effect of polymer physical properties on oil recovery.
Chapter 3 is discussing the approach used to investigate the effect of different polymer
properties per rock types and the model used for the investigation.
Chapter 4 is discussing the results obtained on individual parameter alteration and also on the
studied dependencies. All results are compared with a base case that is representative of the
simulation approach used until now. The base case, therefore, uses common values for the
investigated parameters for all rock types on a heterogeneous model.
27 Literature Review
Chapter 2
Literature Review
The use of polymer-augmented waterflood has proven to be an effective approach to improve
the oil recovery and reduce the amount of injection water needed. Evaluating the applicability
of polymer flood projects is dependent on several factors, such as displaced fluid viscosity,
reservoir heterogeneity, flow rates, polymer-rock-reservoir fluid compatibility, etc.
Understanding the parameters mentioned above requires a comprehensive reservoir
characterization and simulation, laboratory experiments, and field testing in order to be able to
proceed to the polymer design stage. (R.D.Kaminsky, 2007).
Polymer injection has been successfully applied in many projects since the 1980s, with an
estimated recovery of ~ 5% of IOIP. Further understanding of the polymer behavior due to the
extensive implementation of polymer projects increased the recovery to range from 11% to
30% of IOIP (J.J.Taber, 1997).
China has reported many successful polymer projects over the years, with average oil recovery
being 8.9% of IOIP. One of the projects was Xiaerman Field, a very heterogeneous reservoir
with a complex structure. The incremental oil recovery with polymer injection increased to
10% of the original oil in place (Sheng, 2013).
Daqing Field is another successful polymer experience. High molecular weight polymers were
injected with a high concentration in January 2009 to increase the incremental oil recovery to
more than 10% of IOIP (Sheng, 2013).

28 Literature Review
To ensure successful polymer flooding projects; certain technical screening criteria have to be
met. One of the essential design factors is the oil viscosity, where polymer projects are
preferable to be used in reservoirs with oil viscosity ranging between 10 to 100 cP (J.J Taber,
1997). The oil viscosity in fields with ongoing polymer flood projects did not exceed 80 cP
(J.J.Taber, 1997). Therefore, the ability of polymer implementation in highly viscous reservoirs
is considered to be questionable.
However, a successful polymer flood implementation in Pelican lake Field in Alberta, Canada,
changed the previous concept of the viscosity limitation in polymer projects. The reservoir was
first discovered in 1978 with an IOIP ~ 6 billion barrels and a primary recovery of less than 7%
of IOIP (Wilson, 2015).
Due to the low reservoir energy and high oil viscosity (ranges between 1000 to 2500 cP), an
additional recovery technique was needed to increase the oil recovery. Polymer injection was
first used as an EOR technique, but due to the thin reservoir section and the high viscous oil,
the project was a failure. A solution to further increasing the injected polymer viscosity was
implemented, but it failed as a lot of injectivity problems were recognized (Wilson, 2015).
Horizontal wells were used to inject the polymer solving the issues that occurred at first and
boosted the recovery to more than 25% (Wilson, 2015).
Polymer flooding-horizontal wells combination were again seen successful in two other viscous
fields like East Bodo Reservoir in Canada and Tambaredjo Field in Suriname, where both
experienced an improvement in the injectivity and additional oil recovery.
The successful implementation of polymer in the previous fields is based on understanding the
mechanisms of mobility reduction, where comprehensive laboratory studies, simulation
studies, and field pilots were required to characterize the physical behavior of polymer
accurately.
The amount of polymer retained in the reservoir determines the rate of polymer propagation;
thus, the success of the project (R.N Manichand, 2014).
Adsorbed polymer accounts for about 35% of the total polymer retention (Yoram Cohen, 1986);
however, the percentage varies depending on several factors such as the rock type, the type of
polymer used, and the injection flow rate (Maerker, 1973).
Permeability is another factor influencing the polymer adsorption. Generally, the permeability
of more than 500 mD will not lead to polymer adsorption, since the adsorbed polymer is
inversely proportional to permeability (R.N Manichand, 2014).
The influence of residual oil saturation (ROS) on polymer adsorption is still debatable; where
some might argue the presence of ROS decreases the adsorption to half (D.S. Hughes, 1990)

29 Literature Review
(C. Huh, 1990), others contradict the relation. Fully characterizing the polymer behavior in the
reservoir is still a working process, since, with each new project, further understanding is
obtained.
Besides understanding the dependent factors, accurately quantifying, and indicating the
presence or the lack of adsorption is needed. Numerous approaches have been used to quantify
the amount of polymer adsorbed, either by mass balancing the injected polymer or by simply
exposing the polymer solution to the reservoir rock and measuring the amount adsorbed. Each
of the approaches has its limitation and advantages.
As a result of polymer being adsorbed to the rock surface, a delay of polymer propagation in
the reservoir will be seen and compensated by IPV.
It has been noted that polymer molecules propagate faster than salt in the solution (Lantz, 1972).
The large polymer molecules govern the rapid propagation compared to the small molecules of
salt or even polymer (Qingong He, 1990).
IPV is still a not well-understood phenomenon; some might argue that the pores are not wide
enough to allow the entry of polymer molecules (Lantz, 1972). But that would not be the case
for moderate to high permeable formations, where the pores and the pore throats are considered
to be large enough to permit the polymer flow unless clay is present.
But it is still not a well-supported hypothesis; hydrodynamic exclusion is another theory used
in the industry to explain IPV (Sorbie, 1991). Hydrodynamic exclusion or depletion layer is
described, such as if the polymer does not adsorb on the rock surface, then the large polymer
molecules cannot get close either to the pores or the rock surface. Keeping the flow of polymer
molecules concentrated on the center, then no polymer will be able to get close to hydrocarbon
filled pores. However, IPV resulted from hydrodynamic exclusion cannot exceed 9% (W.C.
Liauh, 1979).
But still, all previously mentioned theories are theories, and there is no substantial evidence
that proves one over the other. Based on the arguments, the IPV should be proportional to
permeability. However, the values that are reported in the literature contradict that assumption.
A ~ 500 mD sandstone and ~ 2 Darcy found to experience the same IPV, and this can be
explained by different rock types (Lantz, 1972).
Although the justifications behind IPV are yet not well understood, its effect is. Polymer
molecules will propagate faster in porous media as IPV increases and counteract the impact of
the polymer retained. Hence to recover the inaccessible hydrocarbon, other chemical EOR
processes are used, such as Surfactant-Polymer injection or Alkali-Surfactant-Polymer
injection.

30 Literature Review
Another polymer adsorption related to physical phenomena is permeability reduction. Where it
is expressed in terms of RF and RRF, RRF is considered another mobility control criteria in
polymer projects.
Polymer velocity and concentration are main driven parameters to a favorable RRF, where it
has been found that optimizing the polymer concentration would lead to a substantial increase
in RRF (Shi Leiting, 2010).
An increase in RRF would lead to an increase in the incremental oil recovery as a result of
permeability reduction and improving the mobility control; doubling the RRF from 3 to 6
increased the incremental oil recovery by 4.5 times according to (Shi Leiting, 2010) in a
relatively heavy oil reservoir.
Heterogeneity in permeability is another huge contributor to adsorption. As the permeability
decreases the possibility of polymer adsorbing on the rock surface increases, resulting in
blocking the pore throat, reducing the flow channels and increasing the RRF values (Byungin
Choi, 2015).
Low permeable formation results in high RRF and crossflow of polymer into the more
permeable formation, the opposite would happen in high permeable formations.

31 Methodology
Chapter 3
Methodology
The successful implementation of a polymer injection project requires an extensive
understanding of its physics. As mentioned above, the effect of different rock types (RT) that
are usually present in an oil reservoir on polymer properties is yet to be investigated.
In order to accomplish a reliable oil recovery forecast during a polymer project, a
comprehensive workflow that accounts for the effect of different rock types was followed as
shown:
The analysis started with a cross-section model of the representative reservoir; the model was
provided by OMV. A detailed description of the reservoir, its rock properties, and fluid are
shown in the next section.
The rock type-dependent parameters that were investigated are listed as follows:
Base case definition: no rock types distinction
Analyze the individual impact of polymer properties described per RT in the oil recovery
Base case definition: no rock types distinction
Analyze the individual impact of polymer properties described per RT in the oil recovery
•Account for the interaction of the polymer parameters•Analyze the combinedimpact of polymer properties described per RT in the oil recovery
•Account for the interaction of the polymer parameters•Analyze the combinedimpact of polymer properties described per RT in the oil recovery
•Repeat previous steps on a different geological set up
•Comparison with previous results
•Repeat previous steps on a different geological set up
•Comparison with previous results
•Evaluate the existence of general trends
•Draw conclusions
•Evaluate the existence of general trends
•Draw conclusions

32 Methodology
1. Permeability Reduction in terms of RRF
2. Inaccessible Pore Volume
3. Polymer Adsorption
The effect of each variable was analyzed independently and combined using the tNavigator
uncertainty analysis tool.
For further elaboration of the workflow, see the next sections.
3.1 Model Description
To investigate the effect of rock dependent polymer properties on incremental oil recovery, a
2D reservoir model is provided by OMV, as seen in Figure 9. The model properties are based
on Matzen field, 16 Tortonian Horizon reservoir.
Figure 9 – 2D Reservoir Model
The reservoir model consists of three different rock types extended over a distance of 146 m
between an injector (BO119) and a producer (BO98) and a thickness of almost 55m; it is
discretized into 5200 active cells (26*1*200).
The general reservoir and fluid properties are summarized in Table 1.
Table 1 – Rock and Fluid Properties
Reservoir Pressure, bar 144
Bubble Point Pressure, bar 10
Dissolved Gas, sm3/sm3 3.58
Oil Gravity, API 30.3
33 Methodology
Rock Compressibility, bar-1 1.60428E-05
Water Compressibility, bar-1 4,2912E-05
Water Formation Volume Factor, rm3/sm3 1.0064
Water Viscosity, cP 0.42135
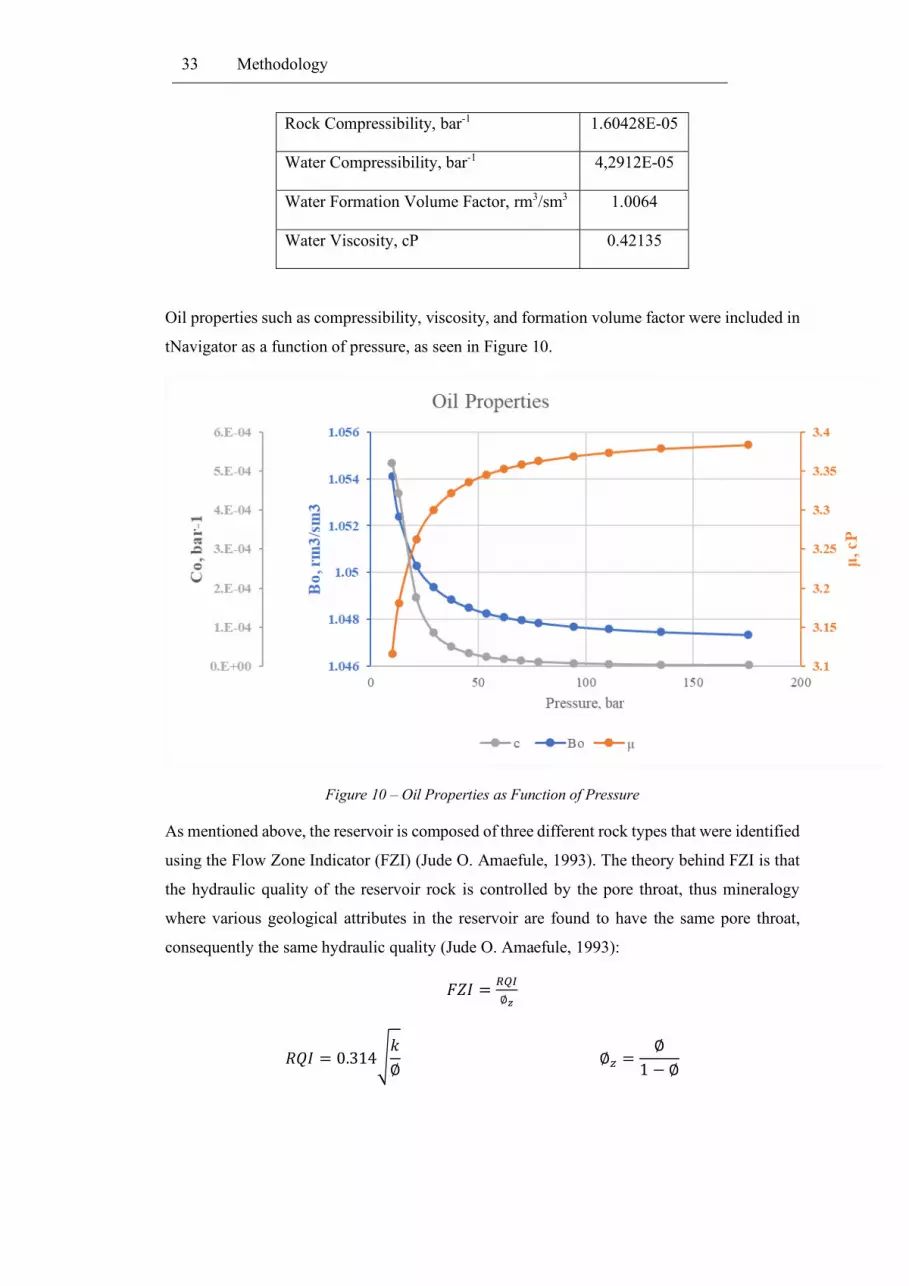
Oil properties such as compressibility, viscosity, and formation volume factor were included in
tNavigator as a function of pressure, as seen in Figure 10.
Figure 10 – Oil Properties as Function of Pressure
As mentioned above, the reservoir is composed of three different rock types that were identified
using the Flow Zone Indicator (FZI) (Jude O. Amaefule, 1993). The theory behind FZI is that
the hydraulic quality of the reservoir rock is controlled by the pore throat, thus mineralogy
where various geological attributes in the reservoir are found to have the same pore throat,
consequently the same hydraulic quality (Jude O. Amaefule, 1993):
𝐹𝑍𝐼 =𝑅𝑄𝐼
∅𝑧
𝑅𝑄𝐼 = 0.314√𝑘
∅ ∅𝑧 =
∅
1 − ∅
34 Methodology
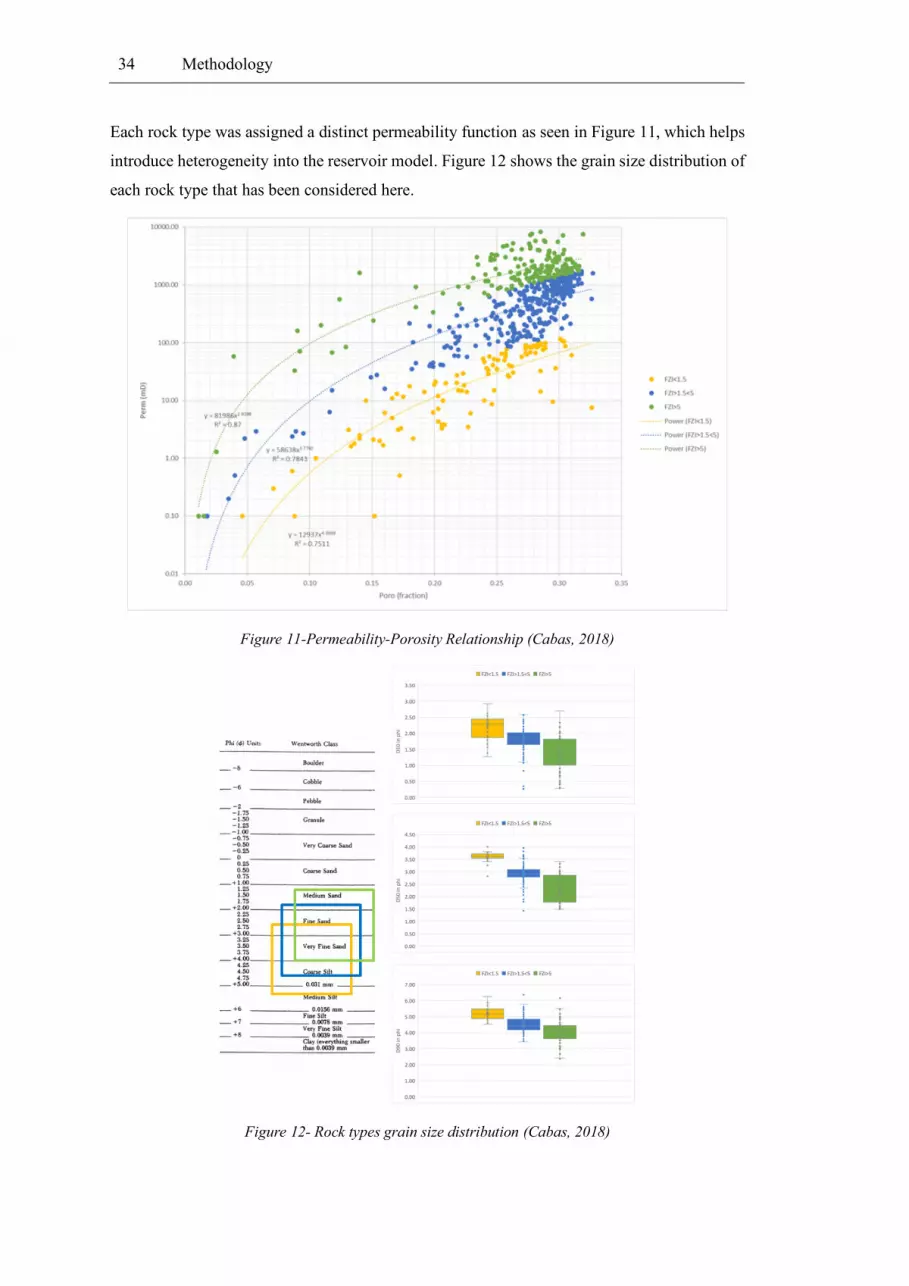
Each rock type was assigned a distinct permeability function as seen in Figure 11, which helps
introduce heterogeneity into the reservoir model. Figure 12 shows the grain size distribution of
each rock type that has been considered here.
Figure 11-Permeability-Porosity Relationship (Cabas, 2018)
Figure 12- Rock types grain size distribution (Cabas, 2018)

35 Methodology
The variation of permeability and porosity between the rocks has fulfilled the scope of the
project, see Figure 13. Following a description of each rock type is given in Table 2:
Table 2 – Rock Type Description
Clean Sandstone Fine Sandstone Silty Shale
Rock Type 1 2 3
Region 1 2 3
Average Porosity, % 31 26 12
Average permeability, mD 2650 360 1.2
Thickness, m ~ 15 ~ 30 ~ 7
Oil In Place IOIP, sm3 421.92 704.73 217.1
Oil Recovered during Waterflooding, sm3 310.87 186.62 1.33
Dissolved Gas In Place, sm3 1497.2 2517.2 776.55
The simulation timeframe is set to start production using waterflooding for five years. Two
tracers during that duration are injected, first at the beginning of the simulation for a month and
the second 2 years later for a month duration.
The polymer injection starts five years later, for one whole year, followed by five years of water
injection. The injection rate is assigned to replace the gross amount produced, which is 1.44
sm3/day.
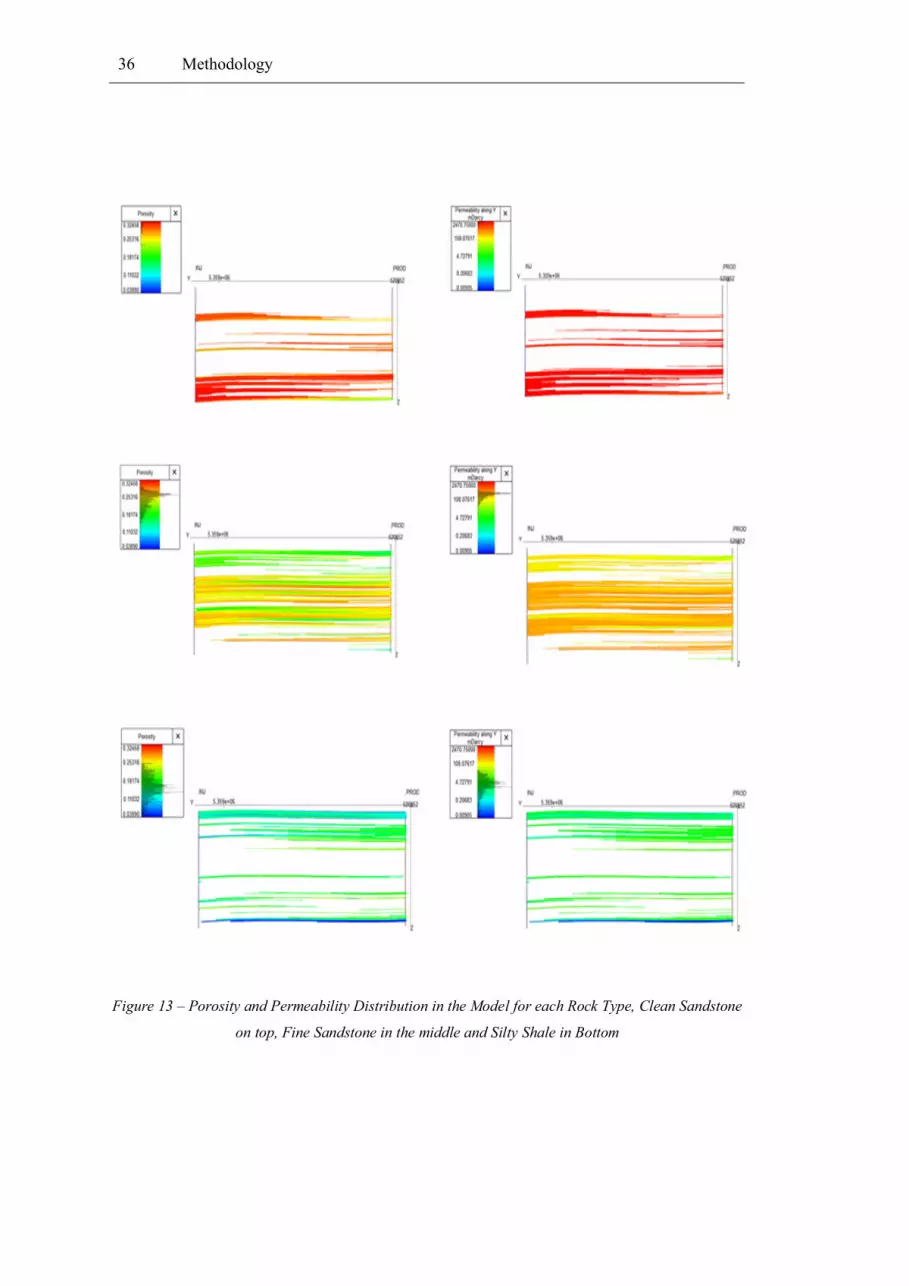
36 Methodology
Figure 13 – Porosity and Permeability Distribution in the Model for each Rock Type, Clean Sandstone
on top, Fine Sandstone in the middle and Silty Shale in Bottom

37 Methodology
3.2 Uncertainty Analysis
The scope of the project is to investigate the effect of describing IPV, RRF, and adsorption per
each rock and analyze their impact on oil recovery. To do so, tNavigator Assisted History
Matching AHM and Uncertainty tool was used.
To start with the sensitivity analysis, an understanding of Design Of Experiments DOE is
required. DOE is aimed at describing and explaining the diversity of information under
conditions that are assumed to reflect variance.
The objective here is to determine the relationship between the investigated factors (polymer
properties per rock type) affecting the process and the output of the process (incremental oil
recovery).
The analysis is done based on the hypothesis test theory to determine the most influenced
factors using statistical methods (Latin Hypercube sampling is chosen as seen below).
Two possibilities for the hypothesis theory are presented, the null hypothesis which is what has
been done for the last decade by describing the polymer properties for all rock types as one and
its impact on the incremental oil recovery. The second hypothesis is the alternative hypothesis,
which is investigated in this study: the objective here is to investigate the impact of having
different rock types uniquely described by polymer properties, on the incremental oil recovery.
The DOE workflow is shown next, followed by a detailed description of the work done.
Using the workflow as a guideline, the following steps were followed:
Describe
•Goals
•Constants
•Variables
Specify
•Statistical Model
Design
•Max/Min
•Number of Variants
Analyze
•Results Analysis
38 Methodology
• Describing the goal needed to be achieved by the project, which is fully understanding
polymer behavior under the mentioned conditions. The studied parameters were chosen
to be IPV, RRF, and adsorption tables.
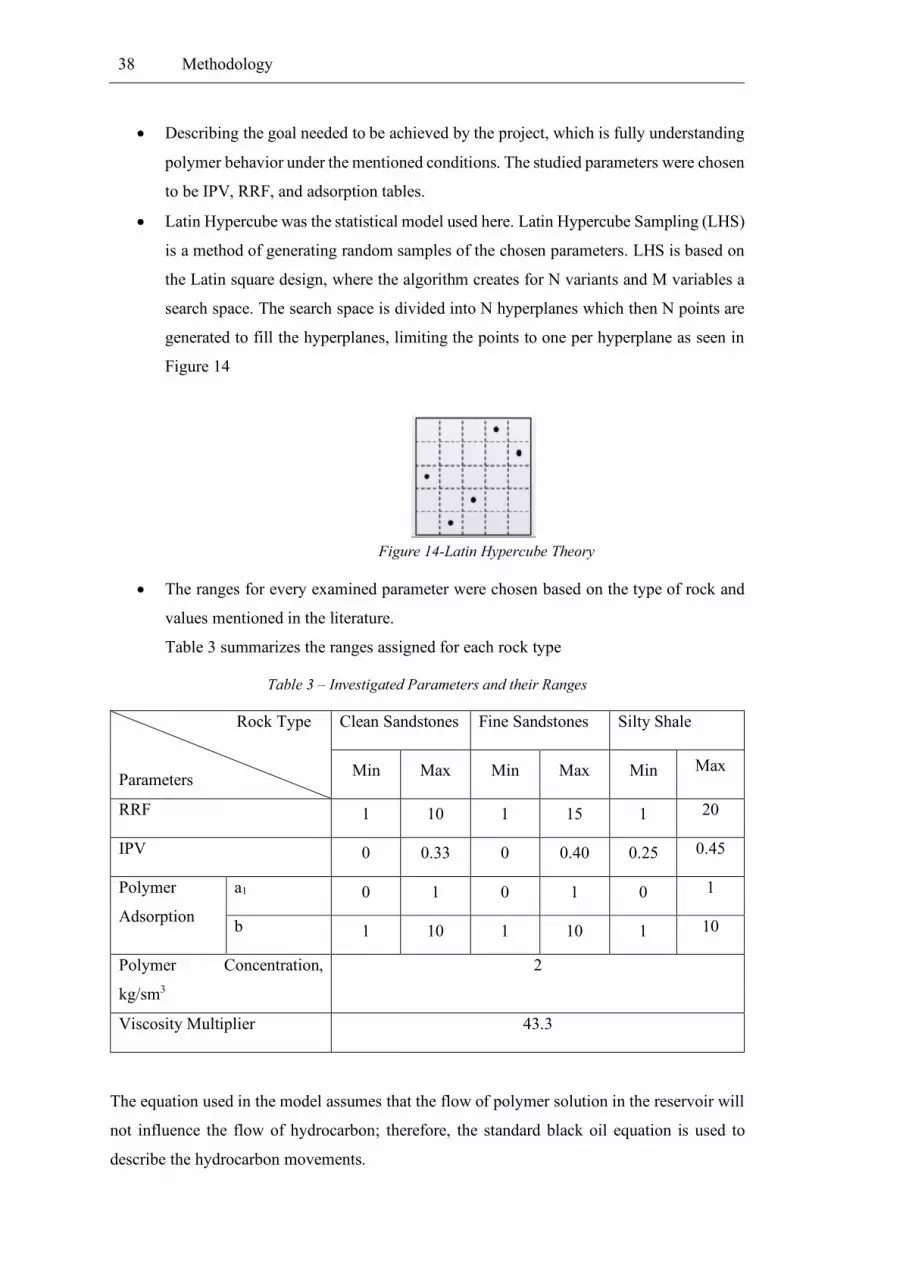
• Latin Hypercube was the statistical model used here. Latin Hypercube Sampling (LHS)
is a method of generating random samples of the chosen parameters. LHS is based on
the Latin square design, where the algorithm creates for N variants and M variables a
search space. The search space is divided into N hyperplanes which then N points are
generated to fill the hyperplanes, limiting the points to one per hyperplane as seen in
Figure 14
Figure 14-Latin Hypercube Theory
• The ranges for every examined parameter were chosen based on the type of rock and
values mentioned in the literature.
Table 3 summarizes the ranges assigned for each rock type
Table 3 – Investigated Parameters and their Ranges
Rock Type
Parameters
Clean Sandstones Fine Sandstones Silty Shale
Min Max Min Max Min Max
RRF 1 10 1 15 1 20
IPV 0 0.33 0 0.40 0.25 0.45
Polymer
Adsorption
a1 0 1 0 1 0 1
b 1 10 1 10 1 10
Polymer Concentration,
kg/sm3
2
Viscosity Multiplier 43.3
The equation used in the model assumes that the flow of polymer solution in the reservoir will
not influence the flow of hydrocarbon; therefore, the standard black oil equation is used to
describe the hydrocarbon movements.

39 Methodology
However, the water phase equation needed to have some modification and some addition. The
first equation describes the effect of the polymer on the flow of the aqueous phase:
𝑑
𝑑𝑡(
𝑉𝑆𝑤
𝐵𝑟𝐵𝑤) = ∑ (
𝑇𝑘𝑟𝑤
𝐵𝑤𝜇𝑤.𝑒𝑓𝑓𝑅𝑘
(𝛿𝑃𝑤 − 𝑔𝜌𝑤𝐷𝑧)) + 𝑄𝑤
𝑑
𝑑𝑡(
𝑉∗𝑆𝑤𝐶𝑝
𝐵𝑟𝐵𝑤) +
𝑑
𝑑𝑡(𝑉𝜌𝑟𝐶𝑝
𝑎1 − 𝜑
𝜑) = ∑ (
𝑇𝑘𝑟𝑤
𝐵𝑤𝜇𝑤.𝑒𝑓𝑓𝑅𝑘
(𝛿𝑃𝑤 − 𝑔𝜌𝑤𝐷𝑧)) 𝐶𝑝 + 𝐶𝑝𝑄𝑤
The left-hand side of the previous equation represents the polymer adsorption, with the need
for specifying 𝐶𝑝, which is using Langmuir-type isothermal:
𝐶𝑝 =𝑎𝐶
1 + 𝑏𝐶
𝑎 = (𝑎1 + 𝑎2𝐶𝑆𝐸)(𝑘𝑟𝑒𝑓
𝑘)0.5
In the model, the salt concentration was set to zero. K is the average block permeability, which
is set to be 509.03 mD, and the reference permeability is the permeability for each rock type,
which was previously mentioned in Table 2.
V* accounts for the IPV with:
𝑉∗ = 𝑉(1 − 𝑆𝐼𝑃𝑉)
Where V is the block pore volume, and SIPV donates the inaccessible pore volume on each grid
block.
The polymer adsorption will cause the permeability to be reduced, to quantify the amount of
reduction of RRF value needs to be assigned to the next equation:
𝑅𝑘 = 1 + (𝑅𝑅𝐹 − 1)𝐶𝑝
𝑎
𝐶𝑝𝑎𝑚𝑎𝑥
𝐶𝑝𝑎𝑚𝑎𝑥 needs to be specified for each rock type.
• The main discussion and results obtained from the simulation model are analyzed in
the next chapter

40 Methodology
3.3 Base Case Description
To establish a baseline, the first simulation models were created without addressing the impact
of rock types. Rock types present in the model were only used for the description of saturation
functions (i.e. relative permeabilities and capillary pressure). The polymer parameters were
varied one at the time within the ranges presented before for the entire reservoir. The results
of this experiment provided an insight into how the models were used before this investigation
would perform. The comparison between this baseline and the investigated properties described
by rock types are presented in the next chapter.
41 Results and Discussion
Chapter 4
Results and Discussion
In this chapter, simulation results and sensitivity analysis of the effect of different rock types
on polymer behavior and incremental oil recovery are presented. The results would help to
appropriately characterize the polymer behavior in the presence of different rock types by
addressing the most influencing physical properties mentioned in 1.1.2.
For simplicity, the concentration-viscosity relation is assumed to be linear, simulating a
Newtonian flow behavior of a target viscosity of 21.6 cP (43.3 times the water viscosity) of the
polymer solution. It has been assumed that the rock type has no effect on the polymer viscosity,
and no shear thinning or thickening since the model used is a simple 2D model (having a linear
velocity with no significant variation).
The cross-section model is set to replace the voidage in the reservoir, where the injection
volume is equal to the produced liquid, the production rate is set at 1.44 sm3/day to achieve the
conventional displacement at reservoir conditions of 1 ft/day, this value is considered to be
small therefore the effect of hydrodynamic entrapment is neglected. The polymer is injected
for one year at a concentration of 2 kg/sm3, the total volume injected is 0.3 pore volume. The
amount of oil recovered by the waterflood is 37.3% of IOIP.
The sensitivity analysis conducted to characterize the behavior of polymer and incremental oil
recovery in the presence of different rock types are summarized next.
The investigation started by ideally generating a base case, which is used to compare the
approach suggested in this thesis (characterizing the polymer properties per rock type) to the
literature used approach.
42 Results and Discussion
43 Results and Discussion

44 Results and Discussion
4.1 Basecase Results
As mentioned in 3.3, the investigated parameters are described for all RTs as one. The results
obtained are then used in comparison with describing polymer properties per rock type.
Figure 15 shows that as the RRF increases an increase in the incremental oil recovery is
observed, this behavior is indicated from the previously conducted studies (see Chapter 2).
However, a decreasing trend is observed in the incremental recovery as IPV increased and less
pore volume is contacted by the polymer which is illustrated in Figure 17.
Decreasing the polymer concentration as more polymer is adsorbed into the rock will lead to a
decrease in the amount of oil recovered, see Figure 17.
Figure 15- Effect of Describing the RRF for all RTs as one
Figure 16- Effect of Describing the IPV for all RTs as one

45 Results and Discussion
Figure 17- Effect of Describing the Polymer Adsorption Coefficient for all RTs as one
4.2 Parametric Studies
4.2.1 Effect of Varying Residual Resistance Factor (RRF)
The effect of varying the RRF in the presence of different rock types on incremental oil
recovery is evaluated at constant IPV of 20% for the RT1 and RT2, and 25% for RT3. Due to
its significantly lower permeability, RT3 is expected to have a higher IPV. The maximum
adsorption values for RT1, RT2, and RT3 are kept constant at 31.8 µg/g, 11.7 µg/g, and 0.68
µg/g, respectively.
Figure 18 shows the effect of assigning different RRF for each rock type on the incremental oil
recovery in comparison with constantly varying the RRF for all RTs (Basecase) all at constant
adsorption and IPV values.
RRF was varied between 1-20, exceeding the value of 1.456 that has been used previously by
OMV.
In the Basecase, the incremental oil increases as the RRF increases for all observed values.
Constantly increasing the RRF values would lead to a reduction in the permeability of rock to
water, accordingly a decrease in the system mobility ratio is observed and a delay in polymer
propagation. As the polymer is coating the rock surface with a hydrophilic film that will swell
as water passes, leading to a reduction in effective permeability of water. Such swelling does
not accrue when oil is passing improving the oil recovery.

46 Results and Discussion
According to the Buckley-Leverett solution in Chapter 1, a further decrease in the mobility ratio
that is caused by the reduction of the water permeability will tend to shift the S-shape curve to
the right, permitting additional oil recovery, consequently improving the volumetric sweep
efficiency across all RTs.
Figure 18– Effect of varying RRF in different RTs on Incremental Oil Recovery. For the sensitivity
analysis, the non-varying RRF is fixed as 1.456 for all RTs
• Varying RRF for RT1, whereas RT2 and RT3 are kept constant at 1.456
Varying RRF RT1 significantly impacts the incremental oil recovery compared with the
Basecase. As the RRF RT1 increases, the permeability to water within RT1 will decrease
causing a volumetric sweep efficiency improvement. promoting the path for the polymer to
flow through the less resistant path along RT2 and recovering the majority of the bypassed oil.
Improving the vertical sweep efficiency will lead to a better polymer propagation across RT2,
where improving the areal sweep efficiency will lead to better sweep of oil within RT1 and
RT2.
Improving the vertical sweep efficiency will lead to a corresponding increase in the oil recovery
associated with RT2 since most of the remaining oil post waterflood is located in RT2 ( ~ 38%
of IOIP), the RT3 contribution to oil recovery is negligible since there it is not accessible to
polymer due to its low permeability. The oil distribution in RT2 is originally higher than it is
47 Results and Discussion
in RT1 and RT2 with 52.4% of IOIP, and during water flooding, only 13.89% of IOIP was
produced from RT2.
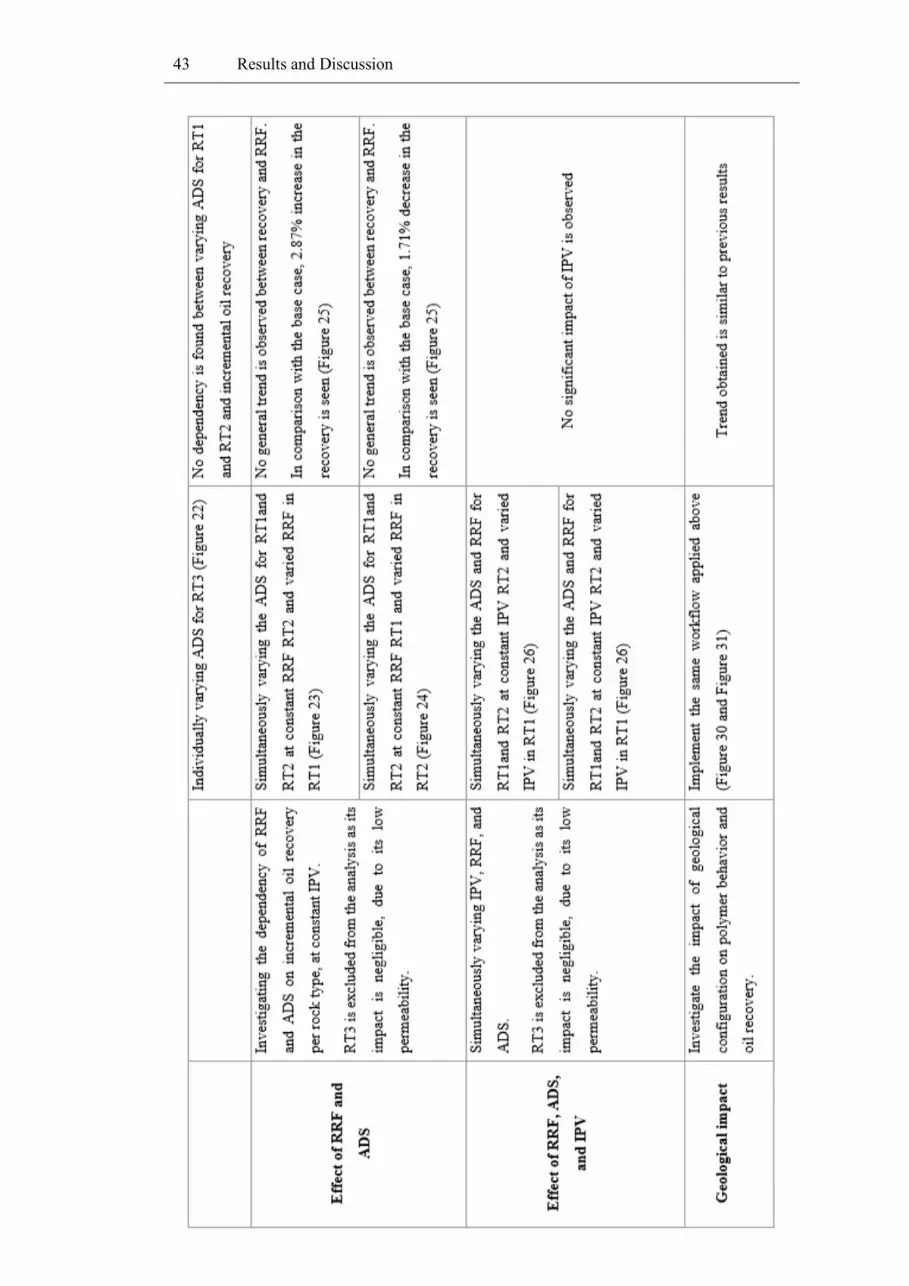
Varying the RRF RT1 increases the incremental oil recovery from 10% of IOIP to ~15.6% of
IOIP compared with an increase of ~ 2% points governed by the Basecase. Describing the
polymer behavior per rock type will yield substantially different recovery values, especially
with the better rock type RT1.
• Varying RRF for RT2, whereas RT1 and RT3 are kept constant at 1.456
Varying RRF RT2 has a negative impact on the incremental oil recovery. Further decrease in
permeability within RT2 will lower the ability for the polymer to propagate causing a reduction
in overall volumetric sweep efficiency since the remaining oil within RT2 will not be efficiently
swept. As the rock permeability to water in RT2 decreases preventing the polymer propagation,
the vertical sweep efficiency decreases, permitting a faster polymer propagation within RT1,
bypassing ~ 38% of IOIP within RT2. Again, the recovery from RT3 is minor and can be
neglected.
• Varying RRF for RT3, whereas RT1 and RT2 are kept constant at 1.456
Varying RRF for RT3 does not have an impact on incremental recovery since a further
reduction of ~ 1.2 mD permeability will not aid the recovery nor the sweep efficiency.
Therefore, the polymer front will propagate through RT1 at a rate higher than RT 2 as a result
of rock permeability contrast.
Analysis
Additional oil obtained by polymer flood is associated with RT2, the medium quality rock class
with intermediate permeability; therefore, the amount of oil recovered from RT2 will determine
the improvement of the volumetric sweep efficiency.
As shown in Figure 18, varying RRF RT3 is independent of incremental oil recovery; however,
varying RRF RT1 will positively impact the recovery since the vertical sweep efficiency will
be improved to recover more oil from RT2 (permeability to water is reduced within RT1
promoting a less resistance path along RT2). But the permeability reduction associated with
48 Results and Discussion
varying RRF RT2 will negatively impact the recovery as a result of poor improvement of
volumetric sweep efficiency.
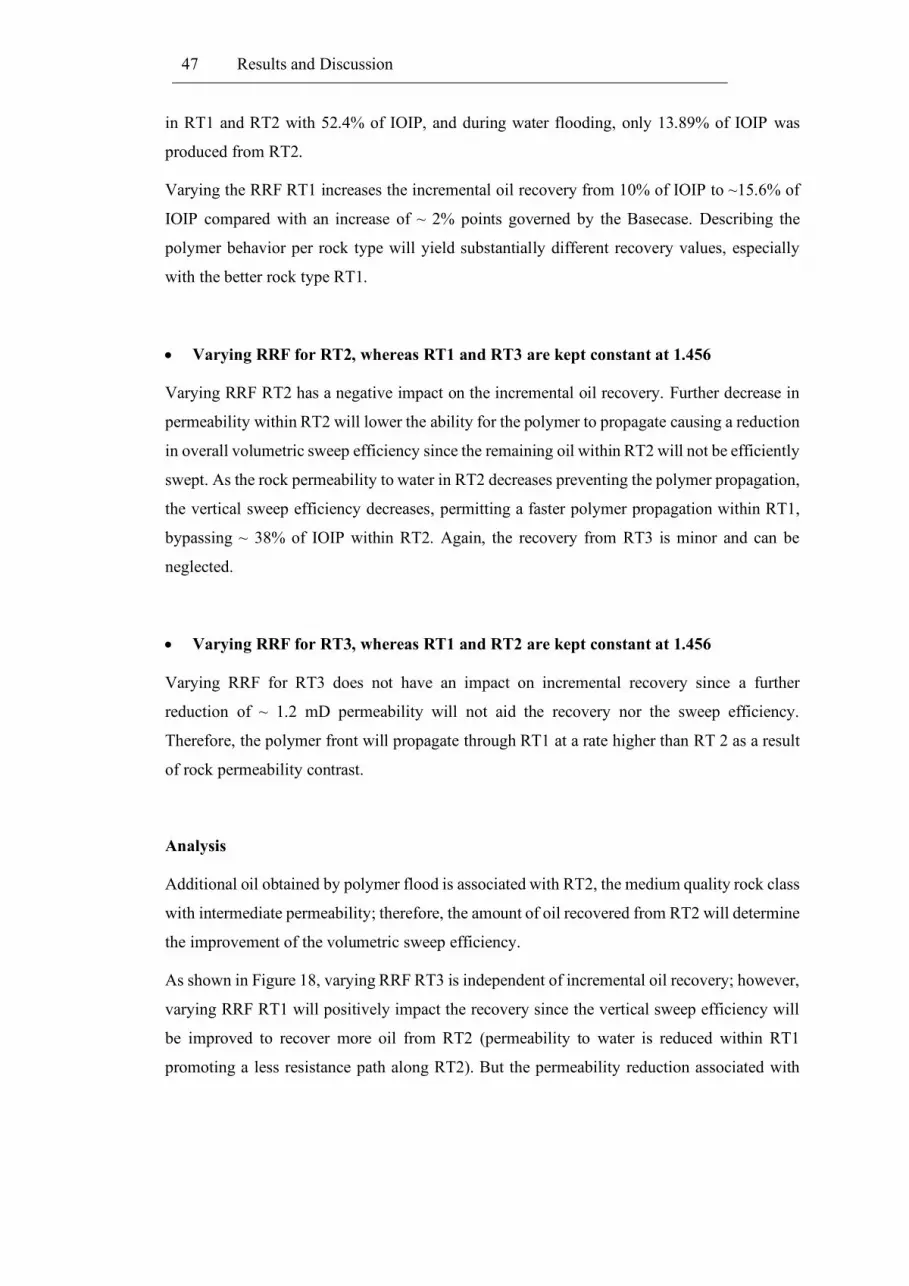
The effect of different RTs and RRF on the incremental oil recovery is seen in Figure 19, where
RT1’s effect on the incremental oil recovery is clear, reduced permeability in RT1 which is the
best rock class with Darcy level permeability will lead to a better mobility control with the
possibility of ~39% increase in the recovery compared to the Basecase.
The effect of varying RRF for RT2 and RT3 on the incremental oil recovery is not as significant
as RT1. Still, the combination of all RTs will lead to a significant increase in the recovery.
Results obtained in the sensitivity analysis presented in Figure 19, suggests that describing the
permeability reduction per rock types will lead to an increase in the incremental oil recovery.
However, the permeability reduction is highly affected by the polymer adsorption, and to
conclude, a dependency investigation of RRF on the adsorption is done.
Figure 19- Sensitivity Analysis for RTS on RRF and Incremental Oil Recovery Difference from
Basecase
4.2.2 Effect of varying the Inaccessible Pore Volume (IPV)
In order to investigate the effect of having different IPV in each RT on incremental oil recovery,
several simulation runs were done at constant RRF values of 1.456, and the maximum
adsorption values of 31.8 µg/g, 11.7 µg/g, and 0.68 µg/g, for RT1, RT2, and RT3, respectively.
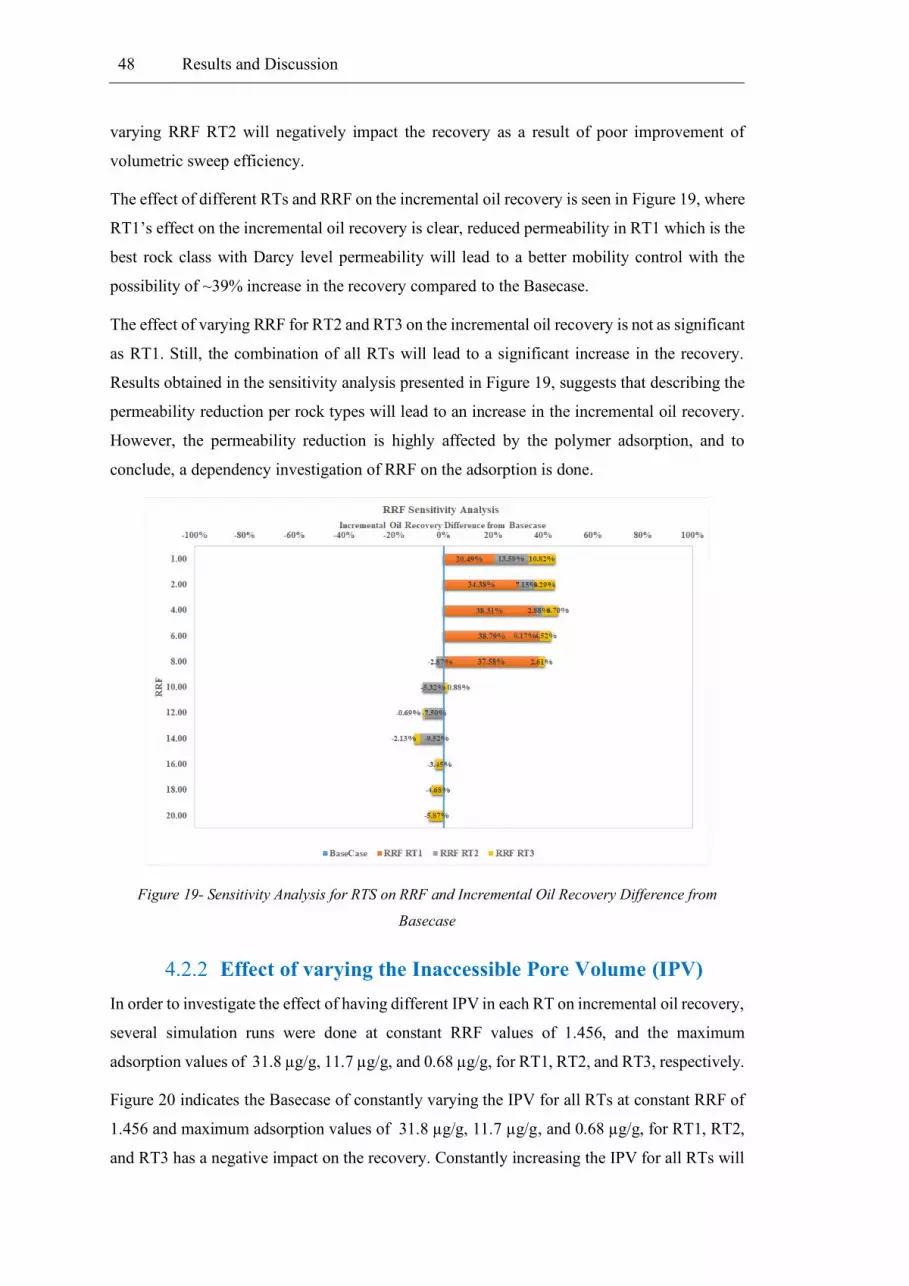
Figure 20 indicates the Basecase of constantly varying the IPV for all RTs at constant RRF of
1.456 and maximum adsorption values of 31.8 µg/g, 11.7 µg/g, and 0.68 µg/g, for RT1, RT2,
and RT3 has a negative impact on the recovery. Constantly increasing the IPV for all RTs will
49 Results and Discussion
reduce the recovery by 0.2% points, since with the basecase all RTs will be treated as one the
preference is still the path along RT1. In theory, increasing, IPV will increase the polymer
propagation in the reservoir and will promote a faster arrival of the oil but at the same time, a
large portion of the reservoir will not be contacted by the polymer.
Higher IPV means a lower slope of polymer velocity in the Buckley-Leverette solution; lower
slope implies higher polymer velocity, which will lead to a decrease in the height of the oil
bank formed as mentioned in 1.1.3, thus a decrease in the recovery.
Figure 20 – Effect of Varying IPV for Different RTs on Incremental Oil Recovery. For the sensitivity
analysis, the non-varying IPV for RT1 and RT2 is fixed as 0.2, for RT 3 is fixed as 0.25
• Varying IPV for RT1, whereas RT2 is constant at 0.2 and RT3 at 0.25
A reduction of ~ 0.6% point of IOIP is associated with increased IPV RT1, increasing the
velocity of polymer in the Darcy level sand RT1 will lead to a faster production of the injected
polymer. Thus, reducing its capability to propagate through RT2 and produce the remaining
oil.
• Varying IPV for RT2, whereas RT1 is constant at 0.2 and RT3 at 0.25
Faster polymer propagation in RT2 will increase the incremental oil recovery by 0.5% points.
As IPV in RT2 increases, the polymer will tend to flow through RT2 as it is less resistant than
50 Results and Discussion
the other RTs. The slight increase in oil recovery is governed by the fast arrival of the oil to the
production well only.
• Varying IPV for RT3, whereas IPV RT1 and RT2 are constant at 0.2
No significant impact is seen in the recovery by varying the IPV of RT3. At permeability of
~1.2 mD increasing velocity of the polymer will not aid the recovery.
Analysis
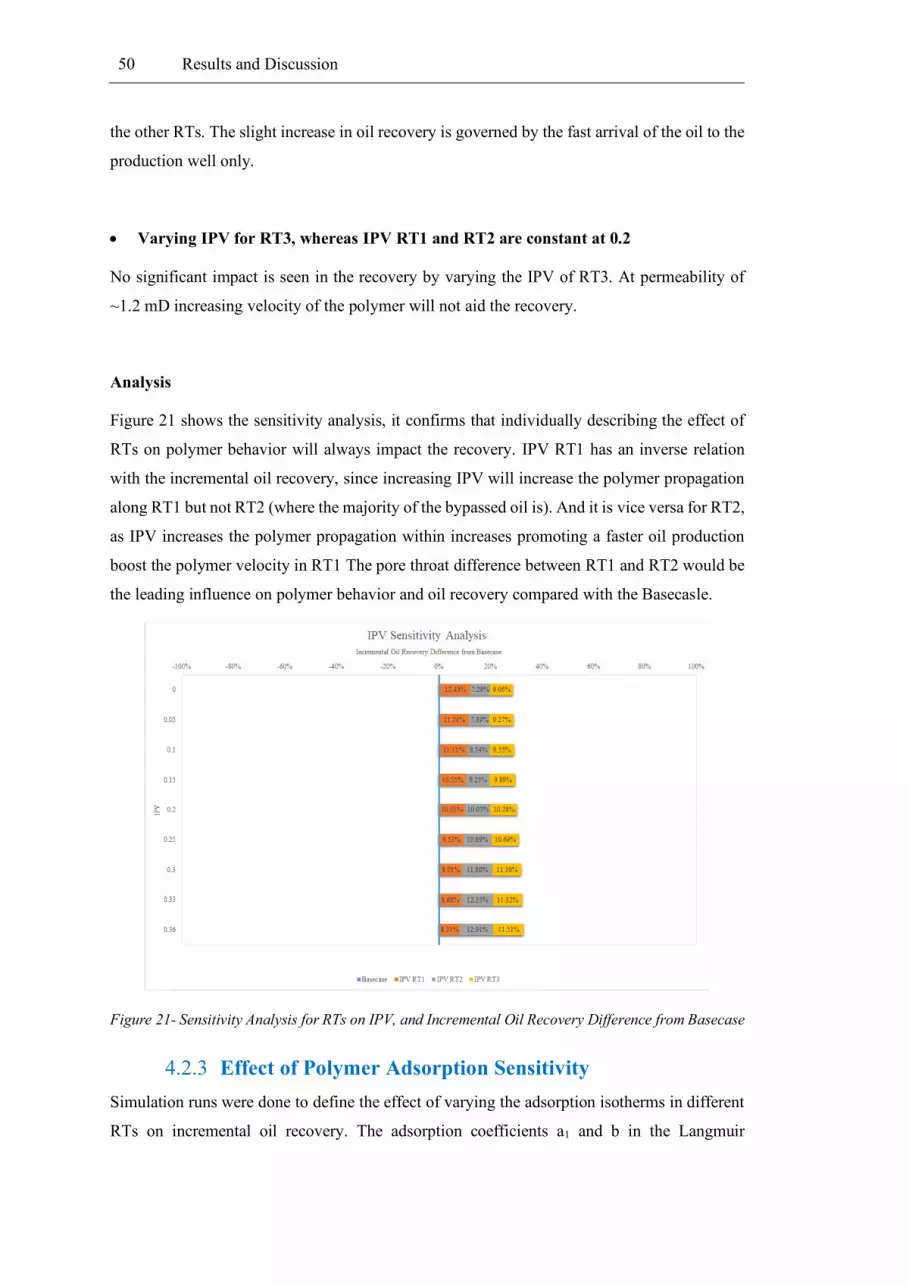
Figure 21 shows the sensitivity analysis, it confirms that individually describing the effect of
RTs on polymer behavior will always impact the recovery. IPV RT1 has an inverse relation
with the incremental oil recovery, since increasing IPV will increase the polymer propagation
along RT1 but not RT2 (where the majority of the bypassed oil is). And it is vice versa for RT2,
as IPV increases the polymer propagation within increases promoting a faster oil production
boost the polymer velocity in RT1 The pore throat difference between RT1 and RT2 would be
the leading influence on polymer behavior and oil recovery compared with the Basecasle.
Figure 21- Sensitivity Analysis for RTs on IPV, and Incremental Oil Recovery Difference from Basecase
4.2.3 Effect of Polymer Adsorption Sensitivity
Simulation runs were done to define the effect of varying the adsorption isotherms in different
RTs on incremental oil recovery. The adsorption coefficients a1 and b in the Langmuir

51 Results and Discussion
Isothermal equation as seen in 1.1.2, are varied from 0 to1 and 1 to 10, respectively, for all
RTs achieving different maximum adsorption levels.
The adsorption coefficients for the Basecase were constantly varied for all RTs. The variation
is done at a constant RRF of 1.456 and IPV for RT1=RT2= 20% and RT3 = 25%.
• Varying Adsorption coefficient for RT1, Maximum adsorption for RT2 is 11.7 µg/g,
and RT 3 is 0.68 µg/g
As can be seen in Figure 22, an initial conclusion is drawn where varying the maximum
adsorption in RT3 does not affect the incremental oil recovery in comparison with varying the
maximum adsorption in RT1 since the Langmuir Isothermal equation takes into consideration
the rock permeability.
The amount of polymer adsorbed in RT1 is ranging between 31.8 μg/g to 767 μg/g, which is
considerably high, and it would cause a significant delay in polymer propagation.
Figure 22 - Effect of Maximum Polymer Adsorption on Incremental Oil Recovery
The results obtained here contradict the results found in literature where adsorption is inversely
proportioned to the permeability (R.N Manichand, 2014). As the polymer adsorption in RT1
increases, the amount of polymer in solution is reduced, and its propagation is delayed causing
a decrease in the incremental oil recovery obtained from RT2.

52 Results and Discussion
• Varying Adsorption coefficient for RT2, Maximum adsorption for RT1 is 31.8 µg/g,
and RT 3 is 0.68 µg/g
Higher adsorption in RT2 will lead to a slight decrease in oil recovery, as seen in Figure 22.
Polymer lost to adsorption will reduce the polymer concentration, and it would delay its
propagation through RT2, causing a decrease in the amount of oil contacted by the polymer.
Approximately 1% of IOIP will not be recovered if the maximum polymer adsorption reaches
~ 300 μg/g.
• Varying Adsorption coefficient for RT3, Maximum adsorption for RT1 is 31.8 µg/g,
and RT 2 is 11.7 µg/g
The amount of polymer adsorbed in RT3 is ranging between 0.68 µg/g and 16.3 µg/g, which is
insignificant. Hence no substantial amount of polymer will be lost as a result of the rock's low
permeability, keeping the recovery at ~ 10.5%.
The Basecase follows the same trend as RT1, concluding that varying the adsorption
coefficients uniquely to each RT will not have an impact on the recovery, except at very high
RT1 adsorption value where ~ 1% of IOIP difference is seen in Figure 22.
Based on the information obtained from above, describing the polymer behavior per rock type
will aid the incremental oil recovery, whereas RT1 is the primary design criterion in this case.
4.2.4 Combined Effect of RRF and Polymer Adsorption
The effect of RRF is usually associated with the amount of polymer adsorbed. To determine
the impact of varying the RRF; and the adsorption simultaneously per rock type on incremental
oil recovery, simulation runs were performed.
A fixed IPV of 20% was used for RT1 and RT2, and 25% for RT3. The RRF varied from 1 to
20, and the adsorption coefficients a and b from Langmuir-Isothermal varied from 0-1 and 1-
10, respectively.
An investigation was done by simultaneously varying polymer adsorption and RRF, as shown
in Figure 23 and Figure 24. The effect of adsorption was illustrated by dividing the polymer
adsorption effect into four different groups to correctly range the RRF value for each rock.
The polymer adsorption groups will be as follows:
1. Group 1: low polymer adsorption in RT1 and RT2.
2. Group 2: low polymer adsorption in RT1 and high polymer adsorption in RT2.
53 Results and Discussion
3. Group 3: high polymer adsorption for RT1 and RT2.
4. Group 4: high polymer adsorption for RT1 and low for RT2.
In the Basecase the maximum adsorption values and RRF increase constantly, the amount
recovered starts to decrease. This can be explained by the reduction in the polymer
concentration because of adsorption, leading to a sharper slope for the polymer velocity.
The sensitivity for varying RRF RT1 and adsorption values for each rock type is illustrated as
a function of the four different adsorption groups described before. As shown previously in
section 4.2.3, polymer adsorption in RT3 has almost no influence on incremental oil recovery
as a result of its low permeability that prevents polymer propagation; therefore the groups were
assigned based solely on the adsorption of RT1 and RT2.
A general increasing trend in oil recovery is observed in RRF values below four, this has
resulted from mobility enhancement through RT2 as the permeability to water is decreased in
RT; however, the amount of adsorption is what is defining the magnitude in the increase.
Having low adsorption for both rocks leads to an increase in the oil recovery with an increase
in the RRF, a consistent behavior with the finding in4.2.1. Combining the effect of permeability
reduction in terms of mobility control improvement (permeability reduction in the better class
rock RT1) and minimum loss in the polymer will increase the amount of oil contacted by the
polymer in RT2.
An increasing trend in the recovery is associated with an increase in polymer adsorption in RT2
but in a lower incremental oil interval ( highlighted in the light green points in Figure 23). The
behavior can be simply described as more polymer is adsorbed in RT2, causing a reduction in
polymer concentration in the solution (this explains the reduction in the recovered oil ~ 8% to
12% compared with beige points that have a range of 12% to 14%). However, since only the
impact of RRF RT1 is seen here (permeability is decreased only within RT1), where RRF RT2
is held constant; an increasing trend in the oil recovery is seen, as RT2 being the preferred path
for the remaining polymer in solution.
As for increasing polymer adsorption and RRF for RT1, that will lead to a decrease in recovery,
as seen in 4.2.1, limiting the possibility for polymer flow in RT2.
The same analysis was carried out with varying RRF RT2, as shown in Figure 24. The effect
of varying RRF for RT2 follows the trend seen in section 4.2.1. As the polymer adsorption
increases, more polymer is lost, leading to further permeability reduction in RT2 since RT1 is
kept constant in this run.
54 Results and Discussion
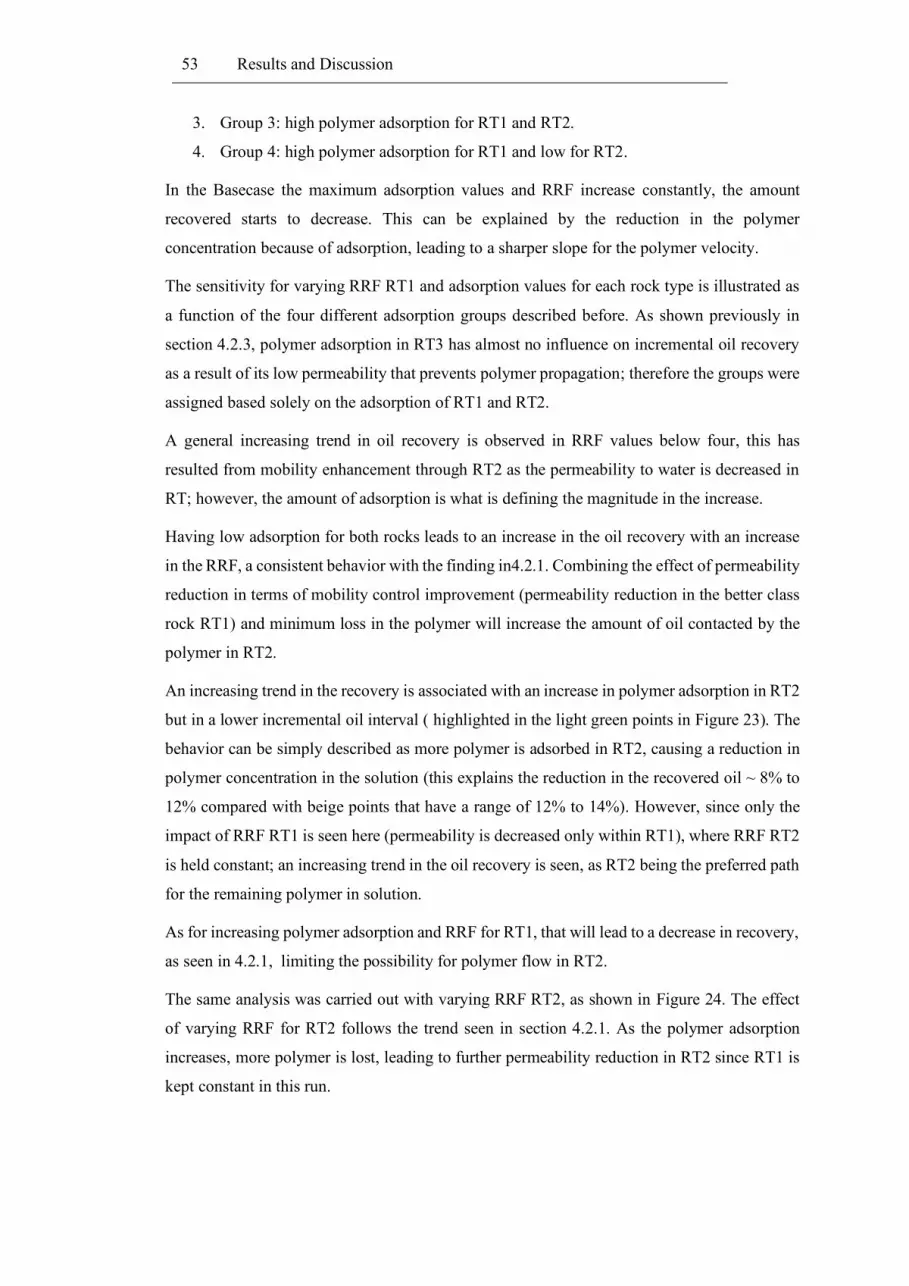
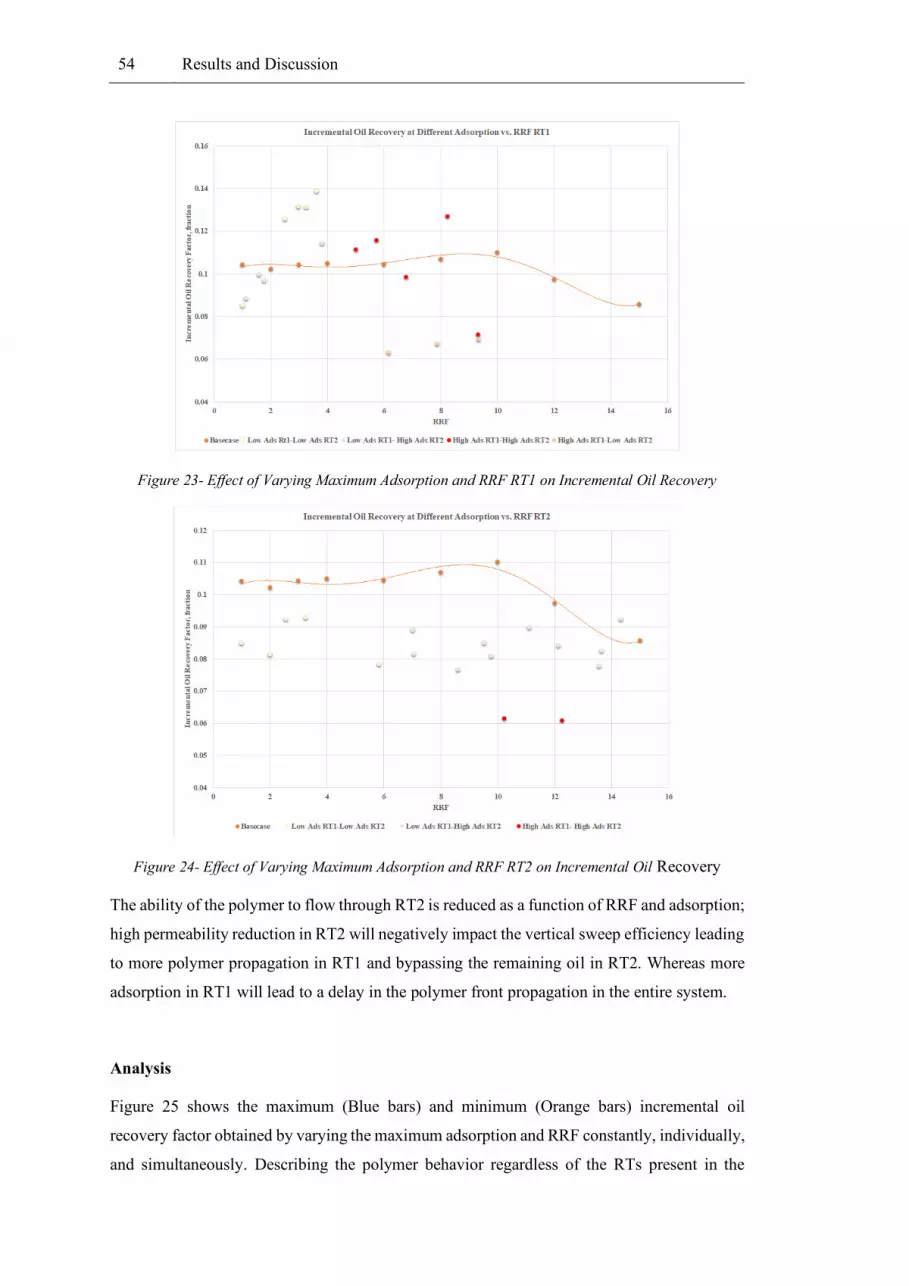
Figure 23- Effect of Varying Maximum Adsorption and RRF RT1 on Incremental Oil Recovery
Figure 24- Effect of Varying Maximum Adsorption and RRF RT2 on Incremental Oil Recovery
The ability of the polymer to flow through RT2 is reduced as a function of RRF and adsorption;
high permeability reduction in RT2 will negatively impact the vertical sweep efficiency leading
to more polymer propagation in RT1 and bypassing the remaining oil in RT2. Whereas more
adsorption in RT1 will lead to a delay in the polymer front propagation in the entire system.
Analysis
Figure 25 shows the maximum (Blue bars) and minimum (Orange bars) incremental oil
recovery factor obtained by varying the maximum adsorption and RRF constantly, individually,
and simultaneously. Describing the polymer behavior regardless of the RTs present in the

55 Results and Discussion
reservoir might yield lower oil recovery of 11%of IOIP compared to describing the polymer
behavior per rock type where the recovery would be ~12% of IOIP. The increase in the recovery
based on Figure 25 is governed by mobility enhancement as a result of reducing the relative
permeability of the aqueous phase in RT1.
Figure 25- Sensitivity Analysis for varying Maximum adsorption and RRF for RTs on Incremental Oil
Recovery
4.2.5 Combined Effect of RRF, IPV and Polymer Adsorption
The combined effect of different RTs on the physical polymer behavior and the incremental oil
recovery is done by varying RRF, Adsorption, IPV RT1, and IPV RT2. Figure 26 illustrates
the effect of constantly varying adsorption, RRF, and IPV (Basecase). The incremental oil
recovery in Basecase does not change by varying IPV RT1 compared with the results seen in
4.2.4.
A slight decrease in the incremental oil recovery is observed as IPV RT1 increases, and the
permeability reduces because of high adsorption in RT2. As seen in section 4.2.4, higher
polymer losses have resulted in high permeability reduction in RT2 and consequently reducing
the amount of polymer propagated through RT2 to recover the remaining oil. Adding the effect
of IPV in RT1 will cause a reduction in the recovery as less polymer will propagate through
RT2 as a result of faster polymer propagation in RT1.
Increased the polymer adsorption for RT1 to 767 μg/ g results in an increase in RRF RT1 and
significant loss in the polymer, leading to a delay of polymer propagation through the reservoir.
The lowest oil recovery of 6% of IOIP is obtained by increasing adsorption in RT1 to a degree
neither the RRF nor IPV will compensate for.

56 Results and Discussion
Figure 26- Effect of Varying Maximum Adsorption, RRF and IPV RT1 on Incremental Oil Recovery
Figure 27- Effect of Varying Maximum Adsorption, RRF and IPV RT2 on Incremental Oil Recovery
Figure 27 shows no trend relating adsorption, RRF, and IPV RT2o incremental oil recovery,
where the oil recovery is ranging from 9% to ~ 13% of IOIP, at low and high IPV values.
Having the right combination of the varied values can give almost the same recovery factor
with two different values. When adsorption increases in RT2 the RRF will follow, causing the
polymer behavior to alter and reduce the amount recovered. This alteration is compensated by
the increase of polymer propagation into RT2, allowing more oil to be contacted with polymer
(12.2% of IOIP is produced) even without the amount of polymer lost.

57 Results and Discussion
Almost the same amount of oil could be recovered (~ 12.7% of IOIP) at low RRF, adsorption,
and IPV RT2, concluding that varying IPV RT2 in the presence of more pronounced behavior
of RRF and adsorption will not have a major impact on the oil recovery.
Having high adsorption values in RT1 and RT2 will also reduce the polymer velocity, and
increase the amount of permeability reduced, causing a lower oil recovery to ~ 7% of IOIP.
Analysis
Describing the polymer behavior per rock type will yield more recovery factor than assuming
that having different rock types will not affect the polymer behavior nor the incremental oil
recovery, as seen in Figure 28. However, we see that including the effect of IPV yields a 0.03%
point reduction in the incremental oil recovery compared with Figure 25, a value which is
considered to be neglected.
Figure 28- Sensitivity Analysis for varying Maximum adsorption, RRF, and IPV for RTs on
Incremental Oil Recovery
4.3 Geological Configuration Investigation
In order to investigate the impact of the geological description of the reservoir on the obtained
results, the location of the injection well and producer are swapped reversing the flow (Figure
29). Therefore, the proportion of contacted rock types by the injector is different from the
previous case, allowing us to study the effect of different rock types on polymer physical
behavior and incremental oil recovery under a different geological configuration (Case 2). The
results are all compared with the results obtained by simulating the configuration used in 4.2.

58 Results and Discussion
The amount of oil recovered before polymer injection is 36.8% of IOIP, before 37.3% for Case
1; the remaining oil is distributed along RT1 and RT2. Injected water during the waterflooding
process should have a more stable front due to the geological discontinuity in RT1 at the new
injection point, limiting the fingering caused by contacting more of the highly permeable RT1
at the injection site. To investigate the effect of rock types on the polymer behavior and
incremental oil recovery under a different geological configuration, the same workflow as
before was implemented.
Ranges of incremental oil recovery for both configurations are similar, as seen in Figure 30 and
Figure 31. The biggest difference between both cases is that the main oil contributor is no longer
RT2 during polymer flood as a result of the previously mentioned RT1 geological
discontinuities. In this case, experimental studies are needed to study the effect of both rock
types on polymer behavior and incremental oil recovery rather than on the good quality sand as
in case 1. No common trends are observed by reversing the flow indicating that the geological
description has a big impact on the results. Therefore, it is important to merge stochastic
modeling with polymer description per rock types to better assess incremental oil from polymer
flooding.
Figure 29- Case 2 Geological Configuration
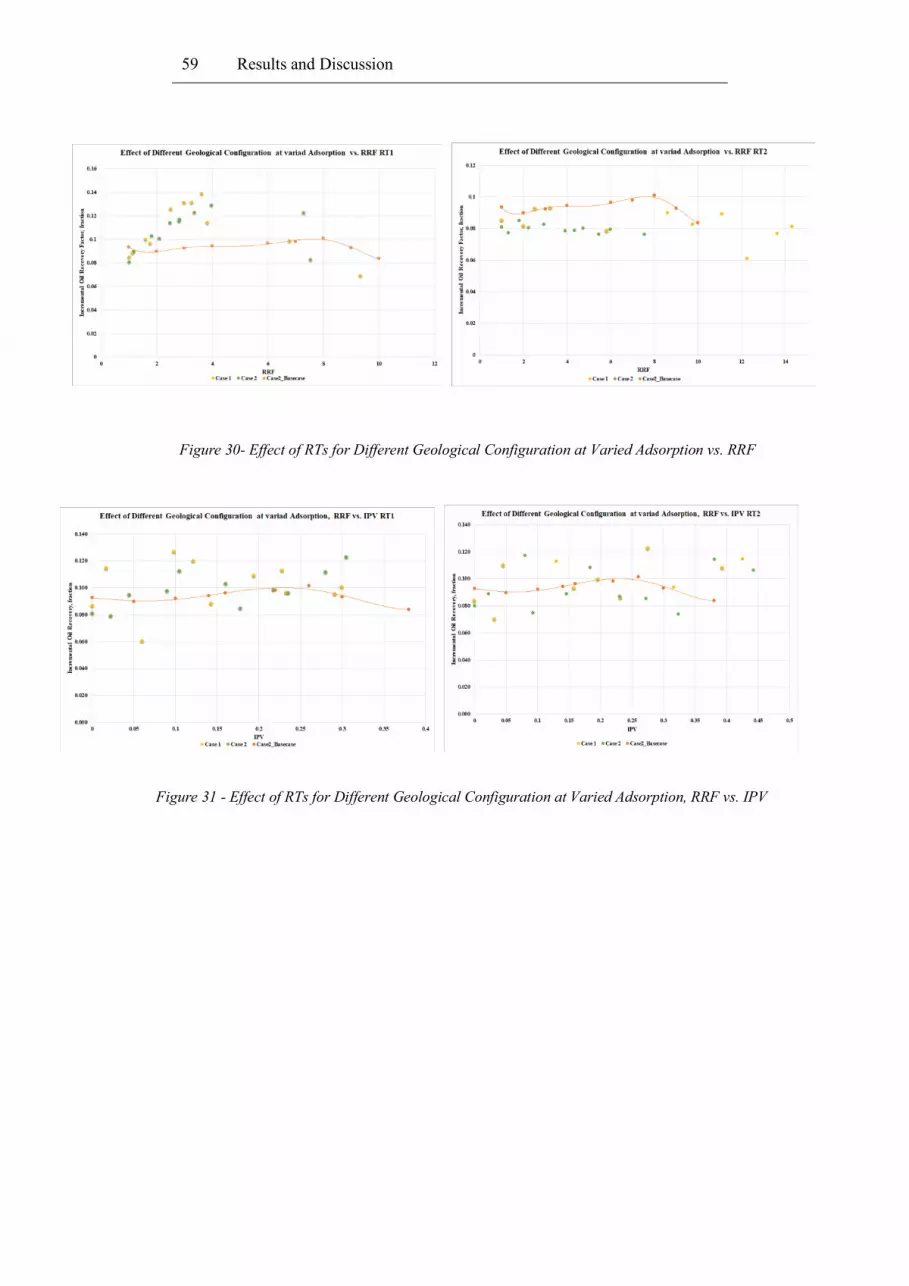
59 Results and Discussion
Figure 31 - Effect of RTs for Different Geological Configuration at Varied Adsorption, RRF vs. IPV
Figure 30- Effect of RTs for Different Geological Configuration at Varied Adsorption vs. RRF


61 Conclusion
Chapter 5
Conclusion
5.1 Summary
This study is focused on using numerical simulation to determine the effect of different rock
types on physical polymer properties and incremental oil recovery by varying the parameters
under uncertainty analysis.
Neglecting the effect of different rock types will lead to an over or an underestimating of
incremental oil recovery most of the time, so does focusing on one parameter rather than all.
Polymer adsorption and residual resistance factor have the most impact on the oil recovery;
optimizing the polymer solution to complement the effect of each rock type would increase the
expected recovery up to 15% of IOIP.
The inaccessible pore volume of different rock types will not have a big impact on the recovery,
but it will aid the recovery in high polymer adsorption cases.
Incremental oil recovery depends on the geological configuration and the oil saturation
distribution before polymer project implementation. The effect of RT is unique in each case;
therefore, no general trend could be concluded.
5.2 Future Work
Based on the observation obtained regarding the effect of different rock types on polymer
physical behavior and incremental oil recovery in 2D model, it is recommended for future work
to include the impact of in-situ viscosity alteration as the physical properties changes.
62 Conclusion
Another aspect is to determine the effect of varying physical property based on different rock
types on oil recovery and pressure response.
The effect of different geological configurations and realizations would help further
understanding the impact of having different rock types on polymer behavior, also, including
the effect of dispersion in the simulation and also the effect of other polymer retention
phenomena.
It would also help to limit the uncertainty ranges of the varied parameters by further
understanding the rock impact by additional laboratory studies.

63 References
References
Ahmed, T., 2019. Reservoir Engineering Handbook. 5th ed.
Akbari, S., Mahmood, S., Nasr, N., Al-Hajri, S. and Sabet, M., 2019. A critical review of
concept and methods related to accessible pore volume during polymer-enhanced oil
recovery. Journal of Petroleum Science and Engineering, 182.
Amaefule, J., Altunbay, M., Tiab, D., Kersey, D. and Keelan, D., 1993. Enhanced Reservoir
Description: Using Core and Log Data to Identify Hydraulic (Flow) Units and Predict
Permeability in Uncored Intervals/Wells. In: SPE Annual Technical Conference and
Exhibition. [online] Houston, Texas: Society of Petroleum Engineers. Available at:
<https://doi.org/10.2118/26436-MS>.
Chiotoroiu, M., Peisker, J., Clemens, T. and Thiele, M., 2016. Forecasting Incremental Oil
Production of a Polymer Pilot Extension in the Matzen Field Including Quantitative Uncertainty
Assessment. In: SPE Improved Oil Recovery Conference. [online] Tulsa, Oklahoma: Society
of Petroleum Engineers. Available at: <https://doi.org/10.2118/179546-MS>.
Cohen, Y. and Christ, F., 1986. Polymer Retention and Adsorption in the Flow of Polymer
Solutions Through Porous Media. SPE Reservoir Engineering, 1(02), pp.113-118.
Choi, B., Park, K., Choi, J. and Lee, S., 2015. Interpretation of Permeability-Dependent
Residual Resistance Factors Caused from Polymer Retention Using Selection of Mechanical
Trapping Constant. In: The Twenty-fifth International Ocean and Polar Engineering
Conference. [online] Kona, Hawaii: International Society of Offshore and Polar Engineers.
Available at: <https://www.onepetro.org/conference-paper/ISOPE-I-15-422>.
Dawson, R. and Lantz, R., 1972. Inaccessible Pore Volume in Polymer Flooding. Society of
Petroleum Engineers Journal, 12(05), pp.448-452.
Energy.gov. 2020. Enhanced Oil Recovery. [online] Available at:
<https://www.energy.gov/fe/science-innovation/oil-gas-research/enhanced-oil-recovery>.
Green, D. and Willhite, G., 1998. Enhanced Oil Recovery. Society of Petroleum Engineers.
He, Q., Young, T., Willhite, G. and Green, D., 1990. Measurement of Molecular Weight
Distribution of Polyacrylamides in Core Effluents. SPE Reservoir Engineering, 5(03), pp.333-
338.
64 References
Huh, C., Lange, E. and Cannella, W., 1990. Polymer Retention in Porous Media. In: SPE/DOE
Enhanced Oil Recovery Symposium. [online] Tulsa, Oklahoma: Society of Petroleum
Engineers. Available at: <https://doi.org/10.2118/20235-MS>.
Hughes, D., Teeuw, D., Cottrell, C. and Tollas, J., 1990. Appraisal of the Use of Polymer
Injection To Suppress Aquifer Influx and To Improve Volumetric Sweep in a Viscous Oil
Reservoir. SPE Reservoir Engineering, 5(01), pp.33-40.
Kaminsky, R., Wattenbarger, R., Szafranski, R. and Coutee, A., 2007. Guidelines for Polymer
Flooding Evaluation and Development. In: International Petroleum Technology. [online]
Dubai: International Petroleum Technology Conference. Available at:
<https://doi.org/10.2523/IPTC-11200-MS>.
Lake, L., 1989. Enhanced Oil Recovery.
Laoroongroj, A., Gumpenberger, T. and Clemens, T., 2014. Polymer Flood Incremental Oil
Recovery and Efficiency in Layered Reservoirs Including Non-Newtonian and Viscoelastic
Effects. In: SPE Annual Technical Conference and Exhibition. [online] Amsterdam: Society of
Petroleum Engineers. Available at: <https://doi.org/10.2118/170657-MS>.
Liauh, W., Duda, J. and Klaus, E., 1979. An Investigation Of The Inaccessible Pore Volume
Phenomena. [online] Society of Petroleum Engineers. Available at:
<https://www.onepetro.org/general/SPE-8751-MS>.
Littmann, W., 1988. Polymer Flooding. Amsterdam: Elsevier.
Manichand, R. and Seright, R., 2014. Field vs Laboratory Polymer Retention Values for a
Polymer Flood in the Tambaredjo Field. In: SPE Improved Oil Recovery Symposium. [online]
Tulsa, Oklahoma: Society of Petroleum Engineers. Available at:
<https://doi.org/10.2118/169027-MS>.
Marker, J., 1973. Dependence of Polymer Retention on Flow Rate. Journal of Petroleum
Technology, 25(11), pp.1307-1308.
Needham, R. and Doe, P., 1987. Polymer Flooding Review. Journal of Petroleum Technology,
39(12), pp.1503-1507.
Pope, G., 1980. The Application of Fractional Flow Theory to Enhanced Oil Recovery. Society
of Petroleum Engineers Journal, 20(03), pp.191-205.
Shaharudin, M., Jalan, S., Masoudi, R. and Othman, M., 2013. Chemical EOR: Challenges for
Full Field Simulation. In: SPE Enhanced Oil Recovery Conference. [online] Kuala Lumpur:
Society of Petroleum Engineers. Available at: <https://doi.org/10.2118/165247-MS>.
65 References
Sheng, J., 2013. Enhanced Oil Recovery Field Case Studies. Waltham, MA: Gulf Professional
Publishing.
Shi, L., Ye, Z., Zhang, Z., Zhou, C., Zhu, S. and Guo, Z., 2010. Necessity and feasibility of
improving the residual resistance factor of polymer flooding in heavy oil reservoirs. Petroleum
Science, 7(2), pp.251-256.
Sieberer, M., Jamek, K. and Clemens, T., 2016. Polymer Flooding Economics, from Pilot to
Field Implementation at the Example of the 8 TH Reservoir, Austria. In: SPE Improved Oil
Recovery Conference. [online] Tulsa, Oklahoma: Society of Petroleum Engineers. Available
at: <https://doi.org/10.2118/179603-MS>.
Sorbie, K., 2013. Polymer-Improved Oil Recovery. Dordrecht: Springer Netherlands.
Taber, J., Martin, F. and Seright, R., 1997. EOR Screening Criteria Revisited - Part 1:
Introduction to Screening Criteria and Enhanced Recovery Field Projects. SPE Reservoir
Engineering, [online] 12(03), pp.189-198. Available at: <https://doi.org/10.2118/35385-PA>.
Taber, J., Martin, F. and Seright, R., 1997. EOR Screening Criteria Revisited—Part 2:
Applications and Impact of Oil Prices. SPE Reservoir Engineering, [online] 12(03), pp.199-
206. Available at: <https://doi.org/10.2118/39234-PA>.
Vanegas, G. and Nejedlik, J., 2018. Rock Types Characterization BO 16TH Alkali Polymer
Project.
Wilson, A., 2015. Pelican Lake: First Successful Application of Polymer Flooding in a Heavy-
Oil Reservoir. Journal of Petroleum Technology, 67(01), pp.78-80.

