effect of pharmaceuticals supply chain
TRANSCRIPT
EFFECT OF PHARMACEUTICALS SUPPLY CHAIN MANAGEMENT
AND PATIENT/CLIENT SATISFACTION ON COMMUNITY
PHARMACIES: THE CASE OF ADDIS ABABA, ETHIOPIA
BY
ABIY ABREHAM
A THESIS SUBMITTED TO THE ADDIS ABABA UNIVERSITY
SCHOOL OF COMMERCE IN PARTIAL FULFILLMENT OF THE
REQUIREMENT FOR THE DEGREE OF MASTER OF ARTS IN
LOGISTICS AND SUPPLY CHAIN MANAGEMENT.
ADVISOR: MATIWOS ENSERMU (PHD)
(ASSOCIATE PROFESSOR)
JUNE, 2018
ADDIS ABABA, ETHIOPIA
Page | i
Effect of Pharmaceuticals Supply Chain Management and Patient/Client Satisfaction on
Community Pharmacies: The Case of Addis Ababa, Ethiopia
by
Abiy Abreham
Approved by:
External Examiner: _______________________Signature ___________Date ____________
Internal Examiner: _______________________Signature ___________Date ____________
Advisor: ________________________Signature ___________Date ____________
Page | ii
Declaration
I Abiy Abreham declare that this thesis submission is my own work towards the award of the
degree of Masters of Arts in Logistics and Supply Chain Management that to be the best of my
knowledge, it contains no material previously published by another person nor material which
has been accepted for the award of any other degree of the university for masters except where
due acknowledgement has been made in the text.
Name: Abiy Abreham
Signature------------------------
Date--------------------------------
Page | iii
Acknowledgement
I am very grateful to my advisor Dr. Matiwos Ensermu for guiding my thesis. Especially I
would like to thank him for the advice he gave me, the excellent and invaluable support he
provided during the course of preparing this study. I would also like to thank Dr. Tariku
Jebena and Dr. Shiferaw Mitiku for their invaluable advice and support. It also gives me
pleasure to extend my gratitude to all community pharmacies in Addis Ababa who are
participating in this work. In addition, I would also pass my keen gratitude to customers of the
community pharmacies for the support they showed during the preparation of this project.
Page | iv
Table of Contents
Acknowledgement ......................................................................................................................... iii
List of Acronyms .......................................................................................................................... vii
Chapter One .................................................................................................................................... 1
Introduction ..................................................................................................................................... 1
1.1 Background of the Study ...................................................................................................... 1
1.2 Statement of the Problem ..................................................................................................... 3
1.3. Basic Research Questions ..................................................................................................... 5
1.4. Objective of the study ........................................................................................................... 5
1.4.1. General Objective ................................................................................................................. 5
1.4.2. Specific Objectives ............................................................................................................... 5
1.5. Significance of the Study ...................................................................................................... 5
1.6. Scope of the Study ................................................................................................................. 6
1.7. Limitation of the Study .......................................................................................................... 6
1.8. Operational Definition of Terms ............................................................................................ 7
1.9. Organization of the Study ...................................................................................................... 7
Chapter Two ................................................................................................................................... 8
Related Literature Review .............................................................................................................. 8
2.1. Theoretical Review .................................................................................................................. 8
2.2 Empirical Review .................................................................................................................. 14
2.3. Conceptual Framework .......................................................................................................... 18
Chapter Three................................................................................................................................ 21
Research Methods and Design ...................................................................................................... 21
3.1. Introduction ............................................................................................................................ 21
3.2. Research Approach ................................................................................................................ 21
3.3. Research Design .................................................................................................................... 21
3.4. Population of the Study .......................................................................................................... 22
3.5. Sample Design ....................................................................................................................... 22
3.6. Data Collection ...................................................................................................................... 23
3.7. Research Area and Setting ..................................................................................................... 24
3.8. Data Collection Subjects and Participants ............................................................................. 24
3.9. Date Analysis and Presentation ............................................................................................. 24
Page | v
3.10. Ethical Considerations ......................................................................................................... 25
Chapter Four ................................................................................................................................. 26
Data Presentation and Analysis .................................................................................................... 26
4.1. Introduction ............................................................................................................................ 26
4.2. Descriptive Statistics .............................................................................................................. 26
4.2.1 Frequency Analysis of the Respondents‟ Profile ................................................................. 26
4.2.2. Supply Chain Management Practices ................................................................................. 31
4.2.2.1. Collaboration with Suppliers ........................................................................................... 31
4.2.2.2. Data Analysis Result of SCMP as collected from Pharmacy Heads ............................... 32
4.2.2.3. Logistics Design .............................................................................................................. 33
4.2.2.4. Customer Satisfaction ...................................................................................................... 35
4.3. Inferential Statistics for SCM Practices and Customer Satisfaction ...................................... 37
4.3.1. Correlation Analysis ........................................................................................................... 37
4.3.1.1. Correlation Analysis between Construct of SCM Practices and Customer Satisfaction . 38
4.3.1.2. Correlation between SCM Practices and Customer Satisfaction ..................................... 39
4.3.2. Regression Analysis ............................................................................................................ 40
4.3.2.1. Regression Analysis between Collaboration and Customer Satisfaction ........................ 40
4.3.2.2. Regression Analysis between Information Sharing and Customer Satisfaction .............. 41
4.3.2.3. Regression analysis between logistics design and customer satisfaction ........................ 41
4.4. Discussion .............................................................................................................................. 42
Chapter Five .................................................................................................................................. 43
Summary of Major Findings, Conclusion and Recommendations ............................................... 43
5.1. Summary of Findings ............................................................................................................. 43
5.2. Conclusions ............................................................................................................................ 44
5.3 Recommendations .................................................................................................................. 45
References ..................................................................................................................................... 46
Appendices ...................................................................................................................................... A
Annex 1. Questionnaire to Pharmacy Head of Community Pharmacies ........................................ A
Annex 2. Questionnaire for Dispensers of Community Pharmacies .............................................. F
Annex 3: Questionnaire for Patients/Clients .................................................................................. J
Annex 4: Interview Guide (Amharic Version) ............................................................................. N
Annex 5: List of Pharmacies Included in the Study ..................................................................... Q
Page | vi
List of Tables
Table 4.1 Gender Frequency of Patients/Clients ......................................................................... 26
Table 4.2 Gender Frequency of Head Pharmacists ....................................................................... 26
Table 4.3 Gender Frequency of Dispensers .................................................................................. 26
Table 4.4 Age Frequency of Patients/Clients ..................................................... ………………27
Table 4.5 Age Frequency of Head Pharmacists ................................................... ………………27
Table 4.6 Age Frequency of Dispensers .......................................................... …………………28
Table 4.7 Work Experience Frequency for Head Pharmacists ……………….. ......................... 28
Table4.8 Work Experience Frequency for Dispensers ……………...………………………… 28
Table4.9 Educational Level Frequency for Patients/Clients …………………………..………29
Table 4.10 Educational Level Frequency for Head Pharmacists………………...………………29
Table4.11 Collaboration with Suppliers..……………………………………………………..…30
Table 4.12 Data Analysis Result of SCMP as collected from Pharmacy Heads in community
pharmacies, Addis Ababa, 2018 ................................................................................. 31
Table 4.13 Logistics Design ……………………………………………..…… .......................... 32
Table 4.14 Community Pharmacies Integration with Customers…………..…… ....................... 34
Table 4.15 Customer Satisfaction Measurements ......................................................................... 36
Table 4.16 Correlation Matrix Between Constructs of SCMP and CP…………......................... 37
Table 4.17 Correlation between SCMP and CS............................................................................ 38
Table 4.18 Regression Analysis between Collaboration and Customer Satisfaction……………39
Table 4.19 Regression Analysis Between IS And CS ………………………..….. ..................... 40
Table 4.20 Regression Analysis between LD and Cs……………………...….. .......................... 40
Page | vii
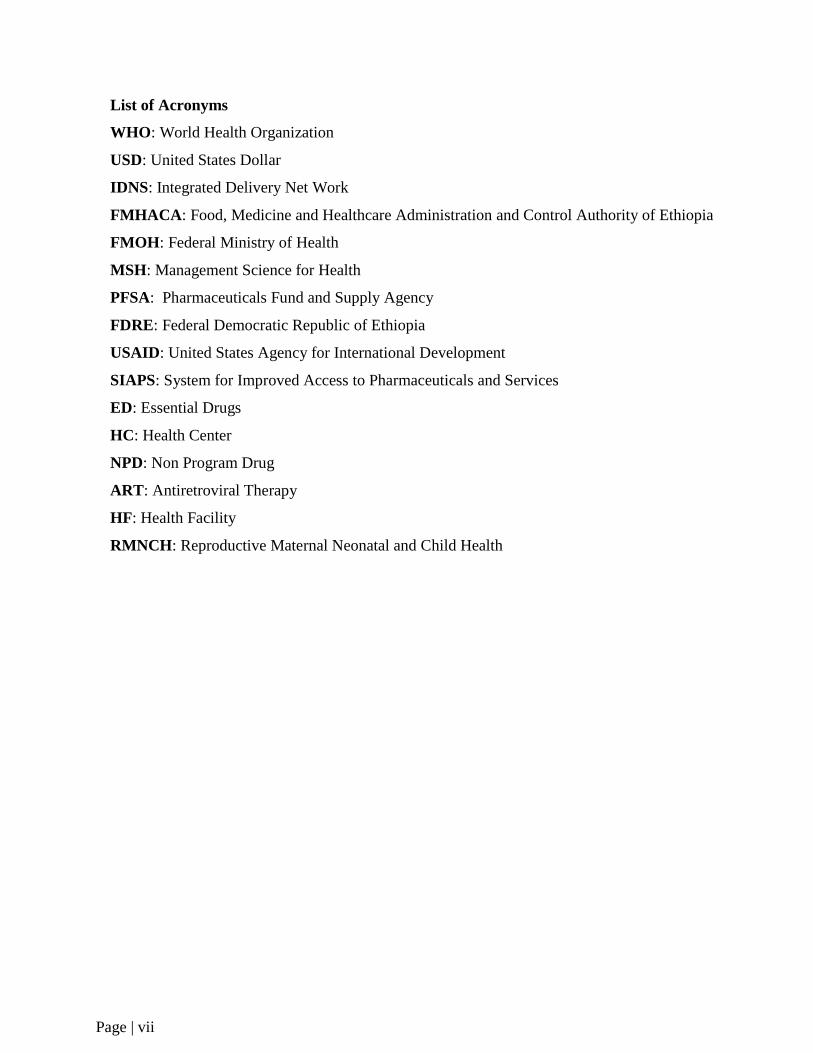
List of Acronyms
WHO: World Health Organization
USD: United States Dollar
IDNS: Integrated Delivery Net Work
FMHACA: Food, Medicine and Healthcare Administration and Control Authority of Ethiopia
FMOH: Federal Ministry of Health
MSH: Management Science for Health
PFSA: Pharmaceuticals Fund and Supply Agency
FDRE: Federal Democratic Republic of Ethiopia
USAID: United States Agency for International Development
SIAPS: System for Improved Access to Pharmaceuticals and Services
ED: Essential Drugs
HC: Health Center
NPD: Non Program Drug
ART: Antiretroviral Therapy
HF: Health Facility
RMNCH: Reproductive Maternal Neonatal and Child Health
Page | viii
Abstract
Effective supply chain management practices has become a valuable way of securing
competitive advantage through customer satisfaction since competition is no longer between
organizations, but among members of supply chains. The demand for medicine supply in
Ethiopia has increased dramatically as the number of health facilities, including pharmacies,
establishments has grown over the last two decades (WHO, 2016). Therefore, this study aims
to outline factors associated with drug supply chain and their effect on the level of
patient/client satisfaction in community pharmacies of Addis Ababa, Ethiopia. The study
adopted a case study descriptive design. The targeted population comprises adults as well as
Ethiopian of all gender, educational status, socio-economic status and residential areas, who
requested pharmacy service in community pharmacies. This research used three dimensions
of SCM practice (collaboration, information sharing and logistics design) and tested the effect
of SCM practices on customer satisfaction. Representative samples are selected using a
formula (Cocharan formula).The data for the study was collected from 385 customers of
different community Pharmacies. In addition, a questionnaire also distributed for both Head
pharmacists and Dispensers as a supporting data .The relationships proposed in the
framework were tested using Pearson correlation, and the causal relations were analyzed
using regression analysis. From the result of the analysis it is concluded that there is strong
relationship between each SCM practices (Collaboration, Information sharing and Logistics
design) and customer satisfaction. Therefore, in order to achieve advancement of
pharmaceuticals service in the long-run through enhancing customer satisfaction, it is better
for the community pharmacies to give due emphasis to the improvement of those SCM
practices.
Keywords: Pharmaceuticals, supply chain management, customer, satisfaction, practices,
community pharmacies.
Page | 1
Chapter One
Introduction
This chapter is going to address back ground of the study, statement of the problem, basic
research questions, objective of the study, significance of the study, scope of the study, limitation
of the study, operational definition of terms, and finally give organization of the study.
1.1 Background of the Study
Supply chain management in the public health sector has received increasing attention in recent
years, as both a priority and a challenge for many countries, as health care institutions find
themselves with increasing number of products, programs and patients to manage. Stakeholders
in the healthcare supply chain can be divided in to the major groups: producers, purchasers, and
providers. The role of producers is to manufacture medical products such as surgical supplies,
medical devices and pharmaceuticals. Purchasers include distributers, wholesalers and group
purchase organizations (GPOS). Distributors and wholesalers held inventory for producers in
order to represent those at the end of the supply achieve economies of scale by aggregating the
volume of member providers. Health care providers chain with the function to serve patients and
include, among others, hospitals, integrated delivery networks (IDNS), physicians, clinics,
nursing homes and pharmacies (Paul et.al, 2014).
Supply Chain Management Practices correctly applied in Public Health Institutions can
contribute greatly in maintaining the availability of essential drugs in public health institutions.
Firms hold inventory (stock) for two main reasons, to reduce costs like logistic costs and to
improve customer service. The motivation for each differs as firms balance the problem of
having too much inventory (which can lead to high cost) versus having too little inventory
(which lead to cost of lost sales) (king and Phumpiu, 1996).
The largest share of the world‟s population that does not benefit from simple, safe ,effective
pharmaceuticals; and millions of children and adults who die each year from common
conditions that can be prevented or treated with modern medicines signal , fundamental failure of
health care systems. In the late 1970s, 60 to 80 percent of people in developing countries were
estimated as lacking regular access to even the most essential medicines. By 2003, WHO
Page | 2
estimated that less than half the citizens in 32 percent of the world‟s poorest countries lacked
regular access to essential medicines, which improved on 1999 access estimates (WHO
2006c).Lack of access is directly related to income-81 percent of the countries with the lowest
access to medicines also had the lowest incomes Those who do have access to essential
medicines often receive the wrong medicine, the wrong dosage, or a quantity insufficient for
their needs. Some countries, many modern medicines are dispensed without prescription by
untrained and unlicensed drug sellers. Even when patients and consumers receive the correct
medicine, half do not consume it correctly. (Management Science for Health, 2012).
Many public health interventions depend on the availability, cost, and quality of pharmaceutical
drugs. Although an intervention may be designed to meet health needs by delivering a vaccine or
medicine to the population, real-world conditions may limit the program‟s effectiveness if there
are pervasive barriers to the selection, financing, manufacturing, distribution or use of the
required drugs. The principal goal of the emerging field of pharmaceutical management is to
improve and expand access to quality medicines. In low and middle income countries, this is
especially challenging due to paucity of domestic financial resources, human resources, technical
knowledge, political will, or uncoordinated health efforts between public, private, and
international actors (Brandon, 2010).
Unlike other goods and services health care services embody some unique characteristics
stemming from inherent market failures. First is the asymmetry of information, and agency
challenge of physicians, acting as agents of patients. Patients are aware they don‟t feel well but
they rely on health professionals, often physicians, to act as their agents in diagnosing and
treating ailments. Patients are ill-equipped to assess the adequacy and quality of physician
decisions and actions, and therefore focus on the environmental and interpersonal aspects of
clinical services, the elements they are best able to evaluate (Maureen, 2006).
For nearly 25 years, the world health organization has identified meeting individual‟s universally
legitimate expectations as a key health system objective. Patient satisfaction and rating have been
given increasing importance for measuring the quality of health services and are routinely used
in developed countries for continuous quality improvement and value-based incentive payments.
In addition to the intrinsic importance of meeting reasonable expectations, patient satisfaction
Page | 3
and perceptions are associated with health care utilization and choice provider (Emily
et.al.2012).
The Ethiopian local pharmaceutical market is growing at an annual rate of around 15%; it is
currently valued at over USD400 million from below USD 200,000.00 in 2000. The share of the
domestic pharmaceutical market held by locally produced medicines is around 20% and rest is
filled by importation. The government of Ethiopia has commitment to improve local production
by supplying 50% of the national medicines demand and export of medicines worth USD20
million by end 2025. The demand for medicine supply in Ethiopia has increased dramatically as
the number of health facilities, including pharmacies, establishments has grown over the last two
decades (WHO, 2016). Therefore, this study aims to outline factors associated with drug supply
chain and their effect on the level of patient/client satisfaction in community pharmacies of
Addis Ababa, Ethiopia.
1.2 Statement of the Problem
In Ethiopia, majority of the common leading causes of morbidity (Pneumonia, Malaria, Acute
Upper Respiratory Infections, Helminithiasis, Acute Febrile Illness and Diarrhea) and mortality
(Pneumonia, Tuberculosis, Malaria, Neonatal Sepsis and Meningitis) can be substantially
reduced if carefully selected, low-cost pharmaceuticals are available and appropriately used
(Abiye et al.,2013).In this regard efforts have been made to increase the accessibility of essential
drugs such as increasing budget allocation by government and adaption of the pull system, but
researches showed that availability of essential drugs in public health facilities in various part of
the country is still a challenge( Carasso etal. 2009; FMOH, 2011; Nigussie, 2014).
Availability of essential drugs is the construct of the components of the pharmaceutical supply
chain (selection, quantification, procurement and distribution), and a failure in one part of the
system leads to the failure of the whole pharmaceutical management process. Lack of effective
pharmaceutical supply chain not only affects the availability of essential drugs but also
significantly affects efficiency. Deficiencies in selection, quantification, storage, as well as high
prices, poor quality, theft, expiration of drugs, irrational prescribing and incorrect use of
medicines by patients cause losses totaling 70% of the original expenditure (MSH,2011)
Page | 4
According to the government of Ethiopia mission statement, “ the government has commitment
to improve local production by supplying 50% of the national medicine demand and export of
medicine worth 20 million by end 2025” (WHO,2016), satisfying the demand of the whole
health care system in general and the medicine demand in particular is mandatory. As a capital
city of Ethiopia, Addis Ababa houses many organizations that have stake with the
pharmaceutical supply chain including, the Central Pharmaceutical Fund and Supply Agency
(PFSA), and around 130pharmaceutical importers and wholesales (FMHACA, 2013). Moreover,
many pharmacy and other health professionals, health facilities, and non-governmental
organizations that work on the health sector are more concentrated in Addis Ababa than other
part of the country (FMOH, 2013; Charities & Societies Agency, 2010). Hence, any problem in
the pharmaceutical supply chain in Addis Ababa has the probability of being manifested
throughout the country.
In addition to hospital pharmacies and other health care facilities, community pharmacies are
one important aspect of the health care environment, since the society is getting its medicine
requirement from them. However, recently patient/clients that are visiting these community
pharmacies are not getting the drugs or other health care materials they required all the time. In
preliminary study before hand, many pharmacists and drug dispensers report that they are unable
to get the drugs / medical supplies that are required by the community pharmacies to satisfy their
customers‟ demand currently. Some others report that they are having problems in setting prices
for drugs and medical supplies since there is high fluctuation in purchasing those drugs and
medical supplies from whole sales and importers. These specifically affect chronic patients
(people that are talking medications in order to control their health states lifetime, example
people living with diabetes and hypertension) and people who are dependent on taking drugs
regularly in order to maintain their health condition(people living with HIV/AIDS). These drugs,
the drugs which are taken by chronic patients regularly, are not only costly but also disappear
from market for unlimited time.
In response this problem the current study investigated the authenticity of these complaints
through determination of the availability drugs,other products required, making the community
pharmacies more helpful and gets their customers satisfied from the service they get.
Page | 5
1.3. Basic Research Questions
What is the practice of drug supply chain management in community pharmacies of
Addis Ababa?
What is the reaction of patient/client satisfaction on the service of community pharmacies
of Addis Ababa?
What is the effect supply chain management on patient/client satisfaction?
What are the challenges for community pharmacies operating in Addis Ababa hindering
to meet their patients/clients expectation?
1.4. Objective of the study
1.4.1. General Objective
The general objective of this study is to analyze the effect of drug supply chain management
on level of patient/client satisfaction in community pharmacies of Addis Ababa.
1.4.2. Specific Objectives
The specific objectives of this study are:
To determine the practice of drug supply chain in community pharmacies of Addis Ababa.
To assess the reaction of patient/client satisfaction on the service of community pharmacies
of Addis Ababa.
To assess the effect of supply chain management on patient/client satisfaction.
To identify challenges for community pharmacies operating in Addis Ababa hindering to
meet their patients/clients expectations.
1.5. Significance of the Study
This study assessed factors associated with patient/client satisfaction such as provider ability,
wait time, drug availability, facility appearance, patient/client expectation…etc; and identify
some of the challenges related with patient/client satisfaction in community pharmacies of
Addis Ababa. The finding and recommendation of the study will be useful for policy makers
and other stakeholder to find ways of improving patient/clients satisfaction level.
Page | 6
The study may contribute to government policy formulation that would enable constant
availability of drug and medical supplies in pharmacies as well as public health institutions.
This intern results in improved service provision in health sector. In addition to this, the study
assists stake holders (producers, importers, wholesalers, distributors and retailers) in their
endeavor to utilize supply chain management practices to improve inventory. The study can
also be useful for academicians to study further in the area.
1.6. Scope of the Study
The scope of the research is to see the effect of drug supply chain management on patient
/client satisfaction in community pharmacies of Addis Ababa. Addis Ababa City, the capital
city of Ethiopia covers an area of540 km with a total population of 6.6 Million. The population
of Addis Ababa in the year 2017 as per estimated data=6.6million (population of 2017 .com).
It is administratively sub-divided into 10 sub-cities (City Government of Addis Ababa,
2012).According to 2017 health and health related indicator there are 11publichospitals, 37
private and NGO hospitals, and 50 Health Centers, while 25 more Health Centers are under
construction. 308 community pharmacies and 232 drugstores are also active in the city. The
study conducted on thirty- one (31) selected pharmacies in Addis Ababa. This study was
conducted from November, 2017 to May, 2018 in HCs in Addis Ababa. The study utilized
both quantitative and qualitative research methods through a case study descriptive design.
The study does not include hospital pharmacies, drug stores, rural drug venders and
community pharmacies that are not found in Addis Ababa. This is due to time and budgetary
constraints.
1.7. Limitation of the Study
The limitation of the study is that it only focuses on the case of “community pharmacies” of
Addis Ababa. Assessing the effect of drug supply chain management on the level of
patient/client satisfaction in hospital pharmacies, drug stores, drug venders, other stake holders
of the pharmaceutical sector in Addis Ababa; and detailed analysis of data is needed for further
conclusion.
Page | 7
1.8. Operational Definition of Terms
Drug: natural or synthetic substance which (when taken into a living body) affects its
functioning or structure, and is used in the diagnosis, mitigation, treatment or prevention of
disease or relief of discomfort.
Drug supply chain management: managing drug supply and demand ,sourcing raw materials
and parts, manufacturing and assembly, warehousing and inventory tracking, order entry and
order management, distribution across all channel, and delivery to the customer.
Patient/client satisfaction: the degree of positive feeling that patients/clients experience
having used a service.
Pharmacy: a shop or hospital dispensary where medical drugs are prepared or sold.
Community pharmacy: any place under the direct supervision of a pharmacist where the
practice of pharmacy occurs or where prescription orders are compounded and dispensed other
than hospital pharmacy or a limited service pharmacy.
Pharmaceuticals: all medicine, laboratory reagent, medical supplies and medical equipments.
1.9. Organization of the Study
This study is organized as follows: in chapter two, a brief literature review of current
publications that are related to patient / client satisfaction and drug supply management is
presented. This is followed by research methodology consists of a case study describing what
and how of patient/client satisfaction level. Next to this, drug supply chain management is
placed as a means to bring optimum patient satisfaction level. Synthesis and analysis of data is
presented to highlight some aspect of the above mentioned case, focusing on problems and
solutions that are critical to achieve optimum patient/client satisfaction level. Lastly, the final
chapter presents summary of major findings, some conclusions and recommendations.
Page | 8
Chapter Two
Related Literature Review
2.1. Theoretical Review
In this part concept of supply chain, supply chain management, drug supply chain
management, customer/client satisfaction and patients‟ satisfaction will be discussed as they
are stated by different writers as follows:“A supply chain is the alignment of firms that brings
products or services to market.” (Lamber etal, 1998). “A supply chain consists of all stages
involved, directly or indirectly, in fulfilling customer request. A supply chain not only includes
the manufacturer and suppliers but also transporters, ware houses, retailers, and customers
themselves.”(Chupra etal, 2001). From the above two scholars, one can understand that all
business activities are incorporated in supply chain activities.
After seeing some definitions of supply chain then let us see the definition of supply chain
management; “supply chain management is the systematic, strategic coordination of the
traditional business functions and the tactics across these business functions within the supply
chain, for the purposes of improving the long term performance of the individual companies
and the supply chain as a whole” (Mentzer etal, 2001).According to Jabulani Nyenwa (2005),
there are four kinds of supply chain management. These are full supply where supply matches
demand; limited supply here demand exceeds supply; integrated supply(the supply chain is a
network of suppliers, factories, warehouses, distribution centers and retailers through which
raw materials are acquired, transformed and delivered to customers.); vertical supply( this is an
arrangement in which the supply chain of a company is owned by that company). He also
mentioned abut some test of supply chain management, he called this test acid test which is the
barometer of effective supply chain management. As he stated it, an effective drug supply
chain management can be tasted by the availability of the right medicine, in the right quantity,
for the right patient, at the right time, in the right condition, at the right price. (Jabulani
Nyenwa, 2005).
Supply chains are critical in defining the ultimate cost and accessibility of medicines. A well
functioning health supply chain provides broad geographic access to affordable, high quality
Page | 9
products. In addition, good supply chains operate with efficiency, adaptability, and financial
integrity. (WHO/HAI, 2008; Asante, Aikins, 2008).
Effective procurement is an important step in pharmaceutical logistics system. An effective
procurement process seeks to ensure the availability of the right pharmaceuticals, in the right
quantities, at reasonable prices, and recognized standards of quality (MSH,2011).It is
dependent on the routine availability of logistics data (e.g., rate of consumption and stock
levels) and the capacity to select products and to forecast and quantify needs(Raja et al., 2006.)
In Tanzania, only 25% of the health facilities surveyed conducted quantification on annual
bases, and majority of them did not provide training on quantification to the staff (MOHSW,
2008).There are numerous mechanisms by which health facilities manage their in-house
procurement of pharmaceuticals ranging from open tender to direct procurement. They may
procure pharmaceuticals by schedule or as needs arise. All these mechanisms have their own
advantage and disadvantage in different situations. For example, a survey of health facilities in
Tanzania revealed that the main method of procurement used by the facilities was direct
procurement-the main supplier being the Medical Stores Department, a semi-autonomous unit
under the Tanzanian ministry of health. The Medical Stores Department on other hand
procures Essential Drugs through international competitive biddings (MOHSW, 2008).
A well-organized pharmaceutical supply chain management ensures the continuous
availability of all pharmaceuticals that are required for patient care. At the same time, an
effective pharmaceutical supply chain should be able to respond to sudden increases in drug
demand, ensuring that adequate supplies are available to deal with any emergencies that arise
(FMOH, 2010).Stock availability is the ultimate measure of the other components of the
supply chain management and it also gives an idea of the overall effectiveness and efficiency
of the system, from forecasting and procurement to distribution, storage and inventory
management(John Snow Inc./DELIVER, 2004).
Measuring the availability of Essential Drugs at health facilities is one of the core components
of the assessment of readiness of facilities to deliver quality services. The health facility
assessments, however, employ a wide variety of tools and approaches to measure availability
of Essential Drugs. For example, rapid assessments employ the reported availability by
Page | 10
respondents without verification as a measurement of availability of Essential Drugs, while in-
depth facility assessment methods validate the reported response by observing the medicines,
verifying the expiration dates and collecting further data on stock-out over an extended period.
As a result, medicine availability estimates may vary across definitions, and need to be
interpreted with careful consideration of the methods used (Choi & Ametepi,
2013).Researches done in Sub-Saharan countries showed that availability of Essential Drugs
has been improved, but still far from the WHO recommended target of 100% (WHO, 1993).In
Ghana, the availability of key Essential Drugs selected for the country in public health
facilities was 80%; and length of stock out duration 29.9 days(Ministry of Health of Ghana
2009).In Tanzania, Uganda and Kenya, all of them East African countries, the availability of
key Essential Drugs was 88.9%, 45.7%and 82.6%, respectively (MOHSW, 2008; Ministry of
Health of Uganda, 2008; WHO, 2009).Though the availability of Essential Drugs seems high
in the health facilities of Tanzania, the same facilities also presented a considerable number of
stock-out days. Some medicines were out of stock for 4 months with the median number of
stock-out 135.6 (MOHSW, 2008).In Uganda, the length of stock-out duration in public health
facility pharmacy was 72.9 days (Ministry of Health of Uganda, 2008).A cross-sectional study
conducted in health centers of Western Ethiopia showed that only 55.6% of the assessed drugs
were available (Abiye et al., 2013).
The choice of essential medicines depends on many factors, such as the pattern of prevalent
diseases, treatment facilities, the training and experience of available personnel, financial
resources, and environmental factor (MSH, 2011).In health facilities found in Sub-Saharan
countries where resources are scarce, wise selection of medicines most relevant to the health
facility is indispensable. Spending the available scarce fund in duplicative and unnecessary
drugs may lead to the stock-out of other essential medicines. (MOHSW, 2008).Essential Drugs
require specific procedures and conditions for safe storage that protect their integrity and
effectiveness, maximize their shelf life, and make them readily available for distribution. The
procedures should include about the dimensions and design of the storage space, appropriate
conditions for storage of drugs, and the importance of stock rotation and systematic
arrangement of stock, as well as attention to cleanliness, fire-prevention measures, and security
within the store.
Page | 11
A drug product must retain its properties within specified limits in order to be useful. When
Essential Drugs are stored appropriately, clients can be assured that they will receive a high-
quality product. The stability of a drug product depends on the active ingredient, which can be
affected by its formulation and packaging. Inadequate storage and distribution can lead to
physical deterioration and chemical decomposition, and reduced potency (MSH, 2011).
In Sub-Saharan countries like Uganda, and South Sudan, only 63.6% and 35% of the surveyed
health facilities had adequate storage practices, respectively (Ministry of Health of Uganda,
2008; GhTech,2011). In Kenya, adequacy of storage in public health facilities was only 60%
(WHO, 2009).A study done in Tanzania probably showed the situation of storage practice of
pharmaceuticals in detail. The study revealed that most health facilities (71%) had a main
storage place, but the storage space for forecasted quantities of medicines and medical supplies
was inadequate and this was affirmed by 56% of facilities surveyed. The study reported that
expired stocks did have a separate storage space in only 41% of the health facility pharmacies.
As regards products requiring cold storage, only 52% of the health facilities had the equipment
(MOHSW, 2008).
Pharmaceutical logistics data are collected, processed, and reported through LMIS, increasing
the likelihood of an adequate supply of Essential Drugs. An effective LMIS may be manual or
computerized collecting essential data about stock status and consumption. It ensures
accountability, a reduction in supply imbalances (stock outs and overstocks), and efficient,
cost-effective pharmaceutical logistics. Because a pharmaceutical logistics system cannot
function effectively without timely, accurate LMIS data, the LMIS is an essential tool. It
provides personnel responsible for pharmaceutical logistics with the information they need to
react or, more important the information they need to anticipate demand (Shawkey & Hart,
2003). To be effective, LIMS should be equipped with adequate trained staff, forms,
equipments, and facilities. However, some studies showed that there is a problem in this regard
(MOHSW, 2008;GH Tech, 2011).LMIS is an important tool in inventory management,
therefore accurate record keeping is essential. A study in Tanzania reported8% and 72%
recorded balance that was less and greater than the physical count (Kagashe &Massawe
2012).Another study done in Tanzania showed that often neither minimum nor maximum
levels were defined(MOHSW, 2008).To the worst, in South Sudan, only 27% of the assessed
health facilities were reported to fill forms accurately(GH Tech, 2011).
Page | 12
The current Ethiopian health care system is guided by a National Health Policy which was
issued in 1993 following changes of government in 1991 (MOH,1993). The policy was the
first of its kind in the Ethiopia in a sense that it incorporates elements of democratization,
decentralization, inter-sectoral collaboration, collaboration with neighboring countries, and
promotion of the participation of the private sector in health care. The policy also calls for the
promotion of occupational health and safety, environmental health and the extension of health
services to pastoralists and other rural populations, the urban poor and victims of manmade
and natural disasters (Kloos H.1997). In response to high burden of ill health and high rate of
mortality in the country because of poor access to health services and complex health system,
the Ethiopian government has sought to reform the health service system into a cost-effective
and efficient system for past several years. Accordingly, a twenty-year health development
implementation strategy, known as Health Sector Development Program (HSDP) with a series
of five-year investment programs was launched in 1998 which is aligned with the wider frame
works of Plan for Accelerated Development to End Poverty and Millennium Development
Goals. Currently the country is implementing the fourth year of HSDPIV (FMOH,
2011).Regarding the health delivery system, Ethiopia implemented a three-tier health service
delivery system characterized by a first level of a Woreda /District health system comprising a
health center (40,000 population) in urban areas, and primary hospital (with population
coverage of 60,000-100,000 people), health centers (1/15,000-25,000population) and their
satellite health posts (1/3,000-5,000 population) in rural areas that are connected to each other
by a referral system. A primary hospital, health center and health posts form a primary health
care unit with each health center having five satellite health posts. The second level in the tier
is a General Hospital with population coverage of 1-1.5 million people; and the third a
Specialized Hospital that covers population of3.5-5 million(FMOH, 2011).
As part of the health care reform, Business Process Reengineering (BPR) was employed in
Ethiopian Fiscal Year 2001 with key principle of bringing a significant improvement in the
quality of health services through the institutionalization of accountability and transparency.
One mechanism of achieving this was to seriously consider the separation of purchaser,
provider and regulator in the health system (FMOH, 2011).As part of this important endeavor,
the former Drug Administration and Control Authority (DACA) has undergone an institutional
transformation to a new agency called Food, Medicine and Health Care Administration and
Page | 13
Control Authority (FMHACA). The mandate of the new agency is to undertake inspection and
quality control of health and health related products; premises, professionals and health
delivery processes in an integrated manner (HPR of FDRE,2010).The National Drug Policy of
1993 which is part and parcel of the health policy has served as an umbrella for pharmaceutical
services in Ethiopia (MOH,1993).Since the start of HSDP I, the government of Ethiopia was
committed to ensuring community‟s access to the essential medicines that are safe, effective
and of assured quality including rational drug prescription and use.
Moreover, since HSDP III a number of reforms have been employed that have significant
impact on quality of pharmaceutical service. One of the reforms is the Pharmaceutical
Logistics Master Plan (PLMP) which was introduced in 2009 with the aim of ensuring the
uninterrupted supply of essential, quality and cost-effective pharmaceuticals at all health
facilities (FMOH, 2009). To achieve this, the Pharmaceutical Fund and Supply Agency
(PFSA) were created with mandates: to supply the entire country with both Program and
Essential pharmaceuticals, as well as serve as the distribution entity for vaccines, other health
facility supplies, and laboratory equipment (The World Bank, 2009).So as to execute its
mandate in the area of pharmaceuticals supply in an efficient and effective manner, PFSA
developed the integrated pharmaceuticals logistics system that integrates the drug, distribution,
and reporting of essential pharmaceuticals that used to be managed vertically into a single
mechanism (FMOH, 2009).
The next point is about customer satisfaction. First, it is better to see the importance of
customer satisfaction; according to Schoenfeld (2008), customer satisfaction is important
because it will help us guaranty that our customer will continue to buy our products or
services. “iso9001:2000, section 8.2.1 customer satisfaction, says the following:
As one of the measurements of the performance of the quality management system, the
organization shall monitor information relating to customer perception as to whether the
organization has met customer requirements. The methods for obtaining and using this
information shall be determined.” (Schoenfeld, 2008)
Finally let us see what patient satisfaction is. Among the scholars who wrote about patient
satisfaction, Ifikar Ahmed and Sirajud Din (2010) are one of them. They defined satisfaction and
Page | 14
patient satisfaction as follows: “satisfaction is a psychological state resulting when the emotion
surrounding disconfirmed expectations is coupled with consumer‟s prior feelings about the
consumption experience. While patient satisfaction has been defined as the degree of congruency
between a patient‟s expectations of ideal care and his/her perception of the real care him/her
receives.” (Ifikar A. and Sirajud D., 2010).
2.2 Empirical Review
According to an article called “Managing Drug Supply” published in “Essential Drugs Monitor”
(1998), health services throughout the world are presented with a fairly common set of health
problems for which essential drugs have an important role; through the relative frequencies of
specific illness vary among countries. In addition to this, if carefully selected, low cost
pharmaceuticals are available and appropriately used, there would a huge reduction of mortality
caused by illness in developing regions. Even in industrialized countries efficient drug supply
management is important to reduce escalating costs of health care and bring effective and
affordable health care service globally. In contrast to this, the experience of many countries
showed that substantive and sustainable improvement in the supply and use of drugs are
possible. Negative experience of the past has shown that success cannot be achieved if there is
no clear goals, sound plans, effective implementation and monitoring of performance.
John (2015) and his colleagues put pharmaceutical supply as complex and overlapping. “ the
pharmaceutical supply chain is complex , and involves multiple organizations that play differing
but some- times overlapping roles in drug distribution and contraction price variability across
different types of consumers is a common phenomenon due to the level of complexity”.(John
etal,2015). The above mentioned people put pharmaceutical supply as a difficult task for policy
makers. To understand this, assessing all supply chain related issues is mandatory. They also put
expressions of inefficient supply chain as follows: product discontinuity, product shortages, poor
performance, lowered patient safety, dispensing errors and technological errors causing stock
shortages in pharmacies.
Ayad (2011) put inventory as the stock of pharmaceutical products retained to meet future
demand. “Inventory represents the largest asset in pharmacy practice, and its value continues to
rise because of the growth in variety and cost of pharmaceutical products,” (Ayad, 2011).
According to Ayad (2011), in pharmacy practice, the role of efficient inventory management
Page | 15
from both financial and operational perspective is very huge. Ayads‟ (2011) conclusion is that
inventory management is reducing carrying costs, while maintain an effective stock of products
to satisfy customer and prescriber demands.
Mezid M. (2014) stated that majority of the common leading causes of morbidity can be
substantially reduced if essential drugs (EDs) are made available and appropriately used; where
functioning of pharmaceutical logistics system is necessary in Ethiopia. Mezid M. (2014) further
stated that tracking changes and improvements of the pharmaceutical logistics performance is
important. His target was to study the pharmaceutical logistics system of health centers (HCs) in
Addis Ababa giving emphasis to non-program drugs (NPDs). At the end of his research he is
able to draw the following conclusions: “there was no major problem common to all HCs
regarding drug selection. In adequate supply of NPDs at PFSA (pharmaceutical fund and supply
agency) was a major obstacle for the overall logistic system. Transportation of NPDs and
infrastructure related to medicine waste management were not adequate, therefore, PFSA should
enhance its capacity in all aspects. HC‟s pharmacy, stockholders should construct standard stares
and medicine waste disposal sites” (Mezid M, 2014).
Marks (2009) and Yadavetal (2011) stated that the world health organization (WHO) defines
access to medicine as a priority for citizens. “Medicine needs to be available at all times in
adequate amount, in appropriate dosage and quality and at an affordable price for individuals and
communities.” (Marks, 2009 and Yadav etal, 2011). They have also estimate that two billion
people do not have access to medicines and four million lives per year could be saved in Africa
and south East Asia with the appropriate treatment and medicine. Based on their estimate, WHO
and 192 states committed themselves to reaching eight millennium development goal on the list
to reduce the child mortality rate, to improve maternal health and to combat HIV/AIDS, malaria
and other disease (WHO,2012). The other person related to this issue is Anna (2013). She said
that WHO focuses on policies, access, quality and rational use, so as to ensure medicine
availability, as it is displayed in the figure below.
Anna (2013) also said that to ensure people have access to essential medicines and to preserve
the quality of the medicine, a functioning medicine supply chain is necessary, which includes
procurement, appropriate ware housing and efficient transportation.
Page | 16
Mohamed B. Ayalew (2017) and his colleague defined patient/ client satisfaction as the degree
of positive feeling that patients/clients experience having used a service. He also puts
patient/client satisfaction as the gap between quality of service expectation and the actual
experience of the service provided from the patients‟ point of view. According to Mohammed B
.Ayalew (2017) and his colleagues “patient satisfaction has become an integral component of the
quality of health care services. It is becoming a popular health care service. It is becoming a
popular health care quality indicator, in which pharmaceutical services are an essential part as it
reflects the reality of service or care provided. It is an established fact that satisfaction influences
adherence and seeking for medical attentions” (Mohammed B. Ayalew etal, 2017).
Mohammed B. Ayalew (2017) and his collagens has also done a review to explore the link
between treatment satisfaction and adherence, compliance, and persistence and concluded that
greater treatment satisfaction was associated with better compliance and improved persistence.
According to the above mentioned researchers, assessing patient satisfaction is an approach for
identifying and meeting patients‟ needs. Providing better access to quality pharmaceutical
service is a way to improve patients‟ satisfaction with health-care service. Low or high level of
patient‟s satisfaction and expectation of the pharmacy service might be influenced by a variety of
factors. Some of these factors are demographic characteristics of the patient, waiting time,
pharmacy setting, medication availability, and service quality. Furthermore, the patient
satisfaction level is found to be directly associated with patients expectations.
From the study by SIAPS, (2017) “in Ethiopia, the pharmacy practice at public health facilities
(PHF) and community pharmacies has largely been commodity centered than patient centered.
This has prevented pharmacists from being active members of the health care team and
contributing to better health outcomes. The lack of auditing practices and of transparent and
accountable systems for managing medicine transactions and services at public health facilities
have resulted in wasted resources, particularly those obtained through donations, including
medicines for opportunistic infections and anti-malarial medicines” (SIAPS, 2017).
According to Owonaro (2017), contemporary pharmacy practice exhibits an evolving paradigm
shift from traditional medication dispensing to more active and expanded clinical roles, such as
dirking of patient on dedication, counseling, screening prescriptions, dispensing and any other
management work related to the stocky of medications activities. (Owonaro A Peter, 2017).
Page | 17
Today, contemporary pharmacy practice exhibits an evolving paradigm shift from traditional
medication dispensing to more active and expanded clinical roles, such as clerking of patient on
medication counseling, screening prescriptions, dispensing and any other management work
related to the stocking of medications activities. Medication counseling has become a key
priority for modern community pharmacists. Medication counseling implies the provision of
medication information orally or in written form to the patients or their caregivers on rational use
of their medications. Studies have shown that right medication counseling by pharmacists
identify and correct potential drug therapy problems, side effects and adverse drug reactions.
This will provide patient satisfaction with the pharmaceutical services and consequently optimize
the patient quality of care. This implies that patient‟s expectations are being met and patient
quality of life equally improves (Yang S, Kim D, Choi HJ Chang MJ, 2016).
Pharmaceutical care is the key factor in pharmacy practice globally. This is aims providing a
better outcome for the patients. Patient satisfaction is one of those outcomes. For pharmacies to
have high patronage, their service must be attractive for patient inflow. Patient satisfaction is
likely to affect the image of the Pharmacist and pharmacy profession. The need to track patient
satisfaction and improvement of pharmaceutical services is vital (AzukaCO, Ehijie FOE,Obhie
AA,2004;Al-Arifi MN2012).Drug manufacturing, dispensing and giving pharmaceutical care to
patients will continue to be the primary responsibility of the pharmacist. Hence, proper
evaluation of the level of satisfaction with medication counseling is pivotal components for
predicting the quality of pharmacy services provided by the pharmacy. Medication counseling
refers to “providing medication information orally or in written form to the patients or their
caregivers on directions of use, advice on side effects, precautions, storage, and diet and lifestyle
modifications”. This will enhance rational use of medicines by the patients and Health
professionals. Although, the legal mandate have been given to the Pharmacists to provide
medication counseling to every patients, but they have failed to offer drug information to their
patients or just provide brief counseling upon patient request (Wilcock M, Harding G,2011).
In this part, different gaps identified from literature which are used as a resource in this paper
listed as follows. In the paper called “Assessment of Pharmaceutical Logistics System in Health
Centers of Addis Ababa” by Mesid Mudzteba (2014), only able to include 10 old health centers
in his study out of 50 health centers in Addis Ababa city. He had better include few new health
Page | 18
centers for the purpose of comparison. As there are a lot of health centers under construction, the
expected input from them would have been immunes for the study.
From the article called Managing Drug Supply in Essential Drug Monitor issue no.25&26(1998),
it is indicated that substantive and sustainable improvement in the supply and use of drugs is
possible. However, it is not indicated in terms of figures. It would have been better if it is
indicated by how much percent or degree the improvement is possible.
Optimizing Drug Supply Chain in Hospital Pharmacy Department done by John Mensah and
David Asamoah (2015) stated a lot about different supply chain practices giving stress on wait
time. But, they did not give any additional empirical findings to other parameters like product
discontinuity, unavailability of products…etc.
In “ Analysis of Challenges of Medical Supply Chains in Sub-Saharan Africa Regarding
Inventory Management and Transport and Distribution” by Anna Schopperle (2013), there are a
lot of good points mentioned about its major objective( identifying challenges for reliable
medicine supply chains with effective in-country distribution systems regarding the medicine
availability due to inventory management and transport distribution). In addition to this, it would
have been better if it has included patients‟ opinion about the case along with the professionals
working in supply area to get a comprehensive view about the entire supply chain. Furthermore,
patients are the ultimate users of medicines that have passed through each and every supply
system, their feedback is very important to evaluate the whole supply system.
Patients‟/clients‟ Expectation toward and Satisfaction from Pharmacy Service by Mohammed
(2017) etal have strong findings about patients‟/clients‟ expectation. However, it has only
included patients/clients who were visited hospital pharmacy. It would have been better if it has
included the perception of pharmacists, dispensers and other health professionals working in the
hospital to counter check the result obtained as a secondary source of data.
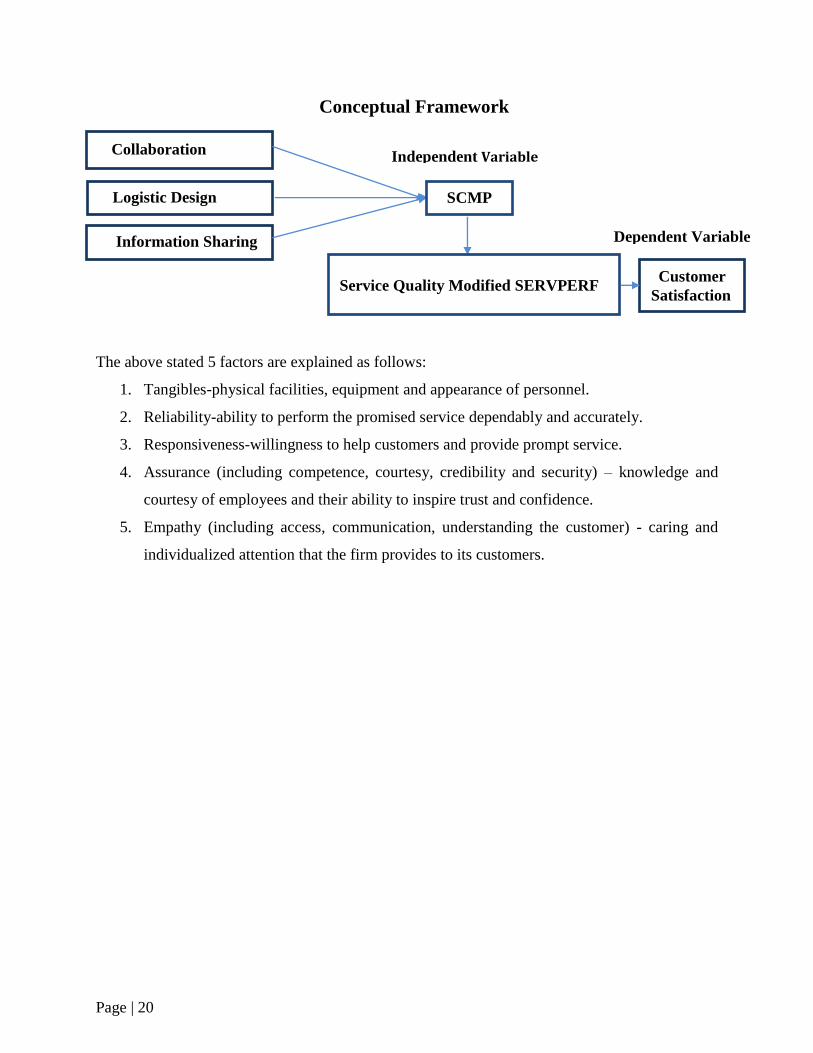
2.3. Conceptual Framework
The following is simple conceptual framework that explains the relationship among the
dependent variables tangibles, reliability, responsiveness, assurance and empathy as a measure
for patent/client satisfaction with that of the independent variable drug supply chain
Page | 19
management. The conceptual model below identifies the link between effects of supply chain
management practices on customer satisfaction. The framework proposes that SCM practices
will have an effect on customer satisfaction both directly and also indirectly. These factors,
factors used to measure patient/client satisfaction, are adapted from SERVPERF model.
SERVPERF is a modification of SERVQUAL model, and thus uses the same categories to assess
service quality. It uses an idea of perceived service quality leading to satisfaction. For the
retailing contexts where the service is more prominent than the goods SERVPERF is more
appropriate (Mattsson J, 1992). SERVQUAL model is one of service quality measurement
models which have been extensively applied and been developed by Parasuraman
etal.(1985,1986,1988,1991,1993,1994; Zeithamal .,1990).
Page | 20
Conceptual Framework
The above stated 5 factors are explained as follows:
1. Tangibles-physical facilities, equipment and appearance of personnel.
2. Reliability-ability to perform the promised service dependably and accurately.
3. Responsiveness-willingness to help customers and provide prompt service.
4. Assurance (including competence, courtesy, credibility and security) – knowledge and
courtesy of employees and their ability to inspire trust and confidence.
5. Empathy (including access, communication, understanding the customer) - caring and
individualized attention that the firm provides to its customers.
Customer
Satisfaction
Collaboration
Logistic Design
Information Sharing
SCMP
Service Quality Modified SERVPERF
Independent Variable
Dependent Variable
Page | 21
Chapter Three
Research Methods and Design
3.1. Introduction
This chapter will discuss the methodologies that would be used in gathering the data,
analyzing the data and reporting the results. The main aim here is at explaining the methods
and tools that will be used in collecting and analyzing data to get proper information related to
the impact and challenges of drug supply chain management practices on level of
patient/clients satisfaction in Addis Ababa.
3.2. Research Approach
In this study, inductive research approach is used. This approach is selected due to the
following reasons: there is generalization from particular observations of the case under study,
generalizing is from the interaction among the dependant variable and independent variables as
they are indicated in the conceptual framework .In addition, both qualitative and quantitative
research method is employed for exploring and understanding the meaning of the impact and
challenges of drug supply chain management practices on level of patient/clients satisfaction in
Addis Ababa.
3.3. Research Design
The study adopted a case study descriptive design. According to Donald and Pamela (2006),
descriptive research is a descriptive study deals with the what, how and WHO of a
phenomenon which is the concern of this study. “Case study is preferred in examining
contemporary events, but when the relevant behaviors cannot be manipulated. Case study has a
general advantage when a how or why questions are being asked over which the investigator
has little or no control” (Robert K.Yins, 2009).
The study specifically tried to ascertain the supply chain management practices among
selected community pharmacies in Addis Ababa and will sight to show their relationship to
patient/client satisfaction. The study identified the challenges faced in the adaption of supply
chain management practices. Descriptive design is considered appropriate for the study since it
Page | 22
helped to describe the phenomenon under study in its current state and its characteristics from
a larger number of respondents at lower cost within a short period of time.
3.4. Population of the Study
Polit and Hungeler (1999; 37) refer to population as aggregate or totality of objects, subjects or
members that conforms to a set of specifications. According to Addis Ababa‟s city
administration, the total population is estimated about 6.6 million out of which about 3.85
million (58.33%) falls under the age category of 18 – 70 years old. Since the aim of this study
is to assess the effect of drug supply chain management on the level of patient/client
satisfaction in community pharmacies of Addis Ababa. The targeted population comprises
adults as well as Ethiopian of all gender, educational status, socio-economic status and
residential areas, who requested pharmacy service in community pharmacies that are found in
Addis Ababa.
3.5. Sample Design
The units of study are patients/clients of community pharmacy. The study conducted a
judgmental sampling on patients/clients in thirty- one (31) pharmacies out of the total number
of community pharmacies Addis Ababa (308). These thirty- one (31) pharmacies were chosen
based on their distribution throughout the ten (10) sub cities of Addis Ababa. Moreover, some
of the selected pharmacies are branches of chain pharmacies that are found in the city.
Studying one of them can give a full picture about the situation in these chain pharmacies as
they have one central main store for all. The other criteria required to select these thirty one
(31) pharmacies is the area where the candidate pharmacy is found. To be selected, the
pharmacy should be found in an area where there is high population density. As there is a high
population density, it would help to address as much people as possible. Judgmental sampling
will be used to select the respondents as they are more conversant with these practices and will
give accurate and objective information. The sampling frames comprised patients/clients that
were selected from the thirty-one (31) pharmacies in Addis Ababa. In addition to this,
dispensers and pharmacy managers are asked about drug supply chain practices to use their
response as a secondary supportive data. A representative sample of 385 from the population
was selected by the use of formula. This is due that the respondents are large and dispersed all
Page | 23
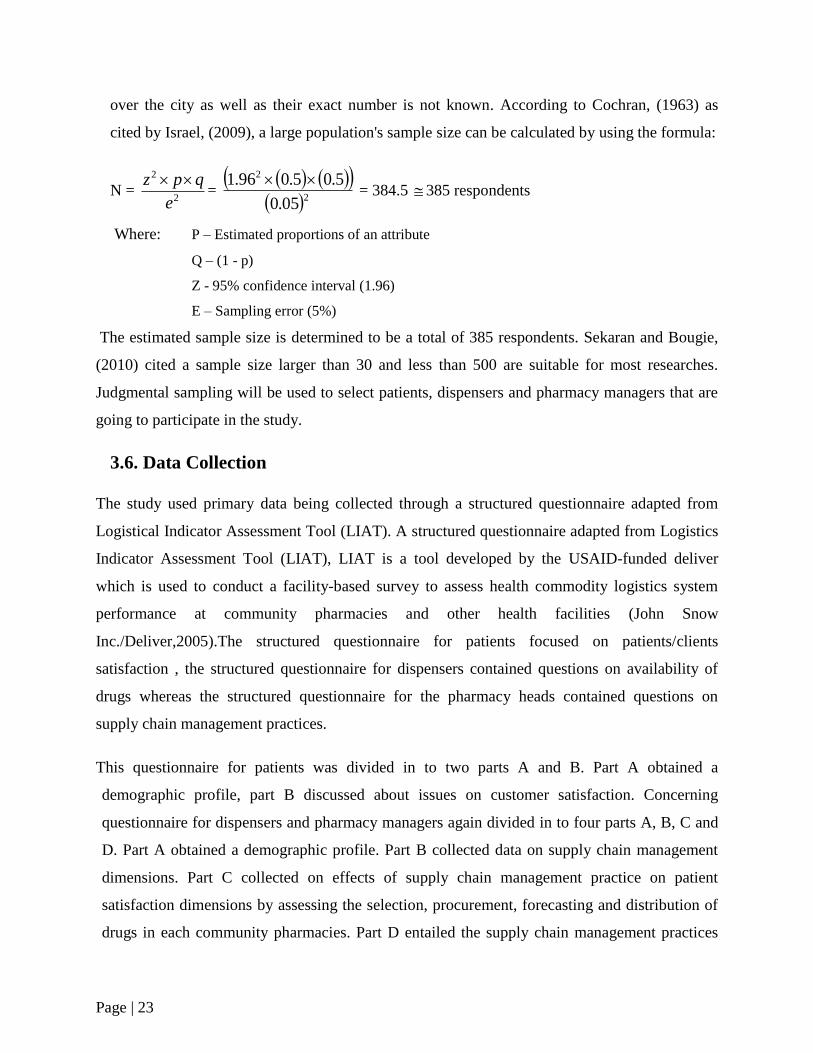
over the city as well as their exact number is not known. According to Cochran, (1963) as
cited by Israel, (2009), a large population's sample size can be calculated by using the formula:
N = 2
2
e
qpz =
2
2
05.0
5.05.096.1 = 384.5 385 respondents
Where: P – Estimated proportions of an attribute
Q – (1 - p)
Z - 95% confidence interval (1.96)
E – Sampling error (5%)
The estimated sample size is determined to be a total of 385 respondents. Sekaran and Bougie,
(2010) cited a sample size larger than 30 and less than 500 are suitable for most researches.
Judgmental sampling will be used to select patients, dispensers and pharmacy managers that are
going to participate in the study.
3.6. Data Collection
The study used primary data being collected through a structured questionnaire adapted from
Logistical Indicator Assessment Tool (LIAT). A structured questionnaire adapted from Logistics
Indicator Assessment Tool (LIAT), LIAT is a tool developed by the USAID-funded deliver
which is used to conduct a facility-based survey to assess health commodity logistics system
performance at community pharmacies and other health facilities (John Snow
Inc./Deliver,2005).The structured questionnaire for patients focused on patients/clients
satisfaction , the structured questionnaire for dispensers contained questions on availability of
drugs whereas the structured questionnaire for the pharmacy heads contained questions on
supply chain management practices.
This questionnaire for patients was divided in to two parts A and B. Part A obtained a
demographic profile, part B discussed about issues on customer satisfaction. Concerning
questionnaire for dispensers and pharmacy managers again divided in to four parts A, B, C and
D. Part A obtained a demographic profile. Part B collected data on supply chain management
dimensions. Part C collected on effects of supply chain management practice on patient
satisfaction dimensions by assessing the selection, procurement, forecasting and distribution of
drugs in each community pharmacies. Part D entailed the supply chain management practices
Page | 24
and service quality delivery challenges in community pharmacies in Addis Ababa.
Questionnaire is fast way of obtaining data as compared to other instruments (Mugenda and
Mugenda, 2003). The questionnaires were administered by the drop-off and pick-up later
method. A five point non comparative Likert scale and a two point of the same scale were used
for the respondents to read, understand and respond appropriately to the statements put across.
3.7. Research Area and Setting
Addis Ababa city, the capital city of Ethiopia covers an area of 540 km2 and total population of
3 million. It is administratively sub divided in to 10 sub-cities (city government of Addis
Ababa, 2012).The population of Addis Ababa in the year 2017 as per estimated data=6.6million
(population of 2017 .com). Addis Ababa has a total of 308 pharmacies, 249 drug stores, 1 rural
drug venders, 709 clinics, 140 importers and 93 whole sealers of human medicine. Six of the 11
pharmaceutical industries in Ethiopia are also found in Addis Ababa. (FMHACA, Google
Scholars).From all pharmacies in Addis Ababa, thirty one (31) are selected to conduct the study,
which are distributed throughout the ten sub cities of Addis Ababa city.
3.8. Data Collection Subjects and Participants
Quantitative data were collected by 2 data-collectors, who are junior pharmacists by profession,
taken 5 each sub cities and cover the whole Addis Ababa. The data collectors used researcher
administered- structured questionnaire, document review and structured observation methods.
To explore the facilitators and barriers of the pharmaceutical supply chain system, in depth
interview with the pharmacy heads of each community pharmacies were conducted by the
student researcher along with a structured questionnaire.
3.9. Date Analysis and Presentation
Data collected was analyzed using descriptive and regression analysis. Both the general and
specific objectives were analyzed using descriptive design to document supply chain
management practices at the community pharmacies and the challenges faced in implementing
the supply chain management practices to meet a high level of patient satisfaction.
Page | 25
3.10. Ethical Considerations
Before commencing data collection, ethical approval will be obtained from ethics review
committee of the school of commerce, Addis Ababa University. Then the selected community
pharmacies are communicated with formal letters from school of commerce, Addis Ababa
University. The study will be conducted after obtaining permission from the head of respective
community pharmacies. Participants of the study will be asked for consent before participating in
the study. During the consent process, they will be provided with information regarding the
purpose of the study, why and how they are selected to be involved in the study, and what will be
expected of them and that they can withdraw from the study at any time. Participants will also
be assured about confidentiality of the information in the course of the study by not using
personal identifiers and analyzing the data in aggregates. If there is a need, personal interview
might be conducted. Concerning the in –depth interviews, interviews will be recorded on digital
voice recorder after interviewees gave informed consent. The name of the interviewees and
community pharmacy in which they work will not appear in data analysis, and interviewees will
be assured that the information they provide will only to be handled by the research team, and
that it will not be discussed with the community pharmacy administrators or other participants of
the study.
Page | 26
Chapter Four
Data Presentation and Analysis
4.1. Introduction
As discussed in previous chapter, this study attempted to examine the relationship between drug
supply chain management practices and patient/client satisfaction in community pharmacies of
Addis Ababa city. Therefore, the findings of community pharmacies are presented and discussed
in this chapter. Some of the questionnaire were developed in five scales ranging from five to
one; where 5 represents very high,4 high, 3 average, 2 low, and 1 very low. Whereas the other
was developed in nine scale ranging from nine to one. In order to assess the relationship between
supply chain management practices and customer satisfaction, correlation and regression
analysis were conducted for scale typed questionnaire. A total of 385 questionnaires were
distributed to patients/clients and 31each questionnaires were distributed to head pharmacists and
dispensers as a supporting data. The collected data were presented and analyzed using SPSS
(version 20) statistical software. The study used descriptive statistics and inferential statistics.
Therefore, mean, standard deviation, correlation analysis, specifically Pearson correlation to
measure the degree of association between different variables under consideration used.
Regression analysis was also used to test the effect of independent variable on dependent
variable.
4.2. Descriptive Statistics
4.2.1 Frequency Analysis of the Respondents’ Profile
The demographic profile of the sample respondents is presented and analyzed below. The
purpose of assessing respondents‟ age, sex, is that, to determine whether the researcher
considered heterogeneity of sample units. On the other hand assessing the work experience and
education level of the respondents‟ is that, when the respondents are more experienced and
educated they have better opportunity to understand the case and give better response than else.
Page | 27
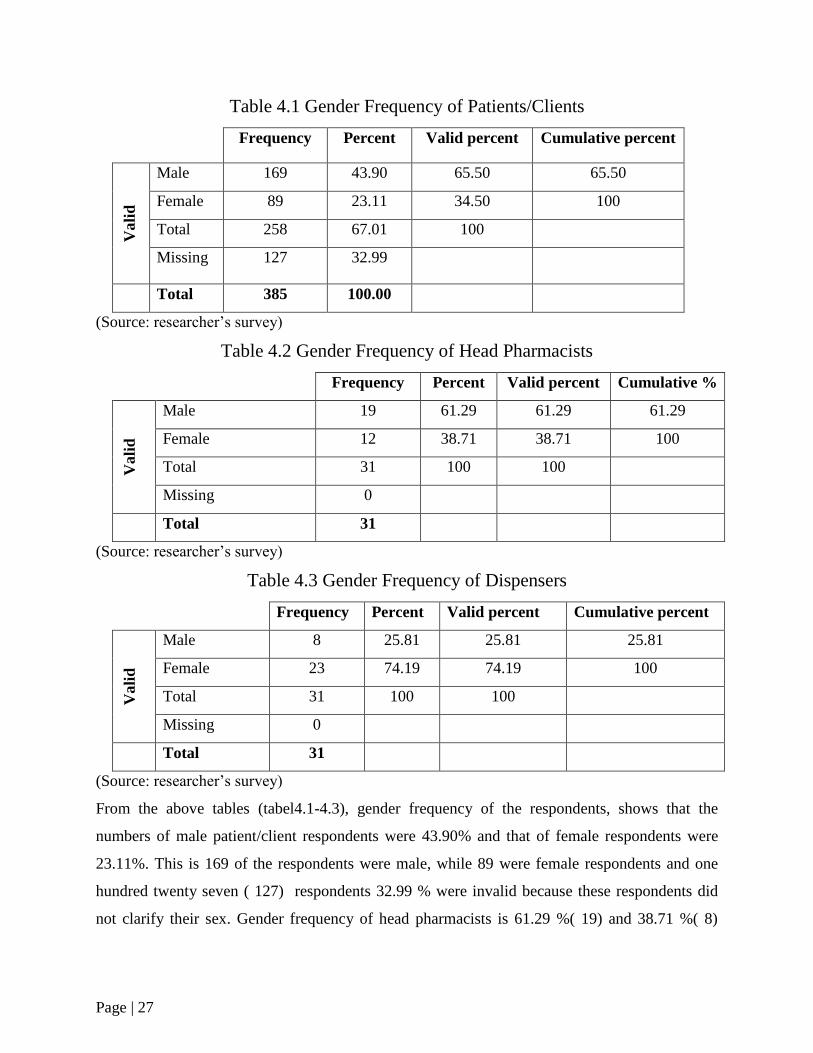
Table 4.1 Gender Frequency of Patients/Clients
Frequency Percent Valid percent Cumulative percent V
ali
d
Male 169 43.90 65.50 65.50
Female 89 23.11 34.50 100
Total 258 67.01 100
Missing 127 32.99
Total 385 100.00
(Source: researcher‟s survey)
Table 4.2 Gender Frequency of Head Pharmacists
Frequency Percent Valid percent Cumulative %
Vali
d
Male 19 61.29 61.29 61.29
Female 12 38.71 38.71 100
Total 31 100 100
Missing 0
Total 31
(Source: researcher‟s survey)
Table 4.3 Gender Frequency of Dispensers
Frequency Percent Valid percent Cumulative percent
Vali
d
Male 8 25.81 25.81 25.81
Female 23 74.19 74.19 100
Total 31 100 100
Missing 0
Total 31
(Source: researcher‟s survey)
From the above tables (tabel4.1-4.3), gender frequency of the respondents, shows that the
numbers of male patient/client respondents were 43.90% and that of female respondents were
23.11%. This is 169 of the respondents were male, while 89 were female respondents and one
hundred twenty seven ( 127) respondents 32.99 % were invalid because these respondents did
not clarify their sex. Gender frequency of head pharmacists is 61.29 %( 19) and 38.71 %( 8)
Page | 28
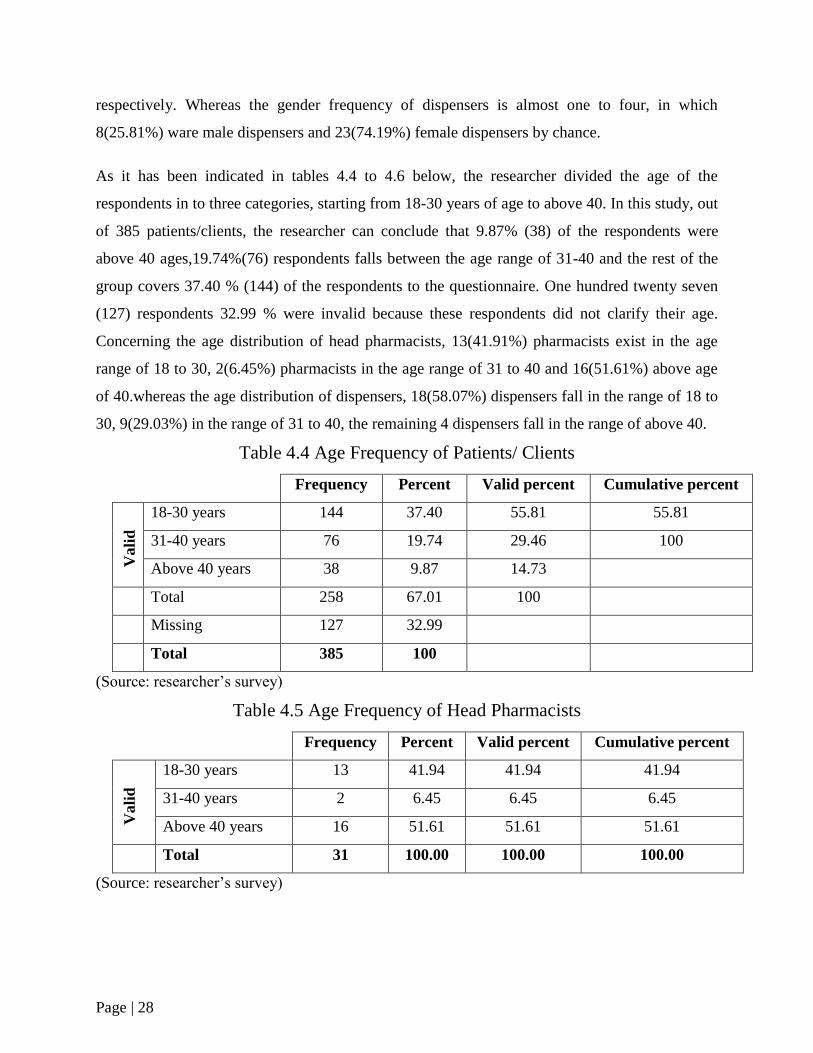
respectively. Whereas the gender frequency of dispensers is almost one to four, in which
8(25.81%) ware male dispensers and 23(74.19%) female dispensers by chance.
As it has been indicated in tables 4.4 to 4.6 below, the researcher divided the age of the
respondents in to three categories, starting from 18-30 years of age to above 40. In this study, out
of 385 patients/clients, the researcher can conclude that 9.87% (38) of the respondents were
above 40 ages,19.74%(76) respondents falls between the age range of 31-40 and the rest of the
group covers 37.40 % (144) of the respondents to the questionnaire. One hundred twenty seven
(127) respondents 32.99 % were invalid because these respondents did not clarify their age.
Concerning the age distribution of head pharmacists, 13(41.91%) pharmacists exist in the age
range of 18 to 30, 2(6.45%) pharmacists in the age range of 31 to 40 and 16(51.61%) above age
of 40.whereas the age distribution of dispensers, 18(58.07%) dispensers fall in the range of 18 to
30, 9(29.03%) in the range of 31 to 40, the remaining 4 dispensers fall in the range of above 40.
Table 4.4 Age Frequency of Patients/ Clients
Frequency Percent Valid percent Cumulative percent
Vali
d
18-30 years 144 37.40 55.81 55.81
31-40 years 76 19.74 29.46 100
Above 40 years 38 9.87 14.73
Total 258 67.01 100
Missing 127 32.99
Total 385 100
(Source: researcher‟s survey)
Table 4.5 Age Frequency of Head Pharmacists
Frequency Percent Valid percent Cumulative percent
Vali
d
18-30 years 13 41.94 41.94 41.94
31-40 years 2 6.45 6.45 6.45
Above 40 years 16 51.61 51.61 51.61
Total 31 100.00 100.00 100.00
(Source: researcher‟s survey)
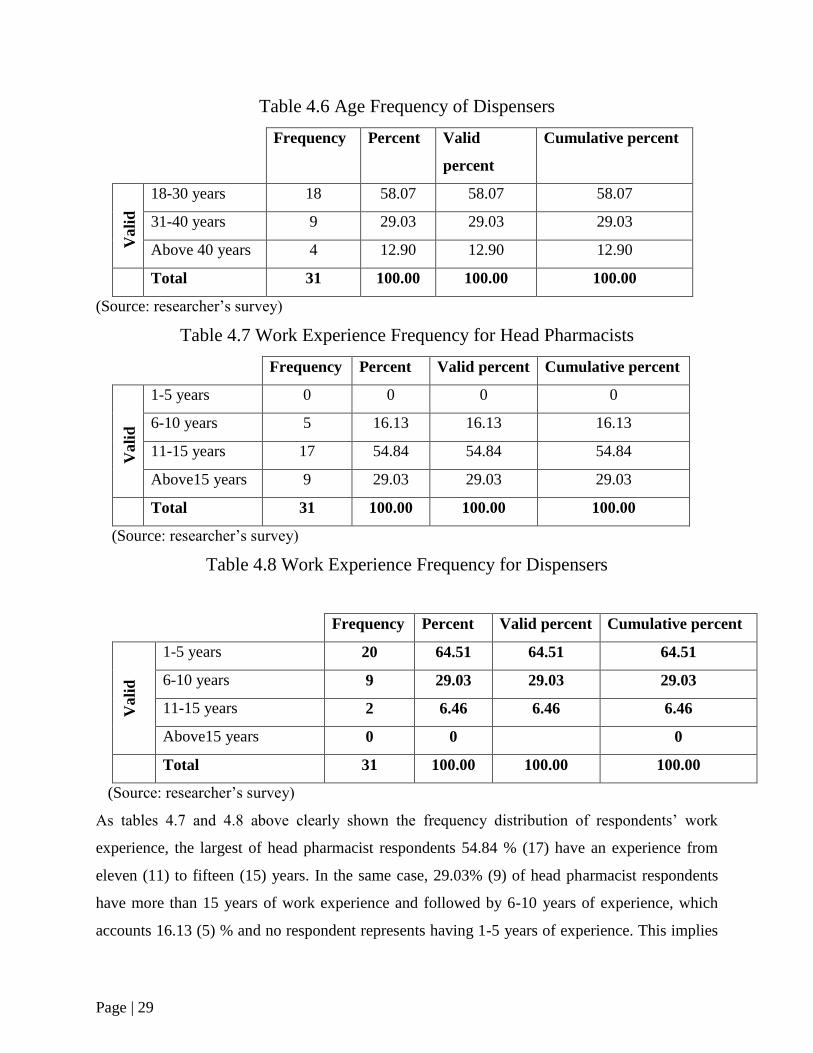
Page | 29
Table 4.6 Age Frequency of Dispensers
Frequency Percent Valid
percent
Cumulative percent V
ali
d
18-30 years 18 58.07 58.07 58.07
31-40 years 9 29.03 29.03 29.03
Above 40 years 4 12.90 12.90 12.90
Total 31 100.00 100.00 100.00
(Source: researcher‟s survey)
Table 4.7 Work Experience Frequency for Head Pharmacists
Frequency Percent Valid percent Cumulative percent
Vali
d
1-5 years 0 0 0 0
6-10 years 5 16.13 16.13 16.13
11-15 years 17 54.84 54.84 54.84
Above15 years 9 29.03 29.03 29.03
Total 31 100.00 100.00 100.00
(Source: researcher‟s survey)
Table 4.8 Work Experience Frequency for Dispensers
Frequency Percent Valid percent Cumulative percent
Vali
d
1-5 years 20 64.51 64.51 64.51
6-10 years 9 29.03 29.03 29.03
11-15 years 2 6.46 6.46 6.46
Above15 years 0 0 0
Total 31 100.00 100.00 100.00
(Source: researcher‟s survey)
As tables 4.7 and 4.8 above clearly shown the frequency distribution of respondents‟ work
experience, the largest of head pharmacist respondents 54.84 % (17) have an experience from
eleven (11) to fifteen (15) years. In the same case, 29.03% (9) of head pharmacist respondents
have more than 15 years of work experience and followed by 6-10 years of experience, which
accounts 16.13 (5) % and no respondent represents having 1-5 years of experience. This implies
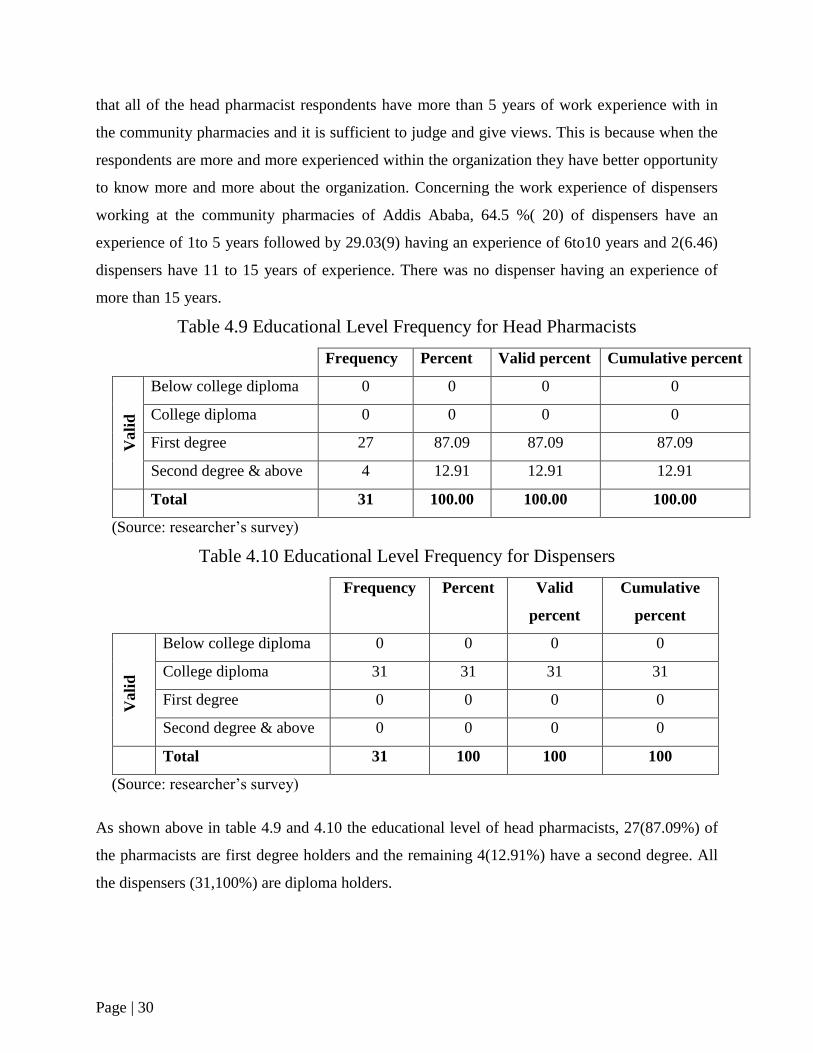
Page | 30
that all of the head pharmacist respondents have more than 5 years of work experience with in
the community pharmacies and it is sufficient to judge and give views. This is because when the
respondents are more and more experienced within the organization they have better opportunity
to know more and more about the organization. Concerning the work experience of dispensers
working at the community pharmacies of Addis Ababa, 64.5 %( 20) of dispensers have an
experience of 1to 5 years followed by 29.03(9) having an experience of 6to10 years and 2(6.46)
dispensers have 11 to 15 years of experience. There was no dispenser having an experience of
more than 15 years.
Table 4.9 Educational Level Frequency for Head Pharmacists
Frequency Percent Valid percent Cumulative percent
Vali
d
Below college diploma 0 0 0 0
College diploma 0 0 0 0
First degree 27 87.09 87.09 87.09
Second degree & above 4 12.91 12.91 12.91
Total 31 100.00 100.00 100.00
(Source: researcher‟s survey)
Table 4.10 Educational Level Frequency for Dispensers
Frequency Percent Valid
percent
Cumulative
percent
Vali
d
Below college diploma 0 0 0 0
College diploma 31 31 31 31
First degree 0 0 0 0
Second degree & above 0 0 0 0
Total 31 100 100 100
(Source: researcher‟s survey)
As shown above in table 4.9 and 4.10 the educational level of head pharmacists, 27(87.09%) of
the pharmacists are first degree holders and the remaining 4(12.91%) have a second degree. All
the dispensers (31,100%) are diploma holders.
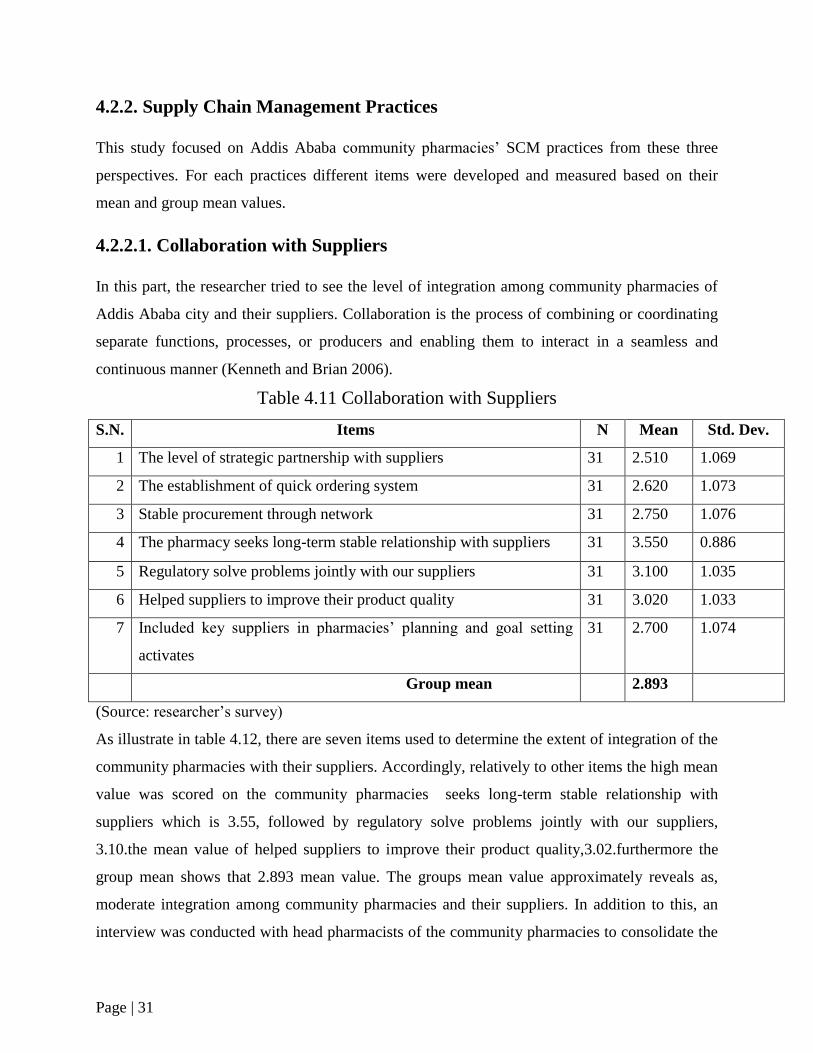
Page | 31
4.2.2. Supply Chain Management Practices
This study focused on Addis Ababa community pharmacies‟ SCM practices from these three
perspectives. For each practices different items were developed and measured based on their
mean and group mean values.
4.2.2.1. Collaboration with Suppliers
In this part, the researcher tried to see the level of integration among community pharmacies of
Addis Ababa city and their suppliers. Collaboration is the process of combining or coordinating
separate functions, processes, or producers and enabling them to interact in a seamless and
continuous manner (Kenneth and Brian 2006).
Table 4.11 Collaboration with Suppliers
S.N. Items N Mean Std. Dev.
1 The level of strategic partnership with suppliers 31 2.510 1.069
2 The establishment of quick ordering system 31 2.620 1.073
3 Stable procurement through network 31 2.750 1.076
4 The pharmacy seeks long-term stable relationship with suppliers 31 3.550 0.886
5 Regulatory solve problems jointly with our suppliers 31 3.100 1.035
6 Helped suppliers to improve their product quality 31 3.020 1.033
7 Included key suppliers in pharmacies‟ planning and goal setting
activates
31 2.700 1.074
Group mean 2.893
(Source: researcher‟s survey)
As illustrate in table 4.12, there are seven items used to determine the extent of integration of the
community pharmacies with their suppliers. Accordingly, relatively to other items the high mean
value was scored on the community pharmacies seeks long-term stable relationship with
suppliers which is 3.55, followed by regulatory solve problems jointly with our suppliers,
3.10.the mean value of helped suppliers to improve their product quality,3.02.furthermore the
group mean shows that 2.893 mean value. The groups mean value approximately reveals as,
moderate integration among community pharmacies and their suppliers. In addition to this, an
interview was conducted with head pharmacists of the community pharmacies to consolidate the
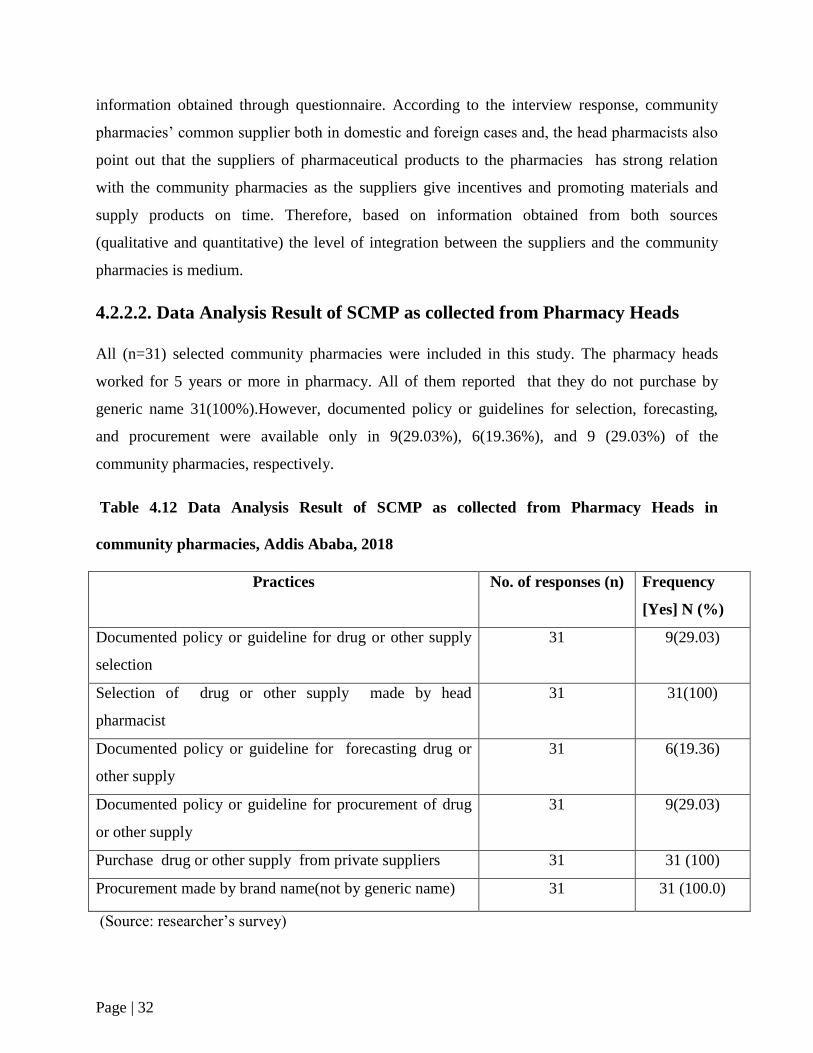
Page | 32
information obtained through questionnaire. According to the interview response, community
pharmacies‟ common supplier both in domestic and foreign cases and, the head pharmacists also
point out that the suppliers of pharmaceutical products to the pharmacies has strong relation
with the community pharmacies as the suppliers give incentives and promoting materials and
supply products on time. Therefore, based on information obtained from both sources
(qualitative and quantitative) the level of integration between the suppliers and the community
pharmacies is medium.
4.2.2.2. Data Analysis Result of SCMP as collected from Pharmacy Heads
All (n=31) selected community pharmacies were included in this study. The pharmacy heads
worked for 5 years or more in pharmacy. All of them reported that they do not purchase by
generic name 31(100%).However, documented policy or guidelines for selection, forecasting,
and procurement were available only in 9(29.03%), 6(19.36%), and 9 (29.03%) of the
community pharmacies, respectively.
Table 4.12 Data Analysis Result of SCMP as collected from Pharmacy Heads in
community pharmacies, Addis Ababa, 2018
Practices No. of responses (n) Frequency
[Yes] N (%)
Documented policy or guideline for drug or other supply
selection
31 9(29.03)
Selection of drug or other supply made by head
pharmacist
31 31(100)
Documented policy or guideline for forecasting drug or
other supply
31 6(19.36)
Documented policy or guideline for procurement of drug
or other supply
31 9(29.03)
Purchase drug or other supply from private suppliers 31 31 (100)
Procurement made by brand name(not by generic name) 31 31 (100.0)
(Source: researcher‟s survey)
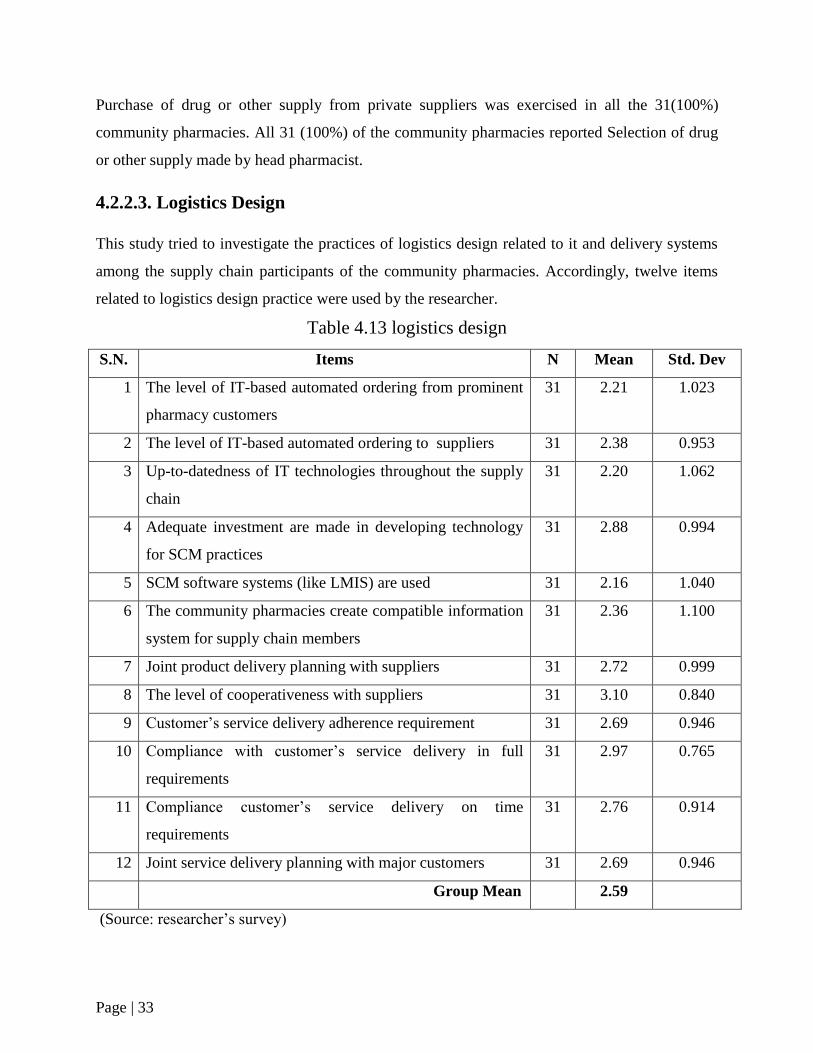
Page | 33
Purchase of drug or other supply from private suppliers was exercised in all the 31(100%)
community pharmacies. All 31 (100%) of the community pharmacies reported Selection of drug
or other supply made by head pharmacist.
4.2.2.3. Logistics Design
This study tried to investigate the practices of logistics design related to it and delivery systems
among the supply chain participants of the community pharmacies. Accordingly, twelve items
related to logistics design practice were used by the researcher.
Table 4.13 logistics design
S.N. Items N Mean Std. Dev
1 The level of IT-based automated ordering from prominent
pharmacy customers
31 2.21 1.023
2 The level of IT-based automated ordering to suppliers 31 2.38 0.953
3 Up-to-datedness of IT technologies throughout the supply
chain
31 2.20 1.062
4 Adequate investment are made in developing technology
for SCM practices
31 2.88 0.994
5 SCM software systems (like LMIS) are used 31 2.16 1.040
6 The community pharmacies create compatible information
system for supply chain members
31 2.36 1.100
7 Joint product delivery planning with suppliers 31 2.72 0.999
8 The level of cooperativeness with suppliers 31 3.10 0.840
9 Customer‟s service delivery adherence requirement 31 2.69 0.946
10 Compliance with customer‟s service delivery in full
requirements
31 2.97 0.765
11 Compliance customer‟s service delivery on time
requirements
31 2.76 0.914
12 Joint service delivery planning with major customers 31 2.69 0.946
Group Mean 2.59
(Source: researcher‟s survey)
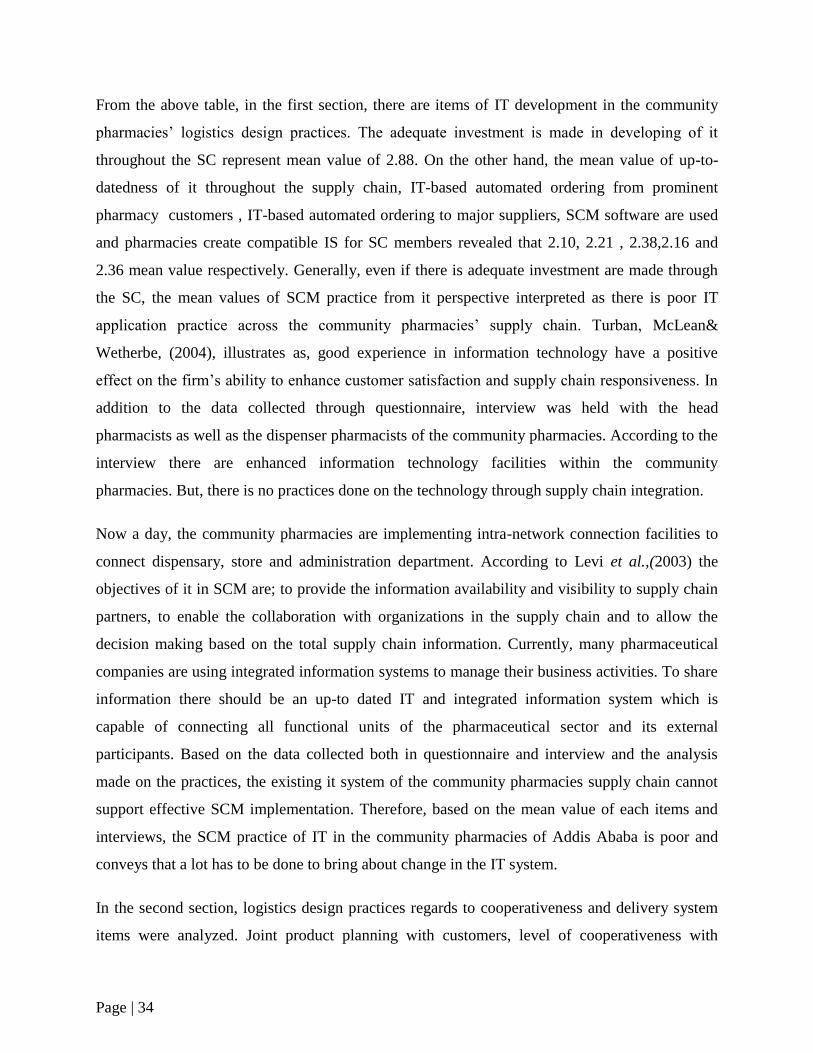
Page | 34
From the above table, in the first section, there are items of IT development in the community
pharmacies‟ logistics design practices. The adequate investment is made in developing of it
throughout the SC represent mean value of 2.88. On the other hand, the mean value of up-to-
datedness of it throughout the supply chain, IT-based automated ordering from prominent
pharmacy customers , IT-based automated ordering to major suppliers, SCM software are used
and pharmacies create compatible IS for SC members revealed that 2.10, 2.21 , 2.38,2.16 and
2.36 mean value respectively. Generally, even if there is adequate investment are made through
the SC, the mean values of SCM practice from it perspective interpreted as there is poor IT
application practice across the community pharmacies‟ supply chain. Turban, McLean&
Wetherbe, (2004), illustrates as, good experience in information technology have a positive
effect on the firm‟s ability to enhance customer satisfaction and supply chain responsiveness. In
addition to the data collected through questionnaire, interview was held with the head
pharmacists as well as the dispenser pharmacists of the community pharmacies. According to the
interview there are enhanced information technology facilities within the community
pharmacies. But, there is no practices done on the technology through supply chain integration.
Now a day, the community pharmacies are implementing intra-network connection facilities to
connect dispensary, store and administration department. According to Levi et al.,(2003) the
objectives of it in SCM are; to provide the information availability and visibility to supply chain
partners, to enable the collaboration with organizations in the supply chain and to allow the
decision making based on the total supply chain information. Currently, many pharmaceutical
companies are using integrated information systems to manage their business activities. To share
information there should be an up-to dated IT and integrated information system which is
capable of connecting all functional units of the pharmaceutical sector and its external
participants. Based on the data collected both in questionnaire and interview and the analysis
made on the practices, the existing it system of the community pharmacies supply chain cannot
support effective SCM implementation. Therefore, based on the mean value of each items and
interviews, the SCM practice of IT in the community pharmacies of Addis Ababa is poor and
conveys that a lot has to be done to bring about change in the IT system.
In the second section, logistics design practices regards to cooperativeness and delivery system
items were analyzed. Joint product planning with customers, level of cooperativeness with
Page | 35
suppliers and compliance with customer‟s service delivery in full-requirement scores the mean
value with 3.10, 2.88 and 2.97.So, from this values, the community pharmacies practices are
good regards to cooperativeness with supplies and joint product planning and full requirement
with customer‟s service delivery . Joint product planning with suppliers, customer‟s service
delivery adherence requirement and compliance with customer‟s service delivery on time also
reveals a mean value 2.72, 2.69and 2.76.Those values also reveals that community pharmacies
interaction with suppliers in product planning and customer service delivery requirement on time
were moderate. But these findings were completely different from the respondents of community
pharmacies customers with regards to delivery requirements and compliance with customer‟s
service delivery on time.
4.2.2.4. Customer Satisfaction
The ultimate goal of an integrated, efficient and effective SC system is superior customer
service: short lead-time, quick response to requirements, accurate delivery, product accessibility,
risk sharing, complains handling etc. (Christopher1998; Kenneth 2006; Russell 2006; and Eyong
2009).SCM suggests that firms need to integrate with their suppliers and customers to achieve
both financial and none financial growth objectives (Tan, 2001).
Table 4.14 Community Pharmacies Integration with Customers
S.N. Items N Mean Std. Dev.
1 Follow-up customers for feedback 31 2.430 1.009
2 Monitoring and measuring customer service level 31 2.270 1.047
3 The level of information sharing with prominent
pharmacy customers
31 2.630 1.008
4 Customer feedback is used to improve customer
relations, processes, products and services
31 2.560 1.084
5 The pharmacy has systematic processes for handling
customer complaints
31 2.260 1.021
Group mean 2.430
(Source: Researcher‟s Survey)
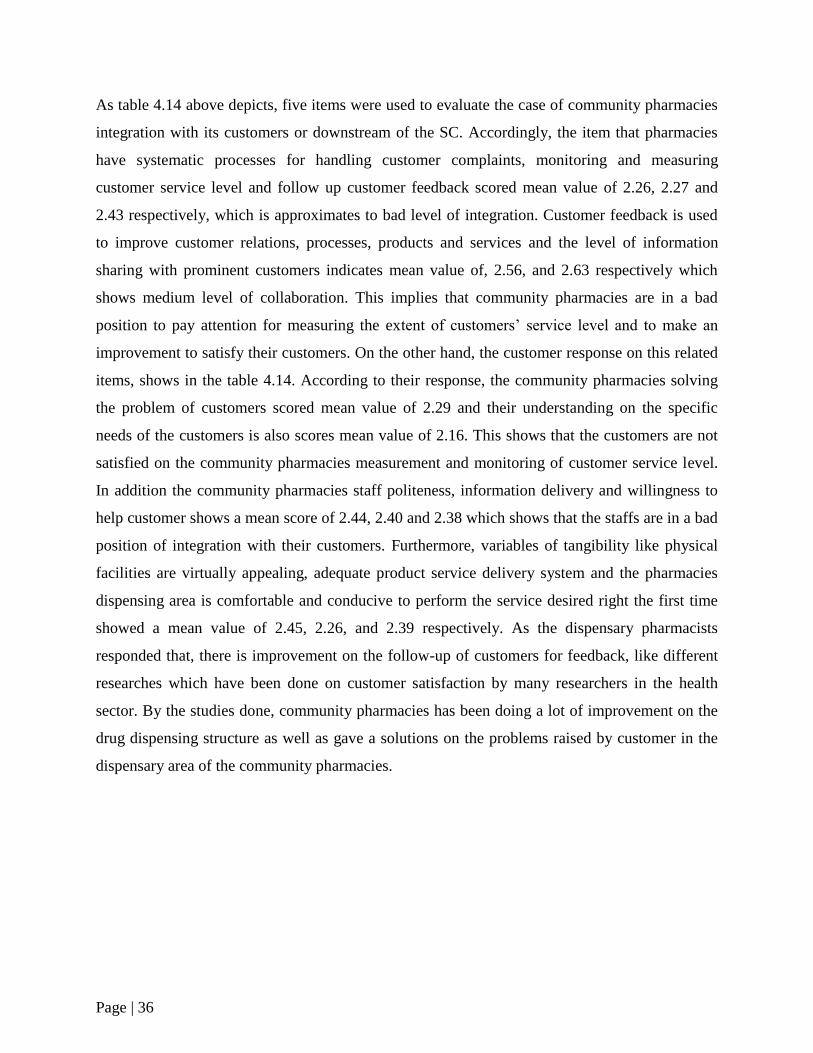
Page | 36
As table 4.14 above depicts, five items were used to evaluate the case of community pharmacies
integration with its customers or downstream of the SC. Accordingly, the item that pharmacies
have systematic processes for handling customer complaints, monitoring and measuring
customer service level and follow up customer feedback scored mean value of 2.26, 2.27 and
2.43 respectively, which is approximates to bad level of integration. Customer feedback is used
to improve customer relations, processes, products and services and the level of information
sharing with prominent customers indicates mean value of, 2.56, and 2.63 respectively which
shows medium level of collaboration. This implies that community pharmacies are in a bad
position to pay attention for measuring the extent of customers‟ service level and to make an
improvement to satisfy their customers. On the other hand, the customer response on this related
items, shows in the table 4.14. According to their response, the community pharmacies solving
the problem of customers scored mean value of 2.29 and their understanding on the specific
needs of the customers is also scores mean value of 2.16. This shows that the customers are not
satisfied on the community pharmacies measurement and monitoring of customer service level.
In addition the community pharmacies staff politeness, information delivery and willingness to
help customer shows a mean score of 2.44, 2.40 and 2.38 which shows that the staffs are in a bad
position of integration with their customers. Furthermore, variables of tangibility like physical
facilities are virtually appealing, adequate product service delivery system and the pharmacies
dispensing area is comfortable and conducive to perform the service desired right the first time
showed a mean value of 2.45, 2.26, and 2.39 respectively. As the dispensary pharmacists
responded that, there is improvement on the follow-up of customers for feedback, like different
researches which have been done on customer satisfaction by many researchers in the health
sector. By the studies done, community pharmacies has been doing a lot of improvement on the
drug dispensing structure as well as gave a solutions on the problems raised by customer in the
dispensary area of the community pharmacies.
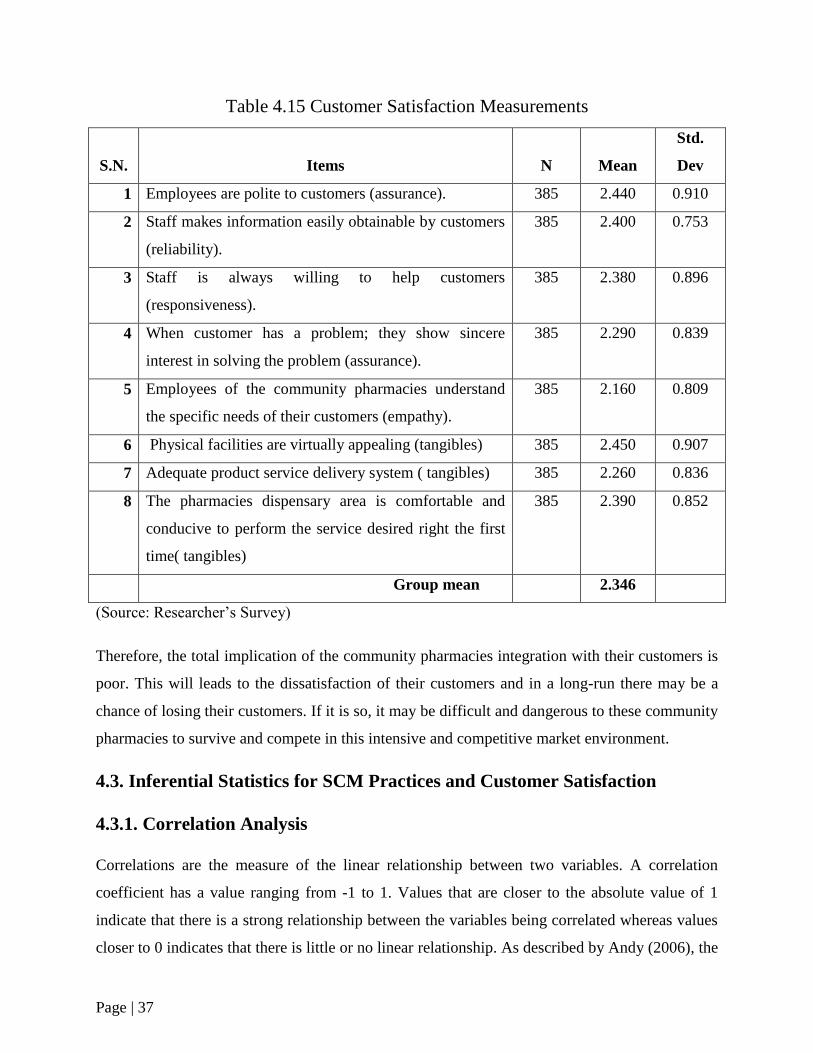
Page | 37
Table 4.15 Customer Satisfaction Measurements
S.N. Items N Mean
Std.
Dev
1 Employees are polite to customers (assurance). 385 2.440 0.910
2 Staff makes information easily obtainable by customers
(reliability).
385 2.400 0.753
3 Staff is always willing to help customers
(responsiveness).
385 2.380 0.896
4 When customer has a problem; they show sincere
interest in solving the problem (assurance).
385 2.290 0.839
5 Employees of the community pharmacies understand
the specific needs of their customers (empathy).
385 2.160 0.809
6 Physical facilities are virtually appealing (tangibles) 385 2.450 0.907
7 Adequate product service delivery system ( tangibles) 385 2.260 0.836
8 The pharmacies dispensary area is comfortable and
conducive to perform the service desired right the first
time( tangibles)
385 2.390 0.852
Group mean 2.346
(Source: Researcher‟s Survey)
Therefore, the total implication of the community pharmacies integration with their customers is
poor. This will leads to the dissatisfaction of their customers and in a long-run there may be a
chance of losing their customers. If it is so, it may be difficult and dangerous to these community
pharmacies to survive and compete in this intensive and competitive market environment.
4.3. Inferential Statistics for SCM Practices and Customer Satisfaction
4.3.1. Correlation Analysis
Correlations are the measure of the linear relationship between two variables. A correlation
coefficient has a value ranging from -1 to 1. Values that are closer to the absolute value of 1
indicate that there is a strong relationship between the variables being correlated whereas values
closer to 0 indicates that there is little or no linear relationship. As described by Andy (2006), the
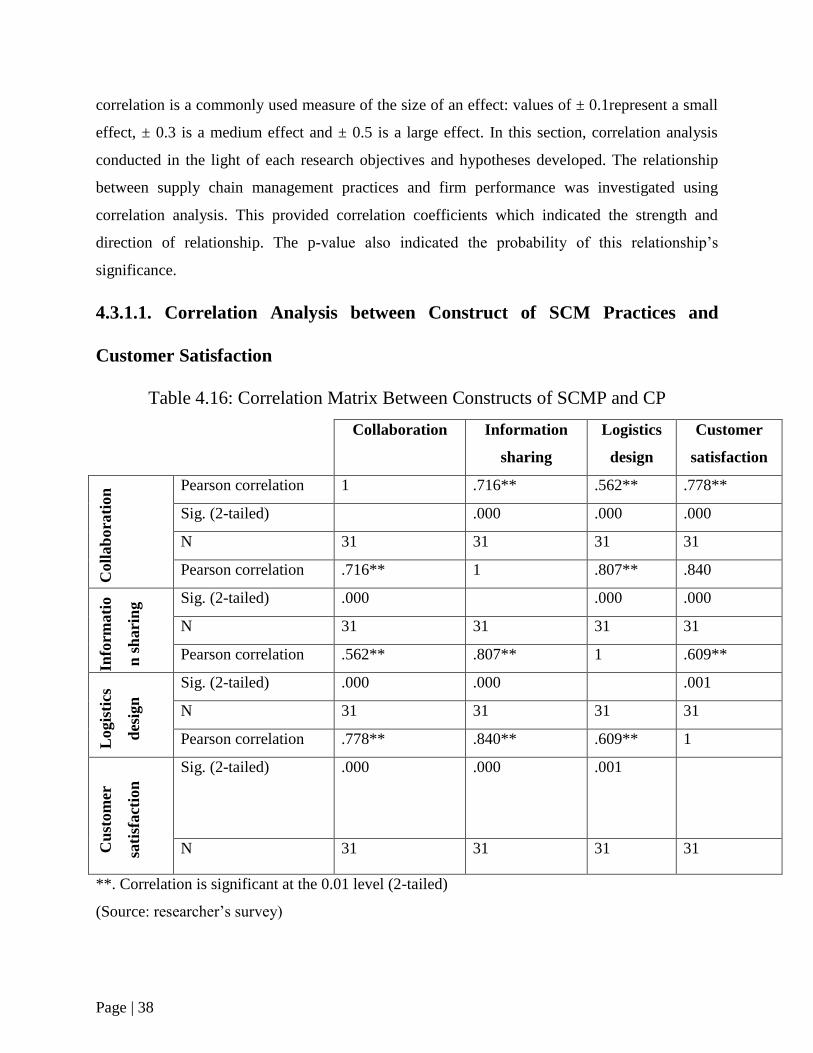
Page | 38
correlation is a commonly used measure of the size of an effect: values of ± 0.1represent a small
effect, ± 0.3 is a medium effect and ± 0.5 is a large effect. In this section, correlation analysis
conducted in the light of each research objectives and hypotheses developed. The relationship
between supply chain management practices and firm performance was investigated using
correlation analysis. This provided correlation coefficients which indicated the strength and
direction of relationship. The p-value also indicated the probability of this relationship‟s
significance.
4.3.1.1. Correlation Analysis between Construct of SCM Practices and
Customer Satisfaction
Table 4.16: Correlation Matrix Between Constructs of SCMP and CP
Collaboration Information
sharing
Logistics
design
Customer
satisfaction
Coll
ab
ora
tion
Pearson correlation 1 .716** .562** .778**
Sig. (2-tailed) .000 .000 .000
N 31 31 31 31
Pearson correlation .716** 1 .807** .840
Info
rmati
o
n s
hari
ng Sig. (2-tailed) .000 .000 .000
N 31 31 31 31
Pearson correlation .562** .807** 1 .609**
Logis
tics
des
ign
Sig. (2-tailed) .000 .000 .001
N 31 31 31 31
Pearson correlation .778** .840** .609** 1
Cu
stom
er
sati
sfact
ion
Sig. (2-tailed) .000 .000 .001
N 31 31 31 31
**. Correlation is significant at the 0.01 level (2-tailed)
(Source: researcher‟s survey)
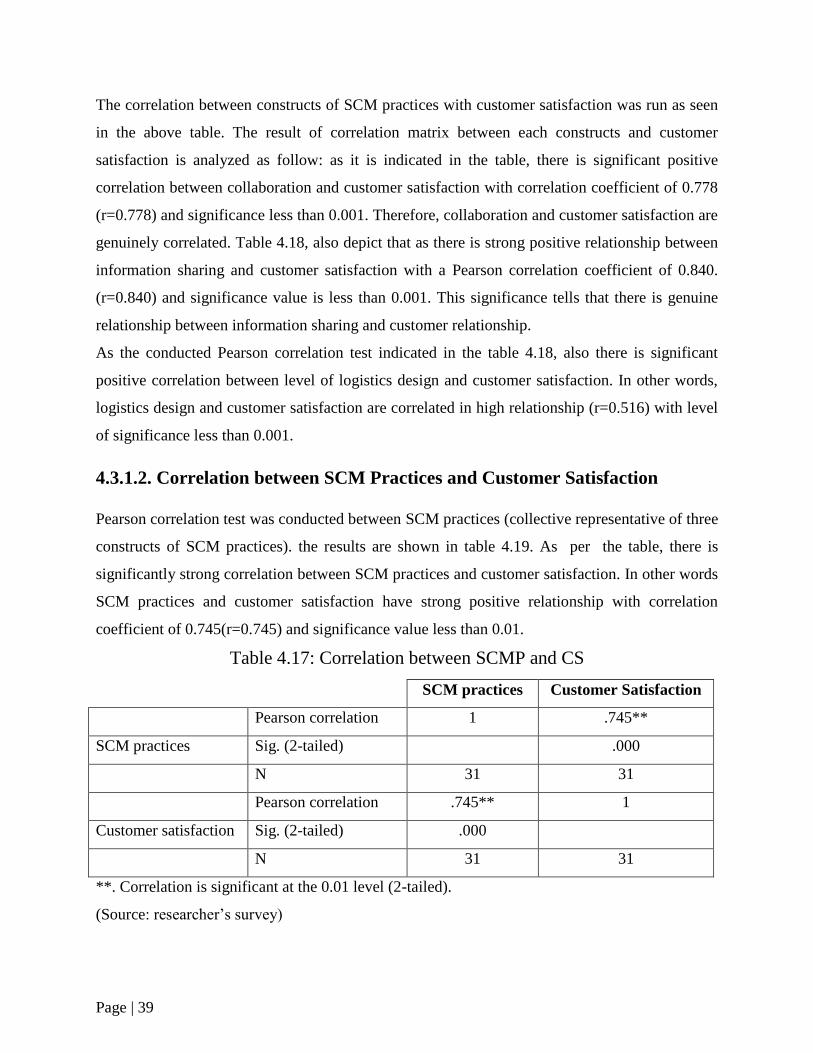
Page | 39
The correlation between constructs of SCM practices with customer satisfaction was run as seen
in the above table. The result of correlation matrix between each constructs and customer
satisfaction is analyzed as follow: as it is indicated in the table, there is significant positive
correlation between collaboration and customer satisfaction with correlation coefficient of 0.778
(r=0.778) and significance less than 0.001. Therefore, collaboration and customer satisfaction are
genuinely correlated. Table 4.18, also depict that as there is strong positive relationship between
information sharing and customer satisfaction with a Pearson correlation coefficient of 0.840.
(r=0.840) and significance value is less than 0.001. This significance tells that there is genuine
relationship between information sharing and customer relationship.
As the conducted Pearson correlation test indicated in the table 4.18, also there is significant
positive correlation between level of logistics design and customer satisfaction. In other words,
logistics design and customer satisfaction are correlated in high relationship (r=0.516) with level
of significance less than 0.001.
4.3.1.2. Correlation between SCM Practices and Customer Satisfaction
Pearson correlation test was conducted between SCM practices (collective representative of three
constructs of SCM practices). the results are shown in table 4.19. As per the table, there is
significantly strong correlation between SCM practices and customer satisfaction. In other words
SCM practices and customer satisfaction have strong positive relationship with correlation
coefficient of 0.745(r=0.745) and significance value less than 0.01.
Table 4.17: Correlation between SCMP and CS
SCM practices Customer Satisfaction
Pearson correlation 1 .745**
SCM practices Sig. (2-tailed) .000
N 31 31
Pearson correlation .745** 1
Customer satisfaction Sig. (2-tailed) .000
N 31 31
**. Correlation is significant at the 0.01 level (2-tailed).
(Source: researcher‟s survey)
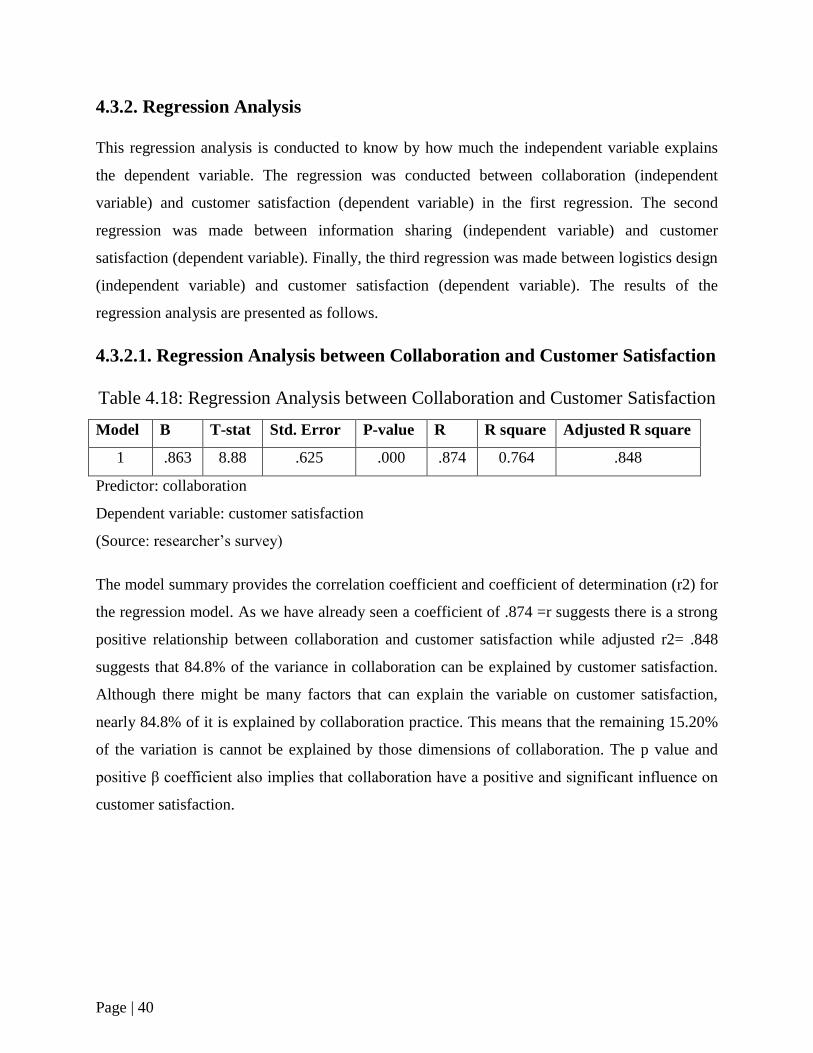
Page | 40
4.3.2. Regression Analysis
This regression analysis is conducted to know by how much the independent variable explains
the dependent variable. The regression was conducted between collaboration (independent
variable) and customer satisfaction (dependent variable) in the first regression. The second
regression was made between information sharing (independent variable) and customer
satisfaction (dependent variable). Finally, the third regression was made between logistics design
(independent variable) and customer satisfaction (dependent variable). The results of the
regression analysis are presented as follows.
4.3.2.1. Regression Analysis between Collaboration and Customer Satisfaction
Table 4.18: Regression Analysis between Collaboration and Customer Satisfaction
Model B T-stat Std. Error P-value R R square Adjusted R square
1 .863 8.88 .625 .000 .874 0.764 .848
Predictor: collaboration
Dependent variable: customer satisfaction
(Source: researcher‟s survey)
The model summary provides the correlation coefficient and coefficient of determination (r2) for
the regression model. As we have already seen a coefficient of .874 =r suggests there is a strong
positive relationship between collaboration and customer satisfaction while adjusted r2= .848
suggests that 84.8% of the variance in collaboration can be explained by customer satisfaction.
Although there might be many factors that can explain the variable on customer satisfaction,
nearly 84.8% of it is explained by collaboration practice. This means that the remaining 15.20%
of the variation is cannot be explained by those dimensions of collaboration. The p value and
positive β coefficient also implies that collaboration have a positive and significant influence on
customer satisfaction.
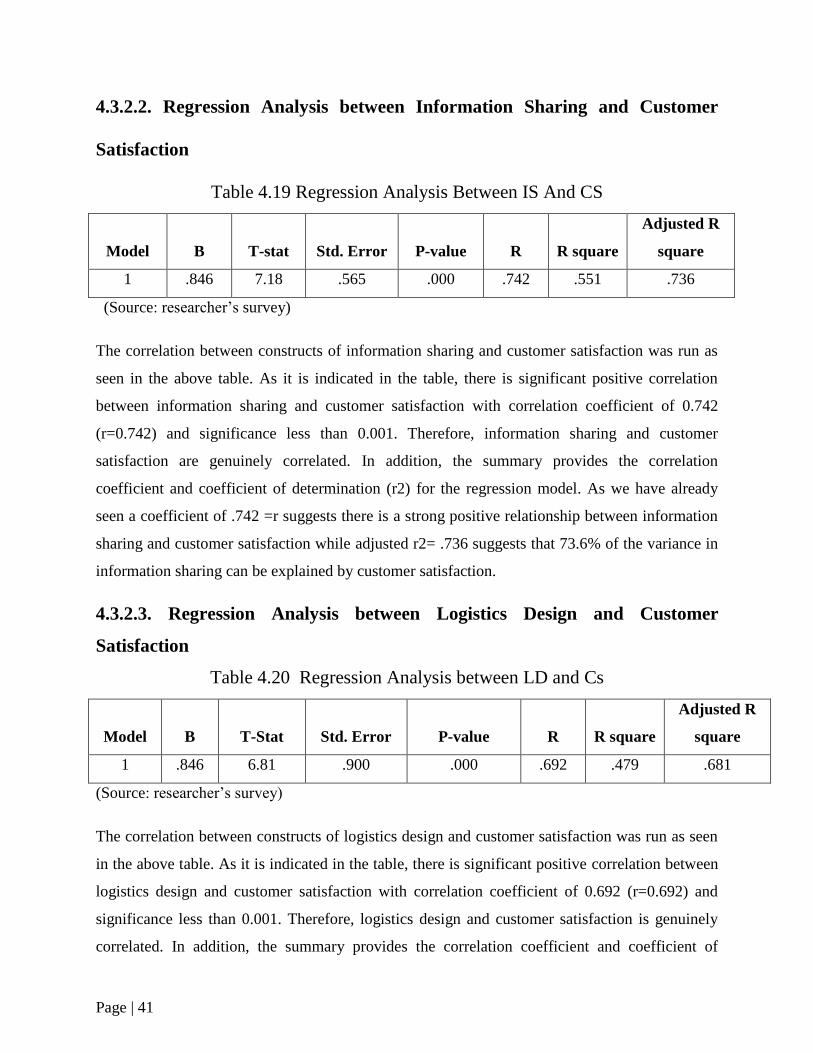
Page | 41
4.3.2.2. Regression Analysis between Information Sharing and Customer
Satisfaction
Table 4.19 Regression Analysis Between IS And CS
Model B T-stat Std. Error P-value R R square
Adjusted R
square
1 .846 7.18 .565 .000 .742 .551 .736
(Source: researcher‟s survey)
The correlation between constructs of information sharing and customer satisfaction was run as
seen in the above table. As it is indicated in the table, there is significant positive correlation
between information sharing and customer satisfaction with correlation coefficient of 0.742
(r=0.742) and significance less than 0.001. Therefore, information sharing and customer
satisfaction are genuinely correlated. In addition, the summary provides the correlation
coefficient and coefficient of determination (r2) for the regression model. As we have already
seen a coefficient of .742 =r suggests there is a strong positive relationship between information
sharing and customer satisfaction while adjusted r2= .736 suggests that 73.6% of the variance in
information sharing can be explained by customer satisfaction.
4.3.2.3. Regression Analysis between Logistics Design and Customer
Satisfaction
Table 4.20 Regression Analysis between LD and Cs
Model B T-Stat Std. Error P-value R R square
Adjusted R
square
1 .846 6.81 .900 .000 .692 .479 .681
(Source: researcher‟s survey)
The correlation between constructs of logistics design and customer satisfaction was run as seen
in the above table. As it is indicated in the table, there is significant positive correlation between
logistics design and customer satisfaction with correlation coefficient of 0.692 (r=0.692) and
significance less than 0.001. Therefore, logistics design and customer satisfaction is genuinely
correlated. In addition, the summary provides the correlation coefficient and coefficient of
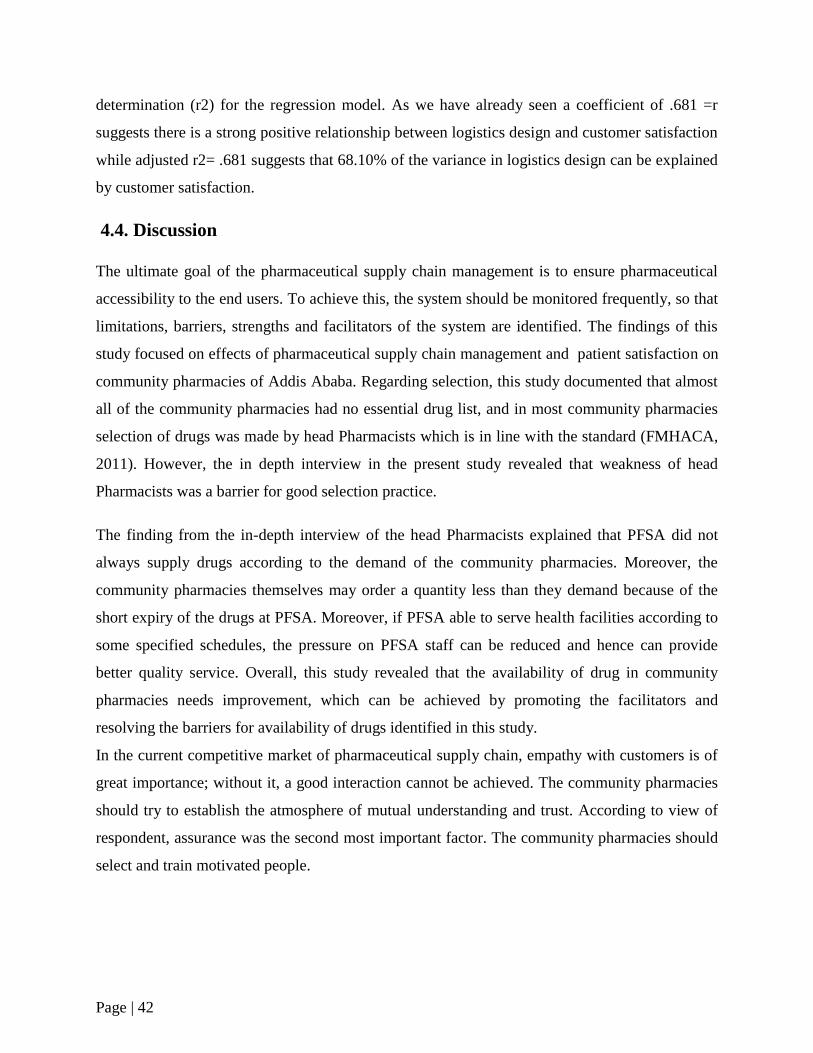
Page | 42
determination (r2) for the regression model. As we have already seen a coefficient of .681 =r
suggests there is a strong positive relationship between logistics design and customer satisfaction
while adjusted r2= .681 suggests that 68.10% of the variance in logistics design can be explained
by customer satisfaction.
4.4. Discussion
The ultimate goal of the pharmaceutical supply chain management is to ensure pharmaceutical
accessibility to the end users. To achieve this, the system should be monitored frequently, so that
limitations, barriers, strengths and facilitators of the system are identified. The findings of this
study focused on effects of pharmaceutical supply chain management and patient satisfaction on
community pharmacies of Addis Ababa. Regarding selection, this study documented that almost
all of the community pharmacies had no essential drug list, and in most community pharmacies
selection of drugs was made by head Pharmacists which is in line with the standard (FMHACA,
2011). However, the in depth interview in the present study revealed that weakness of head
Pharmacists was a barrier for good selection practice.
The finding from the in-depth interview of the head Pharmacists explained that PFSA did not
always supply drugs according to the demand of the community pharmacies. Moreover, the
community pharmacies themselves may order a quantity less than they demand because of the
short expiry of the drugs at PFSA. Moreover, if PFSA able to serve health facilities according to
some specified schedules, the pressure on PFSA staff can be reduced and hence can provide
better quality service. Overall, this study revealed that the availability of drug in community
pharmacies needs improvement, which can be achieved by promoting the facilitators and
resolving the barriers for availability of drugs identified in this study.
In the current competitive market of pharmaceutical supply chain, empathy with customers is of
great importance; without it, a good interaction cannot be achieved. The community pharmacies
should try to establish the atmosphere of mutual understanding and trust. According to view of
respondent, assurance was the second most important factor. The community pharmacies should
select and train motivated people.
Page | 43
Chapter Five
Summary of Major Findings, Conclusion and Recommendations
5.1. Summary of Findings
The purpose of this study was to examine the effect of drug supply chain management and how it
affects customer satisfaction in community pharmacies. The community pharmacies‟ orientation
of SC was evaluated through three SCM practices and five types of measurements that determine
customer satisfaction. In addition, the impact of SCM orientation was examined through
customer service level which is the ultimate goal of an effectively managed supply chain. Based
on the quantitative and qualitative data analysis, discussion of results with respect to the basic
questions, the following are the summary of major findings of this study.
The degree of relationship across the supply chain of community pharmacies has shown less
integration with customer. So, there should be an independent decision making across the
downstream side of the SC. The descriptive analysis and interview with pharmacy heads has
verified the prevalence of these characters of relationship. Regarding to integration among the
SC partners the mean of community pharmacies integration with its supplier‟s conveys group
mean value of 2.893 and this shows the integration is in moderate level. But, the quantitative
analysis of customers‟ integration conveys group mean value of 2.388 and it is really poor. For
instance, low score is the range between1.0 and2.4, medium between 2.5 and 3.4 whereas high is
between3.5 and5 (Oxford and Burry-stock, 1995).
With regard to information sharing, the descriptive data and interview analysis conveys that,
there is poor information sharing with customer, moderate related to suppliers. Again the overall
efforts in coordinating and sharing information across the supply chain partners are weak. Even
the shared information lacks adequacy and quality. Concerning information technology as one of
logistics design, the quantitative and qualitative analysis indicated that, poor and absence of IT &
IS tools with in the community pharmacies. This study is also intended to test if there is a
relationship between SCM practices, and customer satisfaction. Based on the results of the study
the summary of major findings are as follows. The test result indicates that collaboration practice
Page | 44
has positive and strong correlation (r=0.874) with customer satisfaction at significance level of
0.001. In other way, collaboration has also contributed 84.4% for the variability of customer
satisfaction. On the other hand, the test result of information sharing and customer satisfaction
indicates that information sharing has significant positive correlation (r=0.742) at significance
level of 0.001 with customer satisfaction. In addition, 73.6% of variability of customer
satisfaction explained by information sharing. Finally, the test result of logistics design and
customer satisfaction indicates that logistics design is positively correlated to customer
satisfaction with correlation coefficient of 0.692 (r=0.692) and the significance value is of 0.001.
5.2. Conclusions
Based on the results of the study obtained and summary of findings the following conclusions
are given. The eventual conclusion of this study is that generally, the community pharmacies‟
orientation towards SCM is traditional that lacks substantial indicators of an integrated, efficient
and effective SCM. In addition, the quantitative analysis of the community pharmacies‟ customer
satisfaction group mean is low that is 2.346. Therefore, this can‟t ensure customer satisfaction
with respect to indicators taken. Based on qualitative and quantitative analysis the investigator
comes up with conclusion that the community pharmacies‟ orientation towards customer
satisfaction is poor and SCM practices have direct impact on customers‟ satisfaction. The
primary reason mentioned for poor level of customer service is pharmacies integration with
suppliers that have direct effect on the community pharmacies‟ ability (potential) to embark on
external integration. In other words, its effect is clearly reflected on customers not getting what
they need when they need it, long lead time, and poor complaints management, not having
effective flexible drug/goods supply system that could respond to the changing market and
customer‟s preference.
Page | 45
5.3 Recommendations
The management of community pharmacies of Addis Ababa city need to understand how their
customers rate the service quality, what critical dimensions contribute to improving the service
quality; would have ultimately satisfy customers based on the customer satisfaction level.
Therefore, the community pharmacies should be equipped with highly qualified and dedicated
personnel and establish qualitative working systems that pay attention to its customers to
maintain a conducive and higher level of customer satisfaction. Head pharmacist of the
community pharmacies and dispensary pharmacists in particular can use the findings of this
study to identify the most important dimensions which contribute much in quality service to their
customers. In relation to the finding, the researcher came up with the following
recommendations.
1. PFSA should improve its supply not only for government owned pharmacies but also for
community pharmacies in general.
2. Adequate budget should be allocated for procurement of drugs and medical supplies so that to
reduce unavailability of drugs from the market.
3. A strategy that minimize the lead time when drugs procured from private suppliers
Should be devised
4. Priority should be given to pharmacies with high patient flow in resupplying drugs that are
currently out of market
5. Communication among community pharmacies, whole sales, pharmaceutical imports and
other suppliers should be improved
Page | 46
References
Addis (2015). The impact of SCM Practices on Performance of Pharmacies in Governmental
Health Facilities in Addis Ababa, Degree of masters of Art in Logistics & SCM.
Addis Ababa City Government Portal , (2018). Addis Ababa: e- System Africa.
Alireza A. (2011).A Study on Total Quality Management and Lean Manufacturing: Through
Lean Thinking Approach, Department of Industrial Engineering and Management, World
Applied Sciences Journal 12 (9): 1585-1596.
Andy, F. (2009). Discovering Statistic using SPSS. London: SAGE publication
Anna, B.,( 2010). Pharmaceutical Care Service and Quality Management in Community
Pharmacies. Helsinki.
Anna, S.,( 2013).Analysis of Challenges of Medical Supply Chains in Sub-Saharan Africa
Regarding Inventor Management and Transport and Distribution. London: University of West
Minster.
Asanti, F. and Aikins,(2008).does the Nhis Cover the Poor? Accra: University of Ghana.
Ayad, A., (2011).Inventory Management in Pharmacy Practice. In Journal of Pharmacy Practice.
Florida: University of Florida.
Bagchi, K. Prabir; Chun, H. Byoung (2005). Supply Chain Integration: A European Survey.
International Journal Logistics Management, Vol. 16, No. 2, pp. 275 – 294.
Balsmeier. (1996) .Supply chain management: a time based strategy: Industrial Management
Vol. 38, no. 5, pp.24–7.
Barratt.M.Oliveira.A. (2001).Exploring the experiences of collaborative planning initiatives:
International Journal of Physical Distribution & Logistics Management, Vol.31, No.4, pp226-89.
Belay M. (2011).Challenges of supply chain management and their relationship with the
competitive position of Cement industry: Graduate school of business leadership university of
South Africa.
Best. R (2009) .Market Based Management: Strategies for Growing customer value and
profitability, 5th edition, Pearson Education, Inc. New Jersey.
Bogale A. (2015). Supply Chain Collaboration Practices: A Study on Manufacturing Companies
Ethiopia: Industrial Engineering Letters Vol.5, No.12, 2015.
Bowersox, D. J. (2000). Ten mega trends that will revolutionize supply chain Logistics. Journal
of Business Logistics, 21(2), 1-15.
Page | 47
Brandon, E.W.,( 2010). Indicators of pharmaceuticals supply chain assessment in low and
middle income countries: Atlanta.
Bryman, A.and Bell, E. (2007).Business Research Methods: 2nd editon.Oxford University Press,
Oxford.
Cadilhon (2004).Business-to business relationships in parallel vegetable supply chains:
Distribution and Logistics Management, 32(9):755–70.
Childerhouse, P. Disney, S. and Towill, D.R. (2000) “Speeding up the progress curve towards
Effective Supply Chain Management”, Int. Jnl. Sup. Chn. Man, Vol. 5, No. 3, pp 176-186.
Childhouse, P. &Towill, R. (2003). Simplified material flow holds the key to supply chain
integration. Omega Vol, 31(1), pp.17–27.
Chopra, S. and Peter, M.,( 2001). Supply chain management. Upper saddle river, nj: prentice
hall, inc.
Christopher, M. (1998). Logistics and Supply Chain Management. Pitman, London.
Cochran, W.G., (1963). Sampling techniques. New york: wiley.
Cooper, M. C. (1997). Characteristics of supply chain management and the implications for
purchasing and logistics strategy: The International Journal of Logistics Management, Vol. 4,
No. 2, pp. 13-24.
Dereje .A,(2012).The impact of supply chain management practices on the organizational
performance of basic metal and engineering industries in Ethiopia: Master‟s degree in business
Leadership, university of South Africa
Donlon JP, (1996).Maximizing value in the supply chain: Chief Executive; Vol.117:PP.54–63.
Emily, D. etal, (2012). Patient satisfaction and perceived quality of care: evidence from a
cross-sectional national exit survey of HIV service users in Zambia, vol.5, no.12, pp1-26.lusaka:
health service research.
Eyong, M. (2009).Creating a competitive supply chain: Evaluating the impact of lean & agile
supply chain.
Fasika, Klaus, Thoben&Marcus, (2014).Supply chain integration in the manufacturing firms in
developing country: Hindawi Publishing Corporation Journal of Industrial Engineering.
Fawcett, (2001). Achieving World–Class supply chain Alignment: Benefits, Barriers, and
Bridges: Centre for Advanced Purchasing Studies.
Page | 48
Feldmann, M. & Muller, S. (2003). An incentive scheme for true information providing in
supply chains. OMEGA, Vol. 31, no. 3, pp. 63–73.
Fisher, M.L. (2000).What is the right supply chain for your product? :Harvard Business
Review,Vol.75, No.2, pp.105-16
Gattoma and Clark (2003). Education and Skills training Requirements in supply: 9th edition,
Pearson Education, Inc., New Jersy.
Gilaninia& etal, 2011.Impact of supply chain dimensions on customer satisfaction: The
International Journal of Logistics Management, Vol. 2, No. 2, pp. 13-24.
Hanan, Mack and Karp, Peter (2010).Customer Satisfaction: How to Maximize, Measure, and
Market Your Company‟s Ultimate Product: American Management Association, New York, and
XII.
Handfield, R. B., & Nichols, E. L. (1999). Introduction to supply chain management. New
Jersey: Prentice
Haque& Islam, (2013).Effects of Supply Chain Management Practices on Customer Satisfaction
in the pharmaceutical industry of Bangladesh: Global Business and Management Research, An
International Journal Vol. 5.
Hoole, R. (2005).Five ways to simplify your Supply chain, Supply Chain Management: An
international Jouranl, Vol.10, Issue 1.
Huang, G. Q., Lau, J. S. K., & Mark, K. L. (2003). The impact of sharing production information
on supply chain dynamics: a review of the literature: International journal of Production
Research, Vol. 41 No. 7, And pp. 1483-1517.
Iftikhar, A. and Sirajud, D., (2010). Patient satisfaction from the health care service. D.I. Khan.
Israel, G.D., (2009). Determining sample size. Florida: University of Florida.
Jabulani, N.,( 2005). Supply chain management. Beirut: World Bank training program.
John, M., Jonathan A., David ,A.,( 2015).optimizing drug supply chain in hospital department:
an Empirical Evidence from a Developing Country, vol.5, no.2: macro think institute.
Kenneth, L. and Brian, F. (2006). Purchasing and Supply Chain Management 7th edition, Mc
Graw-Hill Publishing Company Limited, New Delhl.
Kiran (2014).Supply Chain Management: Some Issues and Challenges, department of
Mechanical Engineering: University, Institute of Engineering & Technology,Vol.4
Lamber, etal, (1998). Fundamentals of logistics management. Boston: Irwin/mc Grow-hill.
Page | 49
Lambert, M. and Cooper, C. (2000). Issues in Supply Chain Management: Industrial Marketing
Management, vol. 29, no.1, pp 65-83.
Lazarevic, P. Sohal, A. Baihaqi, I. (2007). Supply chain management practices & supply chain
performance in the Australian Manufacturing Industries: In Monish university.
Lee and Whang (2000). Information sharing in a supply chain: International Journal of
Technology management, vol. 20, no. 3/4, pp 373-387.
Lee, H.L. (2002). Aligning supply chain strategy with product uncertainties. California
Management Review, vol. 44, no. 3, pp105.
Lee, H.L. (2005). Creating value through supply chain integration. Supply chain management
review, vol. 4, no.4, pp 30-36.
Lee, H.L. Padmanabhan, V. & Whang, S. (2001). Information distortion in a supply chain: the
bullwhip effect. Management Science, Vol.43, no.4, pp.546–58.
Leedy, P.D. and Ormrod J.E. (2010) Practical Research Planning and Design. Proffesor
D.Lalithia Rani Department of Commerce and Management Studies, Andhra University,
Visakhapatnam, India
Li S, Ragu-Nathan B, Ragu-Nathan T, Subba Rao S (2006). The impact of supply chain
management practices on competitive advantage and organizational performance: Omega. Vol
.34(2), PP.107-124.
Li, S. Rao, S. & Ragu-Nathan, B. (2005).Development and Validation of measurement
Instrument for Studying Supply Chain Management practices: Journal of operation management,
vol.23, no.6, pp 618-641.
Lysons& Farrington (2006), Purchasing & supply chain management, 7th edition.
Maeve Henchion etal (2004).Developments in the Irish Food Supply Chain: Impacts and
Responses by SMEs. Journal of International Food & Agribusiness Marketing, 16(2).
Makweba, R. & Xu. Q. (2009). Supply Chain Management and Challenges Facing the Food
Industry Sector in Tanzania. Vol. 4 No. 12
Management science for health.( 2012). Managing Access to Medicines and Health
Technologies. Arlington.
Managing Drug Supply.(1998). In essential drugs monitor.no.25&26.
Maureen, L.2006. Governance and Corruption in Public Health System: Center for Global
Development.
Page | 50
Mahsson J. A Service Quantity Medel Based on an Ideal Value Standard Int. J. Serv. Ind.
Manag. 1992; 3: 18-33.
WWW. Ceopedia.org/Management online.
Meltzer, J.T. (2004). The nature of inter-firm partnering in Supply Chain Management. Journal
of Retailing, Vol.76, no.4, pp.549–568.
Mentezer,etal, (2001). Defining Supply Chain Management: Journal of Business Logistics,
vol.22, no.2, p18.
Mezid, M.(2014). Assessment of Pharmaceutical Logistics System in Health Centers of Addis
Ababa, Ethiopia. Addis Ababa: Addis Ababa University School of pharmacy.
Min S, Mentzer JT (2004). Developing and Measuring Supply Chain Concepts: Journal of
Business Logistics, Vol.25 (1):PP.63–99.
Min S., Roath A.S., Daugherty P. J., Genchev S.E., Chen H., Arndt A. D., Richey R.
G.,(2005).Supply Chain Collaboration : What‟s Happening :The International Journal of
Logistics Management ,Vol.16 , No.2 , pp. 237-56
Min, S. and Mentzer, J. T. (2004).Developing and Measuring Supply Chain Concepts, Journal of
Business Logistics, Vol.25(1), pp. 63–99.
Mirquez, A.C. (2010).Dynamic Modeling for Supply Chain Management: Dealing with Front-
End, Back-End and Integration Issues, Springer, London.
Moberg. (2002). Identifying Antecedents Of Information Exchange within Supply Chains.
International Journal of Physical Distribution and Logistics Management, Vol.32, no. 9, pp.755–
70.
Mohammed, B. etal. (2017).Patients/Clients Expectation Toward and Satisfaction from
Pharmacy Services: J Res Pham Pract.2017 Jan-Mar; 6(1):21-26
Monczka, R.M. (1998). Success Factors in Strategic Supplier Alliances: the Buying Company
Perspective. Decision Science, Vol. 29, no. 3, pp. 5553–5577.
Mugenda, O.M.and Mugenda, A.G., (2003).Research Methods: Quantitative and Qualitative
Approaches. Nairobi: African Center for Technology Studies.
Narasimhan, R. & Kim, S. W. (2005).Information System Utilization Strategy for Supply Chain
Integration: Journal of Business Logistic, 22(5). 51 – 76.
Nicholas P., (2009).Methods for Measuring Customer Satisfaction: Energy Evaluation
Conference, Chicago.
Page | 51
Nunnally, J. C. (1978).Psychometric Theory. McGraw-Hill, New York, NY.
Raghunathan, S. (2001).Information Sharing In A Supply Chain. A Note on its Value When
Demand in Nonstationary. Management science, Vol.47.No 4, PP603-610.
Raghunathan, S. (2003). Impact of Demand Correlation on The Value of and Incentives for
Information Sharing In A Supply Chain: European Journal of operational research, vol. 146, 634-
649.
Ross, D.F. (1998). Competing through Chain Management: Creating Market-Winning Strategies
through Supply Chain Partnership. New York: Chapman and Hall.
Russsell, H.S (2006).More than integrated logistics, Air Force Journal of Logistics: Supply chain
Management: Vol, No.2.
Sekaran, U. (2002). Research Methods for Business. (2nd ed). New York: John Wiley & Sons,
Inc. The World Bank, 2009. Public Sector Health Care Supply Chain Strategic Network Analysis
and Design, Improving Health Systems: the World Bank, Ethiopia.
Silver, A. Pyke, V. & Peterson, R. (1998). Inventory Management and Production Planning and
Scheduling. John Wiley & Sons, New York.
Stank, etal (2001). Supply chain integration: Tales From The Trenches, Supply Chain
Management Review, vol. 5(3) 62-69.
Tan (2001). A Frame Work of Supply Chain Management Literature. European Journal of
Purchasing and Supply Management, vol. 7, No. 3, pp 39-48.
Tan, K. C., Kannan, and V. R. & Hanfield, R. B. (2001) .Supply Chain Management: Supplier
Performance: International Journal of Purchasing and Materials Management, 34(2). 2 – 9.
Tan, K.C. Lyman, S.B. & Wisner, J.D. (2002). Supply chain management: A Strategic
Perspective. International Journal of operations and production management, vol.22 (6), 614-
631.
Thomas, I.S.(2008). A Practical Application of Supply Chain Management Principles.
Milwaukee, wisconsin: william a. Toney.
Tracey, M., Lim, J. S., &Vonderembse, M. A. (2005) .The Impact of Supply Chain Management
Capabilities on organization performance: Supply Chain Management, 10(3), 179-191.
Turban, E. McLean, E. &Wetherbe, J. (2004). Information Technology for Management 4th
edition: John Wiley & Sons New York.
Ullrich, C.A, (2014), “Issues in Supply Chain Scheduling & Contracting”, P.38
Page | 52
World health organization, (2016). Ethiopia /Essential Drug and Medicine: WHO, Ethiopia.
Www. Fmhaca.gov.et
Www. Google scholar.com
Yin, R.K.(2009).Case Study Research Design and Methods, ed. Thousand Oaks, CA: Sage.
Zairi, M (2000).Managing Customer Dissatisfaction through Effective Complaint Management
Systems: The TQM Magazine, Vol. 12(5), pp. 331-335.
Zeithamal, Parasurman and Berry., (1990). Delivering Quality Service- Balancing Customer
Perceptions and Expectations. New york: the free press.
Page | A
Appendices
Annex 1. Questionnaire to Pharmacy Head of Community Pharmacies
Effect of Drug Supply Chain Management on the Level of Patient /Client
Satisfaction in Community Pharmacies:
The Case of Addis Ababa Ethiopia
Questionnaire for Community Pharmacies in Addis Ababa
May 2018
Respondents Profile
1. Sex: □Male □ Female
2. Age: □20-25 years
□ 26-30 years
□ 31-35 years
□36- 40 years
□Above 40 years
3. Educational Qualification:
□Grade 10 completed □ Grade 12 completed □ Certificate
□College diploma □ First Degree
I. Verbal consent form before administering the questionnaire to the pharmacy head
“Good day to you. My name is Abiy Abreham. I am a student of Logistics and Supply Chain
Management MSC program in School of Commerce, Addis Ababa University. I am here to
collect data about the drug supply chain management system of your facility that is needed for
my thesis titled:
Effect of drug supply chain Management on the level of Patient Satisfaction in Community
Pharmacies: The Case of Addis Ababa, Ethiopia. This survey is done in all 31(thirty one)
selected community Pharmacies of Addis Ababa, Ethiopia. Your facility is selected because it
is one of them. The research will provide an empirical snap shot of the current pharmaceutical
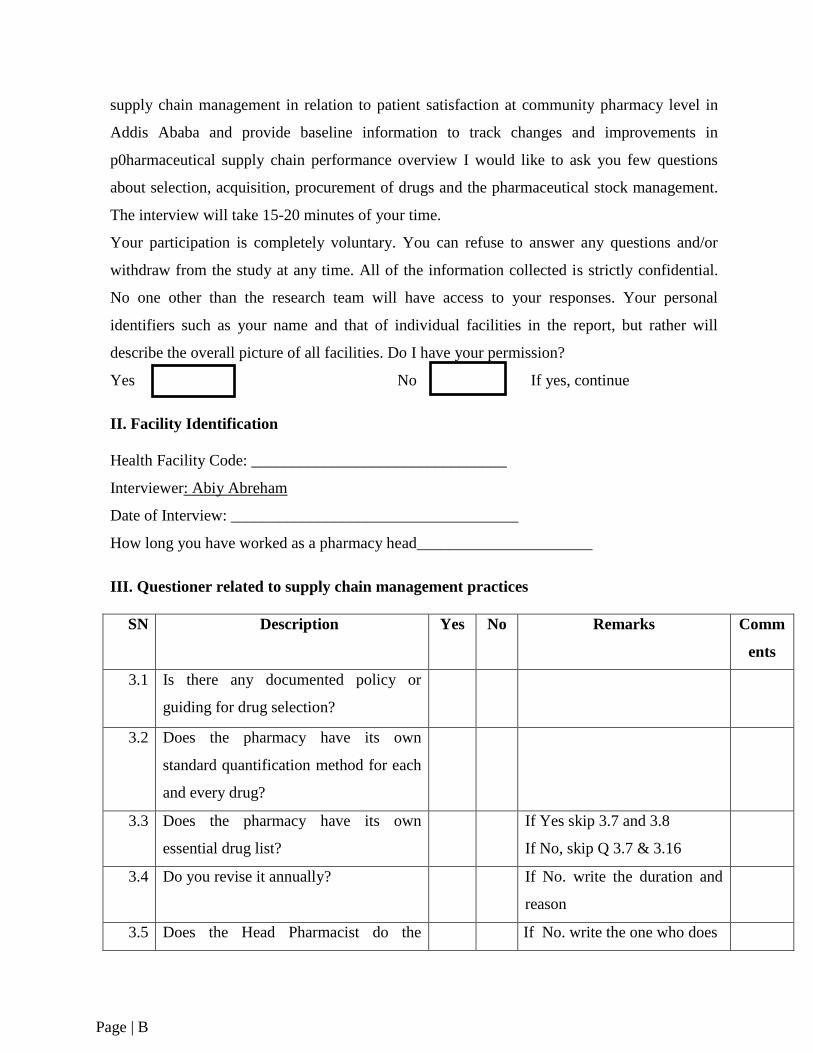
Page | B
supply chain management in relation to patient satisfaction at community pharmacy level in
Addis Ababa and provide baseline information to track changes and improvements in
p0harmaceutical supply chain performance overview I would like to ask you few questions
about selection, acquisition, procurement of drugs and the pharmaceutical stock management.
The interview will take 15-20 minutes of your time.
Your participation is completely voluntary. You can refuse to answer any questions and/or
withdraw from the study at any time. All of the information collected is strictly confidential.
No one other than the research team will have access to your responses. Your personal
identifiers such as your name and that of individual facilities in the report, but rather will
describe the overall picture of all facilities. Do I have your permission?
Yes No If yes, continue
II. Facility Identification
Health Facility Code: ________________________________
Interviewer: Abiy Abreham
Date of Interview: ____________________________________
How long you have worked as a pharmacy head______________________
III. Questioner related to supply chain management practices
SN Description Yes No Remarks Comm
ents
3.1 Is there any documented policy or
guiding for drug selection?
3.2 Does the pharmacy have its own
standard quantification method for each
and every drug?
3.3 Does the pharmacy have its own
essential drug list?
If Yes skip 3.7 and 3.8
If No, skip Q 3.7 & 3.16
3.4 Do you revise it annually? If No. write the duration and
reason
3.5 Does the Head Pharmacist do the If No. write the one who does
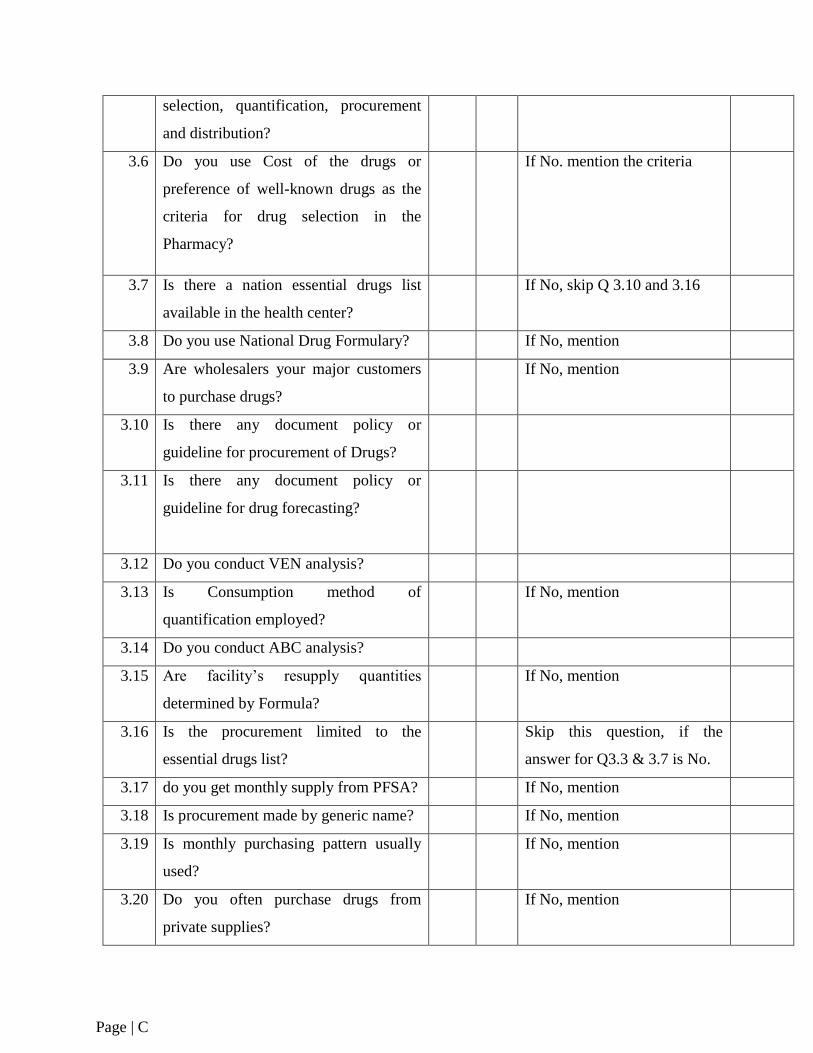
Page | C
selection, quantification, procurement
and distribution?
3.6 Do you use Cost of the drugs or
preference of well-known drugs as the
criteria for drug selection in the
Pharmacy?
If No. mention the criteria
3.7 Is there a nation essential drugs list
available in the health center?
If No, skip Q 3.10 and 3.16
3.8 Do you use National Drug Formulary? If No, mention
3.9 Are wholesalers your major customers
to purchase drugs?
If No, mention
3.10
Is there any document policy or
guideline for procurement of Drugs?
3.11 Is there any document policy or
guideline for drug forecasting?
3.12 Do you conduct VEN analysis?
3.13 Is Consumption method of
quantification employed?
If No, mention
3.14 Do you conduct ABC analysis?
3.15 Are facility‟s resupply quantities
determined by Formula?
If No, mention
3.16 Is the procurement limited to the
essential drugs list?
Skip this question, if the
answer for Q3.3 & 3.7 is No.
3.17 do you get monthly supply from PFSA? If No, mention
3.18 Is procurement made by generic name? If No, mention
3.19 Is monthly purchasing pattern usually
used?
If No, mention
3.20 Do you often purchase drugs from
private supplies?
If No, mention
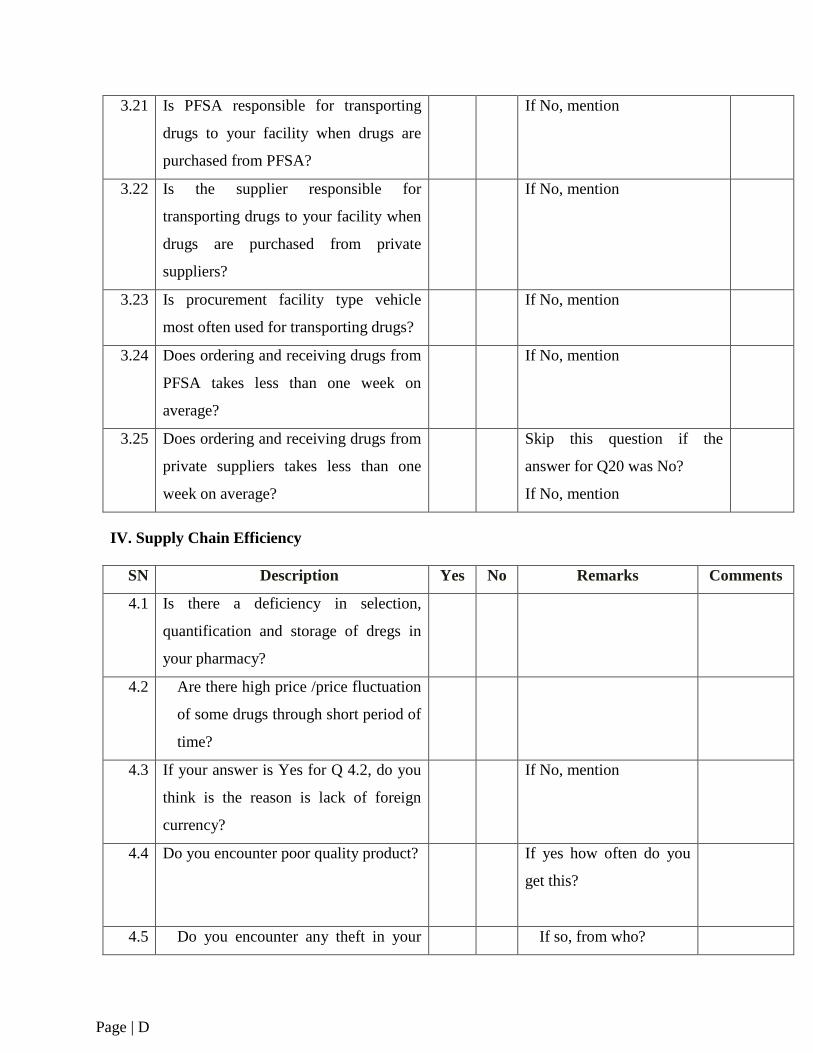
Page | D
3.21 Is PFSA responsible for transporting
drugs to your facility when drugs are
purchased from PFSA?
If No, mention
3.22 Is the supplier responsible for
transporting drugs to your facility when
drugs are purchased from private
suppliers?
If No, mention
3.23 Is procurement facility type vehicle
most often used for transporting drugs?
If No, mention
3.24 Does ordering and receiving drugs from
PFSA takes less than one week on
average?
If No, mention
3.25 Does ordering and receiving drugs from
private suppliers takes less than one
week on average?
Skip this question if the
answer for Q20 was No?
If No, mention
IV. Supply Chain Efficiency
SN Description Yes No Remarks Comments
4.1 Is there a deficiency in selection,
quantification and storage of dregs in
your pharmacy?
4.2 Are there high price /price fluctuation
of some drugs through short period of
time?
4.3 If your answer is Yes for Q 4.2, do you
think is the reason is lack of foreign
currency?
If No, mention
4.4 Do you encounter poor quality product? If yes how often do you
get this?
4.5 Do you encounter any theft in your If so, from who?
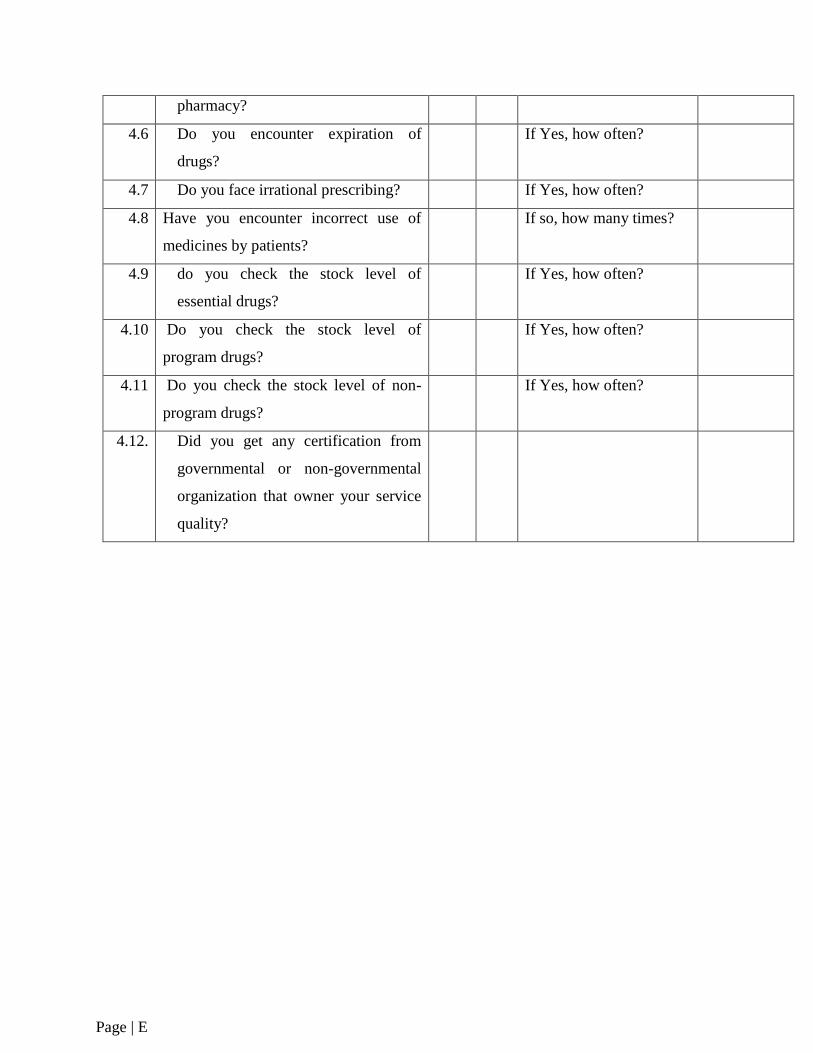
Page | E
pharmacy?
4.6 Do you encounter expiration of
drugs?
If Yes, how often?
4.7 Do you face irrational prescribing? If Yes, how often?
4.8 Have you encounter incorrect use of
medicines by patients?
If so, how many times?
4.9 do you check the stock level of
essential drugs?
If Yes, how often?
4.10
Do you check the stock level of
program drugs?
If Yes, how often?
4.11 Do you check the stock level of non-
program drugs?
If Yes, how often?
4.12. Did you get any certification from
governmental or non-governmental
organization that owner your service
quality?
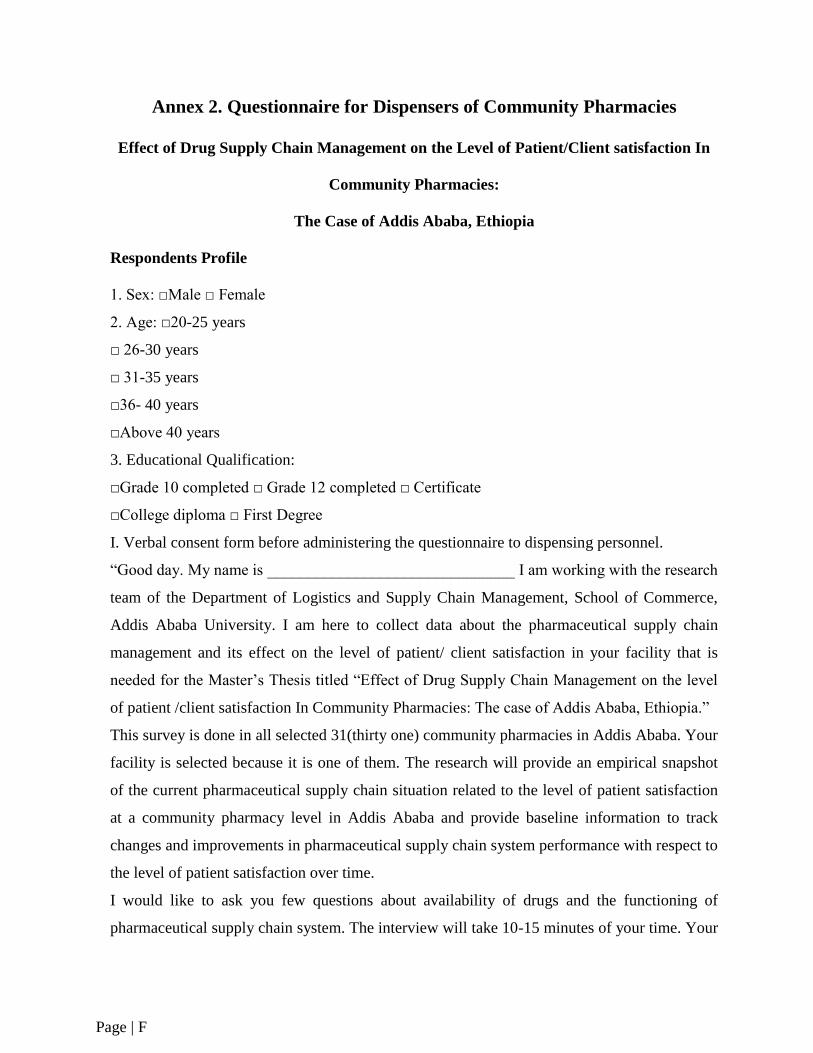
Page | F
Annex 2. Questionnaire for Dispensers of Community Pharmacies
Effect of Drug Supply Chain Management on the Level of Patient/Client satisfaction In
Community Pharmacies:
The Case of Addis Ababa, Ethiopia
Respondents Profile
1. Sex: □Male □ Female
2. Age: □20-25 years
□ 26-30 years
□ 31-35 years
□36- 40 years
□Above 40 years
3. Educational Qualification:
□Grade 10 completed □ Grade 12 completed □ Certificate
□College diploma □ First Degree
I. Verbal consent form before administering the questionnaire to dispensing personnel.
“Good day. My name is _______________________________ I am working with the research
team of the Department of Logistics and Supply Chain Management, School of Commerce,
Addis Ababa University. I am here to collect data about the pharmaceutical supply chain
management and its effect on the level of patient/ client satisfaction in your facility that is
needed for the Master‟s Thesis titled “Effect of Drug Supply Chain Management on the level
of patient /client satisfaction In Community Pharmacies: The case of Addis Ababa, Ethiopia.”
This survey is done in all selected 31(thirty one) community pharmacies in Addis Ababa. Your
facility is selected because it is one of them. The research will provide an empirical snapshot
of the current pharmaceutical supply chain situation related to the level of patient satisfaction
at a community pharmacy level in Addis Ababa and provide baseline information to track
changes and improvements in pharmaceutical supply chain system performance with respect to
the level of patient satisfaction over time.
I would like to ask you few questions about availability of drugs and the functioning of
pharmaceutical supply chain system. The interview will take 10-15 minutes of your time. Your
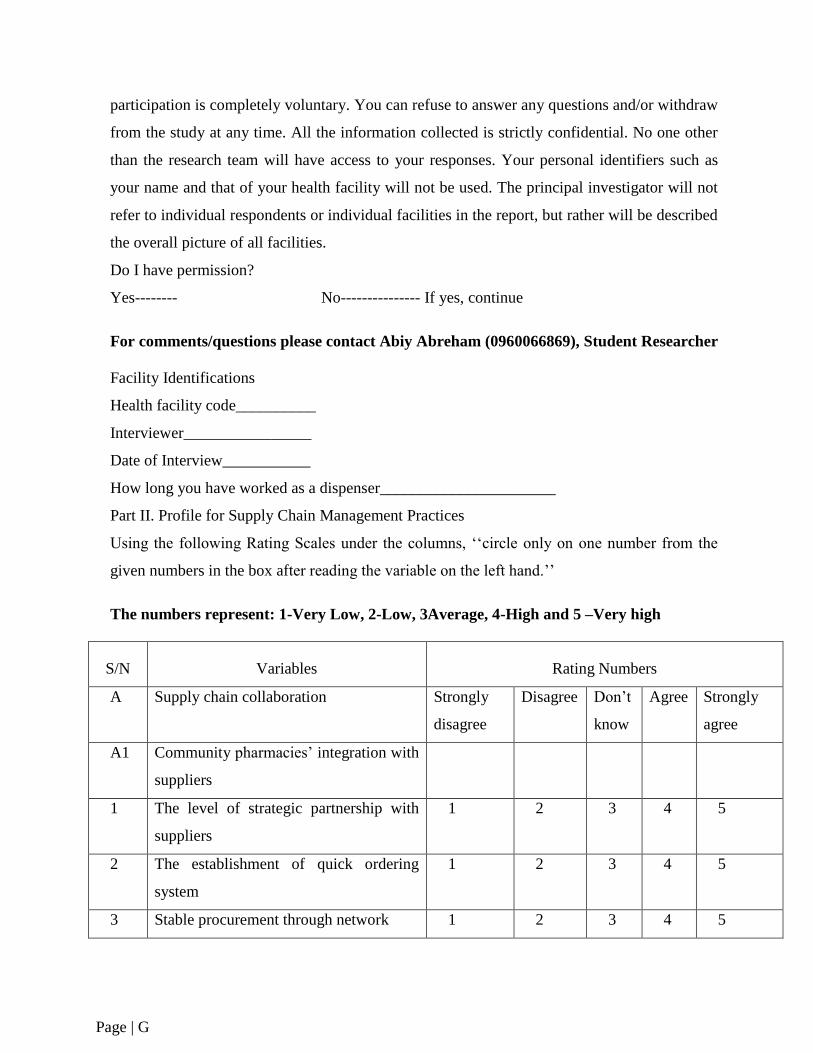
Page | G
participation is completely voluntary. You can refuse to answer any questions and/or withdraw
from the study at any time. All the information collected is strictly confidential. No one other
than the research team will have access to your responses. Your personal identifiers such as
your name and that of your health facility will not be used. The principal investigator will not
refer to individual respondents or individual facilities in the report, but rather will be described
the overall picture of all facilities.
Do I have permission?
Yes-------- No--------------- If yes, continue
For comments/questions please contact Abiy Abreham (0960066869), Student Researcher
Facility Identifications
Health facility code__________
Interviewer________________
Date of Interview___________
How long you have worked as a dispenser______________________
Part II. Profile for Supply Chain Management Practices
Using the following Rating Scales under the columns, „„circle only on one number from the
given numbers in the box after reading the variable on the left hand.‟‟
The numbers represent: 1-Very Low, 2-Low, 3Average, 4-High and 5 –Very high
S/N Variables Rating Numbers
A Supply chain collaboration Strongly
disagree
Disagree Don‟t
know
Agree Strongly
agree
A1 Community pharmacies‟ integration with
suppliers
1 The level of strategic partnership with
suppliers
1 2 3 4 5
2 The establishment of quick ordering
system
1 2 3 4 5
3 Stable procurement through network 1 2 3 4 5
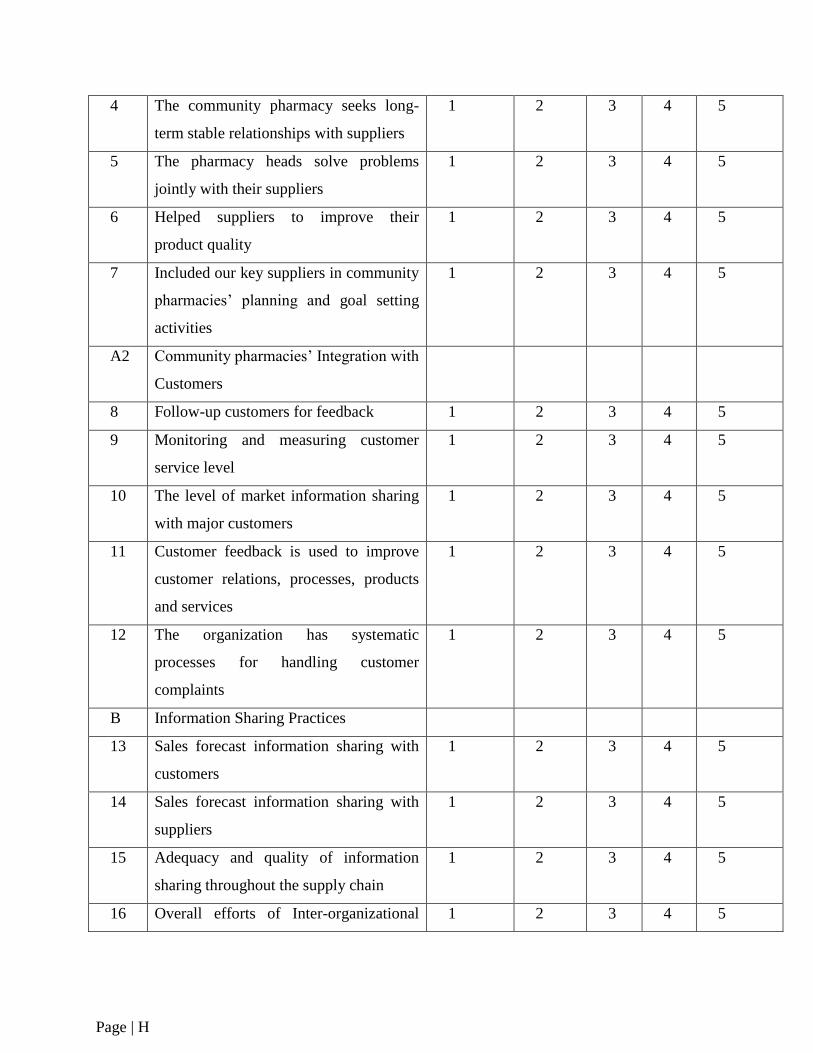
Page | H
4 The community pharmacy seeks long-
term stable relationships with suppliers
1 2 3 4 5
5 The pharmacy heads solve problems
jointly with their suppliers
1 2 3 4 5
6 Helped suppliers to improve their
product quality
1 2 3 4 5
7 Included our key suppliers in community
pharmacies‟ planning and goal setting
activities
1 2 3 4 5
A2 Community pharmacies‟ Integration with
Customers
8 Follow-up customers for feedback 1 2 3 4 5
9 Monitoring and measuring customer
service level
1 2 3 4 5
10 The level of market information sharing
with major customers
1 2 3 4 5
11 Customer feedback is used to improve
customer relations, processes, products
and services
1 2 3 4 5
12 The organization has systematic
processes for handling customer
complaints
1 2 3 4 5
B Information Sharing Practices
13 Sales forecast information sharing with
customers
1 2 3 4 5
14 Sales forecast information sharing with
suppliers
1 2 3 4 5
15 Adequacy and quality of information
sharing throughout the supply chain
1 2 3 4 5
16 Overall efforts of Inter-organizational 1 2 3 4 5
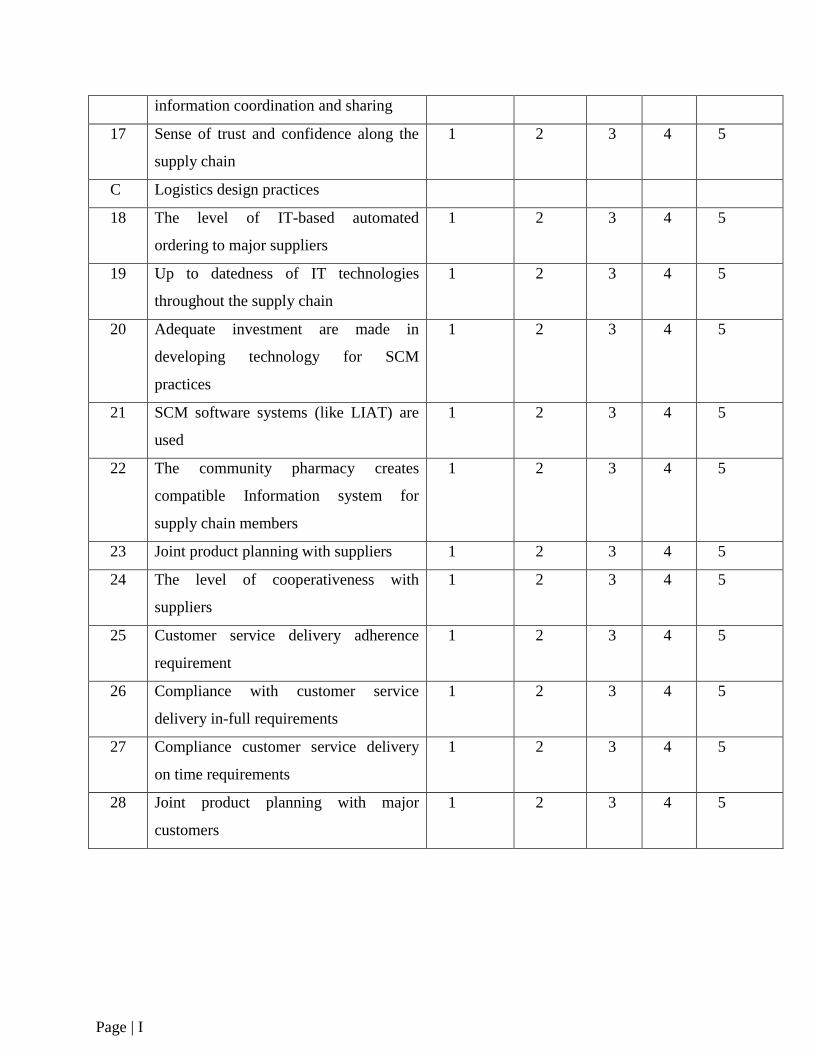
Page | I
information coordination and sharing
17 Sense of trust and confidence along the
supply chain
1 2 3 4 5
C Logistics design practices
18 The level of IT-based automated
ordering to major suppliers
1 2 3 4 5
19 Up to datedness of IT technologies
throughout the supply chain
1 2 3 4 5
20 Adequate investment are made in
developing technology for SCM
practices
1 2 3 4 5
21 SCM software systems (like LIAT) are
used
1 2 3 4 5
22 The community pharmacy creates
compatible Information system for
supply chain members
1 2 3 4 5
23 Joint product planning with suppliers 1 2 3 4 5
24 The level of cooperativeness with
suppliers
1 2 3 4 5
25 Customer service delivery adherence
requirement
1 2 3 4 5
26 Compliance with customer service
delivery in-full requirements
1 2 3 4 5
27 Compliance customer service delivery
on time requirements
1 2 3 4 5
28 Joint product planning with major
customers
1 2 3 4 5
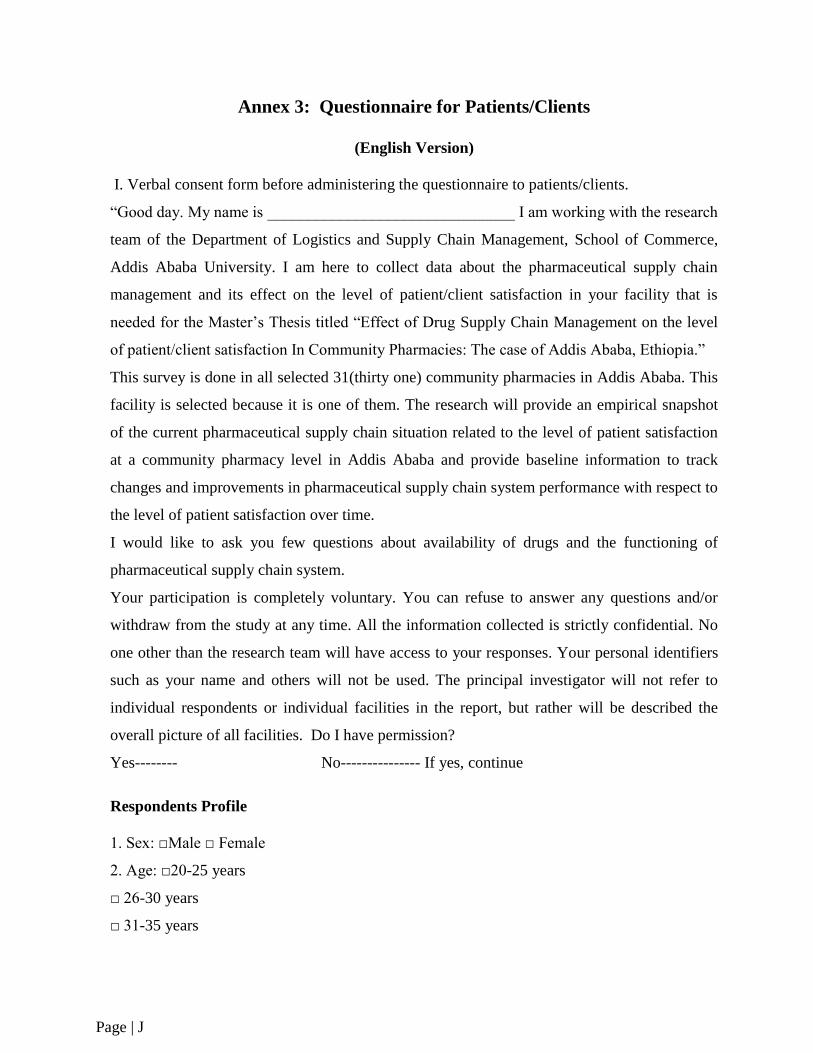
Page | J
Annex 3: Questionnaire for Patients/Clients
(English Version)
I. Verbal consent form before administering the questionnaire to patients/clients.
“Good day. My name is _______________________________ I am working with the research
team of the Department of Logistics and Supply Chain Management, School of Commerce,
Addis Ababa University. I am here to collect data about the pharmaceutical supply chain
management and its effect on the level of patient/client satisfaction in your facility that is
needed for the Master‟s Thesis titled “Effect of Drug Supply Chain Management on the level
of patient/client satisfaction In Community Pharmacies: The case of Addis Ababa, Ethiopia.”
This survey is done in all selected 31(thirty one) community pharmacies in Addis Ababa. This
facility is selected because it is one of them. The research will provide an empirical snapshot
of the current pharmaceutical supply chain situation related to the level of patient satisfaction
at a community pharmacy level in Addis Ababa and provide baseline information to track
changes and improvements in pharmaceutical supply chain system performance with respect to
the level of patient satisfaction over time.
I would like to ask you few questions about availability of drugs and the functioning of
pharmaceutical supply chain system.
Your participation is completely voluntary. You can refuse to answer any questions and/or
withdraw from the study at any time. All the information collected is strictly confidential. No
one other than the research team will have access to your responses. Your personal identifiers
such as your name and others will not be used. The principal investigator will not refer to
individual respondents or individual facilities in the report, but rather will be described the
overall picture of all facilities. Do I have permission?
Yes-------- No--------------- If yes, continue
Respondents Profile
1. Sex: □Male □ Female
2. Age: □20-25 years
□ 26-30 years
□ 31-35 years
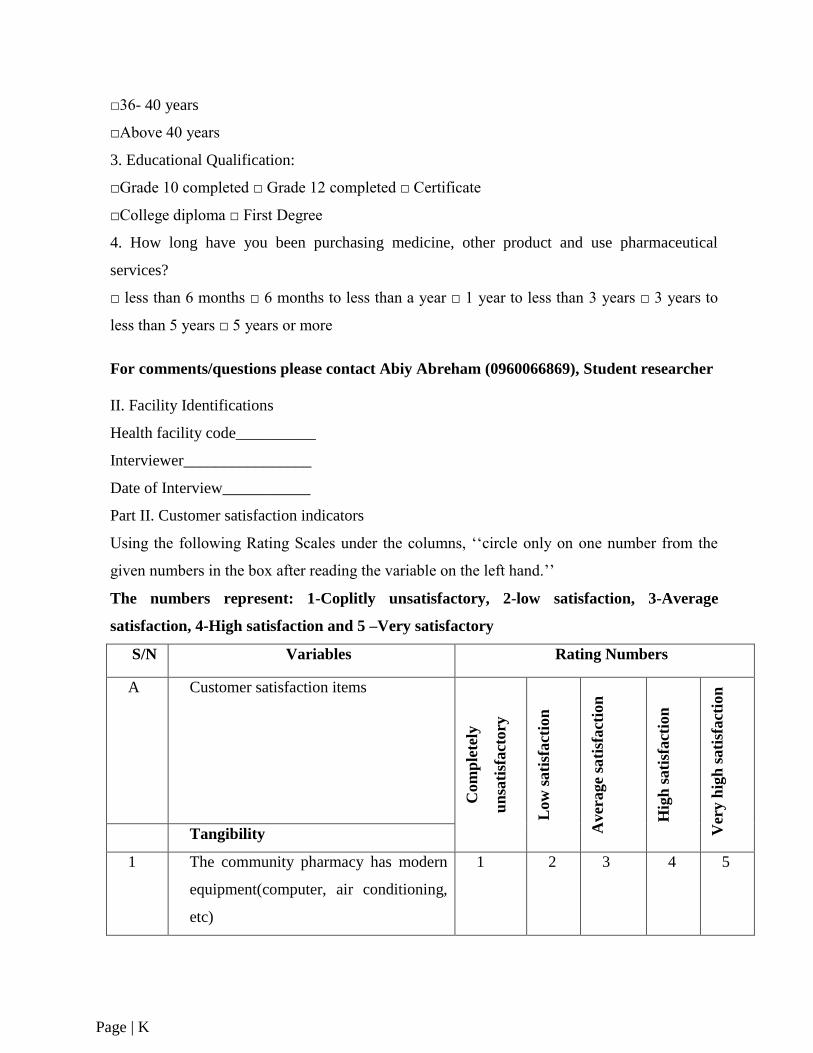
Page | K
□36- 40 years
□Above 40 years
3. Educational Qualification:
□Grade 10 completed □ Grade 12 completed □ Certificate
□College diploma □ First Degree
4. How long have you been purchasing medicine, other product and use pharmaceutical
services?
□ less than 6 months □ 6 months to less than a year □ 1 year to less than 3 years □ 3 years to
less than 5 years □ 5 years or more
For comments/questions please contact Abiy Abreham (0960066869), Student researcher
II. Facility Identifications
Health facility code__________
Interviewer________________
Date of Interview___________
Part II. Customer satisfaction indicators
Using the following Rating Scales under the columns, „„circle only on one number from the
given numbers in the box after reading the variable on the left hand.‟‟
The numbers represent: 1-Coplitly unsatisfactory, 2-low satisfaction, 3-Average
satisfaction, 4-High satisfaction and 5 –Very satisfactory
S/N Variables Rating Numbers
A Customer satisfaction items
Com
ple
tely
un
sati
sfact
ory
L
ow
sati
sfact
ion
Aver
age
sati
sfact
ion
Hig
h s
ati
sfact
ion
Ver
y h
igh
sati
sfact
ion
Tangibility
1 The community pharmacy has modern
equipment(computer, air conditioning,
etc)
1 2 3 4 5
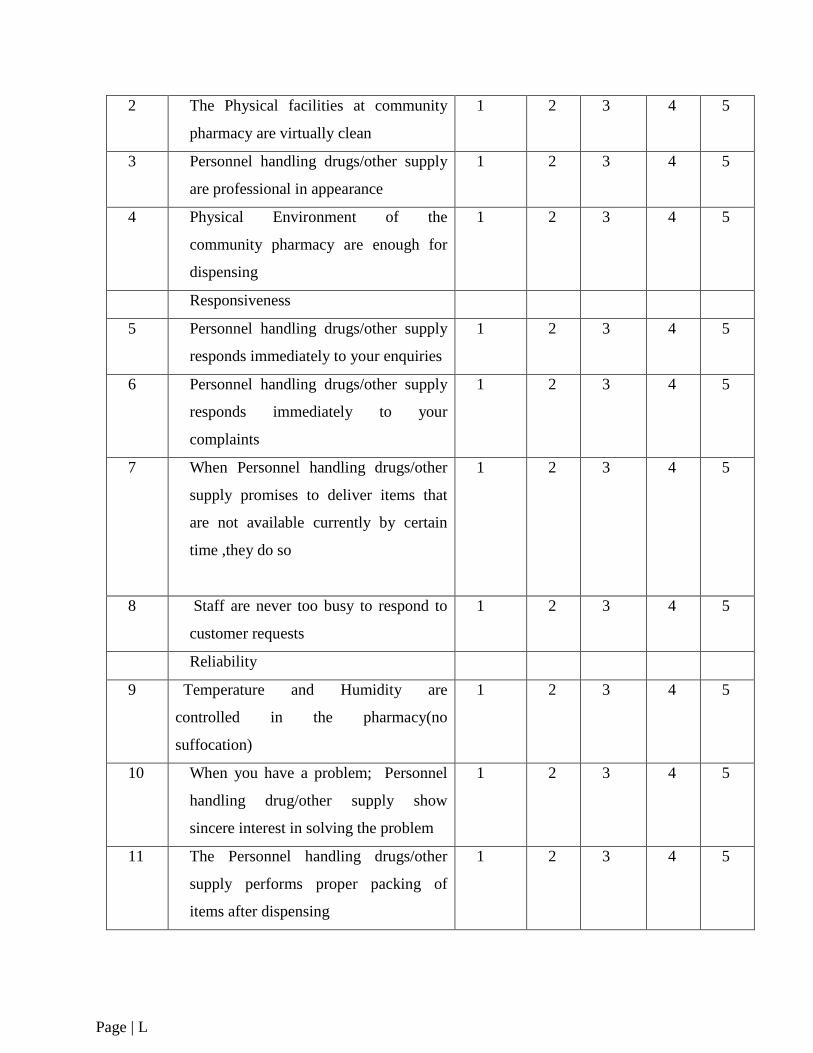
Page | L
2 The Physical facilities at community
pharmacy are virtually clean
1 2 3 4 5
3 Personnel handling drugs/other supply
are professional in appearance
1 2 3 4 5
4 Physical Environment of the
community pharmacy are enough for
dispensing
1 2 3 4 5
Responsiveness
5 Personnel handling drugs/other supply
responds immediately to your enquiries
1 2 3 4 5
6 Personnel handling drugs/other supply
responds immediately to your
complaints
1 2 3 4 5
7 When Personnel handling drugs/other
supply promises to deliver items that
are not available currently by certain
time ,they do so
1 2 3 4 5
8 Staff are never too busy to respond to
customer requests
1 2 3 4 5
Reliability
9 Temperature and Humidity are
controlled in the pharmacy(no
suffocation)
1 2 3 4 5
10 When you have a problem; Personnel
handling drug/other supply show
sincere interest in solving the problem
1 2 3 4 5
11 The Personnel handling drugs/other
supply performs proper packing of
items after dispensing
1 2 3 4 5
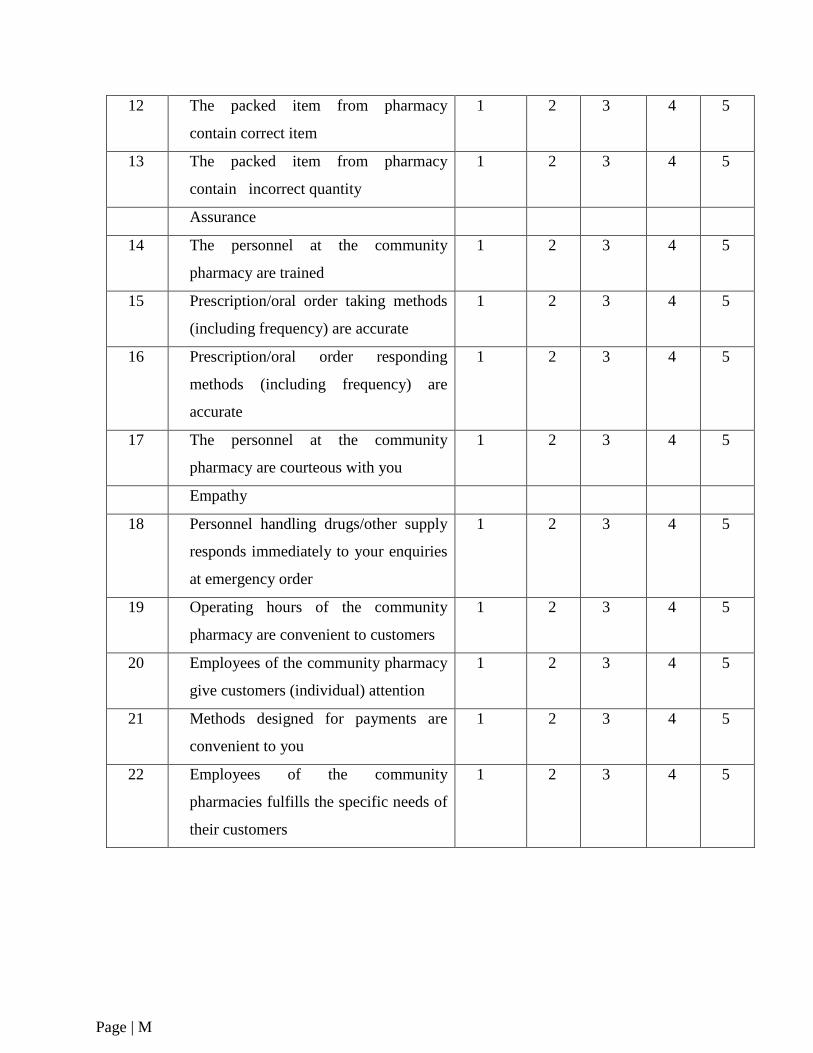
Page | M
12 The packed item from pharmacy
contain correct item
1 2 3 4 5
13 The packed item from pharmacy
contain incorrect quantity
1 2 3 4 5
Assurance
14 The personnel at the community
pharmacy are trained
1 2 3 4 5
15 Prescription/oral order taking methods
(including frequency) are accurate
1 2 3 4 5
16 Prescription/oral order responding
methods (including frequency) are
accurate
1 2 3 4 5
17 The personnel at the community
pharmacy are courteous with you
1 2 3 4 5
Empathy
18 Personnel handling drugs/other supply
responds immediately to your enquiries
at emergency order
1 2 3 4 5
19 Operating hours of the community
pharmacy are convenient to customers
1 2 3 4 5
20 Employees of the community pharmacy
give customers (individual) attention
1 2 3 4 5
21 Methods designed for payments are
convenient to you
1 2 3 4 5
22 Employees of the community
pharmacies fulfills the specific needs of
their customers
1 2 3 4 5
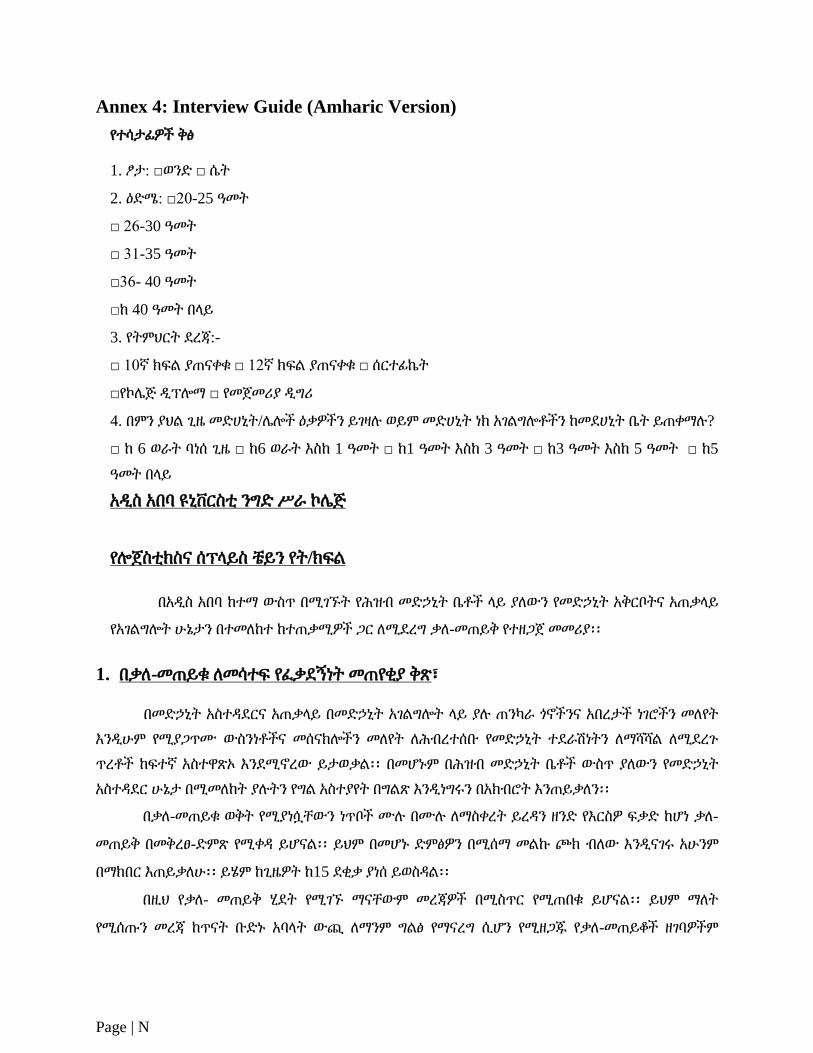
Page | N
Annex 4: Interview Guide (Amharic Version)
የተሳታፊዎች ቅፅ
1. ፆታ: □ወንዴ □ ሴት
2. ዕዴሜ: □20-25 ዓመት
□ 26-30 ዓመት
□ 31-35 ዓመት
□36- 40 ዓመት
□ከ 40 ዓመት በሊይ
3. የትምህርት ዯረጃ:-
□ 10ኛ ክፍሌ ያጠናቀቁ □ 12ኛ ክፍሌ ያጠናቀቁ □ ሰርተፊኬት
□የኮላጅ ዱፕልማ □ የመጀመሪያ ዱግሪ
4. በምን ያህሌ ጊዜ መዴሀኒት/ላልች ዕቃዎችን ይገዛለ ወይም መዴሀኒት ነክ አገሌግልቶችን ከመዯሀኒት ቤት ይጠቀማለ?
□ ከ 6 ወራት ባነሰ ጊዜ □ ከ6 ወራት እስከ 1 ዓመት □ ከ1 ዓመት እስከ 3 ዓመት □ ከ3 ዓመት እስከ 5 ዓመት □ ከ5
ዓመት በሊይ
አዱስ አበባ ዩኒቨርስቲ ንግዴ ሥራ ኮላጅ
የልጀስቲክስና ሰፕሊይስ ቼይን የት/ክፍሌ
በአዱስ አበባ ከተማ ውስጥ በሚገኙት የሕዝብ መዴኃኒት ቤቶች ሊይ ያሇውን የመዴኃኒት አቅርቦትና አጠቃሊይ
የአገሌግልት ሁኔታን በተመሇከተ ከተጠቃሚዎች ጋር ሇሚዯረግ ቃሇ-መጠይቅ የተዘጋጀ መመሪያ፡፡
1. በቃሇ-መጠይቁ ሇመሳተፍ የፇቃዯኝነት መጠየቂያ ቅጽ፣
በመዴኃኒት አስተዲዯርና አጠቃሊይ በመዴኃኒት አገሌግልት ሊይ ያለ ጠንካራ ጎኖችንና አበረታች ነገሮችን መሇየት
እንዱሁም የሚያጋጥሙ ውስንነቶችና መሰናክልችን መሇየት ሇሕብረተሰቡ የመዴኃኒት ተዯራሽነትን ሇማሻሻሌ ሇሚዯረጉ
ጥረቶች ከፍተኛ አስተዋጽኦ እንዯሚኖረው ይታወቃሌ፡፡ በመሆኑም በሕዝብ መዴኃኒት ቤቶች ውስጥ ያሇውን የመዴኃኒት
አስተዲዯር ሁኔታ በሚመሇከት ያለትን የግሌ አስተያየት በግሌጽ እንዱነግሩን በአክብሮት እንጠይቃሇን፡፡
በቃሇ-መጠይቁ ወቅት የሚያነሷቸውን ነጥቦች ሙለ በሙለ ሇማስቀረት ይረዲን ዘንዴ የእርስዎ ፍቃዴ ከሆነ ቃሇ-
መጠይቅ በመቅረፀ-ዴምጽ የሚቀዲ ይሆናሌ፡፡ ይህም በመሆኑ ዴምፅዎን በሚሰማ መሌኩ ጮክ ብሇው እንዱናገሩ አሁንም
በማክበር እጠይቃሇሁ፡፡ ይሄም ከጊዜዎት ከ15 ዯቂቃ ያነሰ ይወስዲሌ፡፡
በዚህ የቃሇ- መጠይቅ ሂዯት የሚገኙ ማናቸውም መረጃዎች በሚስጥር የሚጠበቁ ይሆናሌ፡፡ ይህም ማሇት
የሚሰጡን መረጃ ከጥናት ቡዴኑ አባሊት ውጪ ሇማንም ግሌፅ የማናረግ ሲሆን የሚዘጋጁ የቃሇ-መጠይቆች ዘገባዎችም
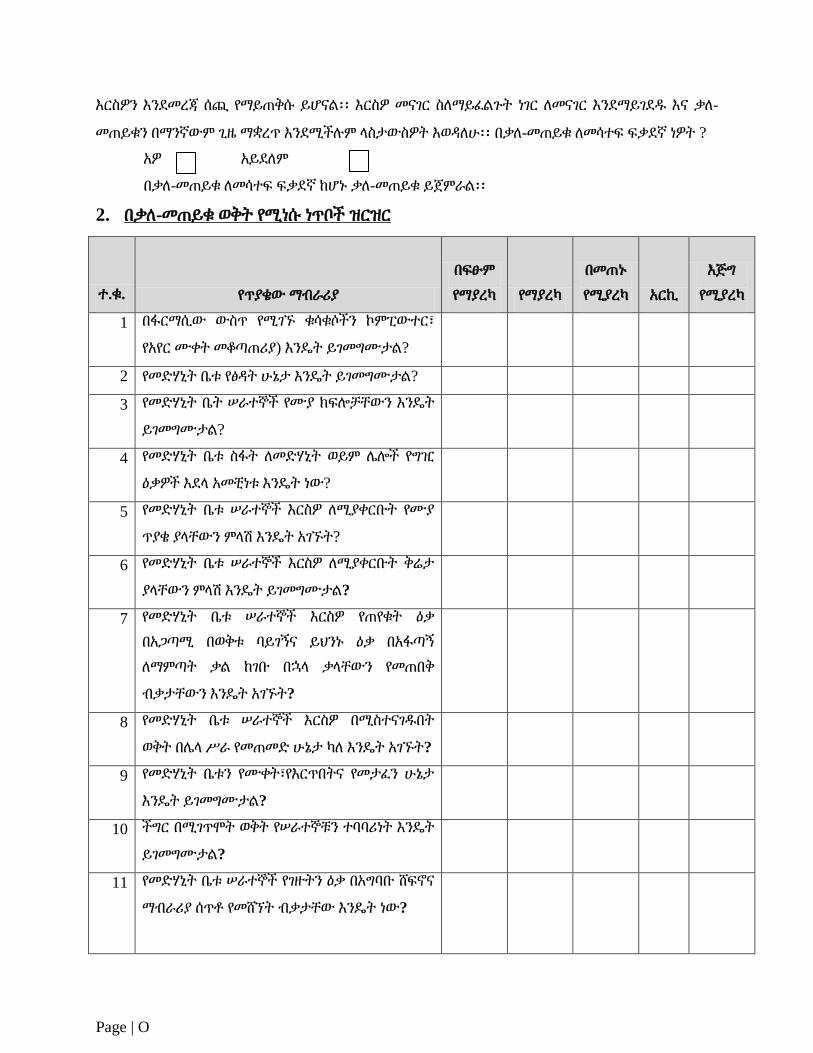
Page | O
እርስዎን እንዯመረጃ ሰጪ የማይጠቅሱ ይሆናሌ፡፡ እርስዎ መናገር ስሇማይፇሌጉት ነገር ሇመናገር እንዯማይገዯደ እና ቃሇ-
መጠይቁን በማንኛውም ጊዜ ማቋረጥ እንዯሚችለም ሊስታውስዎት እወዲሇሁ፡፡ በቃሇ-መጠይቁ ሇመሳተፍ ፍቃዯኛ ነዎት ?
አዎ አይዯሇም
በቃሇ-መጠይቁ ሇመሳተፍ ፍቃዯኛ ከሆኑ ቃሇ-መጠይቁ ይጀምራሌ፡፡
2. በቃሇ-መጠይቁ ወቅት የሚነሱ ነጥቦች ዝርዝር
ተ.ቁ. የጥያቄው ማብራሪያ
በፍፁም
የማያረካ የማያረካ
በመጠኑ
የሚያረካ አርኪ
እጅግ
የሚያረካ
1 በፋርማሲው ውስጥ የሚገኙ ቁሳቁሶችን ኮምፒውተር፣
የአየር ሙቀት መቆጣጠሪያ) እንዳት ይገመግሙታሌ?
2 የመዴሃኒት ቤቱ የፅዲት ሁኔታ እንዳት ይገመግሙታሌ?
3 የመዴሃኒት ቤት ሠራተኞች የሙያ ክፍልቻቸውን እንዳት
ይገመግሙታሌ?
4 የመዴሃኒት ቤቱ ስፋት ሇመዴሃኒት ወይም ላልች የግዢ
ዕቃዎች እዯሊ አመቺነቱ እንዳት ነው?
5 የመዴሃኒት ቤቱ ሠራተኞች እርስዎ ሇሚያቀርቡት የሙያ
ጥያቄ ያሊቸውን ምሊሽ እንዳት አገኙት?
6 የመዴሃኒት ቤቱ ሠራተኞች እርስዎ ሇሚያቀርቡት ቅሬታ
ያሊቸውን ምሊሽ እንዳት ይገመግሙታሌ?
7 የመዴሃኒት ቤቱ ሠራተኞች እርስዎ የጠየቁት ዕቃ
በአጋጣሚ በወቅቱ ባይገኝና ይህንኑ ዕቃ በአፋጣኝ
ሇማምጣት ቃሌ ከገቡ በኋሊ ቃሊቸውን የመጠበቅ
ብቃታቸውን እንዳት አገኙት?
8 የመዴሃኒት ቤቱ ሠራተኞች እርስዎ በሚስተናገደበት
ወቅት በላሊ ሥራ የመጠመዴ ሁኔታ ካሇ እንዳት አገኙት?
9 የመዴሃኒት ቤቱን የሙቀት፣የእርጥበትና የመታፇን ሁኔታ
እንዳት ይገመግሙታሌ?
10 ችግር በሚገጥሞት ወቅት የሠራተኞቹን ተባባሪነት እንዳት
ይገመግሙታሌ?
11 የመዴሃኒት ቤቱ ሠራተኞች የገዙትን ዕቃ በአግባቡ ሸፍኖና
ማብራሪያ ሰጥቶ የመሸኘት ብቃታቸው እንዳት ነው?
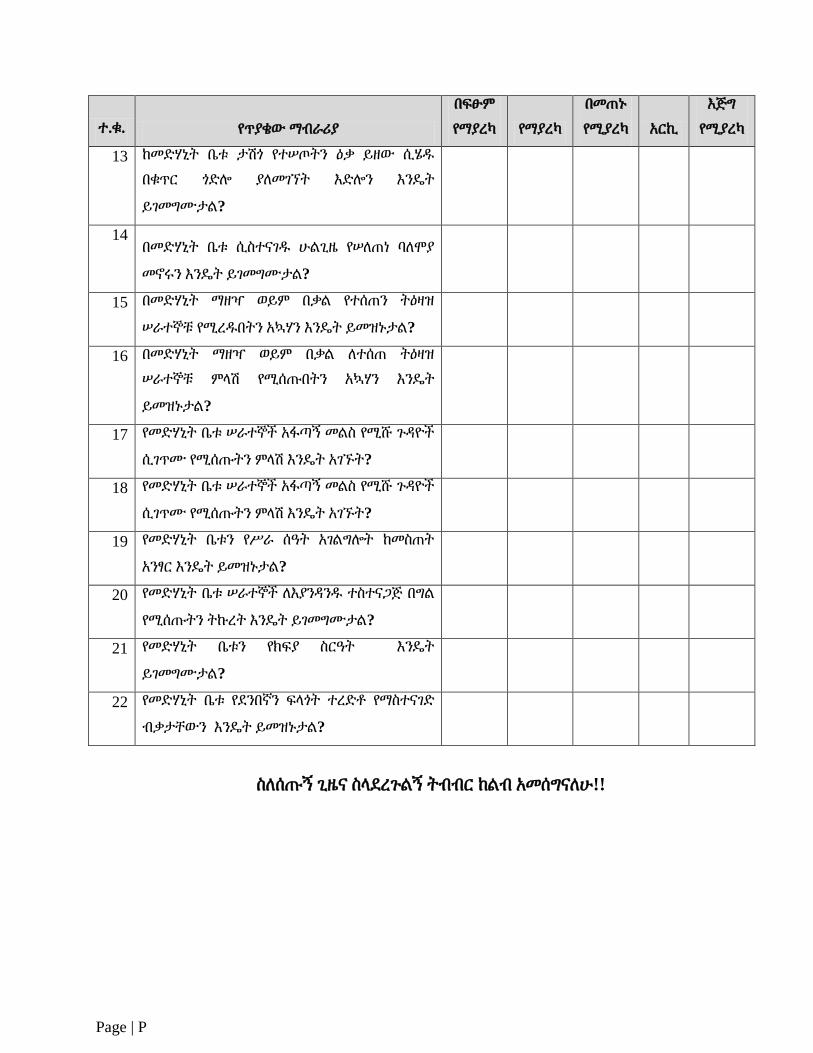
Page | P
ተ.ቁ. የጥያቄው ማብራሪያ
በፍፁም
የማያረካ የማያረካ
በመጠኑ
የሚያረካ አርኪ
እጅግ
የሚያረካ
13 ከመዴሃኒት ቤቱ ታሽጎ የተሠጦትን ዕቃ ይዘው ሲሄደ
በቁጥር ጎዴል ያሇመገኘት እዴልን እንዳት
ይገመግሙታሌ?
14 በመዴሃኒት ቤቱ ሲስተናገደ ሁሌጊዜ የሠሇጠነ ባሇሞያ
መኖሩን እንዳት ይገመግሙታሌ?
15 በመዴሃኒት ማዘዣ ወይም በቃሌ የተሰጠን ትዕዛዝ
ሠራተኞቹ የሚረደበትን አኳሃን እንዳት ይመዝኑታሌ?
16 በመዴሃኒት ማዘዣ ወይም በቃሌ ሇተሰጠ ትዕዛዝ
ሠራተኞቹ ምሊሽ የሚሰጡበትን አኳሃን እንዳት
ይመዝኑታሌ?
17 የመዴሃኒት ቤቱ ሠራተኞች አፋጣኝ መሌስ የሚሹ ጉዲዮች
ሲገጥሙ የሚሰጡትን ምሊሽ እንዳት አገኙት?
18 የመዴሃኒት ቤቱ ሠራተኞች አፋጣኝ መሌስ የሚሹ ጉዲዮች
ሲገጥሙ የሚሰጡትን ምሊሽ እንዳት አገኙት?
19 የመዴሃኒት ቤቱን የሥራ ሰዓት አገሌግልት ከመስጠት
አንፃር እንዳት ይመዝኑታሌ?
20 የመዴሃኒት ቤቱ ሠራተኞች ሇእያንዲንደ ተስተናጋጅ በግሌ
የሚሰጡትን ትኩረት እንዳት ይገመግሙታሌ?
21 የመዴሃኒት ቤቱን የክፍያ ስርዓት እንዳት
ይገመግሙታሌ?
22 የመዴሃኒት ቤቱ የዯንበኛን ፍሊጎት ተረዴቶ የማስተናገዴ
ብቃታቸውን እንዳት ይመዝኑታሌ?
ስሇሰጡኝ ጊዜና ስሊዯረጉሌኝ ትብብር ከሌብ አመሰግናሇሁ!!
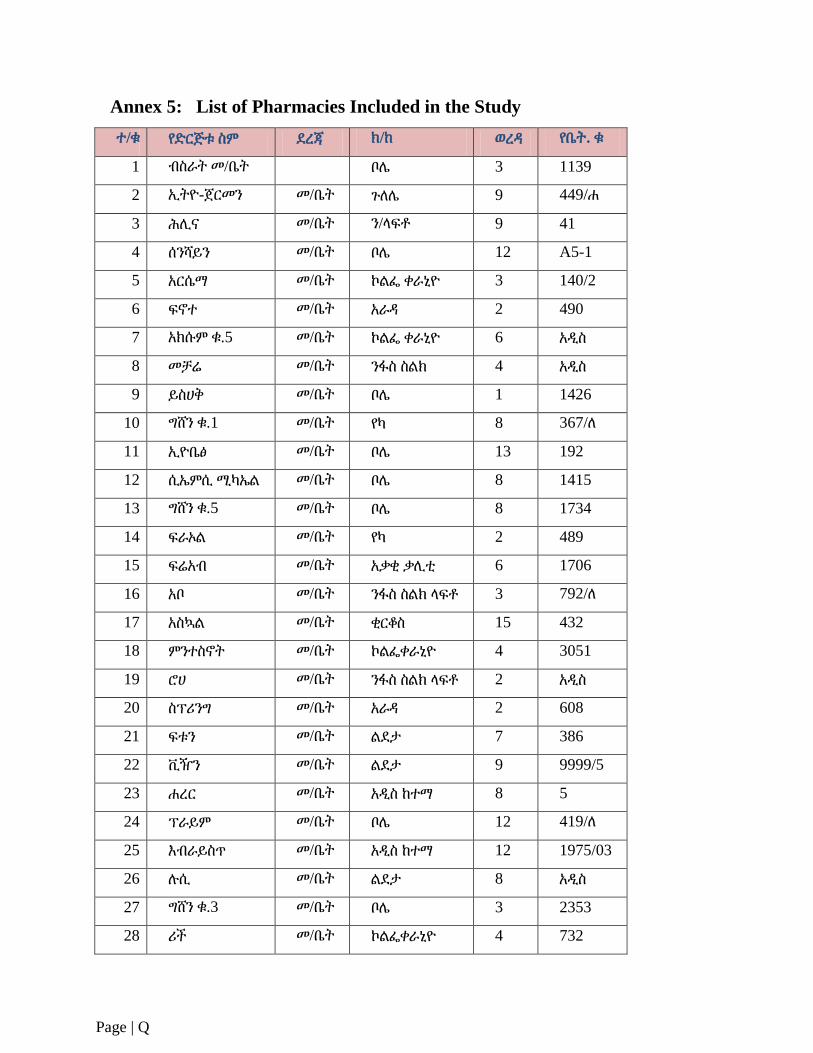
Page | Q
Annex 5: List of Pharmacies Included in the Study
ተ/ቁ የዴርጅቱ ስም ዯረጃ ክ/ከ ወረዲ የቤት. ቁ
1 ብስራት መ/ቤት
ቦላ 3 1139
2 ኢትዮ-ጀርመን መ/ቤት ጉሇላ 9 449/ሐ
3 ሕሉና መ/ቤት ን/ሊፍቶ 9 41
4 ሰንሻይን መ/ቤት ቦላ 12 A5-1
5 አርሴማ መ/ቤት ኮሌፌ ቀራኒዮ 3 140/2
6 ፍኖተ መ/ቤት አራዲ 2 490
7 አክሱም ቁ.5 መ/ቤት ኮሌፌ ቀራኒዮ 6 አዱስ
8 መቻሬ መ/ቤት ንፋስ ስሌክ 4 አዱስ
9 ይስሀቅ መ/ቤት ቦላ 1 1426
10 ግሸን ቁ.1 መ/ቤት የካ 8 367/ሇ
11 ኢዮቤፅ መ/ቤት ቦላ 13 192
12 ሲኤምሲ ሚካኤሌ መ/ቤት ቦላ 8 1415
13 ግሸን ቁ.5 መ/ቤት ቦላ 8 1734
14 ፍራኦሌ መ/ቤት የካ 2 489
15 ፍሬአብ መ/ቤት አቃቂ ቃሉቲ 6 1706
16 አቦ መ/ቤት ንፋስ ስሌክ ሊፍቶ 3 792/ሇ
17 አስኳሌ መ/ቤት ቂርቆስ 15 432
18 ምንተስኖት መ/ቤት ኮሌፌቀራኒዮ 4 3051
19 ሮሀ መ/ቤት ንፋስ ስሌክ ሊፍቶ 2 አዱስ
20 ስፕሪንግ መ/ቤት አራዲ 2 608
21 ፍቱን መ/ቤት ሌዯታ 7 386
22 ቪዥን መ/ቤት ሌዯታ 9 9999/5
23 ሐረር መ/ቤት አዱስ ከተማ 8 5
24 ፕራይም መ/ቤት ቦላ 12 419/ሇ
25 እብራይስጥ መ/ቤት አዱስ ከተማ 12 1975/03
26 ለሲ መ/ቤት ሌዯታ 8 አዱስ
27 ግሸን ቁ.3 መ/ቤት ቦላ 3 2353
28 ሪች መ/ቤት ኮሌፌቀራኒዮ 4 732
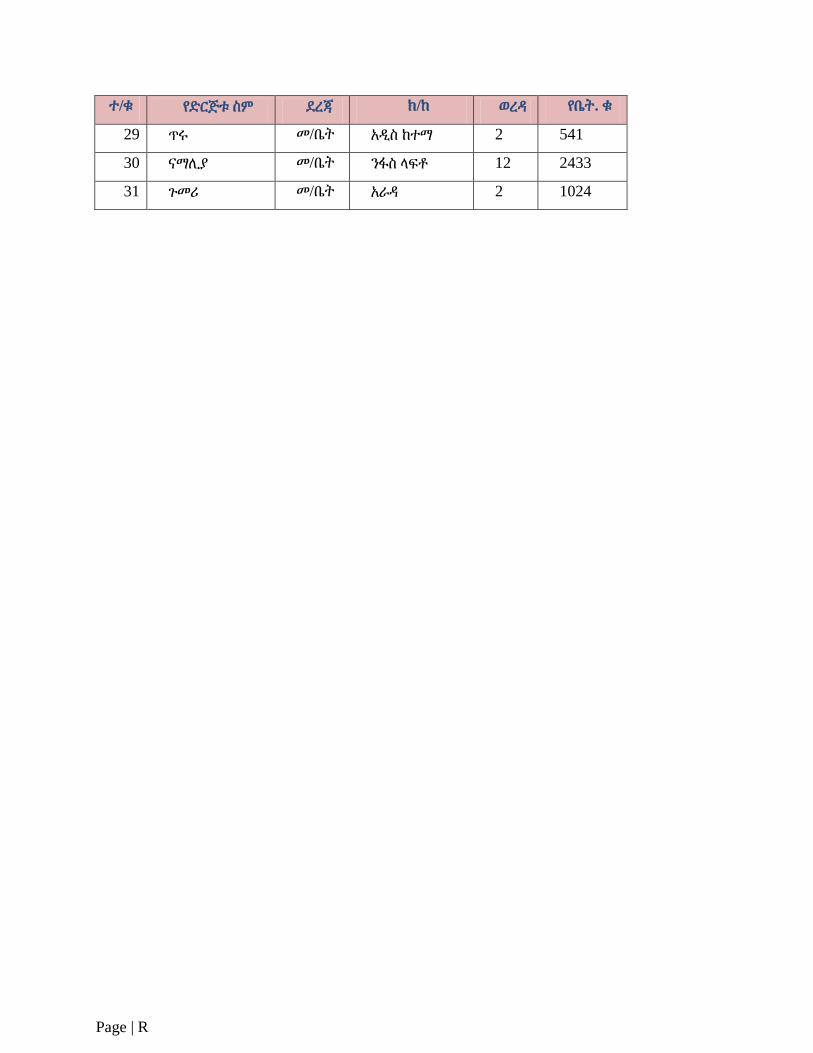
Page | R
ተ/ቁ የዴርጅቱ ስም ዯረጃ ክ/ከ ወረዲ የቤት. ቁ
29 ጥሩ መ/ቤት አዱስ ከተማ 2 541
30 ናማሉያ መ/ቤት ንፋስ ሊፍቶ 12 2433
31 ጉመሪ መ/ቤት አራዲ 2 1024