supply chain asiamagazine
TRANSCRIPT
ForecastingWhy most companies get it wrong
ChemicalsQ&A with Gideon Ong of Bayer MaterialScience FinanceHow to better link supply chain and finance
LogisticsThe World Bank’s logistics leaders
Greener
Customs:How updated codes
affect foods and chemicals traders
Supply Chains
SupplY Chain aSiam
ag
azin
e
www.supplychainasia.comConnect • Communicate • Collaborate
Mica(P) 023/02/2010 | MAR/APR 2010
March/A
pril 2
01
0Sup
ply Cha
in Asia
Magazine
ISSN 1793 5377
Plus…A first-hand account of how
Reliance brought mobile phones to India’s masses

Pub __________________________________
Size: __________________________________
Insertion: ______________________________
Agility GiveAlllMyCargo Ad Page
Prepared By Green Street AdsContact: John Espinoza626-644-8094
SupplyChainAsia
216x303 mm Page
03/01/2010
B r a n d i n g f o r t h e n e w g l o b a l m a r k e t p l a c e
g r e e n s t r e e t a d s
“Give all my cargo undivided
attenti n.”
Go ahead, challenge us.At Agility, we make it our business to pick up as promised, ship as scheduled, track every move and deliver on time, every time. So we’re not only providing reliable solutions to deliver your freight, we’re managing every move down to the last detail.
...............................
© 2010 Agility Logistics AG
Agility is a leading logistics company with 37,000 employees taking care of our customers in more than 120 countries. Put your local office to the test.
AGL-GiveAllMyCargo_ad_SupplyChainAsia_.0225.10.indd 1 2/25/10 12:07 PM
34CHINESE SECTION
Editor’s View02 What’s in a name? Getting
to the bottom of supply chan jargon
President’s Address04 Here’s to a healthy and
prosperous Year of the Tiger
Developments6 Regional and global supply
chain news update
8 Luxury goods drive supply chain efficiency in China
Air Cargo 11 JAL bankruptcy has regional
cargo ramifications
Maritime 16 Shippers protest heavily as
rocketing rates mask boxship glut
Dialogue20 Q&A with Gideon Ong of
Bayer MaterialScience
Strategy22 Linking finance with supply
chain
26 Dr Rakesh Singh on how to be better at forecasting
30 Building operational excellence on the path out of recession
Pricing44 Improve profitability by
turning away customers
Customs48 Updated international
codes will affect foods and chemicals traders
Regulars42 Events Awards 2010 categories
50 People How Reliance brought
mobile phones to India’s masses
54 Opinion The current hot
buttons in supply chain management
56 Lao Tze on Asia The huge cost of market
recalls
57 Book Reviews Robert Sidelsky on
the return of Keynes and Stephen Green on morality and money
58 Supply Chain Indicators
The World Bank’s new ranking of countries by logistics capability
60 Blogs
18
20
March/April 2010
48
54
26
Greener supply chains08 Consignment-level
carbon reporting from the World Economic Forum
10 Eco-measures shake up Japanese auto sector
12 Greening air cargo18 The realities of nuclear-
powered boxships

management team & support team
supply Chain asia - board of advisors
editor’sview
Dr robert Yap (Founding Chairman)Chairman & CEO, YCH Group
Mr paul braDleY (Vice Chairman)Member, Global Advisory Board, Supply Chain Asia
board MeMbers
Mr MahenDra agarwalManaging Director & CEO, GATI
Mr neeraj bhargavaRegional Logistics Procurement Director,
Johnson & Johnson Asia Pacific
Mr jeff bauMSenior Vice President, Manhattan Associates
Mr vittorio favatiPresident, Asia Pacific, CEVA Logistics
Mr allen fukaDaRegional Solutions Leader, Asia Pacific,
Supply Chain Management Services, IBM Business Process Delivery
associate professor Mark gohDirector, Industry Research,
The Logistics Institute Asia Pacific
Mr harrY lagaDExecutive Director, GATI
Mr richarD lorettoExecutive Director, Fashion and Home Asia Pacific Supply Chain,
AVON
Mr turloch MooneYManaging Director, SC Asia Publications
Mr colin nelsonSenior Vice President, Supply Chain, AACEE, Unilever
Mr peter o’ brienHead, Asia Pacific Supply Chain Practice,
Russell Reynolds Associates
Mr Michael proffittStrategic Advisor and Consultant
Mr vivek sooDManaging Director, Global Supply Chain Group
publisherSC ASIA PUBLICATIONS PTE [email protected]
Managing director, editorialTURLOCH MOONEY
Managing director, coMMercialFRANk PAUL
contributorsSUVIR BHATIA, SAM CHAMBERS, CHEw wAI YEE,
BARRY ELLIOTT, PAUL FRENCH, MASANORI kIkUCHI, LUC kREMERS, HARRY LAGAD, PAUL LIM, DR RAkESH SINGH,
CATHERINE TRUEL, CRYSTAL YAN, JONATHAN wRIGHT
design & productionDESIGN wORkz
printingREGENT PRINTING (S) PTE LTD
What’s in a name? When it comes to supply chain – a concept and industry with a reputation for an unfortunate amount of jargon – there is rather a lot in a name.
At an invitation-only gathering of some of the best global minds in supply chain at Macquarie University in Sydney at the end of February, there was unanimity and not a little passion over the idea that the phrase ‘supply chain’ is inadequate for what it is supposed to be describing.
The phrase fails on several levels. It implies an approach to the ‘chain’ from the wrong direction entirely – an effortful push rather than the more natural pull that results from good customer understanding and good demand forecasting, which are core parts of supply chain management. Use of the word ‘chain’ is also a problem. Its linear and restrictive connotations belie the true complexity of an industry that stresses flexibility, innovation and, above all, value creation.
On a daily basis, supply chain is too readily confused with logistics. Logistics is a key part of the business of supply chain management. But it is only one part, and it is a part that should in fact be largely designed and driven by other elements of supply chain management.
Keith Oliver, a vice president with the London office of Booz Allen Hamilton is credited with coming up with the phrase supply chain in 1982. It was probably also in the 80s that the term logistics, considered the forerunner of supply chain, started to be widely applied in commercial business (It was used in a military capacity long before that – the ancient empires of Greece and Rome had military officers called ‘Logistikas’ who were responsible for supply distribution).
So what are our alternatives? ‘Value chain’ and ‘demand chain’ are both suggested and, in the case of the former at least, has been used not uncommonly for decades. Michael Porter introduced the term value chain in his 1985 book ‘Competitive Advantage, Creating and Sustaining Superior Performance’.
Both value chain and demand chain look at things from a better perspective, but both fail to remove the linear connotation of what is inarguably a three dimensional concept. At the summit in Sydney, it was ‘Value Networks’ that was selected the preferred phrase. The term ‘network’ is widely applied to supply chain in the book ‘Competing in a Flat World’ by Victor and William Fung and Jerry Wind of Wharton University, a book I strongly recommend to anyone interested in getting to grips with modern supply chain management.
Although our industry has a reputation for jargon, this discussion is not simply a matter of playing with words. Like many in supply chain, I am constantly asked by outsiders to define the phrase and need to speak for ten minutes and draw a diagram to get people starting to understand.
As I see it, the term ‘supply chain’ fails to provide a semantic framework for the truth that supply chain is not just something people and companies do, but is a mindset: a more effective way of looking at and developing any business or organisation in an increasingly globalised and complex world.
As a career media person, I know intuitively ‘Value Networks’ will be greeted with groans by the jargon-skeptic general public, and by many who should know better or who are not prepared to put thought into the concept in the first place. I have not yet requested my designer to come up with a ‘Value Networks Asia’ masthead for our magazine and portal. But given how quickly this industry and the markets it serves are evolving, I am not ruling anything out.
Turloch Mooney
What’s in a name?Getting to the bottom of supply chain jargon

DXTNTB 12236 EuropeP 6/24/08 12:00 AM Page 2
Composite
C M Y CM MY CY CMY K
DXTNTB 12236_EuropeSupplies Chain Asia_TD300% (Sept,Oct)W210 x H297mm (FTP) DYR M Y
C KWhile every effort has been taken to carry out instruction to customers satisfactionNO RESPONSIBILITY liablilty will be accepted for errorsCUSTOMERSARETHEREFOREURGEDTOCHECKTHOROUGHLY BEFOREAUTHORISINGPRINTRUNSDALIM
11 2 3 4 5 6 7 8 9 10 OK CLC CCCC241927 MAC5osx 23.06.08 CC659
supporting organisations
Corporate endorsers
American Society of Transportation and Logistics (ASTL) Chartered Institute of Logistics & Transport Singapore (CILT)
China Federation of Logistics & Purchasing (CFLP)Singapore Economic Development Board (EDB)Federation of Malaysian Manufacturers (FMM)
Global Logistics Council of Taiwan (GLCT)International Enterprise Singapore (IE Singapore)
Kainan University of Taiwan (KUT)Korea International Logistics Council (KILC)
Logistics Association of Australia (LAA)Logistics and Supply Chain Management Society (LSCMS)
Philippines Institute of Supply Management (PISM)Supply Chain & Logistics Group of the Middle East (SCLG)
Thai Logistics and Production Society (TLAPS)Vietnam Supply Chain Community
list of appointment holders
executive coMMittee MeMbersexecutive teaM
presidentMr Paul Lim (TNT)
vice president, academyMr koh Jin kiat (SCA Academy)
vice president, eventsMr Ang Tian Teck (StickySpy)
vice president, Young professionalsMr Joshua wu (Intel)
acadeMY board MeMbersDr Mark Goh (NUS)
Dr Byung Joon Park (SMU)Mr Raymond Heman (Eastman Chemical)
Mr David Chew (SC Asia Consulting)Mr Pari Annamalai (Planvisage)
Mr Travis wong (Microsoft)Mr koh Jin kiat (SCA Academy)Ms Christine Lee (Flextronics)
Mr Peter Chiong (Epson)Mr k H Goh (NXP Semiconductors)
countrY representativesAustralia
Mr Vivek Sood (Global Supply Chain Group)Mr Peter O’ Brien (Russell Reynolds)
China/Hong KongMr Neil Morrison (Stones International)
Mr Turloch Mooney (SC Asia Publications)Mr Babhui Lee (Independent)
IndonesiaMs Ayda Sulianti (Meratus Group)
Mr Benny woenardi (SC Asia Consulting)India
Mr Sanjay Goel (GTC Corporation)Japan
Mr Pelham Higgins (Japan Logistics Fund)Malaysia
Mr Daniel Lu (CBS Technology)Mr Durairaj Veeraiyah (BASF)
Mr Francis Quek (Share Services IT Advisory)Dr Mohamed Amin (Century Logistics)
Mr wee Ah Siah (SFFLA)Mr k Inbarajan (Logistics & Supply Chain Studies)
Mr Richard wang (CILT Malaysia)Mr Raymond Tan (Spansion)
Mr Nachiappan Suppiah (Mercedes Benz Malaysia)Mr Darren Lo (CBS Technology)
Mr Cheah Hup Lim (Agilent Technology)Mr zuhaimi Mohd Nor (western Digital)
Middle EastMr Nigel Moore (Logistics Executive)Mr Sheikh Abdulhai (Abdulla Fouad)
PhilippinesMr Antonio kent Valderrama (Macrolite Corporation)
SingaporeMr Paul Lim (TNT)
Dr Byung Joon Park (SMU)Mr koh kin kiat (SCA Academy)
Mr Ang Tian Teck (StickySpy)Taiwan
Mr Phil Vaudin (Best Logistics)Dr Jim wu (National Sun Yat Sun University)
ThailandMs Sasitorn Chakranont (Shipco Transport)
Mr Ian Manning (National Starch)Vietnam
Ms Quyen Nguyen (Vietnam Supply Chain Community)
Young proFessionals advisorsMr Joshua wu (Intel)
Mr Low Mun kong (YCH)Ms Christine Lee (Flextronics)
Mr Travis wong (Microsoft)Dr Byung Joon Park (SMU)
Mr Ang Tian Teck (StickySpy)Mr koh Jin kiat (SCA Academy)
Mr kH Goh (NXP Semiconductors)Mr Phil Vaudin (Best Logistics)
The celebration of the Chinese New Year is marked by parades and firecrackers as well as dragon and lion dances. But what underlies these rituals has a far more profound meaning. The holiday takes place in the first lunar month, generally falling between January 19 and February 23. It begins on the new moon and ends 15 days later with the full moon. Traditionally known as the Spring Festival, it is celebrated annually by billions of Chinese.
This year it fell on February 14.As with other years, many Chinese used the opportunity to
throw out the old and welcome the new. The days that led up to the holiday were busy. Markets were crowded, homes thoroughly cleaned to remove the misfortunes of the past year, and debts taken care of. Particular attention is given to the Kitchen God (Zao Jun), whose picture hangs near the stove. As the New Year approaches, his lips are slathered with honey so that he will utter only sweet words when he makes his annual report to the ruler of Heaven, the Jade Emperor (Yu Huang), thus ensuring a prosperous and fortunate household.
Chinese New Year is filled with auspicious characters and pictures. Many families also prepare or buy traditional woodblock prints (nianhua) and good luck characters (chun lian) to place on their doorways. The nianhua are often images of favourite gods, zodiac signs appropriate to the year, and themes from daily life to ensure good fortune, longevity, and harmony. Pictures of a boy and girl known as Da A Fu are also hung on the door. They bring protection, luck, and happiness to the home. Chun lian are calligraphy conveying good wishes for the New Year and are usually brushed on red diamond-shaped paper and also hung on the door.
Foods to bring good fortuneTraditionally on New Year’s Eve the whole family will gather for a feast. Foods served at this time abound with symbolism. Fried
spring rolls, which resemble gold bricks, are served for wealth; steamed clams represent openness to good fortune, and citrus fruits for good luck. Many Chinese will serve a whole fish to symbolise bounty. The Chinese word for fish is Yu and sounds similar to the word for ‘surplus’.
Red envelopes containing money (hongbao) are passed out to children and firecrackers are set off. Firecrackers are an important part of the New Year celebrations, as they are believed to ward off evil spirits and ensure prosperity. The words of New Year good wishes, ‘Gongxi facai’ can be heard throughout the 15 days of merriment.
The culmination of the New Year festivities is held on the 15th day after the first new moon with the Lantern Festival. This day celebrates the first full moon of the year. The lanterns can be simple or elaborate and the lit lantern represents the warmth of the coming spring. The night is magically aglow with the lit lanterns carried by children and adults. Streets take on a carnival-like atmosphere, as street performers, clowns, and musicians perform under the light of hundreds of lanterns. The night concludes with the colourful, loud, and lively Lion Dance. The visit from the lion guarantees a lucky year.
We want to take this opportunity to wish all our readers and Chinese community members prosperity, happiness, wealth and success for the Year of the Tiger.
Paul LimPresident, Supply Chain Asia
president’sADDReSS
Supply Chain Asia Magazine (MICA (P) 023/02/2010) is published by SC Asia Publications, a partner of the Supply Chain Asia industry community. All rights reserved. No part of the publication may be reproduced without prior permission from the publisher. For subscription and other enquiries, please visit www.supplychainasia.com
infrastructure update6 developments
Supply Chain Asia March/April 2010
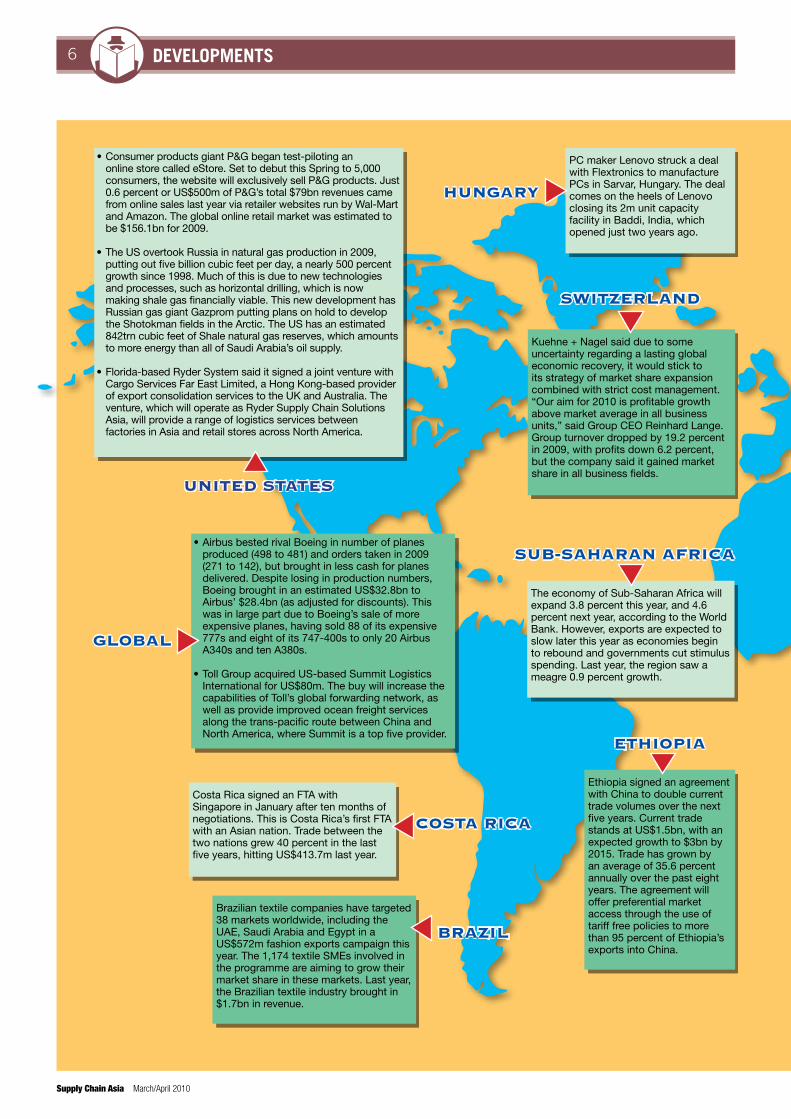
Brazilian textile companies have targeted 38 markets worldwide, including the UAE, Saudi Arabia and Egypt in a US$572m fashion exports campaign this year. The 1,174 textile SMEs involved in the programme are aiming to grow their market share in these markets. Last year, the Brazilian textile industry brought in $1.7bn in revenue.
Costa Rica signed an FTA with Singapore in January after ten months of negotiations. This is Costa Rica’s first FTA with an Asian nation. Trade between the two nations grew 40 percent in the last five years, hitting US$413.7m last year.
The economy of Sub-Saharan Africa will expand 3.8 percent this year, and 4.6 percent next year, according to the World Bank. However, exports are expected to slow later this year as economies begin to rebound and governments cut stimulus spending. Last year, the region saw a meagre 0.9 percent growth.
•
•
•
Consumer products giant P&G began test-piloting an online store called eStore. Set to debut this Spring to 5,000 consumers, the website will exclusively sell P&G products. Just 0.6 percent or US$500m of P&G’s total $79bn revenues came from online sales last year via retailer websites run by Wal-Mart and Amazon. The global online retail market was estimated to be $156.1bn for 2009.
The US overtook Russia in natural gas production in 2009, putting out five billion cubic feet per day, a nearly 500 percent growth since 1998. Much of this is due to new technologies and processes, such as horizontal drilling, which is now making shale gas financially viable. This new development has Russian gas giant Gazprom putting plans on hold to develop the Shotokman fields in the Arctic. The US has an estimated 842trn cubic feet of Shale natural gas reserves, which amounts to more energy than all of Saudi Arabia’s oil supply.
Florida-based Ryder System said it signed a joint venture with Cargo Services Far East Limited, a Hong Kong-based provider of export consolidation services to the UK and Australia. The venture, which will operate as Ryder Supply Chain Solutions Asia, will provide a range of logistics services between factories in Asia and retail stores across North America.
United StateS
HUngary
PC maker Lenovo struck a deal with Flextronics to manufacture PCs in Sarvar, Hungary. The deal comes on the heels of Lenovo closing its 2m unit capacity facility in Baddi, India, which opened just two years ago.
Ethiopia signed an agreement with China to double current trade volumes over the next five years. Current trade stands at US$1.5bn, with an expected growth to $3bn by 2015. Trade has grown by an average of 35.6 percent annually over the past eight years. The agreement will offer preferential market access through the use of tariff free policies to more than 95 percent of Ethiopia’s exports into China.
global
brazil
CoSta riCa
SUb-SaHaran afriCa
etHiopia
Switzerland
Kuehne + Nagel said due to some uncertainty regarding a lasting global economic recovery, it would stick to its strategy of market share expansion combined with strict cost management. “Our aim for 2010 is profitable growth above market average in all business units,” said Group CEO Reinhard Lange. Group turnover dropped by 19.2 percent in 2009, with profits down 6.2 percent, but the company said it gained market share in all business fields.
•
•
Airbus bested rival Boeing in number of planes produced (498 to 481) and orders taken in 2009 (271 to 142), but brought in less cash for planes delivered. Despite losing in production numbers, Boeing brought in an estimated US$32.8bn to Airbus’ $28.4bn (as adjusted for discounts). This was in large part due to Boeing’s sale of more expensive planes, having sold 88 of its expensive 777s and eight of its 747-400s to only 20 Airbus A340s and ten A380s.
Toll Group acquired US-based Summit Logistics International for US$80m. The buy will increase the capabilities of Toll’s global forwarding network, as well as provide improved ocean freight services along the trans-pacific route between China and North America, where Summit is a top five provider.
infrastructure update 7developments
March/April 2010 Supply Chain Asia
Korea
Japan
Singapore
•
•
•
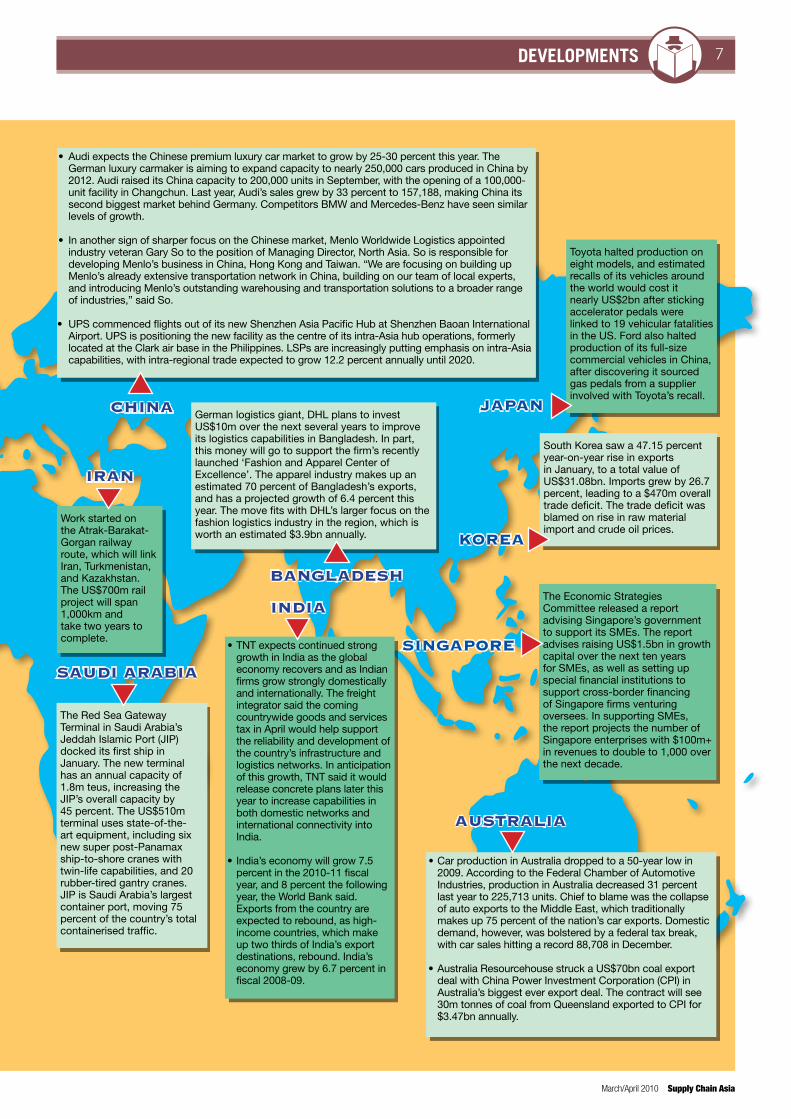
Audi expects the Chinese premium luxury car market to grow by 25-30 percent this year. The German luxury carmaker is aiming to expand capacity to nearly 250,000 cars produced in China by 2012. Audi raised its China capacity to 200,000 units in September, with the opening of a 100,000-unit facility in Changchun. Last year, Audi’s sales grew by 33 percent to 157,188, making China its second biggest market behind Germany. Competitors BMW and Mercedes-Benz have seen similar levels of growth.
In another sign of sharper focus on the Chinese market, Menlo Worldwide Logistics appointed industry veteran Gary So to the position of Managing Director, North Asia. So is responsible for developing Menlo’s business in China, Hong Kong and Taiwan. “We are focusing on building up Menlo’s already extensive transportation network in China, building on our team of local experts, and introducing Menlo’s outstanding warehousing and transportation solutions to a broader range of industries,” said So. UPS commenced flights out of its new Shenzhen Asia Pacific Hub at Shenzhen Baoan International Airport. UPS is positioning the new facility as the centre of its intra-Asia hub operations, formerly located at the Clark air base in the Philippines. LSPs are increasingly putting emphasis on intra-Asia capabilities, with intra-regional trade expected to grow 12.2 percent annually until 2020.
CHina
South Korea saw a 47.15 percent year-on-year rise in exports in January, to a total value of US$31.08bn. Imports grew by 26.7 percent, leading to a $470m overall trade deficit. The trade deficit was blamed on rise in raw material import and crude oil prices.
Toyota halted production on eight models, and estimated recalls of its vehicles around the world would cost it nearly US$2bn after sticking accelerator pedals were linked to 19 vehicular fatalities in the US. Ford also halted production of its full-size commercial vehicles in China, after discovering it sourced gas pedals from a supplier involved with Toyota’s recall.
The Red Sea Gateway Terminal in Saudi Arabia’s Jeddah Islamic Port (JIP) docked its first ship in January. The new terminal has an annual capacity of 1.8m teus, increasing the JIP’s overall capacity by 45 percent. The US$510m terminal uses state-of-the-art equipment, including six new super post-Panamax ship-to-shore cranes with twin-life capabilities, and 20 rubber-tired gantry cranes. JIP is Saudi Arabia’s largest container port, moving 75 percent of the country’s total containerised traffic.
Work started on the Atrak-Barakat-Gorgan railway route, which will link Iran, Turkmenistan, and Kazakhstan. The US$700m rail project will span 1,000km and take two years to complete.
The Economic Strategies Committee released a report advising Singapore’s government to support its SMEs. The report advises raising US$1.5bn in growth capital over the next ten years for SMEs, as well as setting up special financial institutions to support cross-border financing of Singapore firms venturing oversees. In supporting SMEs, the report projects the number of Singapore enterprises with $100m+ in revenues to double to 1,000 over the next decade.
German logistics giant, DHL plans to invest US$10m over the next several years to improve its logistics capabilities in Bangladesh. In part, this money will go to support the firm’s recently launched ‘Fashion and Apparel Center of Excellence’. The apparel industry makes up an estimated 70 percent of Bangladesh’s exports, and has a projected growth of 6.4 percent this year. The move fits with DHL’s larger focus on the fashion logistics industry in the region, which is worth an estimated $3.9bn annually.
bangladeSH
aUStralia
india
SaUdi arabia
iran
•
•
TNT expects continued strong growth in India as the global economy recovers and as Indian firms grow strongly domestically and internationally. The freight integrator said the coming countrywide goods and services tax in April would help support the reliability and development of the country’s infrastructure and logistics networks. In anticipation of this growth, TNT said it would release concrete plans later this year to increase capabilities in both domestic networks and international connectivity into India.
India’s economy will grow 7.5 percent in the 2010-11 fiscal year, and 8 percent the following year, the World Bank said. Exports from the country are expected to rebound, as high-income countries, which make up two thirds of India’s export destinations, rebound. India’s economy grew by 6.7 percent in fiscal 2008-09.
•
•
Car production in Australia dropped to a 50-year low in 2009. According to the Federal Chamber of Automotive Industries, production in Australia decreased 31 percent last year to 225,713 units. Chief to blame was the collapse of auto exports to the Middle East, which traditionally makes up 75 percent of the nation’s car exports. Domestic demand, however, was bolstered by a federal tax break, with car sales hitting a record 88,708 in December.
Australia Resourcehouse struck a US$70bn coal export deal with China Power Investment Corporation (CPI) in Australia’s biggest ever export deal. The contract will see 30m tonnes of coal from Queensland exported to CPI for $3.47bn annually.
infrastructure update8 developments
Supply Chain Asia March/April 2010
World Economic Forum releases supply chain emissions reporting guidelines
At its annual meeting in Davos, the World Economic Forum (WEF) released consignment-level carbon reporting guidelines for the logistics and transport industry. According to the WEF, the guidelines are intended to, “promote consistency across the logistics and transport industry in reporting carbon emissions at the consignment or customer level.” The guidelines, which consist of principles for defining the scope of emissions to report and advise on how emissions should be calculated in cases such as shared transport and backhaul, were developed by the WEF’s Logistics & Transport Industry team in partnership with six of the largest global logistics companies — Agility, Deutsche Post DHL, DP World, FedEx Corporation, TNT and UPS — and the management consulting group Accenture.
The guidelines recommend emissions allocation units for five different modes of transport (road transport is divided into long haul and local delivery) as well as for packaging, sorting and warehousing. They also recommend how to calculate emissions related to differing distribution scenarios, such as regular long haul routes or highly variable local delivery routes.
“[They are] a practical step forward for our industry in working with customers to move towards low carbon supply chains,” said Dr Frank Appel, CEO of Deutsche Post DHL.
Organisations are invited to self-certify or audit compliance with the guidelines, which were devised based on a previous WEF report titled Supply Chain Decarbonization that estimated the logistics and transport sector to be responsible for 5.5 percent of global CO2 emissions, or some 2,800 mega-tonnes per year. That report — also compiled with Accenture — said it was ‘commercially viable’ for the industry to abate some 1,400 mega-tonnes in the medium term.
Over the past years, logistics and transport service providers have been coming out with programmes aimed at reducing their carbon footprints. This is in large part
a result of pressure from brand-owners and manufacturers who are themselves responding to pressure from consumers.
“Many of the large multinationals … are asking for details of green initiatives in their RFQ’s and also insisting that suppliers work towards carbon labelling by 2012. This will require their logistics suppliers to accurately measure the CO2 emitted in getting their products to the market. Suppliers who fail to do this will risk being de-selected and those that make the most progress in reducing the carbon footprint will have an advantage,” Richard Owens, CEO of Global Customers Solutions with DHL Asia Pacific told Supply Chain Asia Magazine.
“They are also nervous about the financial implications of future taxation on CO2 emissions. Many of our customers
By Turloch Mooney
Luxury goods to drive supply chain efficiency in ChinaBy Turloch Mooney
Luxury goods are among the most visible indicators of societies with rapidly growing levels of disposable income. China is no exception and a stroll through the high streets of even second or third tier Chinese cities proves this very quickly. Big name foreign luxury brands like Gucci and Burberry now have literally dozens of outlets across the country, from Beijing and Shanghai to Wuxi, Kunming and Chengdu.
The luxury goods market in China barely noticed the global financial crisis and recession. Figures from the World Luxury Association (WLA) show Chinese consumers spent US$9.4bn on luxury goods in 2009, nudging out Japan to make it the world’s second largest luxury goods market after the US.
are in the retail business and they are also concerned about the market view of environmental issues and how they are perceived to be taking a responsible role,” he added.
Some individual logistics and transport concerns have come out with impressive strategies and targets for emissions reduction. But progress in the area of allowing fair cross-company comparisons on reduction efforts, which would assist shippers to more accurately calculate emissions on a consignment or product basis, has been slow. “By providing accuracy and consistency in carbon reporting, the WEF guidelines help companies to compete meaningfully on environmental efficiency,” said Sean Doherty, Head of the Logistics & Transport Industry Group at the WEF.
And that’s just counting what was spent within the national borders. China mainlanders spend significantly more on luxury when they travel to places like Hong Kong and Europe. Travelling Chinese spend $11.6bn on luxury goods in 2008, compared with $8.6bn at home in the same year.
As disposable income continues to rise, the growth potential for the market is clearly enormous. McKinsey has estimated the number of ‘wealthy households’ — with annual income over RMB250,000 ($36,000) — is growing at 16 percent per annum and will reach four million by 2015.
Unlike many other goods markets in China, the overwhelming demand in luxury is for foreign brands. According to
...continued on page 10

infrastructure update10 developments
Supply Chain Asia March/April 2010
Japanese auto manufacturers are finally seeing some light at the end of a drawn-out recession as a result of a government stimulus package for the sector consisting of tax breaks and replacement and purchase subsidies for eco-friendly cars.
The measures, first introduced in April of 2009 after domestic output slid by 41 percent, 56.2 percent and 50 percent in January, February and March over the same months in 2008, started to have the planned effect at the end of last year when production finally started to expand.
The waiver on purchase and sales tax breaks for eco-friendly vehicles range from
Eco-measures shake up Japanese auto sector
100 percent to 50 percent, depending on the amount of harmful emissions and level of fuel consumption of the automobile. The subsidies range from 50,000 yen (US$555) to 180,000 yen, depending on the size of cars and other conditions. While the tax reduction applies to all cars, the subsidies apply only to those that are newly purchased.
In late January, following criticism of the policy from the US, the Japanese government announced the subsidies would apply to cars made by US manufacturers sold in Japan as well.
The measures to boost consumption are
the traditional competitive advantage of mini-oriented makers like Suzuki and Daihatsu.
Japanese carmakers are competing intensely to develop eco-friendly hybrid vehicles (HV) and electric vehicles (EV). Toyota recently inaugurated a HV line for its high-end Lexus brand. The company has plans to introduce eight new kinds of HVs over the coming few years. In February, Honda started selling its CR-Z, a sports-type HV, and will soon launch the HV line of its mainstay brand, Fit. Nissan is working on a five-seat small EV version of its Leaf brand and will put HV versions of its Fuga brand on sale next autumn.
Globally, Japanese manufacturers are increasing focus on China and India. Nissan expanded production capacity at its main factory in Guangzhou in October by running operations around the clock and increasing work shifts from two to three per day. It plans to add a new factory in China in 2012, which will enlarge its annual production capacity in the market to 900,000 cars from 742,000 cars last year. Honda has plans to build a second factory in Wuhan in central China, a major automotive production hub in the country, due to open in 2011.
Matsuda is reviewing a partnership in China with Ford and planning to integrate its two factories in Chongqing and Nanjing into one facility located in Nanjing. The overall aim of the move is to expand production in the market.
In India, Toyota developed the Etios, an economical car developed solely for the market that sells for between $8,900 and $10,000. Honda plans to follow suit by selling the low-priced New Small in 2011.
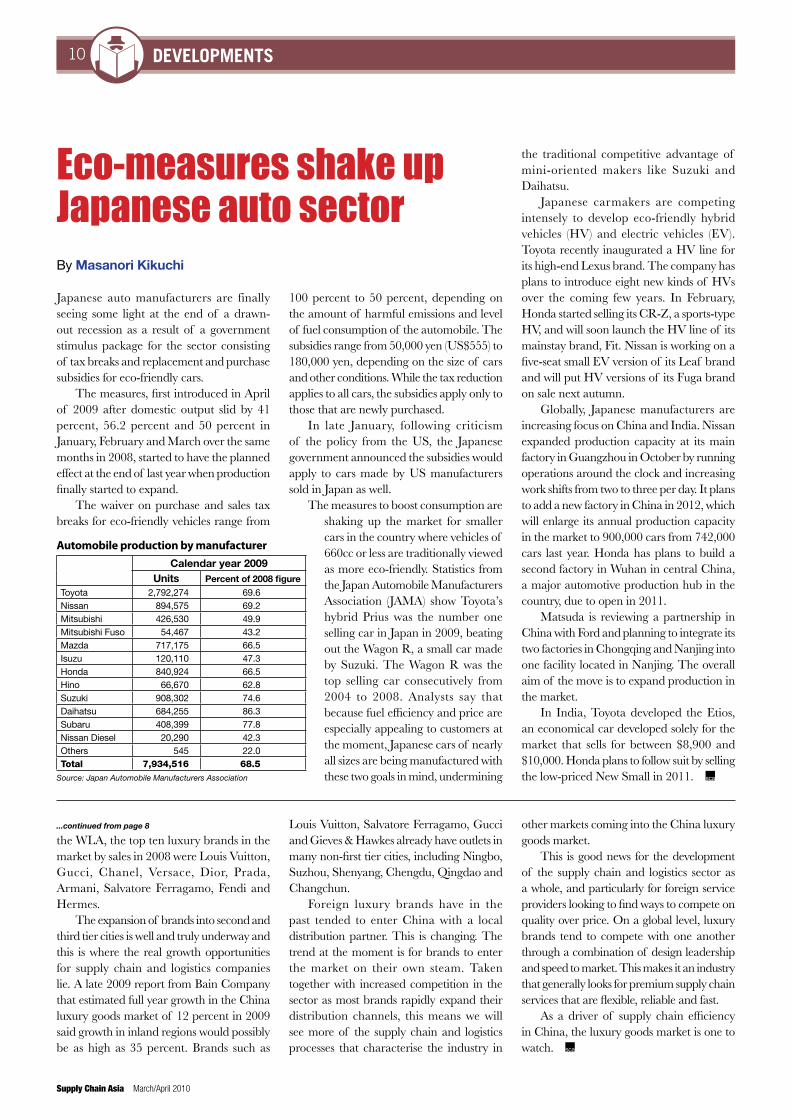
Calendar year 2009Units Percent of 2008 figure
Toyota 2,792,274 69.6Nissan 894,575 69.2Mitsubishi 426,530 49.9Mitsubishi Fuso 54,467 43.2Mazda 717,175 66.5Isuzu 120,110 47.3Honda 840,924 66.5Hino 66,670 62.8Suzuki 908,302 74.6Daihatsu 684,255 86.3Subaru 408,399 77.8Nissan Diesel 20,290 42.3Others 545 22.0Total 7,934,516 68.5
Source: Japan Automobile Manufacturers Association
the WLA, the top ten luxury brands in the market by sales in 2008 were Louis Vuitton, Gucci, Chanel, Versace, Dior, Prada, Armani, Salvatore Ferragamo, Fendi and Hermes.
The expansion of brands into second and third tier cities is well and truly underway and this is where the real growth opportunities for supply chain and logistics companies lie. A late 2009 report from Bain Company that estimated full year growth in the China luxury goods market of 12 percent in 2009 said growth in inland regions would possibly be as high as 35 percent. Brands such as
Louis Vuitton, Salvatore Ferragamo, Gucci and Gieves & Hawkes already have outlets in many non-first tier cities, including Ningbo, Suzhou, Shenyang, Chengdu, Qingdao and Changchun.
Foreign luxury brands have in the past tended to enter China with a local distribution partner. This is changing. The trend at the moment is for brands to enter the market on their own steam. Taken together with increased competition in the sector as most brands rapidly expand their distribution channels, this means we will see more of the supply chain and logistics processes that characterise the industry in
other markets coming into the China luxury goods market.
This is good news for the development of the supply chain and logistics sector as a whole, and particularly for foreign service providers looking to find ways to compete on quality over price. On a global level, luxury brands tend to compete with one another through a combination of design leadership and speed to market. This makes it an industry that generally looks for premium supply chain services that are flexible, reliable and fast.
As a driver of supply chain efficiency in China, the luxury goods market is one to watch.
By Masanori Kikuchi
Automobile production by manufacturer
shaking up the market for smaller cars in the country where vehicles of 660cc or less are traditionally viewed as more eco-friendly. Statistics from the Japan Automobile Manufacturers Association (JAMA) show Toyota’s hybrid Prius was the number one selling car in Japan in 2009, beating out the Wagon R, a small car made by Suzuki. The Wagon R was the top selling car consecutively from 2004 to 2008. Analysts say that because fuel efficiency and price are especially appealing to customers at the moment, Japanese cars of nearly all sizes are being manufactured with these two goals in mind, undermining
...continued from page 8
infrastructure update 11air cargo
March/April 2010 Supply Chain Asia
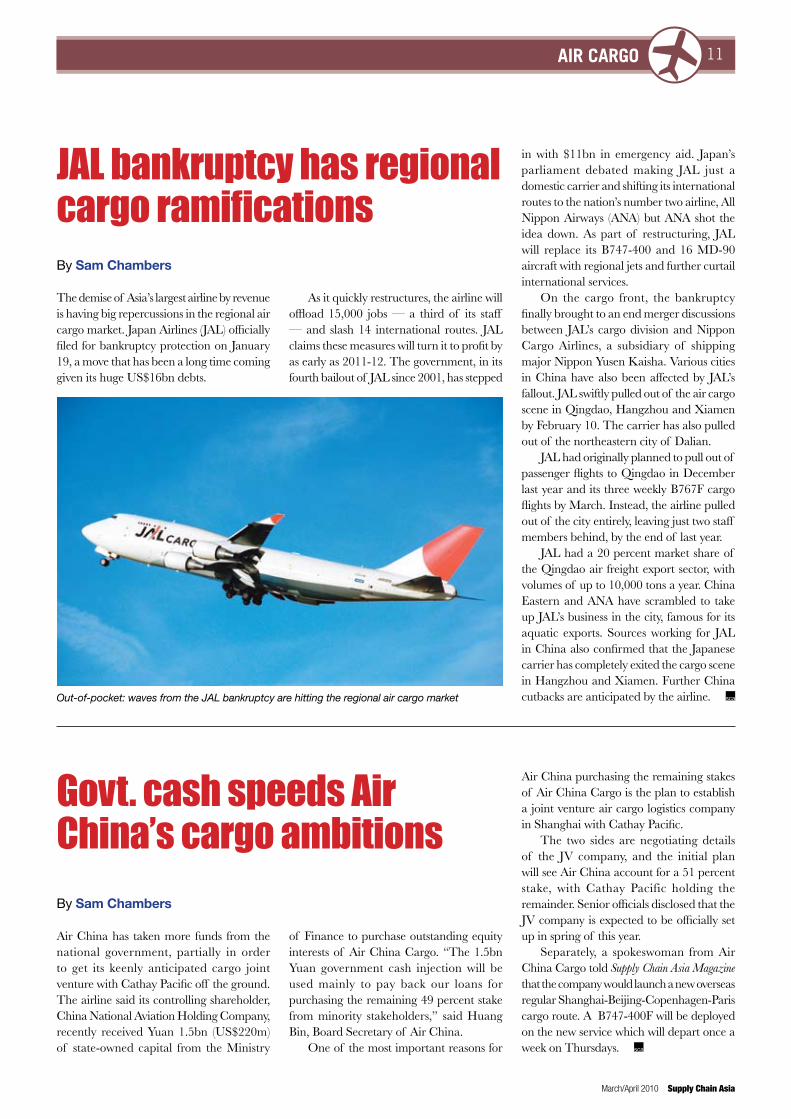
JAL bankruptcy has regional cargo ramifications
The demise of Asia’s largest airline by revenue is having big repercussions in the regional air cargo market. Japan Airlines (JAL) officially filed for bankruptcy protection on January 19, a move that has been a long time coming given its huge US$16bn debts.
As it quickly restructures, the airline will offload 15,000 jobs — a third of its staff — and slash 14 international routes. JAL claims these measures will turn it to profit by as early as 2011-12. The government, in its fourth bailout of JAL since 2001, has stepped
in with $11bn in emergency aid. Japan’s parliament debated making JAL just a domestic carrier and shifting its international routes to the nation’s number two airline, All Nippon Airways (ANA) but ANA shot the idea down. As part of restructuring, JAL will replace its B747-400 and 16 MD-90 aircraft with regional jets and further curtail international services.
On the cargo front, the bankruptcy finally brought to an end merger discussions between JAL’s cargo division and Nippon Cargo Airlines, a subsidiary of shipping major Nippon Yusen Kaisha. Various cities in China have also been affected by JAL’s fallout. JAL swiftly pulled out of the air cargo scene in Qingdao, Hangzhou and Xiamen by February 10. The carrier has also pulled out of the northeastern city of Dalian.
JAL had originally planned to pull out of passenger flights to Qingdao in December last year and its three weekly B767F cargo flights by March. Instead, the airline pulled out of the city entirely, leaving just two staff members behind, by the end of last year.
JAL had a 20 percent market share of the Qingdao air freight export sector, with volumes of up to 10,000 tons a year. China Eastern and ANA have scrambled to take up JAL’s business in the city, famous for its aquatic exports. Sources working for JAL in China also confirmed that the Japanese carrier has completely exited the cargo scene in Hangzhou and Xiamen. Further China cutbacks are anticipated by the airline.
By Sam Chambers
Out-of-pocket: waves from the JAL bankruptcy are hitting the regional air cargo market
Govt. cash speeds Air China’s cargo ambitions
Air China has taken more funds from the national government, partially in order to get its keenly anticipated cargo joint venture with Cathay Pacific off the ground. The airline said its controlling shareholder, China National Aviation Holding Company, recently received Yuan 1.5bn (US$220m) of state-owned capital from the Ministry
of Finance to purchase outstanding equity interests of Air China Cargo. “The 1.5bn Yuan government cash injection will be used mainly to pay back our loans for purchasing the remaining 49 percent stake from minority stakeholders,” said Huang Bin, Board Secretary of Air China.
One of the most important reasons for
Air China purchasing the remaining stakes of Air China Cargo is the plan to establish a joint venture air cargo logistics company in Shanghai with Cathay Pacific.
The two sides are negotiating details of the JV company, and the initial plan will see Air China account for a 51 percent stake, with Cathay Pacific holding the remainder. Senior officials disclosed that the JV company is expected to be officially set up in spring of this year.
Separately, a spokeswoman from Air China Cargo told Supply Chain Asia Magazine that the company would launch a new overseas regular Shanghai-Beijing-Copenhagen-Paris cargo route. A B747-400F will be deployed on the new service which will depart once a week on Thursdays.
By Sam Chambers
Supply Chain Asia March/April 2010
infrastructure update12 air cargo
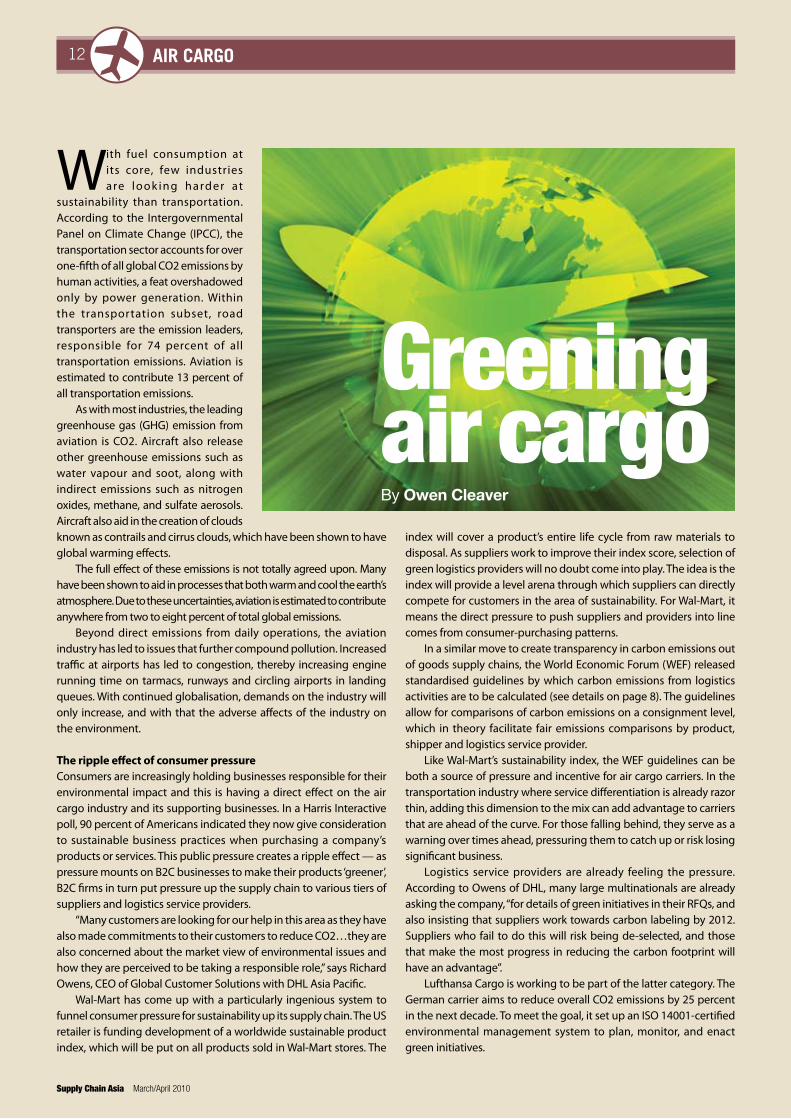
With fuel consumption at its core, few industries are look ing harder at
sustainability than transportation. According to the Intergovernmental Panel on Climate Change (IPCC), the transportation sector accounts for over one-fifth of all global CO2 emissions by human activities, a feat overshadowed only by power generation. Within the transportation subset, road transporters are the emission leaders, responsible for 74 percent of all transportation emissions. Aviation is estimated to contribute 13 percent of all transportation emissions.
As with most industries, the leading greenhouse gas (GHG) emission from aviation is CO2. Aircraft also release other greenhouse emissions such as water vapour and soot, along with indirect emissions such as nitrogen oxides, methane, and sulfate aerosols. Aircraft also aid in the creation of clouds known as contrails and cirrus clouds, which have been shown to have global warming effects.
The full effect of these emissions is not totally agreed upon. Many have been shown to aid in processes that both warm and cool the earth’s atmosphere. Due to these uncertainties, aviation is estimated to contribute anywhere from two to eight percent of total global emissions.
Beyond direct emissions from daily operations, the aviation industry has led to issues that further compound pollution. Increased traffic at airports has led to congestion, thereby increasing engine running time on tarmacs, runways and circling airports in landing queues. With continued globalisation, demands on the industry will only increase, and with that the adverse affects of the industry on the environment.
The ripple effect of consumer pressureConsumers are increasingly holding businesses responsible for their environmental impact and this is having a direct effect on the air cargo industry and its supporting businesses. In a Harris Interactive poll, 90 percent of Americans indicated they now give consideration to sustainable business practices when purchasing a company’s products or services. This public pressure creates a ripple effect — as pressure mounts on B2C businesses to make their products ‘greener’, B2C firms in turn put pressure up the supply chain to various tiers of suppliers and logistics service providers.
“Many customers are looking for our help in this area as they have also made commitments to their customers to reduce CO2…they are also concerned about the market view of environmental issues and how they are perceived to be taking a responsible role,” says Richard Owens, CEO of Global Customer Solutions with DHL Asia Pacific.
Wal-Mart has come up with a particularly ingenious system to funnel consumer pressure for sustainability up its supply chain. The US retailer is funding development of a worldwide sustainable product index, which will be put on all products sold in Wal-Mart stores. The
index will cover a product’s entire life cycle from raw materials to disposal. As suppliers work to improve their index score, selection of green logistics providers will no doubt come into play. The idea is the index will provide a level arena through which suppliers can directly compete for customers in the area of sustainability. For Wal-Mart, it means the direct pressure to push suppliers and providers into line comes from consumer-purchasing patterns.
In a similar move to create transparency in carbon emissions out of goods supply chains, the World Economic Forum (WEF) released standardised guidelines by which carbon emissions from logistics activities are to be calculated (see details on page 8). The guidelines allow for comparisons of carbon emissions on a consignment level, which in theory facilitate fair emissions comparisons by product, shipper and logistics service provider.
Like Wal-Mart’s sustainability index, the WEF guidelines can be both a source of pressure and incentive for air cargo carriers. In the transportation industry where service differentiation is already razor thin, adding this dimension to the mix can add advantage to carriers that are ahead of the curve. For those falling behind, they serve as a warning over times ahead, pressuring them to catch up or risk losing significant business.
Logistics service providers are already feeling the pressure. According to Owens of DHL, many large multinationals are already asking the company, “for details of green initiatives in their RFQs, and also insisting that suppliers work towards carbon labeling by 2012. Suppliers who fail to do this will risk being de-selected, and those that make the most progress in reducing the carbon footprint will have an advantage”.
Lufthansa Cargo is working to be part of the latter category. The German carrier aims to reduce overall CO2 emissions by 25 percent in the next decade. To meet the goal, it set up an ISO 14001-certified environmental management system to plan, monitor, and enact green initiatives.
Greeningair cargoBy Owen Cleaver

March/April 2010 Supply Chain Asia
Beyond the box We go beyond the box in every sense. Like a
helicopter lifting into the blue, our service rises above
the rest. Going beyond reliability and efficiency, we
develop a genuine understanding of our clients’
needs and then meet them with professionalism,
flexibility and care. With over 30 years of experience,
we are able to provide customised solutions for any
requirement. Our service goes above the rest,
you go beyond the best.
Hong Kong Air Cargo Terminals Limited
www.hactl.com
Supply Chain Asia March/April 2010
infrastructure update14 air cargo
TNT is also doing well in the area of air cargo sustainability. Aside from usual activities to lower operational emissions, the company has enacted a global initiative called ‘Planet Me’, designed to encourage proactive, climate-friendly activities. In 2007, the company tested its first zero-emissions programme using electric delivery vans in Wuhan, China.
An internal economic imperative One natural benefit working in favour of more sustainable business practices in the air cargo industry is the direct relationship between carbon emissions and fuel burned. According to a 2009 IPCC report, for every gallon of jet fuel burned, 21 pounds of CO2 is emitted into the atmosphere. Factor in that in 2008, when the price of fuel peaked it accounted for nearly 30 percent of the total operating expenses of US airlines and there exists an undeniable link between lowering emissions and lowering costs. As oil becomes increasingly scarce, prices will only become more volatile, thereby compounding the need for air carriers to lower dependence on fossil fuels.
“With the history of fuel as one of its largest costs, air cargo has a natural economic imperative along with its environmental commitment to improve fuel efficiency,” says David Cunningham Jr., FedEx Express President of Asia Pacific.
Reducing carrier emissions The International Air Transport Association (IATA), which represents some 230 airlines worldwide, and whose members are responsible for 93 percent of the world’s international traffic, recently pledged to cut CO2 emissions from the aviation industry by half its 2005 levels by 2050. IATA’s ‘four-pillar strategy’ to reduce emissions is endorsed by 179 country states, and top aerospace companies including GE, Boeing, Pratt & Whitney, and other affiliate organisations. The central concepts are investment in technology, effective operations, efficient infrastructure, and positive economic measures.
Most sustainability investments in technology revolve around limiting fossil fuel consumption. Investments can be broken down into two categories:
Biofuels: Fossil fuel alternatives that can be mixed in with traditional jet fuel and used in existing engines (called ‘drop in’ fuels). The IATA target is that by 2017, ten percent of all fuel used will be biofuels, many of which are currently undergoing live trials.
New fuel-efficient aircraft: Industry experts believe emissions levels are falling by two percent per year due to fleet replacement. According to IATA, new aircraft such as the Airbus 380 and Boeing 787 are 25 percent more efficient than the average fuel efficiency of operating aircraft today.
Air cargo carriers are already consciously switching to more fuel-efficient aircraft. Fedex has been upgrading its aircraft fleet by replacing narrow-body 727 aircraft with 757 aircraft that lessen environmental impact by reducing fuel consumption by up to 36 percent while at the same time providing 20 percent more payload capacity. FedEx launched a new 777F service between Asia and the US in January. “The 777F is the world’s largest twin-engine cargo aircraft which uses 18 percent less fuel than the MD-11 while its state-of-the-art engine technology reduces emissions 18 percent,” says Cunningham.
Legislation and global treatiesEmissions by much of the transportation industry are not governed under the Kyoto Protocol. The international nature of the shipping and air cargo industries creates an inherent problem with allocating emissions by country, as shipments are transported across multiple countries and international zones. Instead, responsibility for transportation emissions reduction has been assigned to two international organisations — the International Civil Aviation Organization (ICAO), and the International Maritime Organization (IMO).
Regional governments have also begun to take initiative to limit emissions within the industry. Most notably, the EU has plans to include the aviation industry in Phase II of its Emissions Trading Scheme (ETS).
Like other industries already governed under ETS, air cargo carriers and airlines operating in Europe will be assigned an emissions quota and a number of free emissions credits (1 credit = 1 tonne). At the end of the year, carriers exceeding their emissions quota/credits will be forced to purchase additional unused credits on the open market to account for overages.
In order to receive initial free credit allotments, carriers will need to install certified monitoring systems and submit verified emissions data by the January 1, 2012 start date. Current plans call for assigning initial credits at 97 percent of historic emissions (as referenced to the 2004-2006 period) in 2012, and 95 percent in 2013. Under these guidelines, ETS should achieve a five percent reduction in emissions by the end of 2013.
There is resistance to the plan. The Air Transport Association (ATA) and a number of carriers have filed a challenge to ETS in UK courts. They claim that as ETS applies to all airlines flying into and out of EU airspace, it is in effect capping not only emissions over the EU, but all over the world. Their lawyers claim this would be a clear violation of sovereignty of airspace guaranteed to all nations under the Chicago Convention. The outcome of this case is uncertain, but as it is unlikely to be settled before the 2012 start date, airlines will have to submit to ETS at least initially.
But investment in new aircraft is costly, particularly in trying economic times. “Many carriers have orders in place for new aircraft which will be much more fuel efficient, but have had to delay delivery in many cases,” says DHL’s Owens.
Air cargo players are also working to improve the environmental impact of their ground operations. In the US, FedEx uses a fleet of 327 hybrid and electric vehicles, a fleet that recently reached five million miles of revenue service. Other ideas include reduced engine use during taxiing; buying fuel in one place for multiple trips, and reduced packaging by shippers.
Increasing the efficiency of infrastructure at airports and air traffic control is another way to cut down on emissions. According to IATA, addressing infrastructure inefficiencies could reduce emissions from
March/April 2010 Supply Chain Asia
infrastructure update 15air cargo
the aviation sector by as much as 12 percent. Air traffic management systems can be improved dramatically.
Current ground-based radar systems are inefficient, leading to delays, aircraft queues before landing, and other forms of congestion. The proposed European One Sky programme and the NextGen system in the US address this issue by upgrading current ground-based radar systems with an integrated state-of-the-art satellite system. A satellite system would allow for more precise management of airspace, thereby: Allowing carriers to fly more closely together on more direct
routes Reducing the number of carriers circling airports waiting to land Allowing for continuous descent approaches, which saves on
fuel
The futureWith the advance of globalisation and international trade, air cargo volumes will continue to grow, making for a tough battle to keep emissions and fuel consumption steady, let alone achieve reductions. Despite the challenge, the industry is showing plenty of optimism. By
2020, DHL and FedEx both aim to reduce CO2 emissions by 30 and 20 percent respectively. FedEx plans to increase fuel efficiency of its ground transportation fleet by 20 percent over the same period.
Progress to date has been impressive. Since 2004, IATA members have improved fuel efficiency by 16 percent, thereby cutting 71.4m tonnes of CO2 emissions from annual operations. In 2009, global emissions from aviation dropped by 41m tons, 32 percent of which was due to industry efforts, with the remaining attributed to capacity cuts. This is no mean achievement when you consider the enormous capital expense of carrier equipment and the decades-long typical aircraft useful life.
Going forward, the challenge will be to accelerate this progress in concert with a range of other economic and social considerations. Solutions, as David Cunningham puts it, need to match business objectives with environmental ones: “The decision to implement new [sustainability] measures is made after considering a number of elements including environmental criteria, service improvement, safety, employee impact, regulatory compliance and financial analysis.”
Owen Cleaver is a researcher and writer for Supply Chain Asia Magazine
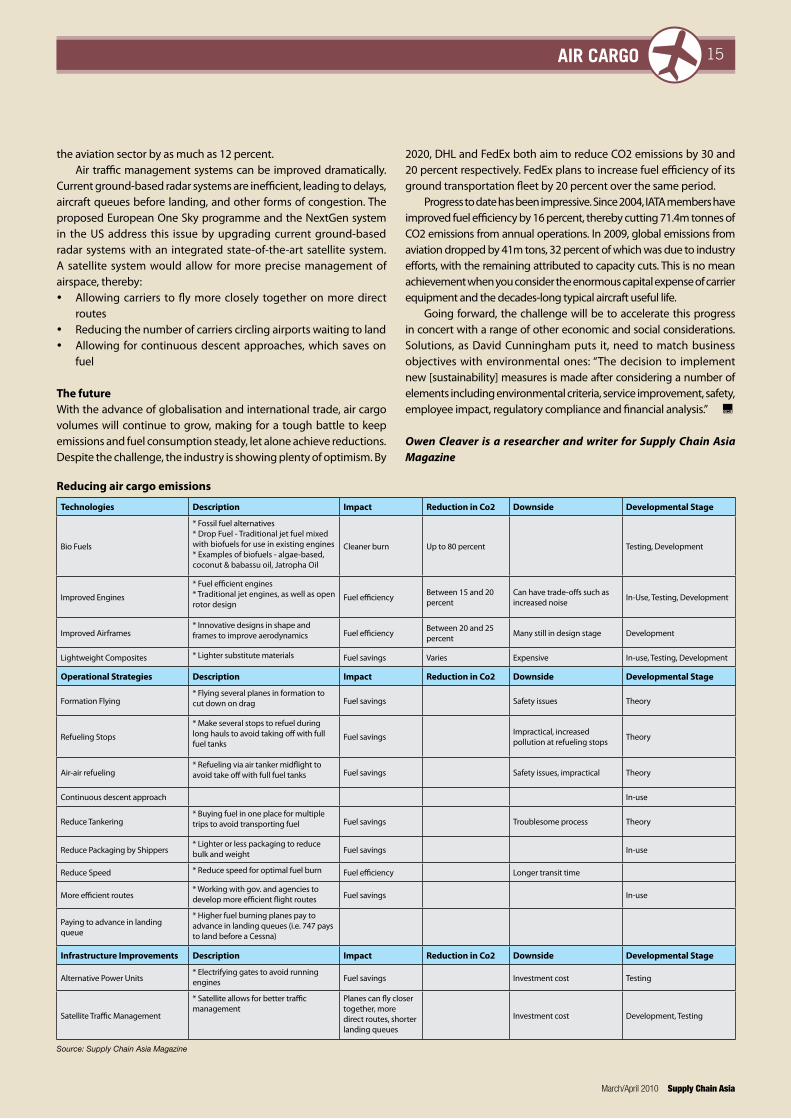
Technologies Description Impact Reduction in Co2 Downside Developmental Stage
Bio Fuels
* Fossil fuel alternatives* Drop Fuel - Traditional jet fuel mixed with biofuels for use in existing engines* Examples of biofuels - algae-based, coconut & babassu oil, Jatropha Oil
Cleaner burn Up to 80 percent Testing, Development
Improved Engines
* Fuel efficient engines* Traditional jet engines, as well as open rotor design
Fuel efficiency Between 15 and 20 percent
Can have trade-offs such as increased noise In-Use, Testing, Development
Improved Airframes* Innovative designs in shape and frames to improve aerodynamics Fuel efficiency Between 20 and 25
percent Many still in design stage Development
Lightweight Composites * Lighter substitute materials Fuel savings Varies Expensive In-use, Testing, Development
Operational Strategies Description Impact Reduction in Co2 Downside Developmental Stage
Formation Flying* Flying several planes in formation to cut down on drag Fuel savings Safety issues Theory
Refueling Stops
* Make several stops to refuel during long hauls to avoid taking off with full fuel tanks
Fuel savings Impractical, increased pollution at refueling stops Theory
Air-air refueling* Refueling via air tanker midflight to avoid take off with full fuel tanks Fuel savings Safety issues, impractical Theory
Continuous descent approach In-use
Reduce Tankering* Buying fuel in one place for multiple trips to avoid transporting fuel Fuel savings Troublesome process Theory
Reduce Packaging by Shippers* Lighter or less packaging to reduce bulk and weight Fuel savings In-use
Reduce Speed * Reduce speed for optimal fuel burn Fuel efficiency Longer transit time
More efficient routes* Working with gov. and agencies to develop more efficient flight routes Fuel savings In-use
Paying to advance in landing queue
* Higher fuel burning planes pay to advance in landing queues (i.e. 747 pays to land before a Cessna)
Infrastructure Improvements Description Impact Reduction in Co2 Downside Developmental Stage
Alternative Power Units* Electrifying gates to avoid running engines Fuel savings Investment cost Testing
Satellite Traffic Management
* Satellite allows for better traffic management
Planes can fly closer together, more direct routes, shorter landing queues
Investment cost Development, Testing
Source: Supply Chain Asia Magazine
Reducing air cargo emissions
16 maritime
Supply Chain Asia March/April 2010
Rocketing rates mask boxship glut
Shippers protest rate hikes
The decision by carriers to cut capacity and promote slow steaming is paying dividends on the Asia-Europe tradelane where rates have been surging for the past four months, leaving brand-owners and forwarders irate.
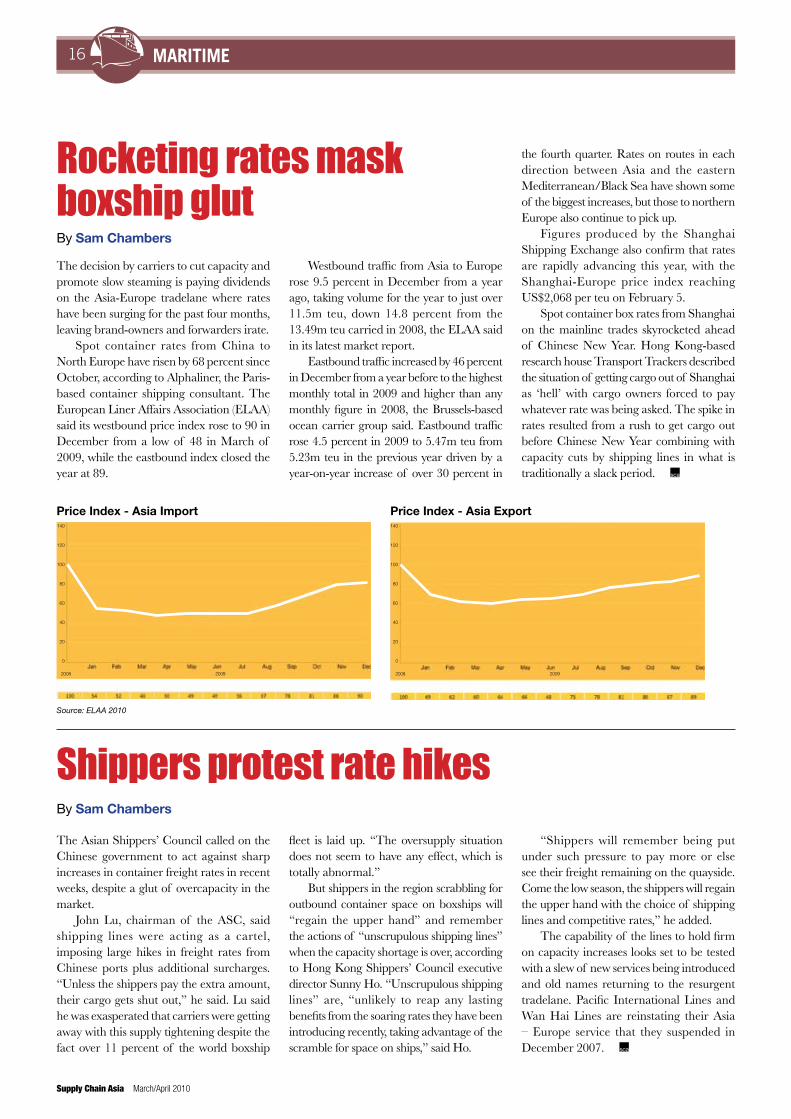
Spot container rates from China to North Europe have risen by 68 percent since October, according to Alphaliner, the Paris-based container shipping consultant. The European Liner Affairs Association (ELAA) said its westbound price index rose to 90 in December from a low of 48 in March of 2009, while the eastbound index closed the year at 89.
The Asian Shippers’ Council called on the Chinese government to act against sharp increases in container freight rates in recent weeks, despite a glut of overcapacity in the market.
John Lu, chairman of the ASC, said shipping lines were acting as a cartel, imposing large hikes in freight rates from Chinese ports plus additional surcharges. “Unless the shippers pay the extra amount, their cargo gets shut out,” he said. Lu said he was exasperated that carriers were getting away with this supply tightening despite the fact over 11 percent of the world boxship
Westbound traffic from Asia to Europe rose 9.5 percent in December from a year ago, taking volume for the year to just over 11.5m teu, down 14.8 percent from the 13.49m teu carried in 2008, the ELAA said in its latest market report.
Eastbound traffic increased by 46 percent in December from a year before to the highest monthly total in 2009 and higher than any monthly figure in 2008, the Brussels-based ocean carrier group said. Eastbound traffic rose 4.5 percent in 2009 to 5.47m teu from 5.23m teu in the previous year driven by a year-on-year increase of over 30 percent in
fleet is laid up. “The oversupply situation does not seem to have any effect, which is totally abnormal.”
But shippers in the region scrabbling for outbound container space on boxships will “regain the upper hand” and remember the actions of “unscrupulous shipping lines” when the capacity shortage is over, according to Hong Kong Shippers’ Council executive director Sunny Ho. “Unscrupulous shipping lines” are, “unlikely to reap any lasting benefits from the soaring rates they have been introducing recently, taking advantage of the scramble for space on ships,” said Ho.
the fourth quarter. Rates on routes in each direction between Asia and the eastern Mediterranean/Black Sea have shown some of the biggest increases, but those to northern Europe also continue to pick up.
Figures produced by the Shanghai Shipping Exchange also confirm that rates are rapidly advancing this year, with the Shanghai-Europe price index reaching US$2,068 per teu on February 5.
Spot container box rates from Shanghai on the mainline trades skyrocketed ahead of Chinese New Year. Hong Kong-based research house Transport Trackers described the situation of getting cargo out of Shanghai as ‘hell’ with cargo owners forced to pay whatever rate was being asked. The spike in rates resulted from a rush to get cargo out before Chinese New Year combining with capacity cuts by shipping lines in what is traditionally a slack period.
“Shippers will remember being put under such pressure to pay more or else see their freight remaining on the quayside. Come the low season, the shippers will regain the upper hand with the choice of shipping lines and competitive rates,” he added.
The capability of the lines to hold firm on capacity increases looks set to be tested with a slew of new services being introduced and old names returning to the resurgent tradelane. Pacific International Lines and Wan Hai Lines are reinstating their Asia – Europe service that they suspended in December 2007.
By Sam Chambers
By Sam Chambers
Price Index - Asia Import Price Index - Asia Export
Source: ELAA 2010
140
120
100
80
60
40
20
0
2008 20082009 2009
140
120
100
80
60
40
20
0
Regional Headquarter:Schaefer Systems International Pte Ltd73, Tuas Avenue 1 Singapore 639512 Phone +65/ 6863 0168Fax +65/ 6863 0288eMail [email protected] www.ssi-schaefer-asia.com
Efficient space utilisation, especially in high-cost cold storage environment is of paramount importance.
SCHAEFER’s mobile racking system is a cost-effective and efficient storage system that can effectively increase pallet capacity by up to 100%! Equipped with the latest technology, with the current EN safety features, the mobile racking system can be customised to specific requirements.
Interested to find out more?
Call us today, or visit us at www.ssi-schaefer-asia.com
“The system maximises both volume capacity and product selectivity, in the space of 2200 m2 at the temperature of -25 ◦C.”
Mr. Kevin LimIntegrated Cold Chain
Logistics Sdn Bhd
Mobile Racking SystemCost-effective, Semi-Automated, Safe
SCA 216x303 bleed Ad_Mobile_Reg.indd 1 8/15/2008 4:42:07 PM
Supply Chain Asia March/April 2010
18 maritime
It was at a conference in Shanghai at the end of last year that Cosco’s Captain Wei Jiafu first dropped the bombshell.
Wei said he was in favour of using nuclear power onboard merchant ships as a green initiative that would go far beyond current green initiatives for vessels such as super slow steaming. “As they are already onboard submarines, why not cargo ships? If we could prove we are able to use nuclear energy on ships safely this could be one of the solutions.”
Speaking afterwards to Supply Chain Asia Magazine he revealed Cosco is in talks with the national nuclear authorities in China to develop nuclear-powered ships. Wei called on the various international shipping
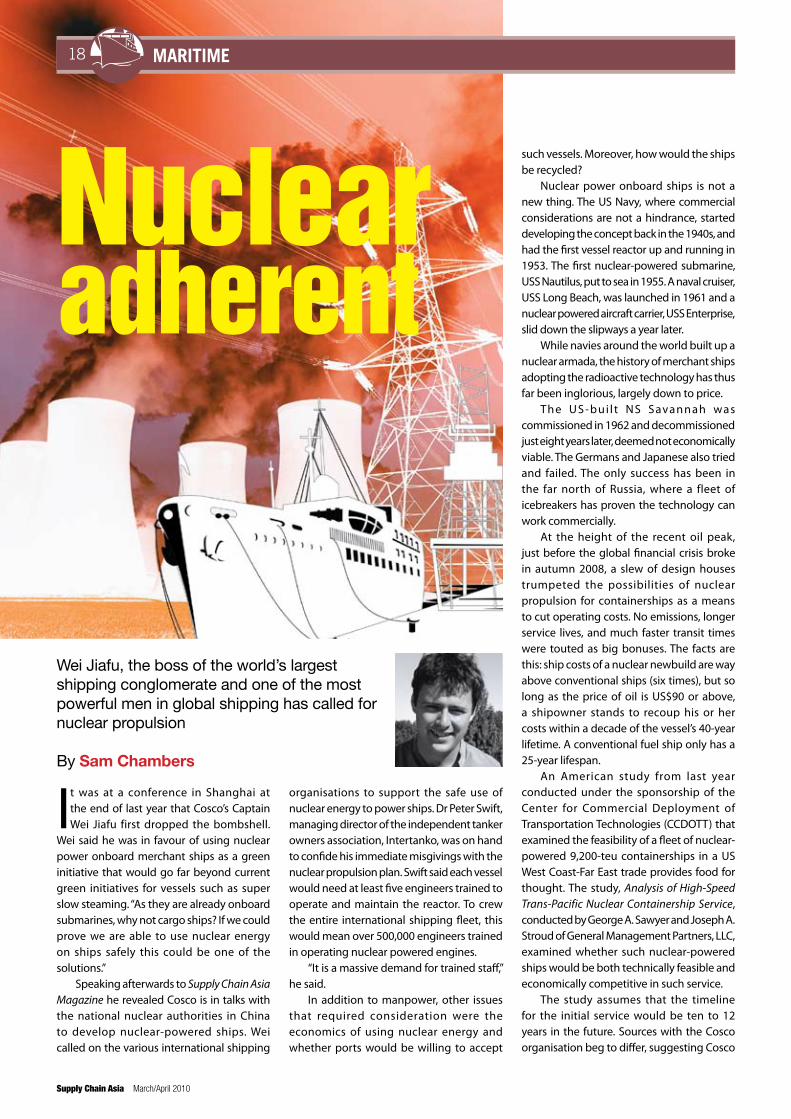
Nuclear adherent
Wei Jiafu, the boss of the world’s largest shipping conglomerate and one of the most powerful men in global shipping has called for nuclear propulsion
By Sam Chambers
organisations to support the safe use of nuclear energy to power ships. Dr Peter Swift, managing director of the independent tanker owners association, Intertanko, was on hand to confide his immediate misgivings with the nuclear propulsion plan. Swift said each vessel would need at least five engineers trained to operate and maintain the reactor. To crew the entire international shipping fleet, this would mean over 500,000 engineers trained in operating nuclear powered engines.
“It is a massive demand for trained staff,” he said.
In addition to manpower, other issues that required consideration were the economics of using nuclear energy and whether ports would be willing to accept
such vessels. Moreover, how would the ships be recycled?
Nuclear power onboard ships is not a new thing. The US Navy, where commercial considerations are not a hindrance, started developing the concept back in the 1940s, and had the first vessel reactor up and running in 1953. The first nuclear-powered submarine, USS Nautilus, put to sea in 1955. A naval cruiser, USS Long Beach, was launched in 1961 and a nuclear powered aircraft carrier, USS Enterprise, slid down the slipways a year later.
While navies around the world built up a nuclear armada, the history of merchant ships adopting the radioactive technology has thus far been inglorious, largely down to price.
The US -bui l t NS Savannah was commissioned in 1962 and decommissioned just eight years later, deemed not economically viable. The Germans and Japanese also tried and failed. The only success has been in the far north of Russia, where a fleet of icebreakers has proven the technology can work commercially.
At the height of the recent oil peak, just before the global financial crisis broke in autumn 2008, a slew of design houses trumpeted the possibilities of nuclear propulsion for containerships as a means to cut operating costs. No emissions, longer service lives, and much faster transit times were touted as big bonuses. The facts are this: ship costs of a nuclear newbuild are way above conventional ships (six times), but so long as the price of oil is US$90 or above, a shipowner stands to recoup his or her costs within a decade of the vessel’s 40-year lifetime. A conventional fuel ship only has a 25-year lifespan.
An American study from last year conducted under the sponsorship of the Center for Commercial Deployment of Transportation Technologies (CCDOTT) that examined the feasibility of a fleet of nuclear-powered 9,200-teu containerships in a US West Coast-Far East trade provides food for thought. The study, Analysis of High-Speed Trans-Pacific Nuclear Containership Service, conducted by George A. Sawyer and Joseph A. Stroud of General Management Partners, LLC, examined whether such nuclear-powered ships would be both technically feasible and economically competitive in such service.
The study assumes that the timeline for the initial service would be ten to 12 years in the future. Sources with the Cosco organisation beg to differ, suggesting Cosco
March/April 2010 Supply Chain Asia
19maritime
could make a nuclear ship within five years. In the American study, the conceptual design for the 9,200 teu nuclear-powered containership was based on the lines of the diesel-powered OOCL Shenzhen, the first ever super post-panamax containership. A nuclear newbuild would cost six times the price of a conventional new ship — that’s up to $900m a piece. The nuclear-powered concept vessel ended up being lengthened by 42 metres to 365 metres overall in order to better accommodate the increased powering required.
The lengthening resulted in a four knot improvement in the speed at the design horsepower and, because of the total weight saved by omitting about 8,900 tons net of fuel, permitted the load-out of an additional 1000+ 40 foot containers.
The study envisioned a hypothetical Rolls-Royce marine PWR nuclear-powered, 35-knot, three-ship express service making weekly calls between the ports of Hong Kong and Long Beach/Los Angeles. This hypothetical
s e r v i c e w a s compared with a four-ship 25-knot c o n v e n t i o n a l
service employing the same sized vessels using diesel technology. The results of the comparison show that under certain assumptions, the conceptual zero emissions nuclear containership service would be economically viable with a crossover point compared to the diesel service at basic oil costs of about $89 per barrel.
Similar studies have been carried out with equally favourable findings, showing transpacific transit times in as little as seven and a half days. Such is the renewed interest in the technology that British classification society Lloyd’s Register has been dusting off
Certain elements of the industry are wildly innovative and this decade has seen some truly significant green design breakthroughs that give optimism to those who believe firmly that shipping can still self-regulate itself.
Among the more revolutionary design teams is Greenwave — a three-year-old charity focused on significantly lowering CO2 and other emissions by reducing the consumption of fossil fuels. Greenwave has developed a wind engine whereby when wind hits a spinning vertical cylinder it creates a very low pressure on one side that generates lift and hence thrust in a similar way that a sail does. Initial wind tunnel tests have indicated that the Greenwave Wind Engines are capable of providing at least 13 percent of the thrust required to propel a ship, saving 900 tonnes of fuel per year.
One German firm has come up with a giant kite system that clearly delivers fuel savings. SkySails claims that depending on prevailing wind conditions, a ship’s average annual fuel costs can be reduced by between ten and 35 percent by using the SkySails system. Under optimal wind conditions, fuel consumption can temporarily be cut by up to 50 percent. Its chief limitation is that at present it cannot shift heavily laden vessels.
Another renewable is making waves this year: the power of the sun. In August the Solon was launched in Berlin, becoming the German capital’s first passenger ship that is driven solely by solar energy. The Berlin-based solar company that the ship is named after also supplied the 24 solar modules with a capacity of 5.6 kWp that are fitted to the ship’s roof and supply its drive energy.
its nuclear propulsion manuals of the ‘60s and ‘70s and updating them
“The technology is there to commence building nuclear ships. The issues regarding their acceptability and the need for a cultural step-change in shipping still need to be addressed so that society is comfortable any risk is being managed,” commented John Carlton, Global Head, Marine Technology & Investigations, Lloyd’s Register.
As we go to press, the volatile price of oil is hovering around $78 a barrel. Last year it hit as high as $150 a barrel and further steep hikes are expected. Oil prices will no doubt likely lead to alternate forms of propulsion, including nuclear. However, the general public — which only comes into contact with the shipping industry via occasional coverage of ship disasters — are unlikely to be convinced of the merits of nuclear ships any time soon.
Sam Chambers is the China Correspondent of Supply Chain Asia Magazine.
Fuel cell technology, estimated to be up to 50 percent more efficient than today’s diesel engines, could in the near future transform the economics and environmental impact of commercial shipping. A fuel cell converts the chemically stored energy in a fuel cell directly to electricity through a reaction with oxygen in the air. The process taking place is very similar to what happens in an ordinary battery, but with the important distinction that a fuel cell does not need to be recharged. The world’s first fuel cell-powered passenger ship was launched in August 2008 in Hamburg.
From Norway, one incredible vision of the future of waterborne transport has made waves around the world. The E/S Orcelle, named after an endangered Irawaddy dolphin, is a concept ship designed by Wallenius Wilhelmsen, a well-known Norwegian owner of car carrier vessels. She does not release any emissions into the atmosphere or into the ocean. She uses the sun, wind and waves as well as fuel cells to generate the energy required to power the vessel. Solar energy is harnessed through photovoltaic panels in the vessel’s three sails, which also help propel the vessel using wind power. Wave power is utilised through a series of 12 fins, which will be able to transform wave energy into hydrogen, electricity or mechanical energy.
This is an abridged version of a chapter on green shipping in the forthcoming book, Oil on Water, co-authored by Sam Chambers. More details available at www.zedbooks.co.uk
Alternative solutions
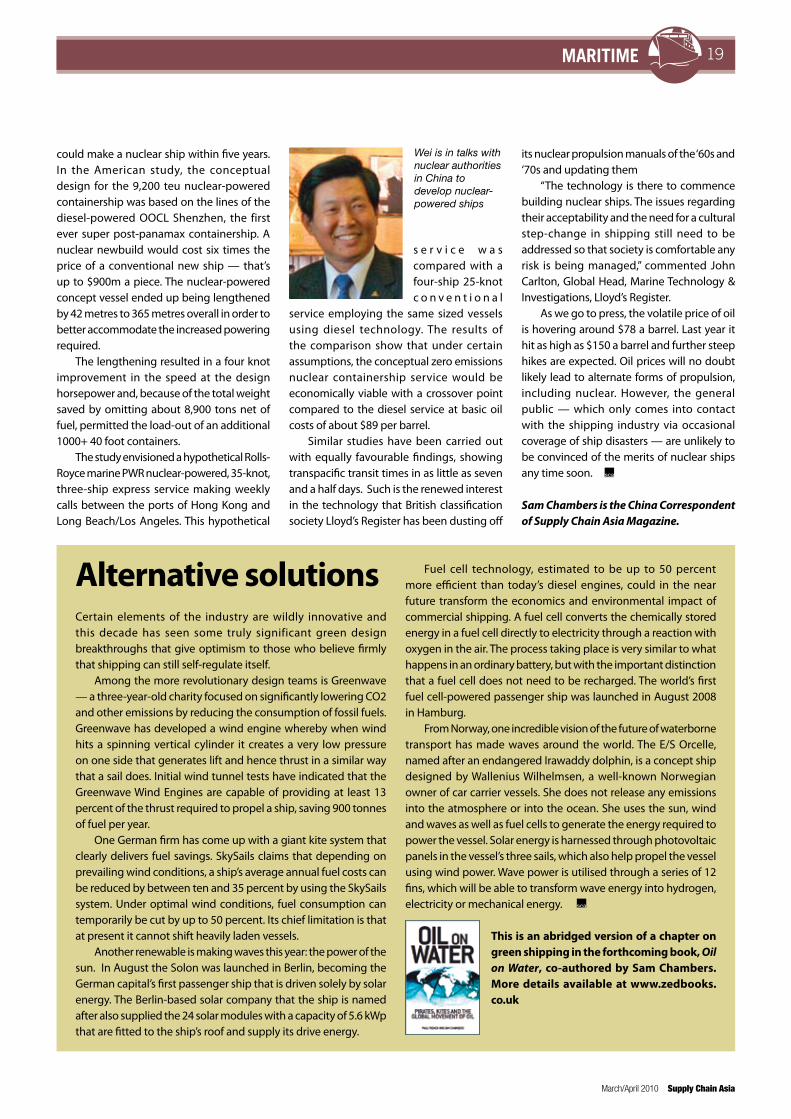
Wei is in talks with nuclear authorities in China to develop nuclear-powered ships
Supply Chain Asia March/April 2010
20 Shipper Dialogue
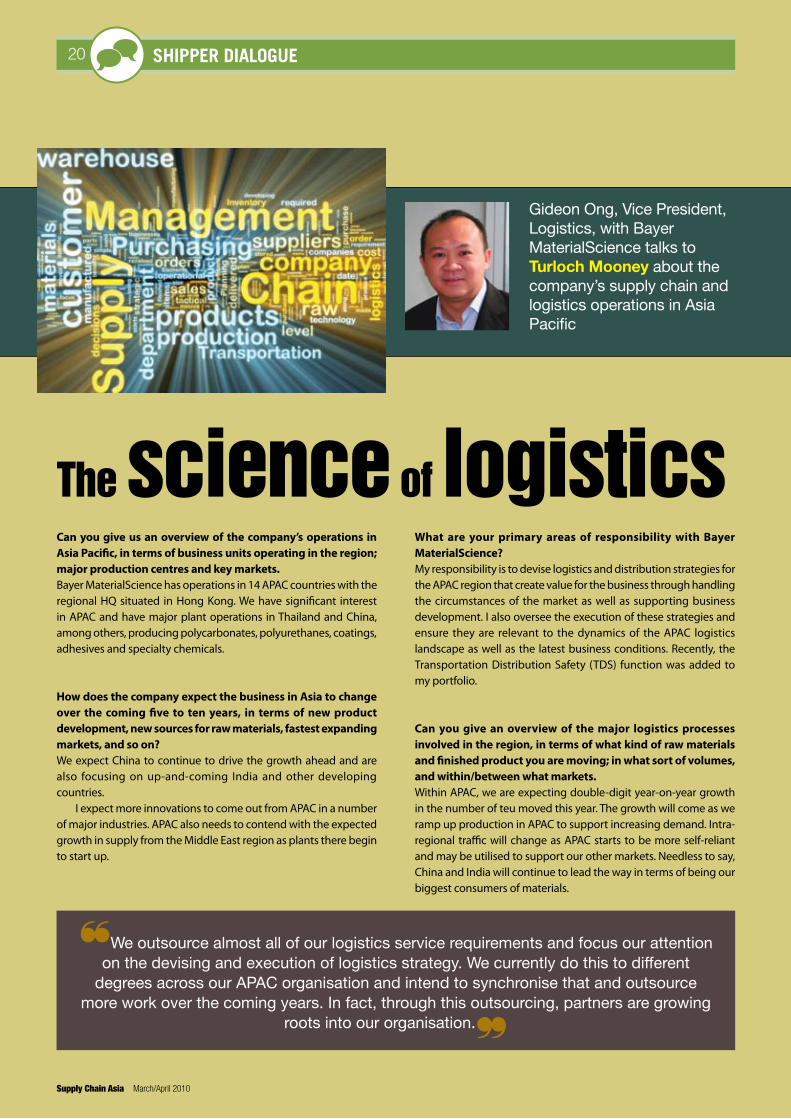
Can you give us an overview of the company’s operations in Asia Pacific, in terms of business units operating in the region; major production centres and key markets. Bayer MaterialScience has operations in 14 APAC countries with the regional HQ situated in Hong Kong. We have significant interest in APAC and have major plant operations in Thailand and China, among others, producing polycarbonates, polyurethanes, coatings, adhesives and specialty chemicals.
How does the company expect the business in Asia to change over the coming five to ten years, in terms of new product development, new sources for raw materials, fastest expanding markets, and so on?We expect China to continue to drive the growth ahead and are also focusing on up-and-coming India and other developing countries.
I expect more innovations to come out from APAC in a number of major industries. APAC also needs to contend with the expected growth in supply from the Middle East region as plants there begin to start up.
The science of logistics
Gideon Ong, Vice President, Logistics, with Bayer MaterialScience talks to Turloch Mooney about the company’s supply chain and logistics operations in Asia Pacific
What are your primary areas of responsibility with Bayer MaterialScience? My responsibility is to devise logistics and distribution strategies for the APAC region that create value for the business through handling the circumstances of the market as well as supporting business development. I also oversee the execution of these strategies and ensure they are relevant to the dynamics of the APAC logistics landscape as well as the latest business conditions. Recently, the Transportation Distribution Safety (TDS) function was added to my portfolio.
Can you give an overview of the major logistics processes involved in the region, in terms of what kind of raw materials and finished product you are moving; in what sort of volumes, and within/between what markets.Within APAC, we are expecting double-digit year-on-year growth in the number of teu moved this year. The growth will come as we ramp up production in APAC to support increasing demand. Intra-regional traffic will change as APAC starts to be more self-reliant and may be utilised to support our other markets. Needless to say, China and India will continue to lead the way in terms of being our biggest consumers of materials.
❝We outsource almost all of our logistics service requirements and focus our attention on the devising and execution of logistics strategy. We currently do this to different
degrees across our APAC organisation and intend to synchronise that and outsource more work over the coming years. In fact, through this outsourcing, partners are growing
roots into our organisation.❞
March/April 2010 Supply Chain Asia
21Shipper Dialogue
What are the main challenges to undertaking logistics operations in Asia? The biggest challenge in any logistics operation is the flexibility to respond to the changes in market conditions and the agility to devise appropriate response or changes to operations. Add the fact that APAC is an amalgamation of 14 different sets of laws and regulations, cultural backgrounds and business dynamics and it makes the coordination and realisation of strategy even more challenging.
The challenges come from the need to deliver to the customer at the right moment, at the right price, at the right cost. To achieve this, we do the following:
Continue to find talent to support our business in these areas. This is a critical factor as it forms the basis of how we address these challenges.
Building of core expertise and outsourcing of non-core expertise. We build core expertise in management of our logistics services but we outsource the physical operation. Critical expertise will be in the area of network optimisation. We do this with an in-house team, so we know how, why and where we are spending money. In-house network optimisation also allows for better process management.
Partnership outsourcing is a critical component of our strategy. We strive to work with the outsource party to become a strategic partner in our operation. The key idea is initially not to look for the ‘best’ but to find the ‘right’ partner and then mould them into an ideal partner. This strategy has worked extremely well for us in China and India where good resources are still limited but there is lots of potential among partner companies. So far we have groomed quite a few good players in the field of chemical logistics.
Stay close to the market and build up a good external network of contacts. I encourage my team to interact with the market to get a feel for the dynamics of the changes and react strategically with tools like network optimisation and tactical operation through our partners. Good plans should be viable for up to three to five years ahead, or else you need to question them harder.
How much of your logistics service requirements do you currently outsource? Will you be outsourcing a larger share of your logistics requirements over the coming years? We outsource almost all of our logistics service requirements and focus our attention on the devising and execution of logistics strategy. We currently do this to different degrees across our APAC organisation and intend to synchronise that and outsource more work over the coming years. In fact, through this outsourcing, partners are growing roots into our organisation.
Is it easier to outsource in certain Asian markets — if so, which ones, and why?Definitely. Countries such as Singapore and Hong Kong are mature logistics markets and the service providers are already familiar with working with chemicals manufacturers. It is relatively challenging to find a good outsourcing partner in countries like China and India, but once you are able to get one and develop them, the returns are rewarding. I am proud to say that we have done it in China and India. There is still room for improvement and we are working on that.
What are the major changes you expect in the area of logistics and supply chain for your industry in Asia over the next five to ten years? What industry/market trends are driving these changes? The changes will depend on markets. In China and India, we are seeing better asset players that are improving their services by becoming asset management companies rather than 2PLs or 3PLs. We are seeing a merging of concepts where there are players that can do the management part and also provide the assets to support operations. Developments are less obvious in the rest of Asia, but with the current economic crisis and volatility, we expect more M&As to happen, resulting in the big getting bigger.
We are also seeing freight forwarders trying to move up the value chain by adding warehousing, trucking and other services. We will see more and more integrated companies that provide one-stop-shop services with strong networks. Single service firms will face more challenges as customers seek integrated operation processes. We are seeing this in China already.
Looking at the current market situation, the next DHL or UPS class of logistics company will come from China or India, and this is not too far away.
❝The biggest challenge in any logistics operation is the flexibility to respond to changes in market conditions and the agility to devise appropriate response or changes to operations. The challenges come from the need to deliver to the customer at the right
moment, at the right price, at the right cost. ❞
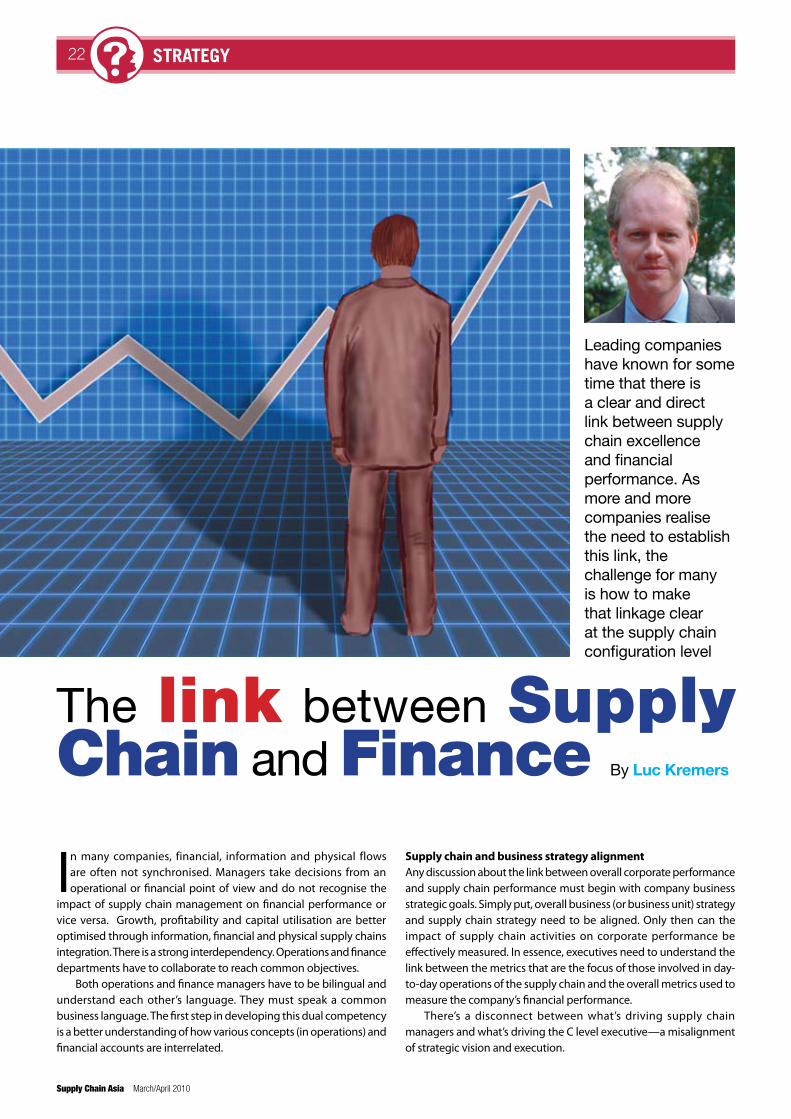
Supply Chain Asia March/April 2010
infrastructure update22 strateGY
In many companies, financial, information and physical flows are often not synchronised. Managers take decisions from an operational or financial point of view and do not recognise the
impact of supply chain management on financial performance or vice versa. Growth, profitability and capital utilisation are better optimised through information, financial and physical supply chains integration. There is a strong interdependency. Operations and finance departments have to collaborate to reach common objectives.
Both operations and finance managers have to be bilingual and understand each other’s language. They must speak a common business language. The first step in developing this dual competency is a better understanding of how various concepts (in operations) and financial accounts are interrelated.
The link between Supply Chain and Finance By Luc Kremers
Leading companies have known for some time that there is a clear and direct link between supply chain excellence and financial performance. As more and more companies realise the need to establish this link, the challenge for many is how to make that linkage clear at the supply chain configuration level
Supply chain and business strategy alignmentAny discussion about the link between overall corporate performance and supply chain performance must begin with company business strategic goals. Simply put, overall business (or business unit) strategy and supply chain strategy need to be aligned. Only then can the impact of supply chain activities on corporate performance be effectively measured. In essence, executives need to understand the link between the metrics that are the focus of those involved in day-to-day operations of the supply chain and the overall metrics used to measure the company’s financial performance.
There’s a disconnect between what’s driving supply chain managers and what’s driving the C level executive—a misalignment of strategic vision and execution.
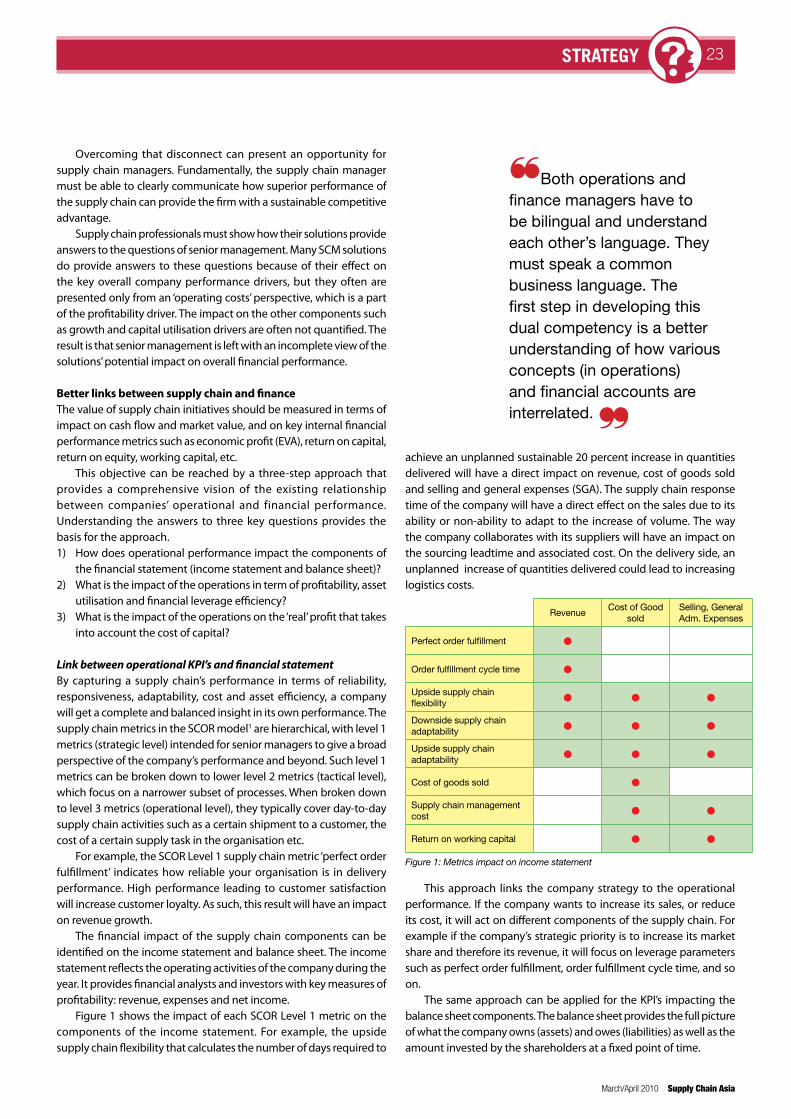
March/April 2010 Supply Chain Asia
infrastructure update 23strateGY
Overcoming that disconnect can present an opportunity for supply chain managers. Fundamentally, the supply chain manager must be able to clearly communicate how superior performance of the supply chain can provide the firm with a sustainable competitive advantage.
Supply chain professionals must show how their solutions provide answers to the questions of senior management. Many SCM solutions do provide answers to these questions because of their effect on the key overall company performance drivers, but they often are presented only from an ‘operating costs’ perspective, which is a part of the profitability driver. The impact on the other components such as growth and capital utilisation drivers are often not quantified. The result is that senior management is left with an incomplete view of the solutions’ potential impact on overall financial performance.
Better links between supply chain and financeThe value of supply chain initiatives should be measured in terms of impact on cash flow and market value, and on key internal financial performance metrics such as economic profit (EVA), return on capital, return on equity, working capital, etc.
This objective can be reached by a three-step approach that provides a comprehensive vision of the existing relationship between companies’ operational and financial performance. Understanding the answers to three key questions provides the basis for the approach. 1) How does operational performance impact the components of
the financial statement (income statement and balance sheet)?2) What is the impact of the operations in term of profitability, asset
utilisation and financial leverage efficiency?3) What is the impact of the operations on the ‘real’ profit that takes
into account the cost of capital?
Link between operational KPI’s and financial statementBy capturing a supply chain’s performance in terms of reliability, responsiveness, adaptability, cost and asset efficiency, a company will get a complete and balanced insight in its own performance. The supply chain metrics in the SCOR model1 are hierarchical, with level 1 metrics (strategic level) intended for senior managers to give a broad perspective of the company’s performance and beyond. Such level 1 metrics can be broken down to lower level 2 metrics (tactical level), which focus on a narrower subset of processes. When broken down to level 3 metrics (operational level), they typically cover day-to-day supply chain activities such as a certain shipment to a customer, the cost of a certain supply task in the organisation etc.
For example, the SCOR Level 1 supply chain metric ‘perfect order fulfillment’ indicates how reliable your organisation is in delivery performance. High performance leading to customer satisfaction will increase customer loyalty. As such, this result will have an impact on revenue growth.
The financial impact of the supply chain components can be identified on the income statement and balance sheet. The income statement reflects the operating activities of the company during the year. It provides financial analysts and investors with key measures of profitability: revenue, expenses and net income.
Figure 1 shows the impact of each SCOR Level 1 metric on the components of the income statement. For example, the upside supply chain flexibility that calculates the number of days required to
achieve an unplanned sustainable 20 percent increase in quantities delivered will have a direct impact on revenue, cost of goods sold and selling and general expenses (SGA). The supply chain response time of the company will have a direct effect on the sales due to its ability or non-ability to adapt to the increase of volume. The way the company collaborates with its suppliers will have an impact on the sourcing leadtime and associated cost. On the delivery side, an unplanned increase of quantities delivered could lead to increasing logistics costs.
Figure 1: Metrics impact on income statement
❝Both operations and finance managers have to be bilingual and understand each other’s language. They must speak a common business language. The first step in developing this dual competency is a better understanding of how various concepts (in operations) and financial accounts are interrelated. ❞
This approach links the company strategy to the operational performance. If the company wants to increase its sales, or reduce its cost, it will act on different components of the supply chain. For example if the company’s strategic priority is to increase its market share and therefore its revenue, it will focus on leverage parameters such as perfect order fulfillment, order fulfillment cycle time, and so on.
The same approach can be applied for the KPI’s impacting the balance sheet components. The balance sheet provides the full picture of what the company owns (assets) and owes (liabilities) as well as the amount invested by the shareholders at a fixed point of time.
RevenueCost of Good
soldSelling, General Adm. Expenses
Perfect order fulfillment Order fulfillment cycle time Upside supply chain flexibility Downside supply chain adaptability Upside supply chain adaptability Cost of goods sold Supply chain management cost Return on working capital
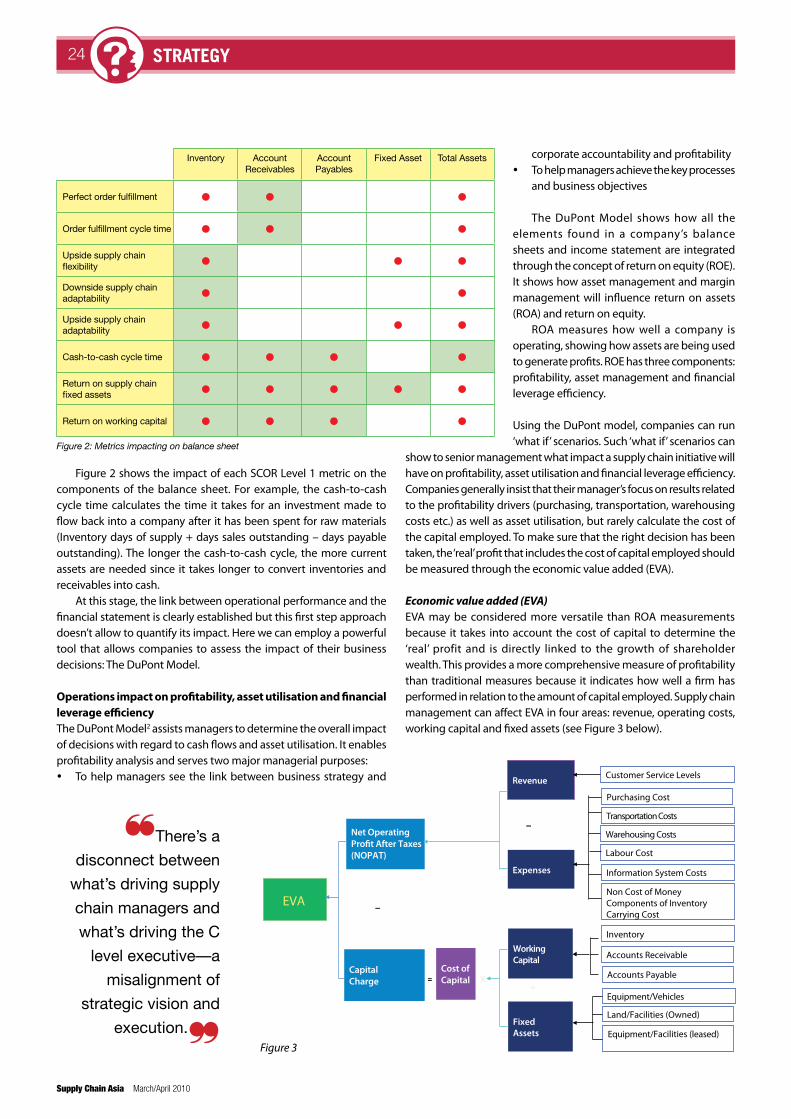
Supply Chain Asia March/April 2010
infrastructure update24 strateGY
Figure 2 shows the impact of each SCOR Level 1 metric on the components of the balance sheet. For example, the cash-to-cash cycle time calculates the time it takes for an investment made to flow back into a company after it has been spent for raw materials (Inventory days of supply + days sales outstanding – days payable outstanding). The longer the cash-to-cash cycle, the more current assets are needed since it takes longer to convert inventories and receivables into cash.
At this stage, the link between operational performance and the financial statement is clearly established but this first step approach doesn’t allow to quantify its impact. Here we can employ a powerful tool that allows companies to assess the impact of their business decisions: The DuPont Model.
Operations impact on profitability, asset utilisation and financial leverage efficiencyThe DuPont Model2 assists managers to determine the overall impact of decisions with regard to cash flows and asset utilisation. It enables profitability analysis and serves two major managerial purposes: To help managers see the link between business strategy and
❝There’s a
disconnect between
what’s driving supply
chain managers and
what’s driving the C
level executive—a
misalignment of
strategic vision and
execution.❞
corporate accountability and profitability To help managers achieve the key processes
and business objectives
The DuPont Model shows how all the elements found in a company’s balance sheets and income statement are integrated through the concept of return on equity (ROE). It shows how asset management and margin management will influence return on assets (ROA) and return on equity.
ROA measures how well a company is operating, showing how assets are being used to generate profits. ROE has three components: profitability, asset management and financial leverage efficiency.
Using the DuPont model, companies can run ‘what if’ scenarios. Such ‘what if’ scenarios can
show to senior management what impact a supply chain initiative will have on profitability, asset utilisation and financial leverage efficiency. Companies generally insist that their manager’s focus on results related to the profitability drivers (purchasing, transportation, warehousing costs etc.) as well as asset utilisation, but rarely calculate the cost of the capital employed. To make sure that the right decision has been taken, the ‘real’ profit that includes the cost of capital employed should be measured through the economic value added (EVA).
Economic value added (EVA)EVA may be considered more versatile than ROA measurements because it takes into account the cost of capital to determine the ‘real’ profit and is directly linked to the growth of shareholder wealth. This provides a more comprehensive measure of profitability than traditional measures because it indicates how well a firm has performed in relation to the amount of capital employed. Supply chain management can affect EVA in four areas: revenue, operating costs, working capital and fixed assets (see Figure 3 below).
Figure 3
Inventory Account Receivables
Account Payables
Fixed Asset Total Assets
Perfect order fulfillment Order fulfillment cycle time Upside supply chain flexibility Downside supply chain adaptability Upside supply chain adaptability Cash-to-cash cycle time Return on supply chain fixed assets Return on working capital
Figure 2: Metrics impacting on balance sheet
Expenses
CapitalCharge
Customer Service Levels
Net Operating
(NOPAT)
Transportation Costs
Warehousing Costs
Labour Cost
Inventory
EVA
Revenue
Land/Facilities (Owned)
Information System Costs
Fixed Assets
Cost ofCapital
Working Capital
–
= X+
–
Purchasing Cost
Facilities
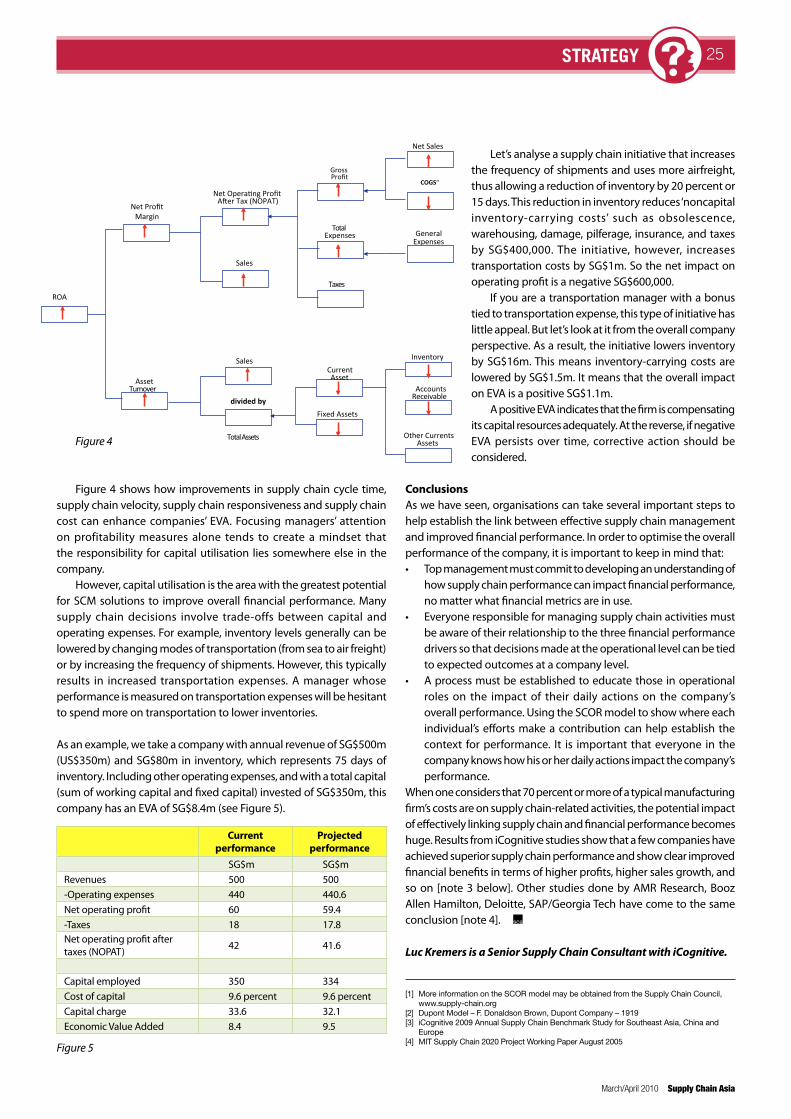
March/April 2010 Supply Chain Asia
infrastructure update 25strateGY
Current performance
Projected performance
SG$m SG$mRevenues 500 500-Operating expenses 440 440.6Net operating profit 60 59.4-Taxes 18 17.8Net operating profit after taxes (NOPAT) 42 41.6
Capital employed 350 334Cost of capital 9.6 percent 9.6 percentCapital charge 33.6 32.1Economic Value Added 8.4 9.5
Let’s analyse a supply chain initiative that increases the frequency of shipments and uses more airfreight, thus allowing a reduction of inventory by 20 percent or 15 days. This reduction in inventory reduces ‘noncapital inventory-carrying costs’ such as obsolescence, warehousing, damage, pilferage, insurance, and taxes by SG$400,000. The initiative, however, increases transportation costs by SG$1m. So the net impact on operating profit is a negative SG$600,000.
If you are a transportation manager with a bonus tied to transportation expense, this type of initiative has little appeal. But let’s look at it from the overall company perspective. As a result, the initiative lowers inventory by SG$16m. This means inventory-carrying costs are lowered by SG$1.5m. It means that the overall impact on EVA is a positive SG$1.1m.
A positive EVA indicates that the firm is compensating its capital resources adequately. At the reverse, if negative EVA persists over time, corrective action should be considered.
Figure 4
Figure 4 shows how improvements in supply chain cycle time, supply chain velocity, supply chain responsiveness and supply chain cost can enhance companies’ EVA. Focusing managers’ attention on profitability measures alone tends to create a mindset that the responsibility for capital utilisation lies somewhere else in the company.
However, capital utilisation is the area with the greatest potential for SCM solutions to improve overall financial performance. Many supply chain decisions involve trade-offs between capital and operating expenses. For example, inventory levels generally can be lowered by changing modes of transportation (from sea to air freight) or by increasing the frequency of shipments. However, this typically results in increased transportation expenses. A manager whose performance is measured on transportation expenses will be hesitant to spend more on transportation to lower inventories.
As an example, we take a company with annual revenue of SG$500m (US$350m) and SG$80m in inventory, which represents 75 days of inventory. Including other operating expenses, and with a total capital (sum of working capital and fixed capital) invested of SG$350m, this company has an EVA of SG$8.4m (see Figure 5).
ConclusionsAs we have seen, organisations can take several important steps to help establish the link between effective supply chain management and improved financial performance. In order to optimise the overall performance of the company, it is important to keep in mind that:• Topmanagementmustcommittodevelopinganunderstandingof
how supply chain performance can impact financial performance, no matter what financial metrics are in use.
• Everyoneresponsibleformanagingsupplychainactivitiesmustbe aware of their relationship to the three financial performance drivers so that decisions made at the operational level can be tied to expected outcomes at a company level.
• Aprocessmustbeestablishedtoeducatethoseinoperationalroles on the impact of their daily actions on the company’s overall performance. Using the SCOR model to show where each individual’s efforts make a contribution can help establish the context for performance. It is important that everyone in the company knows how his or her daily actions impact the company’s performance.
When one considers that 70 percent or more of a typical manufacturing firm’s costs are on supply chain-related activities, the potential impact of effectively linking supply chain and financial performance becomes huge. Results from iCognitive studies show that a few companies have achieved superior supply chain performance and show clear improved financial benefits in terms of higher profits, higher sales growth, and so on [note 3 below]. Other studies done by AMR Research, Booz Allen Hamilton, Deloitte, SAP/Georgia Tech have come to the same conclusion [note 4].
Luc Kremers is a Senior Supply Chain Consultant with iCognitive.
[1] More information on the SCOR model may be obtained from the Supply Chain Council, www.supply-chain.org [2] Dupont Model – F. Donaldson Brown, Dupont Company – 1919 [3] iCognitive 2009 Annual Supply Chain Benchmark Study for Southeast Asia, China and Europe[4] MIT Supply Chain 2020 Project Working Paper August 2005
Figure 5
AccountsReceivable
Other CurrentsAssets
GeneralExpenses
COGS"
Inventory
GrossProfit
TotalExpenses
Net Operating ProfitAfter Tax (NOPAT)
Sales
CurrentAsset
Fixed Assets
divided by
Sales
Total Assets
Net ProfitMargin
ROA
AssetTurnover
Taxes
Net Sales

Supply Chain Asia March/April 2010
26 FORECASTING
into rolling forecasts. This did not meet with much success either. To understand the
problem, we used data collated from Mumbai’s Colaba market and found that the consumption data showed strong seasonality. No forecast would be accurate unless corrected for the seasonal trend and combined with the appropriate time series technique. Nor would investment in an advanced information systems be of much use.
Similarly, another company, a tractor major, had almost given up the causal method of forecasting and embraced the sales force composite method, even though the latter’s accuracy remained a major worry. Tractor demand is closely related to what happens to agriculture. We had identified a causal model that was based on drivers of demand for tractors and provided a fair guide in planning sales. The company did not know how to convert causal forecasts into short-term forecasts for better operational planning and thus gave up scientific forecasting for judgemental methods.
Agribusiness firms such as Bayer and Syngenta have been quite successful in this area. Along with rolling plans, they also forecast the crop scenario for various regions. They intelligently use their sales forces to track changes in the cropping pattern, areas under different crops, procurement prices, and levels of rainfall. This data is then used to create an operational sales forecast on both a quarterly and a monthly basis. Syngenta and Bayer have been able to minimise inventory in comparison to other players in the industry.
Keep internal biases in checkForecasting methods and models need to be applied intelligently. Indian firms seem to have lost their direction. Their choice of forecasting method seems to be dictated by supply chain requirements with little understanding of when, where, what and how to forecast. The appropriate choice of a technique depends upon the inherent uncertainty in the business environment and factors that cause this uncertainty.
As noted, many organisations are today moving away from sophisticated techniques to those based on market response, such as sales force composite. This method is an outcome of thinking that as the business environment becomes more uncertain, firms can minimise their supply chain cost by adapting responsive and postponement strategies rather than being dictated to by forecast.
Despite significant developments in the area of supply chain forecasting, particularly in terms of IT advancements, most organisations continue to do a poor job of incorporating
demand uncertainty into their production planning processes. This is often put down simply to poor forecasting, with little thought going to the methods of forecasting being employed.
Forecasting practices are characterised by some interesting insights on changes in techniques. Research indicates that in the 1980s, despite the growing availability of computer-based forecasting systems, companies continued to rely predominantly on subjective techniques. Since the mid-1990s, companies have increasingly been using computer-based forecasting systems, but for a great many organisations this has done little to improve forecast accuracy.
This raises a plethora of questions on the processes of forecasting: are forecasts reviewed and agreed upon by key departments in the organisation? Are the right statistical methods used in forecasting the demand for a product? What horizons and time periods are used for both long and short-term forecasting? How are statistical and judgmental considerations combined?
A study conducted by the Great Lakes Institute of Management in Chennai found that the most widely used method of forecasting is the sales force composite method, where causal and time series models give way to rolling plans. The changing nature of business and increasing complexity due to the changing nature of demand makes this shift from quantitative to qualitative models understandable. But what we found surprising was that even where causal and time series models would have been appropriate, IT-based sales force composites were often used blindly. The processes, effects and practices of forecasting are rarely limited to one department, and consensus approaches leading to effective budget-driven demand planning have yet to evolve in many organisations.
Demand can be predictable Not all demand is unpredictable. There are times when demand follows a predictable pattern. While auditing the forecasting processes of a lifestyle major, I found that the company used the time series technique for its vacuum cleaners and spare parts requirements. The forecast error was so high that they gave up forecasting in favour of an ERP system where sales force composite forecasts were converted
The demands of forecastingDespite advanced forecasting technologies, accurate demand planning is still an elusive goal for a great many organisations. Dr Rakesh Singh looks at the barriers and identifies the key missing element in undertaking successful forecasting
DXTNTB 12234 Generic 6/16/08 12:30 PM Page 2
Composite
C M Y CM MY CY CMY K
DXTNTB 12234Supplies Chain Asia _TD300%W210 x H297mm (Artpaper 150#) DYR M Y
C KWhile every effort has been taken to carry out instruction to customers satisfactionNO RESPONSIBILITY liablilty will be accepted for errorsCUSTOMERSARETHEREFOREURGEDTOCHECKTHOROUGHLYBEFOREAUTHORISINGPRINTRUNSDALIM
21 2 3 4 5 6 7 8 9 10 OK CLC CCCC241739 MAC5osx 16.06.08 150# CC653

Supply Chain Asia March/April 2010
28 FORECASTING
In supply chain literature, this is called ‘quick response’. Firms use their widely dispersed sales force to compute a rolling forecast and align their supplies to these forecasts. But this approach does not solve all problems.
For example, we found that there is a general tendency for small changes in customer demand to be amplified within a production distribution system. Upstream replenishment demand and physical shipments can exceed the original order quantity. This is caused by orders moving through the levels of the supply chain, unplanned trade and promotion discounts, long lead-times and batch ordering. All of these are essential parts of a business organisation and these marketing, logistics and forecasting initiatives lead to big fluctuations.
Forecasting can be used as an order history from the company ’s immediate customers. At each level of the supply chain, members adjust their orders based on their understanding and comforts. In one agrochemical firm we discovered amazing demand variability. A g r o c h e m i c a l companies have to stock well before the agricultural season, but any incremental changes in demand and supply cause stock-outs in some places and surplus of stock in others. It is easy for managers to misread the market, and the tendency is to under-order in a period of surplus and then ‘smoothen’ orders in order to get the amount of stock they think they need. Game playing by the sales force, such as personal selling, was tactical and not strategic in nature. Further distortions were caused by the sales force being confronted with unrealistic targets which were fixed on the basis of other considerations rather than a business forecast.
Improve core business practicesSuch business-driven variability is further distorted as marketing and promotions create havoc with market data or demand trends. Supply chain members will normally stock up during promotions and discounts, leading to a jump in demand. But each promotion may be carried out in isolation vis-à-vis the rest of the organisation; and strategically to compete with key competitors. Keeping track of demand spikes of this nature is extremely difficult. The result is often that a forecaster sees the upward trend and forecasts high, leading to unnecessary inventory costs.
Similar problems can arise when, for instance, transport loading is adjusted for the sake of efficiency or cost savings. Fully loading trucks to save money despite requirement for a lesser amount of stock can mean jumps in data that mislead forecasters. Our research has discovered that longer order lead-times result in higher demand amplification, poor forecasting and excessive inventory cost.
Firms often blame forecasts for demand planning errors when the real culprits are the practices of the business.
Forecasting can be much more accurate when you are in a position to track this type of
business-driven variability and factor it into your forecasting methods.
An integrated exerciseIt should be remembered that
forecasting is an integrated exercise. All levels of the
supply chain need to be involved and willing to share information to increase demand visibility and improve the performance of forecasts. IT is a critical tool, but on its own is not enough. Most organisations show a significant level of dissatisfaction with the
quality of IT. We h a v e f o u n d
that most organisations lack extended enterprise
functionality and open system architecture that
can facilitate integration and collaboration and bring
transparency across the total domain of supply chain management.
The current information systems are inward looking and miss the need to link
across the boundaries of the organisation. They do not connect easily with other systems. Information
systems often lack flexibility in adapting to the ever changing needs of the supply chain in terms of changing business models and processes.
There is a lack of collaborative architecture in decision support software. Organisations still use order-based information instead of flow-based. Lack of advance planning with process functionality hinders optimal supply chain allocations. Real-time communication between information systems, transport and warehouse management systems, and advance planning systems, is normally absent. Information systems frequently lack a modular, pen and Internet-like architecture or ‘web-enabled ERP’.
Forecasting is a victim of the same ills that plague any organisation. To facilitate the changing dynamics of business in response to uncertainties, organisations need different processes, structures
❝Agribusiness firms such as Bayer and Syngenta have been quite successful in their forecasting. Along with rolling plans, they also forecast
the crop scenario for various regions. They intelligently use their
sales forces to track changes in the cropping pattern, areas under
different crops, procurement prices and levels of rainfall. This data is
then used to create an operational sales forecast on both quarterly and
monthly bases. Syngenta and Bayer have been able to
minimise inventory in comparison to other players
in the industry.❞
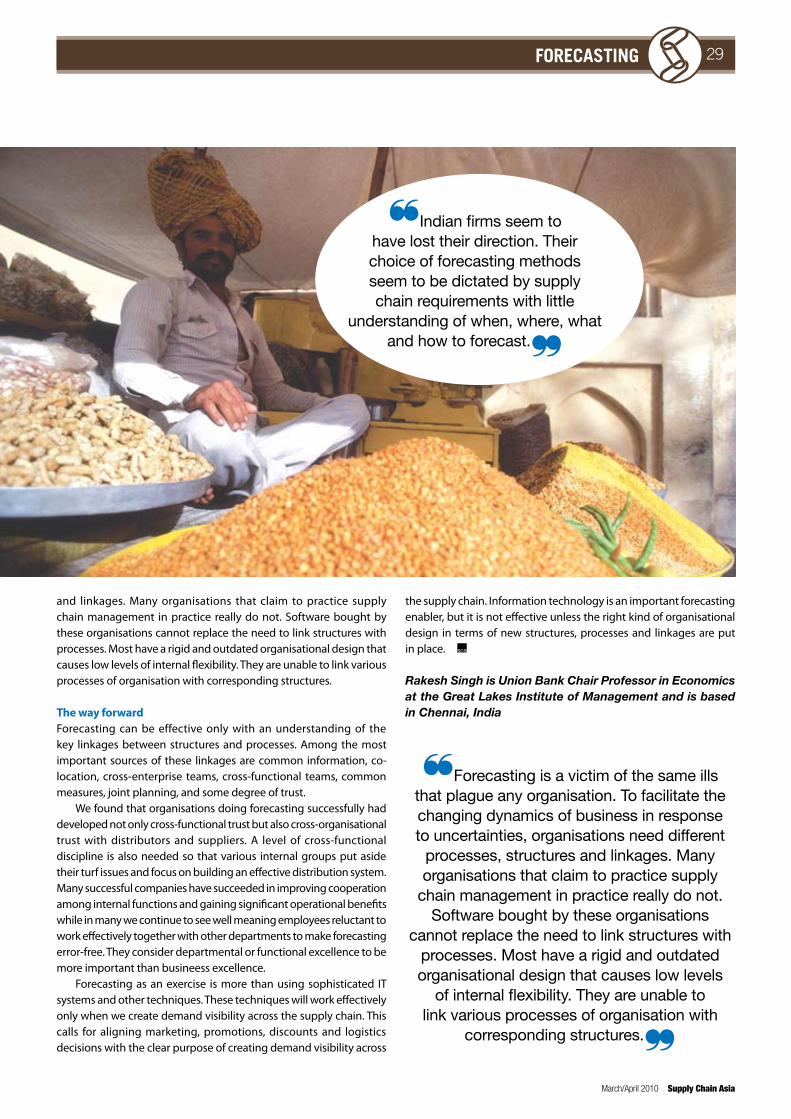
March/April 2010 Supply Chain Asia
29FORECASTING
and linkages. Many organisations that claim to practice supply chain management in practice really do not. Software bought by these organisations cannot replace the need to link structures with processes. Most have a rigid and outdated organisational design that causes low levels of internal flexibility. They are unable to link various processes of organisation with corresponding structures.
The way forwardForecasting can be effective only with an understanding of the key linkages between structures and processes. Among the most important sources of these linkages are common information, co-location, cross-enterprise teams, cross-functional teams, common measures, joint planning, and some degree of trust.
We found that organisations doing forecasting successfully had developed not only cross-functional trust but also cross-organisational trust with distributors and suppliers. A level of cross-functional discipline is also needed so that various internal groups put aside their turf issues and focus on building an effective distribution system. Many successful companies have succeeded in improving cooperation among internal functions and gaining significant operational benefits while in many we continue to see well meaning employees reluctant to work effectively together with other departments to make forecasting error-free. They consider departmental or functional excellence to be more important than busineess excellence.
Forecasting as an exercise is more than using sophisticated IT systems and other techniques. These techniques will work effectively only when we create demand visibility across the supply chain. This calls for aligning marketing, promotions, discounts and logistics decisions with the clear purpose of creating demand visibility across
❝Indian firms seem to have lost their direction. Their choice of forecasting methods seem to be dictated by supply chain requirements with little
understanding of when, where, what and how to forecast.❞
the supply chain. Information technology is an important forecasting enabler, but it is not effective unless the right kind of organisational design in terms of new structures, processes and linkages are put in place.
Rakesh Singh is Union Bank Chair Professor in Economics at the Great Lakes Institute of Management and is based in Chennai, India
❝Forecasting is a victim of the same ills that plague any organisation. To facilitate the changing dynamics of business in response to uncertainties, organisations need different
processes, structures and linkages. Many organisations that claim to practice supply
chain management in practice really do not. Software bought by these organisations
cannot replace the need to link structures with processes. Most have a rigid and outdated organisational design that causes low levels
of internal flexibility. They are unable to link various processes of organisation with
corresponding structures.❞
Supply Chain Asia March/April 2010
infrastructure update30 strateGY
As organisations make their way out of the downturn, their actions over the next twelve months could
very well determine performance results for years to come. And possibly the most critical move those companies can make is to aggressively and skillfully pursue ‘operational excellence’.
Why operational excellence? Perhaps the best reason is that it is both a source of competitive strength and a generator of cost and cash benefits. In effect, operational excellence offers businesses an opportunity to increase quality, reliability, flexibility, speed to market and customer value.
Yet operational excellence represents way more than just doing the same things better. It includes the disciplines of simplification and standardisation, as well as the elimination of waste, waiting time
❝At Apple, the dominant vector is speed to market, rooted in
constant convergence (think iPhone, iPad and a million ‘apps.’).
Walgreens excels at site selection—offering convenient locations as
a central plank of its value to customers. IKEA can point to designer
products at mass-market prices. At Singapore Airlines, high-quality
customer service is the dominant vector: driving all internal decisions
affecting employee engagement and empowerment.❞
Operational excellence:
Creating a market winning position
By Jonathan Wright
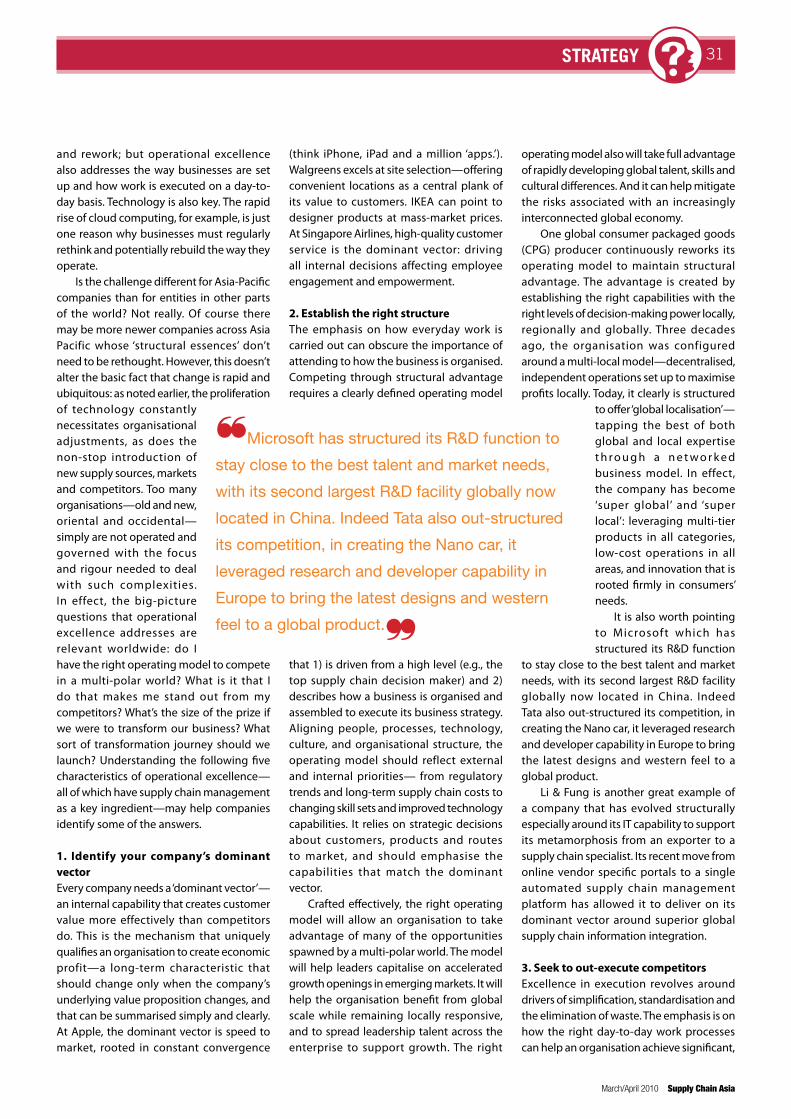
March/April 2010 Supply Chain Asia
infrastructure update 31strateGY
and rework; but operational excellence also addresses the way businesses are set up and how work is executed on a day-to-day basis. Technology is also key. The rapid rise of cloud computing, for example, is just one reason why businesses must regularly rethink and potentially rebuild the way they operate.
Is the challenge different for Asia-Pacific companies than for entities in other parts of the world? Not really. Of course there may be more newer companies across Asia Pacific whose ‘structural essences’ don’t need to be rethought. However, this doesn’t alter the basic fact that change is rapid and ubiquitous: as noted earlier, the proliferation of technology constantly necessitates organisational adjustments, as does the non-stop introduction of new supply sources, markets and competitors. Too many organisations—old and new, oriental and occidental—simply are not operated and governed with the focus and rigour needed to deal with such complexities. In effect, the big-picture questions that operational excellence addresses are relevant worldwide: do I have the right operating model to compete in a multi-polar world? What is it that I do that makes me stand out from my competitors? What’s the size of the prize if we were to transform our business? What sort of transformation journey should we launch? Understanding the following five characteristics of operational excellence—all of which have supply chain management as a key ingredient—may help companies identify some of the answers.
1. Identify your company’s dominant vectorEvery company needs a ‘dominant vector’—an internal capability that creates customer value more effectively than competitors do. This is the mechanism that uniquely qualifies an organisation to create economic profit—a long-term characteristic that should change only when the company’s underlying value proposition changes, and that can be summarised simply and clearly. At Apple, the dominant vector is speed to market, rooted in constant convergence
(think iPhone, iPad and a million ‘apps.’). Walgreens excels at site selection—offering convenient locations as a central plank of its value to customers. IKEA can point to designer products at mass-market prices. At Singapore Airlines, high-quality customer service is the dominant vector: driving all internal decisions affecting employee engagement and empowerment.
2. Establish the right structureThe emphasis on how everyday work is carried out can obscure the importance of attending to how the business is organised. Competing through structural advantage requires a clearly defined operating model
that 1) is driven from a high level (e.g., the top supply chain decision maker) and 2) describes how a business is organised and assembled to execute its business strategy. Aligning people, processes, technology, culture, and organisational structure, the operating model should reflect external and internal priorities— from regulatory trends and long-term supply chain costs to changing skill sets and improved technology capabilities. It relies on strategic decisions about customers, products and routes to market, and should emphasise the capabilities that match the dominant vector.
Crafted effectively, the right operating model will allow an organisation to take advantage of many of the opportunities spawned by a multi-polar world. The model will help leaders capitalise on accelerated growth openings in emerging markets. It will help the organisation benefit from global scale while remaining locally responsive, and to spread leadership talent across the enterprise to support growth. The right
❝Microsoft has structured its R&D function to
stay close to the best talent and market needs,
with its second largest R&D facility globally now
located in China. Indeed Tata also out-structured
its competition, in creating the Nano car, it
leveraged research and developer capability in
Europe to bring the latest designs and western
feel to a global product.❞
operating model also will take full advantage of rapidly developing global talent, skills and cultural differences. And it can help mitigate the risks associated with an increasingly interconnected global economy.
One global consumer packaged goods (CPG) producer continuously reworks its operating model to maintain structural advantage. The advantage is created by establishing the right capabilities with the right levels of decision-making power locally, regionally and globally. Three decades ago, the organisation was configured around a multi-local model—decentralised, independent operations set up to maximise profits locally. Today, it clearly is structured
to offer ‘global localisation’—tapping the best of both global and local expertise t h r o u g h a n e t w o r k e d business model. In effect, the company has become ‘super global’ and ‘super local’: leveraging multi-tier products in all categories, low-cost operations in all areas, and innovation that is rooted firmly in consumers’ needs.
It is also worth pointing to Microsoft which has structured its R&D function
to stay close to the best talent and market needs, with its second largest R&D facility globally now located in China. Indeed Tata also out-structured its competition, in creating the Nano car, it leveraged research and developer capability in Europe to bring the latest designs and western feel to a global product.
Li & Fung is another great example of a company that has evolved structurally especially around its IT capability to support its metamorphosis from an exporter to a supply chain specialist. Its recent move from online vendor specific portals to a single automated supply chain management platform has allowed it to deliver on its dominant vector around superior global supply chain information integration.
3. Seek to out-execute competitorsExcellence in execution revolves around drivers of simplification, standardisation and the elimination of waste. The emphasis is on how the right day-to-day work processes can help an organisation achieve significant,
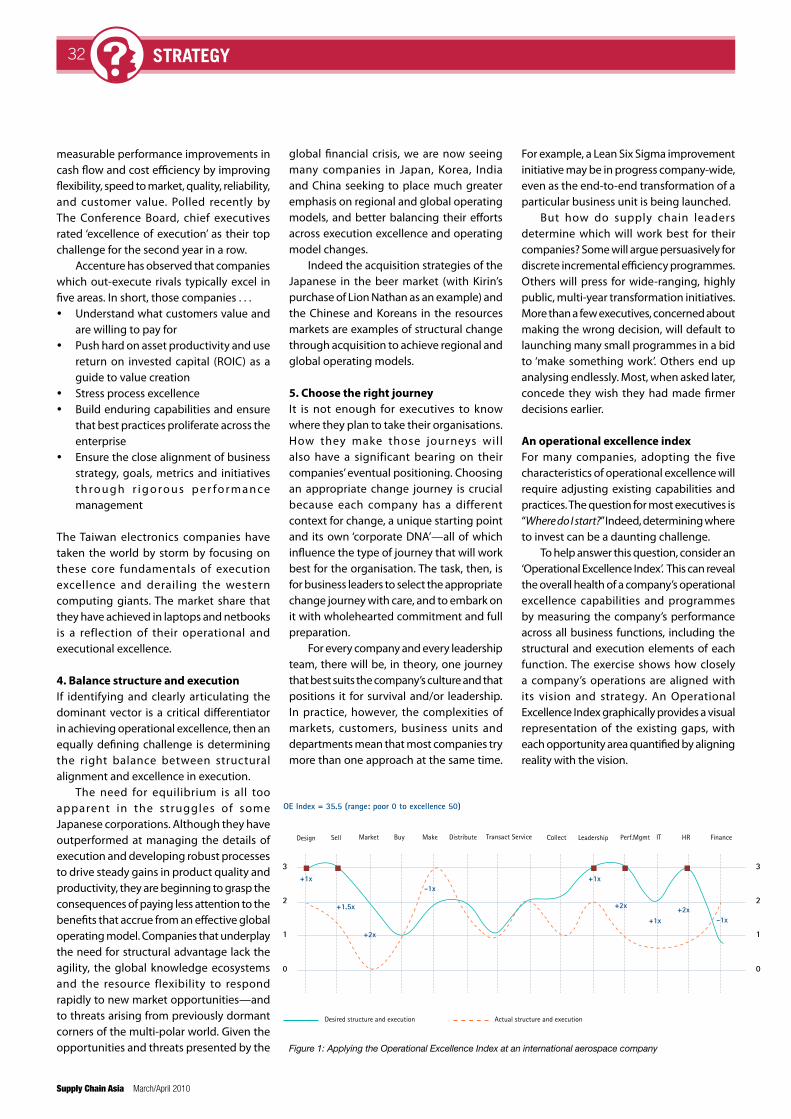
Supply Chain Asia March/April 2010
infrastructure update32 strateGY
measurable performance improvements in cash flow and cost efficiency by improving flexibility, speed to market, quality, reliability, and customer value. Polled recently by The Conference Board, chief executives rated ‘excellence of execution’ as their top challenge for the second year in a row.
Accenture has observed that companies which out-execute rivals typically excel in five areas. In short, those companies . . . Understand what customers value and
are willing to pay for Push hard on asset productivity and use
return on invested capital (ROIC) as a guide to value creation
Stress process excellence Build enduring capabilities and ensure
that best practices proliferate across the enterprise
Ensure the close alignment of business strategy, goals, metrics and initiatives t h ro u g h r i g o ro u s p e r fo r m a n c e management
The Taiwan electronics companies have taken the world by storm by focusing on these core fundamentals of execution excellence and derailing the western computing giants. The market share that they have achieved in laptops and netbooks is a reflection of their operational and executional excellence.
4. Balance structure and executionIf identifying and clearly articulating the dominant vector is a critical differentiator in achieving operational excellence, then an equally defining challenge is determining the right balance between structural alignment and excellence in execution.
The need for equilibrium is all too apparent in the struggles of some Japanese corporations. Although they have outperformed at managing the details of execution and developing robust processes to drive steady gains in product quality and productivity, they are beginning to grasp the consequences of paying less attention to the benefits that accrue from an effective global operating model. Companies that underplay the need for structural advantage lack the agility, the global knowledge ecosystems and the resource flexibility to respond rapidly to new market opportunities—and to threats arising from previously dormant corners of the multi-polar world. Given the opportunities and threats presented by the
For example, a Lean Six Sigma improvement initiative may be in progress company-wide, even as the end-to-end transformation of a particular business unit is being launched.
But how do supply chain leaders determine which will work best for their companies? Some will argue persuasively for discrete incremental efficiency programmes. Others will press for wide-ranging, highly public, multi-year transformation initiatives. More than a few executives, concerned about making the wrong decision, will default to launching many small programmes in a bid to ‘make something work’. Others end up analysing endlessly. Most, when asked later, concede they wish they had made firmer decisions earlier.
An operational excellence indexFor many companies, adopting the five characteristics of operational excellence will require adjusting existing capabilities and practices. The question for most executives is “Where do I start?” Indeed, determining where to invest can be a daunting challenge.
To help answer this question, consider an ‘Operational Excellence Index’. This can reveal the overall health of a company’s operational excellence capabilities and programmes by measuring the company’s performance across all business functions, including the structural and execution elements of each function. The exercise shows how closely a company’s operations are aligned with its vision and strategy. An Operational Excellence Index graphically provides a visual representation of the existing gaps, with each opportunity area quantified by aligning reality with the vision.
global financial crisis, we are now seeing many companies in Japan, Korea, India and China seeking to place much greater emphasis on regional and global operating models, and better balancing their efforts across execution excellence and operating model changes.
Indeed the acquisition strategies of the Japanese in the beer market (with Kirin’s purchase of Lion Nathan as an example) and the Chinese and Koreans in the resources markets are examples of structural change through acquisition to achieve regional and global operating models.
5. Choose the right journeyIt is not enough for executives to know where they plan to take their organisations. How they make those journeys will also have a significant bearing on their companies’ eventual positioning. Choosing an appropriate change journey is crucial because each company has a different context for change, a unique starting point and its own ‘corporate DNA’—all of which influence the type of journey that will work best for the organisation. The task, then, is for business leaders to select the appropriate change journey with care, and to embark on it with wholehearted commitment and full preparation.
For every company and every leadership team, there will be, in theory, one journey that best suits the company’s culture and that positions it for survival and/or leadership. In practice, however, the complexities of markets, customers, business units and departments mean that most companies try more than one approach at the same time.
Figure 1: Applying the Operational Excellence Index at an international aerospace company
10
Figure 4: Results of the Operational Excellence Index at a defense contractor.
Desired structure and execution Actual structure and execution
Design
3+1x +1x
+1x
-1x
-1x
+1.5x
+2x
+2x +2x2
1
0
3
2
1
0
Sell Market Buy Make Distribute Transact Service Collect Leadership Perf.Mgmt IT HR Finance
OE Index = 35.5 (range: poor 0 to excellence 50)
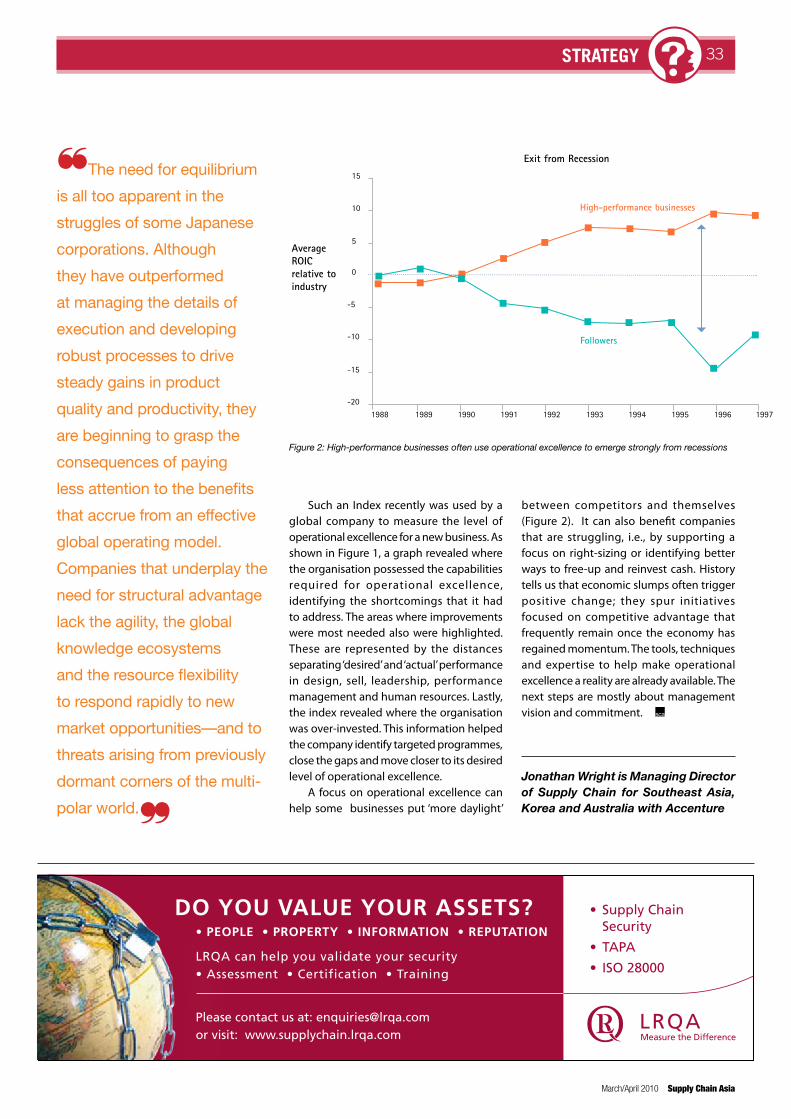
March/April 2010 Supply Chain Asia
infrastructure update 33strateGY
Such an Index recently was used by a global company to measure the level of operational excellence for a new business. As shown in Figure 1, a graph revealed where the organisation possessed the capabilities required for operational excellence, identifying the shortcomings that it had to address. The areas where improvements were most needed also were highlighted. These are represented by the distances separating ‘desired’ and ‘actual’ performance in design, sell, leadership, performance management and human resources. Lastly, the index revealed where the organisation was over-invested. This information helped the company identify targeted programmes, close the gaps and move closer to its desired level of operational excellence.
A focus on operational excellence can help some businesses put ‘more daylight’
Figure 2: High-performance businesses often use operational excellence to emerge strongly from recessions
between competitors and themselves (Figure 2). It can also benefit companies that are struggling, i.e., by supporting a focus on right-sizing or identifying better ways to free-up and reinvest cash. History tells us that economic slumps often trigger positive change; they spur initiatives focused on competitive advantage that frequently remain once the economy has regained momentum. The tools, techniques and expertise to help make operational excellence a reality are already available. The next steps are mostly about management vision and commitment.
Jonathan Wright is Managing Director of Supply Chain for Southeast Asia, Korea and Australia with Accenture
❝The need for equilibrium
is all too apparent in the
struggles of some Japanese
corporations. Although
they have outperformed
at managing the details of
execution and developing
robust processes to drive
steady gains in product
quality and productivity, they
are beginning to grasp the
consequences of paying
less attention to the benefits
that accrue from an effective
global operating model.
Companies that underplay the
need for structural advantage
lack the agility, the global
knowledge ecosystems
and the resource flexibility
to respond rapidly to new
market opportunities—and to
threats arising from previously
dormant corners of the multi-
polar world.❞
Figure 1: High-performance businesses use operational excellence to emerge strongly from recessions.
Exit from Recession
Average ROIC relative to industry
High-performance businesses
Followers
-15
-10
-5
0
5
10
15
-20
1988 1989 1990 1991 1992 1993 1994 1995 1996 1997
DO YOU VALUE YOUR ASSETS?• PEOPLE • PROPERTY • INFORMATION • REPUTATION
LRQA can help you validate your security• Assessment • Certification • Training
• Supply Chain Security
• TAPA
• ISO 28000
Please contact us at: [email protected] or visit: www.supplychain.lrqa.com

34 策略
Supply Chain Asia March/April 2010
Suvir Bhatia 撰文
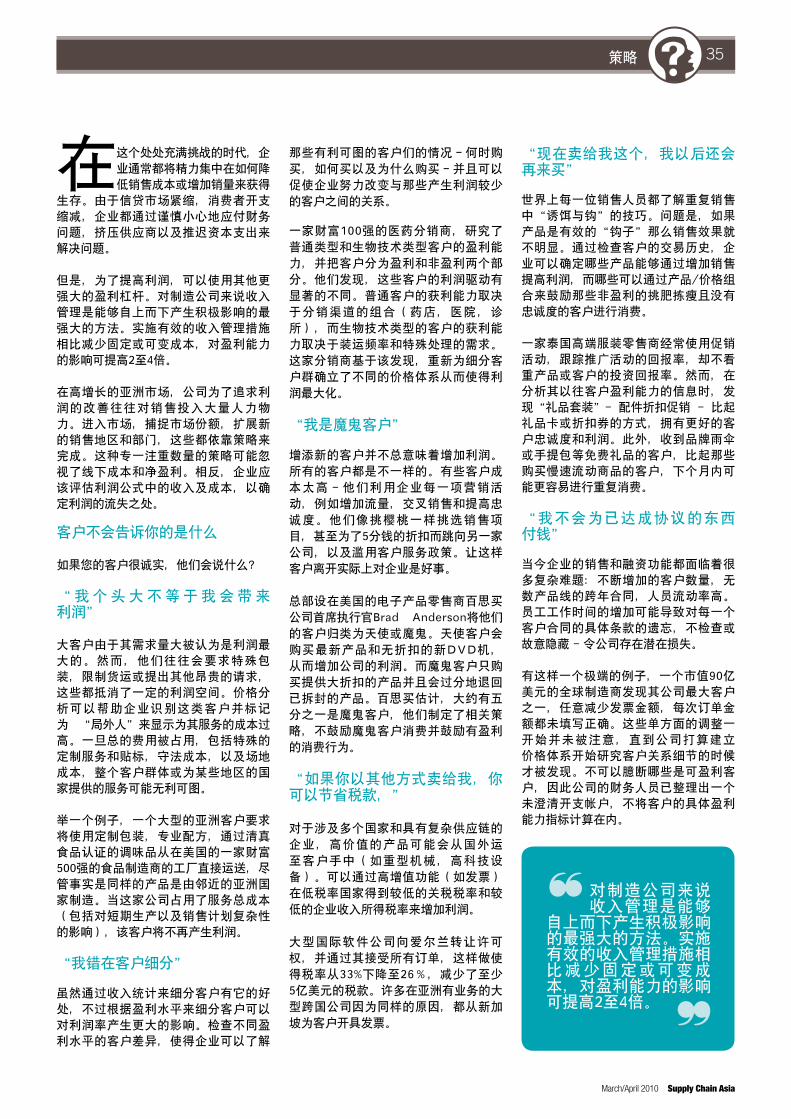
35策略
March/April 2010 Supply Chain Asia
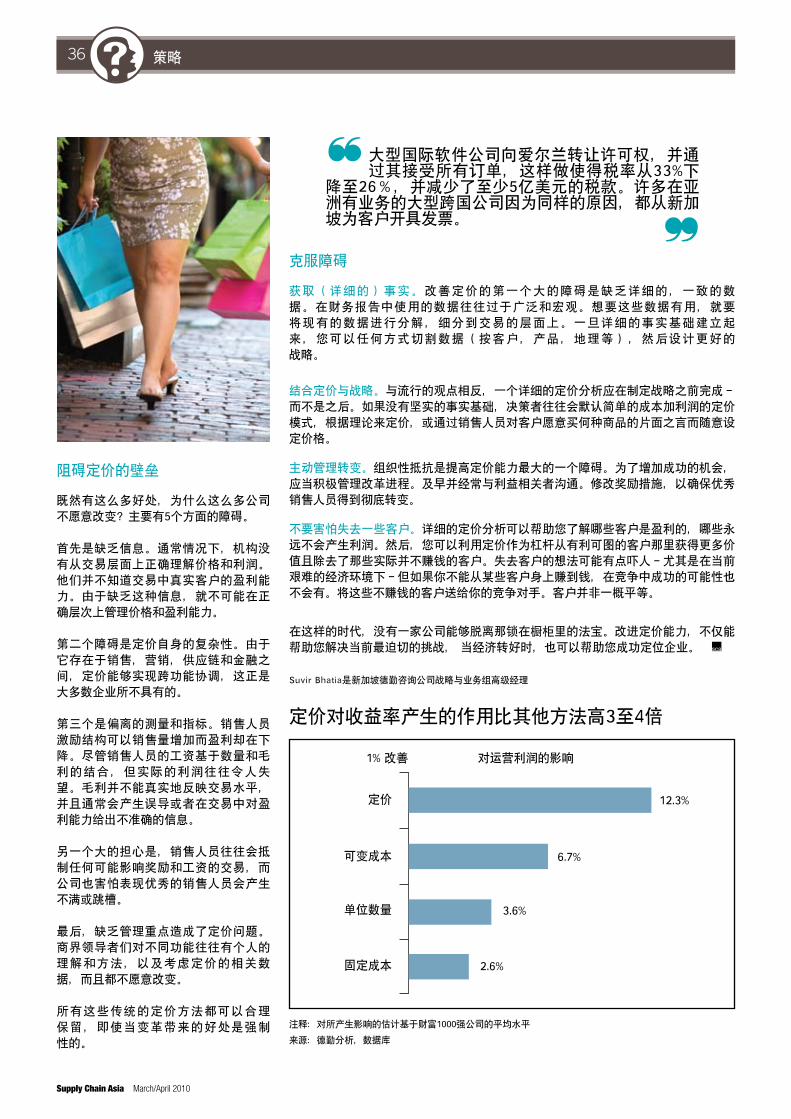
36 策略
Supply Chain Asia March/April 2010
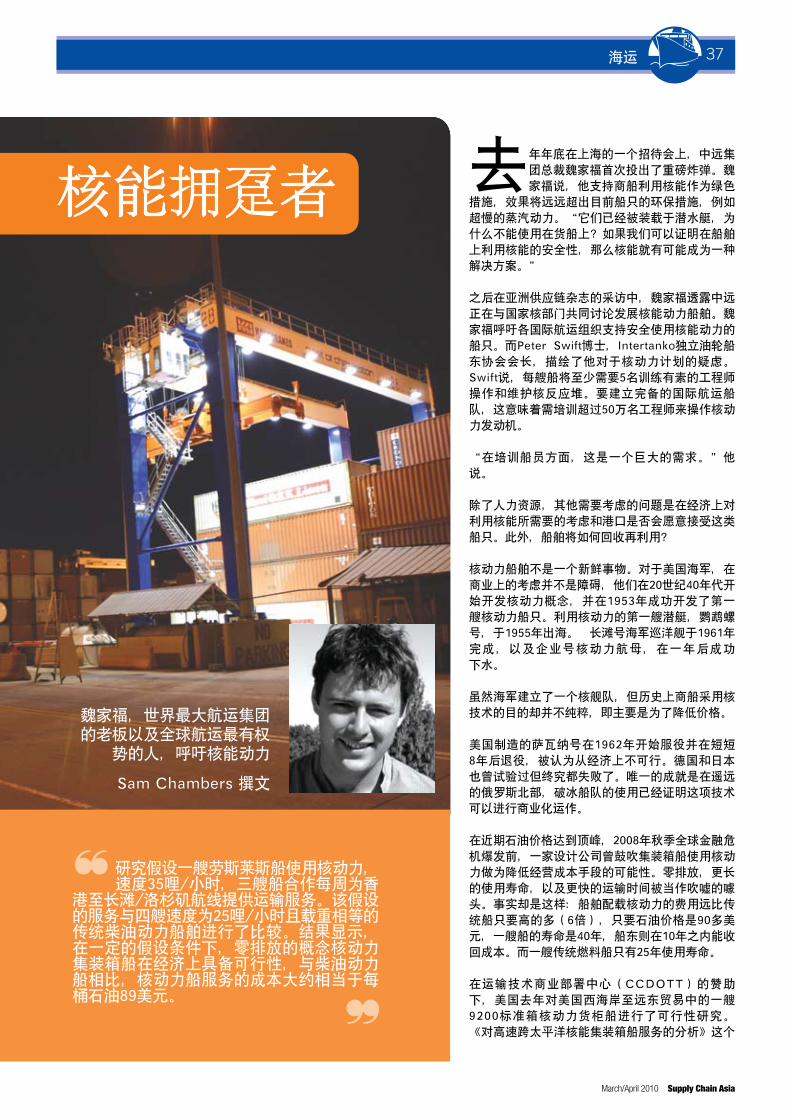
37海运
March/April 2010 Supply Chain Asia
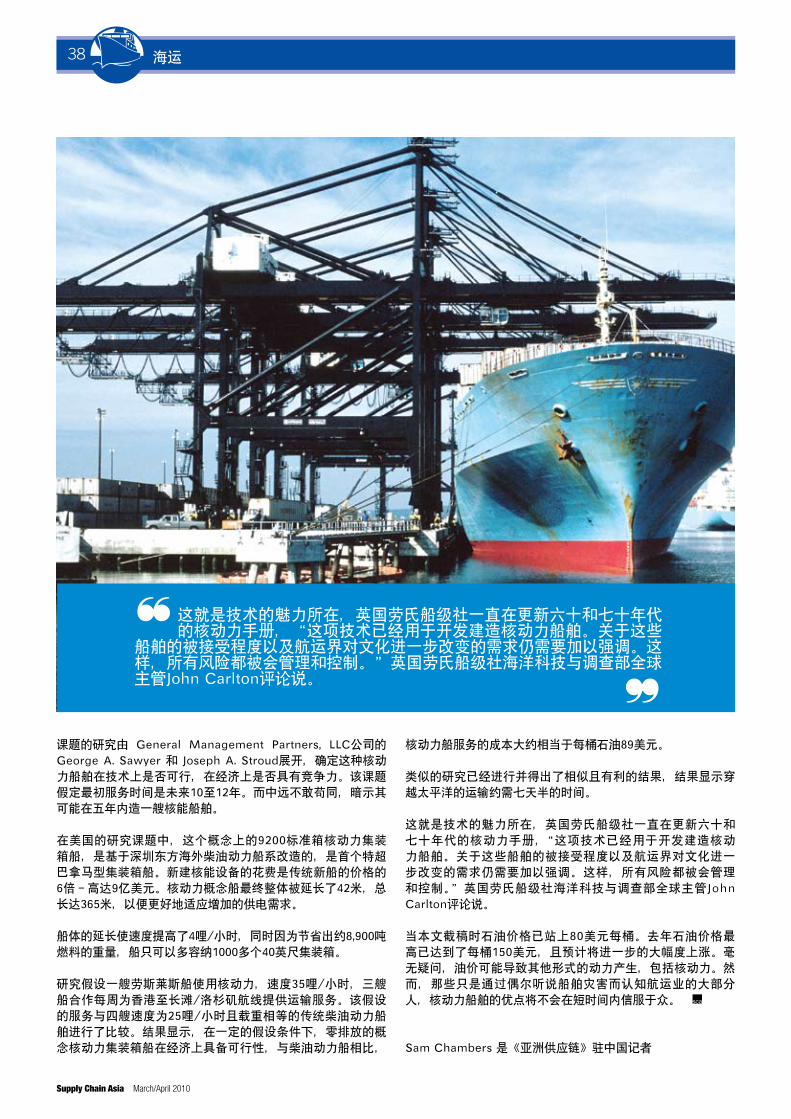
38 海运
Supply Chain Asia March/April 2010

41海关
March/April 2010 Supply Chain Asia
贸 易 商 应 检 查 原 产 地 规 则 (Specific Rules of Origin)以确保它们仍然符合新规定,特别是贸易协议将利用关税的变化作为主要标准来定义原产地。在亚洲这一点极其重要,因为关税的改变在很多协议中被广泛使用。
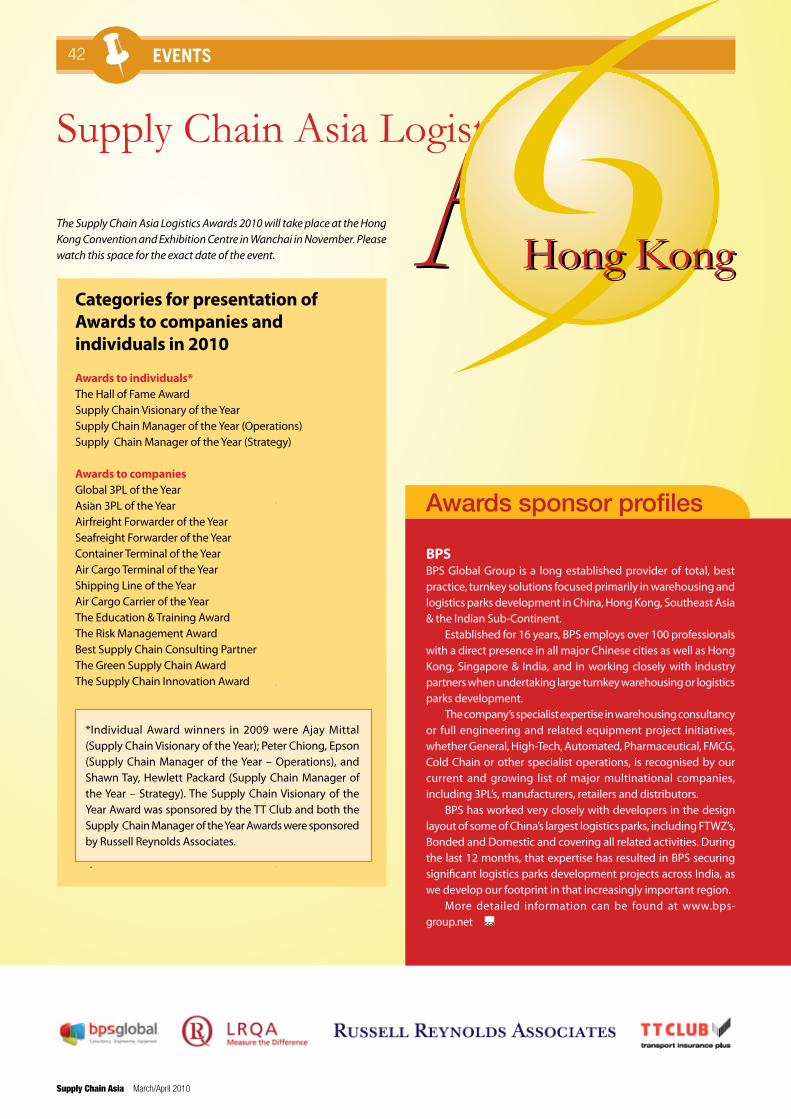
Supply Chain Asia March/April 2010
42 events
Supply Chain Asia March/April 2010
42 events
BPSBPS Global Group is a long established provider of total, best practice, turnkey solutions focused primarily in warehousing and logistics parks development in China, Hong Kong, Southeast Asia & the Indian Sub-Continent.
Established for 16 years, BPS employs over 100 professionals with a direct presence in all major Chinese cities as well as Hong Kong, Singapore & India, and in working closely with industry partners when undertaking large turnkey warehousing or logistics parks development.
The company’s specialist expertise in warehousing consultancy or full engineering and related equipment project initiatives, whether General, High-Tech, Automated, Pharmaceutical, FMCG, Cold Chain or other specialist operations, is recognised by our current and growing list of major multinational companies, including 3PL’s, manufacturers, retailers and distributors.
BPS has worked very closely with developers in the design layout of some of China’s largest logistics parks, including FTWZ’s, Bonded and Domestic and covering all related activities. During the last 12 months, that expertise has resulted in BPS securing significant logistics parks development projects across India, as we develop our footprint in that increasingly important region.
More detailed information can be found at www.bps- group.net
Awards sponsor profiles
wards wards Supply Chain Asia Logistics
*Individual Award winners in 2009 were Ajay Mittal (Supply Chain Visionary of the Year); Peter Chiong, Epson (Supply Chain Manager of the Year – Operations), and Shawn Tay, Hewlett Packard (Supply Chain Manager of the Year – Strategy). The Supply Chain Visionary of the Year Award was sponsored by the TT Club and both the Supply Chain Manager of the Year Awards were sponsored by Russell Reynolds Associates.
The Supply Chain Asia Logistics Awards 2010 will take place at the Hong Kong Convention and Exhibition Centre in Wanchai in November. Please watch this space for the exact date of the event.
Categories for presentation of Awards to companies and individuals in 2010
Awards to individuals* The Hall of Fame Award Supply Chain Visionary of the YearSupply Chain Manager of the Year (Operations)Supply Chain Manager of the Year (Strategy)
Awards to companies Global 3PL of the YearAsian 3PL of the YearAirfreight Forwarder of the YearSeafreight Forwarder of the YearContainer Terminal of the YearAir Cargo Terminal of the YearShipping Line of the YearAir Cargo Carrier of the YearThe Education & Training AwardThe Risk Management AwardBest Supply Chain Consulting PartnerThe Green Supply Chain AwardThe Supply Chain Innovation Award
Hong KongHong Kong

March/April 2010 Supply Chain Asia
events 43
The TT ClubThe TT Club is the international transport and logistics industry’s leading provider of insurance and related risk management services.
Established in 1968, as a mutual association, the TT Club specialises in the insurance of liabilities and equipment for multi-modal operators. Customers range from some of the world’s largest shipping lines, busiest ports, biggest freight forwarders and cargo handling terminals, to companies operating a handful of vehicles. With so many different categories of customer around the world, the TT Club has learned to work closely with brokers to tailor insurance packages that meet individual needs.
Having developed in step with the multi-modal industry, the TT Club is recognised as an independent industry forum, liaising with national and international trade and government associations, including FIATA, IAPH and ICHCA.
Since its inception, the TT Club has grown steadily in terms of premium income, at an average rate of 10% per annum for the last 20 years. Customer loyalty has been an essential factor in this growth. Indeed, more than 90% of Members stay with the TT Club at renewal each year.
Russell Reynolds Associates Leadership –– In today’s ever-changing global business environment, success is driven by the talent, vision and leadership capabilities of senior executives.
Russell Reynolds Associates is a leading global executive search and assessment firm with more than 300 consultants based in 39 offices worldwide. Its consultants conduct senior-level search and assessment assignments in a range of sectors for public and private organisations of all sizes.
With its deep knowledge of major industries and the specific business challenges of its clients, and a complete understanding of who and what makes an effective leader, Russell Reynolds Associates ensures the best leadership teams for the ongoing success of their clients’ businesses.
Russell Reynolds Associates is highly regarded as the executive search leader for its capabilities in Supply Chain Management leadership and talent management. It has worked with numerous organisations across the globe in the appointment of their client supply chain leaders and the building of their wider supply chain teams.
For more information, please visit: www.russellreynolds.com, or liaise with Peter L. O’Brien ([email protected]), Head of Asia Pacific Distribution & Supply Chain Practice.
LRQALRQA is a member of the Lloyd’s Register Group. We are an independent leading provider of Business Assurance services including assurance, validation, certification, verification and training. LRQA helps you identify and manage security risks across your supply chain to improve its reliability and integrity.
As a global organisation we speak the local language and understand security and risk issues at the local level; including threats to supply and distribution chains as well as the needs of national cultures. With the support of our staff in more than 120 offices worldwide LRQA can truly offer global services. We bring deep insight into the complex world of modern supply chain security and risk management. For more than 20 years, we have been working with the world’s top brands.
At LRQA, we:• helpyoutoevaluateandassesssecurityandrisks;• certifythecomplianceofyoursecuritymanagementsystem
against the appropriate international standard/s (ISO:28000, ISO:27001);
• havethecapacityofcontributingtothebusinessobjectives,across industry, because of our knowledge of risk management Standards (ISO 31000 and Guide 73);
• verify thecomplianceofyour facilitiesand logisticsacrossyour supply chain against the appropriate regulatory/non-governmental schemes (TAPA, ISPS, AEO, C-TPAT).
Our experts are regularly part of technical committees developing new and improving existing standards. We also have had a prominent leadership role in the development of global standards in security, risk and regulatory requirements.
The Lloyd’s Register Group provides independent assurance to companies operating high-risk capital-intensive assets to enhance the safety of life, property, and the environment, so helping its clients ensure safe, responsible, and sustainable operations.
The Lloyd’s Register Group has played a major part in the development of the international standard for supply chain security (ISO:28000). LRQA was the first certification body to issue a certificate against this standard.
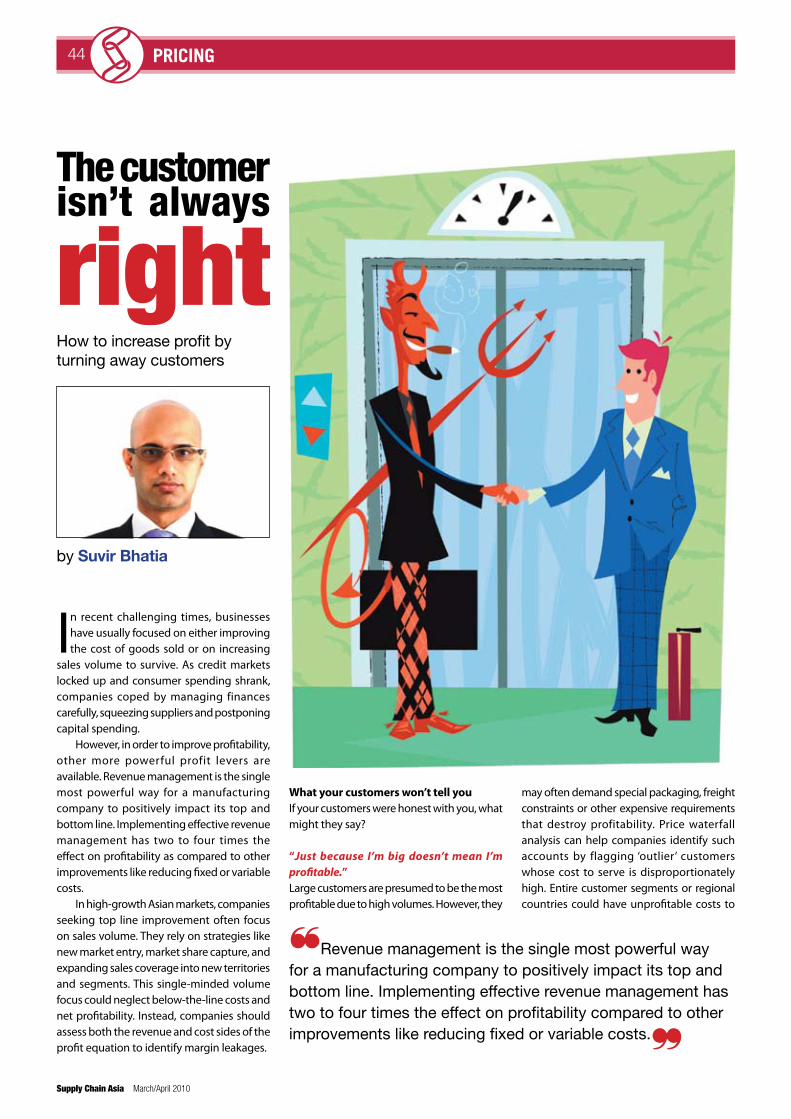
Supply Chain Asia March/April 2010
infrastructure update44 pricing
The customer isn’t always
rightHow to increase profit by turning away customers
In recent challenging times, businesses have usually focused on either improving the cost of goods sold or on increasing
sales volume to survive. As credit markets locked up and consumer spending shrank, companies coped by managing finances carefully, squeezing suppliers and postponing capital spending.
However, in order to improve profitability, other more powerful profit levers are available. Revenue management is the single most powerful way for a manufacturing company to positively impact its top and bottom line. Implementing effective revenue management has two to four times the effect on profitability as compared to other improvements like reducing fixed or variable costs.
In high-growth Asian markets, companies seeking top line improvement often focus on sales volume. They rely on strategies like new market entry, market share capture, and expanding sales coverage into new territories and segments. This single-minded volume focus could neglect below-the-line costs and net profitability. Instead, companies should assess both the revenue and cost sides of the profit equation to identify margin leakages.
What your customers won’t tell youIf your customers were honest with you, what might they say?
“Just because I’m big doesn’t mean I’m profitable.”Large customers are presumed to be the most profitable due to high volumes. However, they
may often demand special packaging, freight constraints or other expensive requirements that destroy profitability. Price waterfall analysis can help companies identify such accounts by flagging ‘outlier’ customers whose cost to serve is disproportionately high. Entire customer segments or regional countries could have unprofitable costs to
❝Revenue management is the single most powerful way for a manufacturing company to positively impact its top and bottom line. Implementing effective revenue management has two to four times the effect on profitability compared to other improvements like reducing fixed or variable costs.❞
by Suvir Bhatia
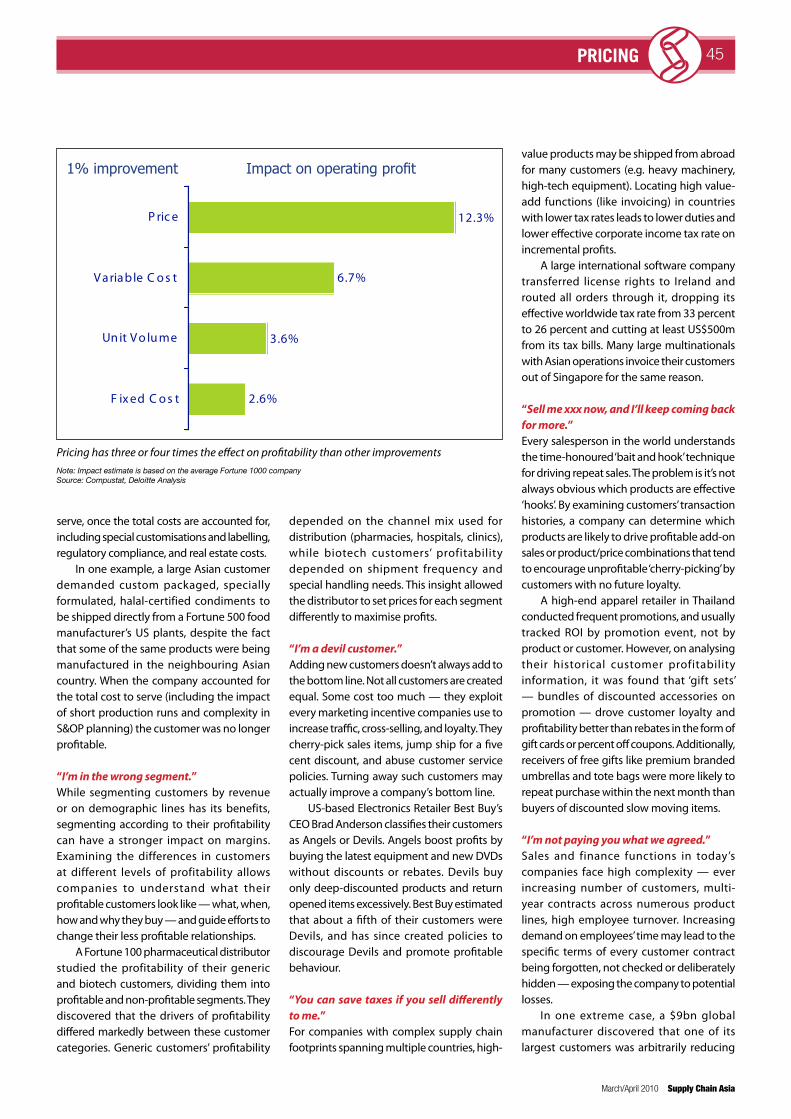
March/April 2010 Supply Chain Asia
infrastructure update 45pricing
serve, once the total costs are accounted for, including special customisations and labelling, regulatory compliance, and real estate costs.
In one example, a large Asian customer demanded custom packaged, specially formulated, halal-certified condiments to be shipped directly from a Fortune 500 food manufacturer’s US plants, despite the fact that some of the same products were being manufactured in the neighbouring Asian country. When the company accounted for the total cost to serve (including the impact of short production runs and complexity in S&OP planning) the customer was no longer profitable.
“I’m in the wrong segment.”While segmenting customers by revenue or on demographic lines has its benefits, segmenting according to their profitability can have a stronger impact on margins. Examining the differences in customers at different levels of profitability allows companies to understand what their profitable customers look like — what, when, how and why they buy — and guide efforts to change their less profitable relationships.
A Fortune 100 pharmaceutical distributor studied the profitability of their generic and biotech customers, dividing them into profitable and non-profitable segments. They discovered that the drivers of profitability differed markedly between these customer categories. Generic customers’ profitability
depended on the channel mix used for distribution (pharmacies, hospitals, clinics), while biotech customers’ profitability depended on shipment frequency and special handling needs. This insight allowed the distributor to set prices for each segment differently to maximise profits.
“I’m a devil customer.”Adding new customers doesn’t always add to the bottom line. Not all customers are created equal. Some cost too much — they exploit every marketing incentive companies use to increase traffic, cross-selling, and loyalty. They cherry-pick sales items, jump ship for a five cent discount, and abuse customer service policies. Turning away such customers may actually improve a company’s bottom line.
US-based Electronics Retailer Best Buy’s CEO Brad Anderson classifies their customers as Angels or Devils. Angels boost profits by buying the latest equipment and new DVDs without discounts or rebates. Devils buy only deep-discounted products and return opened items excessively. Best Buy estimated that about a fifth of their customers were Devils, and has since created policies to discourage Devils and promote profitable behaviour.
“You can save taxes if you sell differently to me.”For companies with complex supply chain footprints spanning multiple countries, high-
value products may be shipped from abroad for many customers (e.g. heavy machinery, high-tech equipment). Locating high value-add functions (like invoicing) in countries with lower tax rates leads to lower duties and lower effective corporate income tax rate on incremental profits.
A large international software company transferred license rights to Ireland and routed all orders through it, dropping its effective worldwide tax rate from 33 percent to 26 percent and cutting at least US$500m from its tax bills. Many large multinationals with Asian operations invoice their customers out of Singapore for the same reason.
“Sell me xxx now, and I’ll keep coming back for more.”Every salesperson in the world understands the time-honoured ‘bait and hook’ technique for driving repeat sales. The problem is it’s not always obvious which products are effective ‘hooks’. By examining customers’ transaction histories, a company can determine which products are likely to drive profitable add-on sales or product/price combinations that tend to encourage unprofitable ‘cherry-picking’ by customers with no future loyalty.
A high-end apparel retailer in Thailand conducted frequent promotions, and usually tracked ROI by promotion event, not by product or customer. However, on analysing their historical customer profitability information, it was found that ‘gift sets’ — bundles of discounted accessories on promotion — drove customer loyalty and profitability better than rebates in the form of gift cards or percent off coupons. Additionally, receivers of free gifts like premium branded umbrellas and tote bags were more likely to repeat purchase within the next month than buyers of discounted slow moving items.
“I’m not paying you what we agreed.”Sales and finance functions in today’s companies face high complexity — ever increasing number of customers, multi-year contracts across numerous product lines, high employee turnover. Increasing demand on employees’ time may lead to the specific terms of every customer contract being forgotten, not checked or deliberately hidden — exposing the company to potential losses.
In one extreme case, a $9bn global manufacturer discovered that one of its largest customers was arbitrarily reducing
2.6%
3.6%
6.7%
12.3%
F ix ed C o s t
Un it V o lu me
V ariable C o s t
P ric e
1% Improvement Impact on Operating Prof it
Note: Impact estimate is based on the average Fortune 1000 companySource: Compustat, Deloitte Analysis
Pricing has 3-4 times the effect on profitability than other improvements
Pricing has three or four times the effect on profitability than other improvementsNote: Impact estimate is based on the average Fortune 1000 companySource: Compustat, Deloitte Analysis
1% improvement Impact on operating profit

Supply Chain Asia March/April 2010
infrastructure update46 pricing
the invoice amount every time orders were not filled 100 percent correctly. These unilateral adjustments had gone unnoticed until the company delved into the details of the relationship to build a price waterfall. Not wanting to make waves with what was assumed to be its most profitable customer, the company’s accounts payable staff had been crediting the difference to an ‘outstanding clarifications’ expense account that was not included in the calculation of the customer’s specific profitability metrics.
Barriers to better pricing performanceGiven the benefits, why are so many companies reluctant to change? There are five major barriers to better pricing performance.
The first is lack of information. Typically, organisations do not have an accurate understanding of what happens to price and
profitability at the transaction level. They are unaware of actual customer profitability by transaction. Due to this lack of information, it is impossible to manage price and profitability at that level.
The second driver is the complex nature of pricing itself. Because it exists in the intersection between sales, marketing, supply chain and finance, pricing demands a level of cross-functional coordination that is absent in most organisations today.
The third driver is misaligned measurement and metrics. Incentive structures for the field sales force can drive profitability down even while growing volume. Even when sales force compensation is based on a mix of volume and gross margin, the actual margin performance is often disappointing. Gross margin is a poor substitute for transaction-level insight and can often give misleading or inaccurate information on the profitability of a specific transaction.
Another big fear is that the sales force will push back. Sales people tend to resist anything that might affect their incentives and compensation, and companies worry the best performers might mutiny or jump ship.
Finally, lack of management focus contributes to the pricing problem. Business leaders in different functions often have their own personal philosophies, methods, and data for thinking about pricing, and are reluctant to change.
All of these forces can conspire to preserve the traditional approach to pricing, even when the benefits of change are compelling.
Overcoming the barriersGet the (detailed) facts. One of the first big barriers to improved pricing is lack of detailed, consistent data. The numbers used for financial reporting tend to be overly broad and inclusive. To be useful, existing data must be disaggregated down to the transaction level. Once this detailed fact base has been established, you can slice and dice the data any way you want (by customer, product, geography, etc.), and design better strategies.
Align pricing with strategy. Contrary to popular opinion, a detailed pricing analysis should be done before setting strategy — not after. Without a solid fact base, decision makers tend to default back to simplistic cost-plus pricing models, theoretical pricing, or haphazardly set prices based on anecdote and conjecture from the sales force about what customers are willing to pay.
❝A Fortune 100 pharmaceutical distributor studied the profitability of its generic and biotech customers, dividing them into profitable and non-profitable segments. They discovered that the drivers of profitability differed markedly between these customer categories. Generic customers’ profitability depended on the channel mix used for distribution (pharmacies, hospitals, clinics), while biotech customers’ profitability depended on shipment frequency and special handling needs. This insight allowed the distributor to set prices for each segment differently to maximise profits.❞
Actively manage change. Organisational resistance is the single biggest obstacle to improved pricing capabilities. To increase the chances for success, actively manage the change process. Get stakeholders involved early and often. Modify incentives to make sure top sales people don’t get short-changed.
Don’t be afraid to lose a few customers. A detailed pricing analysis can help you understand which customers are profitable, and which ones never will be. You can then use pricing as a lever to capture more value from your most profitable customers and weed out the deadbeats. The idea of losing customers might be a little scary — especially in this tough economy — but if you can’t make money on certain customers, odds are the competition can’t either. Send your competitors these bad customers. Not all volume is created equal.
In times like these, no company can afford to leave its most powerful weapon locked in the closet. Improved pricing capabilities not only helps you tackle today’s most pressing challenges, they can help you position your business for success when the economy bounces back.
Suvir Bhatia is based in Singapore where he is Senior Manager of the Strategy and Operations Group of Deloitte Consulting
❝A large international software company transferred license rights to Ireland and routed all orders through it, dropping its effective worldwide tax rate from 33 percent to 26 percent and cutting at least US$500m from its tax bills. Many large multinationals with Asian operations invoice their customers out of Singapore for the same reason.❞
About Supply Chain Asia
Supply Chain Asia is a community dedicated to bring supply chain and logistics profes-sionals in Asia together. Our vision is to create platforms whereby members of the community can come together to network, share and learn from one another. Our focus is to enable the development of collabora-tive relationships and partnerships. Our mission is to make Supply Chain Asia your community of choice.
Connect. Communicate. Collaborate.
Our point of differentiation is really our style of organizing the conference.
√ No corporate marketing on main platform – our panelist of industry experts are specially invited to share their thoughts and opinion and we do not sell speaking slots
√ Background and introduction presented be-fore Forum, allowing speakers and modera-tors to focus on issues and challenges – not definitions and general contents regurgita-tion
The Forum theme for 2010 is “Supply Chain Revo-lutions: Asia Rising!” This theme explores the way supply chains in Asia have been changing over the last few decades and are expected to lead changes in global supply chain evolutions (or revolutions) by playing lead and critical roles in areas of sourc-ing, procurement, infrastructure development, technology innovations and humanitarian sup-port. FOUR core areas of discussions include:
• Supply Chain Revolutions: Asia Rising - A key-note Panelists discussion on their views of developments for Supply Chain and Logistics in Asia
• Sourcing and Manufacturing Challenges: Changing of the Power Base
• Supply Chain Leadership in Asia – Bridging the Gap
• Sustainability Supply Chain – Challenges & Opportunities in Going Green
Supply Chain Asia Forum 201024-27 August 2010
Grand Copthorne Waterfront Hotel, Singapore
Supply Chain RevolutionsAsia Raising!Supply Chain Asia Forum provides a platform that is conducive for NETWORKING and LEARNING
√ Quality Speakers
√ Macro-economic topics covering latest trends and developments
√ No-holds barred discussion and debate
For registration, please visit
www.supplychainasia.com/forum/registration

Customs Q&A with Catherine Truel
International Trade
Instrument director
and Supply Chain
Asia Magazine
correspondent,
Catherine Truel
answers your
queries on customs
practice and
regulation. Here
she looks at how
new updates to the
WCO’s Harmonized
System goods
classification code
will affect traders
in foods and
chemicals
❝It is likely that the entire food supply chain from commodities to finished goods will need a due diligence
exercise to ensure compliance as well as identify new risks and opportunities.❞
What is HS2012 and why are tariff codes being updated? The Harmonized System (HS) is a six digit international coding system used by 137 countries to classify goods. Tariff codes need to be updated regularly to reflect changes in global trade. The HS is maintained by The World Customs Organization (WCO) and is reviewed every five to six years by the Harmonized System Committee. The current version, the HS2007, was implemented on January 1, 2007.
In June 2009, the committee issued its fifth recommendation that will enter into force on January 1, 2012. HS2012 has two new purposes. It becomes the new standard for classifying goods of specific importance to food security under the United Nations food security programme. It will also identify chemicals and pesticides controlled under the Rotterdam Convention and ozone depleting substances controlled under the Montreal Protocol.
All chapters are affected by the 221 sets of amendments, but the most significant changes will hit the chemical sector and the food industry.
In practice, how will HS2012 affect traders?Traders will have to adapt their systems and process in the areas of:
Classification Some HS codes are removed while others are being added so traders will need to review and adjust their classification. Tariff codes are harmonised to the first six digits but countries can, and usually do, add further digits to suit their national specificities. The changes at the international six digits level will therefore create a cascade of further changes at the sub-levels.
For the chemical sector, amendments include the deletion of subheadings 2903.4 to 2903.69 which are replaced by new codes.
The food industry will see profound changes, particularly chapter 3 ‘Fish and crustaceous’, but also in chapters 1, 2, 8, 9, 12, 16 and 17; all of which are undergoing numerous substitutions.
Duty rates Some products might be reclassified under an HS code carrying a higher or lower duty rate than the initial tariff position. This is of particular importance for both the chemical and food industry where duty rates can be relatively high for some products.
Implementation Although most countries will implement on January 1, 2012, there might be some differences in implementation timescale between countries. Traders will need to have access to both versions of the HS for products they trade.
Trade Agreements Countries will negotiate the conversion of FTA’s based on the HS2007 into the new HS2012. Traders will have to review the Specific Rules of Origin to ensure they are still compliant, especially for trade agreements using the change of tariff as the main criteria to determine origin. This is particularly important in Asia where tariff shift is widely used in many agreements.
Supply Chain In the food industry, products affected are often both finished goods and intermediary products entering in the composition of other foodstuffs. It is likely that the entire food supply chain from commodities to finished goods will need a due diligence exercise to ensure compliance as well as identify new risks and opportunities.
Companies, particularly those in the chemicals sector or food industry with large bill of material or ingredients can start consulting the WCO amendments (http://www.wcoomd.org/files/1.%20Public%20files/PDFandDocuments/HarmonizedSystem/HS2012_SH2012.pdf ) to scope the level of change for their industry, their own organisation, their suppliers and the entire supply chain.
In the meantime, the WCO is working on producing explanatory notes and a correlation table between HS2007 and HS2012.
Please email your customs queries to the Editor
48 CUSTOMS
Supply Chain Asia March/April 2010
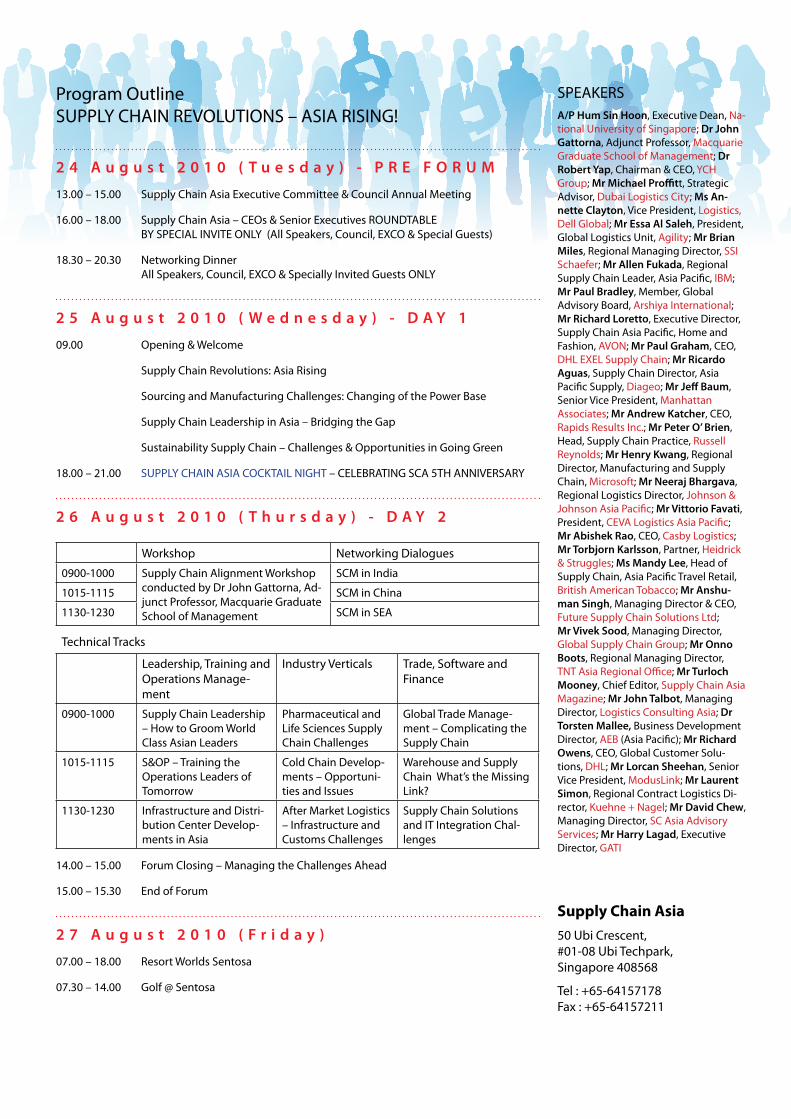
Supply Chain Asia50 Ubi Crescent,#01-08 Ubi Techpark,Singapore 408568
Tel : +65-64157178 Fax : +65-64157211
2 4 A u g u s t 2 0 1 0 ( T u e s d a y ) - P R E F O R U M
13.00 – 15.00 Supply Chain Asia Executive Committee & Council Annual Meeting
16.00 – 18.00 Supply Chain Asia – CEOs & Senior Executives ROUNDTABLE BY SPECIAL INVITE ONLY (All Speakers, Council, EXCO & Special Guests)
18.30 – 20.30 Networking Dinner All Speakers, Council, EXCO & Specially Invited Guests ONLY
2 5 A u g u s t 2 0 1 0 ( W e d n e s d a y ) - D A Y 1
09.00 Opening & Welcome
Supply Chain Revolutions: Asia Rising
Sourcing and Manufacturing Challenges: Changing of the Power Base
Supply Chain Leadership in Asia – Bridging the Gap
Sustainability Supply Chain – Challenges & Opportunities in Going Green
18.00 – 21.00 SUPPLY CHAIN ASIA COCKTAIL NIGHT – CELEBRATING SCA 5TH ANNIVERSARY
2 6 A u g u s t 2 0 1 0 ( T h u r s d a y ) - D A Y 2
Workshop Networking Dialogues
0900-1000 Supply Chain Alignment Workshop conducted by Dr John Gattorna, Ad-junct Professor, Macquarie Graduate School of Management
SCM in India
1015-1115 SCM in China
1130-1230 SCM in SEA
Technical Tracks
Leadership, Training and Operations Manage-ment
Industry Verticals Trade, Software and Finance
0900-1000 Supply Chain Leadership – How to Groom World Class Asian Leaders
Pharmaceutical and Life Sciences Supply Chain Challenges
Global Trade Manage-ment – Complicating the Supply Chain
1015-1115 S&OP – Training the Operations Leaders of Tomorrow
Cold Chain Develop-ments – Opportuni-ties and Issues
Warehouse and Supply Chain What’s the Missing Link?
1130-1230 Infrastructure and Distri-bution Center Develop-ments in Asia
After Market Logistics – Infrastructure and Customs Challenges
Supply Chain Solutions and IT Integration Chal-lenges
14.00 – 15.00 Forum Closing – Managing the Challenges Ahead
15.00 – 15.30 End of Forum
2 7 A u g u s t 2 0 1 0 ( F r i d a y )
07.00 – 18.00 Resort Worlds Sentosa
07.30 – 14.00 Golf @ Sentosa
Program OutlineSUPPLY CHAIN REVOLUTIONS – ASIA RISING!
SPEAKERSA/P Hum Sin Hoon, Executive Dean, Na-tional University of Singapore; Dr John Gattorna, Adjunct Professor, Macquarie Graduate School of Management; Dr Robert Yap, Chairman & CEO, YCH Group; Mr Michael Proffitt, Strategic Advisor, Dubai Logistics City; Ms An-nette Clayton, Vice President, Logistics, Dell Global; Mr Essa Al Saleh, President, Global Logistics Unit, Agility; Mr Brian Miles, Regional Managing Director, SSI Schaefer; Mr Allen Fukada, Regional Supply Chain Leader, Asia Pacific, IBM; Mr Paul Bradley, Member, Global Advisory Board, Arshiya International; Mr Richard Loretto, Executive Director, Supply Chain Asia Pacific, Home and Fashion, AVON; Mr Paul Graham, CEO, DHL EXEL Supply Chain; Mr Ricardo Aguas, Supply Chain Director, Asia Pacific Supply, Diageo; Mr Jeff Baum, Senior Vice President, Manhattan Associates; Mr Andrew Katcher, CEO, Rapids Results Inc.; Mr Peter O’ Brien, Head, Supply Chain Practice, Russell Reynolds; Mr Henry Kwang, Regional Director, Manufacturing and Supply Chain, Microsoft; Mr Neeraj Bhargava, Regional Logistics Director, Johnson & Johnson Asia Pacific; Mr Vittorio Favati, President, CEVA Logistics Asia Pacific; Mr Abishek Rao, CEO, Casby Logistics; Mr Torbjorn Karlsson, Partner, Heidrick & Struggles; Ms Mandy Lee, Head of Supply Chain, Asia Pacific Travel Retail, British American Tobacco; Mr Anshu-man Singh, Managing Director & CEO, Future Supply Chain Solutions Ltd; Mr Vivek Sood, Managing Director, Global Supply Chain Group; Mr Onno Boots, Regional Managing Director, TNT Asia Regional Office; Mr Turloch Mooney, Chief Editor, Supply Chain Asia Magazine; Mr John Talbot, Managing Director, Logistics Consulting Asia; Dr Torsten Mallee, Business Development Director, AEB (Asia Pacific); Mr Richard Owens, CEO, Global Customer Solu-tions, DHL; Mr Lorcan Sheehan, Senior Vice President, ModusLink; Mr Laurent Simon, Regional Contract Logistics Di-rector, Kuehne + Nagel; Mr David Chew, Managing Director, SC Asia Advisory Services; Mr Harry Lagad, Executive Director, GATI

Supply Chain Asia March/April 2010
50 people
Deepavali is one of the most important festivals of India. As Chinese New Year
is to China and most of Southeast Asia, so is Deepavali to India and Indians. It was almost midnight on the eve of Deepavali and my MD and I were still sitting patiently at the new offices of India’s largest corporate, Reliance. I had been told numerous times during the preceding months about how one should expect the process of decision-making to be much
slower in India, and how patient and thick-skinned one needed to be to succeed in winning business. My thoughts wandered far away to Malaysia, where the family was stationed, and being Deepavali, I wanted to be back there with them. Fingers crossed, we waited patiently for the letter of intent.
It wasn’t any normal letter of intent. It was the most important one in the history of TNT Asia and India. For the past six months, we had been working ceaselessly to secure the business that would make TNT the key supply chain partner for the development and implementation of a complete end-to-end fulfilment model for mobile phones. Given that at that time TNT had no prior experience in the consumer goods
sector in India, or experience of interfacing directly with consumers here, this would be quite a challenge.
It was well past midnight when we were handed a small note that gave us what we called TNT’s contract of the year. We had been selected to roll out the entire mobile phone supply chain. The only challenge — we had to do that in just 45 days. I knew we would need all of Deepavali’s support on this one.
An emerging giant Those who did not know India in 2002 might not realise the extent of our challenge, particularly when I happened to be the only member of the TNT team that had any idea about mobile phone supply chains. At that time TNT India was purely focused on express, and we had no bench strength in logistics.
At the time of winning the contract, India was just emerging onto the world stage. There were few international mobile phone operators and they ran services only in a select number of cities. The cost of a phone was horribly expensive, but much more expensive was the cost of a phone call. Calls cost Rs16 per minute (US$0.50) each way, incoming and outgoing. Few could afford it, and those who could did it in moderation.
At the time, there were fewer than 10m phones in India, a drop in the ocean in a country of more than a billion people. Then along came Dhirubhai Ambani, the founder of Reliance, the largest company in Indian corporate history. Ambani set a new vision for his sons and the leadership of Reliance: make phone calls as cheap and affordable as a postcard and let mobile phones ring throughout the country, from the largest cities to the smallest villages.
The leadership team went to task. Reliance had no history of experience in mobile phones. Top consultants and more than 1000 expat experts from all over the world were engaged to deliver the vision. Dhirubhai Ambani, sadly, passed away before the launch of
By Harry Lagad
Vision into reality – how Reliance leadership brought affordable mobile telecommunications to India’s masses
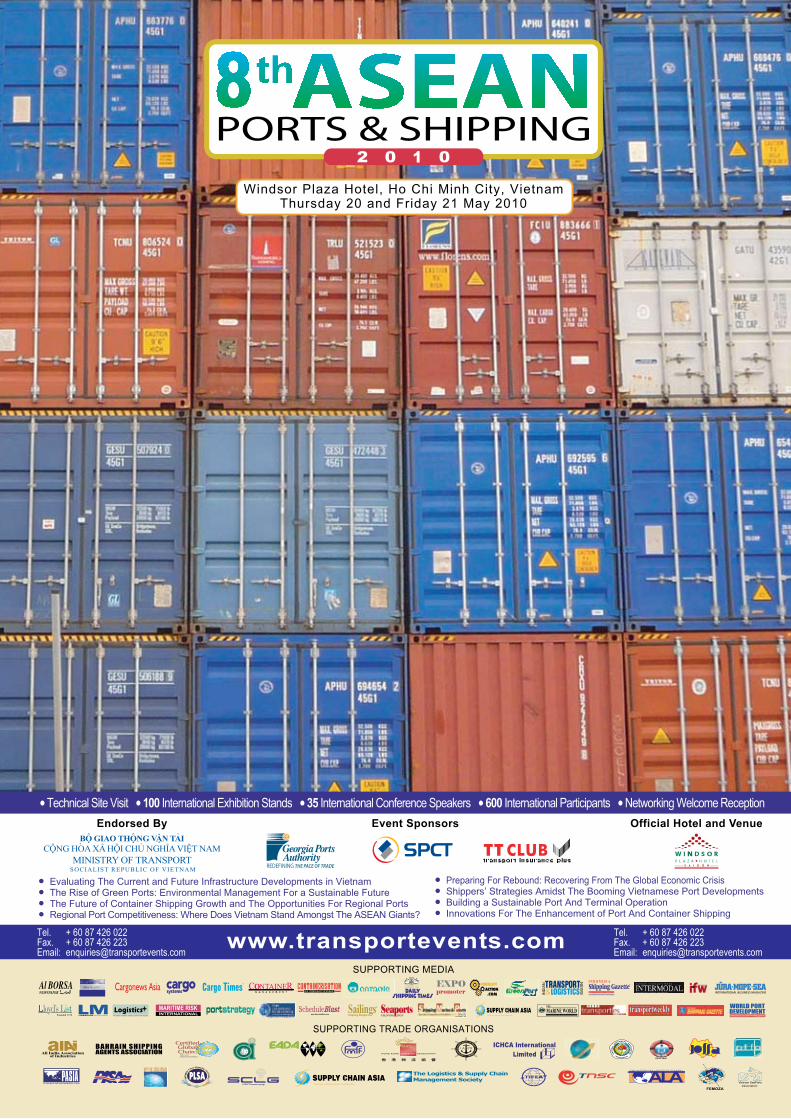
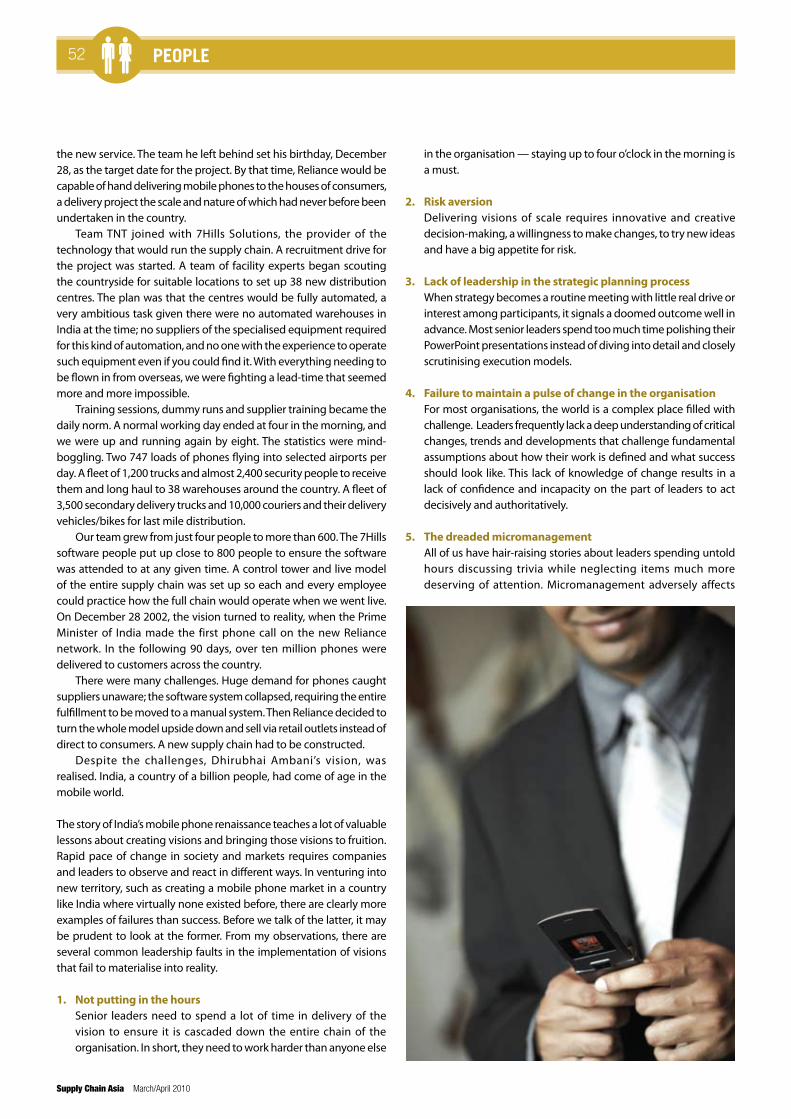
Supply Chain Asia March/April 2010
52 people
the new service. The team he left behind set his birthday, December 28, as the target date for the project. By that time, Reliance would be capable of hand delivering mobile phones to the houses of consumers, a delivery project the scale and nature of which had never before been undertaken in the country.
Team TNT joined with 7Hills Solutions, the provider of the technology that would run the supply chain. A recruitment drive for the project was started. A team of facility experts began scouting the countryside for suitable locations to set up 38 new distribution centres. The plan was that the centres would be fully automated, a very ambitious task given there were no automated warehouses in India at the time; no suppliers of the specialised equipment required for this kind of automation, and no one with the experience to operate such equipment even if you could find it. With everything needing to be flown in from overseas, we were fighting a lead-time that seemed more and more impossible.
Training sessions, dummy runs and supplier training became the daily norm. A normal working day ended at four in the morning, and we were up and running again by eight. The statistics were mind-boggling. Two 747 loads of phones flying into selected airports per day. A fleet of 1,200 trucks and almost 2,400 security people to receive them and long haul to 38 warehouses around the country. A fleet of 3,500 secondary delivery trucks and 10,000 couriers and their delivery vehicles/bikes for last mile distribution.
Our team grew from just four people to more than 600. The 7Hills software people put up close to 800 people to ensure the software was attended to at any given time. A control tower and live model of the entire supply chain was set up so each and every employee could practice how the full chain would operate when we went live. On December 28 2002, the vision turned to reality, when the Prime Minister of India made the first phone call on the new Reliance network. In the following 90 days, over ten million phones were delivered to customers across the country.
There were many challenges. Huge demand for phones caught suppliers unaware; the software system collapsed, requiring the entire fulfillment to be moved to a manual system. Then Reliance decided to turn the whole model upside down and sell via retail outlets instead of direct to consumers. A new supply chain had to be constructed.
Despite the challenges, Dhirubhai Ambani’s vision, was realised. India, a country of a billion people, had come of age in the mobile world.
The story of India’s mobile phone renaissance teaches a lot of valuable lessons about creating visions and bringing those visions to fruition. Rapid pace of change in society and markets requires companies and leaders to observe and react in different ways. In venturing into new territory, such as creating a mobile phone market in a country like India where virtually none existed before, there are clearly more examples of failures than success. Before we talk of the latter, it may be prudent to look at the former. From my observations, there are several common leadership faults in the implementation of visions that fail to materialise into reality.
1. Not putting in the hours Senior leaders need to spend a lot of time in delivery of the
vision to ensure it is cascaded down the entire chain of the organisation. In short, they need to work harder than anyone else
in the organisation — staying up to four o’clock in the morning is a must.
2. Risk aversion Delivering visions of scale requires innovative and creative
decision-making, a willingness to make changes, to try new ideas and have a big appetite for risk.
3. Lack of leadership in the strategic planning process When strategy becomes a routine meeting with little real drive or
interest among participants, it signals a doomed outcome well in advance. Most senior leaders spend too much time polishing their PowerPoint presentations instead of diving into detail and closely scrutinising execution models.
4. Failure to maintain a pulse of change in the organisation For most organisations, the world is a complex place filled with
challenge. Leaders frequently lack a deep understanding of critical changes, trends and developments that challenge fundamental assumptions about how their work is defined and what success should look like. This lack of knowledge of change results in a lack of confidence and incapacity on the part of leaders to act decisively and authoritatively.
5. The dreaded micromanagement All of us have hair-raising stories about leaders spending untold
hours discussing trivia while neglecting items much more deserving of attention. Micromanagement adversely affects

March/April 2010 Supply Chain Asia
53people
the morale of staff and wastes valuable time in delivery of the vision.
6. Inability to let go of old rules In the book The Accelerating Organization, authors Maira and Scott-
Morgan note one principle of survival observed by scientists in natural systems to be the continuous shedding of operating rules that cease to be relevant because of changing environmental conditions. Holding on to old rules can prevent leaders from considering and pursuing new opportunities.
Those are the key common characteristics I have observed embedded in the processes of failed visionary ventures. Following are five attributes I have observed in the implementation of visions that has been achieved successfully.
1. Focus on the final goal The mission, vision, goals and processes contained in the strategic
plan should be the focus for the reflection and decision-making of the organisation’s leadership. In India’s mobile phone renaissance, almost every decision made along the way was based on the final goal to bring affordable mobile phone services to the masses in India.
2. Build a great leadership team and keep developing the second line
Organisations need a long-term plan for developing leadership. The plan can be built around the following questions: What will our leadership look like in the future? How can we find talent? How do we go about retaining our leadership talent? Do we have an effective second line in place? Do we develop new skills and new ways of thinking?
Reliance was able to deliver such a visionary and ambitious plan because they had an effective first and second line of leadership in place. What this essentially meant was that instead of just a team of ten people, you had some 200 leaders all constantly focused on one goal.
3. Create a shared vision in order to achieve dreams The overall vision of an organisation is captured in the question: “If
we could create the organisation of our dreams that will have the impact we most desire, what would that organisation look like?”
Leaders should have the answer to this question in mind for all decision-making, not just during the annual planning retreat. The answer should be debated by others in the organisation; it should be well communicated to the local community, and it should be the basis for regular dialogue on emerging issues and challenges faced by the organisation.
When you walk into a Reliance office, you will see the vision statement of the organisation everywhere. The CEO conducts ‘Town hall’ sessions to update the organisation at every opportunity. People speak the language of the vision and execution of plans is measured against the end goal of the vision.
4. Keep pace with change Visionary leadership requires keeping up with the rapid pace of
change. What external changes and trends will have the greatest impact over the next three to five years on the organisation and the people it serves? How can the organisation effectively respond to these changes and trends? How are similar organisations responding to these changes and trends?
5. Get closer to your customers Leaders need to interact with customers to stay in touch with
changing needs. I am always surprised to see that most CEO’s and top executives spend their time in their offices and not on the road. Customer feedback is rarely topmost on agendas. Answers to the following key questions should be sought continuously: What is the perception of the organisation among our customers? What are the most important future customer needs and service expectations of the organisation? How are competitors positioning themselves to meet the needs of our customers?
When Reliance realised its new mobile phone customers wanted to ‘touch and feel’ the product before buying it, and had a constant need for information on how to use the new technology, they changed their entire direct-to-market plan midway. The supply chain was realigned to a retail model in a matter of just 15 days.
Don’t be satisfied with too little Companies and their leaders are often satisfied with a couple of percentage points increase in market share. When you see this, beware. It is a clear sign of a non-visionary organisation and leadership. Growing market share from zero to 30 percent in two short months seems like an impossible journey, but when achieved becomes history. Reliance created history in India in the early part of this decade by bringing affordable mobile telecommunications to the masses.
Harry Lagad is a former regional director of logistics with Nokia and member of the Supply Chain Asia Global Advisory Board
54 opinion
Supply Chain Asia March/April 2010
One of the best things about being a consultant and writer in supply chain management is that we are often pressed (required, even) to sit back and reflect on the current state and future direction of things. The time and effort required
for this reflection is a luxury that we all have trouble affording but sometimes it needs to be done.
This occurred for me again recently when a colleague and prospective client asked the question, “What are the current hot topics/big opportunities in supply chain management?” As simple a question as that is, it did take a bit of thought and research to come up with what we were comfortable to share. Below is our ‘grab bag’ of what we see as hot buttons for supply chain management in our current environment. We reviewed this list within a conference presentation in India a few weeks ago and received very strong response to it as being pertinent for these times.
1. Responding to changing/cancelled demand While many if not all of us believe that the worst of our difficult financial time is over,
a lesson that will stay with us is the need to be able to respond to sudden, significant changes in demand for our products and services. Our perception is that there is a new maturity in thinking about the roles for demand planning and supply execution. We clearly need an appropriately precise articulation about what we expect to be demanded in the marketplace so that we can have resources available. At the same time, people seem to now better appreciate the value of responsiveness and agility as a complement rather than an either/or choice.
2. Inventory optimisation Stated plainly and simply, one cannot
set global inventory level policies and get it right. The ‘right’ inventory levels must be determined on an item-by-item basis, based on the variables in the safety stock formula. The aggregate inventory investment is based on a bottom-up aggregation (that is where the term comes from) and not from some arbitrary edict from a financial perspective. Of course, financial constraints on working capital are very real, but it is the supply chain personnel’s responsibility to determine and communicate the risk factors involved at the various levels of investment. If you want to reduce inventory, you need to get better at managing demand (creating and influencing demand, demand planning and demand control) and reducing lead times and changeover costs. Inventory is an outcome, not a driver.
3. Short-term vs. long-term thinking and actions
This is a perennial challenge in any business, of course, but has been particularly acute in the past year or so. It is now very apparent that major companies did learn from past mistakes
By Barry Elliott
Current ‘hot buttons’ in supply chain management
❝If you want to reduce inventory, you need to get
better at managing demand (creating and influencing
demand, demand planning and demand control) and reducing lead times and
changeover costs. Inventory is an outcome, not a
driver.❞
55opinion
March/April 2010 Supply Chain Asia
and did not lay off as many during the recent downturn as they may have in the past. Just recently, we heard a story about how one of the major carmakers, in the midst of their tremendous difficulties, still took advantage of the labour market and recruited highly talented personnel while they were available.
4. Reversing globalised outsourcing This is another area in which we perceive greater maturity. It is now
clear that many companies were not ‘trigger happy’ in pulling out of their established outsourcing arrangements. Business knows that they made their outsourcing decisions on a sound basis and did not go too far in second-guessing that earlier thinking, simply due to the uncertainties over those few months. We look forward to the new release of the China Manufacturing Competitiveness Study conducted jointly by the American Chamber of Commerce in Shanghai and Booz & Company, as this will be a clear measure of what did and did not happen in terms of multi-nationals’ arrangements in China, for example.
5. Keeping an eye on suppliers and identifying those in peril As we mentioned several times throughout this past year, it
is now much more apparent that this has been a weak link in procurement activities. People routinely assumed the financial sustainability of their selected suppliers without performing due diligence in the first place and then regularly followed up over time.
6. Consolidating procurement Going hand-in-hand with the previous point is that we continue
to hold the view that one of the biggest opportunities in many industries is to source more strategically. Simply put, this means better arrangements with fewer suppliers, resulting in better financial and quality results.
7. Getting more out of IT We have spent this past year on several assignments, all with the
same theme: getting the people and process elements right so that the organisation can get the value out of the investment that they have long since made in IT solutions. Indeed, one company did their initial ERP implementation more than ten years ago, in the time of Y2K concerns. They are only now getting around to fixing things so that they will even begin to reap benefit from that tremendous investment. In this day and age, it is rarely the IT part that is the problem.
8. Managing risk We are pleased to again credit Martin Christopher of Cranfield for
talking about managing risk several years ago, long before people were able to see what that had to do with SCM. Now that the rest of us have caught on, we have seen great progress in this area in a very short period of time. This is, of course, closely tied to our point above regarding keeping an eye on suppliers, but takes on the full scope of business, particularly including the aspects of the next point in our list.
9. Green/CSR initiatives We have seen such a fresh take on improvement initiatives
driven from this perspective, identifying and implementing new approaches that would not have been uncovered otherwise. Readers of Supply Chain Asia Magazine will recall our reports of the tremendous efforts and commensurate results of many organisations around the world. This is clearly becoming recognised as a key element of optimising supply chain management.
10. S&OP’s time has come Sales & Operations Planning (also often referred to as Integrated
Business Management and Integrated Enterprise Leadership) is the absolute bottom line to opportunities in many different industries, not only in manufacturing. This is the way to ‘pull it all together’. We have done a lot of work in recent years with clients in S&OP education, process design, and implementation programmes and we are pleased to observe that there is not so much questioning as to whether or not this approach to management fits a particular environment. Indeed, we see it as some of the most fundamental common sense that is often overlooked in how people manage their organisations. Thus, even many consultants (including the big guys) who until recently didn’t pay any heed to the need or opportunity from this approach are now certainly doing so.
Barry Elliot is a Hong Kong-based supply chain management consultant
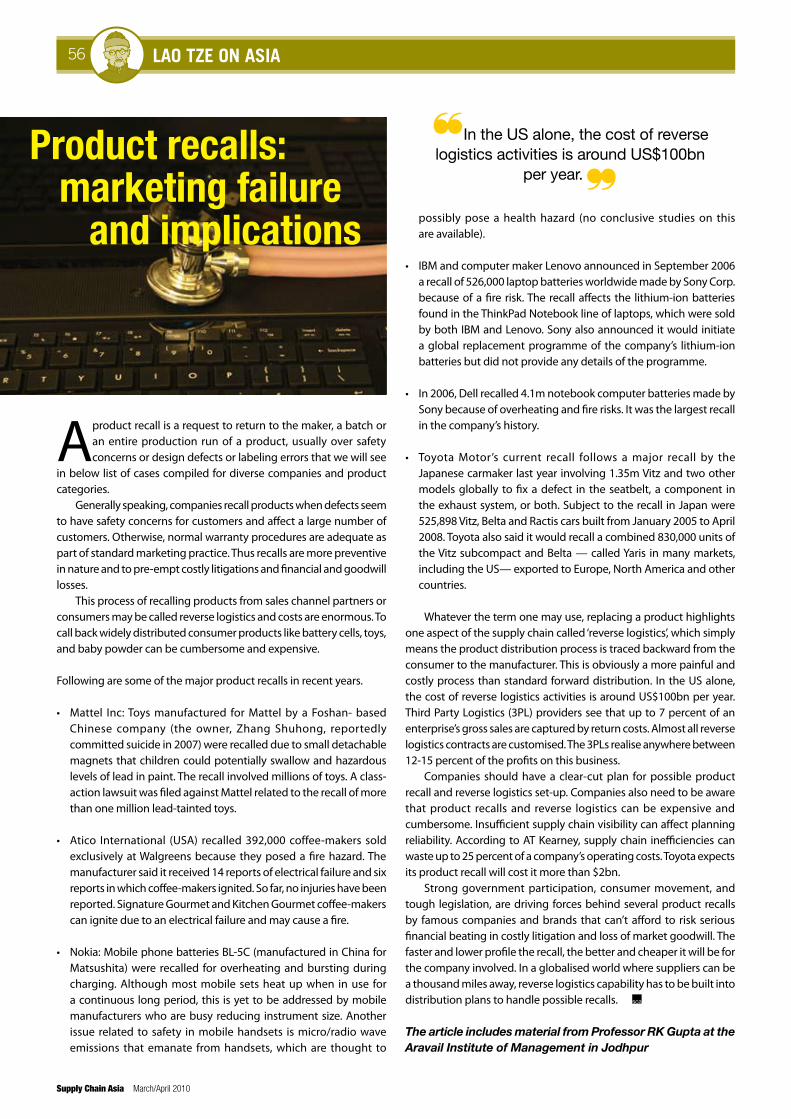
infrastructure update56 lao tze on asia
Supply Chain Asia March/April 2010
Aproduct recall is a request to return to the maker, a batch or an entire production run of a product, usually over safety concerns or design defects or labeling errors that we will see
in below list of cases compiled for diverse companies and product categories.
Generally speaking, companies recall products when defects seem to have safety concerns for customers and affect a large number of customers. Otherwise, normal warranty procedures are adequate as part of standard marketing practice. Thus recalls are more preventive in nature and to pre-empt costly litigations and financial and goodwill losses.
This process of recalling products from sales channel partners or consumers may be called reverse logistics and costs are enormous. To call back widely distributed consumer products like battery cells, toys, and baby powder can be cumbersome and expensive.
Following are some of the major product recalls in recent years.
• Mattel Inc: Toys manufactured for Mattel by a Foshan- based Chinese company (the owner, Zhang Shuhong, reportedly committed suicide in 2007) were recalled due to small detachable magnets that children could potentially swallow and hazardous levels of lead in paint. The recall involved millions of toys. A class-action lawsuit was filed against Mattel related to the recall of more than one million lead-tainted toys.
• Atico International (USA) recalled 392,000 coffee-makers sold exclusively at Walgreens because they posed a fire hazard. The manufacturer said it received 14 reports of electrical failure and six reports in which coffee-makers ignited. So far, no injuries have been reported. Signature Gourmet and Kitchen Gourmet coffee-makers can ignite due to an electrical failure and may cause a fire.
• Nokia: Mobile phone batteries BL-5C (manufactured in China for Matsushita) were recalled for overheating and bursting during charging. Although most mobile sets heat up when in use for a continuous long period, this is yet to be addressed by mobile manufacturers who are busy reducing instrument size. Another issue related to safety in mobile handsets is micro/radio wave emissions that emanate from handsets, which are thought to
possibly pose a health hazard (no conclusive studies on this are available).
• IBM and computer maker Lenovo announced in September 2006 a recall of 526,000 laptop batteries worldwide made by Sony Corp. because of a fire risk. The recall affects the lithium-ion batteries found in the ThinkPad Notebook line of laptops, which were sold by both IBM and Lenovo. Sony also announced it would initiate a global replacement programme of the company’s lithium-ion batteries but did not provide any details of the programme.
• In 2006, Dell recalled 4.1m notebook computer batteries made by Sony because of overheating and fire risks. It was the largest recall in the company’s history.
• Toyota Motor’s current recall follows a major recall by the Japanese carmaker last year involving 1.35m Vitz and two other models globally to fix a defect in the seatbelt, a component in the exhaust system, or both. Subject to the recall in Japan were 525,898 Vitz, Belta and Ractis cars built from January 2005 to April 2008. Toyota also said it would recall a combined 830,000 units of the Vitz subcompact and Belta — called Yaris in many markets, including the US— exported to Europe, North America and other countries.
Whatever the term one may use, replacing a product highlights one aspect of the supply chain called ‘reverse logistics’, which simply means the product distribution process is traced backward from the consumer to the manufacturer. This is obviously a more painful and costly process than standard forward distribution. In the US alone, the cost of reverse logistics activities is around US$100bn per year. Third Party Logistics (3PL) providers see that up to 7 percent of an enterprise’s gross sales are captured by return costs. Almost all reverse logistics contracts are customised. The 3PLs realise anywhere between 12-15 percent of the profits on this business.
Companies should have a clear-cut plan for possible product recall and reverse logistics set-up. Companies also need to be aware that product recalls and reverse logistics can be expensive and cumbersome. Insufficient supply chain visibility can affect planning reliability. According to AT Kearney, supply chain inefficiencies can waste up to 25 percent of a company’s operating costs. Toyota expects its product recall will cost it more than $2bn.
Strong government participation, consumer movement, and tough legislation, are driving forces behind several product recalls by famous companies and brands that can’t afford to risk serious financial beating in costly litigation and loss of market goodwill. The faster and lower profile the recall, the better and cheaper it will be for the company involved. In a globalised world where suppliers can be a thousand miles away, reverse logistics capability has to be built into distribution plans to handle possible recalls.
The article includes material from Professor RK Gupta at the Aravail Institute of Management in Jodhpur
Product recalls: marketing failure and implications
❝In the US alone, the cost of reverse logistics activities is around US$100bn
per year. ❞

The world has been through a p u n i s h i n g e i g h t e e n months. Recession has led
to fears of full-blown depression; crises of confidence have led to the near total meltdown of the global financial system. On a more human level, companies have gone bankrupt, people lost their jobs, and developing countries have been left mired in poverty. The technicalities of how it happened will doubtless be argued for decades but what the crisis tells us about the system globalisation built and how it has
affected our moral and ethical behaviour are the subjects of these two new books.
Robert Skidelsky is a noted economics professor; Stephen Green, the chairman of HSBC bank. Keynes is of course John Maynard Keynes, the economist intrinsically linked to the Great Depression of the 1930s and, to put it simplistically, the father of the concept of spending your way out of recession — what we now more grandly call ‘fiscal
stimulus’. Skidelsky’s concise study of
Keynes looks back at the economist’s contribution to the ‘dismal science’ though also looks at his reflections on the morals of capitalism. In these days of ever more rigid specialisation in economics, the idea that Keynes was a philosopher and moralist as well as an economist seems old-fashioned. But Keynes developed his theories in part by never ceasing to question the reasons for economic activity. To simplify his conclusions — Keynes believed that if the pursuit of money was simply due to ‘love of
Looking at the large-scale stimulus programmes now underway everywhere from Washington to Beijing, it’s pretty obvious Keynes is back.
money’ and not to achieve a ‘good life’, then it was pointless. To make the world ethically better was the primary justification for economic success.
Keynes died in 1946 though his ideas are currently back in vogue after several decades of dominance by the so-called Chicago School, or neo-classical economics, which rejects Keynesianism for monetarism. Looking at the large-scale stimulus programmes now underway everywhere from Washington to Beijing, it’s pretty obvious Keynes is back.
Following Keynes philosophically, Green posits the idea that we have over ‘compartmentalised’ business from ethics — “Capitalism needs to integrate values with value.” He has a range of buzzwords to call upon that Keynes didn’t, (sustainability, corporate governance, and so on) but his conclusion is that in our private lives we do not act in terms only of what is legally permissible and what we can get away with. Rather we develop codes of conduct and then hold ourselves accountable to them. Green is making a Keynesian moral argument for our times — profit, and the getting of it, cannot simply be the sole goal of business. We need to achieve Keynes’ ‘good life’.
If you’d asked him what constituted the ‘good life’, Keynes would have answered that it was anything that advanced civilisation. That was the 1930s. If anything, Green believes the stakes are even higher now: “Aren’t we just fretting about the means — the capitalist system — when we should be fretting about the end: economic development, in its present carbon-intensive form, with the grave threat it poses for the whole planet?”
The world economic system is arguably now in a phase of recovery. How much we are investing and thinking about repairing our ethics as well as our financial system remains open to debate.
Paul French is the Shanghai-based founder of Access Asia
Good Value: Reflections on Money, Morality and an Uncertain World(Allen Lane, 2009) Stephen Green
57book reviews
Keynes: The Return of the Master (Allen Lane, 2009) Robert Skidelsky
March/April 2010 Supply Chain Asia
By Paul French
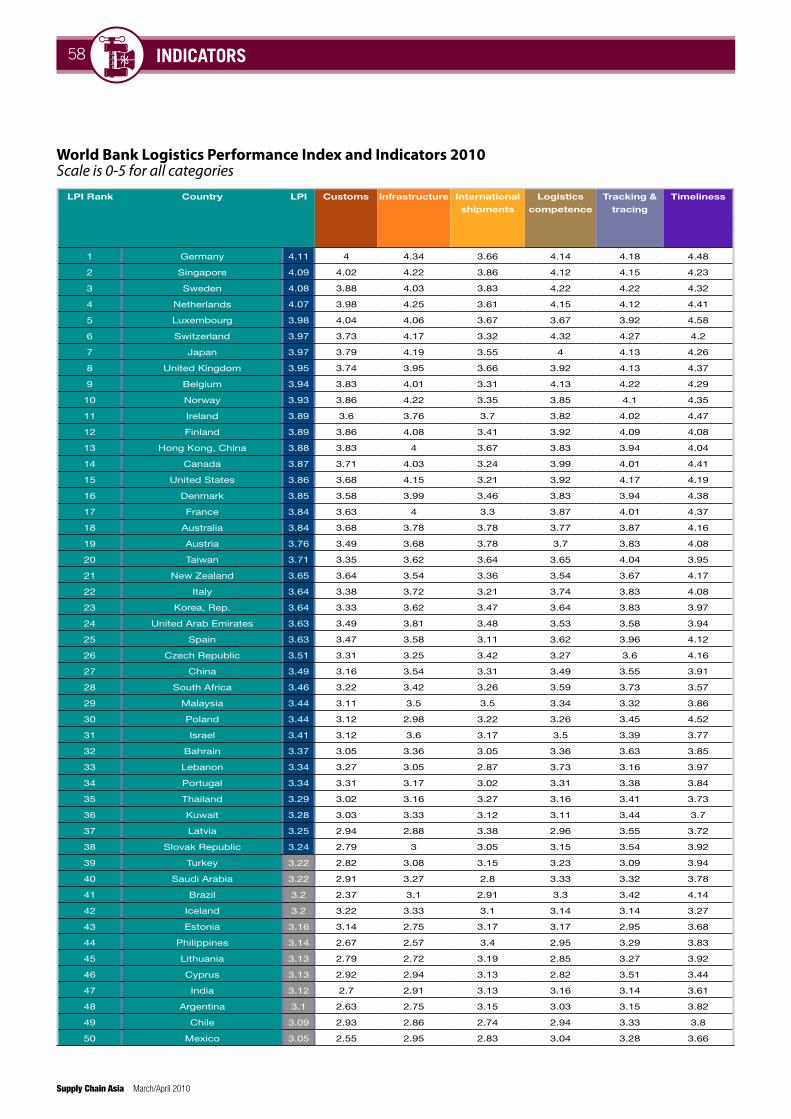
indicators58
Supply Chain Asia March/April 2010
World Bank Logistics Performance Index and Indicators 2010Scale is 0-5 for all categories
LPI Rank Country LPI Customs Infrastructure International
shipments
Logistics
competence
Tracking &
tracing
Timeliness
1 Germany 4.11 4 4.34 3.66 4.14 4.18 4.48
2 Singapore 4.09 4.02 4.22 3.86 4.12 4.15 4.23
3 Sweden 4.08 3.88 4.03 3.83 4.22 4.22 4.32
4 Netherlands 4.07 3.98 4.25 3.61 4.15 4.12 4.41
5 Luxembourg 3.98 4.04 4.06 3.67 3.67 3.92 4.58
6 Switzerland 3.97 3.73 4.17 3.32 4.32 4.27 4.2
7 Japan 3.97 3.79 4.19 3.55 4 4.13 4.26
8 United Kingdom 3.95 3.74 3.95 3.66 3.92 4.13 4.37
9 Belgium 3.94 3.83 4.01 3.31 4.13 4.22 4.29
10 Norway 3.93 3.86 4.22 3.35 3.85 4.1 4.35
11 Ireland 3.89 3.6 3.76 3.7 3.82 4.02 4.47
12 Finland 3.89 3.86 4.08 3.41 3.92 4.09 4.08
13 Hong Kong, China 3.88 3.83 4 3.67 3.83 3.94 4.04
14 Canada 3.87 3.71 4.03 3.24 3.99 4.01 4.41
15 United States 3.86 3.68 4.15 3.21 3.92 4.17 4.19
16 Denmark 3.85 3.58 3.99 3.46 3.83 3.94 4.38
17 France 3.84 3.63 4 3.3 3.87 4.01 4.37
18 Australia 3.84 3.68 3.78 3.78 3.77 3.87 4.16
19 Austria 3.76 3.49 3.68 3.78 3.7 3.83 4.08
20 Taiwan 3.71 3.35 3.62 3.64 3.65 4.04 3.95
21 New Zealand 3.65 3.64 3.54 3.36 3.54 3.67 4.17
22 Italy 3.64 3.38 3.72 3.21 3.74 3.83 4.08
23 Korea, Rep. 3.64 3.33 3.62 3.47 3.64 3.83 3.97
24 United Arab Emirates 3.63 3.49 3.81 3.48 3.53 3.58 3.94
25 Spain 3.63 3.47 3.58 3.11 3.62 3.96 4.12
26 Czech Republic 3.51 3.31 3.25 3.42 3.27 3.6 4.16
27 China 3.49 3.16 3.54 3.31 3.49 3.55 3.91
28 South Africa 3.46 3.22 3.42 3.26 3.59 3.73 3.57
29 Malaysia 3.44 3.11 3.5 3.5 3.34 3.32 3.86
30 Poland 3.44 3.12 2.98 3.22 3.26 3.45 4.52
31 Israel 3.41 3.12 3.6 3.17 3.5 3.39 3.77
32 Bahrain 3.37 3.05 3.36 3.05 3.36 3.63 3.85
33 Lebanon 3.34 3.27 3.05 2.87 3.73 3.16 3.97
34 Portugal 3.34 3.31 3.17 3.02 3.31 3.38 3.84
35 Thailand 3.29 3.02 3.16 3.27 3.16 3.41 3.73
36 Kuwait 3.28 3.03 3.33 3.12 3.11 3.44 3.7
37 Latvia 3.25 2.94 2.88 3.38 2.96 3.55 3.72
38 Slovak Republic 3.24 2.79 3 3.05 3.15 3.54 3.92
39 Turkey 3.22 2.82 3.08 3.15 3.23 3.09 3.94
40 Saudi Arabia 3.22 2.91 3.27 2.8 3.33 3.32 3.78
41 Brazil 3.2 2.37 3.1 2.91 3.3 3.42 4.14
42 Iceland 3.2 3.22 3.33 3.1 3.14 3.14 3.27
43 Estonia 3.16 3.14 2.75 3.17 3.17 2.95 3.68
44 Philippines 3.14 2.67 2.57 3.4 2.95 3.29 3.83
45 Lithuania 3.13 2.79 2.72 3.19 2.85 3.27 3.92
46 Cyprus 3.13 2.92 2.94 3.13 2.82 3.51 3.44
47 India 3.12 2.7 2.91 3.13 3.16 3.14 3.61
48 Argentina 3.1 2.63 2.75 3.15 3.03 3.15 3.82
49 Chile 3.09 2.93 2.86 2.74 2.94 3.33 3.8
50 Mexico 3.05 2.55 2.95 2.83 3.04 3.28 3.66
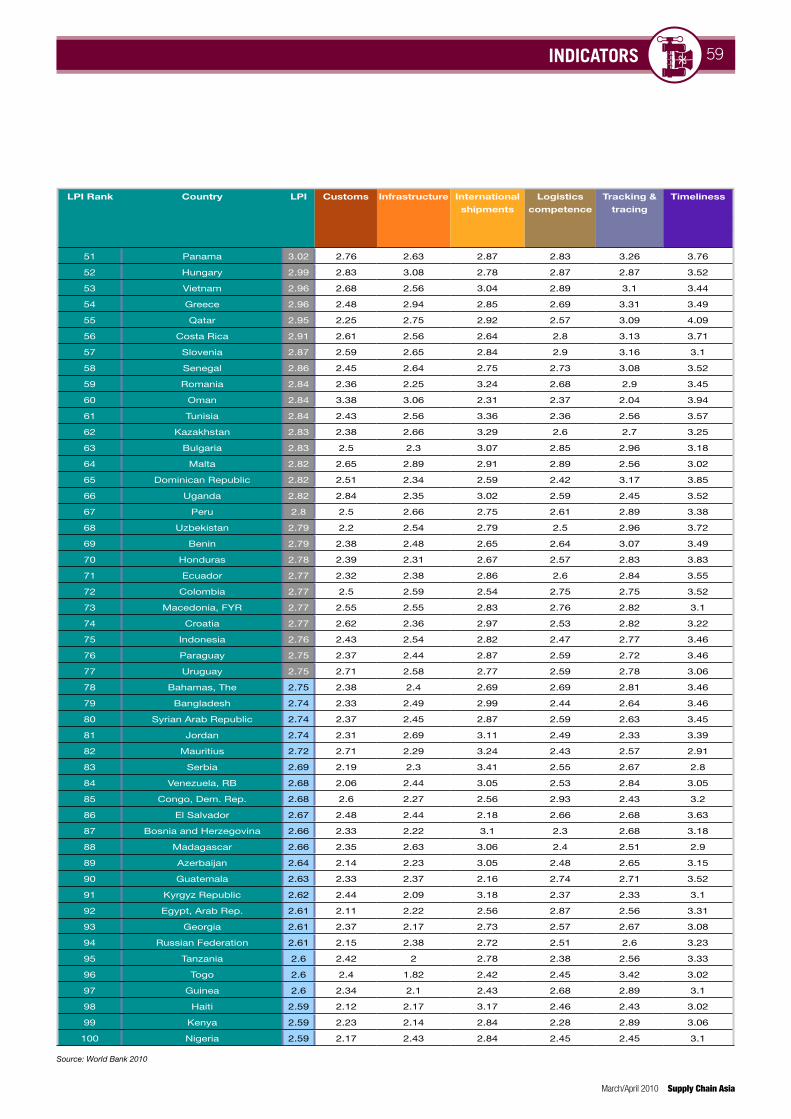
59indicators
March/April 2010 Supply Chain Asia
Source: World Bank 2010
LPI Rank Country LPI Customs Infrastructure International
shipments
Logistics
competence
Tracking &
tracing
Timeliness
51 Panama 3.02 2.76 2.63 2.87 2.83 3.26 3.76
52 Hungary 2.99 2.83 3.08 2.78 2.87 2.87 3.52
53 Vietnam 2.96 2.68 2.56 3.04 2.89 3.1 3.44
54 Greece 2.96 2.48 2.94 2.85 2.69 3.31 3.49
55 Qatar 2.95 2.25 2.75 2.92 2.57 3.09 4.09
56 Costa Rica 2.91 2.61 2.56 2.64 2.8 3.13 3.71
57 Slovenia 2.87 2.59 2.65 2.84 2.9 3.16 3.1
58 Senegal 2.86 2.45 2.64 2.75 2.73 3.08 3.52
59 Romania 2.84 2.36 2.25 3.24 2.68 2.9 3.45
60 Oman 2.84 3.38 3.06 2.31 2.37 2.04 3.94
61 Tunisia 2.84 2.43 2.56 3.36 2.36 2.56 3.57
62 Kazakhstan 2.83 2.38 2.66 3.29 2.6 2.7 3.25
63 Bulgaria 2.83 2.5 2.3 3.07 2.85 2.96 3.18
64 Malta 2.82 2.65 2.89 2.91 2.89 2.56 3.02
65 Dominican Republic 2.82 2.51 2.34 2.59 2.42 3.17 3.85
66 Uganda 2.82 2.84 2.35 3.02 2.59 2.45 3.52
67 Peru 2.8 2.5 2.66 2.75 2.61 2.89 3.38
68 Uzbekistan 2.79 2.2 2.54 2.79 2.5 2.96 3.72
69 Benin 2.79 2.38 2.48 2.65 2.64 3.07 3.49
70 Honduras 2.78 2.39 2.31 2.67 2.57 2.83 3.83
71 Ecuador 2.77 2.32 2.38 2.86 2.6 2.84 3.55
72 Colombia 2.77 2.5 2.59 2.54 2.75 2.75 3.52
73 Macedonia, FYR 2.77 2.55 2.55 2.83 2.76 2.82 3.1
74 Croatia 2.77 2.62 2.36 2.97 2.53 2.82 3.22
75 Indonesia 2.76 2.43 2.54 2.82 2.47 2.77 3.46
76 Paraguay 2.75 2.37 2.44 2.87 2.59 2.72 3.46
77 Uruguay 2.75 2.71 2.58 2.77 2.59 2.78 3.06
78 Bahamas, The 2.75 2.38 2.4 2.69 2.69 2.81 3.46
79 Bangladesh 2.74 2.33 2.49 2.99 2.44 2.64 3.46
80 Syrian Arab Republic 2.74 2.37 2.45 2.87 2.59 2.63 3.45
81 Jordan 2.74 2.31 2.69 3.11 2.49 2.33 3.39
82 Mauritius 2.72 2.71 2.29 3.24 2.43 2.57 2.91
83 Serbia 2.69 2.19 2.3 3.41 2.55 2.67 2.8
84 Venezuela, RB 2.68 2.06 2.44 3.05 2.53 2.84 3.05
85 Congo, Dem. Rep. 2.68 2.6 2.27 2.56 2.93 2.43 3.2
86 El Salvador 2.67 2.48 2.44 2.18 2.66 2.68 3.63
87 Bosnia and Herzegovina 2.66 2.33 2.22 3.1 2.3 2.68 3.18
88 Madagascar 2.66 2.35 2.63 3.06 2.4 2.51 2.9
89 Azerbaijan 2.64 2.14 2.23 3.05 2.48 2.65 3.15
90 Guatemala 2.63 2.33 2.37 2.16 2.74 2.71 3.52
91 Kyrgyz Republic 2.62 2.44 2.09 3.18 2.37 2.33 3.1
92 Egypt, Arab Rep. 2.61 2.11 2.22 2.56 2.87 2.56 3.31
93 Georgia 2.61 2.37 2.17 2.73 2.57 2.67 3.08
94 Russian Federation 2.61 2.15 2.38 2.72 2.51 2.6 3.23
95 Tanzania 2.6 2.42 2 2.78 2.38 2.56 3.33
96 Togo 2.6 2.4 1.82 2.42 2.45 3.42 3.02
97 Guinea 2.6 2.34 2.1 2.43 2.68 2.89 3.1
98 Haiti 2.59 2.12 2.17 3.17 2.46 2.43 3.02
99 Kenya 2.59 2.23 2.14 2.84 2.28 2.89 3.06
100 Nigeria 2.59 2.17 2.43 2.84 2.45 2.45 3.1
60 blogs
Supply Chain Asia March/April 2010
You often hear that SaaS is a more efficient way to deliver software value to the customer. The main feature people point to is, “if you don’t need it — just don’t renew your subscription.” This ‘clouds’ some other real benefits of SaaS.
Deployments are still required for SaaS, but on average they are much less involved and costly.
Security is an even greater benefit of SaaS. An on-demand vendor has the greatest incentive to keep their service secure — it is called losing customers if they don’t. One of my favourite stories is about a large enterprise (years ago) that refused to go SaaS because of ‘data security’ concerns. Ironically, thirty days after this discussion, they had a major breach of their own IT operations, which became public knowledge.
I believe one of the greatest reasons to seek out SaaS offerings centres around system administration. Turnover in IT operations is common these days, so why wouldn’t you want the vendor who knows the offering to be responsible for system administration? As CEO of an SaaS company, I am often asked why we don’t offer a lower cost on-premise version of our offering. I tell them I would have to charge more because we get more customer support calls due to increased system administration calls.
Having pointed out all of these indirect benefits — economics is still the largest reason to go the SaaS way. There were billions of IT monies wasted on what became ‘shelf-ware’ because vendors stuffed contracts with additional users or capabilities that were never used. What I have found with SaaS is customers only order the number of users they need in the short term, because it is easy to add users later on.
While there are still some ‘last remaining holdouts’ on the movement to SaaS — it is now undeniable. A proof point is witnessing some of the most secretive and data security oriented large enterprises asking for SaaS!
...community.kinaxis.com
The views expressed in the blogs are the views of the individual bloggers and do not necessarily represent the views of Supply Chain Asia Magazine or its staff
On-demand versus on-the-shelf
I certainly hope not, what would I blog about? But today in the Wall Street Journal an article highlights the trend that many companies, including Oracle, Pepsi, General Motors and Boeing, are all buying their suppliers and/or partners or investing in them for one reason or another.
While this doesn’t signal the end of the global supply chain, it is a shift worth noting. As some readers have commented, these shifts are cyclical and based on the market. I would agree. But I would also say this is not a one-size-fits-all answer, and ‘going vertical’ doesn’t mean owning the entire supply chain.
Apple does quite well, owning both the software and the hardware of its products, but it still requires its chips from Intel. The same for Pepsi, they are attempting to buy two of their major distributors, but I don’t think we will see Pepsi buying the glass company that provides its bottles.
So a line has to be drawn, where it is drawn is up to the company and the market they are in. Too much control can be costly.
...supplychainrocks.blogspot.com
Are supply chains disappearing?