effect of oblique incidence on silver nanomaterials fabricated in water via ultrafast laser ablation...
TRANSCRIPT
This article appeared in a journal published by Elsevier. The attachedcopy is furnished to the author for internal non-commercial researchand education use, including for instruction at the authors institution
and sharing with colleagues.
Other uses, including reproduction and distribution, or selling orlicensing copies, or posting to personal, institutional or third party
websites are prohibited.
In most cases authors are permitted to post their version of thearticle (e.g. in Word or Tex form) to their personal website orinstitutional repository. Authors requiring further information
regarding Elsevier’s archiving and manuscript policies areencouraged to visit:
http://www.elsevier.com/authorsrights
Author's personal copy
Applied Surface Science 303 (2014) 217–232
Contents lists available at ScienceDirect
Applied Surface Science
jou rn al h om ep age: www.elsev ier .com/ locate /apsusc
Effect of oblique incidence on silver nanomaterials fabricated in watervia ultrafast laser ablation for photonics and explosives detection
G. Krishna Podagatlapalli a, Syed Hamadb, Md. Ahamad Mohiddonc, S. Venugopal Raoa,∗
a Advanced Center of Research in High Energy Materials (ACRHEM), University of Hyderabad, Prof. C. R. Rao Road, Hyderabad 500046, Indiab School of Physics, University of Hyderabad, Prof. C. R. Rao Road, Hyderabad 500046, Indiac Centre for Nanotechnology University of Hyderabad, Prof. C. R. Rao Road, Hyderabad 500046, India
a r t i c l e i n f o
Article history:Received 5 November 2013Received in revised form 24 February 2014Accepted 25 February 2014Available online 12 March 2014
PACS:79.20.Eb78.30.−j42.65.Re42.65.−k
Keywords:Ultrafast ablationSilver nanoparticlesSilver nanostructuresExplosivesSERSDegenerate four wave mixing
a b s t r a c t
Picosecond (ps) laser ablation of silver (Ag) substrate submerged in double distilled water was performedat 800 nm for different angles of incidence of 5◦, 15◦, 30◦ and 45◦. Prepared colloidal solutions werecharacterized through transmission electron microscopy, UV absorption spectroscopy to explore theirmorphologies and surface plasmon resonance (SPR) properties. Third order nonlinear optical (NLO) char-acterization of colloids was performed using degenerate four wave mixing (DFWM) technique with ∼40 fslaser pulses at 800 nm and the NLO coefficients were obtained. Detailed analysis of the data obtained fromcolloidal solutions suggested that superior results in terms of yield, sizes of the NPs, SPR peak positionwere achieved for ablation performed at 30◦ incident angle. Surface enhanced Raman spectra (SERS) ofRhodamine 6G from nanostructured substrates were investigated using excitation wavelengths of 532and 785 nm. In both the cases substrates prepared at 30◦ incident angle exhibited superior enhance-ment in the Raman signatures with a best enhancement factor achieved being >108. SERS of an explosivemolecule 5-amino, 3-nitro, -1H-1,2,4-nitrozole (ANTA) was also demonstrated from these nanostruc-tured substrates. Multiple usage of Ag nanostructures for SERS studies revealed that structures preparedat 30◦ incident angle provided superior performance amongst all.
© 2014 Elsevier B.V. All rights reserved.
1. Introduction
Versatility and extreme simplicity are significant features oftop-down process of pulsed laser ablation of bulk silver targetssubmerged in liquids (PLAL) [1–15]. The technique facilitates fabri-cation of impurity free Ag nanoparticles (NPs) and well texturedAg metallic nanostructures (NSs) in a short time without con-tamination of the environment since rupture of the metal targettakes place underneath the liquid layer. Simultaneous fabricationof the NPs and NSs in a single step is not possible with most ofthe other established lithographic methods. Moreover, products ofPLAL (NSs and NPs) need not be treated using separate chemicalssince the method itself is green and free from precursors or surfac-tants akin to other techniques [16,17]. Aforesaid salient features ofPLAL technique renders it to play a crucial role in plasmonics, pho-tonics, and biosciences. Wide range applications of plasmonic (Ag)
∗ Corresponding author. Tel.: +91 040 23138811.E-mail addresses: [email protected], soma [email protected],
soma [email protected] (S. Venugopal Rao).
NPs include anti-bacterial [18,19] agents, cancer cell destroyers[20,21], elements in device making of optical limiters and essen-tial building blocks of solar cell fabrication etc. [22,23]. Similarly,Ag nanostructured surfaces play a decisive role in surface enhancedRaman scattering spectroscopy (SERS) [24–30] for trace detectionof adsorbed molecules, including potential explosives [31].
In PLAL, a focused pulsed laser beam is allowed to fall on ametallic target submerged in liquid, leading to absorption of thelaser pulse energy through the conduction electrons of metal targetvia inverse Bremsstrahlung. Consequently, ejected ballistic elec-tron gas attains higher temperatures than the surrounding latticewhich remain cold. After a few ps [32,33] electron gas at higher tem-perature transfers heat energy to lattice through electron-phononcoupling achieving a state of equilibrium. Gradient of temperaturesof ballistic electron gas, lattice system and the dynamics of equilib-rium are successfully explained by a two-temperature model [34].Post equilibration, if the temperature attained by entire system isgreater than melting point of metal target then portion of metal atwhich laser energy is deposited turns to melt phase. The metallicmelt acts as a reservoir for fabrication of NPs and NSs. A compli-cated laser-matter interaction under the liquid layer leads to the
http://dx.doi.org/10.1016/j.apsusc.2014.02.1520169-4332/© 2014 Elsevier B.V. All rights reserved.
Author's personal copy
218 G. Krishna Podagatlapalli et al. / Applied Surface Science 303 (2014) 217–232
generation of plasma plume at the point where the local meltinghas taken place. Later, the plasma expands into surrounding liquidmedium resulting in generation of a shockwave. During the processof expansion, plasma plume cools down and transfers the energy toliquid medium. Consequently, cavitation bubble [35] is generatedin the liquid medium which further expands. After a certain period(typically a few hundred microseconds) where inside pressuredecreases compared to the surrounding liquid medium, cavitationbubble collapses followed by generation of a second shock wave[36]. In fact, the exact stage at which nanomaterials are fabricatedis still being debated. Some groups, through extensive experimen-tal research and modeling, have suggested that the nanomaterialsare generated during the expansion of cavitation bubble inside iton a time scale of the order 10−6–10−4 s [37,38]. The expansion ofcavitation bubble into liquid medium exerts a recoil pressure on themetallic melt formed under plasma plume. Recoil pressure splashesthe melt and residual recoil pressure redistributes the metallicmelt. Former process guides the fabrication of nanoparticles andlatter leads to the fabrication of nanostructures. Nanoentities insidethe cavitation bubble are at a higher temperature than liquid envi-ronment. Ag nano-materials exhibit fascinating electronic, optical,and other physical properties depending on their crystallinity,composition, shape, and size. Furthermore, Ag NPs support stronglocalization of surface plasmon resonances (LSPR) [39–41] thanthe other well known plasmonic metals. Besides, Ag colloids andnanostructured Ag targets (with grating formation along with thepresence of Ag nanoparticle grains) act as an efficient SERS activeplatform through the excitation of propagating surface plasmons(surface plasmon polaritons) and non-propagating surface plas-mons (localized surface plasmons) [42,43].
Size and shape of the fabricated metallic nanomaterials in PLALnot only depend on laser parameters [44–48] such as wavelength,pulse duration, energy per pulse, repetition rate, beam waist at thefocus, number of laser pulses per spot but also on the nature ofsurrounding liquid. Extensive studies of laser ablation in liquidsinvestigating some of these parameters and resulting applicationsof the generated NPs have been performed by Meunier group[49–53]. Amendola et al. [36] carried out an extensive study of PLALthrough formation of cavitation bubble and provided a panoramicview of how the various laser parameters and the nature of liq-uid influenced ablation in a qualitative manner. However, veryfew articles extensively dealt with detailed dynamics of laser abla-tion in liquid and dependence of products on laser parameters[54–56]. Notwithstanding several works reporting fabrication ofAg nanomaterials (both NPs and NSs) through pulsed laser abla-tion in liquids, effect of nonzero angle of incidence has not yetbeen attempted/reported. Earlier reports have demonstrated theeffect of lateral beam waist on ablation but not the axial beamwaist which is also the part of ablation when the angle of incidenceis changed. Ganeev and Jia [57] investigated surface modificationsof silicon through laser ablation with fs pulses at an angle of inci-dence close to Brewster angle using interferometry and studied thedependence of grating period on the angle of incidence. Sing andTripathi [58] dealt the laser beat wave excitation of surface plasmawave at an oblique incidence of laser beams through which beamsexerted a ponder motive force on free electrons at the frequencyof beat, consequently producing a nonlinear current that drivesplasma wave resonantly. The surface plasma wave causes an effi-cient heating of electron system which leads to ablation of materialand thus the dependence of ablation on angle of incident laser beamwas retrieved theoretically. George et al. [59] reported the angu-lar dependence of focused ns laser pulses on to polymer films atmoderate energies revealing the control of complex nanostructureformation at oblique incidences.
In our earlier works, fabrication and effects of polarity of liquidmedium was investigated through ablation studies of Al targets in
polar and non-polar liquid media [15]. The effects of over writing(multiple/double/single line ablation) of Ag/Cu substrates in dif-ferent liquid media were also investigated along with the Ramanactivity of fabricated NSs/NPs [46,60]. In continuation of our earlierwork, dependence of non-zero angle of incidence on ablation of Agsubstrate in double distilled water is investigated in the presentwork. Most of the earlier studies of ablation at non-zero angle oflaser incidence were carried out in ambient air and that too for non-metals. In the present work we attempted to (a) fabricate the Agnanomaterials for 5◦, 15◦, 30◦and 45◦ angle of laser incidence on thetarget surface (experiments were also repeated for constant fluenceon the target surface at these four angles of incidence) (b) inves-tigate the specific angle of incidence at which superior productswere achieved after ablation (c) characterize the nonlinear optical(NLO) properties of the prepared Ag colloids using fs degeneratefour wave mixing (fs-DFWM) at 800 nm in the BOXCARS geometry(d) investigate surface enhanced Raman activity of Ag substratesfabricated at different angles of incidence with Rhodamine 6G (�Mconcentration) in methanol excited with 532 nm and 785 nm (d)record the Raman spectra of high explosive molecule of 5-amino-3-nitro-1H-1,2,4-triazole (ANTA) at mM and �M concentrations. Inthis communication we also report the multiple utility of Ag NSswhen combined with appropriate cleaning methods.
2. Experimental details
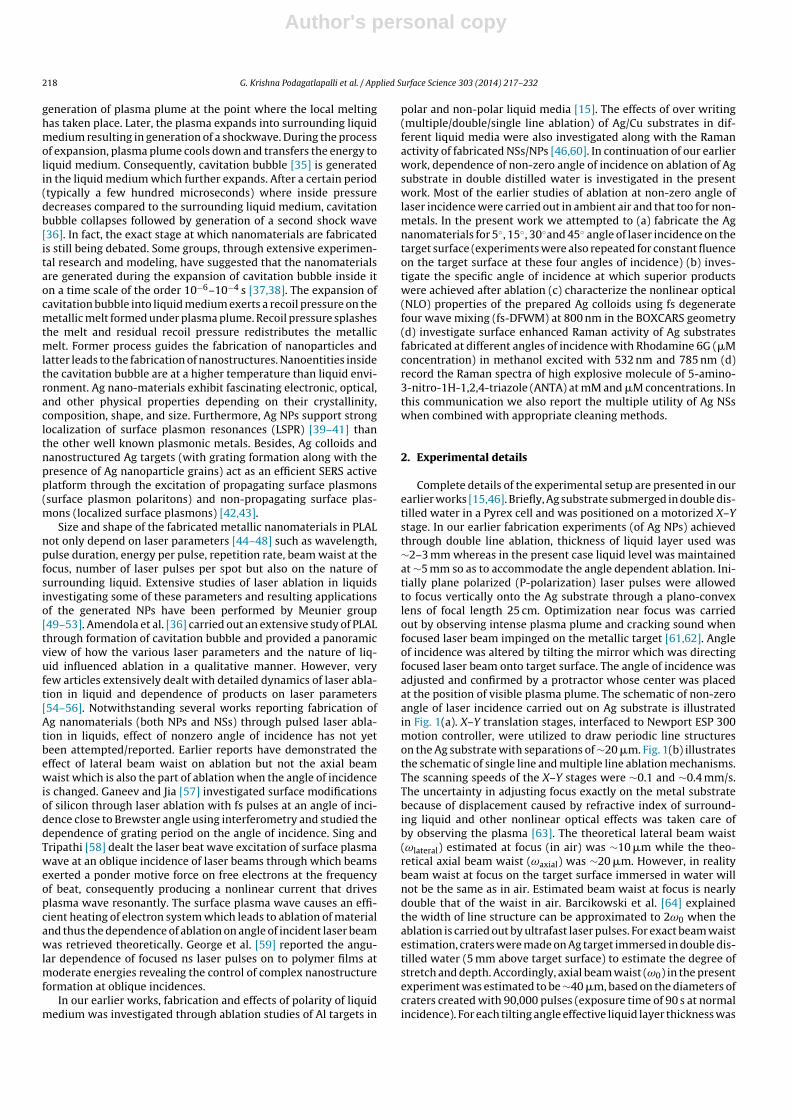
Complete details of the experimental setup are presented in ourearlier works [15,46]. Briefly, Ag substrate submerged in double dis-tilled water in a Pyrex cell and was positioned on a motorized X–Ystage. In our earlier fabrication experiments (of Ag NPs) achievedthrough double line ablation, thickness of liquid layer used was∼2–3 mm whereas in the present case liquid level was maintainedat ∼5 mm so as to accommodate the angle dependent ablation. Ini-tially plane polarized (P-polarization) laser pulses were allowedto focus vertically onto the Ag substrate through a plano-convexlens of focal length 25 cm. Optimization near focus was carriedout by observing intense plasma plume and cracking sound whenfocused laser beam impinged on the metallic target [61,62]. Angleof incidence was altered by tilting the mirror which was directingfocused laser beam onto target surface. The angle of incidence wasadjusted and confirmed by a protractor whose center was placedat the position of visible plasma plume. The schematic of non-zeroangle of laser incidence carried out on Ag substrate is illustratedin Fig. 1(a). X–Y translation stages, interfaced to Newport ESP 300motion controller, were utilized to draw periodic line structureson the Ag substrate with separations of ∼20 �m. Fig. 1(b) illustratesthe schematic of single line and multiple line ablation mechanisms.The scanning speeds of the X–Y stages were ∼0.1 and ∼0.4 mm/s.The uncertainty in adjusting focus exactly on the metal substratebecause of displacement caused by refractive index of surround-ing liquid and other nonlinear optical effects was taken care ofby observing the plasma [63]. The theoretical lateral beam waist(ωlateral) estimated at focus (in air) was ∼10 �m while the theo-retical axial beam waist (ωaxial) was ∼20 �m. However, in realitybeam waist at focus on the target surface immersed in water willnot be the same as in air. Estimated beam waist at focus is nearlydouble that of the waist in air. Barcikowski et al. [64] explainedthe width of line structure can be approximated to 2ω0 when theablation is carried out by ultrafast laser pulses. For exact beam waistestimation, craters were made on Ag target immersed in double dis-tilled water (5 mm above target surface) to estimate the degree ofstretch and depth. Accordingly, axial beam waist (ω0) in the presentexperiment was estimated to be ∼40 �m, based on the diameters ofcraters created with 90,000 pulses (exposure time of 90 s at normalincidence). For each tilting angle effective liquid layer thickness was
Author's personal copy
G. Krishna Podagatlapalli et al. / Applied Surface Science 303 (2014) 217–232 219
Fig. 1. (a) Experimental scheme of laser ablation of Ag substrate immersed in doubledistilled water with different angles of laser incidence with respect to the normal(b) Schematic of single line and multiple line ablation.
measured [63,65] from the cosine angle. From the effective thick-ness of liquid layer dzl (the extent to which focusing lens has tobe displaced) was measured. This estimate revealed that the posi-tions of lens to be displaced [to adjust the focus to be exactly on
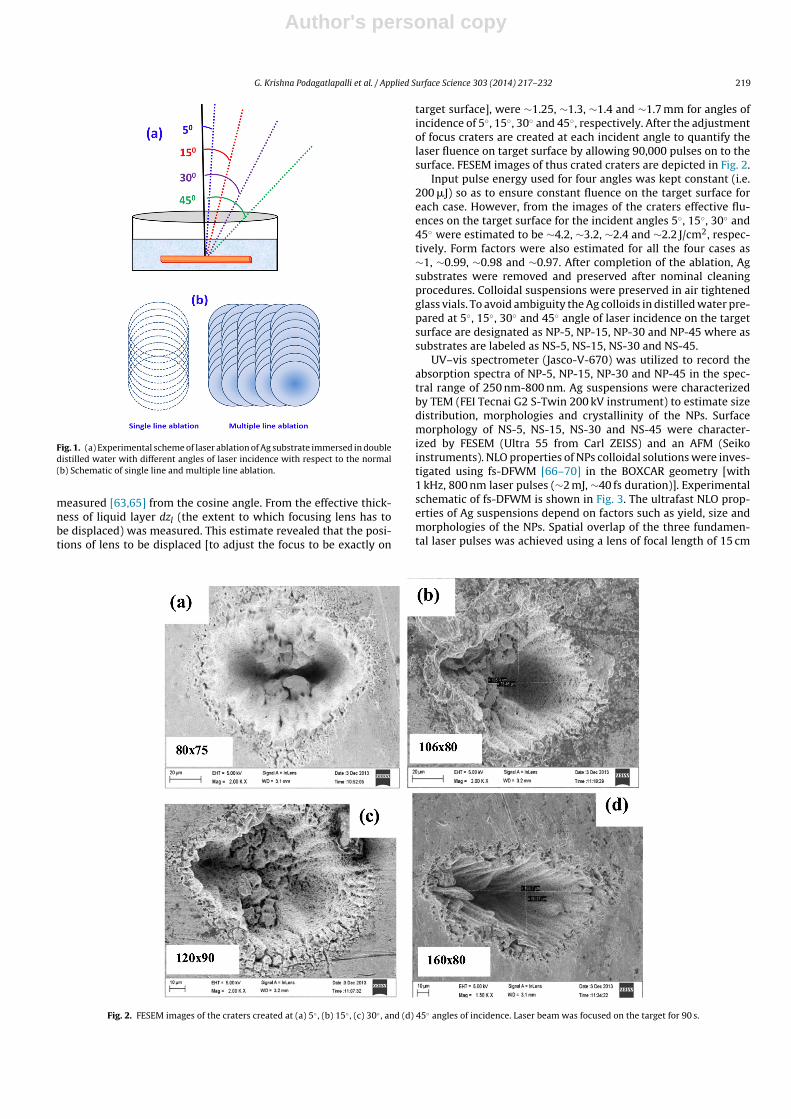
target surface], were ∼1.25, ∼1.3, ∼1.4 and ∼1.7 mm for angles ofincidence of 5◦, 15◦, 30◦ and 45◦, respectively. After the adjustmentof focus craters are created at each incident angle to quantify thelaser fluence on target surface by allowing 90,000 pulses on to thesurface. FESEM images of thus crated craters are depicted in Fig. 2.
Input pulse energy used for four angles was kept constant (i.e.200 �J) so as to ensure constant fluence on the target surface foreach case. However, from the images of the craters effective flu-ences on the target surface for the incident angles 5◦, 15◦, 30◦ and45◦ were estimated to be ∼4.2, ∼3.2, ∼2.4 and ∼2.2 J/cm2, respec-tively. Form factors were also estimated for all the four cases as∼1, ∼0.99, ∼0.98 and ∼0.97. After completion of the ablation, Agsubstrates were removed and preserved after nominal cleaningprocedures. Colloidal suspensions were preserved in air tightenedglass vials. To avoid ambiguity the Ag colloids in distilled water pre-pared at 5◦, 15◦, 30◦ and 45◦ angle of laser incidence on the targetsurface are designated as NP-5, NP-15, NP-30 and NP-45 where assubstrates are labeled as NS-5, NS-15, NS-30 and NS-45.
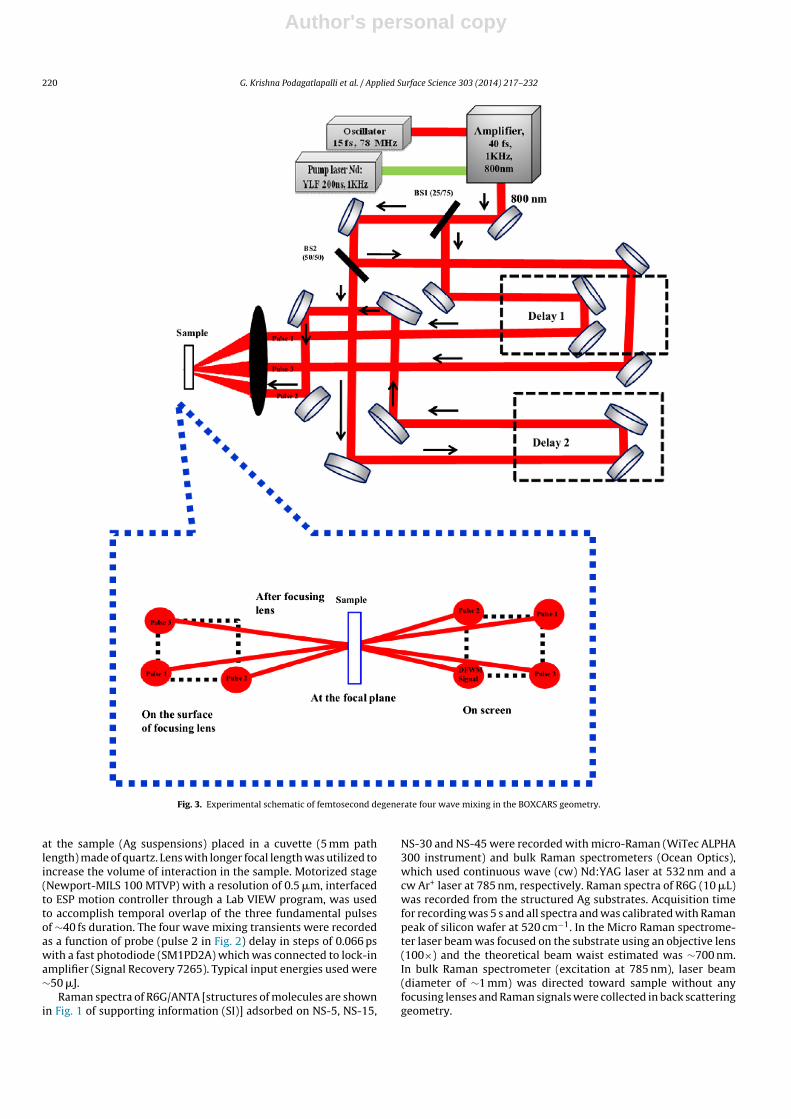
UV–vis spectrometer (Jasco-V-670) was utilized to record theabsorption spectra of NP-5, NP-15, NP-30 and NP-45 in the spec-tral range of 250 nm-800 nm. Ag suspensions were characterizedby TEM (FEI Tecnai G2 S-Twin 200 kV instrument) to estimate sizedistribution, morphologies and crystallinity of the NPs. Surfacemorphology of NS-5, NS-15, NS-30 and NS-45 were character-ized by FESEM (Ultra 55 from Carl ZEISS) and an AFM (Seikoinstruments). NLO properties of NPs colloidal solutions were inves-tigated using fs-DFWM [66–70] in the BOXCAR geometry [with1 kHz, 800 nm laser pulses (∼2 mJ, ∼40 fs duration)]. Experimentalschematic of fs-DFWM is shown in Fig. 3. The ultrafast NLO prop-erties of Ag suspensions depend on factors such as yield, size andmorphologies of the NPs. Spatial overlap of the three fundamen-tal laser pulses was achieved using a lens of focal length of 15 cm
Fig. 2. FESEM images of the craters created at (a) 5◦ , (b) 15◦ , (c) 30◦ , and (d) 45◦ angles of incidence. Laser beam was focused on the target for 90 s.
Author's personal copy
220 G. Krishna Podagatlapalli et al. / Applied Surface Science 303 (2014) 217–232
Fig. 3. Experimental schematic of femtosecond degenerate four wave mixing in the BOXCARS geometry.
at the sample (Ag suspensions) placed in a cuvette (5 mm pathlength) made of quartz. Lens with longer focal length was utilized toincrease the volume of interaction in the sample. Motorized stage(Newport-MILS 100 MTVP) with a resolution of 0.5 �m, interfacedto ESP motion controller through a Lab VIEW program, was usedto accomplish temporal overlap of the three fundamental pulsesof ∼40 fs duration. The four wave mixing transients were recordedas a function of probe (pulse 2 in Fig. 2) delay in steps of 0.066 pswith a fast photodiode (SM1PD2A) which was connected to lock-inamplifier (Signal Recovery 7265). Typical input energies used were∼50 �J.
Raman spectra of R6G/ANTA [structures of molecules are shownin Fig. 1 of supporting information (SI)] adsorbed on NS-5, NS-15,
NS-30 and NS-45 were recorded with micro-Raman (WiTec ALPHA300 instrument) and bulk Raman spectrometers (Ocean Optics),which used continuous wave (cw) Nd:YAG laser at 532 nm and acw Ar+ laser at 785 nm, respectively. Raman spectra of R6G (10 �L)was recorded from the structured Ag substrates. Acquisition timefor recording was 5 s and all spectra and was calibrated with Ramanpeak of silicon wafer at 520 cm−1. In the Micro Raman spectrome-ter laser beam was focused on the substrate using an objective lens(100×) and the theoretical beam waist estimated was ∼700 nm.In bulk Raman spectrometer (excitation at 785 nm), laser beam(diameter of ∼1 mm) was directed toward sample without anyfocusing lenses and Raman signals were collected in back scatteringgeometry.
Author's personal copy
G. Krishna Podagatlapalli et al. / Applied Surface Science 303 (2014) 217–232 221
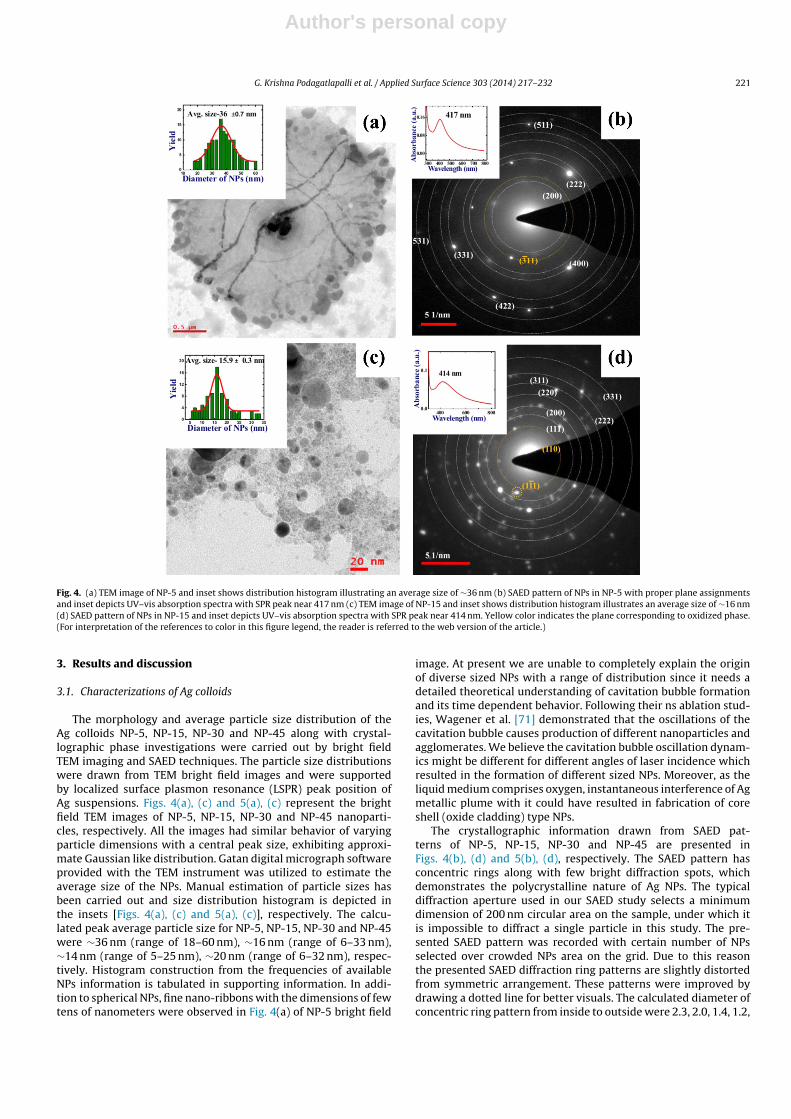
Fig. 4. (a) TEM image of NP-5 and inset shows distribution histogram illustrating an average size of ∼36 nm (b) SAED pattern of NPs in NP-5 with proper plane assignmentsand inset depicts UV–vis absorption spectra with SPR peak near 417 nm (c) TEM image of NP-15 and inset shows distribution histogram illustrates an average size of ∼16 nm(d) SAED pattern of NPs in NP-15 and inset depicts UV–vis absorption spectra with SPR peak near 414 nm. Yellow color indicates the plane corresponding to oxidized phase.(For interpretation of the references to color in this figure legend, the reader is referred to the web version of the article.)
3. Results and discussion
3.1. Characterizations of Ag colloids
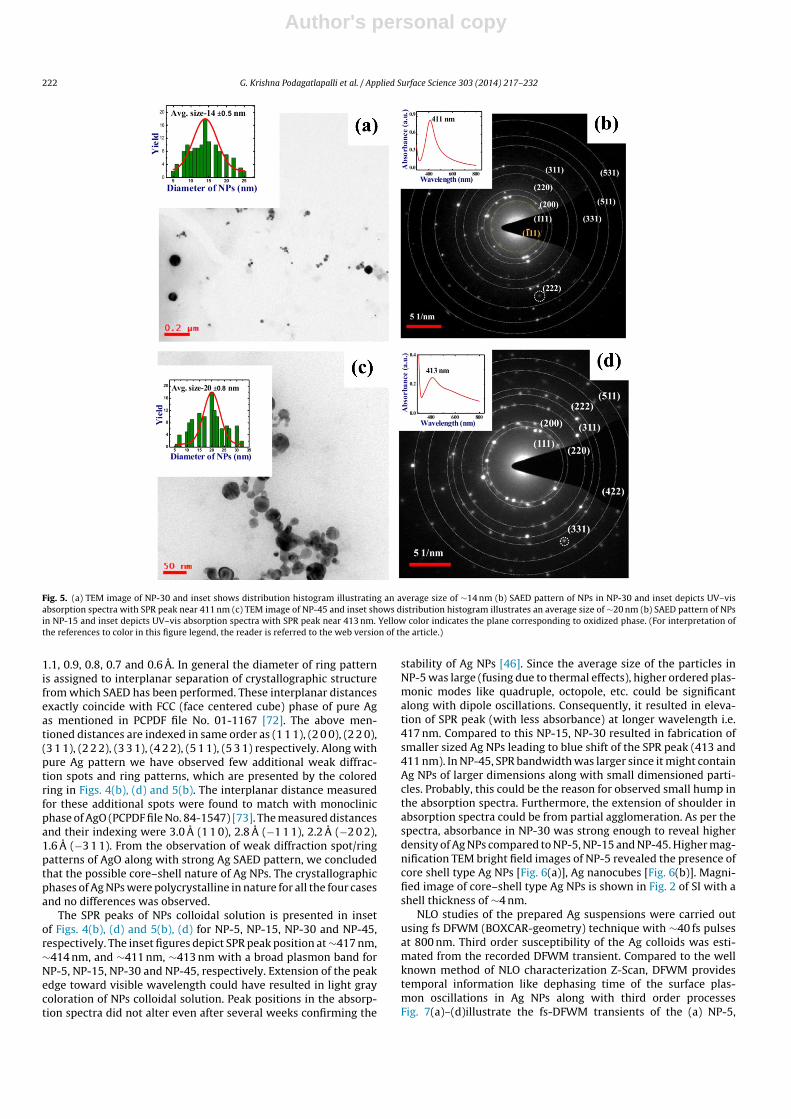
The morphology and average particle size distribution of theAg colloids NP-5, NP-15, NP-30 and NP-45 along with crystal-lographic phase investigations were carried out by bright fieldTEM imaging and SAED techniques. The particle size distributionswere drawn from TEM bright field images and were supportedby localized surface plasmon resonance (LSPR) peak position ofAg suspensions. Figs. 4(a), (c) and 5(a), (c) represent the brightfield TEM images of NP-5, NP-15, NP-30 and NP-45 nanoparti-cles, respectively. All the images had similar behavior of varyingparticle dimensions with a central peak size, exhibiting approxi-mate Gaussian like distribution. Gatan digital micrograph softwareprovided with the TEM instrument was utilized to estimate theaverage size of the NPs. Manual estimation of particle sizes hasbeen carried out and size distribution histogram is depicted inthe insets [Figs. 4(a), (c) and 5(a), (c)], respectively. The calcu-lated peak average particle size for NP-5, NP-15, NP-30 and NP-45were ∼36 nm (range of 18–60 nm), ∼16 nm (range of 6–33 nm),∼14 nm (range of 5–25 nm), ∼20 nm (range of 6–32 nm), respec-tively. Histogram construction from the frequencies of availableNPs information is tabulated in supporting information. In addi-tion to spherical NPs, fine nano-ribbons with the dimensions of fewtens of nanometers were observed in Fig. 4(a) of NP-5 bright field
image. At present we are unable to completely explain the originof diverse sized NPs with a range of distribution since it needs adetailed theoretical understanding of cavitation bubble formationand its time dependent behavior. Following their ns ablation stud-ies, Wagener et al. [71] demonstrated that the oscillations of thecavitation bubble causes production of different nanoparticles andagglomerates. We believe the cavitation bubble oscillation dynam-ics might be different for different angles of laser incidence whichresulted in the formation of different sized NPs. Moreover, as theliquid medium comprises oxygen, instantaneous interference of Agmetallic plume with it could have resulted in fabrication of coreshell (oxide cladding) type NPs.
The crystallographic information drawn from SAED pat-terns of NP-5, NP-15, NP-30 and NP-45 are presented inFigs. 4(b), (d) and 5(b), (d), respectively. The SAED pattern hasconcentric rings along with few bright diffraction spots, whichdemonstrates the polycrystalline nature of Ag NPs. The typicaldiffraction aperture used in our SAED study selects a minimumdimension of 200 nm circular area on the sample, under which itis impossible to diffract a single particle in this study. The pre-sented SAED pattern was recorded with certain number of NPsselected over crowded NPs area on the grid. Due to this reasonthe presented SAED diffraction ring patterns are slightly distortedfrom symmetric arrangement. These patterns were improved bydrawing a dotted line for better visuals. The calculated diameter ofconcentric ring pattern from inside to outside were 2.3, 2.0, 1.4, 1.2,
Author's personal copy
222 G. Krishna Podagatlapalli et al. / Applied Surface Science 303 (2014) 217–232
Fig. 5. (a) TEM image of NP-30 and inset shows distribution histogram illustrating an average size of ∼14 nm (b) SAED pattern of NPs in NP-30 and inset depicts UV–visabsorption spectra with SPR peak near 411 nm (c) TEM image of NP-45 and inset shows distribution histogram illustrates an average size of ∼20 nm (b) SAED pattern of NPsin NP-15 and inset depicts UV–vis absorption spectra with SPR peak near 413 nm. Yellow color indicates the plane corresponding to oxidized phase. (For interpretation ofthe references to color in this figure legend, the reader is referred to the web version of the article.)
1.1, 0.9, 0.8, 0.7 and 0.6 A. In general the diameter of ring patternis assigned to interplanar separation of crystallographic structurefrom which SAED has been performed. These interplanar distancesexactly coincide with FCC (face centered cube) phase of pure Agas mentioned in PCPDF file No. 01-1167 [72]. The above men-tioned distances are indexed in same order as (1 1 1), (2 0 0), (2 2 0),(3 1 1), (2 2 2), (3 3 1), (4 2 2), (5 1 1), (5 3 1) respectively. Along withpure Ag pattern we have observed few additional weak diffrac-tion spots and ring patterns, which are presented by the coloredring in Figs. 4(b), (d) and 5(b). The interplanar distance measuredfor these additional spots were found to match with monoclinicphase of AgO (PCPDF file No. 84-1547) [73]. The measured distancesand their indexing were 3.0 A (1 1 0), 2.8 A (−1 1 1), 2.2 A (−2 0 2),1.6 A (−3 1 1). From the observation of weak diffraction spot/ringpatterns of AgO along with strong Ag SAED pattern, we concludedthat the possible core–shell nature of Ag NPs. The crystallographicphases of Ag NPs were polycrystalline in nature for all the four casesand no differences was observed.
The SPR peaks of NPs colloidal solution is presented in insetof Figs. 4(b), (d) and 5(b), (d) for NP-5, NP-15, NP-30 and NP-45,respectively. The inset figures depict SPR peak position at ∼417 nm,∼414 nm, and ∼411 nm, ∼413 nm with a broad plasmon band forNP-5, NP-15, NP-30 and NP-45, respectively. Extension of the peakedge toward visible wavelength could have resulted in light graycoloration of NPs colloidal solution. Peak positions in the absorp-tion spectra did not alter even after several weeks confirming the
stability of Ag NPs [46]. Since the average size of the particles inNP-5 was large (fusing due to thermal effects), higher ordered plas-monic modes like quadruple, octopole, etc. could be significantalong with dipole oscillations. Consequently, it resulted in eleva-tion of SPR peak (with less absorbance) at longer wavelength i.e.417 nm. Compared to this NP-15, NP-30 resulted in fabrication ofsmaller sized Ag NPs leading to blue shift of the SPR peak (413 and411 nm). In NP-45, SPR bandwidth was larger since it might containAg NPs of larger dimensions along with small dimensioned parti-cles. Probably, this could be the reason for observed small hump inthe absorption spectra. Furthermore, the extension of shoulder inabsorption spectra could be from partial agglomeration. As per thespectra, absorbance in NP-30 was strong enough to reveal higherdensity of Ag NPs compared to NP-5, NP-15 and NP-45. Higher mag-nification TEM bright field images of NP-5 revealed the presence ofcore shell type Ag NPs [Fig. 6(a)], Ag nanocubes [Fig. 6(b)]. Magni-fied image of core–shell type Ag NPs is shown in Fig. 2 of SI with ashell thickness of ∼4 nm.
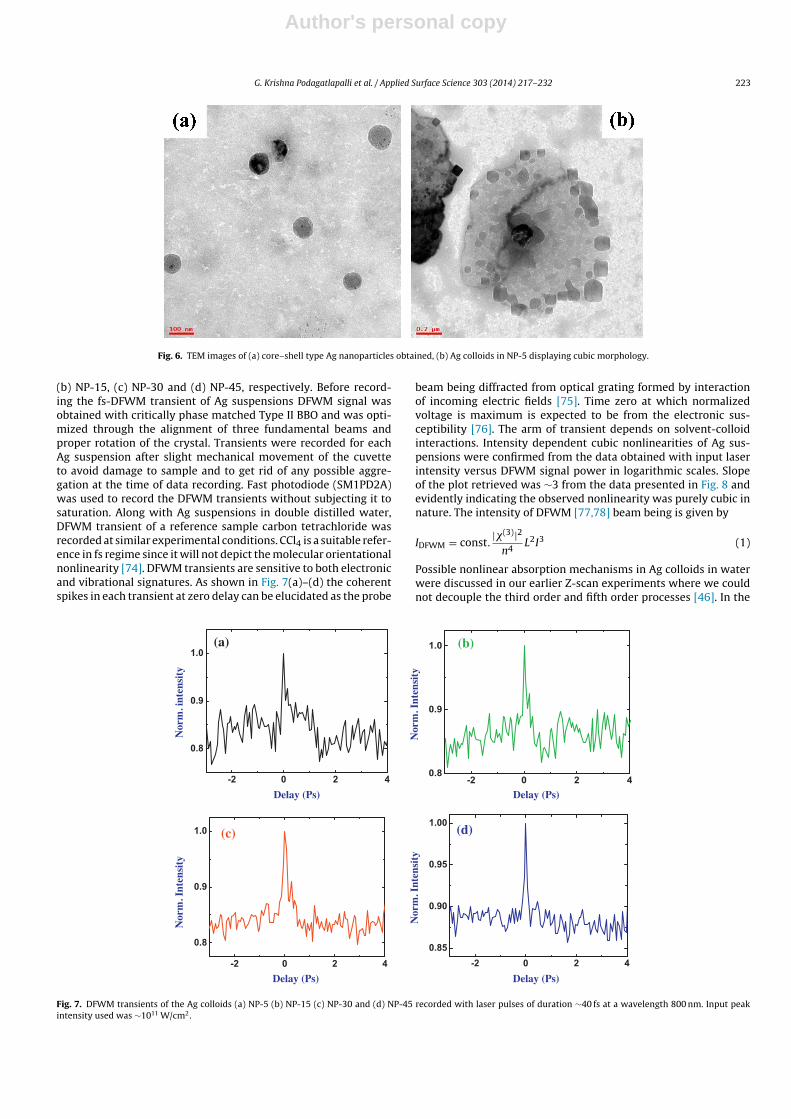
NLO studies of the prepared Ag suspensions were carried outusing fs DFWM (BOXCAR-geometry) technique with ∼40 fs pulsesat 800 nm. Third order susceptibility of the Ag colloids was esti-mated from the recorded DFWM transient. Compared to the wellknown method of NLO characterization Z-Scan, DFWM providestemporal information like dephasing time of the surface plas-mon oscillations in Ag NPs along with third order processesFig. 7(a)–(d)illustrate the fs-DFWM transients of the (a) NP-5,
Author's personal copy
G. Krishna Podagatlapalli et al. / Applied Surface Science 303 (2014) 217–232 223
Fig. 6. TEM images of (a) core–shell type Ag nanoparticles obtained, (b) Ag colloids in NP-5 displaying cubic morphology.
(b) NP-15, (c) NP-30 and (d) NP-45, respectively. Before record-ing the fs-DFWM transient of Ag suspensions DFWM signal wasobtained with critically phase matched Type II BBO and was opti-mized through the alignment of three fundamental beams andproper rotation of the crystal. Transients were recorded for eachAg suspension after slight mechanical movement of the cuvetteto avoid damage to sample and to get rid of any possible aggre-gation at the time of data recording. Fast photodiode (SM1PD2A)was used to record the DFWM transients without subjecting it tosaturation. Along with Ag suspensions in double distilled water,DFWM transient of a reference sample carbon tetrachloride wasrecorded at similar experimental conditions. CCl4 is a suitable refer-ence in fs regime since it will not depict the molecular orientationalnonlinearity [74]. DFWM transients are sensitive to both electronicand vibrational signatures. As shown in Fig. 7(a)–(d) the coherentspikes in each transient at zero delay can be elucidated as the probe
beam being diffracted from optical grating formed by interactionof incoming electric fields [75]. Time zero at which normalizedvoltage is maximum is expected to be from the electronic sus-ceptibility [76]. The arm of transient depends on solvent-colloidinteractions. Intensity dependent cubic nonlinearities of Ag sus-pensions were confirmed from the data obtained with input laserintensity versus DFWM signal power in logarithmic scales. Slopeof the plot retrieved was ∼3 from the data presented in Fig. 8 andevidently indicating the observed nonlinearity was purely cubic innature. The intensity of DFWM [77,78] beam being is given by
IDFWM = const.|�(3)|2
n4L2I3 (1)
Possible nonlinear absorption mechanisms in Ag colloids in waterwere discussed in our earlier Z-scan experiments where we couldnot decouple the third order and fifth order processes [46]. In the
-2 0 2 4
0.8
0.9
1.0
Nor
m. i
nten
sity
Delay (Ps)
(a)
-2 0 2 40.8
0.9
1.0
Nor
m. I
nten
sity
Delay (Ps)
(b)
-2 0 2 4
0.8
0.9
1.0
Nor
m. I
nten
sity
Delay (Ps)
(c)
-2 0 2 40.85
0.90
0.95
1.00
Nor
m. I
nten
sity
Delay (Ps)
(d)
Fig. 7. DFWM transients of the Ag colloids (a) NP-5 (b) NP-15 (c) NP-30 and (d) NP-45 recorded with laser pulses of duration ∼40 fs at a wavelength 800 nm. Input peakintensity used was ∼1011 W/cm2.
Author's personal copy
224 G. Krishna Podagatlapalli et al. / Applied Surface Science 303 (2014) 217–232
3E12 6E12 9E12 1.2E13
1E-6
1E-5
log 10
(DFW
M )
log10 (I ntensity )
Slope 2.7(a)
3E12 6E12 9E12 1.2E13
1E-6
1E-5
(b)
log 10
(DFW
M )
log10 (I ntensity )
Slo pe 2.7
3E12 6E12 9E12 1.2E13
1E-6
1E-5
(c)
log 10
(DFW
M )
log10 (I ntensity )
Slop e 2.8
3E12 6E12 9E12 1.2 E13
1E-6
1E-5(d)
log 10
(DFW
M )
log10 (I ntensity )
Slope 2.7
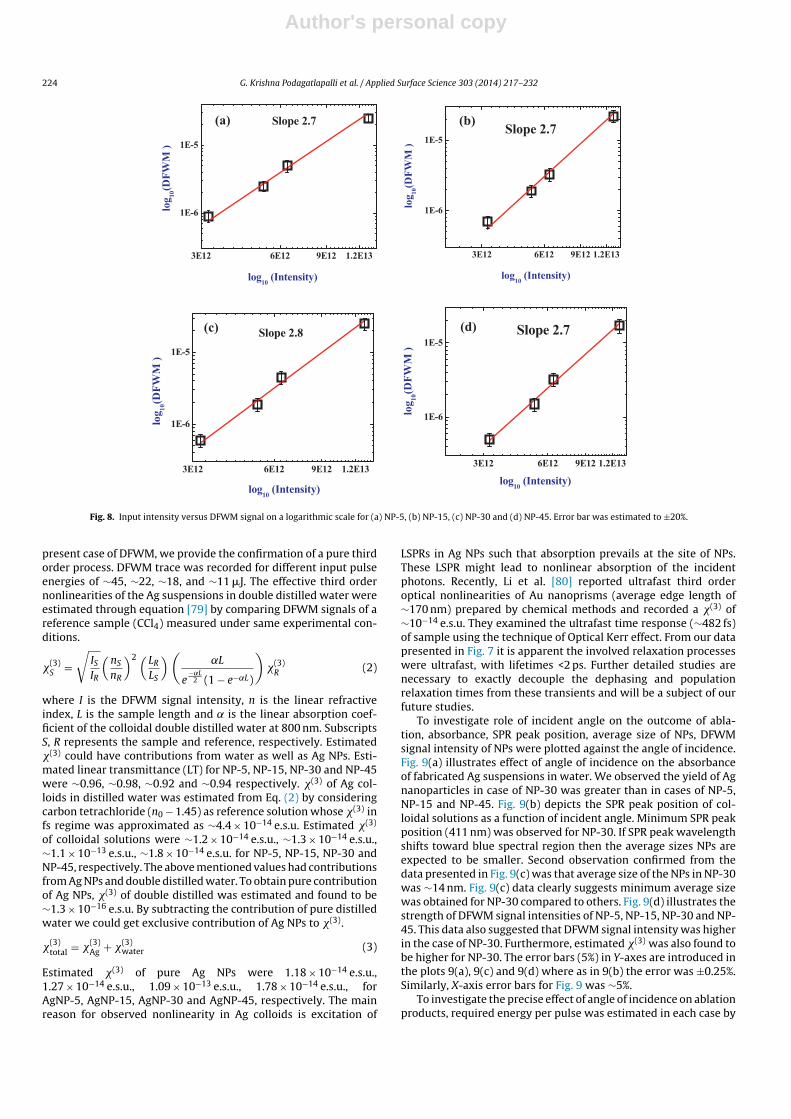
Fig. 8. Input intensity versus DFWM signal on a logarithmic scale for (a) NP-5, (b) NP-15, (c) NP-30 and (d) NP-45. Error bar was estimated to ±20%.
present case of DFWM, we provide the confirmation of a pure thirdorder process. DFWM trace was recorded for different input pulseenergies of ∼45, ∼22, ∼18, and ∼11 �J. The effective third ordernonlinearities of the Ag suspensions in double distilled water wereestimated through equation [79] by comparing DFWM signals of areference sample (CCl4) measured under same experimental con-ditions.
�(3)S =
√ISIR
(nS
nR
)2 (LR
LS
)(˛L
e−˛L
2 (1 − e−˛L)
)�(3)
R (2)
where I is the DFWM signal intensity, n is the linear refractiveindex, L is the sample length and is the linear absorption coef-ficient of the colloidal double distilled water at 800 nm. SubscriptsS, R represents the sample and reference, respectively. Estimated�(3) could have contributions from water as well as Ag NPs. Esti-mated linear transmittance (LT) for NP-5, NP-15, NP-30 and NP-45were ∼0.96, ∼0.98, ∼0.92 and ∼0.94 respectively. �(3) of Ag col-loids in distilled water was estimated from Eq. (2) by consideringcarbon tetrachloride (n0 − 1.45) as reference solution whose �(3) infs regime was approximated as ∼4.4 × 10⁻¹⁴ e.s.u. Estimated �(3)
of colloidal solutions were ∼1.2 × 10⁻¹⁴ e.s.u., ∼1.3 × 10⁻¹⁴ e.s.u.,∼1.1 × 10⁻¹³ e.s.u., ∼1.8 × 10⁻¹⁴ e.s.u. for NP-5, NP-15, NP-30 andNP-45, respectively. The above mentioned values had contributionsfrom Ag NPs and double distilled water. To obtain pure contributionof Ag NPs, �(3) of double distilled was estimated and found to be∼1.3 × 10⁻¹⁶ e.s.u. By subtracting the contribution of pure distilledwater we could get exclusive contribution of Ag NPs to �(3).
�(3)total = �(3)
Ag + �(3)water (3)
Estimated �(3) of pure Ag NPs were 1.18 × 10⁻¹⁴ e.s.u.,1.27 × 10−14 e.s.u., 1.09 × 10⁻¹³ e.s.u., 1.78 × 10⁻¹⁴ e.s.u., forAgNP-5, AgNP-15, AgNP-30 and AgNP-45, respectively. The mainreason for observed nonlinearity in Ag colloids is excitation of
LSPRs in Ag NPs such that absorption prevails at the site of NPs.These LSPR might lead to nonlinear absorption of the incidentphotons. Recently, Li et al. [80] reported ultrafast third orderoptical nonlinearities of Au nanoprisms (average edge length of∼170 nm) prepared by chemical methods and recorded a �(3) of∼10−14 e.s.u. They examined the ultrafast time response (∼482 fs)of sample using the technique of Optical Kerr effect. From our datapresented in Fig. 7 it is apparent the involved relaxation processeswere ultrafast, with lifetimes <2 ps. Further detailed studies arenecessary to exactly decouple the dephasing and populationrelaxation times from these transients and will be a subject of ourfuture studies.
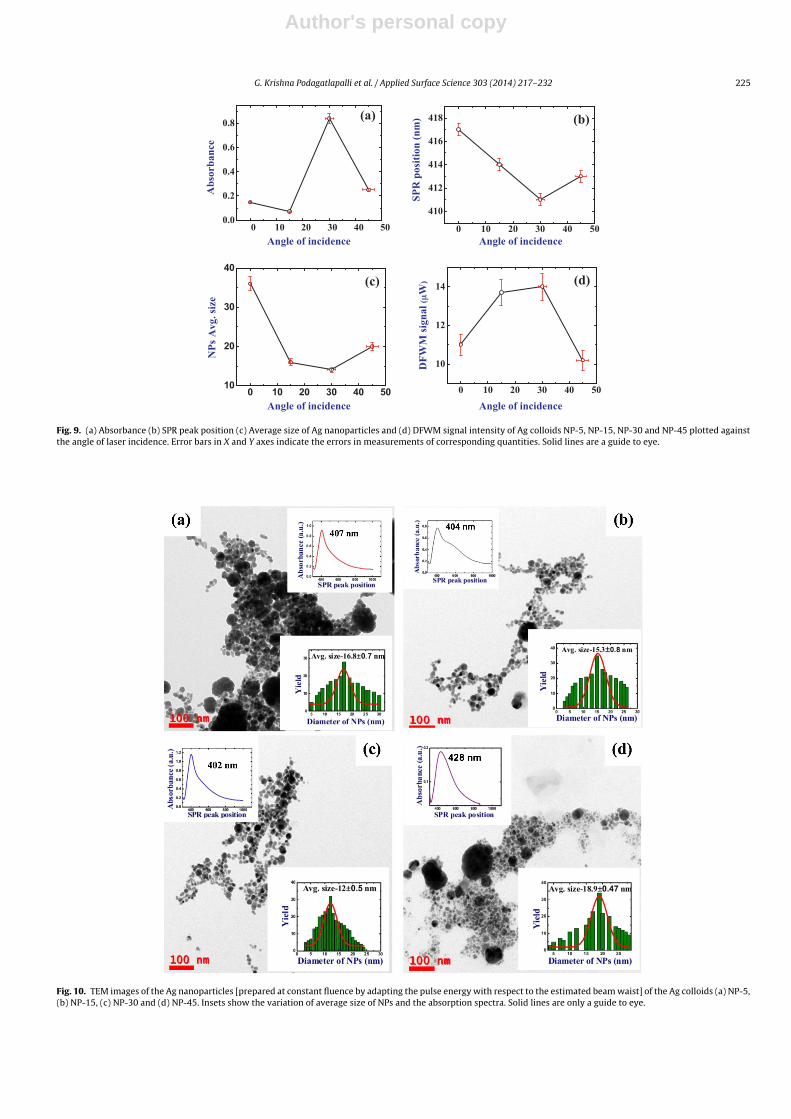
To investigate role of incident angle on the outcome of abla-tion, absorbance, SPR peak position, average size of NPs, DFWMsignal intensity of NPs were plotted against the angle of incidence.Fig. 9(a) illustrates effect of angle of incidence on the absorbanceof fabricated Ag suspensions in water. We observed the yield of Agnanoparticles in case of NP-30 was greater than in cases of NP-5,NP-15 and NP-45. Fig. 9(b) depicts the SPR peak position of col-loidal solutions as a function of incident angle. Minimum SPR peakposition (411 nm) was observed for NP-30. If SPR peak wavelengthshifts toward blue spectral region then the average sizes NPs areexpected to be smaller. Second observation confirmed from thedata presented in Fig. 9(c) was that average size of the NPs in NP-30was ∼14 nm. Fig. 9(c) data clearly suggests minimum average sizewas obtained for NP-30 compared to others. Fig. 9(d) illustrates thestrength of DFWM signal intensities of NP-5, NP-15, NP-30 and NP-45. This data also suggested that DFWM signal intensity was higherin the case of NP-30. Furthermore, estimated �(3) was also found tobe higher for NP-30. The error bars (5%) in Y-axes are introduced inthe plots 9(a), 9(c) and 9(d) where as in 9(b) the error was ±0.25%.Similarly, X-axis error bars for Fig. 9 was ∼5%.
To investigate the precise effect of angle of incidence on ablationproducts, required energy per pulse was estimated in each case by
Author's personal copy
G. Krishna Podagatlapalli et al. / Applied Surface Science 303 (2014) 217–232 225
0 10 20 30 40 500.0
0.2
0.4
0.6
0.8
Abs
orba
nce
(a)
0 10 20 30 40 50
10
12
14 (d)
DFW
M si
gnal
(μW
)
0 10 20 30 40 50
410
412
414
416
418 (b)
SPR
pos
ition
(nm
)
0 10 20 30 40 5010
20
30
40(c)
NPs
Avg
. siz
e
Angle of incidence Angle of incidence
Angle of incidence Angle of incidence
Fig. 9. (a) Absorbance (b) SPR peak position (c) Average size of Ag nanoparticles and (d) DFWM signal intensity of Ag colloids NP-5, NP-15, NP-30 and NP-45 plotted againstthe angle of laser incidence. Error bars in X and Y axes indicate the errors in measurements of corresponding quantities. Solid lines are a guide to eye.
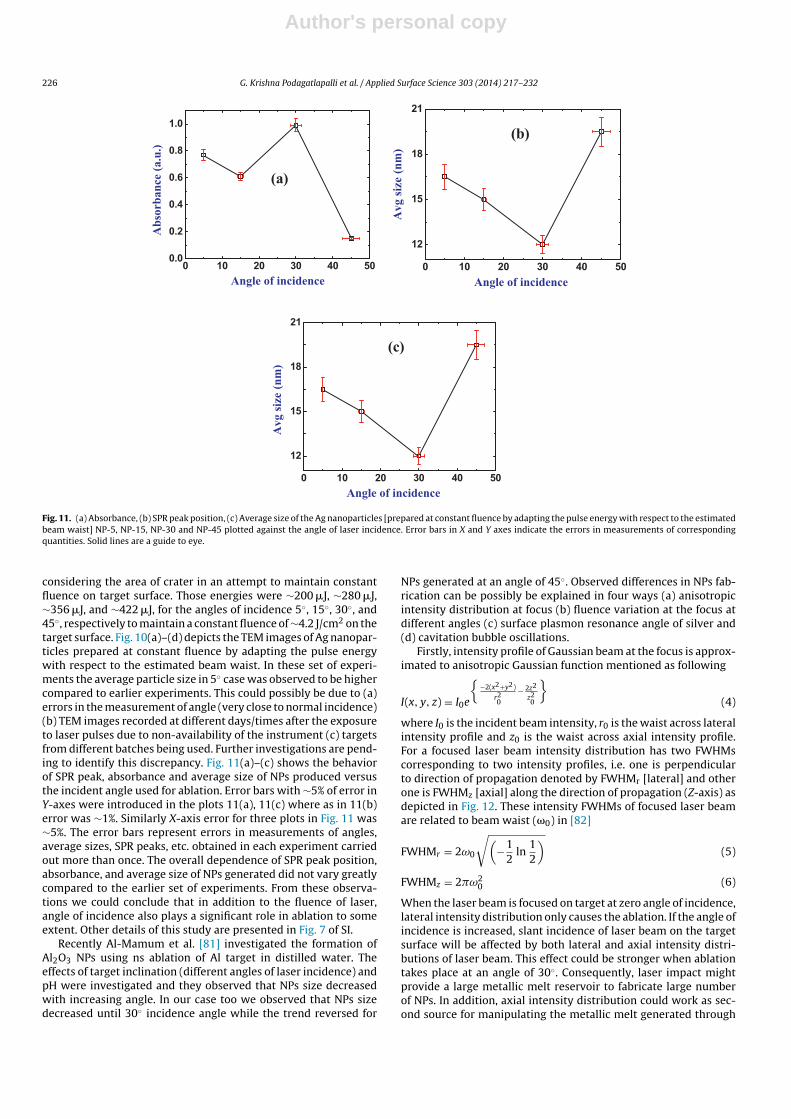
Fig. 10. TEM images of the Ag nanoparticles [prepared at constant fluence by adapting the pulse energy with respect to the estimated beam waist] of the Ag colloids (a) NP-5,(b) NP-15, (c) NP-30 and (d) NP-45. Insets show the variation of average size of NPs and the absorption spectra. Solid lines are only a guide to eye.
Author's personal copy
226 G. Krishna Podagatlapalli et al. / Applied Surface Science 303 (2014) 217–232
0 10 20 30 40 50
12
15
18
21
(c)
Avg
size
(nm
)
Angle of incidence
0 10 20 30 40 500.0
0.2
0.4
0.6
0.8
1.0
Angle of incidence
Abs
orba
nce
(a.u
.)
(a)
0 10 20 30 40 50
12
15
18
21
(b)
Avg
size
(nm
)
Angle of incidence
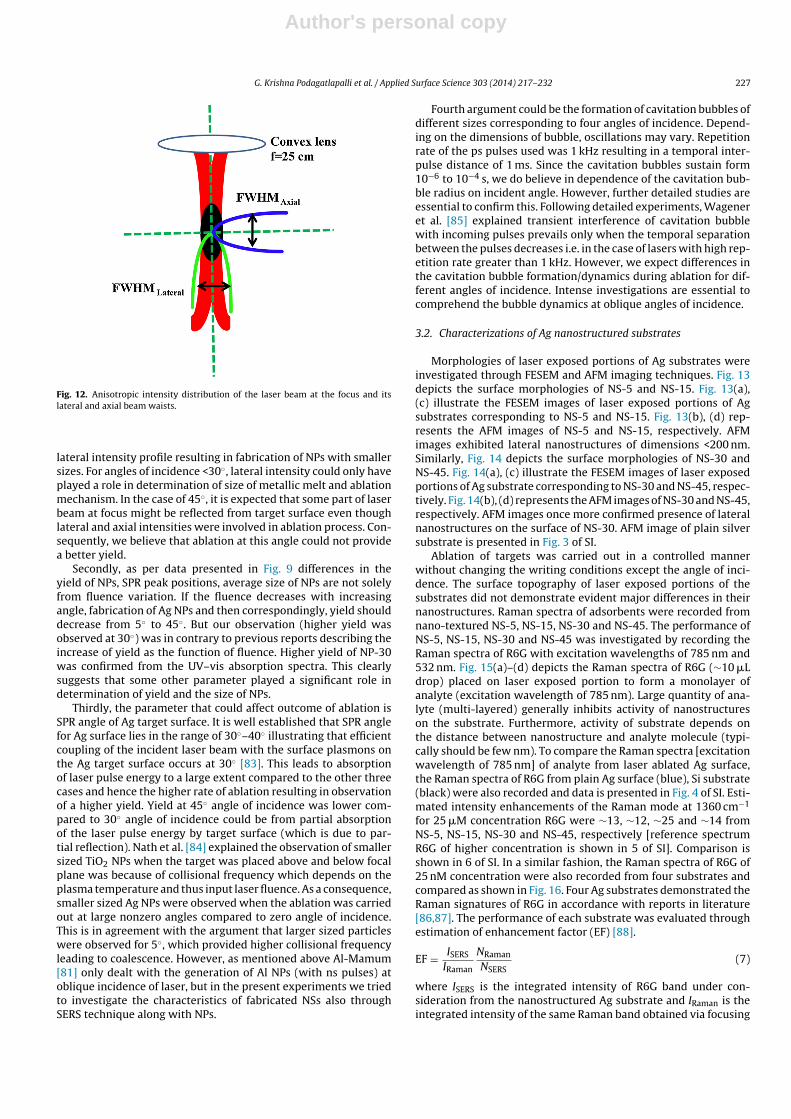
Fig. 11. (a) Absorbance, (b) SPR peak position, (c) Average size of the Ag nanoparticles [prepared at constant fluence by adapting the pulse energy with respect to the estimatedbeam waist] NP-5, NP-15, NP-30 and NP-45 plotted against the angle of laser incidence. Error bars in X and Y axes indicate the errors in measurements of correspondingquantities. Solid lines are a guide to eye.
considering the area of crater in an attempt to maintain constantfluence on target surface. Those energies were ∼200 �J, ∼280 �J,∼356 �J, and ∼422 �J, for the angles of incidence 5◦, 15◦, 30◦, and45◦, respectively to maintain a constant fluence of ∼4.2 J/cm2 on thetarget surface. Fig. 10(a)–(d) depicts the TEM images of Ag nanopar-ticles prepared at constant fluence by adapting the pulse energywith respect to the estimated beam waist. In these set of experi-ments the average particle size in 5◦ case was observed to be highercompared to earlier experiments. This could possibly be due to (a)errors in the measurement of angle (very close to normal incidence)(b) TEM images recorded at different days/times after the exposureto laser pulses due to non-availability of the instrument (c) targetsfrom different batches being used. Further investigations are pend-ing to identify this discrepancy. Fig. 11(a)–(c) shows the behaviorof SPR peak, absorbance and average size of NPs produced versusthe incident angle used for ablation. Error bars with ∼5% of error inY-axes were introduced in the plots 11(a), 11(c) where as in 11(b)error was ∼1%. Similarly X-axis error for three plots in Fig. 11 was∼5%. The error bars represent errors in measurements of angles,average sizes, SPR peaks, etc. obtained in each experiment carriedout more than once. The overall dependence of SPR peak position,absorbance, and average size of NPs generated did not vary greatlycompared to the earlier set of experiments. From these observa-tions we could conclude that in addition to the fluence of laser,angle of incidence also plays a significant role in ablation to someextent. Other details of this study are presented in Fig. 7 of SI.
Recently Al-Mamum et al. [81] investigated the formation ofAl2O3 NPs using ns ablation of Al target in distilled water. Theeffects of target inclination (different angles of laser incidence) andpH were investigated and they observed that NPs size decreasedwith increasing angle. In our case too we observed that NPs sizedecreased until 30◦ incidence angle while the trend reversed for
NPs generated at an angle of 45◦. Observed differences in NPs fab-rication can be possibly be explained in four ways (a) anisotropicintensity distribution at focus (b) fluence variation at the focus atdifferent angles (c) surface plasmon resonance angle of silver and(d) cavitation bubble oscillations.
Firstly, intensity profile of Gaussian beam at the focus is approx-imated to anisotropic Gaussian function mentioned as following
I(x, y, z) = I0e
{−2(x2+y2)
r20
− 2z2
z20
}(4)
where I0 is the incident beam intensity, r0 is the waist across lateralintensity profile and z0 is the waist across axial intensity profile.For a focused laser beam intensity distribution has two FWHMscorresponding to two intensity profiles, i.e. one is perpendicularto direction of propagation denoted by FWHMr [lateral] and otherone is FWHMz [axial] along the direction of propagation (Z-axis) asdepicted in Fig. 12. These intensity FWHMs of focused laser beamare related to beam waist (�0) in [82]
FWHMr = 2ω0
√(−1
2ln
12
)(5)
FWHMz = 2�ω20 (6)
When the laser beam is focused on target at zero angle of incidence,lateral intensity distribution only causes the ablation. If the angle ofincidence is increased, slant incidence of laser beam on the targetsurface will be affected by both lateral and axial intensity distri-butions of laser beam. This effect could be stronger when ablationtakes place at an angle of 30◦. Consequently, laser impact mightprovide a large metallic melt reservoir to fabricate large numberof NPs. In addition, axial intensity distribution could work as sec-ond source for manipulating the metallic melt generated through
Author's personal copy
G. Krishna Podagatlapalli et al. / Applied Surface Science 303 (2014) 217–232 227
Fig. 12. Anisotropic intensity distribution of the laser beam at the focus and itslateral and axial beam waists.
lateral intensity profile resulting in fabrication of NPs with smallersizes. For angles of incidence <30◦, lateral intensity could only haveplayed a role in determination of size of metallic melt and ablationmechanism. In the case of 45◦, it is expected that some part of laserbeam at focus might be reflected from target surface even thoughlateral and axial intensities were involved in ablation process. Con-sequently, we believe that ablation at this angle could not providea better yield.
Secondly, as per data presented in Fig. 9 differences in theyield of NPs, SPR peak positions, average size of NPs are not solelyfrom fluence variation. If the fluence decreases with increasingangle, fabrication of Ag NPs and then correspondingly, yield shoulddecrease from 5◦ to 45◦. But our observation (higher yield wasobserved at 30◦) was in contrary to previous reports describing theincrease of yield as the function of fluence. Higher yield of NP-30was confirmed from the UV–vis absorption spectra. This clearlysuggests that some other parameter played a significant role indetermination of yield and the size of NPs.
Thirdly, the parameter that could affect outcome of ablation isSPR angle of Ag target surface. It is well established that SPR anglefor Ag surface lies in the range of 30◦–40◦ illustrating that efficientcoupling of the incident laser beam with the surface plasmons onthe Ag target surface occurs at 30◦ [83]. This leads to absorptionof laser pulse energy to a large extent compared to the other threecases and hence the higher rate of ablation resulting in observationof a higher yield. Yield at 45◦ angle of incidence was lower com-pared to 30◦ angle of incidence could be from partial absorptionof the laser pulse energy by target surface (which is due to par-tial reflection). Nath et al. [84] explained the observation of smallersized TiO2 NPs when the target was placed above and below focalplane was because of collisional frequency which depends on theplasma temperature and thus input laser fluence. As a consequence,smaller sized Ag NPs were observed when the ablation was carriedout at large nonzero angles compared to zero angle of incidence.This is in agreement with the argument that larger sized particleswere observed for 5◦, which provided higher collisional frequencyleading to coalescence. However, as mentioned above Al-Mamum[81] only dealt with the generation of Al NPs (with ns pulses) atoblique incidence of laser, but in the present experiments we triedto investigate the characteristics of fabricated NSs also throughSERS technique along with NPs.
Fourth argument could be the formation of cavitation bubbles ofdifferent sizes corresponding to four angles of incidence. Depend-ing on the dimensions of bubble, oscillations may vary. Repetitionrate of the ps pulses used was 1 kHz resulting in a temporal inter-pulse distance of 1 ms. Since the cavitation bubbles sustain form10−6 to 10−4 s, we do believe in dependence of the cavitation bub-ble radius on incident angle. However, further detailed studies areessential to confirm this. Following detailed experiments, Wageneret al. [85] explained transient interference of cavitation bubblewith incoming pulses prevails only when the temporal separationbetween the pulses decreases i.e. in the case of lasers with high rep-etition rate greater than 1 kHz. However, we expect differences inthe cavitation bubble formation/dynamics during ablation for dif-ferent angles of incidence. Intense investigations are essential tocomprehend the bubble dynamics at oblique angles of incidence.
3.2. Characterizations of Ag nanostructured substrates
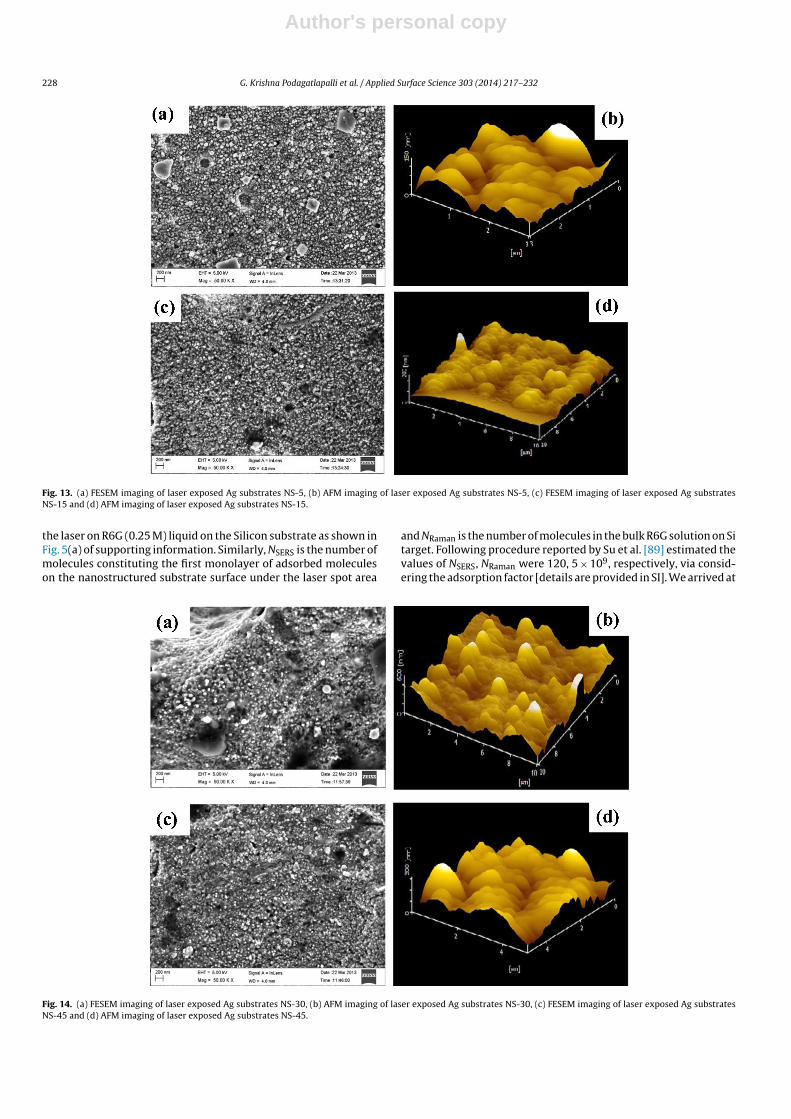
Morphologies of laser exposed portions of Ag substrates wereinvestigated through FESEM and AFM imaging techniques. Fig. 13depicts the surface morphologies of NS-5 and NS-15. Fig. 13(a),(c) illustrate the FESEM images of laser exposed portions of Agsubstrates corresponding to NS-5 and NS-15. Fig. 13(b), (d) rep-resents the AFM images of NS-5 and NS-15, respectively. AFMimages exhibited lateral nanostructures of dimensions <200 nm.Similarly, Fig. 14 depicts the surface morphologies of NS-30 andNS-45. Fig. 14(a), (c) illustrate the FESEM images of laser exposedportions of Ag substrate corresponding to NS-30 and NS-45, respec-tively. Fig. 14(b), (d) represents the AFM images of NS-30 and NS-45,respectively. AFM images once more confirmed presence of lateralnanostructures on the surface of NS-30. AFM image of plain silversubstrate is presented in Fig. 3 of SI.
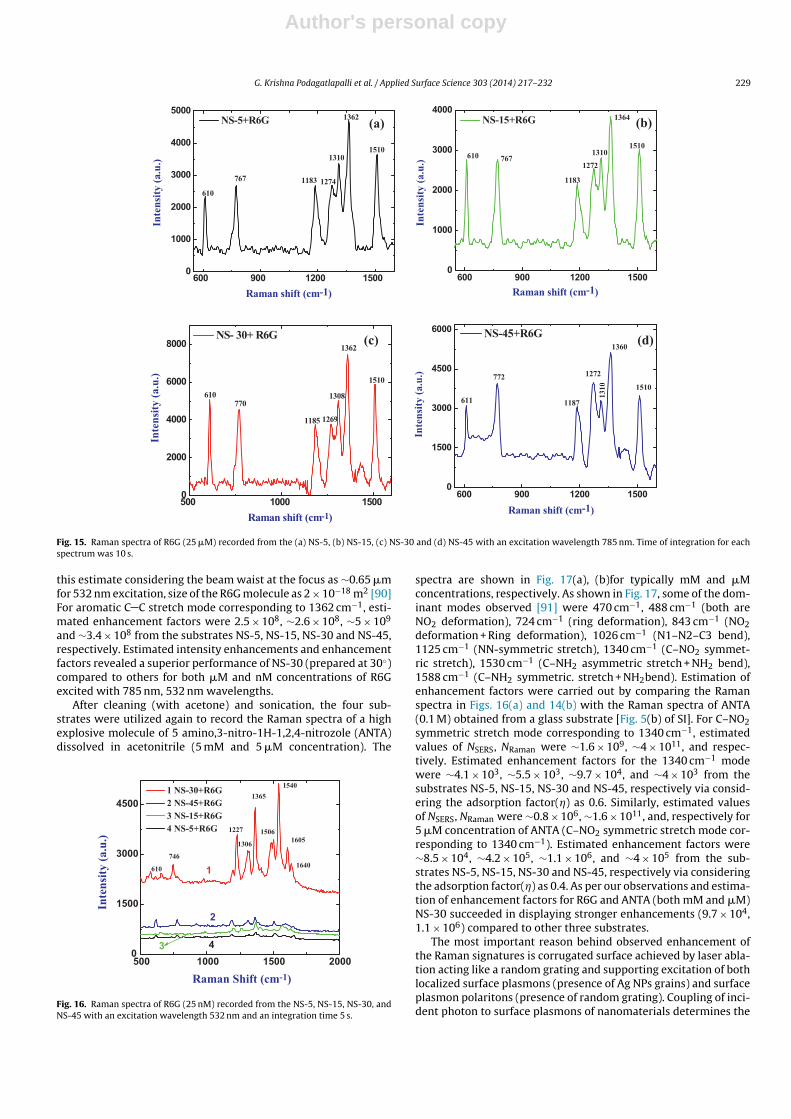
Ablation of targets was carried out in a controlled mannerwithout changing the writing conditions except the angle of inci-dence. The surface topography of laser exposed portions of thesubstrates did not demonstrate evident major differences in theirnanostructures. Raman spectra of adsorbents were recorded fromnano-textured NS-5, NS-15, NS-30 and NS-45. The performance ofNS-5, NS-15, NS-30 and NS-45 was investigated by recording theRaman spectra of R6G with excitation wavelengths of 785 nm and532 nm. Fig. 15(a)–(d) depicts the Raman spectra of R6G (∼10 �Ldrop) placed on laser exposed portion to form a monolayer ofanalyte (excitation wavelength of 785 nm). Large quantity of ana-lyte (multi-layered) generally inhibits activity of nanostructureson the substrate. Furthermore, activity of substrate depends onthe distance between nanostructure and analyte molecule (typi-cally should be few nm). To compare the Raman spectra [excitationwavelength of 785 nm] of analyte from laser ablated Ag surface,the Raman spectra of R6G from plain Ag surface (blue), Si substrate(black) were also recorded and data is presented in Fig. 4 of SI. Esti-mated intensity enhancements of the Raman mode at 1360 cm−1
for 25 �M concentration R6G were ∼13, ∼12, ∼25 and ∼14 fromNS-5, NS-15, NS-30 and NS-45, respectively [reference spectrumR6G of higher concentration is shown in 5 of SI]. Comparison isshown in 6 of SI. In a similar fashion, the Raman spectra of R6G of25 nM concentration were also recorded from four substrates andcompared as shown in Fig. 16. Four Ag substrates demonstrated theRaman signatures of R6G in accordance with reports in literature[86,87]. The performance of each substrate was evaluated throughestimation of enhancement factor (EF) [88].
EF = ISERS
IRaman
NRaman
NSERS(7)
where ISERS is the integrated intensity of R6G band under con-sideration from the nanostructured Ag substrate and IRaman is theintegrated intensity of the same Raman band obtained via focusing
Author's personal copy
228 G. Krishna Podagatlapalli et al. / Applied Surface Science 303 (2014) 217–232
Fig. 13. (a) FESEM imaging of laser exposed Ag substrates NS-5, (b) AFM imaging of laser exposed Ag substrates NS-5, (c) FESEM imaging of laser exposed Ag substratesNS-15 and (d) AFM imaging of laser exposed Ag substrates NS-15.
the laser on R6G (0.25 M) liquid on the Silicon substrate as shown inFig. 5(a) of supporting information. Similarly, NSERS is the number ofmolecules constituting the first monolayer of adsorbed moleculeson the nanostructured substrate surface under the laser spot area
and NRaman is the number of molecules in the bulk R6G solution on Sitarget. Following procedure reported by Su et al. [89] estimated thevalues of NSERS, NRaman were 120, 5 × 10⁹, respectively, via consid-ering the adsorption factor [details are provided in SI]. We arrived at
Fig. 14. (a) FESEM imaging of laser exposed Ag substrates NS-30, (b) AFM imaging of laser exposed Ag substrates NS-30, (c) FESEM imaging of laser exposed Ag substratesNS-45 and (d) AFM imaging of laser exposed Ag substrates NS-45.
Author's personal copy
G. Krishna Podagatlapalli et al. / Applied Surface Science 303 (2014) 217–232 229
500 10 00 15 000
200 0
400 0
6000
800 0
1510
1362
1308
1269 1185
770
NS- 30 + R6G
Inte
nsity
(a.u
.)
Raman shift (cm-1)
(c)
610
600 900 1200 15 000
1000
2000
300 0
400 0
5000
1510
1362
1310
12741183 767
NS-5+R6G
Inte
nsity
(a.u
.)
Raman shift (cm-1)
(a)
610
600 900 1200 15 000
1000
2000
3000
4000
1272
1510
1364
1310
1183
767 610
NS -15+R6G
Inte
nsity
(a.u
.)
Raman shift (c m-1)
(b)
600 90 0 1200 15 000
1500
3000
4500
6000
Inte
nsity
(a.u
.)
1510
136 0
1310
1272
1187
772
611
NS-45+R6G
Raman shift (cm-1)
(d)
Fig. 15. Raman spectra of R6G (25 �M) recorded from the (a) NS-5, (b) NS-15, (c) NS-30 and (d) NS-45 with an excitation wavelength 785 nm. Time of integration for eachspectrum was 10 s.
this estimate considering the beam waist at the focus as ∼0.65 �mfor 532 nm excitation, size of the R6G molecule as 2 × 10⁻¹⁸ m2 [90]For aromatic C C stretch mode corresponding to 1362 cm−1, esti-mated enhancement factors were 2.5 × 10⁸, ∼2.6 × 10⁸, ∼5 × 10⁹
and ∼3.4 × 10⁸ from the substrates NS-5, NS-15, NS-30 and NS-45,respectively. Estimated intensity enhancements and enhancementfactors revealed a superior performance of NS-30 (prepared at 30◦)compared to others for both �M and nM concentrations of R6Gexcited with 785 nm, 532 nm wavelengths.
After cleaning (with acetone) and sonication, the four sub-strates were utilized again to record the Raman spectra of a highexplosive molecule of 5 amino,3-nitro-1H-1,2,4-nitrozole (ANTA)dissolved in acetonitrile (5 mM and 5 �M concentration). The
2000150010005000
1500
3000
4500
3
2
1
1 NS-30+R6G2 NS-45+R6G3 NS-15+R6G4 NS-5+R6G
1640
1605
1540
1506
1365
1306
1227
746
Inte
nsity
(a.u
.)
Raman Shift (cm-1 )
610
4
Fig. 16. Raman spectra of R6G (25 nM) recorded from the NS-5, NS-15, NS-30, andNS-45 with an excitation wavelength 532 nm and an integration time 5 s.
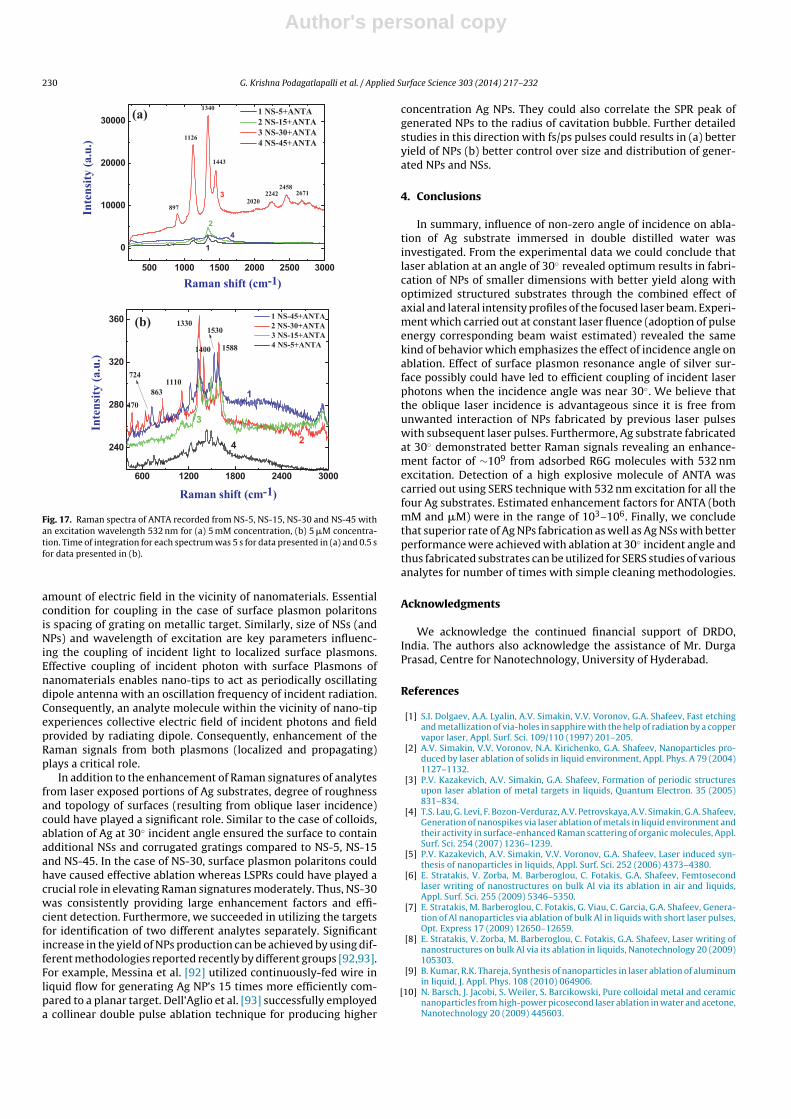
spectra are shown in Fig. 17(a), (b)for typically mM and �Mconcentrations, respectively. As shown in Fig. 17, some of the dom-inant modes observed [91] were 470 cm−1, 488 cm−1 (both areNO2 deformation), 724 cm−1 (ring deformation), 843 cm−1 (NO2deformation + Ring deformation), 1026 cm−1 (N1–N2–C3 bend),1125 cm−1 (NN-symmetric stretch), 1340 cm−1 (C–NO2 symmet-ric stretch), 1530 cm−1 (C–NH2 asymmetric stretch + NH2 bend),1588 cm−1 (C–NH2 symmetric. stretch + NH2bend). Estimation ofenhancement factors were carried out by comparing the Ramanspectra in Figs. 16(a) and 14(b) with the Raman spectra of ANTA(0.1 M) obtained from a glass substrate [Fig. 5(b) of SI]. For C–NO2symmetric stretch mode corresponding to 1340 cm−1, estimatedvalues of NSERS, NRaman were ∼1.6 × 10⁹, ∼4 × 10¹¹, and respec-tively. Estimated enhancement factors for the 1340 cm−1 modewere ∼4.1 × 10³, ∼5.5 × 10³, ∼9.7 × 10⁴, and ∼4 × 10³ from thesubstrates NS-5, NS-15, NS-30 and NS-45, respectively via consid-ering the adsorption factor(�) as 0.6. Similarly, estimated valuesof NSERS, NRaman were ∼0.8 × 10⁶, ∼1.6 × 10¹¹, and, respectively for5 �M concentration of ANTA (C–NO2 symmetric stretch mode cor-responding to 1340 cm−1). Estimated enhancement factors were∼8.5 × 10⁴, ∼4.2 × 10⁵, ∼1.1 × 10⁶, and ∼4 × 10⁵ from the sub-strates NS-5, NS-15, NS-30 and NS-45, respectively via consideringthe adsorption factor(�) as 0.4. As per our observations and estima-tion of enhancement factors for R6G and ANTA (both mM and �M)NS-30 succeeded in displaying stronger enhancements (9.7 × 104,1.1 × 106) compared to other three substrates.
The most important reason behind observed enhancement ofthe Raman signatures is corrugated surface achieved by laser abla-tion acting like a random grating and supporting excitation of bothlocalized surface plasmons (presence of Ag NPs grains) and surfaceplasmon polaritons (presence of random grating). Coupling of inci-dent photon to surface plasmons of nanomaterials determines the
Author's personal copy
230 G. Krishna Podagatlapalli et al. / Applied Surface Science 303 (2014) 217–232
500 100 0 150 0 200 0 250 0 300 0
0
10000
20000
30000
3
24
Inte
nsity
(a.u
.)
26712458
2242202 0
1443
1340
1126
1 NS-5+ANTA2 NS-15+ANTA 3 NS-30+ANTA 4 NS-45+ANTA
Raman shift (cm-1)
(a)
897
1
600 120 0 180 0 240 0 3000
240
280
320
360
4
3
2
1588
1530
724
470
1400
8631110
1 NS-45+ANTA2 NS-30+ANTA 3 NS-15+ANTA 4 NS-5+ANTA
Inte
nsity
(a.u
.)
Raman s hift ( cm-1)
(b) 1330
1
Fig. 17. Raman spectra of ANTA recorded from NS-5, NS-15, NS-30 and NS-45 withan excitation wavelength 532 nm for (a) 5 mM concentration, (b) 5 �M concentra-tion. Time of integration for each spectrum was 5 s for data presented in (a) and 0.5 sfor data presented in (b).
amount of electric field in the vicinity of nanomaterials. Essentialcondition for coupling in the case of surface plasmon polaritonsis spacing of grating on metallic target. Similarly, size of NSs (andNPs) and wavelength of excitation are key parameters influenc-ing the coupling of incident light to localized surface plasmons.Effective coupling of incident photon with surface Plasmons ofnanomaterials enables nano-tips to act as periodically oscillatingdipole antenna with an oscillation frequency of incident radiation.Consequently, an analyte molecule within the vicinity of nano-tipexperiences collective electric field of incident photons and fieldprovided by radiating dipole. Consequently, enhancement of theRaman signals from both plasmons (localized and propagating)plays a critical role.
In addition to the enhancement of Raman signatures of analytesfrom laser exposed portions of Ag substrates, degree of roughnessand topology of surfaces (resulting from oblique laser incidence)could have played a significant role. Similar to the case of colloids,ablation of Ag at 30◦ incident angle ensured the surface to containadditional NSs and corrugated gratings compared to NS-5, NS-15and NS-45. In the case of NS-30, surface plasmon polaritons couldhave caused effective ablation whereas LSPRs could have played acrucial role in elevating Raman signatures moderately. Thus, NS-30was consistently providing large enhancement factors and effi-cient detection. Furthermore, we succeeded in utilizing the targetsfor identification of two different analytes separately. Significantincrease in the yield of NPs production can be achieved by using dif-ferent methodologies reported recently by different groups [92,93].For example, Messina et al. [92] utilized continuously-fed wire inliquid flow for generating Ag NP’s 15 times more efficiently com-pared to a planar target. Dell’Aglio et al. [93] successfully employeda collinear double pulse ablation technique for producing higher
concentration Ag NPs. They could also correlate the SPR peak ofgenerated NPs to the radius of cavitation bubble. Further detailedstudies in this direction with fs/ps pulses could results in (a) betteryield of NPs (b) better control over size and distribution of gener-ated NPs and NSs.
4. Conclusions
In summary, influence of non-zero angle of incidence on abla-tion of Ag substrate immersed in double distilled water wasinvestigated. From the experimental data we could conclude thatlaser ablation at an angle of 30◦ revealed optimum results in fabri-cation of NPs of smaller dimensions with better yield along withoptimized structured substrates through the combined effect ofaxial and lateral intensity profiles of the focused laser beam. Experi-ment which carried out at constant laser fluence (adoption of pulseenergy corresponding beam waist estimated) revealed the samekind of behavior which emphasizes the effect of incidence angle onablation. Effect of surface plasmon resonance angle of silver sur-face possibly could have led to efficient coupling of incident laserphotons when the incidence angle was near 30◦. We believe thatthe oblique laser incidence is advantageous since it is free fromunwanted interaction of NPs fabricated by previous laser pulseswith subsequent laser pulses. Furthermore, Ag substrate fabricatedat 30◦ demonstrated better Raman signals revealing an enhance-ment factor of ∼109 from adsorbed R6G molecules with 532 nmexcitation. Detection of a high explosive molecule of ANTA wascarried out using SERS technique with 532 nm excitation for all thefour Ag substrates. Estimated enhancement factors for ANTA (bothmM and �M) were in the range of 103–106. Finally, we concludethat superior rate of Ag NPs fabrication as well as Ag NSs with betterperformance were achieved with ablation at 30◦ incident angle andthus fabricated substrates can be utilized for SERS studies of variousanalytes for number of times with simple cleaning methodologies.
Acknowledgments
We acknowledge the continued financial support of DRDO,India. The authors also acknowledge the assistance of Mr. DurgaPrasad, Centre for Nanotechnology, University of Hyderabad.
References
[1] S.I. Dolgaev, A.A. Lyalin, A.V. Simakin, V.V. Voronov, G.A. Shafeev, Fast etchingand metallization of via-holes in sapphire with the help of radiation by a coppervapor laser, Appl. Surf. Sci. 109/110 (1997) 201–205.
[2] A.V. Simakin, V.V. Voronov, N.A. Kirichenko, G.A. Shafeev, Nanoparticles pro-duced by laser ablation of solids in liquid environment, Appl. Phys. A 79 (2004)1127–1132.
[3] P.V. Kazakevich, A.V. Simakin, G.A. Shafeev, Formation of periodic structuresupon laser ablation of metal targets in liquids, Quantum Electron. 35 (2005)831–834.
[4] T.S. Lau, G. Levi, F. Bozon-Verduraz, A.V. Petrovskaya, A.V. Simakin, G.A. Shafeev,Generation of nanospikes via laser ablation of metals in liquid environment andtheir activity in surface-enhanced Raman scattering of organic molecules, Appl.Surf. Sci. 254 (2007) 1236–1239.
[5] P.V. Kazakevich, A.V. Simakin, V.V. Voronov, G.A. Shafeev, Laser induced syn-thesis of nanoparticles in liquids, Appl. Surf. Sci. 252 (2006) 4373–4380.
[6] E. Stratakis, V. Zorba, M. Barberoglou, C. Fotakis, G.A. Shafeev, Femtosecondlaser writing of nanostructures on bulk Al via its ablation in air and liquids,Appl. Surf. Sci. 255 (2009) 5346–5350.
[7] E. Stratakis, M. Barberoglou, C. Fotakis, G. Viau, C. Garcia, G.A. Shafeev, Genera-tion of Al nanoparticles via ablation of bulk Al in liquids with short laser pulses,Opt. Express 17 (2009) 12650–12659.
[8] E. Stratakis, V. Zorba, M. Barberoglou, C. Fotakis, G.A. Shafeev, Laser writing ofnanostructures on bulk Al via its ablation in liquids, Nanotechnology 20 (2009)105303.
[9] B. Kumar, R.K. Thareja, Synthesis of nanoparticles in laser ablation of aluminumin liquid, J. Appl. Phys. 108 (2010) 064906.
[10] N. Barsch, J. Jacobi, S. Weiler, S. Barcikowski, Pure colloidal metal and ceramicnanoparticles from high-power picosecond laser ablation in water and acetone,Nanotechnology 20 (2009) 445603.
Author's personal copy
G. Krishna Podagatlapalli et al. / Applied Surface Science 303 (2014) 217–232 231
[11] E. Messina, E. Cavallaro, A. Cacciola, R. Saija, F. Borghese, P. Denti, B. Fazio,C. D’Andrea, P.G. Gucciardi, M.A. Lati, M. Meneghetti, G. Compagnini, V. Amen-dola, M. Marago, Manipulation and Raman spectroscopy with optically trappedmetal nanoparticles obtained by pulsed laser ablation in liquids, J. Phys. Chem.C 115 (2011) 5115–5122.
[12] S. Venugopal Rao, G. Krishna Podagatlapalli, S. Hamad, Ultrafast Laser Ablationin Liquids for Nanomaterials and Applications, J. Nanosci. Nanotech. 14 (2014)1364–1388.
[13] E. Boulais, R. Lachaine, A. Hatef, M. Meunier, Plasmonics for pulsed-laser cellnanosurgery: Fundamentals and applications, Journal of Photochemistry andPhotobiology C: Photochemistry Reviews 17 (2013) 26–49.
[14] S.S. Makridis, E.I. Gkanas, G. Panagakos, E.S. Kikkinides, A.K. Stubos, P. Wagener,S. Barcikowski, Polymer-stable magnesium nanocomposites prepared by laserablation for efficient hydrogen storage, Int. J. Hydrogen Energy 38 (2013)11530–11535.
[15] G. Krishna Podagatlapalli, S. Hamad, S. Sreedhar, S.P. Tewari, S. Venugopal Rao,Fabrication and characterization of aluminum nanostructures and nanopar-ticles obtained using femtosecond ablation technique, Chem. Phys. Lett. 530(2012) 93–97.
[16] J.C. Hulteen, R.P. Vanduyne, Nanosphere lithography: a materials general fab-rication process for periodic particle array surfaces, J. Vac. Sci. Technol. A 13(1995) 1553–1558.
[17] J. Liu, A.I. Maroof, L. Wieczorek, M.B. Cortie, Fabrication of hollow metal nanocaps and their red shifted optical absorption spectra, Adv. Mater. 17 (2005)1276–1281.
[18] K.B. Holt, A.J. Bard, Interaction of silver(I) ions with the respiratory chain ofEscherichia coli: an electrochemical and scanning electrochemical microscopystudy of the antimicrobial mechanism of micromolar Ag, Biochemistry 44(2005) 13214–13223.
[19] S. Shrivastava, T. Bera, A. Roy, G. Singh, P. Ramachandra Rao, D. Dash, Char-acterization of enhanced antibacterial effects of novel silver nanoparticles,Nanotechnology 18 (2007) 225103.
[20] H. Xiaohua, K.J. Prashant, I.H. El-Sayed, M.A. El-Sayed, Gold nanoparticles: inter-esting optical properties and recent applications in cancer diagnostics andtherapy, Nanomedicine 2 (5) (2007) 681–693.
[21] L. Braydich-Stolle, S. Hussain, J.J. Schlager, M. Claude-Hofmann, In vitro cyto-toxicity of nanoparticles in mammalian germline stem cells, Toxicol. Sci. 88(2005) 412–419.
[22] S. Porel, S. Singh, S.S. Harsha, T.P. Radhakrishnan, Nanoparticle-embeddedpolymer in situ synthesis, free-standing films with highly monodis-perse silver nanoparticles and optical limiting, Chem. Mater. 17 (2005)9–12.
[23] S. Ya-Ping, E.R. Jason, W.R. Harry, G. Radhakishan, Strong optical limiting ofsilver-containing nanocrystalline particles in stable suspensions, J. Phys. Chem.B 103 (1999) 77–82.
[24] M. Fleischman, P.J. Hendra, A.J. McQuillan, Raman spectra of pyridine adsorbedat a silver electrode, Chem. Phys. Lett. 26 (1974) 163–166.
[25] D.L. Jeanmaire, R.P.V. Duyne, Surface Raman spectroelectrochemistry Part 1Hetero cyclic, aromatic, and aliphatic amines adsorbed on the anodized silverelectrode, Annu. Rev. Phys. Chem. 84 (1977) 1–20.
[26] M. Moskovits, Surface-enhanced spectroscopy, Rev. Mod. Phys. 57 (1985)783–826.
[27] A. Crookell, M. Fleischmann, M. Hanniet, P.J. Hendra, Surface-enhanced Fouriertransform Raman spectroscopy in the near infrared, Chem. Phys. Lett. 149(1988) 123–127.
[28] D.B. Chase, B.A. Parkinson, Surface-enhanced Raman spectroscopy in the near-infrared, Appl. Spectrosc. 42 (1988) 1186–1187.
[29] S.M. Angel, L.F. Katz, D.D. Archibald, D.E. Hongis, Near-infrared surface-enhanced Raman spectroscopy. Part II: Copper and gold colloids, Appl.Spectrosc. 43 (1989) 367–372.
[30] K. Kniepp, Surface enhanced Raman scattering and related effects, Exp. Tech.Phys. 38 (1990) 3–28.
[31] M.L. Hae, M.J. Seung, M.K. Hyung, D.S. Young, Single-molecule surface-enhanced Raman spectroscopy: a perspective on the current status, Phys.Chem. Chem. Phys. 15 (2013) 5276–5287.
[32] D. Batani, Short-pulse laser ablation of materials at high intensities: influenceof plasma effects, Laser Part. Beams 28 (2010) 235–244.
[33] S. Eliezer, N. Eliaz, E. Grossman, Synthesis of nanoparticles with femtosecondlaser pulses, Phys. Rev. B 69 (2004) 144119.
[34] J.K. Chen, J.E. Beraun, Numerical study of ultrashort laser pulse interactionswith metal film, Numer. Heat Transf. A 40 (2001) 1–20.
[35] D.G. Shchukin, H. Mohwald, Sono-chemical nanosynthesis at the engineeredinterface of a cavitation micro bubble, Phys. Chem. Chem. Phys. 8 (2006)3496–3506.
[36] V. Amendola, M. Meneghetti, What controls the composition and the structureof nano-materials generated by laser ablation in liquid solution? Phys. Chem.Chem. Phys. 15 (2013) 3027–3046.
[37] W.T. Nichols, T. Sasaki, N. Koshizaki, Laser ablation of a platinum target in water.I. Ablation mechanisms, J. Appl. Phys. 100 (2006) 114911.
[38] T.E. Itiana, On nanoparticle formation by laser ablation in liquids, J. Phys. Chem.C 115 (2011) 5044–5048.
[39] P. Mulvaney, Surface plasmon spectroscopy of nanosized metal particles, Lang-muir 12 (1996) 788–800.
[40] Y. Yokata, K. Ueno, H. Misawa, Essential nanogap effects on surface-enhancedRaman scattering signals from closely spaced gold nanoparticles, Chem. Com-mun. 47 (2011) 3505–3507.
[41] K.A. Willets, R.P. Van Duyne, Localized surface plasmon resonance spectroscopyand sensing, Annu. Rev. Phys. Chem. 58 (2007) 267–297.
[42] X. Cui, K. Tawa, H. Hori, J. Nishi, Tailored plasmonic gratings for enhanced flu-orescence detection and microscopic imaging, Adv. Funct. Mater. 20 (2010)546–553.
[43] J. Chandezon, M.T. Dupuis, G. Cornet, D. Mystre, Multicoated gratings: a dif-ferential formalism applicable in the entire optical region, J. Opt. Soc. Am. 72(1982) 839–846.
[44] V. Amendola, M. Meneghetti, Laser ablation synthesis in solution and sizemanipulation of noble metal nanoparticles, Phys. Chem. Chem. Phys. 11 (2009)3805–3821.
[45] D. Riabininan, M. Chaker, J. Margot, Dependence of gold nanoparticle produc-tion on pulse duration by laser ablation in liquid media, Nanotechnology 23(2012) 135603 (4 pp.).
[46] G. Krishna Podagatlapalli, S. Hamad, S.P. Tewari, S. Sreedhar, S. Venugopal Rao,Silver nano-entities through ultrafast double ablation in aqueous media forsurface enhanced Raman scattering and photonics applications, J. Appl. Phys.113 (2013) 073106.
[47] J.B. Nielsen, J.M. Savolainen, M.S. Christensen, P. Balling, Ultra-short pulse laserablation of metals: threshold fluence, incubation coefficient and ablation rates,Appl. Phys. A 101 (2010) 97–101.
[48] F. Liang, R. Vallee, D. Gingras, S.L. Chin, Role of ablation and incubation processeson surface nano grating formation, Opt. Mater. Exp. 1 (2011) 1244–1250.
[49] J.-P. Sylvestre, A.V. Kabashin, E. Sacher, M. Meunier, Femtosecond laser ablationof gold in water: influence of the laser-produced plasma on the nanoparticlesize distribution, Appl. Phys. A. 80 (2005) 753–758.
[50] Y. Liao, J.-Y. Degorce, Meunier, Laser induced formation of periodic nanostruc-tures in silicon covered by SiO2, Appl. Phys. A. 82 (2006) 679–682.
[51] S. Besner, A.V. Kabashin, M. Meunier, Two-step femtosecond laser ablation-based method for the synthesis of stable and ultra-pure gold nanoparticles inwater, Appl. Phys. A. 88 (2007) 269–272.
[52] S. Besner, A.V. Kabashin, E.M. Winnik, M. Meunier, Ultrafast laser based greensynthesis of non-toxic nanoparticles in aqueous solutions, Appl. Phys. A. 93(2008) 955–959.
[53] S. Besner, M. Meunier, Femtosecond laser synthesis of Au–Ag nanoalloys photoinduced oxidation and ions release, J. Phys. Chem. C 114 (2010) 10403–10409.
[54] N.G. Semaltianos, Nanoparticles by laser ablation, Crit. Rev. Solid State Mater.Sci. 35 (2010) 105–124.
[55] Z. Yan, D.B. Chrisey, Pulsed laser ablation in liquid for micro-/nanostructuregeneration, J. Photochem. Photobiol. C: Photochem. Rev. 13 (2012) 204–223.
[56] H. Zeng, X. Du, S.C. Singh, S.A. Kulinich, S. Yang, J. He, W. Cai, Nanomaterialsvia laser ablation/irradiation in liquid: a review, Adv. Funct. Mater. 22 (2012)1333–1353.
[57] R.A. Ganeev, T.Q. Jia, Nano structuring of semiconductor surfaces under theaction of femtosecond pulses, Opt. Spectrosc. 105 (2008) 141–146.
[58] D.B. Singh, V.K. Tripathi, Laser beat wave excitation of surface plasma wave andmaterial ablation, Phys. Plasmas 14 (2007) 103115–103118.
[59] D.S. George, A. Onischenko, A.S. Holmes, On the angular dependence of focusedlaser ablation by nanosecond pulses in solgel and polymer materials, Appl. Phys.Lett. 84 (2004) 1680–1682.
[60] S. Hamad, G. Krishna Podagatlapalli, S. Venugopal Rao, Influence of picosec-ond multiple/single line ablation on copper nanoparticles fabricated for surfaceenhanced Raman spectroscopy and photonics application, J. Phys D: Appl. Phys.46 (2013) 485501.
[61] J. Nedderson, G. Chumanov, T.M. Cotton, Laser ablation of metals: a new methodfor preparing SERS active colloids, Appl. Spectrosc. 47 (1993) 1959–1964.
[62] M. Prochazka, J. Stephanek, B. Vicova, J. Stephanek, B. Vlckova, P.Y. Turpin,Probing applications of laser-ablated Ag colloids in SERS spectroscopy:improvement of ablation procedure and SERS spectral testing, Anal. Chem. 69(1997) 5103–5108.
[63] A.M. Manjon, P. Wagener, S. Barcikowski, Transfer-matrix method for efficientablation by pulsed laser ablation and nanoparticle generation in liquids, J. Phys.Chem. C 115 (2011) 5108–5114.
[64] S. Barcikowski, A. Menéndez-Manjón, B. Chichkov, M. Brikas, R. Gediminas,Generation of nanoparticle colloids by picosecond and femtosecond laser abla-tions in liquid flow, Appl. Phys. Lett. 91 (2007) 083113–83123.
[65] S. Petersen, J. Jacobi, S. Barcikowski, In situ bioconjugation – novel laserbased approach to pure nanoparticle-conjugates, Appl. Surf. Sci. 255 (2009)5435–5438.
[66] S. Mukamel, Nonlinear Optical Spectroscopy, vol. 561, Oxford University Press,New York, 1995.
[67] T. Hofer, P. Cruck, W. Kaiser, Dynamics of photochemical reactions studied bydegenerate four wave mixing, Chem. Phys. Lett. 224 (1994) 411–416.
[68] V. Namboodiri, M. Namboodiri, G. Flachenecker, A. Materny, Two-photonresonances in femtosecond time-resolved four-wave mixing spectroscopy –�-carotene, J. Chem. Phys. 133 (2010) 054503–54506.
[69] H. Skendarovic, Four-wave mixing with femtosecond pulses, Phys. Scr. T135(2009) 014037 (3 pp.).
[70] G. Boudebs, K. Fedus, C. Cassagne, H. Leblond, Degenerate multiwave mixingusing Z-scan technique, Appl. Phys. Lett. 93 (2008) 021118–21122.
[71] P. Wagener, S. Ibrahimkutty, A. Menzel, A. Plech, S. Barcikowski, Dynamics ofsilver nanoparticle formation and agglomeration inside the cavitation bub-ble after pulsed laser ablation in liquid, Phys. Chem. Chem. Phys. 15 (2013)3068–3074.
[72] E.R. Jette, F. Foote, Precision determination of lattice constants, J. Chem. Phys.3 (1935) 605–616.
Author's personal copy
232 G. Krishna Podagatlapalli et al. / Applied Surface Science 303 (2014) 217–232
[73] M. Jansen, P. Fischer, Eine neue Darstellungsmethode für monoklines Silber(I,III)-oxid (AgO). Einkristallzüchtung und Röntgenstrukturanalyse, J. Less-Common Met. 137 (1988) 123–131.
[74] K. Kamada, M. Ueda, T. Sakaguchi, K. Ohta, T. Fukumi, Femtosecond opticalKerr study of heavy atom effects on the third-order optical nonlinearity ofthiophene homologues: purely electronic contribution, Chem. Phys. Lett. 263(1996) 215–222 [Errata: Femtosecond optical Kerr study of heavy atom effectson the third-order optical nonlinearity of thiophene homologues: purely elec-tronic contribution, 267 (1997) 402].
[75] M. Motzkus, S. Pedersen, A.H. Zewail, Femtosecond real-time probing of reac-tions. 19. Nonlinear (DFWM) techniques for probing transition states of uni-and bimolecular reactions, J. Phys. Chem. 100 (1996) 5620–5633.
[76] E.J. Brown, Q. Zhang, M. Dantus, Femtosecond transient-grating techniques:population and coherence dynamics involving ground and excited states, J.Chem. Phys. 110 (1999) 5772–5788.
[77] G.M. Carter, Excited-state dynamics and temporally resolved nonresonantnonlinear-optical processes in polydiacetylenes, J. Opt. Soc. Am. B 4 (1987)1018–1024.
[78] X.F. Cao, J.P. Jiang, D.P. Bloch, R.W. Hellwarth, L.P. Yu, L. Dalton, Picosecondnonlinear optical response of three rugged poly quinoxaline based aromaticconjugated ladder polymer thin films, J. Appl. Phys. 65 (1991) 5012–5018.
[79] M. Samoc, A. Samoc, B.L. Davies, Z. Bao, L. Yu, B. Hsieh, U. Scherf, FemtosecondZ-scan and degenerate four-wave mixing measurements of real and imaginaryparts of the third-order nonlinearity of soluble conjugated polymers, J. Opt. Soc.Am. B 15 (1998) 817–825.
[80] Z. Li, Y. Lu, Z. Chen, T. Liu, Z. Zhou, J. Han, J. Li, C. Jin, X. Wang, Ultra-fast third-order optical nonlinearity in au triangular nanoprism with strongdipole and quadrupole plasmon resonance, J. Phys. Chem. C. 117 (2013)20127–20132.
[81] S.A. Al-Mamum, R. Nikajima, T. Ishigaki, Tuning the size of aluminum oxidenanoparticles synthesized by laser ablation in water using physical and chem-ical approaches, J. Colloid Interface Sci. 392 (2013) 172–182.
[82] M. Muller, J. Squier, C.A. de Lange, J. Brakenhoff, CARS microscopy with foldedBoxCARS phasematching, J. Microsc. 197 (2000) 150–158.
[83] H. Raether, Surface Plasmons on Smooth and Rough Surfaces and on Gratings,Springer-Verlag, Berlin, 1986.
[84] A. Nath, S.S. Laha, A. Khare, Effect of focusing conditions on synthesis of titaniumoxide nanoparticles via laser ablation in titanium–water interface, Appl. Surf.Sci. 257 (2011) 3118–3122.
[85] P. Wagener, A. Schwenke, B.N. Chichkov, S. Barcikowski, Pulsed laser ablationof zinc in Tetrahydrofuran: bypassing the cavitation bubble, J. Phys. Chem. C114 (2010) 7618–7625.
[86] Y. Lu, G.L. Liu, L.P. Lee, High-density silver nanoparticle film with temperature-controllable interparticle spacing for a tunable surface enhanced Ramanscattering substrate, Nano Lett. 5 (2005) 5–9.
[87] L. Jenson, G.C. Schatz, Resonance Raman scattering of Rhodamine 6G as cal-culated using time-dependent density functional theory, J. Phys. Chem. A 110(2006) 5973–5977.
[88] E.C. Le Ru, P.G. Etchegoin, Phenomenological local field enhancement factordistributions around electromagnetic hot spots, J. Chem. Phys. 130 (2009)181101–181104.
[89] L. Su, W. Jia, D.P. Manzzi, L. Zhang, X. Li, Z. Gu, Y. Lei, Highly sensitive surface-enhanced Raman scattering using vertically aligned silver nano petals, RSC Adv.2 (2012) 1439–1443.
[90] N. Tsurumachi, H. Okamoto, K. Ishii, H. Kohkami, S. Nakanishi, T. Ishii, N. Taka-hashi, C. Dou, P. Wen, Q. Feng, Formation of aggregates in nanohybrid materialof dye molecules-titanate nanosheets, J. Photochem. Photobiol. A 243 (2012)1–6.
[91] J.A. Ciezak, S.F. Trevino, The inelastic neutron scattering spectra of �-3-amino-5-nitro-1, 2,4 -2H-triazole: experiment and DFT calculations, Chem. Phys. Lett.403 (2005) 329–333.
[92] G.C. Messina, P. Wagener, R. Streubei, A. De Giacomo, A. Santagata, G. Com-pagnini, S. Barcikowlski, Pulsed laser ablation of a continuously-fed wire inliquid flow for high-yeild production of silver nanoparticles, Phys. Chem. Chem.Phys. 15 (2013) 3093.
[93] M. Dell’Aglio, R. Gaudiuso, R. ElRashedy, O. De Pascale, G. Palazzo, A. De Gia-como, Collinear double pulse laser ablation in water for the production of silvernanoparticles, Phys. Chem. Chem. Phys. 15 (2013) 20868.