editorial: commemorating william playfair's 250th birthday
TRANSCRIPT
Computational Statistics manuscript No.(will be inserted by the editor)
Editorial: Commemorating William Playfair’s 250th
Birthday
Jurgen Symanzik · William (Zelli) Fischetti ·Ian Spence
Received: 1 September 2009 / Accepted: date
Keywords Statistical graphics · Roy Wenzlick
1 William Playfair’s Legacy
In this editorial, we want to commemorate the 250th birthday of William Playfair.
According to pages 564 to 566 of the June 1823 issue of the Gentleman’s Magazine
and to Scott (1925, p. 348), Playfair was born on September 22, 1759, near the city
of Dundee in Scotland, and he died on February 11, 1823, in London. For readers
not familiar with William Playfair and his work, we would suggest to first refer to
Appendix 1 and then continue with the main editorial.
Towards the end of the 19th century, Playfair and his work were mostly forgotten. In
the discussion of a paper on tabular analysis by William A. Guy (an editor, physician,
and statistician), the English economist and statistician W. Stanley Jevons said (see
J. SymanzikUtah State UniversityDepartment of Mathematics and Statistics3900 Old Main HillLogan, UT 84322–3900, USAE-mail: [email protected]
W. FischettiUniversity of Missouri St. LouisWestern Historical Manuscript CollectionThomas Jefferson LibraryOne University BoulevardSt. Louis, MO 63121–4400, USA
I. SpenceUniversity of TorontoDepartment of PsychologySidney Smith Hall100 St George StToronto, Ontario, Canada M5S 3G3
2
Jevons’ comment on p. 657 of Guy, 1879) that “Englishmen lost sight of the fact that
William Playfair, who had never been heard of in this generation, produced statistical
atlases and statistical curves that ought to be treated by some writer in the same way
that Dr. Guy had treated the method of Dr. Todd.” This citation frequently has been
quoted, e.g., in Funkhouser (1937, p. 293), in FitzPatrick (1960, p. 39), and in Maas
and Morgan (2002/2, p. 98). Funkhouser (1937, footnote (5) on p. 293) even stated
that “JEVONS suggestion did not bear fruit until almost sixty years later” and then he
referred to Funkhouser and Walker (1935). However, some credit needs to be given to
Guy. In his 1885 paper, Guy followed up on Jevon’s comment and stated (Guy, 1885,
p. 79):
“Nor should I be doing justice to ourselves did I omit a passing notice of the
works of William Playfair of Dundee, who made such early, free, and skilful use
of the graphic method in his statistical, historical, and political works published
towards the end of the last century and beginning of this — to be more exact,
between the years 1786 and 1805. This graphic method, which owes so much to
M. Guerry and William Playfair, has been largely used here in England by Dr.
Farr, in the shape of curves, columns, rectangular and circular forms.”
Nowadays, such comments are common. Playfair is recognized as the “man who in-
vented outright the graphic method of representing statistical data” (Funkhouser and
Walker, 1935, p. 103), the “Apparent Inventor of Statistical Graphics” (Funkhouser,
1937, p. 280), the “founder of graphic methods in statistics” (FitzPatrick, 1960, p. 39),
the “father of modern graphical display” (Wainer, 2005, p. 5), the “progenitor of modern
statistical graphics” (Wainer, 2005, p. 9), and the “great pioneer of statistical graphics”
(Stephen Stigler, introducing Playfair, 2005, opening page), to quote just a few of the
accolades he received over the last 80 years.
Numerous articles and books have been published describing Playfair’s contri-
butions to and inventions in the field of statistical graphics, most recently Spence
(2004), Wainer (2005), and Playfair (2005), that also contain detailed references re-
lated to Playfair’s work. Just in brief, Playfair deserves credit for the development of
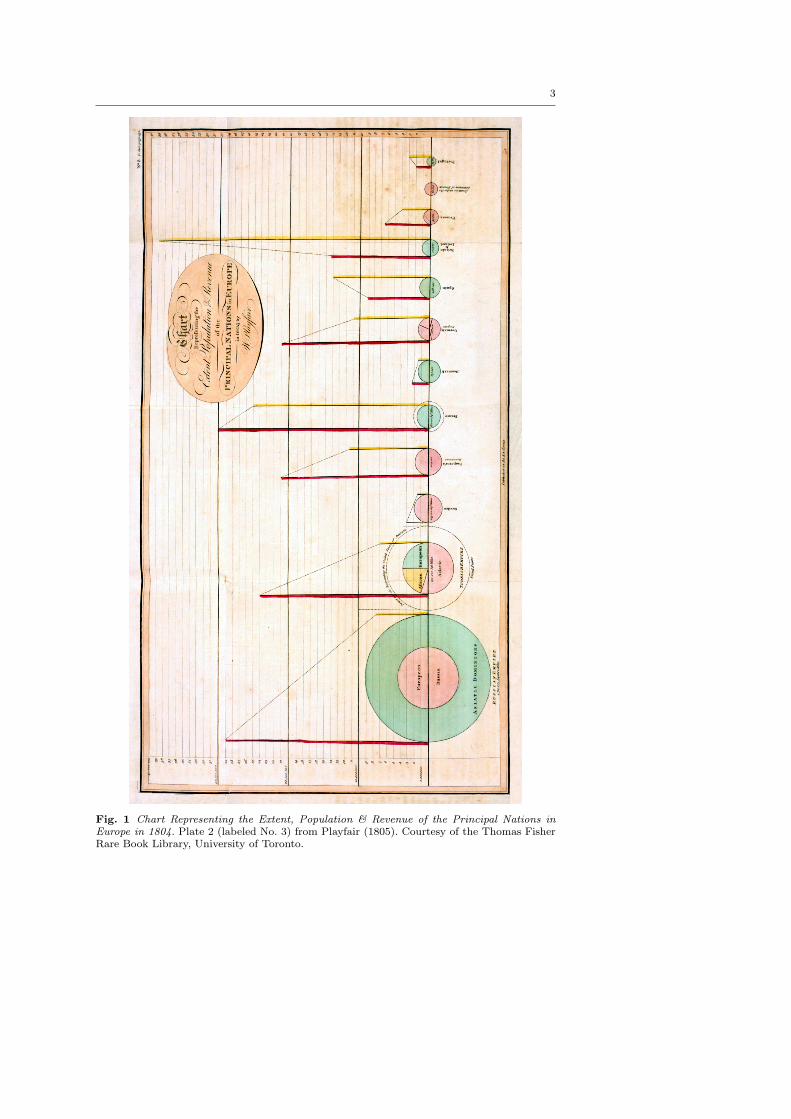
the line graph, the bar chart, the pie chart, and the circle graph. All of these, ex-
cept the line graph, can be seen in Fig. 1 and on the accompanying Web page at
http://www.math.usu.edu/~symanzik/papers/2009_cost/editorial.html.
As two of Playfair’s works, the third edition of The Commercial and Political Atlas
and the first edition of The Statistical Breviary recently have been republished as
Playfair (2005), high–quality versions of some of Playfair’s graphics now are easily
accessible to interested readers. Unfortunately, many of Playfair’s original publications
and figures are unpublished manuscripts or parts of rare book and special collections at
a few distinguished libraries. By chance, when teaching a graduate course on Statistical
Graphics in the Spring 2009 semester, the first author ran into a rarely cited booklet
(Wenzlick, 1950) that contained three excellent reproductions of Playfair’s graphics.
One of its few citations in a statistical source appears in FitzPatrick (1960, p. 39), but
FitzPatrick does not further comment on the excellent quality of the Playfair graphics
reproduced in Wenzlick’s booklet.
We really hope that several traditional commemoratives regarding Playfair, similar
to Droesbeke (2009), will be published in late 2009 and early 2010. In our version,
we will follow a less traditional approach and will primarily focus on Wenzlick (1950),
reproduced in Appendix 1, and use this as the basis to correct some factual errors
regarding Playfair’s life and work that are frequently found in the Playfair literature.
3
Fig. 1 Chart Representing the Extent, Population & Revenue of the Principal Nations inEurope in 1804. Plate 2 (labeled No. 3) from Playfair (1805). Courtesy of the Thomas FisherRare Book Library, University of Toronto.
4
2 Roy Wenzlick’s and his Playfair Booklet
Roy Wenzlick (1894–1989) published the Real Estate Analyst from 1932 until his retire-
ment in 1973. Investors and others involved in the real estate business considered the
publication a must have subscription. Wenzlick and his staff compiled huge amounts
of data and predicted trends in the housing and construction business. Much of the
statistics and information that was analyzed by Wenzlick and his employees appeared
in the form of graphs and charts.
An average issue of the Real Estate Analyst contained from 15 to 25 charts relating
statistics on building costs, real estate sales, foreclosures, interest rates and many other
subjects. Huge charts became a part of every Wenzlick talk. As a hobby Wenzlick
collected antique maps and charts. An interesting feature in Wenzlick’s coat of arms
that is published in some of his works (here on the back page — and therefore on
the first page of the scan of his 1950 booklet) is a slide rule instead of a sword and a
statistical graph in semi–log scale drawn on a shield.
Thus, it should be of no big surprise that Wenzlick, after he purchased a historic
book with one of Playfair’s graphics, “started a long but very interesting investigation
of the life and work of the man whose name was attached to the chart” (Wenzlick,
1950). The result is his unpublished booklet reproduced in full at the end of this
editorial in Appendix 1. High–resolution scans of the booklet, including all three of
Playfair’s figures republished in the booklet, can be accessed at http://www.math.
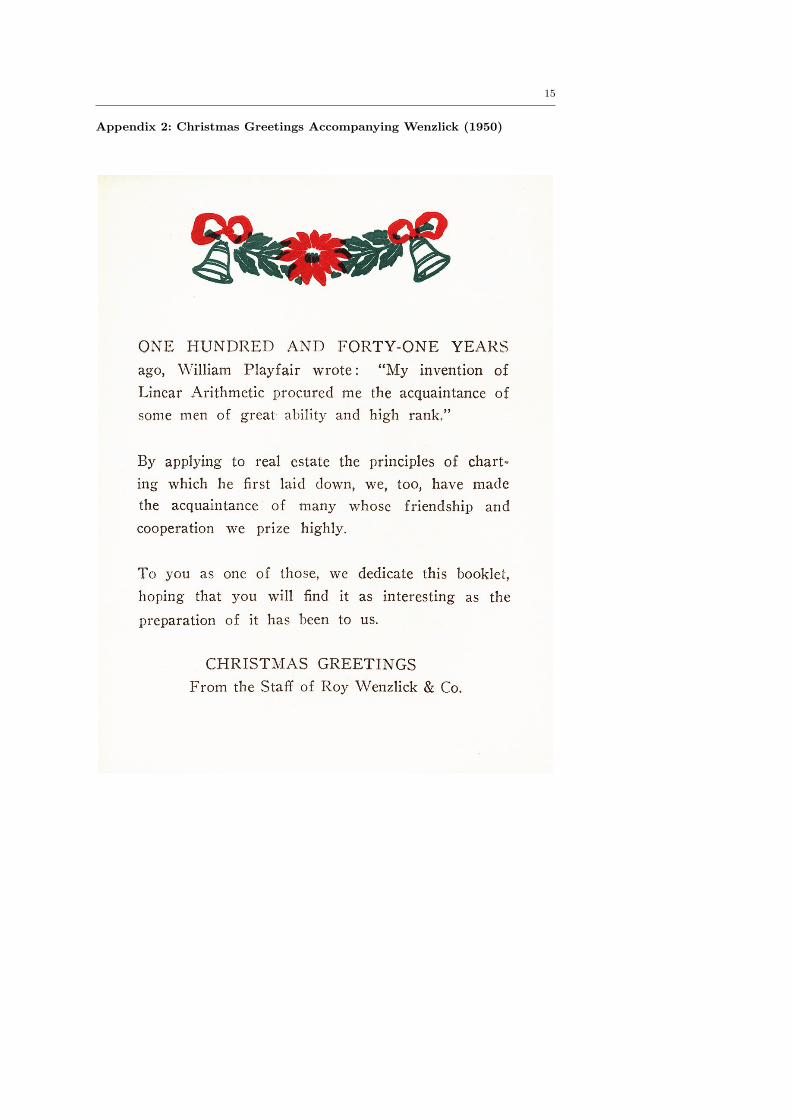
usu.edu/~symanzik/papers/2009_cost/editorial.html. An accompanying card (see
Appendix 2) indicates that Wenzlick’s booklet was distributed as a Christmas gift to
friends and colleagues working in the real estate business.
It should be noted that Wenzlick’s booklet is more than just a brief summary of
the previously existing articles on Playfair and his work. Most notable are the Playfair
graphics Wenzlick was able to obtain and republish in excellent quality (even by today’s
standards) in his booklet.
There are some factual errors in Wenzlick’s text that probably would have been
noticed in a peer–reviewed article, but that slipped unnoticed into the printed version
of his booklet:
In the second paragraph of Wenzlick (1950), it is stated: “His father died when
William was 13 years old.” The same information can be found in in FitzPatrick (1960,
p. 41). However, William’s father, James Playfair, a minister of the united parishes of
Liff and Benvie, died on May 28, 1772, as reported in Rogers (1872, footnote on p. 376)
and Scott (1925, p. 348). Thus, William was still twelve years old when his father died.
Also in the same paragraph, it is stated: “At 21 William Playfair became a drafts-
man for James Watt.” Similarly, Hankins and Silverman (2006, p. 127) state that
“William Playfair had had a career as a machinist and had worked as a draftsman for
Bo[u]lton and Watt beginning in 1780.” Based on a letter reproduced in Appendix 3,
Playfair most likely joined Boulton & Watt in 1777 when he was 17 or 18 years old
(see also Playfair, 2005, p. 5). Moreover, Costigan-Eaves and Macdonald-Ross (1990,
p. 324) quote a letter from Watt to Boulton from June 27, 1778, where it becomes
evident that, at least initially, Watt did not have a very high opinion of Playfair.
In the third paragraph of Wenzlick (1950), it is stated: “In 1798 William Playfair
published Lineal Arithmetic, the first book ever published on charting.” Lineal Arith-
metic indeed was published in 1798. However, Playfair’s Commercial and Political Atlas
of 1786 (Playfair, 1786) was the first book to contain statistical charts, as commonly
5
recognized, e.g., in Funkhouser and Walker (1935, p. 105–106) and in FitzPatrick (1960,
p. 39). The Lineal Arithmetic was an edited revision of the Atlas.
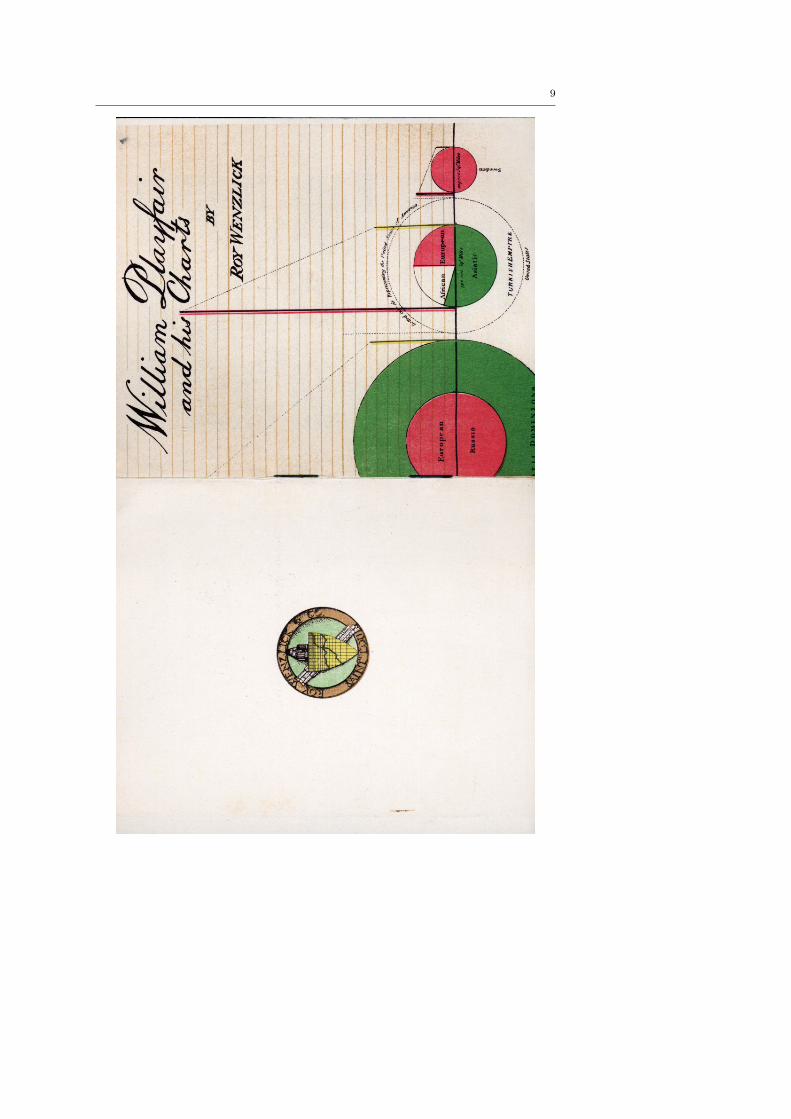
Regarding the partial figure on the title page of his booklet, Wenzlick (1950) wrote:
“The cover of this booklet shows a portion of one of his charts published in 1801,
undoubtedly the first “pie chart” ever drawn. This chart attempted to combine bar
charts and pie charts in the same presentation.” Variants of this figure have been
extensively discussed and republished, e.g., in Funkhouser and Walker (1935, p. 107–
108 and Fig. 4), in Funkhouser (1937, p. 283–285), in Spence (2005, p. 353–356 and
Fig. 1), in Spence (2006, p. 2432 and Fig. 18), and as Chart 1 and Chart 2 from
The Statistical Breviary, as republished in Playfair (2005). However, Wenzlick did not
use the original 1801 version as he assumed, but rather the 1805 version, shown in
Fig. 1. In this later version, the United States are overlaid to the circle depicting the
Turkish Empire. After the Louisiana Purchase of about 828,000 square miles in 1803,
the United States approximately doubled their size. This would roughly match the area
for the United States in this figure that is roughly 2.7 times the area of the Turkish
Empire (representing 790,000 square miles), in particular as the exact boundaries of
the purchase were established only much later.
It is well known that different versions of the same work of Playfair exist, see for
example Playfair (2005, p. 20–23). Although only four countries (Russia, the Turkish
Empire, the United States, and Sweden) are shown in Wenzlick’s adaptation of Play-
fair (1805) for his cover page, several differences are noticeable when compared with
a version of the same chart that is held at the Thomas Fisher Rare Book Library,
University of Toronto (see Fig. 1). In Wenzlick’s version, the European part of the
Turkish Empire is stained in red, representing a land power; the Asiatic part is stained
in green, representing a maritime power; and the African part is not stained at all.
In the Toronto version, the stainings for the European and Asiatic parts are swapped;
and the African part is stained in yellow. Compared to Chart 1 and Chart 2 from
The Statistical Breviary, as republished in Playfair (2005), where Sweden is stained
in green, Sweden is now stained in red in both versions. Both versions show different
omissions of colors: In Wenzlick’s version, there is no yellow coloring of the line to the
right of Sweden that represents revenues. Similarly, in the Toronto version, there is
no red coloring of the line to the left of Sweden that represents population. Some of
these color changes may be intentional, but some seem to be mistakes. It should be
remembered that the charts were hand colored, probably by Playfair himself, and that
without a comparison of several volumes, taken from other rare book libraries, it is
difficult to be sure of Playfair’s intentions when he colored these figures.
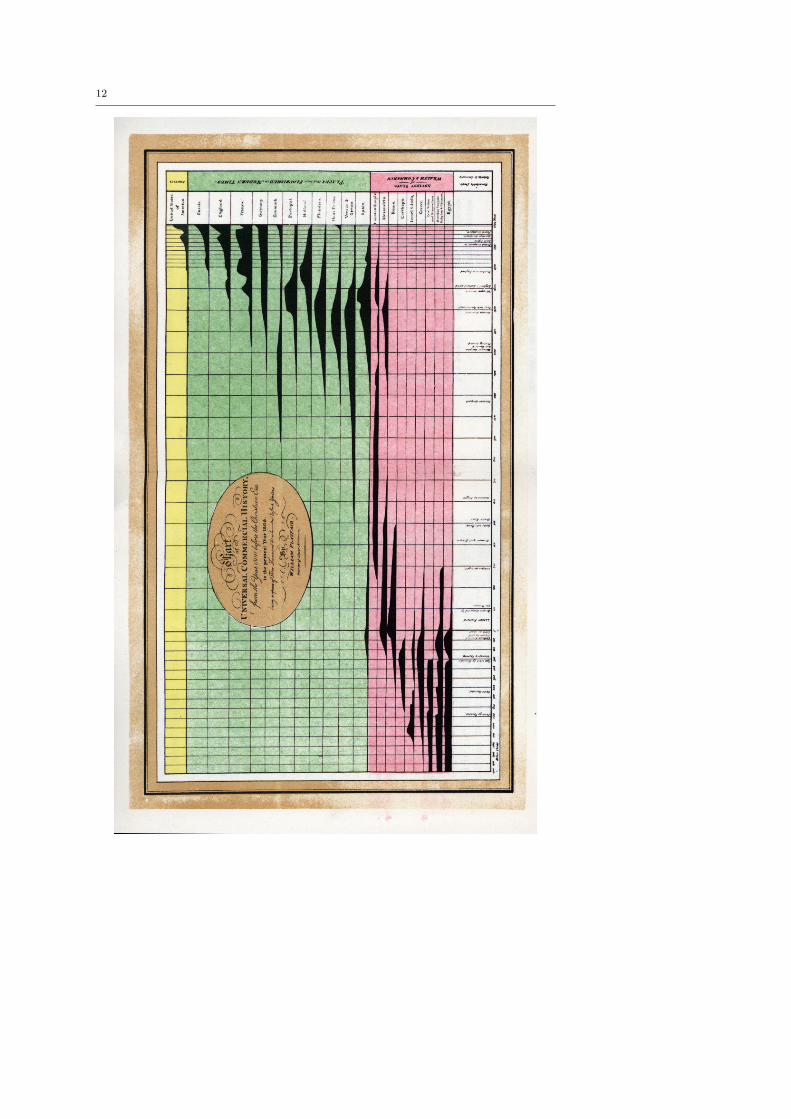
The second figure in the middle of Wenzlick’s booklet shows the “Chart of Universal
Commercial History from the Year 1500 before the Christian Era to the present Year
1805” and also was first published in Playfair (1805). This figure recently has been
republished and discussed in Spence (2006, p. 2431–2432 and Fig. 15) There are two
small differences in the Wenzlick version: (1) no label “FRONTISPIECE” at the top
left outer margin of the figure; and (2) no text “The Explanation of this Plate is at p.78”
at the bottom underneath the figure. These may have been edited out by Wenzlick so
as not to confuse readers of his booklet.
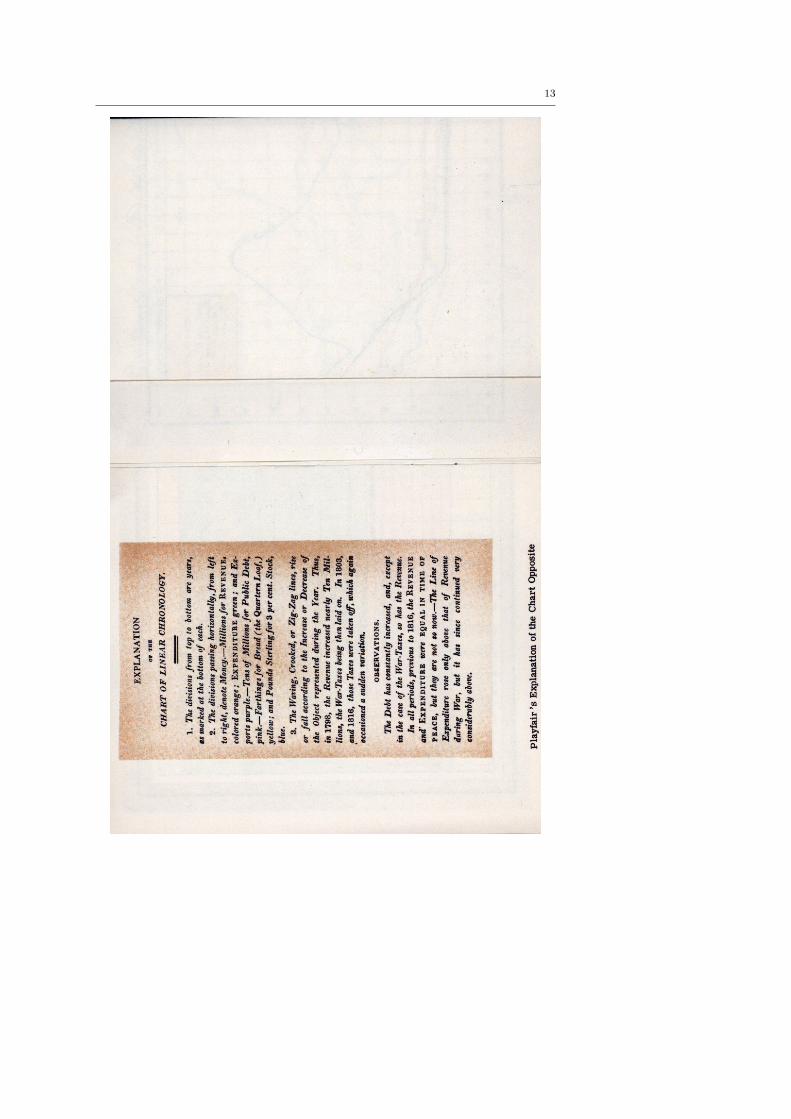
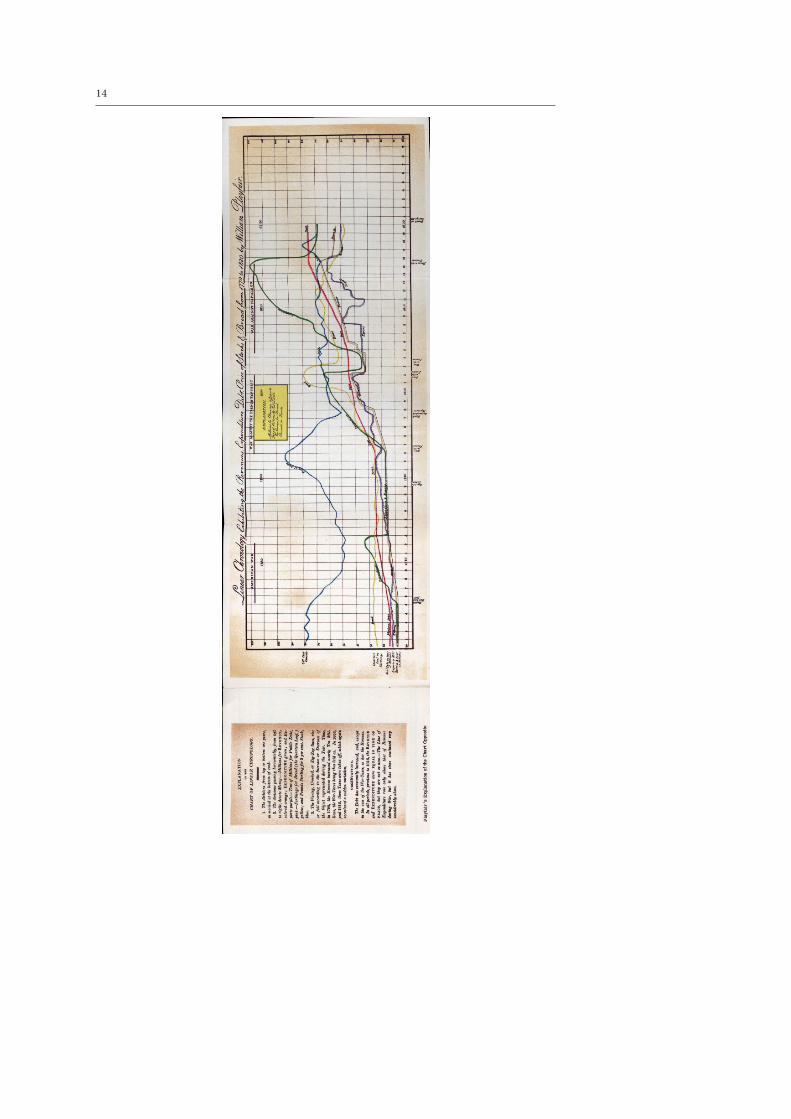
The last figure is a fold–out insert at the end of Wenzlick’s booklet and shows
the “Linear Chronology, Exhibiting the Revenues, Expenditure, Debt, Price of Stocks
& Bread, from 1770 to 1820.” This is really the most interesting of the Playfair charts
republished by Wenzlick. First, from a purely technical standpoint, the quality of the
reproduction clearly shows the original solid (Revenue), dotted (Bread), and various
6
dashed lines (Expenditure, Debt, Exports, Stocks) of the copperplate engraving over-
laid by the hand colored lines. Second, this might actually be Playfair’s final finished
and published graph.
This chart does not appear in any of the editions of Playfair (1821, 1822a,b) or
Playfair (1822?), which are Playfair’s only generally known publications from after
1820. The obituary on pages 564 to 566 of the June 1823 issue of the Gentleman’s
Magazine lists 41 of Playfair’s publications and states that “we doubt not that Mr.
Playfair (including pamphlets) was the author at least of one hundred distinct works”.
The first paragraph of Wenzlick (1950) where he stated that he “purchased a book
published in London in 1823. A folded chart was pasted into the front of the book” is a
first hint that this chart did not appear in any of Playfair’s letters or books. Although
we have not yet located the volume purchased by Wenzlick, we now believe that we
know the source of the chart and this will be the subject of a forthcoming article.
3 Computational Statistics and Graphics
Computational Statistics has a long history in publishing new developments in the field
of statistical graphics. In addition to numerous excellent articles on graphical methods
and graphical software in its regular issues, special editions of Computational Statistics
have been dedicated to various DataViz conferences, such as Volume 13, Issue 1 (1998),
and Volume 14, Issue 1 (1999). Forthcoming are issues dedicated to the work of the
winners of the 2006 Data Exposition, sponsored by the Sections on Statistical Graphics,
Statistical Computing, and Statistics and the Environment of the American Statistical
Association (ASA) (http://stat-computing.org/dataexpo/2006/) and to the 2008
DataViz Workshop held in Bremen, Germany (http://www.jacobs-university.de/
schools/shss/awilhelm/).
Perhaps, in some 200 or 250 years, someone may revisit an issue of Computational
Statistics and detect a graphical method introduced these days that is still in frequent
use at that point. Good luck to all of our authors who are working in the field of
Statistical Graphics — and let’s not forget what our discipline owes to William Playfair!
Acknowledgements Permission to reprint Roy Wenzlick’s booklet was granted by the West-ern Historical Manuscript Collection, University of Missouri–St. Louis, on March 12, 2009.This booklet is part of the Roy Wenzlick collection, archived as Box 4, Series 5, Item 108(http://www.umsl.edu/~whmc/guides/whm0574.htm). Fig. 1, Plate 2 (labeled No. 3) from Play-fair (1805), Courtesy of the Thomas Fisher Rare Book Library, University of Toronto, withminor additional electronic enhancements made for publication. Thanks are due to MichaelFriendly, Friedrich Leisch, and Howard Wainer for their helpful suggestions and comments thatconsiderably helped to improve this editorial. Additional thanks are due to James Odei and Ab-bass Sharif for proofreading and carefully checking the links and figures on the accompanyingWeb page.
References
Costigan-Eaves P, Macdonald-Ross M (1990) William Playfair (1759–1823). Statistical
Science 5(3):318–326
Droesbeke JJ (2009) Historical Anniversaries: William Playfair. ISI Newsletter
33(2):27–28, http://isi.cbs.nl/Nlet/ISINewsletter2009-2.pdf
7
FitzPatrick PJ (1960) Leading British Statisticians of the Nineteenth Century. Journal
of the American Statistical Association 55(289):38–70
Funkhouser HG (1937) Historical Development of the Graphical Representation of
Statistical Data. Osiris 3:269–404
Funkhouser HG, Walker HM (1935) Playfair and his Charts. Economic History 3:103–
109
Guy WA (1879) On Tabular Analysis. Journal of the Statistical Society of London
42(3):644–662
Guy WA (1885) Statistical Development, with Special Reference to Statistics as a
Science. Journal of the Statistical Society of London Jubilee Volume:72–86
Hankins TL, Silverman RJ (2006) Instruments and the Imagination (Paperback Edi-
tion). Princeton University Press, Princeton, NJ
Maas H, Morgan M (2002/2) Timing History: The Introduction of Graphical Analysis
in 19th Century British Economics. Revue d’Histoire des Sciences Humaines (7):97–
127
Playfair W (1786) The Commercial and Political Atlas. Debrett; Robinson; and Sewell,
London, U.K.
Playfair W (1805) An Inquiry into the Permanent Causes of the Decline and Fall of
Powerful and Wealthy Nations. Greenland & Norris, London, U.K.
Playfair W (1821) A Letter on Our Agricultural Distresses, Their Causes and Remedies.
W. Sams, London, U.K.
Playfair W (1822a) A Letter on Our Agricultural Distresses, Their Causes and Reme-
dies. (2nd Edition). W. Sams, London, U.K.
Playfair W (1822b) A Letter on Our Agricultural Distresses, Their Causes and Reme-
dies. (3rd Edition). W. Sams, London, U.K.
Playfair W (1822?) Can This Continue? W. Sams, London, U.K.
Playfair W (2005) The Commercial and Political Atlas and Statistical Breviary, Edited
and Introduced by Howard Wainer and Ian Spence. Cambridge University Press, New
York, NY
Rogers C (1872) Notes on the History of the Scottish Branch of the Norman House of
Roger. Transactions of the Royal Historical Society 1:357–388
Scott H (1925) Fasti Ecclesiæ Scoticanæ: The Succession of Ministers in the Church
of Scotland from the Reformation (New Edition), Volume V. Oliver and Boyd, Ed-
inburgh, U.K.
Smith BMD (2004) Keir, James (1735–1820)). In: Matthew HCG, Harrison B (eds)
Oxford Dictionary of National Biography, Oxford University Press, Oxford, U.K.,
http://www.oxforddnb.com/view/article/15259 (accessed 13 Aug 2009)
Spence I (2004) Playfair, William (1759–1823). In: Matthew HCG, Harrison B (eds)
Oxford Dictionary of National Biography, Oxford University Press, Oxford, U.K.,
http://www.oxforddnb.com/view/article/22370 (accessed 13 Aug 2009)
Spence I (2005) No Humble Pie: The Origins and Usage of a Statistical Chart. Journal
of Educational and Behavioral Statistics 30(4):353–368
Spence I (2006) William Playfair and the Psychology of Graphs. In: 2006 JSM Pro-
ceedings, American Statistical Association, Alexandria, VA, pp 2426–2436, (CD)
Tann J (ed) (1993) The Industrial Revolution: A Documentary History. Series One,
The Boulton and Watt Archive and the Matthew Boulton Papers from the Birm-
ingham Central Library. Part 1: Lunar Society Correspondence. Reel 11, Letter
16, James Keir to Matthew Boulton [?1777]. Adam Matthew Publications, Marl-
borough, U.K., http://www.adam-matthew-publications.co.uk/digital_guides/
8
industrial_revolution/
Wainer H (2005) Graphic Discovery: A Trout in the Milk and Other Visual Adventures.
Princeton University Press, Princeton, NJ
Wenzlick R (1950) William Playfair and his Charts. Unpublished Manuscript, St. Louis
I, MO
Appendix 1: Reproduction of Wenzlick (1950)
The following pages contain scans of the Wenzlick (1950) booklet and have been re-
produced without any modification. Two pages were scanned at a time. The left side
of the first scanned page shows the last page of the booklet.
9
10
11
12
13
14
15
Appendix 2: Christmas Greetings Accompanying Wenzlick (1950)
16
Appendix 3: Playfair at Boulton & Watt
In a letter to Matthew Boulton, apparently written in 1777 and republished in Tann
(1993), James Keir, Scottish chemist, geologist, industrialist, inventor, and member of
the Lunar Society (Smith, 2004) discusses Playfair’s arrival at Boulton & Watt:
”You and Mr Watt desired to know on what expectations of Settlement Mr
[William] Playfair came to Soho. I shall therefore copy the passages of one of
Mr [Robert] Small’s letters concerning him, and send you enclosed two others
relating almost entirely to him —
’When I was at Birmingham Mr Boulton had some conversation with me
on the subject of the Steam Engine &c, in particular said he doubted not but he
might have use for some ingenious young man that might go to distant places
and superintend the erection of them. There is a young man here [Dundee] with
whom I am exceedingly pleased and whom I think might be very serviceable to
Mr Boulton in that business, or in various other ones. His name is Playfair
and his age 18 or 19.
His turn was always mechanical and he has served his apprenticeship to
a Millwright in East Lothian. I have a very great opinion of his capacity and
ingenuity, having seen many curious inventions and models of his, and his draw-
ings are in my opinion remarkably good also. He is the son of a minister in this
neighbourhood, who was a most intimate friend of mine. On his father’s death
his education was carried on by his brother [John Playfair], who besides being
one of the best mathematicians and Philosophers in the island is one of the
worthiest of men’.”
The quotation above has been adapted from http://www.adam-matthew-publications.
co.uk/digital_guides/industrial_revolution/detailed%20listing%20-%20part%201.
aspx. Several additional references to Playfair related to his time at Boulton & Watt
can be found in the same archive.