ecological factors and diversification among neotropical characiforms
TRANSCRIPT
Hindawi Publishing CorporationInternational Journal of EcologyVolume 2012, Article ID 610419, 20 pagesdoi:10.1155/2012/610419
Research Article
Ecological Factors and Diversification amongNeotropical Characiforms
Castor Guisande,1 Patricia Pelayo-Villamil,2 Manuel Vera,3
Ana Manjarres-Hernandez,4 Monica R. Carvalho,5 Richard P. Vari,6
Luz Fernanda Jimenez,2 Carlos Fernandez,3 Paulino Martınez,3
Edgar Prieto-Piraquive,7 Carlos Granado-Lorencio,7 and Santiago R. Duque4
1 Facultad de Ciencias, Universidad de Vigo, Lagoas-Marcosende, 36200 Vigo, Spain2 Grupo de Ictiologıa, Universidad de Antioquia, A.A. 1226, Medellın, Colombia3 Departamento de Xenetica, Facultade de Veterinaria, Universidade de Santiago de Compostela, Campus de Lugo,Avenida Carballo Calero s/n 27002 Lugo, Spain
4 Instituto Amazonico de Investigaciones (IMANI), Universidad Nacional de Colombia, Km 2 vıa Tarapaca, Leticia, Colombia5 Instituto de Biologıa, Universidad de Antioquia, A.A. 1226, Medellın, Colombia6 National Museum of Natural History, Smithsonian Institution, P.O. Box 37012, MRC 159, Washington, DC, USA7 Departamento de Biologıa Vegetal y Ecologıa, Facultad de Biologıa, Universidad de Sevilla,Avenida de Reina Mercedes s/n, 41012-Sevilla, Spain
Correspondence should be addressed to Castor Guisande, [email protected]
Received 25 August 2011; Revised 4 December 2011; Accepted 31 January 2012
Academic Editor: J. J. Wiens
Copyright © 2012 Castor Guisande et al. This is an open access article distributed under the Creative Commons AttributionLicense, which permits unrestricted use, distribution, and reproduction in any medium, provided the original work is properlycited.
Morphological and DNA sequence data has been used to propose hypotheses of relationships within the Characiformes withminimal comparative discussion of causes underpinning the major intraordinal diversification patterns. We explore potentialprimary morphological factors controlling the early diversification process in some Neotropical characiforms as the first step toidentifying factors contributing to the pronounced intraordinal morphological and species diversity. A phylogenetic reconstructionbased on 16S rDNA (mitochondrial) and 18S rDNA (nuclear) genes provided the framework for the identification of the mainmorphological differences among the Acestrorhynchidae, Anostomidae, Characidae, Ctenoluciidae, Curimatidae, Cynodontidae,Gasteropelecidae, Prochilodontidae and Serrasalmidae. Results indicate an initial split into two major groupings: (i) specieswith long dorsal-fin bases relative to the size of other fins (Curimatidae, Prochilodontidae, Anostomidae, Serrasalmidae)which primarily inhabit lakes, swamps, and rivers (lineage I); and (ii) species with short dorsal-fin bases (Acestrorhynchidae,Gasteropelecidae, Characidae) which primarily inhabit creeks and streams (lineage II). The second diversification stage in lineageI involved substantial morphological diversification associated with trophic niche differences among the monophyletic familieswhich range from detritivores to large item predators. Nonmonophyly of the Characidae complicated within lineage II analyzesbut yielded groupings based on differences in pectoral and anal fin sizes correlated with life style differences.
1. Introduction
The speciose nature of tropical freshwater fish faunas hasattracted the attention of many scientists [1, 2]. Prominentamong the studied taxa are East African cichlids, with thesestudies yielding a general agreement that both sexual selec-tion and morphological adaptation, particularly of the feed-ing apparatus, were the factors responsible for the explosive
radiation of cichlids [3]. The relative timing and importanceof these mechanisms remain unclear; however, it has beenproposed that trophic differentiation played an importantrole during the early stages of the speciation process incichlids. An alternative hypothesis proposes that ecologicaldivergence and adaptive morphological change are not theprimary cause of speciation in cichlids, but rather occurfollowing the establishment of genetic isolation via other
2 International Journal of Ecology
mechanisms (see [3]). Another excellent group on which toexamine the factors responsible of the diversification processis the Characiformes, a speciose order widespread in tropicalfreshwaters of Africa and the Neotropics.
The Characiformes includes over 1996 species (although24 species were described in 2011, so it seems that the cumu-lative species description curves for Characiformes have notyet closely approached its asymptote), now divided among20 families, of which four are mostly African (Alestidae,Citharinidae, Distichodontidae, and Hepsetidae), and theothers mostly Neotropical (Acestrorhynchidae, Anostomi-dae, Chalceidae, Characidae, Chilodontidae, Crenuchidae,Ctenoluciidae, Curimatidae, Cynodontidae, Erythrinidae,Gasteropelecidae, Hemiodontidae, Lebiasinidae, Parodonti-dae, Prochilodontidae, and Serrasalmidae) (see IPez [4]).Species diversity ranges dramatically among Neotropicalfamilies from a high of nearly 1200 species in the Characidaeto only seven species in the Ctenoluciidae. More note-worthy is the dramatic diversity in body shape across theCharaciformes, which is arguably the most pronouncedwithin epicontinental fish faunas [5]. This range in externalmorphology is matched and in many instances surpassed bythat in internal systems.
The phylogeny of various subunits of Neotropicalcharaciforms has been studied based on information fromdiverse genetic sequences [6–10] and morphological charac-ters [11–15]. The aim of most of these studies was to obtain arobust phylogeny and all were to varying degrees informativeas to the core question of evolutionary relationships withinthe order. One informative way to address that questionis to use phylogenetic trees as a framework to identify themorphological differences among the different clades. Thephylogeny can also be used to address the phylogenetic signalof different ecological and morphological characters.
The aim of this study was to examine whether therewere differences in habitat and trophic morphology amongthe clades obtained in a phylogenetic tree, among speciesthat belong to a major subset of the families of Neotropicalcharaciforms. Our aim was not to generate an all inclusivephylogeny within the order Characiformes, but to generatea phylogeny appropriate for addressing specific ecologi-cal/evolutionary questions involving those species for whichwe have morphological data. Machine learning techniqueswere used to identify the main morphometric and trophiccharacters that discriminate lineages identified by phylo-genetic hypotheses based on the analysis of mitochondrial(16S rRNA) and nuclear (18S rRNA) gene sequences. Thesehypotheses and the morphological features that differ togreater degrees among clades were assessed for phylogeneticsignal in order to test the degree to which closely relatedfamilies resemble or diverge from each another and to ex-amine character dependence across lineage histories.
2. Material and Methods
2.1. Fish Sampling. The taxonomic sampling strategy wasa dense taxonomic survey covering most of the families ofNeotropical characiforms including both those that have
been proposed to be monophyletic and others whose mon-ophyly is questionable. This approach is preferable overthe alternative of dense taxonomic sampling within a well-defined monophyletic family since the aim of the study wasto identify early stages of the diversification process priorto the development of characters that delimit obviouslymonophyletic groups which are recognized taxonomically atthe family level.
Specimens that served as the basis of the analyses werecollected in a range of aquatic habitats within the Rıo Mag-dalena-Cauca and Amazon basins from January 2007 to June2008 using multiple methods. Fishes were anesthetized withtricaine (MS-222, 250 mg L−1) in a tank prior to preserva-tion with 977 individuals of 68 species analyzed. Speciesand number of individuals of each species used for themorphometric and DNA analyses are detailed in Table 1.
2.2. Habitat Preferences. Species were grouped according totheir habitat preferences into those species that preferentiallyinhabit rivers, lakes/swamps, or creeks/streams.
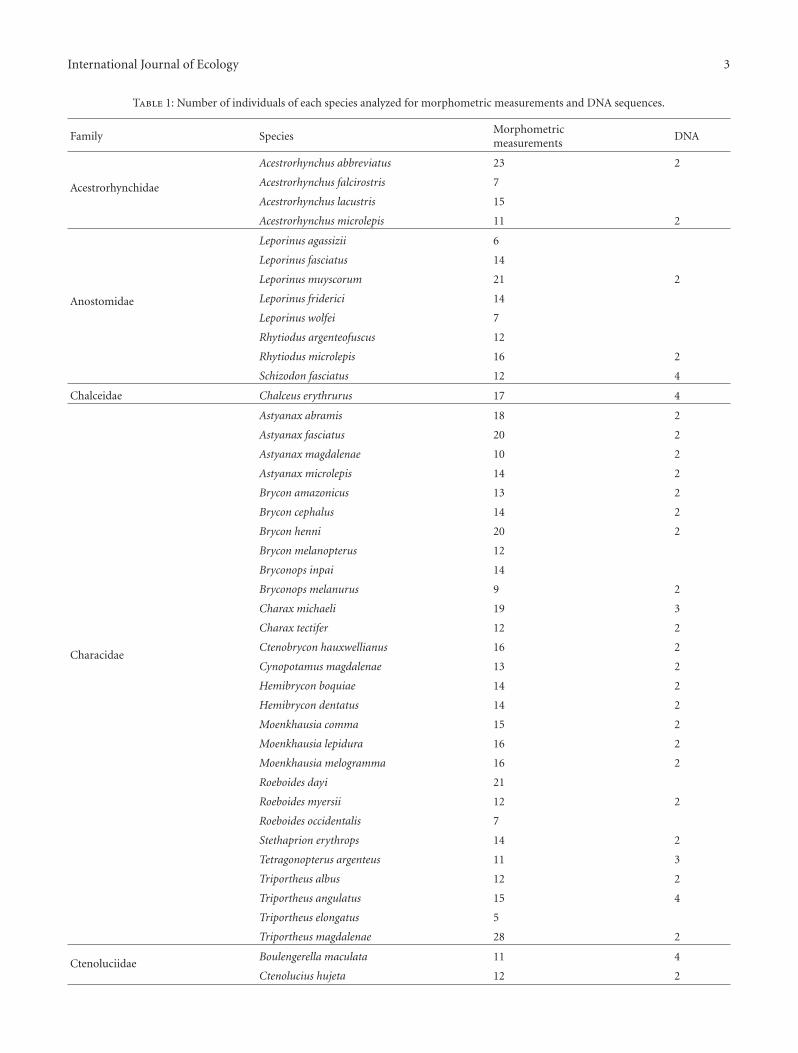
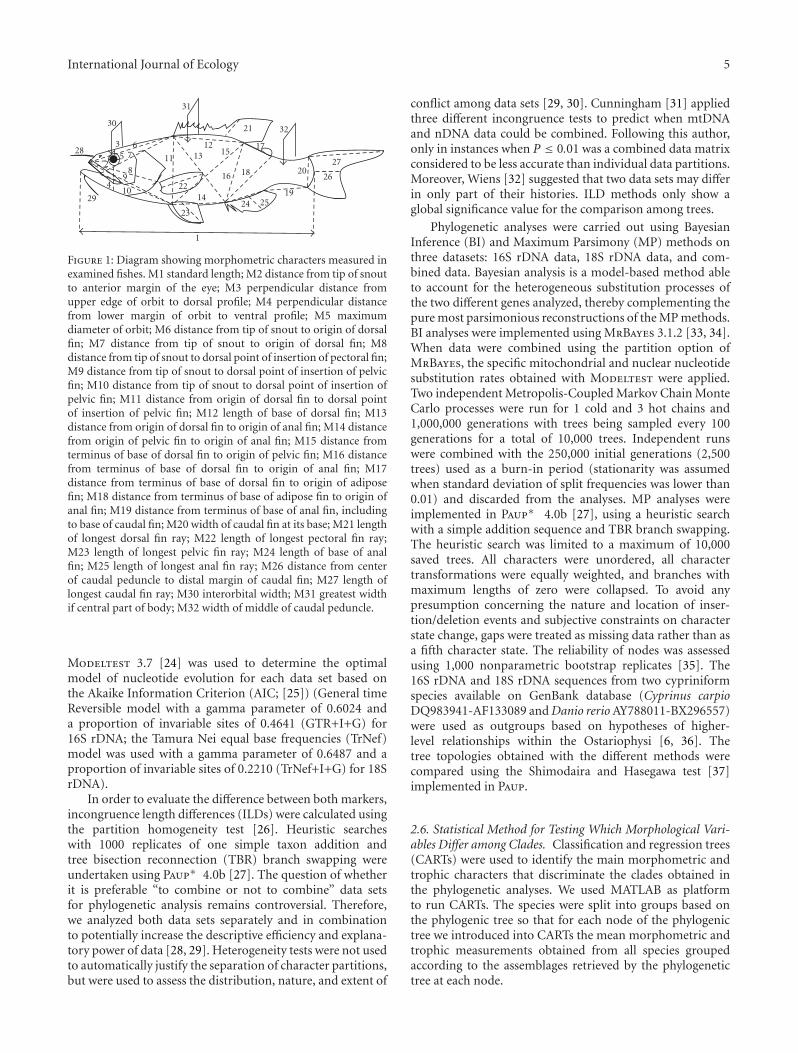
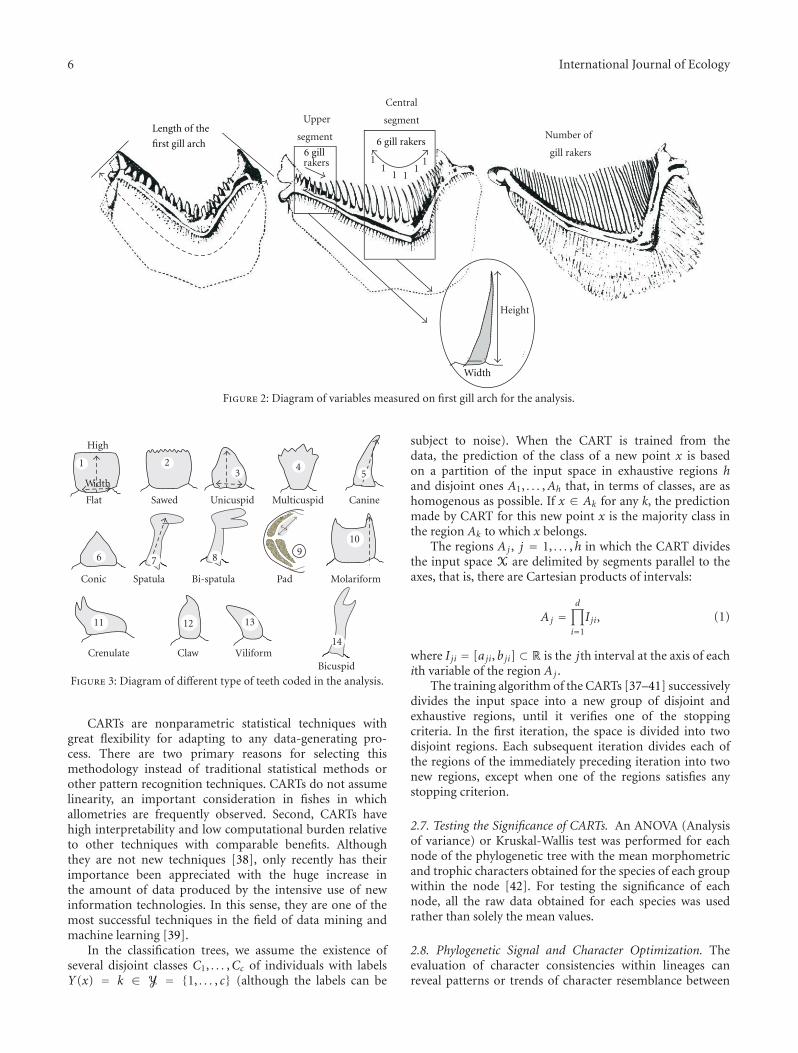
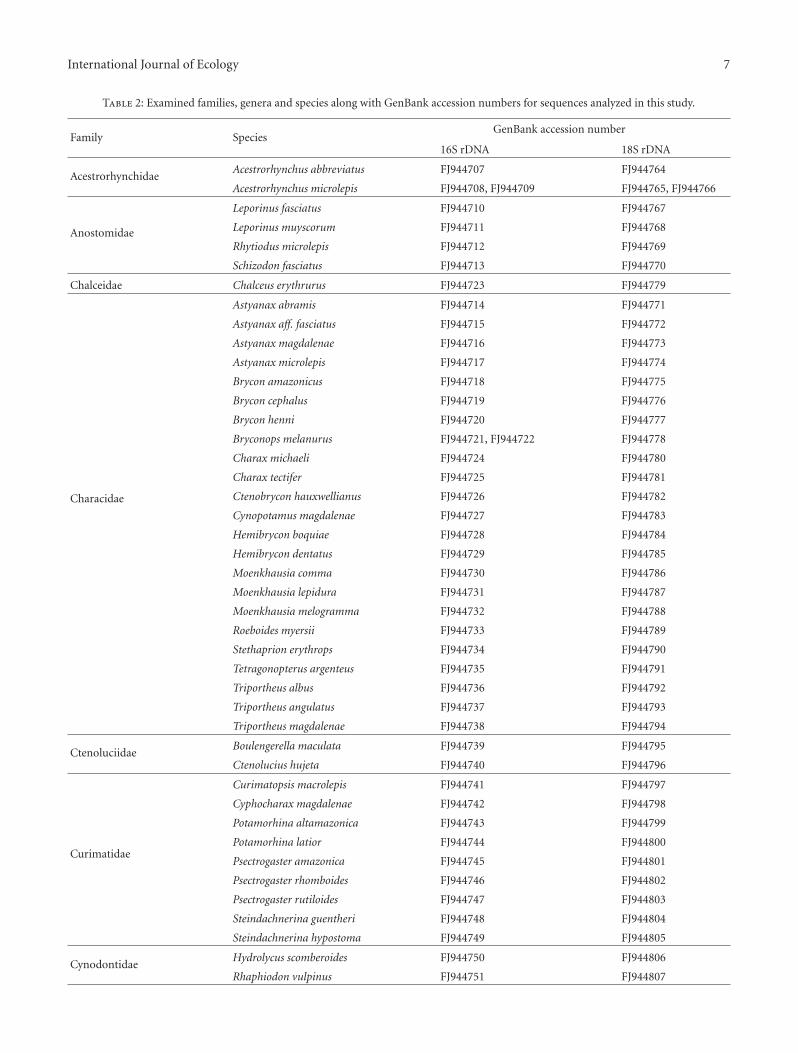
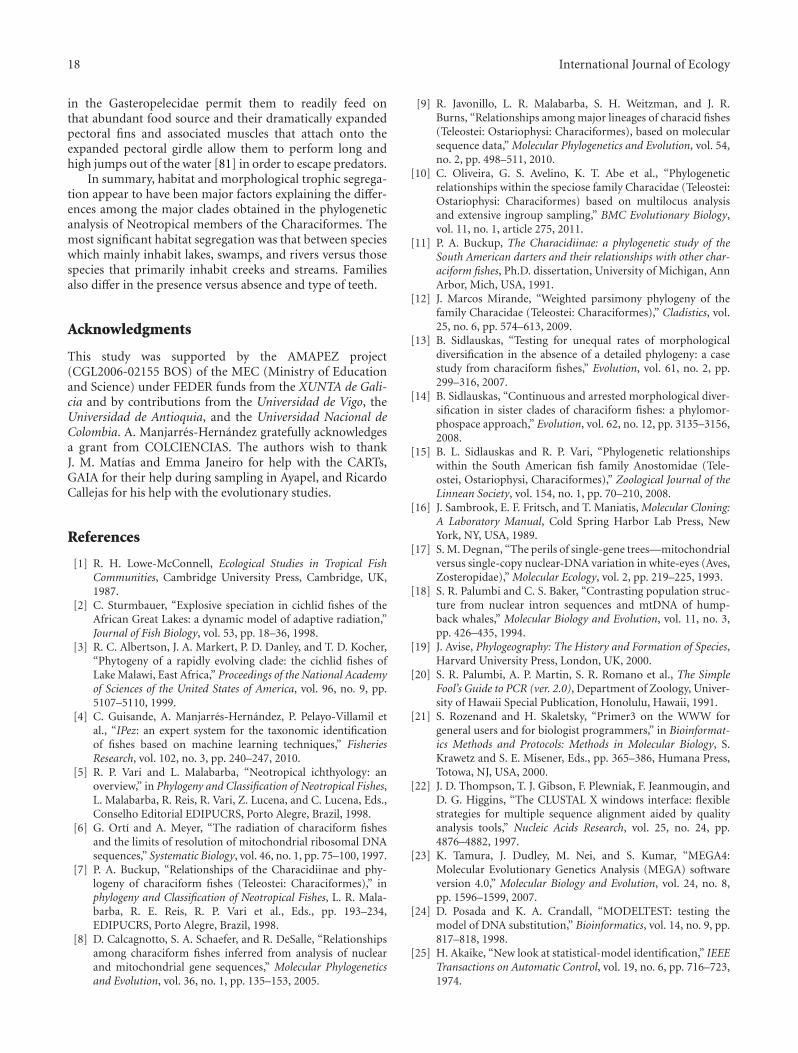
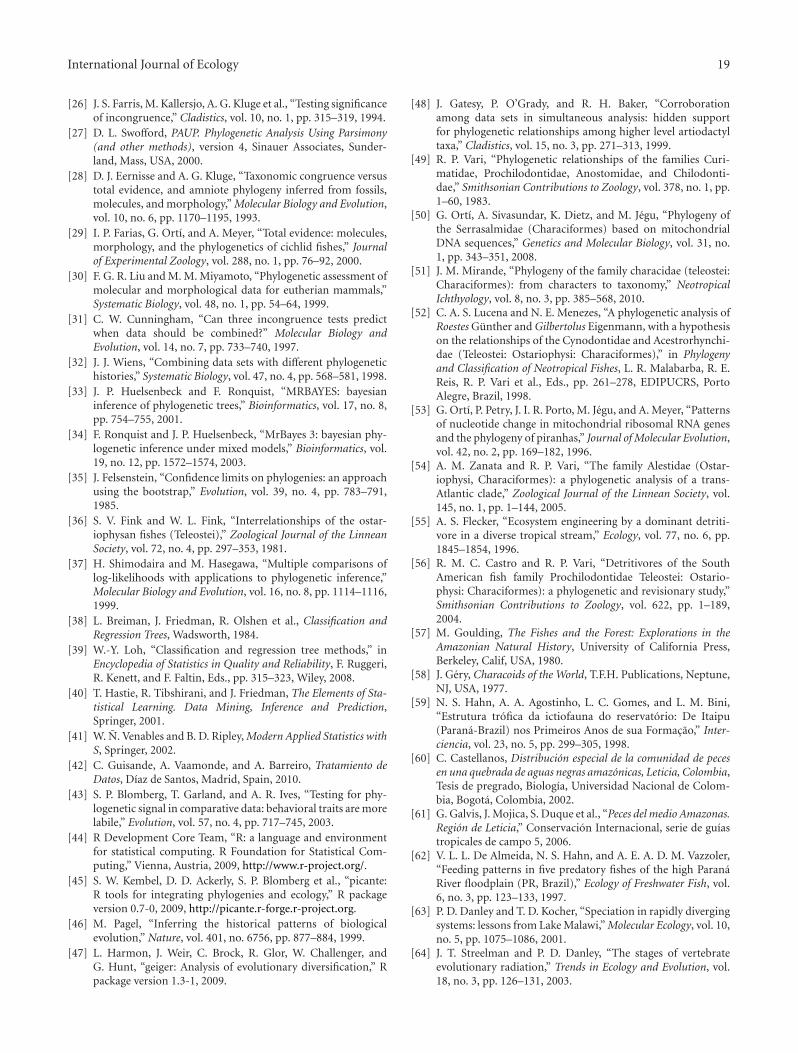
2.3. Morphometric and Trophic Measurements. A total of 32morphological variables were measured in five to 29 adultsof each sampled species without making any distinctionbetween sexes since sexual dimorphism does not occurin these variables among characiforms (Figure 1). Thesevariables were standardized relative to standard length (eachmeasurement was divided by the standard length) and reflectthe primary aspects of external morphology. Several trophicvariables were measured on these individuals. These were thelength of the digestive tract, the length of the first gill-arch(Figure 2), the number of gill rakers on the first arch, andthe width and height of six gill rakers along both the centraland upper segments of the first arch (Figure 2). Counts of thenumbers of teeth on the maxilla, suspensorium, and dorsaland ventral portions of the gill arch were taken. The heightand width of the first 5 teeth in both the upper and lowerjaws were measured (see schematics in Figure 3 for modes ofmeasurement of the different tooth types).
2.4. DNA Extraction, PCR Amplification, and Sequencing.Fifty-three species were incorporated into the molecularanalysis. Genomic DNA was isolated from skeletal muscleusing the Phenol-Chloroform DNA extraction protocol [16]or using DNeasy Blood and Tissue Kit (Qiagen, Hilden,Germany). At least two individuals per species were analyzed(Table 1). Double-stranded DNA was amplified for tworibosomal genes, one mitochondrial (16S rDNA) and theother nuclear (18S rDNA). Despite the high performance ofmitochondrial DNA (mtDNA) for phylogenetic analysis, theuse of both mtDNA and nuclear DNA (nDNA) markers hasbeen emphasized, as the mitochondrial genome only rep-resents a maternal perspective of the total historical recordof sexually reproducing organisms [17–19]. Amplificationof the mitochondrial 16S rDNA region was carried outusing 16Sa-L2510 and 16Sb-H3080 universal primers [20].To amplify nuclear 18S rDNA, a pair of primers was designedusing available 18S rDNA sequences in GenBank from brown
International Journal of Ecology 3
Table 1: Number of individuals of each species analyzed for morphometric measurements and DNA sequences.
Family SpeciesMorphometricmeasurements
DNA
Acestrorhynchidae
Acestrorhynchus abbreviatus 23 2
Acestrorhynchus falcirostris 7
Acestrorhynchus lacustris 15
Acestrorhynchus microlepis 11 2
Anostomidae
Leporinus agassizii 6
Leporinus fasciatus 14
Leporinus muyscorum 21 2
Leporinus friderici 14
Leporinus wolfei 7
Rhytiodus argenteofuscus 12
Rhytiodus microlepis 16 2
Schizodon fasciatus 12 4
Chalceidae Chalceus erythrurus 17 4
Characidae
Astyanax abramis 18 2
Astyanax fasciatus 20 2
Astyanax magdalenae 10 2
Astyanax microlepis 14 2
Brycon amazonicus 13 2
Brycon cephalus 14 2
Brycon henni 20 2
Brycon melanopterus 12
Bryconops inpai 14
Bryconops melanurus 9 2
Charax michaeli 19 3
Charax tectifer 12 2
Ctenobrycon hauxwellianus 16 2
Cynopotamus magdalenae 13 2
Hemibrycon boquiae 14 2
Hemibrycon dentatus 14 2
Moenkhausia comma 15 2
Moenkhausia lepidura 16 2
Moenkhausia melogramma 16 2
Roeboides dayi 21
Roeboides myersii 12 2
Roeboides occidentalis 7
Stethaprion erythrops 14 2
Tetragonopterus argenteus 11 3
Triportheus albus 12 2
Triportheus angulatus 15 4
Triportheus elongatus 5
Triportheus magdalenae 28 2
CtenoluciidaeBoulengerella maculata 11 4
Ctenolucius hujeta 12 2
4 International Journal of Ecology
Table 1: Continued.
Family SpeciesMorphometricmeasurements
DNA
Curimatidae
Curimatopsis macrolepis 24 2
Cyphocharax magdalenae 24 2
Cyphocharax spiluropsis 10
Potamorhina altamazonica 17 4
Potamorhina latior 14 2
Psectrogaster amazonica 12 2
Psectrogaster rhomboides 16 2
Psectrogaster rutiloides 14 2
Steindachnerina guentheri 17 2
Steindachnerina hypostoma 11 2
CynodontidaeHydrolycus scomberoides 8 2
Rhaphiodon vulpinus 11 4
Gasteropelecidae
Carnegiella schereri 10
Carnegiella strigata 15 2
Thoracocharax securis 9
Thoracocharax stellatus 16 2
ProchilodontidaeProchilodus magdalenae 29 2
Prochilodus nigricans 15 2
Semaprochilodus insignis 17 2
Serrasalmidae
Colossoma macropomum 10 2
Mylossoma aureum 10 4
Mylossoma duriventre 18 2
Pygocentrus nattereri 17 2
Serrasalmus elongatus 11 2
Serrasalmus rhombeus 10 2
trout (Salmo trutta, GenBank accession number: X98839),turbot (Scophthalmus maximus EF126038) and several siluri-form species (Channallabes longicaudatus AJ876391, Ictalu-rus punctatus AF021880, Clarias jaensis AJ876386) and onecharaciform species (Prochilodus marggravii AY449633). Thefollowing primers were finally designed using the programPrimer3 [21] 18S-448F 5′-AAACGGCTACCACATCCAAG-3′ and 18S-1041R 5′-CCTCCGACTTTCGTTCTTGA-3′.
PCR was performed in 50 μL of reaction mixture con-taining 100–300 ng of template DNA, 1X PCR Gold Buffer,2.5 mM MgCl2, 0.4 mM of each dNTP, 10 pmol of eachprimer, and 2.5 units of Ampli Taq Gold DNA polymerase(Applied Biosystems, Foster City, CA, USA). PCRs werecarried out in a PTC-100 thermocycler (MJ Research) asfollows: an initial denaturation step at 94◦C for 10 min; 35cycles of 93◦C for 1 min, annealing (50◦C for 16S rDNA and58◦C for 18S rDNA) for 1 min and 72◦C for 3 min; a finalextension step at 72◦C of extension for 10 min. PCR productswere purified using the Spinclean PCR Purification Kit(MyBiotech, Seoul, South Korea) and sequenced followingthe ABI Prism BigDye Terminator v3.1 Cycle SequencingKit protocol on an ABI 3730 DNA sequencer (AppliedBiosystems, Foster City, CA, USA).
2.5. Phylogenetic Analyses. Sequences for both markers (16SrDNA and 18S rDNA) were compared with homolo-gous sequences available on public databases. Errors andnucleotide indeterminations were checked using the pro-gram SeqScape 2.5 (Applied Biosystems). This programchecks the quality of each nucleotide site (a quality value QVis given for each site) showing the electropherogram for eachsequence and allowing its editing. The sequences derivedherein were compared with homologous ones available inpublic databases. Variable sites were checked by hand usingthe program SeqScape 2.5 (Applied Biosystems, Foster City,CA, USA). Sequences were aligned using Clustal X 2.0 [22]with default parameters for gap opening (= 15) and gapextension costs (= 6.66). The different haplotypes fromthe Clustal alignments were detected using the Mega 4.0program [23]. All of the different haplotypes for each specieswere included in the analyses. The Mega 4.0 program wasalso used to estimate the number of nucleotide changesand genetic distances between the characiform taxa in theanalyses (families and species). All haplotype sequenceshave been submitted to GenBank (16S rDNA accessionnumbers: FJ944707 to FJ944763; 18S rDNA accession num-bers: FJ944764 to FJ944818, see Table 2). The program
International Journal of Ecology 5
1
2
3 6
31
32
4
75
89
10
11
1213
18
19
20
21
22
2325
26
27
2414
15
16
17
29
28
30
Figure 1: Diagram showing morphometric characters measured inexamined fishes. M1 standard length; M2 distance from tip of snoutto anterior margin of the eye; M3 perpendicular distance fromupper edge of orbit to dorsal profile; M4 perpendicular distancefrom lower margin of orbit to ventral profile; M5 maximumdiameter of orbit; M6 distance from tip of snout to origin of dorsalfin; M7 distance from tip of snout to origin of dorsal fin; M8distance from tip of snout to dorsal point of insertion of pectoral fin;M9 distance from tip of snout to dorsal point of insertion of pelvicfin; M10 distance from tip of snout to dorsal point of insertion ofpelvic fin; M11 distance from origin of dorsal fin to dorsal pointof insertion of pelvic fin; M12 length of base of dorsal fin; M13distance from origin of dorsal fin to origin of anal fin; M14 distancefrom origin of pelvic fin to origin of anal fin; M15 distance fromterminus of base of dorsal fin to origin of pelvic fin; M16 distancefrom terminus of base of dorsal fin to origin of anal fin; M17distance from terminus of base of dorsal fin to origin of adiposefin; M18 distance from terminus of base of adipose fin to origin ofanal fin; M19 distance from terminus of base of anal fin, includingto base of caudal fin; M20 width of caudal fin at its base; M21 lengthof longest dorsal fin ray; M22 length of longest pectoral fin ray;M23 length of longest pelvic fin ray; M24 length of base of analfin; M25 length of longest anal fin ray; M26 distance from centerof caudal peduncle to distal margin of caudal fin; M27 length oflongest caudal fin ray; M30 interorbital width; M31 greatest widthif central part of body; M32 width of middle of caudal peduncle.
Modeltest 3.7 [24] was used to determine the optimalmodel of nucleotide evolution for each data set based onthe Akaike Information Criterion (AIC; [25]) (General timeReversible model with a gamma parameter of 0.6024 anda proportion of invariable sites of 0.4641 (GTR+I+G) for16S rDNA; the Tamura Nei equal base frequencies (TrNef)model was used with a gamma parameter of 0.6487 and aproportion of invariable sites of 0.2210 (TrNef+I+G) for 18SrDNA).
In order to evaluate the difference between both markers,incongruence length differences (ILDs) were calculated usingthe partition homogeneity test [26]. Heuristic searcheswith 1000 replicates of one simple taxon addition andtree bisection reconnection (TBR) branch swapping wereundertaken using Paup∗ 4.0b [27]. The question of whetherit is preferable “to combine or not to combine” data setsfor phylogenetic analysis remains controversial. Therefore,we analyzed both data sets separately and in combinationto potentially increase the descriptive efficiency and explana-tory power of data [28, 29]. Heterogeneity tests were not usedto automatically justify the separation of character partitions,but were used to assess the distribution, nature, and extent of
conflict among data sets [29, 30]. Cunningham [31] appliedthree different incongruence tests to predict when mtDNAand nDNA data could be combined. Following this author,only in instances when P ≤ 0.01 was a combined data matrixconsidered to be less accurate than individual data partitions.Moreover, Wiens [32] suggested that two data sets may differin only part of their histories. ILD methods only show aglobal significance value for the comparison among trees.
Phylogenetic analyses were carried out using BayesianInference (BI) and Maximum Parsimony (MP) methods onthree datasets: 16S rDNA data, 18S rDNA data, and com-bined data. Bayesian analysis is a model-based method ableto account for the heterogeneous substitution processes ofthe two different genes analyzed, thereby complementing thepure most parsimonious reconstructions of the MP methods.BI analyses were implemented using MrBayes 3.1.2 [33, 34].When data were combined using the partition option ofMrBayes, the specific mitochondrial and nuclear nucleotidesubstitution rates obtained with Modeltest were applied.Two independent Metropolis-Coupled Markov Chain MonteCarlo processes were run for 1 cold and 3 hot chains and1,000,000 generations with trees being sampled every 100generations for a total of 10,000 trees. Independent runswere combined with the 250,000 initial generations (2,500trees) used as a burn-in period (stationarity was assumedwhen standard deviation of split frequencies was lower than0.01) and discarded from the analyses. MP analyses wereimplemented in Paup∗ 4.0b [27], using a heuristic searchwith a simple addition sequence and TBR branch swapping.The heuristic search was limited to a maximum of 10,000saved trees. All characters were unordered, all charactertransformations were equally weighted, and branches withmaximum lengths of zero were collapsed. To avoid anypresumption concerning the nature and location of inser-tion/deletion events and subjective constraints on characterstate change, gaps were treated as missing data rather than asa fifth character state. The reliability of nodes was assessedusing 1,000 nonparametric bootstrap replicates [35]. The16S rDNA and 18S rDNA sequences from two cypriniformspecies available on GenBank database (Cyprinus carpioDQ983941-AF133089 and Danio rerio AY788011-BX296557)were used as outgroups based on hypotheses of higher-level relationships within the Ostariophysi [6, 36]. Thetree topologies obtained with the different methods werecompared using the Shimodaira and Hasegawa test [37]implemented in Paup.
2.6. Statistical Method for Testing Which Morphological Vari-ables Differ among Clades. Classification and regression trees(CARTs) were used to identify the main morphometric andtrophic characters that discriminate the clades obtained inthe phylogenetic analyses. We used MATLAB as platformto run CARTs. The species were split into groups based onthe phylogenic tree so that for each node of the phylogenictree we introduced into CARTs the mean morphometric andtrophic measurements obtained from all species groupedaccording to the assemblages retrieved by the phylogenetictree at each node.
6 International Journal of Ecology
Upper
segment
Central
segment
rakers 11
1 11
1
Height
Number of
gill rakers6 gill
Width
Length of the
first gill arch 6 gill rakers
Figure 2: Diagram of variables measured on first gill arch for the analysis.
UnicuspidSawedFlat Multicuspid Canine
SpatulaConic
High
Width
1 23
45
6 7
Bi-spatula
8
Pad
9
Molariform
10
Crenulate
11
Claw
12 13
ViliformBicuspid
14
Figure 3: Diagram of different type of teeth coded in the analysis.
CARTs are nonparametric statistical techniques withgreat flexibility for adapting to any data-generating pro-cess. There are two primary reasons for selecting thismethodology instead of traditional statistical methods orother pattern recognition techniques. CARTs do not assumelinearity, an important consideration in fishes in whichallometries are frequently observed. Second, CARTs havehigh interpretability and low computational burden relativeto other techniques with comparable benefits. Althoughthey are not new techniques [38], only recently has theirimportance been appreciated with the huge increase inthe amount of data produced by the intensive use of newinformation technologies. In this sense, they are one of themost successful techniques in the field of data mining andmachine learning [39].
In the classification trees, we assume the existence ofseveral disjoint classes C1, . . . ,Cc of individuals with labelsY(x) = k ∈ Y = {1, . . . , c} (although the labels can be
subject to noise). When the CART is trained from thedata, the prediction of the class of a new point x is basedon a partition of the input space in exhaustive regions hand disjoint ones A1, . . . ,Ah that, in terms of classes, are ashomogenous as possible. If x ∈ Ak for any k, the predictionmade by CART for this new point x is the majority class inthe region Ak to which x belongs.
The regions Aj , j = 1, . . . ,h in which the CART dividesthe input space X are delimited by segments parallel to theaxes, that is, there are Cartesian products of intervals:
Aj =d∏
i=1
I ji, (1)
where I ji = [aji, bji] ⊂ R is the jth interval at the axis of eachith variable of the region Aj .
The training algorithm of the CARTs [37–41] successivelydivides the input space into a new group of disjoint andexhaustive regions, until it verifies one of the stoppingcriteria. In the first iteration, the space is divided into twodisjoint regions. Each subsequent iteration divides each ofthe regions of the immediately preceding iteration into twonew regions, except when one of the regions satisfies anystopping criterion.
2.7. Testing the Significance of CARTs. An ANOVA (Analysisof variance) or Kruskal-Wallis test was performed for eachnode of the phylogenetic tree with the mean morphometricand trophic characters obtained for the species of each groupwithin the node [42]. For testing the significance of eachnode, all the raw data obtained for each species was usedrather than solely the mean values.
2.8. Phylogenetic Signal and Character Optimization. Theevaluation of character consistencies within lineages canreveal patterns or trends of character resemblance between
International Journal of Ecology 7
Table 2: Examined families, genera and species along with GenBank accession numbers for sequences analyzed in this study.
Family SpeciesGenBank accession number
16S rDNA 18S rDNA
AcestrorhynchidaeAcestrorhynchus abbreviatus FJ944707 FJ944764
Acestrorhynchus microlepis FJ944708, FJ944709 FJ944765, FJ944766
Anostomidae
Leporinus fasciatus FJ944710 FJ944767
Leporinus muyscorum FJ944711 FJ944768
Rhytiodus microlepis FJ944712 FJ944769
Schizodon fasciatus FJ944713 FJ944770
Chalceidae Chalceus erythrurus FJ944723 FJ944779
Characidae
Astyanax abramis FJ944714 FJ944771
Astyanax aff. fasciatus FJ944715 FJ944772
Astyanax magdalenae FJ944716 FJ944773
Astyanax microlepis FJ944717 FJ944774
Brycon amazonicus FJ944718 FJ944775
Brycon cephalus FJ944719 FJ944776
Brycon henni FJ944720 FJ944777
Bryconops melanurus FJ944721, FJ944722 FJ944778
Charax michaeli FJ944724 FJ944780
Charax tectifer FJ944725 FJ944781
Ctenobrycon hauxwellianus FJ944726 FJ944782
Cynopotamus magdalenae FJ944727 FJ944783
Hemibrycon boquiae FJ944728 FJ944784
Hemibrycon dentatus FJ944729 FJ944785
Moenkhausia comma FJ944730 FJ944786
Moenkhausia lepidura FJ944731 FJ944787
Moenkhausia melogramma FJ944732 FJ944788
Roeboides myersii FJ944733 FJ944789
Stethaprion erythrops FJ944734 FJ944790
Tetragonopterus argenteus FJ944735 FJ944791
Triportheus albus FJ944736 FJ944792
Triportheus angulatus FJ944737 FJ944793
Triportheus magdalenae FJ944738 FJ944794
CtenoluciidaeBoulengerella maculata FJ944739 FJ944795
Ctenolucius hujeta FJ944740 FJ944796
Curimatidae
Curimatopsis macrolepis FJ944741 FJ944797
Cyphocharax magdalenae FJ944742 FJ944798
Potamorhina altamazonica FJ944743 FJ944799
Potamorhina latior FJ944744 FJ944800
Psectrogaster amazonica FJ944745 FJ944801
Psectrogaster rhomboides FJ944746 FJ944802
Psectrogaster rutiloides FJ944747 FJ944803
Steindachnerina guentheri FJ944748 FJ944804
Steindachnerina hypostoma FJ944749 FJ944805
CynodontidaeHydrolycus scomberoides FJ944750 FJ944806
Rhaphiodon vulpinus FJ944751 FJ944807

8 International Journal of Ecology
Table 2: Continued.
Family SpeciesGenBank accession number
16S rDNA 18S rDNA
GasteropelecidaeCarnegiella strigata FJ944752 FJ944808
Thoracocharax stellatus FJ944753 FJ944809
ProchilodontidaeProchilodus magdalenae FJ944754 FJ944810
Prochilodus nigricans FJ944755 FJ944811
Semaprochilodus insignis FJ944756 FJ944812
Serrasalmidae
Colossoma macropomum FJ944757 FJ944813
Mylossoma aureum FJ944758 FJ944814
Mylossoma duriventre FJ944759, FJ944760 FJ944815
Pygocentrus nattereri FJ944761 FJ944816
Serrasalmus elongatus FJ944762 FJ944817
Serrasalmus rhombeus FJ944763 FJ944818
closely related species or groups, with these a function oftheir recent common evolutionary history.
The K-index developed by Blomberg et al. [43] is adescriptive statistic that compares the mean square errorratio, given the data and the phylogenetic tree, versus theexpected mean square error, given the phylogenetic tree anda Brownian motion model assumed for the evolutionaryprocess. This statistic anticipates a value of K = 1 for char-acters fitting a Brownian motion model. Values of K > 1denote a phylogenetic signal, with trait variation being lessthan expected under a Brownian assumption, whereas valuesof K < 1 denote a low phylogenetic signal and higher traitvariation between closely related taxa. The K-index was esti-mated for all continuous characters using the picante pack-age for R! [44, 45].
Phylogenetic signal estimation for discrete characters wasbased on a maximum likelihood approach. Pagel’s Lambda(λ) is a tree scaling parameter that detects whether or notthe relationships specified by a topology produce patterns ofcharacter similarity analogous to those observed in the data[46]. This parameter multiplies all internal branches of thetree, conserving original branch lengths but not phylogeneticstructure. Values of λ = 1 and above denote phylogeneticsignal. Lambda was optimized for all discrete characters andlog-likelihood values for Pagel’s λ were compared with log-likelihood values obtained for a tree with no phylogeneticsignal (λ = 0) using a likelihood ratio test as implementedby the package Geiger for R! [47].
Both statistics were based on the Bayesian consensus tree.Characters that showed significant phylogenetic signal (K-index > 1, P values < 0.01) were optimized as a meansto visualize the character similarity between closely relatedtaxa. The character optimizations were performed usingparsimony over 800 trees selected from the resulting BItopologies, with the “Trace over trees” option in Mesquite.Given that this option only uses discrete character states,continuous characters were divided into three discrete rangesof low, intermediate, and high values. These ranges wereestablished on the basis of the highest and lowest scoresfor each character across all taxa and were used to visualize
the similarity between closely related taxa identified by thephylogenetic signal. All character state changes were treatedas unordered, and the optimizations were plotted over theBayesian consensus tree, thereby indicating the percentage oftrees showing the unique best reconstruction for characterstates at each major node.
3. Results
3.1. Sequence Variations and Character Support Dynamics.Tests of partition homogeneity indicated no evidence forpartition incongruence among both markers (P = 0.01) ac-cording to the recommendations of Cunningham [31],which indicated that combining both datasets decreasesphylogenetic accuracy at P < 0.001. Following the criteriaused by Calcagnotto et al. [8], these results would, however,depart from the null hypothesis. These authors associatedthis incongruence with the different evolutionary dynamicsof mitochondrial versus nuclear genomes. Notwithstanding,nuclear and mitochondrial data were combined in theirstudy because the nodes were strongly supported, as indi-cated by the absence of negative partitioned branch supportas in our study [48]. Combining our data resulted in a matrixof 1071 bp, of which 454 characters were variable and 308were phylogenetically informative under parsimony.
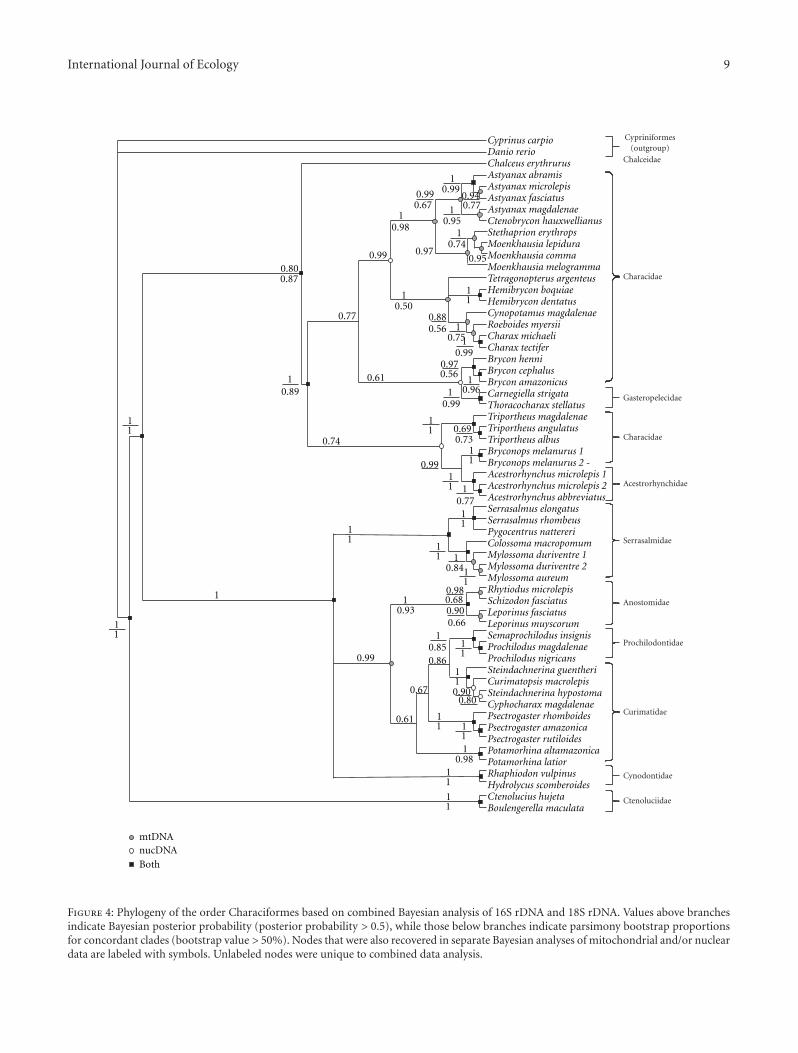
3.2. Phylogenetic Trees. Separate Bayesian and parsimonyanalyses of the 16S rDNA and the 18S rDNA data were mostlycongruent, with both approaches rendering very similarphylogenetic trees. In addition, the Bayesian analysis of thecombined data produced a strongly supported topology thatwas congruent with trees from the separate analyses ofthe mitochondrial and nuclear data (Figure 4). MaximumParsimony analysis of the combined data yielded two equallymost parsimonious trees with lengths of 1,634 steps with aconsistency index (CI) = 0.4168 and a retention index (RI) =0.6692. Parsimony bootstrap proportions were generallylower for the deepest nodes, but the clades recognized in
International Journal of Ecology 9
1
1
1
1 1
1 1
1 1
1 1
1 1
1 1
1 1
1
1
1
1 1
1
1
1
1
1
1 1
1
1
1 1
1 1
1
1
1 1
1 1 1
1 1
1 1
1 1
0.56
0.560.61
0.88
0.77
0.84
0.68
0.66
0.67
0.61
0.850.86
0.690.73
0.75
0.74
0.77
0.67 0.77
0.74
0.80
0.50
0.87
0.89
0.990.99
0.99
0.99
0.99
0.99
0.93
0.99
mtDNAnucDNA
Both
0.98
0.98
0.98
0.97
0.95
0.95
0.97
0.94
0.96
0.90
0.900.80
Cyprinus carpioDanio rerioChalceus erythrurusAstyanax abramisAstyanax microlepisAstyanax fasciatusAstyanax magdalenaeCtenobrycon hauxwellianusStethaprion erythropsMoenkhausia lepiduraMoenkhausia commaMoenkhausia melogrammaTetragonopterus argenteusHemibrycon boquiaeHemibrycon dentatusCynopotamus magdalenaeRoeboides myersiiCharax michaeliCharax tectiferBrycon henniBrycon cephalusBrycon amazonicusCarnegiella strigataThoracocharax stellatusTriportheus magdalenae Triportheus angulatusTriportheus albusBryconops melanurus 1Bryconops melanurus 2 -Acestrorhynchus microlepis 1Acestrorhynchus microlepis 2Acestrorhynchus abbreviatusSerrasalmus elongatusSerrasalmus rhombeusPygocentrus nattereriColossoma macropomumMylossoma duriventre 1Mylossoma duriventre 2Mylossoma aureumRhytiodus microlepisSchizodon fasciatusLeporinus fasciatusLeporinus muyscorumSemaprochilodus insignisProchilodus magdalenaeProchilodus nigricansSteindachnerina guentheriCurimatopsis macrolepisSteindachnerina hypostomaCyphocharax magdalenaePsectrogaster rhomboidesPsectrogaster amazonicaPsectrogaster rutiloidesPotamorhina altamazonicaPotamorhina latiorRhaphiodon vulpinusHydrolycus scomberoidesCtenolucius hujetaBoulengerella maculata
Cypriniformes(outgroup)
Cynodontidae
Ctenoluciidae
Prochilodontidae
Curimatidae
Anostomidae
Gasteropelecidae
Acestrorhynchidae
Serrasalmidae
Characidae
Characidae
Chalceidae
Figure 4: Phylogeny of the order Characiformes based on combined Bayesian analysis of 16S rDNA and 18S rDNA. Values above branchesindicate Bayesian posterior probability (posterior probability > 0.5), while those below branches indicate parsimony bootstrap proportionsfor concordant clades (bootstrap value > 50%). Nodes that were also recovered in separate Bayesian analyses of mitochondrial and/or nucleardata are labeled with symbols. Unlabeled nodes were unique to combined data analysis.
10 International Journal of Ecology
0.89 0.830.51
0.96 0.690.56
0.64
1 0.680.96
1 0.811
1 0.820.99
0.88 0.80.73
1 0.811
1 0.711
Brycon henni
Triportheus magdalenae
Triportheus angulatus
Triportheus albus
Carnegiella strigata
Thoracocharax stellatus
Bryconops melanurus 1
Bryconops melanurus 2
Acestrorhynchus microlepis 1
Acestrorhynchus microlepis 2
Acestrorhynchus abbreviatus
Brycon cephalus
Brycon amazonicus
——
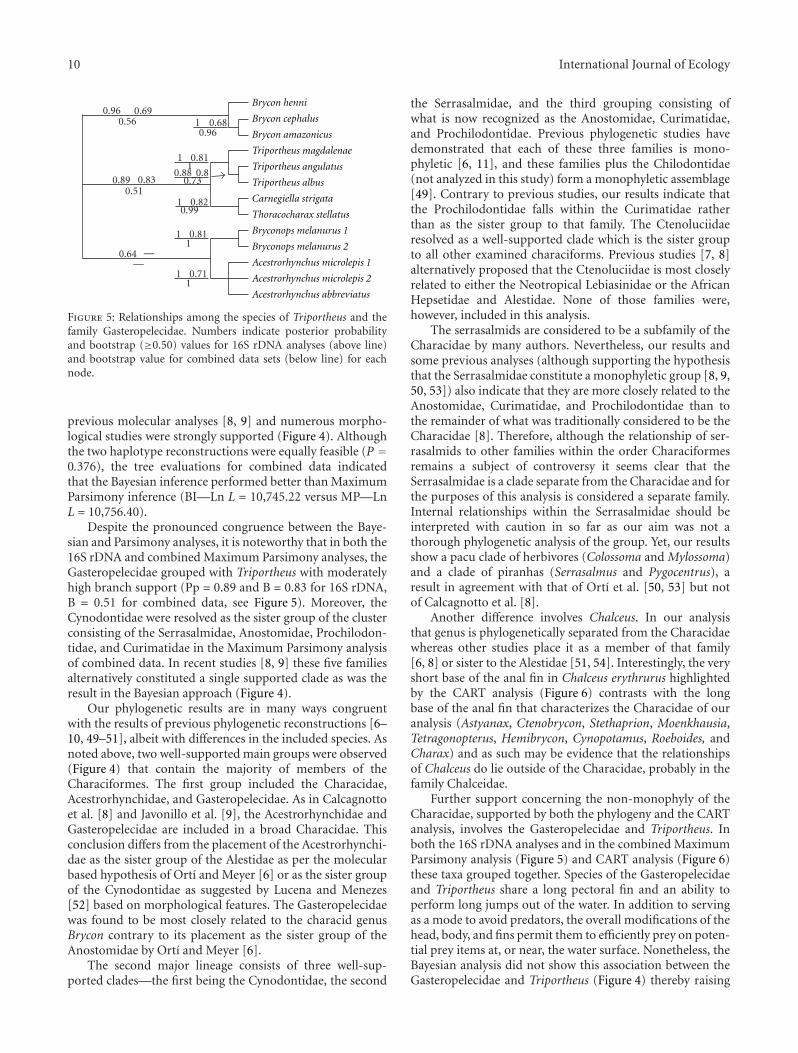
Figure 5: Relationships among the species of Triportheus and thefamily Gasteropelecidae. Numbers indicate posterior probabilityand bootstrap (≥0.50) values for 16S rDNA analyses (above line)and bootstrap value for combined data sets (below line) for eachnode.
previous molecular analyses [8, 9] and numerous morpho-logical studies were strongly supported (Figure 4). Althoughthe two haplotype reconstructions were equally feasible (P =0.376), the tree evaluations for combined data indicatedthat the Bayesian inference performed better than MaximumParsimony inference (BI—Ln L = 10,745.22 versus MP—LnL = 10,756.40).
Despite the pronounced congruence between the Baye-sian and Parsimony analyses, it is noteworthy that in both the16S rDNA and combined Maximum Parsimony analyses, theGasteropelecidae grouped with Triportheus with moderatelyhigh branch support (Pp = 0.89 and B = 0.83 for 16S rDNA,B = 0.51 for combined data, see Figure 5). Moreover, theCynodontidae were resolved as the sister group of the clusterconsisting of the Serrasalmidae, Anostomidae, Prochilodon-tidae, and Curimatidae in the Maximum Parsimony analysisof combined data. In recent studies [8, 9] these five familiesalternatively constituted a single supported clade as was theresult in the Bayesian approach (Figure 4).
Our phylogenetic results are in many ways congruentwith the results of previous phylogenetic reconstructions [6–10, 49–51], albeit with differences in the included species. Asnoted above, two well-supported main groups were observed(Figure 4) that contain the majority of members of theCharaciformes. The first group included the Characidae,Acestrorhynchidae, and Gasteropelecidae. As in Calcagnottoet al. [8] and Javonillo et al. [9], the Acestrorhynchidae andGasteropelecidae are included in a broad Characidae. Thisconclusion differs from the placement of the Acestrorhynchi-dae as the sister group of the Alestidae as per the molecularbased hypothesis of Ortı and Meyer [6] or as the sister groupof the Cynodontidae as suggested by Lucena and Menezes[52] based on morphological features. The Gasteropelecidaewas found to be most closely related to the characid genusBrycon contrary to its placement as the sister group of theAnostomidae by Ortı and Meyer [6].
The second major lineage consists of three well-sup-ported clades—the first being the Cynodontidae, the second
the Serrasalmidae, and the third grouping consisting ofwhat is now recognized as the Anostomidae, Curimatidae,and Prochilodontidae. Previous phylogenetic studies havedemonstrated that each of these three families is mono-phyletic [6, 11], and these families plus the Chilodontidae(not analyzed in this study) form a monophyletic assemblage[49]. Contrary to previous studies, our results indicate thatthe Prochilodontidae falls within the Curimatidae ratherthan as the sister group to that family. The Ctenoluciidaeresolved as a well-supported clade which is the sister groupto all other examined characiforms. Previous studies [7, 8]alternatively proposed that the Ctenoluciidae is most closelyrelated to either the Neotropical Lebiasinidae or the AfricanHepsetidae and Alestidae. None of those families were,however, included in this analysis.
The serrasalmids are considered to be a subfamily of theCharacidae by many authors. Nevertheless, our results andsome previous analyses (although supporting the hypothesisthat the Serrasalmidae constitute a monophyletic group [8, 9,50, 53]) also indicate that they are more closely related to theAnostomidae, Curimatidae, and Prochilodontidae than tothe remainder of what was traditionally considered to be theCharacidae [8]. Therefore, although the relationship of ser-rasalmids to other families within the order Characiformesremains a subject of controversy it seems clear that theSerrasalmidae is a clade separate from the Characidae and forthe purposes of this analysis is considered a separate family.Internal relationships within the Serrasalmidae should beinterpreted with caution in so far as our aim was not athorough phylogenetic analysis of the group. Yet, our resultsshow a pacu clade of herbivores (Colossoma and Mylossoma)and a clade of piranhas (Serrasalmus and Pygocentrus), aresult in agreement with that of Ortı et al. [50, 53] but notof Calcagnotto et al. [8].
Another difference involves Chalceus. In our analysisthat genus is phylogenetically separated from the Characidaewhereas other studies place it as a member of that family[6, 8] or sister to the Alestidae [51, 54]. Interestingly, the veryshort base of the anal fin in Chalceus erythrurus highlightedby the CART analysis (Figure 6) contrasts with the longbase of the anal fin that characterizes the Characidae of ouranalysis (Astyanax, Ctenobrycon, Stethaprion, Moenkhausia,Tetragonopterus, Hemibrycon, Cynopotamus, Roeboides, andCharax) and as such may be evidence that the relationshipsof Chalceus do lie outside of the Characidae, probably in thefamily Chalceidae.
Further support concerning the non-monophyly of theCharacidae, supported by both the phylogeny and the CARTanalysis, involves the Gasteropelecidae and Triportheus. Inboth the 16S rDNA analyses and in the combined MaximumParsimony analysis (Figure 5) and CART analysis (Figure 6)these taxa grouped together. Species of the Gasteropelecidaeand Triportheus share a long pectoral fin and an ability toperform long jumps out of the water. In addition to servingas a mode to avoid predators, the overall modifications of thehead, body, and fins permit them to efficiently prey on poten-tial prey items at, or near, the water surface. Nonetheless, theBayesian analysis did not show this association between theGasteropelecidae and Triportheus (Figure 4) thereby raising
International Journal of Ecology 11
Cynodontidae
Ctenoluciidae
Prochilodontidae
Curimatidae
Anostomidae
Gasteropelecidae
Acestrorhynchidae
Serrasalmidae
Chalceidae
Characidae
Characidae
Lineage I
Lineage II
With teethon the lips
< 2.5∗∗∗
M12/
(M21 + M22 + M23 + M24 + M25)
0.05 0.1 0.15 0.2 0.25
05
1015202530
05
1015202530
Serrasalmidae, Anostomidae,Prochilodontidae and Curimatidae
Rest of species
> 0.12∗∗∗
With teethon jaws
M24
0 0.1 0.2 0.3 0.4 0.5 0.60
5
1005
101520
Chalceus erythrurus
Rest of species
M24
0 0.2 0.4 0.6
0
5
10
150
5
10
Bryconops, Acestrorhynchus andBrycon
Rest of species
> 0.25∗∗∗
M2
0 0.05 0.1 0.15 0.2 0.25 0.30
5
100
1020304050
Ctenoluciidae
Rest of species
M12
0 0.05 0.1 0.15 0.2 0.250
5
100
10
20
30
Cynodontidae
Rest of species
M22
0 0.1 0.2 0.3 0.4 0.5 0.60
5
1005
101520
Gasteropelecidae and Triportheus
Rest of species
< 0.27∗∗∗
< 0.14∗∗∗
> 0.06∗∗∗
< 0.15∗∗∗
Length of digestive tract
0 2 4 6 8 10 12 14
0
10
20
30
0
10
20
30Curimatidae, Prochilodontidae
and Anostomidae
Serrasalmidae
Rhaphiodon vulpinusHydrolycus scomberoidesBoulengerella maculataCtenolucius hujeta
Psectrogaster rutiloides
Psectrogaster rhomboidesPsectrogaster amazonica
Potamorhina altamazonicaPotamorhina latior
Semaprochilodus insignisProchilodus nigricansProchilodus magdalenae
Leporinus muyscorumLeporinus fasciatusLeporinus agassiziiLeporinus wolfeiRhytiodus microlepisRhytiodus argenteofuscusSchizodon fasciatus
Cyphocharax spiluropsisCyphocharax magdalenae
Steindachnerina guentheriSteindachnerina hypostoma
Chalceus erythrurus
Mylossoma duriventreMylossoma aureumColossoma macropomumPygocentrus nattereriSerrasalmus elongatusSerrasalmus rhombeus
Acestrorhynchus abbreviatusAcestrorhynchus microlepisAcestrorhynchus lacustris
Bryconops melanurusBryconops inpaiBrycon cephalusBrycon amazonicus
Brycon melanopterusBrycon henni
Thoracocharax stellatusThoracocharax securisCarnegiella strigataCarnegiella schereri
Triportheus angulatus
Triportheus albus
Triportheus magdalenae
Charax michaeliCharax tectiferRoeboides myersiiRoeboides dayiRoeboides occidentalisCynopotamus magdalenaeHemibrycon dentatusHemibrycon boquiae
Tetragonopterus argenteus
Moenkhausia comma
Moenkhausia melogrammaMoenkhausia lepidura
Stethaprion erythropsCtenobrycon hauxwellianusAstyanax microlepisAstyanax abramisAstyanax fasciatusAstyanax magdalenae
Curimatopsis macrolepis
Acestrorhynchus falcirostris
Leporinus friderici
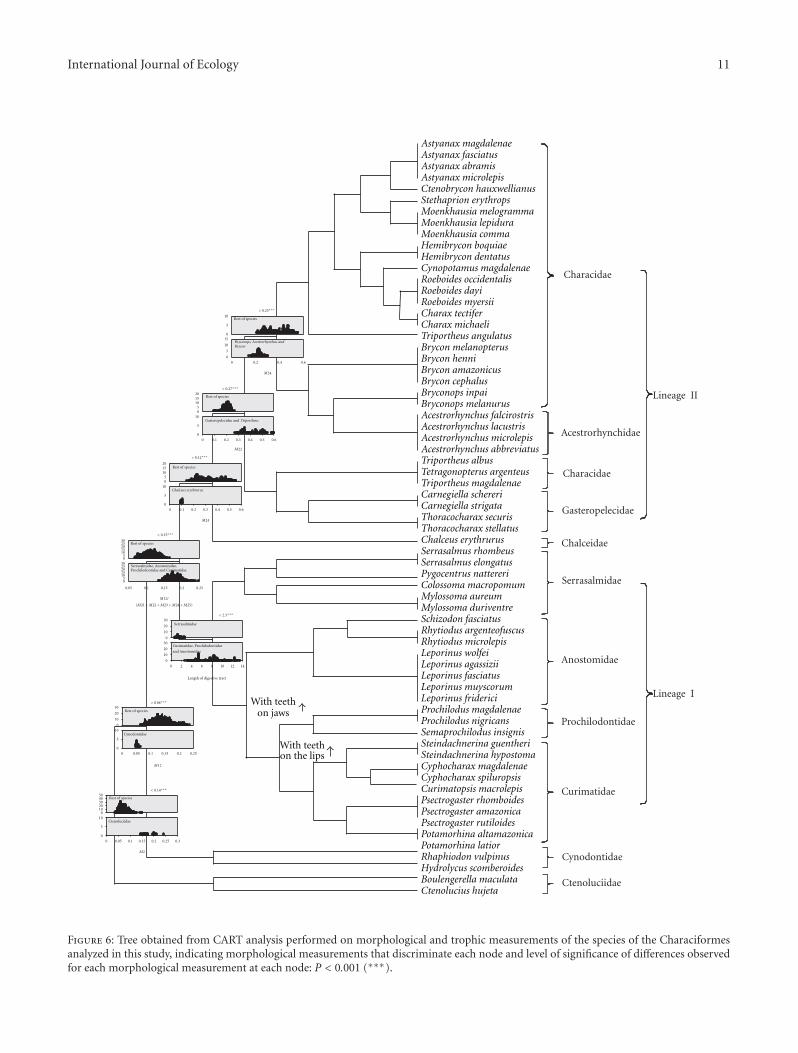
Figure 6: Tree obtained from CART analysis performed on morphological and trophic measurements of the species of the Characiformesanalyzed in this study, indicating morphological measurements that discriminate each node and level of significance of differences observedfor each morphological measurement at each node: P < 0.001 (∗∗∗).
12 International Journal of Ecology
questions as to their sister group relationship. Mirande [51]alternatively suggested that Triportheus is a member of theBryconinae.
3.3. CART Analysis. The CART analysis resulted in theidentification of variables that best discriminate the differ-ent nodes (Figure 6), based on their possible phylogeneticrelationships. At all nodes, at least one character significantlydiscriminated each divergent lineage (Figure 6).
The proportion of the base of the dorsal fin relative tothe dimensions of the other fins was an important morpho-logical character that discriminates two major lineages, oneincluding the Curimatidae, Prochilodontidae, Anostomidae,and Serrasalmidae (lineage I) and the other consistingof the Characidae, Acestrorhynchidae, and Gasteropeleci-dae (lineage II). The two clades differ in their trophic-associated morphology. All of the families in this lineagehave been proposed to be monophyletic on the basis ofa number of morphological synapomorphies and geneticdata. A short digestive tract discriminates the Serrasalmidaefrom the Curimatidae, Prochilodontidae, and Anostomidae(Figure 6). The presence of teeth firmly implanted onto thejaws discriminates the Anostomidae from the Curimatidaeplus Prochilodontidae, both of which lack such dentition.Finally, the main difference between the Curimatidae andProchilodontidae was the absence of any oral dentition inthe former family versus the presence of extensive seriesof mobile teeth implanted on the fleshy lips of the latterfamily (Figure 6). These, particularly the separation of theCurimatidae plus Prochilodontidae, correlate with some dra-matic internal modifications detailed under the discussionbelow.
Lineage II includes two groups long recognized as mono-phyletic (Acestrorhynchidae and Gasteropelecidae) alongwith the Characidae which does not resolve as monophyleticin our results and which has long been recognized as anartificial assemblage in the taxonomic literature [6–10, 49–51]. Notable differences in the size of pectoral and anal finsoccur among the groups in this lineage and will be describedin the discussion. As will be shown in the next section, thereis trophic differentiation among the clades in this lineage inaddition to the differentiation based on the size of anal andpectoral fins.
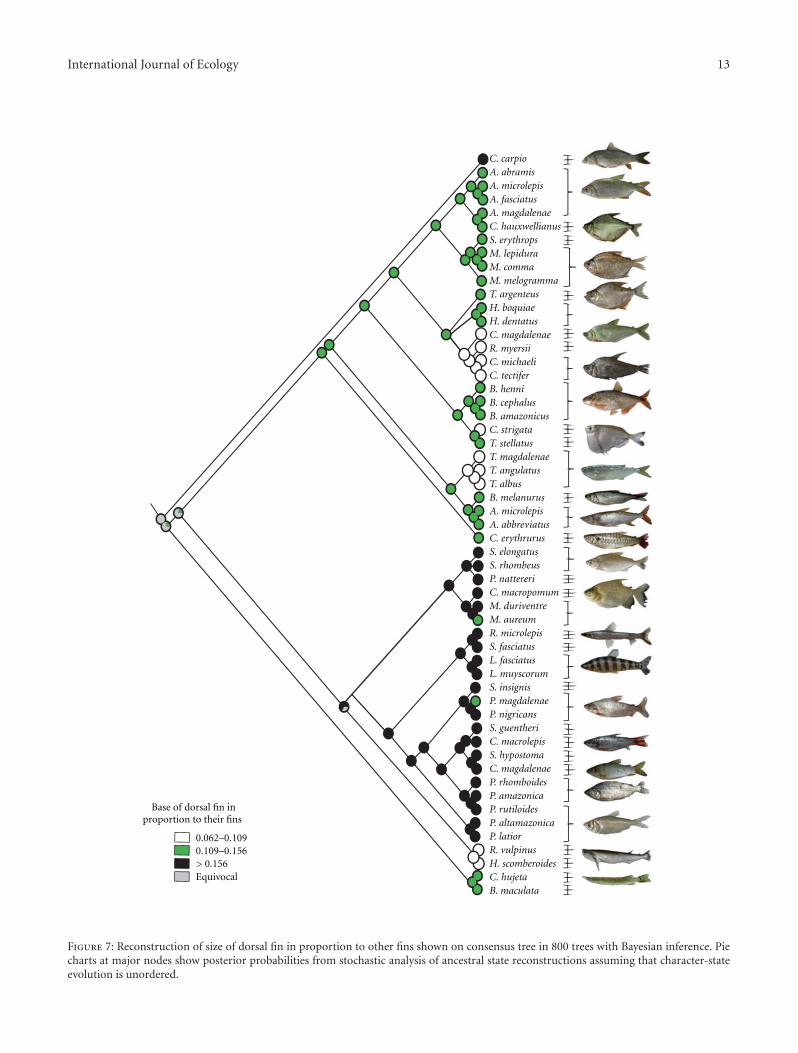
3.4. Phylogenetic Signal and Character Optimization. Basedon the CART analysis, four characters were recovered asbeing important on the discrimination among clades, forwhich K-index showed a significant phylogenetic signal. Allfour are related to swimming and feeding habits. The K-values estimated for the relationship between the lengthof the dorsal fin and all other fins, as well as the lengthof the dorsal fin itself (M12), were all greater than 1,indicating a trend for closely related species to resemble oneanother more so than would be expected under a Brown-ian motion evolutionary model. The larger base of thedorsal fins is consistent across the Anostomidae, Curimati-dae, Prochilodontidae, and Serrasalmidae, whereas the clade
comprised of the Acestrorhynchidae, Characidae, and Gas-teropelecidae has a tendency for the base of the dorsal fin tobe smaller (Figure 7).
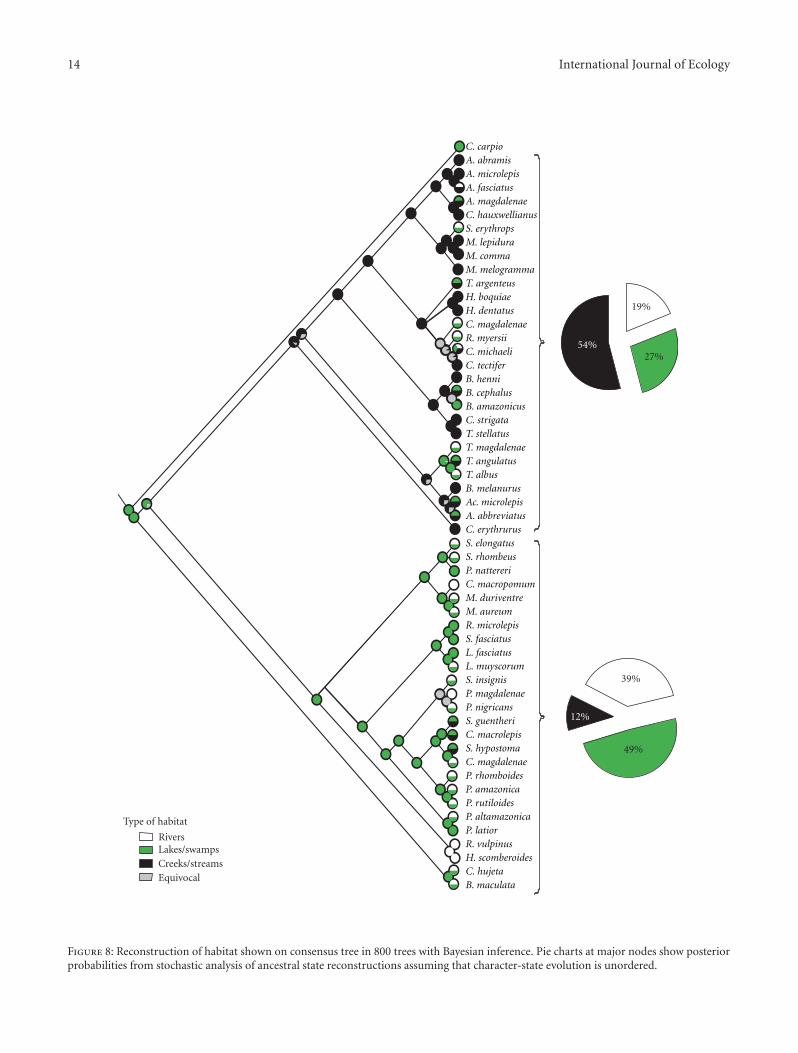
Habitat preference, although variable among most of theconsidered major groups, shows phylogenetic signal (λ =0.89, P-value < 0.01). A general trend is for a predominanceof members of the Acestrorhynchidae, Characidae, andGasteropelecidae in fast-flowing environments such as creeksand streams (54% of the studied species inhabit thesehabitats), whereas the species within the clade formedby the Anostomidae, Curimatidae, Prochilodontidae, andSerrasalmidae are characterized by a preference for environ-ments of flow-flowing or still waters (Figure 8) such as lakesand/or swamps (49%) and slower rivers (39%).
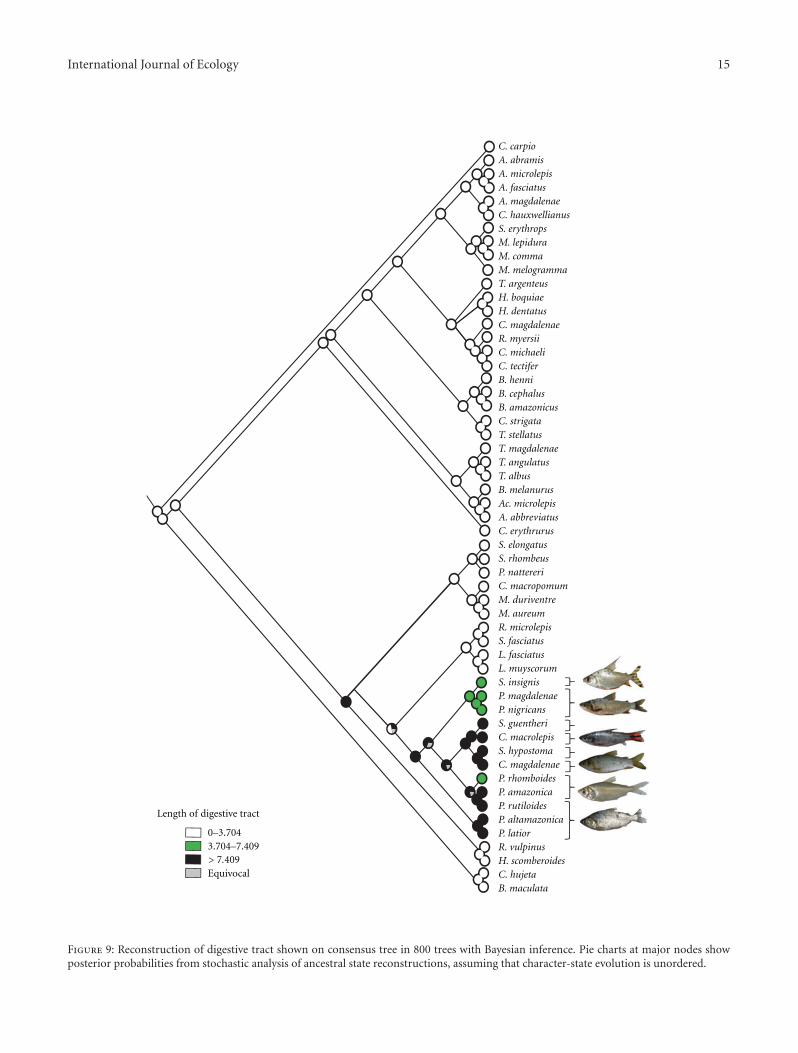
Feeding-related characters with a significant phyloge-netic signal and K-values greater than 1 include the length ofthe digestive tract and measurement M2. M2 is the distancefrom the midpoint of the upper jaw to the anterior marginof the eye with this distance, in turn, largely a functionof alternative jaw forms. Character optimization indicatesthat larger values for the length of the digestive tract arein the families Curimatidae and Prochilodontidae (Figure 9)which jointly form a clade of detritivorous fish [55, 56].Curimatidae plus Prochilodontidae form a monophyleticunit as evidenced by a number of modifications of thegill arches and associated structures (e.g., the muscularepibranchial organs above the gill arches) which are uniqueto these families within the Characiformes [49].
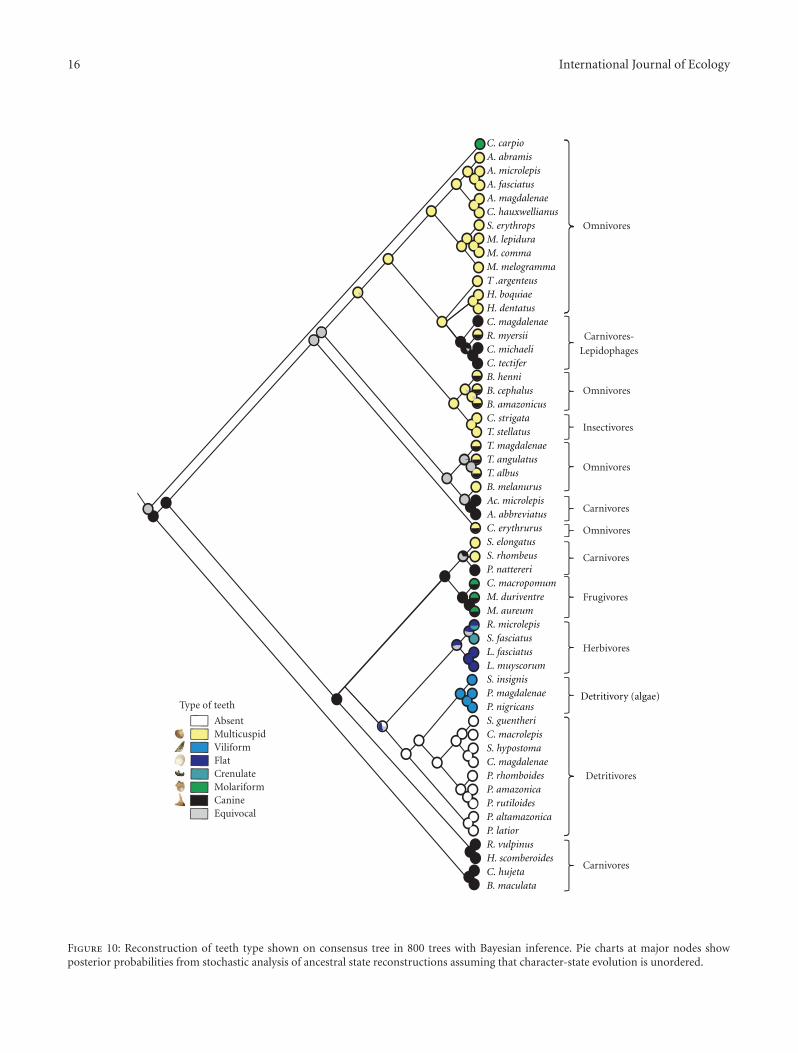
Tooth type also demonstrates a significant phylogeneticsignal (λ = 1, Figure 10). Interfamilial highly divergent,albeit intrafamilial homogeneous modifications of the denti-tion characterize examined members of the Anostomidae, allof which had flat teeth, the species of the Prochilodontidaewhich have in common small villiform teeth attached tothe lips and the members of the Curimatidae which lackoral dentition other than as larvae. Multicuspid dentitionis probably associated with omnivorous feeding habits andteeth of this morphology are present in the genera Astyanax,Ctenobrycon, Stethaprion, Moenkhausia, Tetragonopterus,and Hemibrycon [57–61]. The families Cynodontidae andCtenoluciidae with carnivorous habits [60, 62] and canineteeth form the sister group to the other characiforms in thisanalysis.
4. Discussion
The evidence indicates that the families of Neotropicalcharaciforms analyzed in this study (Acestrorhynchidae,Anostomidae, Characidae, Ctenoluciidae, Curimatidae, Cyn-odontidae, Gasteropelecidae, Prochilodontidae, and Ser-rasalmidae) first shifted into different macrohabitats fol-lowed by morphological diversification in characters seem-ingly related to differences in trophic niches. This model ofdiversification is very similar to that proposed by Danley andKocher [63] for the adaptive radiation of cichlids in LakeMalawi and further explored by Streelman and Danley [64].This model has since been supported by numerous studiesof cichlids as well as of radiations among parrotfishes [65]
International Journal of Ecology 13
C. carpioA. abramisA. microlepisA. fasciatusA. magdalenaeC. hauxwellianusS. erythropsM. lepiduraM. commaM. melogrammaT. argenteusH. boquiaeH. dentatus
C. tectifer
R. myersiiC. magdalenae
C. michaeli
B. cephalusB. amazonicus
B. henni
T. stellatusC. strigata
T. angulatusT. albus
T. magdalenae
A. abbreviatusA. microlepisB. melanurus
C. erythrurus
P. nattereri
S. elongatusS. rhombeus
M. duriventreM. aureum
C. macropomum
L. muyscorumL. fasciatus
R. microlepisS. fasciatus
S. insignis
P. nigricansP. magdalenae
C. magdalenae
S. guentheri
S. hypostomaC. macrolepis
P. rutiloides
P. rhomboidesP. amazonica
R. vulpinus
B. maculataC. hujeta
P. altamazonicaP. latior
H. scomberoidesEquivocal> 0.1560.109–0.1560.062–0.109
Base of dorsal fin inproportion to their fins
Figure 7: Reconstruction of size of dorsal fin in proportion to other fins shown on consensus tree in 800 trees with Bayesian inference. Piecharts at major nodes show posterior probabilities from stochastic analysis of ancestral state reconstructions assuming that character-stateevolution is unordered.
14 International Journal of Ecology
Rivers
EquivocalCreeks/streamsLakes/swamps
Type of habitat
27%
19%
54%
39%
49%
12%
C. carpioA. abramisA. microlepisA. fasciatusA. magdalenaeC. hauxwellianusS. erythropsM. lepiduraM. commaM. melogrammaT. argenteusH. boquiaeH. dentatus
C. tectifer
R. myersiiC. magdalenae
C. michaeli
B. cephalusB. amazonicus
B. henni
T. stellatusC. strigata
T. angulatusT. albus
T. magdalenae
A. abbreviatusAc. microlepisB. melanurus
C. erythrurus
P. nattereri
S. elongatusS. rhombeus
M. duriventreM. aureum
C. macropomum
L. muyscorumL. fasciatus
R. microlepisS. fasciatus
S. insignis
P. nigricansP. magdalenae
C. magdalenae
S. guentheri
S. hypostomaC. macrolepis
P. rutiloides
P. rhomboidesP. amazonica
R. vulpinus
B. maculataC. hujeta
P. altamazonicaP. latior
H. scomberoides
Figure 8: Reconstruction of habitat shown on consensus tree in 800 trees with Bayesian inference. Pie charts at major nodes show posteriorprobabilities from stochastic analysis of ancestral state reconstructions assuming that character-state evolution is unordered.
International Journal of Ecology 15
C. carpioA. abramisA. microlepisA. fasciatusA. magdalenaeC. hauxwellianusS. erythropsM. lepiduraM. commaM. melogrammaT. argenteusH. boquiaeH. dentatus
C. tectifer
R. myersiiC. magdalenae
C. michaeli
B. cephalusB. amazonicus
B. henni
T. stellatusC. strigata
T. angulatusT. albus
T. magdalenae
A. abbreviatusAc. microlepisB. melanurus
C. erythrurus
P. nattereri
S. elongatusS. rhombeus
M. duriventreM. aureum
C. macropomum
L. muyscorumL. fasciatus
R. microlepisS. fasciatus
S. insignis
P. nigricansP. magdalenae
C. magdalenae
S. guentheri
S. hypostomaC. macrolepis
P. rutiloides
P. rhomboidesP. amazonica
R. vulpinus
B. maculataC. hujeta
P. altamazonicaP. latior
H. scomberoides> 7.409Equivocal
3.704–7.4090–3.704
Length of digestive tract
Figure 9: Reconstruction of digestive tract shown on consensus tree in 800 trees with Bayesian inference. Pie charts at major nodes showposterior probabilities from stochastic analysis of ancestral state reconstructions, assuming that character-state evolution is unordered.
16 International Journal of Ecology
Equivocal
Molariform
Absent
Flat
Canine
ViliformMulticuspid
Crenulate Detritivores
Carnivores
Herbivores
Frugivores
Carnivores
Carnivores
Omnivores
Omnivores
Carnivores-
Lepidophages
Insectivores
Omnivores
Omnivores
Type of teethDetritivory (algae)
C. carpioA. abramisA. microlepisA. fasciatusA. magdalenaeC. hauxwellianusS. erythropsM. lepiduraM. commaM. melogrammaT .argenteusH. boquiaeH. dentatus
C. tectifer
R. myersiiC. magdalenae
C. michaeli
B. cephalusB. amazonicus
B. henni
T. stellatusC. strigata
T. angulatusT. albus
T. magdalenae
A. abbreviatusAc. microlepisB. melanurus
C. erythrurus
P. nattereri
S. elongatusS. rhombeus
M. duriventreM. aureum
C. macropomum
L. muyscorumL. fasciatus
R. microlepisS. fasciatus
S. insignis
P. nigricansP. magdalenae
C. magdalenae
S. guentheri
S. hypostomaC. macrolepis
P. rutiloides
P. rhomboidesP. amazonica
R. vulpinus
B. maculataC. hujeta
P. altamazonicaP. latior
H. scomberoides
Figure 10: Reconstruction of teeth type shown on consensus tree in 800 trees with Bayesian inference. Pie charts at major nodes showposterior probabilities from stochastic analysis of ancestral state reconstructions assuming that character-state evolution is unordered.
International Journal of Ecology 17
and gobies [66] in marine waters. Disruptive sexual selectionis proposed in this model based upon nuptial coloration asstage III of the diversification process. In our study it wasnot possible to investigate the role of sexual selection in trig-gering early divisions since the reconstructed relationshipsamong ingroup taxa cannot be taken as definitive species-level phylogenetic hypotheses due to the low number ofspecies analyzed within some genera and/or the low numberof genera analyzed within some speciose families.
Characiforms with a relatively large dorsal-fin base rela-tive to other fins (Anostomidae, Curimatidae, Prochilodonti-dae, and Serrasalmidae) inhabit primarily lakes, swamps, andrivers in the analysis, whereas species with a short dorsal-finbase (Acestrorhynchidae, Characidae, and Gasteropelecidae)inhabit mainly creeks and streams (Figures 7 and 8). Thedorsal fin plays an important role during swimming andmaneuvering although it is difficult to parse out the criticalcomponent for our analysis in light of the multifunctionalityof that and other fins [67, 68].
Nonetheless, studies have demonstrated that the dorsalfin is acted upon by fluid forces that promote rolling move-ments of the body [68]. Although the anal fin may also playan important role in preventing such rolling, some studieshave shown that at all speeds and in all maneuvers, the area ofthe dorsal fin is greater than that of the anal fin [69]. As sucha small dorsal fin which reduces drag should be functionallyadvantageous for life in the higher energy setting of fast waterhabitats.
The length of the dorsal-fin base reflects the total numberof branched plus unbranched rays in the fin. Malabarbaand Weitzman [70] utilized that feature to unite a majorclade within the Characidae which they termed Clade A andthis clade later was supported by the molecular phylogeneticstudy of Javonillo et al. [9]. It is noteworthy that the Africancharaciform family Distichodontidae identified by S. V. Finkand W. L. Fink [36] as basal within the Characiformes in-cludes a number of species and genera with relatively highnumbers of dorsal-fin rays and correlated long dorsal-finbases. Although not part of that study, the members ofthat family with long dorsal-fin bases also tend to occur inhabitats comparable to those occupied by their South Amer-ican characiform counterparts with that condition.
The results of this study indicate that the shift into differ-ent major macrohabitats was followed by trophic segregationamong clades. In the lineage formed by the Curimatidae,Prochilodontidae, Anostomidae, and Serrasalmidae therewas clear food segregation into detritivores (Curimatidae,Prochilodontidae), herbivores (Anostomidae), and carni-vores (Serrasalmidae) [58, 59, 71–73]. The length of the di-gestive tract is notably longer in groups such as the Curima-tidae and Prochilodontidae feeding on detritus and biofilm(Figure 9). Functionally, the long intestine can be explainedby the fact that some of the components of that diet areharder to digest, thereby requiring both a longer passage timeand a large area for processing and absorption [56]. Mostspecies of the Curimatidae evolved to a benthic detritivorousdiet [74] and display adaptations including the lack ofteeth, the presence of a well-developed epibranchial organ,and a long intestine, all modifications which correlate with
benthic feeding [75]. Species of the family Prochilodontidaeprimarily consume fine and flocculent detritus and biofilm,both of which consist of varying amounts of organicparticles, algae, microinvertebrates, and inorganic sedimentswhich these fish gather from the surface of subaquatic plantsand submerged items [76] using their highly modified teethand jaws. The villiform teeth of the family Prochilodontidaeare useful for scraping periphyton [76].
Those and the evertible suctorial jaws of that family alsoserve to ingest organic sediments which settle onto sur-facesfrom the water column and the algae and benthic macroin-vertebrates attached to or living on subaquatic surfaces. Asin the Curimatidae, the epibranchial organ in the Prochilo-dontidae serves to concentrate these times within the oralcavity before they are passed to the esophagus [49].
The family Anostomidae shows some variation in foodhabits. Literature information indicates that Schizodon fas-ciatus primarily exploits the vegetative parts of higher plantswith this sometimes supplemented with algae [71]. Rhytiodushas a diet mainly composed of aquatic macrophytes andwas similarly classified as a herbivore [77]. The species ofAbramites are omnivores that feed primarily on aquatic inver-tebrates and vegetation [78]. Finally, species of Leporinus aregenerally omnivores [79].
Tooth morphology also showed a significant phyloge-netic signal (Figure 10). Different types of teeth found inthe lineages of the order Characiformes showed consistenttrends for some types of teeth and a clear associationwith the types of foods reported to be exploited by thesegroups (Figure 10). The family Characidae typically hasa moderate-to-large-sized maxillae bearing dentition. Thepremaxilla consistently has the greatest number of teeth inthe upper jaw across the Characiformes and demonstratesa pronounced range in dentition. Variables include thepresence versus absence of teeth, their mode of attachment(directly to the premaxilla versus to the overlying lip), therelative size of the teeth, the number of rows of teeth (oneto three), the number of teeth in each tooth row, and inparticular the range in the form of the dentition. This rangeencompasses conical dentition sometimes developed intocanines to increasingly complicated multicuspid teeth thatdiffer in the form and number of cusps. In some instancesthe dentition even extends onto the outer surface of thejaws as is the case in the lepidophagus Roeboides which usesits external mammiliform dentition to remove scales fromprey. The lower jaw demonstrates a comparable pronouncedvariation in the number of tooth rows, numbers of teeth, andtheir form.
Differences in body form also align with phylogeneticgroupings, a not unexpected finding since closely relatedspecies typically have in common similar diets that requirecomparable food acquisition strategies (e.g., carnivory versusdetritivory), locations within the water column (near surface,mid-column and benthic), and feeding patterns (e.g., grazingversus ambush predation). A prime example of how mor-phological modifications permit exploitation of particularfood items is the species of the family Gasteropelecidaethat feed almost entirely on allochthonous insects whichfall on the water surface [80–82]. The upturned mouths
18 International Journal of Ecology
in the Gasteropelecidae permit them to readily feed onthat abundant food source and their dramatically expandedpectoral fins and associated muscles that attach onto theexpanded pectoral girdle allow them to perform long andhigh jumps out of the water [81] in order to escape predators.
In summary, habitat and morphological trophic segrega-tion appear to have been major factors explaining the differ-ences among the major clades obtained in the phylogeneticanalysis of Neotropical members of the Characiformes. Themost significant habitat segregation was that between specieswhich mainly inhabit lakes, swamps, and rivers versus thosespecies that primarily inhabit creeks and streams. Familiesalso differ in the presence versus absence and type of teeth.
Acknowledgments
This study was supported by the AMAPEZ project(CGL2006-02155 BOS) of the MEC (Ministry of Educationand Science) under FEDER funds from the XUNTA de Gali-cia and by contributions from the Universidad de Vigo, theUniversidad de Antioquia, and the Universidad Nacional deColombia. A. Manjarres-Hernandez gratefully acknowledgesa grant from COLCIENCIAS. The authors wish to thankJ. M. Matıas and Emma Janeiro for help with the CARTs,GAIA for their help during sampling in Ayapel, and RicardoCallejas for his help with the evolutionary studies.
References
[1] R. H. Lowe-McConnell, Ecological Studies in Tropical FishCommunities, Cambridge University Press, Cambridge, UK,1987.
[2] C. Sturmbauer, “Explosive speciation in cichlid fishes of theAfrican Great Lakes: a dynamic model of adaptive radiation,”Journal of Fish Biology, vol. 53, pp. 18–36, 1998.
[3] R. C. Albertson, J. A. Markert, P. D. Danley, and T. D. Kocher,“Phytogeny of a rapidly evolving clade: the cichlid fishes ofLake Malawi, East Africa,” Proceedings of the National Academyof Sciences of the United States of America, vol. 96, no. 9, pp.5107–5110, 1999.
[4] C. Guisande, A. Manjarres-Hernandez, P. Pelayo-Villamil etal., “IPez: an expert system for the taxonomic identificationof fishes based on machine learning techniques,” FisheriesResearch, vol. 102, no. 3, pp. 240–247, 2010.
[5] R. P. Vari and L. Malabarba, “Neotropical ichthyology: anoverview,” in Phylogeny and Classification of Neotropical Fishes,L. Malabarba, R. Reis, R. Vari, Z. Lucena, and C. Lucena, Eds.,Conselho Editorial EDIPUCRS, Porto Alegre, Brazil, 1998.
[6] G. Ortı and A. Meyer, “The radiation of characiform fishesand the limits of resolution of mitochondrial ribosomal DNAsequences,” Systematic Biology, vol. 46, no. 1, pp. 75–100, 1997.
[7] P. A. Buckup, “Relationships of the Characidiinae and phy-logeny of characiform fishes (Teleostei: Characiformes),” inphylogeny and Classification of Neotropical Fishes, L. R. Mala-barba, R. E. Reis, R. P. Vari et al., Eds., pp. 193–234,EDIPUCRS, Porto Alegre, Brazil, 1998.
[8] D. Calcagnotto, S. A. Schaefer, and R. DeSalle, “Relationshipsamong characiform fishes inferred from analysis of nuclearand mitochondrial gene sequences,” Molecular Phylogeneticsand Evolution, vol. 36, no. 1, pp. 135–153, 2005.
[9] R. Javonillo, L. R. Malabarba, S. H. Weitzman, and J. R.Burns, “Relationships among major lineages of characid fishes(Teleostei: Ostariophysi: Characiformes), based on molecularsequence data,” Molecular Phylogenetics and Evolution, vol. 54,no. 2, pp. 498–511, 2010.
[10] C. Oliveira, G. S. Avelino, K. T. Abe et al., “Phylogeneticrelationships within the speciose family Characidae (Teleostei:Ostariophysi: Characiformes) based on multilocus analysisand extensive ingroup sampling,” BMC Evolutionary Biology,vol. 11, no. 1, article 275, 2011.
[11] P. A. Buckup, The Characidiinae: a phylogenetic study of theSouth American darters and their relationships with other char-aciform fishes, Ph.D. dissertation, University of Michigan, AnnArbor, Mich, USA, 1991.
[12] J. Marcos Mirande, “Weighted parsimony phylogeny of thefamily Characidae (Teleostei: Characiformes),” Cladistics, vol.25, no. 6, pp. 574–613, 2009.
[13] B. Sidlauskas, “Testing for unequal rates of morphologicaldiversification in the absence of a detailed phylogeny: a casestudy from characiform fishes,” Evolution, vol. 61, no. 2, pp.299–316, 2007.
[14] B. Sidlauskas, “Continuous and arrested morphological diver-sification in sister clades of characiform fishes: a phylomor-phospace approach,” Evolution, vol. 62, no. 12, pp. 3135–3156,2008.
[15] B. L. Sidlauskas and R. P. Vari, “Phylogenetic relationshipswithin the South American fish family Anostomidae (Tele-ostei, Ostariophysi, Characiformes),” Zoological Journal of theLinnean Society, vol. 154, no. 1, pp. 70–210, 2008.
[16] J. Sambrook, E. F. Fritsch, and T. Maniatis, Molecular Cloning:A Laboratory Manual, Cold Spring Harbor Lab Press, NewYork, NY, USA, 1989.
[17] S. M. Degnan, “The perils of single-gene trees—mitochondrialversus single-copy nuclear-DNA variation in white-eyes (Aves,Zosteropidae),” Molecular Ecology, vol. 2, pp. 219–225, 1993.
[18] S. R. Palumbi and C. S. Baker, “Contrasting population struc-ture from nuclear intron sequences and mtDNA of hump-back whales,” Molecular Biology and Evolution, vol. 11, no. 3,pp. 426–435, 1994.
[19] J. Avise, Phylogeography: The History and Formation of Species,Harvard University Press, London, UK, 2000.
[20] S. R. Palumbi, A. P. Martin, S. R. Romano et al., The SimpleFool’s Guide to PCR (ver. 2.0), Department of Zoology, Univer-sity of Hawaii Special Publication, Honolulu, Hawaii, 1991.
[21] S. Rozenand and H. Skaletsky, “Primer3 on the WWW forgeneral users and for biologist programmers,” in Bioinformat-ics Methods and Protocols: Methods in Molecular Biology, S.Krawetz and S. E. Misener, Eds., pp. 365–386, Humana Press,Totowa, NJ, USA, 2000.
[22] J. D. Thompson, T. J. Gibson, F. Plewniak, F. Jeanmougin, andD. G. Higgins, “The CLUSTAL X windows interface: flexiblestrategies for multiple sequence alignment aided by qualityanalysis tools,” Nucleic Acids Research, vol. 25, no. 24, pp.4876–4882, 1997.
[23] K. Tamura, J. Dudley, M. Nei, and S. Kumar, “MEGA4:Molecular Evolutionary Genetics Analysis (MEGA) softwareversion 4.0,” Molecular Biology and Evolution, vol. 24, no. 8,pp. 1596–1599, 2007.
[24] D. Posada and K. A. Crandall, “MODELTEST: testing themodel of DNA substitution,” Bioinformatics, vol. 14, no. 9, pp.817–818, 1998.
[25] H. Akaike, “New look at statistical-model identification,” IEEETransactions on Automatic Control, vol. 19, no. 6, pp. 716–723,1974.
International Journal of Ecology 19
[26] J. S. Farris, M. Kallersjo, A. G. Kluge et al., “Testing significanceof incongruence,” Cladistics, vol. 10, no. 1, pp. 315–319, 1994.
[27] D. L. Swofford, PAUP. Phylogenetic Analysis Using Parsimony(and other methods), version 4, Sinauer Associates, Sunder-land, Mass, USA, 2000.
[28] D. J. Eernisse and A. G. Kluge, “Taxonomic congruence versustotal evidence, and amniote phylogeny inferred from fossils,molecules, and morphology,” Molecular Biology and Evolution,vol. 10, no. 6, pp. 1170–1195, 1993.
[29] I. P. Farias, G. Ortı, and A. Meyer, “Total evidence: molecules,morphology, and the phylogenetics of cichlid fishes,” Journalof Experimental Zoology, vol. 288, no. 1, pp. 76–92, 2000.
[30] F. G. R. Liu and M. M. Miyamoto, “Phylogenetic assessment ofmolecular and morphological data for eutherian mammals,”Systematic Biology, vol. 48, no. 1, pp. 54–64, 1999.
[31] C. W. Cunningham, “Can three incongruence tests predictwhen data should be combined?” Molecular Biology andEvolution, vol. 14, no. 7, pp. 733–740, 1997.
[32] J. J. Wiens, “Combining data sets with different phylogenetichistories,” Systematic Biology, vol. 47, no. 4, pp. 568–581, 1998.
[33] J. P. Huelsenbeck and F. Ronquist, “MRBAYES: bayesianinference of phylogenetic trees,” Bioinformatics, vol. 17, no. 8,pp. 754–755, 2001.
[34] F. Ronquist and J. P. Huelsenbeck, “MrBayes 3: bayesian phy-logenetic inference under mixed models,” Bioinformatics, vol.19, no. 12, pp. 1572–1574, 2003.
[35] J. Felsenstein, “Confidence limits on phylogenies: an approachusing the bootstrap,” Evolution, vol. 39, no. 4, pp. 783–791,1985.
[36] S. V. Fink and W. L. Fink, “Interrelationships of the ostar-iophysan fishes (Teleostei),” Zoological Journal of the LinneanSociety, vol. 72, no. 4, pp. 297–353, 1981.
[37] H. Shimodaira and M. Hasegawa, “Multiple comparisons oflog-likelihoods with applications to phylogenetic inference,”Molecular Biology and Evolution, vol. 16, no. 8, pp. 1114–1116,1999.
[38] L. Breiman, J. Friedman, R. Olshen et al., Classification andRegression Trees, Wadsworth, 1984.
[39] W.-Y. Loh, “Classification and regression tree methods,” inEncyclopedia of Statistics in Quality and Reliability, F. Ruggeri,R. Kenett, and F. Faltin, Eds., pp. 315–323, Wiley, 2008.
[40] T. Hastie, R. Tibshirani, and J. Friedman, The Elements of Sta-tistical Learning. Data Mining, Inference and Prediction,Springer, 2001.
[41] W. N. Venables and B. D. Ripley, Modern Applied Statistics withS, Springer, 2002.
[42] C. Guisande, A. Vaamonde, and A. Barreiro, Tratamiento deDatos, Dıaz de Santos, Madrid, Spain, 2010.
[43] S. P. Blomberg, T. Garland, and A. R. Ives, “Testing for phy-logenetic signal in comparative data: behavioral traits are morelabile,” Evolution, vol. 57, no. 4, pp. 717–745, 2003.
[44] R Development Core Team, “R: a language and environmentfor statistical computing. R Foundation for Statistical Com-puting,” Vienna, Austria, 2009, http://www.r-project.org/.
[45] S. W. Kembel, D. D. Ackerly, S. P. Blomberg et al., “picante:R tools for integrating phylogenies and ecology,” R packageversion 0.7-0, 2009, http://picante.r-forge.r-project.org.
[46] M. Pagel, “Inferring the historical patterns of biologicalevolution,” Nature, vol. 401, no. 6756, pp. 877–884, 1999.
[47] L. Harmon, J. Weir, C. Brock, R. Glor, W. Challenger, andG. Hunt, “geiger: Analysis of evolutionary diversification,” Rpackage version 1.3-1, 2009.
[48] J. Gatesy, P. O’Grady, and R. H. Baker, “Corroborationamong data sets in simultaneous analysis: hidden supportfor phylogenetic relationships among higher level artiodactyltaxa,” Cladistics, vol. 15, no. 3, pp. 271–313, 1999.
[49] R. P. Vari, “Phylogenetic relationships of the families Curi-matidae, Prochilodontidae, Anostomidae, and Chilodonti-dae,” Smithsonian Contributions to Zoology, vol. 378, no. 1, pp.1–60, 1983.
[50] G. Ortı, A. Sivasundar, K. Dietz, and M. Jegu, “Phylogeny ofthe Serrasalmidae (Characiformes) based on mitochondrialDNA sequences,” Genetics and Molecular Biology, vol. 31, no.1, pp. 343–351, 2008.
[51] J. M. Mirande, “Phylogeny of the family characidae (teleostei:Characiformes): from characters to taxonomy,” NeotropicalIchthyology, vol. 8, no. 3, pp. 385–568, 2010.
[52] C. A. S. Lucena and N. E. Menezes, “A phylogenetic analysis ofRoestes Gunther and Gilbertolus Eigenmann, with a hypothesison the relationships of the Cynodontidae and Acestrorhynchi-dae (Teleostei: Ostariophysi: Characiformes),” in Phylogenyand Classification of Neotropical Fishes, L. R. Malabarba, R. E.Reis, R. P. Vari et al., Eds., pp. 261–278, EDIPUCRS, PortoAlegre, Brazil, 1998.
[53] G. Ortı, P. Petry, J. I. R. Porto, M. Jegu, and A. Meyer, “Patternsof nucleotide change in mitochondrial ribosomal RNA genesand the phylogeny of piranhas,” Journal of Molecular Evolution,vol. 42, no. 2, pp. 169–182, 1996.
[54] A. M. Zanata and R. P. Vari, “The family Alestidae (Ostar-iophysi, Characiformes): a phylogenetic analysis of a trans-Atlantic clade,” Zoological Journal of the Linnean Society, vol.145, no. 1, pp. 1–144, 2005.
[55] A. S. Flecker, “Ecosystem engineering by a dominant detriti-vore in a diverse tropical stream,” Ecology, vol. 77, no. 6, pp.1845–1854, 1996.
[56] R. M. C. Castro and R. P. Vari, “Detritivores of the SouthAmerican fish family Prochilodontidae Teleostei: Ostario-physi: Characiformes): a phylogenetic and revisionary study,”Smithsonian Contributions to Zoology, vol. 622, pp. 1–189,2004.
[57] M. Goulding, The Fishes and the Forest: Explorations in theAmazonian Natural History, University of California Press,Berkeley, Calif, USA, 1980.
[58] J. Gery, Characoids of the World, T.F.H. Publications, Neptune,NJ, USA, 1977.
[59] N. S. Hahn, A. A. Agostinho, L. C. Gomes, and L. M. Bini,“Estrutura trofica da ictiofauna do reservatorio: De Itaipu(Parana-Brazil) nos Primeiros Anos de sua Formacao,” Inter-ciencia, vol. 23, no. 5, pp. 299–305, 1998.
[60] C. Castellanos, Distribucion especial de la comunidad de pecesen una quebrada de aguas negras amazonicas, Leticia, Colombia,Tesis de pregrado, Biologıa, Universidad Nacional de Colom-bia, Bogota, Colombia, 2002.
[61] G. Galvis, J. Mojica, S. Duque et al., “Peces del medio Amazonas.Region de Leticia,” Conservacion Internacional, serie de guıastropicales de campo 5, 2006.
[62] V. L. L. De Almeida, N. S. Hahn, and A. E. A. D. M. Vazzoler,“Feeding patterns in five predatory fishes of the high ParanaRiver floodplain (PR, Brazil),” Ecology of Freshwater Fish, vol.6, no. 3, pp. 123–133, 1997.
[63] P. D. Danley and T. D. Kocher, “Speciation in rapidly divergingsystems: lessons from Lake Malawi,” Molecular Ecology, vol. 10,no. 5, pp. 1075–1086, 2001.
[64] J. T. Streelman and P. D. Danley, “The stages of vertebrateevolutionary radiation,” Trends in Ecology and Evolution, vol.18, no. 3, pp. 126–131, 2003.
20 International Journal of Ecology
[65] J. T. Streelman, M. Alfaro, M. W. Westneat, D. R. Bellwood,and S. A. Karl, “Evolutionary history of the parrotfishes: bi-ogeography, ecomorphology, and comparative diversity,” Evo-lution, vol. 56, no. 5, pp. 961–971, 2002.
[66] L. Ruber, J. L. Van Tassell, and R. Zardoya, “Rapid speciationand ecological divergence in the American seven-spinedgobies (Gobiidae, Gobiosomatini) inferred from a molecularphylogeny,” Evolution, vol. 57, no. 7, pp. 1584–1598, 2003.
[67] R. M. N. Alexander, Functional Design of Fishes, Hutchinsonand Co., London, UK, 1967.
[68] D. H. Evans and J. B. Clauborne, The Physiology of Fishes, C. R.C. Press, 2006.
[69] E. M. Standen and G. V. Lauder, “Dorsal and anal fin functionin bluegill sunfish Lepomis macrochirus: three-dimensionalkinematics during propulsion and maneuvering,” Journal ofExperimental Biology, vol. 208, no. 14, pp. 2753–2763, 2005.
[70] L. R. Malabarba and S. H. Weitzman, “Description of a newgenus with six new species from southern Brazil, Uruguayand Argentina, with a discussion of a putative characidclade (Teleostei: Characiformes: Characidae),” Comunicacoesdo Museu de Ciencias e Tecnologia, vol. 16, no. 1, pp. 67–151,2003.
[71] B. de Merona and J. Rankin-de-Merona, “Food resource par-titioning in a fish community of the central Amazon flood-plain,” Neotropical Ichthyology, vol. 2, no. 2, pp. 75–84, 2004.
[72] E. A. Luiz, A. A. Agostinho, L. C. Gomes, and N. S. Hahn,“Ecologia trofica de peixes em riachos da bacia do rio Parana,”Revista Brazileira de Biologia, vol. 58, pp. 273–285, 1998.
[73] L. G. Nico and D. C. Taphorn, “Food habits of piranhas in thelow llanos of Venezuela,” Biotropica, vol. 20, no. 4, pp. 311–321, 1988.
[74] R. P. Vari, “A phylogenetic study of the Neotropical characi-form family Curimatidae (Pisces: Ostariophysi),” SmithsonianContributions to Zoology, vol. 471, pp. 1–71, 1989.
[75] M. Pouilly, F. Lino, J. G. Bretenoux, and C. Rosales, “Dietary-morphological relationships in a fish assemblage of theBolivian Amazonian floodplain,” Journal of Fish Biology, vol.62, no. 5, pp. 1137–1158, 2003.
[76] R. Fugi, N. S. Hahn, and A. A. Agostinho, “Feeding styles offive species of bottom-feeding fishes of the high Parana River,”Environmental Biology of Fishes, vol. 46, no. 3, pp. 297–307,1996.
[77] R. Neves Dos Santos, E. J. G. Ferreira, and S. Amadio, “Effectof seasonality and trophic group on energy acquisition inAmazonian fish,” Ecology of Freshwater Fish, vol. 17, no. 2, pp.340–348, 2008.
[78] D. Taphorn, “The characiform fishes of the Apure Riverdrainage,” Biollania no. 4, Guanare, Venezuela, 1992.
[79] G. J. Galvis, J. I. Mojica, S. Duque et al., “Peces del medioAmazonas Region del Leticia,” Conservacion Internacional,serie de guıas tropicales de campo 5, Bogota, Colombia, 2006.
[80] A. L. Netto-Ferreira, M. P. Albrecht, J. L. Nessimian, andE. P. Caramaschi, “Feeding habits of Thoracocharax stellatus(Characiformes: Gasteropelecidae) in the upper rio Tocantins,Brazil,” Neotropical Ichthyology, vol. 5, no. 1, pp. 69–74, 2007.
[81] S. H. Weitzman and L. Palmer, “Do freshwater hatchetfishesreally fly?” Tropical Fish Hobbyist, vol. 45, no. 1, pp. 195–206,1996.
[82] S. H. Weitzman and L. Palmer, “Family Gasteropelecidae,” inChecklist of the Freshwater fishes of South and Central America,R. E. Reis, S. O. Kullander, and C. Ferraris Jr., Eds., pp. 101–103, Edipucrs, Porto Alegre, Brazil, 2003.