earnings multiples and common stock valuation -dse experiences
TRANSCRIPT
11th Asian Business Conference, 26-27 December, 2014
BIAM Foundation, Dhaka
14
Earnings Multiples and Common Stock Valuation-
DSE Experience Conference Paper
Mohan L Roy & Mohammad Ashrafuzzaman
2
Earnings Multiples and Common Stock Valuation- DSE Experience
Mohan L Roy1 and Mohammad Ashrafuzzaman2
Abstract
This study examines the effectiveness of modular uses of financial data
flows to stock market and tests market efficiency in terms of
participants’ perceptions regarding these models while deployed for
valuing stocks. The concept efficient market hypothesis (EMH) is
seemed impractical and thus it helps nothing impending investors any
way. Testing publicly available financial information like EPS, P/E, P/B,
DPS etc., by earning multiple models it found the popular models failed
to predict stock price properly. An unusual divergence was found lying
between prediction and actual price. Participants do not rely on
published financial data rather they do rely on market soothsayers. ‘The
stock markets seldom walk into accounting equation’ – an eminent
analyst observed. The market regulator BSEC has little control over
market movement. Pragmatically analysts have little scope to verify
publicly available information which believably improvised and serves
common investors as mother of generic delusion.
Key words/phrases: DSE, Market efficiency, EPS, earning multiples,
Field of Research: Accounting & Finance
1 Mohan L Roy, Associate Professor, Finance & Accounting, IBAIS University, Dhaka. Email: [email protected]; [email protected] 2 Mohammad Ashrafuzzaman, Lecturer, Department of Accounting, Bangladesh University of
Business & Technology (BUBT),Dhaka. Email: [email protected]
3
1.0 Introduction
Bangladesh Stock Market Perspective and Retrospect: Bangladesh Capital market is still in fledging stage. Neither of the two organized markets DSE and CSE has even come round to an age of silver jubilant (25 years). On market capitalization and efficient operation, the duo run into the same line of equation as they have been growing old. Turnover performance in typical security numbers and money worth let people perceive equally likely as market capitalization and efficiency of maturity. All investment bankers, broker houses, floating traders and participants apparently, not confidently, help investors by providing liquidity and operational efficiency to some extent but virtually it is far behind to promote capital flows and reduce transactions costs. Initiatives for market orientation using fundamental and technical analyses most possibly have been stayed far-off the door steps of market participants. That makes the price discovery and valuing stocks independently difficult. Monitoring stock issuers activity, insiders’ illicit trade, the SEC, the legislative authority has directives such as imposing conditions and sanctions, penalizing the misnomers etc., but not so effective as expected for an emerging market causes it’s all efforts depart in vain. Operational inefficiency, lack of coordination among the originations, political instability and weak authoritative power caused the young aged markets to experience two massive setbacks3 (1996 and 2011) in shortest working lives. Albeit in the 1990’s there had been severe fiasco in the share market elsewhere, for example in Bombay stock Exchange, but the nature of the market disaster and magnitude of the consequences in Bangladesh were rather diverse. In the later event (2011), even if the common market participants were more tuned in to the nature, working risks conditions in the trading trend failed to perceive the ultimate consequences of the stock markets crash. Similar fashion of occurrences while often, people still have the rush forward in common stock securities? Conceivably it is because of people be acquainted with that shares of common stocks in periodic time horizon, have performed better historically than fixed income securities4. The optimistic run appeared to have been driven greatly by psychological factors and all kinds of market manipulation and not by changes in market fundamentals. Most likely, the very lofty returns to common stocks over the history reason participant groups in lay hatching in Bangladeshi markets. But therein lies a lesson, for with over a billion lost in BSX from time to time which eventually uncertain and appeared so abruptly that the experience of many new investors was very unbearable. Undoubtedly a significant portion of this group once joined the market and lost forever. Because all concerned here cannot be equity gainers, but akin to be an atypical event gainers on kismet rather than relying on fundamentalist’s5 or
3 The safeguard laws proven failure to prevent occurring the massive 1996 & 2011 market debacles in
Bangladesh history! The full affair of the climb and crumple of the stock market was the ineffectiveness and ineptitude of the concerned controlling authority. Interestingly both occurrences started in July 1996 & 2011, there had been continuous and rapid increase in the average price
till the
market collapsed in November 1996 & 2011 respectively. 4 Analyzing country’s market it is found that BSX yielded an average (excluding July 1996 to June 1997 & July 2011 - June 2012) annual return above 17 percent since 1991 compared to 10.5 percent for fixed deposit accounts, 9.5 percent for postal savings certificate, 9.5 percent for corporate bonds, 8.5 percent for long term govt. securities, 7.5 percent for 5-year (BD) government bonds, and 5 percent for 5 year treasury bond, short-term t-bills
.
5 analysts based on published accounting information
4
technician’s6 analyses. On the whole, non-corporate individual investors are mostly interested to such imaginary process and thus neither relative e.g., earnings multiple nor discounted method e.g., DDM7 is applicable effectively here. The available data, in most cases, restrict the choice of model and influence the way it is used. Complex models exist that may improve on the simple valuation, but before using those models and assuming that complexity increases accuracy, the forecaster would do well to consider8 “the law of parsimony”.
2. Review of Literatures:
Does stock market price move along Accounting Equation line? The reporting of earnings and financial position of a company involves both significant independence in selecting from the sphere of GAAP and inevitable need for management to make numerous valuation estimates and judgments (Penman, 2003). Such flexibility in presenting outcomes help the company management portraying financial affairs in the best impressive possible is a common phenomenon. The investors’ responsiveness to recognize the quality of reported affairs, especially to discern the understated and not-so-subtle (understated) items being clearly used and looked for in published accounts to value common stock is thus imperative, despite there are disagreement that such accounting in turn is somewhat responsible for stock price movement (Haskins, et al, 1997). Some contemporary studies (Dyckman and Morse, 1986) supported that stock value is presumably reflected by published accounts in terms of price. Arguably when fundamentals are made public newly, stock prices are likely to apprehend the new fangled quickly (Haskins, et. al….) in a row as the events move hastily. In results, the improvised accounting in line while accessible, the inconceivable impacts may have an effect on the new and progressive investors negatively, because such investors are apparently dubious to take fundamental decisively. This imitation of published accounts often leads stock prices improperly and in fact the degrees of published accounts quality affect the guess levels of individual more than institutional investors. Such happenings are not infrequent in emerging markets like Bangladesh. The probability of losing gain or investment is very high because here study and analysis of financial fundamentals i.e., measuring P/E ratio, P/B ratio, NAV etc. dubiously help estimating stock price in the logical manner. Look for pertinent, dependable and adequate financial information to assess the true economic view in least tolerable effort, perceivably people deem publicly available information is least reflective and arduously misleading to value stock price. However, a few of investors still calculate standard price of stock in the country’s weak form efficient market based on published accounts information.
Multiplier Models: The Value Determiner
Valuation is an imperfect (fallible) discipline, and any method will result in a fallacious forecast at sometime9. An earliest 20th century economist, Milton Friedman, discerns value and price, and said “ price is what you pay, value is what you get” and also pointed out that “investors need a valuation model to understand value and for a
6 analysts not rely on published accounting information 7 The simplest present value model specifies cash flows from a common investment to be dividend.
8 CFA Program curriculum 2013: Equity and Fixed Income, Level 1 Vol. 5 p. 277
9 CFA Program curriculum 2013: Equity and Fixed Income, Level 1 Vol. 5 p. 277
5
valuation model it is a way of understanding a business and how it generates values”. The typical valuation model that relates one of the relative valuation methods refers to a ratio that compares the share price of the sample firms with some sort of monetary flow or value to allow evaluation of the relative worth of the corporate stock. The variables such as dividend payout, ROE, book value, cash flow etc. are often used as screening mechanism to price stock of a company (Beaver and Morse, 1978; Wilcox, 1984; Penman, 1996; o’ Bryne, 1996; Banz, 1981; Bauman and Miller, 1997). Of these valuation techniques, possibly P-E multiples is the most widely used pointer that determines company’s stock price in market (Block 1999). If the ratio falls below some specified value, the shares are identified as entrants for purchase, and if the ratio exceeds some specified value, the shares are identified as entrants for sale. Arguably this is a function of investors’ view with respect to company’s prospective common factors such as relative investment risk, past earnings trace, and growth potential which have an effect on perceptions. Many participants thus use the multiple frequently when examining a group or sector of stocks for which the ratio is relatively low to be attractively valued securities10. The low price ratio indicates a sound business health and instigates a bargain for potential investors relative to a company with higher P/E ratio (Haskins, et al; 1997; Penman, 1996 Stogsvik and stogsvik, 2008). Irregular watching of “buy or-sell” counsel in investor bulletins and the financial press be a sign of P-E multiples at least supply sturdy restrictions for what a “reasonable” stock market value should be. Considerable evidence suggests that P/B multiples are inversely related to future rates of return (Fama and French 1995). Similarly Price-to-sales multiples (P/S) is the ratio of stock price to sales per share, and O’Shaughnessy (2005) provided evidence that a low P/S multiple is the most useful multiple for predicating future returns. Price- to-cash- flow ratio (P/CF) measures the ratio of stock price to some per-share cash flow includes free cash flow (FCF) and operating cash flow (OCF). However a widespread disapproval of all these multiples is that they do not consider the future and most possibly this is true if the multiple is calculated from trailing or current values of the divisor11.
Common participants often believe that investing principally on the basis of trailed P-E multiples can be a risky venture because trailed P-E multiples may be considerably illuminated by the level of reported earning that a firm can possibly manage synthetically. Also, this basis frequently ignores the fact that the current stock prices normally reflect all publicly available information about a company (Haskins, et al…..). Ratios in relative valuation is a ‘mission impossible’ (Skogsvik and Skogsvik,…….) and the meaning of such statement is often dubious.
3. Objectives
This study is to look into what extent potential investors get acquainted with reflected stock price by the publicly available financial information (e.g., EPS, NAV, DPS etc.) and how far they become assisted with the fundamental analysis while the stocks are valued by earnings (e.g., P/E or BV/E) multiples.
10
CFA Program Curriculum 2013: Equity and Fixed Income, Level 1 Vol. 5 p. 262 11 Ibid
6
4. Methodology
4.1 Sample (data) variables and parameters:
Compared to other developed security markets in the world, the BSX is still fledgling stage and suffers various drawbacks. Automation for free information flow though began in the early of this decade but still it’s at stake. Poor database, inconsistency and unusual interruption made the few data dubious. Identifying individual company or even an industry as the ‘comparable’ has been experienced bitterly a challenge. Many large corporations operate in several lines of business, so the scale and scope of their operations are varied significantly12. However identifying comparables, this study carefully checked companies that are most similar in line with a number of dimensions which included (but are not limited to) industry category13, overall size, product lines, and growth rate14. Taking all the constraints into account, monthly price data of frequently traded 50 listed15 PLCs’ common stocks have been sampled from the DSE web profiles. The periodic review January 2009 to December 2013 has been mulled over for the sphere of sample study16. In this period time changing P-E, P-B multiples and NAV have been accounted from the national dailies17 using a complete non-random sampling approach. In this regard industry category for example A, B etc., in the latest past 12 months period was the prime basis for stock selection.
4.2 Built-in valuation model
In the methodology involves using a price multiple to evaluate whether an asset is fairly valued, undervalued or overvalued in relation to a benchmark value of the multiple. Choices for the benchmark multiple include the multiple of a closely matched individual stock, or the average or median value of the multiples for the stock’s industry18. Though various models19 and techniques have been used since early fifties of the last century, this study chose the most popularly known model the P-E multiplier for stock valuation, trailing 5-year average and other multiples comparable for valuing stocks. The economic rationale underlying the method of comparables is the law of one price. This method essentially compares relative values estimated using multiples or the relative values of multiples. The seminal works of McWilliams (1966), Millar and Widmann (1966), Nicholson (1968), Dreman (1977), and Bosu (1977) presented evidence of a return advantage to low P/E
12 For example, SQURPHARMA, BXPHARMA, IDLC Finance Ltd, Apex Tannery, etc 13 BXS industry category based on product lines, functional/ nature of homogeneity is: A, B, N & Z. 14 The type of analysis shown in Section 5.1 CFA @ Program Curriculum 2013 level 1 volume 5 p.263 15
Reading the stock market performance section of the newspaper is an easy thing to do and the sample selection has been based on performance analysis in the stock exchange 16
The price data published during the period July 2011 to June 2012, has been excluded from the study due to unusual upsurge and down fall of share market occurred. 17 Business pages of the Daily Star, and the Corporate & Stock pages of the Financial Express, Bangladesh mainly surveyed for price data. 18 For a benchmark sometimes trend or time series analyses are performed and average values of a price multiple are used.( CFA @ Program Curriculum 2013 level 1 volume 5 p.266) 19 Price–to–book ratio (P/B) measures the ratio of the stock price to book value per share. Price-to-sales ratio (P/S) measures the ratio of stock price to sales per share. Price-to-cash-flow ratio (P/CF) measures the ratio of stock price to some per-share measure of cash flow includes free cash flow (FCF) and operating cash flow (OCF).
7
stocks. P-E multiples necessarily fit together P-B (Price to book value i.e. net assets) multiples to avoid the artificial inflate in operating earnings results brought in by some company. Company’s relative investment risk, past earnings record, and growth potential are the factors that affect investors’ perceptions are reflected in P-B ratio authentically but not in P-E multiples. It discerns standard, trailing P-E multiples from rolling P-E and leading P-E multiples. It also indicates that, in calculating standard and rolling P-E multiples, price in the numerator should be adjusted for dividends that have been paid. The point is that dividends impinge on prices, but they do not have an effect on rambling earning. If a firm pays a dividend its price drops, but not it’s trailed earnings. Consequently, the amount the firm pays for a money unit of earnings, the earning multiple, should always be based on the price the firm pay before the dividend (Penman, 2003). So dividend adjusted trailing P/E = (price + dividend) Earning. The dividend adjustment does not apply to leading P-E multiples because if a dividend is paid out now, it would affect future earnings of assets which are taken out of the firm. Dividend payments affect future earnings but not past earnings. However, past earnings influence dividend policy which might have effect on common stock securities valuation (Penman, 2003).
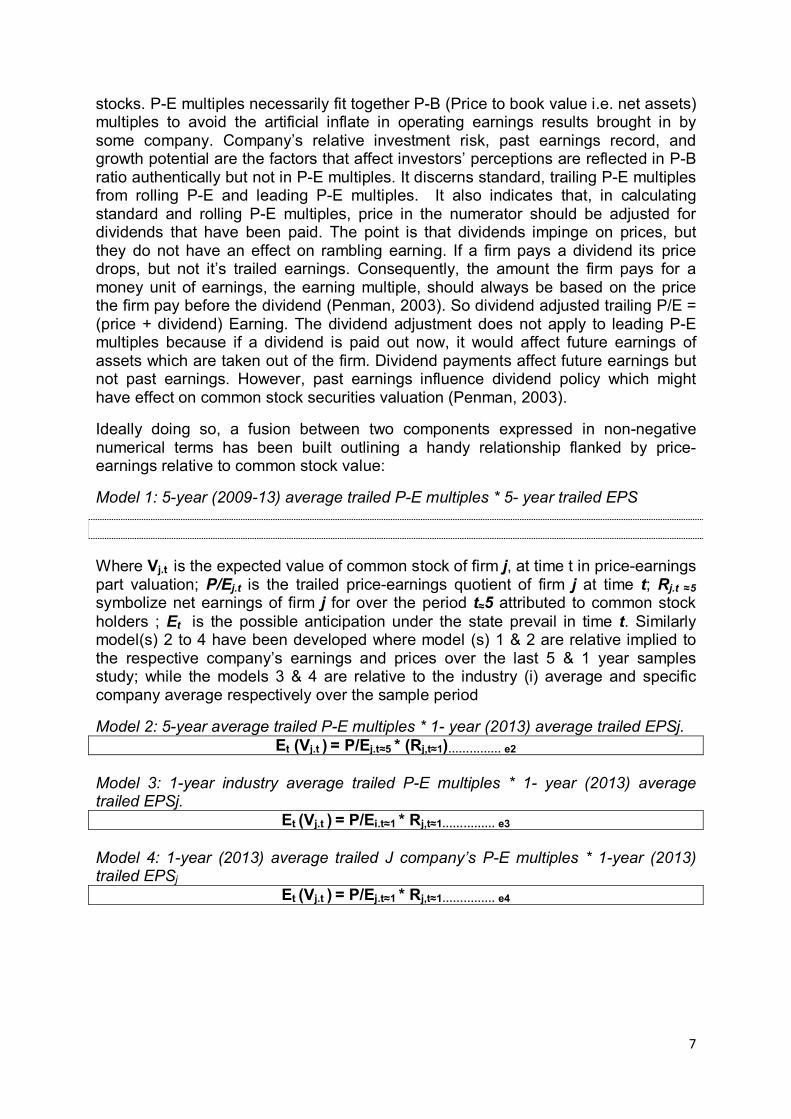
Ideally doing so, a fusion between two components expressed in non-negative numerical terms has been built outlining a handy relationship flanked by price-earnings relative to common stock value:
Model 1: 5-year (2009-13) average trailed P-E multiples * 5- year trailed EPS
Et(Vj.t) = P/Ej.t * Rj,t≈5…………… e1
Where Vj.t
is the expected value of common stock of firm j, at time t in price-earnings part valuation; P/Ej.t is the trailed price-earnings quotient of firm j at time t; Rj.t ≈5
symbolize net earnings of firm j for over the period t≈5 attributed to common stock holders ; Et is the possible anticipation under the state prevail in time t. Similarly model(s) 2 to 4 have been developed where model (s) 1 & 2 are relative implied to the respective company’s earnings and prices over the last 5 & 1 year samples study; while the models 3 & 4 are relative to the industry (i) average and specific company average respectively over the sample period
Model 2: 5-year average trailed P-E multiples * 1- year (2013) average trailed EPSj. Et (Vj.t )
= P/Ej.t≈5 * (Rj,t≈1)…………… e2 Model 3: 1-year industry average trailed P-E multiples * 1- year (2013) average trailed EPSj.
Et (Vj.t ) = P/Ei.t≈1 * Rj,t≈1…………… e3
Model 4: 1-year (2013) average trailed J company’s P-E multiples * 1-year (2013) trailed EPSj
Et (Vj.t ) = P/Ej.t≈1 * Rj,t≈1…………… e4
8
5. Experiential (built in models) Tests’ Outcomes
In observance of publicly available information, some companies’ published financial information has been found to lack verifiability. Adequacy, consistency and reliability of IFRS are found seemingly fuzzy words in practices. Net assets value (NAV), EPS and price stated in the periodical audited financial statements, are considered the prime factors (variables) for common stock valuation.
Findings analysis for Models: These are inaccurate in pointing to cyclical directions on at least two counts, both of which make investment in stock market a lagging economic indicator of the market cycle.
In the first place, the trailed past P-E multiple tends to point to a past economic condition—i.e., it lags the phase—because the share price rises and falls in response to the economic environment. Compounding the inaccuracy, when times get hard, discouraged market participants stop penetrating for new investments, reducing the number typically counted as idle and making the market look stagnant than it really is.
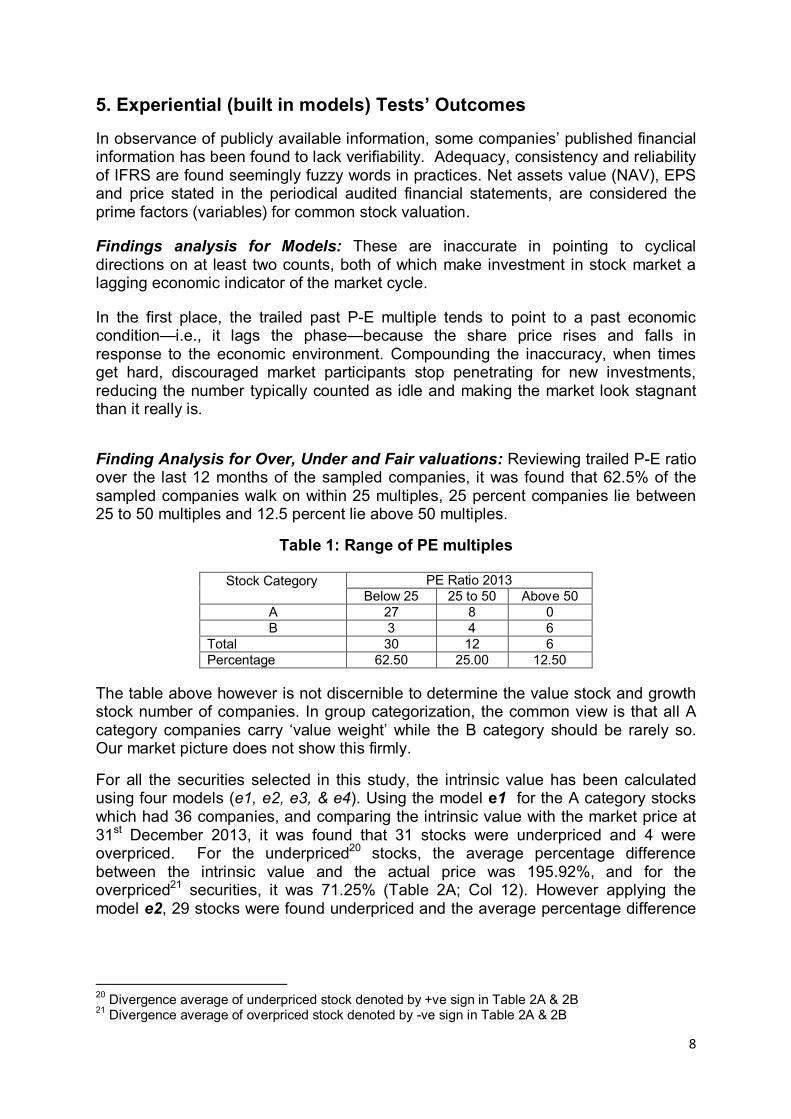
Finding Analysis for Over, Under and Fair valuations: Reviewing trailed P-E ratio over the last 12 months of the sampled companies, it was found that 62.5% of the sampled companies walk on within 25 multiples, 25 percent companies lie between 25 to 50 multiples and 12.5 percent lie above 50 multiples.
Table 1: Range of PE multiples
The table above however is not discernible to determine the value stock and growth stock number of companies. In group categorization, the common view is that all A category companies carry ‘value weight’ while the B category should be rarely so. Our market picture does not show this firmly.
For all the securities selected in this study, the intrinsic value has been calculated using four models (e1, e2, e3, & e4). Using the model e1 for the A category stocks which had 36 companies, and comparing the intrinsic value with the market price at 31st December 2013, it was found that 31 stocks were underpriced and 4 were overpriced. For the underpriced20 stocks, the average percentage difference between the intrinsic value and the actual price was 195.92%, and for the overpriced21 securities, it was 71.25% (Table 2A; Col 12). However applying the model e2, 29 stocks were found underpriced and the average percentage difference
20
Divergence average of underpriced stock denoted by +ve sign in Table 2A & 2B 21 Divergence average of overpriced stock denoted by -ve sign in Table 2A & 2B
Stock Category
PE Ratio 2013 Below 25 25 to 50 Above 50
A 27 8 0 B 3 4 6
Total 30 12 6 Percentage 62.50 25.00 12.50

9
stood at 37.11%, and 6 stocks were found overpriced with an average divergence of 53.67% (Table 2A; Col 13)22.
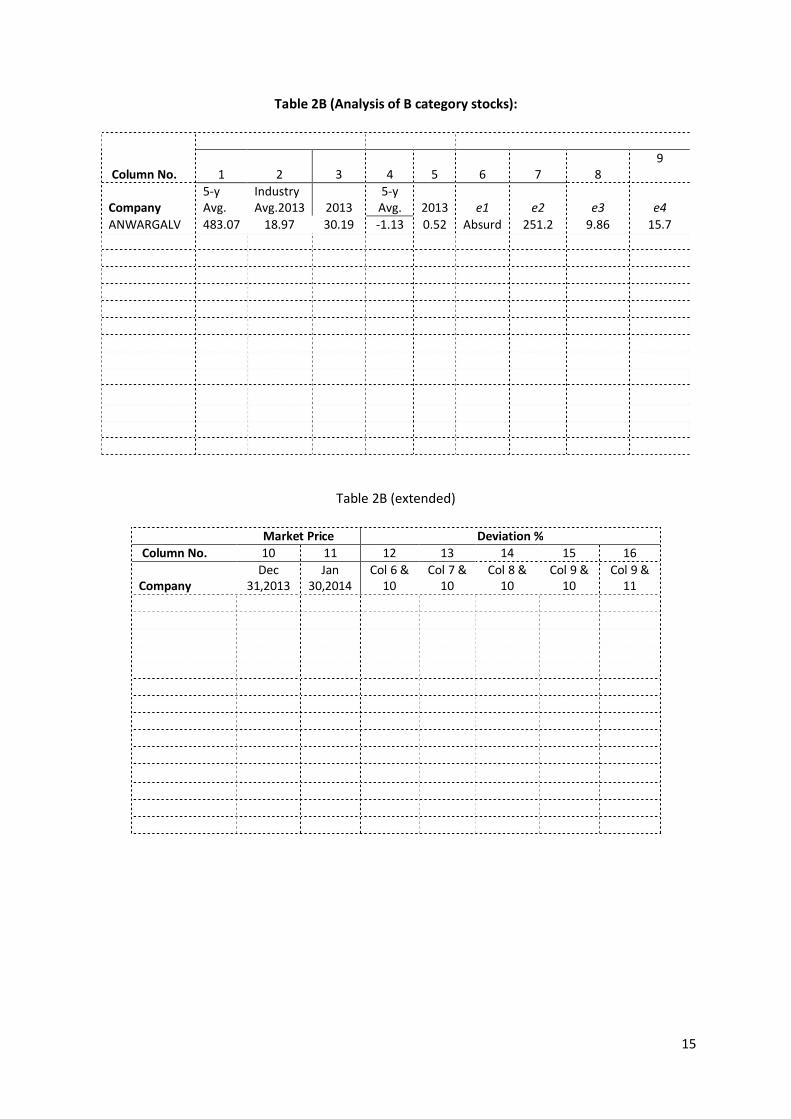
Similarly, for the B category stocks which had 14 companies, the model e1 showed that 10 were underpriced and 3 were overpriced and the percentage difference in price for them were 75.62% and 29.08% respectively (Table 2B; Col 12). The second model e2 renders 8 stocks underpriced and 5 stocks overpriced, and the average percentage difference in price for them were 44.98% and 140.85% respectively (Table 2B; Col 13)23.
Nothing exceptional was found while model e3 was applied. That is 17 and 18 stocks were found underpriced and overpriced respectively from A category stocks. One company’s (BDLAMPS) stock was abandoned because of its negative EPS. The average deviations were 21.75% and 51.76% for under and overpriced respectively (Table 2A; Col 14). A ridiculous outcome was found from B category stocks survey where all stocks were found overvalued (Table 2B; Col 14).
The deviation percent pictured in column 15 of table 2A, (observation on 31 December 2013) the threshold divergence of category A stocks were found 14.29, 57.14 and 28.57 percents for over, under and fairly priced respectively. Just after one month, on 30 January 2014 a different picture was viewed. With the justified P-E ratio, the forecasted deviations were found 60, 31.43 and 8.57 percents for over, under and fairly priced respectively (Table 2A; Col 16). This pattern of inclination would be rising depending on time horizon over which the stock was to be valued.
Making observation on 31 December 2013, category B stocks were found with a divergence of 61.54, 23.08 and 15.38 percents for over, under and fairly priced respectively (Table 2B; Col 15). Just after one month, the 30 January 2014 presented a different picture. With the justified P-E ratio, the forecasted deviations were found 76.92, 23.08 and 00.00 percents for over, under and fairly priced respectively (Table 2B; Col 15). It should be noted here that the B category shares performed somewhat better off only if the fairly priced prediction was compared.
Findings analysis for Investors behavior and Market Efficiency: In question of rationality, the market participants and the market are so volatile that no formula can track down perfectly the traits of the commons and the market; despite we believe that people/investors are always irrational but the market. Investigated people’s perception lets us know that mostly are either ignorant or least caring about P-E multiples or models (relative/ comparative) applicable for valuation. Five year average of P-E multiples times five year average EPS generate predicted values extremely under or over which are hardly ever believable (Table 2A & 2B; Col 12 & 13). Nevertheless, in comparison among the four models’ outcomes, only the (1-year X 1-year) average multiples and EPS gives somewhat closure predictions of stocks values (Table 2A & 2B; Col 15 & 16).
22 Two company’s (BDLAMPS and STANCERAM.) stock had been dropped due to absurdity (negative EPS) found in computational value.
23 Two company’s (ANWARGALV and BDTHAI) stock had been dropped due to absurdity (negative EPS) found in computational value.
10
Findings analysis for investment decisions: It is clearly difficult for investors to rely on PE multiples. For example, City Bank P/E ratio was 34.24 against its industry average of 8.11 in 2013 (Table 2A; Col 2 & 3), which began with an average of 23.51 just 52 weeks before. This hectic growth was obviously vulnerable symptom of stock price movement over the shortest time horizon and it would be an arduous decision for any investor seeking substantial profit from capital market investment. Needless to say City Bank’s Stock value was overpriced and a growth stock.
Under this circumstances prospective investors may invest on ground of P-E multiples which are not above 25 and very close to industry average of multiples. However, the exception may be for the industries like engineering, pharmaceuticals, and ceramic specifically. It would be unlikely to observe a demarcation criterion above 25 multiples for these industries. Nevertheless the firms of this industry should be investigated separately.
6. Reprise and Conclusions
The BSXs have witnessed thrilling performance during the entire period from December 2009 to June 2010. Unlocking the lock-in curb, exemption of sale of bonus shares from capital gains tax and allowing expatriate Bangladesh to take up to certain percent of the IPO were the steps taken by the government during this time. These all are seen reasons but cannot be cause of such continuous buoyancy over the past few months. In view of incessant buoyancy, there was skepticism among the analysts that accounting information had little impact on the markets. Needless to say this is a formidable task to chalk out real reasons behind such buoyancy and advise potential investors for stepping up in prevailing dubious investment situation.
Multipliers models based on firms’ financial statement and BSX (stock market) data published during the period24 January 2009– December 2013, inspected two main issues: first market efficiency i.e., what extent potential investors get acquainted with reflected stock price by the publicly available financial information, and secondly whether earnings multiples are effective in estimating stock price in emerging financial markets like Bangladesh.
A common criticism of all of these multiples is that they do not consider the future. This criticism is true if the multiple is calculated from trailing or current values of the divisor. Practitioners seek to counter this criticism by a variety of techniques, including forecasting fundamental values (the divisors) one or more years into the future. The resulting forward (leading or prospective) price multiples may differ markedly from the trailing price multiples. In the absence of an explicit forecast of fundamental values, the analyst is making an implicit forecast of the future when implementing such models. The choice of price multiple – trailing or forward – should be used consistently for companies being compared.
Besides the traditional price multiples used in valuation, just presented, analysts need to know how to calculate and interpret other ratios. Such ratios include those used to analyze business performance and financial condition based on data reported in financial statements. In addition, many industries have specialized
24 July 2011- June 2012 excluded from sample survey because unusual vulnerability in stock price prevailed
11
measures of business performance that analysts covering those industries should be familiar with.
References
Banz, Rolf. 1981. “The relationship between Return and Market Value of Common Stocks”. Journal of financial Economics, 9 (March)
Beaver, William H. and Dale, Morse. 1978. “What determines Price-Earnings Ratios?” Financial Analysis Journal 34, no.4 (July-August)
Bauman, W. Scott, and Miller, Robert e., 1997 “Investors Expectations and value Stocks versus Growth Stocks.” Journal of Portfolio Management, (Spring)
Bosu, Sanjoy. 1977. “The Investment Performance of the Common Stocks in Relation to their Price-Earnings Ratios: A Test of the Efficient Market Hypothesis.” Journal of Finance, vol. 32 (June), no. 3:663-682
Block, S. 1999. “A Study of Financial Analysts: Practice and Theory.” Financial Analysts Journal, vol. 55, no. 4: 86 – 95.
Dreman, D. 1977. Psychology of the Stock Market. New York: AMACOM.
Dyckman, T. R. and Morse, D. 1986. “Efficient Capital Markets and Accounting”, Englewood Cliffs, N.J. Prentice Hall Inc.
Haskins, Mark E.; Ferris, Kenneth R.; Sack, Robert J.; and Allen, Brandt R., 1997. Financial Accounting and Reporting. Irwin Inc 2/e. P.318-329
Fama, E., and K. French. 1995. “Size and Book-to-Market Factors in Earnings and Returns.” Journal of Finance, vol. 50, no. 1: 131 – 155.
McWilliams, J. 1966. “Prices, Earnings and P-E Ratios.” Financial Analysts Journal, vol. 22, no. 3: 137.
Miller, P., and E. Widmann. 1966. “Price Performance Outlook for High & Low P/E Stocks.” 1966 Stock & Bond Issue, Commercial & Financial Chronicle: 26 – 28.
Nicholson, S. 1968. “Price Ratios in Relation to Investment Results.” Financial Analysts Journal, vol. 24, no 1: 105 – 109. O’Shaughnessy, J. 2005. What Works on Wall Street. New York: McGraw – Hill.
Penman, Stephen H. 1996. “The Articulation of Price-Earnings Ratios and Market-to-book Ratios and the Evaluation of Growth.” Journal of accounting Research 34, no.2 (Spring)
Penman, Stephen H., 2003. Financial statement Analysis and Security Valuation (McGraw Hills Book Co.)
O’Bryne, Stephen E.1996. “EVA and Market Value.” Journal of Applied Corporate Finance (spring)

12
Skogsvik, Stina. 2008 “Financial Statement Information, the Prediction of Book Return on Owner’s Equity and Market Efficiency: The Swedish Case”, Journal of Business Finance and Accounting, 35(7) & (8), 795-817, September/October.
Skogvsik, Kenth and Skogsvik, Stina. 2008. “P/E-Ratios in Relative Valuation-A Mission Impossible?”, Investment Management and Financial Management, Vol. 5, Issue 4.
Wilcox, Jarrod W. 1984. “The P/B-ROE Valuation Model.” Financial Analysts Journal 40, no. 1(January-February)

13
Appendix
Table 2A (Analysis of A category stocks):
Column No.
PE Ratio EPS Intrinsic price(using model e1,e2,e3,e4)
1 2
3 4 5 6 7
8 9
Company 5-y Avg.
Industry Avg.2013
2013
5-y Avg. 2013 e1 e2
e3
e4
PRIMEBANK 13.52 8.11 13.08 4.90 1.98 66.18 26.77 16.06 25.90
ISLAMIBANK 13.53 8.11 11.02 14.7 3.45 199.40 46.66 27.98 38.02
EBL 13.50 8.11 7.01 5.60 4.15 75.62 56.04 33.66 29.09
BANKASIA 14.16 8.11 13.22 15.1 1.92 213.79 27.19 15.57 25.38
BGIC 27.14 19.41 21.32 1.86 1.36 50.36 36.90 26.40 29.00
UNITEDINS 36.11 19.41 15.52 7.00 2.77 252.63 100.02 53.77 42.99
EASTERNINS 28.07 19.41 15.12 7.97 2.46 223.64 69.06 47.75 37.20
IDLC 27.14 15.77 18.89 62.1 4.16 1688.50 112.91 65.60 78.58
PRIMEFIN 32.80 15.77 24.27 7.21 1.1 236.33 36.08 17.35 26.70
LANKABAFIN 24.48 15.77 15.25 12.9 4.58 317.06 112.10 72.23 69.85
AL-HAJTEX 15.48 17.25 34.21 0.64 2.22 9.91 34.37 38.30 75.95
SQUARETEXT 20.60 17.25 15.97 7.12 6.23 146.60 128.35 107.47 99.49
APEXTANRY 15.61 15.01 13.2 42.4 6.57 661.51 102.54 98.62 86.72
STANCERAM 40.73 22.22 28.48 -.36 1.12 absurd 45.62 24.89 31.90 AFTABAUTO 34.03 18.97 34.42 9.67 4.03 329.02 137.15 76.45 138.71
QSMDRYCELL 37.10 18.97 31.4 1.71 1.17 63.59 43.41 22.19 36.74
BDLAMPS 18.61 18.97 nil 17.9 -1.1 334.27 absurd absurd absurd
ACI 10.81 19.77 7.13 10.8 7.13 116.81 77.06 140.96 50.84
BXPHARMA 25.15 19.77 12.36 4.48 4.01 112.68 100.86 79.28 49.56
IBNSINA 29.74 19.77 24.36 14.9 4.48 442.07 133.22 88.57 109.13
SQURPHARMA 24.67 19.77 20.86 75.5 11.1 1861.87 274.55 220.04 232.17
MEGHNACEM 53.71 20.04 27.3 4.51 5.23 242.44 280.89 104.81 142.78
JAMUNAOIL 20.21 20.69 11.56 18.5 21.8 373.57 440.82 451.25 252.12
BATBC 14.81 20.69 19.76 54.4 81.1 805.29 1202 1678.79 1603.33
GP 17.03 15.39 13.45 11.6 10.9 197.06 185.48 167.60 146.47
ABBANK 14.30 8.11 12.78 31.0 2.2 443.45 31.47 17.84 28.12
EXIMBANK 12.07 8.11 8.78 3.22 1.63 38.92 19.68 13.22 14.31
ONEBANKLTD 12.84 8.11 6.48 13.0 2.68 167.33 34.40 21.73 17.37
CITYBANK 22.92 8.11 34.24 12.9 0.71 294.01 16.27 5.76 24.31
CITYGENINS 35.58 19.41 17.52 1.75 1.73 62.41 61.55 33.58 30.31
CONTININS 34.14 19.41 18.71 4.42 1.55 150.97 52.92 30.09 29.00
BDFINANCE 107.90 15.77 23.54 1.99 1.34 214.72 144.59 21.13 31.54 GOLDENSON 22.29 18.97 26.24 3.48 3.13 77.58 69.77 59.38 82.13
BSRMSTEEL 30.56 18.97 16.84 11.1 4.08 339.82 124.70 77.40 68.71
ORIONINFU 34.84 19.77 33.39 3.79 1.27 132.11 43.67 25.11 42.41
MEGHNAPET 19.08 20.69 12.55 16.9 25.6 323.41 488.54 529.87 321.41

14
Table 2A (extended)
Market Price Deviation %
Column No. 10 11 12 13 14 15 16
Company Dec
31,2013 Jan
30,2014 Col 6 &
10 Col 7 &
10 Col 8 &
10 Col 9 &
10 Col 9 &
11
PRIMEBANK 25.9 26.5 60.87 3.23 -61.29 -0.01 -2.32
ISLAMIBANK 34.6 35.6 82.65 25.85 -23.66 8.99 6.36
EBL 29.1 30.9 61.52 48.07 13.54 -0.03 -6.22
BANKASIA 23 21.8 89.24 15.43 -47.71 9.39 14.11
BGIC 29 31.5 42.42 21.42 -9.86 -0.02 -8.64
UNITEDINS 43 46.9 82.98 57.01 20.02 -0.02 -9.09
EASTERNINS 37.2 41.5 83.37 46.13 22.09 -0.01 -11.57
IDLC 62.9 73.9 96.27 44.29 4.12 19.96 5.96
PRIMEFIN 26.7 31 88.70 25.99 -53.92 -0.01 -16.12
LANKABAFIN 66.5 80.6 79.03 40.68 7.93 4.79 -15.40
AL-HAJTEX 72.9 71.4 -635.8 -112 -90.4 4.01 5.99
SQUARETEXT 90.4 103.7 38.34 29.57 15.88 9.14 -4.23
APEXTANRY 124.6 147.5 81.16 -21.51 -26.35 -43.67 -70.08 STANCERAM 40 40.3 N/A 12.32 -60.73 -25.40 -26.34
AFTABAUTO 90.7 90.2 72.43 33.87 -18.64 34.61 34.97
QSMDRYCELL 39.7 46 37.57 8.55 -78.87 -8.06 -25.21
BDLAMPS 125.9 134.4 62.34 n/a n/a n/a n/a
ACI 171.5 179.5 -46.82 -122.55 -21.67 -237.35 -253.09
BXPHARMA 47.2 53.7 58.11 53.20 40.46 4.77 -8.35
IBNSINA 99.4 112.8 77.51 25.39 -12.23 8.92 -3.36
SQURPHARMA 190.2 231.4 89.78 30.72 13.56 18.08 0.33
MEGHNACEM 142.8 158.8 41.10 49.16 -36.25 -0.01 -11.22
JAMUNAOIL 191.8 220.2 48.66 56.49 57.50 23.93 12.66
BATBC 1603.1 1847 -99.07 -33.37 4.51 0.01 -15.20
GP 200.9 211.5 -1.95 -8.31 -19.87 -37.16 -44.40
ABBANK 26.2 30.1 94.09 16.74 -46.84 6.81 -7.06
EXIMBANK 12.9 14 66.86 34.44 2.42 9.86 2.18
ONEBANKLTD 15.8 17.6 90.56 54.07 27.31 9.02 -1.35
CITYBANK 20.2 21.3 93.13 -24.15 -250.81 16.91 12.38
CITYGENINS 27.5 30.5 55.93 55.32 18.10 9.27 -0.63
CONTININS 29 32.7 80.79 45.20 3.61 0.00 -12.76
BDFINANCE 19.3 22 91.01 86.65 8.67 38.81 30.26 GOLDENSON 65.6 61.5 15.44 5.98 -10.48 20.13 25.12
BSRMSTEEL 68.7 82.2 79.78 44.91 11.24 0.01 -19.64
ORIONINFU 40.7 42.5 69.19 6.80 -62.10 4.02 -0.22
MEGHNAPET 6.6 7.5 97.96 98.65 98.75 97.95 97.67
15
Table 2B (Analysis of B category stocks):
Table 2B (extended)
Column No.
PE Ratio EPS Intrinsic price(using model e1,e2,e3,e4)
1 2
3 4 5 6 7
8 9
Company 5-y Avg.
Industry Avg.2013
2013
5-y Avg. 2013 e1 e2
e3
e4
ANWARGALV 483.07 18.97 30.19 -1.13 0.52 Absurd 251.2 9.86 15.7
BDTHAI 65.60 18.97 Nil 8.81 0.13 577.60 Absurd Absurd Absurd
BIFC 82.83 15.77 25.44 8.03 0.71 664.96 58.81 11.20 18.06
DESHBANDHU 41.75 18.97 82.8 2.15 0.26 89.76 10.86 4.93 21.53
DSHGARME 83.95 17.25 31.36 1.19 0.88 99.73 73.87 15.18 27.6
FASFIN 110.24 15.77 62.08 4.95 0.24 545.25 26.46 3.78 14.90
FINEFOODS 103.08 20.69 417.5 1.12 0.05 115.66 5.15 1.03 20.88
HAKKANIPUL 46.76 29.33 34.6 0.85 0.50 39.93 23.38 14.67 17.30
ILFSL 34.48 15.77 23.24 15.54 0.68 535.79 23.45 10.72 15.80
MAKSONSPIN 67.22 17.25 22.03 1.65 0.72 110.65 48.4 12.42 15.86
MIRACLEIND 81.77 13.92 135.56 0.14 0.10 11.28 8.18 1.39 13.56 MONNOCERA 183.24 22.22 79.43 1.3 0.35 239.10 64.14 7.78 27.80
SALVOCHEM 22.97 19.77 24.95 0.95 1.09 21.87 25.04 21.55 27.20
LEGACYFOOT 46.87 15.01 69.35 0.91 0.65 42.75 30.47 9.76 45.08
Market Price Deviation %
Column No. 10 11 12 13 14 15 16
Company Dec
31,2013 Jan
30,2014 Col 6 &
10 Col 7 &
10 Col 8 &
10 Col 9 &
10 Col 9 &
11
ANWARGALV 31.3 30.1 absurd 87.54 -217.30 -99.38 -91.73
BDTHAI 30.4 31.9 94.74 N/A N/A N/A N/A
BIFC 17.3 19.7 97.40 70.58 -54.51 4.22 -9.07
DESHBANDHU 22.4 20.9 75.05 -106.36 -354.16 -4.05 2.92
DSHGARME 62.5 66.2 37.33 15.39 -311.73 -126.48 -139.88
FASFIN 14.9 16.1 97.27 43.68 -293.68 -0.01 -8.06
FINEFOODS 23.8 22.3 79.42 -361.78 -2200.63 -14.01 -6.83
HAKKANIPUL 36.3 33.4 9.09 -55.27 -147.53 -109.83 -93.06
ILFSL 15.8 16.8 97.05 32.61 -47.34 0.02 -6.31
MAKSONSPIN 19 18.8 82.83 60.74 -52.98 -19.79 -18.53
MIRACLEIND 19.6 25.9 -73.70 -139.71 -1308.05 -44.59 -91.06
MONNOCERA 33.4 35.7 86.03 47.92 -329.47 -20.14 -28.41
SALVOCHEM 24.7 24.6 -12.94 1.36 -14.62 9.18 9.54
LEGACYFOOT 43 41.3 -0.59 -41.14 -340.73 4.61 8.38

16
List of Abbreviations & Acronyms
Abbreviations Acronyms Abbreviations Acronyms DSE Dhaka Stock Exchange BATBC BATBC
BSXs Bangladesh Stock Exchanges GP Grameen Phone
DDM Dividend Discount Model ABBANK AB Bank Limited
PLCs Public Limited Companies EXIMBANK Export Import Bank of Bangladesh
PRIMEBANK Prime Bank ONEBANKLTD One Bank Limited
ISLAMIBANK Islami Bank Bangladesh CITYBANK City Bank Limited
EBL Eastern Bank CITYGENINS City General Insurance Co. Ltd.
BANKASIA Bank Asia CONTININS Continental Insurance Ltd.
BGIC Bangladesh General Insurance Company Ltd. BDFINANCE
Bangladesh Finance & Investment Co. Ltd.
UNITEDINS United Insurance GOLDENSON Golden Son Ltd.
EASTERNINS Eastern Insurance BSRMSTEEL BSRM Steels Ltd.
IDLC IDLC Finance Ltd. ORIONINFU Orion Infusion Ltd.
PRIMEFIN Prime Finance & Investment Ltd. MEGHNAPET
Meghna Petroleum Limited
LANKABAFIN LankaBangla Finance Ltd. ANWARGALV Anwar Galvanizing
AL-HAJTEX Al Haj Textile BDTHAI BD Thai Aluminum
SQUARETEXT Square Textile BIFC Bangladesh Industrial Fin. Co. Ltd.
APEXTANRY Apex Tannery DESHBANDHU Deshbandhu Polymer Limited
STANCERAM Standard Ceramic DSHGARME Desh Garmants
AFTABAUTO Aftab Automobiles FASFIN FAS Finance & Investment Limited
QSMDRYCELL Quasem Dry cell FINEFOODS Fine Foods Limited
BDLAMPS Bangladesh Lamps HAKKANIPUL Hakkani Pulp & Paper
ACI ACI Limited ILFSL International Leasing & Financial Service Ltd.
BXPHARMA Beximco Pharma MAKSONSPIN Maksons Spinning Mills Limited
IBNSINA The IBN Sina MIRACLEIND Miracle Ind. SQURPHARMA Square Pharmaceuticals Ltd. MONNOCERA Monno Ceramic
MEGHNACEM Meghna Cement SALVOCHEM Salvo Chemical Industry Limited
JAMUNAOIL Jamuna Oil Company Limited LEGACYFOOT Legacy Footwear
DPS Dividend Per Share BSEC Bangladesh Securities and Exchange Commission
CSE Chittagong Stock Exchange NAV Net Asset Value