dtm - https:/displacement.iom.int - international organization
TRANSCRIPT
IOM NIGERIADISPLACEMENT TRACKING MATRIX (DTM) NORTH-EAST NIGERIA | DISPLACEMENT REPORT 39
DECEMBER 2021
DTMNigeria
Nigeria north-east zone | Displacement Report Round 39 (December 2021) | A2
TABLE OF CONTENTS
KEY HIGHLIGHTS 3
METHODOLOGY 4
LIMITATIONS 5
EXECUTIVE SUMMARY 6
BACKGROUND 7
OVERVIEW: DTM ROUND 39 ASSESSMENTS 8
1. BASELINE ASSESSMENT OF DISPLACEMENT 10
1A: PROFILE OF DISPLACEMENT IN NORTH-EAST NIGERIA 10
1B: DEMOGRAPHIC PROFILE 12
1C: REASONS FOR DISPLACEMENT 12
1D: YEAR OF DISPLACEMENT 12
1E: MOBILITY 13
1F: ORIGIN OF DISPLACED POPULATIONS 13
1G: UNMET NEEDS IN IDP SETTLEMENTS 14
1H: SETTLEMENT TYPE OF THE DISPLACED POPULATIONS 14
2 . S ITE ASSESSMENTS AND SECTORAL NEEDS 16
2A: LOCATION AND NUMBER OF IDPs 16
2B: SETTLEMENT CLASSIFICATION 16
2C: SECTOR ANALYSIS 17
3. RETURNEES 24
3A: YEAR OF DISPLACEMENT 25
3B: YEAR OF RETURN 25
3C: REASONS FOR INITIAL DISPLACEMENT 25
3D: SHELTER CONDITIONS 26
3E: HEALTH FACILITIES 26
3F: EDUCATION FACILITIES 26
3G: WATER, SANITATION AND HYGIENE FACILITIES 27
3H: LIVELIHOOD FACILITIES 27
3I: MARKET FACILITIES 27
3J: PROFILE OF ASSISTANCE 27
ANNEXES 29
Nigeria north-east zone | Displacement Report Round 39 (December 2021) | A3
Jigawa
Katsina
Kano
Plateau
Nasarawa
Benue
Cross River
Niger
Cameroon
Lake Chad
Nganzai
Marte
Abadam
KukawaGuzamala
±
89%
11%
YOBE
151,874
BORNO
52%
48%
91%9%
ADAMAWA
TARABA
6%
94%
100%
GOMBE
98%
2%BAUCHI
66,103
1,639,028
212,253
76,931
45,168
Hard to reach LGA
Less than 100,000
100,001 - 160,000
160,001 - 220,000
Above 220,001
IDPs in camps & camp-like settings
IDPs in host communities
IDP Population by State
0 100 20050 Km
Grand Total
Disclaimer: This map is for illustration purposes only. Names and boundaries in this map do not imply o�cial endorsement or acceptance by IOMData source: IOM DTM (NE RXXXIX), HDX, ESRI
Chad
Lake Chad
±
Taraba
Bauchi
Gombe
Plateau
Jigawa
Benue
92%
4%
92%
8%
90%
10%
Abadam
Chad
Niger
Cameroon
Lake Chad
0 70 14035 Km
Hard to reach LGA
Returnees total by state
Returnees from abroad
Returnee IDPs
Guzamala
Kukawa
Nganzai
Marte
YOBE
BORNO
ADAMAWA
xxxDisclaimer: This map is for illustration purposes only. Names and boundaries in this map do not imply o�cial endorsement or acceptance by IOMData source: IOM DTM (NE RXXXIX), HDX, ESRI
341,579
743,851
832,633
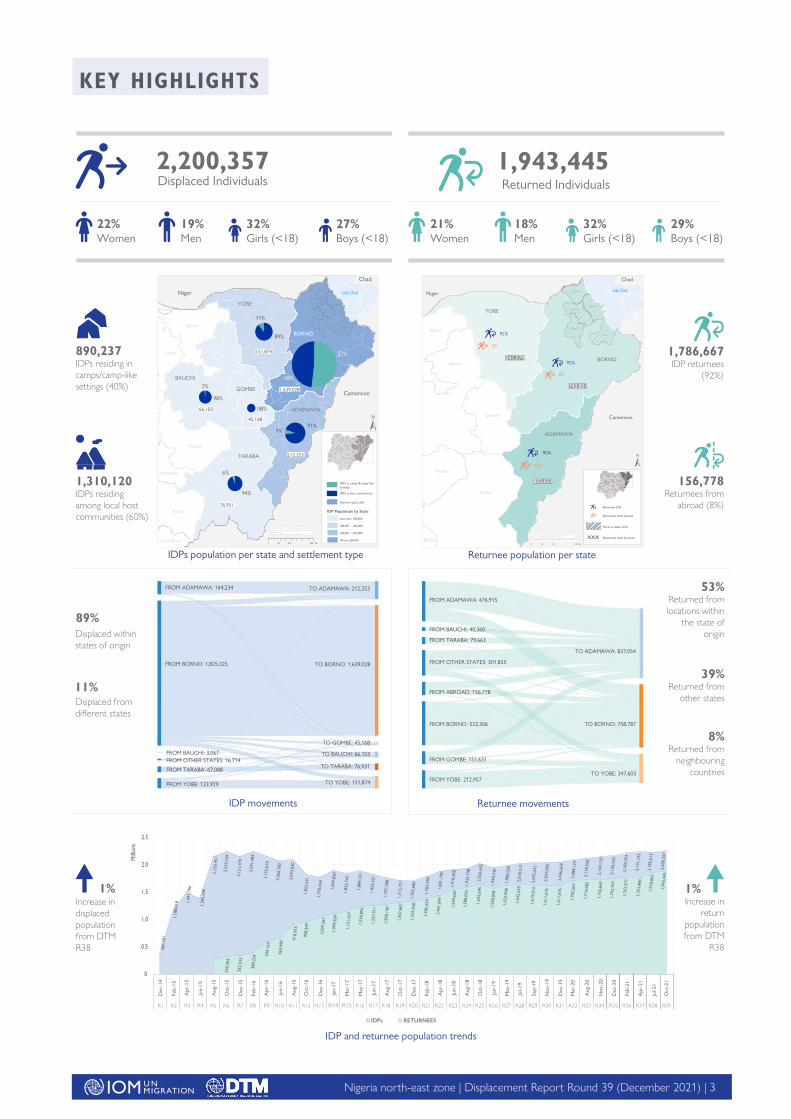
21%Women
18%Men
22%Women
19%Men
32%Girls (<18)
27%Boys (<18)
32%Girls (<18)
29%Boys (<18)
53%Returned from locations within
the state of origin
39%Returned from
other states
8%Returned from
neighbouring countries
1%Increase in displaced population from DTM R38
89%Displaced within states of origin
IDP and returnee population trends
11%Displaced from di�erent states
2,200,357Displaced Individuals
1,943,445 Returned Individuals
1%Increase in
return population from DTM
R38
FROM ADAMAWA: 164,234
FROM BORNO: 1,825,325
TO ADAMAWA: 212,253
FROM ADAMAWA: 476,915
FROM BAUCHI: 40,360
FROM OTHER STATES: 301,835
FROM TARABA: 79,663
FROM ABROAD: 156,778
FROM BORNO: 523,306
FROM GOMBE: 151,631
FROM YOBE: 212,957
TO ADAMAWA: 837,054
TO BORNO: 758,787
TO YOBE: 347,603
TO GOMBE: 45,168
TO TARABA: 76,931
TO BAUCHI: 66,103
TO YOBE: 151,874
TO BORNO: 1,639,028
FROM BAUCHI: 3,067FROM OTHER STATES: 16,714
FROM TARABA: 67,088
FROM YOBE: 123,929
IDPs population per state and settlement type Returnee population per state
IDP movements Returnee movements
890,237IDPs residing in camps/camp-like settings (40%)
1,310,120IDPs residing among local host communities (60%)
1,786,667IDP returnees
(92%)
156,778Returnees from
abroad (8%)
262,
324
1,73
6,84
9
Milli
ons
1,49
1,70
6
2,15
0,45
1
2,23
9,74
9
2,15
1,97
9
2,24
1,48
4
2,15
5,61
8
2,06
6,78
3
2,09
3,03
0
1,82
2,54
1
1,77
0,44
4
1,89
9,83
0
1,83
2,74
3
1,88
4,33
1
1,82
5,32
1
1,75
7,28
8
1,71
3,77
1
1,70
2,68
0
1,78
2,49
0
1,88
1,19
8
1,91
8,50
8
1,92
6,74
8
2,02
6,60
2
1,94
8,34
6
1,98
0,03
6
2,01
8,51
3
2,03
5,23
2
2,03
9,09
2
2,04
6,60
4
2,08
8,12
4
2,11
8,55
0
0
0.5
1.0
1.5
2.0
2.5
Dec
-14
Feb-
15
Apr
-15
Jun-
15
Aug
-15
Oct
-15
Dec
-15
Feb-
16
Apr
-16
Jun-
16
Aug
-16
Oct
-16
Dec
-16
Jan-
17
Mar
-17
May
-17
Jun-
17
Aug
-17
Oct
-17
Dec
-17
Feb-
18
Apr
-18
Jun-
18
Aug
-18
Oct
-18
Jan-
19
May
-19
Jul-1
9
Sep-
19
Nov
-19
Dec
-19
Mar
-20
Aug
-20
R1 R2 R3 R4 R5 R6 R7 R8 R9 R10 R11 R12 R13 R14 R15 R16 R17 R18 R19 R20 R21 R22 R23 R24 R25 R26 R27 R28 R29 R30 R31 R32 R33
Nov
-20
R34
Dec
-20
R35
Feb-
21
R36
Apr
-21
R37
Jul-2
1
R38
IDPs RETURNEES
332,
333
320,
365
389,
224 59
9,16
4
663,
485 91
0,95
5
958,
549
1,03
9,26
7
1,15
1,42
7
1,09
9,50
9
1,23
4,89
4
1,26
8,14
0
1,25
7,91
1
1,30
7,84
7
1,32
9,42
8
1,38
6,22
9
1,44
1,09
9
1,54
9,63
0
1,58
0,09
3
1,64
2,69
6
1,55
8,05
8
1,64
2,53
9
1,62
2,90
8
1,61
9,01
0
1,61
1,67
6
1,61
1,67
6
1,70
5,56
7
1,71
4,68
2
1,73
6,84
9
1,74
2,90
7
1,76
3,37
7
1,75
3,48
4
1,91
8,06
3
2,19
1,19
3
2,18
2,61
3
1,94
3,44
52,
200,
357
2,14
4,13
5
2,15
0,24
3
2,18
4,25
4
389,
281
1,18
8,01
8
1,38
5,29
8
Oct
-21
R39
KEY HIGHLIGHTS
Nigeria north-east zone | Displacement Report Round 39 (December 2021) | A4
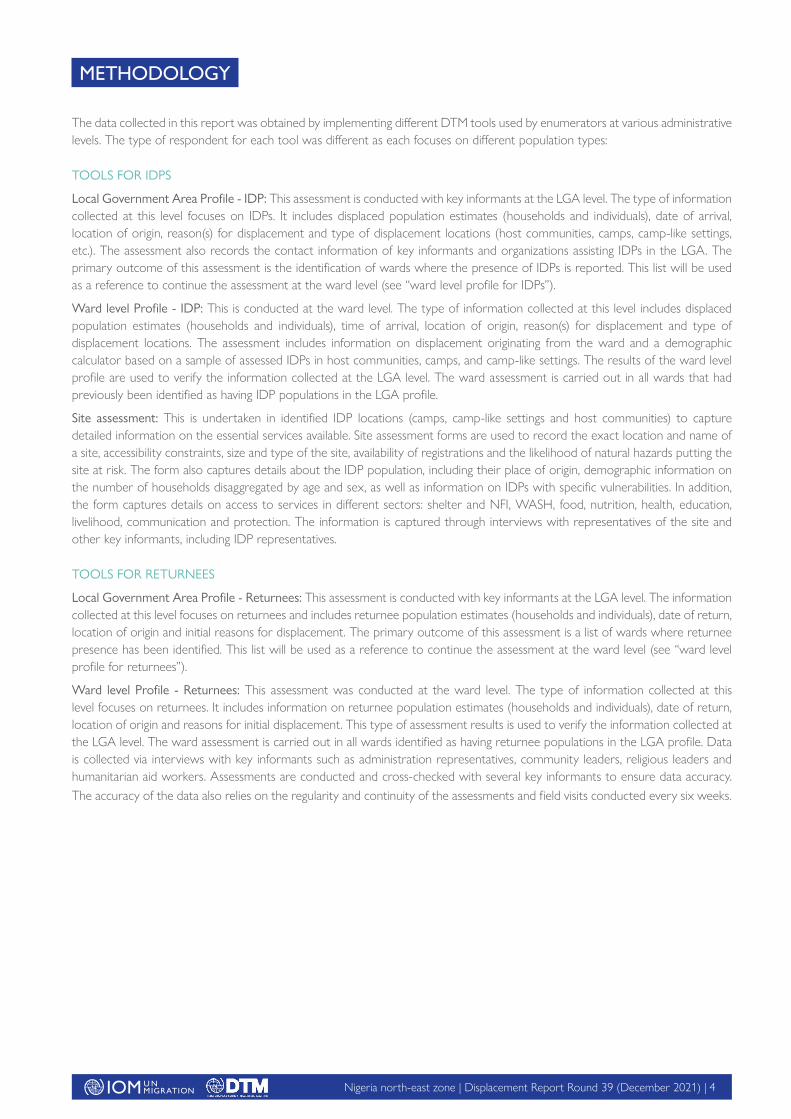
The data collected in this report was obtained by implementing different DTM tools used by enumerators at various administrative levels. The type of respondent for each tool was different as each focuses on different population types:
TOOLS FOR IDPS
Local Government Area Profile ‐ IDP: This assessment is conducted with key informants at the LGA level. The type of information collected at this level focuses on IDPs. It includes displaced population estimates (households and individuals), date of arrival, location of origin, reason(s) for displacement and type of displacement locations (host communities, camps, camp-like settings, etc.). The assessment also records the contact information of key informants and organizations assisting IDPs in the LGA. The primary outcome of this assessment is the identification of wards where the presence of IDPs is reported. This list will be used as a reference to continue the assessment at the ward level (see “ward level profile for IDPs”).
Ward level Profile ‐ IDP: This is conducted at the ward level. The type of information collected at this level includes displaced population estimates (households and individuals), time of arrival, location of origin, reason(s) for displacement and type of displacement locations. The assessment includes information on displacement originating from the ward and a demographic calculator based on a sample of assessed IDPs in host communities, camps, and camp-like settings. The results of the ward level profile are used to verify the information collected at the LGA level. The ward assessment is carried out in all wards that had previously been identified as having IDP populations in the LGA profile.
Site assessment: This is undertaken in identified IDP locations (camps, camp-like settings and host communities) to capture detailed information on the essential services available. Site assessment forms are used to record the exact location and name of a site, accessibility constraints, size and type of the site, availability of registrations and the likelihood of natural hazards putting the site at risk. The form also captures details about the IDP population, including their place of origin, demographic information on the number of households disaggregated by age and sex, as well as information on IDPs with specific vulnerabilities. In addition, the form captures details on access to services in different sectors: shelter and NFI, WASH, food, nutrition, health, education, livelihood, communication and protection. The information is captured through interviews with representatives of the site and other key informants, including IDP representatives.
TOOLS FOR RETURNEES
Local Government Area Profile - Returnees: This assessment is conducted with key informants at the LGA level. The information collected at this level focuses on returnees and includes returnee population estimates (households and individuals), date of return, location of origin and initial reasons for displacement. The primary outcome of this assessment is a list of wards where returnee presence has been identified. This list will be used as a reference to continue the assessment at the ward level (see “ward level profile for returnees”).
Ward level Profile ‐ Returnees: This assessment was conducted at the ward level. The type of information collected at this level focuses on returnees. It includes information on returnee population estimates (households and individuals), date of return, location of origin and reasons for initial displacement. This type of assessment results is used to verify the information collected at the LGA level. The ward assessment is carried out in all wards identified as having returnee populations in the LGA profile. Data is collected via interviews with key informants such as administration representatives, community leaders, religious leaders and humanitarian aid workers. Assessments are conducted and cross-checked with several key informants to ensure data accuracy. The accuracy of the data also relies on the regularity and continuity of the assessments and field visits conducted every six weeks.
METHODOLOGY
Nigeria north-east zone | Displacement Report Round 39 (December 2021) | A5
• The security situation in some wards in north-east Nigeria remains unstable and as a result, accessibility is limited. In locations with limited accessibility, data was collected through telephone interviews with key informants.
• Linked to the security situation, access is often limited due to movement restrictions imposed by the military. During the the assessment period of Round 39, this was the case in the state of Yobe as a result of intermittent kidnappings and abductions.
• As the situation is volatile in some locations, with frequent displacements, it is challenging for the enumerators to build a network of trusted key informants. Additionally, regular updates of the sites or wards are necessary due to the frequency of these movements, often due to attacks or the fear of attacks.
• Key informant fatigue. Many key informants are increasingly reluctant to cooperate due to perceived lack of response. In some cases, this has resulted in threats and intimidation of enumerators.
• The increasing cost of transportation (motorcycle hire) to access hard to reach areas.
• Enumerators feel that sometimes the numbers provided by key informants are not correct. Exaggerated numbers are given in the hope of receiving assistance. Enumerators cross-check the information provided by also using Focus Group Discussions (FGD).
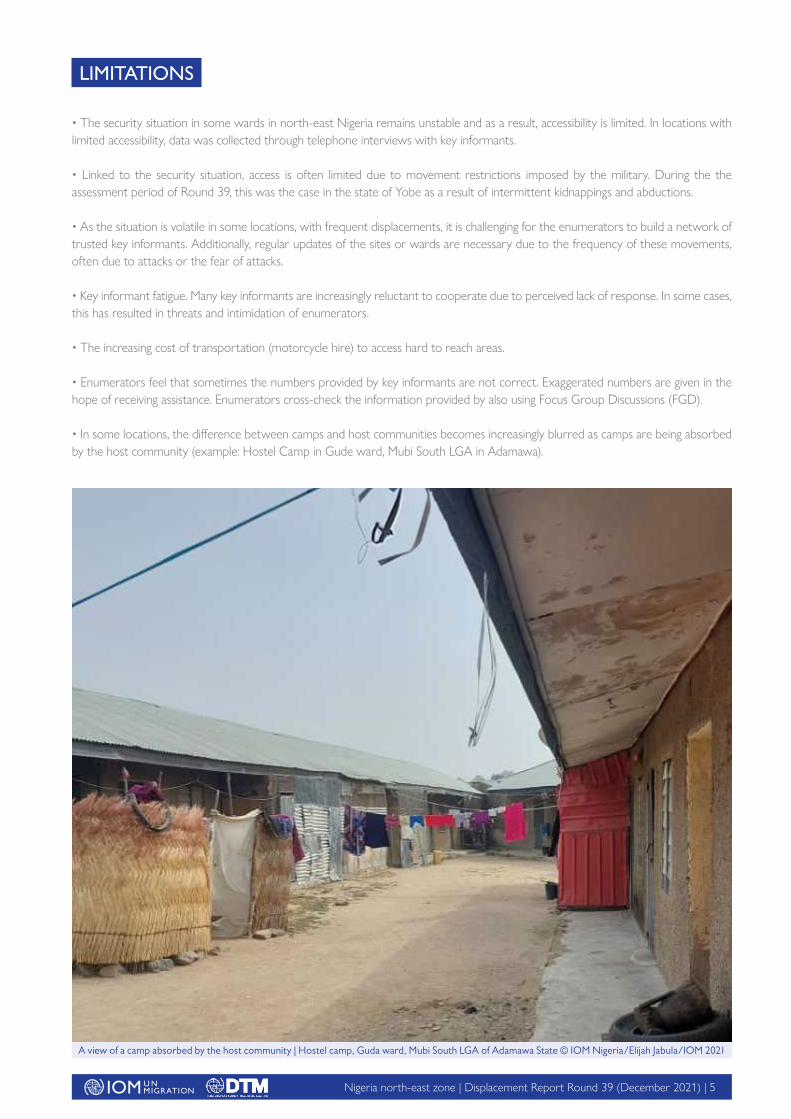
• In some locations, the difference between camps and host communities becomes increasingly blurred as camps are being absorbed by the host community (example: Hostel Camp in Gude ward, Mubi South LGA in Adamawa).
LIMITATIONS
A view of a camp absorbed by the host community | Hostel camp, Guda ward, Mubi South LGA of Adamawa State © IOM Nigeria/Elijah Jabula/IOM 2021
Nigeria north-east zone | Displacement Report Round 39 (December 2021) | A6
This report, which presents the results from Round 39 of Displacement Tracking Matrix (DTM) assessments carried out by the International Organization for Migration (IOM), aims to improve the understanding of the scope of internal displacement, the plight of returnees and the needs of the displacement affected populations in north-east Nigeria. The report covers the period from 30 August to 15 October 2021 and reflects the trends from the six states in Nigeria’s north-east geopolitical zone. This zone is the most affected by the conflict and consists of the following states: Adamawa, Bauchi, Borno, Gombe, Taraba and Yobe.
In Round 39, a total of 2,200,357 Internally Displaced Persons (IDPs) were identified in 452,363 households. This signified an increase of less than 1 per cent (or 17,744 individuals) compared to Round 38 when 2,182,613 IDPs were recorded (July 2021). The number of IDPs recorded during Round 39 also increased by 9,164 individuals or less than 1 per cent compared to Round 37 when 2,191,193 IDPs were identified (May 2021). When comparing the number of IDP individuals between Round 39 and Round 34 (September 2020), the number of IDPs in north-east Nigeria has increased by almost 3 per cent or 56,222 individuals during the past year.
The number of IDPs in the region is now well above (8% increase) the number recorded in Round 25 (2,026,602 individuals), which was conducted before the escalation in violence observed in October 2018. Even though accessibility remains lower than during Round 25 and prior, the increase in IDPs was noted. Since the Round 25 of assessments, the LGAs Kukawa, Kala/Balge and Guzamala in Borno State have been largely inaccessible due to increased hostilities in those districts. In Round 29, the ward Rann in Kala/Balge LGA became accessible again and remains so currently. Given that the number of IDPs is increasing, although accessibility remains low, it can be inferred that the actual displacement figures could be considerably higher.
To gain insights into the profiles of IDPs, interviews were conducted with 6 per cent of the identified IDP population — 122,644 internally displaced persons — during this round of assessments. The information collated and analysed in this report includes the reasons for displacement, places of origin and shelter types, mobility patterns and unfulfilled needs of the displaced populations.
During Round 39, IDP assessments were conducted in 2,381 locations (up from 2,380 locations in Round 38). Assessed locations included 309 camps and camp-like settlements (no change since Round 38) and 2,072 locations where internally displaced persons lived among host communities (up from 2,071 in Round 38). The purpose was to understand better the gaps in services provided and the needs of the affected population. Site assessments included an analysis of sector-wide needs, shelter and non-food items, water, sanitation and hygiene (WASH), food and nutrition, health, education, livelihood, security, communication and protection.
Furthermore, 1,943,445 returnees were recorded in the DTM Round 39 assessment.1 This number represents an increase of 25,382 individuals or more than 1 per cent compared to Round 38 when 1,918,063 returnees were recorded (July 2021). When comparing the number of returnee individuals between Round 39 and Round 34 (1,736,849 individuals in September 2020), the number of returnees in north-east Nigeria has increased by 12 per cent or 206,596 individuals during the past year. While IDP numbers continue to increase, it can be concluded that there is a clear trend toward a return to locations of origin in the BAY (Borno, Adamawa and Yobe) states.
This report includes analyses of the number of returnees, their displacement profiles, shelter conditions, health, education, livelihood, market, assistance and WASH facilities available to the returnees. Notably, as Borno is the most affected state by conflict-related displacements in north-east Nigeria, it concentrates explicitly on the related data and analysis.
EXECUTIVE SUMMARY
1 It is to be noted that return movements are only captured in the states Borno, Adamawa and Yobe.
Nigeria north-east zone | Displacement Report Round 39 (December 2021) | A7
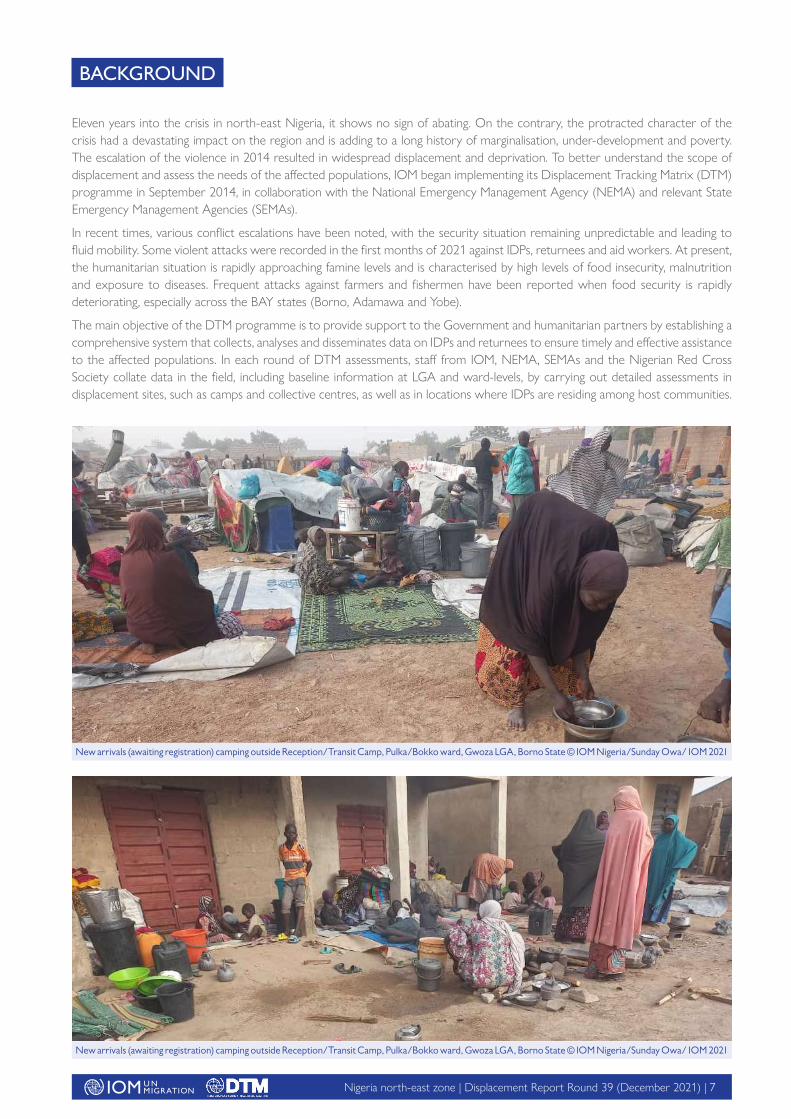
Eleven years into the crisis in north-east Nigeria, it shows no sign of abating. On the contrary, the protracted character of the crisis had a devastating impact on the region and is adding to a long history of marginalisation, under-development and poverty. The escalation of the violence in 2014 resulted in widespread displacement and deprivation. To better understand the scope of displacement and assess the needs of the affected populations, IOM began implementing its Displacement Tracking Matrix (DTM) programme in September 2014, in collaboration with the National Emergency Management Agency (NEMA) and relevant State Emergency Management Agencies (SEMAs).
In recent times, various conflict escalations have been noted, with the security situation remaining unpredictable and leading to fluid mobility. Some violent attacks were recorded in the first months of 2021 against IDPs, returnees and aid workers. At present, the humanitarian situation is rapidly approaching famine levels and is characterised by high levels of food insecurity, malnutrition and exposure to diseases. Frequent attacks against farmers and fishermen have been reported when food security is rapidly deteriorating, especially across the BAY states (Borno, Adamawa and Yobe).
The main objective of the DTM programme is to provide support to the Government and humanitarian partners by establishing a comprehensive system that collects, analyses and disseminates data on IDPs and returnees to ensure timely and effective assistance to the affected populations. In each round of DTM assessments, staff from IOM, NEMA, SEMAs and the Nigerian Red Cross Society collate data in the field, including baseline information at LGA and ward-levels, by carrying out detailed assessments in displacement sites, such as camps and collective centres, as well as in locations where IDPs are residing among host communities.
BACKGROUND
New arrivals (awaiting registration) camping outside Reception/Transit Camp, Pulka/Bokko ward, Gwoza LGA, Borno State © IOM Nigeria/Sunday Owa/ IOM 2021
New arrivals (awaiting registration) camping outside Reception/Transit Camp, Pulka/Bokko ward, Gwoza LGA, Borno State © IOM Nigeria/Sunday Owa/ IOM 2021
Nigeria north-east zone | Displacement Report Round 39 (December 2021) | A8
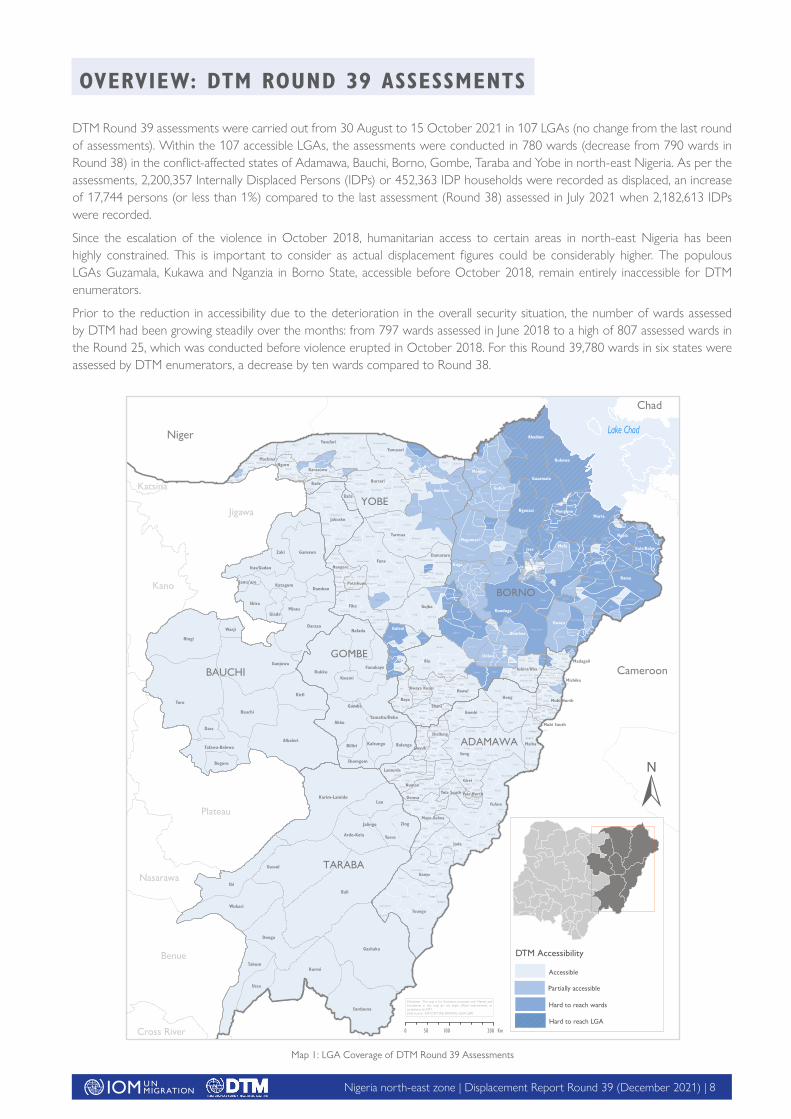
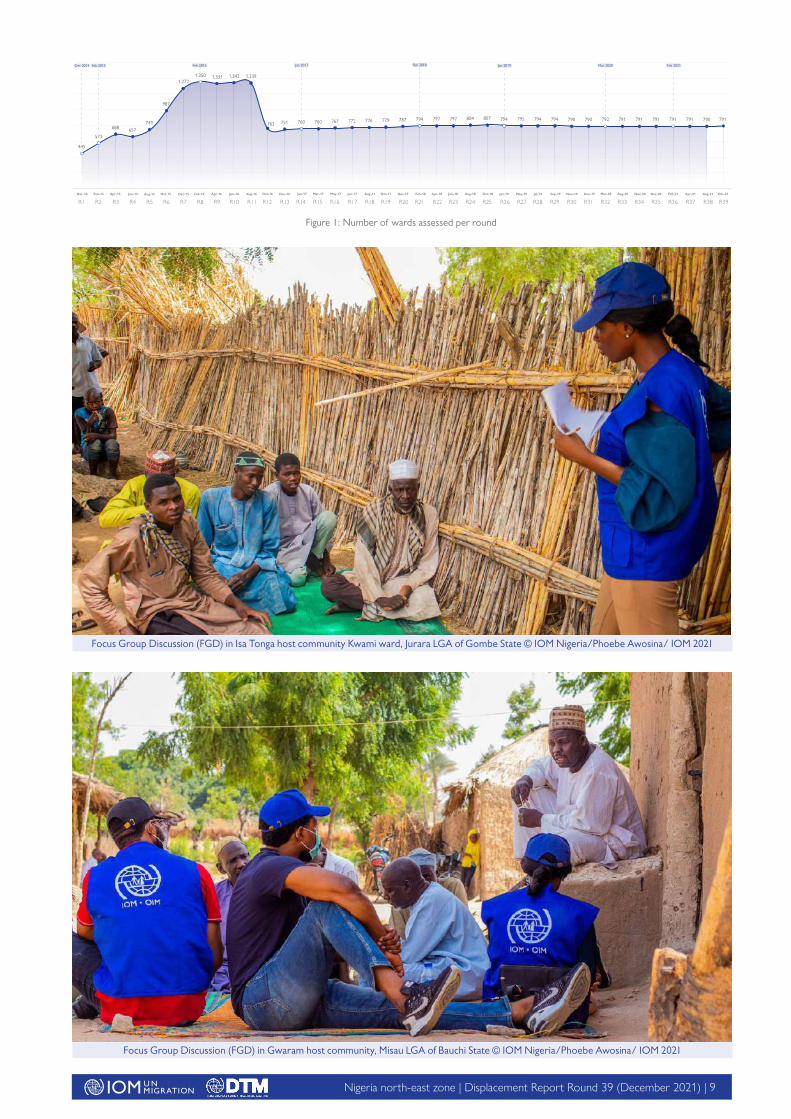
DTM Round 39 assessments were carried out from 30 August to 15 October 2021 in 107 LGAs (no change from the last round of assessments). Within the 107 accessible LGAs, the assessments were conducted in 780 wards (decrease from 790 wards in Round 38) in the conflict-affected states of Adamawa, Bauchi, Borno, Gombe, Taraba and Yobe in north-east Nigeria. As per the assessments, 2,200,357 Internally Displaced Persons (IDPs) or 452,363 IDP households were recorded as displaced, an increase of 17,744 persons (or less than 1%) compared to the last assessment (Round 38) assessed in July 2021 when 2,182,613 IDPs were recorded.
Since the escalation of the violence in October 2018, humanitarian access to certain areas in north-east Nigeria has been highly constrained. This is important to consider as actual displacement figures could be considerably higher. The populous LGAs Guzamala, Kukawa and Nganzia in Borno State, accessible before October 2018, remain entirely inaccessible for DTM enumerators.
Prior to the reduction in accessibility due to the deterioration in the overall security situation, the number of wards assessed by DTM had been growing steadily over the months: from 797 wards assessed in June 2018 to a high of 807 assessed wards in the Round 25, which was conducted before violence erupted in October 2018. For this Round 39,780 wards in six states were assessed by DTM enumerators, a decrease by ten wards compared to Round 38.
OVERVIEW: DTM ROUND 39 ASSESSMENTS
Plateau
Jigawa
Katsina
Kano
Nasarawa
Benue
Cameroon
Disclaimer: This map is for illustration purposes only. Names and boundaries in this map do not imply o�cial endorsement or acceptance by IOMData source: IOM DTM (NE RXXXIX), HDX, ESRI
0 100 20050 KmCross River
±
DTM Accessibility
Accessible
Partially accessible
Hard to reach wards
Hard to reach LGA
Bali
Toro
Ibi
Gashaka
Ningi
Gassol
Alkaleri
Kurmi
Dukku
Ganjuwa
Wukari
Bauchi
Kirfi
Akko
Sardauna
Donga
Zaki
Karim-LamidoLau
Darazo
Takum
Gamawa
Ussa
Shira
Zing
Nafada
Ardo-Kola
Tafawa-Balewa
Misau
Dass
Warji
Bogoro
Kwami
Yorro
Balanga
Funakaye
Itas/Gadau
Katagum
Billiri
Yamaltu/Deba
Gombe
Damban
Giade
Kaltungo
Shomgom
Jama'are
Jalingo
Lake Chad
Chad
Niger
Dalwa
Gumti
Zageri
Kusur
Yabal
Mafa
Fai
Zumo
Biriri
Bita Izge
Kalizoram
Borko
Buratai
Kala
Beti
Mulgo Kopchi
Dilala
Jakana
Wagir
Dawo 2
Gujba
Gabai
Gur
Ajigin A
Tawa
Yeli
Kiri 1
Garaha
Mafa
Zari
Janga
Kurnawa
Jajere
Tulotulo
Soye
Yunusari/Ngirabo
Yadim
Mutai
Gurin
Kayeri
Borno Yesu
Fuye
Danani
Titiwa
Kareto
Farang
Garubula
Zowo
Mashio
Ajiri
Pariya
Muliye
Guya
Gumsuri
Bego
Gunda
Dirma
Suktu
Lantaiwa
Sugu
MadaAjiri
Ngelzarma B
Masu
Ngulde
Buni Gari
Ngohi
Bogomari
Kogin Baba 2
Lege
Ndufu
Kafiya
Kaliyari
Dapchi
Bille
Suwa
Lamisu
Yebbi
Koriyel
Jaba
Bogum
GazabureLayi
Daksiri
Mayo Inne
Goduram
Ngamdu
Yajiwa
Gumsa
Azir Multe
Garu
Tuba
Kalallawa Gabai
Dawo 1
Gulumba
Hambagda
Toungo 2
Uki Tuki
Gaanda
Chamba
Daura A
Ngetra
Kollere Kafaje
Karlahi
Ardimini
Daratoshia
Jebuwa
Gasi
Bodwai
Gurumpawo
Kupti
Ma'Anna
Mairari
Kafa Mafi
Wuyo
Wawa Korode
Ribadu
Sumbar
Lafiya Loi Loi
Kilange Funa
Mussa
Sorau A
Andara
Kwaja�a
Fukurti
Gamu
Wulo
Boga
Korongilum
Song Waje
Leko
Kawuri
Gumshi
Vulpi
Mayori
Guyaku
Gudi Dozi
Limanti
Koma 2
Felo
Yabiri
Dumbari
Duji
Sorau B
Wajiro
Puba Vidau
Bultuwa
Masaba
Muguram
Borno Kiji
Jororo
Wala Warabe
M. Kaza
Yusufari
Mapeo
Gashigar
Jaggu
Alagarno
Wuro Bokki
Gudu Mboi
Manda Da'A
Gawa
Sure
Zah
Ajigin B
Tola
Mayo Farang
Maimalari
Yo�o
Babangida
Duwa
Dilli
Gidgid Bayam
Gadaka
Libbo
Mamudo
Buduwa
Ngalda
Afunori
Namtari
Sigire
Gengle
Jarawa
Gorgoram
Guba Dapso
Ayi Yasku
Dong
Goniri
Furram
Daura B
M. MajaJilbe
Dekwa
Gaya-sikalmi
Gwio-Kura
Gagure
Gabon
Loskuri
Kingowa
Bumsa
Gorobi
Degaltura
Shani
Koma 1
Telli
Amchaka
Mozogun
Yang
Margata
Ardoram
Gotala
Ngurbuwa
Mbullo
Ndikong
Mofio
Toungo 3
Buduwa/Bula Chirabe(Banki)
Gulak
Jereng
Bara
Dabira
Gereng
Guji Metalari
Demsa
Zangebe
Ngelzarma A
Shehuri
Kiri 2
Bwalki
Ruhu
Warshele
Kumagannam
Kiri
Dole
Shekau
Danaba
Yajiri
Bebel
Abbaram
Dokshi
Ngojin
Mujigine
Ngamma
Bare
Mbalala
Dwam
Bukarti
Dille Huyim
Kpasham
Buni Yadi
Waltandi
Alau
Kirawa
Bangshika
Marguba
Hong
Gubio 1
Asaga
Muchalla
Yele
Kaguram
Dagona
Jada 2
Magumeri
Rann
Balle
Zulum
Wuro Dole
Chikila
Waro
Modire
Pallam
Boboshe
Dakri
Yawi
Dikwa
Bularafa
Walama
Gwamba
Digil
Bargu
Bahuli
Jumbam
Mijilu
Jawa G Dole
Mandunari
Jakusko
Damagum B
Kodomti
Tambo
Dogoma
Jara-Dali
Sukur
Dazigau
Kuburmbula
Sungul Koka
Jumbul
Dumsai
Girei 2
Zabudum Dachia
Guwo
Fajiganari
Uba
Dumne
Hildi
Moholo
Gambir Moduri
Gajibo
Mandala
Dadingel
Maja Kura
Dala
Karagawaru
Ngbebogun
Tobolo
Gora
Gulani
Gubio 2
Dawayo
Zarawuyaku
Kola
Duhu
Bakta
Darajamal
Logumane
Damakasu
Bakari Goso
Miringa
Dugja
Mainok
Afuye
Kubo
Uvu Uda
Wamdeo Giwi
Leko
Bebel
Betso
Vimtim
Pemi
Guyuk
Dusuma
Bulabulin
Duvu
Bulatura
Mayo Kalaye
Kukareta Warsala
Murfakalam
Hoserezum
Jawur Katamma Futchimiram
Thilbang
MandaragirauTeteba
Yolde Kohi
Bayamari
Bajama
Dudduye
Ngurno
K Kaudi
Wulgo
Talum
Gwalasho
Nyibago
Song Gari
Zajibiri/Dumbal
Peta
Marmari Gudugurka
Ngurore
Gwangang Chata
Shettimari
Waduku
Kushimaga
Bulanguwa
Ma'Afa
Mayo Lope
Sigal
Karasuwa Galu
Mujara
Kwaya Kusar
Chukuriya
Kautikari
Konkol
Nzuda Wuyaram
Jara-Gol
Binyeri
Maisandari Wi
Damai
Tsugum Tagali
Hoyo Chingowa
Mbamba
Grim Damchoba
Benisheikh
Kasugula
Gyawana
Koshebe
Balbaya
Dalori
Gongulong
Gang Fada
Bobini
Dawasa
Pulka Bokko
Hausari Zadawa
Karauswa Garu Guna
Whuntaku
Watinani
Fika Anze
Mbula
Gasma
Manjekin
Gajigana
Gwaskara
Rumirgu Chul
Bogo
Garin Gawo
Zangaya Mazawaun
Dukul
Maskandare
Tikau
Garta
Gundo
Nduku
Falimaram
Kukuri
Lafiya
Timdore
Machina
Zulum Umarti
Kurba Gayi
Fufore
Bole Yolde Pate
Kirchinga
Dabule
OpaloJera Bakari
Konkomma
Ribadu
Pama Whitambaya
Wawa
Mbokura
Jada 1
Mugulbu
Dongo
Shirarkir
Dumna
Hizhibwala
Monguno
Gude
Asheikri 1
Jera Bonyo
Kararam
Kidda
Garkida
Kwayabura
Kogin Baba 1
Imburu
Askira East
Ngudoram
Limanti
Tambajam
K Kumaga
Nassarawo Demsa
Nangere
Yimirdalang
Juluri Damnawa
Ngurthlavu
Kopa
Degubi
Madzi
Bodeno
Waga-chakawa
Shangui
Shelleng
Vih/Boka
Sasawa Kabaru
Damakuli
Futuless
Ngbakawo
Borgozo
Gamadiyo
Wassaram
Borrong
Girei 1
Humbutudi
Ngala
Wada
Hausari Tampul
Kombo
Lassa
Kuranabasa
Sakwa Hema
Kubuku
Briyel
Taganama
Gella
Kukayasku
Kilange Hirna
Gamboru C
Kumshe
Lamurde
Mayo Nguli
Zara
Buma
Chikide
Gamawu
Tsukumu/Tilijo
Mayo Bani
Purakayo
Dubange
Damboa Central
Galtimari
Sha�a
Lokoro
Kwarhi
Shehuri
Njibulwa
Ketembere
DirbishiLakundum
Maisandari
Gwandi
Bila Gusi
Daima
Ganye 2
Ngubala Bamma
Auno
Bare Bari
Maiha Gari
Langawa Darin
Yerimaram
Gombi North
Chilariye
Wula
Rigange
Sina Kamale
Gatamarwa
Bilingwi
Garu
Mairi
Khadammari
Ufaye
Banjiram
Kwaja
Jigalambu
Lamurde
Shoye
Ngarbi
Hyambula
Gwapopolok
Turmi Malori
Wachakal
Likama
Marama Kidang
Karewa
Bolori I
Tumbara/Ngabili
Guduf A&B
Gombi South
Galangi
Damare
Toungo 1
Ninkisi/Wuro Ngiki
Bolori II
Guwal
Mbilla
Tamsu Ngamdua
Kumalia
Konduga
Garin Tuwo
Gava Agapalawa
Goniri
Damasak
Sabon Pegi
Fikhayel
Pakka
Jaji Maji
Nayinawa
Yelwa
Ashigashiya
Mubi Fussami
Gamadadi
Ngoshe
Old Maiduguri
Damagum A
Asheikri 2
Michika 2Michika 2
Katuzu
Lokuwa
Jambutu
Bulabulin
Gwadabawa
Nglaiwa
Madagali
Njiwaji Gwange
Sarkin Hausawa
Gamboru BTunokalia
Makama A
Galdimari
Sangassumi
Dogon Nini
Gwapopolok
Sabon Gari
Sulumthla
Numan 2
Hausari
Zango
YaleMalari
Fune
Biu
Bama
Song
Toungo
Fufore
Damboa
Konduga
Kaga
Kukawa
Tarmua
Gujba
Mafa
Jada
Fika
Bursari
Marte
Geidam
Hong
AbadamYusufari
Magumeri
Gubio
Gwoza
Yunusari
Jakusko
Mobbar
Gulani
Ganye
Gombi
Hawul
Dikwa
Nganzai
Guzamala
Ngala
Damaturu
Demsa
Maiha
Chibok
Jere
Maiduguri
Monguno
Bayo
Kala/Balge
Girei
Askira/Uba
Shani
Mayo-Belwa
Machina
Shelleng
KarasuwaNguru
Nangere
Lamurde
Numan
Guyuk
Bade
Michika
Madagali
Yola South Yola North
Mubi North
Bade
Potiskum
Kwaya Kusar
Mubi South
ADAMAWA
GOMBE
BAUCHI
YOBE
BORNO
TARABA
Map 1: LGA Coverage of DTM Round 39 Assessments
Nigeria north-east zone | Displacement Report Round 39 (December 2021) | A9
445
573
688 657749
987
1,2721,350 1,331 1,342 1,339
763 751 760 760 767 772 776 779 787 794 797 797 804 807 794 795 794 794 790 790 792 791 791 791 791 791 790 791
R1 R2 R3 R4 R5 R6 R7 R8 R9 R10 R11 R12 R13 R14 R15 R16 R17 R18 R19 R20 R21 R22 R23 R24 R25 R26 R27 R28 R29 R30 R31 R32 R33 R34 R35 R36 R37 R38
Dec-14 Feb-15 Apr-15 Jun-15 Aug-15 Oct-15 Dec-15 Feb-16 Apr-16 Jun-16 Aug-16 Oct-16 Dec-16 Jan-17 Mar-17 May-17 Jun-17 Aug-17 Oct-17 Dec-17 Feb-18 Apr-18 Jun-18 Aug-18 Oct-18 Jan-19 May-19 Jul-19 Sep-19 Nov-19 Dec-19 Mar-20 Aug-20 Nov-20 Dec-20 Feb-21 Apr-21 Aug-21
Dec 2014 Feb 2015 Feb 2016 Jan 2017 Feb 2018 Jan 2019 Mar 2020 Feb 2021
R39
Oct-21
Figure 1: Number of wards assessed per round
Focus Group Discussion (FGD) in Isa Tonga host community Kwami ward, Jurara LGA of Gombe State © IOM Nigeria/Phoebe Awosina/ IOM 2021
Focus Group Discussion (FGD) in Gwaram host community, Misau LGA of Bauchi State © IOM Nigeria/Phoebe Awosina/ IOM 2021
Nigeria north-east zone | Displacement Report Round 39 (December 2021) | A10
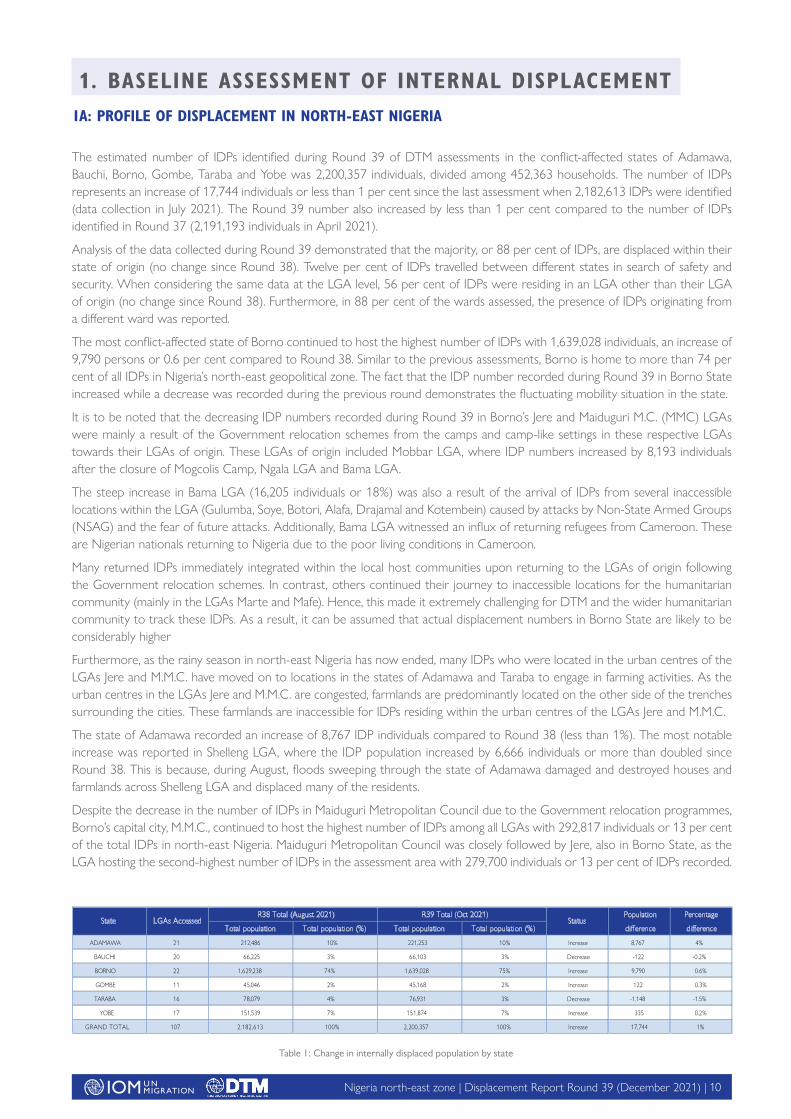
The estimated number of IDPs identified during Round 39 of DTM assessments in the conflict-affected states of Adamawa, Bauchi, Borno, Gombe, Taraba and Yobe was 2,200,357 individuals, divided among 452,363 households. The number of IDPs represents an increase of 17,744 individuals or less than 1 per cent since the last assessment when 2,182,613 IDPs were identified (data collection in July 2021). The Round 39 number also increased by less than 1 per cent compared to the number of IDPs identified in Round 37 (2,191,193 individuals in April 2021).
Analysis of the data collected during Round 39 demonstrated that the majority, or 88 per cent of IDPs, are displaced within their state of origin (no change since Round 38). Twelve per cent of IDPs travelled between different states in search of safety and security. When considering the same data at the LGA level, 56 per cent of IDPs were residing in an LGA other than their LGA of origin (no change since Round 38). Furthermore, in 88 per cent of the wards assessed, the presence of IDPs originating from a different ward was reported.
The most conflict-affected state of Borno continued to host the highest number of IDPs with 1,639,028 individuals, an increase of 9,790 persons or 0.6 per cent compared to Round 38. Similar to the previous assessments, Borno is home to more than 74 per cent of all IDPs in Nigeria’s north-east geopolitical zone. The fact that the IDP number recorded during Round 39 in Borno State increased while a decrease was recorded during the previous round demonstrates the fluctuating mobility situation in the state.
It is to be noted that the decreasing IDP numbers recorded during Round 39 in Borno’s Jere and Maiduguri M.C. (MMC) LGAs were mainly a result of the Government relocation schemes from the camps and camp-like settings in these respective LGAs towards their LGAs of origin. These LGAs of origin included Mobbar LGA, where IDP numbers increased by 8,193 individuals after the closure of Mogcolis Camp, Ngala LGA and Bama LGA.
The steep increase in Bama LGA (16,205 individuals or 18%) was also a result of the arrival of IDPs from several inaccessible locations within the LGA (Gulumba, Soye, Botori, Alafa, Drajamal and Kotembein) caused by attacks by Non-State Armed Groups (NSAG) and the fear of future attacks. Additionally, Bama LGA witnessed an influx of returning refugees from Cameroon. These are Nigerian nationals returning to Nigeria due to the poor living conditions in Cameroon.
Many returned IDPs immediately integrated within the local host communities upon returning to the LGAs of origin following the Government relocation schemes. In contrast, others continued their journey to inaccessible locations for the humanitarian community (mainly in the LGAs Marte and Mafe). Hence, this made it extremely challenging for DTM and the wider humanitarian community to track these IDPs. As a result, it can be assumed that actual displacement numbers in Borno State are likely to be considerably higher
Furthermore, as the rainy season in north-east Nigeria has now ended, many IDPs who were located in the urban centres of the LGAs Jere and M.M.C. have moved on to locations in the states of Adamawa and Taraba to engage in farming activities. As the urban centres in the LGAs Jere and M.M.C. are congested, farmlands are predominantly located on the other side of the trenches surrounding the cities. These farmlands are inaccessible for IDPs residing within the urban centres of the LGAs Jere and M.M.C.
The state of Adamawa recorded an increase of 8,767 IDP individuals compared to Round 38 (less than 1%). The most notable increase was reported in Shelleng LGA, where the IDP population increased by 6,666 individuals or more than doubled since Round 38. This is because, during August, floods sweeping through the state of Adamawa damaged and destroyed houses and farmlands across Shelleng LGA and displaced many of the residents.
Despite the decrease in the number of IDPs in Maiduguri Metropolitan Council due to the Government relocation programmes, Borno’s capital city, M.M.C., continued to host the highest number of IDPs among all LGAs with 292,817 individuals or 13 per cent of the total IDPs in north-east Nigeria. Maiduguri Metropolitan Council was closely followed by Jere, also in Borno State, as the LGA hosting the second-highest number of IDPs in the assessment area with 279,700 individuals or 13 per cent of IDPs recorded.
1A: PROFILE OF DISPLACEMENT IN NORTH-EAST NIGERIA
1. BASELINE ASSESSMENT OF INTERNAL DISPLACEMENT
Table 1: Change in internally displaced population by state
Total population Total population (%) Total population Total population (%)
ADAMAWA 21 212,486 10% 221,253 10% Increase 8,767 4%
BAUCHI 20 66,225 3% 66,103 3% Decrease -122 -0.2%
BORNO 22 1,629,238 74% 1,639,028 75% Increase 9,790 0.6%
GOMBE 11 45,046 2% 45,168 2% Increase 122 0.3%
TARABA 16 78,079 4% 76,931 3% Decrease -1,148 -1.5%
YOBE 17 151,539 7% 151,874 7% Increase 335 0.2%
GRAND TOTAL 107 2,182,613 100% 2,200,357 100% Increase 17,744 1%
Percentage
di�erenceState LGAs Accessed
R38 Total (August 2021) R39 Total (Oct 2021)Status
Population
di�erence
Nigeria north-east zone | Displacement Report Round 39 (December 2021) | A11
Bali
Toro
Fune
Ibi
Biu
Gashaka
Bama
Ningi
Song
Gassol
Alkaleri
Toungo
Fufore
Kurmi
Konduga
Damboa
Jada
Kukawa
Mafa
Tarmua
Gujba
Bauchi
Fika
Ganjuwa
Dukku
Kaga
Bursari
Kir�
Wukari
Sardauna
Yusufari
Geidam
Marte
Hong
Magumeri
Jakusko
Abadam
Akko
Karim-Lamido
Lau
Yunusari
Donga
Zaki
Gubio
GwozaDarazo
Takum
Mobbar
Gamawa
Gulani
Ganye
Ussa
Hawul
Gombi
Dikwa
Nganzai
Shira
Guzamala
Ngala
Kwami
Girei
Shani
Zing
Damaturu
Nafada
Demsa
Jere
Balanga
Ardo-Kola
Chibok
Monguno
Bayo
Funakaye
Misau
Tafawa-Balewa Billiri
Katagum
Dass
Karasuwa
Damban
Warji
Bogoro
Michika
Maiha
Askira/Uba
Yorro
Kala/Balge
Mayo-Belwa
Machina
Itas/Gadau
Shelleng
Yamaltu/Deba
Kaltungo
Giade
Nguru
Lamurde
Nangere
Numan
Bade
Guyuk
Madagali
Yola South
Shomgom
Bade
Potiskum
Mubi NorthKwaya Kusar
Jama'are
Mubi South
Jalingo
Maiduguri
Gombe
Yola North
Chad
Niger
Cameroon
Lake Chad
Jigawa
Katsina
Kano
Plateau
Nasarawa
Benue
Cross River
Hard to reach LGA
Water Bodies
IDP Population by LGA
Less than 7,026
7,027 - 20,211
20,212 - 42,605
42,606 - 146,252
More than 146,253
±ADAMAWA
GOMBE
BAUCHI
YOBE
BORNO
TARABA
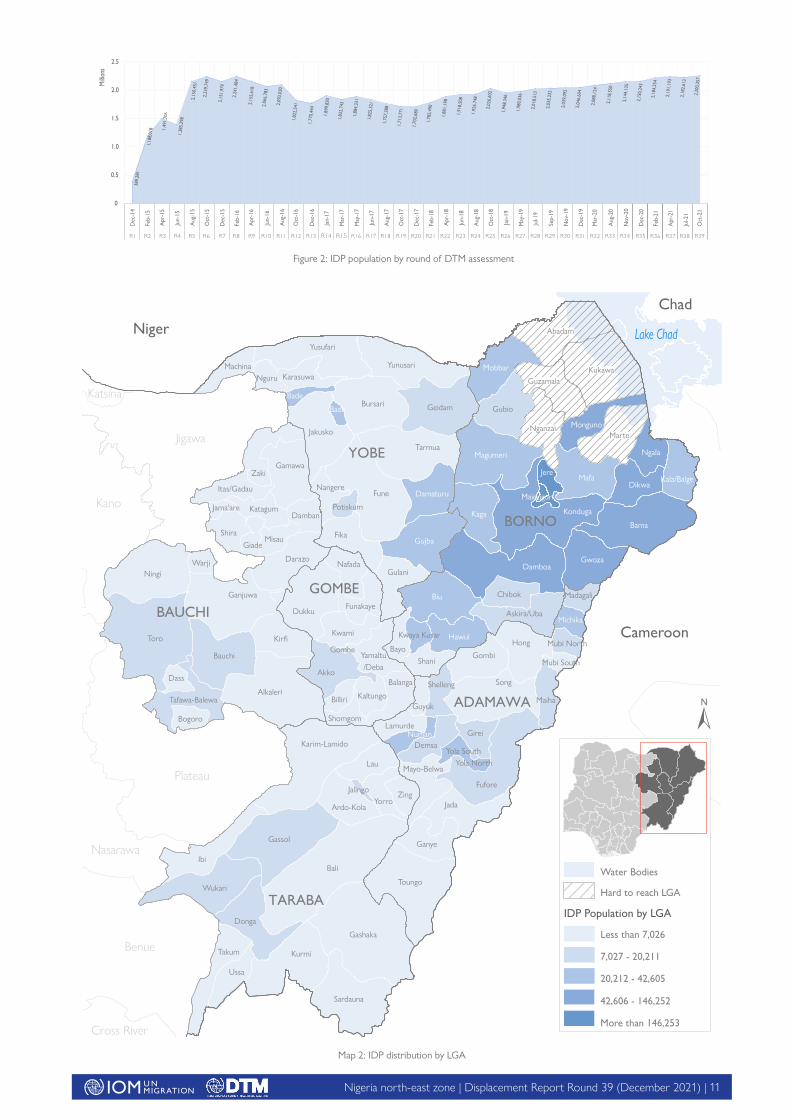
Map 2: IDP distribution by LGA
Figure 2: IDP population by round of DTM assessment
Millio
ns
1,49
1,70
6
2,15
0,45
1
2,23
9,74
9
2,15
1,97
9
2,24
1,48
4
2,15
5,61
8
2,06
6,78
3
2,09
3,03
0
1,82
2,54
1
1,77
0,44
4
1,89
9,83
0
1,83
2,74
3
1,88
4,33
1
1,82
5,32
1
1,75
7,28
8
1,71
3,77
1
1,70
2,68
0
1,78
2,49
0
1,88
1,19
8
1,91
8,50
8
1,92
6,74
8
2,02
6,60
2
1,94
8,34
6
1,98
0,03
6
2,01
8,51
3
2,03
5,23
2
2,03
9,09
2
2,04
6,60
4
2,08
8,12
4
2,11
8,55
0
0
0.5
1.0
1.5
2.0
2.5
Dec
-14
Feb-
15
Apr
-15
Jun-
15
Aug
-15
Oct
-15
Dec
-15
Feb-
16
Apr
-16
Jun-
16
Aug
-16
Oct
-16
Dec
-16
Jan-
17
Mar
-17
May
-17
Jun-
17
Aug
-17
Oct
-17
Dec
-17
Feb-
18
Apr
-18
Jun-
18
Aug
-18
Oct
-18
Jan-
19
May
-19
Jul-1
9
Sep-
19
Nov
-19
Dec
-19
Mar
-20
Aug
-20
R1 R2 R3 R4 R5 R6 R7 R8 R9 R10 R11 R12 R13 R14 R15 R16 R17 R18 R19 R20 R21 R22 R23 R24 R25 R26 R27 R28 R29 R30 R31 R32 R33
Nov
-20
R34
Dec
-20
R35
Feb-
21
R36
Apr
-21
R37
Jul-2
1
R38
2,19
1,19
3
2,18
2,61
3
2,20
0,35
7
2,14
4,13
5
2,15
0,24
3
2,18
4,25
4
389,
281
1,18
8,01
8
1,38
5,29
8
Oct
-21
R39
Nigeria north-east zone | Displacement Report Round 39 (December 2021) | A12
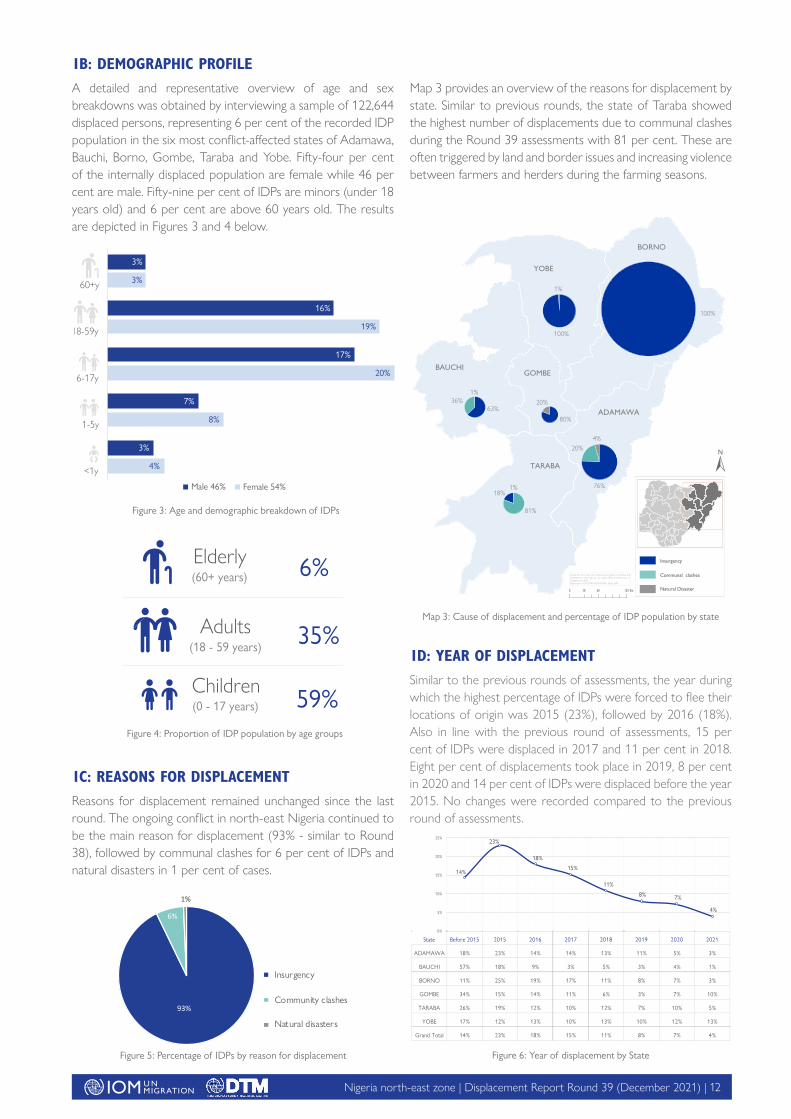
1C: REASONS FOR DISPLACEMENTReasons for displacement remained unchanged since the last round. The ongoing conflict in north-east Nigeria continued to be the main reason for displacement (93% - similar to Round 38), followed by communal clashes for 6 per cent of IDPs and natural disasters in 1 per cent of cases.
1B: DEMOGRAPHIC PROFILEA detailed and representative overview of age and sex breakdowns was obtained by interviewing a sample of 122,644 displaced persons, representing 6 per cent of the recorded IDP population in the six most conflict-affected states of Adamawa, Bauchi, Borno, Gombe, Taraba and Yobe. Fifty-four per cent of the internally displaced population are female while 46 per cent are male. Fifty-nine per cent of IDPs are minors (under 18 years old) and 6 per cent are above 60 years old. The results are depicted in Figures 3 and 4 below.
Figure 4: Proportion of IDP population by age groups
6%
35%
59%
Adults(18 - 59 years)
Elderly(60+ years)
Children(0 - 17 years)
Figure 3: Age and demographic breakdown of IDPs
4%
8%
20%
19%
3%
3%
7%
17%
16%
3%
Female 54%Male 46%
<1y
1-5y
6-17y
60+y
18-59y
Figure 5: Percentage of IDPs by reason for displacement
ADAMAWA
4%
TARABA
1%18%
BAUCHI
36%1%
76%
20%
81%
63%
GOMBE
20%
80%
YOBE
100%
1%
BORNO
100%
Insurgency
Natural Disaster
Communal clashes
±
Disclaimer: This map is for illustration purposes only. Names and boundaries in this map do not imply o�cial endorsement or acceptance by IOMData source: IOM DTM (NE RXXXIX), HDX, ESRI
0 60 12030 Km
Map 3: Cause of displacement and percentage of IDP population by state
Map 3 provides an overview of the reasons for displacement by state. Similar to previous rounds, the state of Taraba showed the highest number of displacements due to communal clashes during the Round 39 assessments with 81 per cent. These are often triggered by land and border issues and increasing violence between farmers and herders during the farming seasons.
1D: YEAR OF DISPLACEMENT
Similar to the previous rounds of assessments, the year during which the highest percentage of IDPs were forced to flee their locations of origin was 2015 (23%), followed by 2016 (18%). Also in line with the previous round of assessments, 15 per cent of IDPs were displaced in 2017 and 11 per cent in 2018. Eight per cent of displacements took place in 2019, 8 per cent in 2020 and 14 per cent of IDPs were displaced before the year 2015. No changes were recorded compared to the previous round of assessments.
Figure 6: Year of displacement by State
State Before 2015 2015 2016 2017 2018 2019 2020 2021
ADAMAWA 18% 23% 14% 14% 13% 11% 5% 3%
BAUCHI 57% 18% 9% 3% 5% 3% 4% 1%
BORNO 11% 25% 19% 17% 11% 8% 7% 3%
GOMBE 34% 15% 14% 11% 6% 3% 7% 10%
TARABA 26% 19% 12% 10% 12% 7% 10% 5%
YOBE 17% 12% 13% 10% 13% 10% 12% 13%
Grand Total 14% 23% 18% 15% 11% 8% 7% 4%
14%
23%
18%
15%
11%
8% 7%
4%
0%
5%
10%
15%
20%
25%
93%
6%
1%
Insurgency
Community clashes
Natural disasters
Nigeria north-east zone | Displacement Report Round 39 (December 2021) | A13
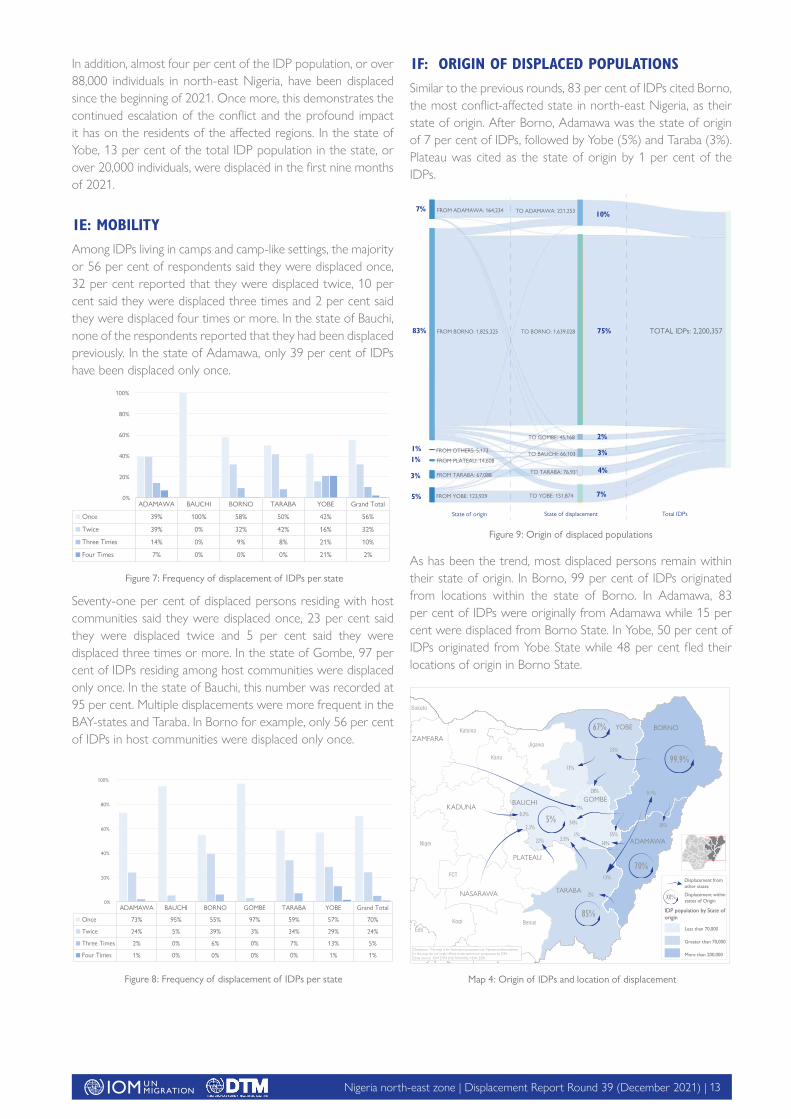
1F: ORIGIN OF DISPLACED POPULATIONSSimilar to the previous rounds, 83 per cent of IDPs cited Borno, the most conflict-affected state in north-east Nigeria, as their state of origin. After Borno, Adamawa was the state of origin of 7 per cent of IDPs, followed by Yobe (5%) and Taraba (3%). Plateau was cited as the state of origin by 1 per cent of the IDPs.
As has been the trend, most displaced persons remain within their state of origin. In Borno, 99 per cent of IDPs originated from locations within the state of Borno. In Adamawa, 83 per cent of IDPs were originally from Adamawa while 15 per cent were displaced from Borno State. In Yobe, 50 per cent of IDPs originated from Yobe State while 48 per cent fled their locations of origin in Borno State.
In addition, almost four per cent of the IDP population, or over 88,000 individuals in north-east Nigeria, have been displaced since the beginning of 2021. Once more, this demonstrates the continued escalation of the conflict and the profound impact it has on the residents of the affected regions. In the state of Yobe, 13 per cent of the total IDP population in the state, or over 20,000 individuals, were displaced in the first nine months of 2021.
1E: MOBILITY Among IDPs living in camps and camp-like settings, the majority or 56 per cent of respondents said they were displaced once, 32 per cent reported that they were displaced twice, 10 per cent said they were displaced three times and 2 per cent said they were displaced four times or more. In the state of Bauchi, none of the respondents reported that they had been displaced previously. In the state of Adamawa, only 39 per cent of IDPs have been displaced only once.
Seventy-one per cent of displaced persons residing with host communities said they were displaced once, 23 per cent said they were displaced twice and 5 per cent said they were displaced three times or more. In the state of Gombe, 97 per cent of IDPs residing among host communities were displaced only once. In the state of Bauchi, this number was recorded at 95 per cent. Multiple displacements were more frequent in the BAY-states and Taraba. In Borno for example, only 56 per cent of IDPs in host communities were displaced only once.
ADAMAWA BAUCHI BORNO TARABA YOBE Grand Total
Once 39% 100% 58% 50% 42% 56%
Twice 39% 0% 32% 42% 16% 32%
Three Times 14% 0% 9% 8% 21% 10%
Four Times 7% 0% 0% 0% 21% 2%
0%
20%
40%
60%
80%
100%
Figure 7: Frequency of displacement of IDPs per state
ADAMAWA BAUCHI BORNO GOMBE TARABA YOBE Grand Total
Once 73% 95% 55% 97% 59% 57% 70%
Twice 24% 5% 39% 3% 34% 29% 24%
Three Times 2% 0% 6% 0% 7% 13% 5%
Four Times 1% 0% 0% 0% 0% 1% 1%
0%
20%
40%
60%
80%
100%
Figure 8: Frequency of displacement of IDPs per state
83% 75%
10%
2%
3%
4%
7%
7%
1%1%
3%
5%
State of displacementState of origin Total IDPs
TOTAL IDPs: 2,200,357TO BORNO: 1,639,028
TO ADAMAWA: 221,253
TO GOMBE: 45,168
TO BAUCHI: 66,103
TO TARABA: 76,931
TO YOBE: 151,874
FROM ADAMAWA: 164,234
FROM BORNO: 1,825,325
FROM PLATEAU: 14,608
FROM OTHERS: 5,173
FROM YOBE: 123,929
FROM TARABA: 67,088
Figure 9: Origin of displaced populations
Niger
BORNO
TARABA
BAUCHI
Kogi
KADUNA
Edo
ZAMFARA
Kano
ADAMAWA
Jigawa
PLATEAU
NASARAWA
Benue
Katsina
Sokoto
GOMBE
Cross River
Edo
Ebonyi
FCT
Niger
70%
85%
99.9%
67%
2%
13%
2.5%1%
0.1%
16%55%
2.3%
22%
30%
33%
5%0.2%
1%
28%
13%
54%
YOBE
Displacement from other states
Displacement within states of Origin
IDP population by State of origin
Less than 70,000
Greater than 70,000
More than 200,000
XX%
Disclaimer: This map is for illustration purposes only. Names and boundaries in this map do not imply o�cial endorsement or acceptance by IOM.Data source: IOM DTM (NE RXXXIX), HDX, ESRI
Map 4: Origin of IDPs and location of displacement
Nigeria north-east zone | Displacement Report Round 39 (December 2021) | A14
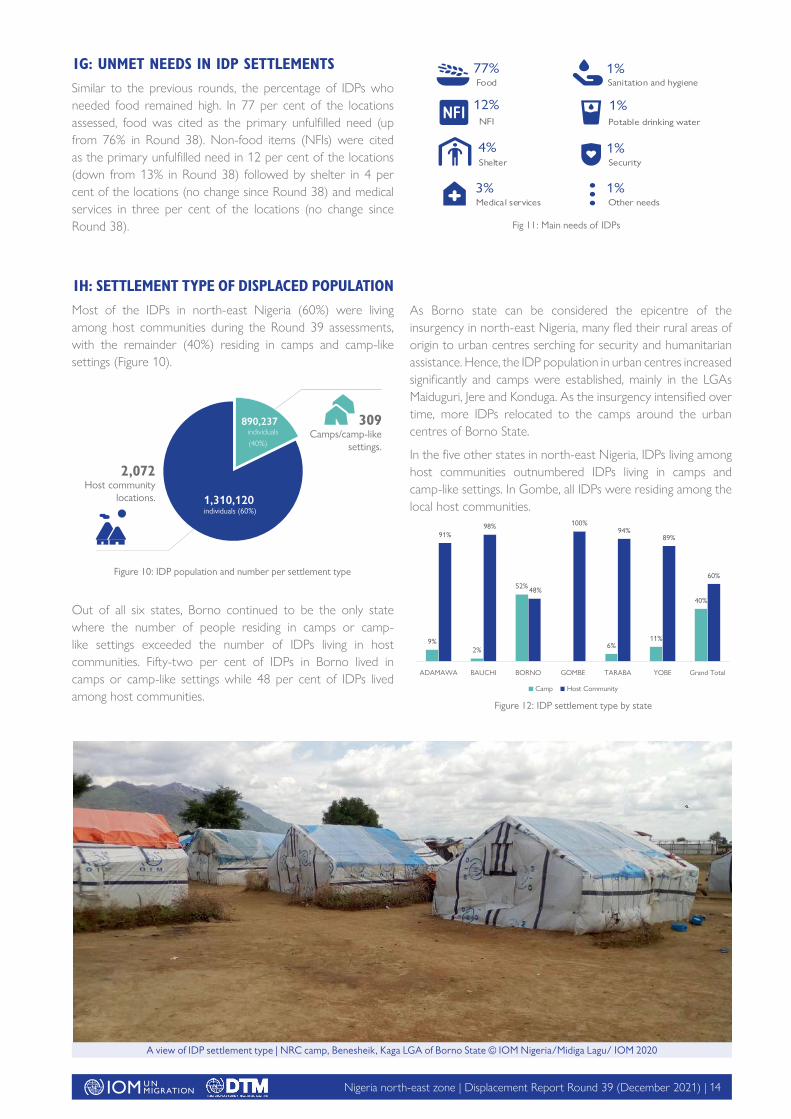
As Borno state can be considered the epicentre of the insurgency in north-east Nigeria, many fled their rural areas of origin to urban centres serching for security and humanitarian assistance. Hence, the IDP population in urban centres increased significantly and camps were established, mainly in the LGAs Maiduguri, Jere and Konduga. As the insurgency intensified over time, more IDPs relocated to the camps around the urban centres of Borno State.
In the five other states in north-east Nigeria, IDPs living among host communities outnumbered IDPs living in camps and camp-like settings. In Gombe, all IDPs were residing among the local host communities.
1G: UNMET NEEDS IN IDP SETTLEMENTSSimilar to the previous rounds, the percentage of IDPs who needed food remained high. In 77 per cent of the locations assessed, food was cited as the primary unfulfilled need (up from 76% in Round 38). Non-food items (NFIs) were cited as the primary unfulfilled need in 12 per cent of the locations (down from 13% in Round 38) followed by shelter in 4 per cent of the locations (no change since Round 38) and medical services in three per cent of the locations (no change since Round 38).
1H: SETTLEMENT TYPE OF DISPLACED POPULATIONMost of the IDPs in north-east Nigeria (60%) were living among host communities during the Round 39 assessments, with the remainder (40%) residing in camps and camp-like settings (Figure 10).
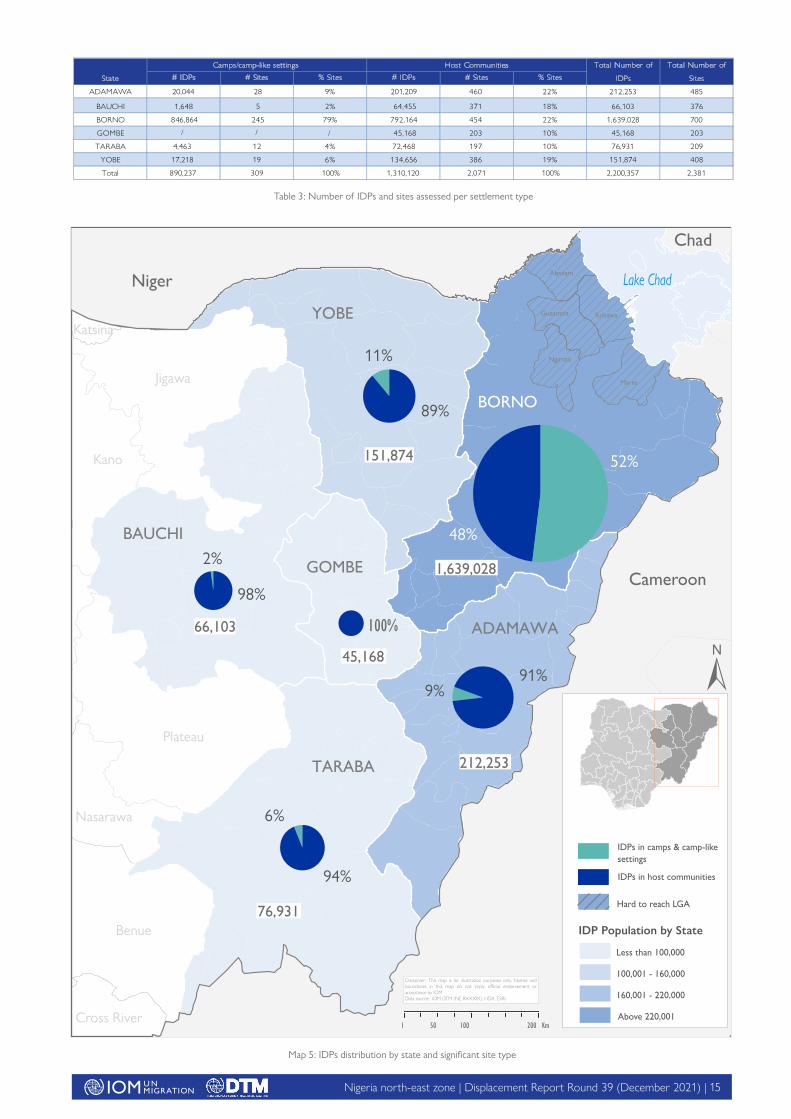
Out of all six states, Borno continued to be the only state where the number of people residing in camps or camp-like settings exceeded the number of IDPs living in host communities. Fifty-two per cent of IDPs in Borno lived in camps or camp-like settings while 48 per cent of IDPs lived among host communities.
Other needs
Security
Potable drinking water
Sanitation and hygiene
Medical services
Shelter
NFI
Food77%
12%
4%
3% 1%
1%
1%
1%
309Camps/camp-like
settings.
2,072 Host community
locations. 1,310,120 individuals (60%)
890,237 individuals
(40%)
Figure 10: IDP population and number per settlement type
Figure 12: IDP settlement type by state
9%2%
52%
6%11%
40%
91%98%
48%
100%94%
89%
60%
ADAMAWA BAUCHI BORNO GOMBE TARABA YOBE Grand Total
Camp Host Community
A view of IDP settlement type | NRC camp, Benesheik, Kaga LGA of Borno State © IOM Nigeria/Midiga Lagu/ IOM 2020
Fig 11: Main needs of IDPs
Nigeria north-east zone | Displacement Report Round 39 (December 2021) | A15
Jigawa
Katsina
Kano
Plateau
Nasarawa
Benue
Cross River
Niger
Cameroon
Lake Chad
Nganzai
Marte
Abadam
KukawaGuzamala
±
89%
11%
YOBE
151,874
BORNO
52%
48%
91%9%
ADAMAWA
TARABA
6%
94%
100%
GOMBE
98%
2%BAUCHI
66,103
1,639,028
212,253
76,931
45,168
Hard to reach LGA
Less than 100,000
100,001 - 160,000
160,001 - 220,000
Above 220,001
IDPs in camps & camp-like settings
IDPs in host communities
IDP Population by State
0 100 20050 Km
Grand Total
Disclaimer: This map is for illustration purposes only. Names and boundaries in this map do not imply o�cial endorsement or acceptance by IOMData source: IOM DTM (NE RXXXIX), HDX, ESRI
Chad
Lake Chad
Map 5: IDPs distribution by state and significant site type
# IDPs # Sites % Sites # IDPs # Sites % Sites
ADAMAWA 20,044 28 9% 201,209 460 22% 212,253 485
BAUCHI 1,648 5 2% 64,455 371 18% 66,103 376
BORNO 846,864 245 79% 792,164 454 22% 1,639,028 700
GOMBE / 45,168 203 10% 45,168 203
TARABA 4,463
/ /
12 4% 72,468 197 10% 76,931 209
YOBE 17,218 19 6% 134,656 386 19% 151,874 408
Total 890,237 309 100% 1,310,120 2,071 100% 2,200,357 2,381
State
Camps/camp-like settings Host Communities Total Number of
IDPs
Total Number of
Sites
Table 3: Number of IDPs and sites assessed per settlement type
Nigeria north-east zone | Displacement Report Round 39 (December 2021) | A16
The majority of camps and camp-like settings were located on publicly owned land (57%), followed by private property (43%) and ancestral ground (1%). Most IDPs living with host communities resided in private buildings (88%). Eight per cent were dwelling in public structures and 4 per cent in ancestral homes.
41%58%
1%
28%
72%
Transitional Centre
Camp
Collective Settlement/Centre
Planned
Spontaneous
Site Classification
IDP Population by Settlement Type
Site Type
Camp/camp-like settings Host Community
Land ownership
40% 60%
Land ownership
1%
43%
57%
Ancestral
Private
Public/Government
4%
7%
88%
Ancestral
Private building
Public/Government
Figure 15: IDP population by settlement type
2A: LOCATION AND NUMBER OF IDPs
2B: SETTLEMENT CLASSIFICATIONSeventy-two per cent of the camps/camp-like settings were classified as spontaneous, while 28 per cent were planned. Most of them were categorised as collective settlement/centres (59%), while others were camps (41%). Only El-Miskin camp II in Old Maiduguri, Jere LGA, was considered a transitional centre.
Fig 13: Type of sectoral support reported in percentage of camps/camp-like settings
No Yes
WASH 71%
Shelter 67%
NFI 67%
Protection 61%
Food 58%
Education 43%
Health 42%
Livelihood 40%
CCCM 40%
Fig 14: Type of sectoral support reported in percentage of host communities
Education 80%
Protection 76%
Health 76%
Food 75%
NFI 67%
Livelihood 55%
Shelter 54%
WASH 45%
2. SITE ASSESMENTS AND SECTORAL NEEDS OF IDPS
The DTM Round 39 site assessments were conducted in 2,381 locations (up from 2,380 locations in Round 38). These locations included camps/camp-like settings and locations where displaced persons lived with local host communities. The purpose of the site assessments was to understand better the gaps in services provided and the needs of the affected population.
These assessed locations included 309 (similar to Round 38) camps/camp-like settings and 2,072 locations where IDPs resided with host communities (up from 2,071 locations in Round 38). The graphic below illustrates the percentage of a specific type of sectoral support reported in camps/camp-like settings and host communities, respectively.
Nigeria north-east zone | Displacement Report Round 39 (December 2021) | A17
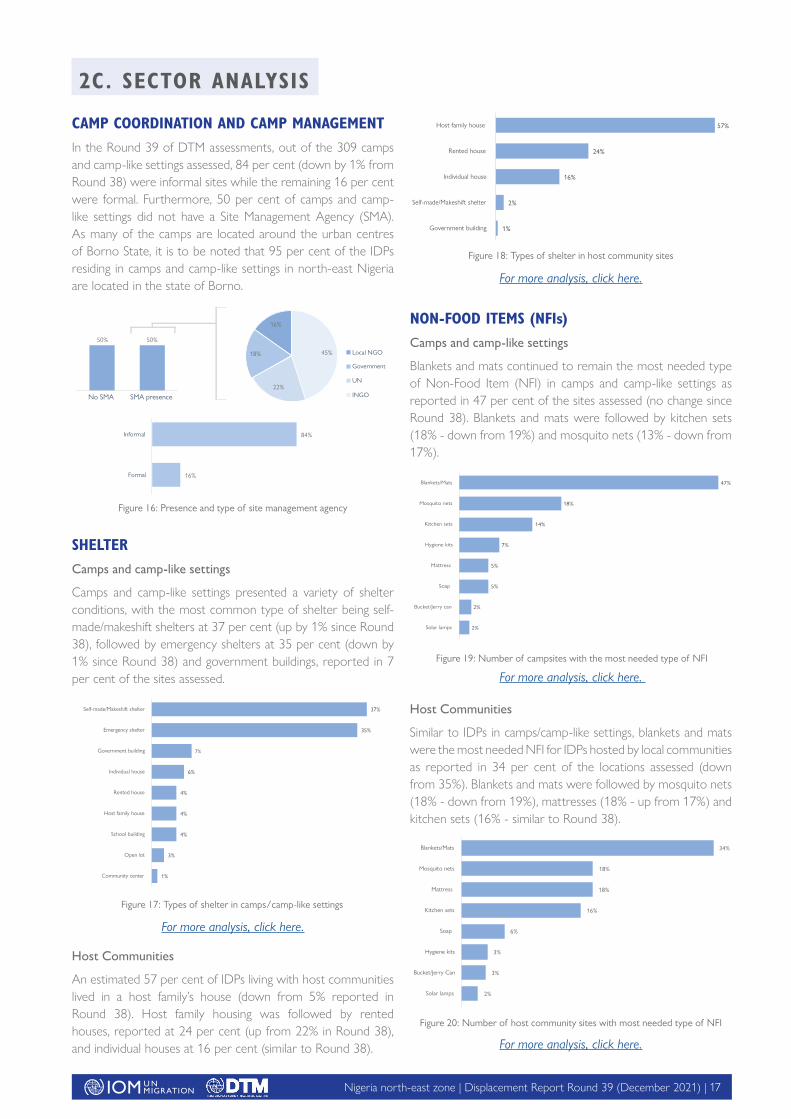
CAMP COORDINATION AND CAMP MANAGEMENTIn the Round 39 of DTM assessments, out of the 309 camps and camp-like settings assessed, 84 per cent (down by 1% from Round 38) were informal sites while the remaining 16 per cent were formal. Furthermore, 50 per cent of camps and camp-like settings did not have a Site Management Agency (SMA). As many of the camps are located around the urban centres of Borno State, it is to be noted that 95 per cent of the IDPs residing in camps and camp-like settings in north-east Nigeria are located in the state of Borno.
SHELTERCamps and camp-like settings
Camps and camp-like settings presented a variety of shelter conditions, with the most common type of shelter being self-made/makeshift shelters at 37 per cent (up by 1% since Round 38), followed by emergency shelters at 35 per cent (down by 1% since Round 38) and government buildings, reported in 7 per cent of the sites assessed.
For more analysis, click here.
Host Communities
An estimated 57 per cent of IDPs living with host communities lived in a host family’s house (down from 5% reported in Round 38). Host family housing was followed by rented houses, reported at 24 per cent (up from 22% in Round 38), and individual houses at 16 per cent (similar to Round 38).
For more analysis, click here.
NON-FOOD ITEMS (NFIs)Camps and camp-like settings
Blankets and mats continued to remain the most needed type of Non-Food Item (NFI) in camps and camp-like settings as reported in 47 per cent of the sites assessed (no change since Round 38). Blankets and mats were followed by kitchen sets (18% - down from 19%) and mosquito nets (13% - down from 17%).
For more analysis, click here.
Host Communities
Similar to IDPs in camps/camp-like settings, blankets and mats were the most needed NFI for IDPs hosted by local communities as reported in 34 per cent of the locations assessed (down from 35%). Blankets and mats were followed by mosquito nets (18% - down from 19%), mattresses (18% - up from 17%) and kitchen sets (16% - similar to Round 38).
For more analysis, click here.
Figure 16: Presence and type of site management agency
16%
45%
22%
18% Local NGO
UN
Government
INGO
50%50%
No SMA SMA presence
16%
84%
Formal
Informal
Figure 17: Types of shelter in camps/camp-like settings
1%
3%
4%
4%
4%
6%
7%
35%
37%
Community center
Open lot
School building
Host family house
Rented house
Individual house
Government building
Emergency shelter
Self-made/Makeshift shelter
Figure 19: Number of campsites with the most needed type of NFI
2%
2%
5%
5%
7%
14%
18%
47%
Solar lamps
Bucket/Jerry can
Soap
Mattress
Hygiene kits
Kitchen sets
Mosquito nets
Blankets/Mats
Figure 18: Types of shelter in host community sites
1%
2%
16%
24%
57%
Government building
Self-made/Makeshift shelter
Individual house
Rented house
Host family house
2C. SECTOR ANALYSIS
Figure 20: Number of host community sites with most needed type of NFI
2%
3%
3%
6%
16%
18%
18%
34%
Solar lamps
Bucket/Jerry Can
Hygiene kits
Soap
Kitchen sets
Mattress
Mosquito nets
Blankets/Mats
Nigeria north-east zone | Displacement Report Round 39 (December 2021) | A18
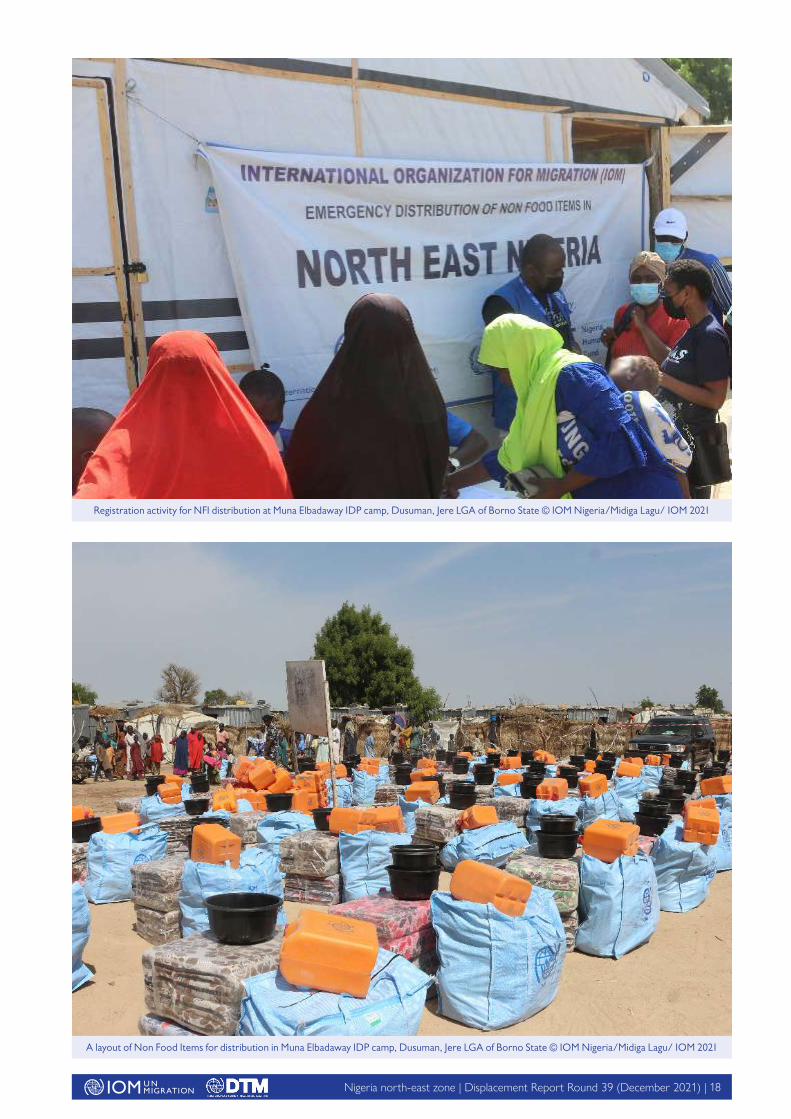
A layout of Non Food Items for distribution in Muna Elbadaway IDP camp, Dusuman, Jere LGA of Borno State © IOM Nigeria/Midiga Lagu/ IOM 2021
Registration activity for NFI distribution at Muna Elbadaway IDP camp, Dusuman, Jere LGA of Borno State © IOM Nigeria/Midiga Lagu/ IOM 2021
Nigeria north-east zone | Displacement Report Round 39 (December 2021) | A19
Host Communities
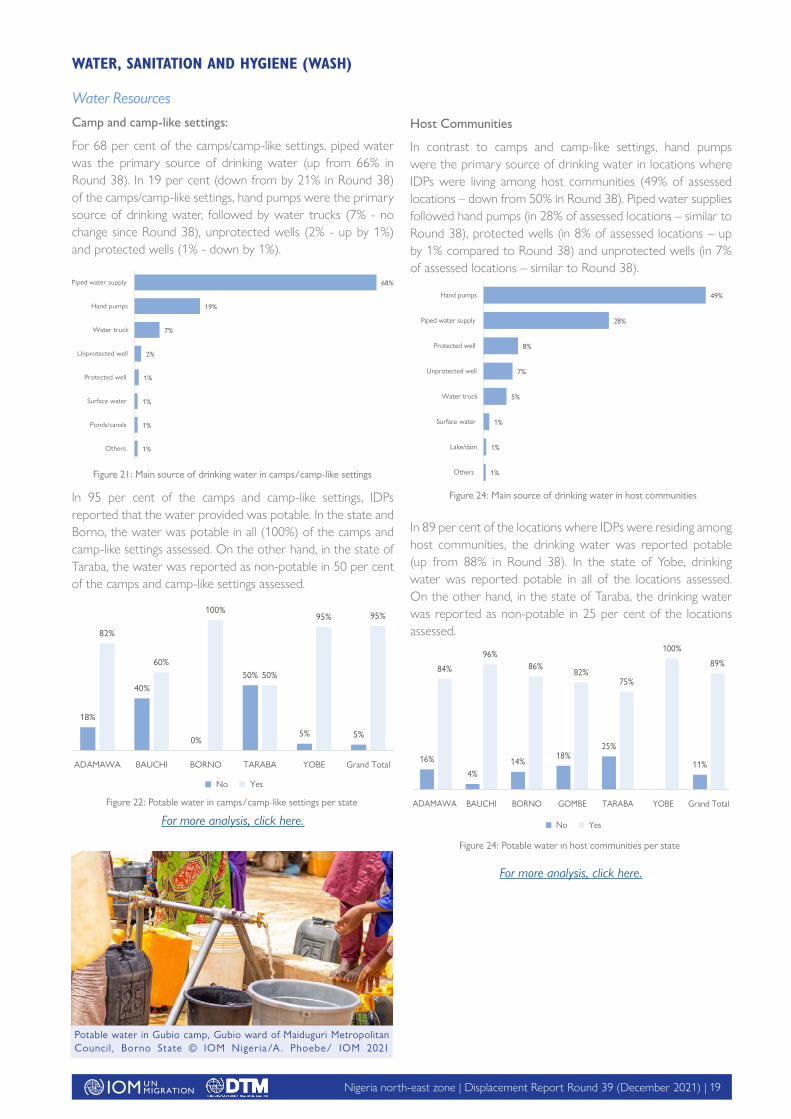
In contrast to camps and camp-like settings, hand pumps were the primary source of drinking water in locations where IDPs were living among host communities (49% of assessed locations – down from 50% in Round 38). Piped water supplies followed hand pumps (in 28% of assessed locations – similar to Round 38), protected wells (in 8% of assessed locations – up by 1% compared to Round 38) and unprotected wells (in 7% of assessed locations – similar to Round 38).
In 89 per cent of the locations where IDPs were residing among host communities, the drinking water was reported potable (up from 88% in Round 38). In the state of Yobe, drinking water was reported potable in all of the locations assessed. On the other hand, in the state of Taraba, the drinking water was reported as non-potable in 25 per cent of the locations assessed.
For more analysis, click here.
WATER, SANITATION AND HYGIENE (WASH)
Water ResourcesCamp and camp-like settings:
For 68 per cent of the camps/camp-like settings, piped water was the primary source of drinking water (up from 66% in Round 38). In 19 per cent (down from by 21% in Round 38) of the camps/camp-like settings, hand pumps were the primary source of drinking water, followed by water trucks (7% - no change since Round 38), unprotected wells (2% - up by 1%) and protected wells (1% - down by 1%).
In 95 per cent of the camps and camp-like settings, IDPs reported that the water provided was potable. In the state and Borno, the water was potable in all (100%) of the camps and camp-like settings assessed. On the other hand, in the state of Taraba, the water was reported as non-potable in 50 per cent of the camps and camp-like settings assessed.
For more analysis, click here.
Figure 21: Main source of drinking water in camps/camp-like settings
1%
1%
1%
1%
2%
7%
19%
68%
Others
Ponds/canals
Surface water
Protected well
Unprotected well
Water truck
Hand pumps
Piped water supply
Figure 22: Potable water in camps/camp-like settings per state
18%
40%
0%
50%
5% 5%
82%
60%
100%
50%
95% 95%
ADAMAWA BAUCHI BORNO TARABA YOBE Grand Total
No Yes
Figure 24: Main source of drinking water in host communities
1%
1%
1%
5%
7%
8%
28%
49%
Others
Lake/dam
Surface water
Water truck
Unprotected well
Protected well
Piped water supply
Hand pumps
Figure 24: Potable water in host communities per state
16%
4%14%
18%25%
11%
84%
96%86%
82%75%
100%
89%
ADAMAWA BAUCHI BORNO GOMBE TARABA YOBE Grand Total
No Yes
Potable water in Gubio camp, Gubio ward of Maiduguri Metropolitan Council, Borno State © IOM Nigeria/A. Phoebe/ IOM 2021
Nigeria north-east zone | Displacement Report Round 39 (December 2021) | A20
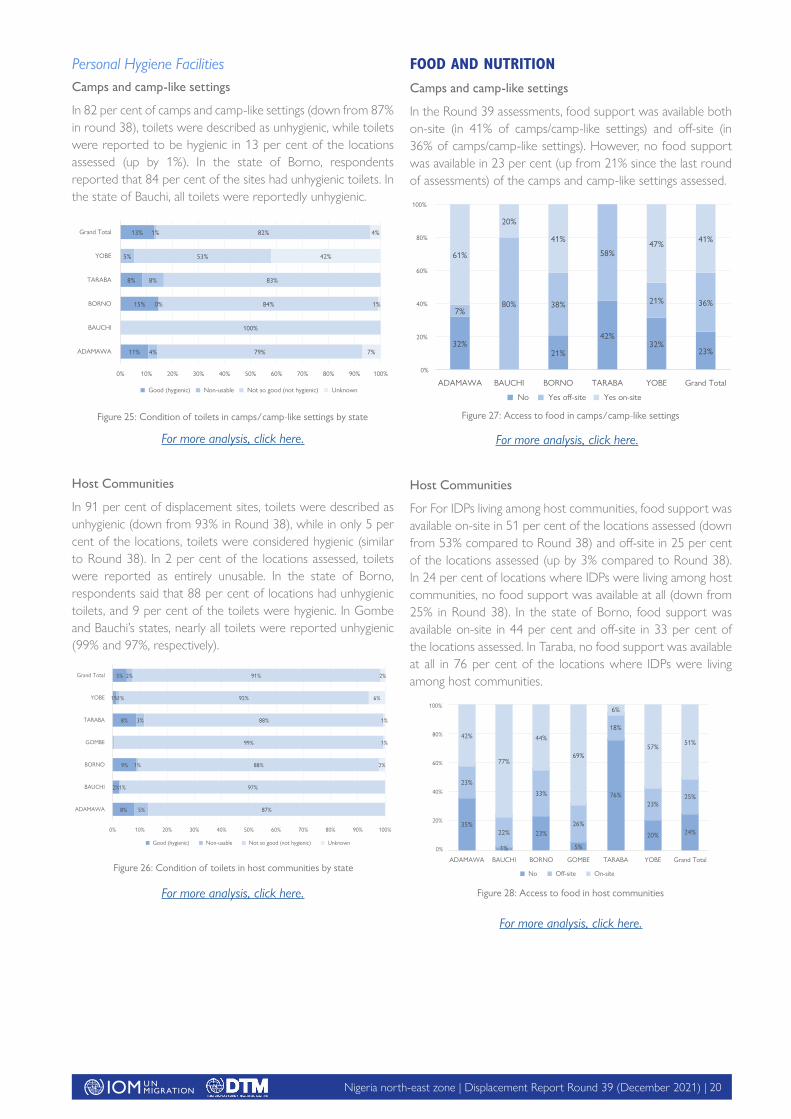
FOOD AND NUTRITION Camps and camp-like settings
In the Round 39 assessments, food support was available both on-site (in 41% of camps/camp-like settings) and off-site (in 36% of camps/camp-like settings). However, no food support was available in 23 per cent (up from 21% since the last round of assessments) of the camps and camp-like settings assessed.
Host Communities
For For IDPs living among host communities, food support was available on-site in 51 per cent of the locations assessed (down from 53% compared to Round 38) and off-site in 25 per cent of the locations assessed (up by 3% compared to Round 38). In 24 per cent of locations where IDPs were living among host communities, no food support was available at all (down from 25% in Round 38). In the state of Borno, food support was available on-site in 44 per cent and off-site in 33 per cent of the locations assessed. In Taraba, no food support was available at all in 76 per cent of the locations where IDPs were living among host communities.
For more analysis, click here.
Camps and camp-like settings
In 82 per cent of camps and camp-like settings (down from 87% in round 38), toilets were described as unhygienic, while toilets were reported to be hygienic in 13 per cent of the locations assessed (up by 1%). In the state of Borno, respondents reported that 84 per cent of the sites had unhygienic toilets. In the state of Bauchi, all toilets were reportedly unhygienic.
For more analysis, click here.
Host Communities
In 91 per cent of displacement sites, toilets were described as unhygienic (down from 93% in Round 38), while in only 5 per cent of the locations, toilets were considered hygienic (similar to Round 38). In 2 per cent of the locations assessed, toilets were reported as entirely unusable. In the state of Borno, respondents said that 88 per cent of locations had unhygienic toilets, and 9 per cent of the toilets were hygienic. In Gombe and Bauchi’s states, nearly all toilets were reported unhygienic (99% and 97%, respectively).
For more analysis, click here.
8%
2%
9%
8%
1%
5%
5%
1%
1%
3%
1%
2%
87%
97%
88%
99%
88%
92%
91%
2%
1%
1%
6%
2%
0% 10% 20% 30% 40% 50% 60% 70% 80% 90% 100%
ADAMAWA
BAUCHI
BORNO
GOMBE
TARABA
YOBE
Grand Total
Good (hygienic) Non-usable Not so good (not hygienic) Unknown
Figure 26: Condition of toilets in host communities by state
11%
15%
8%
13%
4%
0%
8%
5%
1%
79%
100%
84%
83%
53%
82%
7%
1%
42%
4%
0% 10% 20% 30% 40% 50% 60% 70% 80% 90% 100%
ADAMAWA
BAUCHI
BORNO
TARABA
YOBE
Grand Total
Good (hygienic) Non-usable Not so good (not hygienic) Unknown
Figure 25: Condition of toilets in camps/camp-like settings by state Figure 27: Access to food in camps/camp-like settings
32%21%
42%32%
23%
7%80% 38%
58%
21% 36%
61%
20%
41%47% 41%
0%
20%
40%
60%
80%
100%
ADAMAWA BAUCHI BORNO TARABA YOBE Grand Total
No Yes o�-site Yes on-site
For more analysis, click here.
35%
1%
23%
5%
76%
20% 24%
23%
22%
33%
26%
18%
23%25%
42%
77%
44%
69%
6%
57%51%
0%
20%
40%
60%
80%
100%
ADAMAWA BAUCHI BORNO GOMBE TARABA YOBE Grand Total
No O�-site On-site
Figure 28: Access to food in host communities
Personal Hygiene Facilities
Nigeria north-east zone | Displacement Report Round 39 (December 2021) | A21
HEALTHCamps and camp-like settings
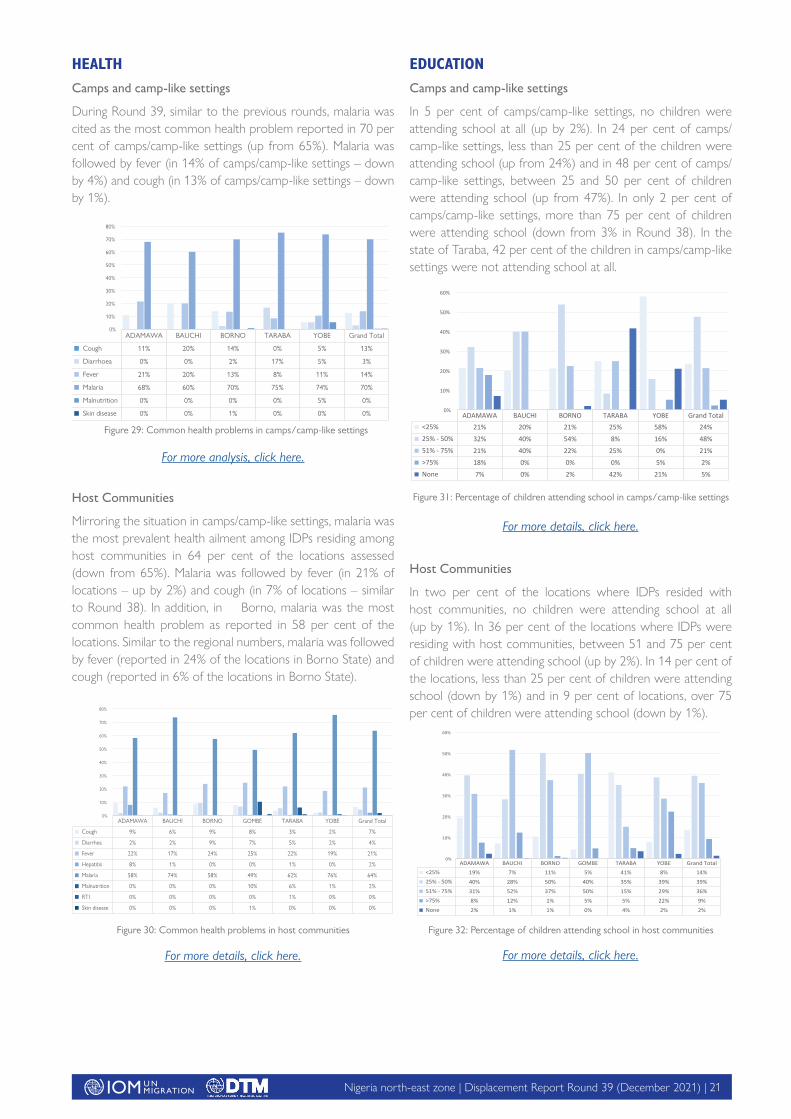
During Round 39, similar to the previous rounds, malaria was cited as the most common health problem reported in 70 per cent of camps/camp-like settings (up from 65%). Malaria was followed by fever (in 14% of camps/camp-like settings – down by 4%) and cough (in 13% of camps/camp-like settings – down by 1%).
For more analysis, click here.
Host Communities
Mirroring the situation in camps/camp-like settings, malaria was the most prevalent health ailment among IDPs residing among host communities in 64 per cent of the locations assessed (down from 65%). Malaria was followed by fever (in 21% of locations – up by 2%) and cough (in 7% of locations – similar to Round 38). In addition, in Borno, malaria was the most common health problem as reported in 58 per cent of the locations. Similar to the regional numbers, malaria was followed by fever (reported in 24% of the locations in Borno State) and cough (reported in 6% of the locations in Borno State).
Figure 29: Common health problems in camps/camp-like settings
ADAMAWA BAUCHI BORNO TARABA YOBE Grand Total
Cough 11% 20% 14% 0% 5% 13%
Diarrhoea 0% 0% 2% 17% 5% 3%
Fever 21% 20% 13% 8% 11% 14%
Malaria 68% 60% 70% 75% 74% 70%
Malnutrition 0% 0% 0% 0% 5% 0%
Skin disease 0% 0% 1% 0% 0% 0%
0%
10%
20%
30%
40%
50%
60%
70%
80%
Figure 30: Common health problems in host communities
ADAMAWA BAUCHI BORNO GOMBE TARABA YOBE Grand Total
Cough 9% 6% 9% 8% 3% 2% 7%
Diarrhea 2% 2% 9% 7% 5% 2% 4%
Fever 22% 17% 24% 25% 22% 19% 21%
Hepatitis 8% 1% 0% 0% 1% 0% 2%
Malaria 58% 74% 58% 49% 62% 76% 64%
Malnutrition 0% 0% 0% 10% 6% 1% 2%
RTI 0% 0% 0% 0% 1% 0% 0%
Skin disease 0% 0% 0% 1% 0% 0% 0%
0%
10%
20%
30%
40%
50%
60%
70%
80%
For more details, click here.
EDUCATIONCamps and camp-like settings
In 5 per cent of camps/camp-like settings, no children were attending school at all (up by 2%). In 24 per cent of camps/camp-like settings, less than 25 per cent of the children were attending school (up from 24%) and in 48 per cent of camps/camp-like settings, between 25 and 50 per cent of children were attending school (up from 47%). In only 2 per cent of camps/camp-like settings, more than 75 per cent of children were attending school (down from 3% in Round 38). In the state of Taraba, 42 per cent of the children in camps/camp-like settings were not attending school at all.
For more details, click here.
Host Communities
In two per cent of the locations where IDPs resided with host communities, no children were attending school at all (up by 1%). In 36 per cent of the locations where IDPs were residing with host communities, between 51 and 75 per cent of children were attending school (up by 2%). In 14 per cent of the locations, less than 25 per cent of children were attending school (down by 1%) and in 9 per cent of locations, over 75 per cent of children were attending school (down by 1%).
For more details, click here.
ADAMAWA BAUCHI BORNO GOMBE TARABA YOBE Grand Total <25% 19% 7% 11% 5% 41% 8% 14% 25% - 50% 40% 28% 50% 40% 35% 39% 39% 51% - 75% 31% 52% 37% 50% 15% 29% 36% >75% 8% 12% 1% 5% 5% 22% 9% None 2% 1% 1% 0% 4% 2% 2%
0%
10%
20%
30%
40%
50%
60%
Figure 32: Percentage of children attending school in host communities
ADAMAWA BAUCHI BORNO TARABA YOBE Grand Total <25% 21% 20% 21% 25% 58% 24% 25% - 50% 32% 40% 54% 8% 16% 48% 51% - 75% 21% 40% 22% 25% 0% 21% >75% 18% 0% 0% 0% 5% 2% None 7% 0% 2% 42% 21% 5%
0%
10%
20%
30%
40%
50%
60%
Figure 31: Percentage of children attending school in camps/camp-like settings
Nigeria north-east zone | Displacement Report Round 39 (December 2021) | A22
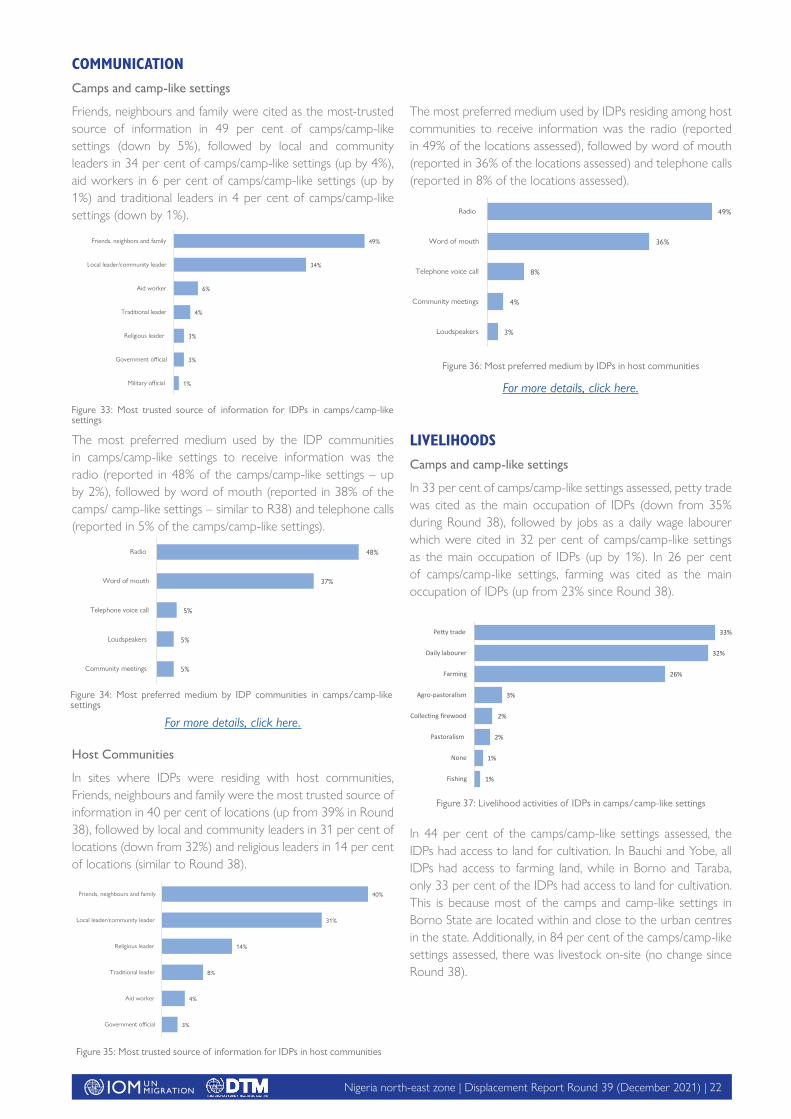
The most preferred medium used by IDPs residing among host communities to receive information was the radio (reported in 49% of the locations assessed), followed by word of mouth (reported in 36% of the locations assessed) and telephone calls (reported in 8% of the locations assessed).
For more details, click here.
LIVELIHOODSCamps and camp-like settings
In 33 per cent of camps/camp-like settings assessed, petty trade was cited as the main occupation of IDPs (down from 35% during Round 38), followed by jobs as a daily wage labourer which were cited in 32 per cent of camps/camp-like settings as the main occupation of IDPs (up by 1%). In 26 per cent of camps/camp-like settings, farming was cited as the main occupation of IDPs (up from 23% since Round 38).
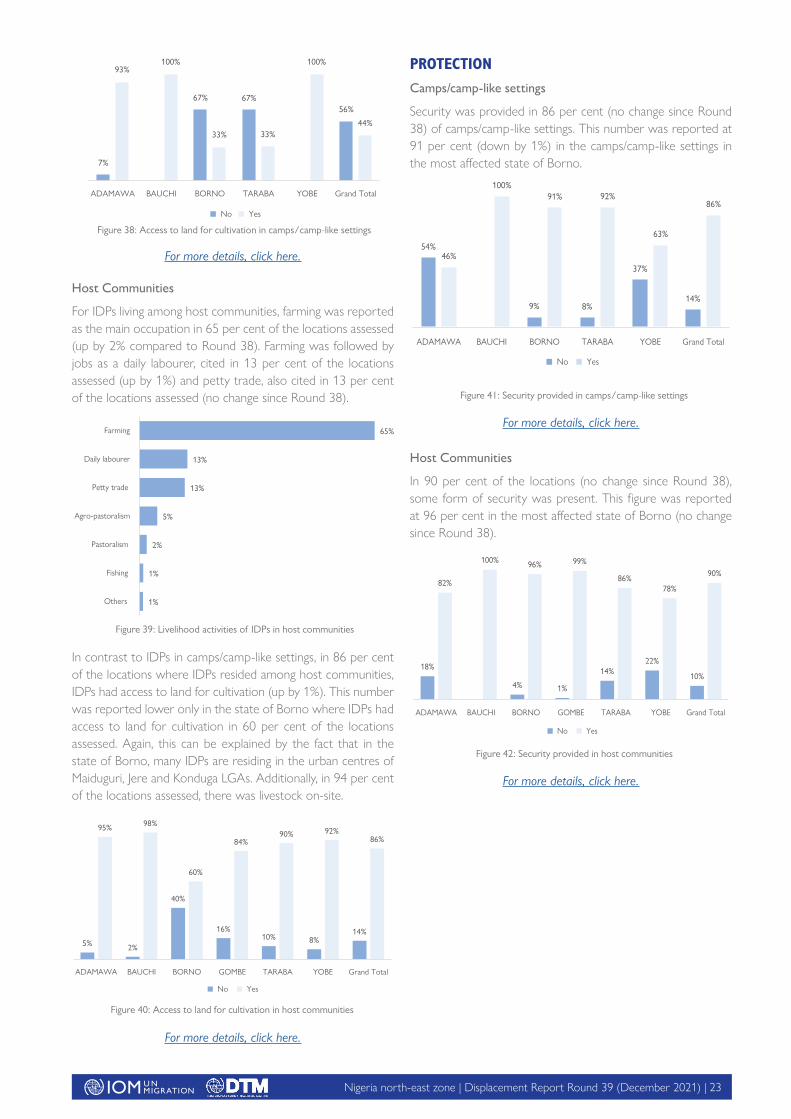
In 44 per cent of the camps/camp-like settings assessed, the IDPs had access to land for cultivation. In Bauchi and Yobe, all IDPs had access to farming land, while in Borno and Taraba, only 33 per cent of the IDPs had access to land for cultivation. This is because most of the camps and camp-like settings in Borno State are located within and close to the urban centres in the state. Additionally, in 84 per cent of the camps/camp-like settings assessed, there was livestock on-site (no change since Round 38).
COMMUNICATIONCamps and camp-like settings
Friends, neighbours and family were cited as the most-trusted source of information in 49 per cent of camps/camp-like settings (down by 5%), followed by local and community leaders in 34 per cent of camps/camp-like settings (up by 4%), aid workers in 6 per cent of camps/camp-like settings (up by 1%) and traditional leaders in 4 per cent of camps/camp-like settings (down by 1%).
The most preferred medium used by the IDP communities in camps/camp-like settings to receive information was the radio (reported in 48% of the camps/camp-like settings – up by 2%), followed by word of mouth (reported in 38% of the camps/ camp-like settings – similar to R38) and telephone calls (reported in 5% of the camps/camp-like settings).
For more details, click here.
Host Communities
In sites where IDPs were residing with host communities, Friends, neighbours and family were the most trusted source of information in 40 per cent of locations (up from 39% in Round 38), followed by local and community leaders in 31 per cent of locations (down from 32%) and religious leaders in 14 per cent of locations (similar to Round 38).
Figure 35: Most trusted source of information for IDPs in host communities
3%
4%
8%
14%
31%
40%
Government o�cial
Aid worker
Traditional leader
Religious leader
Local leader/community leader
Friends, neighbours and family
5%
5%
5%
37%
48%
Community meetings
Loudspeakers
Telephone voice call
Word of mouth
Radio
Figure 34: Most preferred medium by IDP communities in camps/camp-like settings
Figure 33: Most trusted source of information for IDPs in camps/camp-like settings
1%
3%
3%
4%
6%
34%
49%
Military o�cial
Government o�cial
Religious leader
Traditional leader
Aid worker
Local leader/community leader
Friends, neighbors and family
1%
1%
2%
2%
3%
26%
32%
33%
Fishing
None
Pastoralism
Collec�ng firewood
Agro-pastoralism
Farming
Daily labourer
Pe�y trade
Figure 37: Livelihood activities of IDPs in camps/camp-like settings
3%
4%
8%
36%
49%
Loudspeakers
Community meetings
Telephone voice call
Word of mouth
Radio
Figure 36: Most preferred medium by IDPs in host communities
Nigeria north-east zone | Displacement Report Round 39 (December 2021) | A23
PROTECTIONCamps/camp-like settings
Security was provided in 86 per cent (no change since Round 38) of camps/camp-like settings. This number was reported at 91 per cent (down by 1%) in the camps/camp-like settings in the most affected state of Borno.
For more details, click here.
Host Communities
In 90 per cent of the locations (no change since Round 38), some form of security was present. This figure was reported at 96 per cent in the most affected state of Borno (no change since Round 38).
For more details, click here.
For more details, click here.
Host Communities
For IDPs living among host communities, farming was reported as the main occupation in 65 per cent of the locations assessed (up by 2% compared to Round 38). Farming was followed by jobs as a daily labourer, cited in 13 per cent of the locations assessed (up by 1%) and petty trade, also cited in 13 per cent of the locations assessed (no change since Round 38).
In contrast to IDPs in camps/camp-like settings, in 86 per cent of the locations where IDPs resided among host communities, IDPs had access to land for cultivation (up by 1%). This number was reported lower only in the state of Borno where IDPs had access to land for cultivation in 60 per cent of the locations assessed. Again, this can be explained by the fact that in the state of Borno, many IDPs are residing in the urban centres of Maiduguri, Jere and Konduga LGAs. Additionally, in 94 per cent of the locations assessed, there was livestock on-site.
For more details, click here.
Figure 39: Livelihood activities of IDPs in host communities
1%
1%
2%
5%
13%
13%
65%
Others
Fishing
Pastoralism
Agro-pastoralism
Petty trade
Daily labourer
Farming
5% 2%
40%
16%10% 8%
14%
95% 98%
60%
84%90% 92%
86%
ADAMAWA BAUCHI BORNO GOMBE TARABA YOBE Grand Total
No Yes
Figure 40: Access to land for cultivation in host communities
54%
9% 8%
37%
14%
46%
100%91% 92%
63%
86%
ADAMAWA BAUCHI BORNO TARABA YOBE Grand Total
No Yes
Figure 41: Security provided in camps/camp-like settings
18%
4% 1%
14%22%
10%
82%
100% 96% 99%
86%78%
90%
ADAMAWA BAUCHI BORNO GOMBE TARABA YOBE Grand Total
No Yes
Figure 42: Security provided in host communities
7%
67% 67%56%
93%100%
33% 33%
100%
44%
ADAMAWA BAUCHI BORNO TARABA YOBE Grand Total
No Yes
Figure 38: Access to land for cultivation in camps/camp-like settings
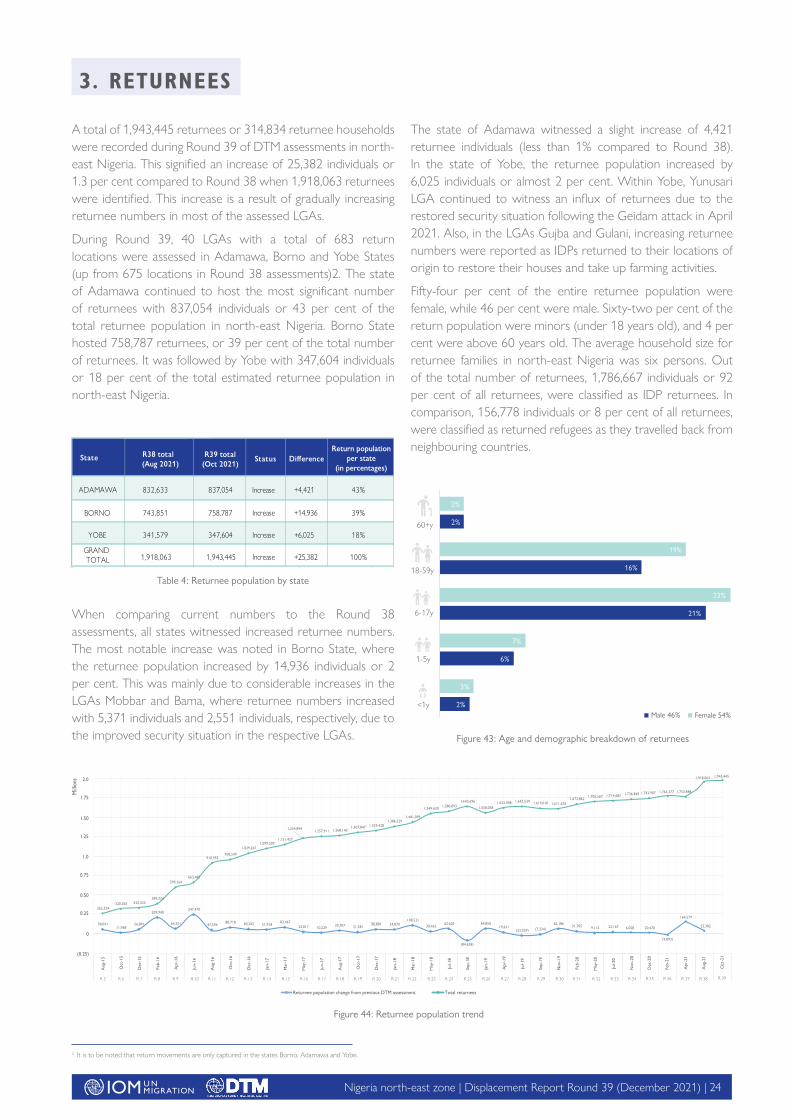
Nigeria north-east zone | Displacement Report Round 39 (December 2021) | A24
3. RETURNEES
A total of 1,943,445 returnees or 314,834 returnee households were recorded during Round 39 of DTM assessments in north-east Nigeria. This signified an increase of 25,382 individuals or 1.3 per cent compared to Round 38 when 1,918,063 returnees were identified. This increase is a result of gradually increasing returnee numbers in most of the assessed LGAs.
During Round 39, 40 LGAs with a total of 683 return locations were assessed in Adamawa, Borno and Yobe States (up from 675 locations in Round 38 assessments)2. The state of Adamawa continued to host the most significant number of returnees with 837,054 individuals or 43 per cent of the total returnee population in north-east Nigeria. Borno State hosted 758,787 returnees, or 39 per cent of the total number of returnees. It was followed by Yobe with 347,604 individuals or 18 per cent of the total estimated returnee population in north-east Nigeria.
When comparing current numbers to the Round 38 assessments, all states witnessed increased returnee numbers. The most notable increase was noted in Borno State, where the returnee population increased by 14,936 individuals or 2 per cent. This was mainly due to considerable increases in the LGAs Mobbar and Bama, where returnee numbers increased with 5,371 individuals and 2,551 individuals, respectively, due to the improved security situation in the respective LGAs.
The state of Adamawa witnessed a slight increase of 4,421 returnee individuals (less than 1% compared to Round 38). In the state of Yobe, the returnee population increased by 6,025 individuals or almost 2 per cent. Within Yobe, Yunusari LGA continued to witness an influx of returnees due to the restored security situation following the Geidam attack in April 2021. Also, in the LGAs Gujba and Gulani, increasing returnee numbers were reported as IDPs returned to their locations of origin to restore their houses and take up farming activities.
Fifty-four per cent of the entire returnee population were female, while 46 per cent were male. Sixty-two per cent of the return population were minors (under 18 years old), and 4 per cent were above 60 years old. The average household size for returnee families in north-east Nigeria was six persons. Out of the total number of returnees, 1,786,667 individuals or 92 per cent of all returnees, were classified as IDP returnees. In comparison, 156,778 individuals or 8 per cent of all returnees, were classified as returned refugees as they travelled back from neighbouring countries.
2 It is to be noted that return movements are only captured in the states Borno, Adamawa and Yobe.
Table 4: Returnee population by state
State R38 total (Aug 2021)
R39 total (Oct 2021)
Status Di�erenceReturn population
per state(in percentages)
ADAMAWA 832,633 837,054 Increase +4,421 43%
BORNO 743,851 758,787 Increase +14,936 39%
YOBE 341,579 347,604 Increase +6,025 18%
GRAND TOTAL 1,918,063 1,943,445 Increase +25,382 100%
Figure 44: Returnee population trend
R 5 R 6 R 7 R 8 R 9 R 10 R 11 R 12 R 13 R 14 R 15 R 16 R 17 R 18 R 19 R 20 R 21 R 22 R 23 R 24 R 25 R 26 R 27 R 28 R 29 R 30 R 31 R 32 R 33 R 34
58,041 11,968
56,891
209,940
64,321
247,470
47,594 80,718 60,242 51,918
83,467 23,017 10,229 39,707 21,581
56,801 54,870 108,531
30,463 62,603
(84,638)
64,850 19,631
(23,529) (7,334)62,186
31,705 9,115 22,167 6,058 20,470
262,324 320,365 332,333
389,224
599,164 663,485
910,955 958,549
1,039,267 1,099,509
1,151,427
1,234,894 1,257,911 1,268,140
1,307,847 1,329,428 1,386,229
1,441,099
1,549,630 1,580,093
1,642,696
1,558,058 1,622,908 1,642,539 1,619,010 1,611,676
1,673,862 1,705,567 1,714,682 1,736,849 1,742,907
Aug
-15
Oct
-15
Dec
-15
Feb-
16
Apr
-16
Jun-
16
Aug
-16
Oct
-16
Dec
-16
Jan-
17
Mar
-17
May
-17
Jun-
17
Aug
-17
Oct
-17
Dec
-17
Jan-
18
Mar
-18
Ma y
-18
Jul-1
8
Sep-
18
Jan-
19
Apr
-19
Jul-1
9
Sep-
19
Nov
-19
Feb-
20
May
-20
Jul-2
0
Nov
-20
R 35
Dec
-20
R 36
Feb-
21
R 37
Apr
-21
R 38
Aug
-21
R 39
Oct
-21
Milli
ons
0.50
0.75
1.0
1.50
1.25
1.75
2.0
0.25
0
(0.25)
Returnee population change from previous DTM assessment Total returnees
(9,893)
1,763,377 1,753,848
1,918,063
164,579
1,943,445
25,382
Figure 43: Age and demographic breakdown of returnees
Female 54%Male 46%2%
6%
21%
16%
2%
3%
7%
23%
19%
2%
<1y
1-5y
6-17y
18-59y
60+y
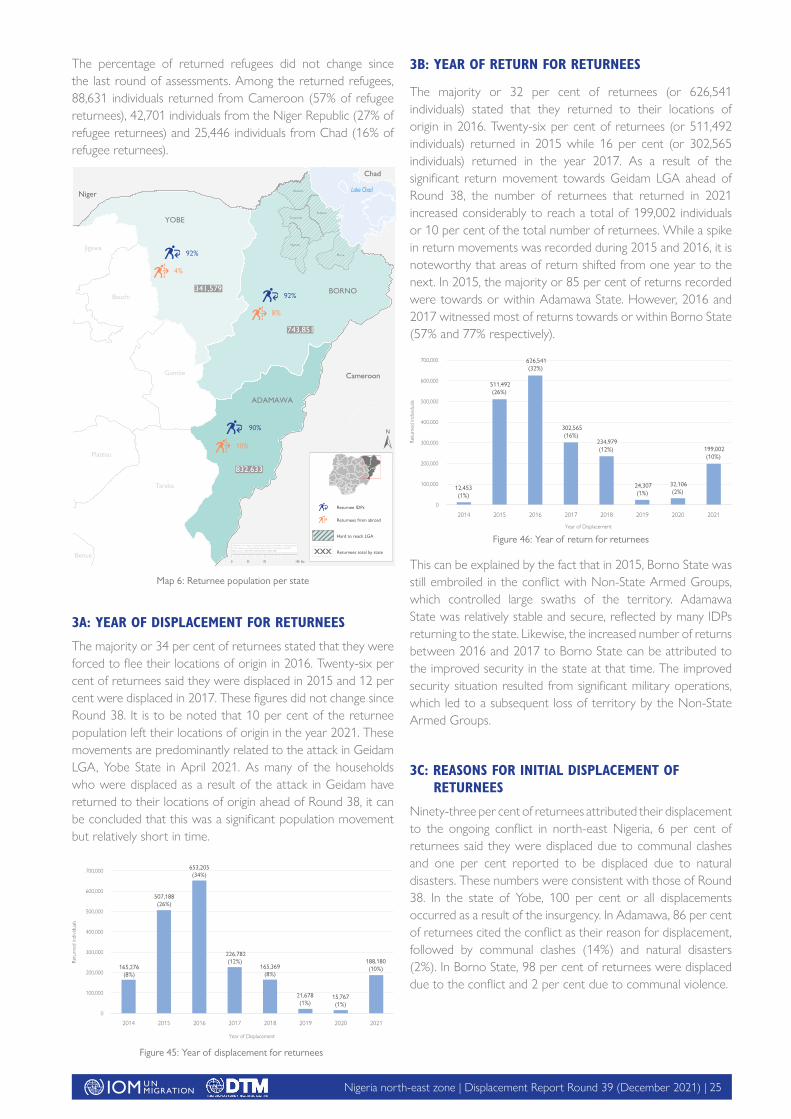
Nigeria north-east zone | Displacement Report Round 39 (December 2021) | A25
The percentage of returned refugees did not change since the last round of assessments. Among the returned refugees, 88,631 individuals returned from Cameroon (57% of refugee returnees), 42,701 individuals from the Niger Republic (27% of refugee returnees) and 25,446 individuals from Chad (16% of refugee returnees).
3A: YEAR OF DISPLACEMENT FOR RETURNEES
The majority or 34 per cent of returnees stated that they were forced to flee their locations of origin in 2016. Twenty-six per cent of returnees said they were displaced in 2015 and 12 per cent were displaced in 2017. These figures did not change since Round 38. It is to be noted that 10 per cent of the returnee population left their locations of origin in the year 2021. These movements are predominantly related to the attack in Geidam LGA, Yobe State in April 2021. As many of the households who were displaced as a result of the attack in Geidam have returned to their locations of origin ahead of Round 38, it can be concluded that this was a significant population movement but relatively short in time.
3B: YEAR OF RETURN FOR RETURNEES
The majority or 32 per cent of returnees (or 626,541 individuals) stated that they returned to their locations of origin in 2016. Twenty-six per cent of returnees (or 511,492 individuals) returned in 2015 while 16 per cent (or 302,565 individuals) returned in the year 2017. As a result of the significant return movement towards Geidam LGA ahead of Round 38, the number of returnees that returned in 2021 increased considerably to reach a total of 199,002 individuals or 10 per cent of the total number of returnees. While a spike in return movements was recorded during 2015 and 2016, it is noteworthy that areas of return shifted from one year to the next. In 2015, the majority or 85 per cent of returns recorded were towards or within Adamawa State. However, 2016 and 2017 witnessed most of returns towards or within Borno State (57% and 77% respectively).
This can be explained by the fact that in 2015, Borno State was still embroiled in the conflict with Non-State Armed Groups, which controlled large swaths of the territory. Adamawa State was relatively stable and secure, reflected by many IDPs returning to the state. Likewise, the increased number of returns between 2016 and 2017 to Borno State can be attributed to the improved security in the state at that time. The improved security situation resulted from significant military operations, which led to a subsequent loss of territory by the Non-State Armed Groups.
Figure 45: Year of displacement for returnees
165,276 (8%)
507,188 (26%)
653,205 (34%)
226,782 (12%)
165,369 (8%)
21,678 (1%)
15,767 (1%)
188,180 (10%)
0
100,000
200,000
300,000
400,000
500,000
600,000
700,000
2014 2015 2016 2017 2018 2019 2020 2021
Retu
rned
indi
vidua
ls
Year of Displacement
±
Taraba
Bauchi
Gombe
Plateau
Jigawa
Benue
92%
4%
92%
8%
90%
10%
Abadam
Chad
Niger
Cameroon
Lake Chad
0 70 14035 Km
Hard to reach LGA
Returnees total by state
Returnees from abroad
Returnee IDPs
Guzamala
Kukawa
Nganzai
Marte
YOBE
BORNO
ADAMAWA
xxxDisclaimer: This map is for illustration purposes only. Names and boundaries in this map do not imply o�cial endorsement or acceptance by IOMData source: IOM DTM (NE RXXXIX), HDX, ESRI
341,579
743,851
832,633
Map 6: Returnee population per state
Retu
rned
indi
vidua
ls
Year of Displacement
12,453(1%)
511,492(26%)
626,541(32%)
302,565(16%)
234,979(12%)
24,307(1%)
32,106(2%)
199,002(10%)
0
100,000
200,000
300,000
400,000
500,000
600,000
700,000
2014 2015 2016 2017 2018 2019 2020 2021
Figure 46: Year of return for returnees
3C: REASONS FOR INITIAL DISPLACEMENT OF RETURNEES
Ninety-three per cent of returnees attributed their displacement to the ongoing conflict in north-east Nigeria, 6 per cent of returnees said they were displaced due to communal clashes and one per cent reported to be displaced due to natural disasters. These numbers were consistent with those of Round 38. In the state of Yobe, 100 per cent or all displacements occurred as a result of the insurgency. In Adamawa, 86 per cent of returnees cited the conflict as their reason for displacement, followed by communal clashes (14%) and natural disasters (2%). In Borno State, 98 per cent of returnees were displaced due to the conflict and 2 per cent due to communal violence.
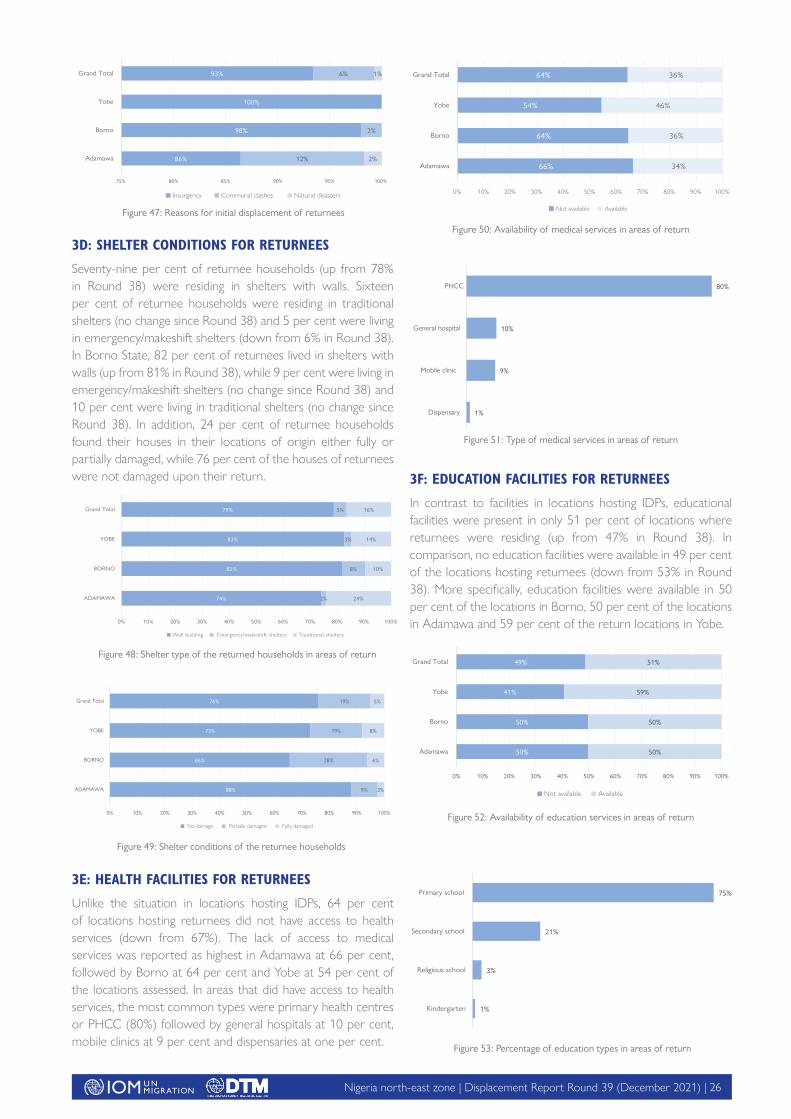
Nigeria north-east zone | Displacement Report Round 39 (December 2021) | A26
3D: SHELTER CONDITIONS FOR RETURNEES
Seventy-nine per cent of returnee households (up from 78% in Round 38) were residing in shelters with walls. Sixteen per cent of returnee households were residing in traditional shelters (no change since Round 38) and 5 per cent were living in emergency/makeshift shelters (down from 6% in Round 38). In Borno State, 82 per cent of returnees lived in shelters with walls (up from 81% in Round 38), while 9 per cent were living in emergency/makeshift shelters (no change since Round 38) and 10 per cent were living in traditional shelters (no change since Round 38). In addition, 24 per cent of returnee households found their houses in their locations of origin either fully or partially damaged, while 76 per cent of the houses of returnees were not damaged upon their return.
3E: HEALTH FACILITIES FOR RETURNEES
Unlike the situation in locations hosting IDPs, 64 per cent of locations hosting returnees did not have access to health services (down from 67%). The lack of access to medical services was reported as highest in Adamawa at 66 per cent, followed by Borno at 64 per cent and Yobe at 54 per cent of the locations assessed. In areas that did have access to health services, the most common types were primary health centres or PHCC (80%) followed by general hospitals at 10 per cent, mobile clinics at 9 per cent and dispensaries at one per cent.
3F: EDUCATION FACILITIES FOR RETURNEES
In contrast to facilities in locations hosting IDPs, educational facilities were present in only 51 per cent of locations where returnees were residing (up from 47% in Round 38). In comparison, no education facilities were available in 49 per cent of the locations hosting returnees (down from 53% in Round 38). More specifically, education facilities were available in 50 per cent of the locations in Borno, 50 per cent of the locations in Adamawa and 59 per cent of the return locations in Yobe.
Figure 51: Type of medical services in areas of return
1%
9%
10%
80%
Dispensary
Mobile clinic
General hospital
PHCC
Figure 48: Shelter type of the returned households in areas of return
74%
82%
83%
79%
2%
8%
3%
5%
24%
10%
14%
16%
0% 10% 20% 30% 40% 50% 60% 70% 80% 90% 100%
ADAMAWA
BORNO
YOBE
Grand Total
Wall building Emergency/makeshift shelters Traditional shelters
Figure 49: Shelter conditions of the returnee households
88%
66%
73%
76%
9%
28%
19%
19%
3%
6%
8%
5%
0% 10% 20% 30% 40% 50% 60% 70% 80% 90% 100%
ADAMAWA
BORNO
YOBE
Grand Total
No damage Partially damaged Fully damaged
Figure 50: Availability of medical services in areas of return
66%
64%
54%
64%
34%
36%
46%
36%
0% 10% 20% 30% 40% 50% 60% 70% 80% 90% 100%
Adamawa
Borno
Yobe
Grand Total
Not available Available
86%
98%
100%
93%
12%
2%
6%
2%
1%
75% 80% 85% 90% 95% 100%
Adamawa
Borno
Yobe
Grand Total
Insurgency Communal clashes Natural disasters
Figure 47: Reasons for initial displacement of returnees
Figure 52: Availability of education services in areas of return
50%
50%
41%
49%
50%
50%
59%
51%
0% 10% 20% 30% 40% 50% 60% 70% 80% 90% 100%
Adamawa
Borno
Yobe
Grand Total
Not available Available
Figure 53: Percentage of education types in areas of return
1%
3%
21%
75%
Kindergarten
Religious school
Secondary school
Primary school
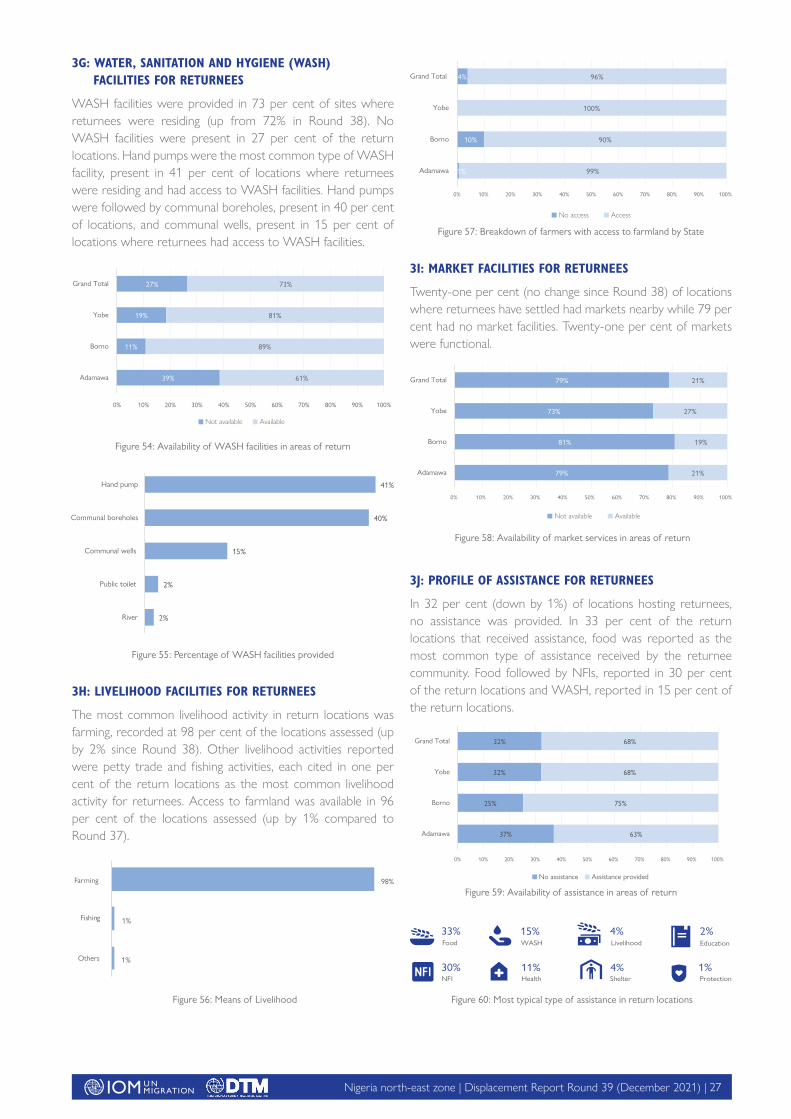
Nigeria north-east zone | Displacement Report Round 39 (December 2021) | A27
3I: MARKET FACILITIES FOR RETURNEES
Twenty-one per cent (no change since Round 38) of locations where returnees have settled had markets nearby while 79 per cent had no market facilities. Twenty-one per cent of markets were functional.
3J: PROFILE OF ASSISTANCE FOR RETURNEES
In 32 per cent (down by 1%) of locations hosting returnees, no assistance was provided. In 33 per cent of the return locations that received assistance, food was reported as the most common type of assistance received by the returnee community. Food followed by NFIs, reported in 30 per cent of the return locations and WASH, reported in 15 per cent of the return locations.
3G: WATER, SANITATION AND HYGIENE (WASH) FACILITIES FOR RETURNEES
WASH facilities were provided in 73 per cent of sites where returnees were residing (up from 72% in Round 38). No WASH facilities were present in 27 per cent of the return locations. Hand pumps were the most common type of WASH facility, present in 41 per cent of locations where returnees were residing and had access to WASH facilities. Hand pumps were followed by communal boreholes, present in 40 per cent of locations, and communal wells, present in 15 per cent of locations where returnees had access to WASH facilities.
3H: LIVELIHOOD FACILITIES FOR RETURNEES
The most common livelihood activity in return locations was farming, recorded at 98 per cent of the locations assessed (up by 2% since Round 38). Other livelihood activities reported were petty trade and fishing activities, each cited in one per cent of the return locations as the most common livelihood activity for returnees. Access to farmland was available in 96 per cent of the locations assessed (up by 1% compared to Round 37).
Figure 55: Percentage of WASH facilities provided
2%
2%
15%
40%
41%
River
Public toilet
Communal wells
Communal boreholes
Hand pump
Figure 54: Availability of WASH facilities in areas of return
39%
11%
19%
27%
61%
89%
81%
73%
0% 10% 20% 30% 40% 50% 60% 70% 80% 90% 100%
Adamawa
Borno
Yobe
Grand Total
Not available Available
Figure 57: Breakdown of farmers with access to farmland by State
1%
10%
4%
99%
90%
100%
96%
0% 10% 20% 30% 40% 50% 60% 70% 80% 90% 100%
Adamawa
Borno
Yobe
Grand Total
No access Access
Figure 56: Means of Livelihood
1%
1%
98%
Others
Fishing
Farming
Figure 58: Availability of market services in areas of return
79%
81%
73%
79%
21%
19%
27%
21%
0% 10% 20% 30% 40% 50% 60% 70% 80% 90% 100%
Adamawa
Borno
Yobe
Grand Total
Not available Available
Health
WASH
NFI
Food
33%
30%
15%
11%Protection1%
Shelter4%
Education
2%Livelihood
4%
Figure 60: Most typical type of assistance in return locations
Figure 59: Availability of assistance in areas of return
37%
25%
32%
32%
63%
75%
68%
68%
0% 10% 20% 30% 40% 50% 60% 70% 80% 90% 100%
Adamawa
Borno
Yobe
Grand Total
No assistance Assistance provided
Nigeria north-east zone | Displacement Report Round 39 (December 2021) | A28
Contacts:
IOM: International Organization for Migration (UN Migration Agency)
No 55 Hassan Musa Katsina Road, Asokoro
Abuja – Nigeria (GMT +1)
Tel.: +234 8085221427
NEMA: Alhassan Nuhu, Director, Disaster Risk Reduction,
Tel.: +234 8035925885
Cover photo: Rann IDP camp, Rann ward, Kala/balge LGA of Borno State © IOM-DTM/Midiga Lagu/2020
The depiction and use of boundaries, geographic names, and related data shown on maps and included in this report are not warranted to be error-free, nor do they imply a judgment on the legal status of any territory or any endorsement or acceptance of such boundaries by IOM.
“When quoting, paraphrasing, or in any other way using the information mentioned in this report, the source needs to be stated appropriately as follows: “Source: Displacement Tracking Matrix (DTM) of the International Organization for Migration (IOM), October 2021.”
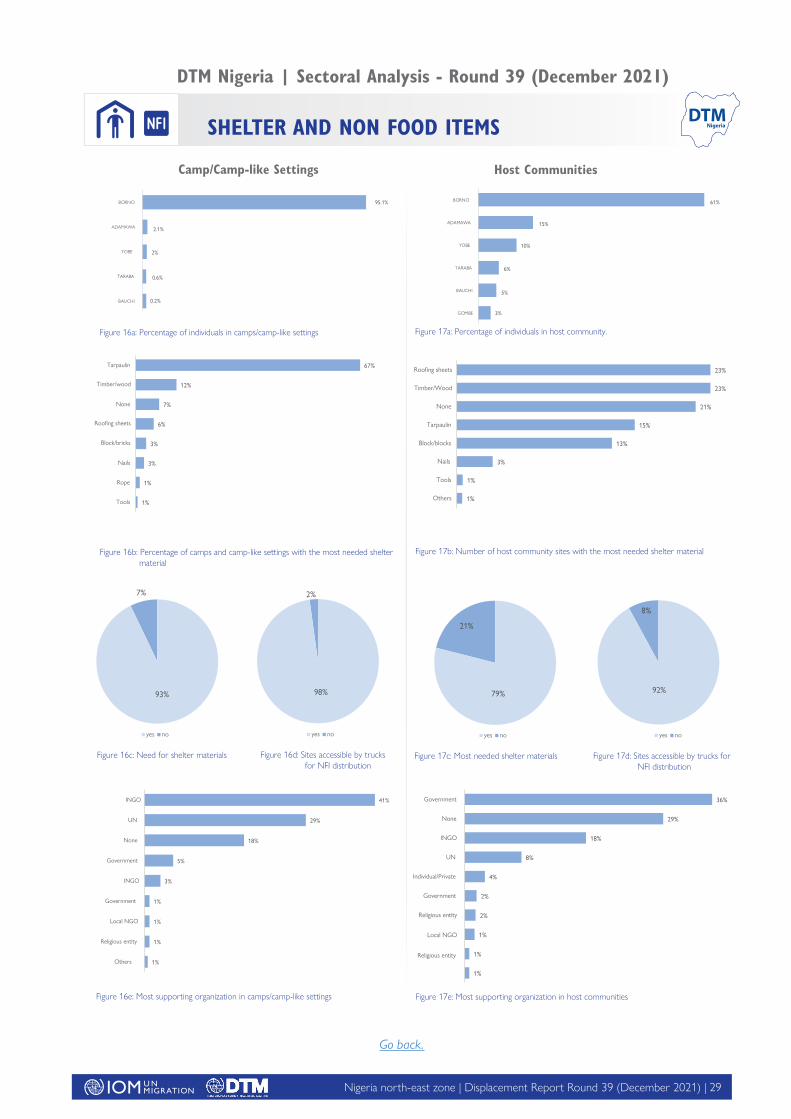
Nigeria north-east zone | Displacement Report Round 39 (December 2021) | A29
DTM Nigeria | Sectoral Analysis - Round 39 (December 2021)
Figure 16b: Percentage of camps and camp-like settings with the most needed shelter material
Figure 17b: Number of host community sites with the most needed shelter material
Figure 16a: Percentage of individuals in camps/camp-like settings Figure 17a: Percentage of individuals in host community.
Figure 16c: Need for shelter materials Figure 17c: Most needed shelter materials
Figure 16e: Most supporting organization in camps/camp-like settings Figure 17e: Most supporting organization in host communities
Figure 17d: Sites accessible by trucks for NFI distribution
Figure 16d: Sites accessible by trucks for NFI distribution
Host CommunitiesCamp/Camp-like Settings
93%
7%
98%
2%
92%
8%
79%
21%
yes no yes no yes no yes no
DTMNigeriaSHELTER AND NON FOOD ITEMS
BAUCHI
TARABA
YOBE
ADAMAWA
BORNO
GOMBE
BAUCHI
TARABA
YOBE
ADAMAWA
BORNO 61%
15%
95.1%
2.1%
2%
0.6%
0.2%
10%
5%
6%
3%
1%
1%
3%
3%
6%
7%
12%
67%
Tools
Rope
Nails
Block/bricks
Roo�ng sheets
None
Timber/wood
Tarpaulin
1%
1%
3%
13%
15%
21%
23%
23%
Others
Tools
Nails
Block/blocks
Tarpaulin
None
Timber/Wood
Roo�ng sheets
1%
1%
1%
1%
3%
5%
18%
29%
41%
Others
Religious entity
Local NGO
Government
INGO
Government
None
UN
INGO
1%
1%
1%
2%
2%
4%
8%
18%
29%
36%
Religious entity
Local NGO
Religious entity
Government
Individual/Private
UN
INGO
None
Government
Go back.
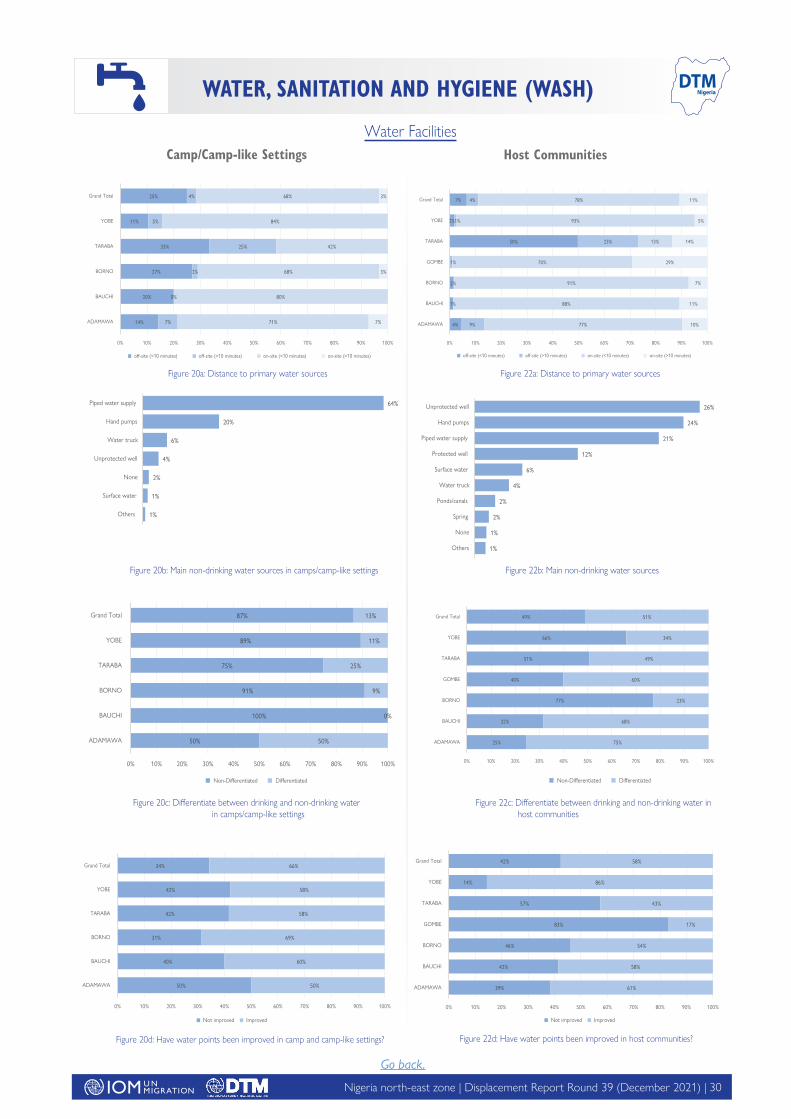
Nigeria north-east zone | Displacement Report Round 39 (December 2021) | A30
DTMNigeria
Figure 20a: Distance to primary water sources Figure 22a: Distance to primary water sources
Figure 20b: Main non-drinking water sources in camps/camp-like settings Figure 22b: Main non-drinking water sources
Water Facilities
Figure 22c: Di�erentiate between drinking and non-drinking water in host communities
Figure 20c: Di�erentiate between drinking and non-drinking water in camps/camp-like settings
Figure 22d: Have water points been improved in host communities?Figure 20d: Have water points been improved in camp and camp-like settings?
Host CommunitiesCamp/Camp-like Settings
WATER, SANITATION AND HYGIENE (WASH)
14%
20%
27%
33%
11%
25%
7%
0%
2%
25%
5%
4%
71%
80%
68%
42%
84%
68%
7%
3%
3%
0% 10% 20% 30% 40% 50% 60% 70% 80% 90% 100%
ADAMAWA
BAUCHI
BORNO
TARABA
YOBE
Grand Total
o�-site (<10 minutes) o�-site (>10 minutes) on-site (<10 minutes) on-site (>10 minutes)
4%
1%
2%
50%
2%
7%
9%
1%
23%
1%
4%
77%
88%
91%
70%
13%
93%
78%
10%
11%
7%
29%
14%
5%
11%
0% 10% 20% 30% 40% 50% 60% 70% 80% 90% 100%
ADAMAWA
BAUCHI
BORNO
GOMBE
TARABA
YOBE
Grand Total
o�-site (<10 minutes) o�-site (>10 minutes) on-site (<10 minutes) on-site (>10 minutes)
1%
1%
2%
2%
4%
6%
12%
21%
24%
26%
Others
None
Spring
Ponds/canals
Water truck
Surface water
Protected well
Piped water supply
Hand pumps
Unprotected well
1%
1%
2%
4%
6%
20%
64%
Others
Surface water
None
Unprotected well
Water truck
Hand pumps
Piped water supply
50%
100%
91%
75%
89%
87%
50%
0%
9%
25%
11%
13%
0% 10% 20% 30% 40% 50% 60% 70% 80% 90% 100%
ADAMAWA
BAUCHI
BORNO
TARABA
YOBE
Grand Total
Non-Di�erentiated Di�erentiated Non-Di�erentiated Di�erentiated
25%
32%
77%
40%
51%
66%
49%
75%
68%
23%
60%
49%
34%
51%
0% 10% 20% 30% 40% 50% 60% 70% 80% 90% 100%
ADAMAWA
BAUCHI
BORNO
GOMBE
TARABA
YOBE
Grand Total
50%
40%
31%
42%
42%
34%
50%
60%
69%
58%
58%
66%
0% 10% 20% 30% 40% 50% 60% 70% 80% 90% 100%
ADAMAWA
BAUCHI
BORNO
TARABA
YOBE
Grand Total
Not improved Improved Not improved Improved
39%
42%
46%
83%
57%
14%
42%
61%
58%
54%
17%
43%
86%
58%
0% 10% 20% 30% 40% 50% 60% 70% 80% 90% 100%
ADAMAWA
BAUCHI
BORNO
GOMBE
TARABA
YOBE
Grand Total
Go back.
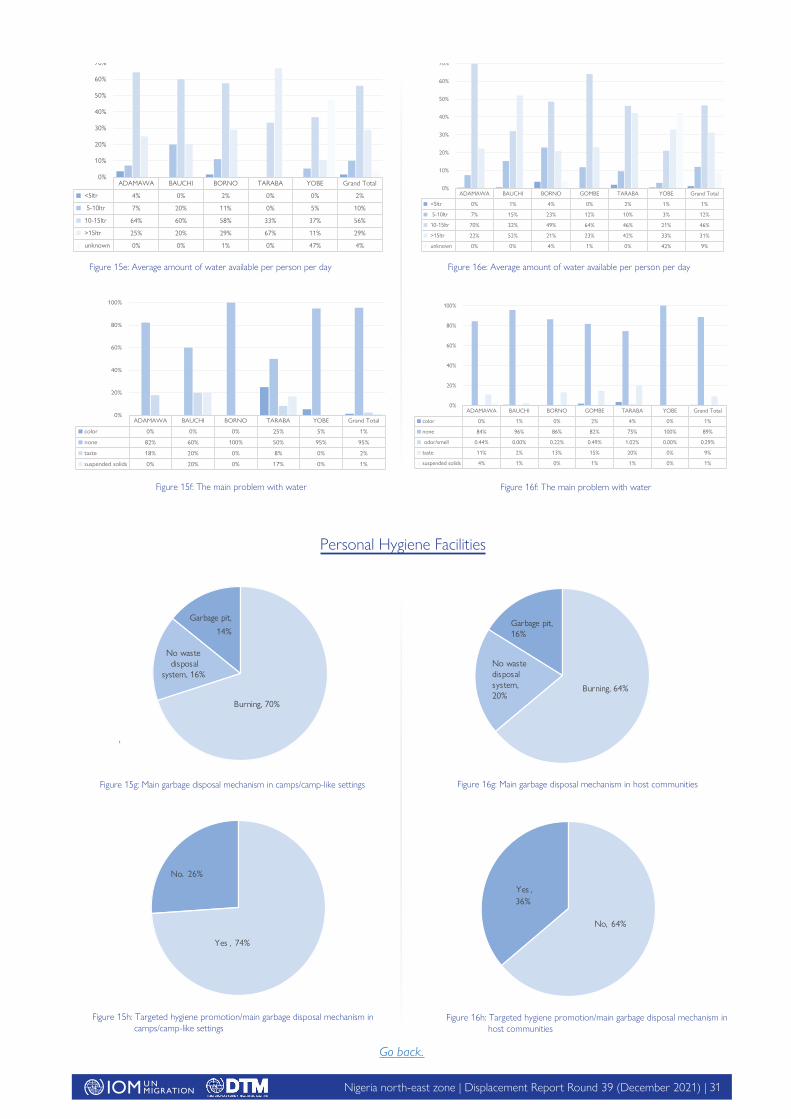
Nigeria north-east zone | Displacement Report Round 39 (December 2021) | A31
,
Figure 16f: The main problem with waterFigure 15f: The main problem with water
Figure 15e: Average amount of water available per person per day Figure 16e: Average amount of water available per person per day
Figure 15g: Main garbage disposal mechanism in camps/camp-like settings
Personal Hygiene Facilities
Figure 15h: Targeted hygiene promotion/main garbage disposal mechanism in camps/camp-like settings
Figure 16g: Main garbage disposal mechanism in host communities
Figure 16h: Targeted hygiene promotion/main garbage disposal mechanism in host communities
No, 26%
Yes , 74%
No, 64%
Yes , 36%
Burning, 64%
No waste disposal system,20%
Garbage pit, 16%
Garbage pit,
No waste disposal
system, 16%
14%
Burning, 70%
ADAMAWA BAUCHI BORNO TARABA YOBE Grand Total
<5ltr 4% 0% 2% 0% 0% 2%
5-10ltr 7% 20% 11% 0% 5% 10%
10-15ltr 64% 60% 58% 33% 37% 56%
>15ltr 25% 20% 29% 67% 11% 29%
unknown 0% 0% 1% 0% 47% 4%
0%
10%
20%
30%
40%
50%
60%
70%
ADAMAWA BAUCHI BORNO GOMBE TARABA YOBE Grand Total
<5ltr 0% 1% 4% 0% 2% 1% 1%
5-10ltr 7% 15% 23% 12% 10% 3% 12%
10-15ltr 70% 32% 49% 64% 46% 21% 46%
>15ltr 22% 52% 21% 23% 42% 33% 31%
unknown 0% 0% 4% 1% 0% 42% 9%
0%
10%
20%
30%
40%
50%
60%
70%
ADAMAWA BAUCHI BORNO TARABA YOBE Grand Total
color 0% 0% 0% 25% 5% 1%
none 82% 60% 100% 50% 95% 95%
taste 18% 20% 0% 8% 0% 2%
suspended solids 0% 20% 0% 17% 0% 1%
0%
20%
40%
60%
80%
100%
ADAMAWA BAUCHI BORNO GOMBE TARABA YOBE Grand Total
color 0% 1% 0% 2% 4% 0% 1%
none 84% 96% 86% 82% 75% 100% 89%
odor/smell 0.44% 0.00% 0.22% 0.49% 1.02% 0.00% 0.29%
taste 11% 2% 13% 15% 20% 0% 9%
suspended solids 4% 1% 0% 1% 1% 0% 1%
0%
20%
40%
60%
80%
100%
Go back.
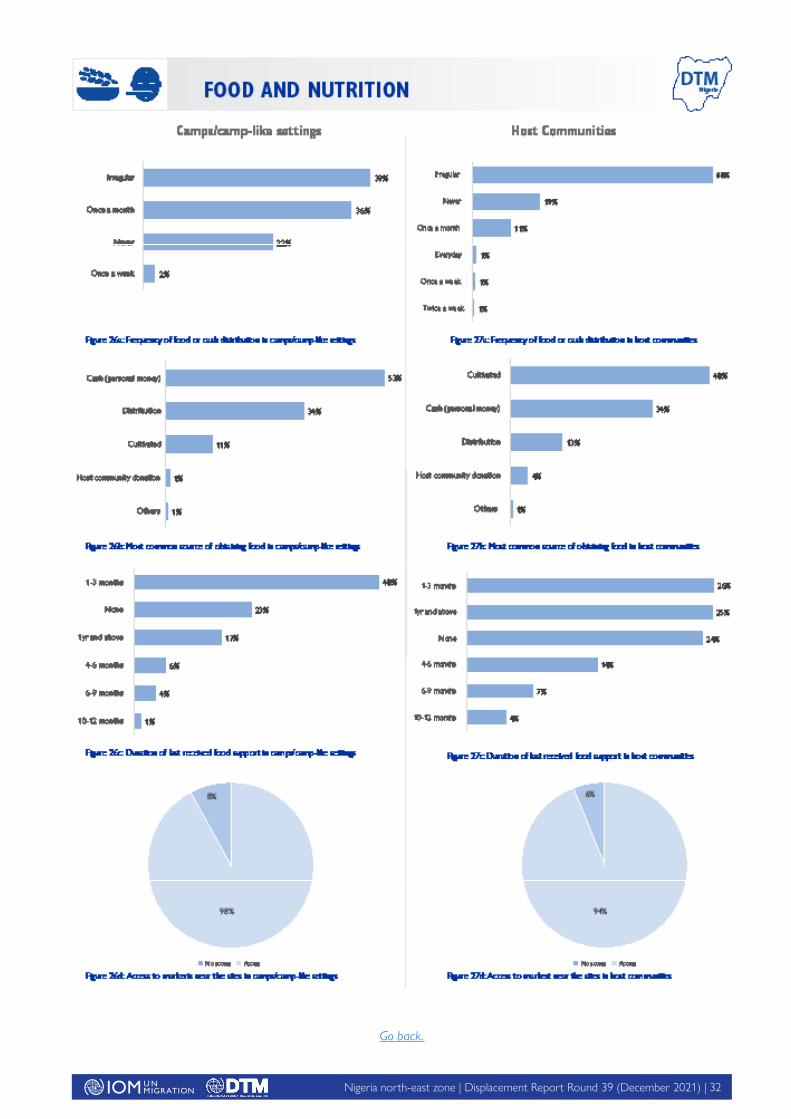
Nigeria north-east zone | Displacement Report Round 39 (December 2021) | A32
Go back.
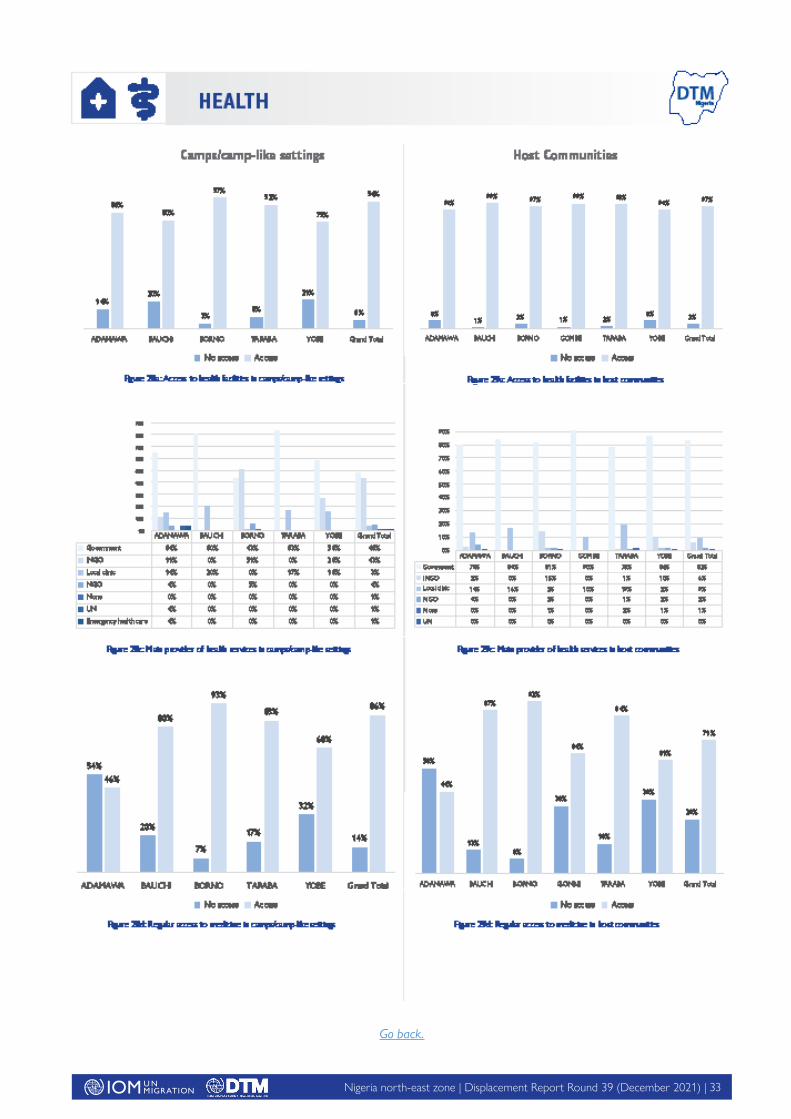
Nigeria north-east zone | Displacement Report Round 39 (December 2021) | A33
Go back.
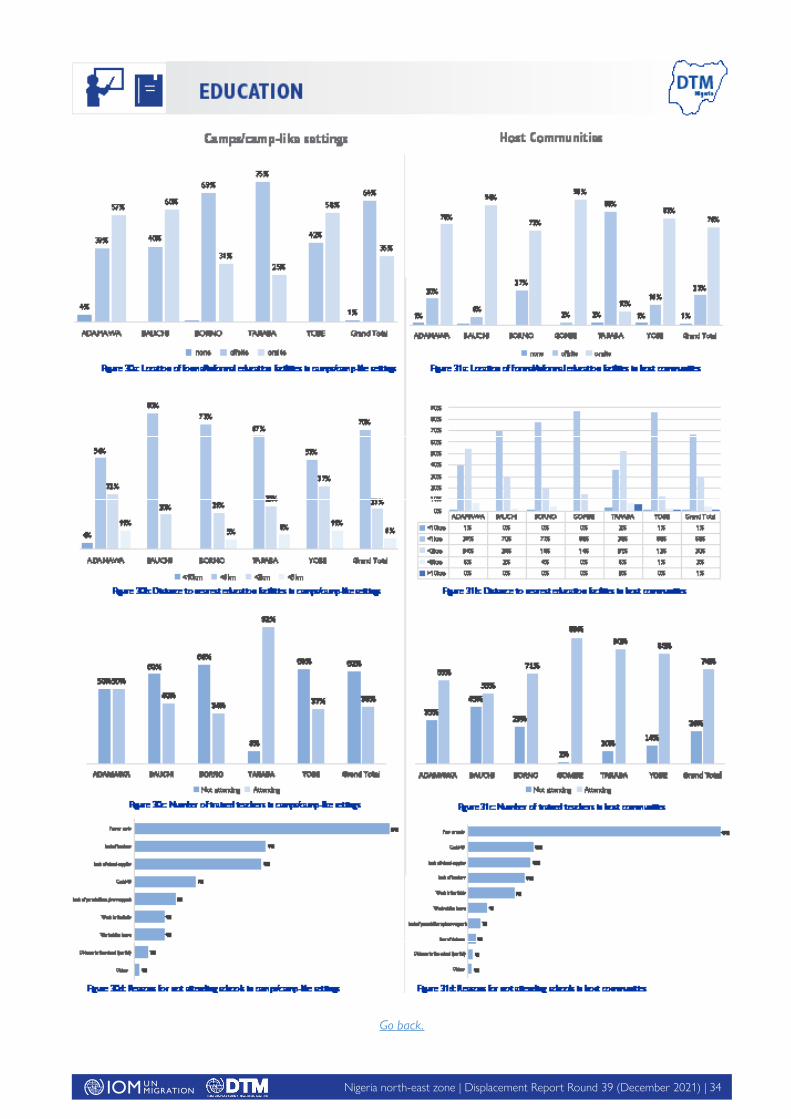
Nigeria north-east zone | Displacement Report Round 39 (December 2021) | A34
Go back.
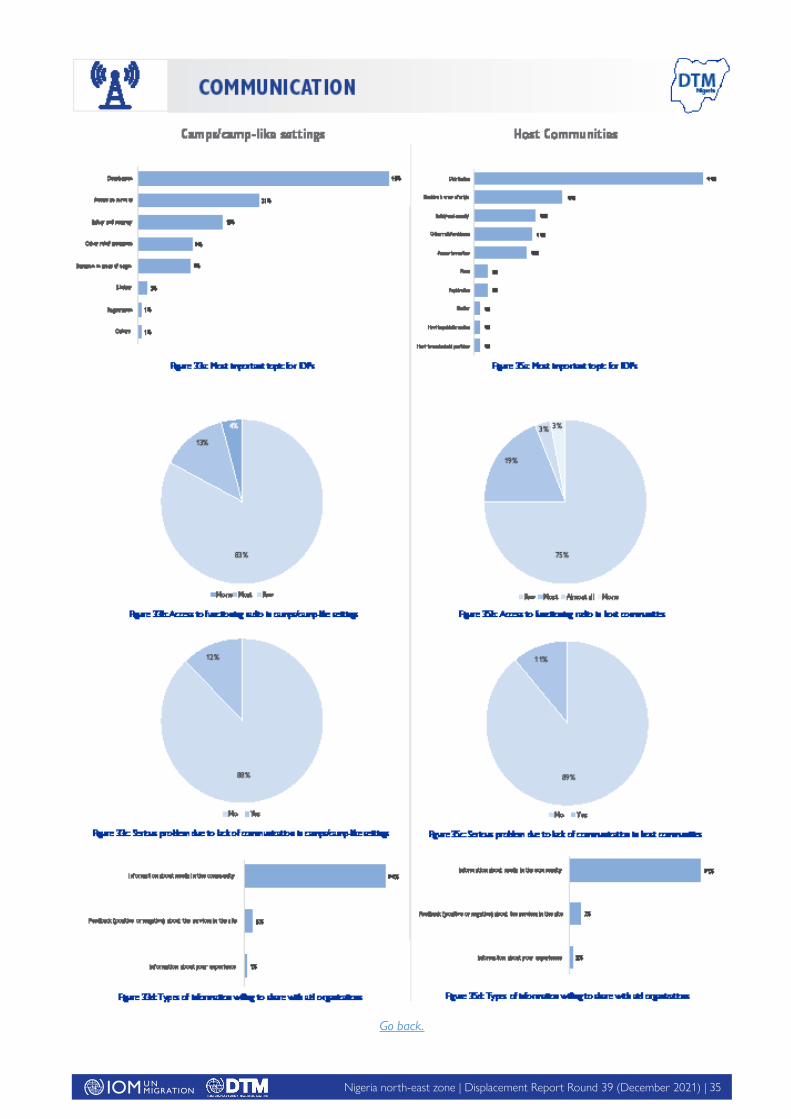
Nigeria north-east zone | Displacement Report Round 39 (December 2021) | A35
Go back.
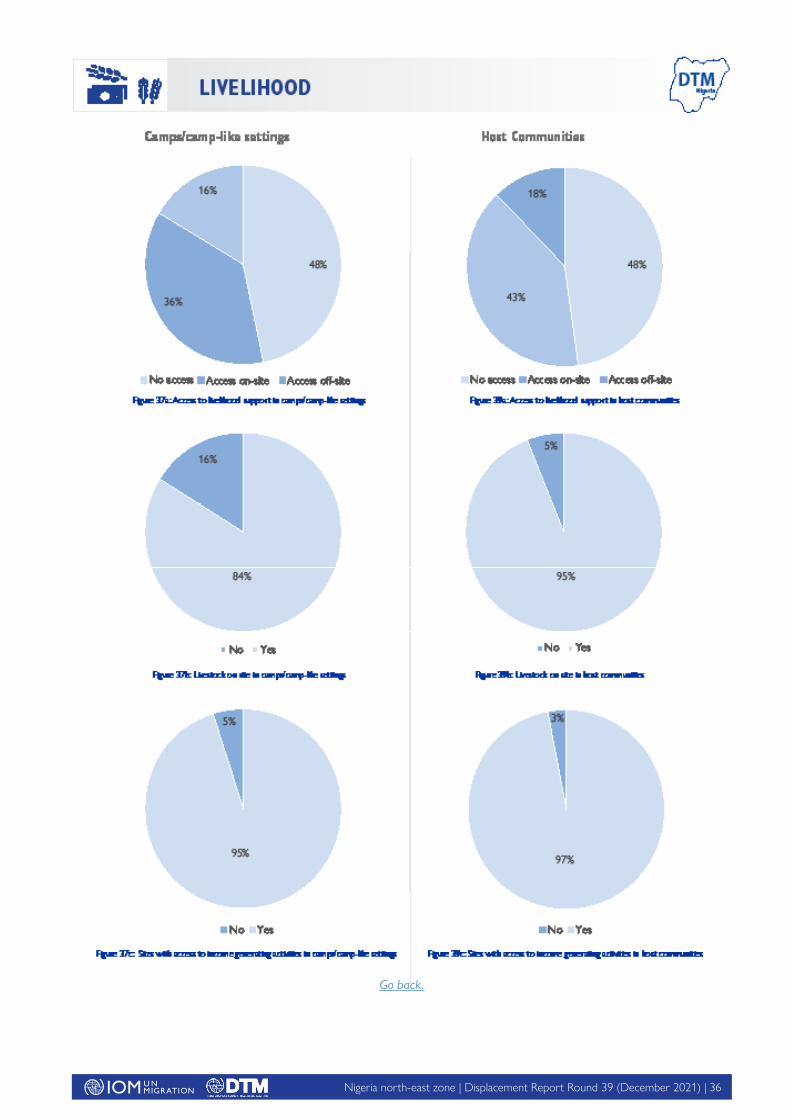
Nigeria north-east zone | Displacement Report Round 39 (December 2021) | A36
Go back.
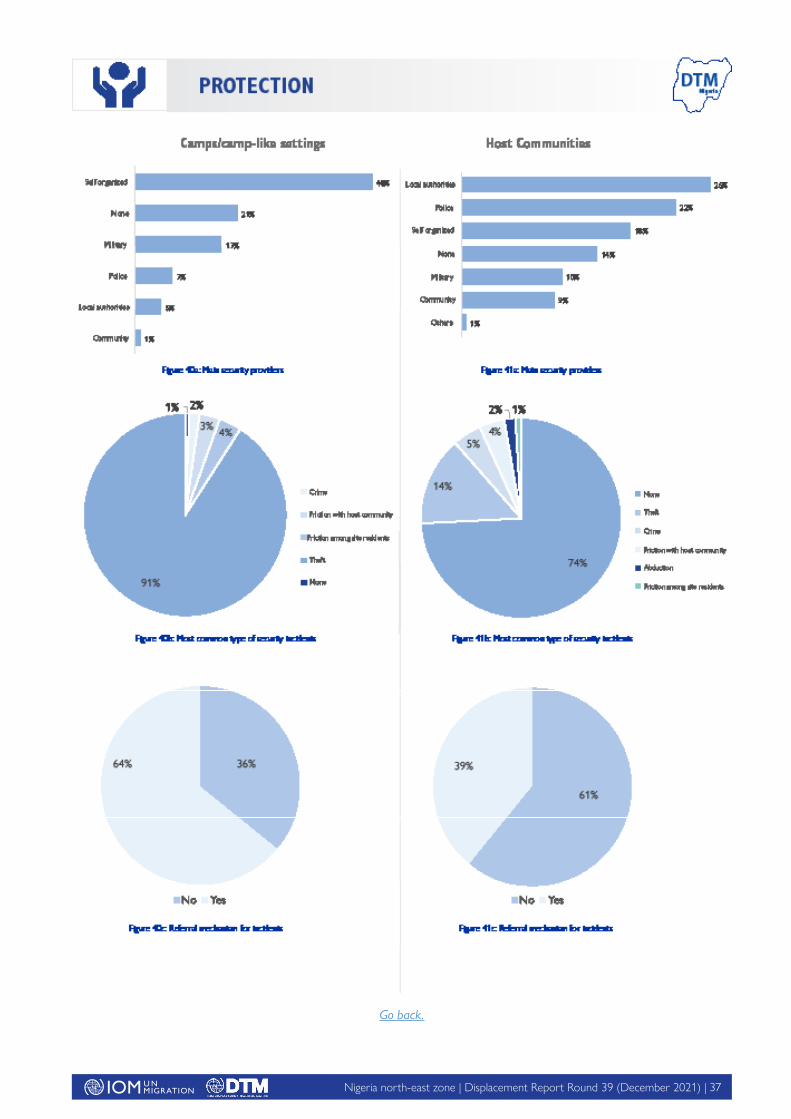
Nigeria north-east zone | Displacement Report Round 39 (December 2021) | A37
Go back.