domain landscape review and data value chain definition
TRANSCRIPT

HORIZON 2020 - ICT-14-2016-1
AEGIS Advanced Big Data Value Chains for Public Safety and Personal Security
WP1 - AEGIS Data Value Chain Definition and Project
Methodology
D1.1 – Domain Landscape Review and
Data Value Chain Definition
Due date: 31.03.2017 Delivery Date: 31.03.2017
Author(s): Jim Dowling, Alexandru A. Ormenisan, Mahmoud Ismail (KTH), Sotiris
Koussouris, Fenareti Lampathaki (SUITE5), Fabian Kirstein (Fraunhofer),
Spiros Mouzakitis, Evmorfia Biliri, John Tsapelas (NTUA), Cinzia Rubattino,
Germana Gianquinto, Giulio Piemontese, Elisa Rossi (GFT)
Editor: Alexandru Ormenisan (KTH)
Lead Beneficiary of Deliverable: KTH
Dissemination level: Public Nature of the Deliverable: Report
Internal Reviewers: Andreas Schramm (Fraunhofer), Konstantinos Perakis (UBITECH)
HORIZON 2020 – 732189 - AEGIS D1.1 – Domain Landscape Review and Data Value Chain Definition
WP1 – AEGIS Data Value Chain Definition and Project Methodology AEGIS Consortium
Page 2 of 108
EXPLANATIONS FOR FRONTPAGE
Author(s): Name(s) of the person(s) having generated the Foreground respectively having written
the content of the report/document. In case the report is a summary of Foreground generated by
other individuals, the latter have to be indicated by name and partner whose employees he/she is.
List them alphabetically.
Editor: Only one. As formal editorial name only one main author as responsible quality manager
in case of written reports: Name the person and the name of the partner whose employee the Editor
is. For the avoidance of doubt, editing only does not qualify for generating Foreground; however,
an individual may be an Author – if he has generated the Foreground - as well as an Editor – if he
also edits the report on its own Foreground.
Lead Beneficiary of Deliverable: Only one. Identifies name of the partner that is responsible for
the Deliverable according to the AEGIS DOW. The lead beneficiary partner should be listed on the
frontpage as Authors and Partner. If not, that would require an explanation.
Internal Reviewers: These should be a minimum of two persons. They should not belong to the
authors. They should be any employees of the remaining partners of the consortium, not directly
involved in that deliverable, but should be competent in reviewing the content of the deliverable.
Typically this review includes: Identifying typos, Identifying syntax & other grammatical errors,
Altering content, Adding or deleting content.

HORIZON 2020 – 732189 - AEGIS D1.1 – Domain Landscape Review and Data Value Chain Definition
WP1 – AEGIS Data Value Chain Definition and Project Methodology AEGIS Consortium
Page 3 of 108
AEGIS KEY FACTS
Topic: ICT-14-2016 - Big Data PPP: cross-sectorial and cross-lingual
data integration and experimentation
Type of Action: Innovation Action
Project start: 1 January 2017
Duration: 30 months from 01.01.2017 to 30.06.2019 (Article 3 GA)
Project Coordinator: Fraunhofer
Consortium: 10 organizations from 8 EU member states
AEGIS PARTNERS Fraunhofer Fraunhofer-Gesellschaft zur Förderung der angewandten Forschung
e.V.
GFT GFT Italia SRL
KTH Kungliga Tekniska högskolan
UBITECH UBITECH Limited
VIF Kompetenzzentrum - Das virtuelle Fahrzeug,
Forschungsgesellschaft-GmbH
NTUA National Technical University of Athens – NTUA
EPFL École polytechnique fédérale de Lausanne
SUITE5 SUITE5 Limited
HYPERTECH HYPERTECH (CHAIPERTEK) ANONYMOS VIOMICHANIKI
EMPORIKI ETAIREIA PLIROFORIKIS KAI NEON
TECHNOLOGION
HDIA HDI Assicurazioni S.P.A
Disclaimer: AEGIS is a project co-funded by the European Commission under the Horizon
2020 Programme (H2020-ICT-2016) under Grant Agreement No. 732189 and is
contributing to the BDV-PPP of the European Commission.
The information and views set out in this publication are those of the author(s) and do not
necessarily reflect the official opinion of the European Communities. Neither the European
Union institutions and bodies nor any person acting on their behalf may be held responsible
for the use which may be made of the information contained therein.
© Copyright in this document remains vested with the AEGIS Partners

HORIZON 2020 – 732189 - AEGIS D1.1 – Domain Landscape Review and Data Value Chain Definition
WP1 – AEGIS Data Value Chain Definition and Project Methodology AEGIS Consortium
Page 4 of 108
EXECUTIVE SUMMARY
This deliverable provides an overview and analysis of tools and systems for Big Linked
Data and the data sources and data value chains that will be defined in the project. AEGIS
is addressing the problem of providing systems support for Public Safety and Personal
Security (hereinafter PSPS), and our approach involves supporting both Big Data and
Linked Data, as a means to integrate a wide variety of potential data sources. The tools and
systems we identify here should help us build platform support for an open ecosystem in
which PSPS actors can safely and securely share data. As such, this document includes a
state-of-art analysis of the Big Data landscape in terms of frameworks and tools that
straddle the boundary with Linked Data. We identify the most promising software artefacts
for inclusion in the AEGIS platform. In the second part of this document, we identify the
stakeholders who could benefit from AEGIS, their needs and requirements, and
preliminary features that we will need to develop in the project to support the requirements.
In the third, and final part, we present the AEGIS data value chain, alongside with a large
set of information/data sources that will be used for validation and exploitation in the
project. The results of this deliverable will be used to help define the software architecture
and data sources in the AEGIS project.
HORIZON 2020 – 732189 - AEGIS D1.1 – Domain Landscape Review and Data Value Chain Definition
WP1 – AEGIS Data Value Chain Definition and Project Methodology AEGIS Consortium
Page 5 of 108
Domain Landscape Review and Data
Value Chain Definition
Table of Contents
EXPLANATIONS FOR FRONTPAGE ...................................................................................................... 2
AEGIS KEY FACTS ..................................................................................................................................... 3
AEGIS PARTNERS....................................................................................................................................... 3
EXECUTIVE SUMMARY ........................................................................................................................... 4
ABBREVIATIONS ........................................................................................................................................ 7
PARTNER ...................................................................................................................................................... 8
LIST OF FIGURES ....................................................................................................................................... 9
LIST OF TABLES ....................................................................................................................................... 10
CODE LISTINGS ........................................................................................................................................ 10
1. INTRODUCTION.................................................................................................................................... 11
1.1. OBJECTIVES OF DELIVERABLE ............................................................................................................. 11 1.2. STRUCTURE OF THE DELIVERABLE ...................................................................................................... 11
2. STATE OF THE ART REVIEW OF BIG DATA AND SEMANTIC WEB OPEN-SOURCE
SYSTEMS, FRAMEWORKS, AND TOOLS ........................................................................................... 12
2.1. INTRODUCTION.................................................................................................................................... 12 2.1.1. Selection of RDF standards ........................................................................................................ 12 2.1.2. General Evaluation Criteria ...................................................................................................... 15
2.2. TRANSFORMATION TOOLS ................................................................................................................... 16 2.2.1. Selection of tools ........................................................................................................................ 16 2.2.2. Comparison of tools ................................................................................................................... 17
2.3. VISUALIZATION AND EXPLORATION ................................................................................................... 19 2.3.1. Selection of tools ........................................................................................................................ 19 2.3.2. Comparison of tools ................................................................................................................... 20
2.4. NAMED ENTITY RECOGNITION TOOLS ................................................................................................ 22 2.4.1. Selection of tools ........................................................................................................................ 22 2.4.2. Comparison of tools ................................................................................................................... 23
2.5. VOCABULARY REPOSITORIES.............................................................................................................. 25 2.5.1. Selection of tools ........................................................................................................................ 25 2.5.2. Comparison of vocabularies ...................................................................................................... 25
2.6. QUERY TOOLS ..................................................................................................................................... 27 2.6.1. Selection of tools ........................................................................................................................ 27
2.7. METADATA MANAGEMENT AND COLLECTING TOOLS ........................................................................ 29 2.7.1. Selection of tools ........................................................................................................................ 29
2.8. STORAGE ............................................................................................................................................. 31 2.8.1. Evaluation criteria ..................................................................................................................... 31 2.8.2. Triple stores ................................................................................................................................ 32 2.8.3. Scalable Data stores ................................................................................................................... 36 2.8.4. Systems not included .................................................................................................................. 39 2.8.5. Comparison of tools ................................................................................................................... 40
HORIZON 2020 – 732189 - AEGIS D1.1 – Domain Landscape Review and Data Value Chain Definition
WP1 – AEGIS Data Value Chain Definition and Project Methodology AEGIS Consortium
Page 6 of 108
2.9. ANALYTICS TOOLS .............................................................................................................................. 42 2.9.1. Selection of tools ........................................................................................................................ 42 2.9.2. Comparison of tools ................................................................................................................... 47
3. STAKEHOLDERS ANALYSIS AND IDENTIFICATION OF PRELIMINARY NEEDS ............. 49
3.1. STAKEHOLDER ANALYSIS.................................................................................................................... 49 3.1.1. High-level stakeholder identification ......................................................................................... 49 3.1.2. Detailed stakeholder analysis .................................................................................................... 50
3.2. PRELIMINARY STAKEHOLDER NEEDS IDENTIFICATION ........................................................................ 60 3.2.1. Questionnaires and Interviews ................................................................................................... 60 3.2.2. Gained Insights into stakeholder needs...................................................................................... 62 3.2.1. Reflections .................................................................................................................................. 69 3.2.2. Conclusions ................................................................................................................................ 70
4. DATA SOURCES AND VALUE CHAIN ............................................................................................. 72
4.1. IDENTIFIED DATA SOURCES ................................................................................................................. 72 4.2. STAKEHOLDERS VALUE CHAIN ........................................................................................................... 90 4.3. DATA VALUE CHAIN DEFINITION (FIRST VERSION) .............................................................................. 94
5. CONCLUSION ........................................................................................................................................ 97
APPENDIX A: LITERATURE .................................................................................................................. 98
APPENDIX B: AEGIS SURVEY ............................................................................................................... 99

HORIZON 2020 – 732189 - AEGIS D1.1 – Domain Landscape Review and Data Value Chain Definition
WP1 – AEGIS Data Value Chain Definition and Project Methodology AEGIS Consortium
Page 7 of 108
ABBREVIATIONS ADL Activity of Daily Living
BI Business Intelligence
CDS Clinical Decision Support
CO Confidential, only for members of the Consortium (including the Commission
Services)
D Deliverable
DoA Description of Action
DoW Description of Work
FLOSS Free/Libre Open Source Software
GRIB Gridded Binary
GUI Graphical User Interface
H2020 Horizon 2020 Programme
HDF Hierarchical Data Format
HDFS The Hadoop Distributed File System
IDN Integrated Delivery Network
IPR Intellectual Property Rights
IRI Internationalised Resource Identifier
KPI Key Performance Indicator
LEA Law Enforcement Agencies
LOV Linked Open Vocabularies
MGT Management
MS Milestone
NER Named Entity Recognition
NetCDF Network Common Data Format
NLP Natural Language Processing
NLP Natural Language Processing
O Other
OS Open Source
OSS Open Source Software
OWL W3C Web Ontology Language
P Prototype
PM Person Month
PSPS Public Safety and Personal Security
PU Public
R Report
R2RML RDB To RDF Mapping Language
RDB Relational Database
RDF Resource Document Framework
RTD Research and Development
WP Work Package
Y1 Year 1

HORIZON 2020 – 732189 - AEGIS D1.1 – Domain Landscape Review and Data Value Chain Definition
WP1 – AEGIS Data Value Chain Definition and Project Methodology AEGIS Consortium
Page 8 of 108
PARTNER Fraunhofer Fraunhofer-Gesellschaft zur Förderung der angewandten Forschung e.V.
GFT GFT Italia SRL
KTH Kungliga Tekniska högskolan
UBITECH UBITECH Limited
VIF Kompetenzzentrum - Das virtuelle Fahrzeug, Forschungsgesellschaft-GmbH
NTUA National Technical University of Athens – NTUA
EPFL École polytechnique fédérale de Lausanne
SUITE5 SUITE5 Limited
HYPERTECH HYPERTECH (CHAIPERTEK) ANONYMOS VIOMICHANIKI EMPORIKI
ETAIREIA PLIROFORIKIS KAI NEON TECHNOLOGION
HDIA HDI Assicurazioni S.P.A

HORIZON 2020 – 732189 - AEGIS D1.1 – Domain Landscape Review and Data Value Chain Definition
WP1 – AEGIS Data Value Chain Definition and Project Methodology AEGIS Consortium
Page 9 of 108
LIST OF FIGURES
Figure 1: RDF structure .................................................................................................... 12 Figure 2: Triple store types ............................................................................................... 32 Figure 3: Apache Jena relevant modules .......................................................................... 33 Figure 4: Virtuoso relevant modules................................................................................. 34 Figure 5: Blazegraph relevant modules ............................................................................ 35 Figure 6: Apache Rya relevant modules ........................................................................... 36 Figure 7: Apache Accumulo table structure ..................................................................... 37 Figure 8: Hops relevant modules ...................................................................................... 38 Figure 9: Janus Graph relevant modules ........................................................................... 39 Figure 10: Sector of respondents ...................................................................................... 62 Figure 11: Number of employees ..................................................................................... 63 Figure 12: To what extent does your organisation have experience in Big Data? ........... 63 Figure 13: Does your organisation have a strategy on Big Data or Data Analytics? ....... 63 Figure 14: Data Sources .................................................................................................... 64 Figure 15: Are data sources multilingual? ........................................................................ 65 Figure 16: Does your organisation have the required translating tools to handle the different
languages? ................................................................................................................. 65 Figure 17: What type(s) of data does your organisation find relevant but has not yet been
able to exploit? .......................................................................................................... 66 Figure 18: From all the data collected by your organisation, what is approx. the percentage
that is further processed for value generation? ......................................................... 66 Figure 19: Does your organisation have the right analytical tools to handle (big) data? . 67 Figure 20: Does your organisation have the right tools to handle unstructured data
expressed in (a) natural language(s)? ........................................................................ 67 Figure 21: In your organisation, data collection is: .......................................................... 68 Figure 22: In your organisation, data analytics is: ............................................................ 68 Figure 23: Does your organisation share data with other entities (with customers, suppliers,
companies, government, etc)?................................................................................... 68 Figure 24: The Micro, Meso, and Macro Levels of a Big Data Ecosystem (from Edward
Curry, 2016 [1]) ........................................................................................................ 93 Figure 25: Big Data Value Chain...................................................................................... 94

HORIZON 2020 – 732189 - AEGIS D1.1 – Domain Landscape Review and Data Value Chain Definition
WP1 – AEGIS Data Value Chain Definition and Project Methodology AEGIS Consortium
Page 10 of 108
LIST OF TABLES
Table 1: Comparison of transformation tools ................................................................... 18 Table 2: Comparison of visualisation tools ...................................................................... 21 Table 3: Comparison of named entity recognition tools ................................................... 24 Table 4: Comparison of vocabularies ............................................................................... 26 Table 5: Comparison of storage solutions ........................................................................ 41 Table 6: Comparison of analytics tools ............................................................................ 48 Table 7: Stakeholder types ................................................................................................ 50 Table 8: Percentages of the survey’s participant organization belonging ........................ 62 Table 9: Summary of the most relevant data types. Percentage of participant collecting and
analysing them. ......................................................................................................... 67 Table 10: On the left the entities with which the data are shared, on the right the main added
value of the sharing ................................................................................................... 69 Table 11: How relevant are the following big data-related challenges for your organisation?
................................................................................................................................... 69 Table 12: Current and forecast growth in five years for percentages of processed data .. 69 Table 13: Dataset characterization icons .......................................................................... 72 Table 14: SG1 provided data ............................................................................................ 73 Table 15: SG2 provided data ............................................................................................ 74 Table 16: Smart Home indicative dataset volume ............................................................ 74 Table 17: SG3 provided data ............................................................................................ 75 Table 18: SG4 provided data ............................................................................................ 76 Table 19: Indicative health related datasets ...................................................................... 78 Table 20: SG5 related data ................................................................................................ 80 Table 21: Indicative crime related datasets ....................................................................... 82 Table 22: Indicative traffic related datasets .................................................................... 84 Table 23: Indicative disaster related datasets.................................................................... 86 Table 24: SG6 provided data ............................................................................................ 87 Table 25: SG10 provided datasets .................................................................................... 88 Table 26: SG11 provided datasets .................................................................................... 88 Table 27: Indicative weather datasets ............................................................................... 89 Table 28: Indicative SG1 cross-domain data consumption .............................................. 91 Table 29: Indicative SG2 cross-domain data consumption .............................................. 91 Table 30: Indicative SG3 cross-domain data consumption .............................................. 91 Table 31: Indicative SG4 cross-domain data consumption .............................................. 92 Table 32: Indicative SG5 cross-domain data consumption .............................................. 92 Table 33: Indicative SG7 cross-domain data consumption .............................................. 92 Table 34: Indicative SG10 cross-domain data consumption ............................................ 93
CODE LISTINGS
Code Listing 1: SPARQL – Friend of a Friend ontology example................................... 14
HORIZON 2020 – 732189 - AEGIS D1.1 – Domain Landscape Review and Data Value Chain Definition
WP1 – AEGIS Data Value Chain Definition and Project Methodology AEGIS Consortium
Page 11 of 108
1. INTRODUCTION
1.1. Objectives of deliverable
AEGIS is addressing the problem of efficiently managing the increasingly larger amounts
and diverse forms of data on Public Safety and Personal Security (hereinafter PSPS).
AEGIS is attempting to unify the fragmented and domain-specific data that is hindering
the PSPS service sector from improving both its performance and efficiency. To this end,
AEGIS is addressing this problem using the dual technologies of Linked Data and Big
Data. Linked Data technologies enable the integration of diverse data sources in a unified
data model that is both human- and machine-readable. Big Data technologies enable the
storage and analysis of increasingly larger amounts of data at low cost, using commodity
hardware.
The objective of this deliverable is to investigate
• the current landscape of Big, Linked and Open Data, starting from the identification
of existing tools and frameworks that are most suitable for inclusion in AEGIS;
• which stakeholders could benefit most from AEGIS and how their requirements
would translate into features in AEGIS;
• which data sources can be included in AEGIS, along with their respective
stakeholders and the definition of Data Value Chains?
1.2. Structure of the deliverable
The deliverable is structured into three sections. Following this introduction section,
section 2 develops a state of the art analysis on existing methods, component and tools
related to Big Data and Semantic Web that can be integrated into the AEGIS platform. We
investigate transformation tools for converting data into RDF format, visualization and
exploration tools, querying tools, analytics tools, storage and vocabulary tools. Section 3
identifies the whole set of stakeholders that are potentially interested in and can also benefit
from the AEGIS data value chain. This section includes a definition of preliminary user
requirements that are used as a high-level description of the features that need to be
developed to serve these sectors and allow the cross-sector and multi-language exchange
of data, alongside with value added services that will renovate the data managing activities
of these sectors. Section 4 defines the integrated AEGIS data value chain, where all related
stakeholders and their existing data will be identified and brought together in an integrated
value chain, bringing forward the value that one can add to each other, under a seamless
collaboration and mutually beneficiary prism.
HORIZON 2020 – 732189 - AEGIS D1.1 – Domain Landscape Review and Data Value Chain Definition
WP1 – AEGIS Data Value Chain Definition and Project Methodology AEGIS Consortium
Page 12 of 108
2. STATE OF THE ART REVIEW OF BIG DATA AND SEMANTIC WEB OPEN-SOURCE
SYSTEMS, FRAMEWORKS, AND TOOLS
2.1. Introduction
Traditionally, Big Data and Linked Data have belonged to different communities with
different platform, standards and tools. Big Data is traditionally associated with platforms
such as Hadoop, commodity computing, and Cloud Computing. While Linked Data has
been associated with the semantic web and standards such as Resource Document
Framework (RDF) and the SPARQL query language. However, in recent times there has
been some convergence with systems that support SPARQL and RDF on Hadoop and more
general graph frameworks that run on Hadoop. This section explores both RDF technology
and Big Data technologies in order to find a synergy between the two.
The explored RDF ecosystem includes:
• transformation tools
• visualization tools
• named entity recognition tools
• vocabulary repositories
• triple stores
The explored Big Data ecosystem includes:
• storage frameworks
• processing frameworks
2.1.1. Selection of RDF standards
The semantic web community uses a set of common standards, abstractions and APIs. This
section describes the most common of them. The selected tools should comply with as
many of the relevant standards as possible.
RDF
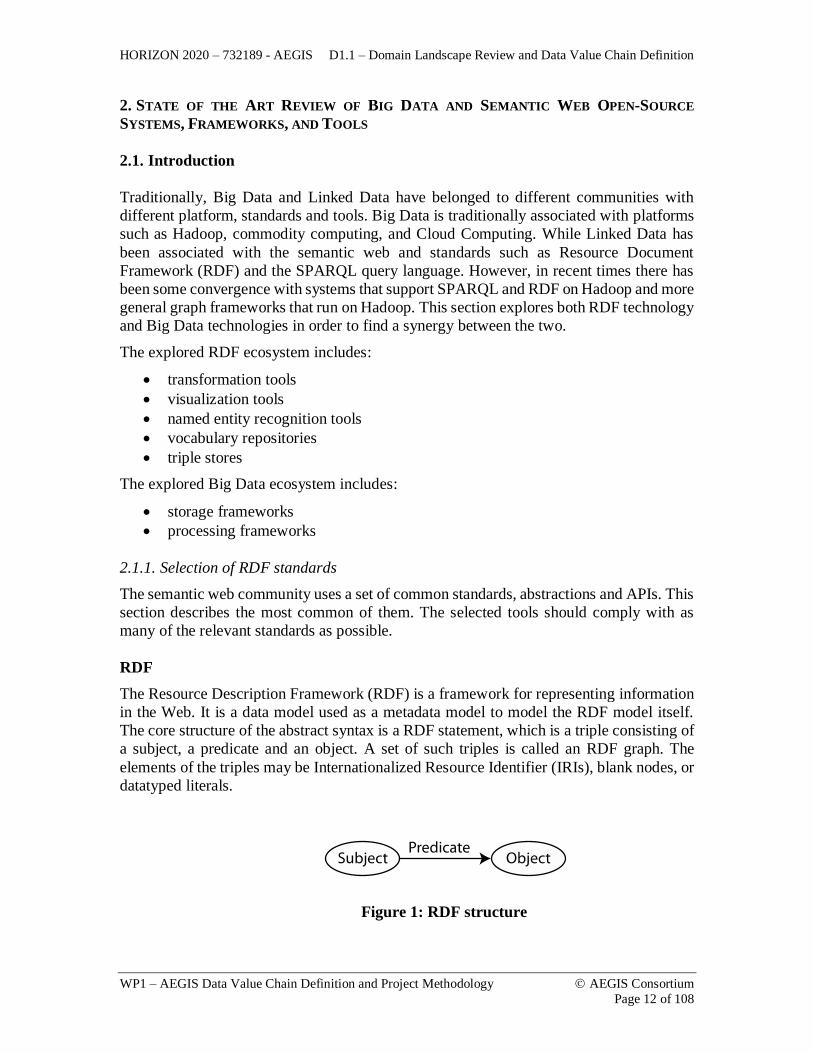
The Resource Description Framework (RDF) is a framework for representing information
in the Web. It is a data model used as a metadata model to model the RDF model itself.
The core structure of the abstract syntax is a RDF statement, which is a triple consisting of
a subject, a predicate and an object. A set of such triples is called an RDF graph. The
elements of the triples may be Internationalized Resource Identifier (IRIs), blank nodes, or
datatyped literals.
Figure 1: RDF structure

HORIZON 2020 – 732189 - AEGIS D1.1 – Domain Landscape Review and Data Value Chain Definition
WP1 – AEGIS Data Value Chain Definition and Project Methodology AEGIS Consortium
Page 13 of 108
An IRI or literal denote a resource in the world. Anything can be a resource including
physical things, documents, abstract concepts, numbers, and strings. IRIs are
generalizations of URI that permit a wider range of Unicode characters. One use of blank
nodes is when the relationship between a subject node and an object node is n-ary, with
n>2. A new entry is made for each blank node encountered in a triple.
A RDF vocabulary is a collection of resources intended for use in a RDF graph. There are
many standard vocabulary and here mention some of them:
• rdf – The RDF built-in vocabulary.
• rdfs – The RDF schema vocabulary.
• xsd – The RDF-compatible XSD types.
• skos – The Simple Knowledge Organization System
• foaf – The Friend of a Friend schema
• dc – The Dublin Core metadata
OWL
The W3C Web Ontology Language (OWL) is a Semantic Web language designed to
represent rich and complex knowledge about things, groups of things, and relations
between things.
As an ontology language, OWL defines terminology such as classes and properties, that
can be used in RDF documents. OWL defines two types of properties: object properties
and datatype properties. Object properties specify relationships between pairs of resources.
Datatype properties specify a relation between a resource and a data type value. In addition
to expressing the semantics of classes and properties, OWL can be used to relate instances.
For example, the “sameAs” property is used to state that two instances are identical. Such
a property is quite useful in a distributed environment where multiple identifiers might get
assigned to the same logical object by different entities. Additionally, OWL allows
restrictions on class properties and on properties of instances of this class.
OWL also provides features for relating ontologies to each other in cases like importing an
ontology or creating new versions of an ontology. A primary goal of the Semantic Web is
to describe ontologies in a way that allows them to be reused. However, different
applications have different needs even if they function in the same domain and as such
might requires slightly different ontologies. It is reasonable to expect that ontologies will
change over time, where the cause of change might be: the ontology was erroneous, the
domain has evolved, or there is a desire to represent the domain in a different way. In a
centralized system, it would be simple to modify the ontology, but in a decentralized
system, like the Web, changes can have far reaching impacts on resources beyond the
control of the original ontology author. When a change needs to be made, the document
should be copied and given a new IRI first. In order to connect this document to the original
version, OWL provides two settable properties: priorVersion and
backwardCompatibleWith. The priorVersion allows a link to the previous modified
version, while the backwardCompatibleWith property allows to flag whether the changes
break backward compatibility. In this way, OWL allows ontologies to evolve over time.
HORIZON 2020 – 732189 - AEGIS D1.1 – Domain Landscape Review and Data Value Chain Definition
WP1 – AEGIS Data Value Chain Definition and Project Methodology AEGIS Consortium
Page 14 of 108
SPARQL
The W3C SPARQL is a semantic query language for retrieving and manipulating RDF
data stored in RDF stores. SPARQL is considered one of the key technologies for semantic
web that was designed by W3C RDF Data Access Working Group.
A SPARQL query consists of conjunctions, disjunctions, triple patterns, and some optional
patterns. SPARQL shares some syntax with SQL such as SELECT and WHERE clauses.
The WHERE clause typically contains a set of triple patterns where the subject, predicate
and/or object can consist of variables. The following example builds on the friend-of-a-
friend ontology definition (foaf), and it provides a simple query to return all the names and
email addresses of RDF data that has the type foaf:Person.
PREFIX foaf: <http://xmlns.com/foaf/0.1/>
SELECT ?name ?email
WHERE
{
?subj a foaf:Person .
?subj foaf:name ?name .
?subj foaf:mbox ?email .
}
Code Listing 1: SPARQL – Friend of a Friend ontology example
The results of SPARQL queries can be expressed in various formats such as SPARQL
Query Result XML format, and JSON.
SPARQL 1.1 became a W3C recommendation in March 2013. It extends the SPARQL 1.0
with a set of features such as:
a. Aggregates: the ability to group results and calculate aggregates e.g. count, max,
min, sum.
b. Sub-Queries: the ability to embed a query inside another query.
c. Query Federation: the ability to split the query and send parts of it to different
SPARQL endpoints, services that accept SPARQL queries and return results, and
then join the returned results.
d. Update: support for updating the RDF stored using the update query.
e. Service description: the ability to discover capabilities of SPARQL endpoints.
f. Negation support through operators NOT EXIST and MINUS.
There are various implementations of SPARQL, such as RDF4J (OpenRDF Sesame), Jena,
and OpenLink Virtuoso. Moreover, there exists transformation tools to translate SPARQL
queries into SQL or XQuery.
SAIL API
The Eclipse RDF4J, formally known as OpenRDF Sesame, is an open source RDF
framework that provides a set of utilities to parse, store, and query RDF data. RDF4J fully
supports SPARQL 1.1 for query and update language. Also, it supports all the standard
HORIZON 2020 – 732189 - AEGIS D1.1 – Domain Landscape Review and Data Value Chain Definition
WP1 – AEGIS Data Value Chain Definition and Project Methodology AEGIS Consortium
Page 15 of 108
RDF file formats such as RDF/XML, N-Triples, and JSON-LD. RDF4J has an extension
API, SAIL, that provides a set of interfaces to enable plugging custom RDF persistence
storage engines.
The RDF Storage and Inference Layer (RDF SAIL) is a set of interfaces provided by
RDF4J that function as a decoupling layer between a specific database/triple store
implementation and the functional modules on top for parsing, querying, and accessing the
RDF data. Multiple SAIL APIs could be stacked on top of each using the StackableSail
interface. SAIL has become the de-facto set of interfaces used for providing access to RDF
data on top of non-RDF storage solutions. The SAIL API is implemented in some of the
evaluated storage solution as a means to provide RDF data support.
2.1.2. General Evaluation Criteria
The evaluation criteria used when assessing Big Data and Interlinked data tools and
frameworks includes aspects like: programming languages, frameworks, existence/quality
of APIs which we analyse for tools later as:
• Open Source License Model
• Development activity (a proxy for the popularity of the tool/platform)
• Extensibility
We explored solutions under open source licenses such as Apache v2 License, MIT, LGPL,
GPL v2, GPL v3. We favoured more permissive licenses (Apache v2, MIT, LGPL) over
GPL v2 (which is acceptable for all software, except commercial packaged software which
will require purchasing a license from the copyright holder), and we are not inclined to
select software with GPL v3 licensing, as it cannot be included in commercial software as
open-source. The development activity is mainly estimated from their GitHub account and
also by inspecting how user friendly their documentation is.
The technologies used to develop a tool may have an impact over the interaction with the
other tools in the ecosystem, as well as adapting the tool to the needs of the project. When
we talk about technologies used, we refer to the used programming languages and
frameworks. It is preferable to have the tool written in a commonly used
language/framework. This increases the possibility of easy integration with other tools or
modifying the tool to the needs of the project.
Quality of APIs addresses modularity and extensible plugin based implementations. The
semantic web community already has well established APIs when we are talking about
storage or querying. If certain APIs already exist in the community, it is preferable that a
candidate solution implements these APIs as opposed to only having their own custom
implementation.

HORIZON 2020 – 732189 - AEGIS D1.1 – Domain Landscape Review and Data Value Chain Definition
WP1 – AEGIS Data Value Chain Definition and Project Methodology AEGIS Consortium
Page 16 of 108
2.2. Transformation tools
Linked data represents a set of recommended principles and techniques that lead to the
structuring of data in a format that is more suitable for automatic processing. The majority
of data on the open Internet is, however, not in this format and instead follow a myriad of
formats, each having their own dictionary of terms and different structures. Data can be
stored in general XML, JSON, CSV, and relational database formats but it can also be
stored in structures more specialized to the field they are attached to. Some examples of
these specialized formats include Hierarchical Data (HDF), Network Common Data
(NetCDF), Gridded Binary (GRIB). All these specialized formats are designed with storage
and processing optimization goals and thus contain hidden structures that make it hard for
automated agents to retrieve such information from multiple, disparate sources.
2.2.1. Selection of tools
This section presents a number of tools that take structured or semi-structured data and
transform it into semantically enriched data. We have looked at solutions released under
open source licenses.
Anything to Triples (any23) (https://any23.apache.org/)
- Any23 is a library, a web service and a command line tool that extracts structured data
in RDF format from a variety of Web documents. Currently it supports the following input
formats: RDF/XML, Turtle, Notation 3; RDFa with RDFa1.1 prefix mechanism;
Microformats1 and Microformats2; JSON-LD: JSON for Linking Data; HTML5
Microdata; CSV and extraction support the following Vocabularies: Dublin Core Terms,
Description of a Career, Description Of A Project, Friend Of A Friend, GEO Names,
ICAL, lkif-core, Open Graph Protocol, BBC Programmes Ontology, RDF Review
Vocabulary, schema.org, VCard, BBC Wildlife Ontology and XHTML.
Apache Marmotta LDClient (http://marmotta.apache.org/ldclient)
- The Apache Marmotta LDClient library is a flexible and modular Linked Data Client
(RDFizer) that can be used by any Linked Data project independent of the Apache
Marmotta platform. The tool provides the infrastructure for retrieving resources via
different protocols and offers pluggable adapters that wrap other data sources as Linked
Data resources.
CSV2RDF4lod (https://github.com/timrdf/csv2rdf4lod-automation/wiki)
- Csv2rdf4lod transforms Comma-Separated-Values (CSV) to RDF format. The tool is
designed to aggregate and integrate multiple versions of multiple datasets of multiple
source organizations in an incremental and backward-compatible way.
Datalift (http://www.datalift.org/)
- Datalift takes its input data from heterogeneous formats like databases, CSV, XML,
RDF, RDFa and others and produces semantic, linked data. The Datalift platform is
actively involved in the Web mutation to the Linked Data.

HORIZON 2020 – 732189 - AEGIS D1.1 – Domain Landscape Review and Data Value Chain Definition
WP1 – AEGIS Data Value Chain Definition and Project Methodology AEGIS Consortium
Page 17 of 108
D2RServer (http://d2rq.org/d2r-server)
- D2RServer is a tool for publishing relational databases on the Semantic Web. It enables
RDF and HTML browsers to navigate the content of the database, and allows querying the
database using the SPARQL query language. It is part of the D2RQ Platform.
Morph-RDB
(http://mayor2.dia.fi.upm.es/oeg-upm/index.php/en/technologies/315-morph-rdb)
- Morph-RDB, formerly called ODEMapster is an RDB2RDF engine developed by the
Ontology Engineering Group, which follows the R2RML specification. The tool can
generate RDF instances from data in relation databases, an operation they refer to as
upgrade. Another supported operation query translation from SPARQL to SQL. The tool
works with relational database management systems like MySQL, PostgreSQL and
MonetDB. In addition, morph-RDB has also been extended to support Google Fusion
Tables in a project called morph-GFT.
Sparklify (http://aksw.org/Projects/Sparqlify.html)
- Sparqlify is a SPARQL-SQL rewriter that enables one to define RDF views on relational
databases and query them with SPARQL. It is currently in alpha state and powers the
Linked-Data Interface of the LinkedGeoData Server – i.e. it provides access to billions of
virtual triples from the OpenStreetMap database.
Tarql (http://tarql.github.io/)
- Tarql is a command-line tool for converting CSV files to RDF using SPARQL 1.1 syntax.
It’s written in Java and based on Apache ARQ.
Virtuoso (http://docs.openlinksw.com/virtuoso/)
- The Virtuoso Sponger is the Linked Data middleware component of Virtuoso that
generates Linked Data from a variety of data sources, supporting a wide variety of data
representation and serialization formats. Virtuoso has support for R2RML, which is a
language for expressing customized mappings from relational databases to RDF data sets.
Such mappings provide the ability to view existing relational data in the RDF data model,
expressed in a structure and target vocabulary of the mapping author's choice without
disrupting the underlying database structure.
CSVImport (http://aksw.org/Projects/CSVImport.html)
- Statistical data on the web is often published as Excel sheets. Although they have the
advantage of being easily readable by humans, they cannot be queried efficiently.
CSVImport uses the RDF Data Cube vocabulary for the conversion. Transforming CSV to
RDF in a fully automated way is not feasible as there may be dimensions encoded in the
heading or label of a sheet.
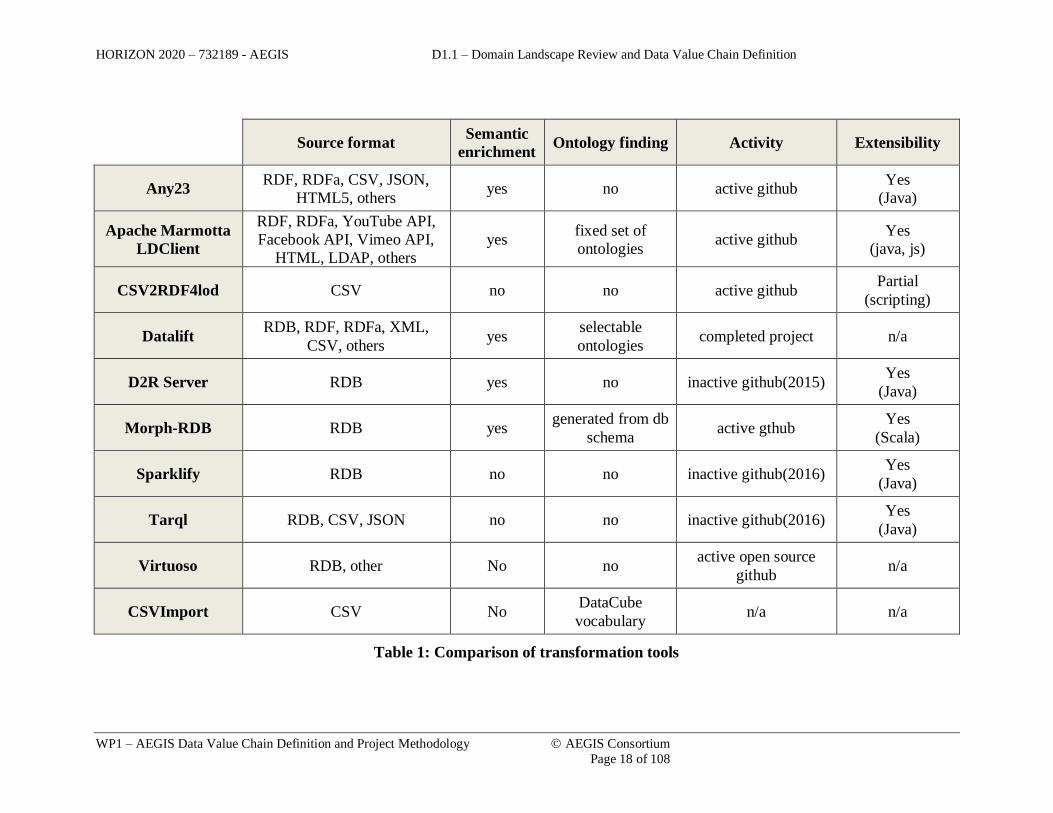
2.2.2. Comparison of tools
As far as transformation tools go, many of them are specialized and provide a general full
spectrum of translations. The two main translation are CSV-to-RDF and Relational-to-
RDF. Existing platforms that support Linked Data have their internal own internal native
transformation components as is the case with Datalift and Virtuoso. Transformations can
range from straight-forward technical data format conversions to ambitious knowledge
transformation, including semantic enrichments. Another explored aspect is whether the
tool helps in finding and identifying the appropriate ontologies/vocabularies.
HORIZON 2020 – 732189 - AEGIS D1.1 – Domain Landscape Review and Data Value Chain Definition
WP1 – AEGIS Data Value Chain Definition and Project Methodology AEGIS Consortium
Page 18 of 108
Source format Semantic
enrichment Ontology finding Activity Extensibility
Any23 RDF, RDFa, CSV, JSON,
HTML5, others yes no active github
Yes
(Java)
Apache Marmotta
LDClient
RDF, RDFa, YouTube API,
Facebook API, Vimeo API,
HTML, LDAP, others
yes fixed set of
ontologies active github
Yes
(java, js)
CSV2RDF4lod CSV no no active github Partial
(scripting)
Datalift RDB, RDF, RDFa, XML,
CSV, others yes
selectable
ontologies completed project n/a
D2R Server RDB yes no inactive github(2015) Yes
(Java)
Morph-RDB RDB yes generated from db
schema active gthub
Yes
(Scala)
Sparklify RDB no no inactive github(2016) Yes
(Java)
Tarql RDB, CSV, JSON no no inactive github(2016) Yes
(Java)
Virtuoso RDB, other No no active open source
github n/a
CSVImport CSV No DataCube
vocabulary n/a n/a
Table 1: Comparison of transformation tools
HORIZON 2020 – 732189 - AEGIS D1.1 – Domain Landscape Review and Data Value Chain Definition
WP1 – AEGIS Data Value Chain Definition and Project Methodology AEGIS Consortium
Page 19 of 108
2.3. Visualization and Exploration
The vision of Semantic Web and Linked Data is to provide a structuring of data that is both
human and machine readable. Humans possess great pattern recognition and analytical
skills when presented the data in graphical format as opposed to a numerical or textual
representation. A good interface to understand the information provided by the Semantic
Web is through exploration and visualization. The main goals of visualization are to
present, transform and convert data into a visual representation that humans can easily
understand. The tools are also expected to allow users to dynamically explore the visual
representation.
2.3.1. Selection of tools
WebVOWL (http://vowl.visualdataweb.org/webvowl.html)
- WebVOWL is a web application for the interactive visualization of ontologies. It
implements the Visual Notation for OWL Ontologies (VOWL) by providing graphical
depictions for elements of the Web Ontology Language (OWL) that are combined to a
force-directed graph layout representing the ontology. Interaction techniques allow to
explore the ontology and to customize the visualization. A custom ontology can be
visualized by either entering the IRI of the ontology or uploading the ontology file.
WebVOWL is able to visualize most language constructs of OWL 2 but not yet all of them.
For instance, complex datatypes and some instance level constructs are not supported by
WebVOWL at the moment.
LD-VOWL (http://vowl.visualdataweb.org/ldvowl.html)
- LD-VOWL is a web application that can extract ontology information from SPARQL
endpoints and display the extracted information in an overview visualization using the
VOWL notation. SPARQL queries are used to infer the schema information from the
endpoint's data, which is then gradually added to an interactive VOWL graph visualization.
RelFinder (http://www.visualdataweb.org/relfinder.php)
- The RelFinder extracts and visualizes relationships between given objects in RDF data
and makes these relationships interactively explorable. Highlighting and filtering features
support visual analysis both on a global and detailed level. It can be easily configured to
work with different RDF datasets that provide standardized SPARQL access and it can
even be called from remote to access a specific dataset and/or certain objects. The
RelFinder is readily configured to access RDF data of the DBpedia project and only
requires a Flash Player plugin to be executed.
rdf:SynopsViz (http://synopsviz.imis.athena-innovation.gr/)
- It constructs hierarchical representation of RDF data and computes statistical parameters
of a dataset. The authors of the tool outline certain features such on-the-fly hierarchy
construction, faceted browsing and an attempt to measure data quality via dataset metadata.
Allowing five types of charts, a timeline and a tree map rdf:SynopsViz, however, has an
intricate interface that might seem too complex for a lay user and therefore is not intended
to be used by non-experts.

HORIZON 2020 – 732189 - AEGIS D1.1 – Domain Landscape Review and Data Value Chain Definition
WP1 – AEGIS Data Value Chain Definition and Project Methodology AEGIS Consortium
Page 20 of 108
LOD Visualization Tool (http://lodvisualization.appspot.com/)
- is a service based on the LDVM model. The service is able to visualize a hierarchy of
classes and properties, and connection points between arbitrary concepts and view
instances with the highest in-/out-degrees.
OntoWiki CubeViz (http://cubeviz.aksw.org/)
- is a faceted browser tool based on OntoWiki (www.ontowiki.org), which works with the
data presented in RDF Data Cube Vocabulary. Being compatible with SDMX
(http://sdmx.org/), CubeViz can visualize statistical data in various formats, e.g. a map,
column charts, a pie chart. CubeViz.js, a JavaScript application that will not need a PHP
backend and will provide the same functionality is currently under development.
LodLive (http://en.lodlive.it/)
- is a tool that offers effective graph visualization of RDF resources based solely on
SPARQL endpoints. It provides a demonstration of the use of Linked Data standards to
browse RDF resources published according to the W3C SPARQL standards using a simple
and friendly interface. It connects the resources published in its configured endpoints and
also allows users to pass from one endpoint to another.
GraphVizdb (http://graphvizdb.imis.athena-innovation.gr)
- is a tool for visualization and graph exploration operations over very large RDF graphs.
It provides quick multi-level exploration, interactive navigation and keyword search on the
graph metadata. It also displays details about each selected node and its incoming edges.
However, the final display of the whole dataset seems too complex for non-expert users,
as too many nodes and edges are displayed at the same time.
2.3.2. Comparison of tools
This category comprises visualization tools for RDF data following the Linked Data
principles. The specific evaluation criteria for this category are:
• Ability to upload datasets as well as to use SPARQL endpoints: Is the functionality
of uploading a dataset implemented? Is it possible to provide the URI of the
SPARQL endpoint of the dataset?
• Out-of-the-box support of different RDF vocabularies: Once the RDF data is
uploaded for visualization, is the tool capable of making use of the semantics
embedded in the dataset using different popular vocabularies or ontologies? (E.g.
DataCube, SDMX, DCAT, etc.).
• Automatic workflow without manual configuration: Is the tool capable of providing
a visualization to the user in an automated way (following a data selection/pre-
selection phase by the user) or is the user left to configure and choose every
parameter of the visualization?
• Ability to change structure and layout of an arbitrary visualization: Once the
visualization is generated, is it possible to change its layout and structure? Can the
visualization be personalised in an easy way by the user?
• Ability to consume (save, load, share or embed) a resulting chart: Once the
visualization is generated can it be saved for future reuse, exported in different
formats or re-loaded in another time.

HORIZON 2020 – 732189 - AEGIS D1.1 – Domain Landscape Review and Data Value Chain Definition
WP1 – AEGIS Data Value Chain Definition and Project Methodology AEGIS Consortium
Page 21 of 108
Dataset upload or
SPARQL endpoint
Different
RDF vocabularies
Automatic
workflow
Modify structure
and layout
Consumption functions
(Save, load, share, embed)
WebVOWL Both No Yes Yes Export as SVG or JSON
LD-VOWL SPARQL
endpoint SKOS Yes Yes No
RelFinder No No Yes Yes No
rdf:SynopsViz Both No No No No
LOD
Visualization
Tool
SPARQL
endpoint No Yes No No
OntoWiki
CubeViz
Dataset
upload
DataCube,
SDMX Yes No No
LodLive SPARQL
endpoint No Yes Yes No
GraphVizdb
Only 2 SPARQL
endpoints (DBpedia
Person & DBLP)
No Yes Yes No
Table 2: Comparison of visualisation tools

HORIZON 2020 – 732189 - AEGIS D1.1 – Domain Landscape Review and Data Value Chain Definition
WP1 – AEGIS Data Value Chain Definition and Project Methodology AEGIS Consortium
Page 22 of 108
2.4. Named Entity Recognition Tools
The Semantic Web vision requires the data on the Web to be represented in a machine-
readable format. A significant percentage of the online data is available in an unstructured
format; thus, tools that transform these data into RDF are of great importance. The field
concerned with programming computers to effectively process natural language text is
called Natural Language Processing (NLP) and is closely linked to computer science,
artificial intelligence, and computational linguistics. A very important subtask of NLP is
Named Entity Recognition (NER), which is the information extraction task that seeks to
locate and classify named entities (e.g., persons, organizations and locations) in text into
pre-defined categories.
2.4.1. Selection of tools
Natural Language Understanding
(https://console.ng.bluemix.net/catalog/services/natural-language-understanding/)
- Natural Language Understanding as part of IBM’s Bluemix analyses text to extract meta-
data from content such as concepts, entities, keywords, categories, sentiment, emotion,
relations, semantic roles, using natural language understanding. With custom annotation
models developed using Watson Knowledge Studio, it identifies industry/domain specific
entities and relations in unstructured text. It can find people, places, events, and other types
of entities mentioned in a given content. Natural Language Understanding is a powerful
tool that takes the place of AlchemyLanguage API and extends its features. It provides a
Restful API to analyse plain text, HTML, or a public URL after the removal of most
advertisements and other unwanted content.
TERMite (https://www.scibite.com/products/termite)
- is a commercial named entity recognition (NER) and extraction engine, which can
recognize and extract relevant terms from a given unstructured text. Its main purpose is
about processing scientific text using biomedical ontologies. It provides a user-friendly
environment to extract knowledge as you type and also an API to receive documents and
send back the enriched results. It can handle multiple input formats, such as .txt, .pdf, .ppt,
.xml, .tsv and more and also provides multiple output formats, such as .json, .xml, .tsv and
.html. TERMite offers the ability to search terms from hierarchical ontologies or from
regular expressions.
FOX (http://aksw.org/Projects/FOX.html)
- is a framework that relies on ensemble learning and use decision-tree-based algorithms
to integrate and merge the results of different Named Entity Recognition tools. It uses
AGDISTIS (http://aksw.org/Projects/AGDISTIS.html), an Open Source Named Entity
Disambiguation Framework able to link entities against every Linked Data Knowledge
Base, to disambiguate entities against DBpedia. Fox can be used programmatically and
also comes with a RESTful web service that can be used with FOX-Java or FOX-Python
bindings.
DBpedia Spotlight (http://www.dbpedia-spotlight.org/)
- is a tool for automatically annotating mentions of DBpedia resources in text, providing a
solution for linking unstructured information sources to the Linked Open Data cloud
through DBpedia. It supports multiple formats, such as HTML, JSON, NIF, N-Triples,
HORIZON 2020 – 732189 - AEGIS D1.1 – Domain Landscape Review and Data Value Chain Definition
WP1 – AEGIS Data Value Chain Definition and Project Methodology AEGIS Consortium
Page 23 of 108
XML and also multiple languages through pre-built datasets. It can also be used for
building your solution for Named Entity Recognition, Keyphrase Extraction, Tagging, etc,
or create your models of DBpedia Spotlight in your language. Currently DBpedia Spotlight
contains two approaches: Model and Lucene.
DBpedia Lookup (https://github.com/dbpedia/lookup)
- is a web service that can be used to look up DBpedia URIs by related keywords. Related
means that either the label of a resource matches, or an anchor text that was frequently used
in Wikipedia to refer to a specific resource matches (for example the resource
http://dbpedia.org/resource/United_States can be looked up by the string "USA"). The
results are ranked by the number of inlinks pointing from other Wikipedia pages at a result
page. Two APIs are offered: KeywordSearch and PrefixSearch. The KeywordSearch API
can be used to find related DBpedia resources for a given string and the PrefixSearch API
can be used to implement autocomplete input boxes. It supports two response types, XML
and JSON.
OpenER (http://www.opener-project.eu/)
- the project’s main goal is to provide a set of ready to use tools to perform some natural
language processing tasks, free and easy to adapt for Academia, Research and Small and
Medium Enterprise to integrate them in their workflow. More precisely, OpenER detects
and disambiguates entity mentions and performs sentiment analysis and opinion detection
on the texts. The Named Entity Recognition and Classification component identifies names
of persons, cities, museums, and classifies them in a semantic class, using the Apache
OpenNLP API. The Named Entity Disambiguation component aims at identifying to which
actual entity in a catalogue such name is referring to, using DBPedia Spotlight.
2.4.2. Comparison of tools
The specific evaluation criteria for this category, identified during the relevant literature
review and adapted, where needed, to better match the scope of AEGIS, are as follows:
• Extraction: Can the tool be provided with chunks of text to perform named entity
extraction on it? Can the tool determine the context based on only one given term?
• Disambiguation: Does the tool perform disambiguation?
• Linked Data resources: Which Linked Data resources, such as DBpedia, freebase,
Wikidata are invoked by the tool.
• Daily allowance: How many free transactions are allowed?
• Commercial or free: Is the tool commercial or free
• Web service: is the tool provided as a web service?
The following table holds the results for the evaluation:

HORIZON 2020 – 732189 - AEGIS D1.1 – Domain Landscape Review and Data Value Chain Definition
WP1 – AEGIS Data Value Chain Definition and Project Methodology AEGIS Consortium
Page 24 of 108
Extraction Disambiguation Linked Data
resources Daily allowance
Commercial
or free Web service
Natural Language
Understanding Yes Yes -
1,000 free NLU
Items Per Day1 Commercial Restful API
DBpedia Spotlight Yes Yes DBpedia Open Free Web service
DBpedia Lookup No No DBpedia Open Free Web service
TERMite Yes Yes Biomedical
Ontologies No Commercial Restful API
OpenER Yes Yes DBpedia Open Free Web service
FOX Yes Yes DBpedia, Other
(URIs assignment) Open Free Web service
Table 3: Comparison of named entity recognition tools
1 A NLU item is based on the number of data units enriched and the number of enrichment features applied. A data unit is 10,000 characters or less. For example:
extracting Entities and Sentiment from 15,000 characters of text is (2 Data Units * 2 Enrichment Features) = 4 NLU Items.

HORIZON 2020 – 732189 - AEGIS D1.1 – Domain Landscape Review and Data Value Chain Definition
WP1 – AEGIS Data Value Chain Definition and Project Methodology AEGIS Consortium
Page 25 of 108
2.5. Vocabulary Repositories
Since vocabulary re-usability is vital for the growth of Linked Data, various vocabulary
repositories have been created in the past. The added value of such repositories consists of
the ability to search for various vocabularies in a single database, to get access to
vocabulary metadata like author and upload information, the ontology’s scope and intended
usage, as well as user feedback and metadata about mappings that interlinks different
vocabularies.
2.5.1. Selection of tools
Prefix.cc (http://prefix.cc/)
- Prefix.cc is a W3C tool developed to simplify a common task in the work of RDF
developers: remembering and looking up URI prefixes. Prefix.cc, built without ability to
accept user feedback, advanced search features or interlinking between different
vocabularies, is more of an index than a full-scale repository. It nevertheless doesn’t fail to
contain references to a wide variety of open vocabularies.
Linked Open Vocabularies (http://lov.okfn.org/)
- Linked Open Vocabularies (LOV) is described on its homepage as an entry point to the
growing ecosystem of linked open vocabularies (RDFS or OWL ontologies) used in the
Linked Data Cloud. LOV offers advanced features like vocabulary interlinking and
vocabulary metadata, like author information and basic vocabulary descriptions. Through
LODStats, Linked Open Vocabularies offers statistics about the usage of vocabularies in
various linked open datasets
LinDA Vocabulary and Metadata Repository
(http://linda.epu.ntua.gr/vocabularies/all/)
- is a web tool that synchronizes with well-established vocabulary catalogues (LOV,
prefix.cc, LODStats) and allows enrichment with comments and rating from users. It
provides the ability to search by vocabularies, classes and properties, add / remove
vocabularies based on the specific needs, enrich the existing vocabularies and more. It also
offers an API for storing and accessing these vocabularies.
DERI Vocabularies (http://vocab.deri.ie/)
- is a URI space for RDF Schema vocabularies and OWL ontologies maintained at DERI,
the Digital Enterprise Research Institute at NUI Galway, Ireland. Its main goal is to
dramatically reduce the time required to create, publish and modify vocabularies for the
Semantic Web.
BioPortal (http://bioportal.bioontology.org/)
- is a comprehensive repository of biomedical ontologies. It provides access to commonly
used biomedical ontologies and to tools for working with them.
2.5.2. Comparison of vocabularies
The following table contains a comparison of the most essential functional specifications
of the presented vocabulary repositories, as these were identified during literature review:

HORIZON 2020 – 732189 - AEGIS D1.1 – Domain Landscape Review and Data Value Chain Definition
WP1 – AEGIS Data Value Chain Definition and Project Methodology AEGIS Consortium
Page 26 of 108
Prefix.cc LOV LinDA DERI
Vocabularies BioPortal
Catalogue of vocabularies Yes Yes Yes Yes Yes
Exposure of vocabulary
entities (classes/properties) Yes Yes Yes Yes Yes
Exposure of connections
between entities No Yes Yes No
Yes (Through
visualization)
Vocabulary Metadata Partial Yes Yes Yes Yes
Discussions and user feedback No No Yes No Yes
Term suggestions API No Yes No? No Yes (Ontology
Suggestion)
SPARQL endpoint No Yes Yes No No
Table 4: Comparison of vocabularies

HORIZON 2020 – 732189 - AEGIS D1.1 – Domain Landscape Review and Data Value Chain Definition
WP1 – AEGIS Data Value Chain Definition and Project Methodology AEGIS Consortium
Page 27 of 108
2.6. Query Tools
In the Semantic Web ecosystem, SPARQL is the de-facto choice of query language.
SPARQL is a semantic query language for retrieving and manipulating RDF data from
triple stores. The language shares some syntax with SQL such as SELECT and WHERE
clauses.
Since RDF data is easily representable in graph format, there is a de-facto translation of
SPARQL onto graph storages, through Apache TinkerPop.
Another standard for querying structured and unstructured data is through free-text search.
Most of the storage solutions analysed in the next section will support free-text search as a
base querying facility.
In this section we investigate Apache TinkerPop and LinDA Query Designer as alternative
querying tools.
2.6.1. Selection of tools
LinDA Query Designer
LinDA Query Designer can be used to create simple or complex linked data queries in a
drag-n-drop manner, similar to SQL Query Designers of relational database management
systems. With LinDA Query Designer you can create complex queries, join multiple data
sources and apply advanced filters with a few clicks. The user selects one (or more)
SPARQL endpoints and/or stored RDF datasets and the LINDA Query Designer auto-
detects the available classes and object properties. The items are presented with pagination,
and they can be filtered via the “Search terms” input box. The user selects the classes that
he desires and drags them to the Query Designer Canvas. The system auto-detects the
available properties of the classes and the user selects the properties that he/she wishes to
include in the query. The Query Designer prompts the number of instances of each property
/ class as an indication for the user for the popularity of the class. For each property, the
user can add filters and ORDER-BY clauses. The user can then click the run button and
get the results of the query. No prior knowledge of the SPARQL language is needed, and
the user can see in real-time the SPARQL query that is being constructed. Moreover, the
user can link any number of classes together in order to create more complicated queries.
The classes can reside in different SPARQL endpoints through the use of the Federated
Query feature of SPARQL 1.1.
Apache TinkerPop
Apache TinkerPop is an open source, vendor-agnostic, and graph computing framework
distributed under the commercial friendly Apache2 license. When a data system is
TinkerPop-enabled, its users are able to model their domain as a graph and analyse that
graph using the Gremlin graph traversal language. Gremlin works over those graph
databases/frameworks that implement the Blueprints property graph data model.
Blueprints is a collection of interfaces, implementations, outplementations, and test suites
for the property graph data model. Blueprints is analogous to the JDBC, but for graph
databases. As such, it provides a common set of interfaces to allow developers to plug-and-
play their graph database backend. Moreover, software written atop Blueprints works over
all Blueprints-enabled graph databases. If these interfaces are implemented, then the

HORIZON 2020 – 732189 - AEGIS D1.1 – Domain Landscape Review and Data Value Chain Definition
WP1 – AEGIS Data Value Chain Definition and Project Methodology AEGIS Consortium
Page 28 of 108
underlying graph database is “Blueprints-enabled”. In some situations, it is not required to
expose Blueprints-enabled graph database, but instead, to expose an implementation of
another set of interfaces. With the use of outplementations any Blueprints-enabled graph
database can be framed within the context of that set of interfaces.
Blueprints Sail outplementation is an implementation of the Sail interface. Any triple or
quad-store developer can implement the Sail interfaces in order to allow third-party
developer to work with different stores without having to change their code. This is very
handy as different RDF-store implementations are optimized for different types of use
cases. In analogy, Sail is like the JDBC of the RDF database world.
PropertyGraphSail, like Blueprints Sail, adapts the Blueprints Property Graph data model
to the Resource Description Framework (RDF). However, it serves a different purpose.
Blueprints Sail allows generic RDF data to be stored in a Blueprints-compatible graph
database like Neo4j, or OrientDB, while PropertyGraphSail allows generic Blueprints
graphs to be accessed as if they were RDF data.
Gremlin was not designed specifically for RDF querying, like SPARQL was, but since it
supports arbitrary graph query, it also has support for running SPARQL queries as long as
the underlying graphs are Sail-based graphs. This means that any storage that supports the
SAIL API are possible candidates for RDF storages.

HORIZON 2020 – 732189 - AEGIS D1.1 – Domain Landscape Review and Data Value Chain Definition
WP1 – AEGIS Data Value Chain Definition and Project Methodology AEGIS Consortium
Page 29 of 108
2.7. Metadata Management and Collecting Tools
In this section we provide an overview of tools for managing and collecting metadata. Such
tools play an important role within Open Data ecosystems, where metadata is usually
collected from various, heterogeneous data sources and presented on one platform. One
aspect of the data value chain of AEGIS platforms is to gather data, harmonize it and make
it available in one place. Therefore, technologies and software from the Open Data domain
may be applicable.
2.7.1. Selection of tools
CKAN
CKAN is an open source data management system mainly for publishing and managing
Open Data. It is maintained and developed by the Open Knowledge Foundation
(https://ckan.org/). The web application is developed in Python and offers a comprehensive
frontend for creating, editing and searching a meta data registry. It employs a PostgreSQL
database for storing the data and a Solr search server for efficiently searching the data. In
addition, all functionalities are available via a JSON-based API. An extensive plug-in
interface allows the customization of built-in features and the extension with new
functionalities. The underlying data structure has established as a de-facto standard for
representing Open Data metadata. It basically consists of key-value pairs for representing
the attributes of a dataset.2 CKAN is widely used for building Open Data platforms.
Prominent examples are the European Data Portal (https://www.europeandataportal.eu/)
and the Open Data portal of the United Kingdom (https://data.gov.uk/). The flat JSON-
based data structure is tightly coupled to the technology stack employed. Therefore, an
adoption to different data, especially Linked Data formats and structures is only possible
to a limited extent, since CKAN only allows to define custom extra data attributes within
the limitations of the JSON standard.
CKAN Harvest Extension
CKAN offers and officially maintained extension for harvesting metadata from third-party
sources. It is built upon a pluggable queue backend, where out-of-box Redis and RabbitMQ
is supported. The extension offers a CLI and a web frontend for managing scheduled
harvesting jobs. Each job consists of two queues, the first one gathers the data and the
second one imports it into the CKAN instance. The software is tightly coupled to CKAN.
It can gather data from various sources, but it can only export it to CKAN.
(https://github.com/ckan/ckanext-harvest)
EDP3 Metadata Transformer Service
The EDP Metadata Transformer Service is an open source standalone solution for
harvesting metadata from diverse Open Data sources (https://gitlab.com/european-data-
portal/MetadataTransformerService). The web application allows the scheduled fetching
of metadata, their rule-based transformation and the export to a target platform. The
application is written in JavaEE, extendable and offers a user-friendly web frontend. A
2 http://docs.ckan.org/en/latest/api/index.html#module-ckan.logic.action.create 3 European Data Portal

HORIZON 2020 – 732189 - AEGIS D1.1 – Domain Landscape Review and Data Value Chain Definition
WP1 – AEGIS Data Value Chain Definition and Project Methodology AEGIS Consortium
Page 30 of 108
variety of interface adapters were already developed, either specialized to concrete
interfaces like CKAN or DCAT-AP or more generic for JSON- or XML-based REST
interfaces. The transformation rules are directly written in the frontend with simple
scripting languages. For XML data XLST is employed, and for JSON data, JavaScript is
employed. Users of this service create source and target repositories and connecting them
by defining a harvester with a corresponding transformation rule. The individual runs of
the scheduled harvester runs can be monitored and evaluated. The tool can be adapted to
harvest not only meta data but also actual data, and transform it accordingly.
EDP Metadata Quality Assurance
The MQA is web application for periodically validating a meta data registry against a
predefined schema (https://gitlab.com/european-data-portal/metadata-quality-assurance).
It was specifically developed for validating DCAT-AP, the Linked Data specification and
vocabulary for European public data. The software generates detailed reports, statistics and
visualizations about the quality of the meta data. Possible violations are highlighted and
described. In addition, the MOA offers its results via a machine-readable API. The schema
to be checked against can be defined dynamically and thus the platform can be adopted to
be used with a various kinds of data specifications.

HORIZON 2020 – 732189 - AEGIS D1.1 – Domain Landscape Review and Data Value Chain Definition
WP1 – AEGIS Data Value Chain Definition and Project Methodology AEGIS Consortium
Page 31 of 108
2.8. Storage
In this section we investigate different storage solutions for the AEGIS platform. The
investigated storage solutions include both existing triple stores and Big Data storage
solutions.
In order to provide support for Linked Data, non-RDF stores should either provide or allow
easy implementations of the SAIL API described in the introduction section.
The AEGIS platform aims at providing support for transferring data safely and securely
and as such we add the security aspect to our evaluation criteria of storage solutions.
Additionally, in order to be able to accommodate support for Big Data, we investigate if
the storage solutions can scale horizontally.
2.8.1. Evaluation criteria
In addition to the general evaluation criteria, we have additional criteria that apply to
storage support:
• Querying support
• Security of data
• Horizontal scalability
Querying support
In order for a storage solution to be a candidate for RDF storage, it needs to implement a
minimal querying support. In the semantic web community, this mainly implies access to
SPARQL queries. Another option is through TinkerPop/Gremlin querying support, which
also supports running SPARQL queries if the underlying graph implements the SAIL API.
Security of data
• Perimeter security and Authentication – Required to guarding access to the
system, its data and its services. Authentication makes sure that the user is who he
claims to be. Kerberos and LDAP are examples of solutions to these problems.
• Authorization and Access – Required to manage access and control over data,
resources and services. Guarantees are related to the ability of user to view only
material defined within their access scope. Here we talk about directory and files
permissions and role based access control.
• Data protection – Required to control access to sensitive data. We are talking here
about encryption of data while stored as well as when in transit over the network,
be in internal or the internet. Another aspect to this might be the anonymization of
data when we store it in the system.
• Audit and Reporting – Required to maintain and report activity on the system.
Auditing is required to ensure security compliance as well as to enable security
forensics to detect the sources of security leaks.

HORIZON 2020 – 732189 - AEGIS D1.1 – Domain Landscape Review and Data Value Chain Definition
WP1 – AEGIS Data Value Chain Definition and Project Methodology AEGIS Consortium
Page 32 of 108
Horizontal scalability
Another important aspect to consider while choosing the RDF store is the horizontal
scalability, by which we mean increasing the capacity of the RDF store by adding more
machines. Single machine RDF stores are not viable choices since we are expecting big
volumes of data.
2.8.2. Triple stores
The RDF data management ecosystem can be subdivided into two categories native and
non-native, depending on whether the durable data is stored as RDF structures. The non-
native solutions use databases or other related systems to store RDF structures. The
category of solutions that use databases as a storage layer is split further into three big
categories:
• Vertical (triple) table stores: the triples are stored in a three column table – subject,
predicate, and object.
• Property (n-ary) table stores: the triples are stored as n-ary table columns for the
same subject.
• Horizontal (binary) table stores: the triples are stored as a set of partitioned binary
tables, with one table for each RDF property.
Figure 2: Triple store types
Apache Jena
Apache Jena is an open source Semantic Web framework for Java. It contains interfaces
for representing all the key concepts of RDF like models, resources, properties, literals,
statements.

HORIZON 2020 – 732189 - AEGIS D1.1 – Domain Landscape Review and Data Value Chain Definition
WP1 – AEGIS Data Value Chain Definition and Project Methodology AEGIS Consortium
Page 33 of 108
Figure 3: Apache Jena relevant modules
Storage - Jena allows the sourcing of models from files, databases, URLs or a combination
of these. TDB is perhaps the most used storage extension which enables Jena to function
as a high performance, single machine, RDF store. SDB, another Jena storage extension,
uses an SQL database for the storage and query of RDF data. Many databases are
supported, both open source and proprietary. Apache Jena Elephas is a set of libraries that
provide various basic building blocks which enable the use with Apache Hadoop based
applications.
Querying - Similar to other RDF tools, Jena allows the querying of models using SPARQL.
The core Jena API also supports some limited querying primitives. Listing all the
statements in the model is perhaps the crudest way of querying a model. The querying
model allows more complicated queries with the use of selectors that can filter statements
of the RDF graph based on subject, predicates and objects. Full text search is supported
through Apache Lucene/Solr.
Ontologies - Since Jena is fundamentally a RDF platform, Jena has full support RDFS and
partial support for OWL 1.1, with promises of better OWL support in future versions.
Security - Jena Permissions transparently intercepts calls to the Graph or Model interface
and evaluates access. It does not implement any specific security policy but provides a
framework for developers or integrators to implement any desired policy. Apache Fuseki
is a SPARQL server built on Jena, that also integrates security through Apache Shiro.
Apache Shiro is a Java security framework that allows authentication, authorization,
cryptography and session management.
Licensing - Jena is an Apache project and thus is under the Apache 2.0 license.
Activity - The Jena GitHub account (https://github.com/apache/jena) shows sustained
activity with periodic releases.
The documentation (https://jena.apache.org/documentation) is extensive and easy to
follow.
Horizontal scalability and Extensibility - Jena allows pluggable storage and at least two of
the choices have good horizontal scalability. Elephas allows integration with Apache
Hadoop, a platform with good support for scalability. The SDB extension allows any
relation database to be plugged in, and, for example, MySQL Cluster is known for its good
scalability.
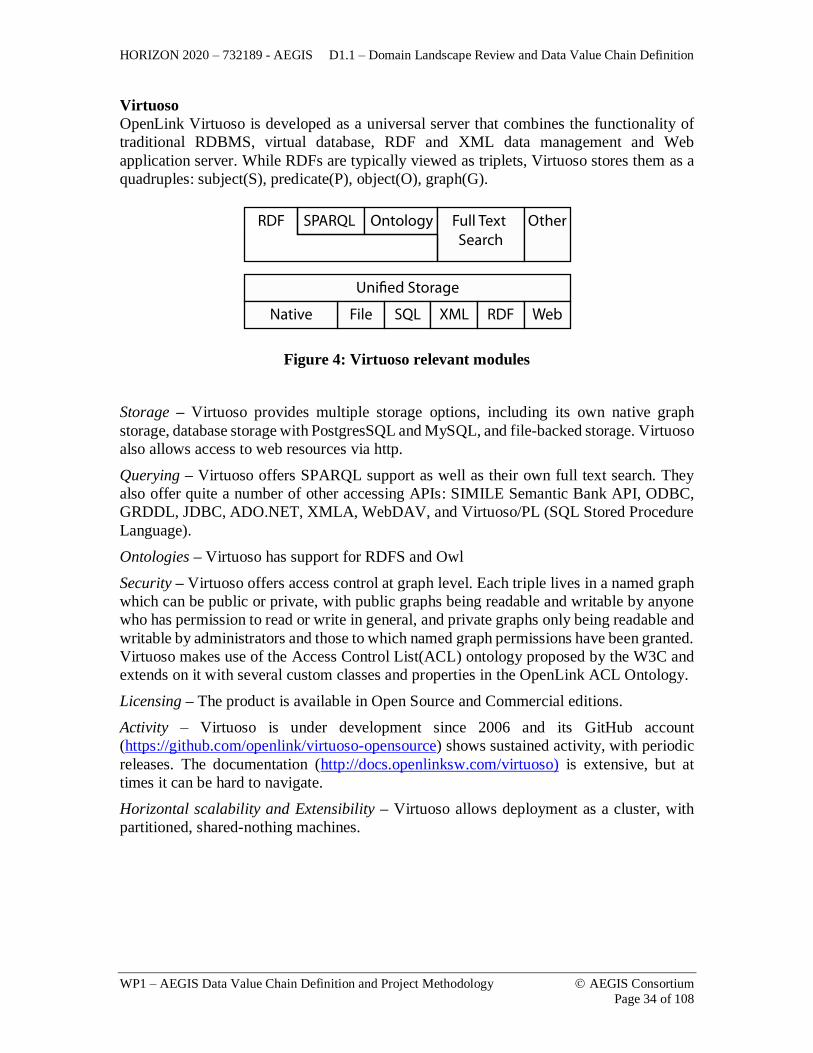
HORIZON 2020 – 732189 - AEGIS D1.1 – Domain Landscape Review and Data Value Chain Definition
WP1 – AEGIS Data Value Chain Definition and Project Methodology AEGIS Consortium
Page 34 of 108
Virtuoso
OpenLink Virtuoso is developed as a universal server that combines the functionality of
traditional RDBMS, virtual database, RDF and XML data management and Web
application server. While RDFs are typically viewed as triplets, Virtuoso stores them as a
quadruples: subject(S), predicate(P), object(O), graph(G).
Figure 4: Virtuoso relevant modules
Storage – Virtuoso provides multiple storage options, including its own native graph
storage, database storage with PostgresSQL and MySQL, and file-backed storage. Virtuoso
also allows access to web resources via http.
Querying – Virtuoso offers SPARQL support as well as their own full text search. They
also offer quite a number of other accessing APIs: SIMILE Semantic Bank API, ODBC,
GRDDL, JDBC, ADO.NET, XMLA, WebDAV, and Virtuoso/PL (SQL Stored Procedure
Language).
Ontologies – Virtuoso has support for RDFS and Owl
Security – Virtuoso offers access control at graph level. Each triple lives in a named graph
which can be public or private, with public graphs being readable and writable by anyone
who has permission to read or write in general, and private graphs only being readable and
writable by administrators and those to which named graph permissions have been granted.
Virtuoso makes use of the Access Control List(ACL) ontology proposed by the W3C and
extends on it with several custom classes and properties in the OpenLink ACL Ontology.
Licensing – The product is available in Open Source and Commercial editions.
Activity – Virtuoso is under development since 2006 and its GitHub account
(https://github.com/openlink/virtuoso-opensource) shows sustained activity, with periodic
releases. The documentation (http://docs.openlinksw.com/virtuoso) is extensive, but at
times it can be hard to navigate.
Horizontal scalability and Extensibility – Virtuoso allows deployment as a cluster, with
partitioned, shared-nothing machines.

HORIZON 2020 – 732189 - AEGIS D1.1 – Domain Landscape Review and Data Value Chain Definition
WP1 – AEGIS Data Value Chain Definition and Project Methodology AEGIS Consortium
Page 35 of 108
Blazegraph
Blazegraph is a scalable, high performant graph database with support for RDF storage and
querying.
Figure 5: Blazegraph relevant modules
Storage - Blazegraph is a scalable graph database that only supports its own native storage.
Querying - Blazegraph supports querying through SPARQL as well as graph manipulation
through TinkerPop. Full text search is supported through its own implementation of B+
trees as well as support for Apache Solr.
Ontologies – Blazegraph has support for RDFS and OWL.
Security – Blazegraph supports multitenancy, but does not impose any security models and
instead believes that the application should enforce the required security models.
Licensing and activity – Blazegraph is available under dual licensing model: GPL v2 and
commercial.
Activity – Blazegraph is under development since 2006 and its GitHub account
(https://github.com/blazegraph) shows sustained activity with periodic releases. The
documentation (https://wiki.blazegraph.com/) is extensive and easy to follow.
Horizontal scalability and Extensibility - Blazegraph does not allow pluggable storage,
since itself is a storage system. The graph database is built with scalability in mind allowing
it to run as a cluster. Since it provides the RDF most used interfaces – SPARQL, TinkerPop,
full text search, it can be easily used as a RDF storage solution.
Apache Rya
Apache Rya is an open-source, scalable RDF triple store for the cloud. Rya is built on top
of Apache Accumulo and OpenRDF. Rya exploits storage methods, and indexing schemes
provided by Accumulo to enable a scalable RDF store that can potentially handle billions
of triples distributed across multiple nodes.
RDF triples are composed of subject (S), predicate (P), and object (O). Rya leverages the
sorting and partitioning scheme of Accumulo by storing the triples in the RowIDs of the
tables. It stores the triples in three different tables SPO, POS, and OSP. Using these three
tables, Rya can support efficient querying of all the query pattern combinations.

HORIZON 2020 – 732189 - AEGIS D1.1 – Domain Landscape Review and Data Value Chain Definition
WP1 – AEGIS Data Value Chain Definition and Project Methodology AEGIS Consortium
Page 36 of 108
Storage - Rya utilizes the SAIL API to provide a pluggable RDF store on top of Apache
Accumulo. Rya chose Accumulo over HBase since it has some important features such as
cell level security, batch scanning, and bulk importing.
Querying - Rya fully supports the SPARQL query language using OpenRDF.
Security - Rya supports authorization by using cell level security provided by Accumulo
using the visibility field.
Licensing and activity - Rya is undergoing incubation at the Apache Software
Foundation. It is available under the Apache 2.0 license.
Horizontal scalability and Extensibility – Rya exploits the scalability features of Apache
Accumulo.
2.8.3. Scalable Data stores
Apache Hadoop
Apache Hadoop is the most popular open source platform for storing, managing, and
processing large volumes of data. Hadoop Distributed File System (HDFS) is the core
component of Hadoop that stores the data replicated across possibly thousands of
commodity machines. Hadoop also contains a resource management framework, YARN,
that manages CPU and memory on behalf of applications such as data parallel processing
frameworks (MapReduce, Flink, Spark), key-value stores (HBase, Accumulo), and SQL-
on-Hadoop services (Hive).
Storage – HDFS is used for the storage of data in a fault tolerant way. On Top of HDFS,
different storage engines were developed such as key-value stores (HBase, Accumulo).
SPARQL
Storage
Accumolo
Query
Rya Query Planar
Rya OpenRDF
SAIL
Figure 6: Apache Rya relevant
modules

HORIZON 2020 – 732189 - AEGIS D1.1 – Domain Landscape Review and Data Value Chain Definition
WP1 – AEGIS Data Value Chain Definition and Project Methodology AEGIS Consortium
Page 37 of 108
Querying – Hadoop ecosystem contains many query and processing frameworks to be used
on top of YARN, such as Apache Spark, Apache Flink, and MapReduce.
Security – Hadoop provides a secure-mode using Kerberos authentication. Moreover,
Hadoop doesn’t provide a native solution for role-base access control, instead other
external tools are used such as Apache Ranger and Apache Sentry.
Licensing and activity – Hadoop is a very active open-source project that is backed by
multiple big companies. It is available under the Apache 2.0 licence.
Horizontal scalability and Extensibility – It is a scalable system that scales to thousands of
machines.
Apache Accumulo
Accumulo is an open source, distributed, key-value store that leverages the Hadoop
Distributed File System (HDFS). Accumulo sorts its data based on the keys lexicography
in an ascending order. Each key is composed of (RowID, Column, Timestamp). Accumulo
sorts and partitions the tables’ data based on the RowIDs of the tables’ keys.
Key
Value RowID Column Timestamp
Family Qualifier Visibility
Figure 7: Apache Accumulo table structure
Storage – Accumulo leverages the HDFS for storage.
Querying – Rya is used as an RDF store on top of Accumulo. MapReduce, Spark, and Flink
could be used to query and process data in Accumulo.
Security – Accumulo provides a cell-level security through the usage of the visibility field.
Every key-value pair has its own security label, stored under the visibility field, which is
used to determine whether a given user has the right to read the values or not. Security
labels supports the use of logical AND and OR for combining terms, as well as nesting
group of terms. Moreover, Accumulo 1.5 offers a pluggable security mechanism for
authentication, authorization, and permission handling.
Licensing and activity – Accumulo is an active project. It is available under the Apache 2.0
licence.
Horizontal scalability and Extensibility – It is a scalable system that scales to thousands of
machines.
Hops
Hops (Hadoop Open Platform-as-a-Service) is a new distribution of Apache Hadoop, the
de-facto platform for Big Data. Hops delivers a quantum leap in both the size and
throughput of Hadoop clusters. Hops delivers over 16 times the throughput of the Hadoop
Filesystem (HDFS) for a real-world Hadoop workload from Spotify AB. Hops’ key
innovation is a novel distributed architecture for managing Hadoop’s metadata in MySQL

HORIZON 2020 – 732189 - AEGIS D1.1 – Domain Landscape Review and Data Value Chain Definition
WP1 – AEGIS Data Value Chain Definition and Project Methodology AEGIS Consortium
Page 38 of 108
Cluster, Oracle’s open-source NewSQL database. The result is a more scalable, reliable,
and more customizable drop-in replacement for Hadoop.
But the real goal of Hops is to make Hadoop easy to use: Hadoop for humans. Hops makes
everything from managing access to data to running programs to sharing data easy to use
for people who are not data engineers. To this end, Hops is the only Hadoop distribution
that provides project-based multi-tenancy in a platform called Hopswork. Hopsworks is a
self-service UI for Hops Hadoop, which introduces new concepts needed for project-based
multi-tenancy: projects, users, and datasets. A project is like a GitHub project - the owner
of the project manages membership, and users can be one of two roles in the project: data
scientists who can just run programs and data owners who can also curate, import, and
export data. Users cannot copy data between projects or run programs that process data
from different projects, even if the user is a member of multiple projects. That is, we
implement multi-tenancy with dynamic roles, where the user's role is based on the currently
active project. Users can still share datasets between projects, however. More precisely,
data owners can give other users access to process data (but not download it, copy it outside
of the project, or cross-link it with data outside the project). Hopsworks, thus, provides
stronger access control guarantees than are available in Hadoop, enabling sensitive data to
securely reside on shared Hadoop clusters.
Hopsworks is a multi-tenant data management and processing Java EE web application
running on top of Hops Hadoop with integrated support for data parallel processing
frameworks such as Apache Spark, Apache Flink, and Tensorflow, as well as Apache
Kafka (a scalable message bus) and interactive notebooks with Apache Zeppelin.
Storage – Hopsworks uses HopsFS for Storage. HopsFS is a highly scalable distributed file
system, which is drop-in replacement for HDFS. HopsFS provides an order of magnitude
larger clusters.
Querying – Hopsworks leverages HopsYARN that enables specifying CPU quotas for
projects. On top of HopsYARN, all well-known processing and querying frameworks can
be used such as Apache Flink, Apache Spark, and Apache Zeppelin.
Security – Hopsworks provides authentication using JDBC Realm, LDAP, or two-factor
authentication. Unlike Hadoop, Hopsworks provides a native role-based access control.
Figure 8: Hops relevant modules
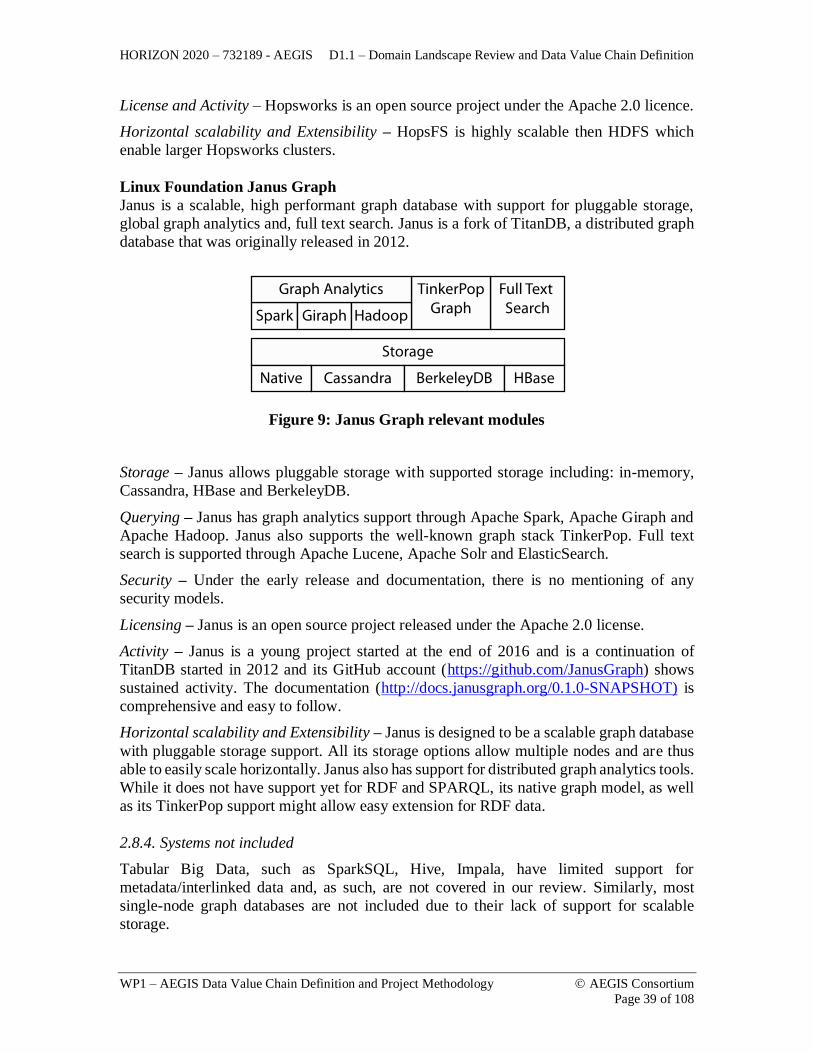
HORIZON 2020 – 732189 - AEGIS D1.1 – Domain Landscape Review and Data Value Chain Definition
WP1 – AEGIS Data Value Chain Definition and Project Methodology AEGIS Consortium
Page 39 of 108
License and Activity – Hopsworks is an open source project under the Apache 2.0 licence.
Horizontal scalability and Extensibility – HopsFS is highly scalable then HDFS which
enable larger Hopsworks clusters.
Linux Foundation Janus Graph
Janus is a scalable, high performant graph database with support for pluggable storage,
global graph analytics and, full text search. Janus is a fork of TitanDB, a distributed graph
database that was originally released in 2012.
Figure 9: Janus Graph relevant modules
Storage – Janus allows pluggable storage with supported storage including: in-memory,
Cassandra, HBase and BerkeleyDB.
Querying – Janus has graph analytics support through Apache Spark, Apache Giraph and
Apache Hadoop. Janus also supports the well-known graph stack TinkerPop. Full text
search is supported through Apache Lucene, Apache Solr and ElasticSearch.
Security – Under the early release and documentation, there is no mentioning of any
security models.
Licensing – Janus is an open source project released under the Apache 2.0 license.
Activity – Janus is a young project started at the end of 2016 and is a continuation of
TitanDB started in 2012 and its GitHub account (https://github.com/JanusGraph) shows
sustained activity. The documentation (http://docs.janusgraph.org/0.1.0-SNAPSHOT) is
comprehensive and easy to follow.
Horizontal scalability and Extensibility – Janus is designed to be a scalable graph database
with pluggable storage support. All its storage options allow multiple nodes and are thus
able to easily scale horizontally. Janus also has support for distributed graph analytics tools.
While it does not have support yet for RDF and SPARQL, its native graph model, as well
as its TinkerPop support might allow easy extension for RDF data.
2.8.4. Systems not included
Tabular Big Data, such as SparkSQL, Hive, Impala, have limited support for
metadata/interlinked data and, as such, are not covered in our review. Similarly, most
single-node graph databases are not included due to their lack of support for scalable
storage.

HORIZON 2020 – 732189 - AEGIS D1.1 – Domain Landscape Review and Data Value Chain Definition
WP1 – AEGIS Data Value Chain Definition and Project Methodology AEGIS Consortium
Page 40 of 108
2.8.5. Comparison of tools
Comparing the characteristics of the presented RDF stores and other scalable storage
solutions, the following conclusions can be drawn:
• Support for basic querying is required from any storage solution that is to be
considered. The main querying tools are full text search and for RDF – SPARQL.
Graph querying support through TinkerPop can also lead to full SPARQL support.
Not all the presented storage solutions allow TinkerPop or SPARQL, but it is
possible to integrate them. Most of the reviewed solutions did have full text search
support.
• For Big Data support, the storage tools should also provide good integration with
processing and analytics platforms. None of the analysed RDF stores had support
for Big Data analytics.
• Storing large amounts of data, leads inevitably to storing sensitive data, which
requires the storage to have proper security support. Out of the analysed tools,
Hadoop and Accumulo seem to have the best to offer from a security perspective.
• From the integration and ease of use perspective, Hopsworks is one of the best
candidate as it offers scalable storage support, together with support for well-known
processing frameworks like spark, as well as machine learning frameworks like
Tensorflow. Machine learning analytics are easy to perform in Hopsworks due to
its integration with Apache Zeppelin notebooks.

HORIZON 2020 – 732189 - AEGIS D1.1 – Domain Landscape Review and Data Value Chain Definition
WP1 – AEGIS Data Value Chain Definition and Project Methodology AEGIS Consortium
Page 41 of 108
Storage Querying Processing Security Horizontal
scalability Activity Extensibility
Jena
Disk,
RelationalDB,
HDFS,
Custom
SPARQL,
Full text search No
Framework
support,
Fuseki
Yes
(HDFS) active github
Yes
(java)
(open source)
Virtuoso
(Community
Version)
Disk,
RelationalDB,
Custom,
Others
SPARQL,
Full text search,
Others
No Access control
list
Partial
(Native) active github
Partial
(community
version)
Blazegraph
(Community
Version)
Native graph
SPARQL,
TinkerPop,
Full text search
No Application level
security
Yes
(Native) Active github
Partial
(java)
(community
version)
Accumulo
and Rya HDFS SPARQL
Spark,
Flink,
MapReduce
Cell level
security
Yes
(HDFS) Active github
Partial
(export control –
security)
Apache
Hadoop HDFS Full text search
Spark,
Flink,
MapReduce
Kerberos,
Apache Ranger,
Apache Sentry
Yes
(HDFS) Active github
Yes
(java)
(open source)
Hops Hopsfs
(HDFS) Full text search
Spark, Flink,
Tensorflow
Dynamic Role-
based access
control
YES
(HopsFS) Active github
Yes
(java)
(open source)
Janus
Native graph,
Cassandra,
BerkeleyDB,
HDFS
TinkerPop,
Full text search
Spark,
Giraph,
MapReduce
No security
primitives
Yes
(Native,
Cassandra,
HDFS)
Active github
Yes
(java)
(open source)
Table 5: Comparison of storage solutions

HORIZON 2020 – 732189 - AEGIS D1.1 – Domain Landscape Review and Data Value Chain Definition
WP1 – AEGIS Data Value Chain Definition and Project Methodology AEGIS Consortium
Page 42 of 108
2.9. Analytics Tools
While SPARQL provides rich capabilities for querying RDF data, its pure declarative
nature and the lack of support for common programming patterns, such as recursion and
iteration, makes it a challenge to perform complex data processing and analysis.
A simple well-known definition tells us that we are moving into the domain of Big Data
when the data cannot be handled – i.e., stored or processed – by a single machine
efficiently. This implies that most traditional data mining methods or data analytics
developed for centralized systems may not be applied directly to the data. When analysing
large scale data there are some new specific techniques like sampling, data condensation,
dimensionality reduction, grid-based approaches, incremental learning. There are widely
known properties of Big Data that should be taken into consideration. The analytics tools
are supposed to be able to handle large volumes of data of a variety of domains and
structures. The data can come into the system at high speed and might be volatile in nature,
losing its worth as time passes and so the analytics tools are expected to be able to process
data fast and output information that can be used immediately.
The increasing volume of RDF data generated by applications has added constraints on
how easily and efficiently it can be processed. Requiring data to be moved before it can be
processed, especially with read-only analytics tasks, is not a viable mechanism at extreme
scale. Therefore, processing data in-place is more and more supported. In-situ data
processing is also reflected by processing data coming from different locations and in
different formats.
With the above challenges in mind, we explore different analytics tools available in the
analytics ecosystem.
2.9.1. Selection of tools
Weka (http://www.cs.waikato.ac.nz/ml/weka)
- Weka is a Java based software package that contains a collection of analytics and machine
learning algorithms tasked to perform data mining directly on specified data sources, or via
Java calls in an application Environment. Weka 3 (with the current version being 3.8) is
the latest Weka release by the University of Waikato and is able to be applied to big data,
and can be used in real time provided that the user has trained the Weka models correctly
and adequately. The latter can be performed using a CLI, or by writing the training modules
directly in Java or in Java-based scripting languages (like Groovy or Jython), as the
graphical assistant provided by Weka (Weka Explorer) for training are impossible to
handle large data volumes. Furthermore, it is now possible to perform incremental training
by loading only samples of a dataset in memory (and not the whole dataset) with methods
as “Reservoir sampling”, while the latest Weka releases allow access the MOA
(http://moa.cms.waikato.ac.nz), which is an open source framework for data stream
mining, able to perform big data stream mining in real time and large scale machine
learning.

HORIZON 2020 – 732189 - AEGIS D1.1 – Domain Landscape Review and Data Value Chain Definition
WP1 – AEGIS Data Value Chain Definition and Project Methodology AEGIS Consortium
Page 43 of 108
Orange (http://orange.biolab.si)
- Orange is an open source software package targeting machine learning and data
visualization, which is addressed to both expert and novice users. The toolkit includes very
well designed interactive user interfaces, and provides a set of components for data pre-
processing, modelling, model evaluation, and exploration techniques. The main usage of
Orange is to better understand datasets through the analysis and their visualisations. Orange
is a Python library and can be used either graphically or through Python scripting. The use
of Orange with Big Data however is not adequately tested, as it is mostly used as a tool for
rapid prototyping in terms of data analysis and visualisation.
Apache Mahout (https://mahout.apache.org)
- Apache Mahout is a project incubated under the Apache foundations, which aims to
deliver implementations of distributed or otherwise scalable machine learning algorithms.
It is focusing mainly on the areas of collaborative filtering, clustering and classification,
with many of its implementations using the Hadoop platform. Mahout offers 3 main
features:
• A simple and extensible programming environment and framework for building
scalable algorithms
• A wide variety of premade algorithms for Scala + Apache Spark, H2O, Apache
Flink
• Samsara, a vector math experimentation environment with R-like syntax which
works at scale
The project also provides some Java libraries for common operations.
R (https://www.r-project.org)
- R is a software environment and programming language focusing on statistical computing
and graphics. It is a GNU project, considered one of the best languages to build analytics,
widely used and supported by a large community of data scientists. The language runs on
various UNIX platforms, Windows and MacOS machines and contains functions for data
manipulation, calculation and graphical display such as (linear and nonlinear modelling,
classical statistical tests, time-series analysis, classification, clustering, etc.). Due to its
extensibility and power, R has been also used to handle Big Data analytics. One of the most
known R packages implementations for handling Big Data is pbdR (Programming with
Big Data in R).
One of the GUIs that can be used for Data Mining is R is Rattle (the R Analytical Tool To
Learn Easily), currently in version 5, (http://rattle.togaware.com), which can be used both
for executing some basic ML models, but is also powerful when it comes to analyse
statistical data properties. Regarding the latter, Rattle is able to present statistical and visual
summaries of data, perform easily modelled data transformations and is able to build both
unsupervised and supervised models for machine learning.
RapidMiner (https://rapidminer.com)
- RapidMiner is a platform for machine learning, data mining, text mining, predictive
analytics and business analytics. Implemented in Java and being able to include other
software snippets as plug-ins, the platform offers its capabilities through an API used to
connect the RapidMiner Engine with other software. In total, the platform in its latest
versions consists of three major tools:

HORIZON 2020 – 732189 - AEGIS D1.1 – Domain Landscape Review and Data Value Chain Definition
WP1 – AEGIS Data Value Chain Definition and Project Methodology AEGIS Consortium
Page 44 of 108
• The RapidMiner Studio, that contains a visual workflow designer and analytics to
accelerate prototyping and validation
• The RapidMiner Server, used for collaboration and for automating analytic jobs
• The RapidMiner Radoop, for using the platform’s functions in a Hadoop
environment.
The latter (RapidMiner Radoop) is targeting structured and unstructured Big Data and can
combine transform and train models, leveraging scripts such as SparkR, PySpark, Pig and
HiveQ.
Knime (http://www.knime.org/)
- KNIME offers for data scientists a selection of tools with its Analytics Platform being an
enterprise-grade solution, that is open source and easy enough to be deployed and scaled
by system administrators. The platform includes a very broad selection of analytics
algorithms and has more than 100 modules, integrating various components for machine
learning and data mining. KNIME has tools for data blending and it also allows to use a
graphical interface to blend other tools (for Python, R, SQL, Java and Weka mostly) as
well (like building a process flow where each tool’s output is provided to the next tool as
input). To access Big Data repositories, KNIME offers some specific connectors which
include nodes such as HDFS Connection, webHDFS Connection, HttpFS Connection,
HDFS File Permission, Hive Connector, Impala Connector, etc., which allow data to be
moved between KNIME and Apache Hive/Apache Impala, write Hive/Impala SQL queries
the standard KNIME Database Query node and also execute SQL queries directly in
Hive/Impala using standard KNIME database nodes.
Scikit-learn (http://scikit-learn.org)
- Scikit-learn is a Python based machine learning library that can be used for data mining
and data analysis, designed to interoperate with the Python numerical and scientific
libraries NumPy and SciPy. The main operations supported have to do with Classification,
Regression, Clustering, Dimensionality reduction, Model selection and Pre-processing.
The implementation started as a Google Summer of Code project. In terms of handling big
volumes of Data with Scikit-learn, the best option is to use libraries that can process
chunked data volumes that fit into memory, while incremental learning is also possible to
make sure the memory is not overloaded with active instances.
OpenNN (http://www.opennn.net)
- OpenNN is a high performance software library for Advanced Analytic, which has the
ability to learn by investigating both datasets and mathematical models. An open source
class library written in C++ for better hardware management, is mostly used to solve
pattern recognition problems through the setup of neural networks. OpenNN implements
any number of layers of non-linear processing units for supervised learning and has as a
key advantage over other machine learning methods its very high performance.
GNU Octave (https://www.gnu.org/software/octave)
- GNU Octave is a scientific programming language, with an engine fitted well to write
mathematical algorithms used in Machine Learning. The language is compatible with many
Matlab scripts and actually is promoted as an open source alternative to Matlab. Currently
at release 4.2.1, the language is supporting the major operating systems

HORIZON 2020 – 732189 - AEGIS D1.1 – Domain Landscape Review and Data Value Chain Definition
WP1 – AEGIS Data Value Chain Definition and Project Methodology AEGIS Consortium
Page 45 of 108
GNU PSPP (https://www.gnu.org/software/pspp)
- GNU PSPP is an open source statistical software package that is often being promoted as
an alternative to IBM’s SPSS package. It provides a rich set of statistical analysis
capabilities, which are widely used by data scientists, however some research
breakthroughs in statistical algorithms are not yet supported. It is can be used both through
a GUI and the command line and is able to support more than 1 billion cases and over 1
billion variables.
TensorFlow (https://www.tensorflow.org)
TensorFlow is an open-source software library developed by Google for the purpose of
machine learning and deep neural networks research. Today this library is generic enough
to be applicable in a wide variety of other domains and is used mostly for advance
numerical computation in highly distributed and edge computing infrastructures. The
method is based on data flow graphs, in which nodes in the graph represent mathematical
operations, while the graph edges represent the multidimensional data arrays (tensors)
communicated between them. This architecture offers the option to deploy computation to
one or more computing units (CPUsm GPUs, etc).
S5 Anlzer
The S5 Anlzer is an enterprise data analytics engine-as-a-service addressing the need of
modern businesses to track their online presence, to understand the sentiment and opinions
about their products and brands, and to distil customer requirements and market trends. A
fork of an open source software developed under an H2020 project, and built on an open-
source big data technology stack, S5 Anlzer tracks, collects, stores, processes and
visualizes unstructured data sources (e.g. social media platforms, web resources, etc.) to
provide business insights in an interactive manner. The S5 Anlzer engine is based on
keyword- and account-based information acquisition, information filtering, natural
language processing, trend analysis and emotion analysis. Various analytics algorithms and
hybrid (supervised and unsupervised) machine learning techniques are applied to extract
relevant topics and actionable data, to detect influencing behaviour (through variations of
the PageRank algorithm) and to back-trace or simply follow the trail of retrieved data. In
its intuitive dashboard, S5 Anlzer provides a playground for experimentation, with easy
navigation to the results and smart filtering options for the user-friendly visualizations (e.g.
to remove promo material). Through its collaboration features, S5 Anlzer allows a team to
get access to the same project settings, to share “live” (in terms of constantly updated)
reports, and to contribute their comments and ideas as inspired by the social media
discussions and other online sources (with social features).
Apache Spark (http://spark.apache.org/)
Apache Spark is a fast and general-purpose cluster computing system. It provides high-
level APIs in Java, Scala, Python and R, and an optimized engine that supports general
execution graphs. It also supports a rich set of higher-level tools including Spark SQL for
SQL and structured data processing, MLlib for machine learning, GraphX for graph
processing, and Spark Streaming.
Streaming - Spark Streaming enables scalable, high-throughput, fault-tolerant stream
processing of live data streams. Data can be ingested from many sources like Kafka, Flume,
Kinesis, or TCP sockets, and can be processed using complex algorithms expressed with
high-level functions like map, reduce, join and window. Finally, processed data can be

HORIZON 2020 – 732189 - AEGIS D1.1 – Domain Landscape Review and Data Value Chain Definition
WP1 – AEGIS Data Value Chain Definition and Project Methodology AEGIS Consortium
Page 46 of 108
pushed out to filesystems, databases, and live dashboards. You can also apply Spark’s
machine learning and graph processing algorithms on data streams.
Machine learning - Spark’s machine learning makes practical machine learning scalable
and easy. At a high level, it provides machine learning algorithms, featurization, pipelines,
persistence and different utilities. The machine learning algorithms include classification,
regression, clustering, and collaborative filtering. Featurization targets feature extraction,
transformation, dimensionality reduction and selection. The pipeline utilities include tools
for constructing, evaluating and tuning machine learning pipelines. Sparks allows you to
save your data, algorithms, models and pipelines.
Graph processing - GraphX is a Spark component for graphs and graph-parallel
computation. To support graph computation, GraphX exposes a set of fundamental
operators like subgraph, joinVertices, and aggregateMessages as well as an optimized
variant of the Pregel API. In addition, GraphX includes a growing collection of graph
algorithms and builders to simplify graph analytics tasks.
Another interesting abstraction is the property graph. The property graph is a directed
multigraph with user defined objects attached to each vertex and edge. A directed
multigraph is a directed graph with potentially multiple parallel edges sharing the same
source and destination vertex. The ability to support parallel edges simplifies modelling
scenarios where there can be multiple relationships (e.g., co-worker and friend) between
the same vertices. The properties of edges can be seen as similar to the RDF properties, but
it is not a direct implementation support for RDF.
Classic analytics - SparkR is an R package that provides a light-weight frontend to use
Apache Spark from R. In Spark 2.1.0, SparkR provides a distributed data frame
implementation that supports operations like selection, filtering, aggregation on large
datasets. SparkR also supports distributed machine learning using MLlib.
Apache Flink
Apache Flink is an open source stream processing framework. It executes arbitrary data
flow programs in a data-parallel and pipelined manner. It enables the execution of batch,
streaming processing programs, and iterative algorithms natively. It provides high level
APIs in Java, Scala, Python, and SQL. As well as providing special-purpose libraries for
machine learning, graph processing, and complex event processing
Streaming – Flink enables a high throughput, low-latency, fault-tolerant, exactly once-
semantics. It can process unbounded datasets in a stateful (maintain state across events),
continuous way. Flink provides DataSink and DataSource APIs to connect to various
systems such as Kafka, HDFS, Cassandra, and ElasticSearch. Flink has a DataStream API
that enables transformations (e.g. filtering, aggregations) on bounded or unbounded stream
of data.
Machine Learning – FlinkML provides a set of scalable machine learning algorithms such
as SVM, and k-nearest neighbours join, as well as providing algorithms for data pre-
processing and recommendation engines.
Graph Processing – Gelly is Flink’s graph processing library. Gelly leverages the native
support for iterative algorithms in Flink to map various graph processing models such as

HORIZON 2020 – 732189 - AEGIS D1.1 – Domain Landscape Review and Data Value Chain Definition
WP1 – AEGIS Data Value Chain Definition and Project Methodology AEGIS Consortium
Page 47 of 108
vertex-centric or gather-sum-apply to Flink dataflows. Gelly provides implementation of
some of the well-known algorithms such as PageRank, Connected Components, and Single
Source Shortest Path.
LinDA Analytics
LinDA Analytics is a service of basic and robust data analytic functionality on Linked Data
for the discovery and communication of meaningful new patterns that were unattainable or
hidden in the previous isolated data structures. High importance is given on the design and
deployment of tools with emphasis on their user-friendliness. Thus, the approach followed
regards the design and deployment of workflows for algorithms execution based on their
categorisation. An indicative categorisation includes Classifiers for identifying to which of
a set of categories a new observation belongs based on a training set, Clusterers
(unsupervised learning) for grouping a set of objects in such a way that objects in the same
group are more similar to each other, Statistical and Forecasting Analysis for discovering
interesting relations between variables and providing information regarding future trends
and Attribute Selection (evaluators and search methods) algorithms for selecting a subset
of relevant features for use in model construction based on evaluation metrics.
2.9.2. Comparison of tools
We compare the explored analytics solutions and check if they support the predefined
analytical capabilities:
• data mining
• machine learning
• statistical analysis
• stream processing
For each of the analysed solutions we are also interested whether they have Big Data
support, as in whether they support distributed data analysis and also whether they are
provided as a platform or if they are easy to integrate libraries.

HORIZON 2020 – 732189 - AEGIS D1.1 – Domain Landscape Review and Data Value Chain Definition
WP1 – AEGIS Data Value Chain Definition and Project Methodology AEGIS Consortium
Page 48 of 108
Data
Mining
Machine
Learning
Statistical
Analysis
Stream
Processing Type of data
Big Data
Support
Platform/
Library
Weka yes yes no yes structured yes platform and
library
Orange yes yes no yes structured no platform
Mahout yes yes no yes structured yes platform
R yes yes yes yes structured and
unstructured yes library
Rapid Miner yes yes no yes structured and
unstructured yes platform
Knime yes yes yes yes structured and
unstructured yes platform
Scikit Learn yes yes yes no structured and
unstructured no library
OpenNN yes yes no no structured no library
GNU Octave yes no yes no structured no library
GNU PSPP no no no no structured no platform
Tensorflow yes yes no yes structured and
unstructured yes library
Spark yes yes yes yes structured and
unstructured yes platform
Flink no partial no yes structured yes platform
S5 Anlyzer yes yes no yes structured and
unstructured yes platform
Linda
Analytics yes yes yes no structured no
platform and
library
Table 6: Comparison of analytics tools

HORIZON 2020 – 732189 - AEGIS D1.1 – Domain Landscape Review and Data Value Chain Definition
WP1 – AEGIS Data Value Chain Definition and Project Methodology AEGIS Consortium
Page 49 of 108
3. STAKEHOLDERS ANALYSIS AND IDENTIFICATION OF PRELIMINARY NEEDS
3.1. Stakeholder analysis
3.1.1. High-level stakeholder identification
The overall objective of this review is to obtain a deep understanding of how big data
technology can be used in the different sectors, in particular the ones that are the AEGIS
targets.
Within this assessment, our purpose is to analyse, synthesize and present a state-of-the-art
structured analysis of big data and big data analytics to support the signposting of future
research directions for each AEGIS target.
In AEGIS, Public Safety and Personal Security (PSPS) refers to the welfare and protection
of the general public and of individuals through prevention and protection from dangers
affecting safety such as crimes, accidents or disasters. In a broad sense, PSPS refers to both
public health and public security issues. Even though, at first glance, PSPS looks like a
broader public sector responsibility, however, a plethora of private enterprises and
organizations are directly or indirectly involved, forming a strong market.
Starting from this definition the AEGIS stakeholders have been identified and grouped to
better understand and collect their requirements. The table below represents such grouping.
STAKEHOLDER GROUP TYPES
SG1 -Smart Insurance
Insurance Companies
Financial institutions
Insurance brokers
SG2 - Smart home
Electronics
Smart home technology providers
Safety and security
Energy and Utilities
SG3 - Smart Automotive
Car manufacturer
Car dealers
Electronics
GPS Navigation System Providers
SG4 - Health
Nursing homes
Hospitals
Doctors
SG5 -
Public safety / law enforcement
Police
Emergency Medical Service
Fire Service
Search and Rescue
Military
SG6 - Research communities
Students
Professors
Research institutes
SG7 –
Road Construction companies
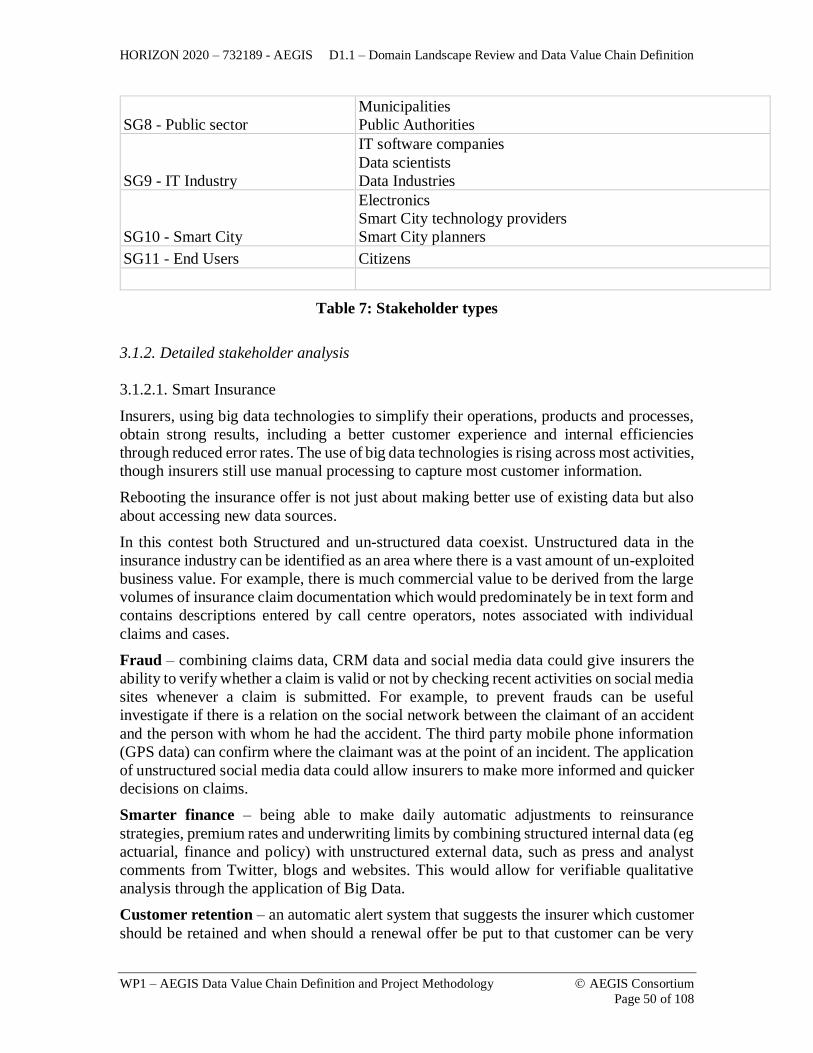
HORIZON 2020 – 732189 - AEGIS D1.1 – Domain Landscape Review and Data Value Chain Definition
WP1 – AEGIS Data Value Chain Definition and Project Methodology AEGIS Consortium
Page 50 of 108
SG8 - Public sector
Municipalities
Public Authorities
SG9 - IT Industry
IT software companies
Data scientists
Data Industries
SG10 - Smart City
Electronics
Smart City technology providers
Smart City planners
SG11 - End Users Citizens
Table 7: Stakeholder types
3.1.2. Detailed stakeholder analysis
3.1.2.1. Smart Insurance
Insurers, using big data technologies to simplify their operations, products and processes,
obtain strong results, including a better customer experience and internal efficiencies
through reduced error rates. The use of big data technologies is rising across most activities,
though insurers still use manual processing to capture most customer information.
Rebooting the insurance offer is not just about making better use of existing data but also
about accessing new data sources.
In this contest both Structured and un-structured data coexist. Unstructured data in the
insurance industry can be identified as an area where there is a vast amount of un-exploited
business value. For example, there is much commercial value to be derived from the large
volumes of insurance claim documentation which would predominately be in text form and
contains descriptions entered by call centre operators, notes associated with individual
claims and cases.
Fraud – combining claims data, CRM data and social media data could give insurers the
ability to verify whether a claim is valid or not by checking recent activities on social media
sites whenever a claim is submitted. For example, to prevent frauds can be useful
investigate if there is a relation on the social network between the claimant of an accident
and the person with whom he had the accident. The third party mobile phone information
(GPS data) can confirm where the claimant was at the point of an incident. The application
of unstructured social media data could allow insurers to make more informed and quicker
decisions on claims.
Smarter finance – being able to make daily automatic adjustments to reinsurance
strategies, premium rates and underwriting limits by combining structured internal data (eg
actuarial, finance and policy) with unstructured external data, such as press and analyst
comments from Twitter, blogs and websites. This would allow for verifiable qualitative
analysis through the application of Big Data.
Customer retention – an automatic alert system that suggests the insurer which customer
should be retained and when should a renewal offer be put to that customer can be very

HORIZON 2020 – 732189 - AEGIS D1.1 – Domain Landscape Review and Data Value Chain Definition
WP1 – AEGIS Data Value Chain Definition and Project Methodology AEGIS Consortium
Page 51 of 108
helpful. Moreover the possibility to easily access data such as who of the existing
customers is looking to renew or change their policy provide an opportunity to offer them
a new policy before they defect to another insurer. Another circumstance that might be
interesting for the insurer is when the life of the customer changes– for instance, when a
student graduates and finds a job, or when someone retires: in the first case an increase of
the income may lead to the necessity of a further insurance, in the second case the costumer
may be more interested on an annuity rather than a savings engine. The insurer will rely on
a combination of structured and unstructured data in order to predict and act on a potential
life changing scenario but, more importantly, they will require the business to react quickly
to the data received.
Telematics – the “pay as you drive” model provides an opportunity for insurers not only
to understand their customers’ driving better; it also provides them with rich data about
how many miles they drive, how and when they drive the car and where they drive and
leave the car. This data, when fed into an underwriting system, potentially allows for more
accurate pricing of policies on a customer level. It should also lead to improved claims
processing as insurers will know the moment a claim is made. And it is intended to reduce
fraudulent claims.
Reputation / brand analysis – nowadays to evaluate the success of a new insurance
product the number of products sold represents surely an important indicator, but is only
one dimension. Coupling that with unstructured information from social media sites the
insurer can be able to get people’s opinions and experiences of the product.
Claims – claims management has always been an area of focus for a number of insurers,
the big data analysis can give tools able to process claims quicker and cheaper with less
leakage, having a single customer view along with CRM data and some social media data
can provide insurers with insight into whether a claim is valid and whether it should be
processed quickly.
Customer satisfaction – insurer to assess if a customer had a bad claims experience,
normally provided a customer service, the customer will phone into the call centre and
complain, but with the diffusion of the social media sites today, it’s easier decide to
comment on social media sites. Insurers may be able to increase customer satisfaction by
responding to those comments or opinions directly and resolving issues, therefore reducing
the risk of losing those customers.
Social network analysis –New customers cost more than retaining an existing customer.
Using the unstructured data available via social media sites can provide an added
dimension to customer insight.
3.1.2.2. Smart Home
The rapid evolution of sensing technology and the increasing power of computation have
resulted in the emergence of smart homes. Those environments are improved living spaces
equipped with distributed sensors and effectors hidden from the view of the residents.
Smart home has been a very active area of research through the last two decades, which
resulted into various applications and philosophies of implementation and design.
HORIZON 2020 – 732189 - AEGIS D1.1 – Domain Landscape Review and Data Value Chain Definition
WP1 – AEGIS Data Value Chain Definition and Project Methodology AEGIS Consortium
Page 52 of 108
In particular, it has been seen as a way to enhance the quality of life of residents by
automating daily tasks and optimizing power consumption. Another very important trend
is the assistance of residents in their daily life activities with the help of smart home
technology.
Researchers envision a future where persons afflicted by a cognitive disease, such as mild
dementia or head trauma, could pursue a semi-autonomous life at their residence for an
extended period. To achieve that goal however, many challenges need to be addressed by
the community.
By now, the concept of smart home that is interesting for the AEGIS team refers to any
standard house with few simple automation systems.
Reflex agents: agents which a thermostat agent could be a small piece of software
implementing a reflex based agent’s function. That agent would have a simple goal
(desired_temperature) and its function would simply be heat whenever the
current_temperature, as observed by its sensor, is inferior to the desired temperature. A
smart home constituted of such simple reflex agents can be exploited to simplify the life of
its residents or to improve the comfort at home.
Weather monitoring/forecasting: thus, smart homes can be exploited to reach a higher
quality of life. By working together, even simple agents could be used to produce
interesting results. For example, imagine if the same thermostat agent could communicate
with a weather monitoring/forecasting agent and a windows/blinds manager agent.
Together, if those three share information, they could work to stabilize the temperature of
the house and to save energy. Let us suppose the day is predicted to be hot and sunny, then
the thermostat agent could lower the heating and ask the blinds manager agent to open the
blinds so the sun comes in as a natural heating.
However, the challenges that limit the possibility of services and home improvement are
relatively unchanged. They mostly regard the data that can be obtained to represent the
environment and the information that we can expect to extract (reliably). The more
information one can obtain on the state of the environment, the better the services provided
can be.
Nowadays, a wide range of sensing technology can be used to gather different type of data
and generally at a reasonable cost.
Despite the availability of data, obtaining useful information is not necessarily easy. Within
AEGIS, we believe that with a better understanding and usage of the data, smart homes
could also be exploited to assist individuals with a reduced autonomy by recognizing the
activities of daily living (ADLs), the context and the occurring problems in their actual
realization (or operation).
Big Data can really change research on smart home and if it is justified to think about
persistence of collected data. Big Data would help improve data centric methods to activity
recognition. These methods suffer from unrealistically small dataset and a very limited set
of activities to be recognized.
For this vision to become reality, many challenges are awaiting to be solved.

HORIZON 2020 – 732189 - AEGIS D1.1 – Domain Landscape Review and Data Value Chain Definition
WP1 – AEGIS Data Value Chain Definition and Project Methodology AEGIS Consortium
Page 53 of 108
Data format: There are many challenges awaiting researchers for the implementation and
implantation of smart home networks. We obviously cannot pretend to cover them all so
we decided to focus on few aspects that seemed more important to discuss. The first one is
the central piece of this vision of smart home in the Big Data era. Which format to use to
save the data from the sensors of habitat? While this question may seem superficial, we
hope to convince the reader in this section that the implications are very important and have
consequences for the use of a data warehouse.
Data mining challenges: Data mining is the set of methods and algorithms allowing the
exploration and analysis of database. In data mining the goal is to discover previously
unknown knowledge that can then be exploited in business intelligence to make better
decisions or with artificial intelligence to perform some computation (deliberation).
The first step is to collect and clean the data from potentially more than one source, which
can be devices, sensors, software or even websites. The goal of this step is to create the
data warehouse that will be exploited for the data mining.
The second step consists of the preparation of the data in the format required by the data
mining algorithm. Sometime in this step, the numerical values are bounded; other time,
two or more attributes can be merged together. It is also at this step that high level
knowledge (temporal or spatial relationships, etc.) can be inferred for suitable algorithms.
The next step is the data mining itself. It is important to choose or design an algorithm for
the context and the data. There are many algorithms to be used. Finally, the data mining
step should result in a set of models (decision trees, rules, etc.) that needs to be evaluated.
It is particularly the case for smart home applications. If the data is collected directly from
the sensors without any transformation, there is a lot of repetition and only a small portion
might be very interesting. In AEGIS we will try to transform the collected data into high-
level knowledge.
Context of Big Data: In addition to the difficulties related to the memory of computer to
process the data, another important question arises in the context of Big Data. Since the
data warehouse is big, it might take some time to process it entirely. The classical data
mining algorithms do not propose any method to revise learned models with new data.
Currently, data mining process must be repeated every time that one needs to integrate new
data. With Big Data warehouse, this process is long and complex, and thus it would be
interesting to develop algorithms that dynamically improve learned models from new
incoming data. These challenges are very important and will need to be addressed in the
future if smart home is to enter the era of Big Data.
3.1.2.3. Smart Automotive
Cars generate data about how they are used, where they are, and who is behind the wheel.
With greater proliferation of shared mobility, progress in powertrain electrification, car
autonomy, and vehicle connectivity, the amount of data from vehicles will grow
exponentially.
Use cases span from predictive maintenance to over-the-air software add-ons and from
vehicle usage scoring to usage based insurance.

HORIZON 2020 – 732189 - AEGIS D1.1 – Domain Landscape Review and Data Value Chain Definition
WP1 – AEGIS Data Value Chain Definition and Project Methodology AEGIS Consortium
Page 54 of 108
Another increasing topic, sometimes called autonomous cars, uses lasers and sensors to
regulate the car’s movement based on inputs from the surrounding environment. The
current versions of driverless technology include stability systems, completely driverless
car for predetermined periods of time such as highway driving, and features like lane guides
when using assisted cruise control. The privacy considerations of driverless cars include
tracking drivers’ locations, centralizing data on what activities occur when the system is in
use, and tracking the gaps between driver and system efficiencies.
These microprocessor-controlled subsystems have been provided by various suppliers and
have been integrated in the car on an ad hoc basis without a well-defined system
architecture that can be updated appropriately as more components with microprocessors
are added to new car designs. Moreover, they generate data only a small percentage of
which is accessible and utilized. Most frequently this data is used to provide variants of a
vehicle’s health report. It ranges from the familiar “check engine” light seen in low-end
vehicles, to the graphical reports provided in the infotainment system of higher-end
vehicle.
In the near future, the number of sensors will increase considerably (engine sensors, its
electrical system sensors, tires sensors, suspension, steering, radar/lidar, cameras, etc). All
of these sensors will generate data constantly. The vehicle’s infotainment system (mapping,
messaging, entertainment content, etc.) is another big data generator. It is expected that
such a car would be generating in excess of 1GB/sec of regular operation. To this data one
has to add the data generated by the passengers in the course of a trip, the data exchanged
between each vehicle and other autonomous vehicles as they try to coordinate with one
another to ensure their passengers’ safety, as well as the data exchanged between each
autonomous car and the smart infrastructure it relies on, e.g., roads, bridges, toll stations,
etc.
3.1.2.4. Health
Big health data technologies help to take existing healthcare Business Intelligence (BI),
Health Data Analytics, and Clinical Decision Support (CDS) as well as health data
management application to the next level by providing means for the efficient handling and
analysis of complex and large healthcare data by relying on:
• data integration (multiple, heterogeneous data sources instead of one single data
sources)
• real-time analysis (instead of benchmarking along predefined key performance
indicators (KPIs))
• predictive analysis
Big Health Data have characteristics that are slightly different from other “Big Data”,
mainly because for its complexity, diversity and timeliness.
Therefore, Big Data in health can be characterized by:
• Variety: Today’s business intelligence and health data analytics application
mainly rely on structured (and rarely, on unstructured data) mostly from a single
as well internal data source. In future, big health data technologies will establish
the basis to aggregate and analyse internal as well as external heterogeneous
data that are integrated from multiple data sources.

HORIZON 2020 – 732189 - AEGIS D1.1 – Domain Landscape Review and Data Value Chain Definition
WP1 – AEGIS Data Value Chain Definition and Project Methodology AEGIS Consortium
Page 55 of 108
• Volume: there’s a distinction from structured and unstructured data:
o Large volume structured health data are already existing today and are
available when all related data sources of a network of health care providers
get integrated. In the US, the volume of data of integrated delivery networks
(IDNs) can easily exceeds one petabyte. In Europe, on the opposite, the
integration of health data is in comparison to the US is less advanced and
the volume of health data is currently not indicated as urgent issue.
o There are various types of unstructured health data that encompass valuable
content for gaining more insights about healthcare related questions and
concerns, such as biometric data, genomic data, text data from clinical
charts, and medical images. Information extraction technologies that allow
transforming unstructured health data into semantic-based structured
formats are the focus of many research initiatives.
• Type of analytics: Today’s business intelligence health data applications rely
mostly on ex post focused KPIs. Future big health data applications will rely on
data integration, complex statistical algorithms, event-based, real-time
algorithm and advanced analytics, such as prediction and device.
• (Business) Value: This seems to be the main challenge as to generate business
value out of the health data. One requires to identify the data sources and
analytics algorithm that can be associated with a compelling business case that
brings value to the involved stakeholders.
The health care system has several major pools of health data which are held by different
stakeholders/parties:
• Clinical data, which is owned by the provider (such as hospitals, care centres
physicians, etc.) and encompass any information stored within the classical
hospital information systems or EHR, such as medical records, medical images,
lab results, genetic data, etc.
• Claims, cost and administrative data, which is owned by the provider and the
payers and encompass any data sets relevant for reimbursement issues, such as
utilization of care, cost estimates, claims, etc.
• Pharmaceutical and R&D data, which is owned by the pharmaceutical
companies, research labs/academia, government and encompass clinical trials,
clinical studies, population and disease data, etc.
• Patient behaviour and sentiment data, which is owned by consumers or
monitoring device producer and encompass any information related to the
patient behaviours and preferences.
• Health data on the web. Websites, like such as eCancermedicalscience and
PatientsLikeMe, getting more and more popular: by voluntarily sharing data
about rare disease or remarkable experiences with common diseases, their
communities and user are generating large sets of health data with valuable
content.
As each data pool is held by different stakeholders/parties, the data in the health domain is
highly fragmented. However, the integration of the various heterogeneous data sets is an
important prerequisite of big health data applications and requires the effective
involvement and interplay of the various stakeholders. Therefore, as already mentioned,
HORIZON 2020 – 732189 - AEGIS D1.1 – Domain Landscape Review and Data Value Chain Definition
WP1 – AEGIS Data Value Chain Definition and Project Methodology AEGIS Consortium
Page 56 of 108
adequate system incentives, that support the seamless sharing and exchange of health data,
are needed.
3.1.2.5. Public safety / law enforcement
Law enforcement agencies (LEAs) and security agencies routinely collect large amounts
of data in the course of their work preventing and detecting crime and gathering
intelligence.
How data are collected and stored typically varies between local police forces. To address
this, a number of national databases have been established to enable sharing of records and
intelligence between local forces and with national agencies such as the National Crime
Agency. These databases contain large quantities of information including:
• Structured data: information that follows a set format, such as the location and
type of crime reported, DNA profiles, or personal details of an individual who
has been arrested or charged.
• Unstructured data: text that does not follow a set format, including police and
witness statements. Context can be more important to extract meaning from
these data.
Big data analytics can be used to process and analyse these structured and unstructured
data automatically to identify patterns or correlations. Advanced computer software can
also be used to link big data in internal datasets with each other or with other datasets, such
as publically available data from social media. Big data analytics can then be used to look
for new insights. These patterns and correlations can be used to highlight areas for further
investigation, give a clearer picture of future trends or possibilities and target limited
resources.
3.1.2.6. Research communities
Scientific research has been revolutionized by Big Data. We have practical examples on
how Big Data changed the approach to science: for example, there’s The Sloan Digital Sky
Survey that has today become a central resource for astronomers the world over. The field
of Astronomy is being transformed from one where taking pictures of the sky was a large
part of an astronomer’s job to one where the pictures are all in a database already and the
astronomer’s task is to find interesting objects and phenomena in the database. In the
biological sciences, there is now a well- established tradition of depositing scientific data
into a public repository, and also of creating public databases for use by other scientists. In
fact, there is an entire discipline of bioinformatics that is largely devoted to the analysis of
such data.
As technology advances, particularly with the advent of Next Generation Sequencing, the
size and number of experimental data sets available is increasing exponentially.
Researchers and funders recognize the value of integrating clinical research networks.
Connecting existing networks means clinical research can be conducted more effectively,
ensuring that patients, providers, and scientists form true communities of research in an
environment of shared operational knowledge and data. Major research institute centres
and funding agencies have made large investments in this domain.

HORIZON 2020 – 732189 - AEGIS D1.1 – Domain Landscape Review and Data Value Chain Definition
WP1 – AEGIS Data Value Chain Definition and Project Methodology AEGIS Consortium
Page 57 of 108
Big Data has the potential to revolutionize not just research, but also education.
There are powerful trends in this direction. In particular, there is a strong trend for massive
Web deployment of educational activities, and this will generate an increasingly large
amount of detailed data about students' performance.
In the domain of research, there are a few challenges to face in the next future and possible
domains to exploit.
• Use of information: from the AEGIS point of view, this could mean
interpretation, propensity, and correlations. The opportunities to learn and
generate value from Big Data systems will depend on the statistically valid use
of the information. The size and heterogeneity of the data being collected is a
major challenge, particularly since the majority of statistical approaches to
interpretation were developed in an era when “sample sizes” were relatively
small, and when data acquisition technologies and computing power were
limited. Nowadays, the high volume, velocity and variety of data collection
methods available is likely to drive the data- driven society to a point in which
sampling will not be necessary because the entire background population is
available. By working with almost all the information about the phenomena
there is a growing capacity to expand research questions.
• Standards and Interoperability: there are still standardization problems in the
research sector, as data is often fragmented, or generated in IT systems with
incompatible formats. Research, clinical activities, services, education, and
administrative services are siloed, and, in many organizations, each silo
maintains its own separate organizational (and sometimes duplicated) data and
information infrastructure. The lack of cross-border coordination and
technology integration calls for standards to facilitate interoperability among
the components of the Big Data value chain in research.
• Data Governance and Trust: as the amount of research related data and global
digital information grows, so does the number of actors accessing and using this
information. There is still scepticism with regards to “where the data goes to”,
“by whom it is used” and “for what purpose” in the EU fragmented and overly
complex legal environment. In what concerns to privacy, conditions under
which data are shared for research are being discussed under the EU Data
Protection Regulation but the discussion around the reliability of de-
identification (i.e., storing and sharing the data without revealing the identity of
the individuals involved) remains strong.
• Data Expertise and Infrastructure: Big Data offers enormous possibilities for
new insights, for understanding many topics and systems in many fields of
research, and for detecting interactions and nonlinearities in relations among
variables. Nevertheless, traditional data analytics, insufficient infrastructure
and funding opportunities, lack of trust in databases and shortage of data experts
and related skills hinder the development of innovative data management
solutions.
Taking in mind the complexity of the problems to be solved, there are also promising fields
to be implemented by the supply of new services and products to assure an enhanced use
of Big Data in research.

HORIZON 2020 – 732189 - AEGIS D1.1 – Domain Landscape Review and Data Value Chain Definition
WP1 – AEGIS Data Value Chain Definition and Project Methodology AEGIS Consortium
Page 58 of 108
3.1.2.7. Road Construction companies
The construction sector differs from many other sectors in its potential to use big data.
While manufacturing, finance, government, and retail already have considerable amounts
of their own big data, construction has relatively little.
Why is there such a difference?
• Fewer commercial transactions. Construction work, even in the commercial
construction sector, by its nature has fewer direct digital transactions than other
sectors like retail. While shops may log hundreds of credit card or other
electronic transactions each day, construction project actions and deliveries are
often far less frequent, even if each transaction is worth more money.
• Difficulty in gathering other digital data. Recording data and events on
construction sites has been a challenge in the past because most work is done
remotely from a computer. With that said, mobile computing and on-site
sensors connected to the Internet are beginning to change this situation.
• High percentage of small companies. The commercial construction industry is
composed of a few large firms and many small ones. There is higher turnover
among the small firms and less incentive to spend time and effort (and money)
on digitizing or improving the way they handle data.
3.1.2.8. Public sector
The public sector is facing important challenges and changes, the lack of productivity
compared to other activities, current budgetary restrictions, and other structural problems
due to the aging population that will lead an increasing demand for medical and social
services, and a foreseen lack of a young workforce in the future. The public sector is
becoming increasingly aware of the potential value to be gained from big data, as
governments generate and collect vast quantities of data through their everyday activities:
let’s just think about managing pensions and allowance payments, tax collection, National
Health System patient care, recording traffic data and issuing a huge amount of official
documents. This data is produced in many formats, textual and numerical are the most
predominant, but also in other multimedia formats for specific duties the sector has
entrusted. The benefits of big data in the public sector can be grouped into four major areas,
based on a classification of the types of benefits: advanced analytics, through automated
algorithms; improvements in effectiveness, providing greater internal transparency;
improvements in efficiency, where better services can be provided based on the
personalization of services; and learning from the performance of such services
Big Data for NGOs and Development is about turning imperfect, complex, often
unstructured data into actionable information. This implies leveraging advanced
computational tools (such as machine learning), which have developed in other fields, to
reveal trends and correlations within and across large data sets that would otherwise remain
undiscovered. The world’s biggest NGOs can surely tackle the world’s major social
problems by the use of Big Data, gathering data on what’s not working and adopting
approaches proven to solve underlying problems.

HORIZON 2020 – 732189 - AEGIS D1.1 – Domain Landscape Review and Data Value Chain Definition
WP1 – AEGIS Data Value Chain Definition and Project Methodology AEGIS Consortium
Page 59 of 108
3.1.2.9. IT Industry
Industry is generally more advanced in the use of Big Data, being accustomed to rely on
various forms of data analytics to put in place market campaign, to analyse customer
transactional data and to model new businesses. However, there are still challenges that
need to be addressed before Big Data is generally adopted. Big Data can only work out if
a business - of whatever type - puts a well-defined data strategy in place before it starts
collecting and processing information.
Obviously, investment in technology requires a strategy to use it according to commercial
expectations; otherwise, it is better to keep current systems and procedures. Most generally,
the required strategy might imply deep changes in business processes that must also be
carried out. The challenge is that operators have just not taken the time to decide what this
strategy should take them, probably due to the current economic situation and uncertain
scenarios which leads to shorter term decisions.
There is still a significant amount of data existing in paper form, or digital data not made
easily accessible and retrievable through networks.
Forward-thinking industry leaders should begin aggressively building their big data
capabilities for several reasons - raw data is translated accurately and in detail about various
consumer and business activities to make better management decisions; it narrows the gap
between industries and the consumer so that they can receive more tailored products or
services; it can minimize risks and reveal valuable insights that would otherwise remain
hidden. Lastly, it can be used to develop the next generation of products and services and
offer proactive maintenance to avoid new product failures.
Digital platforms can transform industries, allowing new ways for businesses to connect
and co-create value. Such a platform is needed to serve the unique requirements of
industrial companies. Industries such as aviation, mining, oil and gas, power generation,
and transportation represent upwards of 30% of the global economy, and touch the lives of
almost everyone on the planet. These capital-intensive industries have long-lived assets
such as aircraft, generators, locomotives, and turbines that are mission- critical and require
considerable monitoring and service throughout their 20- to 50-year lives.
A big data platform that brings new value to the wealth of data coming from these assets,
their processes, and the enterprises, in which they exist, will set the stage for a new wave
of productivity gains and information-based services.
When compared with data in other sectors (e.g., government, financial services, and retail),
industrial data is different. Its creation and use are faster; safety considerations are more
critical and security environments are more restrictive. Computation requirements are also
different. Industrial analytics need to be deployed on machines (sometimes in remote
locations) as well as run on massive cloud-based computing environments. As a result, the
integration and synchronization of data and analytics, often in real time, are needed more
than in other sectors. Industrial businesses require a big data platform optimized for these
unique characteristics.
The need for a new industrial big data platform is also driven by the advent, and thus
ubiquity, of new and cheaper forms of computing, storage, and sensor technology, as well
as the growing complexity of industrial companies themselves. Furthermore, industrial
HORIZON 2020 – 732189 - AEGIS D1.1 – Domain Landscape Review and Data Value Chain Definition
WP1 – AEGIS Data Value Chain Definition and Project Methodology AEGIS Consortium
Page 60 of 108
operators, from the COO to the field technician, are more mobile than ever, and are looking
for more consumer-like experiences in their workplaces, especially as the current
generation retires. An integrated platform responds to these dynamics, while unearthing
opportunities to connect often highly disparate operations and IT organizations.
3.1.2.10. Smart cities
The concept of smart cities has been gaining increasing attention as an application of the
big data analytics, and in the last decade attracted most both researchers and companies’
attention.
The idea is that by using ICT and data analytics technologies, in a smart city it is possible
to monitor what is happening in urban environments and optimize existing infrastructure,
to increase collaboration and integration among economic actors, to provide more efficient
services to citizens, and to support innovative business models across private and public
sectors. In fact, the analysis of big data to design and construct urban–oriented systems and
applications making them behave intelligently as to decision support lead to an
improvement of the efficiency, equity, sustainability, and quality of life in cities.
Various types of sensing devices (i.e. smart home sensors, vehicular networking, weather
and water sensors, wearable devices, surveillance objects and more), computers and
smartphones are responsible for the data generation and collection. A second step involves
computing infrastructures (wireless communication networks, telecommunication
systems, database systems, cloud computing infrastructure, and middleware architecture)
responsible for the data management (aggregation, filtration, classification). A third step
includes data processing platforms and big data analytics techniques (e.g. data mining,
machine learning, statistical analysis, and natural language processing), database
integration and management methods, modelling and simulation methods, decision support
systems, and communication and networking protocols. The final node is responsible for
application and usage of the data analysis and the results generated.
The main interesting applications of smart cities in AEGIS are:
• Public safety and civil security
• Transport efficiency
• Urban infrastructure monitoring and management
• Medical and health systems and social support
• Traffic management and street light control
3.2. Preliminary stakeholder needs identification
3.2.1. Questionnaires and Interviews
This survey has been developed jointly by the partners of the AEGIS project. AEGIS aims
to drive a data-driven innovation that expands over multiple business sectors and takes into
consideration structured, unstructured and multilingual data sets, rejuvenate the existing
models and facilitate all companies and organisations in the PSPS linked sectors to
provided better and personalised services to their users. Moreover, the project will
introduce new business models through the breed of an open ecosystem of innovation and
data sharing principles.
The questionnaire has been set up with the following aims:

HORIZON 2020 – 732189 - AEGIS D1.1 – Domain Landscape Review and Data Value Chain Definition
WP1 – AEGIS Data Value Chain Definition and Project Methodology AEGIS Consortium
Page 61 of 108
• To identify the requirements of the stakeholders that are potentially interested in
AEGIS data value chain
• To extract the needs of the big data users and possible final AEGIS users in terms
of cross domain and multilingual applications
• To define preliminary users requirements and information sources
• To understand the use of (big) data analytics in decision-making, business
processes and emerging business models
• To gather insights on the characteristics of a functioning data ecosystem in specific
domains and identify existing or potential barriers to the development of data-
driven industrial sectors
We tried to collect general information on the responder, its level of experience in using
big data and in which context, from which sources and in what language Big Data are
collected and the further expectations arising from Big Data collection and analysis.
The AEGIS Stakeholders and recipients have been selected on the basis of Table 7:
Stakeholder types, representing the target group and the final end users of the AEGIS
results.
For the first iteration, we decided to design a single questionnaire, which is offered to all
different target groups. In order to allow for some specialisation, we ask organisational
background questions in the beginning.
While settling the questions, we tried to focus on the mentioned value chain representatives
to elicit their needs, to highlight data-driven initiatives and strategies driving data
investments.
Once agreed upon the questions and the structure of the questionnaire, an online version
(powered by Google Forms) has been provided and is it still available at the following link:
https://goo.gl/forms/hCnBJOnGR3eYu47i1. The survey can be found in the Appendix.
Email invitations among the audience of stakeholders collected within the partners’ direct
links and contacts have been sent directly from each partner.
Specific virtual meetings with AEGIS use case partners have been set up to further
investigate stakeholders’ requirements. During this elicitation meetings a more clear and
detailed description and planning of the AEGIS use cases has been achieved.
The AEGIS Partners also conducted in-depth interviews with stakeholders with two-folded
aim: to support them to reply to the questionnaire and to gain further details about their use
of Big Data. The interviews have been performed in person or over the telephone. They
covered varied roles and focus areas, mainly in Insurance and IT companies.
The results both from the questionnaire and from the interviews are now being examined
for further developments within the project’s actions and the outcome will contribute to
the AEGIS project towards the creation of a Big Data value chain for public safety and
personal security.

HORIZON 2020 – 732189 - AEGIS D1.1 – Domain Landscape Review and Data Value Chain Definition
WP1 – AEGIS Data Value Chain Definition and Project Methodology AEGIS Consortium
Page 62 of 108
3.2.2. Gained Insights into stakeholder needs
We received 77 replies to the questionnaire. The respondents covered all the target groups
of AEGIS project as can be seen in the figure below. The major part (almost 50%) of them
is coming from IT industry and this is probably due to the motivation to participate to these
types of study (Table 8). There was also a good geographical distribution, all the countries
of the partners of the project were covered and there were also replies from Portugal,
France, Belgium, Bulgaria, Luxembourg, Nederland, United Kingdom, Cyprus Spain and,
outside Europe, Mexico, Argentina, United States.
Figure 10: Sector of respondents
IT Services 50%
Public
sector 8%
Research 13%
Private
sector 24%
Other 4%
Table 8: Percentages of the survey’s participant organization belonging
There was also a regular distribution of respondents in SMEs and large entities.

HORIZON 2020 – 732189 - AEGIS D1.1 – Domain Landscape Review and Data Value Chain Definition
WP1 – AEGIS Data Value Chain Definition and Project Methodology AEGIS Consortium
Page 63 of 108
Figure 11: Number of employees
According to the figures below only 34.2% are effectively using Big Data, while 35.5%
are starting using and 13.2 % are planning to use Big Data, only 17.1% have no experience.
But it seems that more than half of respondents (55.3%) has already a strategy in place.
Figure 12: To what extent does your organisation have experience in Big Data?
Figure 13: Does your organisation have a strategy on Big Data or Data Analytics?
Concerning the data sources, the most exploited sources at present are Log, Transactions,
Events, Sensors and Open Data, which are also amongst the most willing to be exploited

HORIZON 2020 – 732189 - AEGIS D1.1 – Domain Landscape Review and Data Value Chain Definition
WP1 – AEGIS Data Value Chain Definition and Project Methodology AEGIS Consortium
Page 64 of 108
in the next 5 years together with Social Media and Free-Form Text. While little interest has
been shown in Phone usage, Reports to Authorities, RFID Scans or POS Data, Earth, Space
and Geospatial data.
Figure 14: Data Sources
The most part of respondents stated that 72.6% of data sources are multilingual but only
slightly over half have the needed tools to handle different languages.

HORIZON 2020 – 732189 - AEGIS D1.1 – Domain Landscape Review and Data Value Chain Definition
WP1 – AEGIS Data Value Chain Definition and Project Methodology AEGIS Consortium
Page 65 of 108
Figure 15: Are data sources multilingual?
Figure 16: Does your organisation have the required translating tools to handle the
different languages?
Among the data sources not exploited respondents find relevant Log, Social Media and
Open Data. The main obstacles preventing the use of such types of data sources seems to
be security, privacy and legal aspects, availability and discoverability of data, lack of a
common data model and lack of the necessary skills or strategy within the organisation.

HORIZON 2020 – 732189 - AEGIS D1.1 – Domain Landscape Review and Data Value Chain Definition
WP1 – AEGIS Data Value Chain Definition and Project Methodology AEGIS Consortium
Page 66 of 108
Figure 17: What type(s) of data does your organisation find relevant but has not yet
been able to exploit?
Most of respondents (40%) stated that less than 10% of data collected is further processed
for value generation but a slightly increase is foreseen in the next 5 years. This could be
due to the fact that less than one organisation out of four has the right analytical tools to
handle big data and less than one organisation out of six has the right tools to handle
unstructured data expressed in natural language. The majority of respondents reported the
willingness to have them in 5 years.
Figure 18: From all the data collected by your organisation, what is approx. the
percentage that is further processed for value generation?

HORIZON 2020 – 732189 - AEGIS D1.1 – Domain Landscape Review and Data Value Chain Definition
WP1 – AEGIS Data Value Chain Definition and Project Methodology AEGIS Consortium
Page 67 of 108
Collected Analysed Forecast – 5 years
(Will be collected)
Log 67% 50% 83%
Social Media
Open Data PSI
Event
Sensor
Transaction
External Feeds
40-60% 10-25% 75-80%
Free-Form Text
Geospatial
Images/Videos
25% 10% 50-60%
Table 9: Summary of the most relevant data types. Percentage of participant
collecting and analysing them.
Figure 19: Does your organisation have the right analytical tools to handle (big)
data?
Figure 20: Does your organisation have the right tools to handle unstructured data
expressed in (a) natural language(s)?
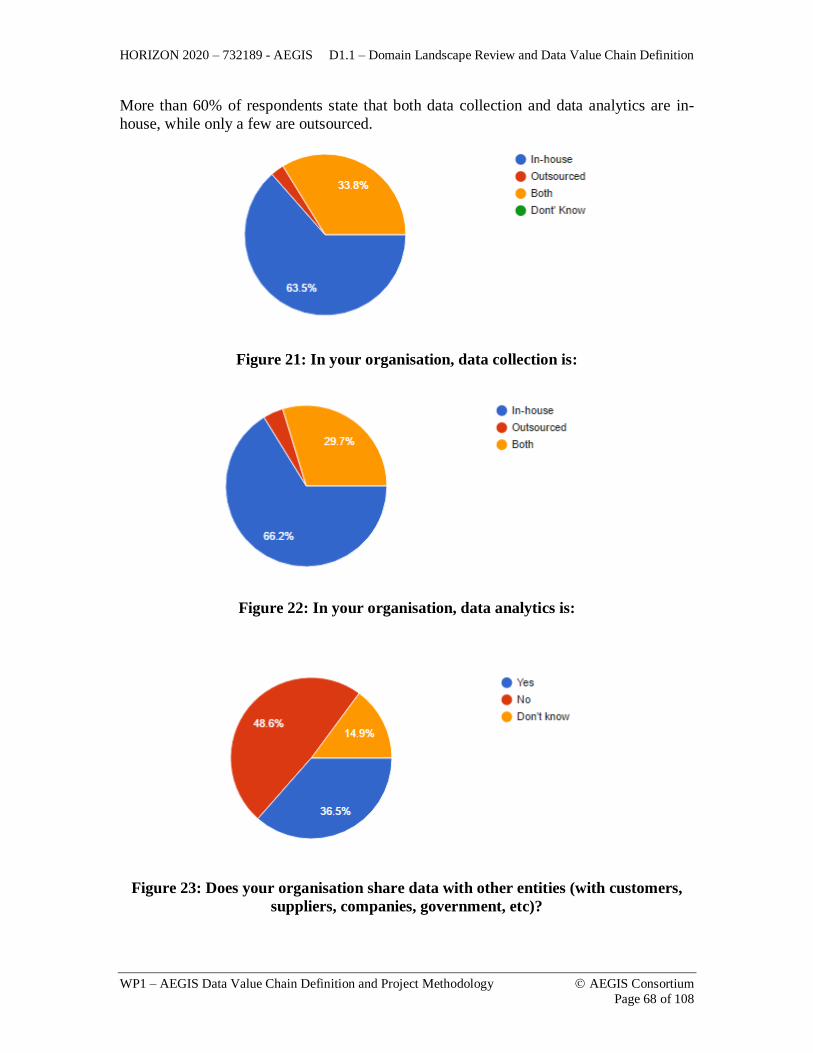
HORIZON 2020 – 732189 - AEGIS D1.1 – Domain Landscape Review and Data Value Chain Definition
WP1 – AEGIS Data Value Chain Definition and Project Methodology AEGIS Consortium
Page 68 of 108
More than 60% of respondents state that both data collection and data analytics are in-
house, while only a few are outsourced.
Figure 21: In your organisation, data collection is:
Figure 22: In your organisation, data analytics is:
Figure 23: Does your organisation share data with other entities (with customers,
suppliers, companies, government, etc)?
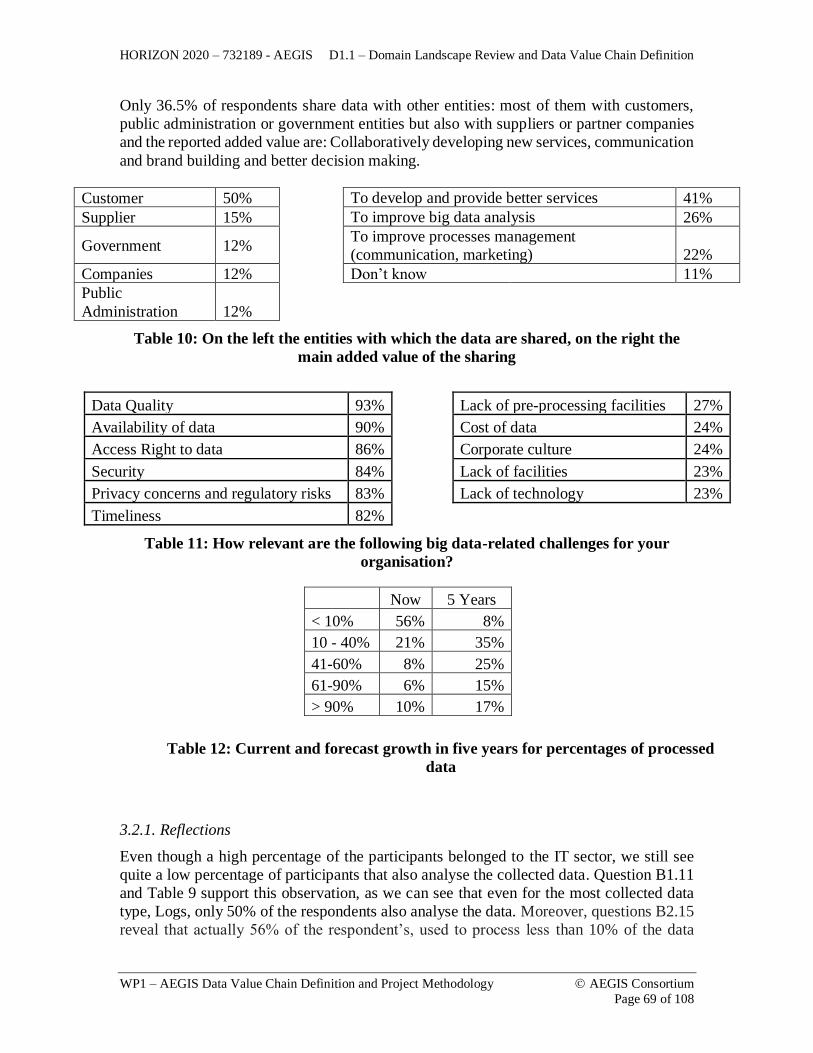
HORIZON 2020 – 732189 - AEGIS D1.1 – Domain Landscape Review and Data Value Chain Definition
WP1 – AEGIS Data Value Chain Definition and Project Methodology AEGIS Consortium
Page 69 of 108
Only 36.5% of respondents share data with other entities: most of them with customers,
public administration or government entities but also with suppliers or partner companies
and the reported added value are: Collaboratively developing new services, communication
and brand building and better decision making.
Customer 50% To develop and provide better services 41%
Supplier 15% To improve big data analysis 26%
Government 12%
To improve processes management
(communication, marketing) 22%
Companies 12% Don’t know 11%
Public
Administration 12%
Table 10: On the left the entities with which the data are shared, on the right the
main added value of the sharing
Data Quality 93% Lack of pre-processing facilities 27%
Availability of data 90% Cost of data 24%
Access Right to data 86% Corporate culture 24%
Security 84% Lack of facilities 23%
Privacy concerns and regulatory risks 83% Lack of technology 23%
Timeliness 82%
Table 11: How relevant are the following big data-related challenges for your
organisation?
3.2.1. Reflections
Even though a high percentage of the participants belonged to the IT sector, we still see
quite a low percentage of participants that also analyse the collected data. Question B1.11
and Table 9 support this observation, as we can see that even for the most collected data
type, Logs, only 50% of the respondents also analyse the data. Moreover, questions B2.15
reveal that actually 56% of the respondent’s, used to process less than 10% of the data
Now 5 Years
< 10% 56% 8%
10 - 40% 21% 35%
41-60% 8% 25%
61-90% 6% 15%
> 90% 10% 17%
Table 12: Current and forecast growth in five years for percentages of processed
data

HORIZON 2020 – 732189 - AEGIS D1.1 – Domain Landscape Review and Data Value Chain Definition
WP1 – AEGIS Data Value Chain Definition and Project Methodology AEGIS Consortium
Page 70 of 108
collected and only around 20% of them analyse more than 50% of the data collected (see
Table 14).
The forecast for the near future points towards a small increase in both the collection and
analysis of data. This trend of small increase points towards a scepticism behind big data
analytics. This scepticism comes firstly from the dissatisfaction of the current big data
analytics tools, in fact only the 26% of the respondent have indicated that they already have
the tools for big data management (only 70% are effectively using or beginning to use big
data, Figure 12).
Regarding the tools in use for big data analytics, the most popular are Hadoop (Apache)
21% and Microsoft Power BI (17%). While 50% of the respondents answered that they
have the tools to translate data between languages, there is no general tool used for this
purpose.
3.2.2. Conclusions
The following table highlights the main outcomes of our survey’s analysis.
Questions Main outcomes Business Requirements
A) From what sources does your
organisation collect, or expects to
collect, data?
B) What type(s) of data does your
organisation find relevant but has not
yet been able to exploit?
C) Does your organisation have the
right analytical tools to handle (big)
data?
D) From all the data collected by
your organisation, what is approx.
the percentage that is further
processed for value generation
(Currently and Expected in 5 years)?
Low utilisation rate of the data
collected, including the ones
pointed out as most relevant:
- lack of right tools
- available tools difficult to use
- the data is heterogeneous (i.e.
structured and unstructured,
different languages)
- privacy and security
- organizational issues
Customizable services
Analysis of different types of
data sources
Protection of personal data and
privacy
A) Are data sources multilingual?
B) Does your organisation have the
needed translating tools to handle the
different languages?
C) Does your organisation have the
right tools to handle unstructured
data expressed in (a) natural
language(s)?
Large percentage of
multilingual data
Lack of right translating tools
Standard tools
Adoption of Semantic Web and
ontologies

HORIZON 2020 – 732189 - AEGIS D1.1 – Domain Landscape Review and Data Value Chain Definition
WP1 – AEGIS Data Value Chain Definition and Project Methodology AEGIS Consortium
Page 71 of 108
A) In your organisation, data
collection is
B) In your organisation, data
analytics is
C) Does your organisation buy
datasets from other entities
D) Does your organisation share data
with other entities (with customers,
suppliers, companies, government,
etc)?
E) Do you see a need to share data
processing facilities
Data collection and analysis
are mainly in-house (65%),
data sharing with other entities
is less than 40%
Sharing services to analyse data
and analytics results without
sharing the data itself
Different levels of visibility and
privacy on the data
A) How relevant are the following
big data-related challenges for your
organisation?
The stakeholders have
identified the same
requirements about big data
analysis (Table 11)
Taking into account data quality,
availability and accessibility
Handling policies that ensure
security and privacy and adhere
to regulatory frameworks
Protection of IPR
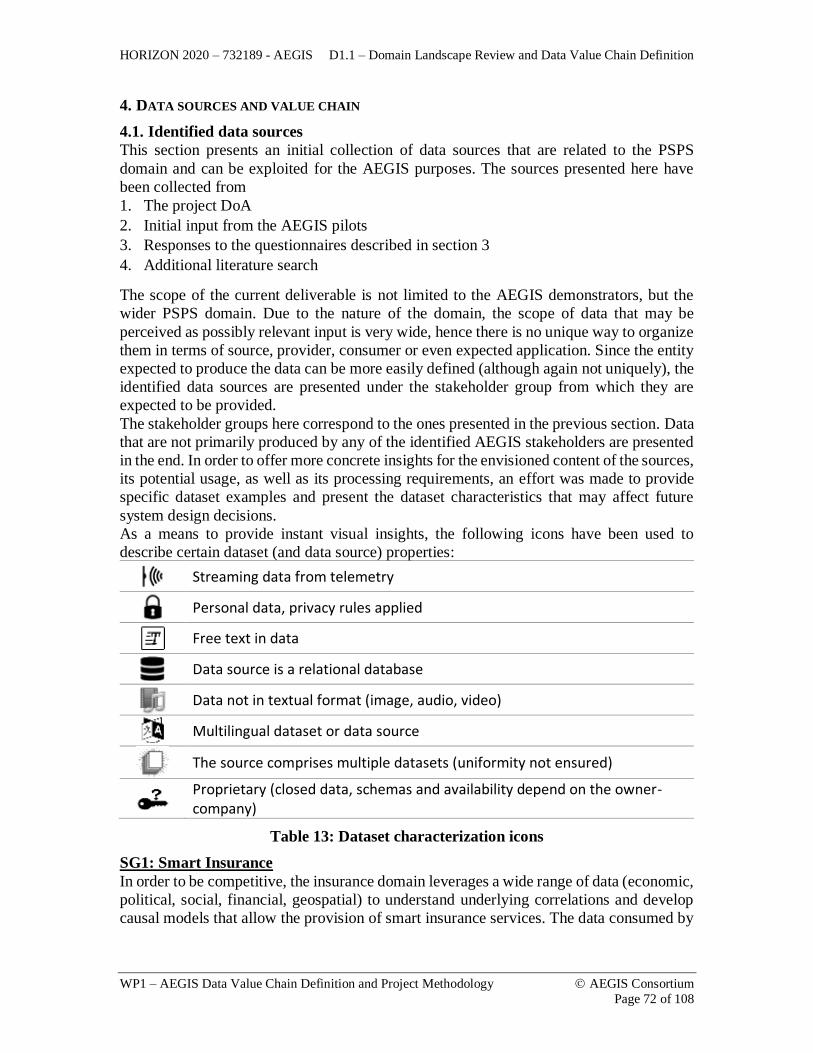
HORIZON 2020 – 732189 - AEGIS D1.1 – Domain Landscape Review and Data Value Chain Definition
WP1 – AEGIS Data Value Chain Definition and Project Methodology AEGIS Consortium
Page 72 of 108
4. DATA SOURCES AND VALUE CHAIN
4.1. Identified data sources
This section presents an initial collection of data sources that are related to the PSPS
domain and can be exploited for the AEGIS purposes. The sources presented here have
been collected from
1. The project DoA
2. Initial input from the AEGIS pilots
3. Responses to the questionnaires described in section 3
4. Additional literature search
The scope of the current deliverable is not limited to the AEGIS demonstrators, but the
wider PSPS domain. Due to the nature of the domain, the scope of data that may be
perceived as possibly relevant input is very wide, hence there is no unique way to organize
them in terms of source, provider, consumer or even expected application. Since the entity
expected to produce the data can be more easily defined (although again not uniquely), the
identified data sources are presented under the stakeholder group from which they are
expected to be provided.
The stakeholder groups here correspond to the ones presented in the previous section. Data
that are not primarily produced by any of the identified AEGIS stakeholders are presented
in the end. In order to offer more concrete insights for the envisioned content of the sources,
its potential usage, as well as its processing requirements, an effort was made to provide
specific dataset examples and present the dataset characteristics that may affect future
system design decisions.
As a means to provide instant visual insights, the following icons have been used to
describe certain dataset (and data source) properties:
Streaming data from telemetry
Personal data, privacy rules applied
Free text in data
Data source is a relational database
Data not in textual format (image, audio, video)
Multilingual dataset or data source
The source comprises multiple datasets (uniformity not ensured)
Proprietary (closed data, schemas and availability depend on the owner-company)
Table 13: Dataset characterization icons
SG1: Smart Insurance
In order to be competitive, the insurance domain leverages a wide range of data (economic,
political, social, financial, geospatial) to understand underlying correlations and develop
causal models that allow the provision of smart insurance services. The data consumed by

HORIZON 2020 – 732189 - AEGIS D1.1 – Domain Landscape Review and Data Value Chain Definition
WP1 – AEGIS Data Value Chain Definition and Project Methodology AEGIS Consortium
Page 73 of 108
the Insurance sector and its interactions with other domains will be presented in section
4.2. This section presents the data sources provided by stakeholders in the domain.
Types of provided data Main sources Dataset Characteristics &
Indicative Datasets
Company claims • Internal databases (customers, claims,
incidents)
• Internal systems (CRM, portfolio)
• Digital documentation of claims
Company customer data
Public data National and international authorities and
institutions, business open data
Indicative datasets
UK Motor Insurance
Database4
Insurance, gross claims
payments by type of
enterprise5
Company call center data Internal recordings and transcripts
Table 14: SG1 provided data
Comments on provided data:
• Data from the internal insurance systems are very sensitive in terms of personal
privacy, so very secure and privacy-respectful data sharing mechanisms are required
• There is a lack of cross-company schemas, since companies have their own relational
databases
• Open data shown above should be further examined in the course of the project
according to specific demonstrator needs.
SG2 - Smart home
The following table presents the data that are provided by Smart Home stakeholders.
Types of
provided data Main sources Dataset Characteristics & Indicative Datasets
Occupancy
Ambient sensors
List of commonly used proptocols:
https://en.wikipedia.org/wiki/Home_automation#Protocols
Refer to Table 16 for expected data volume from ambient
sensors, according to demonstrator “Smart Home and Assisted
Living”.
Luminance
Temperature
Humidity
tVOC
PM2.5 data
Safety & Security
telemetry
Alarm Signals
Pool automation sensors
Energy
consumption
Εlectricity & gas
consumption smart meters
List of commonly used standards:
http://www.iec.ch/smartgrid/standards/
4 https://www.mib.org.uk/managing-insurance-data/the-motor-insurance-database-mid/public-access/ 5 https://data.europa.eu/euodp/en/data/dataset/W13viwr1sWcOtTJcHeEw
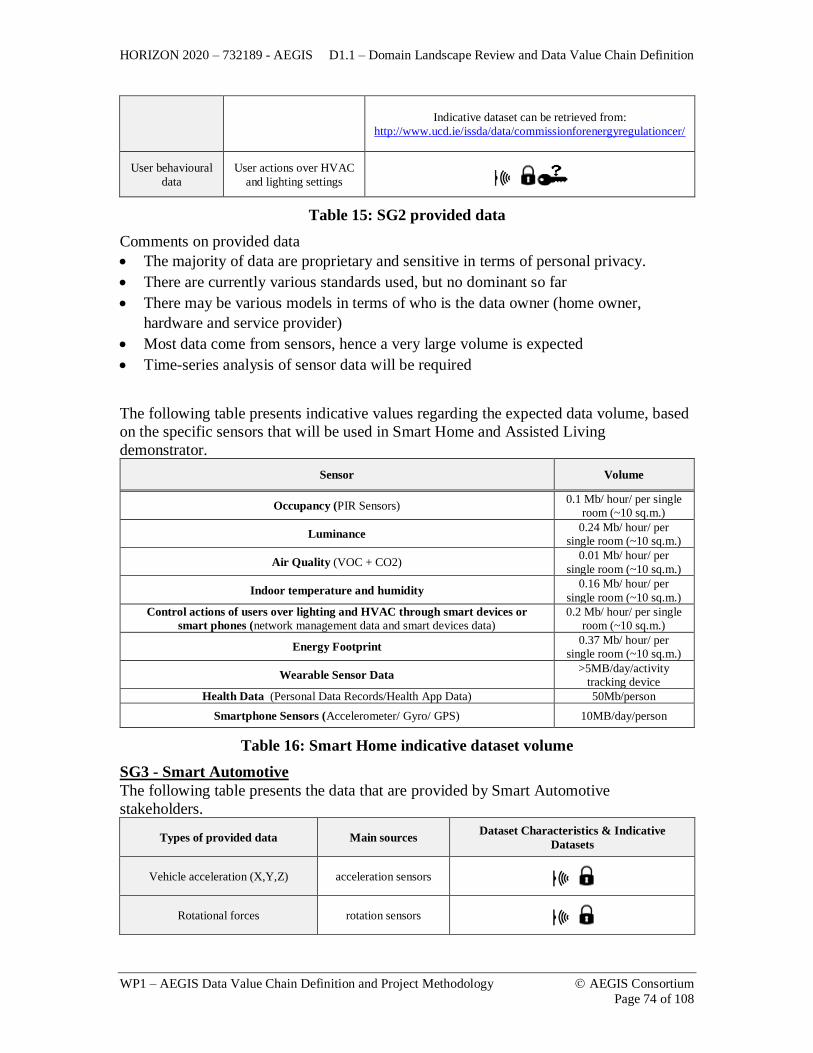
HORIZON 2020 – 732189 - AEGIS D1.1 – Domain Landscape Review and Data Value Chain Definition
WP1 – AEGIS Data Value Chain Definition and Project Methodology AEGIS Consortium
Page 74 of 108
Indicative dataset can be retrieved from:
http://www.ucd.ie/issda/data/commissionforenergyregulationcer/
User behavioural
data
User actions over HVAC
and lighting settings
Table 15: SG2 provided data
Comments on provided data
• The majority of data are proprietary and sensitive in terms of personal privacy.
• There are currently various standards used, but no dominant so far
• There may be various models in terms of who is the data owner (home owner,
hardware and service provider)
• Most data come from sensors, hence a very large volume is expected
• Time-series analysis of sensor data will be required
The following table presents indicative values regarding the expected data volume, based
on the specific sensors that will be used in Smart Home and Assisted Living
demonstrator.
Sensor Volume
Occupancy (PIR Sensors) 0.1 Mb/ hour/ per single
room (~10 sq.m.)
Luminance 0.24 Mb/ hour/ per
single room (~10 sq.m.)
Air Quality (VOC + CO2) 0.01 Mb/ hour/ per
single room (~10 sq.m.)
Indoor temperature and humidity 0.16 Mb/ hour/ per
single room (~10 sq.m.)
Control actions of users over lighting and HVAC through smart devices or
smart phones (network management data and smart devices data)
0.2 Mb/ hour/ per single
room (~10 sq.m.)
Energy Footprint 0.37 Mb/ hour/ per
single room (~10 sq.m.)
Wearable Sensor Data >5MB/day/activity
tracking device
Health Data (Personal Data Records/Health App Data) 50Mb/person
Smartphone Sensors (Accelerometer/ Gyro/ GPS) 10MB/day/person
Table 16: Smart Home indicative dataset volume
SG3 - Smart Automotive
The following table presents the data that are provided by Smart Automotive
stakeholders.
Types of provided data Main sources Dataset Characteristics & Indicative
Datasets
Vehicle acceleration (X,Y,Z) acceleration sensors
Rotational forces rotation sensors

HORIZON 2020 – 732189 - AEGIS D1.1 – Domain Landscape Review and Data Value Chain Definition
WP1 – AEGIS Data Value Chain Definition and Project Methodology AEGIS Consortium
Page 75 of 108
Location GPS
on board diagnostics OBD II
A list of OBD II signal protocolos can be found
here: https://en.wikipedia.org/wiki/On-
board_diagnostics#OBD-II_signal_protocols
Driver video
Open street cameras Refer to Table 20 for data coming from SG5
Car cameras (dash
cameras) Legal constraints in many European countries
Traffic messages
Real time navigation
services
(Satellite data and/or car
sensor data are
leveraged here)
Indicative datasets
Via Michelin Maps and Route
Planner6
TOMTOM traffic Europe cam7
CE Traffic8
Table 17: SG3 provided data
Comments on the provided data:
• Multimedia content should be re-considered according to the demonstrator needs, as it
may require different storage, processing and analysis functionalities.
• The majority of data come from sensors, so similar to Smart Home there will be a very
large volume of them and the need to perform time-series analysis.
SG4 - Health
The following table presents the data that are provided by Health stakeholders.
Types of
provided data Main sources Dataset Characteristics & Indicative Datasets
Public Health
National
authorities reports
Refer to Table 19 for indicative datasets
WHO
Eurostat
OECD
Public hospitals
medical and
patient data
Respective data sources not foreseen in the initial AEGIS use cases, but
may arise in the course of the project as new collaborations Private clinic
medical and
patient data
6https://www.viamichelin.com/web/Traffic/Traffic_info-Europe-78280-Yvelines-
France?strLocid=31NDNwdjMxMGNORGd1TnpZMU5EZz1jTWk0d05qZzJNdz09 7 https://www.tomtom.com/en_us/drive/maps-services/shop/real-time-traffic/europe-truck/ 8 http://www.ce-traffic.com/en/traffic-3/

HORIZON 2020 – 732189 - AEGIS D1.1 – Domain Landscape Review and Data Value Chain Definition
WP1 – AEGIS Data Value Chain Definition and Project Methodology AEGIS Consortium
Page 76 of 108
Clinical Trials
Data
Pharmaceutical
Data
Clinical Trials
Data
Respective data sources not foreseen in the initial AEGIS use cases, but
may arise in the course of the project as new collaborations
Open Data Indicative dataset: General Pharmaceutical Services UK
https://data.gov.uk/dataset/general_pharmaceutical_services
Personal Health
Data
Health records
Medical results
Activity tracking
wearable devices
Indicative dataset:
https://runkeeper.com/developer/healthgraph/overview
Medical IoT
Indicative datasets
GPS-enabled trackers for asthma inhaler usage
Symptom tracking application data
Table 18: SG4 provided data
Comments on the provided datasets:
• Some of the data sources are sensitive in terms of personal privacy
• The quality of open data should be carefully evaluated per dataset
• Very aggregated datasets may be hard to use effectively in new analysis
• The open sources have very diverse information in terms of content and structure which
makes it hard to combine them in a fruitful way. Please refer to the next table for
indicative examples.
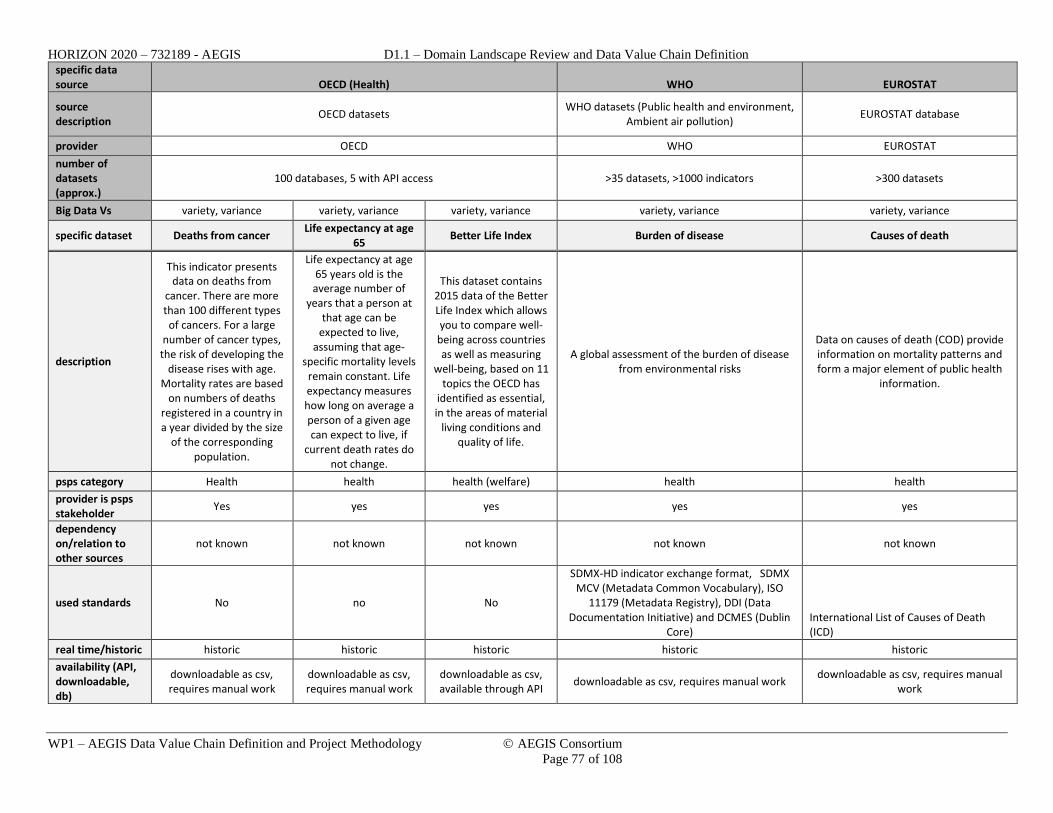
HORIZON 2020 – 732189 - AEGIS D1.1 – Domain Landscape Review and Data Value Chain Definition
WP1 – AEGIS Data Value Chain Definition and Project Methodology AEGIS Consortium
Page 77 of 108
specific data source OECD (Health) WHO EUROSTAT
source description
OECD datasets WHO datasets (Public health and environment,
Ambient air pollution) EUROSTAT database
provider OECD WHO EUROSTAT
number of datasets (approx.)
100 databases, 5 with API access >35 datasets, >1000 indicators >300 datasets
Big Data Vs variety, variance variety, variance variety, variance variety, variance variety, variance
specific dataset Deaths from cancer Life expectancy at age
65 Better Life Index Burden of disease Causes of death
description
This indicator presents data on deaths from
cancer. There are more than 100 different types of cancers. For a large
number of cancer types, the risk of developing the
disease rises with age. Mortality rates are based
on numbers of deaths registered in a country in a year divided by the size
of the corresponding population.
Life expectancy at age 65 years old is the average number of
years that a person at that age can be
expected to live, assuming that age-
specific mortality levels remain constant. Life expectancy measures how long on average a person of a given age can expect to live, if
current death rates do not change.
This dataset contains 2015 data of the Better Life Index which allows you to compare well-being across countries as well as measuring
well-being, based on 11 topics the OECD has
identified as essential, in the areas of material
living conditions and quality of life.
A global assessment of the burden of disease from environmental risks
Data on causes of death (COD) provide information on mortality patterns and form a major element of public health
information.
psps category Health health health (welfare) health health
provider is psps stakeholder
Yes yes yes yes yes
dependency on/relation to other sources
not known not known not known not known not known
used standards No no No
SDMX-HD indicator exchange format, SDMX MCV (Metadata Common Vocabulary), ISO
11179 (Metadata Registry), DDI (Data Documentation Initiative) and DCMES (Dublin
Core) International List of Causes of Death (ICD)
real time/historic historic historic historic historic historic
availability (API, downloadable, db)
downloadable as csv, requires manual work
downloadable as csv, requires manual work
downloadable as csv, available through API
downloadable as csv, requires manual work downloadable as csv, requires manual
work

HORIZON 2020 – 732189 - AEGIS D1.1 – Domain Landscape Review and Data Value Chain Definition
WP1 – AEGIS Data Value Chain Definition and Project Methodology AEGIS Consortium
Page 78 of 108
level of granularity (statistical i.e. processed vs raw)
yearly aggregated per country and gender
yearly aggregated per country and gender
yearly aggregated per country
yearly aggregated yearly aggregated
text/image/audio/video
Text text text text text
format Csv csv csv (downloadable), json (API response)
csv csv
multilingual No no no no no
link https://data.oecd.org/he
althstat/deaths-from-cancer.htm
https://data.oecd.org/healthstat/life-
expectancy-at-65.htm#indicator-chart
http://stats.oecd.org/viewhtml.aspx?datasetco
de=BLI&lang=en#
http://apps.who.int/gho/data/node.main.156?lang=en
http://appsso.eurostat.ec.europa.eu/nui/show.do?dataset=hlth_cd_aro&lang=en
temporal and spatial coverage
1960-2013, OECD countries
1960-2014, OECD countries
2016, OECD countries 2012, WHO countries (subset of) 2011-2014, EC countries
maintenance updated every year, depending on data
availability
updated every year, depending on data
availability
updated every year, depending on data
availability updated every year unknown
related demonstrator
smart home and assisted living, insurance
smart home and assisted living,
insurance
smart home and assisted living,
insurance
smart home and assisted living, insurance, automotive
smart home and assisted living, insurance, automotive
Indicative scenario coverage
Monitoring and alert services for the elderly
Accessibility, Permissions, Anonymization
no personal data included no personal data
included no personal data
included no personal data included no personal data included
limitations/permission status/license
It is the User’s responsibility to verify either in the metadata or source information whether the Data is fully or partially owned by third parties and/or whether additional restrictions may apply... Except where additional restrictions
apply as stated above, You can extract from, download, copy, adapt, print, distribute, share and embed Data for any purpose, even for commercial use.
You must give appropriate credit to the OECD. ( More information at http://www.oecd.org/termsandconditions/ and
http://www.oecd.org/about/publishing/rightsandpermissions.htm )
WHO exercises copyright over its information to make sure that it is used in accordance with the Organization's principles. Extracts of WHO information can be used for private study or
for educational purposes without permission. Wider use requires permission to be obtained
from WHO. WHO licenses its published material widely, in order to encourage
maximum use and dissemination. For more information on how to obtain a licence (either commercial or non-commercial) from WHO:
http://www.who.int/about/licensing/en/
Except where otherwise stated, downloading and reproduction of
Eurostat data/documents for personal use or for further non-commercial or
commercial dissemination are authorised provided appropriate
acknowledgement is given to Eurostat as the source, and subject to the
exceptions/conditions hereinafter specified. (
http://ec.europa.eu/eurostat/statistics-explained/index.php/Copyright/licence_
policy )
Table 19: Indicative health related datasets

HORIZON 2020 – 732189 - AEGIS D1.1 – Domain Landscape Review and Data Value Chain Definition
WP1 – AEGIS Data Value Chain Definition and Project Methodology AEGIS Consortium
Page 79 of 108
It is important to note that, depending on the purpose of the application/service to be
developed and the country (or countries) it is targeted at, a number of additional relevant
and more fine-grained sources may be available. Indicatively, the website
http://www.scopesante.fr/fiches-etablissements provides a catalogue of all health facilities
in France which could be useful for a case similar to the AEGIS smart home and assisted
living demonstrator. However, it would be impossible and of very low value to attempt to
provide an exhaustive list of such sources.
SG5 - Public safety / law enforcement
The following table presents the data that are provided by stakeholders in the Public
Safety/ Law enforcement group.
Types of provided
data
Main
sources Dataset Characteristics & Indicative Datasets
Crime related
National
police
reports
Refer to Table 21 for indicative datasets
Eurostat
European
Commissi
on
Traffic related
National
traffic
police
reports
Refer to Table 22 for indicative datasets
Eurostat
OECD
Open
street
traffic
cameras
Indicative Dataset9
Nationwide cameras from the Finnish Road Administration10
Traffic cameras from the Francophone part of Belgium11
Real time
traffic
data &
road
condition
data
List of sites fro Traffic & Weather Informations for Europe available at
http://www.nor-truck.de/trafic_and_weather.htm
Indicatively for Switcherland: http://www.truckinfo.ch/index.php5
Highways England service for traffic monitoring
http://www.trafficengland.com/traffic-report
Catalogue of websites showing road conditions, traffic (often together with
weather forecast ) at http://europerides.com/rideblog/road-conditions/
Disaster related
EEA
Refer to Table 23for indicative datasets
EM-DAT
Live
flood data
Indicative dataset: UK flood related streaming data at
https://environment.data.gov.uk/flood-monitoring/data/readings?latest
9 A list of traffic web cameras (not only in Europe) can be found in http://www.brombeer.net/cams/ 10 http://liikennetilanne.liikennevirasto.fi/?view=drivingConditionView 11 http://trafiroutes.wallonie.be/trafiroutes/cameras/

HORIZON 2020 – 732189 - AEGIS D1.1 – Domain Landscape Review and Data Value Chain Definition
WP1 – AEGIS Data Value Chain Definition and Project Methodology AEGIS Consortium
Page 80 of 108
EFFIS
Annual Fire reports available at
http://forest.jrc.ec.europa.eu/effis/reports/annual-fire-reports/
CSEM-
EMSC
earthquak
es
Latest earthquakes dataset available at
http://m.emsc.eu/earthquake/latest.php?min_mag=n/a&max_mag=n/a&date=n/a
&euromed=World
Table 20: SG5 related data
Comments on provided data:
The majority of data here come from open sources and have the following, frequently
encountered with, characteristics:
• The sources may not be properly maintained
• There is a lack of schemas and standards
• Spatial and temporal coverage is not always clearly given
• There is a difficulty in the interlinking of similar data from different sources
• The level of granularity may be inappropriate for useful analysis
• There are multilingualism difficulties
The fact that there is a very large number of small datasets that have these characteristics
should be considered in order to avoid having low quality and non-processible data. In
order to make the difficulties more clear, the following three tables present detailed dataset
examples.

HORIZON 2020 – 732189 - AEGIS D1.1 – Domain Landscape Review and Data Value Chain Definition
WP1 – AEGIS Data Value Chain Definition and Project Methodology AEGIS Consortium
Page 81 of 108
specific data source UK police Hellenic Police
source description Open data about crime and policing in England, Wales and Northern Ireland. Statistics PUBLISHED BY Hellenic Police regarding criminality, road accidents, immigration
etc. The source also publishes relevant Eurostat reports.
provider UK police UK Police Hellenic Police
number of datasets (approx.)
>45 datasets 1 API >80 datasets
Big Data Vs variety, veracity variety, veracity variety, veracity
specific dataset Street-level crimes (data) Street-level crimes (API) Crime records for 2016
description
The CSV files provide street-level crime, outcome, and stop and
search information, broken down by police force and 2011 lower layer super output area (LSOA).
Crimes at street-level; either within a 1 mile radius of a single point, or within a custom area. The street-
level crimes returned in the API are only an approximation of where the actual crimes occurred, they are not
the exact locations.
Number of solved and unsolved crimes in the Hellenic district
psps category Public Safety Public Safety Public Safety
provider is psps stakeholder
yes yes yes
dependency on/relation to other
sources unknown unknown unknown
used standards no no no
real time/historic historic historic historic
availability (API, downloadable, db)
doanloadable as csv API downloadable as csv
level of granularity (statistical i.e.
processed vs raw) incident-level data
incident-level requests and responses
aggregated 6-month
text/image/audio/video
text text text
format csv json csv
multilingual no no no
link https://data.police.uk/data/
https://data.police.uk/docs/method/crime-street/
http://www.astynomia.gr/index.php?option=ozo_content&perform=view&id=64341&Itemid=73&lang=
temporal and spatial coverage
December 2010-December 2016, UK
December 2010-December 2016, UK 2016, Greece
maintenance updated monthly updated monthly updated every 6 months

HORIZON 2020 – 732189 - AEGIS D1.1 – Domain Landscape Review and Data Value Chain Definition
WP1 – AEGIS Data Value Chain Definition and Project Methodology AEGIS Consortium
Page 82 of 108
related demonstrator
insurance, smart home and assisted living
insurance, smart home and assisted living
insurance, smart home and assisted living
Indicative scenario coverage
Monitoring and alert services for the elderly, Insurance fraud prevention
Accessibility, Permissions,
Anonymization
The latitude and longitude locations of Crime and ASB incidents published on this site always represent the approximate location of a crime — not the
exact place that it happened. A master list of over 750,000 'anonymous' map points is maintained and each map point is specifically chosen so that (1) it appears over the centre point of a street, above a public place such as a Park or Airport, or above a commercial premise like a Shopping Centre or Nightclub. (2) it has a catchment area which contains at least eight postal addresses or no postal addresses at all. When crime data is uploaded by police forces, the exact location of each crime is compared against this
master list to find the nearest map point. The co-ordinates of the actual crime are then replaced with the co-ordinates of the map point. If the
nearest map point is more than 20km away, the co-ordinates are zeroed out. No other filtering or rules are applied.
no personal data included
limitations/permission status/license
Open Government License v3.0 (https://www.nationalarchives.gov.uk/doc/open-government-
licence/version/3/ ) no limitations specified
Table 21: Indicative crime related datasets
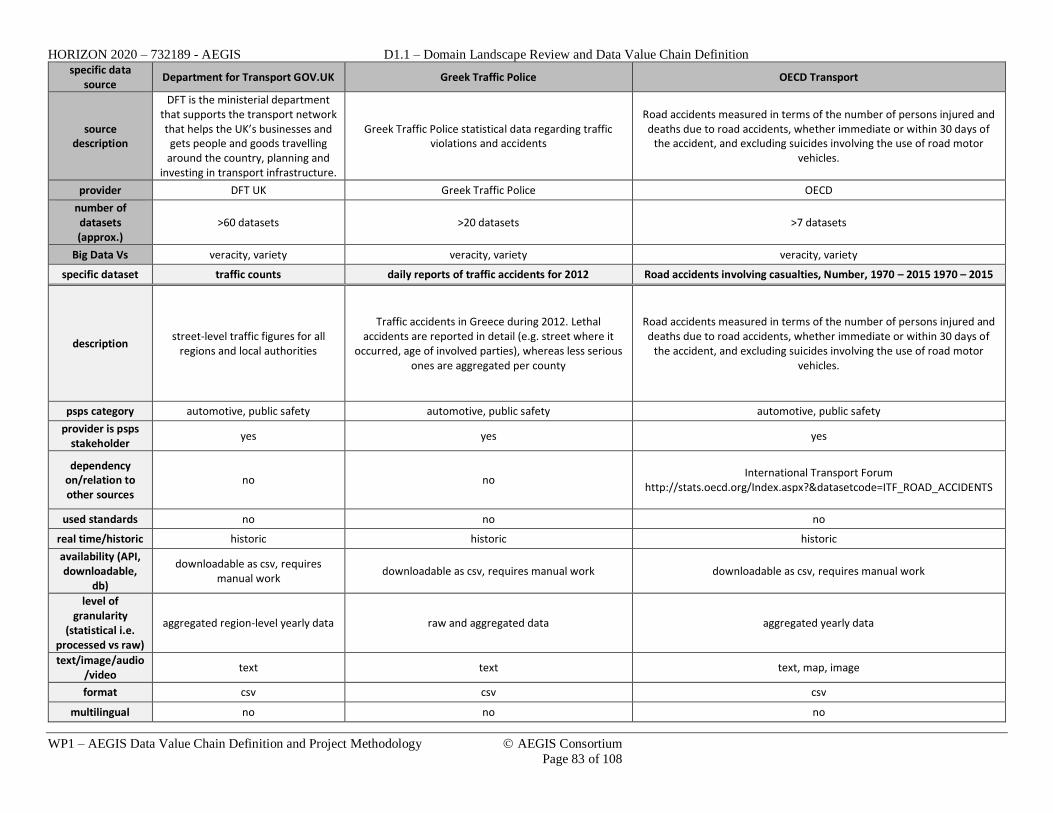
HORIZON 2020 – 732189 - AEGIS D1.1 – Domain Landscape Review and Data Value Chain Definition
WP1 – AEGIS Data Value Chain Definition and Project Methodology AEGIS Consortium
Page 83 of 108
specific data source
Department for Transport GOV.UK Greek Traffic Police OECD Transport
source description
DFT is the ministerial department that supports the transport network that helps the UK’s businesses and gets people and goods travelling
around the country, planning and investing in transport infrastructure.
Greek Traffic Police statistical data regarding traffic violations and accidents
Road accidents measured in terms of the number of persons injured and deaths due to road accidents, whether immediate or within 30 days of
the accident, and excluding suicides involving the use of road motor vehicles.
provider DFT UK Greek Traffic Police OECD
number of datasets (approx.)
>60 datasets >20 datasets >7 datasets
Big Data Vs veracity, variety veracity, variety veracity, variety
specific dataset traffic counts daily reports of traffic accidents for 2012 Road accidents involving casualties, Number, 1970 – 2015 1970 – 2015
description street-level traffic figures for all
regions and local authorities
Traffic accidents in Greece during 2012. Lethal accidents are reported in detail (e.g. street where it
occurred, age of involved parties), whereas less serious ones are aggregated per county
Road accidents measured in terms of the number of persons injured and deaths due to road accidents, whether immediate or within 30 days of
the accident, and excluding suicides involving the use of road motor vehicles.
psps category automotive, public safety automotive, public safety automotive, public safety
provider is psps stakeholder
yes yes yes
dependency on/relation to other sources
no no International Transport Forum
http://stats.oecd.org/Index.aspx?&datasetcode=ITF_ROAD_ACCIDENTS
used standards no no no
real time/historic historic historic historic
availability (API, downloadable,
db)
downloadable as csv, requires manual work
downloadable as csv, requires manual work downloadable as csv, requires manual work
level of granularity
(statistical i.e. processed vs raw)
aggregated region-level yearly data raw and aggregated data aggregated yearly data
text/image/audio/video
text text text, map, image
format csv csv csv
multilingual no no no

HORIZON 2020 – 732189 - AEGIS D1.1 – Domain Landscape Review and Data Value Chain Definition
WP1 – AEGIS Data Value Chain Definition and Project Methodology AEGIS Consortium
Page 84 of 108
link http://www.dft.gov.uk/traffic-
counts/download.php
http://www.astynomia.gr/index.php?option=ozo_content&perform=view&id=55312&Itemid=86&lang=
https://data.oecd.org/transport/road-accidents.htm
temporal and spatial coverage
2000-2015, Great Britain (England, Scotland, Wales)
2012, Greece 1970-2015
maintenance annually updated annually updated regularly updated
related demonstrator
automotive, assisted living, insurance
automotive, assisted living, insurance automotive, assisted living, insurance
Indicative scenario coverage
automotive smart map
Accessibility, Permissions,
Anonymization no personal data included no personal data included no personal data included
limitations/permission
status/license
Open Government License v3.0 (https://www.nationalarchives.gov.
uk/doc/open-government-licence/version/3/ )
no limitations specified
It is the User’s responsibility to verify either in the metadata or source information whether the Data is fully or partially owned by third parties
and/or whether additional restrictions may apply... Except where additional restrictions apply as stated above, You can extract from,
download, copy, adapt, print, distribute, share and embed Data for any purpose, even for commercial use. You must give appropriate credit to
the OECD. ( More information at http://www.oecd.org/termsandconditions/ and
http://www.oecd.org/about/publishing/rightsandpermissions.htm )
Table 22: Indicative traffic related datasets

HORIZON 2020 – 732189 - AEGIS D1.1 – Domain Landscape Review and Data Value Chain Definition
WP1 – AEGIS Data Value Chain Definition and Project Methodology AEGIS Consortium
Page 85 of 108
specific data source EM-DAT European Environment Agency
source description
EM-DAT contains essential core data on the occurrence and effects of over 22,000 mass disasters in the world from 1900 to the present day. The database is compiled from various sources, including UN
agencies, non-governmental organisations, insurance companies, research institutes and press agencies.
The European Environment Agency provides sound, independent information on the environment for those
involved in developing, adopting, implementing and evaluating environmental policy, and also the general
public. In close collaboration with European Environmental Information and Observation Network and
its 33 member countries, the EEA gathers data and produces assessments on a wide range of topics related
to the environment
provider EM-DAT team (data come from various sources, priority is given to data from UN agencies, governments, and the International Federation of Red Cross and Red Crescent Societies. )
European Environment Agency
number of datasets (approx.)
N/A (source is a database) N/A (source is a database) 1 dataset (& 1 database)
Big Data Vs variety, veracity variety, veracity variety, veracity
specific dataset detailed data search disasters list dataset European past floods
description advanced search functionality in disaster data which
supports downloading results in csv format
This section provides a disaster list generated from the user's query,
including the main indicators. It will allow a complete overview on specific
events in a country, region or continent.
Dataset contains information on past floods in Europe since 1980, based on the reporting of EU Member States for the EU Floods Directive (2007/60/EC) and combined
with information provided by relevant national authorities and global databases on natural hazards.
Reported data have been assessed and processed by the ETC-ICM and the EEA.
psps category disasters (natural, technological, complex) disasters (natural, technological,
complex) disasters (natural, technological, complex)
provider is psps stakeholder
yes Yes no

HORIZON 2020 – 732189 - AEGIS D1.1 – Domain Landscape Review and Data Value Chain Definition
WP1 – AEGIS Data Value Chain Definition and Project Methodology AEGIS Consortium
Page 86 of 108
dependency on/relation to other sources
not directly not directly
1. Floods Directive - Preliminary Flood Risk Assessment and Areas of Potential Significant Flood Risk
(http://rod.eionet.europa.eu/obligations/601) 2. Dartmouth Flood Observatory data
(http://floodobservatory.colorado.edu/) 3. EM-DAT data (http://www.emdat.be/)
4. National authorities during consultation (http://forum.eionet.europa.eu/nrc-eionet-
freshwater/library/country-review-european-floods-impact-database-2015)
used standards no No no
real time/historic historic Historic historic
availability (API, downloadable, db)
downloadable as csv, requires manual work downloadable as csv, requires manual
work downloadable, requires manual work
level of granularity (statistical i.e. processed
vs raw) aggregated data aggregated data aggregated data
text/image/audio/video text Text text
format csv Csv Microsoft Access DB, csv
multilingual no No no
link http://www.emdat.be/advanced_search/index.html
http://www.emdat.be/disaster_list/index.html
http://www.eea.europa.eu/data-and-maps/data/european-past-floods
temporal and spatial coverage
1900-2016, worldwide 1900-2016, worldwide 1980-2015, EU countries
maintenance internal database updated daily, publicly accessible information updated every 3 months updated every year
related demonstrator Insurance, Smart Home and Assisted Living (,Automotive)
Indicative scenario coverage
Monitoring and alert services for the elderly, Insurance fraud prevention
Anonymization No personal data included No personal data included No personal data included
limitations/permission status/license
Data and products largely based on em-dat can not be used for any commercial purpose or sold in any form. It is authorised strictly for the purposes of research, teaching or information. Fair usage policy
applied, i.e. requests for data should be limited to the truly required input. open
Table 23: Indicative disaster related datasets

HORIZON 2020 – 732189 - AEGIS D1.1–Domain Landscape Review and Data Value Chain Definition
WP1 – AEGIS Data Value Chain Definition and Project Methodology AEGIS Consortium
Page 87 of 108
SG6 - Research communities
The research community is essentially part of all stakeholder groups and, depending on the
research field, provides data on various domains.
Types of provided data Main sources Dataset Characteristics & Indicative Datasets
experimental results • Research data
repositories
• Depending on the
exact nature of
the research,
these data may be
already included
in other
stakeholder
sections (e.g.
clinical trial data)
Indicative data sources and datasets:
http://www.re3data.org/
https://zenodo.org/
https://www.openaire.eu/search/find?keyword=
statistical analyses
reports
Table 24: SG6 provided data
SG7 - Road Construction companies
This stakeholder group is on a different level compare to the others, i.e. narrow and more
targeted. It was identified early on from the initial input of the automotive demonstrator; during
the next months of the project similar specific groups may be identified in other PSPS domains
as well.
As a result, data sources and respective datasets are limited to the following two:
1. Road condition data
2. Road maintenance data
The way these data are provided depends on the way the road maintenance company stores
them (e.g. csv files, databases, format/schema). These data are proprietary and their availability
depends on collaboration with the data owners, i.e. the data construction companies.
SG8 - Public sector
Public sector generally refers to various governmental services, which, depending on the
country, may include some of the services already presented in previous stakeholder groups,
such as military, police, road infrastructure, energy infrastructure, etc. From a data provision
perspective, the only data sources that can be attributed to the public sector and have not yet
been discussed, are the national open data portals which serve as various purpose data
catalogues. Indicatively, some portals are provided in the following list:
• https://www.europeandataportal.eu/
• https://data.europa.eu/euodp/en/data/
• http://www.data.gov.gr/
• http://www.data.gouv.fr/fr/
• http://www.dati.gov.it/
• https://data.gov.uk/
• https://www.opendataportal.at/
• http://datos.gob.es/
• http://www.dati.piemonte.it/
• https://data.overheid.nl//
• https://opendata.paris.fr/page/home/

HORIZON 2020 – 732189 - AEGIS D1.1–Domain Landscape Review and Data Value Chain Definition
WP1 – AEGIS Data Value Chain Definition and Project Methodology AEGIS Consortium
Page 88 of 108
SG9 - IT Industry
The IT industry is a very important stakeholder in the PSPS domain, however they mostly act
as data consumers and service providers, i.e. are not primarily data providers and therefore no
datasets are identified here.
SG10 - Smart City
The following table presents some examples of data provided by Smart City stakeholders.
Types of provided data Main sources Dataset Characteristics &
Indicative Datasets
Energy data smart grid sensors & meters
Parking spaces telemetry devices
Lighting smart light sensors
Table 25: SG10 provided datasets
There are not yet many Smart City data sources to be leveraged in PSPS, however the volume
of the individual datasets (e.g. city-wide lighting sensors) can certainly be challenging.
SG11 - End Users
End users, as data providers, may hold multiple more specific roles, e.g. drivers, patients, smart
home owners, smartphone and wearable devices users. An indicative list of provided data by
them can be found in the following table.
Types of
provided data Main sources
Dataset Characteristics
& Indicative Datasets
location
smartphone
social media
wearable devices
car GPS
personal health
data exam results and medical records
social activity
data social media posts
activity data
smartphone sensors (gyroscope, accelerometer)
activity-based social networks
Table 26: SG11 provided datasets
It should be stressed that user data are sensitive and their provision should undergo specific
security mechanisms to ensure clear user privacy and anonymity rules are applied according
to the end user consent.

HORIZON 2020 – 732189 - AEGIS D1.1–Domain Landscape Review and Data Value Chain Definition
WP1 – AEGIS Data Value Chain Definition and Project Methodology AEGIS Consortium
Page 89 of 108
Cross-Domain Data
Complementary to the ones presented above, there are some data sources that have been
identified as relevant to and important for AEGIS, cannot however be attributed to any of the
above stakeholder groups. These data sources are perceived as cross-cutting the above
categorization, since they are relevant to more than one categories, whereas the authorities that
provide them do not belong to any of the stakeholder groups in particular.
1. Weather
The weather is a very important factor in the PSPS domain, since it is directly and directly
related to various discussed topics, such as public health (respiratory issues, virus spreading,
pollution levels…), road accident risk etc.
Weather data are relatively easy to obtain, since there are numerous institutions that offer
weather information, indicatively including:
https://openweathermap.org/api
http://www.woeurope.eu/
http://www.ecmwf.int/
http://wxmaps.org/
https://graphical.weather.gov/xml/
Each of these sources may contain a number of datasets, targeting different needs. The
following table presents four datasets offered by OpenWeatherMap:
specific data source open weather map
specific dataset current weather API historical data API weather map layers 5 day forecast
description current weather data
for any location on
Earth
hourly historical
weather data for
cities and historical
data from weather
stations
many kinds of weather
maps including
Precipitation, Clouds,
Pressure, Temperature,
Wind, Snow and Rain
5 day forecast is
available at any
location or city. It
includes weather data
every 3 hours
used standards ISO 3166 country
codes
ISO 3166 country
codes
no ISO 3166 country
codes
real time/ historic real time historic real time real time
availability (API,
downloadable, db)
API API N/A (JS library) API
text/image/audio/vid
eo
text text map text
format json,xml,html json N/A json,xml
multilingual no no no no
license free, paid paid free,paid free,paid
link https://openweather
map.org/current
https://openweather
map.org/history
https://openweathermap.o
rg/docs/hugemaps
https://openweatherm
ap.org/forecast5
maintenance updated real time updated every hour customizable updates updated every 3 hours
Table 27: Indicative weather datasets
2. Map data
However diverse the data sources and datasets presented so far, they almost always have a
geospatial dimension and can serve as the interlinking point of different datasets. It is,
therefore, important to consider maps as a possible data source. Maps may range from
weather maps, pollution maps, crime incident maps, road condition maps, hospital location
maps, etc. As an example, Table 27 presented above shows that one of the
OpenWeatherMap provided datasets is in fact in the form of a map.

HORIZON 2020 – 732189 - AEGIS D1.1–Domain Landscape Review and Data Value Chain Definition
WP1 – AEGIS Data Value Chain Definition and Project Methodology AEGIS Consortium
Page 90 of 108
Although there are multiple solutions that could be considered during the project, the Open
Street Map12 project creates and distributes free (under ODbL) geographic data for the
world.
3. Copernicus13
Copernicus offers a large number of satellite earth observation data which could be both
relevant and useful to certain AEGIS applications. These include, but are not limited to:
• Atmosphere related data (http://atmosphere.copernicus.eu/), which are closely linked to
public health.
• Marine data (http://marine.copernicus.eu/), which could be relevant to various PSPS
perspectives, such as sea pollution and sea travel safety.
• Climate change data (http://climate.copernicus.eu/)
4. Web 2.0
Social media are a very popular means of communication, expression and sharing of
activities and sentiments. Due to their extremely large user base, social media possess useful
insights which are often published in the form of trends, e.g. Twitter trending topics14, which
can serve as indicators of public issues. Social media were also mentioned as data sources
in SG10, but information discussed here pertains to publicly available data, as opposed to
datasets mentioned in that section that are clearly personal.
From the same scope, Google trends can also be leveraged in a similar way.
5. News sites and e-magazines
PSPS issues and related events are almost always reported in informational sites, hence
these sources, properly analysed with NLP (Natural Language Processing) techniques, can
be a valuable information source for AEGIS. However, their selection and inclusion
depends on the specific application needs.
4.2. Stakeholders Value Chain
The previous section presented the identified AEGIS data sources organized under the
stakeholders expected to provide them, without (explicitly) referring to how and by whom they
are consumed.
Task 1.4, which has already started, according to the project DoA, will “reveal the data inputs
and structures needed, as well as the expected outputs for every possible process and interaction
among the stakeholders will be modelled in detail”. This work is planned to be reported in D1.2.
However, in order to provide more useful insights into the data source analysis presented above
and work towards the definition of the data value chain, it is considered useful to present here
some indicative early examples of the initially envisioned data flows among possible AEGIS
stakeholders.
It should be noted that Web 2.0 data, maps and satellite data usages can be envisioned in various
cases and, since they will be de-facto input sources in AEGIS, no specific examples are
provided.
• Indicative data sources leveraged by SG1 (Smart Insurance)
12 https://wiki.openstreetmap.org/wiki/Main_Page 13 http://www.copernicus.eu/main/overview 14 https://dev.twitter.com/rest/reference/get/trends/place

HORIZON 2020 – 732189 - AEGIS D1.1–Domain Landscape Review and Data Value Chain Definition
WP1 – AEGIS Data Value Chain Definition and Project Methodology AEGIS Consortium
Page 91 of 108
Data type (description) Indicative usage Provider
ambient sensors provide smart alert services to customers with health
insurance
SG2
driving patterns implement pay per mile insurance models (black box
insurance)
SG3
public health data design health insurance plans SG4
crime reports evaluate house insurance cost per location SG5
causal analysis of new medical
legislation effect on public health
design new health insurance plans SG6
road conditions implement pay per mile insurance models (black box
insurance)
SG7
national economic data provide services more suited to the public needs SG8
medical records and activity data smart health insurance services SG11
smart parking space data targeted automotive insurance planning SG10
weather alert services to auto insurance customers external
Table 28: Indicative SG1 cross-domain data consumption
• SG2 - Smart home Data type (description) Indicative usage Provider
house insurance incident reports design enhanced home security alerts SG1
driving patterns combine with other behavioural data for early
identification of dementia signs
SG3
public health data proactively take measures to avoid virus spreading SG4
disaster related data take action in case of earthquake SG5
report on the effect of air pollution
on elderly health
enhanced assisted living services SG6
municipality open data improve services based on location SG8
personal health and medical data notification alerts for medication SG11
user location (and location paths) decide if current user status is safe SG11
weather proactively respond to user needs caused by weather
change, configure ambient devices
external
Table 29: Indicative SG2 cross-domain data consumption
• SG3 - Smart Automotive Data type (description) Indicative usage Provider
insurance claims in location identify dangerous areas in terms of road accidents SG1
road accident injuries statistics accident prevention and driver notification services SG4
traffic accident reports identify dangerous areas in terms of road accidents SG5
open street traffic cameras prevention of congestion, alert for accidents SG5
causal analysis of drinking habits
and road accidents per location and
hour of the day
enhanced personalized driver alerts SG6
road conditions driver notification service for accident avoidance SG7
smartphone gyroscope and
accelerometer
infer driving movements SG11
smart parking space data provide parking space recommendations SG10
weather re-evaluate road dangers and notify drivers external
Table 30: Indicative SG3 cross-domain data consumption
• SG4 – Health Data type (description) Indicative usage Provider
health insurance claims determine public health levels and identify trending
problems
SG1
ambient sensors collaborate with smart home service providers to
provide medical help in case of identified dangerous
environmental conditions
SG2
driving patterns notify doctors in the area in case of accident SG3
flood data design emergency response plans to be better prepared
for future events based on historical data
SG5
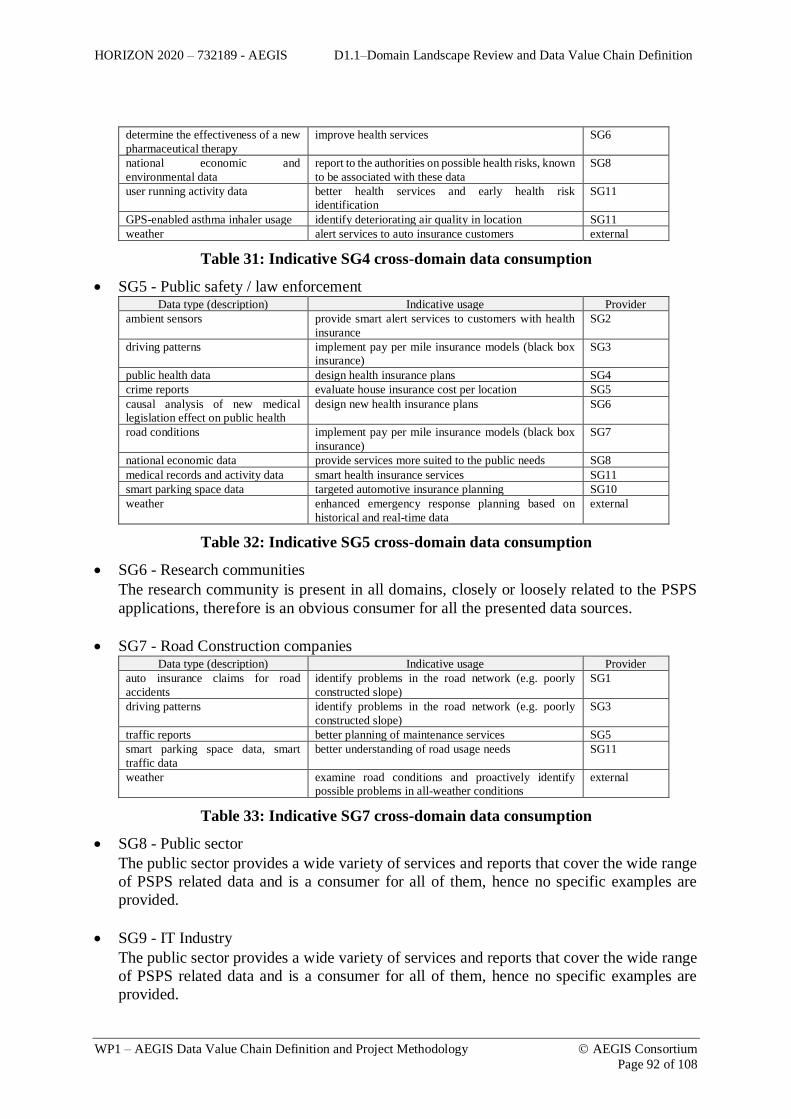
HORIZON 2020 – 732189 - AEGIS D1.1–Domain Landscape Review and Data Value Chain Definition
WP1 – AEGIS Data Value Chain Definition and Project Methodology AEGIS Consortium
Page 92 of 108
determine the effectiveness of a new
pharmaceutical therapy
improve health services SG6
national economic and
environmental data
report to the authorities on possible health risks, known
to be associated with these data
SG8
user running activity data better health services and early health risk
identification
SG11
GPS-enabled asthma inhaler usage identify deteriorating air quality in location SG11
weather alert services to auto insurance customers external
Table 31: Indicative SG4 cross-domain data consumption
• SG5 - Public safety / law enforcement Data type (description) Indicative usage Provider
ambient sensors provide smart alert services to customers with health
insurance
SG2
driving patterns implement pay per mile insurance models (black box
insurance)
SG3
public health data design health insurance plans SG4
crime reports evaluate house insurance cost per location SG5
causal analysis of new medical
legislation effect on public health
design new health insurance plans SG6
road conditions implement pay per mile insurance models (black box
insurance)
SG7
national economic data provide services more suited to the public needs SG8
medical records and activity data smart health insurance services SG11
smart parking space data targeted automotive insurance planning SG10
weather enhanced emergency response planning based on
historical and real-time data
external
Table 32: Indicative SG5 cross-domain data consumption
• SG6 - Research communities
The research community is present in all domains, closely or loosely related to the PSPS
applications, therefore is an obvious consumer for all the presented data sources.
• SG7 - Road Construction companies Data type (description) Indicative usage Provider
auto insurance claims for road
accidents
identify problems in the road network (e.g. poorly
constructed slope)
SG1
driving patterns identify problems in the road network (e.g. poorly
constructed slope)
SG3
traffic reports better planning of maintenance services SG5
smart parking space data, smart
traffic data
better understanding of road usage needs SG11
weather examine road conditions and proactively identify
possible problems in all-weather conditions
external
Table 33: Indicative SG7 cross-domain data consumption
• SG8 - Public sector
The public sector provides a wide variety of services and reports that cover the wide range
of PSPS related data and is a consumer for all of them, hence no specific examples are
provided.
• SG9 - IT Industry
The public sector provides a wide variety of services and reports that cover the wide range
of PSPS related data and is a consumer for all of them, hence no specific examples are
provided.

HORIZON 2020 – 732189 - AEGIS D1.1–Domain Landscape Review and Data Value Chain Definition
WP1 – AEGIS Data Value Chain Definition and Project Methodology AEGIS Consortium
Page 93 of 108
• SG10 - Smart City Data type (description) Indicative usage Provider
auto insurance claims for car theft,
car glass braking etc
Improve lighting in dangerous zones SG1
driving patterns identify poorly lighted streets SG3
respiratory-related health data identify environmental pollution issues and take action SG4
crime reports provide smart city lights in dangerous zones SG5
road conditions driver alert services SG7
national economic, environmental
and other data
enhanced smart city service planning SG8
weather enhanced service planning under all weather
conditions
external
Table 34: Indicative SG10 cross-domain data consumption
• SG11 - End Users
End users mostly benefit through products and services provided to them by other AEGIS
stakeholders, i.e. are not envisioned as direct data consumers in the scope of the project.
Tables 28-34 make apparent the dual role of almost all AEGIS stakeholders, i.e. as data
producers and data consumers, depending on the PSPS scenario to be implemented and the
nature of the services to be provided. Hence, the integrated AEGIS value chain is potentially so
diverse and covers so many PSPS scenarios that may extend to the complete Big Data
Ecosystem, as defined by Curry [1] and presented in Figure 4-1, since it foresees data and data
value exchange among almost all interested parties.
Figure 24: The Micro, Meso, and Macro Levels of a Big Data Ecosystem (from Edward
Curry, 2016 [1])
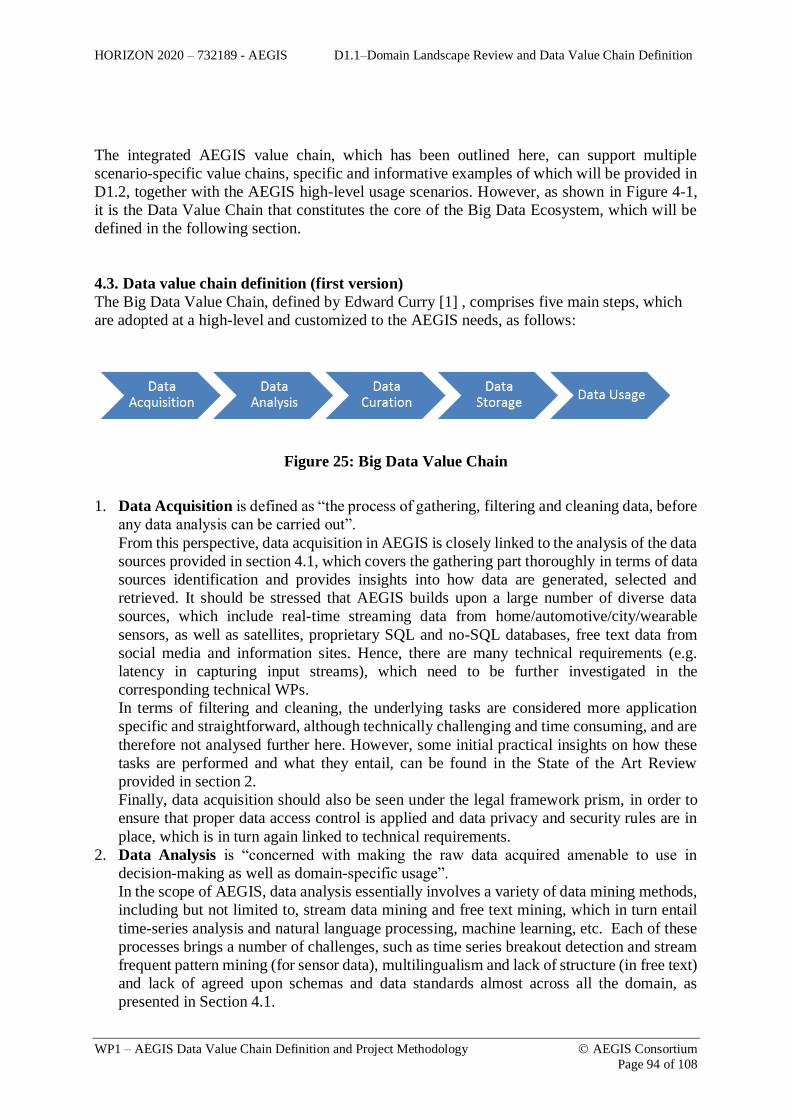
HORIZON 2020 – 732189 - AEGIS D1.1–Domain Landscape Review and Data Value Chain Definition
WP1 – AEGIS Data Value Chain Definition and Project Methodology AEGIS Consortium
Page 94 of 108
The integrated AEGIS value chain, which has been outlined here, can support multiple
scenario-specific value chains, specific and informative examples of which will be provided in
D1.2, together with the AEGIS high-level usage scenarios. However, as shown in Figure 4-1,
it is the Data Value Chain that constitutes the core of the Big Data Ecosystem, which will be
defined in the following section.
4.3. Data value chain definition (first version)
The Big Data Value Chain, defined by Edward Curry [1] , comprises five main steps, which
are adopted at a high-level and customized to the AEGIS needs, as follows:
Figure 25: Big Data Value Chain
1. Data Acquisition is defined as “the process of gathering, filtering and cleaning data, before
any data analysis can be carried out”.
From this perspective, data acquisition in AEGIS is closely linked to the analysis of the data
sources provided in section 4.1, which covers the gathering part thoroughly in terms of data
sources identification and provides insights into how data are generated, selected and
retrieved. It should be stressed that AEGIS builds upon a large number of diverse data
sources, which include real-time streaming data from home/automotive/city/wearable
sensors, as well as satellites, proprietary SQL and no-SQL databases, free text data from
social media and information sites. Hence, there are many technical requirements (e.g.
latency in capturing input streams), which need to be further investigated in the
corresponding technical WPs.
In terms of filtering and cleaning, the underlying tasks are considered more application
specific and straightforward, although technically challenging and time consuming, and are
therefore not analysed further here. However, some initial practical insights on how these
tasks are performed and what they entail, can be found in the State of the Art Review
provided in section 2.
Finally, data acquisition should also be seen under the legal framework prism, in order to
ensure that proper data access control is applied and data privacy and security rules are in
place, which is in turn again linked to technical requirements.
2. Data Analysis is “concerned with making the raw data acquired amenable to use in
decision-making as well as domain-specific usage”.
In the scope of AEGIS, data analysis essentially involves a variety of data mining methods,
including but not limited to, stream data mining and free text mining, which in turn entail
time-series analysis and natural language processing, machine learning, etc. Each of these
processes brings a number of challenges, such as time series breakout detection and stream
frequent pattern mining (for sensor data), multilingualism and lack of structure (in free text)
and lack of agreed upon schemas and data standards almost across all the domain, as
presented in Section 4.1.
HORIZON 2020 – 732189 - AEGIS D1.1–Domain Landscape Review and Data Value Chain Definition
WP1 – AEGIS Data Value Chain Definition and Project Methodology AEGIS Consortium
Page 95 of 108
It should be stressed that, although PSPS applications require high accuracy levels, there
are inherent data features that render the required analysis not only more labour-intensive,
but also error prone. Indicatively, in many NLP tasks 80% correctness counts as good
quality, whereas in real life applications the propagation of such large errors across the value
chain would be disastrous.
One of the main tasks in data analysis is correlation mining, i.e. the discovery of dependency
patterns, among specific data inputs. In order to gain new insights and true value from the
identified correlations, it is important to allow for unforeseen data combinations and means
of evaluation, taking in mind that some datasets are difficult for the human mind to interpret,
e.g. sensor data or data produced from a first level of analysis that strips them from their
human-friendly form (e.g. through transforming natural language text to vectors).
As a conclusion, it becomes evident that the criteria used for the analysis of big data cannot
and should not be known a-priori, but only in analysis time, in order to ensure that the
extracted value is not limited by early erroneous decisions (according to the Principle of
late interpretation). Hence, explorative analysis is at the core of the data analysis step.
Exploratory analysis builds on the fact that when analysis starts, the questions to be
answered are not (always) known. Questions only emerge a-posteriori together with the
extracted answers, which is the case in many of the AEGIS envisioned applications and
services.
The provision of exploratory analysis capabilities inside the wide field of PSPS is extremely
challenging and guides the way the next steps (inside Data Curation) of the value chain are
designed.
3. Data Curation is “the active management of data over its life cycle to ensure it meets the
necessary data quality requirements for its effective usage”.
Data curation is an umbrella term for various processes regarding data organization,
validation, quality evaluation, and provenance and multiple-purpose annotation. Insights on
many of these processes are provided in section 2, through the identification and comparison
of tools used to implement them. There are, however, three important issues that should be
discussed here in more detail:
a. The definition and measurement of data quality. Data quality affects the complete
value chain since it compromises the value of the final output, regardless of the adopted
data processing practices. Along these lines, in order to ensure data quality, AEGIS will
adopt the framework proposed by Batini et al. [2] that identifies Big Data research
coordinates (e.g. variety of data types) and examines the way they affect quality for
specific dataset types that are also present in AEGIS, such as maps and sensor data. The
framework uses seven quality dimensions (accuracy, completeness, redundancy,
readability, accessibility, consistency and trust) and proposes specific structural
characteristics for each dataset type to be used for the evaluation of data quality.
b. The need to employ traceable and repeatable curation processes. This is linked to
the volatile nature of big data, which requires existing data curation steps to be verifiable
against new versions of data and render the detection of new steps possible. These
requirements imply that data curation must be scriptable, but at the same time cannot be
fully automated.
c. The need to avoid irreversible data restructuring. This is a requirement of the
previously explained need to enable exploratory analysis, which by definition forbids
the application of loss data transformations and compressions, since these may impede
future analyses.

HORIZON 2020 – 732189 - AEGIS D1.1–Domain Landscape Review and Data Value Chain Definition
WP1 – AEGIS Data Value Chain Definition and Project Methodology AEGIS Consortium
Page 96 of 108
As a conclusion, data curation processes applied in AEGIS will require the definition and
agreement on certain formalisms, both in terms of inherent big data structural properties,
as well as regarding the algorithms and methods to be applied.
4. Data Storage is “the persistence and management of data in a scalable way that satisfies
the needs of applications”.
Data storage is a wide area and is extremely important in Big Data ecosystems, since it deals
with issues ranging from scalability and performance to data consistency and availability,
to data models and security and many others. The Big Data storage topic has been covered
in the corresponding sub-section of the State of the Art Review.
5. Data Usage refers to the “data-driven” business activities that need access to data, its
analysis, and the tools needed to integrate the data analysis within the business activity”.
Inside AEGIS, this involves various activities, outlined in the stakeholder analysis in
Section 3. AEGIS will enable the provision of smart decision support and analytics
applications, visual analytics and real-time data exploration across all PSPS related fields,
to be showcased through the three project demonstrators.

HORIZON 2020 – 732189 - AEGIS D1.1–Domain Landscape Review and Data Value Chain Definition
WP1 – AEGIS Data Value Chain Definition and Project Methodology AEGIS Consortium
Page 97 of 108
5. CONCLUSION
In this deliverable, we described the state-of-the-art technologies in both Linked Data and Big
Data, identified the stakeholders who we believe can benefit from the project as well as the
features they will need, and, finally, the data sources and subsequent data value chains that can
be used in AEGIS. This deliverable also defined the AEGIS Value Chain.
Our analysis of existing platforms and tools shows that while Big Data and Linked Data have
belonged to different communities with different platforms, standards and tools, in recent times
there has been some convergence with SPARKQL and RDF becoming distributed, enabling
them to scale-out on commodity hardware. Systems such as Apache Rya and Linux Foundation
Janus Graph show how we can unify Big Data and Linked Data in a single platform, enabling
us to build low cost, commodity computing systems, that are capable of storing petabytes of
RDF data that can be queried using SPARKQL. We have also shown how Hopsworks can
provide a unified secure platform for Big Data storage and processing, and has the potential to
be extended for Linked Data with systems such as Linda.
In our analysis of potential AEGIS stakeholders, we have sent out a questionnaire to our
industry contacts and receive 77 replies. We aggregated the results of our survey and identified
11 different sectors where AEGIS can add value. For each of these sectors, we identified the
data sources that may be included in AEGIS. We examined both the public datasets available
and datasets that will be made available by our partners. We then proceeded to define the data
value chain which we will need to manage the lifecycle of data assets in the project. Data will
be ingested, analysed, curated, stored, and used.
The results of this deliverable will be used to help define the AEGIS architecture and help
define the business models to exploit AEGIS.

HORIZON 2020 – 732189 - AEGIS D1.1–Domain Landscape Review and Data Value Chain Definition
WP1 – AEGIS Data Value Chain Definition and Project Methodology AEGIS Consortium
Page 98 of 108
APPENDIX A: LITERATURE
[1] E. Curry, “The Big Data Value Chain: Definitions, Concepts, and Theoretical
Approaches,” in New Horizons for a Data-Driven Economy, Springer, 2016, pp. 29--
37.
[2] C. Batini, A. Rula, M. Scannapieco and G. Viscusi, “From data quality to big data quality,”
in Big Data: Concepts, Methodologies, Tools, and Applications, IGI Global, 2016, pp.
1934--1956.

HORIZON 2020 – 732189 - AEGIS D1.1–Domain Landscape Review and Data Value Chain Definition
WP1 – AEGIS Data Value Chain Definition and Project Methodology AEGIS Consortium
Page 99 of 108
APPENDIX B: AEGIS SURVEY

HORIZON 2020 – 732189 - AEGIS D1.1–Domain Landscape Review and Data Value Chain Definition
WP1 – AEGIS Data Value Chain Definition and Project Methodology AEGIS Consortium
Page 100 of 108

HORIZON 2020 – 732189 - AEGIS D1.1–Domain Landscape Review and Data Value Chain Definition
WP1 – AEGIS Data Value Chain Definition and Project Methodology AEGIS Consortium
Page 101 of 108

HORIZON 2020 – 732189 - AEGIS D1.1–Domain Landscape Review and Data Value Chain Definition
WP1 – AEGIS Data Value Chain Definition and Project Methodology AEGIS Consortium
Page 102 of 108

HORIZON 2020 – 732189 - AEGIS D1.1–Domain Landscape Review and Data Value Chain Definition
WP1 – AEGIS Data Value Chain Definition and Project Methodology AEGIS Consortium
Page 103 of 108
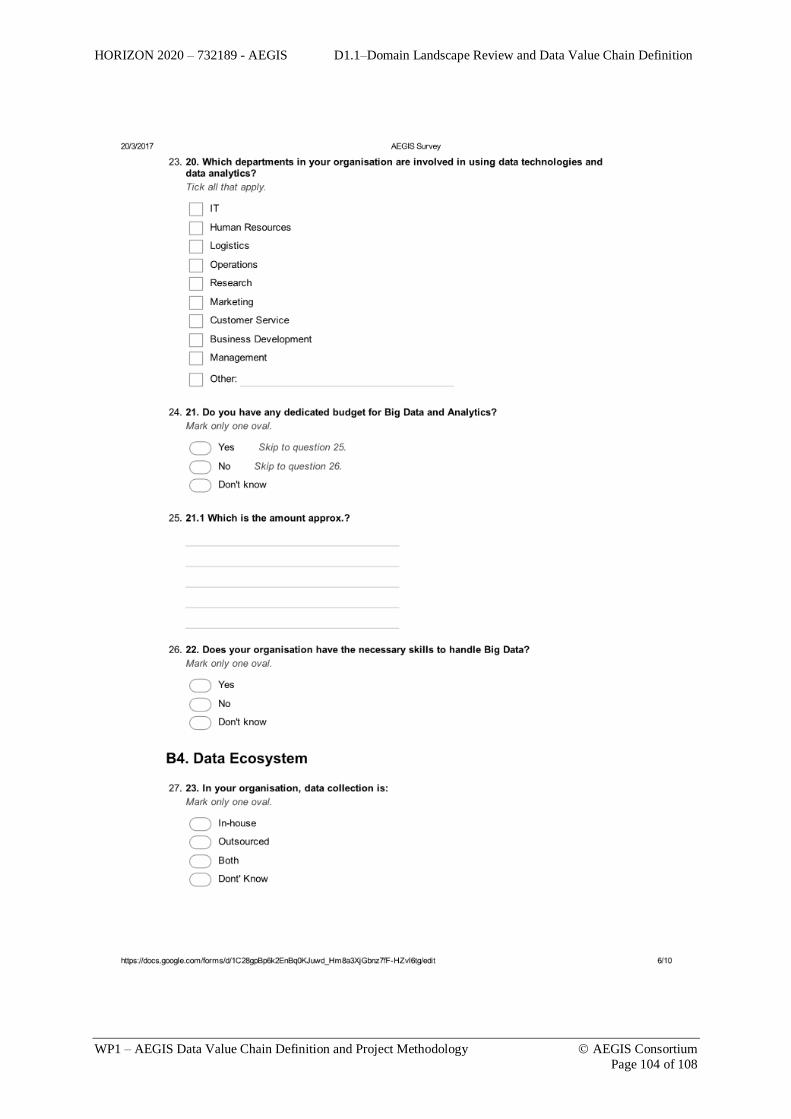
HORIZON 2020 – 732189 - AEGIS D1.1–Domain Landscape Review and Data Value Chain Definition
WP1 – AEGIS Data Value Chain Definition and Project Methodology AEGIS Consortium
Page 104 of 108

HORIZON 2020 – 732189 - AEGIS D1.1–Domain Landscape Review and Data Value Chain Definition
WP1 – AEGIS Data Value Chain Definition and Project Methodology AEGIS Consortium
Page 105 of 108
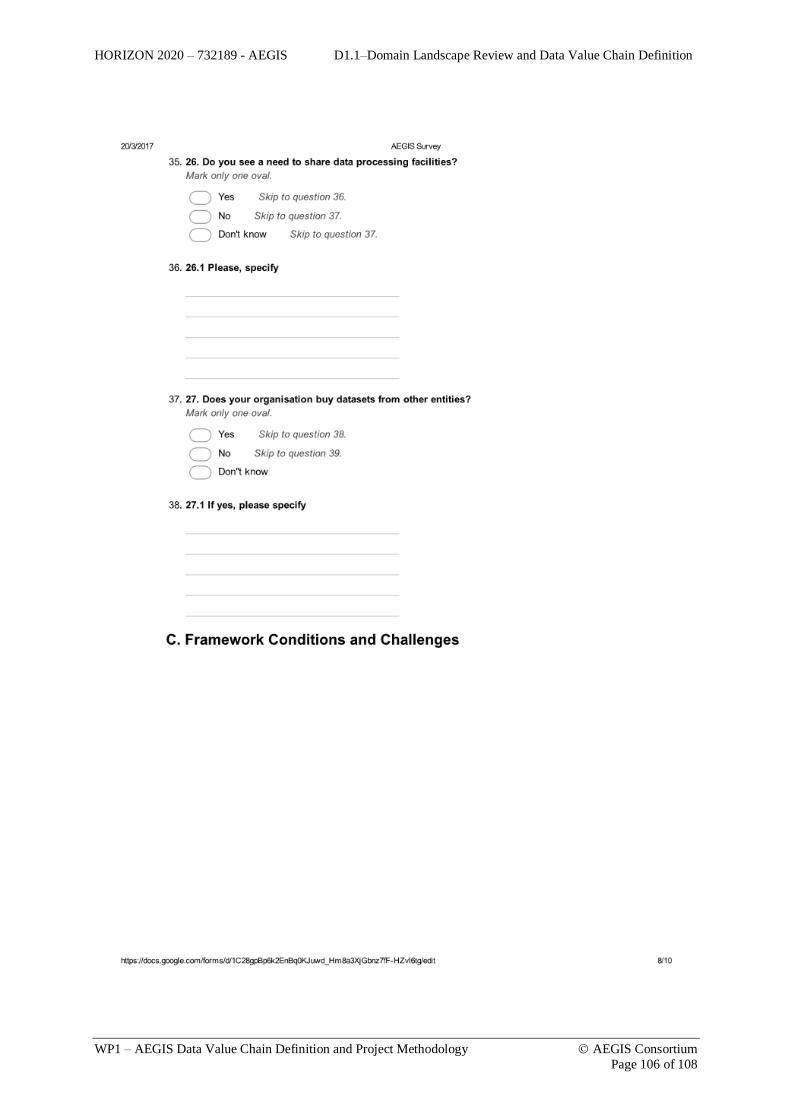
HORIZON 2020 – 732189 - AEGIS D1.1–Domain Landscape Review and Data Value Chain Definition
WP1 – AEGIS Data Value Chain Definition and Project Methodology AEGIS Consortium
Page 106 of 108

HORIZON 2020 – 732189 - AEGIS D1.1–Domain Landscape Review and Data Value Chain Definition
WP1 – AEGIS Data Value Chain Definition and Project Methodology AEGIS Consortium
Page 107 of 108

HORIZON 2020 – 732189 - AEGIS D1.1–Domain Landscape Review and Data Value Chain Definition
WP1 – AEGIS Data Value Chain Definition and Project Methodology AEGIS Consortium
Page 108 of 108