dispersion of qt intervals: a measure of dispersion of repolarization or simply a projection effect
TRANSCRIPT
Dispersion of QT Intervals: A Measure ofDispersion of Repolarization or Simply aProjection Effect?DIEGO DI BERNARDO, PHILIP LANGLEY, and ALAN MURRAYFrom the Regional Medical Physics Department, Freeman Hospital Newcastle upon Tyne,United Kingdom
DI BERNARDO, D., et al.: Dispersion of QT Intervals: A IVleasure of Dispersion of Repolarization or Sim-ply a Projection Effect? QT interval dispersion may provide little information about repolarization dis-persion. Some clinical measurements demonstrate an association between high QT interval dispersionand high morbidity and mortality, but what is being measured is not clear. This study was designed to helpresolve this dilemma. We compared the association between different clinical measures of QT interval dis-persion and the ECG lead amplitudes derived from a heart vector model of repolarization with no repo-larization dispersion whatsoever. We compared our clinical QT interval dispersion data obtained from 25subjects without cardiac disease with similar data from published studies, and correlated these QT dis-persion results with the distribution of lead amplitudes derived from the projection ofthe heart vector ontothe body surface during repolarization. Published results were available for mean relative QT intervalsand mean differences from the maximum QT interval. The leads were derived from Uijen and Dower leadvector data. Using the Uijen lead vector data, the correlation between measurements of dispersion and de-rived lead amplitudes ranged from 0.78 to 0.99 for limb leads, and using the Dower values ranged from0.81 to 0.94 for the precordial leads. These results show a clear association between the measured QT in-terval dispersion and the variation in ECG lead amplitudes derived from a simple heart vector mode! ofrepolarization with no regional information. Therefore, measured QT dispersion is related mostly to a pro-jection effect and is not a true measure of repolarization dispersion. Our existing interpretation of QT dis-persion must be reexamined, and other measurements that provide true repolarization dispersion data in-vestigated. (PACE 2000; 23:1392-1396)
QT dispersion, QT interval, repolarization, dispersion of repolarization
IntroductionQT interval dispersion is accepted as a useful
clinical measurement.^ Patients with higher thannormal QT interval dispersion have been shownto be more likely to suffer from cardiac diseaseand fatal arrhythmias.^ More recently Zabel et al.'̂were not able to confirm an association betweenQT dispersion and mortality, but de Bruyne et al.,^found the corrected QT dispersion to be a goodpredictor of mortality.
It has been shown that differences in the tim-ing of repolarization in different regions of the my-ocardium (dispersion of repolarization), if abnor-mally increased, constitute a substrate for fatal
Supported in part by a Marie Curie Fellowship grant from theEuropean Union (CN. ERB4001GT971847) (D.D.) and hy theBritish Heart Foundation [P.L.).
Address for reprints: Professor Alan Murray, Regional MedicalPhysics Department, Freeman Hospital, Newcastle upon TyneNE7 7DN, UK.
Received Decemher 6, 1999; revised February 3, 2Q00; ac-cepted February 10, 2000.
arrhythmias.^ However, a lack of understanding ofwhat contributes to QT interval dispersion mea-surements has prevented their use in clinical prac-tice. It is generally accepted that dispersion of re-polarization relates to QT interval dispersion.^-^However, recent work suggests that this relation-ship may be weak. Macfarlane et al.^ showed thatwhen QT dispersion was measured from the 12-lead electrocardiograms (ECGs) and comparedwith dispersion from 12-lead ECGs derived fromthe three orthogonal leads, less than a 2-ms differ-ence was found. Similarly, Lee et al.^ measuredQT dispersion as the difference between thelongest and the shortest QT interval from the de-rived ECGs and real EGGs from 129 subjects andfound QT dispersion to be almost identical. Korset al.̂ *̂ demonstrated that subjects with large Twaves and wide T loops on the vectorcardiogramhad greater QT dispersion than subjects withsmaller narrow T loops. Acar et al.^' showed thatthe difference between orientations of the T waveloop and the QRS loop is a potent descriptor of re-polarization abnormalities. Measurements may.
1392 September 2000 PACE, Vol. 23
DISPERSION OF QT INTERVALS
therefore, be influenced more strongly by T wavesize and sbape due to different projections of theT wave loop on the 12-lead vectors. Onr own re-snlts have shown that the amplitude of the T wavealone influences the measurement of QT, Thesmaller the T wave, the shorter the measured QTinterval,'^ In this study, we investigated a simplesingle dipolo model of the electrical activity of theheart, as this allowed the derived leads during re-polarization to be computed. This simple dipoledescribes the heart's electrical activity with no an-gnlar movement during repolarization and noneduring the critical time at the end of repolarizationwhen dispersion measurements are made. Such amodel provides no repolarization dispersionwhatsoever. We proposed in this study to corre-late the 12 derived lead amplitudes predicted hyour model with the 12 measured QT intervals. Wecompared the results from the model with ourown QT data and with puhlished QT data. Astrong correlation would indicate that measure-ments of QT dispersion are unlikely to be associ-ated with repolarization dispersion, at least as cur-rently explained. A weak or no association wouldleave the possibility open.
MethodsHeart Model with No Regional Dispersion ofRepolarization
We used the simplest model of the electricalactivity of the heart, a current dipole, representedby a vector lying in three-dimensional space. Weassumed that the heart vector was fixed in spaceduring the entire repolarization. Its orientationwas chosen from results in the literature. Silver-berg,^' Draper et al./* and Bristow^ '̂ gave vectordirections (T axis) that were in general agreementwith an angle varying between 25° and 46° in thehorizontal plane, 117° and 142° in the sagittalplane, and 37° and 44̂ ^ in the frontal plane. OnlySilverberg selected two normal subject groups dif-fering in their age range: group A [13-39 years)and group B (40-86 years). He found statisticallysignificant differences in the mean T axis betweenthese two groups. We used his values from groupA, equal to 25° in the horizontal plane, 117° in theleft sagittal plane, and 42° in the frontal plane, astheir age range corresponded better with the agerange of the subjects in Ihis study.
Calculation of the Derived LeadsThe heart vector, or current dipole, represents
the global electrical activity of the heart. Any vec-tor with known amplitude and orientation can beresolved into three orthogonal components X, Y,and Z in an orthogonal coordinate system. Whenthe heart vector is embedded in the torso, the
amount that each component contributes to thevoltage Vina given lead is directly proportional tothat component's magnitude, according to someconstant coefficient. Summing the contribution ofthe three components, the voltage V in that lead,generated by the heart vector, is obtained. There-fore, to compute the voltage in each of the 12 leadsof the standard ECG generated by the heart vector,three coefficients for each of the 12 leads areneeded. These coefficients are usually referred toas lead vectors. Each set of three coefficients en-ahles the contribution of the heart vector X, Y, andZ components to each ECG lead to be calculated.The coefficients have heen estimated by differentauthors. However, the two most commonly usedcoefficients are from Uijen et al."'' and Dower etal.^^ We used their data to compute the voltages inthe 12 leads generated by the heart vector with afixed orientation, given in the previous section,and with a nominal amplitude of unity. The re-sulting lead voltages [also called lead amplitudes)are referred to as derived leads.
These leads gave the relative amplitudes ofthe T wave during the final stage of repolarization,as in this model the final components of repolar-ization ended simultaneously in all the leads. Tosimplify the comparison of these simulated datawith QT interval data, the distributions of T waveamplitudes in the 12 derived leads were normal-ized to a range from 0 (smallest amplitude) to 1[largest amplitude), separately for Uijen andDower data, as descrihed later.
Clinical DataInformation on the distribution of QT mea-
surements in individual subjects has heen pre-sented in different ways: distribution of relativeQT intervals from Hnatkova et al.,^" and distribu-tion of differences from the maximum QT intervalfrom Cowan et al.̂ '-' These distributions were alsoobtained from our recent data [Murray et al.̂ **).The calculations are descrihed below. All subjectsstudied were healthy volunteers with no history ofheart disease. Hnatkova et al.^" reported 25 suh-jects in the age range of 19-39 years. Cowan et al. '^included 21 subjects, for which no age range wasreported. The data from Murray et al.^" were from25 subjects in the age range of 19—50.
QT Interval MeasurementsQT intervals in the studies reported were
measured manually. The QT interval in each leadwas measured from the onset of the QRS to the endof the T wave, defined as the time instant of returnto a quiescent state identified visually with the TPhaseline.^ '̂̂ "'̂ '̂ When a U wave was present, thenadir of the curve hetween the T wave and the Uwave was taken as the end of the T wave.
PACE, Vol. 23 September 2000 1393
DI BERNARDO. ETAL.
Manual measurements of QT intervals areprone to errors. Murray et al.'^ reported that thevariability (SD) of repeated manual measurementsof QT intervals by the same investigator was 9.5ms. Cowan et al.^" showed that variability (SD) ofQT measurements due to different cycles, differ-ent observers, and repeated measurements was10.7 ms. Such errors are small and less than theQT interval variability between different leadsand between subjects.
For the relative QT distribution, QT intervalsacross the 12 leads in each subject were first ex-pressed on a 0—1 scale from the minimum (0) tothe maximum (1) QT interval. For each lead, themean was then calculated across all the subjects,yielding a distribution of mean values across the12 leads. This final mean distribution was againnormalized to a range from 0 to 1.
For the distribution of differences from themaximum QT interval, for each subject the differ-ences between the maximum QT interval and theQT interval measured in each of the 12 leads werecomputed. For each lead, the mean was then cal-culated across all the subjects, yielding a distribu-tion of mean values across the 12 leads. The finaldistribution was again normalized to a range fromOto 1.
Simulated Model DataThe heart vector with fixed orientation during
repolarization was used to compute the 12 derivedleads. This was done using Uijen and Dower leadvector coefficients, yielding two different sets ofvalues representing the relative amplitude of the12 derived leads during repolarization. For each ofthese two distributions, the differences betweenthe maximum amplitude and the amplitude valuein each of the 12 derived leads were computed,yielding two additional distributions of differ-ences from the maximum amplitude. These calcu-lations were exactly the same as for the QT inter-val measurements. To compare these fourdistributions with the experimental data, the twoamplitude distributions and the two amplitudedifference distributions were normalized to arange from 0 (minimum value) to 1 [maximumvalue) for the clinical data.
Comparison with Experimental Results for QTIntervals
For each comparison of the derived lead am-plitudes with QT interval measurements, the cor-relation coefficient was calculated for data fromthe distribution of limb and precordial leads.There were four subject data sets (relative QT in-
'^^" and differences from the maximum QT'^"). Each of these four experimental data
sets was compared with the corresponding two
aVL I aVR II aVF VI V2 V3 V4 V5 V6
1.0-
I ^ •' !" ! ^I , , , , , ,V1 V2 V3 Vd V5 V6
C ra 1.0
V4 V5 V6
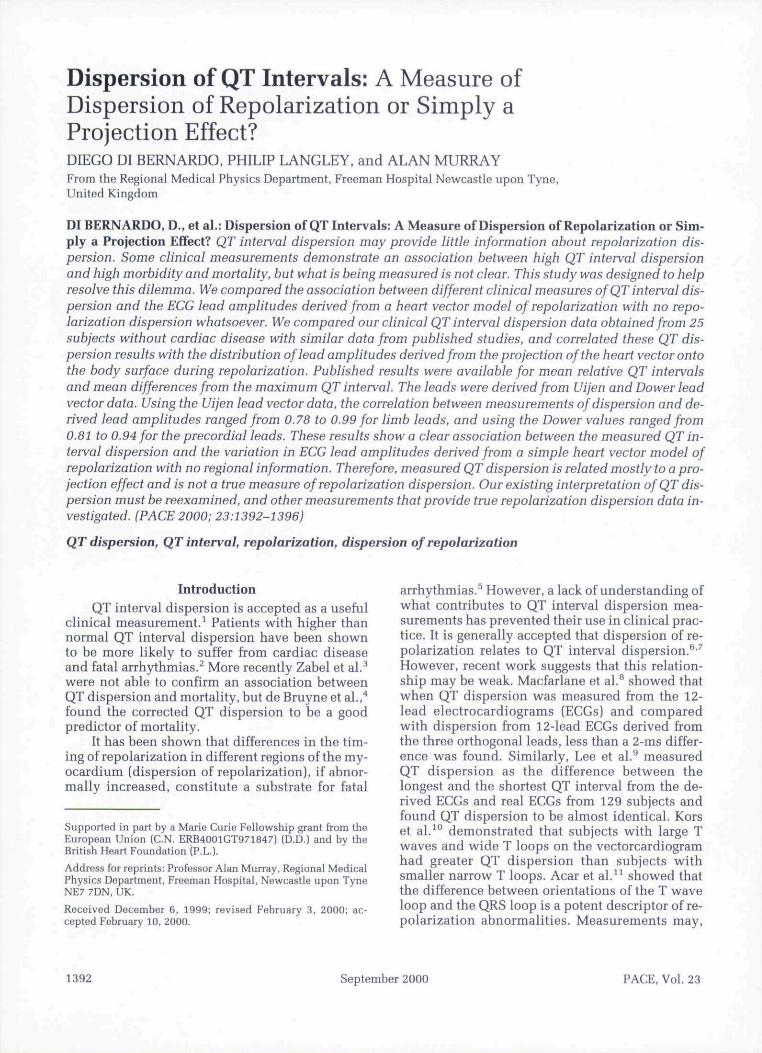
Figure 1. Distributions of relative measurements. (A)Relative QT intervals from Murray et al.^" (B) RelativeQT intervals from Hnatkova et al."' (C] Derived leadamplitudes using the Uijen coefficients."' (D) Derivedlead amplitudes usingthe Dower coefficients.^^ Data arenormalized in a range from 0 to 1. Data in panels A andB are mean values ± SD.
simulated data sets. This gave a total of eight com-parisons. The data were plotted separately for thelimb leads (aVL, I, aVR, II, aVF, III) and the pre-cordial leads (Vi-Vfi) with the leads ordered ac-cording to their lead axes orientation.
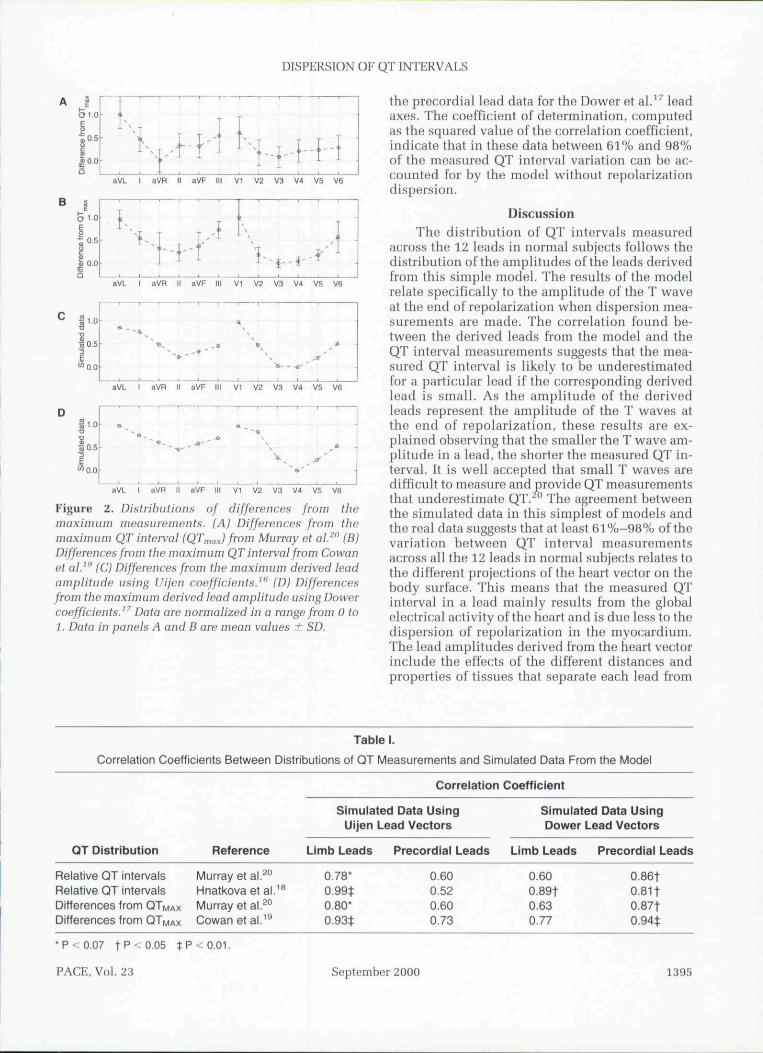
ResultsThe results are presented in Figures 1 and 2.
Each figure gives our clinical data (panel A) fol-lowed by results from a published report (panel B)and the results from our model simulations (pan-els C and D). Figure 1 provides the relative QT in-terval data. Figure 2 gives the distribution of dif-ferences between QT intervals in each lead andthe maximum QT interval. It can be seen that theshape of the distribution for the clinical data fol-lows closely the shape ofthe simulated data. Cor-relation coefficients for these data are given inTable I. The correlations are significant with thelimb lead data for the Uijen et al.̂ *̂ lead axes, ex-cept for the data from Murray et al.,^^ and with all
1394 September 2000 FACE. Vol. 23
DISPERSION OF QT INTERVALS
31,0
| o . 5c
a
•
K T T T I "r - f ' " l 1 1
I , , , "̂ 1" , , ,
fs
aVL I aVR II aVF VI V2 V3 V4 V5 V6
3 1.0E
U.SoV 0.05
T
' T
I l ' l T~ I '^i - ^- - -f'
aVL aVR VI V2 V3 V4 V5 V6
aVL ( aVR aVF III V1 V2 V3 V4 V5 V6
^ 1 . 0• a
TSG.5
h" 0 . 0
a
, -9'
aVL I aVR aVF hi V1 V2 V3 V4 V5 V6
Figure 2. Distributions of differences from themaximum measurements. (A) Differences from themaximum QT interval (QTn,,,x) from Murray et al.^° (R)Differences from the maximum QT interval from Cowanet al.''' (C) Differences from the maximum derived leadamplitude using Uijen coefficients."^ (D) Differencesfrom the maximum derived lead amplitude using Dowercoefficients.''' Data are normalized in a range from 0 to1. Data in panels A and B are mean values ± SD.
the precordial load data for the Dower et al.̂ "̂ leadaxes. The Goefficient of determination, computedas the squared value of the correlation coefficient,indicate that in these data between 61% and 98%of the measured QT interval variation can be ac-counted for hy the model without repolarizationdispersion.
DiscussionThe distribution of QT intervals measured
across the 12 leads in normal subjects follows thedistribution oftbe amplitudes oftbe leads derivedfrom tbis simple model. The results of tbe modelrelate specifically to the amplitude of tbe T waveat tbe end of repolarization when dispersion mea-surements are made. Tbe correlation found be-tween the derived leads from the model and tbeQT interval measurements suggests tbat the mea-sured QT interval is likely to be underestimatedfor a particular lead if the corresponding derivedlead is small. As the amplitude of tbe derivedleads represent tbe amplitude of the T waves attbe end of repolarization, these results are ex-plained observing that tbe smaller the T wave am-plitude in a lead, the shorter the measured QT in-terval. It is well accepted tbat small T waves aredifficult to measure and provide QT measurementsthat underestimate QT.^" Tbe agreement betweenthe simulated data in this simplest of models andthe real data suggests that at least 61%-98% of thevariation between QT interval measurementsacross all the 12 leads in normal subjects relates totbe different projections of the heart vector on thebody surface. This means that the measured QTinterval in a lead mainly results from the globalelectrical activity of the heart and is due less to thedispersion of repolarization in the myocardium.The lead amplitudes derived from tbe heart vectorinclude the effects of tbe different distances andproperties of tissues tbat separate each lead from
Correlation Coefficients Between
OT Distribution
Relative QT intervalsRelative QT intervalsDifferences from QTMAX
Differences from QTMAX
* P < 0.07 t P • • 0.05 It
PACE, Vol. 23
Reference
Murray etal.^°Hnatkova et al.Murray et al.̂ *̂Cowan et al.̂ ^
: P - : 0 . 0 1 .
Table 1
Distributions of QT Measurements and Simulated Data From the Model
Simulated
Correlation
1 Data UsingUijen Lead Vectors
Limb Leads
0.78*^̂ 0.99$
0.80*0.93*
September
Precordial Leads
0.60Q.520.600.73
2000
Coefficient
Simulated Data UsingDower Lead Vectors
Limb Leads
0.600.89t0.630.77
Precordial Leads
0.86t0.81t0.87t0.94t
1395
DI BERNARDO, ETAL.
the heart, as these are reflected in the values ofthecoefficients used to compute the derived leads.This indicates that the QT interval distributionacross the 12 leads is determined not only by theT axis orientation, but also from the torso shapeand properties.
The results were obtained despite the sim-plicity ofthe model. Although the electrical activ-ity of the heart is far more complex than that of asingle current dipole, it has been shown thatnondipolar components in normal subjects arenegligible when computing body surface poten-tials.^^ The choice of a nonrotating dipole (heartvector) during repolarization is justified by ob-serving that the heart vector rotates slowly duringrepolarization and spans a small angle in normalsubjects.^"•^' Moreover, results are still valid evenif the heart vector is rotating, as long as at the endof repolarization its orientation can be consideredconstant. Results could he improved by taking anumber of factors into account, if the data hadbeen available, including using a more preciseheart vector direction for each subject, as thischanges with torso shape and position. It is likelythat the Dower and Uijen coefficients are notideal, as can be seen from the results that gave sig-nificant correlations for the limb leads with the
Uijen data and for the precordial leads with theDower data.
In summary, this work shows that although itis not possible to rule out the influence of repolar-ization dispersion on QT intervals in the ECGleads, this effect is likely to be less than the onedue to the projection effect described above. Al-though these results have been derived from nor-mal subjects, they should apply to other subjectgroups, especially when efforts are made to in-clude low noise T waves from all 12 leads, as theEGG leads record global electrical activity.
These results do not suggest that measure-ments of QT dispersion are not valuable. How-ever, we need a better understanding of the factorsthat contribute to the measurements made, so thatthose factors of clinical importance can be iso-lated, and hopefully, contribute to greater sensi-tivity of any test involving QT interval measure-ments. Our results should stimulate thisdiscussion.
Acknowledgment: Wo acknowledge the stimuhis given hyProfessor Ronnie Camphell, a pioneer of QT dispersion, beforehis untimely death in 1998. We are also grateful to Dr. FrankMcArdle and Mr. John Allen for their helpful comments.
References1. Hill )A, Friedman PL. Measurement of QT interval and Q'l" disper-
sion. Lancet 1997;349:894-895.2. Higham PD. Furniss S. Canipb«ll KWF. QT dispersion and compo-
nents of the QT interval in ischemia and infarction. Br Heart f1995; 7:J:32-36.
3. Zahel M. KHngenhehen T. Franz MR, et al. Assessment of QT dis-persion for prediction of mortality or arrhythmic events after my-ocardial infarction - Resnlts of a prospective, long-term follow-upStudy. Circnlation 1998; 97:2543-2550.
4. de Bruyne MG, Hoes AW, Kors JA, et al. QTc dispersion predictscardiac mortality in the elderly - The Rotterdam Study. Circulation1998; 97;4B7-17'2.
5. Kno C. Mnnakata K, Reddy C, et al. Mechanism of ventricular ar-rhythmias caused by increased di.spersion of repolarisation. EurHeart) 1985; 6:D63-D70.
6. Day CP. McComb [M, Campbell RVVF. QT dispersion in sinus beatsand ventricular extrasystolus in normal hearts. Br Heart I 1992;67:39-41.
7. Zabel M. Portnoy M, Franz R. Electrocardiographic indexes of dis-persion of ventricular repularization; An isolated heart validationstudy- I Am Coll Cardiol 1995; 25:46-72.
8. Macfarlano PW. McLaughlin SC, Rodger C. Inflnence of lead selec-tion and popnlation on automated moiisiirement of QT dispersion.Circulation 1998; 98:ZlBtK2167.
9. Lee KW, Kligfield P, Okin PM, et al. Determinants of precordial QTdispersion in normal subjects. I Electrocardiol 1998; 31:128-133.
10. Kors |A, Van Herpen C, Van Bemmel )H. QT dispersion as an at-tribute of T-loop morphology. Circulation 1999;99:1458-146.'i.
I t . Acar B, Yi G, Hnatkova K, et al. Spatial, temporal and wavefronl
direction characteristics of 12-lead T-wave morphology. Med BiolEng Comput 1999; 37:574-584,
12. Murray A. McLaughlin NB, Bourke |P. ct al. Errors in maniiiil mea-surement ot QT intervals. Br Heart ] 1994; 71:386-39(1.
13. Silverberg SM. A quantitative study of the Frank vectorcardio-gram. Am J Cardiol 1966; 18:672-681.
14. Draper HW, Catherine JP. Friedmann WS, et al. The corrected or-thogonal electrocardiogram and veclorcardiogram in 51t) normalmen. Circulation 1964; 30:853-863.
15. Bristow D). A study ofthe normal Frank vectorcardiogram. AmHeart [ 1960; 61:242-249.
16. Uijen GH, van Ou.sterom A, van Dam RT. The relationship betweenthe 12-lead standard ECG and XYZ vector leads. In E Schubertled.); Proceeding of the 14lh International Congress Electrocardi-ology. Academy of Science of the DDR, Berlin, 1988.
17. Dower GE, Bastos Machado ]A, Oshome H. On deriving the elec-trocardiogram from vectorcardiographic leaiis. Glin Gardiol 1980;3:87-95.
18. Hnatkova K. Malik M, Kautzner |, et al. Adjustment of QT disper-sion assessed from 12 lead electrocardiograms for different num-bers of analysed electrocardiographic leads: comparison of stahil-ity of different methods, Br Heart 11994; 72;390-396.
19. Clowan ]C, Yusoff K, Moore M, et al. Importance ot lead selectionin QT interval measurement. Am | Cardiol 1988; 61:83-87.
20. Murray A. Mcl,aughlin NB, CampheU KWF. Measuring QT disper-sion; Man versus machine. Heart 1997; 77:530-542.
21. Horaceck BM. Lead theory. In PW MacFarlane, TD Veicht Lawrie(eds.); Gomprehensive Electrocardiology. New York, PergamonPress, 1989, p. 291.
1396 September 2000 PACE, Vol. 23