cyclical modulation of human ventricular repolarization by respiration
TRANSCRIPT
ORIGINAL RESEARCH ARTICLEpublished: 24 September 2012doi: 10.3389/fphys.2012.00379
Cyclical modulation of human ventricular repolarizationby respirationBen Hanson 1*, Jaswinder Gill 2, David Western 1, Michael P. Gilbey 3, Julian Bostock2, Mark R. Boyett 4,
Henggui Zhang5, Ruben Coronel6 and Peter Taggart 7*
1 Department of Mechanical Engineering, University College London, London, UK2 Department of Cardiology, Guys and St. Thomas’s Hospital and Kings College London, London, UK3 Department of Neuroscience, Physiology and Pharmacology, University College London, London, UK4 Division of Cardiovascular Medicine, University of Manchester, Manchester, UK5 Biological Physics Group, University of Manchester, Manchester, UK6 Experimental Cardiology Group, Academic Medical Center, Amsterdam, Netherlands7 Neurocardiology Unit, University College London Hospitals, London, UK
Edited by:
Tobias Opthof, Academic MedicalCenter, Netherlands
Reviewed by:
Flavia Ravelli, University of Trento,ItalyKanigula Mubagwa, Kuleuven,Belgium
*Correspondence:
Peter Taggart, Neurocardiology Unit,The Heart Hospital, UniversityCollege London, 16-18Westmoreland Street, London,W1G 8PH, UK.e-mail: [email protected]
Ben Hanson, Department ofMechanical Engineering, UniversityCollege London, London, UK.e-mail: [email protected]
Background: Respiratory modulation of autonomic input to the sinus node results incyclical modulation of heart rate, known as respiratory sinus arrhythmia (RSA). Wehypothesized that the respiratory cycle may also exert cyclical modulation on ventricularrepolarization, which may be separately measurable using local endocardial recordings.Methods and Results: The study included 16 subjects with normal ventricles undergoingroutine clinical electrophysiological procedures for supraventricular arrhythmias. Unipolarelectrograms were recorded from 10 right and 10 left ventricular endocardial sites.Breathing was voluntarily regulated at 5 fixed frequencies (6, 9, 12, 15, and 30 breathsper min) and heart rate was clamped by RV pacing. Activation-recovery intervals (ARI:a surrogate for APD) exhibited significant (p < 0.025) cyclical variation at the respiratoryfrequency in all subjects; ARI shortened with inspiration and lengthened with expiration.Peak-to-peak ARI variation ranged from 0–26 ms; the spatial pattern varied with subject.Arterial blood pressure also oscillated at the respiratory frequency (p < 0.025) and laggedbehind respiration by between 1.5 s and 0.65 s from slowest to fastest breathing ratesrespectively. Systolic oscillation amplitude was significantly greater than diastolic (14 ± 5vs. 8 ± 4 mm Hg ± SD, p < 0.001). Conclusions: Observations in humans with healthyventricles using multiple left and right ventricular endocardial recordings showed that ARIaction potential duration (APD) varied cyclically with respiration.
Keywords: respiration, cardiac electrophysiology
INTRODUCTIONThe timing of ventricular activation exhibits rhythmic cycli-cal variation with the respiratory cycle, whereby the inter-val between heartbeats increases and decreases with expirationand inspiration respectively: respiratory sinus arrhythmia (RSA)(Anrep et al., 1936). Although the mechanisms are complex(Anrep et al., 1936; Cohen and Taylor, 2002; Eckberg, 2009),RSA is generally agreed to result from waxing and waning ofautonomic nerve input to the sinus node. We hypothesized thatthese mechanisms may also influence ventricular action potentialrepolarization. Unlike ventricular activation which is rapid, ven-tricular repolarization is very much slower and spatially hetero-geneous, inscribing the T-wave of the ECG. Dynamic changes inventricular action potential duration (APD), and hence repolar-ization time, are of great importance to fundamental electrophys-iological mechanisms. Hence respiratory-induced fluctuations in
Abbreviations: APD, action potential duration; ARI, activation-recovery interval;LV, left ventricle; PCO2, carbon dioxide partial pressure; RSA, respiratory sinusarrhythmia; RV, right ventricle.
APD might thereby play a role in a number of physiologicaland pathophysiological functions, including instances of suddenarrhythmic death attributable to sleep apnea.
We hypothesized that if APD exhibited localized oscillatorymodulation with respiration, it might be observed in local elec-trical recordings from the in-situ human heart; our preliminaryobservations indicated the presence of a direct relationship (Gillet al., 2010). Here we report findings demonstrating respiratory-related cyclical changes in APD in human ventricles observedusing multiple endocardial electrical recordings. Such cyclicalchanges were observed in conditions where both heart rate andrespiratory rate were clamped.
METHODSETHICAL APPROVALThe study was approved by the Guy’s and St. Thomas’s HospitalsEthics Committee and conformed to the standards set by theDeclaration of Helsinki (latest revision: 59th WMA GeneralAssembly). Informed consent was obtained in writing from allsubjects.
www.frontiersin.org September 2012 | Volume 3 | Article 379 | 1
Hanson et al. Respiratory modulation of ventricular APD
SUBJECTSStudies were performed in 16 patients (15 males, 1 female, agerange 41–73, median 65 years), who were undergoing radiofre-quency ablation procedures for supraventricular arrhythmias.10 patients had established atrial fibrillation, 5 paroxysmal atrialfibrillation and 1 atypical atrial flutter. All subjects were other-wise healthy and had normal ventricular function. All studieswere performed in the cardiac catherization suite at St. Thomas’sHospital and conducted prior to the routine clinical procedurein the un-sedated state, as previously described (Taggart et al.,2003; Hanson et al., 2009). Antiarrhythmic drugs and any othercardio-active medications were discontinued for 5 days prior tothe study, which was sufficient wash-out time for all drugs in thispopulation.
ELECTROPHYSIOLOGICAL RECORDING PROCEDUREOne decapolar electrode catheter [St. Jude Medical (St. Paul,MN, USA) 6F Livewire™ Steerable Catheter model 401915 with2-5-2 mm spacing, 35 mm total span] was introduced from thefemoral vein, passed from right atrium to left atrium via a trans-septal puncture and across the mitral valve, and positioned in abase to apex orientation on the postero-inferior endocardial wallof the left ventricle. A second decapolar electrode catheter (asabove) was introduced into the right ventricle from the femoralvein and across the tricuspid valve, and positioned in a base toapex orientation on the anterior septal wall. The reference elec-trode for all 20 unipolar electrograms from each subject was
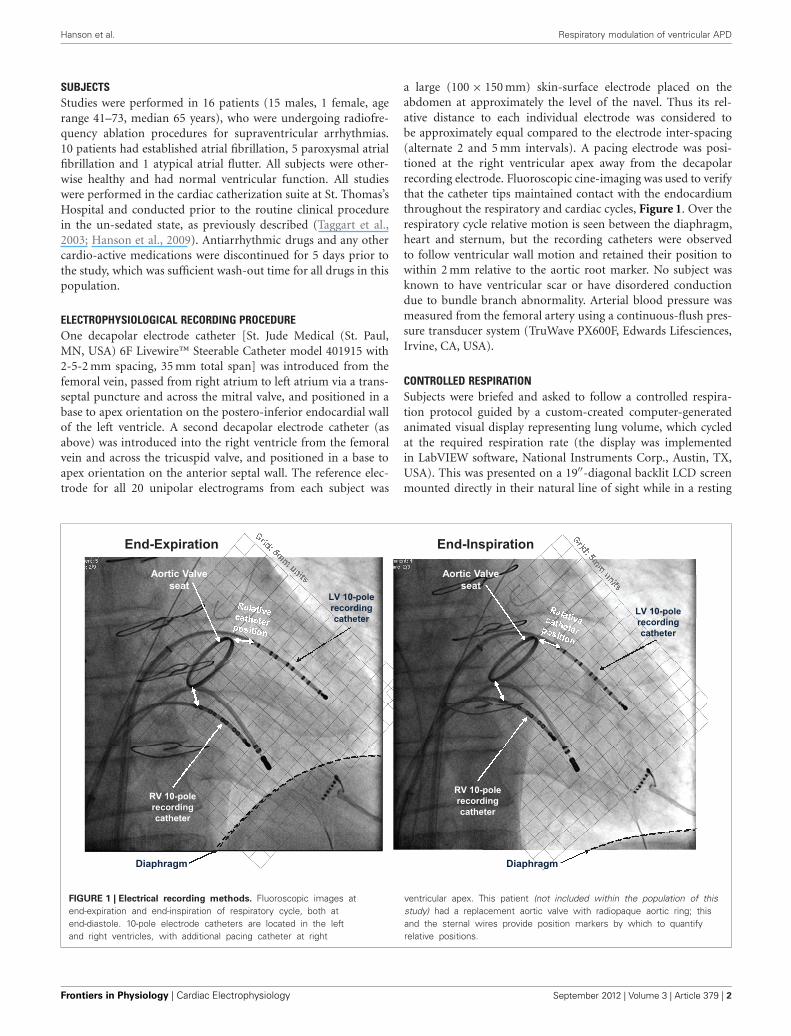
a large (100 × 150 mm) skin-surface electrode placed on theabdomen at approximately the level of the navel. Thus its rel-ative distance to each individual electrode was considered tobe approximately equal compared to the electrode inter-spacing(alternate 2 and 5 mm intervals). A pacing electrode was posi-tioned at the right ventricular apex away from the decapolarrecording electrode. Fluoroscopic cine-imaging was used to verifythat the catheter tips maintained contact with the endocardiumthroughout the respiratory and cardiac cycles, Figure 1. Over therespiratory cycle relative motion is seen between the diaphragm,heart and sternum, but the recording catheters were observedto follow ventricular wall motion and retained their position towithin 2 mm relative to the aortic root marker. No subject wasknown to have ventricular scar or have disordered conductiondue to bundle branch abnormality. Arterial blood pressure wasmeasured from the femoral artery using a continuous-flush pres-sure transducer system (TruWave PX600F, Edwards Lifesciences,Irvine, CA, USA).
CONTROLLED RESPIRATIONSubjects were briefed and asked to follow a controlled respira-tion protocol guided by a custom-created computer-generatedanimated visual display representing lung volume, which cycledat the required respiration rate (the display was implementedin LabVIEW software, National Instruments Corp., Austin, TX,USA). This was presented on a 19′′-diagonal backlit LCD screenmounted directly in their natural line of sight while in a resting
Aortic Valveseat
Aortic Valveseat
LV 10-polerecordingcatheter
LV 10-polerecordingcatheter
mgarhpaiDmgarhpaiD
RV 10-polerecordingcatheter
RV 10-polerecordingcatheter
noitaripxE-dnE noitaripsnI-dnE
FIGURE 1 | Electrical recording methods. Fluoroscopic images atend-expiration and end-inspiration of respiratory cycle, both atend-diastole. 10-pole electrode catheters are located in the leftand right ventricles, with additional pacing catheter at right
ventricular apex. This patient (not included within the population of thisstudy) had a replacement aortic valve with radiopaque aortic ring; thisand the sternal wires provide position markers by which to quantifyrelative positions.
Frontiers in Physiology | Cardiac Electrophysiology September 2012 | Volume 3 | Article 379 | 2
Hanson et al. Respiratory modulation of ventricular APD
supine position. Subjects were instructed to breathe in a naturalmanner, taking deeper breaths at slower breathing rates than atfaster breathing rates. The subject’s breathing cycle was monitoredusing a custom-constructed tension sensor fixed to a freely-expandable band placed around the chest/abdomen (adaptedfrom a RESPeRATE device, InterCure Inc., New York, NY, USA).The optimum location for each subject was chosen as the siteof maximum circumferential strain during normal breathing.Tension in the elastic band was directly proportional to bandcircumference and this output was digitized and recorded ata sample frequency of 1200 Hz, synchronized to intracardiacelectrograms and blood pressure recordings.
PROTOCOLPacing was established using a Biotronik (Berlin, Germany)model UHS 3000 stimulator, with an electrode positioned at theright ventricular apex, at a pulse width of 2 ms and stimulusstrength of 2 × diastolic threshold at a minimum cycle length suf-ficient to maintain capture (median 500 ms). Following a 2 minperiod of adaptation to the paced cycle length the subject breathedat each frequency (6, 9, 12, 15, and 30 breaths per min) for 90 seach in random order. In a subset of 5 subjects blood gaseswere analyzed during normal breathing prior to controlled-ratebreathing and on three occasions equally spaced throughout theprotocol.
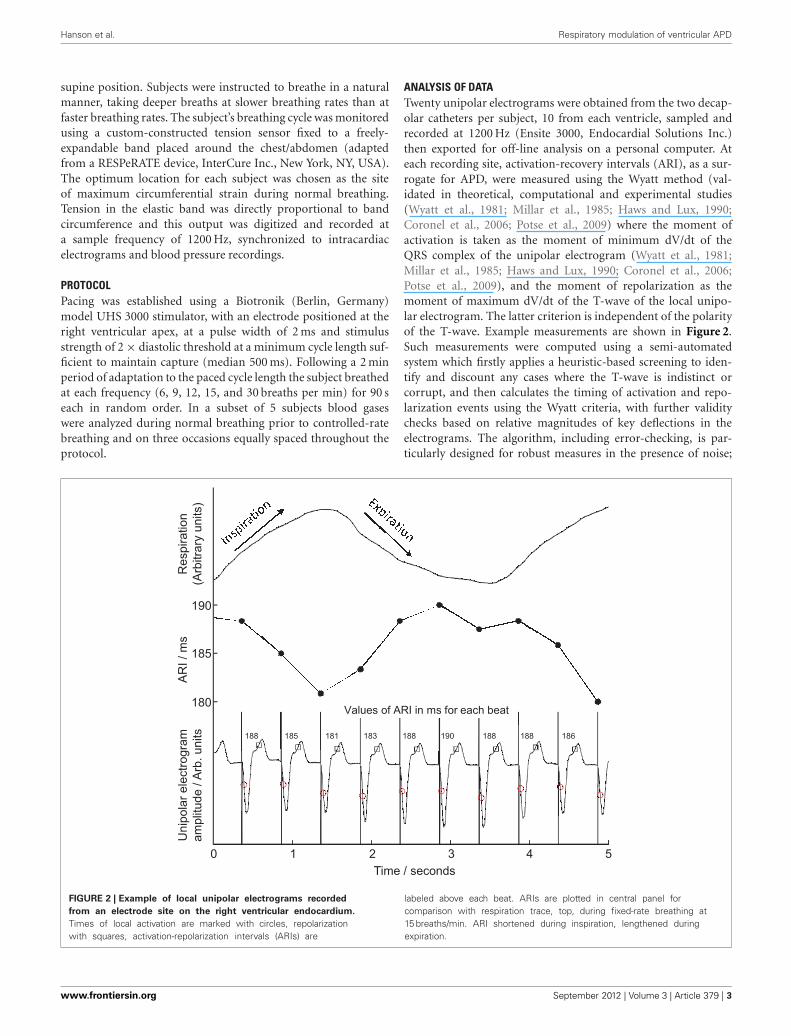
ANALYSIS OF DATATwenty unipolar electrograms were obtained from the two decap-olar catheters per subject, 10 from each ventricle, sampled andrecorded at 1200 Hz (Ensite 3000, Endocardial Solutions Inc.)then exported for off-line analysis on a personal computer. Ateach recording site, activation-recovery intervals (ARI), as a sur-rogate for APD, were measured using the Wyatt method (val-idated in theoretical, computational and experimental studies(Wyatt et al., 1981; Millar et al., 1985; Haws and Lux, 1990;Coronel et al., 2006; Potse et al., 2009) where the moment ofactivation is taken as the moment of minimum dV/dt of theQRS complex of the unipolar electrogram (Wyatt et al., 1981;Millar et al., 1985; Haws and Lux, 1990; Coronel et al., 2006;Potse et al., 2009), and the moment of repolarization as themoment of maximum dV/dt of the T-wave of the local unipo-lar electrogram. The latter criterion is independent of the polarityof the T-wave. Example measurements are shown in Figure 2.Such measurements were computed using a semi-automatedsystem which firstly applies a heuristic-based screening to iden-tify and discount any cases where the T-wave is indistinct orcorrupt, and then calculates the timing of activation and repo-larization events using the Wyatt criteria, with further validitychecks based on relative magnitudes of key deflections in theelectrograms. The algorithm, including error-checking, is par-ticularly designed for robust measures in the presence of noise;
FIGURE 2 | Example of local unipolar electrograms recorded
from an electrode site on the right ventricular endocardium.
Times of local activation are marked with circles, repolarizationwith squares, activation-repolarization intervals (ARIs) are
labeled above each beat. ARIs are plotted in central panel forcomparison with respiration trace, top, during fixed-rate breathing at15 breaths/min. ARI shortened during inspiration, lengthened duringexpiration.
www.frontiersin.org September 2012 | Volume 3 | Article 379 | 3
Hanson et al. Respiratory modulation of ventricular APD
for full details see Western et al. (2010) (algorithm imple-mented using MATLAB R2012a, Mathworks, Inc., Natick, MA,USA). Systolic peaks and diastolic troughs in arterial bloodpressure for each beat were measured from continuous tracesof pressure from a femoral artery along with their times ofoccurrence.
STATISTICAL/NUMERICAL ANALYSISThe statistical significance of respiratory oscillations in ARI(Table 1) was determined using the following spectral method,programmed in MATLAB R2012a (as above). To establish anevenly-sampled series, any beats for which ARI measurementcould not be determined were replaced by linear interpolationbetween the surrounding beats. If these surrogate beats con-stituted more than 10% of any series, the series was rejected.Otherwise, an auto-regressive Yule-Walker approach was applied,in preference to Fourier-Transform methods because it avoids thespectral resolution being constrained by a relatively short timeseries (90 s). Following the recommendation of Kay (1999), sev-eral model orders were tested and the optimal model order foreach sequence was then chosen as that which minimized Akaike’sInformation Criterion (Akaike, 1974). A minimum order of L/3(where L is the length of the series) was applied in order toprovide consistency in the model order between different record-ings from any particular subject. To ensure the models wereun-biased the prediction error from each model was requiredto pass a whiteness test. The frequency spectrum of the serieswas then calculated from the coefficients of the optimal model
(Takalo et al., 2005), providing a power-spectral-density (PSD)series, see Figure 3. The statistical significance of the respira-tory component of this series was determined by comparing itwith components outside the respiratory frequency: this “noiseband” covered the normal range of natural respiratory frequen-cies (0.15–0.4 Hz) while excluding a band covering the frequencyto be tested ±20%. The respiratory-frequency component (M)was identified as statistically significant when the following rulewas satisfied:
(M − Mn
)
σn≥ 1.96
where Mn and σn are the mean and standard deviation of thespectrum in the noise band. The threshold value 1.96 was chosento approximate a 97.5% one-sided confidence limit (p < 0.025).The magnitude of oscillations in ARI was quantified by integrat-ing the area under the PSD plot between frequencies 5% eitherside of the respiratory frequency, as shown in Figure 3. Thisprovided the oscillatory power in 2 ms; the square root of thisvalue then provided the oscillation amplitude in milliseconds, aspresented in Figures 3 and 4.
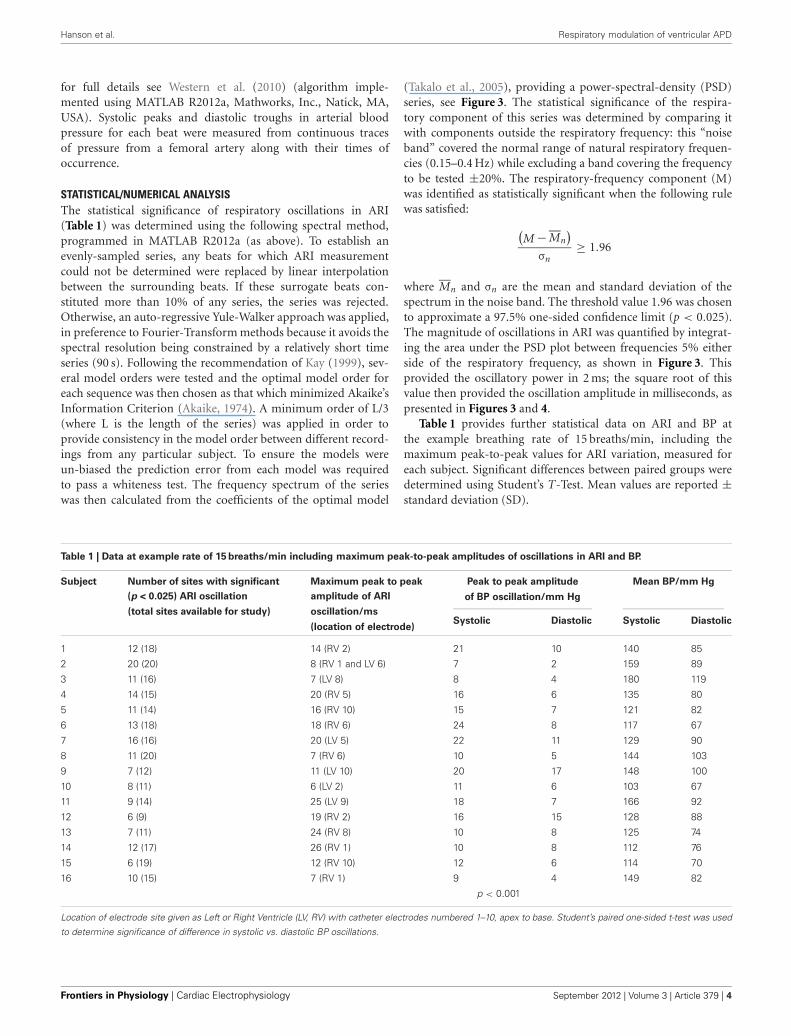
Table 1 provides further statistical data on ARI and BP atthe example breathing rate of 15 breaths/min, including themaximum peak-to-peak values for ARI variation, measured foreach subject. Significant differences between paired groups weredetermined using Student’s T-Test. Mean values are reported ±standard deviation (SD).
Table 1 | Data at example rate of 15 breaths/min including maximum peak-to-peak amplitudes of oscillations in ARI and BP.
Subject Number of sites with significant Maximum peak to peak Peak to peak amplitude Mean BP/mm Hg
of BP oscillation/mm Hg(p < 0.025) ARI oscillation amplitude of ARI
(total sites oscillation/msavailable for study)
(location of electrode)Systolic Diastolic Systolic Diastolic
1 12 (18) 14 (RV 2) 21 10 140 85
2 20 (20) 8 (RV 1 and LV 6) 7 2 159 89
3 11 (16) 7 (LV 8) 8 4 180 119
4 14 (15) 20 (RV 5) 16 6 135 80
5 11 (14) 16 (RV 10) 15 7 121 82
6 13 (18) 18 (RV 6) 24 8 117 67
7 16 (16) 20 (LV 5) 22 11 129 90
8 11 (20) 7 (RV 6) 10 5 144 103
9 7 (12) 11 (LV 10) 20 17 148 100
10 8 (11) 6 (LV 2) 11 6 103 67
11 9 (14) 25 (LV 9) 18 7 166 92
12 6 (9) 19 (RV 2) 16 15 128 88
13 7 (11) 24 (RV 8) 10 8 125 74
14 12 (17) 26 (RV 1) 10 8 112 76
15 6 (19) 12 (RV 10) 12 6 114 70
16 10 (15) 7 (RV 1) 9 4 149 82
p < 0.001
Location of electrode site given as Left or Right Ventricle (LV, RV) with catheter electrodes numbered 1–10, apex to base. Student’s paired one-sided t-test was used
to determine significance of difference in systolic vs. diastolic BP oscillations.
Frontiers in Physiology | Cardiac Electrophysiology September 2012 | Volume 3 | Article 379 | 4
Hanson et al. Respiratory modulation of ventricular APD
A
B
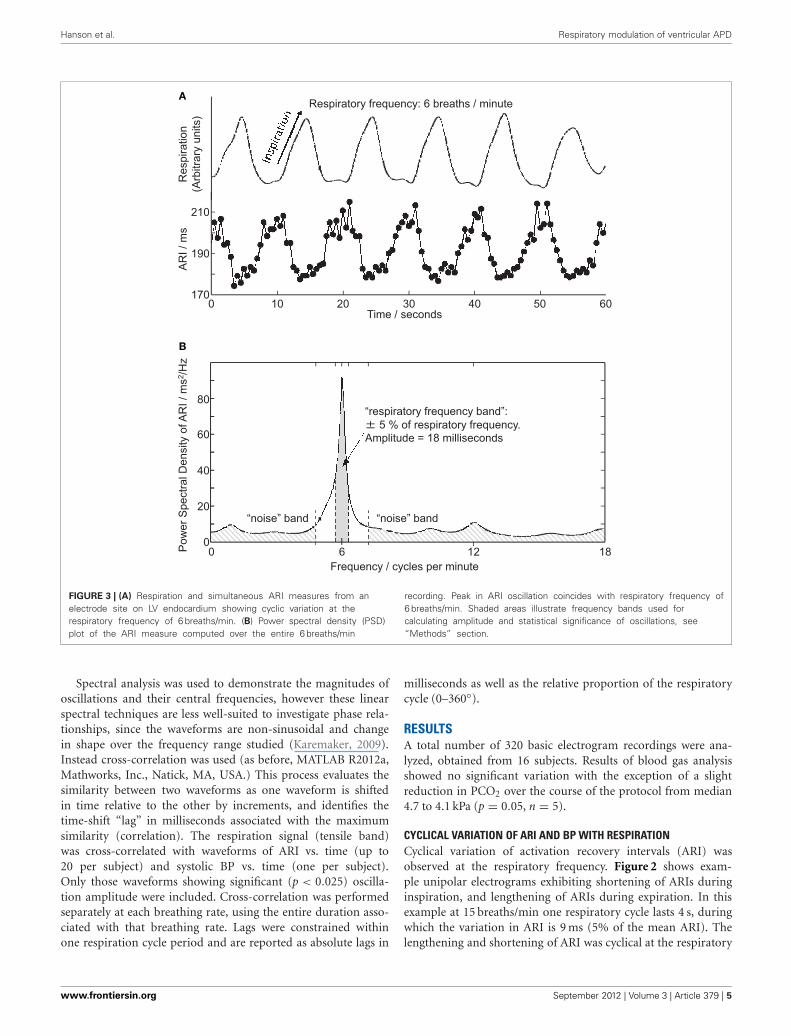
FIGURE 3 | (A) Respiration and simultaneous ARI measures from anelectrode site on LV endocardium showing cyclic variation at therespiratory frequency of 6 breaths/min. (B) Power spectral density (PSD)plot of the ARI measure computed over the entire 6 breaths/min
recording. Peak in ARI oscillation coincides with respiratory frequency of6 breaths/min. Shaded areas illustrate frequency bands used forcalculating amplitude and statistical significance of oscillations, see“Methods” section.
Spectral analysis was used to demonstrate the magnitudes ofoscillations and their central frequencies, however these linearspectral techniques are less well-suited to investigate phase rela-tionships, since the waveforms are non-sinusoidal and changein shape over the frequency range studied (Karemaker, 2009).Instead cross-correlation was used (as before, MATLAB R2012a,Mathworks, Inc., Natick, MA, USA.) This process evaluates thesimilarity between two waveforms as one waveform is shiftedin time relative to the other by increments, and identifies thetime-shift “lag” in milliseconds associated with the maximumsimilarity (correlation). The respiration signal (tensile band)was cross-correlated with waveforms of ARI vs. time (up to20 per subject) and systolic BP vs. time (one per subject).Only those waveforms showing significant (p < 0.025) oscilla-tion amplitude were included. Cross-correlation was performedseparately at each breathing rate, using the entire duration asso-ciated with that breathing rate. Lags were constrained withinone respiration cycle period and are reported as absolute lags in
milliseconds as well as the relative proportion of the respiratorycycle (0–360◦).
RESULTSA total number of 320 basic electrogram recordings were ana-lyzed, obtained from 16 subjects. Results of blood gas analysisshowed no significant variation with the exception of a slightreduction in PCO2 over the course of the protocol from median4.7 to 4.1 kPa (p = 0.05, n = 5).
CYCLICAL VARIATION OF ARI AND BP WITH RESPIRATIONCyclical variation of activation recovery intervals (ARI) wasobserved at the respiratory frequency. Figure 2 shows exam-ple unipolar electrograms exhibiting shortening of ARIs duringinspiration, and lengthening of ARIs during expiration. In thisexample at 15 breaths/min one respiratory cycle lasts 4 s, duringwhich the variation in ARI is 9 ms (5% of the mean ARI). Thelengthening and shortening of ARI was cyclical at the respiratory
www.frontiersin.org September 2012 | Volume 3 | Article 379 | 5
Hanson et al. Respiratory modulation of ventricular APD
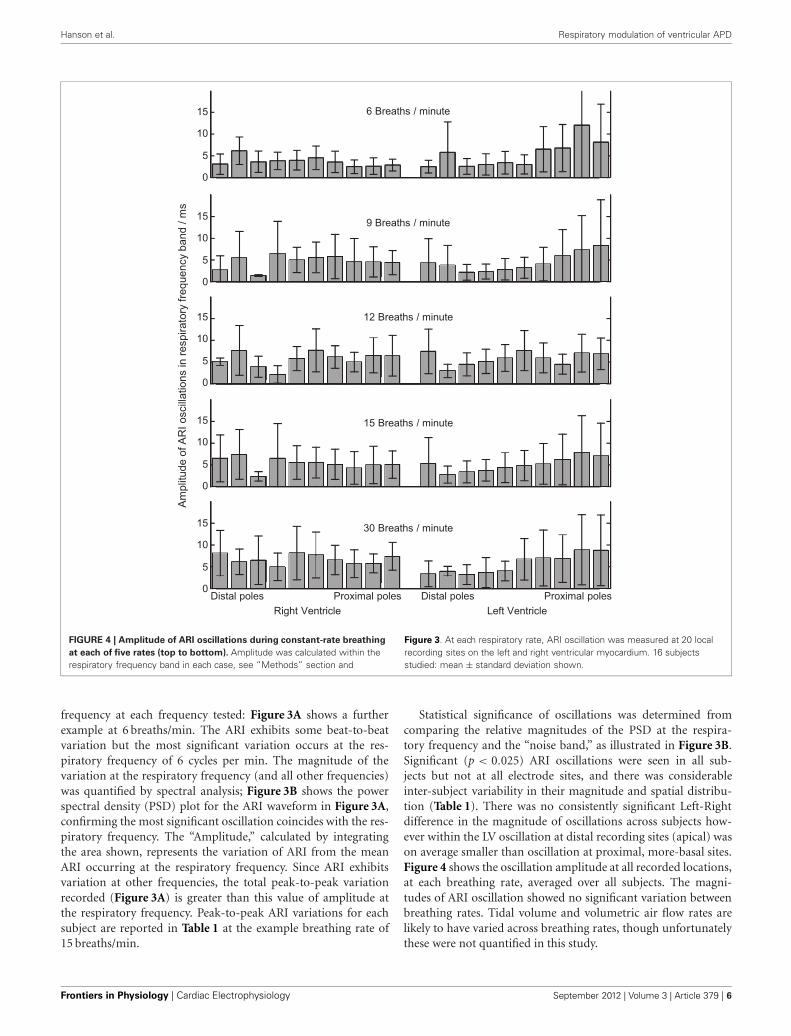
FIGURE 4 | Amplitude of ARI oscillations during constant-rate breathing
at each of five rates (top to bottom). Amplitude was calculated within therespiratory frequency band in each case, see “Methods” section and
Figure 3. At each respiratory rate, ARI oscillation was measured at 20 localrecording sites on the left and right ventricular myocardium. 16 subjectsstudied: mean ± standard deviation shown.
frequency at each frequency tested: Figure 3A shows a furtherexample at 6 breaths/min. The ARI exhibits some beat-to-beatvariation but the most significant variation occurs at the res-piratory frequency of 6 cycles per min. The magnitude of thevariation at the respiratory frequency (and all other frequencies)was quantified by spectral analysis; Figure 3B shows the powerspectral density (PSD) plot for the ARI waveform in Figure 3A,confirming the most significant oscillation coincides with the res-piratory frequency. The “Amplitude,” calculated by integratingthe area shown, represents the variation of ARI from the meanARI occurring at the respiratory frequency. Since ARI exhibitsvariation at other frequencies, the total peak-to-peak variationrecorded (Figure 3A) is greater than this value of amplitude atthe respiratory frequency. Peak-to-peak ARI variations for eachsubject are reported in Table 1 at the example breathing rate of15 breaths/min.
Statistical significance of oscillations was determined fromcomparing the relative magnitudes of the PSD at the respira-tory frequency and the “noise band,” as illustrated in Figure 3B.Significant (p < 0.025) ARI oscillations were seen in all sub-jects but not at all electrode sites, and there was considerableinter-subject variability in their magnitude and spatial distribu-tion (Table 1). There was no consistently significant Left-Rightdifference in the magnitude of oscillations across subjects how-ever within the LV oscillation at distal recording sites (apical) wason average smaller than oscillation at proximal, more-basal sites.Figure 4 shows the oscillation amplitude at all recorded locations,at each breathing rate, averaged over all subjects. The magni-tudes of ARI oscillation showed no significant variation betweenbreathing rates. Tidal volume and volumetric air flow rates arelikely to have varied across breathing rates, though unfortunatelythese were not quantified in this study.
Frontiers in Physiology | Cardiac Electrophysiology September 2012 | Volume 3 | Article 379 | 6
Hanson et al. Respiratory modulation of ventricular APD
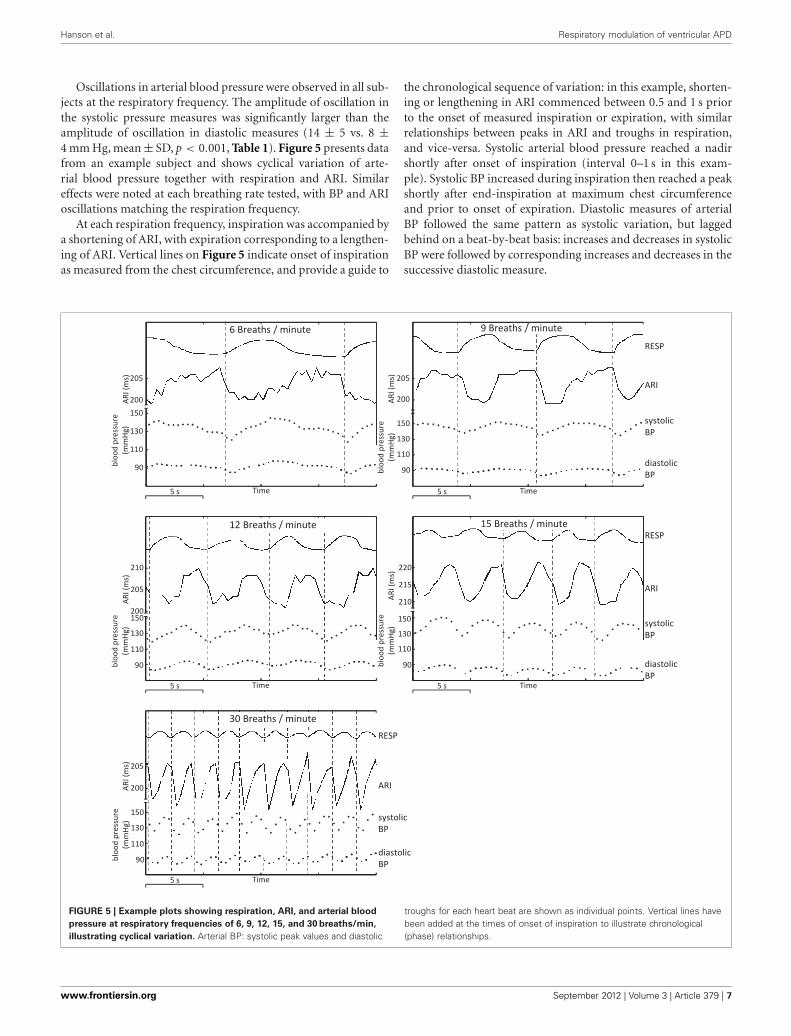
Oscillations in arterial blood pressure were observed in all sub-jects at the respiratory frequency. The amplitude of oscillation inthe systolic pressure measures was significantly larger than theamplitude of oscillation in diastolic measures (14 ± 5 vs. 8 ±4 mm Hg, mean ± SD, p < 0.001, Table 1). Figure 5 presents datafrom an example subject and shows cyclical variation of arte-rial blood pressure together with respiration and ARI. Similareffects were noted at each breathing rate tested, with BP and ARIoscillations matching the respiration frequency.
At each respiration frequency, inspiration was accompanied bya shortening of ARI, with expiration corresponding to a lengthen-ing of ARI. Vertical lines on Figure 5 indicate onset of inspirationas measured from the chest circumference, and provide a guide to
the chronological sequence of variation: in this example, shorten-ing or lengthening in ARI commenced between 0.5 and 1 s priorto the onset of measured inspiration or expiration, with similarrelationships between peaks in ARI and troughs in respiration,and vice-versa. Systolic arterial blood pressure reached a nadirshortly after onset of inspiration (interval 0–1 s in this exam-ple). Systolic BP increased during inspiration then reached a peakshortly after end-inspiration at maximum chest circumferenceand prior to onset of expiration. Diastolic measures of arterialBP followed the same pattern as systolic variation, but laggedbehind on a beat-by-beat basis: increases and decreases in systolicBP were followed by corresponding increases and decreases in thesuccessive diastolic measure.
FIGURE 5 | Example plots showing respiration, ARI, and arterial blood
pressure at respiratory frequencies of 6, 9, 12, 15, and 30 breaths/min,
illustrating cyclical variation. Arterial BP: systolic peak values and diastolic
troughs for each heart beat are shown as individual points. Vertical lines havebeen added at the times of onset of inspiration to illustrate chronological(phase) relationships.
www.frontiersin.org September 2012 | Volume 3 | Article 379 | 7
Hanson et al. Respiratory modulation of ventricular APD
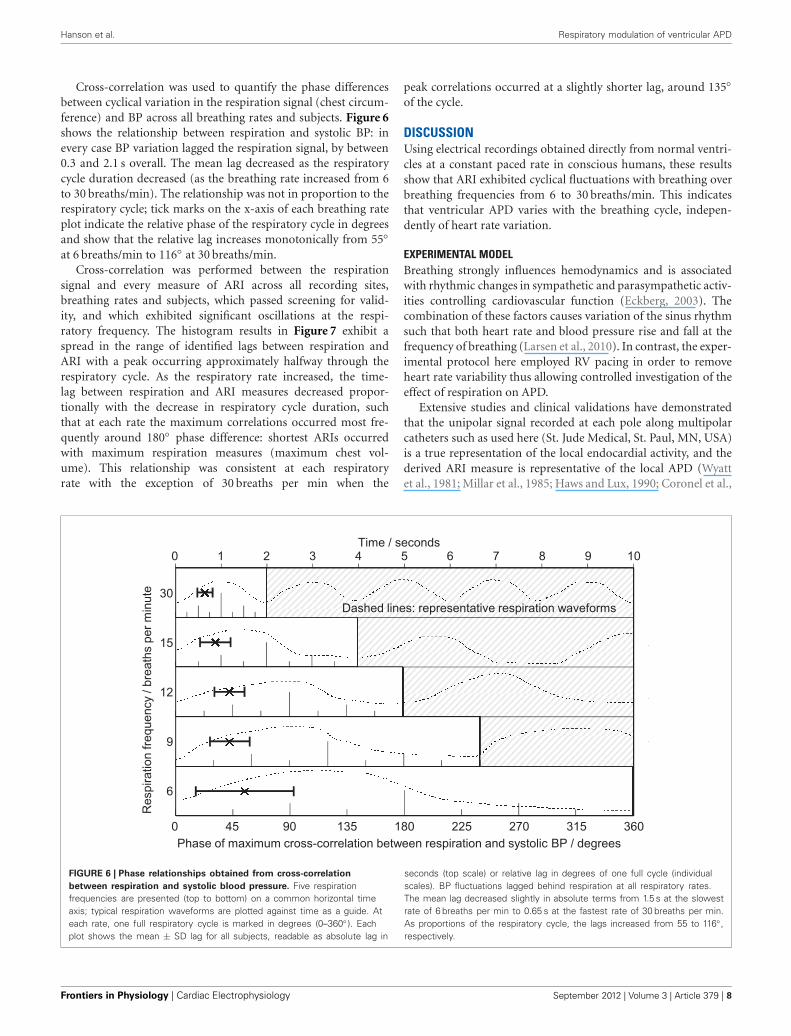
Cross-correlation was used to quantify the phase differencesbetween cyclical variation in the respiration signal (chest circum-ference) and BP across all breathing rates and subjects. Figure 6shows the relationship between respiration and systolic BP: inevery case BP variation lagged the respiration signal, by between0.3 and 2.1 s overall. The mean lag decreased as the respiratorycycle duration decreased (as the breathing rate increased from 6to 30 breaths/min). The relationship was not in proportion to therespiratory cycle; tick marks on the x-axis of each breathing rateplot indicate the relative phase of the respiratory cycle in degreesand show that the relative lag increases monotonically from 55◦at 6 breaths/min to 116◦ at 30 breaths/min.
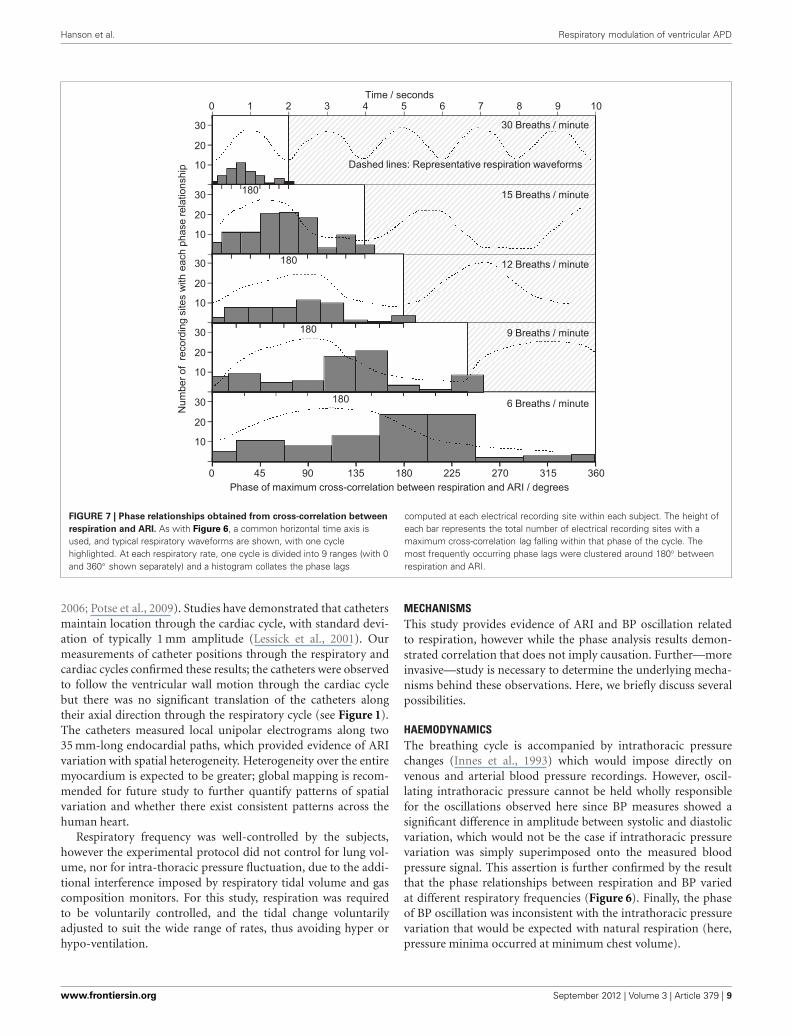
Cross-correlation was performed between the respirationsignal and every measure of ARI across all recording sites,breathing rates and subjects, which passed screening for valid-ity, and which exhibited significant oscillations at the respi-ratory frequency. The histogram results in Figure 7 exhibit aspread in the range of identified lags between respiration andARI with a peak occurring approximately halfway through therespiratory cycle. As the respiratory rate increased, the time-lag between respiration and ARI measures decreased propor-tionally with the decrease in respiratory cycle duration, suchthat at each rate the maximum correlations occurred most fre-quently around 180◦ phase difference: shortest ARIs occurredwith maximum respiration measures (maximum chest vol-ume). This relationship was consistent at each respiratoryrate with the exception of 30 breaths per min when the
peak correlations occurred at a slightly shorter lag, around 135◦of the cycle.
DISCUSSIONUsing electrical recordings obtained directly from normal ventri-cles at a constant paced rate in conscious humans, these resultsshow that ARI exhibited cyclical fluctuations with breathing overbreathing frequencies from 6 to 30 breaths/min. This indicatesthat ventricular APD varies with the breathing cycle, indepen-dently of heart rate variation.
EXPERIMENTAL MODELBreathing strongly influences hemodynamics and is associatedwith rhythmic changes in sympathetic and parasympathetic activ-ities controlling cardiovascular function (Eckberg, 2003). Thecombination of these factors causes variation of the sinus rhythmsuch that both heart rate and blood pressure rise and fall at thefrequency of breathing (Larsen et al., 2010). In contrast, the exper-imental protocol here employed RV pacing in order to removeheart rate variability thus allowing controlled investigation of theeffect of respiration on APD.
Extensive studies and clinical validations have demonstratedthat the unipolar signal recorded at each pole along multipolarcatheters such as used here (St. Jude Medical, St. Paul, MN, USA)is a true representation of the local endocardial activity, and thederived ARI measure is representative of the local APD (Wyattet al., 1981; Millar et al., 1985; Haws and Lux, 1990; Coronel et al.,
FIGURE 6 | Phase relationships obtained from cross-correlation
between respiration and systolic blood pressure. Five respirationfrequencies are presented (top to bottom) on a common horizontal timeaxis; typical respiration waveforms are plotted against time as a guide. Ateach rate, one full respiratory cycle is marked in degrees (0–360◦ ). Eachplot shows the mean ± SD lag for all subjects, readable as absolute lag in
seconds (top scale) or relative lag in degrees of one full cycle (individualscales). BP fluctuations lagged behind respiration at all respiratory rates.The mean lag decreased slightly in absolute terms from 1.5 s at the slowestrate of 6 breaths per min to 0.65 s at the fastest rate of 30 breaths per min.As proportions of the respiratory cycle, the lags increased from 55 to 116◦ ,respectively.
Frontiers in Physiology | Cardiac Electrophysiology September 2012 | Volume 3 | Article 379 | 8
Hanson et al. Respiratory modulation of ventricular APD
FIGURE 7 | Phase relationships obtained from cross-correlation between
respiration and ARI. As with Figure 6, a common horizontal time axis isused, and typical respiratory waveforms are shown, with one cyclehighlighted. At each respiratory rate, one cycle is divided into 9 ranges (with 0and 360◦ shown separately) and a histogram collates the phase lags
computed at each electrical recording site within each subject. The height ofeach bar represents the total number of electrical recording sites with amaximum cross-correlation lag falling within that phase of the cycle. Themost frequently occurring phase lags were clustered around 180◦ betweenrespiration and ARI.
2006; Potse et al., 2009). Studies have demonstrated that cathetersmaintain location through the cardiac cycle, with standard devi-ation of typically 1 mm amplitude (Lessick et al., 2001). Ourmeasurements of catheter positions through the respiratory andcardiac cycles confirmed these results; the catheters were observedto follow the ventricular wall motion through the cardiac cyclebut there was no significant translation of the catheters alongtheir axial direction through the respiratory cycle (see Figure 1).The catheters measured local unipolar electrograms along two35 mm-long endocardial paths, which provided evidence of ARIvariation with spatial heterogeneity. Heterogeneity over the entiremyocardium is expected to be greater; global mapping is recom-mended for future study to further quantify patterns of spatialvariation and whether there exist consistent patterns across thehuman heart.
Respiratory frequency was well-controlled by the subjects,however the experimental protocol did not control for lung vol-ume, nor for intra-thoracic pressure fluctuation, due to the addi-tional interference imposed by respiratory tidal volume and gascomposition monitors. For this study, respiration was requiredto be voluntarily controlled, and the tidal change voluntarilyadjusted to suit the wide range of rates, thus avoiding hyper orhypo-ventilation.
MECHANISMSThis study provides evidence of ARI and BP oscillation relatedto respiration, however while the phase analysis results demon-strated correlation that does not imply causation. Further—moreinvasive—study is necessary to determine the underlying mecha-nisms behind these observations. Here, we briefly discuss severalpossibilities.
HAEMODYNAMICSThe breathing cycle is accompanied by intrathoracic pressurechanges (Innes et al., 1993) which would impose directly onvenous and arterial blood pressure recordings. However, oscil-lating intrathoracic pressure cannot be held wholly responsiblefor the oscillations observed here since BP measures showed asignificant difference in amplitude between systolic and diastolicvariation, which would not be the case if intrathoracic pressurevariation was simply superimposed onto the measured bloodpressure signal. This assertion is further confirmed by the resultthat the phase relationships between respiration and BP variedat different respiratory frequencies (Figure 6). Finally, the phaseof BP oscillation was inconsistent with the intrathoracic pressurevariation that would be expected with natural respiration (here,pressure minima occurred at minimum chest volume).
www.frontiersin.org September 2012 | Volume 3 | Article 379 | 9
Hanson et al. Respiratory modulation of ventricular APD
BP oscillation at the respiratory frequency could thereforeresult either from variation in cardiac function, or variation inafterload attributable to vascular tone. Since vasomotor dynam-ics would be unlikely to respond at sufficient speed to match therespiratory rates in this study (Julien et al., 2001) oscillation incardiac mechanical function at the respiratory rate would seemthe more likely explanation.
MECHANICAL-ELECTRICAL COUPLINGA possible mechanism for fluctuations of ventricular ARI atthe respiratory frequency could be mechano-electric feedbackwhereby changes in ventricular loading alter the electrophysiol-ogy (Kohl et al., 2006; Taggart and Sutton, 2011). Respirationinduces cyclical changes in ventricular pressure/volume relationswith a reduction of ventricular filling occurring during inspira-tion (Innes et al., 1993). We have previously shown in humansusing a model of instituting and discontinuing cardiopulmonarybypass in patients undergoing cardiac surgical procedures, thatreducing ventricular filling and volume increased APD of epi-cardial monophasic action potentials (Taggart and Sutton, 2011).Conversely refilling the heart from a reduced volume load short-ened APD. These findings are in keeping with a substantialamount work in a wide range of experimental models (Kohl et al.,2006; Taggart and Sutton, 2011). The direction of APD changes inrelation to ventricular volume changes in these previous surgicalstudies is opposite to the ARI changes we observed with respira-tion. However, whether APD lengthens or shortens in response tomechanical stretch or deformation is critically dependent on thenature and timing of the mechanical perturbation, and thereforemechano-electric feedback remains a possible mechanism.
NERVOUS MECHANISMSTwo potential mechanisms proposed to account for respiratory-related oscillations of sinus node firing (i.e., RSA) have been thesubject of extensive investigation and ongoing debate (Task force,1996; Malliani, 2000; Cohen and Taylor, 2002; Eckberg, 2009;Karemaker, 2009). Both mechanisms could be operative. Of these,the baroreflex mechanism posits that fluctuations in intrathoracicpressure synchronous with respiration induce changes in strokevolume (Innes et al., 1993) and hence fluctuations in arterial pres-sure. These rhythmic fluctuations in systemic arterial pressureare sensed by baroreflex afferent nerves resulting in appropri-ately increasing and decreasing efferent vagal activity, whichinduces corresponding fluctuations RR interval (De Boer et al.,1987). Fluctuations in arterial BP were observed in this study,therefore the baroreflex may have been generating fluctuatingnervous activity at the respiration frequency. The results of phaseanalysis (Figures 6 and 7) over a range of respiration rates (6–30 breaths/min), indicate that this mechanism may partially—but not fully—explain the observed oscillations, as follows: thebaroreflex is characterized by a delay (latency) in responding toarterial pressure fluctuations of at least one heartbeat, and upto 2.5 s (Julien, 2006). This time delay would produce a phaselag that would become much more significant at faster breath-ing rates; e.g., at 6 breaths/min, 2.5 s corresponds to ¼ of thecycle period (90◦), but at 15 breaths/min 2.5 s is more than halfthe cycle period (>180◦). Thus a baroreflex-driven model of
interaction between BP and ARI would have a phase relationshipwhich varied proportionally with respiratory frequency. Figure 6shows that the relative phase lag between respiration and BP didindeed increase with increasing respiratory frequency (from 55 to116◦), however this was not consistent with the time lags associ-ated with the baroreflex: the mean absolute lag was not constantbut decreased from 1.5 to 0.65 s from the slowest to the fastestbreathing rate. This suggests that the baroreflex mechanism didnot have a major role in causing the ARI and BP oscillationsobserved here. An alternative mechanism to that of the barore-flex is central gating of autonomic drive to the heart by centralrespiratory networks (Gilbey and Spyer, 1997; Gilbey, 2004). Ourresults are consistent with the presence of fluctuating autonomicneural traffic to the ventricular myocardium sculptured by centralrespiratory activity, which arises through brainstem interactions(Spyer and Gilbey, 1988; Dergacheva et al., 2010) or throughentrainment by activity arising in the cerebral cortex during con-trolled breathing (Evans, 2010). Interactions associated with thecardiac plexus may also be involved (Armour and Hopkins, 1990).
It is likely that the time delay for sympathetic nerve trans-mission at neuro-effector junctions would induce a degree ofbuffering of the response to cyclical neural input. During inspi-ration, there is also a decrease in parasympathetic activity (Kollaiand Koizumi, 1981; Gilbey et al., 1984). Parasympathetic stimu-lation, via the release of acetylcholine (ACh), was thought to haveno direct effect on the ventricles. However, it has been shown that,in mammalian ventricular myocytes (including human), ACh canactivate the ACh-activated K+ current, IK, ACh, and shortenthe action potential, (Koumi and Wasserstrom, 1994; Yang et al.,1996; Dobrzynski et al., 2002). Via this pathway, the decreasein parasympathetic activity during inspiration is expected toincrease (rather than decrease) the APD (ARI). However, inaddition, there can be an interaction between the effects of thetwo branches of the autonomic nervous system on the heart,a process known as “accentuated antagonism.” Parasympatheticstimulation can antagonize, both presynaptically and postsynap-tically, the effects of sympathetic stimulation (Stramba-Badialeet al., 1991). Parasympathetic stimulation can inhibit the acti-vation of ICa, L, and IK’s caused by sympathetic stimulation(Nakajima et al., 1990; Freeman and Kass, 1995). Via this path-way, the decrease in parasympathetic activity during inspirationis expected to shorten the action potential.
IMPLICATIONSThese endocardial data are, to the authors’ knowledge, the firstindication of alteration of APD attributable to respiration andindependent of heart rate. The cyclical modulation of APD mayplay a role in a range of electrophysiological functions includ-ing arrhythmogenesis, in-keeping with the concept of a dynamicsubstrate created by the collective interaction of several dynamicphysiological processes.
Our data support the idea that respiratory patterningof autonomic nervous activity influences repolarization byenhancing autonomic influences on cardiac electrophys-iology (Gilbey, 2004). This action would be particularlyrobust in regions of high innervation, thereby potentiallyincreasing electrophysiological inhomogeneity: autonomic nerve
Frontiers in Physiology | Cardiac Electrophysiology September 2012 | Volume 3 | Article 379 | 10
Hanson et al. Respiratory modulation of ventricular APD
innervation is highly inhomogeneous, particularly in diseasedhearts subject to nerve damage and regrowth, “nerve sprouting”(Chen et al., 2001).
The interaction between respiration and APD may be rele-vant to the well-known arrhythmogenic potential of sleep apneaand its associated irregular respiratory patterns, particularly indiseased hearts.
LIMITATIONSIt has long been known that hyperventilation may induce repolar-ization changes in the electrocardiogram of normal subjects, forexample T-wave flattening or inversion has been reported in up to50–70% of healthy individuals (Bieberman et al., 1971), howeverthese changes occur at a much slower rate than the breath-to-breath oscillations we observed here. Similarly, small changes inpCO2 were observed during the course of the fixed-rate breathingprotocol. These changes may have affected pH and ion chan-nel function and thereby APD and ARI. However, these changesoccur in the course of h, whereas we studied rapidly occurring
respiration dependent changes. Therefore, pH changes are notlikely to have affected the results.
AUTHOR CONTRIBUTIONSBen Hanson, Peter Taggart, Jaswinder Gill and Julian Bostockconceived and designed the experiments. All authors took respon-sibility in collecting, analyzing and interpreting the data, withparticular individual input in the following areas: nervous con-trol of cardiovascular and respiratory systems (Michael P. Gilbey),cellular mechanisms (Henggui Zhang and Mark R. Boyett), elec-trophysiology (Peter Taggart). All authors contributed to draftingor revising the manuscript and all authors approved the finalversion of the manuscript.
ACKNOWLEDGMENTSProf. Taggart and Dr. Hanson are part-supported by a grant fromthe UK Medical Research Council (G0901819). Dr. Gill receivedfunding from the Academic Health Sciences Centre for researchactivity time.
REFERENCESAkaike, H. (1974). A new look at
the statistical model identification.IEEE Trans. Automatic Control 19,716–723.
Anrep, G. V., Pascual, W., and Rossler,R. (1936). Respiratory variations ofthe heart rate, I - the reflex mech-anism of respiratory arrhythmia.Proc. R. Soc. Edinburgh B 119B,191–217.
Armour, J. A., and Hopkins, D. A.(1990). Activity of in-vivo canineventricular neurons, Am. J. Physiol.27, H326–H336.
Bieberman, L., Sarma, R. N., andSurawicz, B. (1971). T wave abnor-malities during hyperventilationand isoprenaline infusion. Am.Heart J. 81, 166.
Chen, P.-S., Chen, L. S., Cao, J.-M.,Sharifi, B., Karagueuzian, H. S., andFishbein, M. C. (2001). Sympatheticnerve sprouting, electrical remodel-ing and the mechanisms of suddencardiac death. Cardiovasc. Res. 50,409–416.
Cohen, M. A., and Taylor, J. A. (2002).Short term cardiovascular oscilla-tions in man: measuring and mod-eling the physiologies. J. Physiology.542, 669–683.
Coronel, R., de Bakker, J. M. T.,Wilms-Schopman, F. J. G., Opthof,T., Linnebank, A. C., Belterman,C. N., and Janse, M. J. (2006).Monophasic action potentials andactivation recovery intervals as mea-sures of action potential duration:experimental evidence to resolvesome controversies. Heart Rhythm3, 1043–1050.
De Boer, R. W., Karemaker, J. M., andStrackee, J. (1987). Hemodynamic
fluctuations and baroreflex sensitiv-ity in humans. A beat-to-beatmodel. Am. J. Physiol. 253,H680–H689.
Dergacheva, O., Griffioen, K. J., Neff,R. A., and Mendelowitz, D. (2010).Respiratory modulation of pre-motor cardiac vagal neurons inthe brainstem. Respir. Physiol.Neurobiol. 174, 102–110.
Dobrzynski, H., Janvier, N. C., Leach,R., Findlay, J. B. C., Boyett, M. R.(2002). Effects of ACh and adeno-sine mediated by Kir3.1 and Kir3.4on ferret ventricular cells. Am. J.Physiol. 283, H615–H630.
Eckberg, D. L. (2003). The humanrespiratory gate. J. Physiol. 548,339–352.
Eckberg, D. L. (2009). Point: coun-terpoint: respiratory sinus arrhyth-mia is due to a central mechanismvs. respiratory sinus arrhythmia isdue to the baroreflex mechanism. J.Appl. Physiol. 106, 1740–1742. dis-cussion: Julien, C., Parkes, M. J.,Tzeng, S. Y. C., Sin, S. Y. W., Ainslie,N., van de Borne, P., Fortrat, J. Q.,Custaud, M. A., Gharib, C., Porta,A., Vallais, F., Baselli, G., Pagani,M., Lucini, D., Hughson, R. L.,Taylor, J. A., Tan, C. O., Baekey,D. M., Dick, T. E., Paton, J. F.R., Taha, B. J. Appl. Physiol. 106,1744–1751.
Evans, K. C. (2010). Cortico-limbic cir-cuitry and the airways: insights fromfunctional neuroimaging of respi-ratory afferents and efferents. Biol.Psychol. 84, 13–25.
Freeman, L. C., and Kass, R. S.(1995). Cholinergic inhibition ofslow delayed-rectifier K+ current inguinea pig sino-atrial node is not
mediated by muscarinic receptors.Mol. Pharmacol. 47, 1248–1254.
Gilbey, M. P. (2004). “Entrainment ofsympathetic rhythms,” in Primer onthe Autonomic Nervous System, 2ndEdn. eds D. Robertson, I. Biaggioni,G. Burnstock, and P. A. Low (SanDiego, Elsevier Academic Press),147–150.
Gilbey, M. P., Jordan, D., Richter,D. W., and Spyer, K. M. (1984).Synaptic mechanisms involved inthe inspiratory modulation of vagalcardio-inhibitory neurones in thecat. J. Physiol. 356, 65–78.
Gilbey, M. P., and Spyer, K. M.(1997). “Cardiorespiratory regu-lation,” in Neural Control of theRespiratory Muscles, eds A. D.Miller, A. L. Bianchi, and B. P.Bishop (New York, NY: CRC Press),259–268.
Gill, J. G., Hanson, B., Western, D.,Bostock, J., and Taggart, P. (2010).Respiration Exerts cyclical modu-lation of ventricular repolarization.Heart Rhythm. 2010, P06–P122.
Hanson, B., Sutton, P., Nasser, E., Gray,M., Critchley, H., Gill, J. S., andTaggart, P. (2009). Interactionof activation-repolarizationcoupling and restitution prop-erties in humans. Circ. Arrhythm.Electrophysiol. 2, 162–170.
Haws, C. W., and Lux, R. L. (1990).Correlation between in vivotransmembrane action potentialdurations and activation recoveryintervals from electrograms:effectof interventions that alter repo-larization time. Circulation 81,281–288.
Innes, J. A., De Court, S. C., Kox, W.,and Guz, A. (1993). Within-breath
modulation of left ventricularfunction during normal breathingand positive-pressure ventilation inman. J. Physiol. 460, 487–502.
Julien, C. (2006). The enigma of Mayerwaves: facts and models. Cardiovasc.Res. 70, 12–21.
Julien, C., Malpas, S. C., and Strauss,H. M. (2001). Review: sympa-thetic modulation of blood pres-sure variability. J. Hypertens. 19,1707–1712.
Karemaker, J. M. (2009). Counterpoint:Respiratory sinus arrhythmiais due to the baroreflex mech-anism. J. Appl. Physiol. 106,1742–1743.
Kay, S. M. (1999). Modern SpectralEstimation: Theory and Application.Englewood Cliffs, NJ: Prentice Hall,P. T. R.
Kohl, P., Bollensdorff, C., and Garny,A. (2006). Effects of mechanosen-sitive ion channels on ventricularelectrophysiology, experiments andtheoretical models. Exp. Physiol. 91,307–321.
Kollai, M., and Koizumi, K. (1981).Cardiovascular reflexes andinterrelationships between sym-pathetic and parasympatheticactivity. J. Auton. Nerv. Syst. 4,135–148.
Koumi, S. I., and Wasserstrom, J.A. (1994). Acetylcholine-sensitivemuscarinic K+ channels in mam-malian ventricular myocytes. Am.J. Physiol. 266, H1812–H1821.
Larsen, P. D., Tzeng, Y. C., Sin, P. Y.W., and Galletly, D. C. (2010).Respiratoy sinus arrhythmia inconscious humans during sponta-neous respiration. Respir. Physiol.Neurobiol. 174, 111–118.
www.frontiersin.org September 2012 | Volume 3 | Article 379 | 11
Hanson et al. Respiratory modulation of ventricular APD
Lessick, J., Kornowski, R., Fuchs, S., andBen-Haim, S. (2001). Assessmentof NOGA catheter stability duringthe entire cardiac cycle by meansof a special needle-tipped catheter.Catheter. Cardiovasc. Interv. 52,400–406.
Malliani, A. (2000). Principles ofCardiovascular Neural Regulation inHealth and Disease. Boston, MA:Kluwer Academic Publishers.
Millar, C. K., Kralios, F. A., andLux, R. L. (1985). Correlationbetween refractory periods andactivation-recovery intervalsfrom electrograms: effects of rateand adrenergic interventions.Circulation 72, 1372–1379.
Nakajima, T., Wu, S., Irisawa, H., andGiles, W. (1990). Mechanism ofacetylcholine-induced inhibitionof Ca current in bullfrog atrialmyocytes. J. Gen. Physiol. 96,865–885.
Potse, M., Vinet, A., Opthof, T., andCoronel, R. (2009). Validationof a simple model for themorphology of the T wave inunipolar electrograms. Am. J.Physiol. Heart Circ. Physiol. 297,H792–H801.
Spyer, K. M., and Gilbey, M. P. (1988).Cardiorespiratory interactions inheart-rate control. Ann. N.Y. Acad.Sci. 533, 350–357.
Stramba-Badiale, M., Vanoli, E.,De Ferrari, G. M., Cerati, D.,Foreman, R. D., and Schwartz,P. J. (1991). Sympathetic-parasympathetic in-teractionand accentuated antagonism inconscious dogs. Am. J. Physiol. 260,H335–H340.
Taggart, P., Sutton, P., Chalabi, Z.,Boyett, M. R., Simon, R., Elliott,D., and Gill, J. S. (2003). Effectof adrenergic stimulation on actionpotential duration restitution inhumans. Circulation 107, 285–289.
Taggart, P., and Sutton, P. (2011) “Loaddependence of ventricular repolar-ization,” in Cardiac Mechano-electricFeedback and Arrhythmias. FromPipette to Subject, 2nd Edn. eds P.Kohl, F. Sachs, and M. R. Franz(Philadelphia, USA: Publ.Elsevier),269–273.
Takalo, R., Hytti, H., and Ihalainen,H. (2005). Tutorial on univari-ate autoregressive spectral analy-sis. J. Clin. Monit. Comput. 19,401–410.
Task force of the European Societyof Cardiology and the NorthAmerican Society of Pacingand Electrophysiology. (1996).Heart rate variability: standardsof measurement, physiologicalinterpretation, and clinical use.Circulation 93, 1043–1065.
Western, D., Taggart, P., and Hanson,B. (2010). “Real-Time feedbackof dynamic cardiac repolarizationproperties,” in Proceedings of AnnualInternational Conference of the IEEEEngineering in Medicine and BiologySociety (EMBC), Buenos Aires,Argentina, 30/8 to 4/9/2010,114–117.
Wyatt, R. F., Burgess, M. L., Evans,A. K., Lux, R. L., Abildskov, J. A.,and Tsutsu, T. (1981). Estimation ofventricular transmembrane actionpotential durations and repolariza-tion times from unipolar electro-grams. Am. J. Cardiol. 47, 488.
Yang, Z.-K., Boyett, M. R., Janvier,N. C., McMorn, S. O., Shui, Z.,and Karim, F. (1996). Regionaldifferences in the negative inotropiceffectof acetylcholine within thecanine ventricle. J. Physiol. 492,789–806.
Conflict of Interest Statement: Theauthors declare that the researchwas conducted in the absence of anycommercial or financial relationshipsthat could be construed as a potentialconflict of interest.
Received: 01 May 2012; accepted: 06September 2012; published online: 244September 2012.Citation: Hanson B, Gill J, WesternD, Gilbey MP, Bostock J, Boyett MR,Zhang H, Coronel R and Taggart P(2012) Cyclical modulation of humanventricular repolarization by respiration.Front. Physio. 3:379. doi: 10.3389/fphys.2012.00379This article was submitted to Frontiers inCardiac Electrophysiology, a specialty ofFrontiers in Physiology.Copyright © 2012 Hanson, Gill,Western, Gilbey, Bostock, Boyett, Zhang,Coronel and Taggart. This is an open-access article distributed under the termsof the Creative Commons AttributionLicense, which permits use, distributionand reproduction in other forums,provided the original authors and sourceare credited and subject to any copyrightnotices concerning any third-partygraphics etc.
Frontiers in Physiology | Cardiac Electrophysiology September 2012 | Volume 3 | Article 379 | 12
4