digital color imaging
TRANSCRIPT
IEEE TRANSACTIONS ON IMAGE PROCESSING, VOL. 6, NO. 7, JULY 1997 901
Digital Color ImagingGaurav Sharma, Member, IEEE, and H. Joel Trussell, Fellow, IEEE
Abstract—This paper surveys current technology and researchin the area of digital color imaging. In order to establish thebackground and lay down terminology, fundamental conceptsof color perception and measurement are first presented us-ing vector-space notation and terminology. Present-day colorrecording and reproduction systems are reviewed along withthe common mathematical models used for representing thesedevices. Algorithms for processing color images for display andcommunication are surveyed, and a forecast of research trends isattempted. An extensive bibliography is provided.
I. INTRODUCTION
AMONG THE human senses, sight and color perceptionare perhaps the most fascinating. There is, consequently,
little wonder that color images pervade our daily life intelevision, photography, movies, books, and newspapers. Withthe digital revolution, color has become even more accessible.Color scanners, cathode ray tube (CRT) displays, and printersare now an integral part of the office environment. Extrapo-lating from current trends, homes will also have a plethora ofdigital color imaging products in the near future.
The increased use of color has brought with it new chal-lenges and problems. In order to meaningfully record andprocess color images, it is essential to understand the mech-anisms of color vision and the capabilities and limitationsof color imaging devices. It is also necessary to developalgorithms that minimize the impact of device limitations andpreserve color information as images are exchanged betweendevices. The goal of this paper is to present a survey of thetechnology and research in these areas.
The rest of this paper is broadly organized into four sections.Section II provides an introduction to color science for imagingapplications. Commonly used color recording and reproductiondevices are discussed in Section III. A survey of algorithmsused for processing color images in desktop applications ispresented in Section IV. Finally, research directions in colorimaging are summarized in Section V.
II. COLOR FUNDAMENTALS
Prior to the time of Sir Isaac Newton, the nature of lightand color was rather poorly understood [1], [2]. Newton’smeticulous experiments [3], [4, Chap. 3] with sunlight and
Manuscript received September 15, 1996; revised February 24, 1997. Theassociate editors coordinating the review of this manuscript and approving itfor publication were Drs. Ping Wah Wong, Jan Allebach, Mark D. Fairchild,and Brian Funt.
G. Sharma is with Xerox Corporation, Webster, NY 14580 USA (e-mail:[email protected]).
H. J. Trussell is with the Electrical and Computer Engineering Department,North Carolina State University, Raleigh, NC 27695-7911 USA (e-mail:[email protected]).
Publisher Item Identifier S 1057-7149(97)04731-3.
a prism helped dispel existing misconceptions and led tothe realization that the color of light depended on its spec-tral composition. Even though Grimaldi preceded Newton inmaking these discoveries, his book [5], [2, pp. 141–147] onthe subject received attention much later, and credit for thewidespread dissemination of the new ideas goes to Newton.While Newton’s experiments established a physical basis forcolor, they were still a long way from a system for colorimetry.
Before a system to measure and specify color could bedeveloped, it was necessary to understand the nature of thecolor sensing mechanisms in the human eye. While someprogress in this direction was made in the late 18th century [6],the prevalent anthropocentric views contributed to a confusionbetween color vision and the nature of light [6], [7]. Thewider acceptance of the wave theory of light paved the wayfor a better understanding of both light and color [8], [9].Both Palmer [6] and Young [9] hypothesized that the humaneye has three receptors, and the difference in their responsescontributes to the sensation of color. However, Grassmann[10] and Maxwell [11] were the first to clearly state that colorcan be mathematically specified in terms of three independentvariables. Grassmann also stated experimental laws of colormatching that now bear his name [12, p. 118]. Maxwell [13],[14] demonstrated that any additive color mixture could be“matched” by proper amounts of three primary stimuli, a factnow referred to as trichromatic generalization or trichromacy.Around the same time, Helmholtz [15] explained the dis-tinction between additive and subtractive color mixing andexplained trichromacy in terms of spectral sensitivity curvesof the three “color sensing fibers” in the eye.
Trichromacy provided strong indirect evidence for the factthat the human eye has three color receptors. This fact wasconfirmed only much later by anatomical and physiologi-cal studies. The three receptors are known as the S, M,and L cones (short, medium, and long wavelength sensitive)and their spectral sensitivities have now been determineddirectly through microspectrophotometric measurements [16],[17]. Long before these measurements were possible, color-matching functions (CMF’s) were determined through psy-chophysical experiments [12], [18]–[21]. CMF’s are sets ofthree functions related to the spectral sensitivities of the threecones by nonsingular linear transformations. The CMF’s de-termined by Guild [19] and Wright [18] were used by the CIE(Commission Internationale de l’Eclairage or the InternationalCommission on Illumination) to establish a standard for anumerical specification of color in terms of three coordinatesor tristimulus values.
While the CMF’s provide a basis for a linear model forcolor specification, it is clear that the human visual sensitivity
1057–7149/97$10.00 1997 IEEE
902 IEEE TRANSACTIONS ON IMAGE PROCESSING, VOL. 6, NO. 7, JULY 1997
to color changes is nonlinear. Since color differences betweenreal world objects and images are evaluated by human viewers,it is desirable to determine uniform color spaces in which equalEuclidean distances correspond to roughly equal perceivedcolor differences. Considerable research has focused on thisproblem since the establishment of colorimetry.
Tristimulus values are useful for specifying colors andcommunicating color information precisely. Uniform colorspaces are useful in evaluating color matching/mismatchingof similar stimuli under identical adaptation conditions. Sincethe human visual system undergoes significant changes inresponse to its environment, tristimuli under different condi-tions of adaptation cannot be meaningfully compared. Sincetypical color reproduction problems involve different media orviewing conditions, it is necessary to consider descriptors ofcolor appearance that transcend these adaptations. This is thegoal of color appearance modeling.
A. Trichromacy and Human Color Vision
In the human eye, an image is formed by light focusedonto the retina by the eye’s lens. The three types of cones thatgovern color sensation are embedded in the retina, and containphotosensitive pigments with different spectral absorptances. Ifthe spectral distribution of light incident on the retina is givenby , where represents wavelength (we are ignoring anyspatial variations in the light for the time being), the responsesof the three cones can be modeled as a three vector withcomponents given by
(1)
where denotes the sensitivity of the th type of cones,and denotes the interval of wavelengths outsideof which all these sensitivities are zero. Typically in air orvacuum, the visible region of the electromagnetic spectrum isspecified by the wavelength region between nmand nm.
Mathematically, the expressions in (1) correspond to innerproduct operations [22] in the Hilbert space of square inte-grable functions . Hence, the cone responsemechanism corresponds to a projection of the spectrum ontothe space spanned by three sensitivity functions .This space is called the human visual subspace (HVSS)[23]–[26]. The perception of color depends on further non-linear processing of the retinal responses. However, to a firstorder of approximation, under similar conditions of adaptation,the sensation of color may be specified by the responses of thecones. This is the basis of all colorimetry and will be implicitlyassumed throughout this section. A discussion of perceptualuniformity and appearance will be postponed until SectionsII-C and II-D.
For computation, the spectral quantities in (1) may bereplaced by their sampled counterparts to obtain summationsas numerical approximations to the integrals. For most colorspectra, a sampling rate of 10 nm provides sufficient accuracy,but in applications involving fluorescent lamps with sharp
spectral peaks, a higher sampling rate or alternative approachesmay be required [27]–[30].
If uniformly spaced samples are used over the visiblerange , (1) can be compactly written as
(2)
where the superscript denotes the transpose,is an 3 matrix whose th column, ,
is the vector of samples of , and is the vector ofsamples of . The HVSS then corresponds to the columnspace of .
In normal human observers, the spectral sensitivities ofthe three cones are linearly independent. Furthermore, thedifferences between the spectral sensitivities of color-normalobservers are (relatively) small [18], [31], [12, p. 343] andarise primarily due to the difference in the spectral transmit-tance of the eye’s lens and the optical medium ahead of theretina [18], [32]–[34].
If a standardized set of cone responses is defined, colormay be specified using the three-vector, , in (2), known as atristimulus vector. Just as several different coordinate systemsmay be used for specifying position in three-dimensional (3-D) space, any nonsingular well-defined linear transformationof the tristimulus vector, , can also serve the purpose ofcolor specification. Since the cone responses are difficult tomeasure directly, but nonsingular linear transformations of thecone responses are readily determined through color-matchingexperiments, such a transformed coordinate system is used forthe measurement and specification of color.
1) Color Matching: Two spectra, represented by -vectors, and , produce the same cone responses andtherefore represent the same color if
(3)
To see how (2) encapsulates the principle of trichromacyand how CMF’s are determined, consider three color pri-maries, i.e., three colorimetrically independent light sources
. The term colorimetrically independent will be usedin this paper to denote a collection of spectra such thatthe color of any one cannot be visually matched by anylinear combination of the others. Mathematically, colorimetricindependence of is equivalent to the linear indepen-dence of the three-vectors , and . Hence if
, the matrix is nonsingular.
For any visible spectrum, , the three-vectorsatisfies the relation
(4)
which is the relation for a color match. Hence, for any visiblespectrum, , there exists a combination of the primaries,
, which matches the color of . This statement encap-sulates the principle of trichromacy. From the standpoint ofobtaining a physical match, the above mathematical argumentrequires some elaboration. It is possible that the obtainedvector of primary “strengths,” , has negative components(in fact it can be readily shown that for any set of physicalprimaries there exist visible spectra for which this happens).
SHARMA AND TRUSSELL: DIGITAL COLOR IMAGING 903
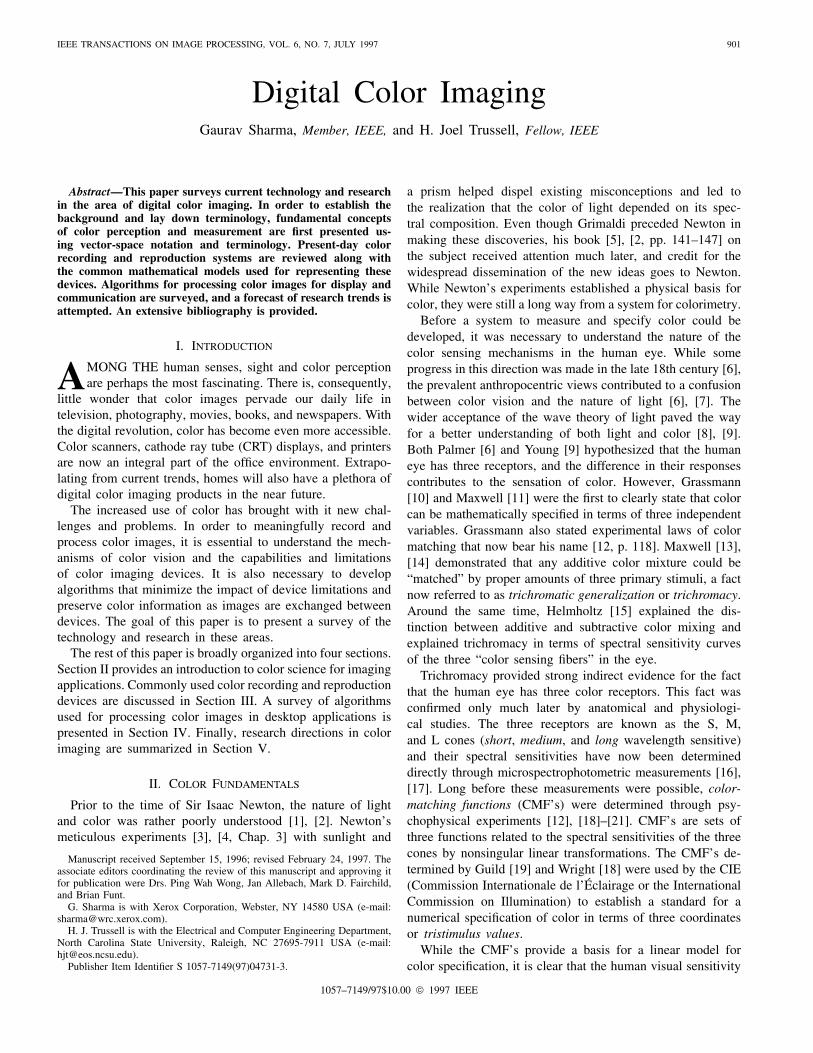
Fig. 1. Color-matching experiment.
Since negative intensities of the primaries cannot be produced,the spectrum is not realizable using the primaries.A physical realization corresponding to the equations is,however, still possible by rearranging the terms in (4) and“subtracting” the primaries with negative “strengths” from. The double negation cancels out and corresponds to the
addition of positive amounts of the appropriate primaries to .The setup for a typical color-matching experiment is shown
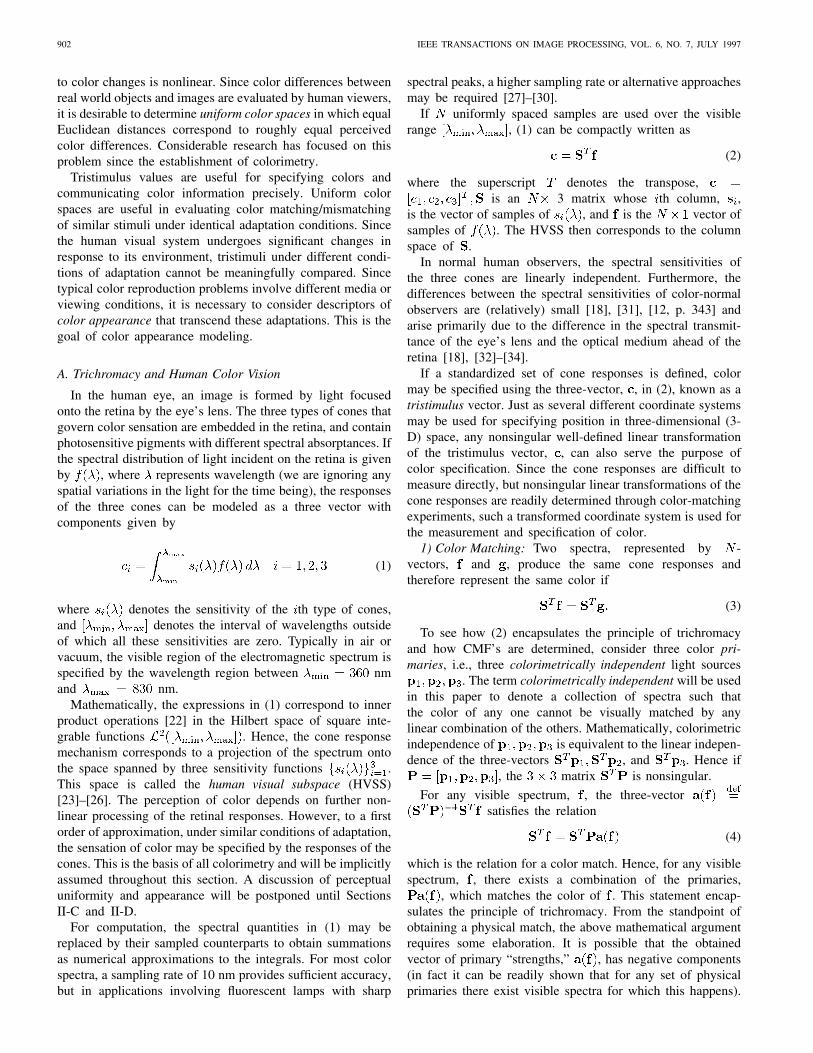
schematically in Fig. 1. The observer views a small circularfield that is split into two halves. The spectrum is displayedon one half of a visual field. On the other half of the visualfield appears a linear combination of the primary sources.The observer attempts to visually match the input spectrumby adjusting the relative intensities of the primary sources.The vector, , denotes the relative intensities of the threeprimaries when a match is obtained. Physically, it may beimpossible to match the input spectrum by adjusting theintensities of the primaries. When this happens, the observeris allowed to move one or two of the primaries so that theyilluminate the same field as input spectrum, (see Fig. 2). Asnoted earlier, this procedure is mathematically equivalent tosubtracting that amount of primary from the primary field,i.e., the strengths in corresponding to the primarieswhich were moved are negative. As demonstrated in thelast paragraph, all visible spectra can be matched using thismethod.
2) Color-Matching Functions: The linearity of colormatching expressed in (3) implies that if the color tristimulusvalues for a basis set of spectra are known, the color valuesfor all linear combinations of those spectra can be readilydeduced. The unit intensity monochromatic spectra, given by
, where is an -vector having a one in the thposition and zeros elsewhere, form a orthonormal basis interms of which all spectra can be expressed. Hence, the colormatching properties of all spectra (with respect to a given setof primaries) can be specified in terms of the color matchingproperties of these monochromatic spectra.
Consider the color-matching experiment of the last sectionfor the monochromatic spectra. Denoting the relative inten-
Fig. 2. Color-matching experiment with negative value for primary p1.
sities of the three primaries required for matching by, the matches for all the monochromatic spectra
can be written as
(5)
Combining the results of all monochromatic spectra, weget
(6)
where is the identity matrix,and is the color-matching matrixcorresponding to the primaries . The entries in the thcolumn of correspond to the relative amount of the thprimary required to match , respectively. The columnsof are therefore referred to as the color-matching functions(CMF’s) (associated with the primaries ).
From (6), it can be readily seen that the color-matchingmatrix . Hence the CMF’s are a nonsingularlinear transformation of the sensitivities of the three cones inthe eye. It also follows that the color of two spectra, and
, matches if and only if . As mentioned earlier,color of a visible spectrum, , may be specified in terms ofthe tristimulus values, , instead of . The fact thatthe color-matching matrix is readily determinable using theprocedure outlined above makes such a scheme for specifyingcolor considerably attractive in comparison to one based onthe actual cone sensitivities. Note also that the HVSS that wasdefined as the column space of can alternately be definedas the column space of .
3) Metamerism and Black Space: As stated in (3), twospectra represented by -vectors and match in colorif (or ). Since (or equivalently
) is an 3 matrix, with 3, it is clear that there areseveral different spectra that appear to be the same color to theobserver. Two distinct spectra that appear the same are calledmetamers, and such a color match is said to be a metamericmatch (as opposed to a spectral match).
Metamerism is both a boon and a curse in color applications.Most color output systems (such as CRT’s and color photogra-phy) exploit metamerism to reproduce color. However, in the
904 IEEE TRANSACTIONS ON IMAGE PROCESSING, VOL. 6, NO. 7, JULY 1997
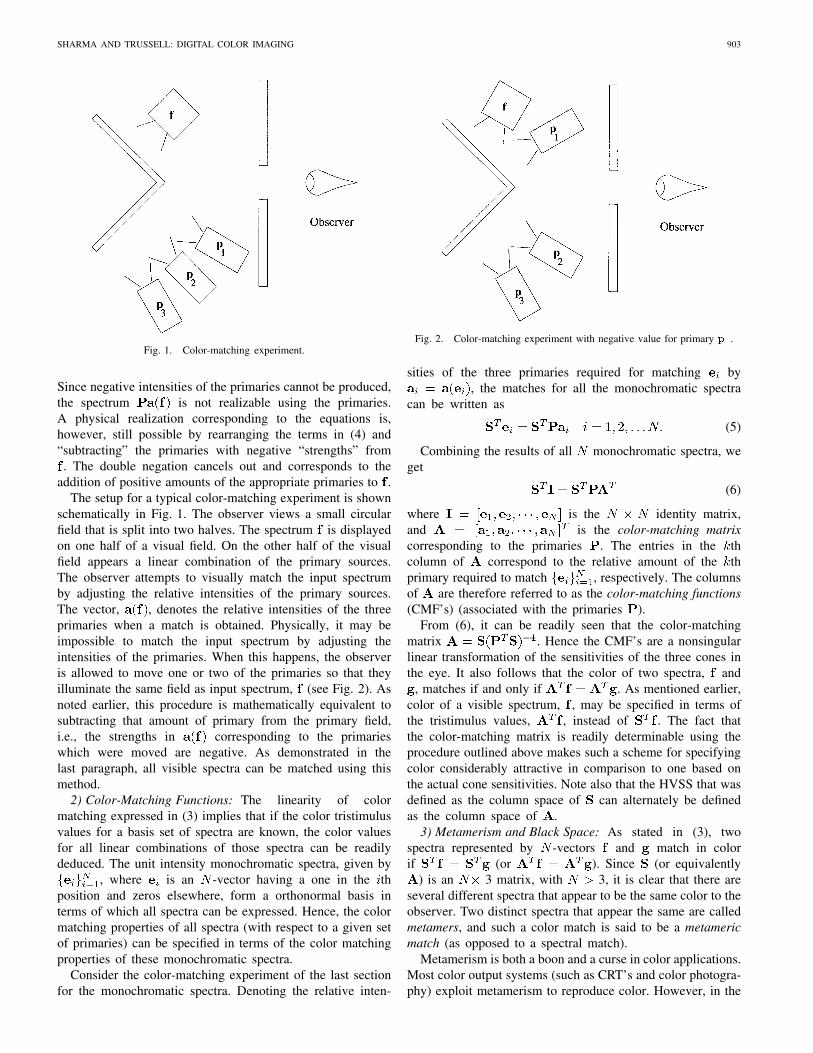
Fig. 3. CIE �r(�); �g(�); �b(�) color-matching functions.
matching of reflective materials, a metameric match under oneviewing illuminant is usually insufficient to establish a matchunder other viewing illuminants. A common manifestation ofthis phenomenon is the color match of (different) fabrics underone illumination and mismatch under another.
The vector space view of color matching presented abovewas first given by Cohen and Kaupauf [35], [36], [24].Tutorial descriptions using current notation and terminologyappear in [23], [25], [37], and [38]. This approach allowsus to deduce a number of interesting and useful propertiesof color vision. One such property is the decomposition ofthe dimensional spectral space into the 3-D HVSS and the
-dimensional metameric black space, which was firsthypothesized by Wyszecki [39]. Mathematically, this resultstates that any visible spectrum, , can be written as
(7)
where is the orthogonal projector ontothe column space of , i.e., the HVSS, andis the orthogonal projector onto the black space, which is theorthogonal complement of the HVSS. The projection, , iscalled the fundamental metamer of because all metamers of
are given by .Another direct consequence of the above description of
color matching is the fact that the primaries in any color-matching experiment are unique only up to metamers. Sincemetamers are visually identical, the CMF’s are not changedif each of the three primaries are replaced by any of theirmetamers.
The physical realization of metamers imposes additionalconstraints over and above those predicated by the equationsabove. In particular, any physically realizable spectrum needsto be nonnegative, and, hence, it is possible that the metamers
described by the above mathematics may not be realizable.In cases where a realizable metamer exists, set theoreticapproaches may be used to incorporate nonnegativity and otherconstraints [37].
B. Colorimetry
It was mentioned in Section II-A2 that the color of avisible spectrum, , can be specified in terms of the tristimulusvalues, , where is a matrix of CMF’s. In order to haveagreement between different measurements, it is necessary todefine a standard set of CMF’s with respect to which thetristimulus values are stated. A number of different standardshave been defined for a variety of applications, and it is worthreviewing some of these standards and the historical reasonsbehind their development.
1) CIE Standards: The CIE is the primary organization re-sponsible for standardization of color metrics and terminology.A colorimetry standard was first defined by the CIE in 1931and continues to form the basis of modern colorimetry.
The CIE 1931 recommendations define a standard colori-metric observer by providing two different but equivalentsets of CMF’s. The first set of CMF’s is known as the CIERed–Green–Blue (RGB) CMF’s, . These areassociated with monochromatic primaries at wavelengths of700.0, 546.1, and 435.8 nm, respectively, with their radiantintensities adjusted so that the tristimulus values of the equi-energy spectrum are all equal [40]. The equi-energy spectrumis the one whose spectral irradiance (as a function of wave-length) is constant. The CIE RGB CMF’s are shown in Fig. 3.
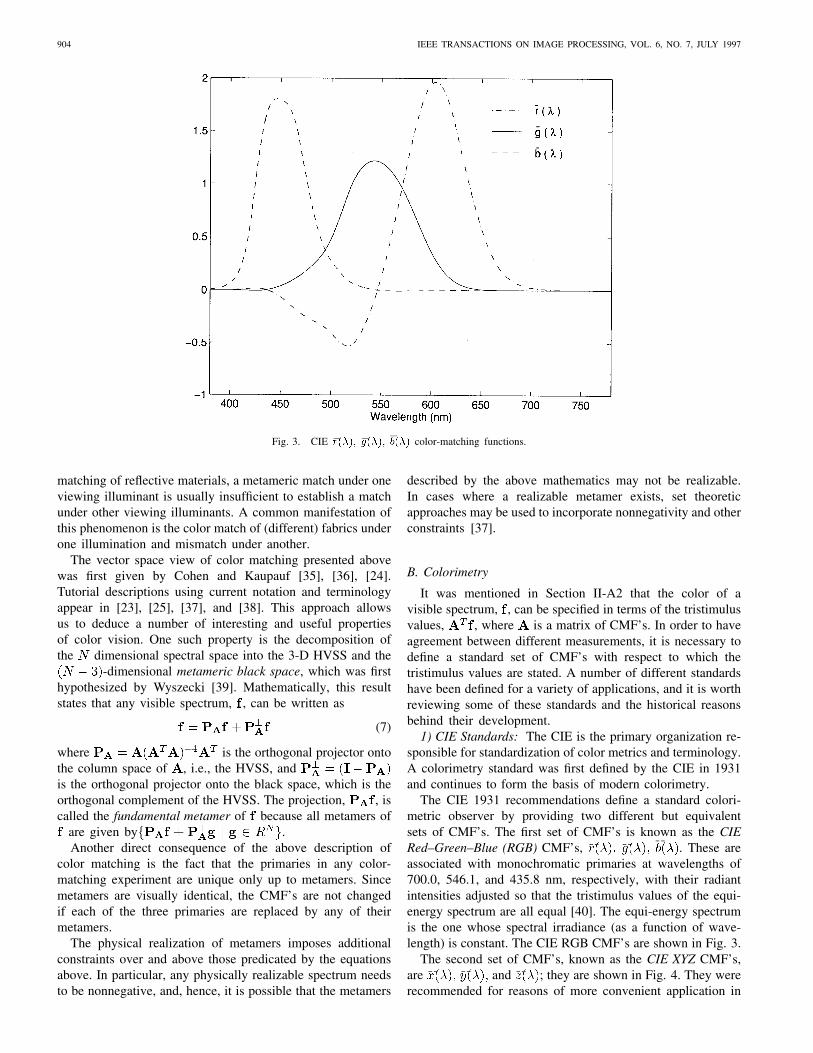
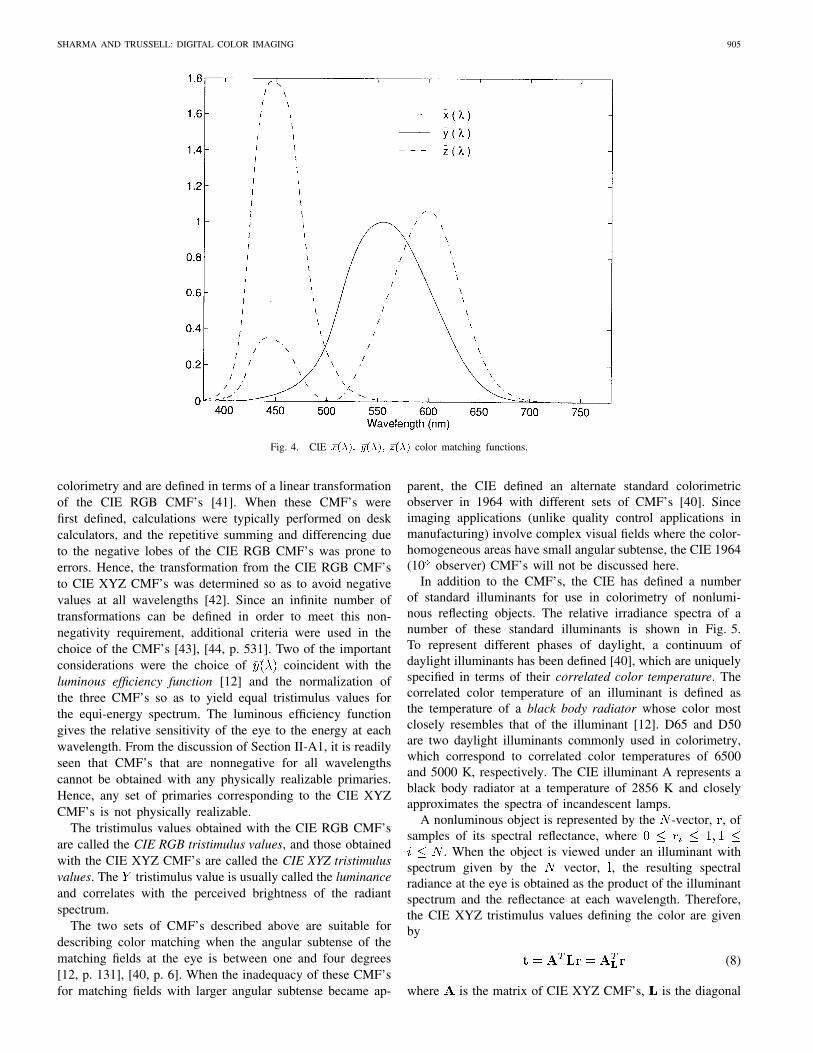
The second set of CMF’s, known as the CIE XYZ CMF’s,are and ; they are shown in Fig. 4. They wererecommended for reasons of more convenient application in
SHARMA AND TRUSSELL: DIGITAL COLOR IMAGING 905
Fig. 4. CIE �x(�); �y(�); �z(�) color matching functions.
colorimetry and are defined in terms of a linear transformationof the CIE RGB CMF’s [41]. When these CMF’s werefirst defined, calculations were typically performed on deskcalculators, and the repetitive summing and differencing dueto the negative lobes of the CIE RGB CMF’s was prone toerrors. Hence, the transformation from the CIE RGB CMF’sto CIE XYZ CMF’s was determined so as to avoid negativevalues at all wavelengths [42]. Since an infinite number oftransformations can be defined in order to meet this non-negativity requirement, additional criteria were used in thechoice of the CMF’s [43], [44, p. 531]. Two of the importantconsiderations were the choice of coincident with theluminous efficiency function [12] and the normalization ofthe three CMF’s so as to yield equal tristimulus values forthe equi-energy spectrum. The luminous efficiency functiongives the relative sensitivity of the eye to the energy at eachwavelength. From the discussion of Section II-A1, it is readilyseen that CMF’s that are nonnegative for all wavelengthscannot be obtained with any physically realizable primaries.Hence, any set of primaries corresponding to the CIE XYZCMF’s is not physically realizable.
The tristimulus values obtained with the CIE RGB CMF’sare called the CIE RGB tristimulus values, and those obtainedwith the CIE XYZ CMF’s are called the CIE XYZ tristimulusvalues. The tristimulus value is usually called the luminanceand correlates with the perceived brightness of the radiantspectrum.
The two sets of CMF’s described above are suitable fordescribing color matching when the angular subtense of thematching fields at the eye is between one and four degrees[12, p. 131], [40, p. 6]. When the inadequacy of these CMF’sfor matching fields with larger angular subtense became ap-
parent, the CIE defined an alternate standard colorimetricobserver in 1964 with different sets of CMF’s [40]. Sinceimaging applications (unlike quality control applications inmanufacturing) involve complex visual fields where the color-homogeneous areas have small angular subtense, the CIE 1964(10 observer) CMF’s will not be discussed here.
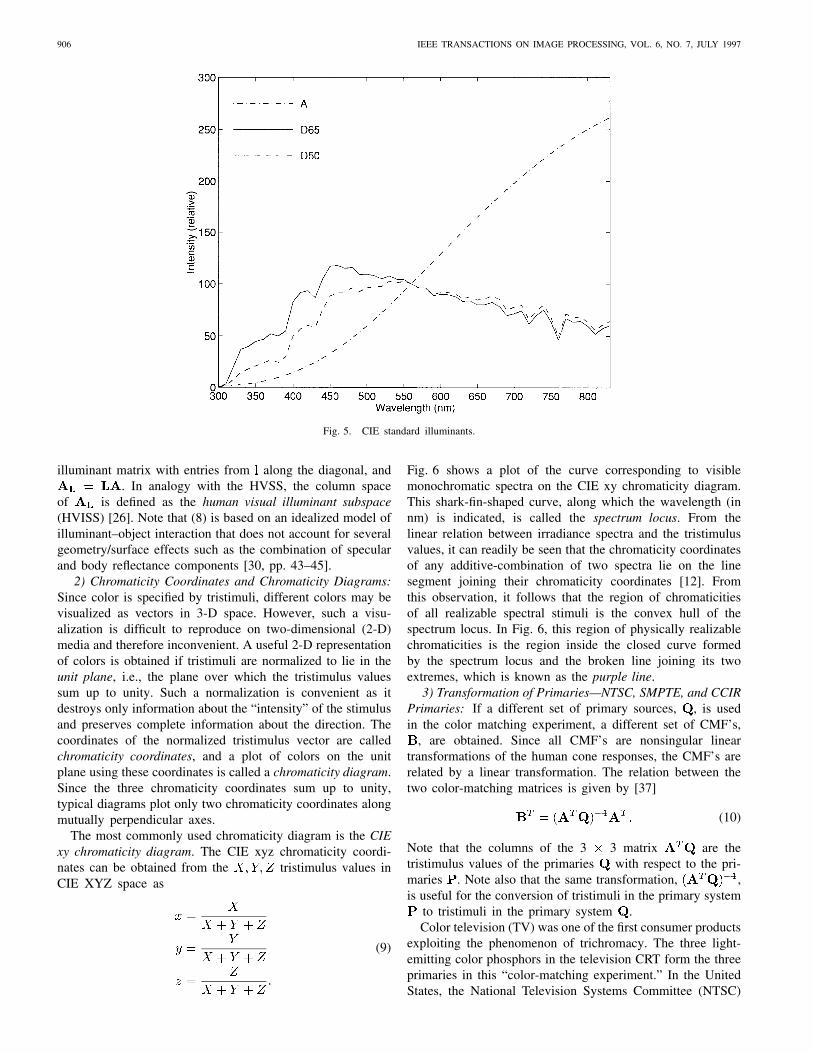
In addition to the CMF’s, the CIE has defined a numberof standard illuminants for use in colorimetry of nonlumi-nous reflecting objects. The relative irradiance spectra of anumber of these standard illuminants is shown in Fig. 5.To represent different phases of daylight, a continuum ofdaylight illuminants has been defined [40], which are uniquelyspecified in terms of their correlated color temperature. Thecorrelated color temperature of an illuminant is defined asthe temperature of a black body radiator whose color mostclosely resembles that of the illuminant [12]. D65 and D50are two daylight illuminants commonly used in colorimetry,which correspond to correlated color temperatures of 6500and 5000 K, respectively. The CIE illuminant A represents ablack body radiator at a temperature of 2856 K and closelyapproximates the spectra of incandescent lamps.
A nonluminous object is represented by the -vector, , ofsamples of its spectral reflectance, where
. When the object is viewed under an illuminant withspectrum given by the vector, , the resulting spectralradiance at the eye is obtained as the product of the illuminantspectrum and the reflectance at each wavelength. Therefore,the CIE XYZ tristimulus values defining the color are givenby
(8)
where is the matrix of CIE XYZ CMF’s, is the diagonal
906 IEEE TRANSACTIONS ON IMAGE PROCESSING, VOL. 6, NO. 7, JULY 1997
Fig. 5. CIE standard illuminants.
illuminant matrix with entries from along the diagonal, and. In analogy with the HVSS, the column space
of is defined as the human visual illuminant subspace(HVISS) [26]. Note that (8) is based on an idealized model ofilluminant–object interaction that does not account for severalgeometry/surface effects such as the combination of specularand body reflectance components [30, pp. 43–45].
2) Chromaticity Coordinates and Chromaticity Diagrams:Since color is specified by tristimuli, different colors may bevisualized as vectors in 3-D space. However, such a visu-alization is difficult to reproduce on two-dimensional (2-D)media and therefore inconvenient. A useful 2-D representationof colors is obtained if tristimuli are normalized to lie in theunit plane, i.e., the plane over which the tristimulus valuessum up to unity. Such a normalization is convenient as itdestroys only information about the “intensity” of the stimulusand preserves complete information about the direction. Thecoordinates of the normalized tristimulus vector are calledchromaticity coordinates, and a plot of colors on the unitplane using these coordinates is called a chromaticity diagram.Since the three chromaticity coordinates sum up to unity,typical diagrams plot only two chromaticity coordinates alongmutually perpendicular axes.
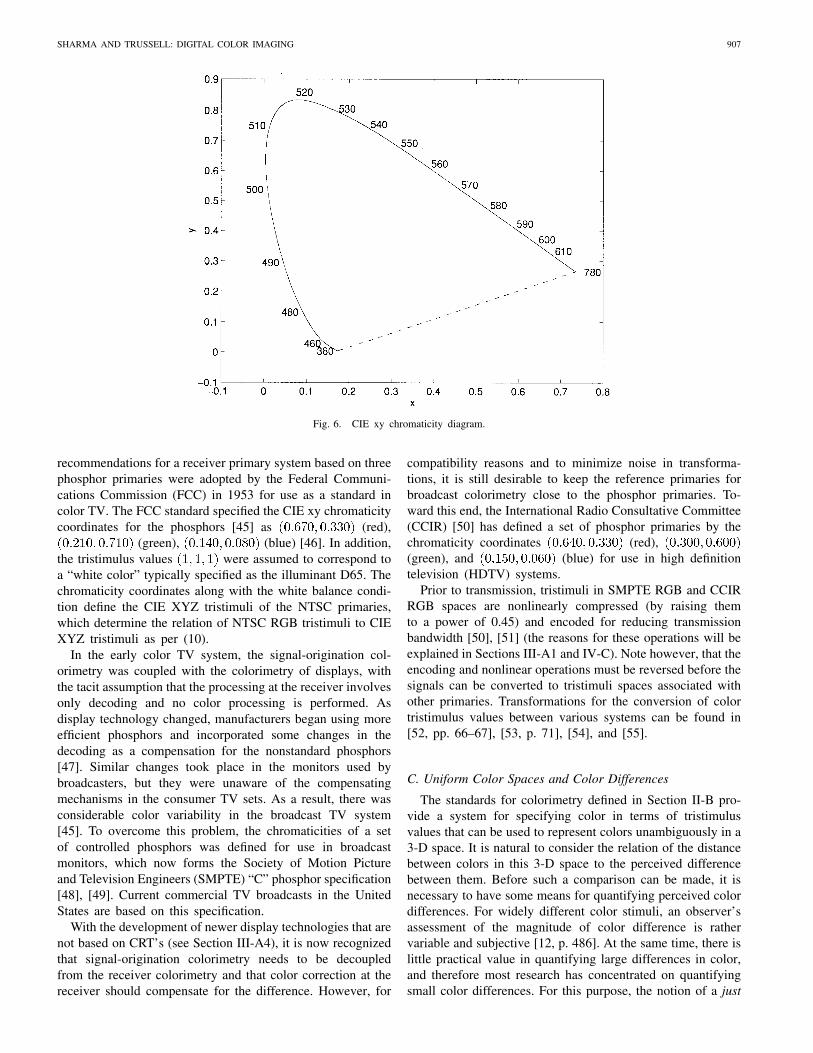
The most commonly used chromaticity diagram is the CIExy chromaticity diagram. The CIE xyz chromaticity coordi-nates can be obtained from the tristimulus values inCIE XYZ space as
(9)
Fig. 6 shows a plot of the curve corresponding to visiblemonochromatic spectra on the CIE xy chromaticity diagram.This shark-fin-shaped curve, along which the wavelength (innm) is indicated, is called the spectrum locus. From thelinear relation between irradiance spectra and the tristimulusvalues, it can readily be seen that the chromaticity coordinatesof any additive-combination of two spectra lie on the linesegment joining their chromaticity coordinates [12]. Fromthis observation, it follows that the region of chromaticitiesof all realizable spectral stimuli is the convex hull of thespectrum locus. In Fig. 6, this region of physically realizablechromaticities is the region inside the closed curve formedby the spectrum locus and the broken line joining its twoextremes, which is known as the purple line.
3) Transformation of Primaries—NTSC, SMPTE, and CCIRPrimaries: If a different set of primary sources, , is usedin the color matching experiment, a different set of CMF’s,
, are obtained. Since all CMF’s are nonsingular lineartransformations of the human cone responses, the CMF’s arerelated by a linear transformation. The relation between thetwo color-matching matrices is given by [37]
(10)
Note that the columns of the 3 3 matrix are thetristimulus values of the primaries with respect to the pri-maries . Note also that the same transformation, ,is useful for the conversion of tristimuli in the primary system
to tristimuli in the primary system .Color television (TV) was one of the first consumer products
exploiting the phenomenon of trichromacy. The three light-emitting color phosphors in the television CRT form the threeprimaries in this “color-matching experiment.” In the UnitedStates, the National Television Systems Committee (NTSC)
SHARMA AND TRUSSELL: DIGITAL COLOR IMAGING 907
Fig. 6. CIE xy chromaticity diagram.
recommendations for a receiver primary system based on threephosphor primaries were adopted by the Federal Communi-cations Commission (FCC) in 1953 for use as a standard incolor TV. The FCC standard specified the CIE xy chromaticitycoordinates for the phosphors [45] as (red),
(green), (blue) [46]. In addition,the tristimulus values were assumed to correspond toa “white color” typically specified as the illuminant D65. Thechromaticity coordinates along with the white balance condi-tion define the CIE XYZ tristimuli of the NTSC primaries,which determine the relation of NTSC RGB tristimuli to CIEXYZ tristimuli as per (10).
In the early color TV system, the signal-origination col-orimetry was coupled with the colorimetry of displays, withthe tacit assumption that the processing at the receiver involvesonly decoding and no color processing is performed. Asdisplay technology changed, manufacturers began using moreefficient phosphors and incorporated some changes in thedecoding as a compensation for the nonstandard phosphors[47]. Similar changes took place in the monitors used bybroadcasters, but they were unaware of the compensatingmechanisms in the consumer TV sets. As a result, there wasconsiderable color variability in the broadcast TV system[45]. To overcome this problem, the chromaticities of a setof controlled phosphors was defined for use in broadcastmonitors, which now forms the Society of Motion Pictureand Television Engineers (SMPTE) “C” phosphor specification[48], [49]. Current commercial TV broadcasts in the UnitedStates are based on this specification.
With the development of newer display technologies that arenot based on CRT’s (see Section III-A4), it is now recognizedthat signal-origination colorimetry needs to be decoupledfrom the receiver colorimetry and that color correction at thereceiver should compensate for the difference. However, for
compatibility reasons and to minimize noise in transforma-tions, it is still desirable to keep the reference primaries forbroadcast colorimetry close to the phosphor primaries. To-ward this end, the International Radio Consultative Committee(CCIR) [50] has defined a set of phosphor primaries by thechromaticity coordinates (red),(green), and (blue) for use in high definitiontelevision (HDTV) systems.
Prior to transmission, tristimuli in SMPTE RGB and CCIRRGB spaces are nonlinearly compressed (by raising themto a power of 0.45) and encoded for reducing transmissionbandwidth [50], [51] (the reasons for these operations will beexplained in Sections III-A1 and IV-C). Note however, that theencoding and nonlinear operations must be reversed before thesignals can be converted to tristimuli spaces associated withother primaries. Transformations for the conversion of colortristimulus values between various systems can be found in[52, pp. 66–67], [53, p. 71], [54], and [55].
C. Uniform Color Spaces and Color Differences
The standards for colorimetry defined in Section II-B pro-vide a system for specifying color in terms of tristimulusvalues that can be used to represent colors unambiguously in a3-D space. It is natural to consider the relation of the distancebetween colors in this 3-D space to the perceived differencebetween them. Before such a comparison can be made, it isnecessary to have some means for quantifying perceived colordifferences. For widely different color stimuli, an observer’sassessment of the magnitude of color difference is rathervariable and subjective [12, p. 486]. At the same time, there islittle practical value in quantifying large differences in color,and therefore most research has concentrated on quantifyingsmall color differences. For this purpose, the notion of a just
908 IEEE TRANSACTIONS ON IMAGE PROCESSING, VOL. 6, NO. 7, JULY 1997
noticeable difference (JND) in stimuli has been extensivelyused as a unit by color scientists. An alternate empiricallyderived system, which has also been used often, is the Munsellcolor system [56], [57]. In the Munsell system, all possiblecolors are defined in terms of the perceptual attributes oflightness, hue, and chroma; and associated Munsell book(s)of color contain reflective samples, which (when viewedunder daylight), are spaced apart in perceptually equal stepsof these attributes [12]. Lightness, hue, chroma, and otherterms of color perception will be used in this paper inaccordance with common terminology, but a definition willnot be attempted here because of their subjective nature.Definitions are, however, provided in [12, p. 487], [58], [59],and [60].
Several researchers have examined the distribution of JNDcolors in CIE xy chromaticity and CIE XYZ tristimuli spacesand have found that it varies widely over the color space[61]–[65]. Hence, the CIE XYZ space is perceptually nonuni-form in that equal perceptual differences between colors do notcorrespond to equal distances in the tristimulus space. Sinceperceptual uniformity is an extremely desirable feature fordefining tolerances in color reproduction systems, considerableresearch has been directed toward the development of uniformcolor spaces. Traditionally, the problem has been decomposedinto two sub-problems: i) one of determining a uniformlightness scale, and ii) the other of determining a uniformchromaticity diagram for equilightness color stimuli. Thetwo are then combined with suitable scaling factors for thechromaticity scale and the lightness scale to make their unitscorrespond to the same factor of a JND.
The historical milestones in the search for uniform bright-ness and lightness scales are described in Wyszecki and Stiles[12, pp. 493–499]. Typical experiments determine these scaleseither by a process of repeated bisection of the scale extremesor by moving up in increments of a JND. A cube-root powerlaw relation between brightness and luminance provides asatisfactory fit for most experimental data and, therefore, hasthe most widespread acceptance at present [12, p. 494].
The search for a uniform lightness scale was complementedby efforts toward determination of a uniform chromaticity scalefor constant lightness. Two of these attempts are noteworthy.The first determined a linear transformation of the tristimulusspace that yielded a chromaticity diagram with JND colorsbeing roughly equispaced [66], [67]. This was the precursorof the CIE 1960 u, v diagram [12, p. 503]. The secondwas primarily motivated by the Munsell system and used anonlinear transformation of the CIE XYZ tristimuli to obtaina chromatic-value diagram in which the distances of Munsellcolors of equal lightness would be in proportion to theirhue and chroma differences [68]. The form for the nonlineartransformation was based on a color vision model proposedearlier by Adams [69], and the diagram is therefore referredto as Adams’ chromatic-value diagram.
Based on the aforementioned research, the CIE has recom-mended two uniform color spaces for practical applications:the CIE 1976 (CIELUV) space and the CIE 1976
(CIELAB) space [40]. These spaces are defined interms of transformations from CIE XYZ tristimuli into these
spaces. Both spaces employ a common lightness scale, , thatdepends only on the luminance value . The lightness scaleis combined with different uniform chromaticity diagrams toobtain a 3-D uniform color space. For the CIELUV space,a later version of CIE 1960 u, v diagram is used whereasCIELAB uses a modification of Adams’ chromatic-value dia-gram [12, p. 503]. In either case, the transformations includea normalization involving the tristimuli of a white stimulus,which provides a crude approximation to the eye’s adaptation (see Section II-D1). Euclidean distances in either space providea color-difference formula for evaluating color differences inperceptually relevant units.
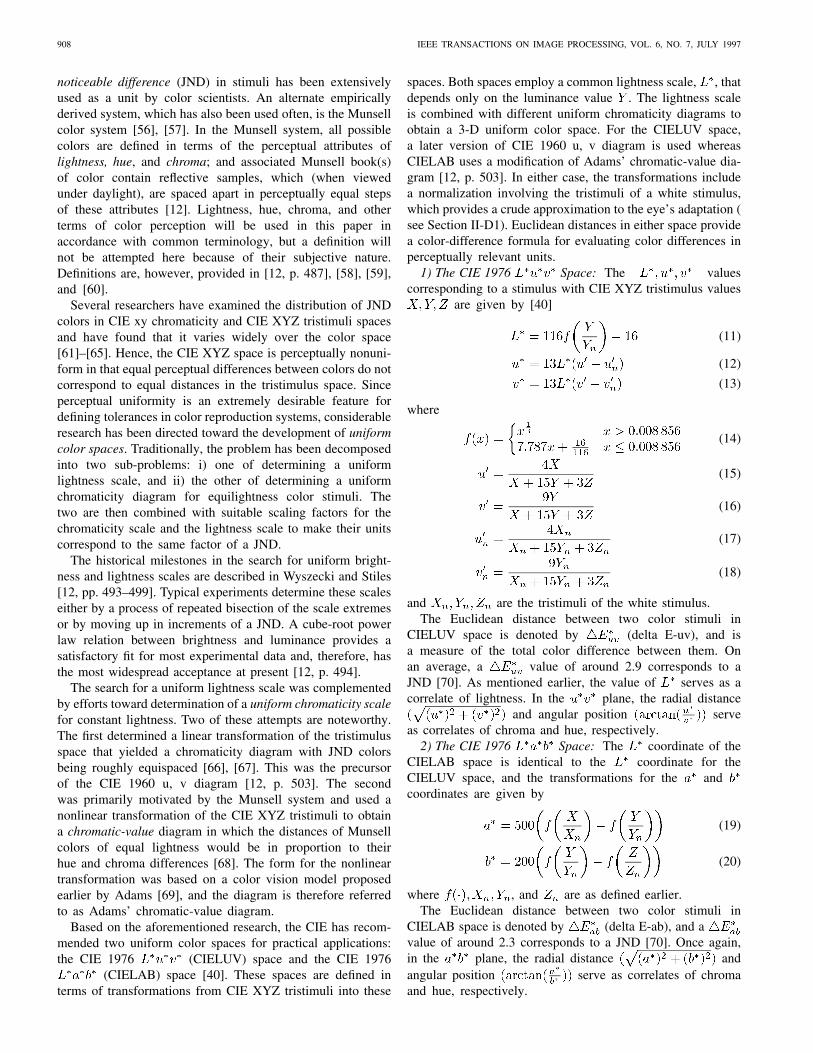
1) The CIE 1976 Space: The valuescorresponding to a stimulus with CIE XYZ tristimulus values
are given by [40]
(11)
(12)
(13)
where
(14)
(15)
(16)
(17)
(18)
and are the tristimuli of the white stimulus.The Euclidean distance between two color stimuli in
CIELUV space is denoted by (delta E-uv), and isa measure of the total color difference between them. Onan average, a value of around 2.9 corresponds to aJND [70]. As mentioned earlier, the value of serves as acorrelate of lightness. In the plane, the radial distance
and angular position serveas correlates of chroma and hue, respectively.
2) The CIE 1976 Space: The coordinate of theCIELAB space is identical to the coordinate for theCIELUV space, and the transformations for the andcoordinates are given by
(19)
(20)
where , and are as defined earlier.The Euclidean distance between two color stimuli in
CIELAB space is denoted by (delta E-ab), and avalue of around 2.3 corresponds to a JND [70]. Once again,in the plane, the radial distance andangular position serve as correlates of chromaand hue, respectively.
SHARMA AND TRUSSELL: DIGITAL COLOR IMAGING 909
2) Other Color Difference Formulae: As may be expected,the CIELUV and CIELAB color spaces are only approximatelyuniform and are often inadequate for specific applications.The uniformity of CIELAB and CIELUV is about the same,but the largest departures from uniformity occur in differentregions of the color space [71]–[73]. Several other uniformcolor spaces and color difference formulae have been proposedsince the acceptance of the CIE standards. Since CIELAB hasgained wide acceptance as a standard, most of the differenceformulae attempt to use alternate (non-Euclidean) “distancemeasures”1 in the CIELAB space. Prominent among these arethe CMC (l:c) distance function based on the CIELAB space[74] and the BFD (l:c) function [75], [76]. A comparisonof these and other uniform color spaces using perceptibilityand acceptability criteria appears in [70]. In image processingapplications involving color, the CIELAB and CIELUV spaceshave been used extensively, whereas in industrial color controlapplications the CMC formulae have found wider acceptance.Recently [77], the CIE issued a new recommendation forthe computation of color differences in CIELAB space thatincorporates several of the robust and attractive features ofthe CMC (l:c) distance function.
D. Psychophysical Phenomena and Color Appearance Models
The human visual system as a whole displays considerableadaptation. It is estimated that the total intensity range overwhich colors can be sensed is around 10 : 1. While thecones themselves respond only over a 1000 : 1 intensity range,the vast total operating range is achieved by adjustment oftheir sensitivity to light as a function of the incident photonflux [78]. This adjustment is believed to be largely achievedthrough a feedback from the neuronal layers that providetemporal lowpass filtering and adjust the cones output asa function of average illumination. A small fraction of theadaptation corresponding to a factor of around 8 : 1 is the resultof a 4 : 1 change in the diameter of the pupil that acts as theaperture of the eye [60, p. 23].
Another fascinating aspect of human vision is the invarianceof object colors under lights with widely varying intensitylevels and spectral distributions. Thus objects are often rec-ognized as having approximately the same color in phasesof daylight having considerable difference in their spectralpower distribution and also under artificial illumination. Thisphenomenon is called color constancy. The term chromaticadaptation is used to describe the changes in the visual systemthat relate to this and other psychophysical phenomena.
While colorimetry provides a representation of colors interms of three independent variables, it was realized earlyon that humans perceive color as having four distinct huescorresponding to the perceptually unique sensations of red,green, yellow, and blue. Thus, while yellow can be producedby the additive combination of red and green, it is clearlyperceived as being qualitatively different from each of the twocomponents. Hering [79] had considerable success in explain-ing color perception in terms of an opponent-colors theory,
1 Note several of these distance measures are asymmetric and as such donot satisfy the mathematical requirements for a metric [22, p. 91].
which assumed the existence of neural signals of oppositekinds with the red–green hues forming one opponent pair andthe yellow–blue hues constituting the other. Such a theory alsosatisfactorily explains both the existence of some intermediatehues (such as red–yellow, yellow–green, green–blue, andblue–red) and the absence of other intermediate hues (suchas reddish-greens and yellowish-blues).
Initially, the trichromatic theory and the opponent-colorstheory were considered competitors for explaining color vi-sion. However, neither one by itself was capable of givingsatisfactory explanations of several important color visionphenomena. In more recent years, these competing theorieshave been combined in the form of zone theories of colorvision, which assume that there are two separate but sequentialzones in which these theories apply. Thus, in these theoriesit is postulated that the retinal color sensing mechanism istrichromatic, but an opponent-color encoding is employedin the neural pathways carrying the retinal responses to thebrain. These theories of color vision have formed the basisof a number of color appearance models that attempt toexplain psychophysical phenomena. Typically in the inter-ests of simplicity, these models follow the theories onlyapproximately and involve empirically determined parameters.The simplicity, however, allows their practical use in colorreproduction applications involving different media wherea perceptual match is more desirable and relevant than acolorimetric match.
A somewhat different but widely publicized color visiontheory was the retinex (from retina and cortex) theory ofEdwin Land [80], [81]. Through a series of experiments, Landdemonstrated that integrated broadband reflectances in red,green, and blue channels show a much stronger correlationwith perceived color than the actual spectral composition ofradiant light incident at the eye. He further postulated that thehuman visual system is able to infer the broadband reflectancesfrom a scene through a successive comparison of spatiallyneighboring areas. As a model of human color perception, theretinex theory has received only limited attention in recentliterature, and has been largely superseded by other theoriesthat explain a wider range of psychophysical effects. However,a computational version of the theory has recently been used,with moderate success, in the enhancement of color images[82], [83].
One may note here that some of the uniform color spacesinclude some aspects of color constancy and color appear-ance in their definitions. In particular, both the CIELAB andCIELUV spaces employ an opponent-color encoding and usewhite-point normalizations that partly explain color constancy.However, the notion of a color appearance model is distinctfrom that of a uniform color space. Typical uniform colorspaces are useful only for comparing stimuli under similarconditions of adaptation and can yield incorrect results if usedfor comparing stimuli under different adaptation conditions.
1) Chromatic Adaptation and Color Constancy: Severalmechanisms of chromatic adaptation have been proposedto explain the phenomenon of color constancy. Perhapsthe most widely used of these in imaging applications isone proposed by Von Kries [84]. He hypothesized that the
910 IEEE TRANSACTIONS ON IMAGE PROCESSING, VOL. 6, NO. 7, JULY 1997
chromatic adaptation is achieved through individual adaptivegain control on each of the three cone responses. Thus, insteadof (2), a more complete model represents the cone responses as
(21)
where is a diagonal matrix corresponding to the gains of thethree channels, and the other terms are as before. The gains ofthe three channels depend on the state of adaptation of the eye,which is determined by preexposed stimuli and the surround,but independent of the test stimulus . This is known as theVon Kries coefficient rule.
The term asymmetric-matching is used to describe matchingof color stimuli under different adaptation conditions. Usingthe Von Kries coefficient rule, two radiant spectra, and ,viewed under adaptation conditions specified by the diagonalmatrices, and , respectively, will match if
(22)
Thus, under the Von Kries coefficient rule, chromatic adapta-tion can be modeled as a diagonal transformation for tristimulispecified in terms of the eye’s cone responses. Usually, tris-timulus values are specified not relative to the cone responsesthemselves, but to CMF’s that are linear transformations of thecone responses. In this case, it can readily be seen [12, p. 432]that the tristimuli of color stimuli that are in an asymmetriccolor match are related by a similarity transformation [85] ofthe diagonal matrix .
A Von Kries transformation is commonly used in colorrendering applications because of its simplicity and is a part ofseveral standards for device-independent color imaging [86],[87]. Typically, the diagonal matrix is determinedby assuming that the cone responses on either side of (22)are identical for white stimuli (usually a perfect reflectorilluminated by the illuminant under consideration). The white-point normalization in CIELAB space was primarily motivatedby such a model. Since the CIE XYZ CMF’s are not per sethe cone responses of the eye, the diagonal transformation rep-resenting the normalization is not a Von Kries transformationand was chosen more for convenience than accuracy [88].
In actual practice, the Von Kries transformation can ex-plain results obtained from psychophysical experiments onlyapproximately [12, pp. 433–451]. At the same time, theconstancy of metameric matches under different adaptationconditions provides strong evidence for the fact that the coneresponse curves vary only in scale while preserving the sameshape [89, p. 15]. Therefore, it seems most likely that partof the adaptation lies in the nonlinear processing of the coneresponses in the neural pathways leading to the brain.
A number of alternatives to the Von Kries adaptationrule have been proposed to obtain better agreement withexperimental observations. Most of these are nonlinear anduse additional information that is often unavailable in imagingapplications. A discussion of these is beyond the scope of thispaper, and the reader is referred to [60, pp. 81, 217], [90]–[92],and [88] for examples of such models.
The phenomenon of color constancy suggests that the hu-man visual system transforms recorded stimuli into representa-tions of the scene reflectance that are (largely) independent of
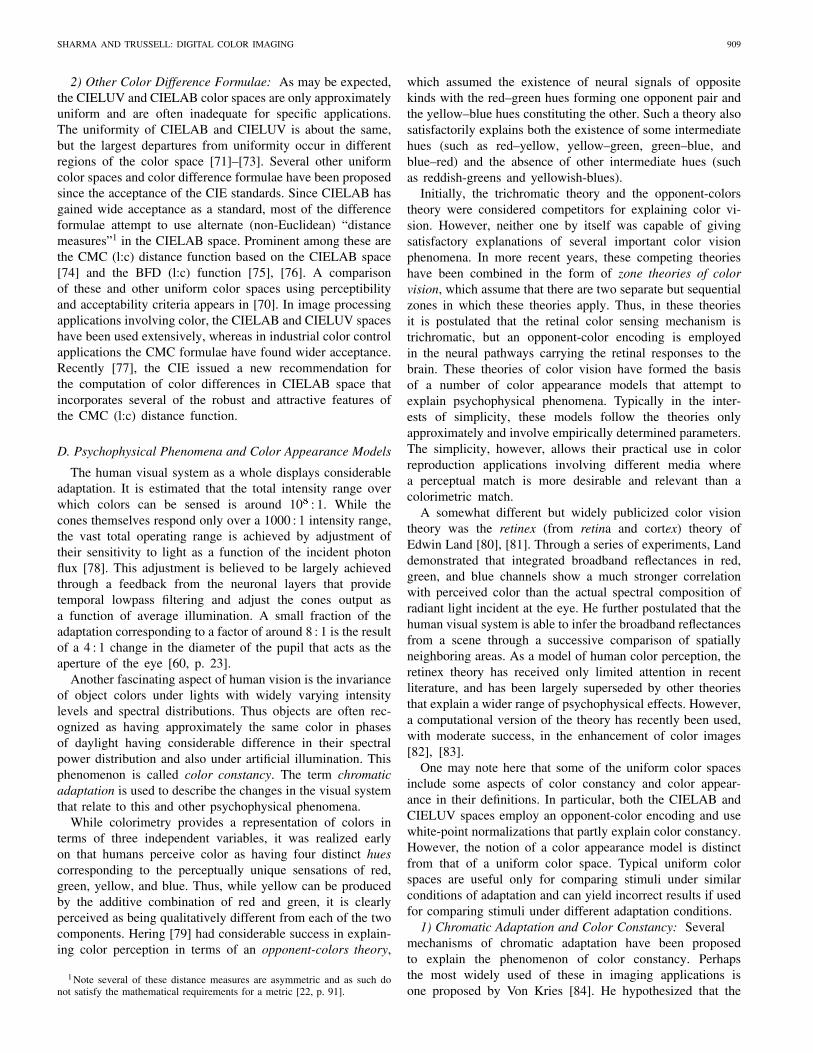
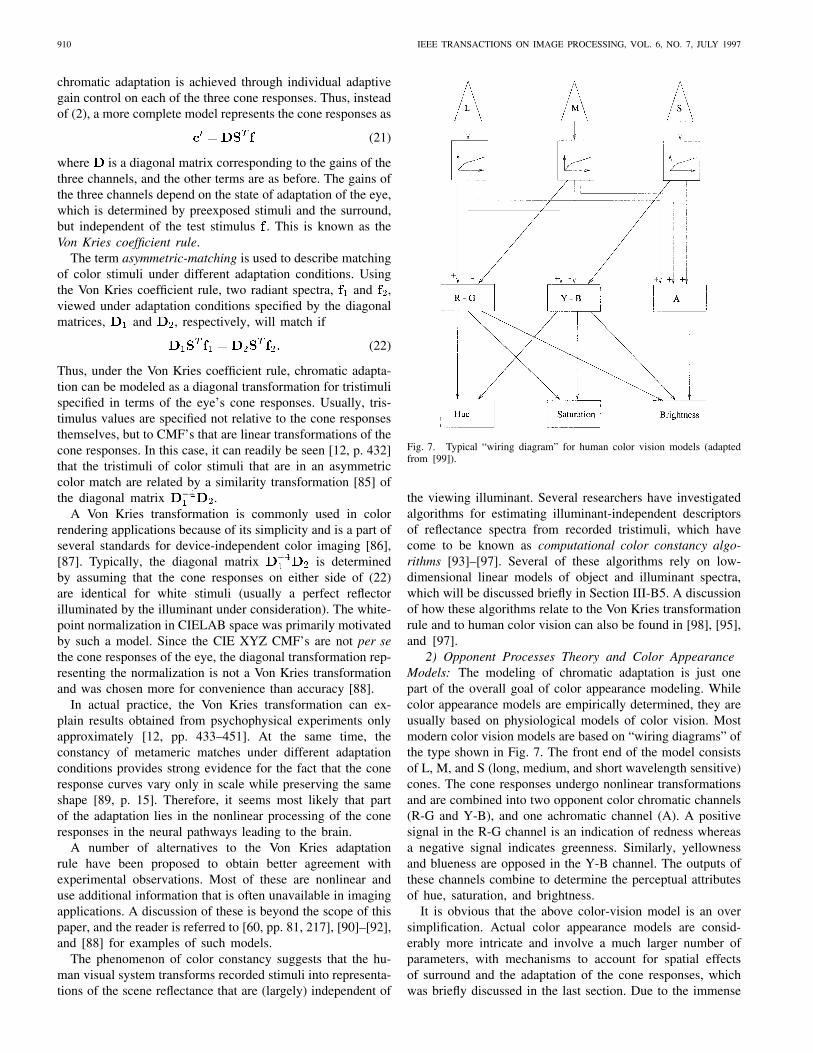
Fig. 7. Typical “wiring diagram” for human color vision models (adaptedfrom [99]).
the viewing illuminant. Several researchers have investigatedalgorithms for estimating illuminant-independent descriptorsof reflectance spectra from recorded tristimuli, which havecome to be known as computational color constancy algo-rithms [93]–[97]. Several of these algorithms rely on low-dimensional linear models of object and illuminant spectra,which will be discussed briefly in Section III-B5. A discussionof how these algorithms relate to the Von Kries transformationrule and to human color vision can also be found in [98], [95],and [97].
2) Opponent Processes Theory and Color AppearanceModels: The modeling of chromatic adaptation is just onepart of the overall goal of color appearance modeling. Whilecolor appearance models are empirically determined, they areusually based on physiological models of color vision. Mostmodern color vision models are based on “wiring diagrams” ofthe type shown in Fig. 7. The front end of the model consistsof L, M, and S (long, medium, and short wavelength sensitive)cones. The cone responses undergo nonlinear transformationsand are combined into two opponent color chromatic channels(R-G and Y-B), and one achromatic channel (A). A positivesignal in the R-G channel is an indication of redness whereasa negative signal indicates greenness. Similarly, yellownessand blueness are opposed in the Y-B channel. The outputs ofthese channels combine to determine the perceptual attributesof hue, saturation, and brightness.
It is obvious that the above color-vision model is an oversimplification. Actual color appearance models are consid-erably more intricate and involve a much larger number ofparameters, with mechanisms to account for spatial effectsof surround and the adaptation of the cone responses, whichwas briefly discussed in the last section. Due to the immense

SHARMA AND TRUSSELL: DIGITAL COLOR IMAGING 911
practical importance of color appearance modeling to colorreproduction systems, there has been considerable research inthis area that cannot be readily summarized here. The inter-ested reader is referred to [60, pp. 213–258] and [100]–[112]for examples of some of the prominent color appearancemodels in current literature. A recent overview of the currentunderstanding of human color vision can also be found in[113].
III. COLOR REPRODUCTION AND RECORDING SYSTEMS
The basics of color discussed in the last section addressedthe issue of specification of a single color stimulus. In practicalsystems, one is usually concerned with the processing ofcolor images with a large number of colors. In the physicalworld, these images exist as spatially varying spectral radianceor reflectance distributions. Color information needs to berecorded from these distributions before any processing canbe attempted. Conversely, the physical realization of colorimages from recorded information requires synthesis of spa-tially varying spectral radiance or reflectance distributions. Inthis section, some of the common color output and inputsystems are surveyed. Output systems are discussed firstbecause color recording systems may also be used to recordcolor reproductions and may exploit the characteristics of thereproduction device.
A. Color Output Systems
Nature provides a variety of mechanisms by which colormay be produced. As many as fifteen distinct physical mech-anisms have been identified that are responsible for color innature [114]. While only a fraction of these mechanisms is suit-able for technological exploitation, there is still considerablediversity in available technologies and devices for displayingand printing color images.
Color output devices can broadly be classified into threetypes: additive, subtractive, and hybrid. Additive color systemsproduce color through the combination of differently coloredlights, known as primaries. The qualifier additive is used tosignify the fact that the final spectrum is the sum (or average)of the spectra of the individual lights, as was assumed inthe discussion of color matching in Section II-A1. Examplesof additive color systems include color CRT displays andprojection video systems. Color in subtractive systems isproduced through a process of removing (subtracting) un-wanted spectral components from “white” light. Typically,such systems produce color on transparent or reflective media,which are illuminated by white light for viewing. Dye subli-mation printers, color photographic prints, and color slides arerepresentatives of the subtractive process. Hybrid systems usea combination of additive and subtractive processes to producecolor. The main use of a hybrid system is in color halftoneprinting, which is commonly used for lithographic printing andin most desktop color printers.
Any practical output system is capable of producing onlya limited range of colors. The range of producible colorson a device is referred to as its gamut. The gamut of adevice is a 3-D object and can be visualized using a 3-D
representation of the color space, such as the colorimetrystandards or uniform color spaces discussed earlier [115],[116]. Often, 2-D representations are more convenient fordisplay, and chromaticity diagrams are used for this purpose.From the linearity of color matching, it can be readily seen thatthe gamut of additive systems in CIE XYZ space (or any ofthe other linear tristimulus spaces) is the convex polyhedronformed by linear combinations of the color tristimuli of theprimaries over the realizable amplitude range. On the CIE xychromaticity diagram, the gamut appears as a convex polygonwith the primaries representing the vertices. For the usual caseof three red, green, and blue primaries, the gamut appears asa triangle on the CIE xy chromaticity diagram. Since mostsubtractive and hybrid systems are nonlinear, their gamutshave irregular shape and are not characterized by such elegantgeometric constructs. One may note here that in order to obtainthe largest possible chromaticity gamut, most three-primaryadditive systems use red, green, and blue colored primaries.For the same reason, cyan, magenta, and yellow primaries areused in subtractive and hybrid systems.
In order to discuss colorimetric reproduction on color outputdevices, it is useful to introduce some terminology. The termcontrol values is used to denote signals that drive a device.The operation of the device can be represented as a multidi-mensional mapping from control values to colors specified ina device-independent color space. This mapping is referred toas the (device) characterization. Since specified colors in adevice-independent color space need to be mapped to devicecontrol values to obtain colorimetric output, it is necessaryto determine the inverse of the multidimensional device-characterization function. In this paper, the term calibrationwill be used for the entire procedure of characterizing a deviceand determining the inverse transformation. If the device’soperation can be accurately represented by a parametric model,the characterization is readily done by determining the modelparameters from a few measurements. If no useful modelexists, a purely empirical approach is necessary, in which thecharacterization function is directly measured over a grid ofdevice control values. The inversion may be performed ina closed form if the characterization uses a device modelthat allows this. If an empirical approach is employed incharacterization or if the model used is noninvertible (oftenthe case with nonlinear models), one has to resort to numericalmethods in the inversion step.
1) Cathode Ray Tubes: The most widely used display de-vice for television and computer monitors is the color CRT.The CRT produces visible light by bombardment of a thinlayer of phosphor material by an energetic beam of electrons.The electron beam causes the phosphor to fluoresce andemit light whose spectral characteristics are governed bythe chemical nature of the phosphor. The most commonlyused color CRT tubes are the shadow-mask type, in whicha mosaic of red, green, and blue light emitting phosphorson a screen is illuminated by three independent electronbeams. The intensity of light emitted by the phosphors isgoverned by the velocity and number of electrons. The beamis scanned across the screen by electrostatic or electromagneticdeflection mechanisms. The number of electrons is modulated
912 IEEE TRANSACTIONS ON IMAGE PROCESSING, VOL. 6, NO. 7, JULY 1997
in synchronism with the scan to obtain spatial variations inthe intensity of the light emitted by the three phosphors. Atnormal viewing distances, the light from the mosaic is spatiallyaveraged by the eye, and the CRT thus forms an additive colorsystem.
There are several design choices in the manufacture ofshadow mask CRT’s. Other competing designs offer improvedresolution by utilizing a layered phosphor instead of a mosaic.The reader is referred to [117] and [118] for a description ofthe different technologies and involved tradeoffs. A detaileddescription of physical principles involved in the operation ofthese devices is provided in [119, pp. 79–200].
Color in CRT displays is controlled through the applicationof different voltages to the red, green, and blue guns. For acomplete colorimetric characterization of these devices, theCIE XYZ tristimulus values (or other tristimuli) need to bespecified as a spatially varying function of the voltages appliedto the three guns. A brute force approach to this problem, usinga multidimensional look-up table, is infeasible because of theextremely large number of measurements required. Hence,simplifying assumptions need to be made in order to makethe problem tractable.
Assumptions of spatial uniformity, gun independence, andphosphor constancy are commonly made in order to simplifyCRT colorimetry [120]. Spatial uniformity implies that thecolor characterization of the CRT does not vary with position.Gun independence refers to the assumption that the threephosphors and their driving mechanisms do not interact. Thisimplies that the incident intensity at the eye when the guns areoperated simultaneously is the sum of the intensities when theguns are operated individually. Phosphor constancy refers tothe assumption that the relative spectral power distribution oflight emitted by the phosphors does not change with drivingvoltage (i.e., at all driving voltages the spectra emitted by aphosphor are scalar multiples of a single spectrum).
With the above three assumptions, the problem of char-acterizing the CRT reduces to a problem of relating theamplitudes of the individual red, green, and blue channels totheir corresponding gun voltages. The problem can be furthersimplified through the use of a parametric model for theoperation of the individual guns. Typically, these models arebased on the exponential relation between the beam currentand grid voltage in vacuum tubes [121], [122]. For each gun,the spectrum of emitted light in response to a control voltage,
, is modeled by an expression of the form ,where is the maximum value of the voltage, is theemitted phosphor spectrum at the maximum voltage, andis the exponential parameter. The exponent, , is commonlyreferred to as the monitor-gamma and is normally around 2.2for most color monitors. Since the above parametric model isonly approximate, several modifications of it have been usedby researchers [123]–[126]. Using the parametric models, CRTmonitors can be readily characterized using a small number ofmeasurements.
In order to produce colorimetric color on a CRT display,the “inverse” of the characterization, i.e., the transformationfrom CIE XYZ tristimuli to the driving voltages for theguns, is required. Since the characterization is on a per-
channel basis, the transformation from CIE XYZ tristimulusvalues can also be determined as a linear transformation,corresponding to a transformation from the CIE primaries tothe phosphor primaries, followed by a one-dimensional (1-D)transformation that is determined by the parametric model usedto represent the operation of the individual electron guns [125].Typically, this operation involves exponentiation to the powerof and is known as gamma-correction. As mentionedin Section II-B3, TV signals are normally gamma correctedbefore transmission. One may note here that quantizationof gamma corrected signals results in wider quantizationintervals at higher amplitudes where the sensitivity of theeye is also lower. Therefore, just like speech companding,gamma correction of color tristimuli prior to quantization in adigital system (or transmission in a limited bandwidth system)reduces the perceptibility of errors and contours in comparisonto a scheme in which no gamma correction is used [73],[127]–[130, p. 393].
For colors that the phosphors are capable of producing,fairly good color reproduction can be obtained on a CRTusing the models mentioned above. Berns et al. [125] reportan accuracy around 0.4 using only eight measurementsfor determining model parameters. However, the gamut ofCRT tubes is limited by the phosphors used, which causessignificant color errors for colors that lie beyond the gamut.This is one of the primary sources of color errors seen inbroadcast TV.
The assumptions of gun independence and phosphor con-stancy have been tested by several researchers and found tohold reasonably well [123], [131], [120], [126]. However,in most CRT monitors for the same driving voltage, thelight intensity is brightest at the center and falls off towardthe edges. The change in luminance over the screen can beas high as 25% [132, p. 104]. Therefore, the assumptionof spatial uniformity does not strictly hold. Since the eye’ssensitivity itself is not uniform over the entire field of viewand because the eye adapts well to the smooth variation inintensity across the screen, the spatial nonuniformity of CRT’sis not too noticeable. An algorithm for correcting for spatialinhomogeneity is discussed in [133].
2) Contone Printers: Continuous tone (“contone”) printersuse subtractive color reproduction to produce color imageson (special) paper or transparent media. Subtractive colorreproduction is achieved by using cyan, magenta, and yel-low colorants in varying concentrations to absorb differentamounts of light in the red, green, and blue spectral regions,respectively. Each colorant absorbs its complimentary colorand transmits the rest of the spectrum. The extent of absorptionis determined by the concentration of the colorant, and the useof different concentrations produces different colors. For anexcellent description of the subtractive process and the reasonsbehind the choice of cyan, magenta, and yellow colorants, thereader is referred to [134, Chap. 3].
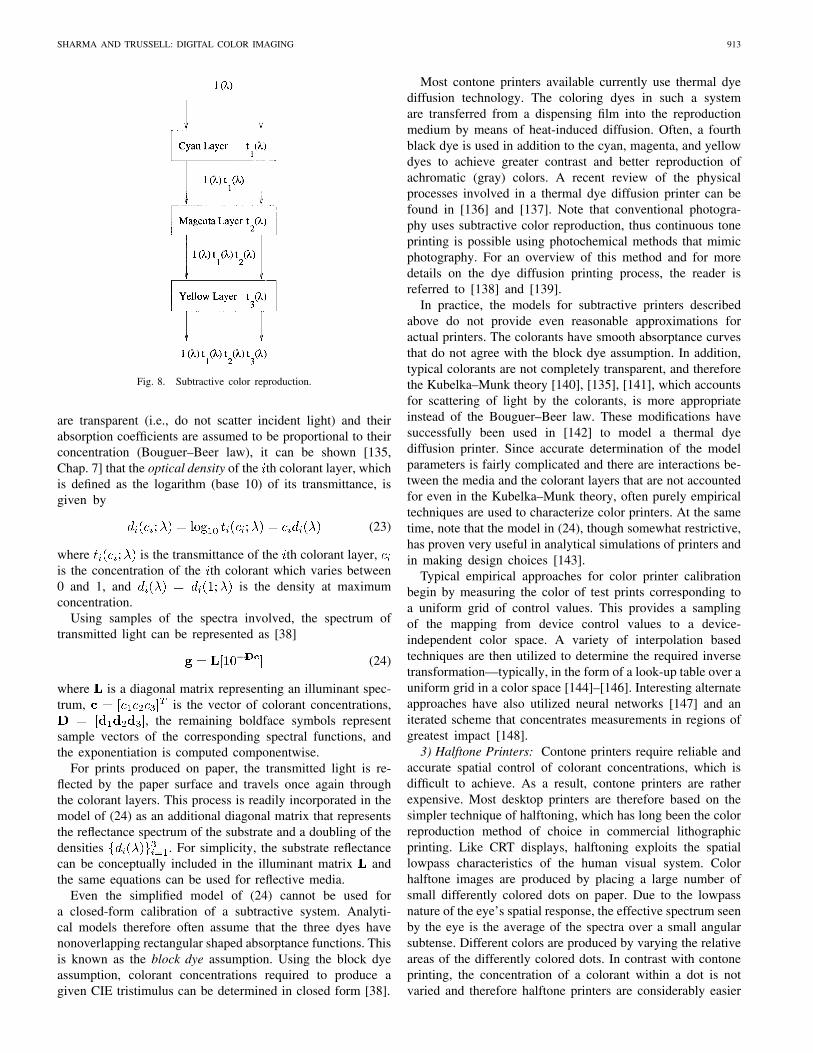
The subtractive principle is schematically shown in Fig. 8for a transmissive system. If the incident light spectrum is
, the spectrum of the light transmitted through the threelayers is given by, , whereis the spectral transmittance of the th layer. If the colorants
SHARMA AND TRUSSELL: DIGITAL COLOR IMAGING 913
Fig. 8. Subtractive color reproduction.
are transparent (i.e., do not scatter incident light) and theirabsorption coefficients are assumed to be proportional to theirconcentration (Bouguer–Beer law), it can be shown [135,Chap. 7] that the optical density of the th colorant layer, whichis defined as the logarithm (base 10) of its transmittance, isgiven by
(23)
where is the transmittance of the th colorant layer,is the concentration of the th colorant which varies between0 and 1, and is the density at maximumconcentration.
Using samples of the spectra involved, the spectrum oftransmitted light can be represented as [38]
(24)
where is a diagonal matrix representing an illuminant spec-trum, is the vector of colorant concentrations,
, the remaining boldface symbols representsample vectors of the corresponding spectral functions, andthe exponentiation is computed componentwise.
For prints produced on paper, the transmitted light is re-flected by the paper surface and travels once again throughthe colorant layers. This process is readily incorporated in themodel of (24) as an additional diagonal matrix that representsthe reflectance spectrum of the substrate and a doubling of thedensities . For simplicity, the substrate reflectancecan be conceptually included in the illuminant matrix andthe same equations can be used for reflective media.
Even the simplified model of (24) cannot be used fora closed-form calibration of a subtractive system. Analyti-cal models therefore often assume that the three dyes havenonoverlapping rectangular shaped absorptance functions. Thisis known as the block dye assumption. Using the block dyeassumption, colorant concentrations required to produce agiven CIE tristimulus can be determined in closed form [38].
Most contone printers available currently use thermal dyediffusion technology. The coloring dyes in such a systemare transferred from a dispensing film into the reproductionmedium by means of heat-induced diffusion. Often, a fourthblack dye is used in addition to the cyan, magenta, and yellowdyes to achieve greater contrast and better reproduction ofachromatic (gray) colors. A recent review of the physicalprocesses involved in a thermal dye diffusion printer can befound in [136] and [137]. Note that conventional photogra-phy uses subtractive color reproduction, thus continuous toneprinting is possible using photochemical methods that mimicphotography. For an overview of this method and for moredetails on the dye diffusion printing process, the reader isreferred to [138] and [139].
In practice, the models for subtractive printers describedabove do not provide even reasonable approximations foractual printers. The colorants have smooth absorptance curvesthat do not agree with the block dye assumption. In addition,typical colorants are not completely transparent, and thereforethe Kubelka–Munk theory [140], [135], [141], which accountsfor scattering of light by the colorants, is more appropriateinstead of the Bouguer–Beer law. These modifications havesuccessfully been used in [142] to model a thermal dyediffusion printer. Since accurate determination of the modelparameters is fairly complicated and there are interactions be-tween the media and the colorant layers that are not accountedfor even in the Kubelka–Munk theory, often purely empiricaltechniques are used to characterize color printers. At the sametime, note that the model in (24), though somewhat restrictive,has proven very useful in analytical simulations of printers andin making design choices [143].
Typical empirical approaches for color printer calibrationbegin by measuring the color of test prints corresponding toa uniform grid of control values. This provides a samplingof the mapping from device control values to a device-independent color space. A variety of interpolation basedtechniques are then utilized to determine the required inversetransformation—typically, in the form of a look-up table over auniform grid in a color space [144]–[146]. Interesting alternateapproaches have also utilized neural networks [147] and aniterated scheme that concentrates measurements in regions ofgreatest impact [148].
3) Halftone Printers: Contone printers require reliable andaccurate spatial control of colorant concentrations, which isdifficult to achieve. As a result, contone printers are ratherexpensive. Most desktop printers are therefore based on thesimpler technique of halftoning, which has long been the colorreproduction method of choice in commercial lithographicprinting. Like CRT displays, halftoning exploits the spatiallowpass characteristics of the human visual system. Colorhalftone images are produced by placing a large number ofsmall differently colored dots on paper. Due to the lowpassnature of the eye’s spatial response, the effective spectrum seenby the eye is the average of the spectra over a small angularsubtense. Different colors are produced by varying the relativeareas of the differently colored dots. In contrast with contoneprinting, the concentration of a colorant within a dot is notvaried and therefore halftone printers are considerably easier
914 IEEE TRANSACTIONS ON IMAGE PROCESSING, VOL. 6, NO. 7, JULY 1997
and cheaper to manufacture. Special processing of imagesis necessary to determine the dot patterns for the differentcolors prior to printing on a halftone printer. This processingis the subject of Section IVB, and only the halftone printingmechanism will be discussed in this section.
In order to obtain a reasonable gamut, most three-inkhalftone systems use cyan, magenta, and yellow colorants forprinting the dots [134, Chap. 3]. Just as in contone printers, afourth black colorant is often introduced to conserve the moreexpensive colorants, reduce ink usage, and produce denserblacks [134, p. 282]. The colorants combine subtractively overthe regions in which they overlap producing up to 2 differentcolors with colorants. These distinct colors are called theNeugebauer primaries after H. E. J. Neugebauer who firstsuggested that halftone reproduction may be viewed as anadditive process involving these primaries [149].
In Neugebauer’s model for halftone printers, the spectralmacroreflectance of a halftoned region can be expressed asthe weighted average of the reflectances of the individualNeugebauer primaries, with the weighting factor of eachprimary given by its relative area. The term macroreflectanceis used to indicate that it is actually an average of an in-homogeneous region of differing (micro)reflectances. Sincethe model is linear in the reflectances of the Neugebauerprimaries, the same weighted average formulation applies tocolors specified in a tristimulus space instead of the spectra.Since the original Neugebauer model used a tristimulus space,recent spectral versions of the statement are referred to asthe spectral Neugebauer model [150]. For a three colorantprinter, Demichel [151] suggested a statistical scheme (as-suming random coverage) for determining the areas of theNeugebauer primaries from the physical printing areas of thethree colorants. As a further simplification, the reflectances ofthe Neugebauer primaries composed of overprints of more thanone colorant may be expressed in terms of the transmittancesof the different colorant layers as was done in the subtractivemodel of (24). However, since this assumption of additivityof densities reduces accuracy, it is usually not invoked.
Prior to the work of Neugebauer, halftone color repro-duction was often confused with subtractive reproduction,and the Neugebauer model therefore offered very significantimprovements [152]. However, the actual halftone process isconsiderably more complicated. Due to the penetration andscattering of light in paper, known as the Yule–Nielsen effect2
[153], [154], the simple Neugebauer model does not performwell in practice. As a result, several empirical modificationshave been suggested for the model. The papers in [155] are anexcellent repository of information on the Neugebauer modeland its modifications. More recently, considerable success hasbeen demonstrated in using a spectral Neugebauer model withempirical corrections for the Yule–Nielsen effect [150], [156].Complete and accurate physical models for the color halftoneprinting process and the Yule–Nielsen effect continue to beelusive, though recent research [157] has yielded encouragingresults.
2 Note that in the printing of the original paper [153], Nielsen’s name wasmisspelled as “Neilsen”. Both spellings have therefore been used in existingliterature.
One obstacle in the direct use of Neugebauer models incharacterizing a halftone printer is that the relation between thecontrol values and the printing area of the different colorantsis usually not known a priori. Hence, an empirical componentis normally required even for characterization schemes usinga model. This empirical component is in the form of 1-D pretransformations of device control values, which oftenserve the additional purpose of increasing characterization-accuracy along the achromatic or neutral gray axis, wherethe eye has significantly greater sensitivity [158]. Purelyempirical schemes similar to those used for characterizingcontone printers can also be used for halftone printers. Themodels mentioned above are nonlinear and nonseparable inthe device control values and cannot be inverted analyti-cally. Hence, for both model-based and empirical schemes,the inversion of the characterization needs to be performednumerically. In either case, the final mapping from requiredcolor tristimuli to device control values is realized as amultidimensional look-up table. The models, however, havean advantage over a purely empirical approach in that theyoffer a significant reduction in the number of measurementsrequired. An interesting generalization of the Neugebauermodel is discussed in [159] and [160], where the model isinterpreted as interpolating between a number of end-pointsspecified by the primaries. Accuracy is improved by usinglocal interpolation over smaller cells, which in turn impliesmore measurements. The generalization, known as the cellularNeugebauer model, thus offers a graceful tradeoff betweenaccuracy and the number of measurements required. Due tothe large number of effects ignored by most models, theycan offer only limited accuracy. Therefore, in graphic arts andprinting industries, where there is greater emphasis on quality,measurement-intensive empirical schemes are often preferred[161]. A comparison of some model-based and measurement-based empirical schemes for electronic imaging applicationscan be found in [162].
Halftone printers have been manufactured using very dif-ferent technologies for printing dots on paper [139, pp. 4–8].The most promising current technologies utilize inkjet, thermaltransfer, and electrophotography to produce the halftone dots.Even a brief mention of the principles and technology of thesedevices is beyond the scope of this paper, and the interestedreader is referred to [138], [163], [139] and [164] for details.
4) Recent Advances in Color Displays and Printing: Theincreasing use of portable computers has fostered consider-able research in displays that overcome the CRT’s problemsof bulk, weight, and high power consumption. Active andpassive color liquid-crystal displays (LCD’s) are already inuse in notebook personal computers, and their use is alsoproposed in wall-mounted displays for HDTV [165]. A numberof other technologies, including color light-emitting diodes(LED’s), electro-luminescent displays, and plasma displays,are also being actively investigated. A description of theirhistorical development, physical principles, and relative meritsand demerits can be found in [118], [119], [166], and [167].Most of them are additive color systems similar to a CRTand use a mosaic of red, green, and blue “dots” to producecolor, though there are also some LCD devices based on the
SHARMA AND TRUSSELL: DIGITAL COLOR IMAGING 915
subtractive principle [165], [167] or on spectrally selectivereflection [168].
A majority of the color display devices mentioned so farrely on the spatial lowpass characteristics of the human eye toproduce different colors using a mosaic of differently coloredregions. An alternative system for producing color, knownas field sequential color (FSC), is based on the temporallowpass nature of the eye’s response. In an FSC system, red,green, and blue image frames are projected in rapid successiononto the viewing screen, and the temporal averaging in theobserver’s eye produces the illusion of a single colored image.An FSC system was originally selected by the FCC for colorTV transmission, but before it could be commercialized itwas replaced by the monochrome-compatible NTSC systemin use today. The primary drawback in such a system wasthe high frame rate and bandwidth requirements [169, pp.218–219]. Recently, there has been a resurgence of interestin FSC systems. An interesting example of a recent FSC sys-tem is Texas Instrument’s digital micromirror device (DMD)[170] that utilizes an array of deformable micromirrors. Inthe deformed state, each micromirror deflects light from anilluminating lamp onto a single picture element (pixel) onthe viewing screen. The duty cycles of the deformation ofdifferent mirrors are modulated to produce image intensityvariations on the screen. Color is produced by placing a colorfilter-wheel between the lamp and the micromirror device andsynchronizing the red, green, and blue frames with the colorwheel. Alternate configurations using three separate DMDdevices or two devices in a five primary projection system havealso been reported [171]. From a color imaging standpoint,DMD displays are rather interesting, as they are almost linearand allow considerable flexibility in the choice of the primariesthrough the use of different color filters in the filter-wheel.
There have also been significant new advances in colorprinting. Color halftone printers have continually improved inresolution, speed, and cost. Some devices now incorporate lim-ited contone capability through a coarse variation in colorantconcentrations. The gamut of printers has also been enlargedby using improved colorants, or more recently, by using morethan three/four inks, which is referred to as high-fidelity (“hi-fi”) printing [172]–[174].
Since most of the devices mentioned above are still in theirinfancy, little information if any is available on the colorcharacterization and performance of these devices. As they findincreased acceptance, there will no doubt be a greater demandfor more accurate color characterization and for reasonablemodels of these devices. This will, therefore, be an active areaof color imaging research in the future.
B. Color Input Systems
In order to process images digitally, the continuous-space,analog, real-world images need to be sampled and quantized.Requirements for the spatial sampling process and the effectsof quantization have been analyzed in considerable detailin signal processing and communications literature and willnot be reiterated here. This section will, instead, look at therequirements of devices that sample spectral information ateach spatial location and attempt to preserve color information.
Fig. 9. Schematic cross section of a typical spectroradiometer.
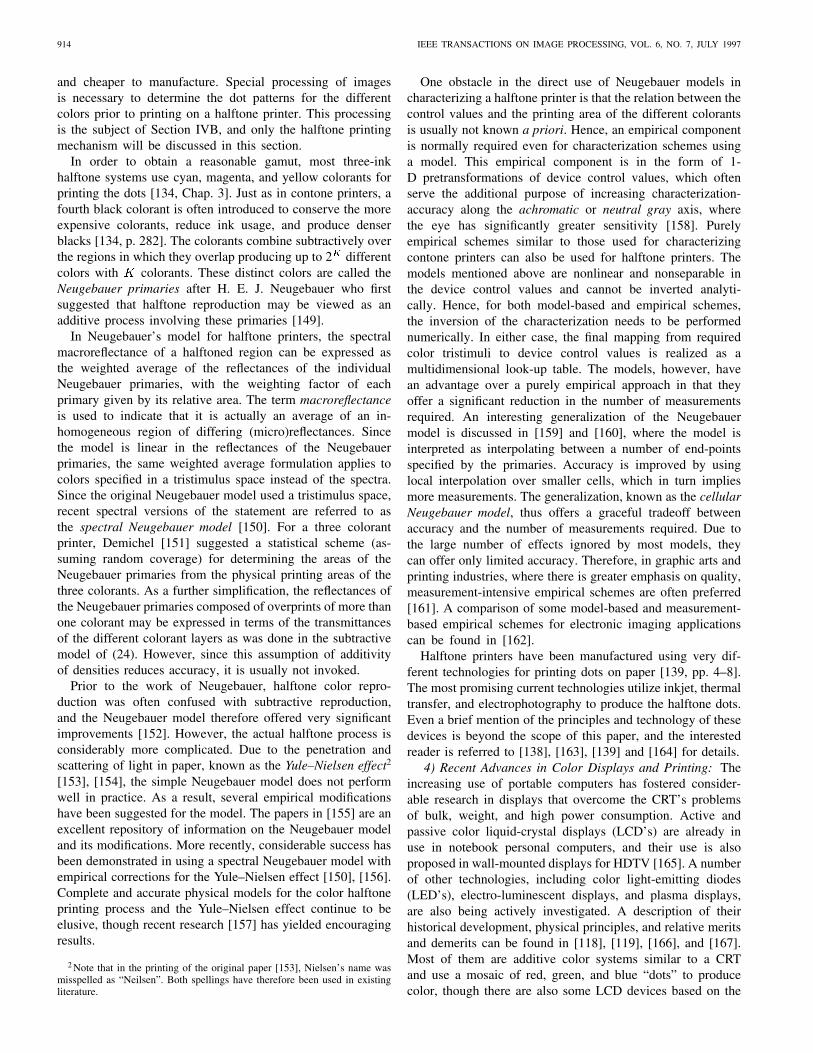
1) Spectroradiometers and Spectrophotometers: Samplingof the spectral distribution provides the most direct andcomplete technique for recording color information. Aspectroradiometer is the fundamental device used to recordthe spectrum. Fig. 9 shows the schematic cross section of aspectroradiometer. The light is collimated by the lens ontoa dispersive element, which decomposes it into its spectrum.The spectrum is then sampled and recorded using eithersingle or multiple detectors. Typically, a diffraction grating isused as the dispersive element because it provides an almostlinear relation between wavelength and displacement in thedetector plane as opposed to an optical prism, for which thecorrespondence is highly nonlinear. The linear relationshipconsiderably simplifies calibration procedures.
Modern spectroradiometers use charge-coupled device(CCD) arrays as the detectors because of their linearcharacteristics. A sampling of the spectrum is achievedautomatically through the placement of physically distinctdetectors in the measurement plane. Since the separationbetween the detectors need not correspond directly to aconvenient wavelength spacing, the detector outputs areusually interpolated to obtain the final spectral samples. Eventhough the CCD’s are almost linear in their response at a givenwavelength, their spectral sensitivity is not uniform. Therefore,a gain compensation procedure is usually necessary to obtaincalibrated output from the device [175, p. 338].
The range and the sampling interval of spectroradiometersvary according to their intended application. Spectroradiome-ters used for color typically report measurements over therange of 360–780 nm and are capable of a spectral resolutionof 1 to 2 nm. This resolution is sufficient for most radiantspectra. However, since some light sources have monochro-matic emission lines in their spectra, a deconvolution of thespectroradiometer measurements may sometimes be necessaryto obtain greater accuracy [27], [28].
An interesting application of spectroradiometry that extendsbeyond the visible spectrum is in multispectral scanners carriedby remote sensing satellites. These scanners disperse radiationinto different spectral bands in much the same way as thespectroradiometers discussed above. Early cameras in thesesatellites used five to 12 spectral bands extending from thevisible into the infrared region [176], [177]. The AirborneVisible Infrared Imaging Spectrometer (AVIRIS) [178], whichsamples the range of 400–2500 nm at 10 nm resolution, is an
916 IEEE TRANSACTIONS ON IMAGE PROCESSING, VOL. 6, NO. 7, JULY 1997
Fig. 10. Spectrophotometer measurement.
example of more recent scanners that use a larger number ofbands.
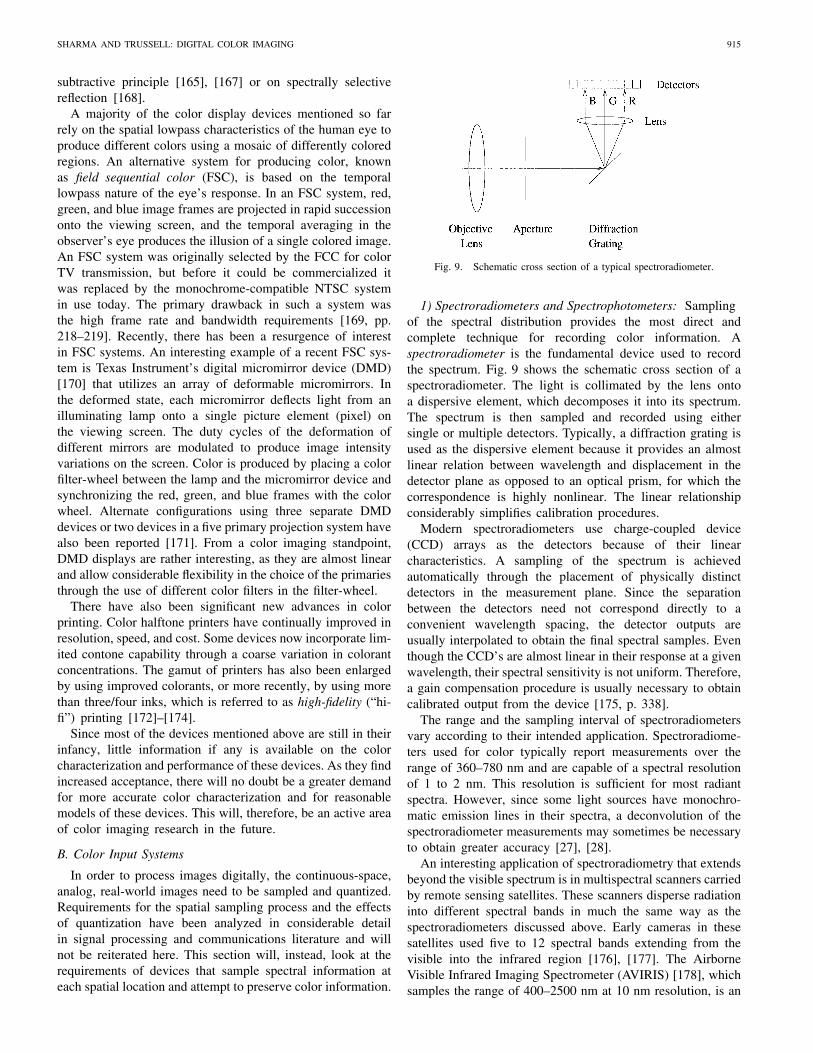
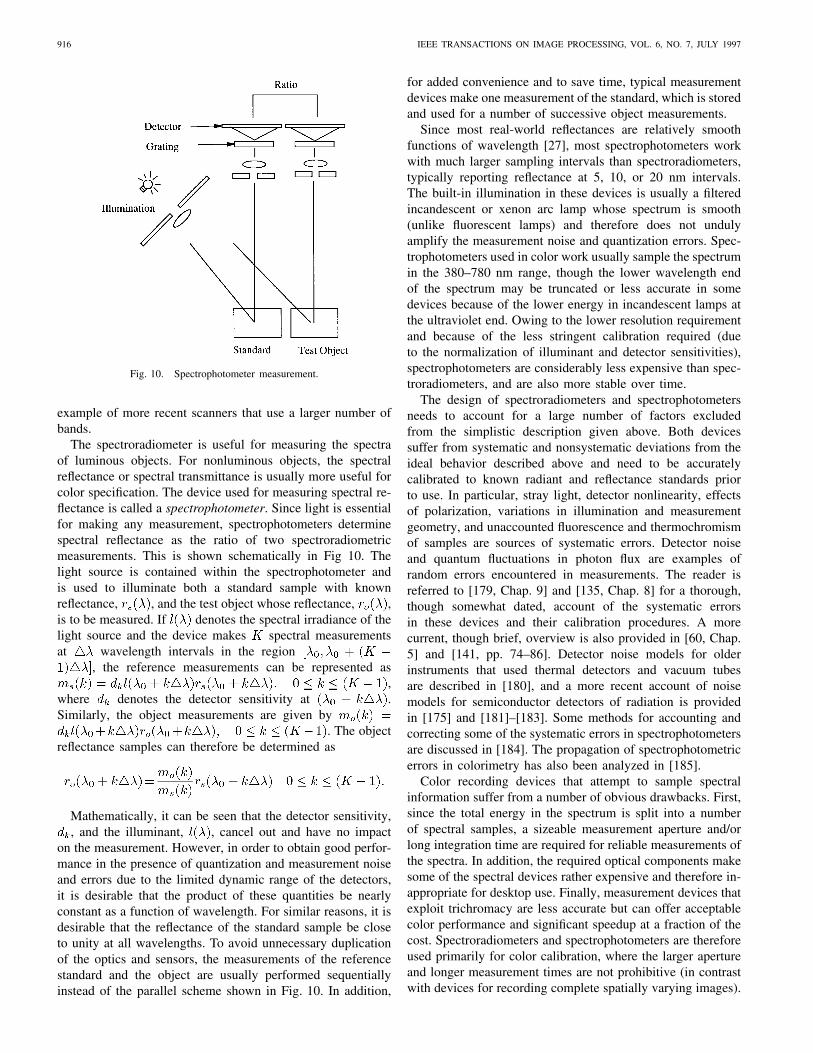
The spectroradiometer is useful for measuring the spectraof luminous objects. For nonluminous objects, the spectralreflectance or spectral transmittance is usually more useful forcolor specification. The device used for measuring spectral re-flectance is called a spectrophotometer. Since light is essentialfor making any measurement, spectrophotometers determinespectral reflectance as the ratio of two spectroradiometricmeasurements. This is shown schematically in Fig 10. Thelight source is contained within the spectrophotometer andis used to illuminate both a standard sample with knownreflectance, , and the test object whose reflectance, ,is to be measured. If denotes the spectral irradiance of thelight source and the device makes spectral measurementsat wavelength intervals in the region
, the reference measurements can be represented as,
where denotes the detector sensitivity at .Similarly, the object measurements are given by
. The objectreflectance samples can therefore be determined as
Mathematically, it can be seen that the detector sensitivity,, and the illuminant, , cancel out and have no impact
on the measurement. However, in order to obtain good perfor-mance in the presence of quantization and measurement noiseand errors due to the limited dynamic range of the detectors,it is desirable that the product of these quantities be nearlyconstant as a function of wavelength. For similar reasons, it isdesirable that the reflectance of the standard sample be closeto unity at all wavelengths. To avoid unnecessary duplicationof the optics and sensors, the measurements of the referencestandard and the object are usually performed sequentiallyinstead of the parallel scheme shown in Fig. 10. In addition,
for added convenience and to save time, typical measurementdevices make one measurement of the standard, which is storedand used for a number of successive object measurements.
Since most real-world reflectances are relatively smoothfunctions of wavelength [27], most spectrophotometers workwith much larger sampling intervals than spectroradiometers,typically reporting reflectance at 5, 10, or 20 nm intervals.The built-in illumination in these devices is usually a filteredincandescent or xenon arc lamp whose spectrum is smooth(unlike fluorescent lamps) and therefore does not undulyamplify the measurement noise and quantization errors. Spec-trophotometers used in color work usually sample the spectrumin the 380–780 nm range, though the lower wavelength endof the spectrum may be truncated or less accurate in somedevices because of the lower energy in incandescent lamps atthe ultraviolet end. Owing to the lower resolution requirementand because of the less stringent calibration required (dueto the normalization of illuminant and detector sensitivities),spectrophotometers are considerably less expensive than spec-troradiometers, and are also more stable over time.
The design of spectroradiometers and spectrophotometersneeds to account for a large number of factors excludedfrom the simplistic description given above. Both devicessuffer from systematic and nonsystematic deviations from theideal behavior described above and need to be accuratelycalibrated to known radiant and reflectance standards priorto use. In particular, stray light, detector nonlinearity, effectsof polarization, variations in illumination and measurementgeometry, and unaccounted fluorescence and thermochromismof samples are sources of systematic errors. Detector noiseand quantum fluctuations in photon flux are examples ofrandom errors encountered in measurements. The reader isreferred to [179, Chap. 9] and [135, Chap. 8] for a thorough,though somewhat dated, account of the systematic errorsin these devices and their calibration procedures. A morecurrent, though brief, overview is also provided in [60, Chap.5] and [141, pp. 74–86]. Detector noise models for olderinstruments that used thermal detectors and vacuum tubesare described in [180], and a more recent account of noisemodels for semiconductor detectors of radiation is providedin [175] and [181]–[183]. Some methods for accounting andcorrecting some of the systematic errors in spectrophotometersare discussed in [184]. The propagation of spectrophotometricerrors in colorimetry has also been analyzed in [185].
Color recording devices that attempt to sample spectralinformation suffer from a number of obvious drawbacks. First,since the total energy in the spectrum is split into a numberof spectral samples, a sizeable measurement aperture and/orlong integration time are required for reliable measurements ofthe spectra. In addition, the required optical components makesome of the spectral devices rather expensive and therefore in-appropriate for desktop use. Finally, measurement devices thatexploit trichromacy are less accurate but can offer acceptablecolor performance and significant speedup at a fraction of thecost. Spectroradiometers and spectrophotometers are thereforeused primarily for color calibration, where the larger apertureand longer measurement times are not prohibitive (in contrastwith devices for recording complete spatially varying images).
SHARMA AND TRUSSELL: DIGITAL COLOR IMAGING 917
2) Photographic Film-Based Recording Schemes:Photograpihic film is not a digital recording device; however,a brief discussion of this medium is worthwhile, as it oftenforms the primary input to many digital color imagingsystems. Film used for color photography records the colorinformation in three spectral bands corresponding roughly tothe red, green, and blue regions of the spectrum.
The image to be recorded is focused by a lens onto thefilm. The film contains three emulsion layers with silver halidecrystals that act as the light sensors and sensitizing dyes thatmake the crystals in the three layers respond to differentspectral regions. Typically, the top layer is blue sensitive,followed by a yellow filter and green- and red-sensitive layers,respectively. The yellow filter keeps blue light from getting tothe lower layers that are also sensitive to blue light. Lightin each of the three spectral bands initiates the formation ofdevelopment centers in the corresponding film layer. Whenthe film is chemically processed, the silver halide crystals atthe development centers are converted into grains of silverand unexposed crystals are removed. The number of grains ofsilver in a given layer at a particular location is determinedby the incident light energy in the image in the correspondingspectral band at that location. Thus, the spatial distribution ofsilver grains in the three layers forms a record of the spatialdistribution of blue, green, and red energy in the image.
The relation between the density of silver grains and theincident light spectrum is highly nonlinear. In addition, theformation of silver grains is not deterministic, and the random-ness in grain formation contributes to noise in the recordingprocess, known as film grain noise. Film grain noise is oftenmodeled as a Poisson or Gaussian random process [186, pp.619–622], [187]–[189] and constitutes multiplicative noise inthe recorded image intensity [52, p. 342].
An image record in the form of three layers of silvergrains is obviously of limited use. Therefore, further chemicalprocessing of the film is necessary. For the purposes of thisdiscussion, it suffices to note that this processing replaces thesilver grains in the red, green, and blue layers with cyan,magenta, and yellow dyes in accordance with the principlesof subtractive color reproduction, which were be discussed inSection III-A2. A more complete description of color pho-tography can be found in [130], and simplified mathematicalmodels for the process are described in [52, pp. 335–339].
As an aside, one may note that prior to the invention ofspectrophotometers and spectroradiometers, two techniqueswere developed to record the spectral information of entire im-ages on (monochromatic) film. In the microdispersion methodof color photography, the light from each small region ofimage was split into its spectral components using dispersiveelements, and the corresponding spectra (of rather small spatialextent) were recorded on film. The second method, known asLippman photography, recorded the color information in theform of a standing wave pattern by using a mercury coatingon the rear of the film as a mirror. Both methods required ex-tremely fine-grain film in order to achieve the high resolutionrequired and long exposure times to compensate for the lowenergy at each spectral wavelength. The reader is referred to[130] for a slightly more detailed account of these techniques.
3) Colorimeters, Cameras, and Scanners: Colorimeters,digital color cameras, and color scanners are color recordingdevices that operate on very similar principles and differ pri-marily only in their intended use. All these devices record colorinformation by transmitting the image through a number ofcolor filters having different spectral transmittances and sam-pling the resulting “colored” images using electronic sensors.
The colorimeter is primarily intended for color calibration orquality control applications and is used to measure the color(typically using the CIE system) of luminous (or externallyilluminated) objects of somewhat larger angular subtense.Thus, these devices do not involve any spatial sampling, haveone sensor per color channel, and make a single average colormeasurement over their aperture. Colorimeters are often usedfor the calibration of color monitors.
Digital color cameras are designed to capture color imagesof real-world objects in much the same way as conventionalcameras, with the difference that the images are recordedelectronically instead of using film. Since the scenes mayinvolve moving objects, they typically have 2-D CCD arraysthat capture the image in a single electronically controlledexposure. Different schemes may be used to achieve thespatial sampling and color filtering operations concurrently.One arrangement uses three CCD arrays with red, green, andblue color filters, respectively. In such an arrangement, precisemechanical and optical alignment is necessary to maintaincorrespondence between the images from the different chan-nels. Often the green channel is offset by half a pixel in thehorizontal direction to increase bandwidth beyond that achiev-able by individual CCD’s [190]. For economy, and in orderto avoid the problems of registering multiple images, anothercommon arrangement uses a color filter mosaic that is overlaidon the CCD array during the semiconductor processing steps.Since the green region of the spectrum is perceptually moresignificant, such mosaics are laid out so as to have green, red,and blue recording pixels in the ratio 2 : 1 : 1 or 3 : 1 : 1 [191].Image restoration techniques are then used to reconstruct thefull images for each of the channels [192]–[194].
Scanners are usually designed for scanning images re-produced on paper or transparencies and include their ownsources of illumination. Since the objects are stationary, thesedevices do not need to capture the entire image in a singleexposure. Typical drum or flatbed moving stage scanners usea single sensor per channel, which is scanned across theimage to provide spatial sampling. The single sensor makesthe characterization of the device easier and more precise, andalso allows the use of more expensive and accurate sensors.For desktop scanners, speed is of greater importance, andtherefore they usually employ an array of three linear CCDsensors with red, green, and blue color filters. The linearsensors extend across one dimension of the scanned image.This allows three filtered channels of the image along a lineto be acquired simultaneously. To sample the entire image,the linear array is moved optically or mechanically across theother dimension of the image. In another variation of thesedevices, three different lamps are used in conjunction with asingle linear CCD array to obtain a three-band image fromthree successive measurements.
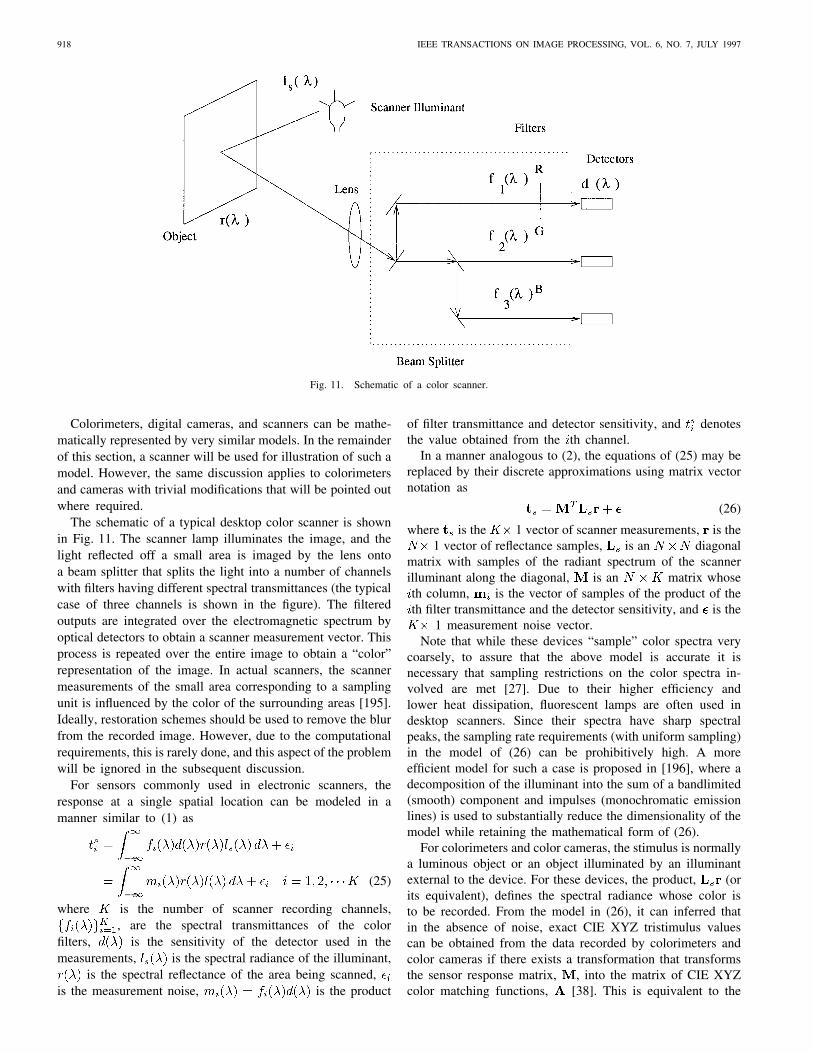
918 IEEE TRANSACTIONS ON IMAGE PROCESSING, VOL. 6, NO. 7, JULY 1997
Fig. 11. Schematic of a color scanner.
Colorimeters, digital cameras, and scanners can be mathe-matically represented by very similar models. In the remainderof this section, a scanner will be used for illustration of such amodel. However, the same discussion applies to colorimetersand cameras with trivial modifications that will be pointed outwhere required.
The schematic of a typical desktop color scanner is shownin Fig. 11. The scanner lamp illuminates the image, and thelight reflected off a small area is imaged by the lens ontoa beam splitter that splits the light into a number of channelswith filters having different spectral transmittances (the typicalcase of three channels is shown in the figure). The filteredoutputs are integrated over the electromagnetic spectrum byoptical detectors to obtain a scanner measurement vector. Thisprocess is repeated over the entire image to obtain a “color”representation of the image. In actual scanners, the scannermeasurements of the small area corresponding to a samplingunit is influenced by the color of the surrounding areas [195].Ideally, restoration schemes should be used to remove the blurfrom the recorded image. However, due to the computationalrequirements, this is rarely done, and this aspect of the problemwill be ignored in the subsequent discussion.
For sensors commonly used in electronic scanners, theresponse at a single spatial location can be modeled in amanner similar to (1) as
(25)
where is the number of scanner recording channels,, are the spectral transmittances of the color
filters, is the sensitivity of the detector used in themeasurements, is the spectral radiance of the illuminant,
is the spectral reflectance of the area being scanned,is the measurement noise, is the product
of filter transmittance and detector sensitivity, and denotesthe value obtained from the th channel.
In a manner analogous to (2), the equations of (25) may bereplaced by their discrete approximations using matrix vectornotation as
(26)
where is the 1 vector of scanner measurements, is the1 vector of reflectance samples, is an diagonal
matrix with samples of the radiant spectrum of the scannerilluminant along the diagonal, is an matrix whoseth column, is the vector of samples of the product of theth filter transmittance and the detector sensitivity, and is the
1 measurement noise vector.Note that while these devices “sample” color spectra very
coarsely, to assure that the above model is accurate it isnecessary that sampling restrictions on the color spectra in-volved are met [27]. Due to their higher efficiency andlower heat dissipation, fluorescent lamps are often used indesktop scanners. Since their spectra have sharp spectralpeaks, the sampling rate requirements (with uniform sampling)in the model of (26) can be prohibitively high. A moreefficient model for such a case is proposed in [196], where adecomposition of the illuminant into the sum of a bandlimited(smooth) component and impulses (monochromatic emissionlines) is used to substantially reduce the dimensionality of themodel while retaining the mathematical form of (26).
For colorimeters and color cameras, the stimulus is normallya luminous object or an object illuminated by an illuminantexternal to the device. For these devices, the product, (orits equivalent), defines the spectral radiance whose color isto be recorded. From the model in (26), it can inferred thatin the absence of noise, exact CIE XYZ tristimulus valuescan be obtained from the data recorded by colorimeters andcolor cameras if there exists a transformation that transformsthe sensor response matrix, , into the matrix of CIE XYZcolor matching functions, [38]. This is equivalent to the
SHARMA AND TRUSSELL: DIGITAL COLOR IMAGING 919
requirement that the HVSS be contained in the sensor visualspace defined as the column space of [26]. For devicesusing three channels, this reduces to the requirement that
be a nonsingular linear transformation of . This facthas been known for some time and is referred to as theLuther–Ives condition [197], [198]. Recent reiterations of thisresult can be found in [199] and [200]. A device that satisfies(generalizations of) the Luther–Ives condition will be said tobe colorimetric.
For color scanners, the analysis is slightly more involvedbecause the illuminant used in the scanner is usually differentfrom the illuminant under which the scanned object is viewedby an observer. Under these conditions, it can be shown thatthe CIE XYZ tristimulus values of the scanned object underthe viewing illuminant can be determined exactly from thenoiseless scanner measurements if the human visual (viewing)illuminant space (HVISS) is contained in the scanner visualspace (SVS) defined as the column space of . Sincethe spectra of fluorescent lamps used in most scanners isquite different from that of the daylight illuminants used incolorimetry, this condition is rarely met in practice. In addition,often color tristimuli under multiple viewing illuminants needto be estimated from a single scan of the image, and theabove criterion would require an inordinately large numberof detectors. In addition to the problems caused by fluorescentlamps, actual colorimeters, cameras, and scanners are subjectto a wide variety of restrictions arising out of economicconsiderations and limitations of the processes and materialsfor manufacturing filters, optical components, and sensors.Techniques from signal processing are therefore useful for theevaluation and design of these devices.
It is the filters, , over which the designer has themost control. A quality measure for evaluating single colorfilters was first proposed by Neugebauer [201]. Recently, thiswas extended to provide a computationally simple measureof goodness for multiple filters in terms of the principalangles between the HVISS and the SVS [26]. The measurewas used for the evaluation and design of color scanningfilters [202], [203]. The same measure was also success-fully applied to the combinatorial problem of selecting anappropriate set of filters for a scanner from given off-the-shelf candidate filters [204]. A minimum-mean-squared error(MMSE) approach, which requires more statistical informationthan purely subspace-based approaches, was introduced in[205], where numerical approaches for minimizing errors inuniform color spaces were also considered. In [206], noisewas included in the analysis, and [207]–[209] emphasized thereduction of perceived color errors in a hybrid device capableof measuring both reflective and emissive objects through theuse of linearized versions of CIELAB space [210]. An alternatenovel approach accounting for noise was proposed in [211],where a filter-set was chosen from the multitude satisfying theLuther–Ives condition so as to minimize the perceptual impactof noise. In [212], a unified treatment encompassing a numberof these approaches is presented, and their performances arecompared.
In actual devices, it is possible to have systematic deviationsfrom the linear model of (26). Sources of error include
fluorescence of samples in scanners, stray light, inclusion ofultraviolet and infrared radiation in the measurements (whichis not accounted for if the visible region of the spectrum is usedin the model), and limited dynamic range of detectors [213].However, if proper precautions are taken, these errors are smalland can be included in the noise process with minimal loss offunctionality [213].
It should also be noted here that the above discussion appliesto a system for recording color where the input spectra arenot constrained to lie in a restricted set. In recording colorinformation from color reproductions that exploit trichromacyand utilize three primaries, the requirements for obtainingprecise color information are much less stringent, and typicallysensors with any three linearly independent channels suffice. Aproof of this result for a system using three additive primaries(whose spectra vary only in amplitude and not in spectralshape) appears in [23]. An example of an application wherethis can be readily seen is the measurement of colors producedon a CRT [214]. Note, however, that the calibration of thesenoncolorimetric recording systems is highly dependent onthe primaries used in creating the images. Thus, they yieldlarge color errors with images that are not produced with theprimaries used in calibration.
For subtractive color reproduction systems (described inSection III-A2) that use varying densities of cyan, magenta,and yellow dyes to reproduce colors, one can conclude thatany three sensors from whose measurements the densities canbe inferred will suffice. While mathematical characterizationof this requirement would require assumptions on the spectraof the dyes and models for the specific processes used, inpractical systems any three reasonably narrow color filterswith peaks in the red, green, and blue regions suffice [215],[130, p. 247]. Since this is far less demanding as a designobjective than the colorimetric criteria discussed above andbecause a large fraction of input images to scanners are inthe form of photographic prints that use subtractive repro-duction, most present day scanners are designed to satisfythis requirement. The cost levied by this design trade-offis greater user intervention since distinct calibrations of thescanner are required for accurately scanning reproductionsproduced with different subtractive primaries [216]. With theadvent of hi-fi printing systems that employ more than threeprimaries, the accuracy of such scanners is likely to be furthercompromised.
If scanners are designed to be colorimetric, a linear trans-formation, independent of the scanned object characteristics,can be used to accurately estimate the CIE XYZ tristimulusvalues from the scanner measurements. However, due to thenonlinear relationship between density and tristimuli, scannersdesigned to measure dye densities perform poorly with alinear transformation. A number of heuristic nonlinear cali-bration schemes have therefore been used in practice. Three-dimensional look-up tables [146], least-squares polynomialregression [217], [146], and neural networks [147] are exam-ples of these approaches. Note, however, that these approachesoffer significant gains over a simple linear transformation onlywhen the characterization is performed for a restricted classof media [216].
920 IEEE TRANSACTIONS ON IMAGE PROCESSING, VOL. 6, NO. 7, JULY 1997
4) Multispectral Imaging Systems: In remote sensing ap-plications, multispectral scanners often utilize narrowbandspectral filters to record energy in different regions of thespectrum in a manner very similar to the color recordingdevices mentioned in Section III-B3. A major differencebetween these and the color recording devices arises fromthe fact that they are not attempting to capture informa-tion so as to match a human observer. Therefore, thesedevices are not restricted to operating within the visibleregion of the electromagnetic spectrum and typically useinfrared, visible, and microwave regions of the spectrum[177]. For the same reason, while dimensionality reductionof recorded data is often done while processing (see SectionIII-B5), there is no direct analog of trichromacy in remotesensing.
Most multispectral remote sensing applications are gearedtoward classification of acquired images into regions belongingto a number of known categories. While this is different fromthe color recording devices goal of capturing images withoutloss of visual information, the mathematical model of (26)can also be used to represent multispectral systems. Since therestrictions on the fabrication of these devices are similar tothose for color recording devices, a number of ideas mentionedin the previous sections could also be applied to the design andanalysis of multispectral imaging systems.
5) Principal Component Recording: The color recordingdevices of Section III-B3 attempt to sample the spectra ofimages while preserving visual information. A recording ofthe spectra itself provides greater information but is extremelyslow and expensive. Since spectral information of reflectiveimages is extremely useful for determining of color underdifferent illuminants, alternate schemes for recording theirspectral information are of interest.
Note that in the absence of noise, the scanned image in (26)can be directly used to determine the projection of the imagespectra onto the SVS. Hence, to obtain good reconstructionof reflectance spectra, the sensors can be chosen so thata large fraction of the energy in reflectance spectra liesin the SVS. In the absence of noise, the Karhunen–Loeve(KL) transformation provides the mathematical solution to thisproblem in terms of the statistics of the ensemble of reflectancespectra [218]. The best spectral reconstruction of scannedspectra in a mean-squared error (MSE) sense is obtained froma channel scanner when the SVS corresponds to the spanof the principal components of the reflectance spectra, i.e.,the eigenvectors associated with the largest eigenvalues ofthe spectral reflectance correlation matrix.
The reflectance spectra of most naturally occurring objectsare smooth functions of wavelength; the same is true of spectraproduced using photography, printing, or paints. As a result,these spectra can be accurately represented by a few princi-pal components. Various studies of reflectance spectra haveestimated that between three to seven principal components(depending on application) provide satisfactory reconstruc-tion of reflectance spectra for most color work [219]–[223].Note that this offers a significant reduction in dimensionalityin comparison with spectrophotometric measurements usinguniform sampling.
Linear models for object reflectance spectra based on theprincipal components idea have been used by a large numberof researchers for recovering illuminant and surface reflectancedata from recorded images and for color correction appli-cations [220], [223]–[225]. Most of this research used KLtransform on a spectrophotometrically recorded ensemble ofreflectance spectra, and the problem of designing spectralrecording devices based inherently on the principal compo-nents approach has received little attention. There is, however,one commercial color measuring device that attempts to re-construct spectral data from sensor measurements [226]. Inaddition, the principal components approach has been usedin analyzing multispectral satellite imagery, and the idea ofa recorder based on principal components has also beensuggested for acquiring satellite images [176, Chap. 7].
One may note here that some naturally occurring reflectancespectra do not adhere to the smoothness assumption. Examplesof such spectra are colors produced due to multiple film inter-ference in certain minerals and iridescent colors on some birdfeathers and in shells containing calcium carbonate [114, pp.261, 267]. A principal components scheme leads to relativelylarge errors in such spectra. Hence, in imaging applicationsinvolving these objects, the principal components approachwould be inappropriate.
IV. COLOR IMAGE PROCESSING ALGORITHMS
For obvious historical reasons, a large fraction of theexisting research in digital image processing deals only withmonochrome images. While some of this can be extended tothe processing of color images in a straightforward fashion,there are several problems that are unique to the processingof color images. This section is a survey of the researchaddressing some of these problems.
A. Color Quantization
Most computer color displays are based on a frame bufferarchitecture [227]. In such an architecture, the image is storedin a video memory from which controllers constantly refreshthe display screen. The images are usually first recorded as fullcolor images, where the color of each picture element (pixel) isrepresented by (gamma-corrected) tristimuli with respect to thedisplay’s primaries and quantized to 8 or 12 bits (b) for each ofthe three channels. Often, the cost of high-speed video memoryneeded to support storage of these full color images on ahigh-resolution display is not justified. Many color-displaydevices therefore reduce memory requirements by restrictingthe number of colors that can be displayed simultaneously.Often, 8, 12, or 16 b of video memory are allocated toeach pixel, allowing simultaneous display of , orcolors, respectively. The user then has the capability to choosea palette of simultaneously displayable colors from a muchlarger set of colors that the device is capable of rendering.A palettized image, which has only the colors contained inthe palette, can be stored in the video memory and rapidlydisplayed using look-up tables implemented in hardware [227].
The use of a fixed image-independent palette usually pro-duces unacceptable results, unless halftoning (see Section
SHARMA AND TRUSSELL: DIGITAL COLOR IMAGING 921
IV-B) is employed. Hence, most image displays use an imagedependent palette. In the ideal case, the palette and thepalettized image should be simultaneously determined from afull-color image so as to minimize the perceived differencebetween the displayed and the full-color image. Since thissolution is intractable, usually it is simplified by splitting itinto two successive steps: i) the selection of a palette and ii)the mapping of each pixel to a color in the palette.
The problem of selecting a palette is a specific instanceof the more general problem of vector quantization (VQ)[228], [229]. If the true color image has distinct colorsand the palette is to have entries, the palette selectionmay be viewed as the process of dividing colors into
clusters in 3-D color space and selecting a representativecolor for each cluster. Ideally, this clustering should minimizeperceived color error. For mathematical tractability, however,the problem is often formulated in terms of minimizationof the MSE between the true-color tristimuli in the imageand the palette representatives of their clusters. The selectionof a globally optimal palette under the MSE criterion isa nondeterministic polynomial-time (NP) complete problem[230]–[232]. For cases where the number of palette and truecolors is extremely small, a branch and bound algorithm canbe used to determine the optimal solution [233]. However, formost realistic images, this approach is infeasible. Therefore,efficient palette selection algorithms use suboptimal formu-lations of the problem and heuristics to achieve acceptableperformance in reasonable time. Often, the Linde–Buzo–Gray(LBG) algorithm [234] can be used to iteratively improve anexisting palette to achieve a local minimum with respect tothe MSE criterion. The algorithm is a generalization of the1-D Lloyd–Max quantization algorithm [235], [236] and isidentical to the -means clustering algorithm [237] used inpattern recognition and classification.
A simple heuristic that has been used for palette designis the popularity algorithm, which works by forming a 3-Dhistogram of the true image colors and assigning the mostfrequently occurring colors in the histogram as the palettecolors [238]. While the popularity algorithm is extremely fast,it performs rather poorly on images with a wide range ofcolors. The idea of using histograms is, however, useful, andis often used as a first step in the palette selection processto reduce the number of colors to more manageable levels.Typically, the histogram is formed by the simple process ofignoring some of the least-significant bits in each tristimu-lus. Braudaway [239] suggested a variant of the popularityalgorithm that prevents the concentration of too many colorsaround a single histogram peak by allocating the palette colorssequentially and modifying the histogram after each allocation.Gentile et al. [124] modified Braudaway’s algorithm and usedit to perform palettization in CIELUV space. An alternateheuristic was suggested by Heckbert [238], which attemptsto use each palette color to represent an equal number oftrue colors. The proposed algorithm determines a palette bya recursive process of splitting the largest cluster into twoequal halves. Since the splitting is done about the median pointafter sorting the colors in the cluster along the dimension withlargest spread, the algorithm is commonly referred to as the
median cut algorithm. Both Heckbert and Braudaway used theLBG algorithm to improve the initial palettes obtained fromtheir heuristic procedures. However, since the LBG algorithmconverges only to a local minimum, this step often yields onlyslight improvements [238].
More significant improvements can be obtained by replacingthe heuristics by schemes that attempt to select the palettethrough a sequential splitting process while reducing the MSEat each step. Various splitting procedures, and different criteriafor selection of the cluster to be split, have been used byresearchers. An algorithm suggested by Wan et al. [240],[241] (binarily) splits the cluster with the largest MSE ateach stage along the plane orthogonal to the (tristimulus)coordinate axis yielding greatest reduction in the total MSE. Asimilar scheme has also been reported more recently in [242].Orchard and Bouman [243] developed a more generalizedbinary splitting algorithm that allows arbitrary orientationsof the plane used to split a cluster. The algorithm selectsthe cluster with the most variation along a single directionand splits it along the direction of maximum variation. Italso incorporated a modification of the MSE by a subjectiveweighting factor to reduce undesirable visible artifacts ofquantization. Balasubramanian et al. [244] used efficient data-structures, histogramming, and prequantization to speed up theOrchard–Bouman splitting algorithm.
Since the binary splitting algorithms use the “greedy” strat-egy of minimizing the MSE at each split, they can potentiallyget stuck in poor local minima. Wu [245] developed an alter-native dynamic programming scheme that performs multiplesplits at each stage to partially remedy this problem. Forreasonable sized color palettes, the potential for encounteringpoor local minima with the greedy strategy is rather low.Consequently, Wu’s algorithm offered the greatest gains forquantization with small palettes [245].
While several of the VQ algorithms mentioned above allownearly transparent quantization of images for display, theircomputational cost is often too high. Recently, Balasubrama-nian et al. [246] reported a new VQ technique called sequentialscalar quantization (SSQ). SSQ is able to exploit correlationbetween the color components and offers some of the benefitsof conventional VQ, while retaining the simplicity of scalarquantization. The application of SSQ to color quantization hasbeen reported in [246] and [247], where it can be seen thatSSQ offers slightly inferior MSE performance in comparisonto some of the binary splitting techniques while providingvery significant speed-up. SSQ has also been used for thecreation of universal (image-independent) color palettes forerror-diffusion (discussed in Section IV-B) [248].
One limitation of the palettization schemes based on MSEis that they offer no guarantees regarding the maximum colorerror. The octree quantization algorithm [249], [250] and thecenter-cut algorithm [251] are two simple color quantizationschemes motivated by the idea of limiting the maximumerror. The center-cut algorithm is a minor modification of themedian-cut algorithm, in which the cluster with the largestdimension along a coordinate axis is split along the center ateach step. The octree algorithm is a bottom-up approach tothe problem, in contrast with all the other top-down schemes.
922 IEEE TRANSACTIONS ON IMAGE PROCESSING, VOL. 6, NO. 7, JULY 1997
Conceptually, it subdivides the color space into cubes untileach cube contains only one image color and then reduces theresulting octree by an averaging and merging process so thateach node represents a palette color. In practice, the buildingand reduction are performed in a single pass. An alternatebottom-up color quantization scheme, that uses histogrammingand prequantization with a cluster-merging VQ algorithm, wasalso presented in [252].
Thus far, the palettization algorithms discussed were con-cerned with single images. The problem of palettization ismore involved for video sequences. In addition to the re-quirement of real-time performance, care must be taken in thedesign of palettes for successive frames to minimize the visibleeffects of colormap flashing that occurs when the color map isupdated prior to the update of a frame. The reader is referredto [253] for a description of a mathematical formulation andsolution scheme for the problem of color quantization of videosequences. A less sophisticated scheme utilizing a single colorpalette for the entire sequence is also discussed in [254].Colormap flashing can also be encountered in the simultane-ous display of multiple independently palettized images. Theproblem can be eliminated through the use of a combinedpalette. An efficient VQ scheme for combining palettes withlittle visual distortion is presented in [255].
Once the design of a palette is over, the second step in colorquantization, i.e., the mapping of image pixels to the palettecolors, needs to be performed. The simplest approach to thisproblem is to map each pixel to its nearest neighbor in thepalette. Often, the palette design process can be used to obtaina tree structure that simplifies this nearest neighbor search orprovides a good approximation to it. This is particularly truefor the binary splitting algorithms that can use the classic k-d tree [256] for nearest-neighbor search. Similar procedurescan also be readily used with the octree quantization scheme.Note however, that if the LBG algorithm is used for iterativeimprovement of the obtained palette, the tree structure of thepalette is destroyed, and therefore the nearest-neighbor searchis more involved though fast searching schemes can still bedeveloped [257], [258].
While the nearest-neighbor mapping algorithm is optimalfrom a minimum-average-error standpoint, it often producesobjectionable contours in smooth image regions. A significantreduction in visible contours can be obtained by a using thehalftoning techniques of dither or error diffusion, which will bebriefly discussed in Section IV-B. The use of these techniquesin the pixel mapping step has been discussed by a number ofresearchers [238], [239], [124], [243]. Liu et al. [242] describeanother pixel mapping scheme that combines error diffusionwith morphological operations in an attempt to reduce visibleartifacts.
B. Halftoning
The human eye is extremely sensitive to color variations,and is capable of distinguishing around 10 million colors underoptimal viewing conditions [259]. At the same time, coloroutput devices such as halftone color printers and palette-based displays are capable of producing only a limited numberof colors at each addressable spatial location. However, these
devices normally possess rather high spatial resolution, which(at normal viewing distances) is often beyond the resolvingcapabilities of the human eye. In reproducing color images onthese devices, it is therefore desirable to use techniques thattrade off (excess) spatial resolution in favor of a greater rangeof perceived colors. The term halftoning is used to describe avariety of image processing techniques based on this idea.
The eye perceives only a spatial average of the microvari-ation in spot-color produced by the device, and is relativelyinsensitive to high-frequency differences between the originalcontinuous-tone image and the halftone image. Halftoningalgorithms therefore attempt to preserve this average in thereproduction while forcing a large fraction of the (neces-sary) difference between the halftone and contone imagesinto the perceptually irrelevant high-frequency regions. In theremainder of this section, the distinction between spot-colorand perceived average color will not always be explicitlyemphasized. The implied meaning should, however, be clearfrom the context. Similarly, most of the discussion will referto halftone printing, and the use of halftoning in displays willbe mentioned where appropriate.
Halftoning methods have been used in lithographic printingfor the reproduction of both gray-scale and color images fora considerable length of time [260, p. 128]. The halftonesfor lithographic printing processes were traditionally obtainedby photographing (color-filtered) images through a fine screenon a high-contrast film [260, Chap. 7]. In digital imagingapplications, halftoning was originally used in binary displaydevices and printers for producing the illusion of gray scale.There is a vast amount of literature dealing with the halfton-ing of gray-scale images (see [261]–[265] for an extensivebibliography). This section will focus mainly on digital colorhalftoning. Since several techniques of color halftoning inherittheir motivation and principles from prior schemes used inhalftoning gray-scale images, some of the pertinent gray-scaleschemes will also be referenced.
One problem unique to color halftoning is the problemof registration. Most printing processes print halftone “sep-arations” of the different color dyes sequentially. Typically,the reproduction medium is moved by mechanical systemsin the process and some variation in the alignment of theseseparations is inevitable. If ideal cyan, magenta, and yellowdyes (which follow the Bouguer–Beer law and the blockdye assumptions mentioned in Section III-A2) are used, thevisual appearance would be essentially independent of smallregistration errors [134]. However, real dyes are far from ideal,and registration errors can produce significant color shifts dueto varying amounts of overlap between the separations. Colorhalftoning schemes, therefore, attempt to arrange separationsso that the relative overlaps of the dye layers are insensitiveto alignment errors.
In conventional digital color halftoning (for printers), theimage is decomposed into a cyan, magenta, yellow, and blackseparations, which are halftoned independently. The halftoningfor each separation is done by comparing the pixel value witha spatially repeated dither array and turning on pixels forwhich the image exceeds the value in the corresponding dithermatrix [264]. The dither matrix is designed so that thresholds
SHARMA AND TRUSSELL: DIGITAL COLOR IMAGING 923
close in value occur near each other in the dither array. For auniform image, the halftoning schemes yield a grid of halftonedots (consisting of clusters of “on” pixels) similar to oneproduced by the photographic screen in lithography. The sizeof the clustered dots increases with increase in the image pixelvalues. The grids for different colors are oriented at differentangles to make the overlaps between the dots in the fourseparations invariant to small registration errors. The printingmechanism is therefore said to employ rotated screens. Therotation angles for the different colors are chosen so asto minimize the occurrence and visibility of low-frequencyinterference patterns, known as moire [134]. The most visibleblack screen is typically oriented along a 45 angle, alongwhich the eye is least sensitive. The yellow, magenta, and cyanscreens are located along 0 , 15 , and 75 , respectively [134,pp. 328–330]. In digital imaging applications, often one isconfined to working on a rectangular raster. An elegant schemefor obtaining different screen angles on rectangular rasterswas developed by Holladay [266]. An analysis of moire usingFourier transforms and methods of designing dither arrays thatminimize moire can be found in [267] and [268].
The requirement that pixels in a dither pattern must beclustered together is fairly restrictive and compromises spa-tial resolution. However, clustered dots are insensitive tocommon printing distortions and reproduce well on printersand copiers that have difficulty in reproducing isolated pixels[265]. Therefore, rotated clustered-dot screens have been usedextensively for color printing. For displays, these considera-tions are inapplicable, and therefore alternate dither matricesthat produce dispersed dots with greater spatial resolution havebeen successfully used for bilevel displays [269]. The useof rotated dispersed-dot dithering for color printing on inkjetprinters has also been recently mentioned in [270].
One may note here that the process of thresholding with adither array can be replaced by a mathematically equivalentscheme of adding a dither pattern to the image and thresh-olding at a constant level. This is a variant of the schemeproposed in [271]. The original scheme proposed the use ofrandom noise as the dither pattern. Such a scheme is known toreduce visible artifacts due to quantization and is often usedin monochrome and color displays. In order to emphasize thedifference with this random dither, the term ordered dither isoften used to describe schemes of the last two paragraphs, forwhich the dither pattern is not random.
Halftoning schemes that employ dither matrices quantizethe image pixels in isolation. Considerable improvements inimage quality can be obtained by using adaptive schemesthat process each pixel depending on the result of processingother pixels. Error-diffusion (ED) [272], [273] is an adaptivescheme that has been widely used. ED works by “diffusing”the error resulting from the quantization of the current pixel toneighboring pixels. At each pixel, the diffused error is addedto the image value prior to quantization, and the quantizationerror is again distributed over adjacent pixels. Since theobjective of error diffusion is to preserve the average valueof the image over local regions, a unity-gain lowpass finiteimpulse response (FIR) filter is used for distributing the error.From a signal processing viewpoint, ED can be viewed as a
2-D version of - A/D converters. An analysis of ED and- A/D conversion in a common framework was presented
in [274], [275]. From such an analysis, it can be seen that theimage resulting from ED can be represented as the sum ofthe original image and a highpass filtered error image [276],[277]. Since the eye is less sensitive to high spatial frequencies,the images resulting from ED typically appear closer to theoriginals than those obtained with ordered dither.
ED was originally used and analyzed for gray-scale images.Most of the analysis is, however, applicable to color imagestoo. For color images, the image may be represented astristimuli in a color space or as separate cyan, magenta, yellow,and black images for printing. Typically, the error diffusion isdone independently for each channel using identical spatialfilters, but quantization may be performed independently ineach channel (scalar ED) or simultaneously for the entire colorvector (vector ED). For printers, both scalar and vector EDschemes have been used [278], [279], but for color displayswith an image-dependent palette, it is usually necessary touse vector ED. For unity-gain ED filters with positive weightsonly, it can be shown that scalar ED is a stable process withbounded quantizer overload [274]. However, for vector ED,severe quantizer overload can occur, leading to significantcolor artifacts. A discussion of this problem and methods thatattempt to reduce overload by reducing the feedback in EDcan be found in [243] for displays and in [279] for printers.
The ED filter needs to be causal if the image is to behalftoned in a single pass. The causality requirement for nor-mal raster processing implies that the filter is asymmetric. Thisasymmetry often results in visible low-frequency “wormlike”artifacts in bilevel ED. Several schemes, such as a larger areaof support for the FIR filter [280], [281], processing on aserpentine raster [282], and symmetric error diffusion neuralnetworks [274], have been proposed for gray-scale imagesto overcome these limitations. For color images, however,the problem of visible artifacts is not that acute due to themultiple output choices for each pixel in both displays andprinters [283]. While clustered dot dithering schemes are oftenpreferred for printing for reasons mentioned earlier, ED is theprimary halftoning scheme used in displays.
It was mentioned earlier in this section that ED imagesare pleasing to the eye because of the highpass nature ofthe “noise” in the reproduction. The fact that pushing imagequantization noise to high spatial frequencies results in reducednoise visibility was recognized early on and exploited indithering schemes by several researchers [269], [284]–[286].Noise processes having only high spatial frequency compo-nents were given the name blue noise by Ulichney [287].He convincingly argued that since a large MSE is inevitablewhen reproducing a gray-scale image on a bilevel device,halftoning should attempt to concentrate on shaping resultingnoise spectrum to be blue, and therefore least visible. WhileED produces blue noise, it offers only a limited control overthe noise spectrum and also requires considerable processingin comparison to the pixelwise thresholding for ordered dither.Several researchers have therefore worked on developing largedither matrices, which achieve ED-like performance with thecomputational benefits of pointwise processing [288]–[290].

924 IEEE TRANSACTIONS ON IMAGE PROCESSING, VOL. 6, NO. 7, JULY 1997
The resulting techniques along with ED-like adaptive algo-rithms are collectively known as blue noise halftoning orstochastic screening. The dither arrays produced for obtainingblue noise characteristics are known as blue noise masks. Mostof the literature dealing with the design of blue noise masksaddresses only grayscale halftoning. For color, independent(uncorrelated) blue noise masks are used for each separation.Just as in bilevel reproduction, blue noise masks in coloroffer the advantages of high processing speed, good spatialresolution, and few visible artifacts. An added advantage,particularly for hi-fi printing, is the lack of visible screentexture and interference between angled screens.
The halftoning methods mentioned thus far are (intelligent)heuristic algorithms that exploit the lowpass nature of the eye’sspatial response. The problem of halftoning can alternatelybe formulated as an optimization problem that aims at maxi-mizing the “visual similarity” between the original image andthe halftoned image. In order to quantify visual similarity,several schemes utilize a model for the spatial response of theeye. These schemes are therefore referred to as model-basedhalftoning methods. Based on psychophysical measurementswith sinusoidal gratings, an empirical isotropic linear shift-invariant (LSI) model for the eye’s spatial response wasdeveloped in [291] along with a distortion measure. The dis-tortion measure corresponds to the MSE between the filteredversions of the actual and halftoned images, where the filter isthe LSI model of the eye’s spatial response. Most model-basedhalftoning methods use variants of this distortion measure. Forthe spatial response of the eye, however, a number of othermodels have also been proposed, including some that take intoaccount known anisotropy in the visual-system [292].
The exact optimization in model-based halftoning schemesis an intractable integer programming problem. For displayof gray-scale images on binary output devices, a numberof researchers have suggested iterative schemes that pro-vide good solutions with varying computational requirements[292]–[296]. For color displays with reasonable sized palettes,the problem remains computationally infeasible at present. Aniterative algorithm for model-based halftoning for color print-ers has been reported in [297]. The algorithm uses a linearizedversion of CIELAB space for perceptual uniformity alongwith separate spatial models for luminance and chrominancechannels. Pappas [283], [298], [299] has also considered anextension of the model-based halftoning scheme to color thatalso accounts for some printing distortions.
Since the computational requirements of most model-basedschemes are rather restrictive, a number of researchers haveinvestigated hybrid schemes that use the halftoning methodsmentioned earlier but still attempt to minimize a visual model-based error. For gray-scale images, Sullivan et al. [300]have incorporated a visual model in ED. The use of neuralnets to minimize a visual model-based distortion function insymmetric error diffusion has also been reported in [274]. Forcolor applications, significantly less research has been done.The optimization of ED for color display applications has beenreported in [301] and [302], where optimal ED filter coeffi-cients were determined through a process of autoregressive(AR) modeling of the eye’s spatial response.
The method of ED continues to be an active area ofresearch. Recent novel developments in the area include theuse of adaptive signal processing techniques and embeddedquantization schemes. Image-adaptive ED filters that use thewell-known least-mean-squares (LMS) algorithm [303] havebeen employed for halftoning gray-scale [304] and color[305], [306] images (although, with slightly different errorcriteria). The methods exploit the local characteristics ofthe image to obtain improvements over a constant filter.Another modification of color vector ED is proposed in [307],[308]. The resulting embedded multilevel ED algorithm allowscoarse quantizations of an image to be embedded in finerquantizations, which can be useful in (among other things)the progressive transmission of color images.
One may note here that the issue of obtaining colorimet-rically accurate reproduction has been consciously avoided inthe discussion above. Due to gamut restrictions, a colorimetricmatch is often neither feasible nor desirable. In addition,even with these problems excluded, there have been onlya few attempts at incorporating colorimetric matching intohalftoning algorithms. If the output device is linear and amean preserving scheme such as conventional ED is usedfor halftoning in the device color space, it can be expectedthat a good colorimetric match will be obtained. However,these assumptions are rarely valid. For CRT displays, due tothe larger number of output quantization levels, an argumentof local linearity can be invoked [309]. This justifies andexplains the relatively accurate color reproductions obtainedusing ED on CRT displays. In printing, color accuracy isnormally addressed (using the methods mentioned in SectionIII-A3) after selecting a halftoning scheme. The problemof colorimetric match can also be partly addressed usinga uniform color space (UCS) for vector ED [297], [279].However, since the number of possible output pixel colorsfor printers is small, analysis of colorimetric behavior ofhalftoning algorithms needs further research.
C. Color Image Coding
Since color has become such a large part of digital imagery,the problem of coding color images for transmission andstorage has gained increased importance. The natural evolutionof coding treated color images simply as three independentmonochrome bands. This allowed all known monochromecoding methods to be used. Since CRT displays were theprimary intended target, the RGB representation was mostcommon. However, the monitor-based RGB tristimuli arehighly correlated and therefore not suited for independentcoding [310]. This was also recognized in early work withcolor television, and other color spaces were investigated.A review of this work is given in [42]. There are a fewimportant points about this early work that are worth notinghere. The importance of using a luminance chrominancespace similar to CIELAB and CIELUV was recognized. Anindependent luminance channel was also required for reasonsof compatibility with existing monochrome system. The resultwas YIQ, which is still used for many applications outsideof television today. The YIQ signals had to be transformedinto driving signals for the RGB phosphor guns used in the

SHARMA AND TRUSSELL: DIGITAL COLOR IMAGING 925
receiver. Since precision analog hardware was expensive, anattempt was made to minimize the complexity of the varioustransformations. The spectral sensitivities of the recordingcameras were chosen to approximate the color-matching func-tions defined by phosphor primaries. In doing so, the negativeportions of the color-matching functions were ignored, andsensitivities that matched the nonnegative portions were used[42]. This was recognized as creating color errors; however,the errors seemed tolerable. In order to simplify receivers, theYIQ signals were derived from gamma-corrected RGB signalsassociated with the phosphor primaries, and therefore the YIQspace used in TV transmission is not a linear transformationof the CIE XYZ space.
With the advent of HDTV, the problem of negative lobetruncation in the camera sensitivities is to be entirely elim-inated by implementing matrix transformations of recordedcolor tristimuli. The gamma-correction mentioned in SectionIII-A1 has still been retained due to its perceptual benefits.Instead of YIQ, an opponent color space encoding for gamma-corrected RGB data has been standardized as the YCrCb space[51]. This space has also been used frequently in recent workon image compression.
Since it was well known that color perception errors didnot correlate well with Euclidean distances in RGB spaceand the television standard was available, most research oncoding used variations of monochrome coding in combinationwith transformations to better color spaces. Transformationsto novel color spaces were used, such as the K–L transform,which offered performance similar to YIQ [310]. Some workhas also been done with coding images using perceptual errormeasures (see for e.g., [311], [312]). While the CIELUVand CIELAB spaces were designed to match the results ofperceptual tests on larger patches of color, tests confirm thatquantizing in these spaces produces smaller perceptual errorsin images.
With the increasing use of digital imagery that is indepen-dent of TV, new methods are continually being introduced.Just as in halftoning, coding schemes that exploit the lowpassspatial response of the eye have been suggested for imagecoding. In subband coding [313], the image is split intoorthogonal subbands with varying frequency content. Thesubbands are then quantized with fewer bits allocated tohigher frequency components. VQ techniques, similar to thosedescribed in the earlier section on palettization, can be usedfor the quantization. Known anisotropy in the eye’s spatialresponse can also be utilized. The lower sensitivity of theeye along the 45 angle, permits fewer bits to be allocatedto frequency bands located on the diagonal. This idea iseasily extended to color images. However, complete data onthe spatial frequency response of the eye to spatial color(chromatic) frequencies has only recently been published. Thecombination of subband coding with color spatial frequencyresponse was presented in [314] and [315].
Similar ideas provide the motivation for the discrete-cosine-transform-based (DCT-based) Joint Photographers ExpertGroup (JPEG) and Moving Pictures Expert Group (MPEG)standards [316]–[318]. These standards specify the coding tobe performed on each image band, and allow for a variety of
color spaces to be used. This means that as better color-codingmethods are developed, they can be implemented in the currentframework. In current implementations, the YCrCb space isoften used with the Cr and Cb components subsampled bya factor of two along both spatial dimensions [319]. TheJPEG compression scheme has also been incorporated in theInternational Color Facsimile Standard [320], [321].
An interesting problem is the coding of palettized im-ages. While the palettization process offers some compression(typically 3 : 1), this is usually significantly lower than whatis attainable with other image coding schemes. Smoothnessassumptions are typically invalid for color mapped “image”data. Therefore, normal coding schemes are inapplicable un-less the images are remapped to full color images beforecoding. Recently, Wu [322] has suggested a new YIQ palettearchitecture that uses joint VQ of spatial and color informationto obtain modest compression ratios. A more aggressive codingscheme for palettized images has been suggested in [323],where the colormap data is locally reorganized to obtainsmooth blocks, and DCT coding is then utilized. Losslessentropy coding schemes have also been presented recently in[324] and [325].
D. Gamut Mapping
It was mentioned in Section III-A that color output devicesare capable of producing only a limited range of colors definedas their gamut. Often, an image contains colors beyond thegamut of the target output device. In such a case, before theimage can be reproduced, it is necessary to transform theimage colors to lie within the gamut. This process is referredto as gamut mapping. The goal in gamut mapping is to obtaina reproduction that appears identical to an “original” image.The original image is often itself a reproduction from anothercolor output device. Since output devices have widely varyingphysical characteristics, they can have significantly differentcolor gamuts. In addition, devices rely on different mecha-nisms (e.g., emission, transmission, or reflection) to producecolor and therefore imply different viewing conditions andconsequently different states of adaptation for the observer’svisual system. Gamut mapping is therefore a difficult problemin which the issue of device capabilities is interwoven withthe psychophysics of color vision.
While the gamut mapping problem has been successfullyaddressed in the printing and graphic arts industries for con-siderable time, it has become an active area of research indigital imaging applications only recently. In graphic artsand printing, skilled human operators rely on experience toperform gamut mapping for each image independently. Indigital imaging applications, on the other hand, it is desirableto automate as much of the process as possible and make ittransparent to the end user.
Due to the large differences in dynamic range of differentcolor devices and due to the normalizing adaptation in theeye, little success can be achieved by gamut mapping schemesthat attempt to match tristimulus values. Use of uniformcolor spaces that incorporate some white point scaling in thespecification of colors mitigates the problem of normalization
926 IEEE TRANSACTIONS ON IMAGE PROCESSING, VOL. 6, NO. 7, JULY 1997
to a limited extent. However, naive schemes that map out-of-gamut colors to the nearest color in a uniform color spaceor scale the entire image colors to lie within the gamut arealso unsatisfactory in most cases. A robust and universalgamut mapping strategy remains an elusive goal. However,several researchers have reported encouraging results fromexperiments with different gamut mapping strategies. Themore successful approaches tend to use uniform color spacesor color appearance models and manipulate color data usingperceptual attributes of lightness, hue, and chroma in anattempt to preserve the more important attributes.
Stone et al. [158] laid down some principles of gamutmapping that were culled from psychophysics and acceptedprocedures in graphic arts. For printing images displayed onCRT monitors, they described an interactive gamut mappingstrategy involving translation, scaling, and rotation of colorsin CIE XYZ space. For an identical scenario, simulations of anumber of clipping and compression based gamut mappingschemes using CIELUV [326], [327] and CIELAB [328],[329] color spaces have also been reported. For obtainingsimilar reproductions on transmissive and reflective media,the use of an invertible color appearance model was reportedin [330]. Recently, a gamut mapping strategy for printersthat does not involve any explicit clipping and scaling waspresented in [331]. The mapping for a limited subset of colorswas explicitly specified, and an interpolation algorithm basedon morphing was then used to obtain a mapping for the othercolors.
E. Device-Independent Color and Color Management Systems
In digital imaging applications, color was first used pri-marily on CRT displays. The color data in most images wasadjusted and stored in a device-dependent format suited forproviding reasonable reproduction on common CRT monitors.With the proliferation of a large number of other color devices,it is desirable to use a device-independent color specificationfrom which identical-appearing images can be created onmultiple output devices. While this has been an active areaof research in the industry, a universally acceptable colorspecification system that guarantees device independence isyet to be defined. The use of standardized colorimetry definescolors in a device-independent space and therefore forms afirst step toward achieving device independent color. However,as discussed in Sections II-D and IV-D, the use of a device-independent color space does not by itself guarantee an appear-ance match between images reproduced on different devicesunder different viewing conditions. Therefore, in addition tocolorimetry, the use of auxillary information regarding viewingconditions and white points has been proposed for colorspecification. Such information would allow exploitation ofvision psychophysics and gamut mapping to achieve device-independent color [332], [333].
For device-independent color reproduction, it is necessary toaccurately characterize each individual color input and outputdevice and transform image data into appropriate device-dependent versions based on the characterization. In order toisolate the end user from the nitty-gritty of handling color
characterization information and transformations, color man-agement systems have been proposed to automate this task.For a discussion of the systems issues in color managementand existing color management schemes, the reader is referredto recent presentations on the topic [334]–[336]. A notableadvance in this direction is the emergence of a widely acceptedstandard [86], [337] to facilitate the communication of devicecharacterizations.
V. RESEARCH DIRECTIONS IN COLOR IMAGING
This paper surveyed the current technology and researchin the area of color imaging. As compared to monochromeimaging, the field of color imaging is still in its infancy andabounds with a large number of interesting research problems.Of greatest relevance, perhaps, is the problem of colorimetricrecording of image data. Since the “garbage-in garbage-out”paradigm still holds, significant gains in processing and dis-play can be made only if the recorded colors are accurate.Toward this end, the construction of readily manufacturableand inexpensive colorimetric filters remains elusive, thoughadvances in electrically tunable acouto-optic filters [338],[339, Chap. 7] offer considerable promise. Using appropriateelectrical modulation, a wide range of filter transmittancescan be synthesized on these devices [340]. Their use inscientific applications requiring precise color recording hasbeen recently reported in [341]. Other research areas in colorinput systems are the development of multidimensional image-restoration schemes for effective deconvolution of adjacencyeffects in scanning, robust methods for scanning halftoneimages, and methods for illuminant independent recording ofreflective and transmissive images. Research in several of theseareas would also be relevant to satellite multispectral imagers.In quantifying color recording accuracy, it is also desirableto develop metrics that are based on complex image scenesinstead of the CIE metrics based on large uniform areas.
Color appearance modeling for imaging applications isanother prospective area for investigation. While there areseveral color appearance models, most are fairly complexand their suitability for color imaging remains to be compre-hensively evaluated. The development of simpler and readilyapplicable (though, not necessarily physiological) models ofcolor perception and their incorporation into color processingalgorithms to improve performance is also a desirable researchgoal. This is particularly relevant for problems of gamutmapping and cross-device rendering, though such an approachwould also benefit coding and compression algorithms.
With the advent of new display and printer technologies,their modeling and easy calibration will also pose new chal-lenges. Few predictions, if any, can be made regarding thenature of devices yet to come. However, it is likely that anumber of these will utilize more than three primaries toobtain an increased gamut. Color coordinates, which drive theprimaries in these systems, would therefore be mathematicallyunderdetermined. Research is needed on schemes for dealingwith this underdeterminacy that incorporate feasibility con-straints and also avoid introducing undesirable discontinuities,while exploiting the full device gamut. Several of these
SHARMA AND TRUSSELL: DIGITAL COLOR IMAGING 927
problems are already under investigation in the context of hi-fiprinting mentioned in Section III-A4.
Finally, there is room for improvement in existing color pro-cessing algorithms. More efficient quantization and halftoningschemes are necessary for use with real-time video on frame-buffer displays. Colorimetric behavior of halftone printing alsodeserves attention, though such an analysis would necessarilyhave to account for imperfections in the printing process inorder to be useful.
ACKNOWLEDGMENT
The authors thank Prof. J. P. Allebach, Dr. P. W. Wong,Prof. M. D. Fairchild, and Prof. B. V. Funt for their helpfulcomments and suggestions. We would also like to acknowl-edge assistance received from Dr. R. R. Buckley, Dr. P. L.Vora, Dr. R. Balasubramanian, and numerous other profes-sionals who reviewed early drafts of this paper. Their inputshave helped improve the content and presentation of this papersignificantly.
REFERENCES
[1] D. L. MacAdam, Ed., Selected Papers on Colorimetry-Fundamentals.Bellingham, WA: SPIE, 1993.
[2] V. Ronchi, The Nature of Light. A Historical Survey. Cambridge, MA:Harvard Univ. Press, 1970, (originally published in Italian as Storiadella Luce, 1939, trans. V. Barocas).
[3] I. Newton, “New theory of light and colors,” Philos. Trans. Roy. Soc.London, vol. 80, pp. 3075–3087, 1671/72, repr. in [1], [342].
[4] , Opticks, or, A Treatise of the Reflections, Refractions, Inflections& Colors of Light, 4th ed. New York: Dover, 1952, based on 4th ed.,London, U.K., 1730.
[5] F. M. Grimaldi, Physico-mathesis de lumine, colobris et iride.Bologna, Italy, 1665 (in Latin), results summarized in [2].
[6] G. Palmer, Theory of Colors and Vision. London, U.K.: Leacroft, 1777,extracts repr. in [1], [342].
[7] , Theory of Light. Paris, France: Hardouin and Gattey, 1786 (inFrench), extracts repr. in [1], [342].
[8] T. Young, “An account of some cases of the production of colors, nothitherto described,” Philos. Trans. R. Soc. London, p. 387, 1802.
[9] , “On the theory of light and colors,” Philos. Trans. R. Soc.London, vol. 92, pp. 20–71, 1802, extracts repr. in [1], [342].
[10] H. G. Grassmann, “Zur theorie der farbenmischung,” Poggendorf’,Annalen Phys. Chemie, vol. 89, pp. 69–84, 1853, trans. as “Theory ofcompound colors,” in Philos. Mag., vol. 4, no. 7, pp. 254–264, 1854,repr. in [1], [342].
[11] J. C. Maxwell, “Theory of the perception of colors,” Trans. R. ScottishSoc. Arts, vol. 4, pp. 394–400, 1856, repr. in [1], [342].
[12] G. Wyszecki and W. S. Stiles, Color Science: Concepts and Methods,Quantitative Data and Formulae, 2nd ed. New York: Wiley, 1982.
[13] J. C. Maxwell, “The diagram of colors,” Trans. R. Soc. Edinburgh, vol.21, pp. 275–298, 1857, repr. in [1], [342].
[14] , “Theory of compound colors and the relations to the colors ofthe spectrum,” in Proc. R. Soc. Lond., 1860, vol. 10, pp. 404–409, repr.in [1], [342].
[15] H. L. F. von Helmholtz, Phys. Opt., 1866, extracts repr. in [342].[16] H. J. A. Dartnall, J. K. Bowmaker, and J. D. Mollon, “Microspectropho-
tometry of human photoreceptors,” in Color Vision, J. D. Mollon, Ed.New York: Academic, pp. 69–80, 1983.
[17] S. Stockman, D. I. MacLeod, and N. E. Johnson, “Spectral sensitivitiesof the human cones,” J. Opt. Soc. Amer. A, vol. 10, no. 12, pp.2491–2521, Dec. 1993.
[18] W. D. Wright, “A re-determination of the trichromatic coefficients ofthe spectral colors,” Trans. Opt. Soc., vol. 30, no. 4, pp. 141–164,1928–1929.
[19] J. Guild, “The colorimetric properties of the spectrum,” Philos. Trans.R. Soc. Lond., A, vol. 230, pp. 149–178, 1931.
[20] S. Polyak, “Retinal structure and color vision,” Documenta Opthalmo-logica, vol. 3, pp. 24–46, 1949, repr. in [342].
[21] H. B. Barlow and J. D. Mollon, Eds., The Senses. Cambridge, U.K.:Cambridge Univ. Press, 1982.
[22] A. Friedman, The Foundations of Modern Analysis. New York: Dover,1982.
[23] B. K. P. Horn, “Exact reproduction of color images,” Comput. Vis.,Graphics, Image Processing, vol. 26, pp. 135–167, 1984.
[24] J. B. Cohen, “Color and color mixture: Scalar and vector fundamentals,”Color Res. Appl., vol. 13, no. 1, pp. 5–39, Feb. 1988.
[25] H. J. Trussell and J. R. Sullivan, “A vector-space approach to colorimaging systems,” in Proc. SPIE: Image Processing Algorithms andTechniques, K. S. Pennington, Ed., 1990, vol. 1244, pp. 264–271.
[26] P. L. Vora and H. J. Trussell, “Measure of goodness of a set of colorscanning filters,” J. Opt. Soc. Amer. A, vol. 10, no. 7, pp. 1499–1508,1993.
[27] H. J. Trussell and M. S. Kulkarni, “Sampling and processing of colorsignals,” IEEE Trans. Image Processing, vol. 5, pp. 677–681, Apr. 1996.
[28] G. Sharma and H. J. Trussell, “Decomposition of fluorescent illuminantspectra for accurate colorimetry,” in Proc. IEEE Int. Conf. ImageProcessing, Nov. 1994, pp. II-1002–II-1006.
[29] H. J. Trussell and M. Kulkarni, “Estimation of color under fluorescentilluminants,” in Proc. IEEE Int. Conf. Image Processing, 1994, pp.III-1006–III-1010.
[30] D. L. MacAdam, Color Measurement: Theme and Variations, 2nd ed.New York: Springer-Verlag, 1981.
[31] V. C. Smith and J. Pokorny, “Chromatic-discrimination axes, CRTphosphor spectra, and individual variation in color vision,” J. Opt. Soc.Amer. A, vol. 12, no. 1, pp. 27–35, Jan. 1995.
[32] Y. Nayatani, K. Takahama, and H. Sobagaki, “Physiological causes ofvariations of color-matching functions,” Color Res. Appl., vol. 13, pp.289–297, 1988.
[33] A. D. North and M. D. Fairchild, “Measuring color-matching functions.Part I,” Color Res. Appl., vol. 18, no. 3, pp. 155–162, June 1993.
[34] , “Measuring color-matching functions. Part II. New data forassessing observer metamerism,” Color Res. Appl., vol. 20, no. 1, pp.29–35, Feb. 1995.
[35] J. B. Cohen and W. E. Kappauf, “Metameric color stimuli, fundamentalmetamers, and Wyszecki’s metameric blacks,” Amer. J. Psychol., vol.95, no. 4, pp. 537–564, Winter 1982.
[36] , “Color mixture and fundamental metamers: Theory, algebra,geometry, application,” Amer. J. Psychol., vol. 98, no. 2, pp. 171–259,Summer 1985.
[37] H. J. Trussell, “Application of set theoretic models to color systems,”Color Res. Appl., vol. 16, no. 1, pp. 31–41, Feb. 1991.
[38] , “DSP solutions run the gamut for color systems,” IEEE SignalProcessing Mag., vol. 10, pp. 8–23, Apr. 1993.
[39] G. Wyszecki, “Valenzmetrische Untersuchung des Zusammenhangeszwischen normaler und anomaler Trichromasie,” Die Farbe, vol. 2, pp.39–52, 1953.
[40] CIE, Colorimetry, CIE Pub. no. 15.2, Centr. Bureau CIE, Vienna,Austria, 1986.
[41] D. B. Judd, “Reduction of data on mixture of color stimuli,” BureauStand. J. Res., vol. 4, pp. 515–548, 1930.
[42] J. O. Limb, C. B. Rubinstein, and J. E. Thompson, “Digital coding ofcolor video signals—A review,” IEEE Trans. Commun., vol. COMM-25,pp. 1349–1385, Nov. 1977.
[43] H. S. Fairman, M. H. Brill, and H. Hemmendinger, “How the CIE 1931color-matching functions were derived from Wright-Guild data,” ColorRes. Appl., vol. 22, no. 1, pp. 11–23, Feb. 1997.
[44] P. K. Kaiser and R. M. Boynton, Human Color Vision, 2nd ed.Washington, DC: Opt. Soc. Amer., 1996.
[45] L. E. DeMarsh, “T.V. display phosphors/primaries—Some history,”SMPTE J., pp. 1095–1098, Dec. 1993.
[46] NTSC, “NTSC signal specifications,” in Proc. IRE, Jan. 1954, vol.IRE-42, no. 1, pp. 17–19.
[47] N. W. Parker, “An analysis of the necessary receiver decoder correctionsfor color receiver operation with nonstandard primaries,” IEEE Trans.Broadcast TV Rec., vol. BTR-12, no. 1, pp. 23–32, Apr. 1966.
[48] SMPTE, “Color temperature for color television studio monitors,”SMPTE Recommended Practice RP 37-1969, White Plains, NY, July1969.
[49] , “Color monitor colorimetry,” SMPTE Recommended PracticeRP 145-1987, White Plains, NY, June 1987.
[50] ITU, “Basic parameter values for the HDTV standard for the studioand for international programme exchange,” ITU-R RecommendationBT 709, ITU, 1211 Geneva 20, Switzerland, Apr. 1990, formerly CCIRRec. 709.
[51] CCIR, “Encoding parameters of digital television for studios,” CCIRRecommendation 601-2, Int. Radio Consult. Committee, Geneva,Switzerland, 1990.
[52] W. K. Pratt, Digital Image Processing, 2nd ed. New York: Wiley,1991.
928 IEEE TRANSACTIONS ON IMAGE PROCESSING, VOL. 6, NO. 7, JULY 1997
[53] A. K. Jain, Fundamentals of Digital Image Processing, EnglewoodCliffs, NJ: Prentice-Hall, 1989.
[54] C. Poynton, “Color FAQ,” available at URL http://www.inforamp.net/poynton/Poynton-color.html.
[55] A. Ford and A. Roberts, “Color space conversions,” available at URLhttp://www.wmin.ac.uk/ITRG/docs/coloreq/coloreq.
[56] A. E. O. Munsell, Munsell Book of Color. Baltimore, MD: MunsellColor Co., 1929–1966.
[57] F. Birren, Ed., Munsell: A Grammar of Color, A Basic Treatise on theColor System of Albert H Munsell. New York: Van Nostrand Reinhold,1969.
[58] R. W. G. Hunt, “The specification of color appearance, I: Concepts andterms,” Color Res. Appl., vol. 2, no. 2, pp. 55–68, Summer 1977.
[59] , “Color terminology,” Color Res. Appl., vol. 3, no. 2, pp. 79–87,Summer 1978.
[60] , Measuring Color, 2nd ed. New York: Ellis Horwood, 1991.[61] W. D. Wright, “The sensitivity of the eye to small color differences,”
in Proc. Phys. Soc., Mar. 1941, vol. 53, no. 296, pp. 93–112.[62] D. L. MacAdam, “Visual sensitivities to color differences in daylight,”
J. Opt. Soc. Amer., vol. 32, no. 5, pp. 247–274, May 1942.[63] W. R. J. Brown and D. L. MacAdam, “Visual sensitivities to combined
chromaticity and luminance differences,” J. Opt. Soc. Amer., vol. 39,no. 10, pp. 808–834, Oct. 1949.
[64] G. Wyszecki and G. H. Felder, “New color matching ellipses,” J. Opt.Soc. Amer., vol. 61, no. 9, pp. 1135–1152, Sept. 1971.
[65] , “Color difference matches,” J. Opt. Soc. Amer., vol. 61, no. 11,pp. 1501–1513, Nov. 1971.
[66] D. B. Judd, “Chromatic sensibility to stimulus differences,” J. Opt. Soc.Amer., vol. 22, no. 2, pp. 72–108, Feb. 1932.
[67] , “A maxwell triangle yielding uniform chromaticity scales,” J.Opt. Soc. Amer., vol. 25, no. 1, pp. 24–35, Jan. 1935.
[68] E. Q. Adams, “X-Z planes in the 1931 ICI system of colorimetry,” J.Opt. Soc. Amer., vol. 32, no. 3, pp. 168–173, Mar. 1942.
[69] , “A theory of color vision,” Psychol. Rev., vol. 36, pp. 56–76,1923.
[70] M. Mahy, L. Van Eyckden, and A. Oosterlinck, “Evaluation of uniformcolor spaces developed after the adoption of CIELAB and CIELUV,”Color Res. Appl., vol. 19, no. 2, pp. 105–121, Apr. 1994.
[71] M. R. Pointer, “A comparison of the CIE 1976 color spaces,” ColorRes. Appl., vol. 6, no. 2, pp. 108–118, Summer 1981.
[72] A. R. Robertson, “The CIE 1976 color-difference formulae,” Color Res.Appl., vol. 2, no. 1, pp. 7–11, Spring 1977.
[73] J. M. Kasson and W. Plouffe, “An analysis of selected computerinterchange color spaces,” ACM Trans. Graphics, vol. 11, no. 4, pp.373–405, Oct. 1992.
[74] F. J. J. Clarke, R. McDonald, and B. Rigg, “Modification to theJPC79 color-difference formula,” J. Soc. Dyers Colorists, vol. 100, pp.128–132, 1984.
[75] M. R. Luo and B. Rigg, “BFD (l:c) color-difference formula. PartI—Development of the formula,” J. Soc. Dyers Colorists, vol. 103, pp.86–94, 1987.
[76] , “BFD (l:c) color-difference formula. Part II—Performance ofthe formula,” J. Soc. Dyers Colorists, vol. 103, pp. 126–132, 1987.
[77] CIE, “Industrial color difference evaluation,” CIE Pub. no. 116-1995,Centr. Bureau CIE, Vienna, Austria, 1995.
[78] F. Werblin, A. Jacobs, and J. Teeters, “The computational eye,” IEEESpectrum, vol. 33, no. 5, pp. 30–37, May 1996.
[79] E. Hering, Outlines of a Theory of the Light Sense. Cambridge, MA:Harvard Univ. Press, 1964, trans. L. M. Hurvich and D. Jameson.
[80] E. H. Land and J. J. McCann, “Lightness and retinex theory,” J. Opt.Soc. Amer., vol. 61, no. 1, pp. 1–11, Jan. 1971.
[81] E. H. Land, “The retinex theory of color vision,” Sci. Amer., vol. 237,no. 6, pp. 108–129, Dec. 1977.
[82] D. J. Jobson, Z. Rahman, and G. A. Woodell, “Properties and perfor-mance of a center/surround retinex,” IEEE Trans. Image Processing,vol. 6, pp. 451–462, Mar. 1997.
[83] , “A multi-scale retinex for bridging the gap between color imagesand the human observation of scenes,” IEEE Trans. Image Processing,this issue, pp. 965–976.
[84] J. A. Von Kries, “Die Gesichtsempfindungen,” in Handbuch der Phys-iologie der Menschen, Tiel III, W. Nagel, Ed., vol. 3, pp. 109–282.Vieweg, Brunswick, 1905, repr. as “Influence of adaptation on the effectsproduced by luminous stimuli” in [342, pp. 121–126].
[85] G. H. Golub and C. F. Van Loan, Matrix Computations, 2nd ed.Baltimore, MD: Johns Hopkins Univ. Press, 1989.
[86] International Color Consortium, Int. Color Consort. Profile Format, Ver.3.2, Nov. 20, 1995, available by anonymous ftp from ftp.fogra.org.
[87] E. Taft and J. Walden, Eds., PostScript Language Reference Manual,2nd ed. Reading, MA: Addison-Wesley, 1990.
[88] M. D. Fairchild, “Formulation and testing of an incomplete-chromatic-adaptation model,” Color Res. Appl., vol. 16, no. 4, pp. 243–250, Aug.1991.
[89] R. W. G. Hunt, “Sky-blue pink,” Color Res. Appl., vol. 1, no. 1, pp.11–16, Spring 1976.
[90] Y. Nayatani, K. Takahama, and H. Sobagaki, “Formulation of a non-linear model of chromatic adaptation,” Color Res. Appl., vol. 6, no. 3,pp. 161–171, Fall 1981.
[91] Y. Nayatani, K. Takahama, H. Sobagaki, and J. Hirono, “On exponentsof a nonlinear model of chromatic adaptation,” Color Res. Appl., vol. 7,no. 1, pp. 34–45, Spring 1982.
[92] K. Takahama, H. Sobagaki, and Y. Nayatani, “Formulation of a nonlin-ear model of chromatic adaptation for a light-gray background,” ColorRes. Appl., vol. 9, no. 2, pp. 106–115, Summer 1984.
[93] L. T. Maloney and B. A. Wandell, “Color constancy: A method forrecovering surface reflectance,” J. Opt. Soc. Amer. A, vol. 3, no. 1, pp.29–33, Jan. 1986.
[94] D. A. Forsyth, “A novel algorithm for color constancy,” Int. J. Comput.Vis., vol. 5, no. 1, pp. 5–36, Aug. 1990.
[95] G. D. Finlayson, M. S. Drew, and B. V. Funt, “Spectral sharpening:Sensor transformations for improved color constancy,” J. Opt. Soc.Amer. A, vol. 11, no. 5, pp. 1553–1563, May 1994.
[96] , “Color constancy: Generalized diagonal transforms suffice,” J.Opt. Soc. Amer. A, vol. 11, no. 11, pp. 3011–3019, Nov. 1994.
[97] G. D. Finlayson and B. V. Funt, “Coefficient channels: Derivation andrelationship to other theoretical studies,” Color Res. Appl., vol. 21, no.2, pp. 87–96, Apr. 1996.
[98] G. West and M. Brill, “Necessary and sufficient conditions for von Krieschromatic adaptation to give color constancy,” J. Math. Biol., vol. 15,no. 2, pp. 249–258, Oct. 1982.
[99] A. R. Robertson, “The future of color science,” Color Res. Appl., vol.7, no. 1, pp. 16–18, Spring 1982.
[100] R. W. G. Hunt, “Revised color-appearance model for related andunrelated colors,” Color Res. Appl., vol. 16, no. 3, pp. 146–165, June1991.
[101] , “Model of color vision for predicting the appearance of colorsunder different viewing conditions,” in [343], pp. 2–14.
[102] Y. Nayatani, K. Hashimoto, K. Takahama, and H. Sobagaki, “A non-linear color-appearance model using Est’evez-Hunt-Pointer primaries,”Color Res. Appl., vol. 12, pp. 231–242, Oct. 1987.
[103] Y. Nayatani, K. Takahama, H. Sobagaki, and K. Hashimoto, “Colorappearance model and chromatic-adaptation transform,” Color Res.Appl., vol. 15, pp. 210–221, Feb. 1990.
[104] Y. Nayatani, T. Mori, K. Hashimoto, H. Sobagaki, and K. Takahama,“Comparison of color-appearance models,” Color Res. Appl., vol. 15,pp. 272–284, Oct. 1990.
[105] T. Benzschawel and S. L. Guth, “ATDN: Toward a uniform color space,”Color Res. Appl., vol. 9, pp. 133–141, Fall 1984.
[106] S. L. Guth, “Model for color vision and light adaptation,” J. Opt. Soc.Amer. A, vol. 8, pp. 976–993, June 1991.
[107] M. R. Luo et al., “Quantifying color appearance, Part II—Testing colormodels performance using LUTCHI color appearance data,” Color Res.Appl., vol. 16, pp. 181–197, June 1991.
[108] M. R. Luo, et al., “Quantifying color appearance, Part IV—Transmissivemedia,” Color Res. Appl., vol. 18, pp. 191–205, June 1993.
[109] M. R. Luo, X. W. Gao, and S. A. R. Scrivener, “Quantifying colorappearance, Part V—Simultaneous contrast,” Color Res. Appl., vol. 20,pp. 18–28, Feb. 1995.
[110] M. D. Fairchild, “RLAB: A color appearance space for color reproduc-tion,” in [343], pp. 19–30.
[111] M. D. Fairchild and R. S. Berns, “Image color-appearance specificationthrough extension of CIELAB,” Color Res. Appl., vol. 18, pp. 178–190,June 1993.
[112] M. D. Fairchild, “Refinement of the RLAB color space,” Color Res.Appl., vol. 21, pp. 338–346, Oct. 1996.
[113] B. A. Wandell, Foundations of Vision. Sunderland, MA: Sinauer As-soc., 1995.
[114] K. Nassau, The Physics and Chemistry of Color: The Fifteen Causes ofColor. New York: Wiley, 1983.
[115] R. Rolleston, “Visualization of colorimetric calibration,” in [344], pp.299–309.
[116] D. Kalra, “GamOpt: A tool for visualization and optimization ofgamuts,” in [345], pp. 299–309.
[117] J. C. Whitaker, Electronic Displays: Technology, Design, and Applica-tions. New York: McGraw-Hill, 1994.
[118] J. A. Castellano, Handbook of Display Technology. New York: Aca-demic, 1992.
[119] S. Sherr, Electronic Displays, 2nd ed. New York: Wiley, 1993.
SHARMA AND TRUSSELL: DIGITAL COLOR IMAGING 929
[120] D. H. Brainard, “Calibration of a computer controlled color monitor,”Color Res. Appl., vol. 14, pp. 23–34, Feb. 1989.
[121] C. D. Child, “Discharge from hot CaO,” Phys. Rev., vol. 32, pp.492–511, May 1911.
[122] I. Langmuir, “The effect of space charge and residual gases onthermionic current in high vacuum,” Phys. Rev., 2nd Ser., vol. 2,pp. 450–486, Dec. 1913.
[123] W. B. Cowan, “An inexpensive scheme for calibration of a color monitorin terms of standard CIE coordinates,” Comput. Graph., vol. 17, pp.315–321, July 1983.
[124] R. S. Gentile, J. P. Allebach, and E. Walowit, “Quantization of colorimages based on uniform color spaces,” J. Imaging Technol., vol. 16,pp. 11–21, Feb. 1990.
[125] R. S. Berns, R. J. Motta, and M. E. Gorzynski, “CRT Colorimetry. PartI: Theory and practice,” Color Res. Appl., vol. 18, pp. 299–314, Oct.1993.
[126] R. S. Berns, M. E. Gorzynski, and R. J. Motta, “CRT colorimetry. PartII: Metrology,” Color Res. Appl., vol. 18, pp. 315–325, Oct. 1993.
[127] F. Kretz, “Subjectively optimal quantization of pictures,” IEEE Trans.Commun., vol. COMM-23, pp. 1288–1292, Nov. 1975.
[128] C. A. Poynton, “’Gamma’ and its disguises: The nonlinear mappings ofintensity in perception, CRT’s, film, and video,” SMPTE J., vol. 102,pp. 377–385, Dec. 1993.
[129] R. Patterson, “Gamma correction and tone reproduction in scannedphotographic images,” SMPTE J., vol. 103, pp. 377–385, June 1994.
[130] R. W. G. Hunt, The Reproduction of Color, 3rd ed. New York: Wiley,1975.
[131] W. B. Cowan and N. Rowell, “On the gun independency and phosphorconstancy of color video monitors,” Color Res. Appl., suppl., vol. 11,pp. S34–S38, 1986.
[132] V. Mani, “Calibration of color monitors,” Master’s thesis, North Car-olina State Univ., Raleigh, 1991.
[133] J. N. Cook, P. A. Sample, and R. N. Weinreb, “Solution to spatial inho-mogenity on video monitors,” Color Res. Appl., vol. 18, pp. 334–340,Oct. 1993.
[134] J. A. C. Yule, Principles of Color Reproduction, Applied to Photome-chanical Reproduction, Color Photography, and the Ink, Paper, andOther Related Industries. New York: Wiley, 1967.
[135] F. Grum and C. J. Bartleson, Eds., Optical Radiation Measurements:Color Measurement, vol. 2. New York: Academic, 1983.
[136] R. A. Hann and N. C. Beck, “Dye diffusion thermal transfer (D2C2)color printing,” J. Imaging Technol., vol. 16, pp. 238–241, Dec. 1990.
[137] R. A. Hann, “Thermal dye diffusion printing,” in [344], pp. 252–260.[138] R. C. Durbeck and S. Sherr, Eds., Output Hardcopy Devices. New
York: Academic, 1988.[139] J. L. Johnson, Principles of Nonimpact Printing, 2nd ed. Irvine, CA:
Palatino, 1992.[140] P. Kubelka and F. Munk, “Ein Beitrag zur Optik der Farbanstriche,” Z.
Tech. Phys., vol. 11a, pp. 593–601, 1931.[141] A. Berger-Schunn, Practical Color Measurement. New York: Wiley,
1994.[142] R. S. Berns, “Spectral modeling of a dye diffusion thermal transfer
printer,” J. Electron. Imaging, vol. 2, pp. 359–370, Oct. 1993.[143] M. Inui, “Fast algorithms for computing color gamuts,” Color Res. Appl.,
vol. 18, pp. 341–348, Oct. 1993.[144] S. I. Nin, J. M. Kasson, and W. Plouffe, “Printing CIELAB images on
a CMYK printer using tri-linear interpolation,” in [346], pp. 356–364.[145] S. A. Rajala and A. P. Kakodkar, “Interpolation of color data,” in
Proc. IS&T/SID Color Imaging Conference: Transforms and Portabilityof Color, Nov. 7–11, 1993, pp. 180–183.
[146] P. C. Hung, “Colorimetric calibration in electronic imaging devicesusing a look-up table model and interpolations,” J. Electron. Imaging,vol. 2, pp. 53–61, Jan. 1993.
[147] H. R. Kang and P. G. Anderson, “Neural network applications to thecolor scanner and printer calibrations,” J. Electron. Imaging, vol. 1, pp.125–134, Apr. 1992.
[148] J. Z. Chang, C. A. Bouman, and J. P. Allebach, “Recent results incolor calibration using sequential linear interpolation,” in IS&T’s 47thAnn. Conf., ICPS’94: Physics and Chemistry of Imaging Systems, May15–20, 1994, vol. 2, pp. 500–505.
[149] H. E. J. Neugebauer, “Die theoretischen Grundlagen des Mehrfar-benbuchdrucks,” Zeitschrift wissenschaftliche Photographie Photophys.Photochem., vol. 36, pp. 73–89, Apr. 1937, repr. in [155, pp. 194–202].
[150] J. A. S. Viggiano, “Modeling the color of multi-colored halftones,” inProc. TAGA , 1990, pp. 44–62.
[151] E. Demichel, Procede, 1924, vol. 26, pp. 17–21 and 26–27.[152] W. Rhodes, “Fifty years of the Neugebauer equations,” in Proc. SPIE:
Neugebauer Memorial Seminar on Color Reproduction, K. Sayangi, Ed.,1989, vol. 1184, pp. 7–18.
[153] J. A. C. Yule and W. J. Neilsen, “The penetration of light into paper andits effect on halftone reproduction,” in TAGA Proc., May 7–9, 1951, pp.65–76.
[154] F. R. Clapper and J. A. C. Yule, “Reproduction of color with halftoneimages,” in Proc. Seventh Ann. Tech. Meet. TAGA, May 9, 1955, pp.1–14.
[155] K. Sayangi, Ed., Proc. SPIE: Neugebauer Memorial Seminar on ColorReproduction, Dec. 14–15, 1989, vol. 1184.
[156] R. Balasubramanian, “Colorimetric modeling of binary color printers,”in Proc. IEEE Int. Conf. Image Processing, Nov. 1995, pp. II-327–II-330.
[157] S. Gustavson, “The color gamut of halftone reproduction,” in Proc.IS&T/SID Fourth Color Imaging Conference: Color Science, Systemsand Applications, Scottsdale, AZ, Nov. 19–22, 1996, pp. 80–85.
[158] M. C. Stone, W. B. Cowan, and J. C. Beatty, “Color gamut mappingand the printing of digital color images,” ACM Trans. Graph., vol. 7,pp. 249–292, Oct. 1988.
[159] R. Rolleston and R. Balasubramanian, “Accuracy of various types ofneugebauer models,” in Proc. IS&T/SID Color Imaging Conference:Transforms and Portability of Color, Nov. 1993, pp. 32–37.
[160] R. Balasubramanian, “A printer model for dot-on-dot halftone screens,”in [347], pp. 356–364.
[161] M. Rodriguez, “A graphics arts perspective on RGB-to-CMYK con-version,” in Proc. IEEE Int. Conf. Image Processing, Nov. 1995, pp.II-319–II-322.
[162] H. Kang, “Printer-related color processing techniques,” in [347], pp.410–419.
[163] O. Sahni, “Color printing technologies,” in Proc. SPIE: Printing Tech-nologies for Images, Gray Scale, and Color, D. B. Dove, T. Abe, andJ. Heinzl Eds., 1991, vol. 1458, pp. 4–16.
[164] I. Rezanka, “Thermal ink jet: A review,” in [346], pp. 192–200.[165] K. I. Werner, “The flat panel’s future,” IEEE Spectrum, vol. 30, pp.
18–26, Nov. 1993.[166] S. Matsumoto, Ed., Electronic Display Devices. New York: Wiley,
1990.[167] E. Kaneko, Liquid Crystal TV Displays: Principles and Applications of
Liquid Crystal Displays. Tokyo, Japan: KTK Scientific, 1987.[168] S. Gregory, R. Poe, and D. Walker, “Communicating color appearance
with the ICC color profile,” in Proc. IS&T/SID 2nd Color Imaging Conf.:Color Science, Systems, and Applications, Scottsdale, AZ, Nov. 15–18,1994, pp. 170–174.
[169] W. F. Schreiber, Fundamentals of Electronic Imaging Systems: SomeAspects of Image Processing, 3rd ed. New York: Springer-Verlag,1993.
[170] J. M. Younse, “Mirrors on a chip,” IEEE Spectrum, vol. 30, pp. 27–31,Nov. 1993.
[171] L. A. Yoder, “The TI digital light processing micromirror tech: Puttingit to work now,” Adv. Imaging, vol. 11, pp. 43–46, June 1996.
[172] V. Ostromoukhov, “Chromaticity gamut enhancement by heptatonemulti-color printing,” in [343], pp. 139–150.
[173] H. Boll, “A color to colorant transformation for a seven ink process,”in [348], pp. 108–118.
[174] E. M. Granger, “Press controls for extra-trinary printing,” in [334], pp.147–150.
[175] R. McCluney, Introduction to Radiometry and Photometry. Boston,MA: Artech House, 1994.
[176] P. H. Swain and S. M. Davis, Eds., Remote Sensing: The QuantitativeApproach. New York: McGraw-Hill, 1978.
[177] J. B. Campbell, Introduction to Remote Sensing. New York: Guilford,1987.
[178] R. O. Green et al., “AVIRIS: A new approach to earth remote sensing,”Opt. Photon. News, vol. 6, pp. 30–33, Jan. 1995.
[179] F. Grum and R. J. Becherer, Optical Radiation Measurements: Radiom-etry, vol. 1. New York: Academic, 1979.
[180] W. Budde, Optical Radiation Measurements: Physical Detectors ofOptical Radiation, vol. 4. New York: Academic, 1983.
[181] T. E. Jenkins, Optical Sensing Techniques and Signal Processing. En-glewood Cliffs, NJ: Prentice-Hall, 1987.
[182] R. W. Boyd, Radiometry and the Detection of Optical Radiation. NewYork: Wiley, 1983.
[183] E. L. Dereniak and D. G. Crowe, Optical Radiation Detectors. NewYork: Wiley, 1984.
[184] R. S. Berns and K. H. Petersen, “Empirical modeling of systematicspectrophotometric errors,” Color Res. Appl., vol. 13, pp. 243–256, Aug.1988.
[185] M. D. Fairchild and L. Reniff, “Propagation of random errors inspectrophotometric colorimetry,” Color Res. Appl., vol. 16, pp. 360–367,Dec. 1991.
930 IEEE TRANSACTIONS ON IMAGE PROCESSING, VOL. 6, NO. 7, JULY 1997
[186] T. H. James, Ed., The Theory of Photographic Process, 4th ed. NewYork: MacMillan, 1977.
[187] W. Thomas, Ed., SPSE Handbook of Photographic Science and Engi-neering. New York: Wiley, 1973.
[188] E. W. H. Selwyn, “A theory of graininess,” Photog. J., vol. 73, pp. 571,1935.
[189] , “Experiments on the nature of graininess,” Photog. J., vol. 79,p. 513, 1939.
[190] Y. Hashimoto, M. Yamamoto, and T. Asaida, “Cameras and displaysystems,” Proc. IEEE, vol. 83, pp. 1032–1043 July 1995,.
[191] K. A. Parulski, L. J. D’Luna, B. L. Benamati, and P. R. Shelley, “High-performance digital color video camera,” J. Electron. Imaging, vol. 1,pp. 35–45, Jan. 1992.
[192] D. H. Brainard, “Bayesian method for reconstructing color imagesfrom trichromatic samples,” in IS&T’s 47th Annu. Conf., ICPS’94: ThePhysics and Chemistry of Imaging Systems, May 15–20, 1994, vol. 2,pp. 375–380.
[193] D. R. Cok, “Reconstruction of CCD images using template matching,”in IS&T’s 47th Annu. Conf., ICPS’94: The Physics and Chemistry ofImaging Systems, May 15–20, 1994, vol. 2, pp. 380–385.
[194] D. H. Brainard and D. Sherman, “Reconstructing images from trichro-matic samples: From basic research to practical applications,” in Proc.Third IS&T/SID Color Imaging Conf.: Color Science, Systems, andApplications, Nov. 1995, pp. 4–10.
[195] D. L. Spooner, “Translucent blurring errors in small area reflectancesspectrophotometric and densitometric measurements,” in Proc. TechnicalAssociation Graphic Arts Annu. Meet., Rochester, NY, May 2–5, 1991,pp. 130–143.
[196] G. Sharma and H. J. Trussell, “Set theoretic estimation in color scannercharacterization,” J. Electron. Imaging, vol. 5, pp. 479–489, Oct. 1996.
[197] R. Luther, “Aus Dem Gebiet der Farbreizmetrik,” Z. Technol. Phys.,vol. 8, pp. 540–558, 1927.
[198] H. E. Ives, “The transformation of color-mixture equations from onesystem to another,” J. Franklin Inst., vol. 16, pp. 673–701, 1915.
[199] P. C. Hung, “Colorimetric calibration for scanners and media,” Proc.SPIE, vol. 1448, pp. 164–174, 1991.
[200] J. J. Gordon and R. A. Holub, “On the use of linear transformations forscanner calibration,” Color Res. Appl., vol. 18, pp. 218–219, June 1993.
[201] H. E. J. Neugebauer, “Quality factor for filters whose spectral trans-mittances are different from color mixture curves, and its application tocolor photography,” J. Opt. Soc. Amer., vol. 46, pp. 821–824, Oct. 1956.
[202] P. L. Vora and H. J. Trussell, “Mathematical methods for the designof color scanning filters,” IEEE Trans. Image Processing, vol. 6, pp.312–320, Feb. 1997.
[203] , “Mathematical methods for the analysis of color scanningfilters,” IEEE Trans. Image Processing, vol. 6, pp. 321–327, Feb. 1997.
[204] P. L. Vora, H. J. Trussell, and L. R. Iwan, “A mathematical method fordesigning a set of color scanning filters,” in [344], pp. 322–332.
[205] M. J. Vrhel and H. J. Trussell, “Filter considerations in color correction,”IEEE Trans. Image Processing, vol. 3, pp. 147–161, Mar. 1994.
[206] , “Optimal color filters in the presence of noise,” IEEE Trans.Image Processing, vol. 4, pp. 814–823, June 1995.
[207] M. Wolski, J. P. Allebach, C. A. Bouman, and E. Walowit, “Optimizationof sensor response functions for colorimetry of reflective and emissiveobjects,” in [348], pp. 209–219.
[208] M. Wolski, C. A. Bouman, J. P. Allebach, and E. Walowit, “Optimizationof sensor response functions for colorimetry of reflective and emissiveobjects,” in Proc. IEEE Int. Conf. Image Processing, Nov. 1995, pp.II-323–II-326.
[209] M. Wolski, J. P. Allebach, C. A. Bouman, and E. Walowit, “Optimizationof sensor response functions for colorimetry of reflective and emissiveobjects,” IEEE Trans. Image Processing, vol. 5, pp. 507–517, Mar. 1996.
[210] B. Sluban, “Comparison of colorimetric and spectrophotometric algo-rithms for computer match prediction,” Color Res. Appl., vol. 18, pp.74–79, Apr. 1993.
[211] K. Engelhardt and P. Seitz, “Optimum color filters for CCD digitalcameras,” Opt. Eng., vol. 32, pp. 3015–3023, June 1993.
[212] G. Sharma and H. J. Trussell, “Figures of merit for color scanners,”IEEE Trans. Image Processing, this issue, pp. 990–1001.
[213] J. E. Farrell and B. A. Wandell, “Scanner linearity,” J. Electron. Imaging,vol. 2, pp. 225–230, July 1993.
[214] J. E. Hardis, “Improving color measurements of displays,” in [334], pp.182–191.
[215] M. A. Rodriguez and T. G. Stockham, “Producing colorimetric datafrom densitometric scans,” in [349], pp. 413–418.
[216] H. Haneishi, T. Hirao, A. Shimazu, and Y. Mikaye, “Colorimetricprecision in scanner calibration using matrices,” in Proc. Third IS&T/SIDColor Imaging Conference: Color Science, Systems and Applications,Nov. 1995, pp. 106–108.
[217] H. R. Kang, “Color scanner calibration,” J. Imaging Sci. Technol., vol.36, pp. 162–170, Mar./Apr. 1992.
[218] J. J. Y. Huang and P. M. Schultieiss, “Block quantization of correlatedGaussian random variables,” IEEE Trans. Commun. Syst., vol. CS-11,pp. 289–296, Sept. 1963.
[219] J. Cohen, “Dependency of the spectral reflectance curves of the Munsellcolor chips,” Psychronomic Sci., vol. 1, pp. 369–370, 1964.
[220] B. A. Wandell, “The synthesis and analysis of color images,” IEEETrans. Pattern Anal. Machine Intell., vol. PAMI-9, pp. 2–13, Jan. 1987.
[221] D. Marimont and B. A. Wandell, “Linear models of surface andilluminant spectra,” J. Opt. Soc. Amer. A, vol. 9, pp. 1905–1913, Nov.1992.
[222] M. J. Vrhel, R. Gershon, and L. S. Iwan, “Measurement and analysis ofobject reflectance spectra,” Color Res. Appl., vol. 19, pp. 4–9, Feb. 1994.
[223] J. Ho, B. V. Funt, and M. S. Drew, “Separating a color signal into illu-mination and surface reflectance components: Theory and applications,”IEEE Trans. Pattern Anal. Machine Intell., vol. 12, pp. 966–977, Oct.1990.
[224] M. J. Vrhel and H. J. Trussell, “Color correction using principalcomponents,” Color Res. Appl., vol. 17, pp. 328–338, Oct. 1992.
[225] P. R. Chang and T. H. Hsieh, “Constrained nonlinear optimizationapproaches to color signal separation,” IEEE Trans. Image Processing,vol. 4, pp. 81–94, Jan. 1995.
[226] P. Chen and H. J. Trussell, “Color filter design for multiple illuminantsand detectors,” in Proc. Third IS&T/SID Color Imaging Conf.: ColorScience, Systems and Applications, Nov. 1995, pp. 67–70.
[227] D. Travis, Effective Color Displays: Theory and Practice. New York:Academic, 1991.
[228] R. M. Gray, “Vector quantization,” IEEE Signal Processing Mag., vol.4, pp. 4–29, Apr. 1984.
[229] A. Gersho and R. M. Gray, Vector Quantization and Signal Compression.Boston, MA: Kluwer, 1992.
[230] L. Hyafil and R. L. Rivest, “Construction of optimal binary decisiontrees is NP-complete,” Inform. Processing Lett., vol. 5, pp. 15–17, May1976.
[231] P. Brucker, “On the complexity of clustering problems,” in Optimizationand Operations Research, R. Henn, B. Korte, and W. Oetly, Eds. NewYork: Springer-Verlag, 1977, pp. 45–54.
[232] M. R. Garey, D. S. Johnson, and H. S. Witsenhausen, “The complexityof the generalized Lloyd–Max problem,” IEEE Trans. Inform. Theory,vol. IT-28, pp. 255–256, Mar. 1982.
[233] W. L. G. Koontz, P. M. Narendra, and K. Fukunaga, “A branchand bound clustering algorithm,” IEEE Trans. Comput., vol. C-24, pp.908–915, Sept. 1975.
[234] Y. Linde, A. Buzo, and R. M. Gray, “An algorithm for vector quantizerdesign,” IEEE Trans. Commun., vol. COMM-28, pp. 84–89, Jan. 1980.
[235] S. P. Lloyd, “Least squares quantization in PCM,” unpub. Tech. Note,Bell Labs; later publ. as [350].
[236] J. Max, “Quantizing for minimum distortion,” IRE Trans. Inform.Theory, vol. IT-6, pp. 7–12, Mar. 1960.
[237] J. B. MacQueen, “Some methods for classification and analysis ofmultivariate observations,” in Proc. 5th Berkeley Symp. MathematicalStatistics and Probability 1, 1967, pp. 281–297.
[238] P. Heckbert, “Color image quantization for frame buffer display,”Comput. Graph., vol. 16, pp. 297–307, July 1982.
[239] G. Braudaway, “A procedure for optimum choice of a small number ofcolors from a large color palette for color imaging,” in Proc. ElectronicImaging’87, San Francisco, CA, 1987, pp. 75–79.
[240] S. J. Wan, S. K. M. Wong, and P. Prusinkiewicz, “An algorithm formulti-dimensional data clustering,” ACM Trans. Math. Softw., vol. 14,pp. 153–162, June 1988.
[241] S. J. Wan, P. Prusinkiewicz, and S. K. M. Wong, “Variance-based colorimage quantization for frame-buffer display,” Color Res. Appl., vol. 15,pp. 52–58, Feb. 1990.
[242] T. S. Liu and L. W. Chang, “Fast color image quantization with errordiffusion and morphological operations,” Signal Processing, vol. 43,pp. 293–303, May 1995.
[243] M. T. Orchard and C. A. Bouman, “Color quantization of images,” IEEETrans. Signal Processing, vol. 39, pp. 2677–2690, Dec. 1991.
[244] R. Balasubramanian, J. P. Allebach, and C. A. Bouman, “Color-imagequantization with use of a fast binary splitting technique,” J. Opt. Soc.Amer, A, vol. 11, pp. 2777–2786, Nov. 1994.
[245] X. Wu, “Color quantization by dynamic programming and principalanalysis,” ACM Trans. Graph., vol. 11, pp. 348–372, Oct. 1992.
[246] R. Balasubramanian, C. A. Bouman, and J. P. Allebach, “Sequen-tial scalar quantization of vectors: An analysis,” IEEE Trans. ImageProcessing, vol. 4, pp. 1282–1295, Sept. 1995.
[247] , “Sequential scalar quantization of color images,” J. Electron.Imaging, vol. 3, pp. 45–59, Jan. 1994.
SHARMA AND TRUSSELL: DIGITAL COLOR IMAGING 931
[248] B. W. Kolpatzik and C. A. Bouman, “Optimized universal color palettedesign for error diffusion,” J. Electron. Imaging, vol. 4, pp. 131–143,Apr. 1995.
[249] M. Gervautz and W. Purgathofer, “A simple method for color quanti-zation: Octree quantization,” in New Trends in Computer Graphics, H.M. Thalmann and D. Thalmann, Eds. New York: Springer, 1988, pp.219–231.
[250] , “A simple method for color quantization: Octree quantization,”in Graphics Gems, A. S. Glassner, Ed. New York: Academic, 1990,pp. 287–293.
[251] G. Joy and Z. Xiang, “Center-cut for color-image quantization,” Vis.Comput., vol. 10, no. 1, pp. 62–66, 1993.
[252] R. Balasubramanian and J. P. Allebach, “A new approach to paletteselection for color images,” J. Imaging Tech., vol. 17, pp. 284–290,1991.
[253] E. Roytman and C. Gotsman, “Dynamic color quantization of videosequences,” IEEE Trans. Visual. Comput. Graph., vol. 1, pp. 274–286,Sept. 1995.
[254] C. B. Atkins, T. J. Flohr, D. P. Hilgenberg, C. A. Bouman, and J. P.Allebach, “Model-based color image sequence quantization,” in Proc.SPIE: Human Vision, Visual Processing, and Digital Display V, B. E.Rogowitz and J. P. Allebach, Eds., 1994, vol. 2179, pp. 310–309.
[255] V. S. Iverson and E. A. Riskin, “A fast method for combining palettesof color quantized images,” in Proc. ICASSP, 1993, vol. V, pp.317–320. Images resulting from this technique can be viewed at URLhttp://www.numinous.com/palette.htm.
[256] J. H. Friedman, J. L. Bentley, and R. A. Finkel, “An algorithm forfinding best matches in logarithmic expected time,” ACM Trans. Math.Softw., vol. 3, pp. 209–226, Sept. 1977.
[257] M. T. Orchard, “A fast nearest neighbor search algorithm,” in Proc.ICASSP, 1991, pp. 2297–2300.
[258] C. M. Huang, “Fast full search equivalent encoding algorithms for imagecompression using vector quantization,” IEEE Trans. Image Processing,vol. 1, pp. 413–416, July 1992.
[259] D. B. Judd and G. Wyszecki, Color in Business, Science, and Industry,3rd ed. New York: Wiley, 1975.
[260] J. M. Adams, D. D. Faux, and L. J. Riebe, Printing Technology, 3rd ed.Albany, NY: Delmar, 1988.
[261] J. C. Stoffel and J. F. Moreland, “A survey of electronic techniques forpictoral image reproduction,” IEEE Trans. Commun., vol. COMM-29,pp. 1898–1925, Dec. 1981.
[262] D. Anastassiou and K. S. Pennington, “Digital halftoning of images,”IBM J. Res. Develop., vol. 26, pp. 687–697, Nov. 1982.
[263] R. Ulichney, Digital Halftoning. Cambridge, MA: MIT Press, 1987.[264] P. Roetling and R. P. Loce, “Digital halftoning,” in Image Processing:
Fundamentals and Applications, E. R. Dougherty, Ed. New York:Marcel Dekker, 1994.
[265] K. T. Knox, “Introduction to digital halftones,” in IS&T’s 47th AnnualConf., ICPS’94: Physics and Chemistry of Imaging Systems, vol. 2, pp.456–459.
[266] T. Holladay, “An optimum algorithm for halftone generation for displaysand hard copies,” in Proc. SID, vol. 21, no. 2, pp. 185–192, 1980.
[267] P. Delabastita, “Screening techniques, moire in four color printing,” inTAGA Proc., 1992, pp. 44–65.
[268] I. Amidror, R. D. Hersch, and V. Ostromoukhov, “Spectral analysisand minimization of moire patterns in color separation,” J. Electron.Imaging, vol. 3, pp. 295–317, July 1994.
[269] B. E. Bayer, “An optimum method for two level rendition of continuoustone pictures,” in IEEE Int. Conf. Communications, 1973, vol. 1, pp.26.11–26.15.
[270] V. Ostromoukhov and R. D. Hersch, “Halftoning by rotating nonbayerdispersed dither arrays,” in Proc. SPIE: Human Vision, Visual Process-ing, and Digital Display VI, B. E. Rogowitz and J. P. Allebach, Eds.,1995, vol. 2411, pp. 180–197.
[271] L. G. Roberts, “Picture coding using pseudo-random noise,” IRE Trans.Inform. Theory, vol. IT-8, pp. 145–154, Feb. 1962.
[272] M. R. Schroeder, “Images from computers,” IEEE Spectrum, vol. 6, pp.66–78, Mar. 1969.
[273] R. W. Floyd and L. Steinberg, “An adaptive algorithm for spatialgrayscale,” in Proc. SID, vol. 17, no. 2, pp. 75–77 1976.
[274] D. Anastassiou, “Error diffusion coding for A/D conversion,” IEEETrans. Circuits Syst., vol. 36, pp. 1175–1186, Sept. 1989.
[275] S. Kollias and D. Anastassiou, “A unified neural network approach todigital image halftoning,” IEEE Trans. Signal Processing, vol. 39, pp.980–984, Apr. 1991.
[276] K. T. Knox, “Error image in error diffusion,” in Proc. SPIE: ImageProcessing Algorithms and Techniques III, J. R. Sullivan, M. Rabbani,and B. M. Dawson, Eds., 1992, vol. 1657, pp. 268–279.
[277] K. T. Knox and R. Eschbach, “Threshold modulation in error diffusion,”J. Electron. Imaging, vol. 2, pp. 185–192, July 1993.
[278] J. R. Sullivan, R. L. Miller, and T. J. Wetzel, “Color digital halftoningwith vector error diffusion,” U.S. Patent 5 070 413, Dec. 3, 1991.
[279] H. Haneishi, T. Suzuki, N. Shimoyama, and Y. Miyake, “Color digitalhalftoning taking colorimetric color reproduction into account,” J.Electron. Imaging, vol. 5, pp. 97–106, Jan. 1996.
[280] J. F. Jarvis, C. N. Judice, and W. H. Ninke, “A survey of techniquesfor the display of continuous tone images on bilevel displays,” Comput.Graph. Image Processing, vol. 5, pp. 13–40, Mar. 1976.
[281] J. Shiau and Z. Fan, “A set of easily implementable coefficients in errordiffusion with reduced worm artifacts,” in [334], pp. 265–270.
[282] K. T. Knox, “Error diffusion: A theoretical view,” in [349], pp. 326–331.[283] T. N. Pappas, “Model-based halftoning of color images,” in Proc.
IS&T’s Eighth Int. Congress Advances in Non-Impact Printing Tech-nologies, 1992, pp. 270–274.
[284] J. O. Limb, “Design of dither waveforms for quantized visual signals,”Bell Syst. Tech. J., vol. 48, pp. 2555–2582, Sept. 1969.
[285] J. P. Allebach and B. Liu, “Analysis of halftone dot profile and aliasingin the discrete binary representation of images,” J. Opt. Soc. Amer., vol.67, pp. 1147–1154, Sept. 1977.
[286] J. P. Allebach, “Aliasing and quantization in the efficient display ofimages,” J. Opt. Soc. Amer., vol. 69, pp. 869–877, June 1979.
[287] R. A. Ulichney, “Dithering with blue noise,” in Proc. IEEE, vol. 76,pp. 56–79 Jan. 1988.
[288] , “The void-and-cluster method for dither array generation,” in[349], pp. 332–343.
[289] T. Mitsa and K. J. Parker, “Digital halftoning technique using a blue-noise mask,” J. Opt. Soc. Amer. A, vol. 9, pp. 1920–1929, Nov. 1992.
[290] M. Yao and K. J. Parker, “Modified approach to the construction of ablue-noise mask,” J. Electron. Imaging, vol. 3, pp. 92–97, Jan. 1994.
[291] J. L. Mannos and D. J. Sakrison, “The effects of a visual fidelity criterionon the encoding of images,” IEEE Trans. Inform. Theory, vol. IT-20,pp. 525–536, July 1974.
[292] J. R. Sullivan, L. A. Ray, and R. Miller, “Design of minimum visualmodulation halftone patterns,” IEEE Trans. Syst., Man, Cybern., vol.21, pp. 33–38, Jan. 1991.
[293] T. N. Pappas and D. L. Neuhoff, “Model-based halftoning,” in Proc.SPIE: Human Vision, Visual Processing, and Digital Display II, B. E.Rogowitz, M. H. Brill, and J. P. Allebach, Eds., 1991, vol. 1453, pp.244–255.
[294] M. Analoui and J. P. Allebach, “Model based halftoning using directbinary search,” in [351], pp. 96–108.
[295] J. B. Mulligan and A. J. Ahumada, Jr., “Principled halftoning based onhuman vision models,” in [351], pp. 109–120.
[296] J. P. Allebach, T. J. Flohr, and D. P. Hilgenberg, “Model-based halfton-ing via direct binary search,” in Proc. IS&T’s 47th Ann. Conf., ICPS’94:Physics and Chemistry of Imaging Systems, vol. 2, pp. 476–482.
[297] T. J. Flohr et al., “Model based color image quantization,” in [349],pp. 265–270.
[298] T. N. Pappas, “Digital halftoning: A model-based perspective,” J. Imag.Syst. Tech., vol. 7, pp. 110–120, Summer 1996.
[299] , “Model-based halftoning of color images,” IEEE Trans. ImageProcessing, this issue, pp. 1014–1024.
[300] J. Sullivan, R. Miller, and G. Pios, “Image halftoning using a visualmodel in error diffusion,” J. Opt. Soc. Amer. A, vol. 10, pp. 1714–1724,Aug. 1993.
[301] , “Optimized error diffusion based on a human vision model,” in[351], pp. 152–164.
[302] B. W. Kolpatzik and C. A. Bouman, “Optimized error diffusion forimage display,” J. Electron. Imag., vol. 1, pp. 277–292, July 1992.
[303] B. Widrow and S. D. Stearns, Adaptive Signal ProcessingEnglewoodCliffs, NJ: Prentice-Hall, 1985.
[304] P. W. Wong, “Adaptive error diffusion and its application in multiresolu-tion rendering,” IEEE Trans. Image Processing, vol. 5, pp. 1184–1196,July 1996.
[305] L. Akarun, Y. Yardimci, and A. E. Cetin, “Adaptive methods fordithering color images,” in Proc. IEEE Int. Conf. Image Processing,Oct. 1995, vol. III, pp. 125–128.
[306] , “Adaptive methods for dithering color images,” IEEE Trans.Image Processing, this issue, pp. 950–955.
[307] J. R. Goldschneider, E. A. Riskin, and P. W. Wong, “Embedded colorerror diffusion,” in Proc. IEEE Int. Conf. Image Processing, Sept. 1996,vol. I, pp. 565–568.
[308] , “Embedded multilevel error diffusion,” IEEE Trans. ImageProcessing, this issue pp. 956–964.
[309] R. S. Gentile, E. Walowit, and J. P. Allebach, “Quantization andmultilevel halftoning of color images for near-original image quality,”J. Opt. Soc. Amer. A, vol. 7, pp. 1019–1026, June 1990.
932 IEEE TRANSACTIONS ON IMAGE PROCESSING, VOL. 6, NO. 7, JULY 1997
[310] W. K. Pratt, “Spatial transform coding of color images,” IEEE Trans.Commun. Technol., vol. COMM-19, pp. 980–992, Dec. 1971.
[311] L. Stenger, “Quantization of TV chrominance signals consideringthe visibility of small color differences,” IEEE Trans. Commun., vol.COMM-25, pp. 1393, Nov. 1977.
[312] S. E. Budge, T. G. Stockham, D. M. Chabries, and R. W. Christiansen,“Vector quantization of color digital images within the human visualmodel,” in Proc. ICASSP, 1988, pp. 816–819.
[313] J. W. Woods, Subband Image Coding. Boston, MA: Kluwer, 1991.[314] R. E. Vandyck and S. A. Rajala, “Subband/VQ coding of color images
using separable diamond-shaped subbands,” in Proc. IEEE VSPC, 1992.[315] , “Subband/VQ coding in perceptually uniform color spaces,” in
Proc. ICASSP, 1992, pp. 237–240.[316] V. Bhaskaran and K. Konstantinides, Image and Video Compression
Standards: Algorithms and Architectures. Boston, MA: Kluwer, 1995.[317] W. B. Pennebaker and J. L. Mitchell, JPEG Still Image Data Compres-
sion Standard. New York: Van Nostrand Reinhold, 1993.[318] J. L. Mitchell, C. Fogg, D. J. LeGall, and W. B. Pennebaker, Eds.,
MPEG Digital Video Compression Standard. New York: Chapman &Hall, 1997.
[319] A. Netravali and B. Haskell, Eds., Digital Pictures, Representation,Compression, and Standards. New York: Plenum, 1995.
[320] M. Matsuki and D. T. Lee, “Development of color facsimile standards:An overview,” in SID Symp. Dig. Tech. Papers, 1994, pp. 883–886.
[321] A. Mutz and D. T. Lee, “An international standard for color facsimile,”in Proc. IS&T/SID Second Color Imaging Conf.: Color Science, Systems,and Applications, Scottsdale, AZ, Nov. 15–18, 1994, pp. 52–54.
[322] X. Wu, “YIQ vector quantization in a new color palette architecture,”IEEE Trans. Image Processing, vol. 5, pp. 321–329, Feb. 1996.
[323] A. Zaccarin and B. Liu, “A novel approach for coding color quantizedimages,” IEEE Trans. Image Processing, vol. 2, pp. 442–453, Oct. 1993.
[324] M. J. Gormish, “Compression of palettized images by color,” in Proc.IEEE Int. Conf. Image Processing, 1995, pp. I274–277.
[325] A. Zandi, D. G. Stork, and J. D. Allen, “Optimizing bit-plane context-dependent entropy coding for palettized images,” in Proc. IEEE Int.Conf. Image Processing, 1995, pp. I270–273.
[326] R. S. Gentile, E. Walowit, and J. P. Allebach, “A comparison of tech-niques for color gamut mismatch compensation,” J. Imaging Technol.,vol. 16, pp. 176–181, 1990.
[327] M. Wolski, J. P. Allebach, and C. A. Bouman, “Gamut mapping:Squeezing the most out of your color system,” in Proc. IS&T/SIDSecond Color Imaging Conf.: Color Science, Systems and Applications,Scottsdale, AZ, Nov. 15–18, 1994, pp. 89–92.
[328] E. D. Montag and M. D. Fairchild, “Simulated color gamut mappingusing simple rendered images,” in [334], pp. 316–325.
[329] , “Evaluation of gamut mapping techniques using simple renderedimages and artificial gamut boundaries,” IEEE Trans. Image Processing,this issue, pp. 977–989.
[330] T. Hoshino and R. S. Berns, “Color gamut mapping for color hard copyimages,” in [343], pp. 152–165.
[331] K. E. Spaulding, R. N. Ellson, and J. R. Sullivan, “UltraColor: A newgamut mapping strategy,” in Proc. SPIE: Device-Independent ColorImaging II, E. Walowit, Ed., 1995, vol. 2414, pp. 61–68.
[332] P. A. Crean and R. R. Buckley, “Device independent color—Who wantsit?,” in [345], pp. 267–272.
[333] Z. T. Liang, “Dealing with the device-dependency of color for device-independent color reproduction,” in [343], pp. 178–183.
[334] J. Bares, Ed., Proc. SPIE: Color Imaging—Device-Independent Color,Color Hard Copy, and Graphic Arts, 1996, vol. 2658.
[335] R. S. Gentile, “Device independent color in PostScript,” in [349], pp.419–432.
[336] M. Stokes, “Description of the ColorSync 2.0 architecture,” in [348],
pp. 120–124.[337] G. B. Pawle, “Inside the ICC color device profile,” in Proc. IS&T/SID
Third Color Imaging Conf.: Color Science, Systems and Applications,Scottsdale, AZ, Nov. 7–10, 1995, pp. 160–163.
[338] I. C. Chang, “Tunable acousto-optic filters: An overview,” in Proc. SPIE,J. B. Houston, Ed., vol. 90, pp. 12–22, 1976.
[339] J. Xu and R. Stroud, Acousto-Optic Devices: Principles Design, andApplications. New York: Wiley, 1992.
[340] P. Schnister, “Adaptive spectral filtering technology and its applicationfor target simulation and optical sensor testing,” in Proc. SPIE Conf.Photometric Engineering of Sources and Systems, San Diego, CA, July27–Aug. 1, 1997, to be presented.
[341] S. Berman, “Color accuracy and image management for scientific andmedical databases,” Adv. Imaging, vol. 11, pp. 32–37, June 1996.
[342] D. L. MacAdam, Ed., Sources of Color Science. Cambridge, MA: MITPress, 1970.
[343] R. J. Motta and H. A. Berberian, Eds., Proc. SPIE: Device-IndependentColor Imaging and Imaging Systems Integration, 1993, vol. 1909.
[344] J. Bares, Ed., Proc. SPIE: Color Hard Copy and Graphic Arts II, 1993,vol. 1912.
[345] , Proc. SPIE: Color Hard Copy and Graphic Arts III, 1994, vol.2171.
[346] , Proc. SPIE: Color Hard Copy and Graphic Arts, 1992, vol. 1670.[347] , Proc. SPIE: Color Hard Copy and Graphic Arts IV, 1995, vol.
2413.[348] E. Walowit, Ed., Proc. SPIE: Device-Independent Color Imaging and
Imaging Systems Integration, 1994, vol. 2170.[349] J. P. Allebach and B. E. Rogowitz, Eds., Proc. SPIE: Human Vision,
Visual Processing, and Digital Display IV, 1993, vol. 1913.[350] S. P. Lloyd, “Least squares quantization in PCM,” IEEE Trans. Inform.
Theory, vol. IT-28, pp. 129–137, Mar. 1982.[351] B. E. Rogowitz, Ed., Proc. SPIE: Human Vision, Visual Processing, and
Digital Display III, 1992, vol. 1666.
Gaurav Sharma (S’88–M’97) was born inDehradun, India, on October 12, 1968. He receivedthe B.E. degree in electronics and communicationengineering from University of Roorkee, India, in1990, the M.E. degree in electrical communicationengineering from the Indian Institute of Science,Bangalore, India, in 1992, and the M.S. degree inapplied mathematics and Ph.D. degree in electricalengineering from North Carolina State University(NCSU), Raleigh, in 1995 and 1996, respectively.
From August 1992 through August 1996 hewas a Research Assistant at the Center for Advanced Computing andCommunications, Electrical and Computer Engineering Department, NCSU.Since August 1996, he has been employed as a member of the Research andTechnical Staff at the Digital Imaging Technology Center, Xerox Corporation,Webster, NY. His current research interests include signal restoration, colorscience, image halftoning, and error correction coding.
Dr. Sharma is a member of Phi Kappa Phi, an associate member of SigmaXi, and a member of the IEEE Signal Processing Society, IS&T, and SPIE.
H. Joel Trussell (S’75–M’76–SM’91–F’94), for a photograph and biography,see this issue, p. 899.