color spaces for color mapping
TRANSCRIPT
A Velocital Information Feature for Charting Spatio-TemporalChanges in Digital Image SequencesGregory J. Powera, Mohammad A. Karimb, and Farid AhmedcaAir Force Research Laboratory, AFRL/SNAT/Target Recognition Branch,2010 5th Street, Wright-Patterson AFB, Ohio 45433-7001bUniversity of Dayton, Department of Electrical and Computer Engineering,300 College Park, Dayton, Ohio 45469-0226cElectrical Engineering, School of Engineering and Engineering Technology,Pennsylvania State University, The Behrend College,Erie, PA, 16563-1701ABSTRACTThis paper introduces a velocital information feature that is extracted for each frame of an image sequence. Thefeature is based on the optical ow in each frame. A mathematical formulation for the velocital information featureis derived. Charting the feature over a sequence provides a quality metric called velocital information content(VIC). The relationship of VIC to the spatial and temporal information content is shown. VIC o�ers a di�erentrole from traditional transmission-based quality metrics which require two images: the original input image anddegraded output image to calculate the quality metric. VIC can detect artifacts from a single image sequence bycharting variations from the norm. Therefore, VIC o�ers a metric for judging the quality of the image frames priorto transmission, without a transmission system or without any knowledge of the higher quality image input. Thedi�erences between VIC and transmission-oriented quality metrics, can provide a di�erent role for VIC in analysisand image sequence processing. Results are shown for using VIC on standard video image sequences that su�er fromblurring and compression artifacts. The ability of VIC to detect gradual and sudden changes in an image sequenceis shown. Results are shown for using VIC as a �lter on electro-optical infrared image sequences where VIC detectsframes su�ering from erratic noise.Keywords: Velocital, Velocital Information Feature, Optical Flow, Image Quality, Spatio-Temporal Analysis, Dig-ital Transmission, Image Sequence 1. INTRODUCTIONDigital video is made up of digitally-sampled image frames usually displayed at 30 frames per second that can becharacterized by gradual and sudden changes.1 The gradual changes can be the result of camera movements suchas slow pans, zooming, and focusing. The sudden changes can be the result of editing functions such as frame cuts,digital transmission artifacts such as frame repeats, or erratic noise. A feature that reliably detects gradual andsudden changes in an image sequence can be of use for multiple applications.2,3For instance, if from apriori knowledge, an imaging system is known to produce high quality edited image frameswith no noise, blurring, or compression artifacts, then a feature that detects sudden changes can be useful in detectingframe cuts. This can be useful in automatically creating an index into a digital image sequence. On the other hand,if from apriori knowledge, an imaging system is known to be unedited without signi�cant camera movements, then achange detector can be useful for detecting poor quality image frames which could be useful in image quality analysis,transmission systems, and machine vision applications.A system that automatically �lters out or enhances poor quality image frames can reduce workload for the imageanalyst who needs to examine each frame. A subsystem that removes or enhances lower quality image frames beforeOther author information: (Send correspondence to G.J.Power)G.J.Power: E-mail: [email protected]: E-mail: [email protected]: E-mail: [email protected]
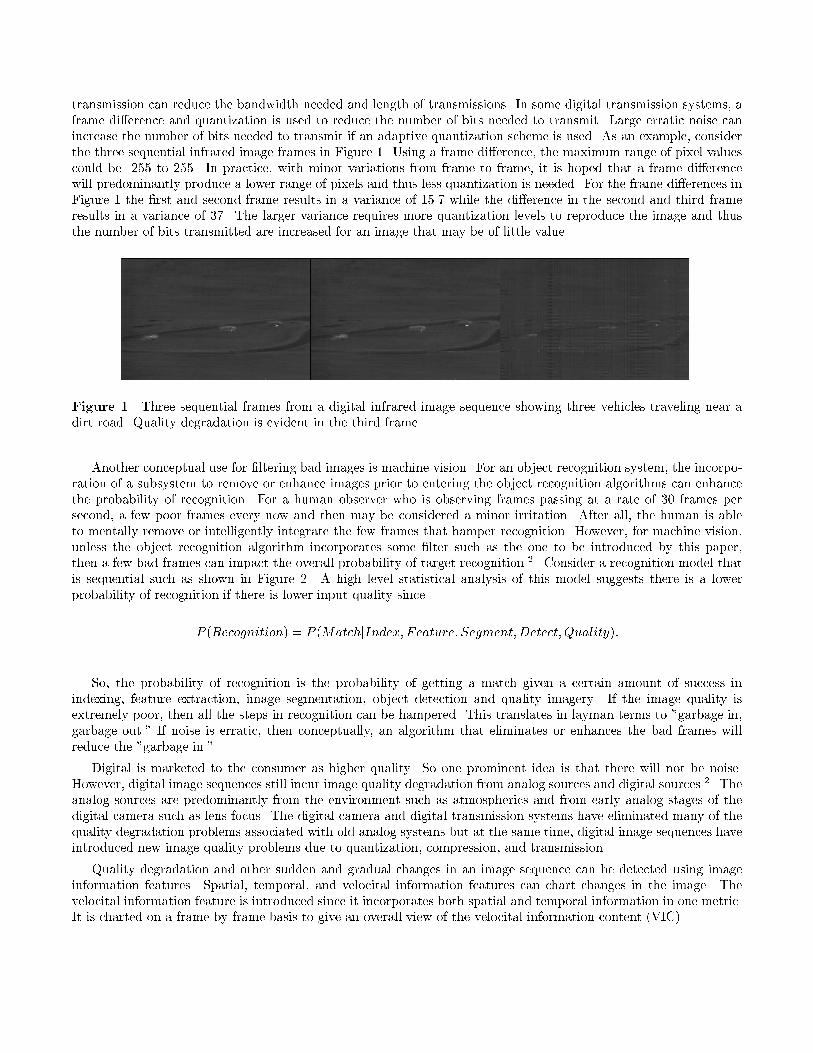
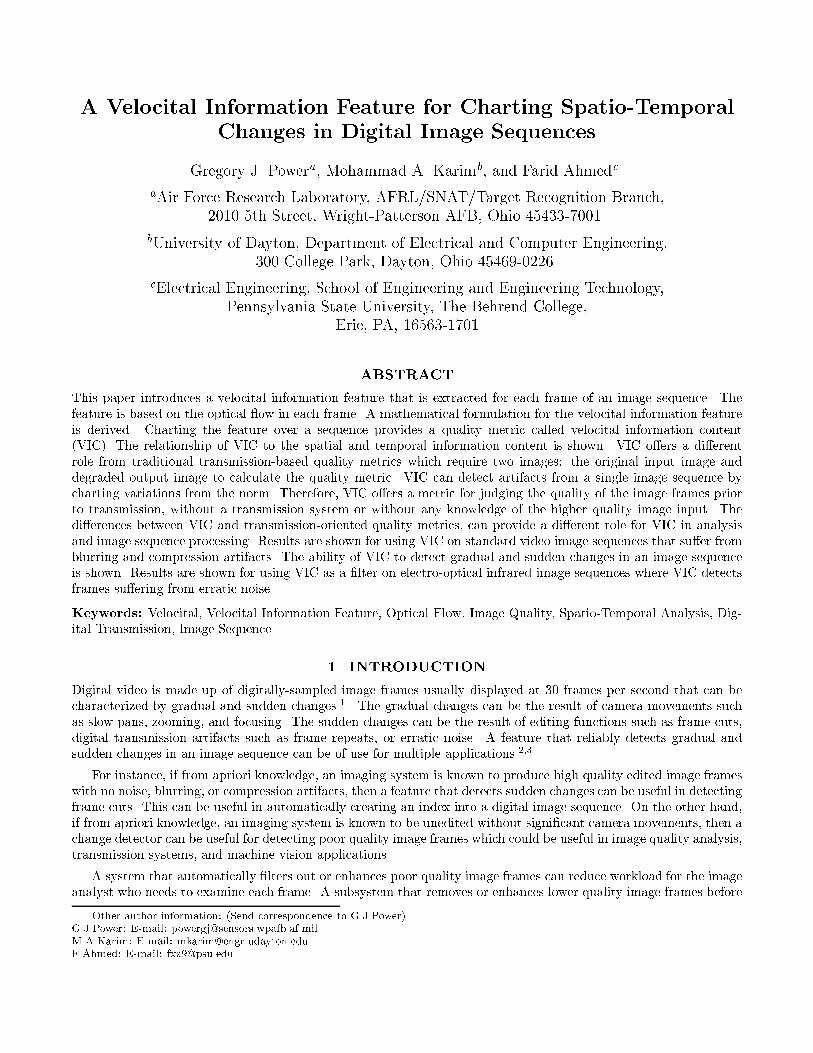
transmission can reduce the bandwidth needed and length of transmissions. In some digital transmission systems, aframe di�erence and quantization is used to reduce the number of bits needed to transmit. Large erratic noise canincrease the number of bits needed to transmit if an adaptive quantization scheme is used. As an example, considerthe three sequential infrared image frames in Figure 1. Using a frame di�erence, the maximum range of pixel valuescould be -255 to 255. In practice, with minor variations from frame to frame, it is hoped that a frame di�erencewill predominantly produce a lower range of pixels and thus less quantization is needed. For the frame di�erences inFigure 1 the �rst and second frame results in a variance of 15.7 while the di�erence in the second and third frameresults in a variance of 37. The larger variance requires more quantization levels to reproduce the image and thusthe number of bits transmitted are increased for an image that may be of little value.Figure 1. Three sequential frames from a digital infrared image sequence showing three vehicles traveling near adirt road. Quality degradation is evident in the third frame.Another conceptual use for �ltering bad images is machine vision. For an object recognition system, the incorpo-ration of a subsystem to remove or enhance images prior to entering the object recognition algorithms can enhancethe probability of recognition. For a human observer who is observing frames passing at a rate of 30 frames persecond, a few poor frames every now and then may be considered a minor irritation. After all, the human is ableto mentally remove or intelligently integrate the few frames that hamper recognition. However, for machine vision,unless the object recognition algorithm incorporates some �lter such as the one to be introduced by this paper,then a few bad frames can impact the overall probability of target recognition.2 Consider a recognition model thatis sequential such as shown in Figure 2. A high level statistical analysis of this model suggests there is a lowerprobability of recognition if there is lower input quality sinceP (Recognition) = P (MatchjIndex; Feature; Segment;Detect;Quality):So, the probability of recognition is the probability of getting a match given a certain amount of success inindexing, feature extraction, image segmentation, object detection and quality imagery. If the image quality isextremely poor, then all the steps in recognition can be hampered. This translates in layman terms to "garbage in,garbage out." If noise is erratic, then conceptually, an algorithm that eliminates or enhances the bad frames willreduce the "garbage in."Digital is marketed to the consumer as higher quality. So one prominent idea is that there will not be noise.However, digital image sequences still incur image quality degradation from analog sources and digital sources.2 Theanalog sources are predominantly from the environment such as atmospherics and from early analog stages of thedigital camera such as lens focus. The digital camera and digital transmission systems have eliminated many of thequality degradation problems associated with old analog systems but at the same time, digital image sequences haveintroduced new image quality problems due to quantization, compression, and transmission.Quality degradation and other sudden and gradual changes in an image sequence can be detected using imageinformation features. Spatial, temporal, and velocital information features can chart changes in the image. Thevelocital information feature is introduced since it incorporates both spatial and temporal information in one metric.It is charted on a frame-by-frame basis to give an overall view of the velocital information content (VIC).
2. SPATIAL AND TEMPORAL INFORMATION FEATURESSpatial information and temporal information features for digital image sequences have been obtained by determininga spatial standard deviation and a temporal standard deviation. This paper uses the formulations de�ned in an ANSIstandard.4The spatial content is obtained by �rst acquiring spatial edge information using Sobel operations5 on each imageframe. The spatial edges are expressed mathematically for the horizontal mask asSIh(i; j; tn) = Y (i+1; j�1; tn)�Y (i�1; j�1; tn)+2Y (i+1; j; tn)�2Y (i�1; j; tn)+Y (i+1; j+1; tn)�Y (i�1; j+1; tn)where i and j represent a particular pixel position in an image and tn represents a particular image frame intime. For the vertical mask the Sobel operation is expressed asSIv(i; j; tn) = Y (i�1; j+1; tn)�Y (i�1; j�1; tn)+2Y (i; j+1; tn)�2Y (i; j�1; tn)+Y (i+1; j+1; tn)�Y (i+1; j�1; tn)with the magnitude of the spatial information de�ned asSIr(i; j; tn) =qSI2h(i; j; tn) + SI2v (i; j; tn):For the total pixels, P , in an image, the standard deviation of each Sobel �ltered image is calculated asSIstdev(tn) =vuuut24 1P Xi Xj SI2r (i; j; tn)35� SI2mean(tn);where SImean(tn) = 1P Xi Xj SIr(i; j; tn):SIstdev(tn) results in a time series of standard deviations which can be plotted on the spatial axis of the spatio-temporal plot. A similar approach as well as a rationale for using the Sobel operator is documented by Lee.6 Toobtain the temporal content, a frame di�erence is computed for frame Y de�ned as
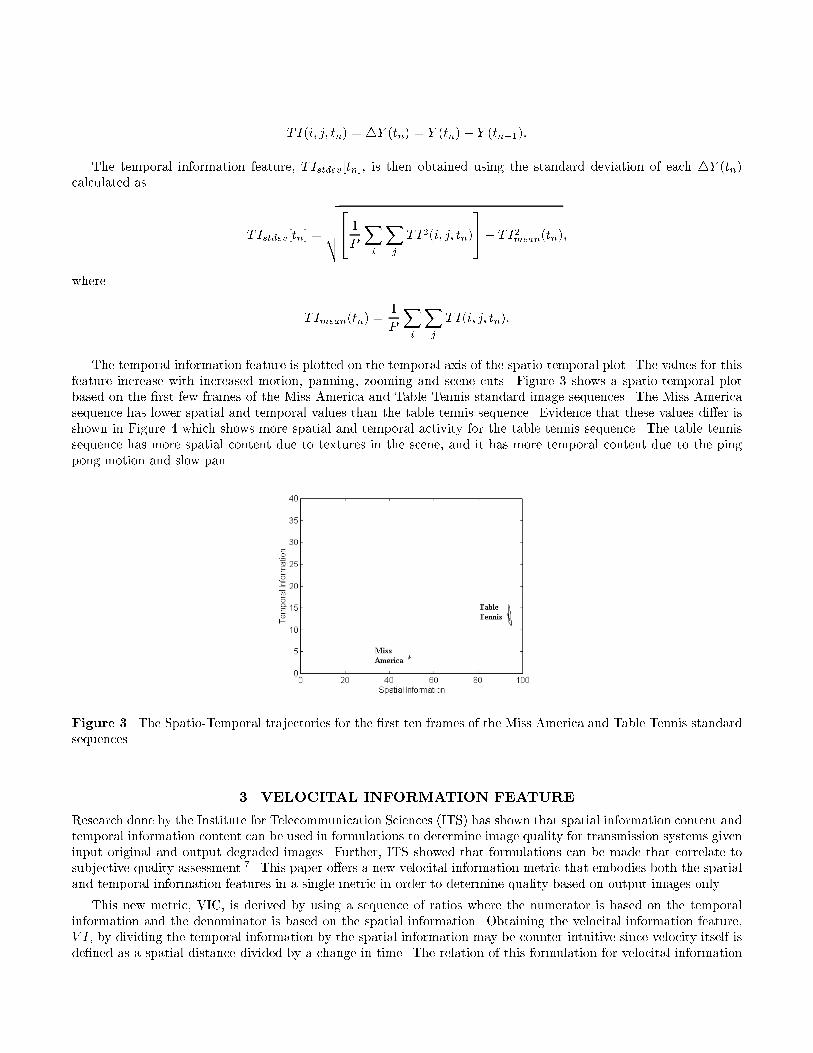
Figure 2. For a sequential model of object recognition, the probability of high recognition is dependent on input ofsu�cient quality.
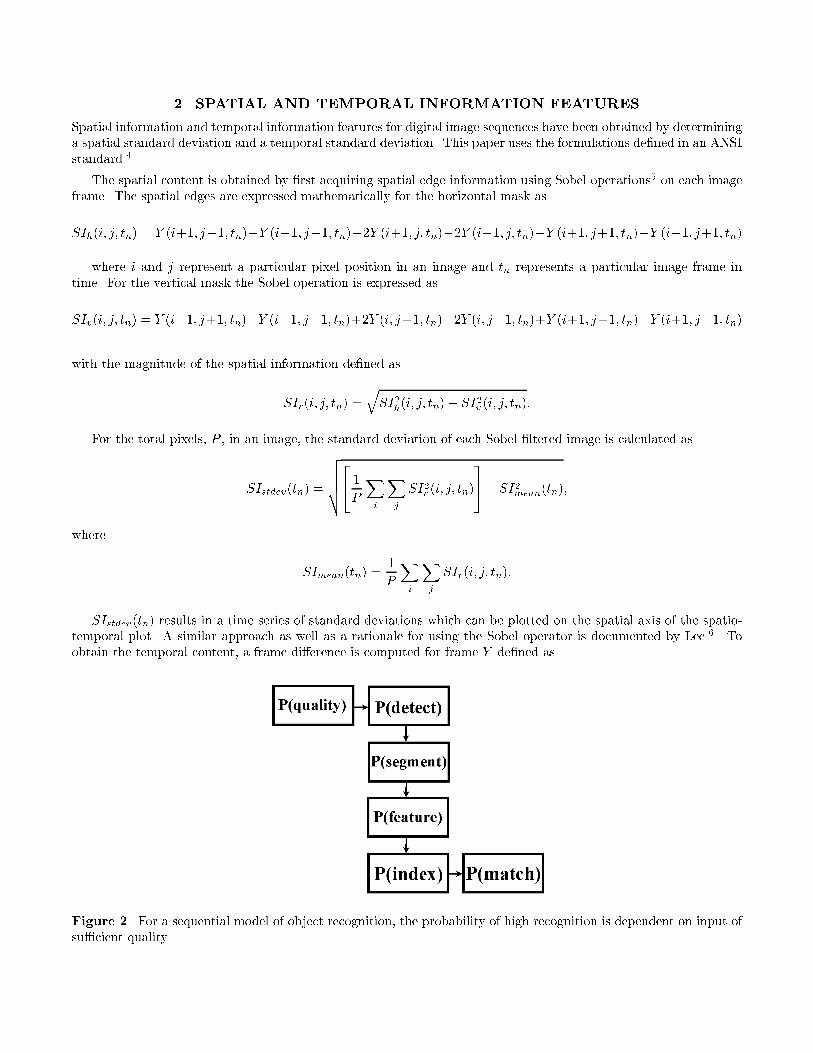
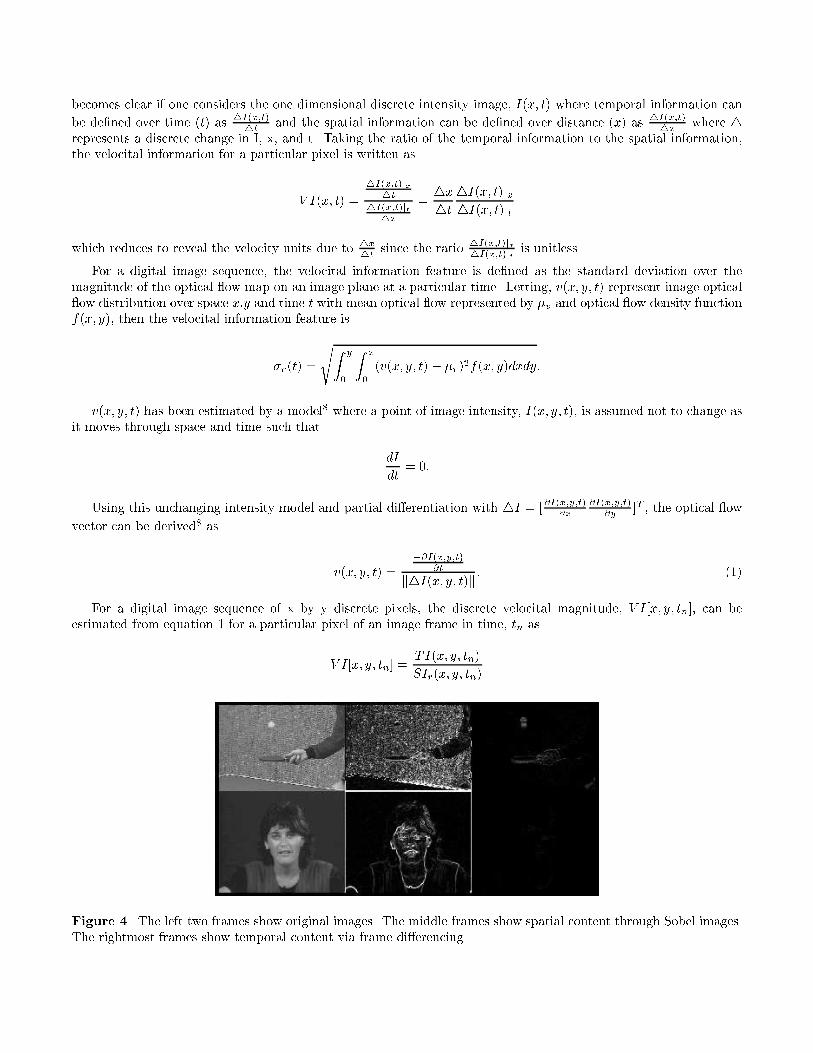
TI(i; j; tn) = 4Y (tn) = Y (tn)� Y (tn�1):The temporal information feature, TIstdev [tn], is then obtained using the standard deviation of each 4Y (tn)calculated as TIstdev[tn] =vuuut24 1P Xi Xj TI2(i; j; tn)35� TI2mean(tn);where TImean(tn) = 1P Xi Xj TI(i; j; tn):The temporal information feature is plotted on the temporal axis of the spatio-temporal plot. The values for thisfeature increase with increased motion, panning, zooming and scene cuts. Figure 3 shows a spatio-temporal plotbased on the �rst few frames of the Miss America and Table Tennis standard image sequences. The Miss Americasequence has lower spatial and temporal values than the table tennis sequence. Evidence that these values di�er isshown in Figure 4 which shows more spatial and temporal activity for the table tennis sequence. The table tennissequence has more spatial content due to textures in the scene, and it has more temporal content due to the pingpong motion and slow pan.
Figure 3. The Spatio-Temporal trajectories for the �rst ten frames of the Miss America and Table Tennis standardsequences. 3. VELOCITAL INFORMATION FEATUREResearch done by the Institute for Telecommunication Sciences (ITS) has shown that spatial information content andtemporal information content can be used in formulations to determine image quality for transmission systems giveninput original and output degraded images. Further, ITS showed that formulations can be made that correlate tosubjective quality assessment.7 This paper o�ers a new velocital information metric that embodies both the spatialand temporal information features in a single metric in order to determine quality based on output images only.This new metric, VIC, is derived by using a sequence of ratios where the numerator is based on the temporalinformation and the denominator is based on the spatial information. Obtaining the velocital information feature,V I , by dividing the temporal information by the spatial information may be counter-intuitive since velocity itself isde�ned as a spatial distance divided by a change in time. The relation of this formulation for velocital information
becomes clear if one considers the one dimensional discrete intensity image, I(x; t) where temporal information canbe de�ned over time (t) as 4I(x;t)4t and the spatial information can be de�ned over distance (x) as 4I(x;t)4x where 4represents a discrete change in I, x, and t. Taking the ratio of the temporal information to the spatial information,the velocital information for a particular pixel is written asV I(x; t) = 4I(x;t)jx4t4I(x;t)jt4x = 4x4t 4I(x; t)jx4I(x; t)jtwhich reduces to reveal the velocity units due to 4x4t since the ratio 4I(x;t)jx4I(x;t)jt is unitless.For a digital image sequence, the velocital information feature is de�ned as the standard deviation over themagnitude of the optical ow map on an image plane at a particular time. Letting, v(x; y; t) represent image optical ow distribution over space x,y and time t with mean optical ow represented by �v and optical ow density functionf(x; y), then the velocital information feature is�v(t) =sZ y0 Z x0 (v(x; y; t) � �v)2f(x; y)dxdy:v(x; y; t) has been estimated by a model8 where a point of image intensity, I(x; y; t), is assumed not to change asit moves through space and time such that dIdt = 0:Using this unchanging intensity model and partial di�erentiation with 4I = [@I(x;y;t)@x @I(x;y;t)@y ]T , the optical owvector can be derived8 as v(x; y; t) = �@I(x;y;t)@tk4I(x; y; t)k : (1)For a digital image sequence of x by y discrete pixels, the discrete velocital magnitude, V I [x; y; tn], can beestimated from equation 1 for a particular pixel of an image frame in time, tn asV I [x; y; tn] = TI(x; y; tn)SIr(x; y; tn)
Figure 4. The left two frames show original images. The middle frames show spatial content through Sobel images.The rightmost frames show temporal content via frame di�erencing.
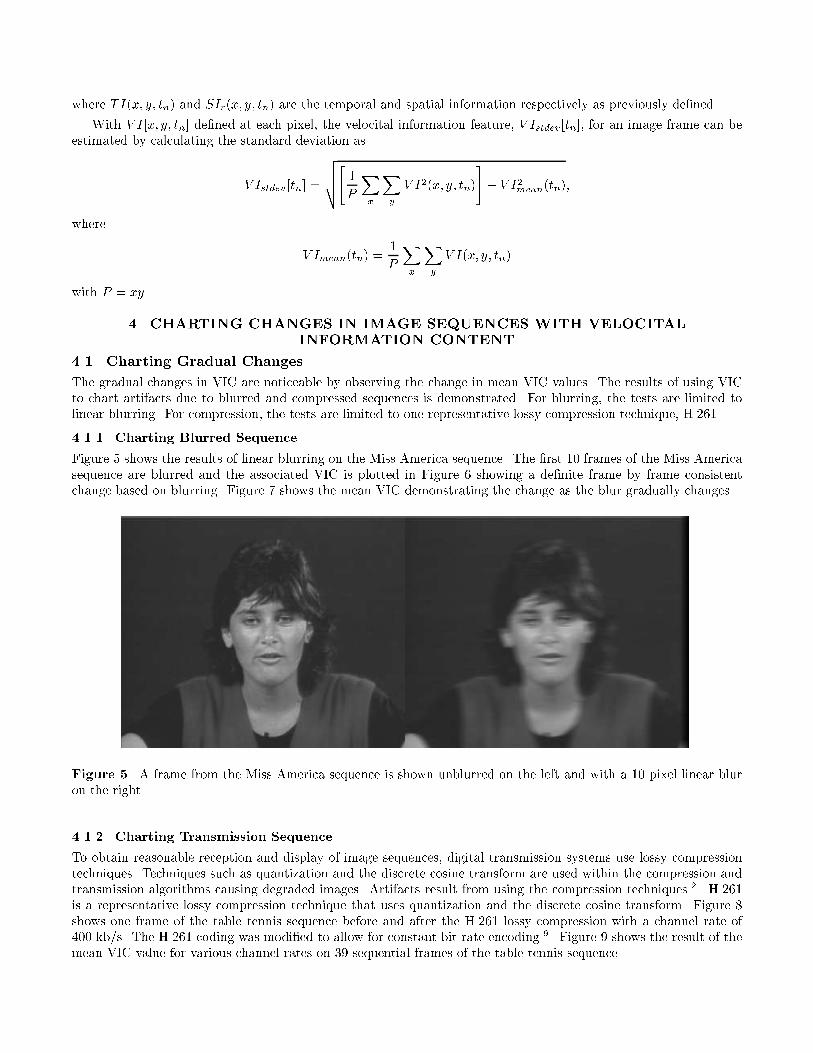
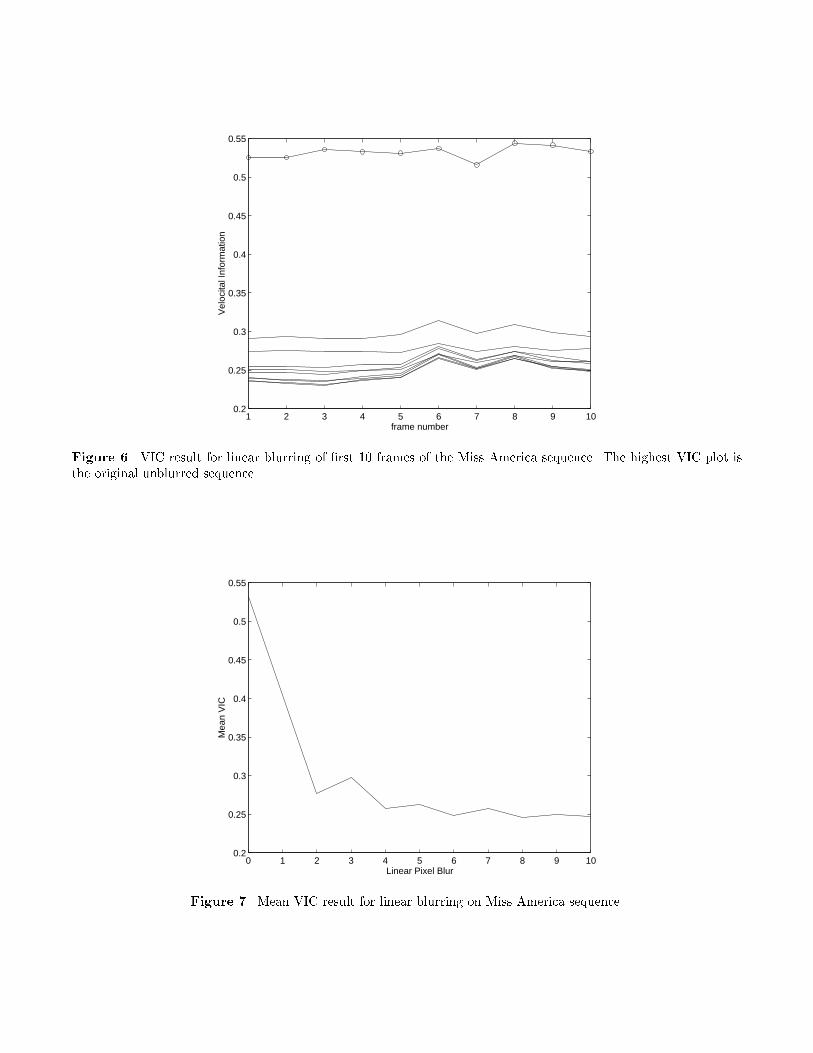
where TI(x; y; tn) and SIr(x; y; tn) are the temporal and spatial information respectively as previously de�ned.With V I [x; y; tn] de�ned at each pixel, the velocital information feature, V Istdev [tn], for an image frame can beestimated by calculating the standard deviation asV Istdev [tn] =vuut" 1P Xx Xy V I2(x; y; tn)# � V I2mean(tn);where V Imean(tn) = 1P Xx Xy V I(x; y; tn)with P = xy.4. CHARTING CHANGES IN IMAGE SEQUENCES WITH VELOCITALINFORMATION CONTENT4.1. Charting Gradual ChangesThe gradual changes in VIC are noticeable by observing the change in mean VIC values. The results of using VICto chart artifacts due to blurred and compressed sequences is demonstrated. For blurring, the tests are limited tolinear blurring. For compression, the tests are limited to one representative lossy compression technique, H.261.4.1.1. Charting Blurred SequenceFigure 5 shows the results of linear blurring on the Miss America sequence. The �rst 10 frames of the Miss Americasequence are blurred and the associated VIC is plotted in Figure 6 showing a de�nite frame by frame consistentchange based on blurring. Figure 7 shows the mean VIC demonstrating the change as the blur gradually changes.
Figure 5. A frame from the Miss America sequence is shown unblurred on the left and with a 10 pixel linear bluron the right.4.1.2. Charting Transmission SequenceTo obtain reasonable reception and display of image sequences, digital transmission systems use lossy compressiontechniques. Techniques such as quantization and the discrete cosine transform are used within the compression andtransmission algorithms causing degraded images. Artifacts result from using the compression techniques.2 H.261is a representative lossy compression technique that uses quantization and the discrete cosine transform. Figure 8shows one frame of the table tennis sequence before and after the H.261 lossy compression with a channel rate of400 kb/s. The H.261 coding was modi�ed to allow for constant bit rate encoding.9 Figure 9 shows the result of themean VIC value for various channel rates on 39 sequential frames of the table tennis sequence.
1 2 3 4 5 6 7 8 9 100.2
0.25
0.3
0.35
0.4
0.45
0.5
0.55
Vel
ocita
l Inf
orm
atio
n
frame numberFigure 6. VIC result for linear blurring of �rst 10 frames of the Miss America sequence. The highest VIC plot isthe original unblurred sequence.
0 1 2 3 4 5 6 7 8 9 100.2
0.25
0.3
0.35
0.4
0.45
0.5
0.55
Mea
n V
IC
Linear Pixel BlurFigure 7. Mean VIC result for linear blurring on Miss America sequence.
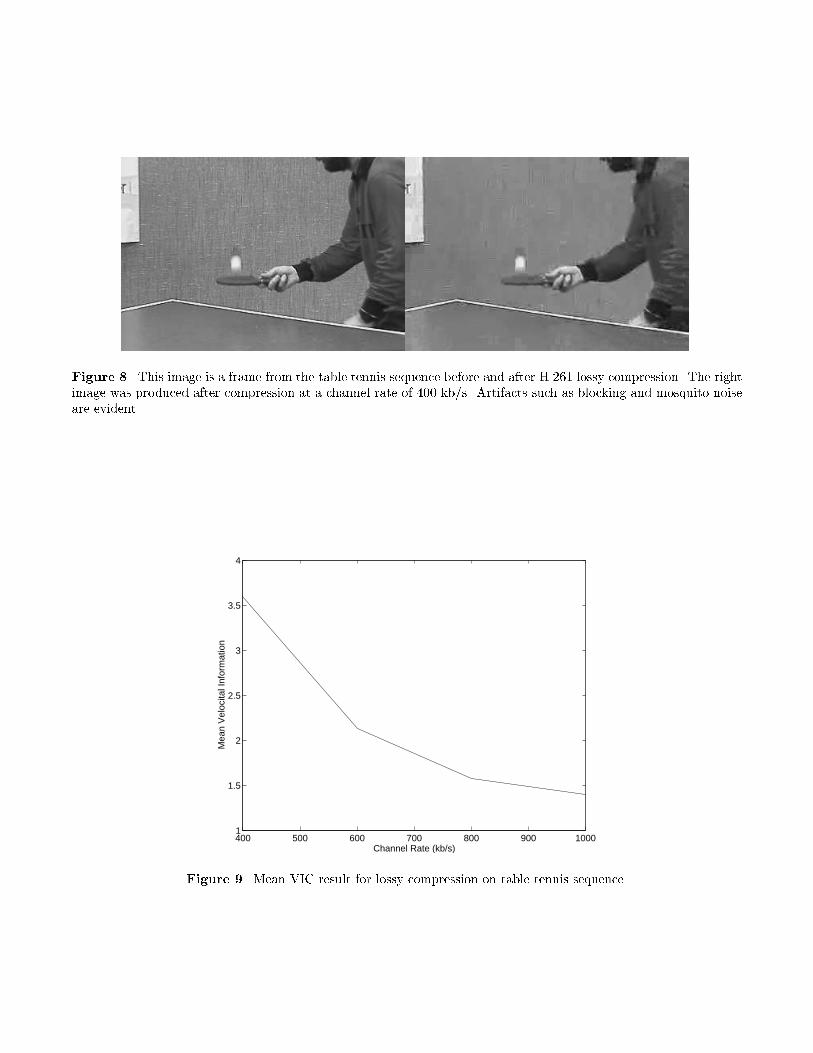
Figure 8. This image is a frame from the table tennis sequence before and after H.261 lossy compression. The rightimage was produced after compression at a channel rate of 400 kb/s. Artifacts such as blocking and mosquito noiseare evident.
400 500 600 700 800 900 10001
1.5
2
2.5
3
3.5
4
Mea
n V
eloc
ital I
nfor
mat
ion
Channel Rate (kb/s)Figure 9. Mean VIC result for lossy compression on table tennis sequence.
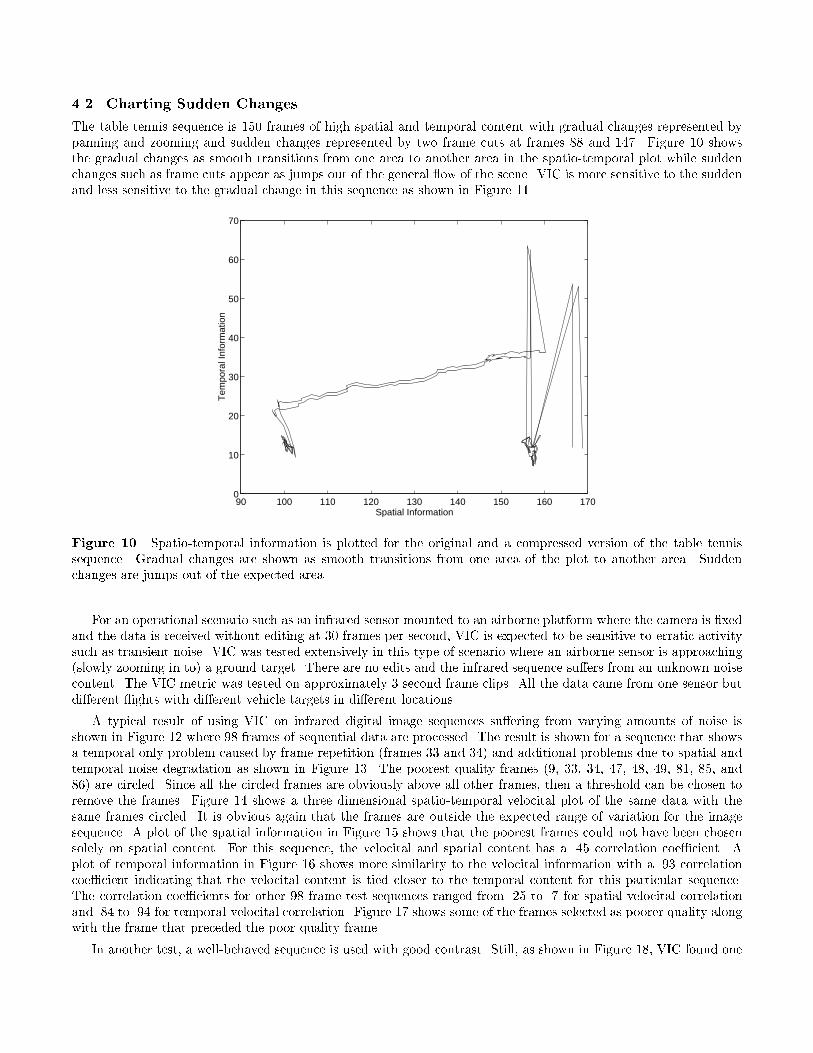
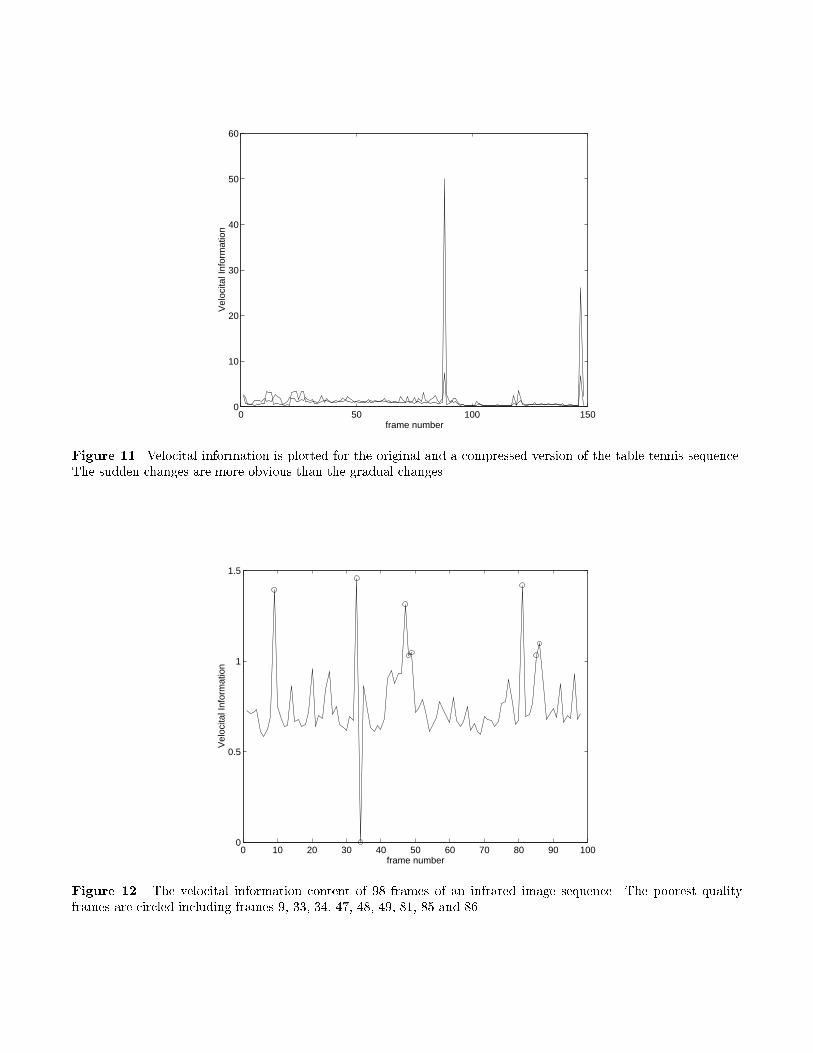
4.2. Charting Sudden ChangesThe table tennis sequence is 150 frames of high spatial and temporal content with gradual changes represented bypanning and zooming and sudden changes represented by two frame cuts at frames 88 and 147. Figure 10 showsthe gradual changes as smooth transitions from one area to another area in the spatio-temporal plot while suddenchanges such as frame cuts appear as jumps out of the general ow of the scene. VIC is more sensitive to the suddenand less sensitive to the gradual change in this sequence as shown in Figure 11.
90 100 110 120 130 140 150 160 1700
10
20
30
40
50
60
70
Spatial Information
Tem
pora
l Inf
orm
atio
n
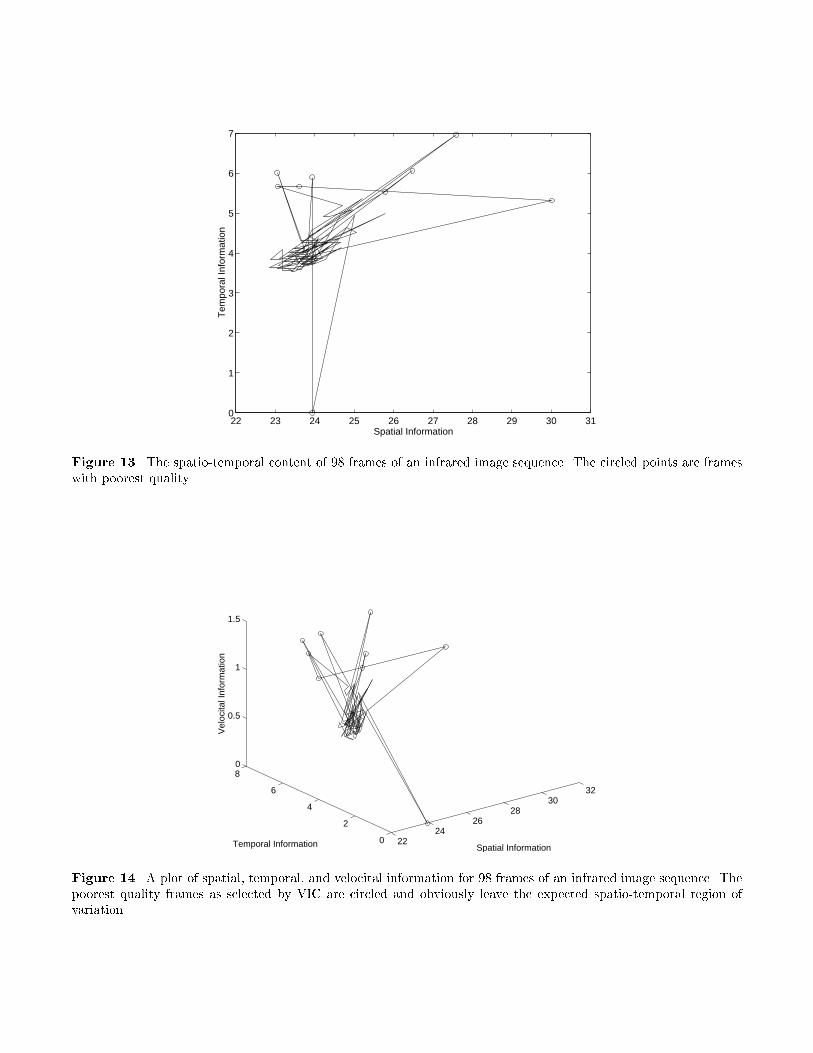
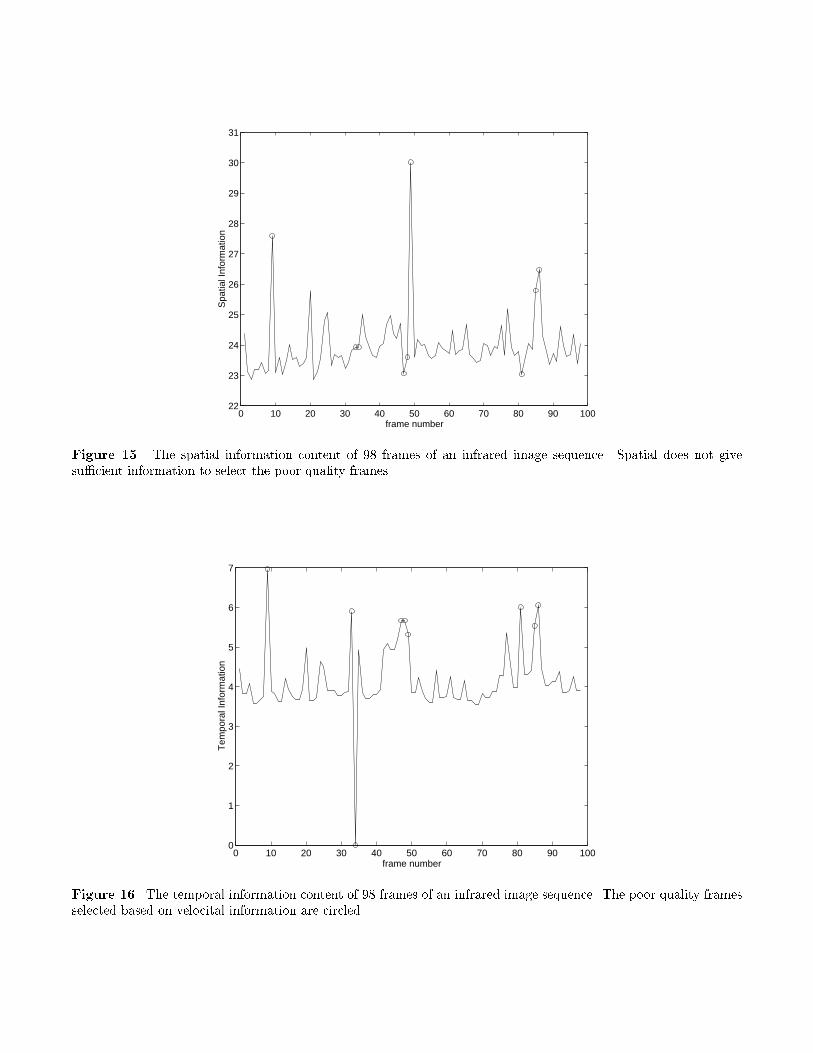
Figure 10. Spatio-temporal information is plotted for the original and a compressed version of the table tennissequence. Gradual changes are shown as smooth transitions from one area of the plot to another area. Suddenchanges are jumps out of the expected area.For an operational scenario such as an infrared sensor mounted to an airborne platform where the camera is �xedand the data is received without editing at 30 frames per second, VIC is expected to be sensitive to erratic activitysuch as transient noise. VIC was tested extensively in this type of scenario where an airborne sensor is approaching(slowly zooming in to) a ground target. There are no edits and the infrared sequence su�ers from an unknown noisecontent. The VIC metric was tested on approximately 3 second frame clips. All the data came from one sensor butdi�erent ights with di�erent vehicle targets in di�erent locations.A typical result of using VIC on infrared digital image sequences su�ering from varying amounts of noise isshown in Figure 12 where 98 frames of sequential data are processed. The result is shown for a sequence that showsa temporal only problem caused by frame repetition (frames 33 and 34) and additional problems due to spatial andtemporal noise degradation as shown in Figure 13. The poorest quality frames (9, 33, 34, 47, 48, 49, 81, 85, and86) are circled. Since all the circled frames are obviously above all other frames, then a threshold can be chosen toremove the frames. Figure 14 shows a three dimensional spatio-temporal velocital plot of the same data with thesame frames circled. It is obvious again that the frames are outside the expected range of variation for the imagesequence. A plot of the spatial information in Figure 15 shows that the poorest frames could not have been chosensolely on spatial content. For this sequence, the velocital and spatial content has a .45 correlation coe�cient. Aplot of temporal information in Figure 16 shows more similarity to the velocital information with a .93 correlationcoe�cient indicating that the velocital content is tied closer to the temporal content for this particular sequence.The correlation coe�cients for other 98-frame test sequences ranged from .25 to .7 for spatial-velocital correlationand .84 to .94 for temporal-velocital correlation. Figure 17 shows some of the frames selected as poorer quality alongwith the frame that preceded the poor quality frame.In another test, a well-behaved sequence is used with good contrast. Still, as shown in Figure 18, VIC found one
0 50 100 1500
10
20
30
40
50
60
Vel
ocita
l Inf
orm
atio
n
frame numberFigure 11. Velocital information is plotted for the original and a compressed version of the table tennis sequence.The sudden changes are more obvious than the gradual changes.
0 10 20 30 40 50 60 70 80 90 1000
0.5
1
1.5
Vel
ocita
l Inf
orm
atio
n
frame numberFigure 12. The velocital information content of 98 frames of an infrared image sequence. The poorest qualityframes are circled including frames 9, 33, 34, 47, 48, 49, 81, 85 and 86.
22 23 24 25 26 27 28 29 30 310
1
2
3
4
5
6
7
Spatial Information
Tem
pora
l Inf
orm
atio
n
Figure 13. The spatio-temporal content of 98 frames of an infrared image sequence. The circled points are frameswith poorest quality.
2224
2628
3032
0
2
4
6
80
0.5
1
1.5
Temporal Information Spatial Information
Vel
ocita
l Inf
orm
atio
n
Figure 14. A plot of spatial, temporal, and velocital information for 98 frames of an infrared image sequence. Thepoorest quality frames as selected by VIC are circled and obviously leave the expected spatio-temporal region ofvariation.
0 10 20 30 40 50 60 70 80 90 10022
23
24
25
26
27
28
29
30
31
Spa
tial I
nfor
mat
ion
frame numberFigure 15. The spatial information content of 98 frames of an infrared image sequence. Spatial does not givesu�cient information to select the poor quality frames.
0 10 20 30 40 50 60 70 80 90 1000
1
2
3
4
5
6
7
frame number
Tem
pora
l Inf
orm
atio
n
Figure 16. The temporal information content of 98 frames of an infrared image sequence. The poor quality framesselected based on velocital information are circled.
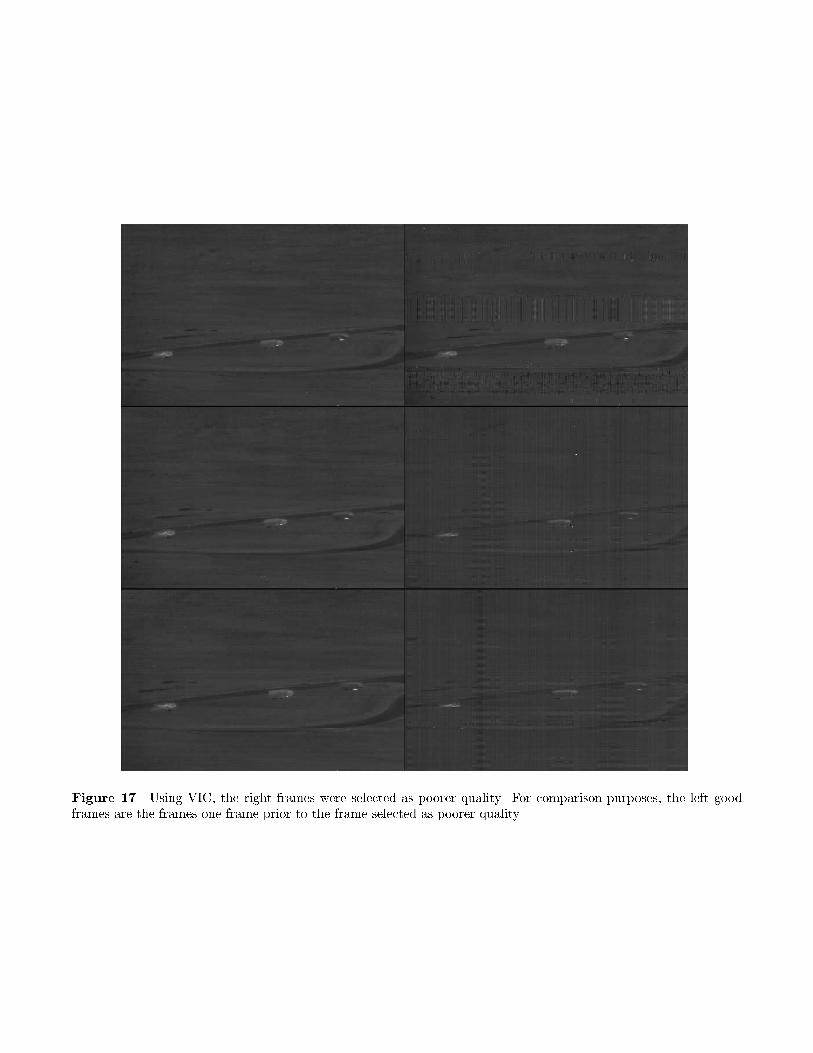
Figure 17. Using VIC, the right frames were selected as poorer quality. For comparison purposes, the left goodframes are the frames one frame prior to the frame selected as poorer quality.
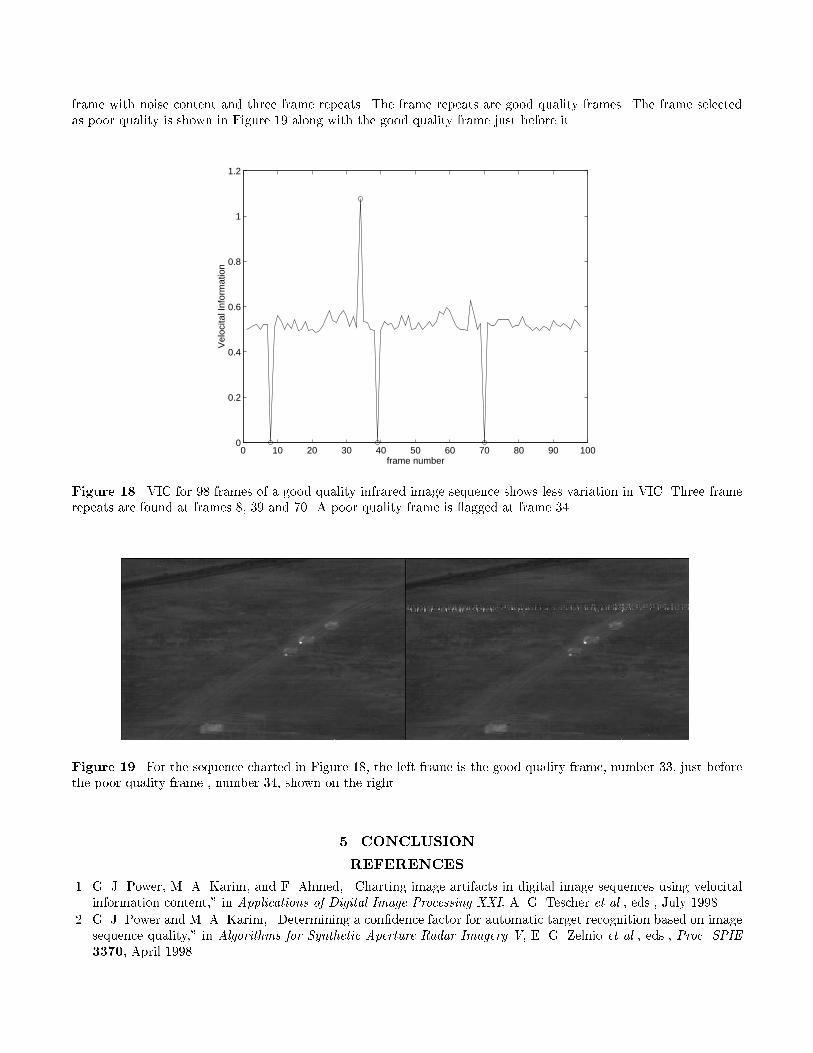
frame with noise content and three frame repeats. The frame repeats are good quality frames. The frame selectedas poor quality is shown in Figure 19 along with the good quality frame just before it.
0 10 20 30 40 50 60 70 80 90 1000
0.2
0.4
0.6
0.8
1
1.2
Vel
ocita
l Inf
orm
atio
n
frame numberFigure 18. VIC for 98 frames of a good quality infrared image sequence shows less variation in VIC. Three framerepeats are found at frames 8, 39 and 70. A poor quality frame is agged at frame 34.
Figure 19. For the sequence charted in Figure 18, the left frame is the good quality frame, number 33, just beforethe poor quality frame , number 34, shown on the right.5. CONCLUSIONREFERENCES1. G. J. Power, M. A. Karim, and F. Ahmed, \Charting image artifacts in digital image sequences using velocitalinformation content," in Applications of Digital Image Processing XXI, A. G. Tescher et al., eds., July 1998.2. G. J. Power and M. A. Karim, \Determining a con�dence factor for automatic target recognition based on imagesequence quality," in Algorithms for Synthetic Aperture Radar Imagery V, E. G. Zelnio et al., eds., Proc. SPIE3370, April 1998.
3. G. J. Power and M. A. Karim, \Automatic removal of poor quality images from digital image sequences," inAirborne Reconnaissance XXII, W. G. Fishell et al., eds., July 1998.4. \Digital transport of one-way video signals - parameters for objective performance assessment." ANSI T1.801.03-1996, February 1996.5. R. Gonzalez and P. Wintz, Digital Image Processing, Addison-Wesley Publishing Co., Reading, Massachusetts,2 ed., 1987.6. D. J. Lee, \Objective quality metrics: Applications for partially compensated images of space objects," Master'sthesis, Air Force Institute of Technology, Wright-Patterson AFB, Ohio, 45433-7765, 1993.7. S. Wolf, \Features for automated quality assessment of digitally transmitted video," Tech. Rep. 90-264, USDepartment of Commerce, National Telecommunications and Information Administration, June 1990.8. A. M. Tekalp, Digital Video Processing, Prentice-Hall, Inc., Upper Saddle River, NJ, 1995.9. I. Dalgic and F. A. Tobagi, \Constant quality video encoding," in Proc. IEEE ICC 95, (Seattle, WA), June 1995.