diffusion of iodine and rhenium in category 3 waste encasement concrete and soil fill material
TRANSCRIPT
PNNL-16268
Diffusion of Iodine and Rhenium in Category 3 Waste Encasement Concrete and Soil Fill Material D. M. Wellman S. V. Mattigod G. A. Whyatt L. Powers K.E. Parker L.N. Clayton M. I. Wood December 2006 Prepared for the U.S. Department of Energy under Contract DE-AC05-76RL01830
DISCLAIMER
This report was prepared as an account of work sponsored by an agency of the United States Government. Reference herein to any specific commercial product, process, or service by trade name, trademark, manufacturer, or otherwise does not necessarily constitute or imply its endorsement, recommendation, or favoring by the United States Government or any agency thereof, or Battelle Memorial Institute.
PACIFIC NORTHWEST NATIONAL LABORATORY operated by BATTELLE
for the UNITED STATES DEPARTMENT OF ENERGY
under Contract DE-AC05-76RL01830
Printed in the United States of America
Available to DOE and DOE contractors from the Office of Scientific and Technical Information,
P.O. Box 62, Oak Ridge, TN 37831-0062; ph: (865) 576-8401 fax: (865) 576-5728
email: [email protected]
Available to the public from the National Technical Information Service, U.S. Department of Commerce, 5285 Port Royal Rd., Springfield, VA 22161
ph: (800) 553-6847 fax: (703) 605-6900
email: [email protected] online ordering: http://www.ntis.gov/ordering.htm
This document was printed on recycled paper.
Diffusion of Iodine and Rhenium in Category 3 Waste Encasement Concrete and Soil Fill Material D. M. Wellman S. V. Mattigod G. A. Whyatt L. Powers K.E. Parker L.N. Clayton M. I. Wood December 2006 Prepared for the U.S. Department of Energy under Contract DE-AC05-76RL01830 Pacific Northwest National Laboratory Richland, Washington 99354
SUMMARY
Assessing long-term performance of Category 3 waste cement grouts for radionuclide encasement requires knowledge of the radionuclide-cement interactions and mechanisms of retention (i.e. sorption or precipitation). This understanding will enable accurate prediction of radionuclide fate when the waste forms come in contact with groundwater. A set of diffusion experiments using carbonated and non-carbonated concrete-soil half cells was conducted under unsaturated conditions (4% and 7% by wt moisture content). Spiked concrete half-cell specimens were prepared with and without colloidal metallic iron addition and were carbonated using supercritical carbon dioxide. Spikes of I and Re were added to achieve measurable diffusion profile in the soil part of the half-cell. In addition, properties of concrete materials likely to influence radionuclide migration such as carbonation were evaluated in an effort to correlate these properties with the release of iodine and rhenium.
The behavior of rhenium and iodine release was comparable within a given half-cell test.
The release of iodine and rhenium at 4% moisture content initiated with an initial concentration spike in the sediment immediately contacting the concrete monolith. The concentration profile rapidly decreased to zero within the first 5 cm of the sediment profile. Normalized concentration profiles for iodine and rhenium in sediments at 7% moisture content were asymmetrical increasing over the first 1 to 4 cm from the interface, reaching maximum concentrations 2 – 5 cm from the interface, and decreasing asymptotically thereafter. The apparent release profile for sediments at 7% moisture content may be the result of i) limited diffusion within the concrete monolith which depletes the concentration source, or ii) compaction of the sediment half-cell resulting in separation from the concrete monolith, both of which effectively “cuts off” the source. Because of the method by which the sediment was sampled, it is unknown whether or not the later occurred. However, future efforts to quantify of the concentration profile within the concrete monoliths will aid in further understanding the release profiles. Comparing the release profiles at 4% and 7% moisture content suggests the rate of diffusion increases with increasing moisture content. However, because the source term was “cut-off” from the migrating contaminant at the higher moisture content the rate of diffusion was not sustained throughout the duration of testing.
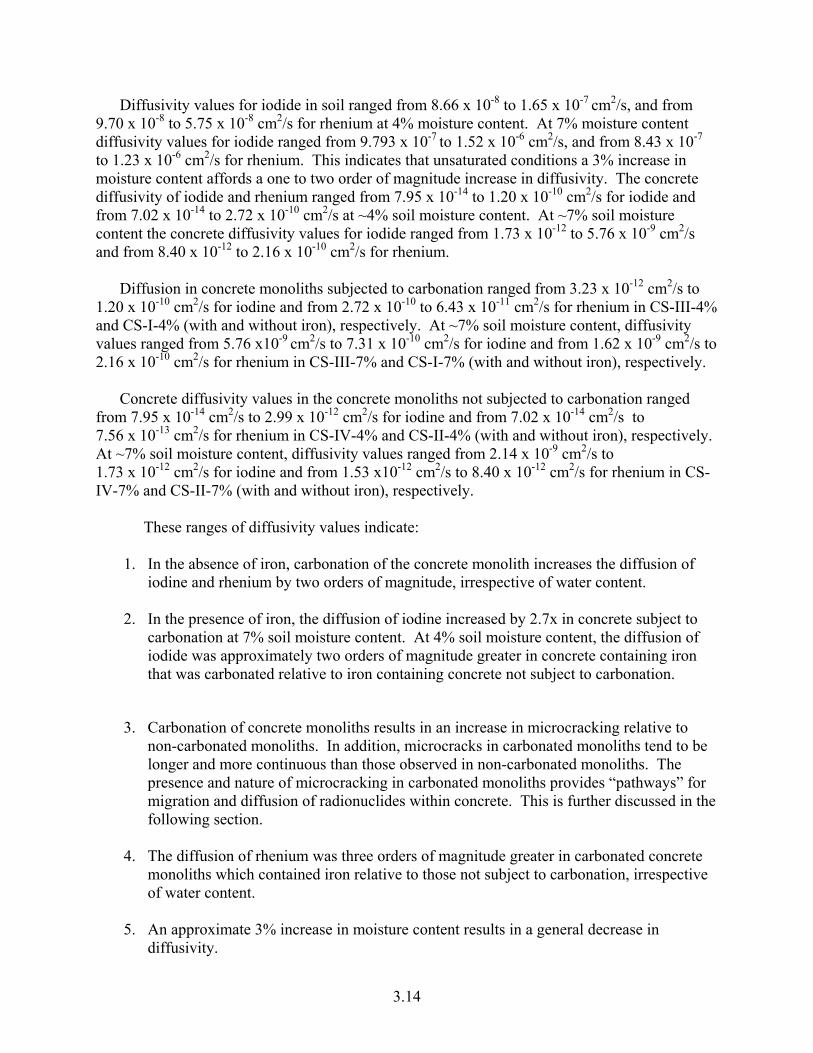
Diffusivity values for iodide in soil ranged from 8.66 x 10⁻⁸ to 1.65 x 10⁻⁷ cm2/s, and from
9.70 x 10⁻⁸ to 5.75 x 10⁻⁸ cm2/s for rhenium at 4% moisture content. At 7% moisture content diffusivity values for iodide ranged from 9.793 x 10⁻⁷ to 1.52 x 10⁻⁶ cm2/s, and from 8.43 x 10⁻⁷ to 1.23 x 10⁻⁶ cm2/s for rhenium. This indicates that unsaturated conditions a 3% increase in moisture content affords a one to two order of magnitude increase in diffusivity. The concrete diffusivity of iodide and rhenium ranged from 7.95 x 10⁻¹⁴ to 1.20 x 10⁻¹⁰ cm2/s for iodide and from 7.02 x 10⁻¹⁴ to 2.72 x 10⁻¹⁰ cm2/s at ~4% soil moisture content. At ~7% soil moisture content the concrete diffusivity values for iodide ranged from 1.73 x 10⁻¹² to 5.76 x 10⁻⁹ cm2/s and from 8.40 x 10⁻¹² to 2.16 x 10⁻¹⁰ cm2/s for rhenium.
Diffusion in concrete monoliths subjected to carbonation ranged from 3.23 x 10⁻¹² cm2/s to
1.20 x 10⁻¹⁰ cm2/s for iodine and from 2.72 x 10⁻¹⁰ to 6.43 x 10⁻¹¹ cm2/s for rhenium in CS-III-4% and CS-I-4% (with and without iron), respectively. At ~7% soil moisture content, diffusivity
ii
values ranged from 5.76 x10⁻⁹ cm2/s to 7.31 x 10⁻¹⁰ cm2/s for iodine and from 1.62 x 10⁻⁹ cm2/s to 2.16 x 10⁻¹⁰ cm2/s for rhenium in CS-III-7% and CS-I-7% (with and without iron), respectively.
Concrete diffusivity values in the concrete monoliths not subjected to carbonation ranged
from 7.95 x 10⁻¹⁴ cm2/s to 2.99 x 10⁻¹² cm2/s for iodine and from 7.02 x 10⁻¹⁴ cm2/s to 7.56 x 10⁻¹³ cm2/s for rhenium in CS-IV-4% and CS-II-4% (with and without iron), respectively. At ~7% soil moisture content, diffusivity values ranged from 2.14 x 10⁻⁹ cm2/s to 1.73 x 10⁻¹² cm2/s for iodine and from 1.53 x10⁻¹² cm2/s to 8.40 x 10⁻¹² cm2/s for rhenium in CS-IV-7% and CS-II-7% (with and without iron), respectively.
These ranges of diffusivity values indicate: 1) in the absence of iron, carbonation of the concrete monolith increases the diffusion of iodine and rhenium by two orders of magnitude, irrespective of water content, 2) in the presence of iron, the diffusion of iodine increased by 2.7x in concrete subject to carbonation at 7% soil moisture content. At 4% soil moisture content, the diffusion of iodide was approximately two orders of magnitude greater in concrete containing iron that was carbonated relative to iron containing concrete not subject to carbonation, 3) the diffusion of rhenium was three orders of magnitude greater in carbonated concrete monoliths which contained iron relative to those not subject to carbonation, irrespective of water content, and 4) an approximate 3% increase in moisture content results in a general decrease in diffusivity. Results presented here confirm previous findings from (Mattigod et al., 2001) which indicated the diffusion increased with increasing water content. However, results presented here conflict with previous findings that the 1) inclusion of iron did not significantly influence the diffusion of iodine or technetium and/or rhenium and 2) the diffusion of iodine was less than technetium and/or rhenium.
The effect of iron on the release of iodine and rhenium from concrete monoliths varied
between carbonated and non-carbonated monoliths. The release of iodine and rhenium was greater in iron-free, relative to iron-containing, non-carbonated monoliths. This suggests that in the presence of iron, iodine and rhenium are converted to reduced species, which are more insoluble and better retained within the concrete monolith.
Iodine and rhenium release was greatest from concrete monoliths which had been subjected
to carbonation. Release of iodine and rhenium was 1 to 2 orders of magnitude less from non-carbonated, relative to carbonated, concrete monoliths. The most significant release and diffusion was exhibited by CS-III-4% and CS-III-7%, carbonated concrete monoliths which contained iron, for both rhenium and iodine, suggesting carbonation negates the effect of iron on the retention of iodine and rhenium within concrete monoliths. This is due to enhanced formation of microcracks in the presence of iron, which provide preferential paths for contaminant migration.
iii

ACKNOWLEDGMENTS
We thank K.N. Geiszler, S.R. Baum, and E.T. Clayton in conducting ICP-MS analyses. In addition, the support of Wiss, Janney, Elstner Associates, Inc. for conducting petrographic and scanning electron microscopy analyses is greatly appreciated.
iv
Contents 1.0 Introduction...................................................................................................................... 1.1
2.0 Concrete Composition and Fabrication of Test Specimens............................................. 2.1
2.1 Specified Concrete Composition for Encasement ....................................................... 2.1
2.2 Materials and Laboratory-Scale Mixture Design......................................................... 2.1
2.2.1 Concrete Mold Design ......................................................................................... 2.2
2.3 Concrete Mix and Specimen Preparation .................................................................... 2.2
3.0 Concrete-Soil Half Cell Diffusion Tests.......................................................................... 3.1
3.1 Concrete-Soil Half Cells .............................................................................................. 3.1
3.2 Effective Diffusion Coefficient Calculations............................................................... 3.2
3.3 Normalized Concentration Profile Results and Discussion ......................................... 3.4
3.4 Diffusivity Results and Discussion............................................................................ 3.11
3.5 Carbonation and Micro-Cracking .............................................................................. 3.17
3.5.1 Petrographic Analyses ....................................................................................... 3.18
4.0 References Cited .............................................................................................................. 4.1
v
Figures
Figure 3-1. a) Mechanism for soil sampling from a concrete-soil diffusion half cell. b) Soil sampling from a diffusion half cell. ..................................................................................... 3.2
Figure 3-2. Normalized concentration profiles for soil half cell iodine and rhenium profiles,
respectively, in CS-I-4% and CS-I-7% Concrete-Soil Half Cells (no iron, carbonated concrete monolith). .............................................................................................................. 3.5
Figure 3-3. Normalized concentration profiles for soil half cell iodine and rhenium profiles,
respectively, in CS-III-4% and CS-III-7% Concrete-Soil Half Cells (iron, carbonated concrete monolith). .............................................................................................................. 3.6
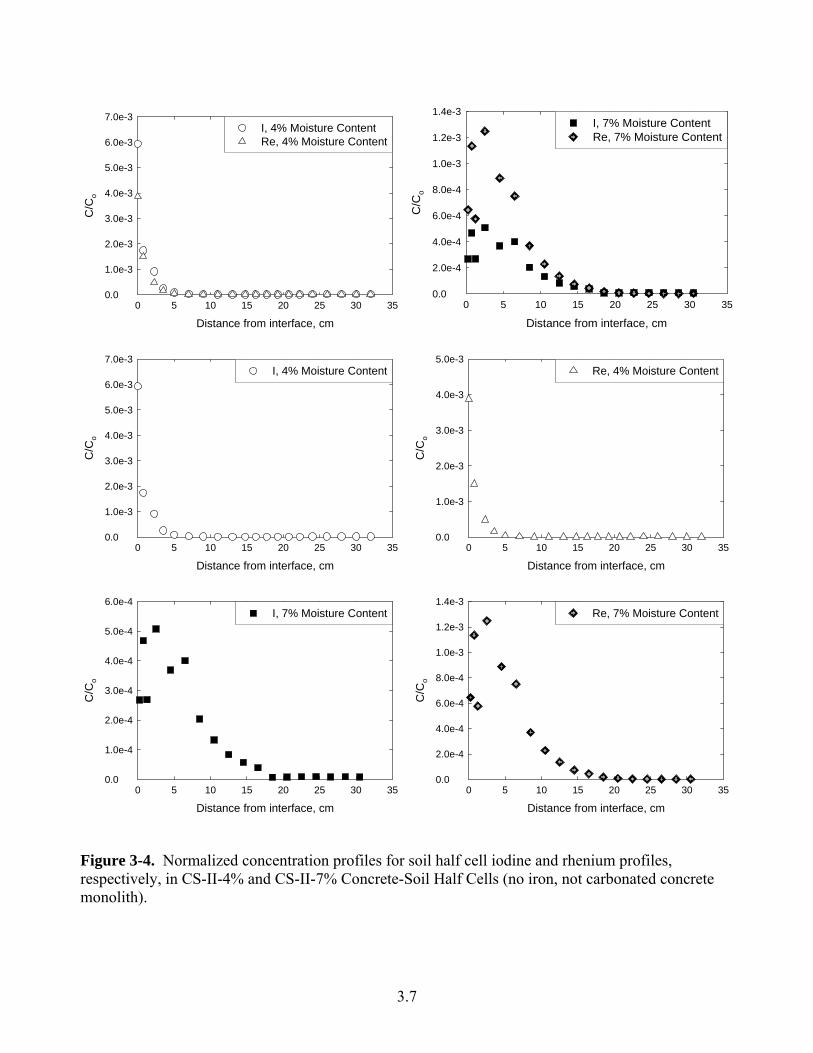
Figure 3-4. Normalized concentration profiles for soil half cell iodine and rhenium profiles,
respectively, in CS-II-4% and CS-II-7% Concrete-Soil Half Cells (no iron, not carbonated concrete monolith). .............................................................................................................. 3.7
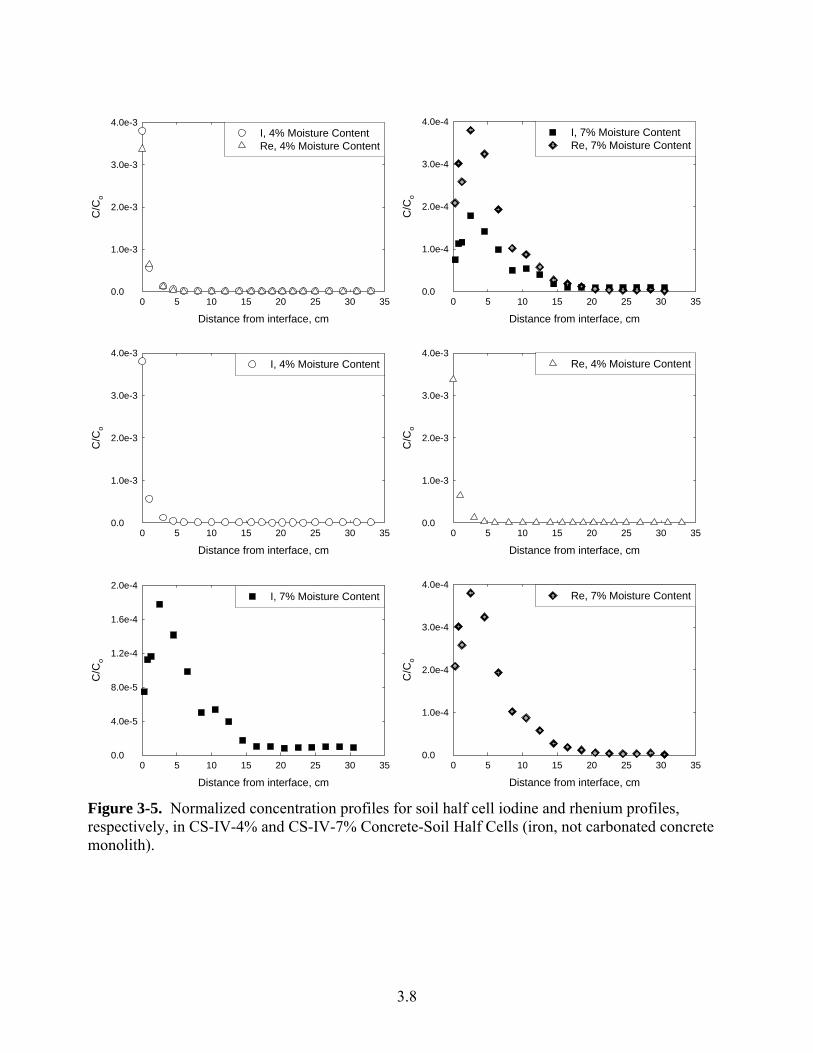
Figure 3-5. Normalized concentration profiles for soil half cell iodine and rhenium profiles,
respectively, in CS-IV-4% and CS-IV-7% Concrete-Soil Half Cells (iron, not carbonated concrete monolith). .............................................................................................................. 3.8
Figure 3-6. Iodine and rhenium concentration profiles for concrete half cell in CS-I-4% and CS-
I-7% Concrete-Soil Half Cells, respectively, (no iron, carbonated concrete monolith). ... 3.10 Figure 3-7. Iodine and rhenium concentration profiles for concrete half cell in CS-III-4% and
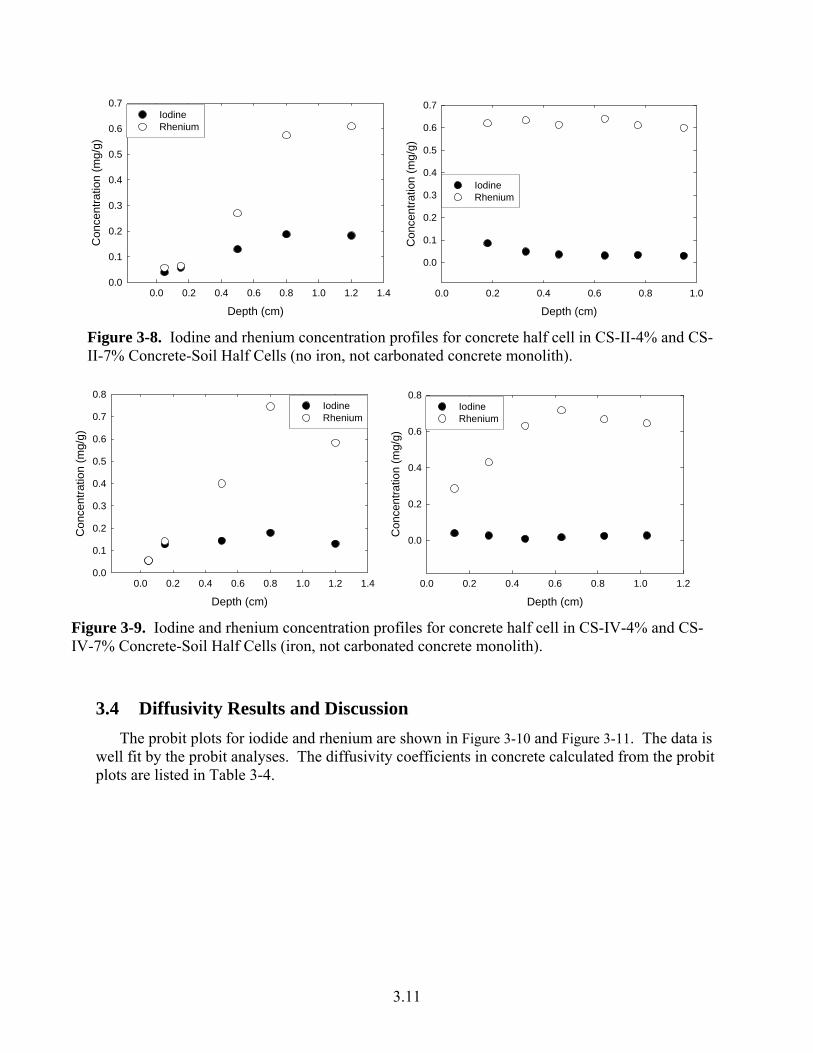
CS-III-7% Concrete-Soil Half Cells (iron, carbonated concrete monolith). ..................... 3.10 Figure 3-8. Iodine and rhenium concentration profiles for concrete half cell in CS-II-4% and CS-
II-7% Concrete-Soil Half Cells (no iron, not carbonated concrete monolith)................... 3.11 Figure 3-9. Iodine and rhenium concentration profiles for concrete half cell in CS-IV-4% and
CS-IV-7% Concrete-Soil Half Cells (iron, not carbonated concrete monolith). ............... 3.11 Figure 3-10. Probit Plot for iodide and rhenium in concrete-soil half-cells at 7% soil moisture
content................................................................................................................................ 3.12 Figure 3-11. Probit plots for iodide and rhenium in concrete-soil half-cells at 4% soil moisture
content................................................................................................................................ 3.13 Figure 3-13. Schematic illustrating concrete treatment and surface designations for petrographic
analysis............................................................................................................................... 3.17 Figure 3-14. a) Lapped surface of CS-II-4%. The top surface shown in the photo is a cast
surface. Air voids are non-uniformly distributed. b) Close view of a fracture surface treated with phenolphthalein pH indicator solution. The top surface shown in the photo is a cast
vi
surface.Non-carbonated paste is stained magenta. A cast surface is at the top of the photo. Scale at left is marked in millimeter increments................................................................ 3.18
Figure 3-15. a) BSE image showing microcracks and aggregate boundary microcracks and
separation. Spherical objects are fly ash particles (magnification is 250X). b) BSE images at 500X and 3000X showing a typical microcrack. The area enclosed by the white box in the image on the left is enlarged in the image on the right. The scale bars are above and below the left and right images, respectively. The image on the right shows that the microcracks are substantially less than 10 micrometers wide. The X-ray analysis at the bottom is for a small region of paste adjacent to the microcrack. The area of the analysis is indicated in the image on the right by the gray box containing the small white square.... 3.19
Figure 3-16. a) Lapped surface of CS-IV-4%. The top surface shown in the photo is a cast
surface. Clustering of the entrained air voids can be clearly seen. b) Close view of a fracture surface treated with phenolphthalein pH indicator solution. The top surface shown in the photo is a cast surface.Non-carbonated concrete is stained magenta. A cast surface is at the top of the photo. Scale at left is marked in millimeter increments. ......................... 3.20
Figure 3-17. a) BSE image showing typical concrete microcracks and aggregate boundary
microcracks and separation (magnification 250X). b) BSE image of discontinuous microcrack. Area enclosed by the white box on the left is enlarged in the image on the right. Image on the right shows the microcracks are substantially less than 10 micrometers wide. The X-ray analysis is for the small region of concrete adjacent to the microcrack indicated by the small white square. .................................................................................. 3.20
Figure 3-18. a) Lapped surface of CS-I-7%. The top surface of the cast specimen is at the top of
the photo. Note concrete color change and abundance of white deposits in the bottom portion of the photo. Scale at left is marked in millimeter increments. b) Closer view of concrete and air voids lined with ....................................................................................... 3.21
Figure 3-19. a) BSE image at 500 X. Microcracks pass between aggregate particles and fly ash
particles. Microcracks also transect portlnad cement grains. Separation microcracks around aggregate particles and fly ash particles are common. b) BSE images at 500X and 4000X showing narrow microcracks branching from the wider, longer microcracks. The X-ray analysis at the bottom is for a small area between microcrack. The area of the analysis is indicated in the image on the right by the gray box containing the small white square.... 3.22
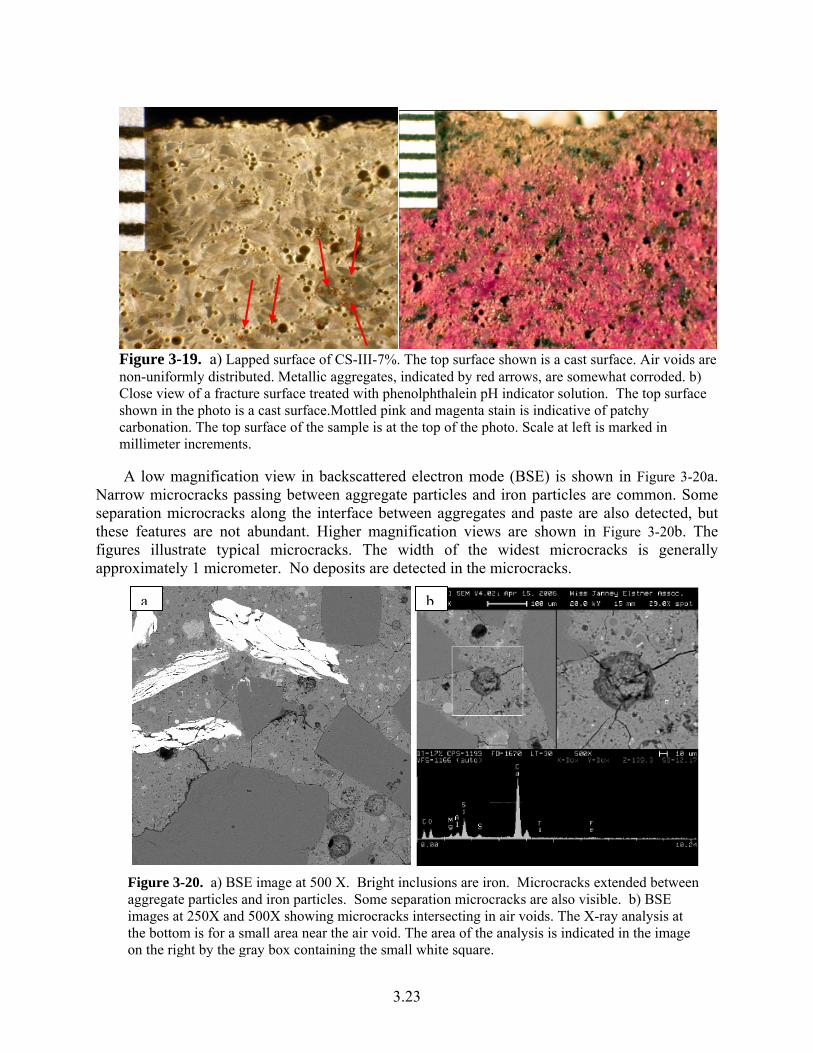
Figure 3-20. a) Lapped surface of CS-III-7%. The top surface shown is a cast surface. Air voids
are non-uniformly distributed. Metallic aggregates, indicated by red arrows, are somewhat corroded. b) Close view of a fracture surface treated with phenolphthalein pH indicator solution. The top surface shown in the photo is a cast surface.Mottled pink and magenta stain is indicative of patchy carbonation. The top surface of the sample is at the top of the photo. Scale at left is marked in millimeter increments..................................................... 3.23
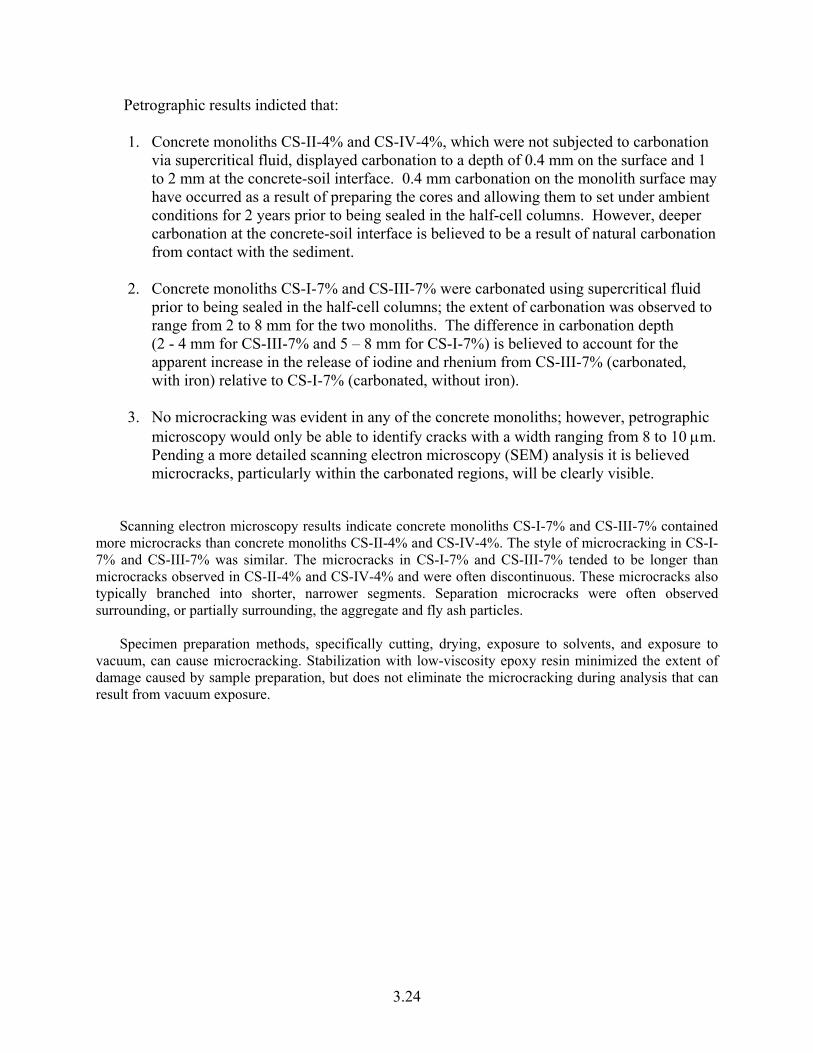
Figure 3-21. a) BSE image at 500 X. Bright inclusions are iron. Microcracks extended between
aggregate particles and iron particles. Some separation microcracks are also visible. b)
vii
BSE images at 250X and 500X showing microcracks intersecting in air voids. The X-ray analysis at the bottom is for a small area near the air void. The area of the analysis is indicated in the image on the right by the gray box containing the small white square.... 3.23
viii
Tables
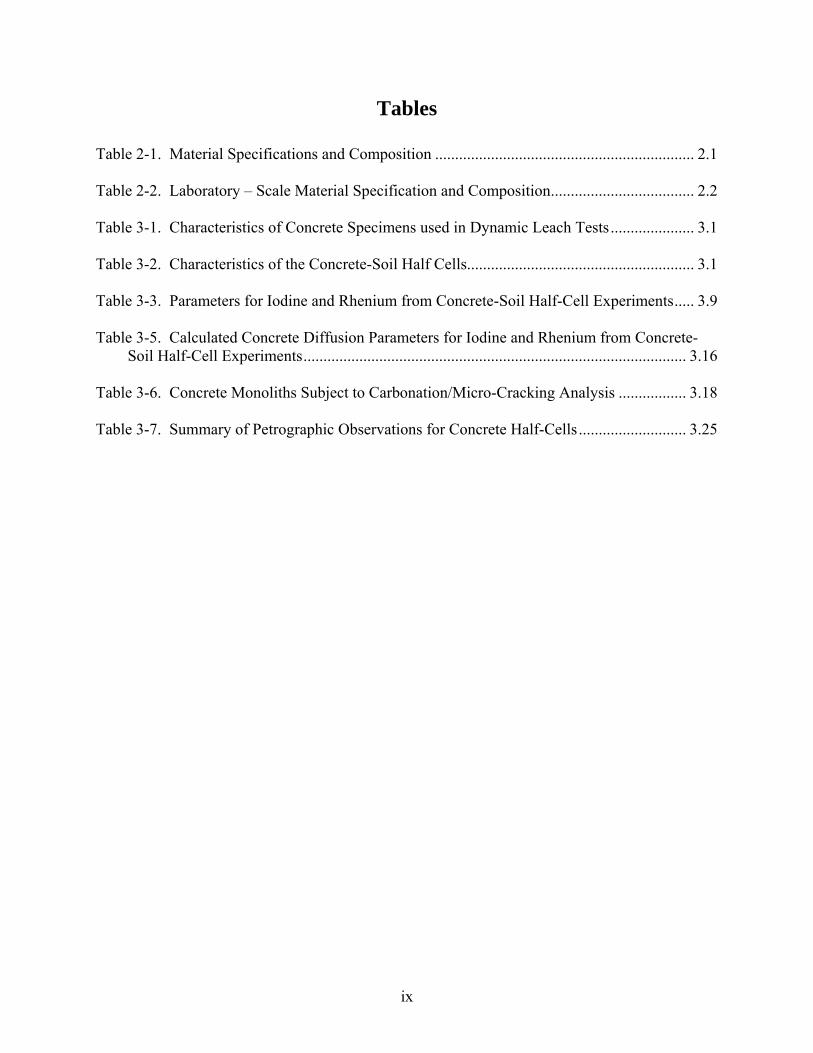
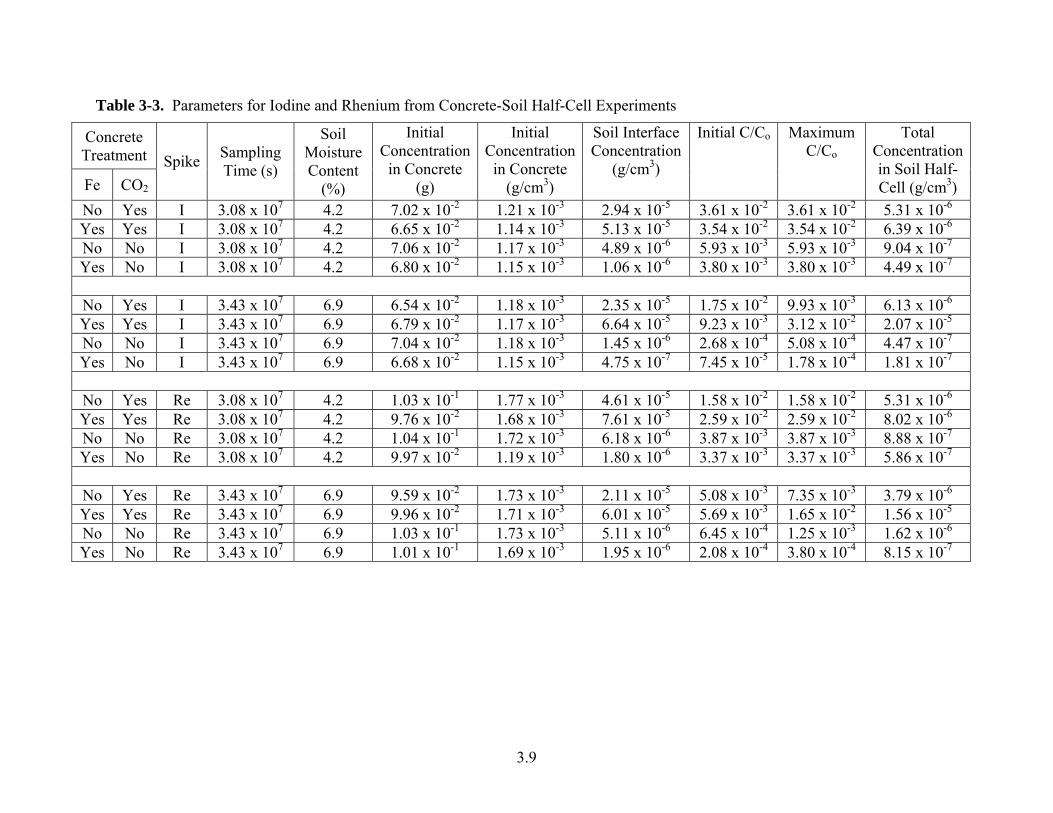
Table 2-1. Material Specifications and Composition ................................................................. 2.1 Table 2-2. Laboratory – Scale Material Specification and Composition.................................... 2.2 Table 3-1. Characteristics of Concrete Specimens used in Dynamic Leach Tests..................... 3.1 Table 3-2. Characteristics of the Concrete-Soil Half Cells......................................................... 3.1 Table 3-3. Parameters for Iodine and Rhenium from Concrete-Soil Half-Cell Experiments..... 3.9 Table 3-5. Calculated Concrete Diffusion Parameters for Iodine and Rhenium from Concrete-
Soil Half-Cell Experiments................................................................................................ 3.16 Table 3-6. Concrete Monoliths Subject to Carbonation/Micro-Cracking Analysis ................. 3.18 Table 3-7. Summary of Petrographic Observations for Concrete Half-Cells........................... 3.25
ix
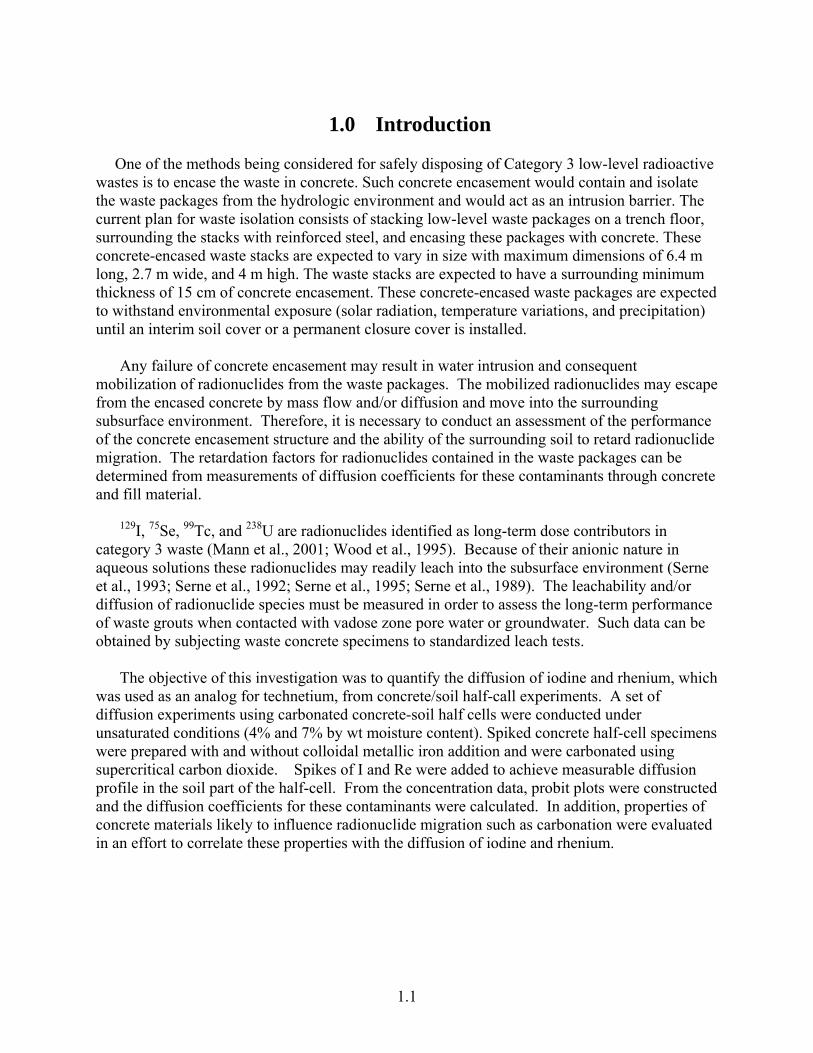
1.0 Introduction
One of the methods being considered for safely disposing of Category 3 low-level radioactive wastes is to encase the waste in concrete. Such concrete encasement would contain and isolate the waste packages from the hydrologic environment and would act as an intrusion barrier. The current plan for waste isolation consists of stacking low-level waste packages on a trench floor, surrounding the stacks with reinforced steel, and encasing these packages with concrete. These concrete-encased waste stacks are expected to vary in size with maximum dimensions of 6.4 m long, 2.7 m wide, and 4 m high. The waste stacks are expected to have a surrounding minimum thickness of 15 cm of concrete encasement. These concrete-encased waste packages are expected to withstand environmental exposure (solar radiation, temperature variations, and precipitation) until an interim soil cover or a permanent closure cover is installed.
Any failure of concrete encasement may result in water intrusion and consequent mobilization of radionuclides from the waste packages. The mobilized radionuclides may escape from the encased concrete by mass flow and/or diffusion and move into the surrounding subsurface environment. Therefore, it is necessary to conduct an assessment of the performance of the concrete encasement structure and the ability of the surrounding soil to retard radionuclide migration. The retardation factors for radionuclides contained in the waste packages can be determined from measurements of diffusion coefficients for these contaminants through concrete and fill material.
129I, 75Se, 99Tc, and 238U are radionuclides identified as long-term dose contributors in category 3 waste (Mann et al., 2001; Wood et al., 1995). Because of their anionic nature in aqueous solutions these radionuclides may readily leach into the subsurface environment (Serne et al., 1993; Serne et al., 1992; Serne et al., 1995; Serne et al., 1989). The leachability and/or diffusion of radionuclide species must be measured in order to assess the long-term performance of waste grouts when contacted with vadose zone pore water or groundwater. Such data can be obtained by subjecting waste concrete specimens to standardized leach tests.
The objective of this investigation was to quantify the diffusion of iodine and rhenium, which
was used as an analog for technetium, from concrete/soil half-call experiments. A set of diffusion experiments using carbonated concrete-soil half cells were conducted under unsaturated conditions (4% and 7% by wt moisture content). Spiked concrete half-cell specimens were prepared with and without colloidal metallic iron addition and were carbonated using supercritical carbon dioxide. Spikes of I and Re were added to achieve measurable diffusion profile in the soil part of the half-cell. From the concentration data, probit plots were constructed and the diffusion coefficients for these contaminants were calculated. In addition, properties of concrete materials likely to influence radionuclide migration such as carbonation were evaluated in an effort to correlate these properties with the diffusion of iodine and rhenium.
1.1
2.0 Concrete Composition and Fabrication of Test Specimens
The concrete composition for the burial encasement was specified in Specification for Concrete Encasement for Contact-Handled Category 3 Waste.(a) This specification was used as the basis to prepare a concrete for fabrication of test specimens. 2.1 Specified Concrete Composition for Encasement
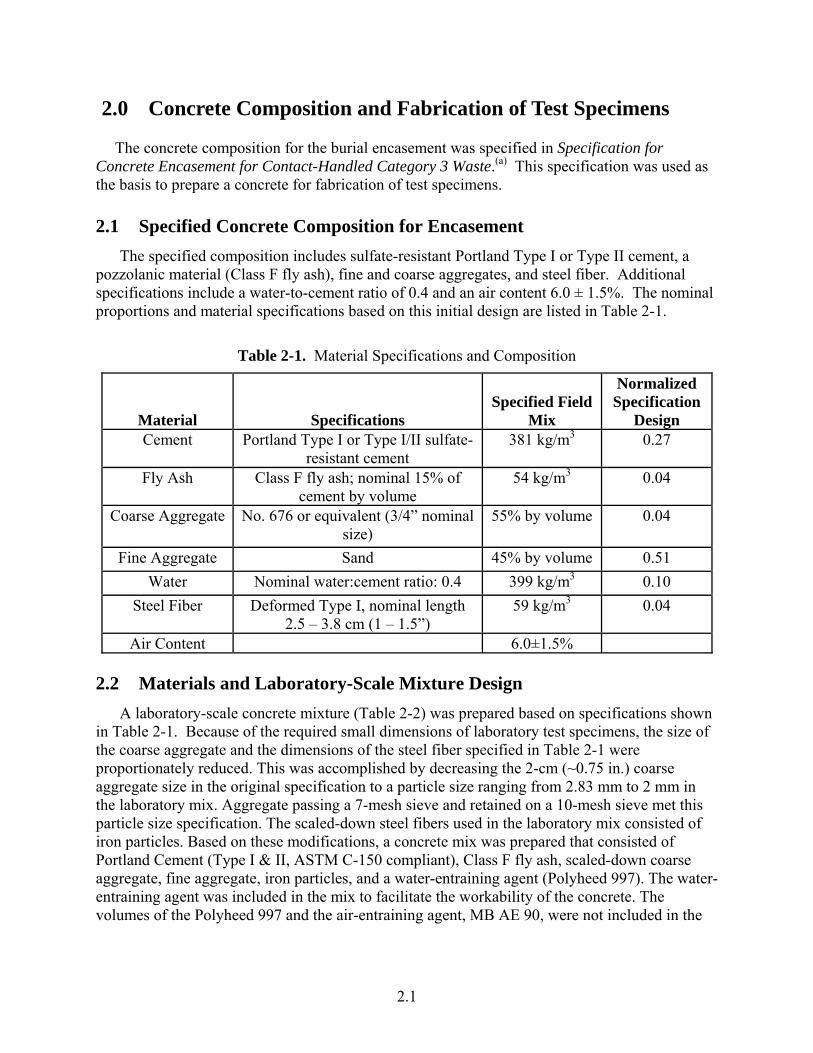
The specified composition includes sulfate-resistant Portland Type I or Type II cement, a pozzolanic material (Class F fly ash), fine and coarse aggregates, and steel fiber. Additional specifications include a water-to-cement ratio of 0.4 and an air content 6.0 ± 1.5%. The nominal proportions and material specifications based on this initial design are listed in Table 2-1.
Table 2-1. Material Specifications and Composition
Material
Specifications
Specified Field
Mix
Normalized Specification
Design Cement Portland Type I or Type I/II sulfate-
resistant cement 381 kg/m3 0.27
Fly Ash Class F fly ash; nominal 15% of cement by volume
54 kg/m3 0.04
Coarse Aggregate No. 676 or equivalent (3/4” nominal size)
55% by volume 0.04
Fine Aggregate Sand 45% by volume 0.51 Water Nominal water:cement ratio: 0.4 399 kg/m3 0.10
Steel Fiber Deformed Type I, nominal length 2.5 – 3.8 cm (1 – 1.5”)
59 kg/m3 0.04
Air Content 6.0±1.5% 2.2 Materials and Laboratory-Scale Mixture Design
A laboratory-scale concrete mixture (Table 2-2) was prepared based on specifications shown in Table 2-1. Because of the required small dimensions of laboratory test specimens, the size of the coarse aggregate and the dimensions of the steel fiber specified in Table 2-1 were proportionately reduced. This was accomplished by decreasing the 2-cm (~0.75 in.) coarse aggregate size in the original specification to a particle size ranging from 2.83 mm to 2 mm in the laboratory mix. Aggregate passing a 7-mesh sieve and retained on a 10-mesh sieve met this particle size specification. The scaled-down steel fibers used in the laboratory mix consisted of iron particles. Based on these modifications, a concrete mix was prepared that consisted of Portland Cement (Type I & II, ASTM C-150 compliant), Class F fly ash, scaled-down coarse aggregate, fine aggregate, iron particles, and a water-entraining agent (Polyheed 997). The water-entraining agent was included in the mix to facilitate the workability of the concrete. The volumes of the Polyheed 997 and the air-entraining agent, MB AE 90, were not included in the
2.1
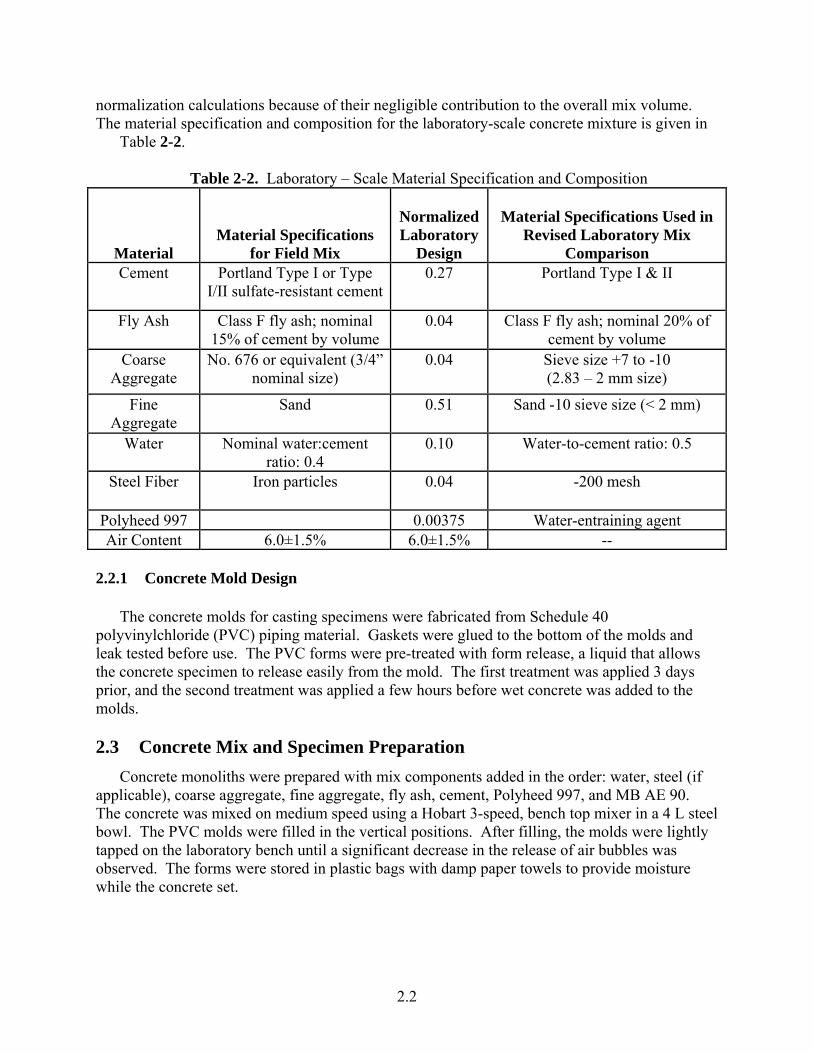
normalization calculations because of their negligible contribution to the overall mix volume. The material specification and composition for the laboratory-scale concrete mixture is given in
Table 2-2.
Table 2-2. Laboratory – Scale Material Specification and Composition
Material
Material Specifications for Field Mix
Normalized Laboratory
Design
Material Specifications Used in
Revised Laboratory Mix Comparison
Cement Portland Type I or Type I/II sulfate-resistant cement
0.27 Portland Type I & II
Fly Ash Class F fly ash; nominal 15% of cement by volume
0.04 Class F fly ash; nominal 20% of cement by volume
Coarse Aggregate
No. 676 or equivalent (3/4” nominal size)
0.04 Sieve size +7 to -10 (2.83 – 2 mm size)
Fine Aggregate
Sand 0.51 Sand -10 sieve size (< 2 mm)
Water Nominal water:cement ratio: 0.4
0.10 Water-to-cement ratio: 0.5
Steel Fiber Iron particles 0.04 -200 mesh
Polyheed 997 0.00375 Water-entraining agent Air Content 6.0±1.5% 6.0±1.5% --
2.2.1 Concrete Mold Design
The concrete molds for casting specimens were fabricated from Schedule 40 polyvinylchloride (PVC) piping material. Gaskets were glued to the bottom of the molds and leak tested before use. The PVC forms were pre-treated with form release, a liquid that allows the concrete specimen to release easily from the mold. The first treatment was applied 3 days prior, and the second treatment was applied a few hours before wet concrete was added to the molds.
2.3 Concrete Mix and Specimen Preparation
Concrete monoliths were prepared with mix components added in the order: water, steel (if applicable), coarse aggregate, fine aggregate, fly ash, cement, Polyheed 997, and MB AE 90. The concrete was mixed on medium speed using a Hobart 3-speed, bench top mixer in a 4 L steel bowl. The PVC molds were filled in the vertical positions. After filling, the molds were lightly tapped on the laboratory bench until a significant decrease in the release of air bubbles was observed. The forms were stored in plastic bags with damp paper towels to provide moisture while the concrete set.
2.2
3.1
3.0 Concrete-Soil Half Cell Diffusion Tests
3.1 Concrete-Soil Half Cells Diffusion tests were conducted to assess the effects of concrete carbonation and the inclusion
of colloidal iron on the rate of diffusion of key, long-lived, mobile contaminants, iodine and rhenium, in unsaturated Hanford sediments (~4% and 7% moisture content by weight) in contact with a spiked concrete monolith. The experiments were conducted using a half cell of Trench 8 soil (~4 cm in diameter and 20 cm long) in contact with a concrete monolith (~4 cm diameter and ~4 cm long) spiked with iodine and rhenium. Trench 8 soil is a medium coarse sand obtained from the sidewall of the W-5 burial ground located on the Hanford Site. The physical, chemical and mineralogical properties of this soil have been previously characterized by Serne et al. (1993). Concrete monoliths were prepared in two separate batches based on the laboratory scale specifications for the concrete (
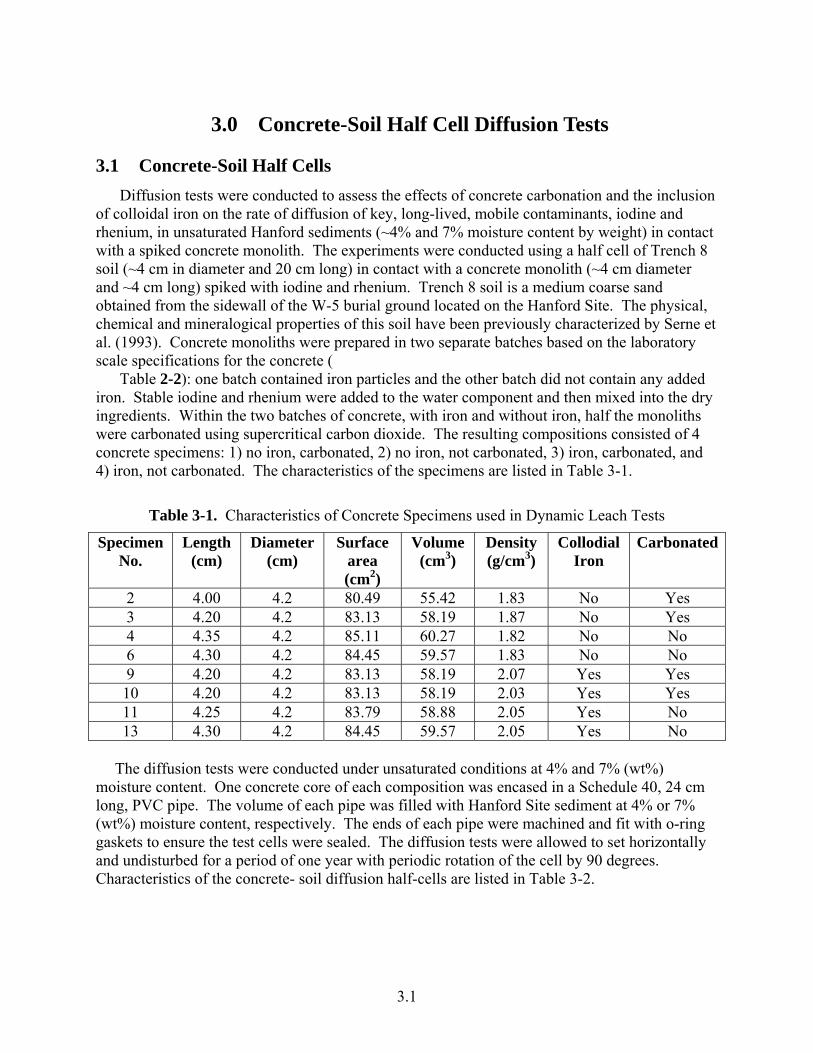
Table 2-2): one batch contained iron particles and the other batch did not contain any added iron. Stable iodine and rhenium were added to the water component and then mixed into the dry ingredients. Within the two batches of concrete, with iron and without iron, half the monoliths were carbonated using supercritical carbon dioxide. The resulting compositions consisted of 4 concrete specimens: 1) no iron, carbonated, 2) no iron, not carbonated, 3) iron, carbonated, and 4) iron, not carbonated. The characteristics of the specimens are listed in Table 3-1.
Table 3-1. Characteristics of Concrete Specimens used in Dynamic Leach Tests
Specimen No.
Length (cm)
Diameter (cm)
Surface area (cm2)
Volume (cm3)
Density (g/cm3)
Collodial Iron
Carbonated
2 4.00 4.2 80.49 55.42 1.83 No Yes 3 4.20 4.2 83.13 58.19 1.87 No Yes 4 4.35 4.2 85.11 60.27 1.82 No No 6 4.30 4.2 84.45 59.57 1.83 No No 9 4.20 4.2 83.13 58.19 2.07 Yes Yes 10 4.20 4.2 83.13 58.19 2.03 Yes Yes 11 4.25 4.2 83.79 58.88 2.05 Yes No 13 4.30 4.2 84.45 59.57 2.05 Yes No
The diffusion tests were conducted under unsaturated conditions at 4% and 7% (wt%)
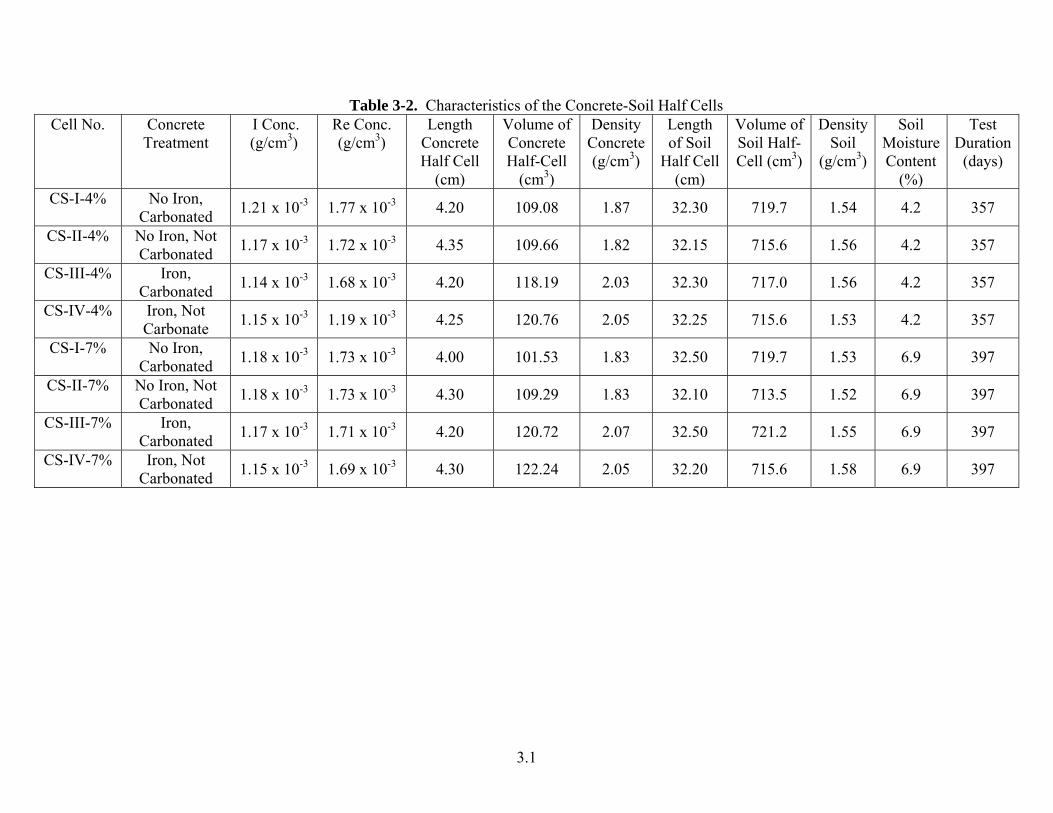
moisture content. One concrete core of each composition was encased in a Schedule 40, 24 cm long, PVC pipe. The volume of each pipe was filled with Hanford Site sediment at 4% or 7% (wt%) moisture content, respectively. The ends of each pipe were machined and fit with o-ring gaskets to ensure the test cells were sealed. The diffusion tests were allowed to set horizontally and undisturbed for a period of one year with periodic rotation of the cell by 90 degrees. Characteristics of the concrete- soil diffusion half-cells are listed in Table 3-2.
3.1
Table 3-2. Characteristics of the Concrete-Soil Half Cells Cell No. Concrete
Treatment I Conc. (g/cm3)
Re Conc. (g/cm3)
Length Concrete Half Cell
(cm)
Volume of Concrete Half-Cell
(cm3)
Density Concrete (g/cm3)
Length of Soil
Half Cell (cm)
Volume of Soil Half-Cell (cm3)
Density Soil
(g/cm3)
Soil Moisture Content
(%)
Test Duration
(days)
CS-I-4% No Iron, Carbonated 1.21 x 10⁻³ 1.77 x 10⁻³ 4.20 109.08 1.87 32.30 719.7 1.54 4.2 357
CS-II-4% No Iron, Not Carbonated 1.17 x 10⁻³ 1.72 x 10⁻³ 4.35 109.66 1.82 32.15 715.6 1.56 4.2 357
CS-III-4% Iron, Carbonated 1.14 x 10⁻³ 1.68 x 10⁻³ 4.20 118.19 2.03 32.30 717.0 1.56 4.2 357
CS-IV-4% Iron, Not Carbonate 1.15 x 10⁻³ 1.19 x 10⁻³ 4.25 120.76 2.05 32.25 715.6 1.53 4.2 357
CS-I-7% No Iron, Carbonated 1.18 x 10⁻³ 1.73 x 10⁻³ 4.00 101.53 1.83 32.50 719.7 1.53 6.9 397
CS-II-7% No Iron, Not Carbonated 1.18 x 10⁻³ 1.73 x 10⁻³ 4.30 109.29 1.83 32.10 713.5 1.52 6.9 397
CS-III-7% Iron, Carbonated 1.17 x 10⁻³ 1.71 x 10⁻³ 4.20 120.72 2.07 32.50 721.2 1.55 6.9 397
CS-IV-7% Iron, Not Carbonated 1.15 x 10⁻³ 1.69 x 10⁻³ 4.30 122.24 2.05 32.20 715.6 1.58 6.9 397
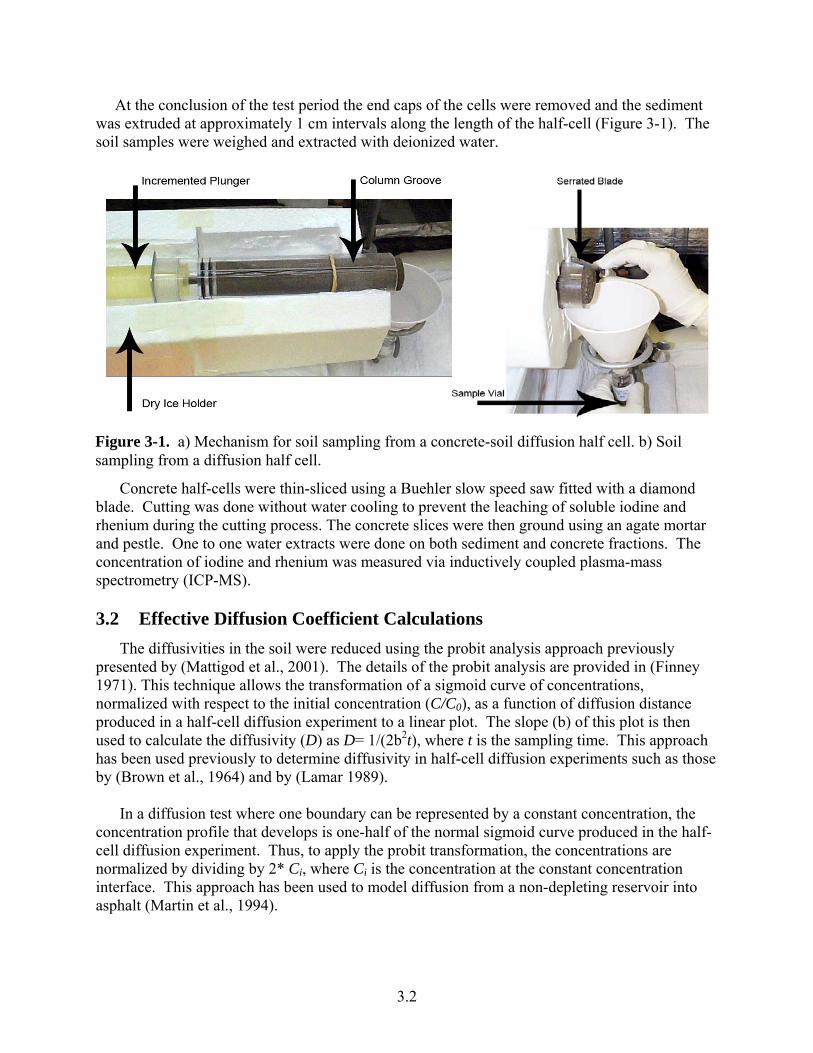
At the conclusion of the test period the end caps of the cells were removed and the sediment was extruded at approximately 1 cm intervals along the length of the half-cell (Figure 3-1). The soil samples were weighed and extracted with deionized water.
Figure 3-1. a) Mechanism for soil sampling from a concrete-soil diffusion half cell. b) Soil sampling from a diffusion half cell.
Concrete half-cells were thin-sliced using a Buehler slow speed saw fitted with a diamond blade. Cutting was done without water cooling to prevent the leaching of soluble iodine and rhenium during the cutting process. The concrete slices were then ground using an agate mortar and pestle. One to one water extracts were done on both sediment and concrete fractions. The concentration of iodine and rhenium was measured via inductively coupled plasma-mass spectrometry (ICP-MS). 3.2 Effective Diffusion Coefficient Calculations
The diffusivities in the soil were reduced using the probit analysis approach previously presented by (Mattigod et al., 2001). The details of the probit analysis are provided in (Finney 1971). This technique allows the transformation of a sigmoid curve of concentrations, normalized with respect to the initial concentration (C/C0), as a function of diffusion distance produced in a half-cell diffusion experiment to a linear plot. The slope (b) of this plot is then used to calculate the diffusivity (D) as D= 1/(2b2t), where t is the sampling time. This approach has been used previously to determine diffusivity in half-cell diffusion experiments such as those by (Brown et al., 1964) and by (Lamar 1989).
In a diffusion test where one boundary can be represented by a constant concentration, the concentration profile that develops is one-half of the normal sigmoid curve produced in the half-cell diffusion experiment. Thus, to apply the probit transformation, the concentrations are normalized by dividing by 2* Ci, where Ci is the concentration at the constant concentration interface. This approach has been used to model diffusion from a non-depleting reservoir into asphalt (Martin et al., 1994).
3.2
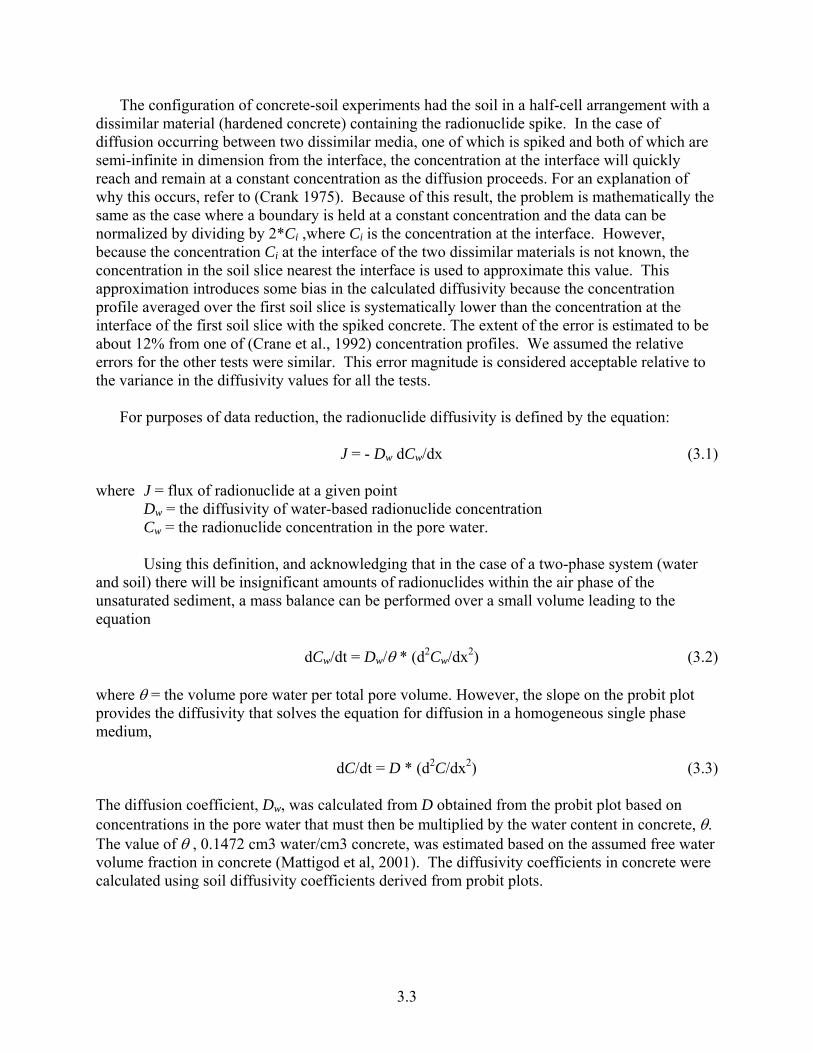
The configuration of concrete-soil experiments had the soil in a half-cell arrangement with a dissimilar material (hardened concrete) containing the radionuclide spike. In the case of diffusion occurring between two dissimilar media, one of which is spiked and both of which are semi-infinite in dimension from the interface, the concentration at the interface will quickly reach and remain at a constant concentration as the diffusion proceeds. For an explanation of why this occurs, refer to (Crank 1975). Because of this result, the problem is mathematically the same as the case where a boundary is held at a constant concentration and the data can be normalized by dividing by 2*Ci ,where Ci is the concentration at the interface. However, because the concentration Ci at the interface of the two dissimilar materials is not known, the concentration in the soil slice nearest the interface is used to approximate this value. This approximation introduces some bias in the calculated diffusivity because the concentration profile averaged over the first soil slice is systematically lower than the concentration at the interface of the first soil slice with the spiked concrete. The extent of the error is estimated to be about 12% from one of (Crane et al., 1992) concentration profiles. We assumed the relative errors for the other tests were similar. This error magnitude is considered acceptable relative to the variance in the diffusivity values for all the tests.
For purposes of data reduction, the radionuclide diffusivity is defined by the equation:
J = - Dw dCw/dx (3.1) where J = flux of radionuclide at a given point
Dw = the diffusivity of water-based radionuclide concentration Cw = the radionuclide concentration in the pore water.
Using this definition, and acknowledging that in the case of a two-phase system (water
and soil) there will be insignificant amounts of radionuclides within the air phase of the unsaturated sediment, a mass balance can be performed over a small volume leading to the equation
dCw/dt = Dw/θ * (d2Cw/dx2) (3.2)
where θ = the volume pore water per total pore volume. However, the slope on the probit plot provides the diffusivity that solves the equation for diffusion in a homogeneous single phase medium,
dC/dt = D * (d2C/dx2) (3.3) The diffusion coefficient, Dw, was calculated from D obtained from the probit plot based on concentrations in the pore water that must then be multiplied by the water content in concrete, θ. The value of θ , 0.1472 cm3 water/cm3 concrete, was estimated based on the assumed free water volume fraction in concrete (Mattigod et al, 2001). The diffusivity coefficients in concrete were calculated using soil diffusivity coefficients derived from probit plots.
3.3
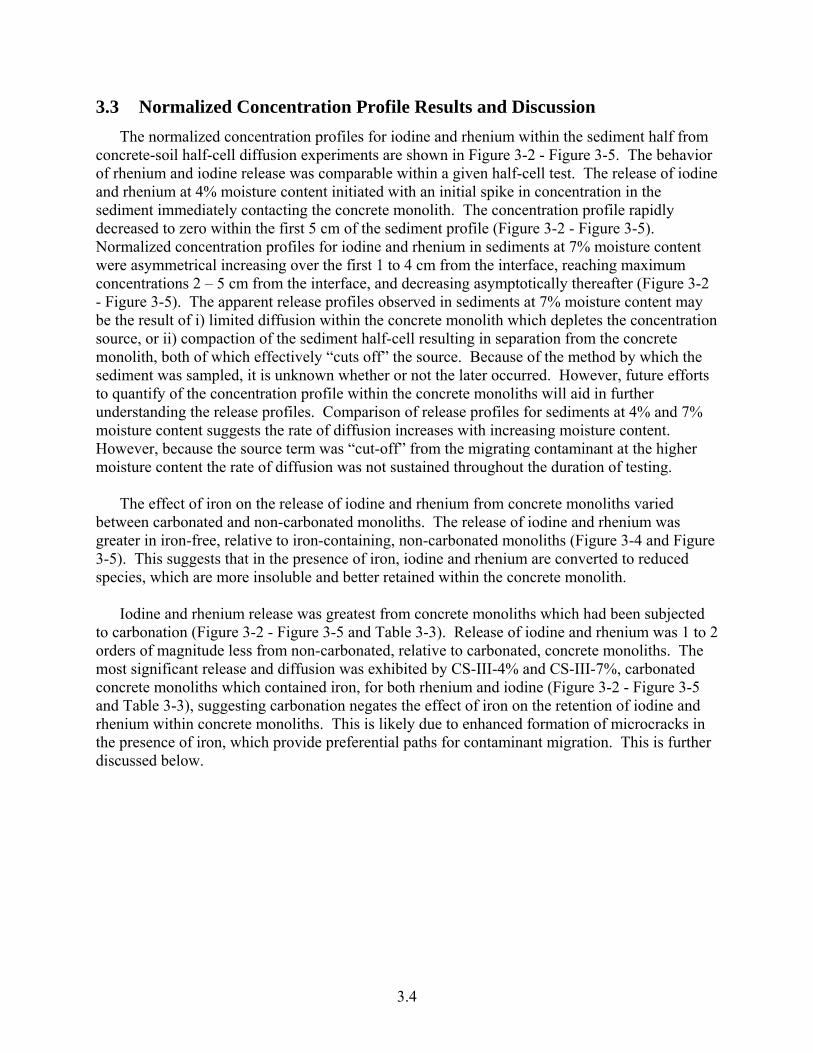
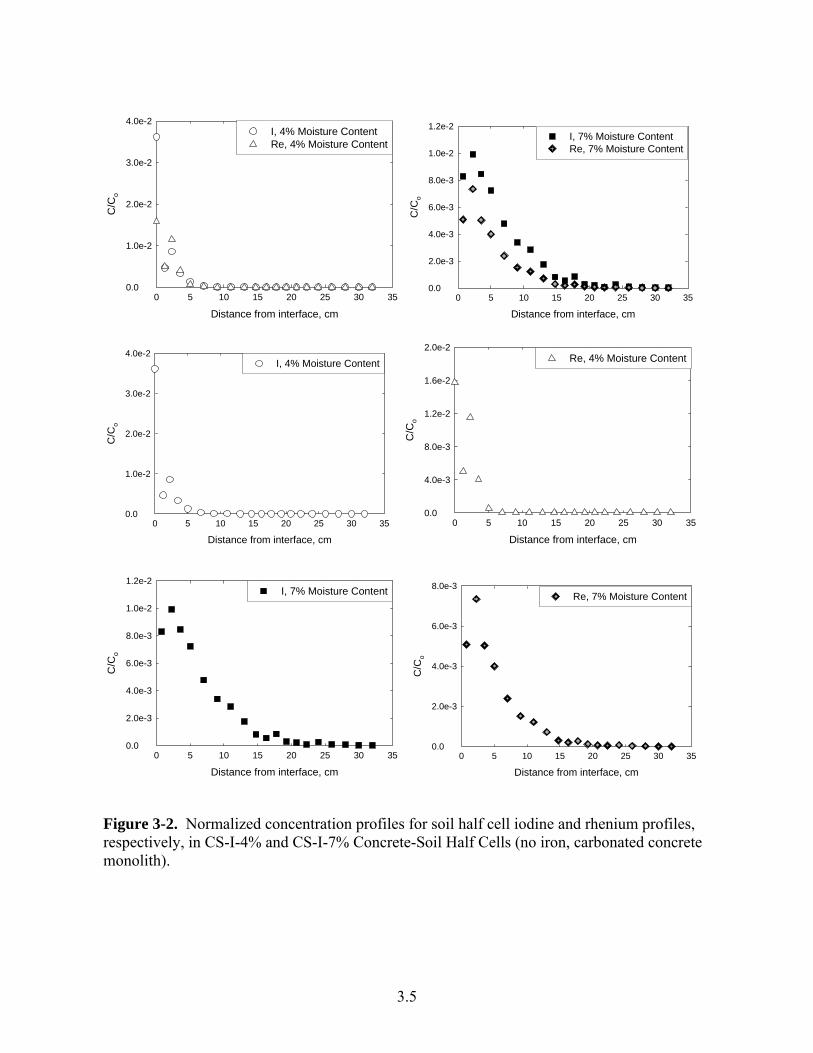
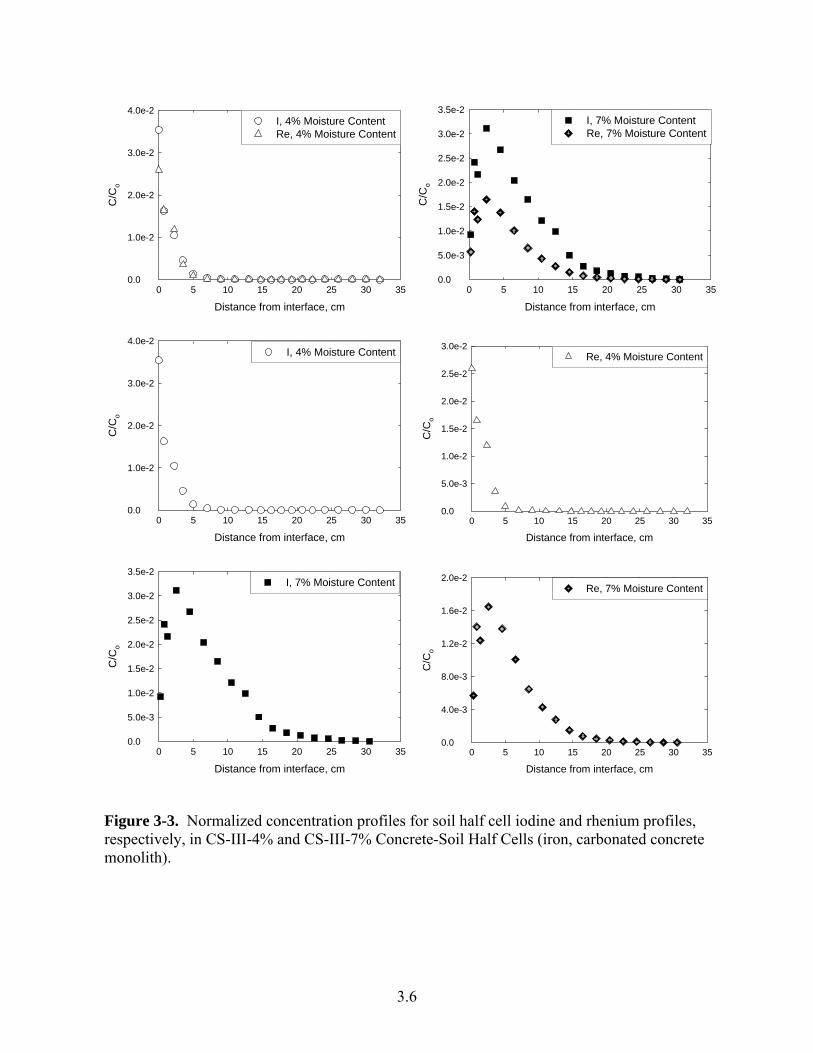
3.3 Normalized Concentration Profile Results and Discussion The normalized concentration profiles for iodine and rhenium within the sediment half from
concrete-soil half-cell diffusion experiments are shown in Figure 3-2 - Figure 3-5. The behavior of rhenium and iodine release was comparable within a given half-cell test. The release of iodine and rhenium at 4% moisture content initiated with an initial spike in concentration in the sediment immediately contacting the concrete monolith. The concentration profile rapidly decreased to zero within the first 5 cm of the sediment profile (Figure 3-2 - Figure 3-5). Normalized concentration profiles for iodine and rhenium in sediments at 7% moisture content were asymmetrical increasing over the first 1 to 4 cm from the interface, reaching maximum concentrations 2 – 5 cm from the interface, and decreasing asymptotically thereafter (Figure 3-2 - Figure 3-5). The apparent release profiles observed in sediments at 7% moisture content may be the result of i) limited diffusion within the concrete monolith which depletes the concentration source, or ii) compaction of the sediment half-cell resulting in separation from the concrete monolith, both of which effectively “cuts off” the source. Because of the method by which the sediment was sampled, it is unknown whether or not the later occurred. However, future efforts to quantify of the concentration profile within the concrete monoliths will aid in further understanding the release profiles. Comparison of release profiles for sediments at 4% and 7% moisture content suggests the rate of diffusion increases with increasing moisture content. However, because the source term was “cut-off” from the migrating contaminant at the higher moisture content the rate of diffusion was not sustained throughout the duration of testing.
The effect of iron on the release of iodine and rhenium from concrete monoliths varied
between carbonated and non-carbonated monoliths. The release of iodine and rhenium was greater in iron-free, relative to iron-containing, non-carbonated monoliths (Figure 3-4 and Figure 3-5). This suggests that in the presence of iron, iodine and rhenium are converted to reduced species, which are more insoluble and better retained within the concrete monolith.
Iodine and rhenium release was greatest from concrete monoliths which had been subjected
to carbonation (Figure 3-2 - Figure 3-5 and Table 3-3). Release of iodine and rhenium was 1 to 2 orders of magnitude less from non-carbonated, relative to carbonated, concrete monoliths. The most significant release and diffusion was exhibited by CS-III-4% and CS-III-7%, carbonated concrete monoliths which contained iron, for both rhenium and iodine (Figure 3-2 - Figure 3-5 and Table 3-3), suggesting carbonation negates the effect of iron on the retention of iodine and rhenium within concrete monoliths. This is likely due to enhanced formation of microcracks in the presence of iron, which provide preferential paths for contaminant migration. This is further discussed below.
3.4
Distance from interface, cm0 5 10 15 20 25 30 35
C/C
o
0.0
1.0e-2
2.0e-2
3.0e-2
4.0e-2I, 4% Moisture ContentRe, 4% Moisture Content
Distance from interface, cm0 5 10 15 20 25 30 35
C/C
o
0.0
2.0e-3
4.0e-3
6.0e-3
8.0e-3
1.0e-2
1.2e-2I, 7% Moisture ContentRe, 7% Moisture Content
Distance from interface, cm0 5 10 15 20 25 30 35
C/C
o
0.0
1.0e-2
2.0e-2
3.0e-2
4.0e-2I, 4% Moisture Content
Distance from interface, cm0 5 10 15 20 25 30 35
C/C
o
0.0
4.0e-3
8.0e-3
1.2e-2
1.6e-2
2.0e-2Re, 4% Moisture Content
Distance from interface, cm0 5 10 15 20 25 30 35
C/C
o
0.0
2.0e-3
4.0e-3
6.0e-3
8.0e-3
1.0e-2
1.2e-2I, 7% Moisture Content
Distance from interface, cm0 5 10 15 20 25 30 35
C/C
o
0.0
2.0e-3
4.0e-3
6.0e-3
8.0e-3Re, 7% Moisture Content
Figure 3-2. Normalized concentration profiles for soil half cell iodine and rhenium profiles, respectively, in CS-I-4% and CS-I-7% Concrete-Soil Half Cells (no iron, carbonated concrete monolith).
3.5
Distance from interface, cm0 5 10 15 20 25 30 35
C/C
o
0.0
1.0e-2
2.0e-2
3.0e-2
4.0e-2I, 4% Moisture ContentRe, 4% Moisture Content
Distance from interface, cm0 5 10 15 20 25 30 35
C/C
o
0.0
5.0e-3
1.0e-2
1.5e-2
2.0e-2
2.5e-2
3.0e-2
3.5e-2I, 7% Moisture ContentRe, 7% Moisture Content
Distance from interface, cm0 5 10 15 20 25 30 35
C/C
o
0.0
1.0e-2
2.0e-2
3.0e-2
4.0e-2I, 4% Moisture Content
Distance from interface, cm0 5 10 15 20 25 30 35
C/C
o
0.0
5.0e-3
1.0e-2
1.5e-2
2.0e-2
2.5e-2
3.0e-2Re, 4% Moisture Content
Distance from interface, cm0 5 10 15 20 25 30 35
C/C
o
0.0
5.0e-3
1.0e-2
1.5e-2
2.0e-2
2.5e-2
3.0e-2
3.5e-2I, 7% Moisture Content
Distance from interface, cm0 5 10 15 20 25 30 35
C/C
o
0.0
4.0e-3
8.0e-3
1.2e-2
1.6e-2
2.0e-2Re, 7% Moisture Content
Figure 3-3. Normalized concentration profiles for soil half cell iodine and rhenium profiles, respectively, in CS-III-4% and CS-III-7% Concrete-Soil Half Cells (iron, carbonated concrete monolith).
3.6
Distance from interface, cm0 5 10 15 20 25 30 35
C/C
o
0.0
1.0e-3
2.0e-3
3.0e-3
4.0e-3
5.0e-3
6.0e-3
7.0e-3I, 4% Moisture ContentRe, 4% Moisture Content
Distance from interface, cm0 5 10 15 20 25 30 35
C/C
o
0.0
2.0e-4
4.0e-4
6.0e-4
8.0e-4
1.0e-3
1.2e-3
1.4e-3I, 7% Moisture ContentRe, 7% Moisture Content
Distance from interface, cm0 5 10 15 20 25 30 35
C/C
o
0.0
1.0e-3
2.0e-3
3.0e-3
4.0e-3
5.0e-3
6.0e-3
7.0e-3I, 4% Moisture Content
Distance from interface, cm0 5 10 15 20 25 30 35
C/C
o
0.0
1.0e-3
2.0e-3
3.0e-3
4.0e-3
5.0e-3Re, 4% Moisture Content
Distance from interface, cm0 5 10 15 20 25 30 35
C/C
o
0.0
1.0e-4
2.0e-4
3.0e-4
4.0e-4
5.0e-4
6.0e-4I, 7% Moisture Content
Distance from interface, cm0 5 10 15 20 25 30 35
C/C
o
0.0
2.0e-4
4.0e-4
6.0e-4
8.0e-4
1.0e-3
1.2e-3
1.4e-3Re, 7% Moisture Content
Figure 3-4. Normalized concentration profiles for soil half cell iodine and rhenium profiles, respectively, in CS-II-4% and CS-II-7% Concrete-Soil Half Cells (no iron, not carbonated concrete monolith).
3.7
3.8
Distance from interface, cm0 5 10 15 20 25 30 35
C/C
o
0.0
1.0e-3
2.0e-3
3.0e-3
4.0e-3I, 4% Moisture ContentRe, 4% Moisture Content
Distance from interface, cm0 5 10 15 20 25 30 35
C/C
o
0.0
1.0e-3
2.0e-3
3.0e-3
4.0e-3I, 4% Moisture Content
Distance from interface, cm0 5 10 15 20 25 30 35
C/C
o
0.0
1.0e-3
2.0e-3
3.0e-3
4.0e-3Re, 4% Moisture Content
Distance from interface, cm0 5 10 15 20 25 30 35
Figure 3-5. Normalized concentration profiles for soil half cell iodine and rhenium profiles, respectively, in CS-IV-4% and CS-IV-7% Concrete-Soil Half Cells (iron, not carbonated concrete monolith).
C/C
o
0.0
4.0e-5
8.0e-5
1.2e-4
1.6e-4
2.0e-4
Distance from interface, cm0 5 10 15 20 25 30 35
C/C
o
0.0
1.0e-4
2.0e-4
3.0e-4
4.0e-4I, 7% Moisture ContentRe, 7% Moisture Content
I, 7% Moisture Content
Distance from interface, cm0 5 10 15 20 25 30 35
C/C
o
0.0
1.0e-4
2.0e-4
3.0e-4
4.0e-4Re, 7% Moisture Content
3.9
Table 3-3. Parameters for Iodine and Rhenium from Concrete-Soil Half-Cell Experiments
Concrete Treatment
Fe CO2
Spike Sampling Time (s)
Soil Moisture Content
(%)
Initial Concentration
in Concrete (g)
Initial Concentration
in Concrete (g/cm3)
Soil Interface Concentration
(g/cm3)
Initial C/Co Maximum C/Co
Total Concentration in Soil Half-Cell (g/cm3)
No Yes I 3.08 x 10⁷ 4.2 7.02 x 10⁻² 1.21 x 10⁻³ 2.94 x 10⁻⁵ 3.61 x 10⁻² 3.61 x 10⁻² 5.31 x 10⁻⁶
Yes Yes I 3.08 x 10⁷ 4.2 6.65 x 10⁻² 1.14 x 10⁻³ 5.13 x 10⁻⁵ 3.54 x 10⁻² 3.54 x 10⁻² 6.39 x 10⁻⁶
No No I 3.08 x 10⁷ 4.2 7.06 x 10⁻² 1.17 x 10⁻³ 4.89 x 10⁻⁶ 5.93 x 10⁻³ 5.93 x 10⁻³ 9.04 x 10⁻⁷
Yes No I 3.08 x 10⁷ 4.2 6.80 x 10⁻² 1.15 x 10⁻³ 1.06 x 10⁻⁶ 3.80 x 10⁻³ 3.80 x 10⁻³ 4.49 x 10⁻⁷
No Yes I 3.43 x 10⁷ 6.9 6.54 x 10⁻² 1.18 x 10⁻³ 2.35 x 10⁻⁵ 1.75 x 10⁻² 9.93 x 10⁻³ 6.13 x 10⁻⁶
Yes Yes I 3.43 x 10⁷ 6.9 6.79 x 10⁻² 1.17 x 10⁻³ 6.64 x 10⁻⁵ 9.23 x 10⁻³ 3.12 x 10⁻² 2.07 x 10⁻⁵
No No I 3.43 x 10⁷ 6.9 7.04 x 10⁻² 1.18 x 10⁻³ 1.45 x 10⁻⁶ 2.68 x 10⁻⁴ 5.08 x 10⁻⁴ 4.47 x 10⁻⁷
Yes No I 3.43 x 10⁷ 6.9 6.68 x 10⁻² 1.15 x 10⁻³ 4.75 x 10⁻⁷ 7.45 x 10⁻⁵ 1.78 x 10⁻⁴ 1.81 x 10⁻⁷
No Yes Re 3.08 x 10⁷ 4.2 1.03 x 10⁻¹ 1.77 x 10⁻³ 4.61 x 10⁻⁵ 1.58 x 10⁻² 1.58 x 10⁻² 5.31 x 10⁻⁶
Yes Yes Re 3.08 x 10⁷ 4.2 9.76 x 10⁻² 1.68 x 10⁻³ 7.61 x 10⁻⁵ 2.59 x 10⁻² 2.59 x 10⁻² 8.02 x 10⁻⁶
No No Re 3.08 x 10⁷ 4.2 1.04 x 10⁻¹ 1.72 x 10⁻³ 6.18 x 10⁻⁶ 3.87 x 10⁻³ 3.87 x 10⁻³ 8.88 x 10⁻⁷
Yes No Re 3.08 x 10⁷ 4.2 9.97 x 10⁻² 1.19 x 10⁻³ 1.80 x 10⁻⁶ 3.37 x 10⁻³ 3.37 x 10⁻³ 5.86 x 10⁻⁷
No Yes Re 3.43 x 10⁷ 6.9 9.59 x 10⁻² 1.73 x 10⁻³ 2.11 x 10⁻⁵ 5.08 x 10⁻³ 7.35 x 10⁻³ 3.79 x 10⁻⁶
Yes Yes Re 3.43 x 10⁷ 6.9 9.96 x 10⁻² 1.71 x 10⁻³ 6.01 x 10⁻⁵ 5.69 x 10⁻³ 1.65 x 10⁻² 1.56 x 10⁻⁵
No No Re 3.43 x 10⁷ 6.9 1.03 x 10⁻¹ 1.73 x 10⁻³ 5.11 x 10⁻⁶ 6.45 x 10⁻⁴ 1.25 x 10⁻³ 1.62 x 10⁻⁶
Yes No Re 3.43 x 10⁷ 6.9 1.01 x 10⁻¹ 1.69 x 10⁻³ 1.95 x 10⁻⁶ 2.08 x 10⁻⁴ 3.80 x 10⁻⁴ 8.15 x 10⁻⁷
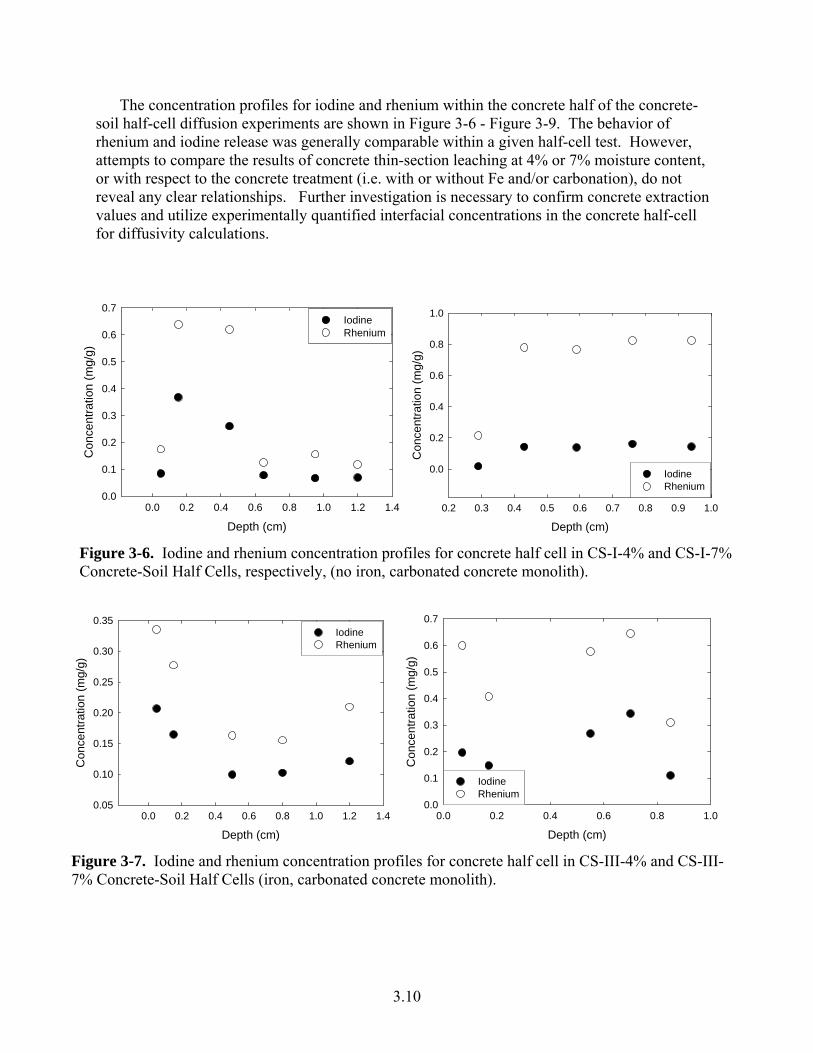
The concentration profiles for iodine and rhenium within the concrete half of the concrete-soil half-cell diffusion experiments are shown in Figure 3-6 - Figure 3-9. The behavior of rhenium and iodine release was generally comparable within a given half-cell test. However, attempts to compare the results of concrete thin-section leaching at 4% or 7% moisture content, or with respect to the concrete treatment (i.e. with or without Fe and/or carbonation), do not reveal any clear relationships. Further investigation is necessary to confirm concrete extraction values and utilize experimentally quantified interfacial concentrations in the concrete half-cell for diffusivity calculations.
Depth (cm)0.0 0.2 0.4 0.6 0.8 1.0 1.2 1.4
Con
cent
ratio
n (m
g/g)
0.0
0.1
0.2
0.3
0.4
0.5
0.6
0.7IodineRhenium
Depth (cm)0.2 0.3 0.4 0.5 0.6 0.7 0.8 0.9 1.0
Con
cent
ratio
n (m
g/g)
0.0
0.2
0.4
0.6
0.8
1.0
IodineRhenium
Figure 3-6. Iodine and rhenium concentration profiles for concrete half cell in CS-I-4% and CS-I-7% Concrete-Soil Half Cells, respectively, (no iron, carbonated concrete monolith).
Depth (cm)0.0 0.2 0.4 0.6 0.8 1.0 1.2 1.4
Con
cent
ratio
n (m
g/g)
0.05
0.10
0.15
0.20
0.25
0.30
0.35IodineRhenium
Depth (cm)0.0 0.2 0.4 0.6 0.8 1.0
Con
cent
ratio
n (m
g/g)
0.0
0.1
0.2
0.3
0.4
0.5
0.6
0.7
IodineRhenium
Figure 3-7. Iodine and rhenium concentration profiles for concrete half cell in CS-III-4% and CS-III-7% Concrete-Soil Half Cells (iron, carbonated concrete monolith).
3.10
Depth (cm)0.0 0.2 0.4 0.6 0.8 1.0 1.2 1.4
Con
cent
ratio
n (m
g/g)
0.0
0.1
0.2
0.3
0.4
0.5
0.6
0.7IodineRhenium
Depth (cm)0.0 0.2 0.4 0.6 0.8 1.0
Con
cent
ratio
n (m
g/g)
0.0
0.1
0.2
0.3
0.4
0.5
0.6
0.7
IodineRhenium
Figure 3-8. Iodine and rhenium concentration profiles for concrete half cell in CS-II-4% and CS-II-7% Concrete-Soil Half Cells (no iron, not carbonated concrete monolith).
Depth (cm)0.0 0.2 0.4 0.6 0.8 1.0 1.2 1.4
Con
cent
ratio
n (m
g/g)
0.0
0.1
0.2
0.3
0.4
0.5
0.6
0.7
0.8IodineRhenium
Depth (cm)0.0 0.2 0.4 0.6 0.8 1.0 1.2
Con
cent
ratio
n (m
g/g)
0.0
0.2
0.4
0.6
0.8IodineRhenium
Figure 3-9. Iodine and rhenium concentration profiles for concrete half cell in CS-IV-4% and CS-IV-7% Concrete-Soil Half Cells (iron, not carbonated concrete monolith).
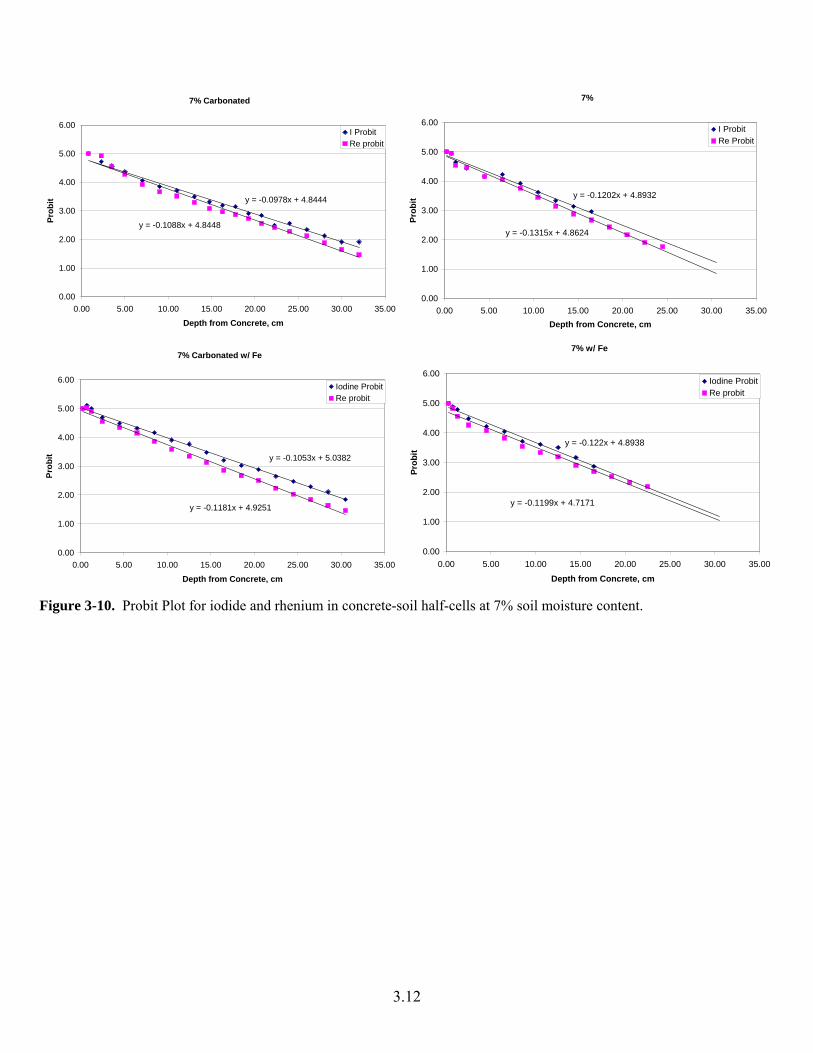
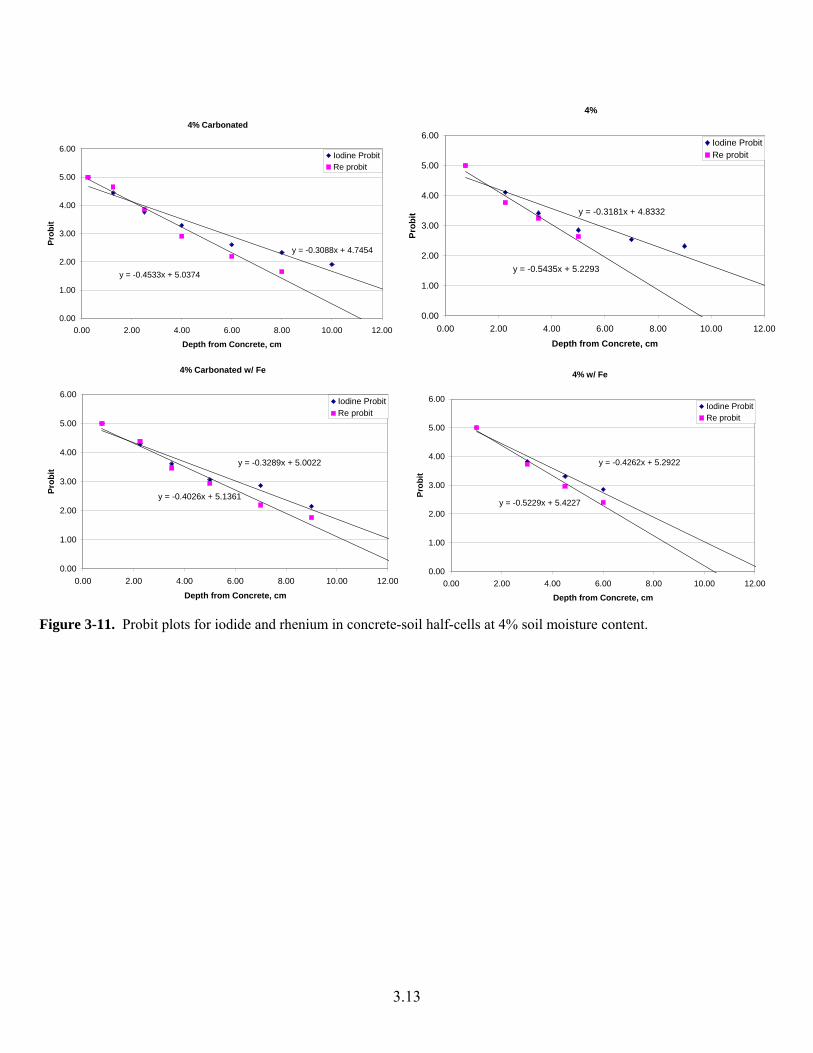
3.4 Diffusivity Results and Discussion The probit plots for iodide and rhenium are shown in Figure 3-10 and Figure 3-11. The data is
well fit by the probit analyses. The diffusivity coefficients in concrete calculated from the probit plots are listed in Table 3-4.
3.11
7%
y = -0.1315x + 4.8624
y = -0.1202x + 4.8932
0.00
1.00
2.00
3.00
4.00
5.00
6.00
0.00 5.00 10.00 15.00 20.00 25.00 30.00 35.00Depth from Concrete, cm
Prob
it
I ProbitRe Probit
7% Carbonated
y = -0.1088x + 4.8448
y = -0.0978x + 4.8444
0.00
1.00
2.00
3.00
4.00
5.00
6.00
0.00 5.00 10.00 15.00 20.00 25.00 30.00 35.00
Depth from Concrete, cm
Prob
it
I ProbitRe probit
7% w/ Fe
y = -0.1199x + 4.7171
y = -0.122x + 4.8938
0.00
1.00
2.00
3.00
4.00
5.00
6.00
0.00 5.00 10.00 15.00 20.00 25.00 30.00 35.00
Depth from Concrete, cm
Prob
it
Iodine ProbitRe probit
7% Carbonated w/ Fe
y = -0.1181x + 4.9251
y = -0.1053x + 5.0382
0.00
1.00
2.00
3.00
4.00
5.00
6.00
0.00 5.00 10.00 15.00 20.00 25.00 30.00 35.00
Depth from Concrete, cm
Prob
it
Iodine ProbitRe probit
Figure 3-10. Probit Plot for iodide and rhenium in concrete-soil half-cells at 7% soil moisture content.
3.12
4% Carbonated
y = -0.4533x + 5.0374
y = -0.3088x + 4.7454
0.00
1.00
2.00
3.00
4.00
5.00
6.00
0.00 2.00 4.00 6.00 8.00 10.00 12.00
Depth from Concrete, cm
Prob
it
Iodine ProbitRe probit
4%
y = -0.5435x + 5.2293
y = -0.3181x + 4.8332
0.00
1.00
2.00
3.00
4.00
5.00
6.00
0.00 2.00 4.00 6.00 8.00 10.00 12.00
Depth from Concrete, cm
Prob
it
Iodine ProbitRe probit
4% Carbonated w/ Fe
y = -0.3289x + 5.0022
y = -0.4026x + 5.1361
0.00
1.00
2.00
3.00
4.00
5.00
6.00
0.00 2.00 4.00 6.00 8.00 10.00 12.00
Depth from Concrete, cm
Prob
it
Iodine ProbitRe probit
4% w/ Fe
y = -0.4262x + 5.2922
y = -0.5229x + 5.4227
0.00
1.00
2.00
3.00
4.00
5.00
6.00
0.00 2.00 4.00 6.00 8.00 10.00 12.00
Depth from Concrete, cm
Prob
itIodine ProbitRe probit
Figure 3-11. Probit plots for iodide and rhenium in concrete-soil half-cells at 4% soil moisture content.
3.13
Diffusivity values for iodide in soil ranged from 8.66 x 10⁻⁸ -7 to 1.65 x 10 cm2/s, and from 9.70 x 10⁻⁸ -8 to 5.75 x 10 cm2/s for rhenium at 4% moisture content. At 7% moisture content diffusivity values for iodide ranged from 9.793 x 10⁻⁷ -6to 1.52 x 10 cm2 -7/s, and from 8.43 x 10 to 1.23 x 10⁻⁶ cm2/s for rhenium. This indicates that unsaturated conditions a 3% increase in moisture content affords a one to two order of magnitude increase in diffusivity. The concrete diffusivity of iodide and rhenium ranged from 7.95 x 10⁻¹⁴ to 1.20 x 10⁻¹⁰ cm2/s for iodide and from 7.02 x 10⁻¹⁴ to 2.72 x 10⁻¹⁰ cm2/s at ~4% soil moisture content. At ~7% soil moisture content the concrete diffusivity values for iodide ranged from 1.73 x 10⁻¹² -9 to 5.76 x 10 cm2/s and from 8.40 x 10⁻¹² to 2.16 x 10⁻¹⁰ cm2/s for rhenium.
-12Diffusion in concrete monoliths subjected to carbonation ranged from 3.23 x 10 cm2/s to
1.20 x 10⁻¹⁰ cm2/s for iodine and from 2.72 x 10⁻¹⁰ -11 to 6.43 x 10 cm2/s for rhenium in CS-III-4% and CS-I-4% (with and without iron), respectively. At ~7% soil moisture content, diffusivity values ranged from 5.76 x10⁻⁹ cm2/s to 7.31 x 10⁻¹⁰ cm2/s for iodine and from 1.62 x 10⁻⁹ cm2/s to 2.16 x 10⁻¹⁰ cm2/s for rhenium in CS-III-7% and CS-I-7% (with and without iron), respectively.
Concrete diffusivity values in the concrete monoliths not subjected to carbonation ranged
from 7.95 x 10⁻¹⁴ cm2 -12/s to 2.99 x 10 cm2/s for iodine and from 7.02 x 10⁻¹⁴ cm2/s to 7.56 x 10⁻¹³ cm2/s for rhenium in CS-IV-4% and CS-II-4% (with and without iron), respectively. At ~7% soil moisture content, diffusivity values ranged from 2.14 x 10⁻⁹ cm2/s to 1.73 x 10⁻¹² cm2/s for iodine and from 1.53 x10⁻¹² cm2 -12/s to 8.40 x 10 cm2/s for rhenium in CS-IV-7% and CS-II-7% (with and without iron), respectively. These ranges of diffusivity values indicate:
1. In the absence of iron, carbonation of the concrete monolith increases the diffusion of iodine and rhenium by two orders of magnitude, irrespective of water content.
2. In the presence of iron, the diffusion of iodine increased by 2.7x in concrete subject to
carbonation at 7% soil moisture content. At 4% soil moisture content, the diffusion of iodide was approximately two orders of magnitude greater in concrete containing iron that was carbonated relative to iron containing concrete not subject to carbonation.
3. Carbonation of concrete monoliths results in an increase in microcracking relative to
non-carbonated monoliths. In addition, microcracks in carbonated monoliths tend to be longer and more continuous than those observed in non-carbonated monoliths. The presence and nature of microcracking in carbonated monoliths provides “pathways” for migration and diffusion of radionuclides within concrete. This is further discussed in the following section.
4. The diffusion of rhenium was three orders of magnitude greater in carbonated concrete
monoliths which contained iron relative to those not subject to carbonation, irrespective of water content.
5. An approximate 3% increase in moisture content results in a general decrease in
diffusivity.
3.14
3.15
Mattigod et al., 2001 previously quantified the diffusion of iodine and technetium from
concrete monoliths containing iron at 4% and 7% moisture contents, sampling at 64 and 169 days. At 4% moisture content the diffusion of iodine quantified here, after 357 days, was nearly an order of magnitude less in the soil half-cell; whereas, the diffusion of iodide in concrete was only 4x less. The diffusion of rhenium is approximately an order of magnitude lower than that quantified previously quantified for technetium (Mattigod et al., 2001). This is likely due to molecular size limitation of the perrhenate relative to the pertechnetate ion. Similarly, the diffusivity of rhenium is an order of magnitude less at soil moisture content of 7% than that previously quantified for technetium. Although, diffusivity values quantified here were on the low end of the diffusion range quantified previously at 4% moisture content, the diffusion of both iodine and rhenium compared well with previous results for the diffusion of iodine and technetium under similar conditions. Results presented here confirm previous findings from (Mattigod et al., 2001) which indicated the diffusion increased with increasing water content. However, results presented here conflict with previous findings that the 1) inclusion of iron did not significantly influence the diffusion of iodine or technetium and/or rhenium and 2) the diffusion of iodine was less than technetium and/or rhenium.
3.16
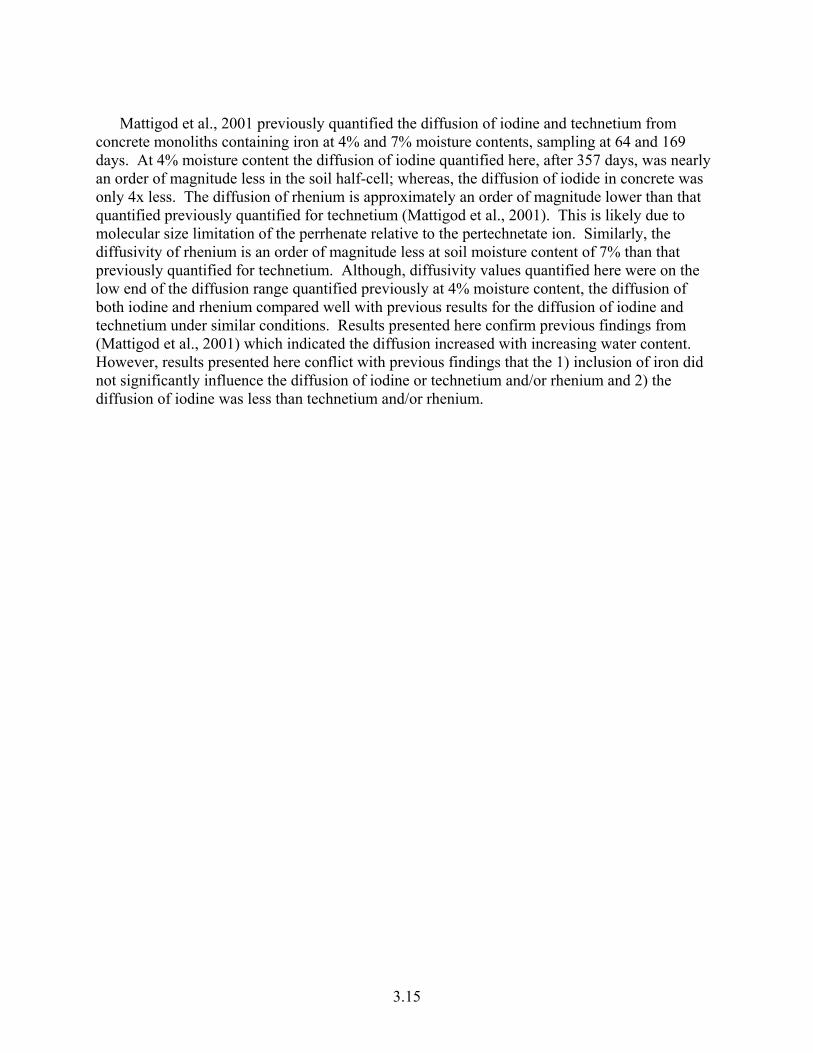
Table 3-4. Calculated Concrete Diffusion Parameters for Iodine and Rhenium from Concrete-Soil Half-Cell Experiments
Concrete Treatment
Fe CO2
Spike Sampling Time (s)
Soil Moisture Content
(%)
Soil Diffusivity
(cm2/s)
Initial Conc. Concrete (g/cm3)
Soil Interface Concentration
(g/cm3)
Concrete Diffusivity
(cm2/s) Source
No Yes I 3.08 x 10⁷ 4.2 1.65 x 10⁻⁷ 1.21 x 10⁻³ 2.94 x 10⁻⁵ 1.20 x 10⁻¹⁰ This Study Yes Yes I 3.08 x 10⁷ 4.2 1.45 x 10⁻⁷ 1.14 x 10⁻³ 5.13 x 10⁻⁵ 3.23 x 10⁻¹² This Study No No I 3.08 x 10⁷ 4.2 1.55 x 10⁻⁷ 1.17 x 10⁻³ 4.89 x 10⁻⁶ 2.99 x 10⁻¹² This Study Yes No I 3.08 x 10⁷ 4.2 8.66 x 10⁻⁸ 1.15 x 10⁻³ 1.06 x 10⁻⁶ 7.95 x 10⁻¹⁴ This Study Yes No I 1.46 x 10⁷ ~4.0 2.64 x 10⁻⁷ 1.01x 10⁻³ 1.74 x 10⁻⁷ 2.07x 10⁻¹⁴ Mattigod et al. (2001)
No Yes I 3.43 x 10⁷ 6.9 1.52 x 10⁻⁶ 1.18 x 10⁻³ 2.35 x 10⁻⁵ 7.31 x 10⁻⁹ This Study Yes Yes I 3.43 x 10⁷ 6.9 1.31 x 10⁻⁶ 1.17 x 10⁻³ 6.64 x 10⁻⁵ 5.76 x 10⁻⁹ This Study No No I 3.43 x 10⁷ 6.9 1.01 x 10⁻⁶ 1.18 x 10⁻³ 1.45 x 10⁻⁶ 1.73 x 10⁻¹² This Study Yes No I 3.43 x 10⁷ 6.9 9.79 x 10⁻⁷ 1.15 x 10⁻³ 4.75 x 10⁻⁷ 2.14 x 10⁻⁹ This Study Yes No I 1.46 x 10⁷ ~7.0 -- 1.01 x 10⁻³ 8.00 x 10⁻⁷ 1.31 x 10⁻¹² Mattigod et al (2001)
No Yes Re 3.08 x 10⁷ 4.2 7.65 x 10⁻⁸ 1.77 x 10⁻³ 4.61 x 10⁻⁵ 6.43 x 10⁻¹¹ This Study Yes Yes Re 3.08 x 10⁷ 4.2 9.70 x 10⁻⁸ 1.68 x 10⁻³ 7.61 x 10⁻⁵ 2.72 x 10⁻¹⁰ This Study No No Re 3.08 x 10⁷ 4.2 5.32 x 10⁻⁸ 1.72 x 10⁻³ 6.18 x 10⁻⁶ 7.56 x 10⁻¹³ This Study Yes No Re 3.08 x 10⁷ 4.2 5.75 x 10⁻⁸ 1.19 x 10⁻³ 1.80 x 10⁻⁶ 7.02 x 10⁻¹⁴ This Study Yes No Tc 5.53 x 10⁶ ~4.0 9.49 x 10⁻⁷ 2.99 x 10⁻⁶ 7.27 x 10⁻⁹ 6.22 x 10⁻¹² Mattigod et al (2001) Yes No Tc 1.46 x 10⁷ ~4.0 4.70 x 10⁻⁷ 2.96 x 10⁻⁶ 1.80 x 10⁻⁹ 4.54x 10⁻¹³ Mattigod et al (2001)
No Yes Re 3.43 x 10⁷ 6.9 1.23 x 10⁻⁶ 1.73 x 10⁻³ 2.11 x 10⁻⁵ 2.16 x 10⁻¹⁰ This Study Yes Yes Re 3.43 x 10⁷ 6.9 1.05 x 10⁻⁶ 1.71 x 10⁻³ 6.01 x 10⁻⁵ 1.62 x 10-09 This Study No No Re 3.43 x 10⁷ 6.9 8.43 x 10⁻⁷ 1.73 x 10⁻³ 5.11 x 10⁻⁶ 8.40 x 10⁻¹² This Study Yes No Re 3.43 x 10⁷ 6.9 1.01 x 10⁻⁶ 1.69 x 10⁻³ 1.95 x 10⁻⁶ 1.53 x 10⁻¹² This Study Yes No Tc 5.53 x 10⁶ ~7.0 1.04 x 10⁻⁶ 3.01 x 10⁻⁶ 1.32 x 10⁻⁸ 4.24 x 10⁻¹¹ Mattigod et al (2001) Yes No Tc 1.46 x 10⁷ ~7.0 1.04 x 10⁻⁶ 2.96 x 10⁻⁶ 6.63 x 10⁻⁹ 8.02 x 10⁻¹¹ Mattigod et al (2001)
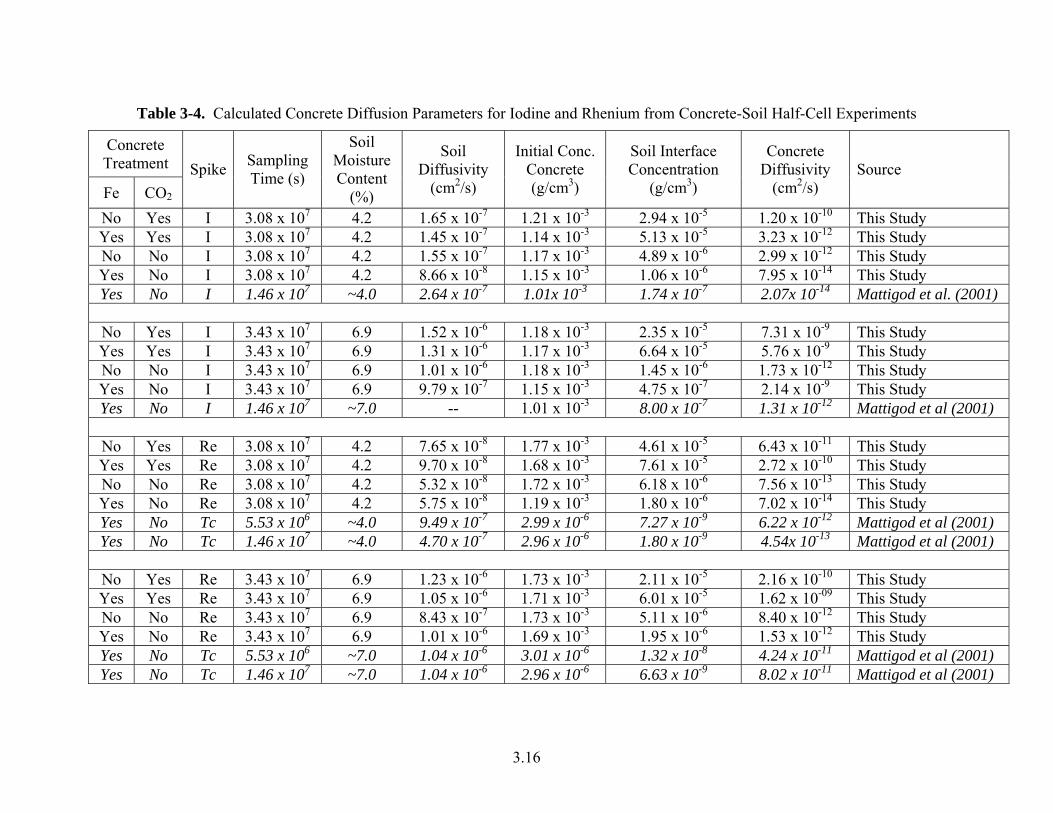
3.5 Carbonation and Micro-Cracking Four concrete monoliths spiked with iodine and rhenium, from the concrete-soil half cells, were subjected to petrographic studies in effort to evaluate the extent of carbonation, the degree of microcracking induced by carbonation, and discern correlations between the diffusion of iodine and rhenium from the monoliths (
Figure 3-12. Schematic illustrating concrete treatment and surface designations for petrographic analysis.
Table 3-5). Prior to analysis the cylindrical cores (~4 cm diameter and ~4 cm long) were cut length-wise; half of each core was subjected to petrographic analysis while the other half was archived for future analyses. The longitudinal cross-section resulting from slicing the core in half is designated the “lapped” surface; the monolithic surface in contact with the sediment during half-cell experiments is the “cast” surface; a cross-section in the monolith parallel to the lapped surface is designated as a “fracture” surface (Figure 3-12).
Petrographic studies were conducted in general accordance with the relevant portions of
ASTM C 856, Standard Practice for Petrographic Examination of Hardened Concrete. Phenolphthalein was used as an indicator to establish the extent of carbonation within the concrete monolith. A 2% phenolphthalein:98% ethyl alcohol solution was applied directly to a freshly broken, fracture surface and immediately examined via petrographic microscopy. Phenolphthalein indicator affords a maximum color, deep reddish-purple, at pH ≥ 9.8. Below pH = 9.8 the color may be varying shades of red and/or pink, and colorless at pH 8. The depth of carbonation was measured from the cast surface to where the indicator colored the monolith pink. In other words, the measured depth of carbonation corresponded to the location where the paste remained colorless. The results are summarized in Table 3-6.
Scanning electron microscopy studies were performed also performed to identify
microcracks with widths less than 2 to 3 micrometers. A small block measuring approximately 20 mm on each side was cut from central portion of each of the mortar samples. Each block was placed in a plastic cup and impregnated with low-viscosity epoxy resin. After the resin hardened, the embedded mortars were polished using successively finer alumina grits down to a final stage of 0.05 micron. The polished surfaces were carbon coated and then examined in backscattered electron mode using an ASPEX Personal SEM. The relative extent of microcracking can be judged from a comparison of the images. However, it is necessary to note that microcracking can result from any, or a combination, of the preparation steps, which include drying in a low-temperature oven, carbon coating under a vacuum, and SEM studies conducted in a vacuum of about 6 x 10
-6 torr.
3.17
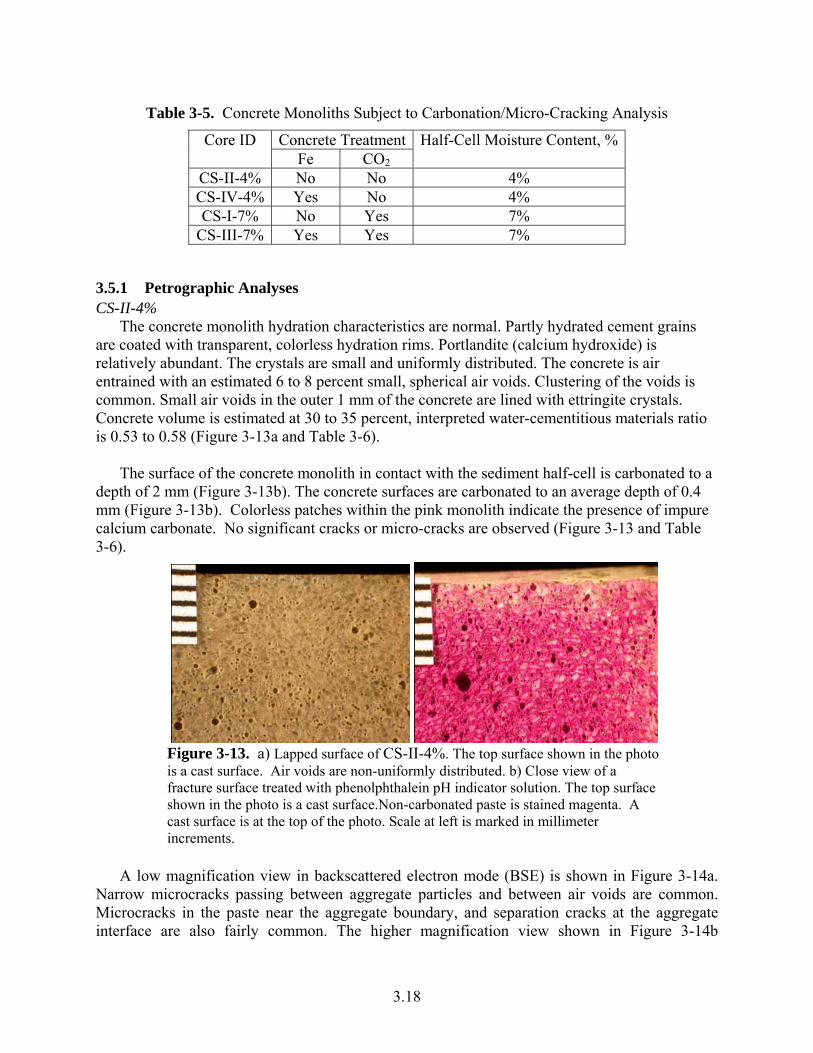
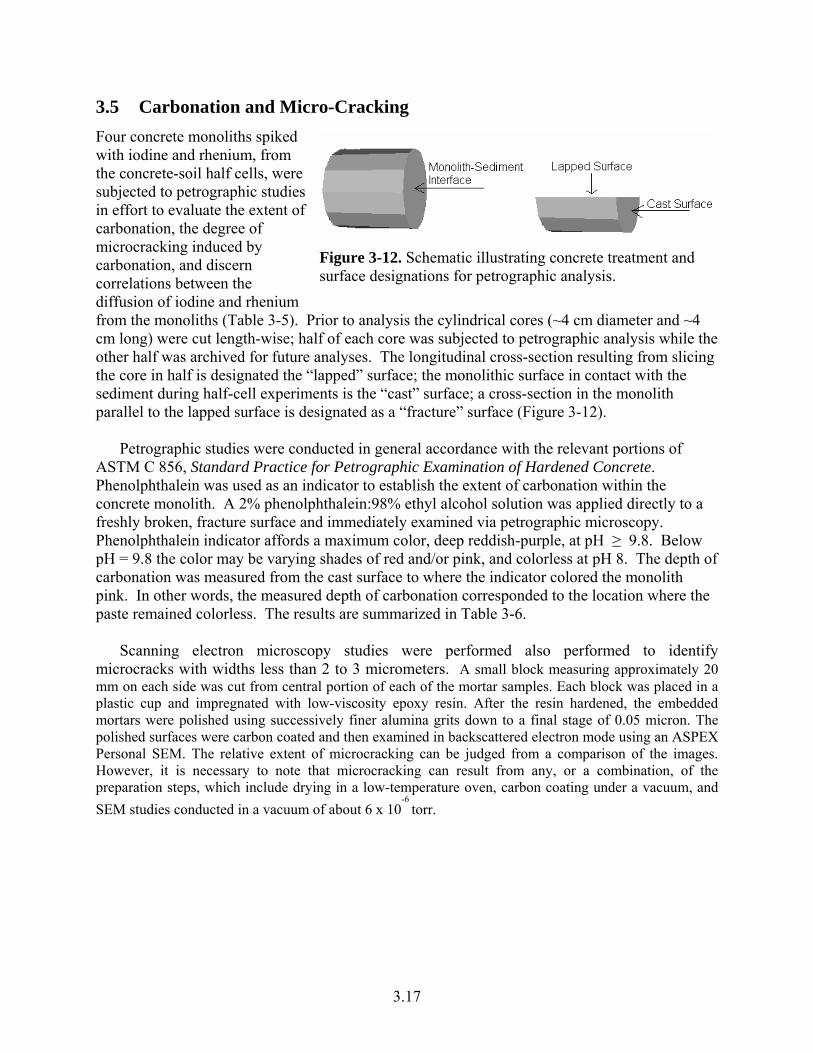
Table 3-5. Concrete Monoliths Subject to Carbonation/Micro-Cracking Analysis
Concrete TreatmentCore ID Half-Cell Moisture Content, % Fe CO2
CS-II-4% No No 4% CS-IV-4% Yes No 4% CS-I-7% No Yes 7%
CS-III-7% Yes Yes 7% 3.5.1 Petrographic Analyses CS-II-4%
The concrete monolith hydration characteristics are normal. Partly hydrated cement grains are coated with transparent, colorless hydration rims. Portlandite (calcium hydroxide) is relatively abundant. The crystals are small and uniformly distributed. The concrete is air entrained with an estimated 6 to 8 percent small, spherical air voids. Clustering of the voids is common. Small air voids in the outer 1 mm of the concrete are lined with ettringite crystals. Concrete volume is estimated at 30 to 35 percent, interpreted water-cementitious materials ratio is 0.53 to 0.58 (Figure 3-13a and Table 3-6).
The surface of the concrete monolith in contact with the sediment half-cell is carbonated to a depth of 2 mm (Figure 3-13b). The concrete surfaces are carbonated to an average depth of 0.4 mm (Figure 3-13b). Colorless patches within the pink monolith indicate the presence of impure calcium carbonate. No significant cracks or micro-cracks are observed (Figure 3-13 and Table 3-6).
A low magnification view in backscattered electron mode (BSE) is shown in Figure 3-14a.
Narrow microcracks passing between aggregate particles and between air voids are common. Microcracks in the paste near the aggregate boundary, and separation cracks at the aggregate interface are also fairly common. The higher magnification view shown in Figure 3-14b
Figure 3-13. a) Lapped surface of CS-II-4%. The top surface shown in the photo is a cast surface. Air voids are non-uniformly distributed. b) Close view of a fracture surface treated with phenolphthalein pH indicator solution. The top surface shown in the photo is a cast surface.Non-carbonated paste is stained magenta. A cast surface is at the top of the photo. Scale at left is marked in millimeter increments.
3.18
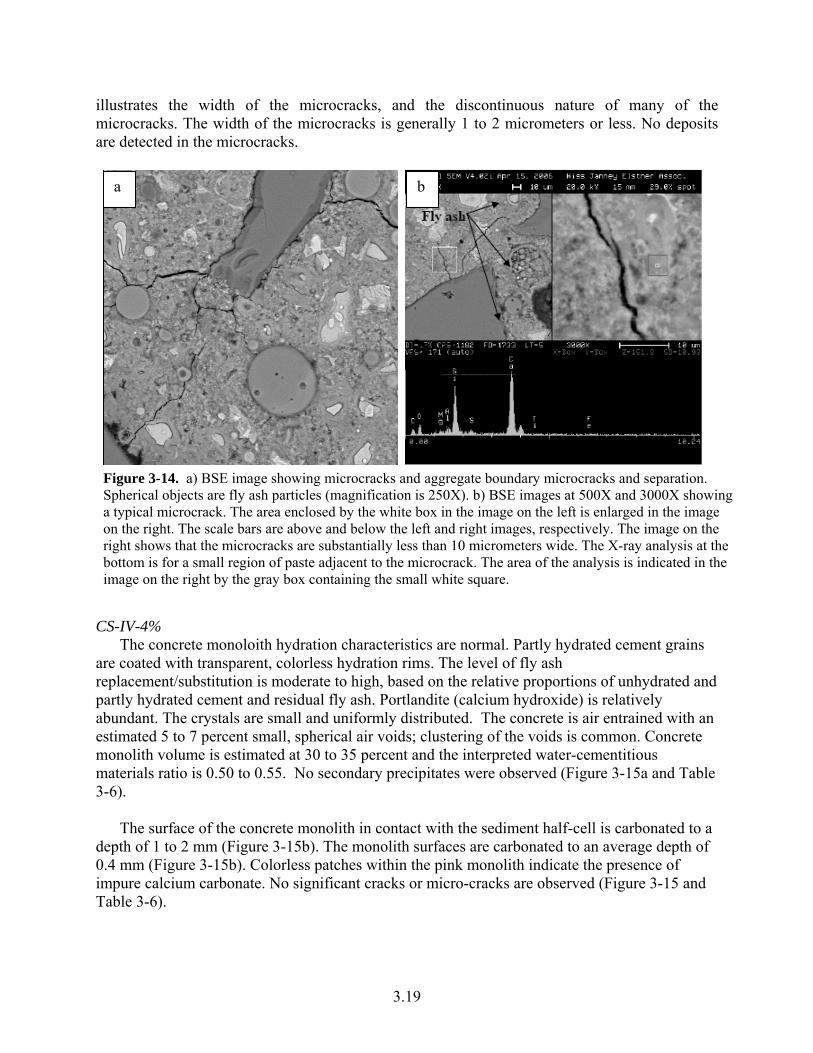
illustrates the width of the microcracks, and the discontinuous nature of many of the microcracks. The width of the microcracks is generally 1 to 2 micrometers or less. No deposits are detected in the microcracks.
CS-IV-4%
The concrete monoloith hydration characteristics are normal. Partly hydrated cement grains are coated with transparent, colorless hydration rims. The level of fly ash replacement/substitution is moderate to high, based on the relative proportions of unhydrated and partly hydrated cement and residual fly ash. Portlandite (calcium hydroxide) is relatively abundant. The crystals are small and uniformly distributed. The concrete is air entrained with an estimated 5 to 7 percent small, spherical air voids; clustering of the voids is common. Concrete monolith volume is estimated at 30 to 35 percent and the interpreted water-cementitious materials ratio is 0.50 to 0.55. No secondary precipitates were observed (Figure 3-15a and Table 3-6).
The surface of the concrete monolith in contact with the sediment half-cell is carbonated to a
depth of 1 to 2 mm (Figure 3-15b). The monolith surfaces are carbonated to an average depth of 0.4 mm (Figure 3-15b). Colorless patches within the pink monolith indicate the presence of impure calcium carbonate. No significant cracks or micro-cracks are observed (Figure 3-15 and Table 3-6).
a b
Figure 3-14. a) BSE image showing microcracks and aggregate boundary microcracks and separation. Spherical objects are fly ash particles (magnification is 250X). b) BSE images at 500X and 3000X showing a typical microcrack. The area enclosed by the white box in the image on the left is enlarged in the image on the right. The scale bars are above and below the left and right images, respectively. The image on the right shows that the microcracks are substantially less than 10 micrometers wide. The X-ray analysis at the bottom is for a small region of paste adjacent to the microcrack. The area of the analysis is indicated in the image on the right by the gray box containing the small white square.
3.19
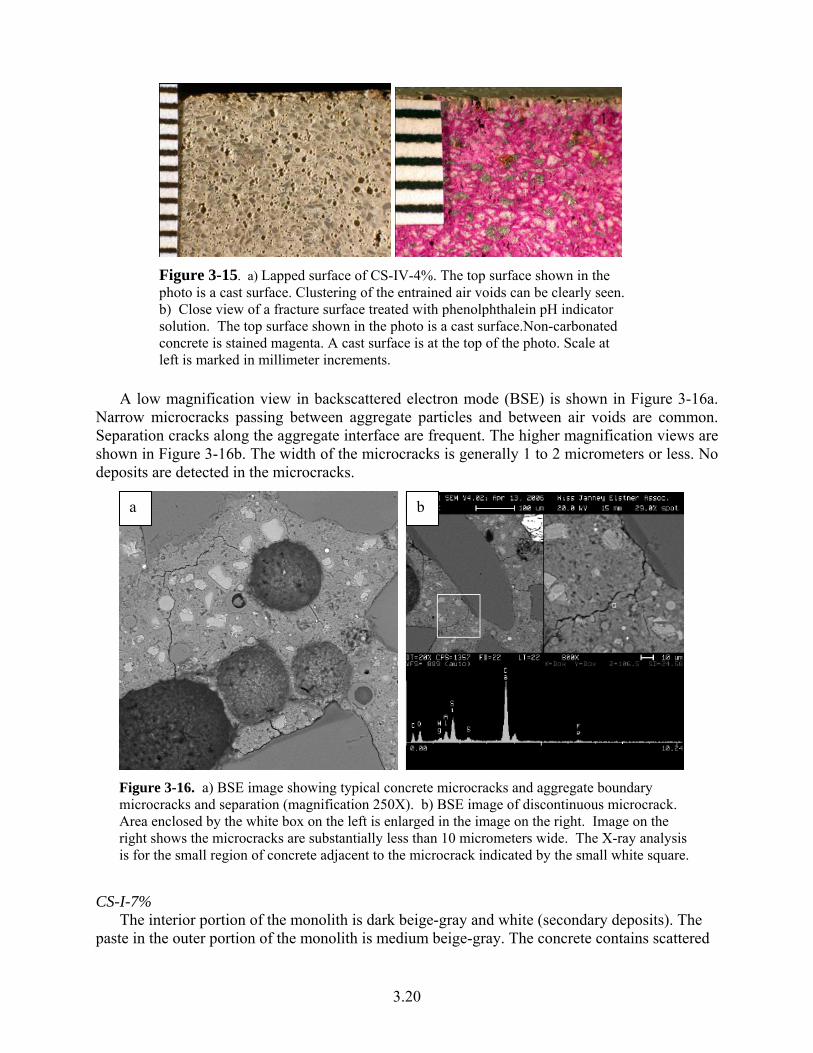
Figure 3-15. a) Lapped surface of CS-IV-4%. The top surface shown in the photo is a cast surface. Clustering of the entrained air voids can be clearly seen. b) Close view of a fracture surface treated with phenolphthalein pH indicator solution. The top surface shown in the photo is a cast surface.Non-carbonated concrete is stained magenta. A cast surface is at the top of the photo. Scale at left is marked in millimeter increments.
A low magnification view in backscattered electron mode (BSE) is shown in Figure 3-16a.
Narrow microcracks passing between aggregate particles and between air voids are common. Separation cracks along the aggregate interface are frequent. The higher magnification views are shown in Figure 3-16b. The width of the microcracks is generally 1 to 2 micrometers or less. No deposits are detected in the microcracks.
CS-I-7%
The interior portion of the monolith is dark beige-gray and white (secondary deposits). The paste in the outer portion of the monolith is medium beige-gray. The concrete contains scattered
a b
Figure 3-16. a) BSE image showing typical concrete microcracks and aggregate boundary microcracks and separation (magnification 250X). b) BSE image of discontinuous microcrack. Area enclosed by the white box on the left is enlarged in the image on the right. Image on the right shows the microcracks are substantially less than 10 micrometers wide. The X-ray analysis is for the small region of concrete adjacent to the microcrack indicated by the small white square.
3.20
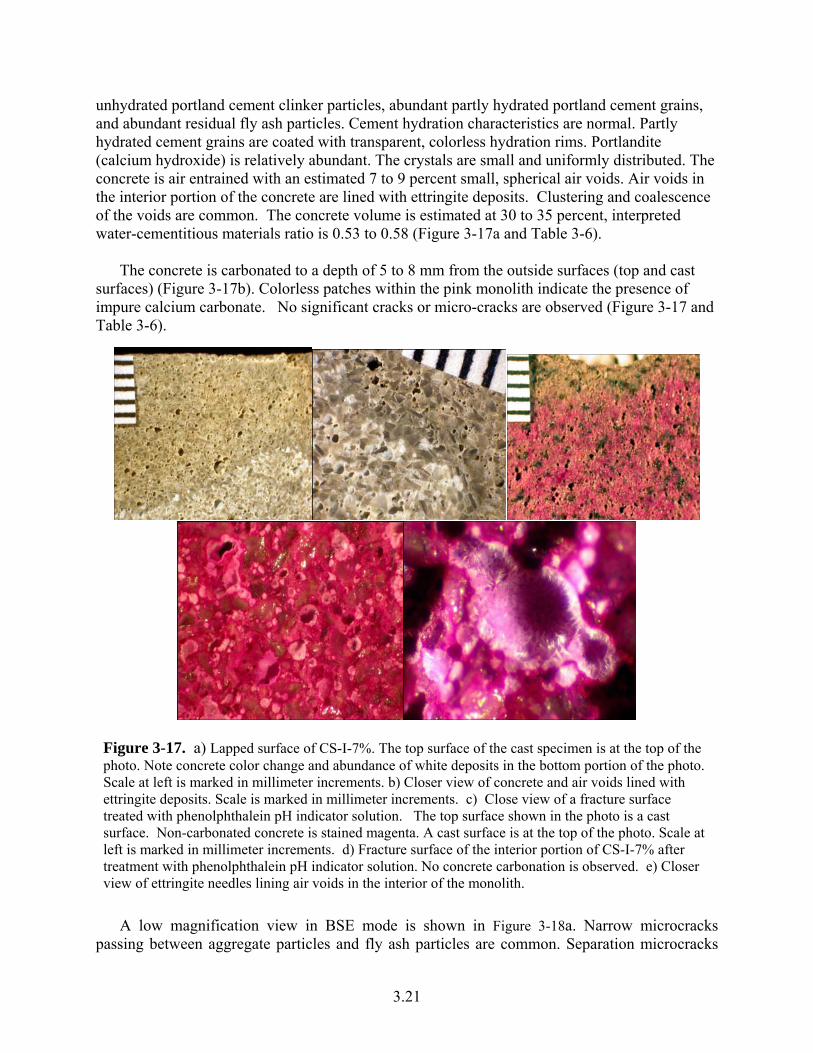
unhydrated portland cement clinker particles, abundant partly hydrated portland cement grains, and abundant residual fly ash particles. Cement hydration characteristics are normal. Partly hydrated cement grains are coated with transparent, colorless hydration rims. Portlandite (calcium hydroxide) is relatively abundant. The crystals are small and uniformly distributed. The concrete is air entrained with an estimated 7 to 9 percent small, spherical air voids. Air voids in the interior portion of the concrete are lined with ettringite deposits. Clustering and coalescence of the voids are common. The concrete volume is estimated at 30 to 35 percent, interpreted water-cementitious materials ratio is 0.53 to 0.58 (Figure 3-17a and Table 3-6).
The concrete is carbonated to a depth of 5 to 8 mm from the outside surfaces (top and cast
surfaces) (Figure 3-17b). Colorless patches within the pink monolith indicate the presence of impure calcium carbonate. No significant cracks or micro-cracks are observed (Figure 3-17 and Table 3-6).
Figure 3-17. a) Lapped surface of CS-I-7%. The top surface of the cast specimen is at the top of the photo. Note concrete color change and abundance of white deposits in the bottom portion of the photo. Scale at left is marked in millimeter increments. b) Closer view of concrete and air voids lined with ettringite deposits. Scale is marked in millimeter increments. c) Close view of a fracture surface treated with phenolphthalein pH indicator solution. The top surface shown in the photo is a cast surface. Non-carbonated concrete is stained magenta. A cast surface is at the top of the photo. Scale at left is marked in millimeter increments. d) Fracture surface of the interior portion of CS-I-7% after treatment with phenolphthalein pH indicator solution. No concrete carbonation is observed. e) Closer view of ettringite needles lining air voids in the interior of the monolith.
A low magnification view in BSE mode is shown in Figure 3-18a. Narrow microcracks
passing between aggregate particles and fly ash particles are common. Separation microcracks
3.21
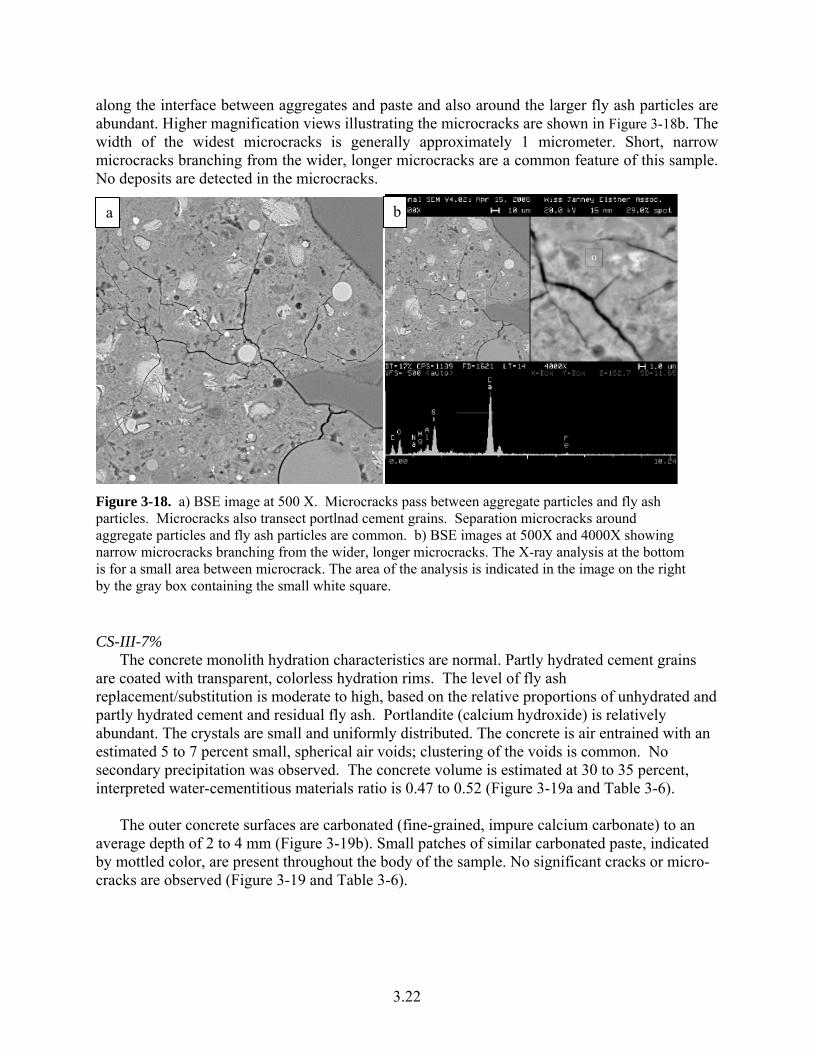
along the interface between aggregates and paste and also around the larger fly ash particles are abundant. Higher magnification views illustrating the microcracks are shown in Figure 3-18b. The width of the widest microcracks is generally approximately 1 micrometer. Short, narrow microcracks branching from the wider, longer microcracks are a common feature of this sample. No deposits are detected in the microcracks.
ba
Figure 3-18. a) BSE image at 500 X. Microcracks pass between aggregate particles and fly ash particles. Microcracks also transect portlnad cement grains. Separation microcracks around aggregate particles and fly ash particles are common. b) BSE images at 500X and 4000X showing narrow microcracks branching from the wider, longer microcracks. The X-ray analysis at the bottom is for a small area between microcrack. The area of the analysis is indicated in the image on the right by the gray box containing the small white square.
CS-III-7%
The concrete monolith hydration characteristics are normal. Partly hydrated cement grains are coated with transparent, colorless hydration rims. The level of fly ash replacement/substitution is moderate to high, based on the relative proportions of unhydrated and partly hydrated cement and residual fly ash. Portlandite (calcium hydroxide) is relatively abundant. The crystals are small and uniformly distributed. The concrete is air entrained with an estimated 5 to 7 percent small, spherical air voids; clustering of the voids is common. No secondary precipitation was observed. The concrete volume is estimated at 30 to 35 percent, interpreted water-cementitious materials ratio is 0.47 to 0.52 (Figure 3-19a and Table 3-6).
The outer concrete surfaces are carbonated (fine-grained, impure calcium carbonate) to an average depth of 2 to 4 mm (Figure 3-19b). Small patches of similar carbonated paste, indicated by mottled color, are present throughout the body of the sample. No significant cracks or micro-cracks are observed (Figure 3-19 and Table 3-6).
3.22
A low magnification view in backscattered electron mode (BSE) is shown in Figure 3-20a. Narrow microcracks passing between aggregate particles and iron particles are common. Some separation microcracks along the interface between aggregates and paste are also detected, but these features are not abundant. Higher magnification views are shown in Figure 3-20b. The figures illustrate typical microcracks. The width of the widest microcracks is generally approximately 1 micrometer. No deposits are detected in the microcracks.
Figure 3-19. a) Lapped surface of CS-III-7%. The top surface shown is a cast surface. Air voids are non-uniformly distributed. Metallic aggregates, indicated by red arrows, are somewhat corroded. b) Close view of a fracture surface treated with phenolphthalein pH indicator solution. The top surface shown in the photo is a cast surface.Mottled pink and magenta stain is indicative of patchy carbonation. The top surface of the sample is at the top of the photo. Scale at left is marked in millimeter increments.
a b
Figure 3-20. a) BSE image at 500 X. Bright inclusions are iron. Microcracks extended between aggregate particles and iron particles. Some separation microcracks are also visible. b) BSE images at 250X and 500X showing microcracks intersecting in air voids. The X-ray analysis at the bottom is for a small area near the air void. The area of the analysis is indicated in the image on the right by the gray box containing the small white square.
3.23
3.24
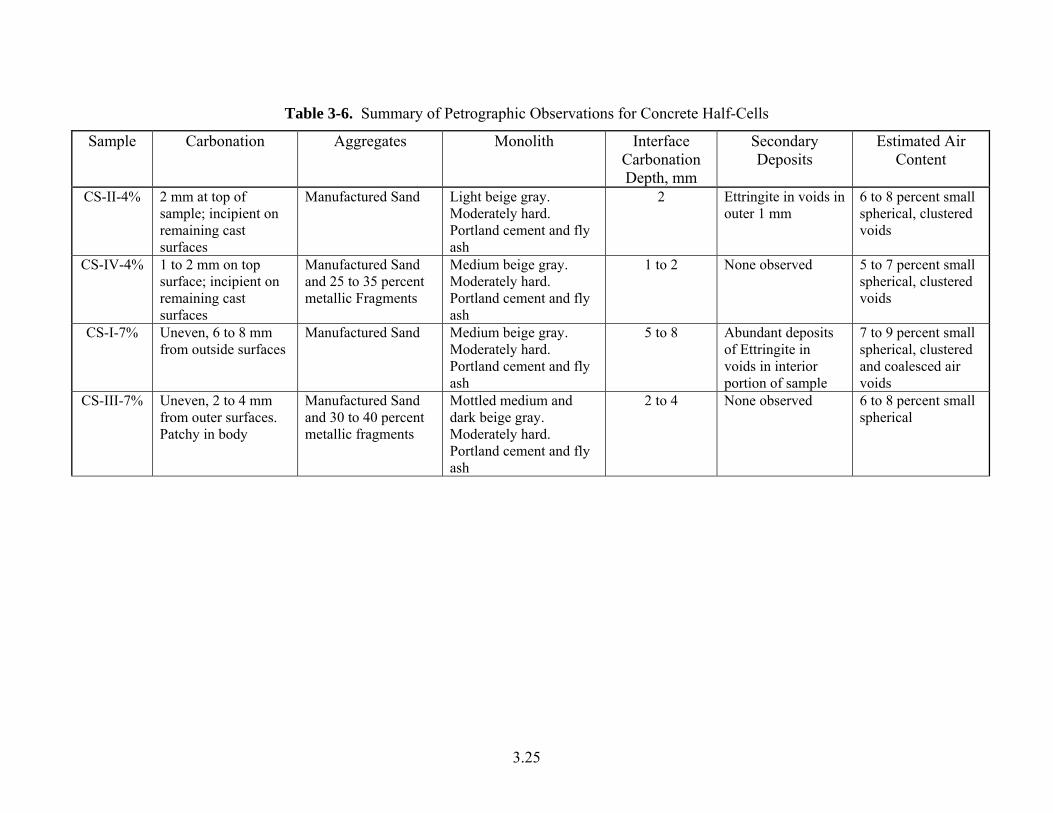
Petrographic results indicted that:
1. Concrete monoliths CS-II-4% and CS-IV-4%, which were not subjected to carbonation via supercritical fluid, displayed carbonation to a depth of 0.4 mm on the surface and 1 to 2 mm at the concrete-soil interface. 0.4 mm carbonation on the monolith surface may have occurred as a result of preparing the cores and allowing them to set under ambient conditions for 2 years prior to being sealed in the half-cell columns. However, deeper carbonation at the concrete-soil interface is believed to be a result of natural carbonation from contact with the sediment.
2. Concrete monoliths CS-I-7% and CS-III-7% were carbonated using supercritical fluid
prior to being sealed in the half-cell columns; the extent of carbonation was observed to range from 2 to 8 mm for the two monoliths. The difference in carbonation depth (2 - 4 mm for CS-III-7% and 5 – 8 mm for CS-I-7%) is believed to account for the apparent increase in the release of iodine and rhenium from CS-III-7% (carbonated, with iron) relative to CS-I-7% (carbonated, without iron).
3. No microcracking was evident in any of the concrete monoliths; however, petrographic
microscopy would only be able to identify cracks with a width ranging from 8 to 10 μm. Pending a more detailed scanning electron microscopy (SEM) analysis it is believed microcracks, particularly within the carbonated regions, will be clearly visible.
Scanning electron microscopy results indicate concrete monoliths CS-I-7% and CS-III-7% contained more microcracks than concrete monoliths CS-II-4% and CS-IV-4%. The style of microcracking in CS-I-7% and CS-III-7% was similar. The microcracks in CS-I-7% and CS-III-7% tended to be longer than microcracks observed in CS-II-4% and CS-IV-4% and were often discontinuous. These microcracks also typically branched into shorter, narrower segments. Separation microcracks were often observed surrounding, or partially surrounding, the aggregate and fly ash particles.
Specimen preparation methods, specifically cutting, drying, exposure to solvents, and exposure to vacuum, can cause microcracking. Stabilization with low-viscosity epoxy resin minimized the extent of damage caused by sample preparation, but does not eliminate the microcracking during analysis that can result from vacuum exposure.
3.25
Table 3-6. Summary of Petrographic Observations for Concrete Half-Cells
Sample Carbonation Aggregates Monolith Interface Carbonation Depth, mm
Secondary Deposits
Estimated Air Content
CS-II-4% 2 mm at top of sample; incipient on remaining cast surfaces
Manufactured Sand Light beige gray. Moderately hard. Portland cement and fly ash
2 Ettringite in voids in outer 1 mm
6 to 8 percent small spherical, clustered voids
CS-IV-4% 1 to 2 mm on top surface; incipient on remaining cast surfaces
Manufactured Sand and 25 to 35 percent metallic Fragments
Medium beige gray. Moderately hard. Portland cement and fly ash
1 to 2 None observed 5 to 7 percent small spherical, clustered voids
CS-I-7% Uneven, 6 to 8 mm from outside surfaces
Manufactured Sand Medium beige gray. Moderately hard. Portland cement and fly ash
5 to 8 Abundant deposits of Ettringite in voids in interior portion of sample
7 to 9 percent small spherical, clustered and coalesced air voids
CS-III-7% Uneven, 2 to 4 mm from outer surfaces. Patchy in body
Manufactured Sand and 30 to 40 percent metallic fragments
Mottled medium and dark beige gray. Moderately hard. Portland cement and fly ash
2 to 4 None observed 6 to 8 percent small spherical
4.0 References Cited 1. Mattigod, S.V., G.A. Whyatt, R.J. Serne, P.F. Martin, K.E. Schwab, and M.I. Wood,
Diffusion and Leaching of Selected Radionuclides (Iodine-129, Technetium-99, and Uranium) Through Category 3 Waste Encasement Concrete and Soil Fill Material. 2001, PNNL: Richland.
2. Mann, F.M., R.J. Puigh II, S.H. Finfrock, J. Freeman, E.J., R. Khaleel, D.H. Bacon, M.P.
Bergeron, P.B. McGrail, and S.K. Wurstner, Hanford Immobilized Low-Activity Waste Performance Assessment: 2001 Version. 2001, Pacific Northwest National Laboratory: Richland, WA.
3. Wood, M.I., R. Khaleel, P.D. Rittman, A.H. Lu, S. Finfrock, R.J. Serne, and K.J.
Cantrell, Performance Assessment for the Disposal of Low-Level Waste in the 218-W-5 Burial Ground. 1995, Westinghouse Hanford Company: Richland, WA.
4. Serne, R.J., J.L. Conca, V.L. LeGore, K.J. Cantrell, C.W. Lindenmeier, J.A. Campbell,
J.E. Amonette, and M.I. Wood, Solid-waste leach characterization and contaminant-sediment interactions. 1993, Pacific Northwest Laboratory: Richland, WA.
5. Serne, R.J., R.O. Lokken, and L.J. Criscenti, Characterization of Grouted LLW to
Support Performance Assessment. Waste Management, 1992. 12: p. 271-287. 6. Serne, R.J., W.J. Martin, and V.L. LeGore, Leach Test of Cladding Removal Waste Grout
Using Hanford Groundwater. 1995, Pacific Northwest Laboratory: Richland, Washington.
7. Serne, R.J., W.J. Martin, V.L. LeGore, C.W. Lindenmeier, S.B. McLaurine, P.F.C.
Martin, and R.O. Lokken, Leach Tests on Grouts Made with Actual and Trace Metal-Spiked Synthetic Phosphate/Sulfate Waste. 1989, Pacific Northwest Laboratory: Richland, Washington.
8. Belokoneva, E.L., V.I. Mokeeva, L.M. Kuznetsov, M.A. Simonov, E.S. Makarov, and
N.V. Belov, Crystal structure of synthetic soddyite (UO2)2 [SiO4] (H20)2. American Institute of Physics, 1979.
9. Casas, I., I. Perez, M.E. Torrero, J. Bruno, E. Cera, and L. Duro, Dissoulution studies of
synthetic soddyite and uranophane. 1997. 10. Demartin, F., C.M. Gramaccioli, and T. Pilati, The importance of accurate crystal
structure determination of uranium minerals. II. Soddyite (UO2)2(SiO4).2H20. Acta Crystallographica, Section C: Crystal Structure Communications, 1992: p. 1-4.
4.1